CONSUMERS ENERGY CO
10-Ks and 10-Qs
|
|
|
|
|
|
|
|
|
|
|
|
|
|
|
|
|
|
|
|
|
|
|
|
|
|
|
|
|
|
|
|
|
UNITED STATES SECURITIES AND EXCHANGE COMMISSION
|
||||||||
|
Washington, D.C. 20549
|
||||||||
|
FORM 10‑Q
|
||||||||
|
x
QUARTERLY REPORT PURSUANT TO SECTION 13 OR 15(d) OF THE SECURITIES
EXCHANGE ACT OF 1934
|
||||||||
|
For the quarterly period ended June 30, 2018
|
||||||||
|
OR
|
||||||||
|
o
TRANSITION REPORT PURSUANT TO SECTION 13 OR 15(d) OF THE SECURITIES
EXCHANGE ACT OF 1934
|
||||||||
|
For the transition period from _____to_____
|
||||||||
|
Commission
|
Registrant; State of Incorporation;
|
IRS Employer
|
||||||
|
File Number
|
Address; and Telephone Number
|
Identification No.
|
||||||
|
1-9513
|
CMS ENERGY CORPORATION
|
38-2726431
|
||||||
|
(A Michigan Corporation)
|
||||||||
|
One Energy Plaza, Jackson, Michigan 49201
|
||||||||
|
(517) 788-0550
|
||||||||
|
1-5611
|
CONSUMERS ENERGY COMPANY
|
38-0442310
|
||||||
|
(A Michigan Corporation)
|
||||||||
|
One Energy Plaza, Jackson, Michigan 49201
|
||||||||
|
(517) 788-0550
|
||||||||
|
Indicate by check mark whether the registrant (1) has filed all reports required to be filed by Section 13 or 15(d) of the Securities Exchange Act of 1934 during the preceding 12 months (or for such shorter period that the Registrant was required to file such reports), and (2) has been subject to such filing requirements for the past 90 days.
|
||||||||
|
CMS Energy Corporation:
Yes
x
No
o
|
Consumers Energy Company:
Yes
x
No
o
|
|||||||
|
Indicate by check mark whether the registrant has submitted electronically and posted on its corporate Web site, if any, every Interactive Data file required to be submitted and posted pursuant to Rule 405 of Regulation S-T (§232.405 of this chapter) during the preceding 12 months (or for such shorter period that the registrant was required to submit and post such files).
|
||||||||
|
CMS Energy Corporation:
Yes
x
No
o
|
Consumers Energy Company:
Yes
x
No
o
|
|||||||
|
Indicate by check mark whether the registrant is a large accelerated filer, an accelerated filer, a non‑accelerated filer, a smaller reporting company, or emerging growth company. See the definitions of “large accelerated filer,” “accelerated filer,” “smaller reporting company,” and “emerging growth company” in Rule 12b-2 of the Exchange Act.
|
||||||||
|
CMS Energy Corporation:
|
Consumers Energy Company:
|
|||||||
|
Large accelerated filer
x
|
Large accelerated filer
o
|
|||||||
|
Non‑accelerated filer
o
|
Non‑accelerated filer
x
|
|||||||
|
(Do not check if a smaller reporting company)
|
(Do not check if a smaller reporting company)
|
|||||||
|
Emerging growth company
o
|
Emerging growth company
o
|
|||||||
|
Accelerated filer
o
|
Accelerated filer
o
|
|||||||
|
Smaller reporting company
o
|
Smaller reporting company
o
|
|||||||
|
If an emerging growth company, indicate by check mark if the registrant has elected not to use the extended transition period for complying with any new or revised financial accounting standards provided pursuant to Section 13(a) of the Exchange Act.
|
||||||||
|
CMS Energy Corporation:
o
|
Consumers Energy Company:
o
|
|||||||
|
Indicate by check mark whether the registrant is a shell company (as defined in Rule 12b-2 of the Exchange Act).
|
||||||||
|
CMS Energy Corporation:
Yes
o
No
x
|
Consumers Energy Company:
Yes
o
No
x
|
|||||||
|
Indicate the number of shares outstanding of each of the issuer’s classes of common stock at July 11, 2018:
|
||||||||
|
CMS Energy Corporation:
|
||||||||
|
CMS Energy Common Stock, $0.01 par value
|
||||||||
|
(including 20,316 shares owned by Consumers Energy)
|
283,265,427
|
|||||||
|
Consumers Energy Company:
|
||||||||
|
Consumers Common Stock, $10 par value, privately held by CMS Energy Corporation
|
84,108,789
|
|||||||
CMS Energy Corporation
Consumers Energy Company
Quarterly Reports on Form 10‑Q to the Securities and Exchange Commission for the Period Ended
June 30, 2018
Table of Contents
1
Glossary
Certain terms used in the text and financial statements are defined below.
2016 Energy Law
Michigan’s Public Acts 341 and 342 of 2016
2017
Form 10-K
Each of CMS Energy’s and Consumers’ Annual Report on Form 10‑K for the year ended December 31, 2017
ABATE
Association of Businesses Advocating Tariff Equity
AOCI
Accumulated other comprehensive income (loss)
ARO
Asset retirement obligation
ASU
Financial Accounting Standards Board Accounting Standards Update
Bay Harbor
A residential/commercial real estate area located near Petoskey, Michigan, in which CMS Energy sold its interest in 2002
bcf
Billion cubic feet
Cantera Gas Company
Cantera Gas Company LLC, a non‑affiliated company, formerly known as CMS Field Services
Cantera Natural Gas, Inc.
Cantera Natural Gas, Inc., a non‑affiliated company that purchased CMS Field Services
CCR
Coal combustion residual
CEO
Chief Executive Officer
CERCLA
Comprehensive Environmental Response, Compensation, and Liability Act of 1980, as amended
CFO
Chief Financial Officer
Clean Air Act
Federal Clean Air Act of 1963, as amended
Clean Water Act
Federal Water Pollution Control Act of 1972, as amended
CMS Capital
CMS Capital, L.L.C., a wholly owned subsidiary of CMS Energy
2
CMS Energy
CMS Energy Corporation and its consolidated subsidiaries, unless otherwise noted; the parent of Consumers and CMS Enterprises
CMS Enterprises
CMS Enterprises Company, a wholly owned subsidiary of CMS Energy
CMS ERM
CMS Energy Resource Management Company, formerly known as CMS MST, a wholly owned subsidiary of CMS Enterprises
CMS Field Services
CMS Field Services, Inc., a former wholly owned subsidiary of CMS Gas Transmission Company, a wholly owned subsidiary of CMS Enterprises
CMS Land
CMS Land Company, a wholly owned subsidiary of CMS Capital
CMS MST
CMS Marketing, Services and Trading Company, a wholly owned subsidiary of CMS Enterprises, whose name was changed to CMS ERM in 2004
Consumers
Consumers Energy Company and its consolidated subsidiaries, unless otherwise noted; a wholly owned subsidiary of CMS Energy
CSAPR
The Cross-State Air Pollution Rule of 2011, as amended
DB Pension Plans
Defined benefit pension plans of CMS Energy and Consumers, including certain present and former affiliates and subsidiaries
DB SERP
Defined Benefit Supplemental Executive Retirement Plan
Dodd-Frank Act
Dodd-Frank Wall Street Reform and Consumer Protection Act of 2010
EBITDA
Earnings before interest, taxes, depreciation, and amortization
EEI
Edison Electric Institute, an association representing all U.S. investor-owned electric companies
EnerBank
EnerBank USA, a wholly owned subsidiary of CMS Capital
energy waste reduction
The reduction of energy consumption through energy efficiency and demand-side energy conservation, as established under the 2016 Energy Law
EPA
U.S. Environmental Protection Agency
3
EPS
Earnings per share
Exchange Act
Securities Exchange Act of 1934
FDIC
Federal Deposit Insurance Corporation
FERC
The Federal Energy Regulatory Commission
FTR
Financial transmission right
GAAP
U.S. Generally Accepted Accounting Principles
GCR
Gas cost recovery
Genesee
Genesee Power Station Limited Partnership, a variable interest entity in which HYDRA-CO Enterprises, Inc., a wholly owned subsidiary of CMS Enterprises, has a 50-percent interest
IRP
Integrated resource plan
kWh
Kilowatt-hour, a unit of energy equal to one thousand watt-hours
Ludington
Ludington pumped-storage plant, jointly owned by Consumers and DTE Electric Company, a non‑affiliated company
MATS
Mercury and Air Toxics Standards, which limit mercury, acid gases, and other toxic pollution from coal-fueled and oil-fueled power plants
MCV Partnership
Midland Cogeneration Venture Limited Partnership
MCV PPA
PPA between Consumers and the MCV Partnership
MD&A
Management’s Discussion and Analysis of Financial Condition and Results of Operations
MDEQ
Michigan Department of Environmental Quality
METC
Michigan Electric Transmission Company, LLC, a non‑affiliated company
MGP
Manufactured gas plant
4
Michigan Mercury Rule
Michigan Air Pollution Control Rules of 2009, as amended, Part 15: Emission Limitations and Prohibitions – Mercury
MISO
Midcontinent Independent System Operator, Inc.
mothball
To place a generating unit into a state of extended reserve shutdown in which the unit is inactive and unavailable for service for a specified period, during which the unit can be brought back into service after receiving appropriate notification and completing any necessary maintenance or other work; generation owners in MISO must request approval to mothball a unit, and MISO then evaluates the request for reliability impacts
MPSC
Michigan Public Service Commission
MW
Megawatt, a unit of power equal to one million watts
NAAQS
National Ambient Air Quality Standards
NPDES
National Pollutant Discharge Elimination System, a permit system for regulating point sources of pollution under the Clean Water Act
NREPA
Part 201 of Michigan’s Natural Resources and Environmental Protection Act of 1994, as amended
NSR
New Source Review, a construction-permitting program under the Clean Air Act
OPEB
Other Post-Employment Benefits
OPEB Plan
Postretirement health care and life insurance plans of CMS Energy and Consumers, including certain present and former affiliates and subsidiaries
OSHA
Occupational Safety and Health Administration
PCB
Polychlorinated biphenyl
PHMSA
The U.S. Department of Transportation’s Pipeline and Hazardous Materials Safety Administration
PPA
Power purchase agreement
PSCR
Power supply cost recovery
5
PURPA
The Public Utility Regulatory Policies Act of 1978
RCRA
The Federal Resource Conservation and Recovery Act of 1976
REC
Renewable energy credit
ROA
Retail Open Access, which allows electric generation customers to choose alternative electric suppliers pursuant to Michigan’s Public Acts 141 and 142 of 2000, as amended
SEC
U.S. Securities and Exchange Commission
securitization
A financing method authorized by statute and approved by the MPSC which allows a utility to sell its right to receive a portion of the rate payments received from its customers for the repayment of securitization bonds issued by a special-purpose entity affiliated with such utility
Smart Energy
Consumers’ Smart Energy grid modernization project, which includes the installation of smart meters that transmit and receive data, a two-way communications network, and modifications to Consumers’ existing information technology system to manage the data and enable changes to key business processes
TCJA
Tax Cuts and Jobs Act of 2017
T.E.S. Filer City
T.E.S. Filer City Station Limited Partnership, a variable interest entity in which HYDRA-CO Enterprises, Inc., a wholly owned subsidiary of CMS Enterprises, has a 50-percent interest
6
Filing Format
This combined Form 10‑Q is separately filed by CMS Energy and Consumers. Information in this combined Form 10‑Q relating to each individual registrant is filed by such registrant on its own behalf. Consumers makes no representation regarding information relating to any other companies affiliated with CMS Energy other than its own subsidiaries. None of CMS Energy, CMS Enterprises, nor any of CMS Energy’s other subsidiaries (other than Consumers) has any obligation in respect of Consumers’ debt securities and holders of such debt securities should not consider the financial resources or results of operations of CMS Energy, CMS Enterprises, nor any of CMS Energy’s other subsidiaries (other than Consumers and its own subsidiaries (in relevant circumstances)) in making a decision with respect to Consumers’ debt securities. Similarly, neither Consumers nor any other subsidiary of CMS Energy has any obligation in respect of debt securities of CMS Energy.
This report should be read in its entirety. No one section of this report deals with all aspects of the subject matter of this report. This report should be read in conjunction with the consolidated financial statements and related notes and with MD&A included in the
2017
Form 10‑K.
Available Information
CMS Energy’s internet address is www.cmsenergy.com. CMS Energy routinely posts important information on its website and considers the Investor Relations section, www.cmsenergy.com/investor-relations, a channel of distribution. Information contained on CMS Energy’s website is not incorporated herein.
Forward-Looking Statements and Information
This Form 10‑Q and other CMS Energy and Consumers disclosures may contain forward-looking statements as defined by the Private Securities Litigation Reform Act of 1995. The use of “might,” “may,” “could,” “should,” “anticipates,” “believes,” “estimates,” “expects,” “intends,” “plans,” “projects,” “forecasts,” “predicts,” “assumes,” and other similar words is intended to identify forward-looking statements that involve risk and uncertainty. This discussion of potential risks and uncertainties is designed to highlight important factors that may impact CMS Energy’s and Consumers’ businesses and financial outlook. CMS Energy and Consumers have no obligation to update or revise forward-looking statements regardless of whether new information, future events, or any other factors affect the information contained in the statements. These forward-looking statements are subject to various factors that could cause CMS Energy’s and Consumers’ actual results to differ materially from the results anticipated in these statements. These factors include, but are not limited to, the following, all of which are potentially significant:
|
•
|
the impact of new regulation by the MPSC, FERC, and other applicable governmental proceedings and regulations, including any associated impact on electric or gas rates or rate structures
|
|
•
|
potentially adverse regulatory treatment or failure to receive timely regulatory orders affecting Consumers that are or could come before the MPSC, FERC, or other governmental authorities
|
|
•
|
changes in the performance of or regulations applicable to MISO, METC, pipelines, railroads, vessels, or other service providers that CMS Energy, Consumers, or any of their affiliates rely on to serve their customers
|
|
•
|
the adoption of federal or state laws or regulations or challenges to federal or state laws or regulations, or changes in applicable laws, rules, regulations, principles, or practices, or in their interpretation, such as those related to energy policy and ROA, infrastructure integrity or security, gas pipeline safety,
|
7
|
•
|
gas pipeline capacity, energy waste reduction, the environment, regulation or deregulation, reliability, health care reforms (including comprehensive health care reform enacted in 2010), taxes, accounting matters, climate change, air emissions, renewable energy, potential effects of the Dodd-Frank Act, and other business issues that could have an impact on CMS Energy’s, Consumers’, or any of their affiliates’ businesses or financial results
|
|
•
|
factors affecting operations, such as costs and availability of personnel, equipment, and materials; weather conditions; natural disasters; catastrophic weather-related damage; scheduled or unscheduled equipment outages; maintenance or repairs; environmental incidents; failures of equipment or materials; and electric transmission and distribution or gas pipeline system constraints
|
|
•
|
increases in demand for renewable energy by customers seeking to meet sustainability goals
|
|
•
|
the ability of Consumers to execute its cost-reduction strategies
|
|
•
|
potentially adverse regulatory or legal interpretations or decisions regarding environmental matters, or delayed regulatory treatment or permitting decisions that are or could come before the MDEQ, EPA, and/or U.S. Army Corps of Engineers, and potential environmental remediation costs associated with these interpretations or decisions, including those that may affect Bay Harbor or Consumers’ routine maintenance, repair, and replacement classification under NSR regulations
|
|
•
|
changes in energy markets, including availability and price of electric capacity and the timing and extent of changes in commodity prices and availability and deliverability of coal, natural gas, natural gas liquids, electricity, oil, and certain related products
|
|
•
|
the price of CMS Energy common stock, the credit ratings of CMS Energy and Consumers, capital and financial market conditions, and the effect of these market conditions on CMS Energy’s and Consumers’ interest costs and access to the capital markets, including availability of financing to CMS Energy, Consumers, or any of their affiliates
|
|
•
|
the investment performance of the assets of CMS Energy’s and Consumers’ pension and benefit plans, the discount rates used in calculating the plans’ obligations, and the resulting impact on future funding requirements
|
|
•
|
the impact of the economy, particularly in Michigan, and potential future volatility in the financial and credit markets on CMS Energy’s, Consumers’, or any of their affiliates’ revenues, ability to collect accounts receivable from customers, or cost and availability of capital
|
|
•
|
changes in the economic and financial viability of CMS Energy’s and Consumers’ suppliers, customers, and other counterparties and the continued ability of these third parties, including those in bankruptcy, to meet their obligations to CMS Energy and Consumers
|
|
•
|
population changes in the geographic areas where CMS Energy and Consumers conduct business
|
|
•
|
national, regional, and local economic, competitive, and regulatory policies, conditions, and developments
|
|
•
|
loss of customer demand for electric generation supply to alternative electric suppliers, increased use of distributed generation, or energy waste reduction
|
|
•
|
adverse consequences of employee, director, or third-party fraud or non‑compliance with codes of conduct
|
8
|
•
|
federal regulation of electric sales and transmission of electricity, including periodic re‑examination by federal regulators of CMS Energy’s and Consumers’ market-based sales authorizations
|
|
•
|
the impact of credit markets, economic conditions, increased competition, and any new banking and consumer protection regulations on EnerBank
|
|
•
|
the availability, cost, coverage, and terms of insurance, the stability of insurance providers, and the ability of Consumers to recover the costs of any insurance from customers
|
|
•
|
the effectiveness of CMS Energy’s and Consumers’ risk management policies, procedures, and strategies, including strategies to hedge risk related to future prices of electricity, natural gas, and other energy-related commodities
|
|
•
|
factors affecting development of electric generation projects and gas and electric transmission and distribution infrastructure replacement, conversion, and expansion projects, including factors related to project site identification, construction material pricing, schedule delays, availability of qualified construction personnel, permitting, acquisition of property rights, and government approvals
|
|
•
|
potential disruption to, interruption of, or other impacts on facilities, utility infrastructure, operations, or backup systems due to accidents, explosions, physical disasters, cyber incidents, vandalism, war, or terrorism, and the ability to obtain or maintain insurance coverage for these events
|
|
•
|
changes or disruption in fuel supply, including but not limited to supplier bankruptcy and delivery disruptions
|
|
•
|
potential costs, lost revenues, or other consequences resulting from misappropriation of assets or sensitive information, corruption of data, or operational disruption in connection with a cyber attack or other cyber incident
|
|
•
|
potential disruption to, interruption or failure of, or other impacts on information technology backup or disaster recovery systems
|
|
•
|
technological developments in energy production, storage, delivery, usage, and metering
|
|
•
|
the ability to implement technology successfully
|
|
•
|
the impact of CMS Energy’s and Consumers’ integrated business software system and its effects on their operations, including utility customer billing and collections
|
|
•
|
adverse consequences resulting from any past, present, or future assertion of indemnity or warranty claims associated with assets and businesses previously owned by CMS Energy or Consumers, including claims resulting from attempts by foreign or domestic governments to assess taxes on or to impose environmental liability associated with past operations or transactions
|
|
•
|
the outcome, cost, and other effects of any legal or administrative claims, proceedings, investigations, or settlements
|
|
•
|
the reputational impact on CMS Energy and Consumers of operational incidents, violations of corporate policies, regulatory violations, inappropriate use of social media, and other events
|
9
|
•
|
restrictions imposed by various financing arrangements and regulatory requirements on the ability of Consumers and other subsidiaries of CMS Energy to transfer funds to CMS Energy in the form of cash dividends, loans, or advances
|
|
•
|
earnings volatility resulting from the application of fair value accounting to certain energy commodity contracts or interest rate contracts
|
|
•
|
changes in financial or regulatory accounting principles or policies
|
|
•
|
other matters that may be disclosed from time to time in CMS Energy’s and Consumers’ SEC filings, or in other public documents
|
All forward-looking statements should be considered in the context of the risk and other factors described above and as detailed from time to time in CMS Energy’s and Consumers’ SEC filings. For additional details regarding these and other uncertainties, see
Part I—Item 1. Financial Statements
—MD&A—Outlook
and
Notes to the Unaudited Consolidated Financial Statements
—
Note 2, Regulatory Matters
and
Note 3, Contingencies and Commitments
; and
Part II—Item 1A. Risk Factors
.
10
Part I
—
Financial Information
Item
1
.
Financial Statements
Index to Financial Statements
11
CMS Energy Corporation
Consumers Energy Company
Management’s Discussion and Analysis of Financial Condition and Results of Operations
This
MD&A
is a combined report of CMS Energy and Consumers.
Executive Overview
CMS Energy is an energy company operating primarily in Michigan. It is the parent holding company of several subsidiaries, including Consumers, an electric and gas utility, and CMS Enterprises, primarily a domestic independent power producer. Consumers’ electric utility operations include the generation, purchase, transmission, distribution, and sale of electricity, and Consumers’ gas utility operations include the purchase, transmission, storage, distribution, and sale of natural gas. Consumers’ customer base consists of a mix of residential, commercial, and diversified industrial customers. CMS Enterprises, through its subsidiaries and equity investments, is engaged in domestic independent power production, the marketing of independent power production, and the development and operation of renewable generation.
CMS Energy and Consumers manage their businesses by the nature of services each provides. CMS Energy operates principally in three business segments: electric utility; gas utility; and enterprises, its non‑utility operations and investments. Consumers operates principally in two business segments: electric utility and gas utility. CMS Energy’s and Consumers’ businesses are affected primarily by:
|
•
|
regulation and regulatory matters
|
|
•
|
state and federal legislation
|
|
•
|
economic conditions
|
|
•
|
weather
|
|
•
|
energy commodity prices
|
|
•
|
interest rates
|
|
•
|
their securities’ credit ratings
|
The Triple Bottom Line
CMS Energy’s and Consumers’ purpose is to achieve world class performance while delivering hometown service. In support of this purpose, the companies employ the “Consumers Energy Way,” a lean operating model designed to improve safety, quality, cost, delivery, and employee morale.
CMS Energy and Consumers measure their progress toward the purpose by considering their impact on the “triple bottom line” of people, planet, and profit, which is underpinned by performance; this consideration takes into account not only the economic value that the companies create for customers and investors, but also their responsibility to social and environmental goals. The triple bottom line balances the interests of the companies’ employees, customers, suppliers, regulators, creditors, Michigan’s residents, the investment community, and other stakeholders, and it reflects the broader societal impacts of the companies’ activities.

12
Consumers’ Sustainability Report, which is available to the public, describes the company’s progress toward world class performance measured in the areas of people, planet, and profit.
People
: The people element of the triple bottom line represents CMS Energy’s and Consumers’ commitment to their employees, their customers, the residents of local communities in which the companies do business, and other stakeholders.
The safety of employees, customers, and the general public is a priority of CMS Energy and Consumers. Accordingly, CMS Energy and Consumers have worked to integrate a set of safety principles into their business operations and culture. These principles include complying with applicable safety, health, and security regulations and implementing programs and processes aimed at continually improving safety and security conditions. The number of recordable safety incidents in 2017 was 65, compared with 73 in 2016 and 106 in 2015. The number of recordable safety incidents in 2017 was the lowest in Consumers’ history. In 2017, Consumers’ OSHA recordable incident rate was 0.77, compared with 0.88 in 2016 and 1.31 in 2015, and was the lowest among its EEI peer group.
CMS Energy and Consumers also place a high priority on customer value and on providing a hometown customer experience. Consumers’ customer-driven investment program is aimed at improving safety and increasing electric and gas reliability, which has resulted in measurable improvements in customer satisfaction.
Central to Consumers’ commitment to its customers are the initiatives it has undertaken to keep electricity and natural gas affordable, including:
|
•
|
replacement of coal-fueled generation with cleaner and more efficient gas-fueled generation, renewable energy, and energy waste reduction and demand response programs
|
|
•
|
targeted infrastructure investment, including the installation of smart meters
|
|
•
|
information and control system efficiencies
|
|
•
|
employee and retiree health care cost sharing
|
|
•
|
workforce productivity enhancements
|
In addition, Consumers’ gas commodity costs declined by 60 percent from 2007 through 2017, due not only to a decrease in market prices but also to Consumers’ improvements to its gas infrastructure and optimization of its gas purchasing and storage strategy. These gas commodity savings are passed on to customers.
Consumers filed an IRP with the MPSC in June 2018,
detailing its long-term strategy for delivering reliable and affordable energy to its customers through the increased use of energy efficiency and customer demand management programs and additional renewable energy.
The IRP supports Consumers’ commitment to the triple bottom line.
Planet
: The planet element of the triple bottom line represents CMS Energy’s and Consumers’ commitment to protect the environment; this commitment extends beyond complying with the various state and federal environmental and health and safety laws and regulations to which CMS Energy and Consumers are subject. Management considers climate change risk and other environmental risks in the companies’ strategy development, business planning, and enterprise risk management processes. By November 30, 2018, CMS Energy will publish a climate assessment report of the long-term impacts on the company’s portfolio, of public policies and technological advances that are consistent with limiting global warming to no more than two degrees Celsius over pre‑industrial levels.
13
CMS Energy and Consumers continue to focus on opportunities to protect the environment and to reduce their carbon footprint. As a result of actions already taken by CMS Energy and Consumers, including the retirement of
seven
of Consumers’ coal-fueled electric generating units in 2016, the companies have:
|
•
|
decreased their combined percentage of electric supply (self-generated and purchased) from coal by 16 percentage points since 2015
|
|
•
|
reduced carbon dioxide emissions by over 35 percent since 2005
|
|
•
|
reduced the amount of water used to generate electricity by over 35 percent since 2012
|
|
•
|
reduced landfill waste disposal by over one million cubic yards since 1992
|
Additionally, over the last 20 years, Consumers has reduced its sulfur dioxide, nitrogen oxide, particulate matter, and mercury emissions by 90 percent.
The 2016 Energy Law, which became effective in April 2017:
|
•
|
raised the renewable energy standard from the present ten-percent requirement to
12.5 percent
by
2019
and
15 percent
by
2021
|
|
•
|
established a goal of 35 percent combined renewable energy and energy waste reduction by 2025
|
|
•
|
authorized incentives for demand response programs and expanded existing incentives for energy efficiency programs, referring to the combined initiatives as energy waste reduction programs
|
|
•
|
established an integrated planning process for new generation resources
|
In June 2018, Consumers filed an IRP with the MPSC, detailing how Consumers will meet the requirements of the 2016 Energy Law and reflecting its clean and lean energy strategy. This strategy focuses on increasing the generation of renewable energy, helping customers use less energy, and offering demand response programs to reduce demand during critical peak times.
In its IRP, Consumers details its plans to replace coal-fueled generation with investment in renewable energy, proposing
renewable energy levels of 25 percent by 2025, over 35 percent by 2030, and over 40 percent by 2040
. The attainment of these renewable energy levels will enable Consumers to meet and exceed the 2016 Energy Law renewable energy requirements and fulfill increasing customer demand for renewable energy. The IRP supports the following clean energy goals, which Consumers announced during 2018:
|
•
|
a breakthrough goal to reduce carbon emissions by 80 percent and to eliminate the use of coal to generate electricity by 2040
|
|
•
|
a target of at least 50 percent combined renewable energy and energy waste reduction by 2030
|
Additionally, in an effort to advance its environmental stewardship in Michigan and to minimize the impact of future regulations, Consumers announced these five-year targets during 2018:
|
•
|
to reduce its water use by one billion gallons
|
|
•
|
to reduce the amount of waste taken to landfills by 35 percent
|
|
•
|
to enhance, restore, or protect 5,000 acres of land
|
CMS Energy, through its non‑utility businesses, continues to pursue further opportunities for the development of renewable generation projects. CMS Enterprises recently
completed the development and construction of an 8‑MW solar generation project
in Michigan and expects to complete a 16‑MW solar generation project in August 2018. CMS Enterprises also
entered into an agreement to purchase a 105‑MW wind generation project in
Ohio.
Renewable energy produced by the wind generation project has been committed to General Motors LLC, a non‑affiliated company, under a 15‑year PPA.
CMS Energy and Consumers are monitoring numerous legislative, policy, and regulatory initiatives, including those to regulate greenhouse gases, and related litigation. While CMS Energy and Consumers cannot predict the outcome of these matters, which could have a material effect on the companies, they intend to continue to move forward with their clean and lean energy strategy.
14
Profit
: The profit element of the triple bottom line represents CMS Energy’s and Consumers’ commitment to meeting financial objectives and providing economic development opportunities and benefits in the communities in which they do business. CMS Energy’s and Consumers’ financial strength allows them to maintain solid investment-grade credit ratings and thereby reduce funding costs for the benefit of customers and investors, to preserve and create jobs, and to reinvest in the communities they serve.
For the
six months ended June 30, 2018
, CMS Energy’s
net income available to common stockholders
was
$380 million
, and diluted EPS were
$1.35
. This compares with
net income available to common stockholders
of
$291 million
and diluted EPS of
$1.04
for the
six months ended June 30, 2017
. In
2018
, higher sales, rate increases, and lower postretirement benefits costs were offset partially by higher depreciation on increased plant in service. A more detailed discussion of the factors affecting CMS Energy’s and Consumers’ performance can be found in the
Results of Operations
section that follows this
Executive Overview
.
Consumers projects that its electric and gas weather-normalized deliveries will
remain stable
through 2022. This outlook reflects
growth in electric demand offset by the effects of energy waste reduction programs
, and
growth in gas demand offset by
energy efficiency and conservation
.
Performance: Impacting the Triple Bottom Line
During 2017, CMS Energy’s and Consumers’ commitment to achieving world class performance while delivering hometown service resulted in the companies’ best-ever performance in the areas of safety, service, and customer satisfaction. Leveraging the Consumers Energy Way, the companies met record-breaking goals in the areas of:
|
•
|
lowering recordable safety incidents
|
|
•
|
improving customer satisfaction scores
|
|
•
|
decreasing the duration of customer outages
|
|
•
|
responding faster to customer calls
|
|
•
|
achieving on-time delivery commitments
|
|
•
|
reading more meters monthly
|
|
•
|
improving the accuracy of customer bills
|
|
•
|
delivering energy efficiency solutions to customers
|
CMS Energy and Consumers will continue to utilize the Consumers Energy Way to enable them to achieve world class performance and positively impact the triple bottom line. Consumers’ investment plan and the regulatory environment in which it operates also drive its ability to impact the triple bottom line.
Investment Plan
: Consumers expects to make significant expenditures on infrastructure upgrades and replacements and electric supply projects from
2018
through 2027. While it has a large number of potential investment opportunities that would add customer value, Consumers has prioritized its spending based on the criteria of enhancing public safety, increasing reliability, maintaining affordability for its customers, and advancing its environmental stewardship. Consumers’ investment program is expected to result in annual rate-base growth of six to eight percent. This rate-base growth, together with cost-control initiatives, should allow Consumers to maintain affordable customer prices.
15
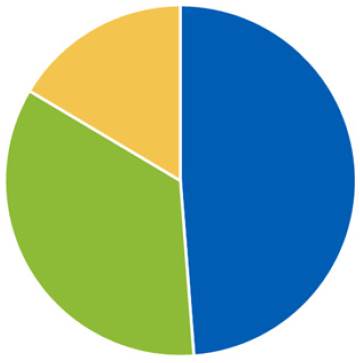
Presented in the following illustration are planned capital expenditures of $10.1 billion that Consumers expects to make from
2018
through 2022:
|
|||
|
Gas infrastructure
|
|||
|
($4.9 billion)
|
|||
|
Electric distribution
|
|||
|
($3.5 billion)
|
|||
|
Electric supply
|
|||
|
($1.7 billion)
|
|||
Consumers plans to spend $8.4 billion over the next five years to maintain and upgrade its gas infrastructure and electric distribution systems in order to enhance safety and reliability, improve customer satisfaction, and reduce energy waste on those systems. The gas infrastructure projects comprise $4.9 billion to sustain deliverability and enhance pipeline integrity and safety. These projects, which involve replacement of mains and services and enhancement of transmission and storage systems, should reduce the minor quantity of methane emissions released as gas is transported. The electric distribution projects comprise $3.5 billion to strengthen circuits and substations and replace poles. Consumers also expects to spend $1.7 billion on electric supply projects, representing new generation, including renewable generation, and environmental investments needed to comply with state and federal laws and regulations.
Regulation
: Regulatory matters are a key aspect of Consumers’ business, particularly rate cases and regulatory proceedings before the MPSC, which permit recovery of new investments while helping to ensure that customer rates are fair and affordable. Important regulatory events and developments not already discussed are summarized below.
|
•
|
2017 Electric Rate Case
:
In March 2017, Consumers filed an application with the MPSC seeking an annual rate increase of
$173 million
, based on a
10.5 percent
authorized return on equity. The filing requested authority to recover new investment in system reliability, environmental compliance, and technology enhancements. In September 2017, Consumers reduced its requested annual rate increase to
$148 million
. The MPSC issued an order in March 2018, authorizing an annual rate increase of
$66 million
, based on a
10.0 percent
authorized return on equity.
In June 2018, as a result of a petition for rehearing filed by Consumers, the MPSC issued an order adjusting the authorized annual rate increase to
$72 million
by allowing recovery of additional retirement benefit plan costs.
|
|
•
|
2018 Electric Rate Case
:
In May 2018, Consumers filed an application with the MPSC seeking an annual rate increase of
$58 million
, based on a
10.75 percent
authorized return on equity. The filing requests authority to recover new investment in system reliability, environmental compliance, and technology enhancements.
The filing also seeks approval of an investment recovery mechanism that would provide for an additional annual rate increase of
$49 million
beginning in 2020 and another
$48 million
beginning in 2021 for incremental investments that Consumers plans to make for distribution infrastructure, subject to reconciliation.
|
16
|
•
|
Gas Rate Case
:
In October 2017, Consumers filed an application with the MPSC seeking an annual rate increase of
$178 million
, based on a
10.5 percent
authorized return on equity. The largest component of the request was an annual revenue requirement of
$162 million
related to infrastructure investment and related costs that would allow Consumers to improve system safety, capacity, and deliverability. In March 2018, Consumers reduced its requested revenue requirement to
$145 million
, before taking into consideration any impact of the TCJA. Consumers further reduced its requested revenue requirement to
$83 million
to reflect the impact of the TCJA, offset partially by an increase in the authorized return on equity to
10.75 percent
to compensate for the anticipated negative effects of tax reform on Consumers’ cash flows from operating activities.
In July 2018, Consumers reduced its requested revenue requirement to
$60 million
, based on a
10.0 percent
authorized return on equity.
|
In July 2018, the administrative law judge issued a proposal for decision, recommending an annual rate increase of $11 million, based on a 10.0 percent authorized return on equity. The administrative law judge also recommended approval of the revenue decoupling mechanism, as proposed, and the investment recovery mechanism, as requested with modifications. In addition, based on the position of the MPSC Staff, the administrative law judge
recommended the disallowance of cost recovery for certain categories of historical capital expenditures incurred by Consumers
. If, in the final order in this case,
the MPSC were to adopt some or all of the administrative law judge’s recommendations, Consumers would be required to write off up to
$145 million
of assets
. A final order is expected by the end of August 2018.
|
•
|
Tax Cuts and Jobs Act:
The TCJA, which changed existing federal tax law and included numerous provisions that affect businesses, was signed into law in December 2017. In February 2018, the MPSC ordered Consumers to file various proceedings to determine the reduction in its electric and gas revenue requirements as a result of the TCJA. The MPSC also ordered Consumers to implement bill credits to reflect that reduction until customer rates are adjusted through Consumers’ general rate cases. Consumers filed the first of these proceedings in March 2018, requesting a
$49 million
reduction in its annual gas revenue requirement. The MPSC approved this reduction in June 2018, with credits to customer bills beginning in July 2018. Consumers filed the second proceeding in April 2018, requesting a
$113 million
reduction in its annual electric revenue requirement. The MPSC approved this reduction in July 2018, with credits to customer bills beginning in August 2018. These credits will reduce rates prospectively for the impact of the TCJA but do not include potential refunds associated with Consumers’ remeasurement of its deferred income taxes; these will be considered in a subsequent proceeding.
|
By October 2018, Consumers will file two more proceedings to address amounts collected from customers during 2018 through the implementation of the first two proceedings. Consumers’ liability for customer refunds for amounts over-collected during that time was
$88 million
at
June 30, 2018
.
Consumers will also file, by October 2018, additional proceedings to address the December 31, 2017 remeasurement of its deferred income taxes and any other impacts of the TCJA on customers.
Looking Forward
CMS Energy and Consumers will continue to consider the impact on the triple bottom line of people, planet, and profit in their daily operations as well as in their long-term strategic decisions. Consumers will continue to seek fair and timely regulatory treatment that will support its customer-driven investment plan, while pursuing cost-control initiatives that will allow it to maintain sustainable customer base rates. The Consumers Energy Way is an important means of realizing CMS Energy’s and Consumers’ purpose of achieving world class performance while delivering hometown service.
17
Results of Operations
CMS Energy Consolidated Results of Operations
|
In Millions, Except Per Share Amounts
|
|||||||||||||||||||||||||
|
Three Months Ended
|
Six Months Ended
|
||||||||||||||||||||||||
|
June 30
|
2018
|
2017
|
Change
|
2018
|
2017
|
Change
|
|||||||||||||||||||
|
Net Income Available to Common Stockholders
|
$
|
139
|
|
$
|
92
|
|
$
|
47
|
|
$
|
380
|
|
$
|
291
|
|
$
|
89
|
|
|||||||
|
Basic Earnings Per Average Common Share
|
$
|
0.49
|
|
$
|
0.33
|
|
$
|
0.16
|
|
$
|
1.35
|
|
$
|
1.04
|
|
$
|
0.31
|
|
|||||||
|
Diluted Earnings Per Average Common Share
|
$
|
0.49
|
|
$
|
0.33
|
|
$
|
0.16
|
|
$
|
1.35
|
|
$
|
1.04
|
|
$
|
0.31
|
|
|||||||
|
In Millions
|
|||||||||||||||||||||||||
|
Three Months Ended
|
Six Months Ended
|
||||||||||||||||||||||||
|
June 30
|
2018
|
2017
|
Change
|
2018
|
2017
|
Change
|
|||||||||||||||||||
|
Electric utility
|
$
|
130
|
|
$
|
94
|
|
$
|
36
|
|
$
|
269
|
|
$
|
218
|
|
$
|
51
|
|
|||||||
|
Gas utility
|
21
|
|
9
|
|
12
|
|
124
|
|
96
|
|
28
|
|
|||||||||||||
|
Enterprises
|
14
|
|
7
|
|
7
|
|
29
|
|
19
|
|
10
|
|
|||||||||||||
|
Corporate interest and other
|
(26
|
)
|
(18
|
)
|
(8
|
)
|
(42
|
)
|
(42
|
)
|
—
|
|
|||||||||||||
|
Net Income Available to Common Stockholders
|
$
|
139
|
|
$
|
92
|
|
$
|
47
|
|
$
|
380
|
|
$
|
291
|
|
$
|
89
|
|
|||||||
Presented in the following table are specific after-tax changes to CMS Energy’s
net income available to common stockholders
for the
three and six months ended June 30, 2018
versus
2017
:
|
In Millions
|
|||||||||||||||||
|
Three Months Ended
|
Six Months Ended
|
||||||||||||||||
|
June 30, 2017
|
$
|
92
|
|
$
|
291
|
|
|||||||||||
|
Reasons for the change
|
|||||||||||||||||
|
Consumers electric utility and gas utility
|
|||||||||||||||||
|
Electric sales
|
$
|
16
|
|
$
|
11
|
|
|||||||||||
|
Gas sales
|
14
|
|
34
|
|
|||||||||||||
|
Electric rate increase
|
13
|
|
25
|
|
|||||||||||||
|
Gas rate increase
|
6
|
|
16
|
|
|||||||||||||
|
OPEB Plan changes
|
13
|
|
27
|
|
|||||||||||||
|
2017 service restoration costs following severe storms
|
—
|
|
8
|
|
|||||||||||||
|
Depreciation and amortization
|
(5
|
)
|
(17
|
)
|
|||||||||||||
|
Other, including $9 million intercompany gain in 2017
|
(9
|
)
|
48
|
|
(25
|
)
|
79
|
|
|||||||||
|
Enterprises
|
|||||||||||||||||
|
Reduction of the corporate income tax rate due to the impacts of the TCJA
|
1
|
|
4
|
|
|||||||||||||
|
Higher earnings from equity method investees and lower maintenance expenses at subsidiaries
|
3
|
|
3
|
|
|||||||||||||
|
Expiration of indemnity obligation
|
3
|
|
3
|
|
|||||||||||||
|
Corporate interest and other
|
|||||||||||||||||
|
2017 elimination of an intercompany gain on the donation of CMS Energy stock
|
—
|
|
9
|
|
|||||||||||||
|
Lower fixed charges and administrative and other expenses
|
3
|
|
3
|
|
|||||||||||||
|
Lower tax benefit due to the impacts of the TCJA
|
(7
|
)
|
(8
|
)
|
|||||||||||||
|
Loss on the early extinguishment of debt
|
(4
|
)
|
(4
|
)
|
|||||||||||||
|
June 30, 2018
|
$
|
139
|
|
$
|
380
|
|
|||||||||||
18
Consumers Electric Utility Results of Operations
For the
three months ended June 30, 2018
, Consumers electric utility’s
net income available to common stockholders
was
$130 million
. This compares with
net income available to common stockholders
of
$94 million
for the
three months ended June 30, 2017
. In
2018
, higher net income was due primarily to a rate increase and higher sales as a result of favorable weather. Lower tax expense in 2018 resulting from the TCJA was offset fully by a reduction in revenue to reflect Consumers’ obligation to refund TCJA-related benefits to its customers. Presented in the following table are the detailed changes to the electric utility’s
net income available to common stockholders
for the
three months ended June 30, 2018
versus
2017
:
|
In Millions
|
||||||||
|
Three Months Ended June 30, 2017
|
$
|
94
|
|
|||||
|
Reasons for the change
|
||||||||
|
Electric deliveries
1
and rate increases
|
||||||||
|
Rate increase, including the impacts of the March 2018 order
|
$
|
19
|
|
|||||
|
Higher sales due primarily to favorable weather in 2018
|
20
|
|
||||||
|
Higher energy waste reduction program revenues
|
6
|
|
||||||
|
Increase in other revenues
|
1
|
|
$
|
46
|
|
|||
|
Revenue reserve for impacts of the TCJA
|
||||||||
|
Reserve for future customer refunds
2
|
(34
|
)
|
||||||
|
Maintenance and other operating expenses
|
||||||||
|
Mutual insurance distribution in 2018
|
3
|
|
||||||
|
Higher energy waste reduction program costs
|
(6
|
)
|
||||||
|
Higher other operating and maintenance expenses
|
(2
|
)
|
(5
|
)
|
||||
|
Depreciation and amortization
|
||||||||
|
Increased plant in service, reflecting higher capital spending
|
(4
|
)
|
||||||
|
General taxes
|
(1
|
)
|
||||||
|
Other income, net of expenses
|
||||||||
|
Impact of OPEB Plan changes approved in November 2017
|
10
|
|
|
|
||||
|
Other income, net of expenses
|
(1
|
)
|
9
|
|
||||
|
Interest charges
|
(1
|
)
|
||||||
|
Income taxes
|
||||||||
|
Reduction of the corporate income tax rate due to the impacts of the TCJA
|
27
|
|
||||||
|
Higher electric utility earnings
|
(6
|
)
|
||||||
|
Lower other income taxes
|
5
|
|
26
|
|
||||
|
Three Months Ended June 30, 2018
|
$
|
130
|
|
|||||
|
1
|
Deliveries to end-use customers were 9.2 billion kWh in
2018
and 9.0 billion kWh in
2017
.
|
|
2
|
See
Note 2, Regulatory Matters
.
|
19
For the
six months ended June 30, 2018
, Consumers electric utility’s
net income available to common stockholders
was
$269 million
. This compares with
net income available to common stockholders
of
$218 million
for the
six months ended June 30, 2017
. In
2018
, higher net income was due primarily to a rate increase and higher sales as a result of favorable weather. Lower tax expense in 2018 resulting from the TCJA was offset fully by a reduction in revenue to reflect Consumers’ obligation to refund TCJA-related benefits to its customers. Presented in the following table are the detailed changes to the electric utility’s
net income available to common stockholders
for the
six months ended June 30, 2018
versus
2017
:
|
In Millions
|
||||||||
|
Six Months Ended June 30, 2017
|
$
|
218
|
|
|||||
|
Reasons for the change
|
||||||||
|
Electric deliveries
1
and rate increases
|
||||||||
|
Rate increase, including the impacts of the March 2018 order
|
$
|
34
|
|
|||||
|
Higher sales due primarily to favorable weather in 2018
|
17
|
|
||||||
|
Higher energy waste reduction program revenues
|
15
|
|
||||||
|
Decrease in other revenues
|
(2
|
)
|
$
|
64
|
|
|||
|
Revenue reserve for impacts of the TCJA
|
||||||||
|
Reserve for future customer refunds
2
|
(69
|
)
|
||||||
|
Maintenance and other operating expenses
|
||||||||
|
2017 service restoration costs following severe storms
|
11
|
|
||||||
|
Mutual insurance distribution in 2018
|
7
|
|
||||||
|
Higher energy waste reduction program costs
|
(15
|
)
|
||||||
|
Higher other operating and maintenance expenses
|
(4
|
)
|
(1
|
)
|
||||
|
Depreciation and amortization
|
||||||||
|
Increased plant in service, reflecting higher capital spending
|
(10
|
)
|
||||||
|
General taxes
|
||||||||
|
Settlement of a property tax appeal related to the Campbell plant in 2018
|
9
|
|
||||||
|
Settlement of a property tax appeal related to the Zeeland plant in 2017
|
(10
|
)
|
||||||
|
Higher other general taxes
|
(1
|
)
|
(2
|
)
|
||||
|
Other income, net of expenses
|
||||||||
|
Impact of OPEB Plan changes approved in November 2017
|
21
|
|
||||||
|
2017 gain on the donation of CMS Energy stock
3
|
(9
|
)
|
||||||
|
Lower other income, net of expenses
|
(3
|
)
|
9
|
|
||||
|
Interest charges
|
||||||||
|
Higher other interest charges
|
(3
|
)
|
||||||
|
Income taxes
|
||||||||
|
Reduction of the corporate income tax rate due to the impacts of the TCJA
|
54
|
|
||||||
|
Research and development tax credits
4
|
6
|
|
||||||
|
Lower electric utility earnings
|
2
|
|
||||||
|
Lower other income taxes
|
1
|
|
63
|
|
||||
|
Six Months Ended June 30, 2018
|
$
|
269
|
|
|||||
|
1
|
Deliveries to end-use customers were 18.5 billion kWh in
2018
and 18.2 billion kWh in
2017
.
|
|
2
|
See
Note 2, Regulatory Matters
.
|
|
3
|
Gain at segment is eliminated on CMS Energy’s consolidated statements of income.
|
|
4
|
See
Note 9, Income Taxes
.
|
20
Consumers Gas Utility Results of Operations
For the
three months ended June 30, 2018
, Consumers gas utility’s
net income available to common stockholders
was
$21 million
. This compares with
net income available to common stockholders
of
$9 million
for the
three months ended June 30, 2017
. In
2018
, higher net income was due primarily to increased sales and a rate increase, offset partially by higher depreciation and property taxes on increased plant in service. Lower tax expense in 2018 resulting from the TCJA was offset fully by a reduction in revenue to reflect Consumers’ obligation to refund TCJA-related benefits to its customers. Presented in the following table are the detailed changes to the gas utility’s
net income available to common stockholders
for the
three months ended June 30, 2018
versus
2017
:
|
In Millions
|
||||||||
|
Three Months Ended June 30, 2017
|
$
|
9
|
|
|||||
|
Reasons for the change
|
||||||||
|
Gas deliveries
1
and rate increases
|
||||||||
|
Higher sales due primarily to favorable weather in 2018
|
$
|
12
|
|
|||||
|
Rate increase
|
8
|
|
||||||
|
Increase in other revenues
|
7
|
|
$
|
27
|
|
|||
|
Revenue reserve for impacts of the TCJA
|
||||||||
|
Reserve for future customer refunds
2
|
(10
|
)
|
||||||
|
Maintenance and other operating expenses
|
||||||||
|
Increased distribution, transmission, and customer operations expenses
|
(6
|
)
|
||||||
|
Higher other operating and maintenance expenses
|
(2
|
)
|
(8
|
)
|
||||
|
Depreciation and amortization
|
||||||||
|
Increased plant in service, reflecting higher capital spending
|
(3
|
)
|
||||||
|
General taxes
|
||||||||
|
Higher property tax, reflecting higher capital spending
|
(1
|
)
|
||||||
|
Other income, net of expenses
|
||||||||
|
Impact of OPEB Plan changes approved in November 2017
|
8
|
|
||||||
|
Interest charges
|
(2
|
)
|
||||||
|
Income taxes
|
||||||||
|
Reduction of the corporate income tax rate due to the impacts of the TCJA
|
5
|
|
||||||
|
Higher gas utility earnings
|
(4
|
)
|
1
|
|
||||
|
Three Months Ended June 30, 2018
|
$
|
21
|
|
|||||
|
1
|
Deliveries to end-use customers were 50 bcf in
2018
and 43 bcf in
2017
.
|
|
2
|
See
Note 2, Regulatory Matters
.
|
21
For the
six months ended June 30, 2018
, Consumers gas utility’s
net income available to common stockholders
was
$124 million
. This compares with
net income available to common stockholders
of
$96 million
for the
six months ended June 30, 2017
. In
2018
, higher net income was due primarily to increased sales and a rate increase, offset partially by higher depreciation and property taxes on increased plant in service. Lower tax expense in 2018 resulting from the TCJA was offset fully by a reduction in revenue to reflect Consumers’ obligation to refund TCJA-related benefits to its customers. Presented in the following table are the detailed changes to the gas utility’s
net income available to common stockholders
for the
six months ended June 30, 2018
versus
2017
:
|
In Millions
|
||||||||
|
Six Months Ended June 30, 2017
|
$
|
96
|
|
|||||
|
Reasons for the change
|
||||||||
|
Gas deliveries
1
and rate increases
|
||||||||
|
Higher sales due primarily to favorable weather in 2018
|
$
|
41
|
|
|||||
|
Rate increase
|
21
|
|
||||||
|
Higher energy waste reduction program revenues
|
17
|
|
||||||
|
Increase in other revenues
|
6
|
|
$
|
85
|
|
|||
|
Revenue reserve for impacts of the TCJA
|
||||||||
|
Reserve for future customer refunds
2
|
(37
|
)
|
||||||
|
Maintenance and other operating expenses
|
||||||||
|
Higher energy waste reduction program costs
|
(17
|
)
|
||||||
|
Increased distribution, transmission, and customer operations expenses
|
(10
|
)
|
||||||
|
Higher other operating and maintenance expenses
|
(3
|
)
|
(30
|
)
|
||||
|
Depreciation and amortization
|
||||||||
|
Increased plant in service, reflecting higher capital spending
|
(13
|
)
|
||||||
|
General taxes
|
||||||||
|
Higher property taxes, reflecting higher capital spending
|
(6
|
)
|
||||||
|
Other income, net of expenses
|
||||||||
|
Impact of OPEB Plan changes approved in November 2017
|
16
|
|
||||||
|
2017 gain on the donation of CMS Energy stock
3
|
(5
|
)
|
11
|
|
||||
|
Interest charges
|
(3
|
)
|
||||||
|
Income taxes
|
||||||||
|
Reduction of the corporate income tax rate due to the impacts of the TCJA
|
26
|
|
||||||
|
Higher gas utility earnings
|
(4
|
)
|
||||||
|
Higher other income taxes
|
(1
|
)
|
21
|
|
||||
|
Six Months Ended June 30, 2018
|
$
|
124
|
|
|||||
|
1
|
Deliveries to end-use customers were 183 bcf in
2018
and 162 bcf in
2017
.
|
|
2
|
See
Note 2, Regulatory Matters
.
|
|
3
|
Gain at segment is eliminated on CMS Energy’s consolidated statements of income.
|
22
Enterprises Results of Operations
Presented in the following table are the detailed after-tax changes to the enterprises segment’s
net income available to common stockholders
for the
three months ended June 30, 2018
versus
2017
:
|
In Millions
|
||||||
|
Three Months Ended June 30, 2017
|
$
|
7
|
|
|||
|
Reason for the change
|
||||||
|
Higher earnings from equity method investees and lower maintenance expenses at subsidiaries
|
$
|
3
|
|
|||
|
Expiration of indemnity obligation
|
3
|
|
||||
|
Reduction of corporate income tax rate due to the impacts of the TCJA
|
1
|
|
||||
|
Three Months Ended June 30, 2018
|
$
|
14
|
|
|||
Presented in the following table are the detailed after-tax changes to the enterprises segment’s
net income available to common stockholders
for the
six months ended June 30, 2018
versus
2017
:
|
In Millions
|
||||||
|
Six Months Ended June 30, 2017
|
$
|
19
|
|
|||
|
Reason for the change
|
||||||
|
Reduction of corporate income tax rate due to the impacts of the TCJA
|
$
|
4
|
|
|||
|
Expiration of indemnity obligation
|
3
|
|
||||
|
Lower maintenance expenses at subsidiaries
|
3
|
|
||||
|
Six Months Ended June 30, 2018
|
$
|
29
|
|
|||
Corporate Interest and Other Results of Operations
Presented in the following table are the detailed after-tax changes to corporate interest and other results for the
three months ended June 30, 2018
versus
2017
:
|
In Millions
|
||||||
|
Three Months Ended June 30, 2017
|
$
|
(18
|
)
|
|||
|
Reasons for the change
|
||||||
|
Lower fixed charges and administrative and other expenses
|
$
|
3
|
|
|||
|
Lower tax benefit due to the impacts of the TCJA
|
(7
|
)
|
||||
|
Loss on the early extinguishment of debt
|
(4
|
)
|
||||
|
Three Months Ended June 30, 2018
|
$
|
(26
|
)
|
|||
Presented in the following table are the detailed after-tax changes to corporate interest and other results for the
six months ended June 30, 2018
versus
2017
:
|
In Millions
|
||||||
|
Six Months Ended June 30, 2017
|
$
|
(42
|
)
|
|||
|
Reasons for the change
|
|
|
||||
|
2017 elimination of an intercompany gain on the donation of CMS Energy stock
1
|
$
|
9
|
|
|||
|
Lower fixed charges and administrative and other expenses
|
3
|
|
||||
|
Lower tax benefit due to the impacts of the TCJA
|
(8
|
)
|
||||
|
Loss on the early extinguishment of debt
|
(4
|
)
|
||||
|
Six Months Ended June 30, 2018
|
$
|
(42
|
)
|
|||
23
|
1
|
Gain at electric and gas utility segments is eliminated on CMS Energy’s consolidated statements of income.
|
Cash Position, Investing, and Financing
At
June 30, 2018
, CMS Energy had
$501 million
of consolidated cash and cash equivalents, which included
$24 million
of restricted cash and cash equivalents. At
June 30, 2018
, Consumers had
$276 million
of consolidated cash and cash equivalents, which included
$22 million
of restricted cash and cash equivalents. For additional details, see
Note 12, Cash and Cash Equivalents
.
Operating Activities
For the
six months ended June 30, 2018
,
net cash provided by operating activities
at CMS Energy
increased
$297 million
compared with 2017 and
net cash provided by operating activities
at Consumers
decreased
$27 million
compared with
2017
. The TCJA had no impact on net cash provided by operating activities for the
six months ended June 30, 2018
, because CMS Energy made no income tax payments, and because Consumers’ rates do not yet reflect the anticipated reduction in its revenue requirements related to the TCJA. Presented in the following table are specific components of the changes to
net cash provided by operating activities
for the
six months ended June 30, 2018
versus
2017
:
|
In Millions
|
||||
|
CMS Energy, including Consumers
|
||||
|
Six Months Ended June 30, 2017
|
$
|
1,119
|
|
|
|
Reasons for the change
|
||||
|
Higher net income
|
$
|
89
|
|
|
|
Favorable impact of changes in core working capital,
1
due primarily to the receipt of alternative minimum tax credit refunds
|
123
|
|
||
|
Favorable impact of changes in other assets and liabilities, including the collection of an increased surcharge to fund Consumers’ energy waste reduction plan and lower prepayments of expenses
|
85
|
|
||
|
Six Months Ended June 30, 2018
|
$
|
1,416
|
|
|
|
Consumers
|
||||
|
Six Months Ended June 30, 2017
|
$
|
1,125
|
|
|
|
Reasons for the change
|
||||
|
Higher net income
|
$
|
79
|
|
|
|
Unfavorable impact of changes in core working capital,
1
including lower overcollections of PSCR charges and higher vendor payments, offset largely by higher sales
|
(3
|
)
|
||
|
Unfavorable impact of changes in other assets and liabilities, due primarily to higher income tax payments to CMS Energy, offset partially by the collection of an increased surcharge to fund Consumers’ energy waste reduction plan and lower prepayments of expenses
|
(103
|
)
|
||
|
Six Months Ended June 30, 2018
|
$
|
1,098
|
|
|
|
1
|
Core working capital comprises accounts receivable, notes receivable, accrued revenue, inventories, accounts payable, and accrued rate refunds related to PSCR and GCR overrecoveries.
|
24
Investing Activities
Presented in the following table are specific components of the changes to
net cash used in investing activities
for the
six months ended June 30, 2018
versus
2017
:
|
In Millions
|
||||
|
CMS Energy, including Consumers
|
||||
|
Six Months Ended June 30, 2017
|
$
|
(806
|
)
|
|
|
Reasons for the change
|
||||
|
Higher capital expenditures
|
$
|
(126
|
)
|
|
|
Changes in EnerBank notes receivable, reflecting growth in consumer lending
|
(55
|
)
|
||
|
Proceeds from the sale of EnerBank notes receivable in 2017
|
(19
|
)
|
||
|
Other investing activities
|
(2
|
)
|
||
|
Six Months Ended June 30, 2018
|
$
|
(1,008
|
)
|
|
|
Consumers
|
||||
|
Six Months Ended June 30, 2017
|
$
|
(802
|
)
|
|
|
Reasons for the change
|
||||
|
Higher capital expenditures
|
$
|
(118
|
)
|
|
|
Decrease in DB SERP investment
|
6
|
|
||
|
Six Months Ended June 30, 2018
|
$
|
(914
|
)
|
|
Financing Activities
Presented in the following table are specific components of
net cash provided by (used in) financing activities
for the
six months ended June 30, 2018
and
2017
:
|
In Millions
|
||||
|
CMS Energy, including Consumers
|
||||
|
Six Months Ended June 30, 2017
|
$
|
(129
|
)
|
|
|
Reasons for the change
|
||||
|
Lower debt issuances
|
$
|
(129
|
)
|
|
|
Higher debt retirements
|
(172
|
)
|
||
|
Changes in EnerBank certificates of deposit, reflecting higher borrowings
|
163
|
|
||
|
Lower repayments under Consumers’ commercial paper program
|
228
|
|
||
|
Lower issuances of common stock under the continuous equity offering program
|
(40
|
)
|
||
|
Higher payments of dividends on common stock
|
(16
|
)
|
||
|
Higher debt issuance costs and early debt retirement payments
|
(16
|
)
|
||
|
Six Months Ended June 30, 2018
|
$
|
(111
|
)
|
|
|
Consumers
|
||||
|
Six Months Ended June 30, 2017
|
$
|
(111
|
)
|
|
|
Reasons for the change
|
||||
|
Higher debt issuances
|
$
|
195
|
|
|
|
Higher debt retirements
|
(67
|
)
|
||
|
Lower repayments under Consumers’ commercial paper program
|
228
|
|
||
|
Lower stockholder contribution from CMS Energy
|
(200
|
)
|
||
|
Higher payments of dividends on common stock
|
(9
|
)
|
||
|
Higher debt issuance costs and early debt retirement payments
|
(9
|
)
|
||
|
Six Months Ended June 30, 2018
|
$
|
27
|
|
|
25
Capital Resources and Liquidity
CMS Energy uses dividends and tax-sharing payments from its subsidiaries and external financing and capital transactions to invest in its utility and non‑utility businesses, retire debt, pay dividends, and fund its other obligations. The ability of CMS Energy’s subsidiaries, including Consumers, to pay dividends to CMS Energy depends upon each subsidiary’s revenues, earnings, cash needs, and other factors. In addition, Consumers’ ability to pay dividends is restricted by certain terms included in its debt covenants and articles of incorporation and potentially by FERC requirements and provisions under the Federal Power Act and the Natural Gas Act. For additional details on Consumers’ dividend restrictions, see
Note 4, Financings and Capitalization—Dividend Restrictions
.
For the
six months ended June 30, 2018
, Consumers paid
$245 million
in dividends on its common stock to CMS Energy.
As a result of a provision in the TCJA, CMS Energy is required to recover all alternative minimum tax credits over the next four years through offsets of regular tax and through cash refunds. CMS Energy expects to be able to offset regular tax through the use of federal net operating loss carryforwards and, accordingly, receive alternative minimum tax credit refunds through 2021. Another provision in the TCJA excludes rate-regulated utilities from 100 percent cost expensing of certain property after September 27, 2017. This provision will cause Consumers to make higher tax-sharing payments to CMS Energy during that period, which in turn might permit CMS Energy to maintain lower levels of debt in order to invest in its businesses, pay dividends, and fund its general obligations. Consumers expects to have sufficient funding sources available to issue credits to customers for all impacts of the TCJA.
In March 2017, CMS Energy entered into an updated continuous equity offering program
. Under this program, CMS Energy may
sell, from time to time in “at the market” offerings, common stock having an aggregate sales price of up to
$100 million
.
CMS Energy issued common stock under this program and received net proceeds of
$29 million
in May 2018 and
$70 million
in June 2017. CMS Energy plans to file a new prospectus supplement to allow additional issuances of common stock.
Consumers uses cash flows generated from operations and external financing transactions, as well as stockholder contributions from CMS Energy, to fund capital expenditures, retire debt, pay dividends, contribute to its employee benefit plans, and fund its other obligations. Accelerated pension funding in prior years and several initiatives to reduce costs have helped improve cash flows from operating activities. Consumers anticipates continued strong cash flows from operating activities for
2018
and beyond.
In July 2018, Consumers entered into a bond purchase agreement to issue an aggregate principal amount of
$500 million
in first mortgage bonds through a private placement. The issuance and funding of the bonds is expected to occur in October 2018.
Access to the financial and capital markets depends on CMS Energy’s and Consumers’ credit ratings and on market conditions. As evidenced by past financing transactions, CMS Energy and Consumers have had ready access to these markets. Barring major market dislocations or disruptions, CMS Energy and Consumers expect to continue to have ready access to the financial and capital markets. If access to these markets were to diminish or otherwise become restricted, CMS Energy and Consumers would implement contingency plans to address debt maturities, which could include reduced capital spending.
At
June 30, 2018
, CMS Energy had
$549 million
of its revolving credit facility available and Consumers had
$1,068 million
of its secured revolving credit facilities available. CMS Energy and Consumers use these credit facilities for general working capital purposes and to issue letters of credit. An additional source of liquidity is
Consumers’ commercial paper program
, which allows Consumers to
issue, in one or more placements
,
up to
$500 million
in the aggregate in commercial paper notes
with maturities of up to 365 days and that bear interest at fixed or floating rates. These issuances are supported by Consumers’ revolving credit facilities
.
While the amount of outstanding commercial paper does not reduce the available capacity of the revolving credit facilities, Consumers does not intend to issue commercial paper in an amount exceeding the available capacity of the facilities. At
June 30, 2018
, no commercial paper
26
notes were outstanding under this program.
For additional details on CMS Energy’s and Consumers’ revolving credit facilities and commercial paper program, see
Note 4, Financings and Capitalization
.
Certain of CMS Energy’s and Consumers’ credit agreements, debt indentures, and other facilities contain covenants that require CMS Energy and Consumers to maintain certain financial ratios, as defined therein. At
June 30, 2018
, no default had occurred with respect to any financial covenants contained in CMS Energy’s and Consumers’ credit agreements, debt indentures, or other facilities. CMS Energy and Consumers were each in compliance with these covenants as of
June 30, 2018
, as presented in the following table:
|
June 30, 2018
|
|||
|
Credit Agreement, Indenture, or Facility
|
Limit
|
Actual
|
|
|
CMS Energy, parent only
|
|||
|
Debt to EBITDA
1
|
<
|
6.0 to 1.0
|
4.2 to 1.0
|
|
Debt to EBITDA
2
|
<
|
6.25 to 1.0
|
4.1 to 1.0
|
|
Consumers
|
|||
|
Debt to Capital
3
|
<
|
0.65 to 1.0
|
0.46 to 1.0
|
|
1
|
Applies to CMS Energy’s term loan agreements.
|
|
2
|
Applies to CMS Energy’s revolving credit agreement.
In June 2018, CMS Energy amended this revolving credit facility, eliminating the security provided by Consumers common stock, and extending the expiration date to June 2023.
|
|
3
|
Applies to Consumers’
$850 million
and
$250 million
revolving credit agreements and its $35 million and $30 million reimbursement agreements.
|
Components of CMS Energy’s and Consumers’ cash management plan include controlling operating expenses and capital expenditures and evaluating market conditions for financing and refinancing opportunities. CMS Energy’s and Consumers’ present level of cash and expected cash flows from operating activities, together with access to sources of liquidity, are anticipated to be sufficient to fund the companies’ contractual obligations for
2018
and beyond.
Off-Balance-Sheet Arrangements
CMS Energy, Consumers, and certain of their subsidiaries enter into various arrangements in the normal course of business to facilitate commercial transactions with third parties. These arrangements include indemnities, surety bonds, letters of credit, and financial and performance guarantees. Indemnities are usually agreements to reimburse a counterparty that may incur losses due to outside claims or breach of contract terms. The maximum payment that could be required under a number of these indemnity obligations is not estimable; the maximum obligation under indemnities for which such amounts were estimable was
$153 million
at
June 30, 2018
. While CMS Energy and Consumers believe it is unlikely that they will incur any material losses related to indemnities they have not recorded as liabilities, they cannot predict the impact of these contingent obligations on their liquidity and financial condition. For additional details on these and other guarantee arrangements, see
Note 3, Contingencies and Commitments—Guarantees
.
Outlook
Several business trends and uncertainties may affect CMS Energy’s and Consumers’ financial condition and results of operations. These trends and uncertainties could have a material impact on CMS Energy’s and Consumers’ consolidated income, cash flows, or financial position. For additional details regarding
27
these and other uncertainties, see
Forward-Looking Statements and Information
;
Note 2, Regulatory Matters
;
Note 3, Contingencies and Commitments
; and
Part II—Item 1A. Risk Factors
.
Consumers Electric Utility Outlook and Uncertainties
Energy Resource Planning:
While Consumers continues to experience increasing demand for electricity due to Michigan’s growing economy and increased use of air conditioning, consumer electronics, and other electric devices, it expects that increase in demand to be offset by the effects of energy efficiency and conservation.
In June 2018, Consumers filed an IRP with the MPSC
detailing its long-term strategy for delivering reliable and affordable energy to its customers through the increased use of energy efficiency and customer demand management programs and additional renewable energy.
The IRP supports Consumers’ clean energy breakthrough goal of reducing carbon emissions by 80 percent and eliminating the use of coal to generate electricity by 2040.
Specifically, in its IRP filing, Consumers requests the MPSC’s approval of:
|
•
|
the retirement of two coal-fueled generating units, totaling 515 MW, in 2023
|
|
•
|
the retirement of two coal-fueled and two oil- and natural gas-fueled generating units, totaling 1,815 MW, in 2031
|
|
•
|
the retirement of its remaining coal-fueled generating unit, totaling 780 MW, in 2039
|
Consumers proposes replacing the capacity to be retired with:
|
•
|
demand response programs
|
|
•
|
increased energy efficiency
|
|
•
|
increased renewable energy generation
|
|
•
|
grid modernization tools
|
|
•
|
battery storage
|
The IRP proposes renewable energy levels beyond the standard set in the 2016 Energy Law, which raised the renewable energy standard from the present ten-percent requirement to 15 percent by 2021. Specifically, the IRP proposes
renewable energy levels of 25 percent by 2025, over 35 percent by 2030, and over 40 percent by 2040
, to be achieved mainly through the economic development of up to 6,000 MW of solar generation and 550 MW of wind generation.
The IRP filing also incorporates Consumers’ existing plans to purchase additional electricity from the T.E.S. Filer City plant following the conversion of the plant to use natural gas as its primary fuel instead of coal.
The conversion is expected to increase the amount of capacity and energy produced by the plant from 73 MW to 225 MW. In May 2017, in anticipation of the planned conversion, T.E.S. Filer City and Consumers agreed to amend their PPA. Under the amendment to the PPA, Consumers will purchase the increased capacity and electricity generated by the converted facility for 15 years. The original PPA was set to expire in 2025. In February 2018, the MPSC approved the amendment to the PPA. The amendment is contingent on a finding by FERC that sales made under the amended PPA are exempt from, or authorized under, Section 205 of the Federal Power Act and on commercial operation of the converted facility on or before June 1, 2022. T.E.S. Filer City expects the converted plant to be operational in 2020.
PURPA:
PURPA requires Consumers to purchase power from qualifying cogeneration and small power production facilities at a price approved by the MPSC that is meant to represent Consumers’ “avoided cost” of generating power or purchasing power from another source. In November 2017, the MPSC issued an order setting a new avoided-cost formula to determine the price that Consumers must pay to purchase power under PURPA. Among other things, the MPSC’s order changes the basis of Consumers’ avoided cost from the cost of coal-fueled generating units to that of natural gas-fueled generating units. The MPSC order also assigns more capacity value to qualifying facilities that are consistently able to
28
generate electricity during peak times. Although the costs Consumers incurs to purchase power from qualifying facilities are passed on to customers, the order could result in mandated purchases of generation, potentially at above-market prices, and reduce Consumers’ need for new owned generation. This in turn could have a material adverse effect on Consumers’ long-term capital investment plan and the affordability of future customer rates.
In December 2017, Consumers filed a petition with the MPSC requesting corrections to the pricing calculations and capacity purchase model set in the order. Subsequently, the MPSC suspended the implementation of the order and reopened the proceeding. In February 2018, the MPSC issued an order limiting Consumers’ obligation to pay the full avoided capacity cost, which is based on the cost of a natural gas combustion turbine under the new avoided-cost formula, to existing qualifying facilities upon the expiration of outstanding contracts and to the first 150 MW of new generation projects that qualify under PURPA. The February 2018 order also set a schedule to resolve the remaining issues.
In its June 2018 IRP filing, Consumers proposed a new method of calculating its avoided cost, based on a competitive bidding process, which will enable Consumers to purchase energy from new generation at the lowest cost and mitigate the risk of forced purchases of renewable generation. In accordance with the 2016 Energy Law, Consumers also proposed a financial compensation mechanism to recognize the financial impacts associated with procuring capacity from third parties and enable Consumers to earn a financial incentive on PPAs entered into through the proposed competitive bidding process.
Renewable Energy Plan:
The 2016 Energy Law
raised the renewable energy standard from the present ten-percent requirement to
15 percent
in
2021
, with an interim target of
12.5 percent
in
2019
. Consumers is required to submit RECs, which represent proof that the associated electricity was generated from a renewable energy resource, in an amount equal to at least the required percentage of Consumers’ electric sales volume each year. Under its renewable energy plan, Consumers expects to meet its renewable energy requirement each year with a combination of newly generated RECs and previously generated RECs carried over from prior years.
In conjunction with its renewable energy plan, Consumers obtained the MPSC’s approval to construct two additional phases at its Cross Winds
®
Energy Park. Phase II of the park, with a nameplate capacity of 44 MW, became operational in January 2018. Consumers began construction of Phase III, with a planned nameplate capacity of 76 MW, in June 2017 and expects it to be operational in 2020. Both phases of the project are expected to qualify for certain federal production tax credits, which are expected to generate cost savings that will be passed on to customers.
In September 2017, Consumers filed amendments to its renewable energy plan with the MPSC, requesting approval to acquire up to 525 MW of new wind generation projects and up to 100 MW of new solar generation projects in order to meet its renewable energy requirement. In May 2018, as a result of requests for proposals issued in 2017 to acquire wind and solar generation projects within MISO’s service territory, Consumers entered into an agreement to purchase a wind generation project under development, with capacity of up to 150 MW, in Gratiot County, Michigan. Consumers expects to begin construction in May 2019 and that the project will be completed and operational in 2020. The agreement is subject to MPSC approval.
In June 2018, Consumers issued additional requests for proposals to acquire up to 400 MW of wind generation projects ranging in size from 75 MW to 200 MW and up to 100 MW of solar generation projects at least 10 MW in size. The projects are required to be located in Michigan and operational by 2021. Any contracts entered into as a result of the requests for proposals would be subject to MPSC approval.
Voluntary Large Customer Renewable Energy Pilot Program:
In February 2018, Consumers began providing service under a pilot program that provides large full-service electric customers with the opportunity to advance the development of renewable energy beyond the requirements of the 2016 Energy Law. Under the pilot program, customers may match up to 100 percent of their energy use with
29
renewable energy generated from wind resources. In August 2017, the MPSC conditionally approved the pilot program through October 2018 and instructed Consumers to submit the program for review as a voluntary green pricing program under provisions of the 2016 Energy Law. Consumers submitted this program for review in October 2017.
Electric Customer Deliveries and Revenue:
Consumers’ electric customer deliveries are seasonal and largely dependent on Michigan’s economy. The consumption of electric energy typically increases in the summer months, due primarily to the use of air conditioners and other cooling equipment. In addition, Consumers’ electric rates, which follow a seasonal rate design, are higher in the summer months than in the remaining months of the year.
Consumers expects weather-normalized electric deliveries in
2018
and over the next five years to
remain stable
relative to
2017
. This outlook reflects modest
growth in electric demand offset by the effects of energy waste reduction programs
and appliance efficiency standards. Actual delivery levels will depend on:
|
•
|
energy conservation measures and results of energy waste reduction programs
|
|
•
|
weather fluctuations
|
|
•
|
Michigan’s economic conditions, including utilization, expansion, or contraction of manufacturing facilities, population trends, and housing activity
|
Electric ROA:
Under Michigan law, electric customers in Consumers’ service territory are allowed to buy electric generation service from alternative electric suppliers in an aggregate amount up to ten percent of Consumers’ weather-normalized retail sales for the preceding calendar year. At
June 30, 2018
, electric deliveries under the ROA program were at the ten-percent limit. Of Consumers’ 1.8 million electric customers, 287 customers, or 0.02 percent, purchased electric generation service under the ROA program.
The 2016 Energy Law, which became effective in April 2017, established a path to ensure that forward capacity is secured for all electric customers in Michigan, including customers served by alternative electric suppliers under ROA. The new law also authorized the MPSC to ensure that alternative electric suppliers have procured enough capacity to cover their anticipated capacity requirements for the four-year forward period. In November 2017, the MPSC issued an order establishing a state reliability mechanism for Consumers. Under this mechanism, beginning June 1, 2018, if an alternative electric supplier does not demonstrate that it has procured its capacity requirements for the four-year forward period, its customers will pay a set charge to the utility for capacity that is not provided by the alternative electric supplier. For the MISO planning year beginning June 1, 2018, all alternative electric suppliers have demonstrated that they have procured their capacity requirements.
In June 2018, the MPSC issued an order requiring all electric suppliers to demonstrate that a portion of the capacity procured to serve customers during peak demand times is located in the MISO footprint in Michigan’s Lower Peninsula. In July 2018, the Michigan Court of Appeals issued a decision that the MPSC does not have statutory authority to implement such a requirement for alternative electric suppliers. Consumers believes the 2016 Energy Law does give such authorization to the MPSC, and plans to file an application for leave to appeal the Court of Appeals’ decision to the Michigan Supreme Court. The Michigan Supreme Court has discretion on whether to grant an application for leave to appeal.
Electric Rate Matters:
Rate matters are critical to Consumers’ electric utility business. For additional details on rate matters, see
Note 2, Regulatory Matters
.
30
2018 Electric Rate Case
:
In May 2018, Consumers filed an application with the MPSC seeking an annual rate increase of
$58 million
, based on a
10.75 percent
authorized return on equity. The filing requests authority to recover new investment in system reliability, environmental compliance, and technology enhancements.
Presented in the following table are the components of the requested increase in revenue:
|
In Millions
|
|||
|
Components of the requested rate increase
|
|||
|
Investment in rate base
|
$
|
95
|
|
|
Cost of capital
|
62
|
|
|
|
Operating and maintenance costs
|
19
|
|
|
|
Working capital
|
5
|
|
|
|
Effects of TCJA
|
(113
|
)
|
|
|
Gross margin
|
(10
|
)
|
|
|
Total
|
$
|
58
|
|
The filing also seeks approval of an investment recovery mechanism that would provide for an additional annual rate increase of
$49 million
beginning in 2020 and another
$48 million
beginning in 2021 for incremental investments that Consumers plans to make for distribution infrastructure, subject to reconciliation.
Electric Environmental Outlook
:
Consumers’ operations are subject to various state and federal environmental laws and regulations. Consumers estimates that it will incur capital expenditures of $0.4 billion from
2018
through 2022 to continue to comply with RCRA, the Clean Water Act, the Clean Air Act, and numerous state and federal environmental regulations. Consumers expects to recover these costs in customer rates, but cannot guarantee this result. Consumers’ primary environmental compliance focus includes, but is not limited to, the following matters.
Air Quality:
CSAPR, which became effective in 2015, requires Michigan and 27 other states to improve air quality by reducing power plant emissions that, according to EPA computer models, contribute to ground-level ozone and fine particle pollution in other downwind states. In 2016, the EPA finalized new ozone season standards for CSAPR, which became effective in May 2017. CSAPR is presently being litigated; however, any decision will not impact Consumers’ compliance strategy, as Consumers expects its emissions to be within the CSAPR allowance allocations.
In 2012, the EPA published emission standards for electric generating units, based on Section 112 of the Clean Air Act, calling the final rule MATS. Under MATS, all of Consumers’ existing coal-fueled electric generating units were required to add additional controls for hazardous air pollutants. Consumers met the extended deadline of April 2016 for five coal-fueled units and two oil/gas-fueled units it continues to operate and retired its
seven
remaining coal-fueled units. MATS is presently being litigated, but any decision is not expected to impact Consumers’ MATS compliance strategy. In addition, Consumers must comply with the Michigan Mercury Rule and with its settlement agreement with the EPA entered into in 2014 concerning opacity and NSR.
In 2015, the EPA released its new rule to lower the NAAQS for ozone.
The new ozone NAAQS will make it more difficult to construct or modify power plants in areas of the country that have not met the new ozone standard.
In April 2018, the EPA designated certain areas of Michigan as not meeting the new standard;
none of Consumers’ fossil-fuel-fired generating units are located in these areas. Some of Consumers’ compressor stations are located in areas impacted by the rule, but Consumers expects only minor permitting impacts if those units are modified in the future. The NAAQS for ozone are presently being litigated. Consumers does not expect that any decision will have a material adverse impact on its generating assets.
31
Consumers’ strategy to comply with air quality regulations, including CSAPR, NAAQS, and MATS, as well as its legal obligations, involved the installation and operation of emission control equipment at some facilities and the suspension of operations at others; however, Consumers continues to evaluate these rules in conjunction with other EPA rulemakings, litigation, and congressional action. This evaluation could result in:
|
•
|
a change in Consumers’ fuel mix
|
|
•
|
changes in the types of generating units Consumers may purchase or build in the future
|
|
•
|
changes in how certain units are used
|
|
•
|
the retirement, mothballing, or repowering with an alternative fuel of some of Consumers’ generating units
|
|
•
|
changes in Consumers’ environmental compliance costs
|
Greenhouse Gases:
There have been numerous legislative and regulatory initiatives at the state, regional, national, and international levels that involve the potential regulation of greenhouse gases. Consumers continues to monitor and comment on these initiatives and to follow litigation involving greenhouse gases.
In 2015, the EPA finalized new rules pursuant to Section 111(b) of the Clean Air Act to limit carbon dioxide emissions from new electric generating units. New coal-fueled units will not be able to meet this limit without installing carbon dioxide control equipment using such methods as carbon capture and sequestration. In addition, the EPA finalized new rules pursuant to Section 111(b) of the Clean Air Act to limit carbon dioxide emissions from modified or reconstructed electric generating units. Both of these rules are being litigated.
Also in 2015, the EPA published final rules pursuant to Section 111(d) of the Clean Air Act to limit carbon dioxide emissions from existing electric generating units, calling the rules the “Clean Power Plan.” The rules required a 32-percent nationwide reduction in carbon emissions from existing power plants by 2030 (based on 2005 levels), and states choosing not to develop their own implementation plans would be subject to the federal plan. Certain states, corporations, and industry groups initiated litigation opposing the proposed Clean Power Plan, and in 2016, the U.S. Supreme Court stayed the Clean Power Plan while the litigation proceeded. In March 2017, the EPA and other federal agencies were directed to review rules and policies that burden domestic energy production, including the Clean Power Plan. The EPA subsequently filed motions to hold the Section 111(b) and Clean Power Plan litigation in abeyance while it reconsiders the rule. In October 2017, the EPA published a proposal to repeal the Clean Power Plan and is reviewing comments received.
The EPA has also announced that it intends to begin the rulemaking process for a replacement rule that conforms to the new legal interpretation set forth in the published proposed repeal of the Clean Power Plan. In December 2017, the EPA published an advance notice of proposed rulemaking soliciting information on whether the EPA should replace the Clean Power Plan and, if so, how it should be replaced. It is expected that the EPA will propose a replacement rule in the summer of 2018. Consumers does not expect that any changes to the Clean Power Plan will have an adverse impact on its environmental strategy.
In 2015, a group of 195 countries, including the U.S., finalized the Paris Agreement, which governs carbon dioxide reduction measures beginning in 2020. Although the U.S. subsequently withdrew from the Paris Agreement, it has stated a desire to renegotiate a new agreement in the future. Consumers does not expect any adverse changes to its environmental strategy as a result of these events.
While Consumers cannot predict the outcome of changes in U.S. policy or of other legislative or regulatory initiatives involving the potential regulation of greenhouse gases, it intends to continue to move forward with its clean energy plan, its present carbon reduction target, and its emphasis on supply diversity. Consumers will continue to monitor regulatory and legislative activity and related litigation regarding greenhouse gas emissions standards that may affect electric generating units.
32
Severe weather events and climate change associated with increasing levels of greenhouse gases could affect the companies’ facilities and energy sales and could have a material impact on the companies’ future results of operations. Consumers is unable to predict these events or their financial impact; however, Consumers plans for adverse weather and takes steps to reduce its potential impact.
Litigation, as well as federal laws, EPA regulations regarding greenhouse gases, or similar treaties, state laws, or rules, if enacted or ratified, could ultimately require Consumers to replace equipment, install additional emission control equipment, purchase emission allowances, curtail operations, arrange for alternative sources of supply, or take other steps to manage or lower the emission of greenhouse gases. Although associated capital or operating costs relating to greenhouse gas regulation or legislation could be material and cost recovery cannot be assured, Consumers expects to recover these costs and capital expenditures in rates consistent with the recovery of other reasonable costs of complying with environmental laws and regulations.
CCRs:
In 2015, the EPA published a final rule regulating CCRs, such as coal ash, under RCRA. The final rule adopts minimum standards for beneficially reusing and disposing of non‑hazardous CCRs. The rule establishes new minimum requirements for site location, groundwater monitoring, flood protection, storm water design, fugitive dust control, and public disclosure of information. The rule also sets out conditions under which CCR units would be forced to cease receiving CCR and non‑CCR waste and initiate closure based on the inability to achieve minimum safety standards, meet a location standard, or meet minimum groundwater standards. Consumers has received approval of and has begun work to close some existing ash ponds and replace them with double-lined ash ponds or concrete infrastructure. Consumers will continue to develop additional work plans for submission to the MDEQ to ensure coordination between federal and state requirements.
Furthermore, Congress passed legislation in 2016 that allows states to develop a permitting program for CCR under RCRA, and Michigan is taking legislative steps to adopt such a program. In March 2018, the EPA proposed the first of two rules intended to amend the 2015 final rule. In the proposed rule, the EPA put forth several provisions that would allow states or the EPA to incorporate flexibilities into their permitting process. Consumers may need to adjust its recorded ARO associated with coal ash disposal sites depending on the outcome of its submissions to the MDEQ and on a future RCRA permitting program under MDEQ, if the EPA approves a state-level program. Consumers has historically been authorized to recover in electric rates costs incurred related to cleanup and closure of coal ash disposal sites.
Water:
The EPA’s rule to regulate existing electric generating plant cooling water intake systems under Section 316(b) of the Clean Water Act became effective in 2014. The rule is aimed at reducing alleged harmful impacts on fish and shellfish. In April 2018, Consumers submitted to the MDEQ for review and approval all required studies and recommended plans to comply with Section 316(b).
In 2015, the EPA released its final effluent limitation guidelines. These guidelines, which are presently being litigated, set stringent new requirements for the discharge from electric generating units into wastewater streams. In August 2017, the EPA announced that it will undertake a rulemaking to replace specific portions of the rule. In September 2017, the EPA proposed delaying the compliance start dates for two years, but maintained the compliance end dates. Rulemaking is expected to conclude in late 2018 or early 2019. Consumers does not expect any adverse changes to its environmental strategy as a result of any revisions to the rule.
In 2015, the EPA and the U.S. Army Corps of Engineers published a final rule redefining “waters of the United States,” which designates the EPA’s jurisdiction under the Clean Water Act. Numerous states and other interested parties, including Michigan’s Attorney General, have filed suits in federal courts to block the rule, which subsequently was stayed in 2015 while litigation ensued. In January 2018, the U.S. Supreme Court unanimously ruled that the federal district courts, not the federal appellate courts, had jurisdiction over challenges to the 2015 rule. Consequently, in February 2018, the U.S. Court of Appeals for the Sixth Circuit lifted the stay of the rule. The EPA has published a notice that prevents the
33
2015 rule from going into effect until February 2020 in an attempt to maintain consistency and provide certainty for regulated entities while the agencies continue to consider possible revisions to the 2015 rule. The 2015 rule changes the scope of water and wetlands regulations; however, the EPA has delegated authority to manage the Michigan wetlands program to the MDEQ. As a result, regardless of whether the 2015 rule is rescinded or maintained, Consumers will continue to operate under Michigan’s wetlands regulations, and under the applicable state and federal water jurisdictional regulations. Thus, Consumers does not expect any adverse changes to its environmental strategy as a result of these events.
Many of Consumers’ facilities maintain NPDES permits, which are renewed every five years and are vital to the facilities’ operations. Failure of the MDEQ to renew any NPDES permit, a successful appeal against a permit, or onerous terms contained in a permit could have a significant detrimental effect on the operations of a facility.
Other Matters
: Other electric environmental matters could have a material impact on Consumers’ outlook. For additional details on other electric environmental matters, see
Note 3, Contingencies and Commitments—Consumers Electric Utility Contingencies—Electric Environmental Matters
.
Consumers Gas Utility Outlook and Uncertainties
Gas Deliveries:
Consumers’ gas customer deliveries are seasonal. The peak demand for natural gas occurs in the winter due to colder temperatures and the resulting use of natural gas as heating fuel. Consumers expects weather-normalized gas deliveries in
2018
and over the next five years to remain stable relative to 2017. This outlook reflects modest
growth in gas demand offset by
the predicted effects of
energy efficiency and conservation
. Actual delivery levels from year to year may vary from this expectation due to:
|
•
|
weather fluctuations
|
|
•
|
use by power producers
|
|
•
|
availability and development of renewable energy sources
|
|
•
|
gas price changes
|
|
•
|
Michigan economic conditions, including population trends and housing activity
|
|
•
|
the price of competing energy sources or fuels
|
|
•
|
energy efficiency and conservation impacts
|
Gas Rate Matters:
Rate matters are critical to Consumers’ gas utility business. For additional details on rate matters, see
Note 2, Regulatory Matters
.
Gas Rate Case:
In October 2017, Consumers filed an application with the MPSC seeking an annual rate increase of
$178 million
, based on a
10.5 percent
authorized return on equity. The largest component of the request was an annual revenue requirement of
$162 million
related to infrastructure investment and related costs that would allow Consumers to improve system safety, capacity, and deliverability. In March 2018, Consumers reduced its requested revenue requirement to
$145 million
, before taking into consideration any impact of the TCJA. Consumers further reduced its requested revenue requirement to
$83 million
to reflect the impact of the TCJA, offset partially by an increase in the authorized return on equity to
10.75 percent
to compensate for the anticipated negative effects of tax reform on Consumers’ cash flows from operating activities.
In July 2018, Consumers reduced its requested revenue requirement to
$60 million
, based on a
10.0 percent
authorized return on equity.
The filing also seeks approval of two rate adjustment mechanisms: a revenue decoupling mechanism and an investment recovery mechanism. The revenue decoupling mechanism would annually reconcile Consumers’ actual weather-normalized nonfuel revenues with the revenues approved by the MPSC. The investment recovery mechanism would provide for additional annual rate increases of
$39 million
beginning in July 2019 and another
$39 million
beginning in July 2020 for incremental investments that Consumers plans to make in those years, subject to reconciliation. In March 2018, Consumers modified its request for the investment recovery mechanism to reduce the annual rate increase to
$25 million
34
beginning in July 2019 and another
$25 million
beginning in July 2020. The request was reduced to reflect several adjustments proposed by the MPSC Staff. These future investments are intended to help ensure adequate system capacity and deliverability. The MPSC previously approved an investment recovery mechanism in July 2017 that will be in effect until rates are changed in the pending proceeding.
In July 2018, the administrative law judge issued a proposal for decision, recommending an annual rate increase of $11 million, based on a 10.0 percent authorized return on equity. The administrative law judge also recommended approval of the revenue decoupling mechanism, as proposed, and the investment recovery mechanism, as requested with modifications. In addition, based on the position of the MPSC Staff, the administrative law judge
recommended the disallowance of cost recovery for certain categories of historical capital expenditures incurred by Consumers
. If, in the final order in this case,
the MPSC were to adopt some or all of the administrative law judge’s recommendations, Consumers would be required to write off up to
$145 million
of assets
.
A material disallowance of historical costs could negatively affect CMS Energy’s and Consumers’ results of operations. While Consumers cannot predict the outcome of this proceeding, it does not believe it is probable that the MPSC will disallow these historical capital expenditures in the final order, as there is no regulatory precedent of a disallowance of this type.
Gas Pipeline and Storage Integrity and Safety:
In 2016, PHMSA published a notice of proposed rulemaking that would expand federal safety standards for gas transmission pipelines. The rule could cause Consumers to incur increased capital costs to install and remediate pipelines as well as operating and maintenance costs to expand inspections, maintenance, and monitoring of its existing pipelines. PHMSA expects to publish a final rule in
2018
.
Also in 2016, PHMSA published an interim final rule that will establish minimum federal safety standards for underground natural gas storage facilities. As proposed, the rule could cause Consumers to incur increased capital and operating and maintenance costs to expand inspections, maintenance, and monitoring of its underground gas storage facilities. PHMSA expects to publish a final rule in
2018
.
Although associated capital or operating and maintenance costs relating to these regulations could be material and cost recovery cannot be assured, Consumers would expect to recover such costs and capital expenditures in rates consistent with the recovery of other reasonable costs of complying with laws and regulations. Consumers will continue to monitor gas safety regulations.
Gas Environmental Outlook:
Consumers expects to incur response activity costs at a number of sites, including
23
former MGP
sites. For additional details, see
Note 3, Contingencies and Commitments—Consumers Gas Utility Contingencies—Gas Environmental Matters
.
Consumers Electric Utility and Gas Utility Outlook and Uncertainties
Energy Waste Reduction Plan:
The 2016 Energy Law, which became effective in April 2017, authorized incentives for demand response programs and expanded existing incentives for energy efficiency programs, referring to the combined initiatives as energy waste reduction. The 2016 Energy Law:
|
•
|
extended the requirement to achieve annual reductions of 1.0 percent in customers’ electricity use through 2021 and 0.75 percent in customers’ natural gas use indefinitely
|
|
•
|
removed limits on investments under the program and provided for a higher return on those investments; together, these provisions effectively doubled the financial incentives Consumers may earn for exceeding the statutory targets
|
|
•
|
established a goal of 35 percent combined renewable energy and energy waste reduction by 2025
|
During 2017, the MPSC approved an energy waste reduction plan for Consumers that amended and expanded its existing energy optimization plan, allowing for recovery of increased investments to meet the requirements of the 2016 Energy Law and expanding the financial incentive that Consumers may earn for exceeding savings targets during the year. Under this plan, Consumers will continue to provide its
35
customers with incentives to reduce usage by offering energy audits, rebates and discounts on purchases of highly efficient appliances, and other incentives and programs.
Enterprises Outlook and Uncertainties
The primary focus with respect to CMS Energy’s enterprises businesses is to maximize the value of their generating assets, which represent 1,110 MW of capacity, and to pursue opportunities for the development of renewable generation projects.
T.E.S. Filer City plans to convert its plant to use natural gas as its primary fuel instead of coal.
The conversion is expected to increase the amount of capacity and energy produced by the plant from 73 MW to 225 MW. In May 2017, in anticipation of the planned conversion, T.E.S. Filer City and Consumers agreed to amend their PPA. Under the amendment to the PPA, Consumers will purchase the increased capacity and electricity generated by the converted facility for 15 years. The original PPA was set to expire in 2025. In February 2018, the MPSC approved the amendment to the PPA. The amendment is contingent on a finding by FERC that sales made under the amended PPA are exempt from, or authorized under, Section 205 of the Federal Power Act and on commercial operation of the converted facility on or before June 1, 2022. T.E.S. Filer City expects the converted plant to be operational in 2020.
In June 2018, CMS Enterprises
completed the development and construction of an 8‑MW solar generation project
in Delta Township, Michigan. A second solar generation project, totaling 16 MW, is presently under construction. Energy produced by the solar generation projects will be sold under 25‑year PPAs to Lansing Board of Water and Light, a non‑affiliated utility.
In June 2018, CMS Enterprises
entered into an agreement to purchase a 105‑MW wind generation project in
northwest Ohio. The project is presently under construction and expected to be completed by fall 2018.
Renewable energy produced by the wind generation project has been committed to General Motors LLC, a non‑affiliated company, under a 15‑year PPA.
The enterprises segment’s assets may be affected by environmental laws and regulations.
The new ozone NAAQS will make it more difficult to construct or modify power plants in areas of the country that have not met the new ozone standard.
In April 2018, the EPA designated certain areas of Michigan as not meeting the new standard;
the enterprises segment’s independent power plant located in Dearborn, Michigan is in one such area and, as a result, would be subject to additional permitting restrictions in the event of any future modifications. For additional details regarding the new ozone NAAQS, see
Consumers Electric Utility Outlook and Uncertainties—Electric Environmental Outlook
.
Trends, uncertainties, and other matters related to the enterprises segment that could have a material impact on CMS Energy’s consolidated income, cash flows, or financial position include:
|
•
|
investment in and financial benefits received from renewable energy and energy storage projects
|
|
•
|
changes in energy and capacity prices
|
|
•
|
changes in commodity prices and interest rates on certain derivative contracts that do not qualify for hedge accounting and must be marked to market through earnings
|
|
•
|
changes in various environmental laws, regulations, principles, or practices, or in their interpretation
|
|
•
|
the outcome of certain legal proceedings, including gas price reporting litigation
|
|
•
|
indemnity and environmental remediation obligations at Bay Harbor
|
|
•
|
obligations related to a tax claim from the government of Equatorial Guinea
|
|
•
|
representations, warranties, and indemnities provided by CMS Energy in connection with previous sales of assets
|
For additional details regarding the enterprises segment’s uncertainties, see
Note 3, Contingencies and Commitments
.
36
Other Outlook and Uncertainties
EnerBank:
EnerBank is a Utah state-chartered, FDIC-insured industrial bank providing unsecured consumer installment loans for financing home improvements. EnerBank represented
four percent
of CMS Energy’s net assets at
June 30, 2018
and
four percent
of CMS Energy’s
net income available to common stockholders
for the
six months ended June 30, 2018
. The carrying value of EnerBank’s loan portfolio was
$1.4 billion
at
June 30, 2018
. Its loan portfolio was funded primarily by certificates of deposit of
$1.4 billion
. The twelve-month rolling average net default rate on loans held by EnerBank was
1.3 percent
at
June 30, 2018
. CMS Energy is required both by law and by contract to provide financial support, including infusing additional capital, to ensure that EnerBank satisfies mandated capital requirements and has sufficient liquidity to operate. With its self-funding plan, EnerBank has exceeded these requirements historically and exceeded them as of
June 30, 2018
.
Litigation:
CMS Energy, Consumers, and certain of their subsidiaries are named as parties in various litigation matters, as well as in administrative proceedings before various courts and governmental agencies, arising in the ordinary course of business. For additional details regarding these and other legal matters, see
Note 2, Regulatory Matters
and
Note 3, Contingencies and Commitments
.
New Accounting Standards
For details regarding new accounting standards issued but not yet effective, see
Note 1, New Accounting Standards
.
37
CMS Energy Corporation
|
In Millions, Except Per Share Amounts
|
|||||||||||||||||
|
Three Months Ended
|
Six Months Ended
|
||||||||||||||||
|
June 30
|
2018
|
2017
|
2018
|
2017
|
|||||||||||||
|
Operating Revenue
|
$
|
1,492
|
|
$
|
1,449
|
|
$
|
3,445
|
|
$
|
3,278
|
|
|||||
|
Operating Expenses
|
|||||||||||||||||
|
Fuel for electric generation
|
115
|
|
125
|
|
247
|
|
242
|
|
|||||||||
|
Purchased and interchange power
|
393
|
|
373
|
|
775
|
|
706
|
|
|||||||||
|
Purchased power – related parties
|
19
|
|
21
|
|
38
|
|
43
|
|
|||||||||
|
Cost of gas sold
|
112
|
|
111
|
|
493
|
|
447
|
|
|||||||||
|
Maintenance and other operating expenses
|
326
|
|
315
|
|
636
|
|
605
|
|
|||||||||
|
Depreciation and amortization
|
204
|
|
197
|
|
483
|
|
459
|
|
|||||||||
|
General taxes
|
68
|
|
66
|
|
155
|
|
147
|
|
|||||||||
|
Total operating expenses
|
1,237
|
|
1,208
|
|
2,827
|
|
2,649
|
|
|||||||||
|
Operating Income
|
255
|
|
241
|
|
618
|
|
629
|
|
|||||||||
|
Other Income (Expense)
|
|||||||||||||||||
|
Interest income
|
4
|
|
2
|
|
6
|
|
7
|
|
|||||||||
|
Allowance for equity funds used during construction
|
1
|
|
2
|
|
2
|
|
4
|
|
|||||||||
|
Income from equity method investees
|
4
|
|
3
|
|
7
|
|
7
|
|
|||||||||
|
Nonoperating retirement benefits, net
|
22
|
|
4
|
|
46
|
|
7
|
|
|||||||||
|
Other income
|
—
|
|
—
|
|
1
|
|
2
|
|
|||||||||
|
Other expense
|
(9
|
)
|
(2
|
)
|
(11
|
)
|
(4
|
)
|
|||||||||
|
Total other income
|
22
|
|
9
|
|
51
|
|
23
|
|
|||||||||
|
Interest Charges
|
|||||||||||||||||
|
Interest on long-term debt
|
103
|
|
103
|
|
203
|
|
203
|
|
|||||||||
|
Other interest expense
|
10
|
|
8
|
|
21
|
|
16
|
|
|||||||||
|
Allowance for borrowed funds used during construction
|
(1
|
)
|
(1
|
)
|
(1
|
)
|
(2
|
)
|
|||||||||
|
Total interest charges
|
112
|
|
110
|
|
223
|
|
217
|
|
|||||||||
|
Income Before Income Taxes
|
165
|
|
140
|
|
446
|
|
435
|
|
|||||||||
|
Income Tax Expense
|
25
|
|
47
|
|
65
|
|
143
|
|
|||||||||
|
Net Income
|
140
|
|
93
|
|
381
|
|
292
|
|
|||||||||
|
Income Attributable to Noncontrolling Interests
|
1
|
|
1
|
|
1
|
|
1
|
|
|||||||||
|
Net Income Available to Common Stockholders
|
$
|
139
|
|
$
|
92
|
|
$
|
380
|
|
$
|
291
|
|
|||||
|
Basic Earnings Per Average Common Share
|
$
|
0.49
|
|
$
|
0.33
|
|
$
|
1.35
|
|
$
|
1.04
|
|
|||||
|
Diluted Earnings Per Average Common Share
|
$
|
0.49
|
|
$
|
0.33
|
|
$
|
1.35
|
|
$
|
1.04
|
|
|||||
|
Dividends Declared Per Common Share
|
$
|
0.3575
|
|
$
|
0.3325
|
|
$
|
0.7150
|
|
$
|
0.6650
|
|
|||||
The accompanying notes are an integral part of these statements.
38
CMS Energy Corporation
Consolidated Statements of Comprehensive Income (Unaudited)
|
In Millions
|
|||||||||||||||||
|
Three Months Ended
|
Six Months Ended
|
||||||||||||||||
|
June 30
|
2018
|
2017
|
2018
|
2017
|
|||||||||||||
|
Net Income
|
$
|
140
|
|
$
|
93
|
|
$
|
381
|
|
$
|
292
|
|
|||||
|
Retirement Benefits Liability
|
|||||||||||||||||
|
Amortization of net actuarial loss, net of tax of $- for all periods
|
1
|
|
1
|
|
2
|
|
1
|
|
|||||||||
|
Amortization of prior service credit, net of tax of $- for all periods
|
(1
|
)
|
—
|
|
(1
|
)
|
—
|
|
|||||||||
|
Investments
|
|||||||||||||||||
|
Unrealized gain (loss) on investments, net of tax of $-, $1, $-, and $1
|
—
|
|
—
|
|
(1
|
)
|
1
|
|
|||||||||
|
Other Comprehensive Income
|
—
|
|
1
|
|
—
|
|
2
|
|
|||||||||
|
Comprehensive Income
|
140
|
|
94
|
|
381
|
|
294
|
|
|||||||||
|
Comprehensive Income Attributable to Noncontrolling Interests
|
1
|
|
1
|
|
1
|
|
1
|
|
|||||||||
|
Comprehensive Income Attributable to CMS Energy
|
$
|
139
|
|
$
|
93
|
|
$
|
380
|
|
$
|
293
|
|
|||||
The accompanying notes are an integral part of these statements.
39
(This page intentionally left blank)
40
CMS Energy Corporation
|
In Millions
|
||||||||
|
Six Months Ended June 30
|
2018
|
2017
|
||||||
|
Cash Flows from Operating Activities
|
||||||||
|
Net income
|
$
|
381
|
|
$
|
292
|
|
||
|
Adjustments to reconcile net income to net cash provided by operating activities
|
||||||||
|
Depreciation and amortization
|
483
|
|
459
|
|
||||
|
Deferred income taxes and investment tax credit
|
60
|
|
132
|
|
||||
|
Other non-cash operating activities and reconciling adjustments
|
22
|
|
47
|
|
||||
|
Cash provided by (used in) changes in assets and liabilities
|
||||||||
|
Accounts and notes receivable and accrued revenue
|
298
|
|
154
|
|
||||
|
Inventories
|
101
|
|
44
|
|
||||
|
Accounts payable and accrued refunds
|
(41
|
)
|
37
|
|
||||
|
Other current and non-current assets and liabilities
|
112
|
|
(46
|
)
|
||||
|
Net cash provided by operating activities
|
1,416
|
|
1,119
|
|
||||
|
Cash Flows from Investing Activities
|
||||||||
|
Capital expenditures (excludes assets placed under capital lease)
|
(872
|
)
|
(746
|
)
|
||||
|
Increase in EnerBank notes receivable
|
(80
|
)
|
(25
|
)
|
||||
|
Proceeds from the sale of EnerBank notes receivable
|
—
|
|
19
|
|
||||
|
Cost to retire property and other investing activities
|
(56
|
)
|
(54
|
)
|
||||
|
Net cash used in investing activities
|
(1,008
|
)
|
(806
|
)
|
||||
|
Cash Flows from Financing Activities
|
||||||||
|
Proceeds from issuance of debt
|
794
|
|
923
|
|
||||
|
Retirement of debt
|
(660
|
)
|
(488
|
)
|
||||
|
Increase (decrease) in EnerBank certificates of deposit
|
136
|
|
(27
|
)
|
||||
|
Decrease in notes payable
|
(170
|
)
|
(398
|
)
|
||||
|
Issuance of common stock
|
36
|
|
76
|
|
||||
|
Payment of dividends on common and preferred stock
|
(204
|
)
|
(188
|
)
|
||||
|
Payment of capital lease obligations and other financing costs
|
(43
|
)
|
(27
|
)
|
||||
|
Net cash used in financing activities
|
(111
|
)
|
(129
|
)
|
||||
|
Net Increase in Cash and Cash Equivalents, Including Restricted Amounts
|
297
|
|
184
|
|
||||
|
Cash and Cash Equivalents, Including Restricted Amounts, Beginning of Period
|
204
|
|
257
|
|
||||
|
Cash and Cash Equivalents, Including Restricted Amounts, End of Period
|
$
|
501
|
|
$
|
441
|
|
||
|
Other non-cash investing and financing activities
|
||||||||
|
Non-cash transactions
|
||||||||
|
Capital expenditures not paid
|
$
|
140
|
|
$
|
146
|
|
||
The accompanying notes are an integral part of these statements.
41
CMS Energy Corporation
|
ASSETS
|
||||||||
|
In Millions
|
||||||||
|
June 30
2018 |
December 31
2017 |
|||||||
|
Current Assets
|
||||||||
|
Cash and cash equivalents
|
$
|
477
|
|
$
|
182
|
|
||
|
Restricted cash and cash equivalents
|
17
|
|
17
|
|
||||
|
Accounts receivable and accrued revenue, less allowance of $20 in both periods
|
708
|
|
1,032
|
|
||||
|
Notes receivable, less allowance of $23 in 2018 and $20 in 2017
|
206
|
|
198
|
|
||||
|
Notes receivable held for sale
|
—
|
|
2
|
|
||||
|
Accounts receivable – related parties
|
14
|
|
12
|
|
||||
|
Inventories at average cost
|
|
|
||||||
|
Gas in underground storage
|
367
|
|
458
|
|
||||
|
Materials and supplies
|
143
|
|
133
|
|
||||
|
Generating plant fuel stock
|
60
|
|
81
|
|
||||
|
Deferred property taxes
|
187
|
|
257
|
|
||||
|
Regulatory assets
|
14
|
|
20
|
|
||||
|
Prepayments and other current assets
|
93
|
|
83
|
|
||||
|
Total current assets
|
2,286
|
|
2,475
|
|
||||
|
Plant, Property, and Equipment
|
|
|
|
|
||||
|
Plant, property, and equipment, gross
|
23,258
|
|
22,506
|
|
||||
|
Less accumulated depreciation and amortization
|
6,808
|
|
6,510
|
|
||||
|
Plant, property, and equipment, net
|
16,450
|
|
15,996
|
|
||||
|
Construction work in progress
|
787
|
|
765
|
|
||||
|
Total plant, property, and equipment
|
17,237
|
|
16,761
|
|
||||
|
Other Non-current Assets
|
|
|
|
|
||||
|
Regulatory assets
|
1,690
|
|
1,764
|
|
||||
|
Accounts and notes receivable
|
1,246
|
|
1,187
|
|
||||
|
Investments
|
74
|
|
64
|
|
||||
|
Other
|
779
|
|
799
|
|
||||
|
Total other non-current assets
|
3,789
|
|
3,814
|
|
||||
|
Total Assets
|
$
|
23,312
|
|
$
|
23,050
|
|
||
42
|
LIABILITIES AND EQUITY
|
||||||||
|
In Millions
|
||||||||
|
June 30
2018 |
December 31
2017 |
|||||||
|
Current Liabilities
|
||||||||
|
Current portion of long-term debt, capital leases, and financing obligation
|
$
|
1,216
|
|
$
|
1,103
|
|
||
|
Notes payable
|
—
|
|
170
|
|
||||
|
Accounts payable
|
623
|
|
725
|
|
||||
|
Accounts payable – related parties
|
6
|
|
15
|
|
||||
|
Accrued rate refunds
|
45
|
|
33
|
|
||||
|
Accrued interest
|
102
|
|
103
|
|
||||
|
Accrued taxes
|
267
|
|
360
|
|
||||
|
Regulatory liabilities
|
159
|
|
80
|
|
||||
|
Other current liabilities
|
117
|
|
195
|
|
||||
|
Total current liabilities
|
2,535
|
|
2,784
|
|
||||
|
Non-current Liabilities
|
|
|
|
|
||||
|
Long-term debt
|
9,272
|
|
9,123
|
|
||||
|
Non-current portion of capital leases and financing obligation
|
81
|
|
91
|
|
||||
|
Regulatory liabilities
|
3,751
|
|
3,715
|
|
||||
|
Postretirement benefits
|
787
|
|
766
|
|
||||
|
Asset retirement obligations
|
426
|
|
430
|
|
||||
|
Deferred investment tax credit
|
102
|
|
87
|
|
||||
|
Deferred income taxes
|
1,344
|
|
1,269
|
|
||||
|
Other non-current liabilities
|
305
|
|
307
|
|
||||
|
Total non-current liabilities
|
16,068
|
|
15,788
|
|
||||
|
Commitments and Contingencies
(Notes 2 and 3)
|
|
|
|
|
||||
|
Equity
|
|
|
|
|
||||
|
Common stockholders’ equity
|
|
|
|
|
||||
|
Common stock, authorized 350.0 shares; outstanding 283.2 shares in 2018 and 281.6 shares in 2017
|
3
|
|
3
|
|
||||
|
Other paid-in capital
|
5,076
|
|
5,019
|
|
||||
|
Accumulated other comprehensive loss
|
(61
|
)
|
(50
|
)
|
||||
|
Accumulated deficit
|
(346
|
)
|
(531
|
)
|
||||
|
Total common stockholders’ equity
|
4,672
|
|
4,441
|
|
||||
|
Noncontrolling interests
|
37
|
|
37
|
|
||||
|
Total equity
|
4,709
|
|
4,478
|
|
||||
|
Total Liabilities and Equity
|
$
|
23,312
|
|
$
|
23,050
|
|
||
The accompanying notes are an integral part of these statements.
43
CMS Energy Corporation
Consolidated Statements of Changes in Equity (Unaudited)
|
In Millions
|
|||||||||||||||||
|
Three Months Ended
|
Six Months Ended
|
||||||||||||||||
|
June 30
|
2018
|
2017
|
2018
|
2017
|
|||||||||||||
|
Total Equity at Beginning of Period
|
$
|
4,633
|
|
$
|
4,407
|
|
$
|
4,478
|
|
$
|
4,290
|
|
|||||
|
Common Stock
|
|||||||||||||||||
|
At beginning and end of period
|
3
|
|
3
|
|
3
|
|
3
|
|
|||||||||
|
Other Paid-in Capital
|
|||||||||||||||||
|
At beginning of period
|
5,037
|
|
4,927
|
|
5,019
|
|
4,916
|
|
|||||||||
|
Common stock issued
|
39
|
|
80
|
|
47
|
|
88
|
|
|||||||||
|
Common stock repurchased
|
—
|
|
(1
|
)
|
(10
|
)
|
(13
|
)
|
|||||||||
|
Common stock reissued
|
—
|
|
—
|
|
20
|
|
15
|
|
|||||||||
|
At end of period
|
5,076
|
|
5,006
|
|
5,076
|
|
5,006
|
|
|||||||||
|
Accumulated Other Comprehensive Loss
|
|||||||||||||||||
|
At beginning of period
|
(61
|
)
|
(49
|
)
|
(50
|
)
|
(50
|
)
|
|||||||||
|
Retirement benefits liability
|
|
|
|
|
|||||||||||||
|
At beginning of period
|
(60
|
)
|
(50
|
)
|
(50
|
)
|
(50
|
)
|
|||||||||
|
Cumulative effect of change in accounting principle
|
—
|
|
—
|
|
(11
|
)
|
—
|
|
|||||||||
|
Amortization of net actuarial loss
|
1
|
|
1
|
|
2
|
|
1
|
|
|||||||||
|
Amortization of prior service credit
|
(1
|
)
|
—
|
|
(1
|
)
|
—
|
|
|||||||||
|
At end of period
|
(60
|
)
|
(49
|
)
|
(60
|
)
|
(49
|
)
|
|||||||||
|
Investments
|
|||||||||||||||||
|
At beginning of period
|
(1
|
)
|
1
|
|
—
|
|
—
|
|
|||||||||
|
Unrealized gain (loss) on investments
|
—
|
|
—
|
|
(1
|
)
|
1
|
|
|||||||||
|
At end of period
|
(1
|
)
|
1
|
|
(1
|
)
|
1
|
|
|||||||||
|
At end of period
|
(61
|
)
|
(48
|
)
|
(61
|
)
|
(48
|
)
|
|||||||||
|
Accumulated Deficit
|
|||||||||||||||||
|
At beginning of period
|
(383
|
)
|
(511
|
)
|
(531
|
)
|
(616
|
)
|
|||||||||
|
Cumulative effect of change in accounting principle
|
—
|
|
—
|
|
8
|
|
—
|
|
|||||||||
|
Net income attributable to CMS Energy
|
139
|
|
92
|
|
380
|
|
291
|
|
|||||||||
|
Dividends declared on common stock
|
(102
|
)
|
(93
|
)
|
(203
|
)
|
(187
|
)
|
|||||||||
|
At end of period
|
(346
|
)
|
(512
|
)
|
(346
|
)
|
(512
|
)
|
|||||||||
|
Noncontrolling Interests
|
|||||||||||||||||
|
At beginning of period
|
37
|
|
37
|
|
37
|
|
37
|
|
|||||||||
|
Income attributable to noncontrolling interests
|
1
|
|
1
|
|
1
|
|
1
|
|
|||||||||
|
Distributions and other changes in noncontrolling interests
|
(1
|
)
|
(1
|
)
|
(1
|
)
|
(1
|
)
|
|||||||||
|
At end of period
|
37
|
|
37
|
|
37
|
|
37
|
|
|||||||||
|
Total Equity at End of Period
|
$
|
4,709
|
|
$
|
4,486
|
|
$
|
4,709
|
|
$
|
4,486
|
|
|||||
The accompanying notes are an integral part of these statements.
44
(This page intentionally left blank)
45
Consumers Energy Company
Consolidated Statements of Income (Unaudited)
|
In Millions
|
|||||||||||||||||
|
Three Months Ended
|
Six Months Ended
|
||||||||||||||||
|
June 30
|
2018
|
2017
|
2018
|
2017
|
|||||||||||||
|
Operating Revenue
|
$
|
1,395
|
|
$
|
1,362
|
|
$
|
3,250
|
|
$
|
3,099
|
|
|||||
|
Operating Expenses
|
|||||||||||||||||
|
Fuel for electric generation
|
86
|
|
100
|
|
188
|
|
189
|
|
|||||||||
|
Purchased and interchange power
|
388
|
|
369
|
|
766
|
|
700
|
|
|||||||||
|
Purchased power – related parties
|
19
|
|
22
|
|
39
|
|
44
|
|
|||||||||
|
Cost of gas sold
|
108
|
|
105
|
|
485
|
|
437
|
|
|||||||||
|
Maintenance and other operating expenses
|
298
|
|
285
|
|
580
|
|
550
|
|
|||||||||
|
Depreciation and amortization
|
201
|
|
195
|
|
478
|
|
455
|
|
|||||||||
|
General taxes
|
66
|
|
64
|
|
151
|
|
143
|
|
|||||||||
|
Total operating expenses
|
1,166
|
|
1,140
|
|
2,687
|
|
2,518
|
|
|||||||||
|
Operating Income
|
229
|
|
222
|
|
563
|
|
581
|
|
|||||||||
|
Other Income (Expense)
|
|||||||||||||||||
|
Interest income
|
2
|
|
2
|
|
4
|
|
6
|
|
|||||||||
|
Allowance for equity funds used during construction
|
1
|
|
2
|
|
2
|
|
4
|
|
|||||||||
|
Nonoperating retirement benefits, net
|
20
|
|
2
|
|
42
|
|
5
|
|
|||||||||
|
Other income
|
—
|
|
—
|
|
1
|
|
14
|
|
|||||||||
|
Other expense
|
(3
|
)
|
(2
|
)
|
(5
|
)
|
(4
|
)
|
|||||||||
|
Total other income
|
20
|
|
4
|
|
44
|
|
25
|
|
|||||||||
|
Interest Charges
|
|||||||||||||||||
|
Interest on long-term debt
|
67
|
|
66
|
|
134
|
|
132
|
|
|||||||||
|
Other interest expense
|
4
|
|
4
|
|
9
|
|
7
|
|
|||||||||
|
Allowance for borrowed funds used during construction
|
(1
|
)
|
(1
|
)
|
(1
|
)
|
(2
|
)
|
|||||||||
|
Total interest charges
|
70
|
|
69
|
|
142
|
|
137
|
|
|||||||||
|
Income Before Income Taxes
|
179
|
|
157
|
|
465
|
|
469
|
|
|||||||||
|
Income Tax Expense
|
27
|
|
53
|
|
71
|
|
154
|
|
|||||||||
|
Net Income
|
152
|
|
104
|
|
394
|
|
315
|
|
|||||||||
|
Preferred Stock Dividends
|
1
|
|
1
|
|
1
|
|
1
|
|
|||||||||
|
Net Income Available to Common Stockholder
|
$
|
151
|
|
$
|
103
|
|
$
|
393
|
|
$
|
314
|
|
|||||
The accompanying notes are an integral part of these statements.
46
Consumers Energy Company
Consolidated Statements of Comprehensive Income (Unaudited)
|
In Millions
|
|||||||||||||||||
|
Three Months Ended
|
Six Months Ended
|
||||||||||||||||
|
June 30
|
2018
|
2017
|
2018
|
2017
|
|||||||||||||
|
Net Income
|
$
|
152
|
|
$
|
104
|
|
$
|
394
|
|
$
|
315
|
|
|||||
|
Retirement Benefits Liability
|
|
|
|
||||||||||||||
|
Amortization of net actuarial loss, net of tax of $- for all periods
|
—
|
|
1
|
|
1
|
|
1
|
|
|||||||||
|
Investments
|
|
|
|
|
|||||||||||||
|
Unrealized gain (loss) on investments, net of tax of $-, $1, $-, and $1
|
—
|
|
—
|
|
(1
|
)
|
2
|
|
|||||||||
|
Reclassification adjustments included in net income, net of tax of $-, $-, $-, and $(5)
|
—
|
|
—
|
|
—
|
|
(8
|
)
|
|||||||||
|
Other Comprehensive Income (Loss)
|
—
|
|
1
|
|
—
|
|
(5
|
)
|
|||||||||
|
Comprehensive Income
|
$
|
152
|
|
$
|
105
|
|
$
|
394
|
|
$
|
310
|
|
|||||
The accompanying notes are an integral part of these statements.
47
(This page intentionally left blank)
48
Consumers Energy Company
Consolidated Statements of Cash Flows (Unaudited)
|
In Millions
|
||||||||
|
Six Months Ended June 30
|
2018
|
|
2017
|
|
||||
|
Cash Flows from Operating Activities
|
|
|
|
|
||||
|
Net income
|
$
|
394
|
|
$
|
315
|
|
||
|
Adjustments to reconcile net income to net cash provided by operating activities
|
|
|
||||||
|
Depreciation and amortization
|
478
|
|
455
|
|
||||
|
Deferred income taxes and investment tax credit
|
35
|
|
157
|
|
||||
|
Other non-cash operating activities and reconciling adjustments
|
15
|
|
44
|
|
||||
|
Cash provided by (used in) changes in assets and liabilities
|
|
|
||||||
|
Accounts and notes receivable and accrued revenue
|
172
|
|
158
|
|
||||
|
Inventories
|
98
|
|
43
|
|
||||
|
Accounts payable and accrued refunds
|
(34
|
)
|
38
|
|
||||
|
Other current and non-current assets and liabilities
|
(60
|
)
|
(85
|
)
|
||||
|
Net cash provided by operating activities
|
1,098
|
|
1,125
|
|
||||
|
Cash Flows from Investing Activities
|
|
|
|
|
||||
|
Capital expenditures (excludes assets placed under capital lease)
|
(859
|
)
|
(741
|
)
|
||||
|
Cost to retire property and other investing activities
|
(55
|
)
|
(61
|
)
|
||||
|
Net cash used in investing activities
|
(914
|
)
|
(802
|
)
|
||||
|
Cash Flows from Financing Activities
|
|
|
|
|
||||
|
Proceeds from issuance of debt
|
544
|
|
349
|
|
||||
|
Retirement of debt
|
(330
|
)
|
(263
|
)
|
||||
|
Decrease in notes payable
|
(170
|
)
|
(398
|
)
|
||||
|
Stockholder contribution
|
250
|
|
450
|
|
||||
|
Payment of dividends on common and preferred stock
|
(246
|
)
|
(237
|
)
|
||||
|
Payment of capital lease obligations and other financing costs
|
(21
|
)
|
(12
|
)
|
||||
|
Net cash provided by (used in) financing activities
|
27
|
|
(111
|
)
|
||||
|
Net Increase in Cash and Cash Equivalents, Including Restricted Amounts
|
211
|
|
212
|
|
||||
|
Cash and Cash Equivalents, Including Restricted Amounts, Beginning of Period
|
65
|
|
152
|
|
||||
|
Cash and Cash Equivalents, Including Restricted Amounts, End of Period
|
$
|
276
|
|
$
|
364
|
|
||
|
Other non-cash investing and financing activities
|
|
|
|
|
||||
|
Non-cash transactions
|
|
|
|
|
||||
|
Capital expenditures not paid
|
$
|
116
|
|
$
|
133
|
|
||
The accompanying notes are an integral part of these statements.
49
Consumers Energy Company
Consolidated Balance Sheets (Unaudited)
|
ASSETS
|
||||||||
|
In Millions
|
||||||||
|
June 30
2018 |
December 31
2017 |
|||||||
|
Current Assets
|
||||||||
|
Cash and cash equivalents
|
$
|
254
|
|
$
|
44
|
|
||
|
Restricted cash and cash equivalents
|
17
|
|
17
|
|
||||
|
Accounts receivable and accrued revenue, less allowance of $20 in both periods
|
690
|
|
885
|
|
||||
|
Notes receivable
|
17
|
|
17
|
|
||||
|
Accounts receivable – related parties
|
1
|
|
2
|
|
||||
|
Inventories at average cost
|
||||||||
|
Gas in underground storage
|
367
|
|
458
|
|
||||
|
Materials and supplies
|
138
|
|
128
|
|
||||
|
Generating plant fuel stock
|
58
|
|
76
|
|
||||
|
Deferred property taxes
|
187
|
|
257
|
|
||||
|
Regulatory assets
|
14
|
|
20
|
|
||||
|
Prepayments and other current assets
|
82
|
|
71
|
|
||||
|
Total current assets
|
1,825
|
|
1,975
|
|
||||
|
Plant, Property, and Equipment
|
||||||||
|
Plant, property, and equipment, gross
|
23,059
|
|
22,318
|
|
||||
|
Less accumulated depreciation and amortization
|
6,736
|
|
6,441
|
|
||||
|
Plant, property, and equipment, net
|
16,323
|
|
15,877
|
|
||||
|
Construction work in progress
|
763
|
|
753
|
|
||||
|
Total plant, property, and equipment
|
17,086
|
|
16,630
|
|
||||
|
Other Non-current Assets
|
||||||||
|
Regulatory assets
|
1,690
|
|
1,764
|
|
||||
|
Accounts receivable
|
21
|
|
22
|
|
||||
|
Investments
|
1
|
|
21
|
|
||||
|
Other
|
660
|
|
687
|
|
||||
|
Total other non-current assets
|
2,372
|
|
2,494
|
|
||||
|
Total Assets
|
$
|
21,283
|
|
$
|
21,099
|
|
||
50
|
LIABILITIES AND EQUITY
|
||||||||
|
In Millions
|
||||||||
|
June 30
2018 |
December 31
2017 |
|||||||
|
Current Liabilities
|
||||||||
|
Current portion of long-term debt, capital leases, and financing obligation
|
$
|
398
|
|
$
|
365
|
|
||
|
Notes payable
|
—
|
|
170
|
|
||||
|
Accounts payable
|
594
|
|
701
|
|
||||
|
Accounts payable – related parties
|
11
|
|
19
|
|
||||
|
Accrued rate refunds
|
45
|
|
33
|
|
||||
|
Accrued interest
|
65
|
|
67
|
|
||||
|
Accrued taxes
|
279
|
|
542
|
|
||||
|
Regulatory liabilities
|
159
|
|
80
|
|
||||
|
Other current liabilities
|
84
|
|
159
|
|
||||
|
Total current liabilities
|
1,635
|
|
2,136
|
|
||||
|
Non-current Liabilities
|
||||||||
|
Long-term debt
|
5,738
|
|
5,561
|
|
||||
|
Non-current portion of capital leases and financing obligation
|
81
|
|
91
|
|
||||
|
Regulatory liabilities
|
3,751
|
|
3,715
|
|
||||
|
Postretirement benefits
|
731
|
|
711
|
|
||||
|
Asset retirement obligations
|
425
|
|
429
|
|
||||
|
Deferred investment tax credit
|
102
|
|
87
|
|
||||
|
Deferred income taxes
|
1,689
|
|
1,640
|
|
||||
|
Other non-current liabilities
|
243
|
|
241
|
|
||||
|
Total non-current liabilities
|
12,760
|
|
12,475
|
|
||||
|
Commitments and Contingencies
(Notes 2 and 3)
|
|
|
|
|
||||
|
Equity
|
||||||||
|
Common stockholder’s equity
|
||||||||
|
Common stock, authorized 125.0 shares; outstanding 84.1 shares in both periods
|
841
|
|
841
|
|
||||
|
Other paid-in capital
|
4,699
|
|
4,449
|
|
||||
|
Accumulated other comprehensive loss
|
(29
|
)
|
(12
|
)
|
||||
|
Retained earnings
|
1,340
|
|
1,173
|
|
||||
|
Total common stockholder’s equity
|
6,851
|
|
6,451
|
|
||||
|
Preferred stock
|
37
|
|
37
|
|
||||
|
Total equity
|
6,888
|
|
6,488
|
|
||||
|
Total Liabilities and Equity
|
$
|
21,283
|
|
$
|
21,099
|
|
||
The accompanying notes are an integral part of these statements.
51
Consumers Energy Company
Consolidated Statements of Changes in Equity (Unaudited)
|
In Millions
|
|||||||||||||||||
|
Three Months Ended
|
Six Months Ended
|
||||||||||||||||
|
June 30
|
2018
|
2017
|
2018
|
2017
|
|||||||||||||
|
Total Equity at Beginning of Period
|
$
|
6,713
|
|
$
|
6,246
|
|
$
|
6,488
|
|
$
|
5,939
|
|
|||||
|
Common Stock
|
|
|
|
||||||||||||||
|
At beginning and end of period
|
841
|
|
841
|
|
841
|
|
841
|
|
|||||||||
|
Other Paid-in Capital
|
|
||||||||||||||||
|
At beginning of period
|
4,549
|
|
4,249
|
|
4,449
|
|
3,999
|
|
|||||||||
|
Stockholder contribution
|
150
|
|
200
|
|
250
|
|
450
|
|
|||||||||
|
At end of period
|
4,699
|
|
4,449
|
|
4,699
|
|
4,449
|
|
|||||||||
|
Accumulated Other Comprehensive Loss
|
|
|
|
|
|||||||||||||
|
At beginning of period
|
(29
|
)
|
(9
|
)
|
(12
|
)
|
(3
|
)
|
|||||||||
|
Retirement benefits liability
|
|||||||||||||||||
|
At beginning of period
|
(28
|
)
|
(21
|
)
|
(24
|
)
|
(21
|
)
|
|||||||||
|
Cumulative effect of change in accounting principle
|
—
|
|
—
|
|
(5
|
)
|
—
|
|
|||||||||
|
Amortization of net actuarial loss
|
—
|
|
1
|
|
1
|
|
1
|
|
|||||||||
|
At end of period
|
(28
|
)
|
(20
|
)
|
(28
|
)
|
(20
|
)
|
|||||||||
|
Investments
|
|
|
|
|
|||||||||||||
|
At beginning of period
|
(1
|
)
|
12
|
|
12
|
|
18
|
|
|||||||||
|
Cumulative effect of change in accounting principle
|
—
|
|
—
|
|
(12
|
)
|
—
|
|
|||||||||
|
Unrealized gain (loss) on investments
|
—
|
|
—
|
|
(1
|
)
|
2
|
|
|||||||||
|
Reclassification adjustments included in net income
|
—
|
|
—
|
|
—
|
|
(8
|
)
|
|||||||||
|
At end of period
|
(1
|
)
|
12
|
|
(1
|
)
|
12
|
|
|||||||||
|
At end of period
|
(29
|
)
|
(8
|
)
|
(29
|
)
|
(8
|
)
|
|||||||||
|
Retained Earnings
|
|
|
|
|
|||||||||||||
|
At beginning of period
|
1,315
|
|
1,128
|
|
1,173
|
|
1,065
|
|
|||||||||
|
Cumulative effect of change in accounting principle
|
—
|
|
—
|
|
19
|
|
—
|
|
|||||||||
|
Net income
|
152
|
|
104
|
|
394
|
|
315
|
|
|||||||||
|
Dividends declared on common stock
|
(126
|
)
|
(88
|
)
|
(245
|
)
|
(236
|
)
|
|||||||||
|
Dividends declared on preferred stock
|
(1
|
)
|
(1
|
)
|
(1
|
)
|
(1
|
)
|
|||||||||
|
At end of period
|
1,340
|
|
1,143
|
|
1,340
|
|
1,143
|
|
|||||||||
|
Preferred Stock
|
|
|
|||||||||||||||
|
At beginning and end of period
|
37
|
|
37
|
|
37
|
|
37
|
|
|||||||||
|
Total Equity at End of Period
|
$
|
6,888
|
|
$
|
6,462
|
|
$
|
6,888
|
|
$
|
6,462
|
|
|||||
The accompanying notes are an integral part of these statements.
52
CMS Energy Corporation
Consumers Energy Company
Notes to the Unaudited Consolidated Financial Statements
These interim consolidated financial statements have been prepared by CMS Energy and Consumers in accordance with GAAP for interim financial information and with the instructions to Form 10‑Q and Article 10 of Regulation S‑X. As a result, CMS Energy and Consumers have condensed or omitted certain information and note disclosures normally included in consolidated financial statements prepared in accordance with GAAP. CMS Energy and Consumers have reclassified certain prior period amounts to conform to the presentation in the current period and to reflect the implementation of new accounting standards. CMS Energy and Consumers are required to make estimates using assumptions that may affect reported amounts and disclosures; actual results could differ from these estimates. In management’s opinion, the unaudited information contained in this report reflects all adjustments of a normal recurring nature necessary to ensure that CMS Energy’s and Consumers’ financial position, results of operations, and cash flows for the periods presented are fairly stated. The notes to the unaudited consolidated financial statements and the related unaudited consolidated financial statements should be read in conjunction with the consolidated financial statements and related notes contained in the 2017 Form 10‑K. Due to the seasonal nature of CMS Energy’s and Consumers’ operations, the results presented for this interim period are not necessarily indicative of results to be achieved for the fiscal year.
1
:
New Accounting Standards
Implementation of New Accounting Standards
ASU 2014-09,
Revenue from Contracts with Customers:
This standard, which was effective on January 1, 2018 for CMS Energy and Consumers, provides new guidance for recognizing revenue from contracts with customers. A primary objective of the standard is to provide a single, comprehensive revenue recognition model that will be applied across entities, industries, and capital markets. The new guidance replaced most of the previous revenue recognition requirements in GAAP, although certain guidance specific to rate-regulated utilities was retained. CMS Energy and Consumers had the option to apply the standard retrospectively to all prior periods presented or retrospectively with the cumulative effect of the standard recorded as an adjustment to beginning retained earnings. They also had the option to apply the standard only to contracts existing on the effective date. CMS Energy and Consumers applied the standard retrospectively to contracts existing on the effective date, and recorded an immaterial cumulative-effect reduction to beginning retained earnings for certain contract costs that can no longer be deferred under the new guidance.
The implementation of this standard did not have a material impact on CMS Energy’s or Consumers’ consolidated net income, cash flows, or financial position. CMS Energy and Consumers did not identify any significant changes to their revenue recognition practices that were required by the new guidance, but in accordance with the standard, they have provided additional disclosures about their revenues in
Note 11, Revenue
.
ASU 2016-01, Recognition and Measurement of Financial Assets and Financial Liabilities:
This standard, which was effective on January 1, 2018 for CMS Energy and Consumers, is intended to improve the accounting for financial instruments. The standard requires investments in equity securities to be measured at fair value, with changes in fair value recognized in net income, except for certain investments such as those that qualify for equity-method accounting. The standard no longer permits unrealized gains and losses for certain equity investments to be recorded in AOCI. There are other targeted changes as well. Entities must apply the standard using a modified retrospective approach, with the cumulative effect of the standard recorded as an adjustment to beginning retained earnings.
53
The implementation of the standard had no impact on CMS Energy’s consolidated financial statements. In accordance with the standard, as of January 1, 2018, Consumers removed a
$19 million
unrealized gain and the associated deferred taxes on its investment in CMS Energy common stock from AOCI and recorded the gain in retained earnings. In January 2018, Consumers transferred substantially all of its shares in CMS Energy common stock to a related charitable foundation and, in accordance with this standard, recognized all unrealized gains and losses on its remaining shares in net income for the
three and six months ended June 30, 2018
. The accounting treatment for this investment is reflected in Consumers’ consolidated financial statements only, and had no impact on CMS Energy’s consolidated financial statements. For further details on CMS Energy’s and Consumers’ investments in debt and equity securities, see
Note 6, Financial Instruments
.
ASU 2018-02, Reclassification of Certain Tax Effects from Accumulated Other Comprehensive Income:
This standard addresses the income tax effects stranded in AOCI as a result of the TCJA. Existing GAAP requires that the remeasurement of deferred tax assets and liabilities resulting from a change in tax laws or rates be presented in net income from continuing operations, even if the deferred taxes were associated with items that were originally recognized in AOCI. As a result, upon recognizing the effects of the TCJA, the tax effects of items in AOCI (referred to as stranded tax effects) no longer reflected the current income tax rate. To address this matter, this standard permits companies to reclassify to retained earnings the stranded tax effects of the TCJA. The standard is effective on January 1, 2019 for CMS Energy and Consumers, but early adoption is permitted. The new guidance is to be applied either in the period of adoption or retrospectively to each prior period in which the effect of the TCJA was recognized. CMS Energy and Consumers elected to adopt this standard early. Accordingly, as of January 1, 2018, CMS Energy reclassified
$11 million
of stranded tax effects from AOCI to retained earnings, which included
$5 million
reclassified at Consumers. At
June 30, 2018
, CMS Energy and Consumers did not have any material stranded tax effects remaining in AOCI.
New Accounting Standards Not Yet Effective
ASU 2016-02, Leases:
This standard establishes a new accounting model for leases. The standard will require entities to recognize lease assets and liabilities on the balance sheet for all leases with a term of more than one year, including operating leases, which are not recorded on the balance sheet under existing standards. The new guidance will also amend the definition of a lease to require that a lessee control the use of a specified asset, and not simply control or take the output of the asset. On the income statement, leases that meet existing capital lease criteria will generally be accounted for under a financing model, while operating leases will generally be accounted for under a straight-line expense model. The standard will be effective on January 1, 2019 for CMS Energy and Consumers, but early adoption is permitted.
CMS Energy and Consumers are not adopting the standard early and expect to elect certain practical expedients permitted by the standard, under which they will not be required to perform lease assessments or reassessments for agreements existing on the effective date. CMS Energy and Consumers expect to recognize additional lease assets and liabilities for their operating leases under the standard. CMS Energy and Consumers are continuing to evaluate the standard; however, they do not expect that it will have a material impact on their consolidated net income or cash flows.
ASU 2016-13, Measurement of Credit Losses on Financial Instruments:
This standard, which will be effective January 1, 2020 for CMS Energy and Consumers, provides new guidance for estimating and recording credit losses on financial instruments. The standard will apply to the recognition of loan losses at EnerBank as well as to the recognition of uncollectible accounts expense at Consumers. Entities will apply the standard using a modified retrospective approach, with a cumulative-effect adjustment recorded to beginning retained earnings on the effective date. CMS Energy and Consumers are evaluating the impact of the standard on their consolidated financial statements.
54
2
:
Regulatory Matters
Regulatory matters are critical to Consumers. The Michigan Attorney General, ABATE, the MPSC Staff, and certain other parties typically participate in MPSC proceedings concerning Consumers, such as Consumers’ rate cases and PSCR and GCR processes. These parties often challenge various aspects of those proceedings, including the prudence of Consumers’ policies and practices, and seek cost disallowances and other relief. The parties also have appealed significant MPSC orders. Depending upon the specific issues, the outcomes of rate cases and proceedings, including judicial proceedings challenging MPSC orders or other actions, could negatively affect CMS Energy’s and Consumers’ liquidity, financial condition, and results of operations. Consumers cannot predict the outcome of these proceedings.
There are multiple appeals pending that involve various issues concerning cost recovery from customers, the adequacy of the record evidence supporting the recovery of Smart Energy investments, and other matters. Consumers is unable to predict the outcome of these appeals.
Electric Rate Case:
In March 2017, Consumers filed an application with the MPSC seeking an annual rate increase of
$173 million
, based on a
10.5 percent
authorized return on equity. The filing requested authority to recover new investment in system reliability, environmental compliance, and technology enhancements. In September 2017, Consumers reduced its requested annual rate increase to
$148 million
. In October 2017, Consumers self-implemented an annual rate increase of
$130 million
, subject to refund with interest and potential penalties
. The MPSC issued an order in March 2018, authorizing an annual rate increase of
$66 million
, based on a
10.0 percent
authorized return on equity.
In June 2018, as a result of a petition for rehearing filed by Consumers, the MPSC issued an order adjusting the authorized annual rate increase to
$72 million
by allowing recovery of additional retirement benefit plan costs.
Consumers had a recorded liability of
$35 million
for customer refunds at
June 30, 2018
.
Gas Rate Case:
In February 2018, the MPSC Staff filed testimony in the general gas rate case that Consumers filed in October 2017. In its testimony, the MPSC Staff
recommended the disallowance of cost recovery for certain categories of historical capital expenditures incurred by Consumers
, totaling over
$115 million
. In July 2018, the administrative law judge issued a proposal for decision supporting a portion of the MPSC Staff’s recommended disallowance, totaling
$100 million
. If
the MPSC were to adopt some or all of the administrative law judge’s recommendations, Consumers would be required to write off up to
$145 million
of assets
; this range of loss takes into account Consumers’ actual historical costs.
A material disallowance of historical costs could negatively affect CMS Energy’s and Consumers’ results of operations. While Consumers cannot predict the outcome of this proceeding, it does not believe it is probable that the MPSC will disallow these historical capital expenditures in the final order, as there is no regulatory precedent of a disallowance of this type.
Tax Cuts and Jobs Act
:
The TCJA, which changed existing federal tax law and included numerous provisions that affect businesses, was signed into law in December 2017. In February 2018, the MPSC ordered Consumers to file various proceedings to determine the reduction in its electric and gas revenue requirements as a result of the TCJA. The MPSC also ordered Consumers to implement bill credits to reflect that reduction until customer rates are adjusted through Consumers’ general rate cases. Consumers filed the first of these proceedings in March 2018, requesting a
$49 million
reduction in its annual gas revenue requirement. The MPSC approved this reduction in June 2018, with credits to customer bills beginning in July 2018. Consumers filed the second proceeding in April 2018, requesting a
$113 million
reduction in its annual electric revenue requirement. The MPSC approved this reduction in July 2018, with credits to customer bills beginning in August 2018. These credits will reduce rates prospectively for the impact of the TCJA but do not include potential refunds associated with Consumers’ remeasurement of its deferred income taxes; these will be considered in a subsequent proceeding.
By October 2018, Consumers will file two more proceedings to address amounts collected from customers during 2018 through the implementation of the first two proceedings. Consumers’ liability for customer refunds for amounts over-collected during that time was
$88 million
at
June 30, 2018
.
55
Consumers will also file, by October 2018, additional proceedings to address the December 31, 2017 remeasurement of its deferred income taxes and any other impacts of the TCJA on customers.
For additional details on the remeasurement, see
Note 9, Income Taxes
.
Energy Waste Reduction Plan Incentive:
Consumers filed its 2017 energy waste reduction reconciliation in May 2018, requesting the MPSC’s approval to collect from customers the maximum performance incentive of
$31 million
for exceeding its statutory savings targets in 2017. Consumers recognized incentive revenue under this program of
$31 million
in 2017.
3
:
Contingencies and Commitments
CMS Energy and Consumers are involved in various matters that give rise to contingent liabilities. Depending on the specific issues, the resolution of these contingencies could negatively affect CMS Energy’s and Consumers’ liquidity, financial condition, and results of operations. In their disclosures of these matters, CMS Energy and Consumers provide an estimate of the possible loss or range of loss when such an estimate can be made. Disclosures that state that CMS Energy or Consumers cannot predict the outcome of a matter indicate that they are unable to estimate a possible loss or range of loss for the matter.
CMS Energy Contingencies
Gas Index Price Reporting Litigation:
CMS Energy, along with CMS MST, CMS Field Services, Cantera Natural Gas, Inc., and Cantera Gas Company, were named as defendants in
four
class action lawsuits and
one
individual lawsuit arising as a result of alleged inaccurate natural gas price reporting to publications that report trade information. Allegations include price-fixing conspiracies, restraint of trade, and artificial inflation of natural gas retail prices in Kansas, Missouri, and Wisconsin. In 2016, CMS Energy entities reached a settlement with the plaintiffs in the Kansas and Missouri class action cases for an amount that was not material to CMS Energy. In August 2017, the federal district court approved the settlement. Plaintiffs are making claims for the following: treble damages, full consideration damages, exemplary damages, costs, interest, and/or attorneys’ fees.
After removal to federal court, all of the cases were transferred to a single federal district court pursuant to the multidistrict litigation process. In 2010 and 2011, all claims against CMS Energy defendants were dismissed by the district court based on FERC preemption. In 2013, the U.S. Court of Appeals for the Ninth Circuit reversed the district court decision. The appellate court found that FERC preemption does not apply under the facts of these cases. The appellate court affirmed the district court’s denial of leave to amend to add federal antitrust claims. The matter was appealed to the U.S. Supreme Court, which in 2015 upheld the Ninth Circuit’s decision. The cases were remanded back to the federal district court.
In 2016, the federal district court granted the defendants’ motion for summary judgment in the individual lawsuit filed in Kansas based on a release in a prior settlement involving similar allegations; the order of summary judgment was subsequently appealed. In March 2018, the U.S. Court of Appeals for the Ninth Circuit reversed the lower court’s ruling and remanded the case back to the federal district court.
In March 2017, the federal district court denied plaintiffs’ motion for class certification in the
two
pending class action cases. The plaintiffs appealed that decision to the U.S. Court of Appeals for the Ninth Circuit, which has accepted the matter for hearing. In June 2017, an unaffiliated company that is also a defendant in these cases filed for bankruptcy, which could increase the risk of loss to CMS Energy.
These cases involve complex facts, a large number of similarly situated defendants with different factual positions, and multiple jurisdictions. Presently, any estimate of liability would be highly speculative; the amount of CMS Energy’s reasonably possible loss would be based on widely varying models previously untested in this context. If the outcome after appeals is unfavorable, these cases could negatively affect CMS Energy’s liquidity, financial condition, and results of operations.
56
Bay Harbor:
CMS Land retained environmental remediation obligations for the collection and treatment of leachate, a liquid consisting of water and other substances, at Bay Harbor after selling its interests in the development in 2002. Leachate is produced when water enters into cement kiln dust piles left over from former cement plant operations at the site. In 2012, CMS Land and the MDEQ finalized an agreement that established the final remedies and the future water quality criteria at the site. CMS Land completed all construction necessary to implement the remedies required by the agreement and will continue to maintain and operate a system to discharge treated leachate into Little Traverse Bay under an NPDES permit issued in 2010 and renewed in 2016. The renewed NPDES permit is valid through September 2020.
Various claims have been brought against CMS Land or its affiliates, including CMS Energy, alleging environmental damage to property, loss of property value, insufficient disclosure of environmental matters, breach of agreement relating to access, or other matters. CMS Land and other parties have received a demand for payment from the EPA in the amount of
$8 million
, plus interest and costs. The EPA is seeking recovery under CERCLA of response costs allegedly incurred at Bay Harbor. These costs exceed what was agreed to in a 2005 order between CMS Land and the EPA and CMS Land believes that the claim was made beyond the appropriate statute of limitations. CMS Land has communicated to the EPA that it does not believe that this is a valid claim. The EPA has filed a lawsuit to collect these costs.
At
June 30, 2018
, CMS Energy had a recorded liability of
$47 million
for its remaining obligations for environmental remediation. CMS Energy calculated this liability based on discounted projected costs, using a discount rate of
4.34 percent
and an inflation rate of
one
percent on annual operating and maintenance costs. The undiscounted amount of the remaining obligation is
$58 million
. CMS Energy expects to pay the following amounts for long-term liquid disposal and operating and maintenance costs during the remainder of
2018
and in each of the next five years:
|
In Millions
|
||||||||||||||||||||||||
|
2018
|
2019
|
2020
|
2021
|
2022
|
2023
|
|||||||||||||||||||
|
CMS Energy
|
||||||||||||||||||||||||
|
Long-term liquid disposal and operating and maintenance costs
|
$
|
2
|
|
$
|
4
|
|
$
|
4
|
|
$
|
4
|
|
$
|
4
|
|
$
|
4
|
|
||||||
CMS Energy’s estimate of response activity costs and the timing of expenditures could change if there are changes in circumstances or assumptions used in calculating the liability. Although a liability for its present estimate of remaining response activity costs has been recorded, CMS Energy cannot predict the ultimate financial impact or outcome of this matter.
Equatorial Guinea Tax Claim:
In 2002, CMS Energy sold its oil, gas, and methanol investments in Equatorial Guinea. The government of Equatorial Guinea claims that, in connection with the sale, CMS Energy owes
$152 million
in taxes, plus substantial penalties and interest that could be up to the amount of the taxes claimed. In 2015, the matter was proceeding to formal arbitration; however, since then, the government of Equatorial Guinea has stopped communicating. CMS Energy has concluded that the government’s tax claim is without merit and will continue to contest the claim, but cannot predict the financial impact or outcome of the matter. An unfavorable outcome could have a material adverse effect on CMS Energy’s liquidity, financial condition, and results of operations.
Consumers Electric Utility Contingencies
Electric Environmental Matters:
Consumers’ operations are subject to environmental laws and regulations. Historically, Consumers has generally been able to recover, in customer rates, the costs to operate its facilities in compliance with these laws and regulations.
Cleanup and Solid Waste:
Consumers expects to incur remediation and other response activity costs at a number of sites under the NREPA. Consumers believes that these costs should be recoverable in rates, but cannot guarantee that outcome. Consumers estimates that its liability for NREPA sites for which it can
57
estimate a range of loss will be between
$3 million
and
$4 million
. At
June 30, 2018
, Consumers had a recorded liability of
$3 million
, the minimum amount in the range of its estimated probable NREPA liability, as no amount in the range was considered a better estimate than any other amount.
Consumers is a potentially responsible party at a number of contaminated sites administered under CERCLA. CERCLA liability is joint and several. In 2010, Consumers received official notification from the EPA that identified Consumers as a potentially responsible party for cleanup of PCBs at the Kalamazoo River CERCLA site. The notification claimed that the EPA has reason to believe that Consumers disposed of PCBs and arranged for the disposal and treatment of PCB-containing materials at portions of the site. In 2011, Consumers received a follow-up letter from the EPA requesting that Consumers agree to participate in a removal action plan along with several other companies for an area of lower Portage Creek, which is connected to the Kalamazoo River. All parties, including Consumers, that were asked to participate in the removal action plan declined to accept liability. Until further information is received from the EPA, Consumers is unable to estimate a range of potential liability for cleanup of the river.
Based on its experience, Consumers estimates that its share of the total liability for known CERCLA sites will be between
$3 million
and
$8 million
. Various factors, including the number and creditworthiness of potentially responsible parties involved with each site, affect Consumers’ share of the total liability. At
June 30, 2018
, Consumers had a recorded liability of
$3 million
for its share of the total liability at these sites, the minimum amount in the range of its estimated probable CERCLA liability, as no amount in the range was considered a better estimate than any other amount.
The timing of payments related to Consumers’ remediation and other response activities at its CERCLA and NREPA sites is uncertain. Consumers periodically reviews these cost estimates. A change in the underlying assumptions, such as an increase in the number of sites, different remediation techniques, the nature and extent of contamination, and legal and regulatory requirements, could affect its estimates of NREPA and CERCLA liability.
Ludington PCB:
In 1998, during routine maintenance activities, Consumers identified PCB as a component in certain paint, grout, and sealant materials at Ludington. Consumers removed part of the PCB material and replaced it with non‑PCB material. Consumers has had several communications with the EPA regarding this matter, but cannot predict the financial impact or outcome.
MCV PPA:
In December 2017, the MCV Partnership initiated arbitration against Consumers, asserting a breach of contract associated with the MCV PPA. Under this PPA, Consumers pays the MCV Partnership a fixed energy charge based on Consumers’ annual average baseload coal generating plant operating and maintenance cost, fuel inventory, and administrative and general expenses. The MCV Partnership asserts that Consumers should have installed pollution control equipment on coal-fueled electric generating units years before they were retired. The MCV Partnership also asserts that Consumers should have installed pollution control equipment earlier on its remaining coal-fueled electric generating units. The assertion claims that these changes would have increased Consumers’ costs to operate and maintain the facilities and, thereby, the fixed energy charge paid to the MCV Partnership. Additionally, the MCV Partnership claims that Consumers improperly characterized certain costs included in the calculation of the fixed energy charge.
The claim estimates damages and interest in excess of
$270 million
, the majority of which is related to the claim on the installation of pollution control equipment. Consumers believes that the MCV Partnership’s claim is without merit, but cannot predict the financial impact or outcome of the matter.
Underwater Cables in Straits of Mackinac:
Consumers owns certain underwater electric cables in the Straits of Mackinac, which were de‑energized and retired in 1990. Consumers was notified that some of these cables were damaged as a result of vessel activity in April 2018. Following the notification, Consumers located, inspected, sampled, capped, and returned the retired cables to their original location on the lake bottom, and did not find any substantive evidence of environmental contamination.
58
Consumers is collaborating with the State of Michigan, local tribes, and other stakeholders to evaluate the status of the cables and to determine if any additional action is required. Consumers cannot predict the outcome of this matter, but if Consumers is required to remove all the cables, it could incur additional costs of up to
$10 million
. Consumers plans to file suit against the company that owns the vessel that allegedly caused the damage. Consumers would likely seek recovery from customers of any costs incurred.
Consumers Gas Utility Contingencies
Gas Environmental Matters:
Consumers expects to incur remediation and other response activity costs at a number of sites under the NREPA. These sites include
23
former MGP
facilities. Consumers operated the facilities on these sites for some part of their operating lives. For some of these sites, Consumers has no present ownership interest or may own only a portion of the original site.
At
June 30, 2018
, Consumers had a recorded liability of
$83 million
for its remaining obligations for these sites. This amount represents the present value of long-term projected costs, using a discount rate of
2.57 percent
and an inflation rate of
2.5 percent
. The undiscounted amount of the remaining obligation is
$90 million
. Consumers expects to pay the following amounts for remediation and other response activity costs during the remainder of 2018 and in each of the next five years:
|
In Millions
|
||||||||||||||||||||||||
|
2018
|
2019
|
2020
|
2021
|
2022
|
2023
|
|||||||||||||||||||
|
Consumers
|
||||||||||||||||||||||||
|
Remediation and other response activity costs
|
$
|
11
|
|
$
|
18
|
|
$
|
10
|
|
$
|
18
|
|
$
|
7
|
|
$
|
2
|
|
||||||
Consumers periodically reviews these cost estimates. Any significant change in the underlying assumptions, such as an increase in the number of sites, changes in remediation techniques, or legal and regulatory requirements, could affect Consumers’ estimates of annual response activity costs and the MGP liability.
Pursuant to orders issued by the MPSC, Consumers defers its MGP-related remediation costs and recovers them from its customers over a
ten
-year period. At
June 30, 2018
, Consumers had a regulatory asset of
$139 million
related to the MGP sites.
Consumers estimates that its liability to perform remediation and other response activities at NREPA sites other than the MGP sites could reach
$3 million
. At
June 30, 2018
, Consumers had a recorded liability of less than
$1 million
, the minimum amount in the range of its estimated probable liability, as no amount in the range was considered a better estimate than any other amount.
Guarantees
Presented in the following table are CMS Energy’s and Consumers’ guarantees at
June 30, 2018
:
|
In Millions
|
||||||||||||
|
Guarantee Description
|
Issue Date
|
Expiration Date
|
Maximum Obligation
|
Carrying Amount
|
||||||||
|
CMS Energy, including Consumers
|
||||||||||||
|
Indemnity obligations from stock and asset sale agreements
1
|
Various
|
Indefinite
|
$
|
153
|
|
$
|
3
|
|
||||
|
Guarantees
2
|
Various
|
Indefinite
|
39
|
|
—
|
|
||||||
|
Consumers
|
||||||||||||
|
Guarantee
2
|
July 2011
|
Indefinite
|
$
|
30
|
|
$
|
—
|
|
||||
59
|
1
|
These obligations arose from stock and asset sale agreements under which CMS Energy or a subsidiary of CMS Energy indemnified the purchaser for losses resulting from various matters, primarily claims related to taxes. CMS Energy believes the likelihood of material loss to be remote for the indemnity obligations not recorded as liabilities.
|
|
2
|
At Consumers, this obligation comprises a guarantee provided to the U.S. Department of Energy in connection with a settlement agreement regarding damages resulting from the department’s failure to accept spent nuclear fuel from nuclear power plants formerly owned by Consumers. At CMS Energy, the guarantee obligations comprise Consumers’ guarantee to the U.S. Department of Energy and CMS Energy’s 1994 guarantee of non‑recourse revenue bonds issued by Genesee.
|
Additionally, in the normal course of business, CMS Energy, Consumers, and certain other subsidiaries of CMS Energy have entered into various agreements containing tax and other indemnity provisions for which they are unable to estimate the maximum potential obligation. The carrying value of these indemnity obligations is
$1 million
. CMS Energy and Consumers consider the likelihood that they would be required to perform or incur substantial losses related to these indemnities to be remote.
Other Contingencies
In addition to the matters disclosed in this Note and
Note 2, Regulatory Matters
, there are certain other lawsuits and administrative proceedings before various courts and governmental agencies arising in the ordinary course of business to which CMS Energy, Consumers, and certain other subsidiaries of CMS Energy are parties. These other lawsuits and proceedings may involve personal injury, property damage, contracts, environmental matters, federal and state taxes, rates, licensing, employment, and other matters. Further, CMS Energy and Consumers occasionally self-report certain regulatory non‑compliance matters that may or may not eventually result in administrative proceedings. CMS Energy and Consumers believe that the outcome of any one of these proceedings will not have a material negative effect on their consolidated results of operations, financial condition, or liquidity.
60
4
:
Financings and Capitalization
Financings:
Presented in the following table is a summary of major long-term debt transactions during the six months ended
June 30, 2018
.
|
Principal
(In Millions) |
Interest Rate
|
|
Issue/Retirement
Date
|
Maturity Date
|
||||
|
Debt issuances
|
||||||||
|
CMS Energy, parent only
|
||||||||
|
Junior subordinated notes
1
|
$
|
200
|
|
5.625
|
%
|
March 2018
|
March 2078
|
|
|
Total CMS Energy, parent only
|
$
|
200
|
|
|||||
|
Consumers
|
||||||||
|
First mortgage bonds
|
$
|
550
|
|
4.05
|
%
|
May 2018
|
May 2048
|
|
|
Total Consumers
|
$
|
550
|
|
|||||
|
Total CMS Energy
|
$
|
750
|
|
|||||
|
Debt retirements
|
||||||||
|
CMS Energy, parent only
|
||||||||
|
Term loan facility
|
$
|
180
|
|
variable
|
|
March 2018
|
December 2018
|
|
|
Senior notes
2
|
$
|
100
|
|
8.75
|
%
|
June 2018
|
June 2019
|
|
|
Total CMS Energy, parent only
|
$
|
280
|
|
|||||
|
Consumers
|
||||||||
|
Tax-exempt pollution control revenue bonds
|
$
|
68
|
|
various
|
|
April 2018
|
April 2018
|
|
|
First mortgage bonds
|
250
|
|
5.65
|
%
|
May 2018
|
September 2018
|
||
|
Total Consumers
|
$
|
318
|
|
|||||
|
Total CMS Energy
|
$
|
598
|
|
|||||
|
1
|
These unsecured obligations rank subordinate and junior in right of payment to all of CMS Energy’s existing and future senior indebtedness.
|
|
2
|
CMS Energy retired these senior notes at a premium and recorded a loss on extinguishment of
$5 million
in other expense on its consolidated statements of income.
|
In July 2018, Consumers entered into a bond purchase agreement to issue an aggregate principal amount of
$500 million
in first mortgage bonds through a private placement. The issuance and funding of the bonds is expected to occur in October 2018.
Revolving Credit Facilities:
The following revolving credit facilities with banks were available at
June 30, 2018
:
|
In Millions
|
||||||||||||||||
|
Expiration Date
|
Amount of Facility
|
Amount Borrowed
|
Letters of Credit Outstanding
|
Amount Available
|
||||||||||||
|
CMS Energy, parent only
|
||||||||||||||||
|
June 5, 2023
1
|
$
|
550
|
|
$
|
—
|
|
$
|
1
|
|
$
|
549
|
|
||||
|
Consumers
|
||||||||||||||||
|
June 5, 2023
2,3
|
$
|
850
|
|
$
|
—
|
|
$
|
7
|
|
$
|
843
|
|
||||
|
November 23, 2019
3
|
250
|
|
—
|
|
25
|
|
225
|
|
||||||||
|
September 9, 2019
3
|
30
|
|
—
|
|
30
|
|
—
|
|
||||||||
61
|
1
|
During the
six months ended June 30, 2018
, CMS Energy’s average borrowings totaled
$23 million
with a weighted-average interest rate of
2.81 percent
.
In June 2018, CMS Energy amended this revolving credit facility, eliminating the security provided by Consumers common stock, and extending the expiration date to June 2023.
|
|
2
|
In June 2018, Consumers amended this revolving credit facility by increasing its borrowing capacity to
$850 million
and extending the expiration date to June 2023.
|
|
3
|
Obligations under this facility are secured by first mortgage bonds of Consumers.
|
Short-term Borrowings:
Under
Consumers’ commercial paper program
, Consumers may
issue, in one or more placements
, commercial paper notes
with maturities of up to 365 days and that bear interest at fixed or floating rates. These issuances are supported by Consumers’ revolving credit facilities
and may have an aggregate principal amount outstanding of
up to
$500 million
.
While the amount of outstanding commercial paper does not reduce the available capacity of the revolving credit facilities, Consumers does not intend to issue commercial paper in an amount exceeding the available capacity of the facilities. At
June 30, 2018
, no commercial paper notes were outstanding under this program.
Dividend Restrictions
:
At
June 30, 2018
, payment of dividends by CMS Energy on its common stock was limited to
$4.7 billion
under provisions of the Michigan Business Corporation Act of 1972.
Under the provisions of its articles of incorporation, at
June 30, 2018
, Consumers had
$1.3 billion
of unrestricted retained earnings available to pay dividends on its common stock to CMS Energy. Provisions of the Federal Power Act and the Natural Gas Act appear to restrict dividends payable by Consumers to the amount of Consumers’ retained earnings. Several decisions from FERC suggest that, under a variety of circumstances, dividends from Consumers on its common stock would not be limited to amounts in Consumers’ retained earnings. Any decision by Consumers to pay dividends on its common stock in excess of retained earnings would be based on specific facts and circumstances and would be subject to a formal regulatory filing process.
For the
six months ended June 30, 2018
, Consumers paid
$245 million
in dividends on its common stock to CMS Energy.
Issuance of Common Stock:
In March 2017, CMS Energy entered into an updated continuous equity offering program
permitting it to
sell, from time to time in “at the market” offerings, common stock having an aggregate sales price of up to
$100 million
.
Presented in the following table are the transactions that CMS Energy entered into under the program:
|
Number of Shares Issued
|
Average Price per Share
|
Net Proceeds
(In Millions) |
|||||||||
|
May 2018
|
638,898
|
|
$
|
45.83
|
|
$
|
29
|
|
|||
|
June 2017
|
1,494,371
|
|
47.31
|
|
70
|
|
|||||
62
5
:
Fair Value Measurements
Accounting standards define fair value as the price that would be received to sell an asset or paid to transfer a liability in an orderly transaction between market participants. When measuring fair value, CMS Energy and Consumers are required to incorporate all assumptions that market participants would use in pricing an asset or liability, including assumptions about risk. A fair value hierarchy prioritizes inputs used to measure fair value according to their observability in the market. The three levels of the fair value hierarchy are as follows:
|
•
|
Level 1 inputs are unadjusted quoted prices in active markets for identical assets or liabilities.
|
|
•
|
Level 2 inputs are observable, market-based inputs, other than Level 1 prices. Level 2 inputs may include quoted prices for similar assets or liabilities in active markets, quoted prices in inactive markets, and inputs derived from or corroborated by observable market data.
|
|
•
|
Level 3 inputs are unobservable inputs that reflect CMS Energy’s or Consumers’ own assumptions about how market participants would value their assets and liabilities.
|
CMS Energy and Consumers classify fair value measurements within the fair value hierarchy based on the lowest level of input that is significant to the fair value measurement in its entirety.
Assets and Liabilities Measured at Fair Value on a Recurring Basis
Presented in the following table are CMS Energy’s and Consumers’ assets and liabilities recorded at fair value on a recurring basis:
|
In Millions
|
|||||||||||||||||
|
CMS Energy, including Consumers
|
Consumers
|
||||||||||||||||
|
June 30
2018 |
December 31
2017 |
June 30
2018 |
December 31
2017 |
||||||||||||||
|
Assets
1
|
|||||||||||||||||
|
Cash equivalents
|
$
|
56
|
|
$
|
74
|
|
$
|
—
|
|
$
|
—
|
|
|||||
|
Restricted cash equivalents
|
17
|
|
17
|
|
17
|
|
17
|
|
|||||||||
|
CMS Energy common stock
|
—
|
|
—
|
|
1
|
|
21
|
|
|||||||||
|
Nonqualified deferred compensation plan assets
|
14
|
|
14
|
|
11
|
|
10
|
|
|||||||||
|
DB SERP
|
|||||||||||||||||
|
Cash equivalents
|
7
|
|
5
|
|
5
|
|
4
|
|
|||||||||
|
Debt securities
|
133
|
|
141
|
|
97
|
|
102
|
|
|||||||||
|
Derivative instruments
|
|||||||||||||||||
|
Commodity contracts
|
2
|
|
1
|
|
2
|
|
1
|
|
|||||||||
|
Total
|
$
|
229
|
|
$
|
252
|
|
$
|
133
|
|
$
|
155
|
|
|||||
|
Liabilities
1
|
|||||||||||||||||
|
Nonqualified deferred compensation plan liabilities
|
$
|
14
|
|
$
|
14
|
|
$
|
11
|
|
$
|
10
|
|
|||||
|
Derivative instruments
|
|||||||||||||||||
|
Commodity contracts
|
1
|
|
1
|
|
1
|
|
—
|
|
|||||||||
|
Total
|
$
|
15
|
|
$
|
15
|
|
$
|
12
|
|
$
|
10
|
|
|||||
|
1
|
All assets and liabilities were classified as Level 1 with the exception of some commodity contracts, which were classified as Level 3.
|
63
Cash Equivalents:
Cash equivalents and restricted cash equivalents consist of money market funds with daily liquidity. Short-term debt instruments classified as cash equivalents on the consolidated balance sheets are not included since they are recorded at amortized cost.
Nonqualified Deferred Compensation Plan Assets and Liabilities:
The nonqualified deferred compensation plan assets consist of mutual funds, which are valued using the daily quoted net asset values. CMS Energy and Consumers value their nonqualified deferred compensation plan liabilities based on the fair values of the plan assets, as they reflect the amount owed to the plan participants in accordance with their investment elections. CMS Energy and Consumers report the assets in other non‑current assets and the liabilities in other non‑current liabilities on their consolidated balance sheets.
DB SERP Assets:
The DB SERP cash equivalents consist of a money market fund with daily liquidity. The DB SERP debt securities consist of U.S. Treasury debt securities and are valued at their daily quoted market prices. CMS Energy and Consumers report their DB SERP assets in other non‑current assets on their consolidated balance sheets.
In July 2018, CMS Energy and Consumers sold the DB SERP debt securities
. For additional details about DB SERP securities, see
Note 6, Financial Instruments
.
Derivative Instruments:
CMS Energy and Consumers value their derivative instruments using either a market approach that incorporates information from market transactions, or an income approach that discounts future expected cash flows to a present value amount. CMS Energy values its exchange-traded derivative contracts based on Level 1 quoted prices. CMS Energy’s and Consumers’ remaining derivatives are classified as Level 3.
The majority of these derivatives are FTRs held by Consumers. Consumers uses FTRs to manage price risk related to electricity transmission congestion. An FTR is a financial instrument that entitles its holder to receive compensation or requires its holder to remit payment for congestion-related transmission charges. Under regulatory accounting, all changes in fair value associated with FTRs are deferred as regulatory assets and liabilities until the instruments are settled. Due to the lack of quoted pricing information, Consumers determines the fair value of its FTRs based on Consumers’ average historical settlements. There was no material activity within the Level 3 category of financial assets and liabilities during the periods presented.
64
6
:
Financial Instruments
Presented in the following table are the carrying amounts and fair values, by level within the fair value hierarchy, of CMS Energy’s and Consumers’ financial instruments that are not recorded at fair value. The table excludes cash, cash equivalents, short-term financial instruments, and trade accounts receivable and payable whose carrying amounts approximate their fair values. For information about assets and liabilities recorded at fair value and for additional details regarding the fair value hierarchy, see
Note 5, Fair Value Measurements
.
|
In Millions
|
|||||||||||||||||||||||||||||||||||||||||
|
June 30, 2018
|
December 31, 2017
|
||||||||||||||||||||||||||||||||||||||||
|
Fair Value
|
Fair Value
|
||||||||||||||||||||||||||||||||||||||||
|
Carrying
|
Level
|
Carrying
|
Level
|
||||||||||||||||||||||||||||||||||||||
|
Amount
|
Total
|
1
|
2
|
3
|
Amount
|
Total
|
1
|
2
|
3
|
||||||||||||||||||||||||||||||||
|
CMS Energy, including Consumers
|
|||||||||||||||||||||||||||||||||||||||||
|
Assets
|
|||||||||||||||||||||||||||||||||||||||||
|
Long-term receivables
1
|
$
|
21
|
|
$
|
21
|
|
$
|
—
|
|
$
|
—
|
|
$
|
21
|
|
$
|
21
|
|
$
|
21
|
|
$
|
—
|
|
$
|
—
|
|
$
|
21
|
|
|||||||||||
|
Notes receivable
2
|
1,437
|
|
1,522
|
|
—
|
|
—
|
|
1,522
|
|
1,371
|
|
1,464
|
|
—
|
|
—
|
|
1,464
|
|
|||||||||||||||||||||
|
Securities held to maturity
|
19
|
|
19
|
|
—
|
|
19
|
|
—
|
|
16
|
|
16
|
|
—
|
|
16
|
|
—
|
|
|||||||||||||||||||||
|
Liabilities
|
|||||||||||||||||||||||||||||||||||||||||
|
Long-term debt
3
|
10,466
|
|
10,539
|
|
199
|
|
9,053
|
|
1,287
|
|
10,204
|
|
10,715
|
|
—
|
|
9,363
|
|
1,352
|
|
|||||||||||||||||||||
|
Long-term payables
4
|
26
|
|
26
|
|
—
|
|
—
|
|
26
|
|
27
|
|
26
|
|
—
|
|
—
|
|
26
|
|
|||||||||||||||||||||
|
Consumers
|
|||||||||||||||||||||||||||||||||||||||||
|
Assets
|
|||||||||||||||||||||||||||||||||||||||||
|
Long-term receivables
1
|
$
|
21
|
|
$
|
21
|
|
$
|
—
|
|
$
|
—
|
|
$
|
21
|
|
$
|
21
|
|
$
|
21
|
|
$
|
—
|
|
$
|
—
|
|
$
|
21
|
|
|||||||||||
|
Notes receivable
5
|
17
|
|
17
|
|
—
|
|
—
|
|
17
|
|
17
|
|
17
|
|
—
|
|
—
|
|
17
|
|
|||||||||||||||||||||
|
Liabilities
|
|||||||||||||||||||||||||||||||||||||||||
|
Long-term debt
6
|
6,114
|
|
6,163
|
|
—
|
|
4,876
|
|
1,287
|
|
5,904
|
|
6,236
|
|
—
|
|
4,883
|
|
1,353
|
|
|||||||||||||||||||||
|
1
|
Includes current accounts receivable of
$14 million
at
June 30, 2018
and
December 31, 2017
.
|
|
2
|
Includes current portion of notes receivable of
$206 million
at
June 30, 2018
and
$200 million
at
December 31, 2017
.
|
|
3
|
Includes current portion of long-term debt of
$1.2 billion
at
June 30, 2018
and
$1.1 billion
at
December 31, 2017
.
|
|
4
|
Includes current portion of long-term payables of
$3 million
at
June 30, 2018
and
December 31, 2017
.
|
|
5
|
Includes current portion of notes receivable of
$17 million
at
June 30, 2018
and
December 31, 2017
.
|
|
6
|
Includes current portion of long-term debt of
$376 million
at
June 30, 2018
and
$343 million
at
December 31, 2017
.
|
At CMS Energy, notes receivable consisted primarily of EnerBank’s fixed-rate installment loans. EnerBank estimated the fair value of these loans using a discounted cash flows technique that
65
incorporates market interest rates as well as assumptions about the remaining life of the loans and credit risk.
CMS Energy and Consumers estimated the fair value of their long-term debt using quoted prices from market trades of the debt, if available. In the absence of quoted prices, CMS Energy and Consumers calculated market yields and prices for the debt using a matrix method incorporating market data for similarly rated debt. Depending on the information available, other valuation techniques and models may be used that rely on assumptions that cannot be observed or confirmed through market transactions.
The effects of third-party credit enhancements were excluded from the fair value measurements of long-term debt. The principal amount of CMS Energy’s long-term debt supported by third-party credit enhancements was
$35 million
at
June 30, 2018
and
$103 million
at
December 31, 2017
. The entirety of these amounts was at Consumers.
Presented in the following table are CMS Energy’s and Consumers’ investment securities classified as available for sale or held to maturity:
|
In Millions
|
|||||||||||||||||||||||||||||||||
|
June 30, 2018
|
December 31, 2017
|
||||||||||||||||||||||||||||||||
|
Cost
|
Unrealized
Gains
|
Unrealized
Losses
|
Fair
Value
|
Cost
|
Unrealized
Gains
|
Unrealized
Losses
|
Fair
Value
|
||||||||||||||||||||||||||
|
CMS Energy, including Consumers
|
|||||||||||||||||||||||||||||||||
|
Available for sale
|
|||||||||||||||||||||||||||||||||
|
DB SERP
|
|||||||||||||||||||||||||||||||||
|
Debt securities
|
$
|
135
|
|
$
|
—
|
|
$
|
(2
|
)
|
$
|
133
|
|
$
|
141
|
|
$
|
—
|
|
$
|
—
|
|
$
|
141
|
|
|||||||||
|
Held to maturity
|
|||||||||||||||||||||||||||||||||
|
Debt securities
|
19
|
|
—
|
|
—
|
|
19
|
|
16
|
|
—
|
|
—
|
|
16
|
|
|||||||||||||||||
|
Consumers
|
|||||||||||||||||||||||||||||||||
|
Available for sale
|
|||||||||||||||||||||||||||||||||
|
DB SERP
|
|||||||||||||||||||||||||||||||||
|
Debt securities
|
$
|
98
|
|
$
|
—
|
|
$
|
(1
|
)
|
$
|
97
|
|
$
|
102
|
|
$
|
—
|
|
$
|
—
|
|
$
|
102
|
|
|||||||||
|
CMS Energy common stock
1
|
—
|
|
—
|
|
—
|
|
—
|
|
2
|
|
19
|
|
—
|
|
21
|
|
|||||||||||||||||
|
1
|
In January 2018, Consumers implemented ASU 2016-01,
Recognition and Measurement of Financial Assets and Financial Liabilities
. In accordance with the standard, as of January 1, 2018, Consumers removed a
$19 million
unrealized gain on its investment in CMS Energy common stock from AOCI and recorded the gain in retained earnings. For further details on CMS Energy’s and Consumers’ accounting for this new standard, see
Note 1, New Accounting Standards
.
|
In January 2018, Consumers transferred substantially all of its shares in CMS Energy common stock to a related charitable foundation. Consumers’ remaining equity investment in CMS Energy common stock was
$1 million
at
June 30, 2018
. There were
no
material changes in the fair value of Consumers’ investment in CMS Energy common stock during the
six months ended June 30, 2018
.
The DB SERP debt securities classified as available for sale were U.S. Treasury debt securities with maturities ranging from
one
to
ten years
. Debt securities classified as held to maturity consisted primarily of mortgage-backed securities and Utah Housing Corporation bonds held by EnerBank.
In July 2018, CMS Energy and Consumers sold the DB SERP debt securities
and CMS Energy issued a
$146 million
demand note payable to the DB SERP rabbi trust. The demand note payable and associated DB SERP investment will be eliminated on CMS Energy’s consolidated balance sheets. The CMS Energy demand note payable bears interest at an annual rate of
4.10 percent
and has a maturity date of 2028.
66
7
:
Notes Receivable
Presented in the following table are details of CMS Energy’s and Consumers’ current and non‑current notes receivable:
|
In Millions
|
||||||||
|
June 30, 2018
|
December 31, 2017
|
|||||||
|
CMS Energy, including Consumers
|
||||||||
|
Current
|
||||||||
|
EnerBank notes receivable, net of allowance for loan losses
|
$
|
186
|
|
$
|
178
|
|
||
|
EnerBank notes receivable held for sale
|
—
|
|
2
|
|
||||
|
Michigan tax settlement
|
20
|
|
20
|
|
||||
|
Non-current
|
||||||||
|
EnerBank notes receivable
|
1,231
|
|
1,171
|
|
||||
|
Total notes receivable
|
$
|
1,437
|
|
$
|
1,371
|
|
||
|
Consumers
|
||||||||
|
Current
|
||||||||
|
Michigan tax settlement
|
$
|
17
|
|
$
|
17
|
|
||
|
Total notes receivable
|
$
|
17
|
|
$
|
17
|
|
||
EnerBank notes receivable are unsecured consumer installment loans for financing home improvements. EnerBank records its notes receivable at cost, less an allowance for loan losses. Authorized contractors pay fees to EnerBank to provide borrowers with same-as-cash, zero interest, or reduced interest loans. Unearned income associated with the loan fees, which is recorded as a reduction to notes receivable on CMS Energy’s consolidated balance sheets, was
$85 million
at
June 30, 2018
and
$84 million
at
December 31, 2017
.
In July 2018, EnerBank purchased a portfolio of secured and unsecured consumer retail installment contracts with a principal value of
$81 million
.
The allowance for loan losses is a valuation allowance to reflect estimated credit losses. The allowance is increased by the provision for loan losses and decreased by loan charge-offs net of recoveries. Management estimates the allowance balance required by taking into consideration historical loan loss experience, the nature and volume of the portfolio, economic conditions, and other factors. Loan losses are charged against the allowance when the loss is confirmed, but no later than the point at which a loan becomes 120 days past due.
Loans that are 30 days or more past due are considered delinquent. The balance of EnerBank’s delinquent consumer loans was
$13 million
at
June 30, 2018
and
$14 million
at
December 31, 2017
.
At June 30, 2018 and
December 31, 2017
,
$1 million
of EnerBank’s loans had been modified as troubled debt restructurings.
67
8
:
Retirement Benefits
CMS Energy and Consumers provide pension, OPEB, and other retirement benefits to employees under a number of different plans.
In November 2017, CMS Energy and Consumers approved certain amendments to the OPEB Plan, resulting in higher OPEB Plan credits in 2018 compared to 2017. Presented in the following table are the costs (credits) and other changes in plan assets and benefit obligations incurred in CMS Energy’s and Consumers’ retirement benefits plans:
|
In Millions
|
|||||||||||||||||||||||||||||||||||
|
DB Pension Plans
|
OPEB Plan
|
||||||||||||||||||||||||||||||||||
|
Three Months Ended
|
Six Months Ended
|
Three Months Ended
|
Six Months Ended
|
||||||||||||||||||||||||||||||||
|
June 30
|
2018
|
2017
|
2018
|
2017
|
2018
|
2017
|
2018
|
2017
|
|||||||||||||||||||||||||||
|
CMS Energy, including Consumers
|
|||||||||||||||||||||||||||||||||||
|
Net periodic cost (credit)
|
|||||||||||||||||||||||||||||||||||
|
Service cost
|
$
|
12
|
|
$
|
11
|
|
$
|
24
|
|
$
|
22
|
|
$
|
5
|
|
$
|
5
|
|
$
|
9
|
|
$
|
10
|
|
|||||||||||
|
Interest cost
|
23
|
|
22
|
|
45
|
|
44
|
|
9
|
|
13
|
|
18
|
|
26
|
|
|||||||||||||||||||
|
Expected return on plan assets
|
(37
|
)
|
(38
|
)
|
(74
|
)
|
(76
|
)
|
(25
|
)
|
(23
|
)
|
(49
|
)
|
(45
|
)
|
|||||||||||||||||||
|
Amortization of:
|
|||||||||||||||||||||||||||||||||||
|
Net loss
|
19
|
|
20
|
|
37
|
|
40
|
|
4
|
|
8
|
|
8
|
|
16
|
|
|||||||||||||||||||
|
Prior service cost (credit)
|
—
|
|
1
|
|
1
|
|
2
|
|
(17
|
)
|
(9
|
)
|
(34
|
)
|
(18
|
)
|
|||||||||||||||||||
|
Net periodic cost (credit)
|
$
|
17
|
|
$
|
16
|
|
$
|
33
|
|
$
|
32
|
|
$
|
(24
|
)
|
$
|
(6
|
)
|
$
|
(48
|
)
|
$
|
(11
|
)
|
|||||||||||
|
Consumers
|
|||||||||||||||||||||||||||||||||||
|
Net periodic cost (credit)
|
|||||||||||||||||||||||||||||||||||
|
Service cost
|
$
|
11
|
|
$
|
11
|
|
$
|
23
|
|
$
|
22
|
|
$
|
4
|
|
$
|
4
|
|
$
|
8
|
|
$
|
9
|
|
|||||||||||
|
Interest cost
|
21
|
|
22
|
|
42
|
|
43
|
|
9
|
|
13
|
|
17
|
|
26
|
|
|||||||||||||||||||
|
Expected return on plan assets
|
(34
|
)
|
(37
|
)
|
(69
|
)
|
(74
|
)
|
(23
|
)
|
(21
|
)
|
(46
|
)
|
(42
|
)
|
|||||||||||||||||||
|
Amortization of:
|
|||||||||||||||||||||||||||||||||||
|
Net loss
|
18
|
|
19
|
|
36
|
|
39
|
|
4
|
|
8
|
|
8
|
|
16
|
|
|||||||||||||||||||
|
Prior service cost (credit)
|
—
|
|
1
|
|
1
|
|
2
|
|
(16
|
)
|
(8
|
)
|
(32
|
)
|
(17
|
)
|
|||||||||||||||||||
|
Net periodic cost (credit)
|
$
|
16
|
|
$
|
16
|
|
$
|
33
|
|
$
|
32
|
|
$
|
(22
|
)
|
$
|
(4
|
)
|
$
|
(45
|
)
|
$
|
(8
|
)
|
|||||||||||
68
9
:
Income Taxes
Presented in the following table is a reconciliation of the statutory U.S. federal income tax rate to the effective income tax rate from continuing operations:
|
Six Months Ended June 30
|
2018
|
|
2017
|
|
||
|
CMS Energy, including Consumers
|
|
|
|
|
||
|
U.S. federal income tax rate
|
21.0
|
%
|
35.0
|
%
|
||
|
Increase (decrease) in income taxes from:
|
|
|
|
|
||
|
State and local income taxes, net of federal effect
|
5.6
|
|
4.7
|
|
||
|
Accelerated flow-through of regulatory tax benefits
1
|
(5.0
|
)
|
(4.2
|
)
|
||
|
TCJA excess deferred taxes
2
|
(3.4
|
)
|
—
|
|
||
|
Research and development tax credits, net
3
|
(2.2
|
)
|
(0.1
|
)
|
||
|
Production tax credits
|
(1.7
|
)
|
(1.0
|
)
|
||
|
Employee share-based awards
|
(0.3
|
)
|
(1.4
|
)
|
||
|
Other, net
|
0.6
|
|
(0.1
|
)
|
||
|
Effective tax rate
|
14.6
|
%
|
32.9
|
%
|
||
|
Consumers
|
|
|
|
|
||
|
U.S. federal income tax rate
|
21.0
|
%
|
35.0
|
%
|
||
|
Increase (decrease) in income taxes from:
|
|
|
|
|
||
|
State and local income taxes, net of federal effect
|
5.8
|
|
4.6
|
|
||
|
Accelerated flow-through of regulatory tax benefits
1
|
(4.7
|
)
|
(4.0
|
)
|
||
|
TCJA excess deferred taxes
2
|
(3.2
|
)
|
—
|
|
||
|
Research and development tax credits, net
3
|
(2.1
|
)
|
(0.1
|
)
|
||
|
Production tax credits
|
(1.5
|
)
|
(0.9
|
)
|
||
|
Employee share-based awards
|
(0.3
|
)
|
(1.2
|
)
|
||
|
Other, net
|
0.3
|
|
(0.6
|
)
|
||
|
Effective tax rate
|
15.3
|
%
|
32.8
|
%
|
||
|
1
|
In 2013, the MPSC issued an order authorizing Consumers to accelerate the flow-through to electric and gas customers of certain income tax benefits associated primarily with the cost of removal of plant placed in service before 1993. Consumers implemented this regulatory treatment beginning in 2014. This change, which also accelerates Consumers’ recognition of the income tax benefits, reduced Consumers’ income tax expense by
$22 million
for the
six months ended June 30, 2018
and by
$19 million
for the
six months ended June 30, 2017
.
|
|
2
|
In December 2017, Consumers remeasured its deferred tax assets and liabilities at the new federal tax rate enacted by the TCJA and recorded a
$1.8 billion
regulatory liability. This regulatory liability relates to the excess deferred taxes arising from accelerated tax depreciation on assets in rate base that are governed by normalization provisions of the U.S. Internal Revenue Code. The normalization provisions require that the excess deferred taxes be refunded to customers over the remaining average service life of the associated assets. In January 2018, Consumers began to reduce this regulatory liability by crediting income tax expense. Consumers has fully reserved for the eventual refund of these excess deferred taxes that it has credited to income tax expense in a separate regulatory liability established by reducing revenue, and will continue to do so until these benefits are passed on to customers in accordance with an MPSC order, expected to be issued in 2019. At
June 30, 2018
, this reserve for refund of these excess deferred taxes totaled
$18 million
.
|
|
3
|
In March 2018, Consumers finalized a study of research and development tax credits for the tax years 2012 through 2016. As a result, Consumers recognized an
$8 million
increase in the credit, net of reserves for uncertain tax positions.
|
69
10
:
Earnings Per Share—CMS Energy
Presented in the following table are CMS Energy’s basic and diluted EPS computations based on net income:
|
In Millions, Except Per Share Amounts
|
|||||||||||||||||
|
Three Months Ended
|
Six Months Ended
|
||||||||||||||||
|
June 30
|
2018
|
2017
|
2018
|
2017
|
|||||||||||||
|
Income available to common stockholders
|
|||||||||||||||||
|
Net income
|
$
|
140
|
|
$
|
93
|
|
$
|
381
|
|
$
|
292
|
|
|||||
|
Less income attributable to noncontrolling interests
|
1
|
|
1
|
|
1
|
|
1
|
|
|||||||||
|
Net income available to common stockholders – basic and diluted
|
$
|
139
|
|
$
|
92
|
|
$
|
380
|
|
$
|
291
|
|
|||||
|
Average common shares outstanding
|
|||||||||||||||||
|
Weighted-average shares – basic
|
282.1
|
|
279.5
|
|
281.8
|
|
279.2
|
|
|||||||||
|
Add dilutive nonvested stock awards
|
0.5
|
|
0.8
|
|
0.6
|
|
0.9
|
|
|||||||||
|
Weighted-average shares – diluted
|
282.6
|
|
280.3
|
|
282.4
|
|
280.1
|
|
|||||||||
|
Net income per average common share available to common stockholders
|
|||||||||||||||||
|
Basic
|
$
|
0.49
|
|
$
|
0.33
|
|
$
|
1.35
|
|
$
|
1.04
|
|
|||||
|
Diluted
|
0.49
|
|
0.33
|
|
1.35
|
|
1.04
|
|
|||||||||
Nonvested Stock Awards
CMS Energy’s nonvested stock awards are composed of participating and non‑participating securities. The participating securities accrue cash dividends when common stockholders receive dividends. Since the recipient is not required to return the dividends to CMS Energy if the recipient forfeits the award, the nonvested stock awards are considered participating securities. As such, the participating nonvested stock awards were included in the computation of basic EPS. The non‑participating securities accrue stock dividends that vest concurrently with the stock award. If the recipient forfeits the award, the stock dividends accrued on the non‑participating securities are also forfeited. Accordingly, the non‑participating awards and stock dividends were included in the computation of diluted EPS, but not basic EPS.
70
11
:
Revenue
Presented in the following tables are the components of operating revenue:
|
In Millions
|
||||||||||||||||||||
|
Three Months Ended June 30, 2018
|
Electric Utility
|
Gas Utility
|
Enterprises
1
|
Other
2
|
Consolidated
|
|||||||||||||||
|
CMS Energy, including Consumers
|
||||||||||||||||||||
|
Consumers utility revenue
|
$
|
1,087
|
|
$
|
302
|
|
$
|
—
|
|
$
|
—
|
|
$
|
1,389
|
|
|||||
|
Other
|
—
|
|
—
|
|
24
|
|
—
|
|
24
|
|
||||||||||
|
Revenue recognized from contracts with customers
|
1,087
|
|
302
|
|
24
|
|
—
|
|
1,413
|
|
||||||||||
|
Leasing income
|
—
|
|
—
|
|
37
|
|
—
|
|
37
|
|
||||||||||
|
Financing income
|
2
|
|
2
|
|
—
|
|
36
|
|
40
|
|
||||||||||
|
Consumers alternative revenue programs
|
—
|
|
2
|
|
—
|
|
—
|
|
2
|
|
||||||||||
|
Total operating revenue – CMS Energy
|
$
|
1,089
|
|
$
|
306
|
|
$
|
61
|
|
$
|
36
|
|
$
|
1,492
|
|
|||||
|
Consumers
|
||||||||||||||||||||
|
Consumers utility revenue
|
||||||||||||||||||||
|
Residential
|
$
|
475
|
|
$
|
194
|
|
$
|
—
|
|
$
|
—
|
|
$
|
669
|
|
|||||
|
Commercial
|
386
|
|
58
|
|
—
|
|
—
|
|
444
|
|
||||||||||
|
Industrial
|
170
|
|
9
|
|
—
|
|
—
|
|
179
|
|
||||||||||
|
Other
|
56
|
|
41
|
|
—
|
|
—
|
|
97
|
|
||||||||||
|
Revenue recognized from contracts with customers
|
1,087
|
|
302
|
|
—
|
|
—
|
|
1,389
|
|
||||||||||
|
Financing income
|
2
|
|
2
|
|
—
|
|
—
|
|
4
|
|
||||||||||
|
Alternative revenue programs
|
—
|
|
2
|
|
—
|
|
—
|
|
2
|
|
||||||||||
|
Total operating revenue – Consumers
|
$
|
1,089
|
|
$
|
306
|
|
$
|
—
|
|
$
|
—
|
|
$
|
1,395
|
|
|||||
71
|
In Millions
|
||||||||||||||||||||
|
Six Months Ended June 30, 2018
|
Electric Utility
|
Gas Utility
|
Enterprises
1
|
Other
2
|
Consolidated
|
|||||||||||||||
|
CMS Energy, including Consumers
|
||||||||||||||||||||
|
Consumers utility revenue
|
$
|
2,163
|
|
$
|
1,075
|
|
$
|
—
|
|
$
|
—
|
|
$
|
3,238
|
|
|||||
|
Other
|
—
|
|
—
|
|
48
|
|
—
|
|
48
|
|
||||||||||
|
Revenue recognized from contracts with customers
|
2,163
|
|
1,075
|
|
48
|
|
—
|
|
3,286
|
|
||||||||||
|
Leasing income
|
—
|
|
—
|
|
76
|
|
—
|
|
76
|
|
||||||||||
|
Financing income
|
4
|
|
4
|
|
—
|
|
71
|
|
79
|
|
||||||||||
|
Consumers alternative revenue programs
|
—
|
|
4
|
|
—
|
|
—
|
|
4
|
|
||||||||||
|
Total operating revenue – CMS Energy
|
$
|
2,167
|
|
$
|
1,083
|
|
$
|
124
|
|
$
|
71
|
|
$
|
3,445
|
|
|||||
|
Consumers
|
||||||||||||||||||||
|
Consumers utility revenue
|
||||||||||||||||||||
|
Residential
|
$
|
976
|
|
$
|
731
|
|
$
|
—
|
|
$
|
—
|
|
$
|
1,707
|
|
|||||
|
Commercial
|
747
|
|
220
|
|
—
|
|
—
|
|
967
|
|
||||||||||
|
Industrial
|
313
|
|
33
|
|
—
|
|
—
|
|
346
|
|
||||||||||
|
Other
|
127
|
|
91
|
|
—
|
|
—
|
|
218
|
|
||||||||||
|
Revenue recognized from contracts with customers
|
2,163
|
|
1,075
|
|
—
|
|
—
|
|
3,238
|
|
||||||||||
|
Financing income
|
4
|
|
4
|
|
—
|
|
—
|
|
8
|
|
||||||||||
|
Alternative revenue programs
|
—
|
|
4
|
|
—
|
|
—
|
|
4
|
|
||||||||||
|
Total operating revenue – Consumers
|
$
|
2,167
|
|
$
|
1,083
|
|
$
|
—
|
|
$
|
—
|
|
$
|
3,250
|
|
|||||
|
1
|
Amounts represent the enterprises segment’s operating revenue from independent power production and CMS ERM’s sales of energy commodities in support of the independent power production portfolio.
|
|
2
|
Amount represents EnerBank’s operating revenue from unsecured consumer installment loans for financing home improvements.
|
Electric and Gas Utilities
Consumers Utility Revenue:
Consumers recognizes revenue primarily from the sale of electric and gas utility services at tariff-based rates regulated by the MPSC. Consumers’ customer base consists of a mix of residential, commercial, and diversified industrial customers. Consumers’ tariff-based sales performance obligations are described below.
|
•
|
Consumers has performance obligations for the service of standing ready to deliver electricity or natural gas to customers, and it satisfies these performance obligations over time. Consumers recognizes revenue at a fixed rate as it provides these services. These arrangements generally do not have fixed terms and remain in effect as long as the customer consumes the utility service. The rates are set by the MPSC through the rate-making process and represent the stand-alone selling price of Consumers’ service to stand ready to deliver.
|
|
•
|
Consumers has performance obligations for the service of delivering the commodity of electricity or natural gas to customers, and it satisfies these performance obligations upon delivery. Consumers recognizes revenue at a price per unit of electricity or natural gas delivered, based on the tariffs established by the MPSC. These arrangements generally do not have fixed terms and remain in effect as long as the customer consumes the utility service. The rates are set by the MPSC through the rate-making process and represent the stand-alone selling price of a bundled
|
72
product comprising the commodity, electricity or natural gas, and the service of delivering such commodity.
In some instances, Consumers has specific fixed-term contracts with large commercial and industrial customers to provide electricity or gas at certain tariff rates or to provide gas transportation services at contracted rates. The amount of electricity and gas to be delivered under these contracts and the associated future revenue to be received are generally dependent on the customers’ needs. Accordingly, Consumers recognizes revenues at the tariff or contracted rate as electricity or gas is delivered to the customer. Consumers also has other miscellaneous contracts with customers related to pole and other property rentals, appliance service plans, and utility contract work. Generally, these contracts are short term or evergreen in nature.
Accounts Receivable and Unbilled Revenues:
Accounts receivable comprise trade receivables and unbilled receivables. CMS Energy and Consumers record their accounts receivable at cost, which approximates fair value. CMS Energy and Consumers establish an allowance for uncollectible accounts based on historical losses, management’s assessment of existing economic conditions, customer payment trends, and other factors. CMS Energy and Consumers assess late payment fees on trade receivables based on contractual past-due terms established with customers. CMS Energy and Consumers charge off accounts deemed uncollectible to operating expense. Uncollectible expense for CMS Energy, including Consumers, was
$14 million
for the
six months ended June 30, 2018
. Uncollectible expense for Consumers was
$14 million
for the
six months ended June 30, 2018
.
Consumers’ customers are billed monthly in cycles having billing dates that do not generally coincide with the end of a calendar month. This results in customers having received electricity or natural gas that they have not been billed for as of the month-end. Consumers estimates its unbilled revenues by applying an average billed rate to total unbilled deliveries for each customer class. Unbilled revenues, which are recorded as accounts receivable on CMS Energy’s and Consumers’ consolidated balance sheets, were
$280 million
at
June 30, 2018
and
$481 million
at
December 31, 2017
.
Alternative-Revenue Programs:
Under a gas revenue decoupling mechanism authorized by the MPSC, Consumers is allowed to adjust future gas rates for differences between Consumers’ actual weather-normalized nonfuel revenues and the revenues approved by the MPSC. Consumers accounts for this program as an alternative-revenue program that meets the criteria for recognizing the effects of decoupling adjustments on revenue as gas is delivered.
73
12
:
Cash and Cash Equivalents
Presented in the following table are the components of total cash and cash equivalents, including restricted amounts, and their location on CMS Energy’s and Consumers’ consolidated balance sheets:
|
In Millions
|
||||||||
|
June 30, 2018
|
December 31, 2017
|
|||||||
|
CMS Energy, including Consumers
|
||||||||
|
Cash and cash equivalents
|
$
|
477
|
|
$
|
182
|
|
||
|
Restricted cash and cash equivalents
|
17
|
|
17
|
|
||||
|
Other non-current assets
|
7
|
|
5
|
|
||||
|
Cash and cash equivalents, including restricted amounts
|
$
|
501
|
|
$
|
204
|
|
||
|
Consumers
|
||||||||
|
Cash and cash equivalents
|
$
|
254
|
|
$
|
44
|
|
||
|
Restricted cash and cash equivalents
|
17
|
|
17
|
|
||||
|
Other non-current assets
|
5
|
|
4
|
|
||||
|
Cash and cash equivalents, including restricted amounts
|
$
|
276
|
|
$
|
65
|
|
||
Cash and Cash Equivalents:
Cash and cash equivalents include short-term, highly liquid investments with original maturities of three months or less.
Restricted Cash and Cash Equivalents:
Restricted cash and cash equivalents are held primarily for the repayment of securitization bonds. Cash and cash equivalents may also be restricted to pay other contractual obligations such as leasing of coal rail cars. These amounts are classified as current assets since they relate to payments that could or will occur within one year.
Other Non‑current Assets:
The cash equivalents classified as other non‑current assets represent an investment in a money market fund held in the DB SERP rabbi trust. See
Note 5, Fair Value Measurements
for more information regarding the DB SERP.
74
13
:
Reportable Segments
Reportable segments consist of business units defined by the products and services they offer. CMS Energy and Consumers evaluate the performance of each segment based on its contribution to net income available to CMS Energy’s common stockholders.
CMS Energy
The reportable segments for CMS Energy are:
|
•
|
electric utility, consisting of regulated activities associated with the generation, transmission, and distribution of electricity in Michigan
|
|
•
|
gas utility, consisting of regulated activities associated with the transportation, storage, and distribution of natural gas in Michigan
|
|
•
|
enterprises, consisting of various subsidiaries engaging in domestic independent power production, the marketing of independent power production, and the development and operation of renewable generation
|
CMS Energy presents EnerBank, corporate interest and other expenses, and Consumers’ other consolidated entities within other reconciling items.
Consumers
The reportable segments for Consumers are:
|
•
|
electric utility, consisting of regulated activities associated with the generation, transmission, and distribution of electricity in Michigan
|
|
•
|
gas utility, consisting of regulated activities associated with the transportation, storage, and distribution of natural gas in Michigan
|
Consumers’ other consolidated entities are presented within other reconciling items.
75
Presented in the following tables is financial information by reportable segment:
|
In Millions
|
|||||||||||||||||
|
Three Months Ended
|
Six Months Ended
|
||||||||||||||||
|
June 30
|
2018
|
2017
|
2018
|
2017
|
|||||||||||||
|
CMS Energy, including Consumers
|
|||||||||||||||||
|
Operating revenue
|
|||||||||||||||||
|
Electric utility
|
$
|
1,089
|
|
$
|
1,077
|
|
$
|
2,167
|
|
$
|
2,113
|
|
|||||
|
Gas utility
|
306
|
|
285
|
|
1,083
|
|
986
|
|
|||||||||
|
Enterprises
|
61
|
|
55
|
|
124
|
|
114
|
|
|||||||||
|
Other reconciling items
|
36
|
|
32
|
|
71
|
|
65
|
|
|||||||||
|
Total operating revenue – CMS Energy
|
$
|
1,492
|
|
$
|
1,449
|
|
$
|
3,445
|
|
$
|
3,278
|
|
|||||
|
Consumers
|
|||||||||||||||||
|
Operating revenue
|
|||||||||||||||||
|
Electric utility
|
$
|
1,089
|
|
$
|
1,077
|
|
$
|
2,167
|
|
$
|
2,113
|
|
|||||
|
Gas utility
|
306
|
|
285
|
|
1,083
|
|
986
|
|
|||||||||
|
Total operating revenue – Consumers
|
$
|
1,395
|
|
$
|
1,362
|
|
$
|
3,250
|
|
$
|
3,099
|
|
|||||
|
CMS Energy, including Consumers
|
|||||||||||||||||
|
Net income (loss) available to common stockholders
|
|
|
|
|
|||||||||||||
|
Electric utility
|
$
|
130
|
|
$
|
94
|
|
$
|
269
|
|
$
|
218
|
|
|||||
|
Gas utility
|
21
|
|
9
|
|
124
|
|
96
|
|
|||||||||
|
Enterprises
|
14
|
|
7
|
|
29
|
|
19
|
|
|||||||||
|
Other reconciling items
|
(26
|
)
|
(18
|
)
|
(42
|
)
|
(42
|
)
|
|||||||||
|
Total net income available to common stockholders – CMS Energy
|
$
|
139
|
|
$
|
92
|
|
$
|
380
|
|
$
|
291
|
|
|||||
|
Consumers
|
|||||||||||||||||
|
Net income available to common stockholder
|
|
|
|
|
|||||||||||||
|
Electric utility
|
$
|
130
|
|
$
|
94
|
|
$
|
269
|
|
$
|
218
|
|
|||||
|
Gas utility
|
21
|
|
9
|
|
124
|
|
96
|
|
|||||||||
|
Total net income available to common stockholder – Consumers
|
$
|
151
|
|
$
|
103
|
|
$
|
393
|
|
$
|
314
|
|
|||||
76
|
In Millions
|
||||||||
|
June 30, 2018
|
December 31, 2017
|
|||||||
|
CMS Energy, including Consumers
|
||||||||
|
Plant, property, and equipment, gross
|
||||||||
|
Electric utility
1
|
$
|
15,646
|
|
$
|
15,221
|
|
||
|
Gas utility
1
|
7,397
|
|
7,080
|
|
||||
|
Enterprises
|
175
|
|
167
|
|
||||
|
Other reconciling items
|
40
|
|
38
|
|
||||
|
Total plant, property, and equipment, gross – CMS Energy
|
$
|
23,258
|
|
$
|
22,506
|
|
||
|
Consumers
|
||||||||
|
Plant, property, and equipment, gross
|
||||||||
|
Electric utility
1
|
$
|
15,646
|
|
$
|
15,221
|
|
||
|
Gas utility
1
|
7,397
|
|
7,080
|
|
||||
|
Other reconciling items
|
16
|
|
17
|
|
||||
|
Total plant, property, and equipment, gross – Consumers
|
$
|
23,059
|
|
$
|
22,318
|
|
||
|
CMS Energy, including Consumers
|
||||||||
|
Total assets
|
||||||||
|
Electric utility
1
|
$
|
14,075
|
|
$
|
13,906
|
|
||
|
Gas utility
1
|
7,187
|
|
7,139
|
|
||||
|
Enterprises
|
321
|
|
342
|
|
||||
|
Other reconciling items
|
1,729
|
|
1,663
|
|
||||
|
Total assets – CMS Energy
|
$
|
23,312
|
|
$
|
23,050
|
|
||
|
Consumers
|
||||||||
|
Total assets
|
||||||||
|
Electric utility
1
|
$
|
14,075
|
|
$
|
13,907
|
|
||
|
Gas utility
1
|
7,187
|
|
7,139
|
|
||||
|
Other reconciling items
|
21
|
|
53
|
|
||||
|
Total assets – Consumers
|
$
|
21,283
|
|
$
|
21,099
|
|
||
|
1
|
Amounts include a portion of Consumers’ other common assets attributable to both the electric and gas utility businesses.
|
77
Item
2
.
Management’s Discussion and Analysis of Financial Condition and Results of Operations
Management’s discussion and analysis of financial condition and results of operations for CMS Energy and Consumers is contained in
Part I—Item 1. Financial Statements
—MD&A
, which is incorporated by reference herein.
Item
3
.
Quantitative and Qualitative Disclosures About Market Risk
There have been no material changes to market risk as previously disclosed in Part II—Item 7A. Quantitative and Qualitative Disclosures About Market Risk, in the
2017
Form 10‑K.
Item
4
.
Controls and Procedures
CMS Energy
Disclosure Controls and Procedures:
CMS Energy’s management, with the participation of its CEO and CFO, has evaluated the effectiveness of its disclosure controls and procedures (as such term is defined in Rules 13a-15(e) and 15d-15(e) under the Exchange Act) as of the end of the period covered by this report. Based on such evaluation, CMS Energy’s CEO and CFO have concluded that, as of the end of such period, its disclosure controls and procedures are effective.
Internal Control Over Financial Reporting:
There have not been any changes in CMS Energy’s internal control over financial reporting (as such term is defined in Rules 13a-15(f) and 15d-15(f) under the Exchange Act) during the last fiscal quarter that have materially affected, or are reasonably likely to materially affect, its internal control over financial reporting.
Consumers
Disclosure Controls and Procedures:
Consumers’ management, with the participation of its CEO and CFO, has evaluated the effectiveness of its disclosure controls and procedures (as such term is defined in Rules 13a-15(e) and 15d-15(e) under the Exchange Act) as of the end of the period covered by this report. Based on such evaluation, Consumers’ CEO and CFO have concluded that, as of the end of such period, its disclosure controls and procedures are effective.
Internal Control Over Financial Reporting:
There have not been any changes in Consumers’ internal control over financial reporting (as such term is defined in Rules 13a-15(f) and 15d-15(f) under the Exchange Act) during the last fiscal quarter that have materially affected, or are reasonably likely to materially affect, its internal control over financial reporting.
78
Part II—
Other Information
Item
1
.
Legal Proceedings
CMS Energy, Consumers, and certain of their affiliates are parties to various lawsuits and regulatory matters in the ordinary course of business. For information regarding material legal proceedings, including updates to information reported under Part I—Item 3. Legal Proceedings, of the
2017
Form 10‑K, see
Part I—Item 1. Financial Statements
—Notes to the Unaudited Consolidated Financial Statements
—
Note 2, Regulatory Matters
and
Note 3, Contingencies and Commitments
.
Item
1A
.
Risk Factors
There have been no material changes to the Risk Factors as previously disclosed in Part I—Item 1A. Risk Factors, in the
2017
Form 10‑K, which Risk Factors are incorporated herein by reference.
Item
2
.
Unregistered Sales of Equity Securities and Use of Proceeds
Unregistered Sales of Equity Securities
None.
Issuer Repurchases of Equity Securities
Presented in the following table are CMS Energy’s repurchases of equity securities for the three months ended
June 30, 2018
:
|
Period
|
Total Number
of Shares
Purchased
1
|
Average
Price Paid
per Share
|
Total Number of
Shares Purchased as
Part of Publicly
Announced Plans or
Programs
|
Maximum Number of
Shares That May Yet Be
Purchased Under Publicly
Announced Plans or
Programs
|
|||||||||
|
April 1, 2018 to
|
|||||||||||||
|
April 30, 2018
|
101
|
|
$
|
45.29
|
|
—
|
|
—
|
|
||||
|
May 1, 2018 to
|
|||||||||||||
|
May 31, 2018
|
721
|
|
45.58
|
|
—
|
|
—
|
|
|||||
|
June 1, 2018 to
|
|||||||||||||
|
June 30, 2018
|
917
|
|
45.17
|
|
—
|
|
—
|
|
|||||
|
Total
|
1,739
|
|
$
|
45.35
|
|
—
|
|
—
|
|
||||
|
1
|
All of the common shares were repurchased to satisfy the minimum statutory income tax withholding obligation for common shares that have vested under the Performance Incentive Stock Plan. The value of shares repurchased is based on the market price on the vesting date.
|
79
Item
3
.
Defaults Upon Senior Securities
None.
Item
4
.
Mine Safety Disclosures
Not applicable.
Item
5
.
Other Information
On July 24, 2018, Consumers and certain institutional purchasers in the private placement market (“Purchasers”) entered into a Bond Purchase Agreement (“BPA”) whereby Consumers will sell to the Purchasers named in the BPA an aggregate principal amount of
$500 million
First Mortgage Bonds (“FMBs”). The issuance and funding is expected to occur in October 2018, subject to customary conditions, and includes $100 million aggregate principal amount of 3.68 percent FMBs due 2027, $215 million aggregate principal amount of 4.01 percent FMBs due 2038 and $185 million aggregate principal amount of 4.28 percent FMBs due 2057. The foregoing description of the BPA does not purport to be complete and is qualified in its entirety by the provisions of the BPA, which is attached hereto as Exhibit 10.3 and incorporated by reference herein.
80
Item
6
.
Exhibits
CMS Energy’s and Consumers’ Exhibit Index
The agreements included as exhibits to this Form 10‑Q filing are included solely to provide information regarding the terms of the agreements and are not intended to provide any other factual or disclosure information about CMS Energy, Consumers, or other parties to the agreements. The agreements may contain representations and warranties made by each of the parties to each of the agreements that were made exclusively for the benefit of the parties involved in each of the agreements and should not be treated as statements of fact. The representations and warranties were made as a way to allocate risk if one or more of those statements prove to be incorrect. The statements were qualified by disclosures of the parties to each of the agreements that may not be reflected in each of the agreements. The agreements may apply standards of materiality that are different than standards applied to other investors. Additionally, the statements were made as of the date of the agreements or as specified in the agreements and have not been updated. The representations and warranties may not describe the actual state of affairs of the parties to each agreement.
Additional information about CMS Energy and Consumers may be found in this filing, at www.cmsenergy.com, at www.consumersenergy.com, and through the SEC’s website at www.sec.gov.
|
Exhibits
|
Description
|
|
|
4.1
|
—
|
|
|
4.2
|
—
|
|
|
10.1
1
|
—
|
|
|
10.2
|
—
|
|
|
10.3
|
—
|
|
|
12.1
|
—
|
|
|
12.2
|
—
|
|
|
31.1
|
—
|
|
|
31.2
|
—
|
|
|
31.3
|
—
|
|
|
31.4
|
—
|
|
|
32.1
|
—
|
|
|
32.2
|
—
|
|
|
101.INS
|
—
|
XBRL Instance Document
|
|
101.SCH
|
—
|
XBRL Taxonomy Extension Schema
|
|
101.CAL
|
—
|
XBRL Taxonomy Extension Calculation Linkbase
|
|
101.DEF
|
—
|
XBRL Taxonomy Extension Definition Linkbase
|
|
101.LAB
|
—
|
XBRL Taxonomy Extension Labels Linkbase
|
|
101.PRE
|
—
|
XBRL Taxonomy Extension Presentation Linkbase
|
|
1
|
Obligations of CMS Energy or its subsidiaries, but not of Consumers.
|
81
Signatures
Pursuant to the requirements of the Securities Exchange Act of 1934, each registrant has duly caused this report to be signed on its behalf by the undersigned thereunto duly authorized. The signature for each undersigned company shall be deemed to relate only to matters having reference to such company or its subsidiary.
|
CMS ENERGY CORPORATION
|
||
|
Dated: July 26, 2018
|
By:
|
/s/ Rejji P. Hayes
|
|
Rejji P. Hayes
|
||
|
Executive Vice President and Chief Financial Officer
|
||
|
CONSUMERS ENERGY COMPANY
|
||
|
Dated: July 26, 2018
|
By:
|
/s/ Rejji P. Hayes
|
|
Rejji P. Hayes
|
||
|
Executive Vice President and Chief Financial Officer
|
||
82
EXHIBITS
83
TABLE OF CONTENTS
Part I Item 1. Financial StatementsNote 2, Regulatory MattersNote 3, Contingencies and CommitmentsItem 1A . Risk FactorsItem 2 . Unregistered Sales Of Equity Securities and Use Of ProceedsItem 3 . Defaults Upon Senior SecuritiesItem 4 . Mine Safety DisclosuresItem 5 . Other InformationItem 6 . Exhibits