CMS ENERGY CORP
10-Ks and 10-Qs
|
|
|
|
|
|
|
|
|
|
|
|
|
|
|
|
|
|
|
|
|
|
|
|
|
|
|
|
|
|
|
|
|
|
|
|
|
|
|
|
|
|
|
|
|
|
|
|
|
|
|
|
|
|
|
|
|
UNITED STATES SECURITIES AND EXCHANGE COMMISSION
|
||||||
|
Washington, D.C. 20549
|
||||||
|
FORM 10-K
|
||||||
|
x
ANNUAL REPORT PURSUANT TO SECTION 13 OR 15(d) OF THE SECURITIES EXCHANGE ACT OF 1934
|
||||||
|
For the fiscal year ended
December 31, 2018
|
||||||
|
OR
|
||||||
|
o
TRANSITION REPORT PURSUANT TO SECTION 13 OR 15(d) OF THE SECURITIES EXCHANGE ACT OF 1934
|
||||||
|
For the transition period from_____to_____
|
||||||
|
Commission
|
Registrant; State of Incorporation;
|
IRS Employer
|
||||
|
File Number
|
Address; and Telephone Number
|
Identification No.
|
||||
|
1-9513
|
CMS ENERGY CORPORATION
|
38-2726431
|
||||
|
|
(A Michigan Corporation)
|
|
||||
|
|
One Energy Plaza, Jackson, Michigan 49201
|
|
||||
|
|
(517) 788-0550
|
|
||||
|
|
|
|
|
|||
|
1-5611
|
CONSUMERS ENERGY COMPANY
|
38-0442310
|
||||
|
|
(A Michigan Corporation)
|
|||||
|
|
One Energy Plaza, Jackson, Michigan 49201
|
|
||||
|
|
(517) 788-0550
|
|
||||
|
Securities registered pursuant to Section 12(b) of the Act:
|
||||||
|
Name of Each Exchange
|
||||||
|
Registrant
|
Title of Class
|
on Which Registered
|
||||
|
CMS Energy Corporation
|
Common Stock, $0.01 par value
|
New York Stock Exchange
|
||||
|
Consumers Energy Company
|
Cumulative Preferred Stock, $100 par value: $4.50 Series
|
New York Stock Exchange
|
||||
|
Securities registered pursuant to Section 12(g) of the Act:
None
|
||||||
|
Indicate by check mark if the registrant is a well-known seasoned issuer, as defined in Rule 405 of the Securities Act.
|
||||||
|
CMS Energy Corporation:
Yes
x
No
o
|
Consumers Energy Company:
Yes
x
No
o
|
|||||
|
Indicate by check mark if the registrant is not required to file reports pursuant to Section 13 or Section 15(d) of the Act.
|
||||||
|
CMS Energy Corporation:
Yes
o
No
x
|
Consumers Energy Company:
Yes
o
No
x
|
|||||
|
Indicate by check mark whether the registrant (1) has filed all reports required to be filed by Section 13 or 15(d) of the Securities Exchange Act of 1934 during the preceding 12 months (or for such shorter period that the Registrant was required to file such reports), and (2) has been subject to such filing requirements for the past 90 days.
|
||||||
|
CMS Energy Corporation:
Yes
x
No
o
|
Consumers Energy Company:
Yes
x
No
o
|
|||||
|
Indicate by check mark whether the registrant has submitted electronically every Interactive Data file required to be submitted pursuant to Rule 405 of Regulation S-T (§232.405 of this chapter) during the preceding 12 months (or for such shorter period that the registrant was required to submit such files).
|
||||||
|
CMS Energy Corporation:
Yes
x
No
o
|
Consumers Energy Company:
Yes
x
No
o
|
|||||
|
Indicate by check mark if disclosure of delinquent filers pursuant to Item 405 of Regulation S-K (§229.405 of this chapter) is not contained herein, and will not be contained, to the best of registrant’s knowledge, in definitive proxy or information statements incorporated by reference in Part III of this Form 10-K or any amendment to this Form 10-K.
x
|
||||||
|
Indicate by check mark whether the registrant is a large accelerated filer, an accelerated filer, a non‑accelerated filer, a smaller reporting company, or an emerging growth company. See the definitions of “large accelerated filer,” “accelerated filer,” “smaller reporting company,” and “emerging growth company” in Rule 12b-2 of the Exchange Act.
|
||||||
|
CMS Energy Corporation:
|
Consumers Energy Company:
|
|||||
|
Large accelerated filer
x
|
Large accelerated filer
o
|
|||||
|
Non‑Accelerated filer
o
|
Non‑Accelerated filer
x
|
|||||
|
Accelerated filer
o
|
Accelerated filer
o
|
|||||
|
Smaller reporting company
o
|
Smaller reporting company
o
|
|||||
|
Emerging growth company
o
|
Emerging growth company
o
|
|||||
|
If an emerging growth company, indicate by check mark if the registrant has elected not to use the extended transition period for complying with any new or revised financial accounting standards provided pursuant to Section 13(a) of the Exchange Act.
|
||||||
|
CMS Energy Corporation:
o
|
Consumers Energy Company:
o
|
|||||
|
Indicate by check mark whether the registrant is a shell company (as defined in Rule 12b-2 of the Exchange Act).
|
||||||
|
CMS Energy Corporation:
Yes
o
No
x
|
Consumers Energy Company:
Yes
o
No
x
|
|||||
The aggregate market value of CMS Energy voting and non‑voting common equity held by non‑affiliates was
$13.332 billion
for the
281,980,308
CMS Energy Common Stock shares outstanding on
June 30, 2018
based on the closing sale price of
$47.28
for CMS Energy Common Stock, as reported by the New York Stock Exchange on such date. There were no shares of Consumers common equity held by non‑affiliates as of
June 30, 2018
.
There were
283,400,105
shares of CMS Energy Common Stock outstanding on
January 14, 2019
, including
20,316
shares owned by Consumers. On
January 14, 2019
, CMS Energy held all
84,108,789
outstanding shares of common stock of Consumers.
Documents incorporated by reference in Part III: CMS Energy’s and Consumers’ proxy statement relating to their
2019
Annual Meetings of Shareholders to be held
May 3, 2019
.
CMS Energy Corporation
Consumers Energy Company
Annual Reports on Form 10-K to the Securities and Exchange Commission for the Year Ended
December 31, 2018
Table of Contents
1
(This page intentionally left blank)
2
Glossary
Certain terms used in the text and financial statements are defined below.
2016 Energy Law
Michigan’s Public Acts 341 and 342 of 2016, which became effective in April 2017
ABATE
The Association of Businesses Advocating Tariff Equity
ABO
Accumulated benefit obligation; the liabilities of a pension plan based on service and pay to date, which differs from the PBO in that it does not reflect expected future salary increases
AFUDC
Allowance for borrowed and equity funds used during construction
AOCI
Accumulated other comprehensive income (loss)
ARO
Asset retirement obligation
ASC 715
Financial Accounting Standards Board Accounting Standards Codification Topic 715, Retirement Benefits
ASC 740
Financial Accounting Standards Board Accounting Standards Codification Topic 740, Income Taxes
ASU
Financial Accounting Standards Board Accounting Standards Update
Bay Harbor
A residential/commercial real estate area located near Petoskey, Michigan, in which CMS Energy sold its interest in 2002
bcf
Billion cubic feet
Cantera Gas Company
Cantera Gas Company LLC, a non‑affiliated company, formerly known as CMS Field Services
Cantera Natural Gas, Inc.
Cantera Natural Gas, Inc., a non‑affiliated company that purchased CMS Field Services
CAO
Chief Accounting Officer
CCR
Coal combustion residual
CEO
Chief Executive Officer
3
CERCLA
The Comprehensive Environmental Response, Compensation, and Liability Act of 1980, as amended
CFO
Chief Financial Officer
city-gate contract
An arrangement made for the point at which a local distribution company physically receives gas from a supplier or pipeline
Clean Air Act
Federal Clean Air Act of 1963, as amended
Clean Water Act
Federal Water Pollution Control Act of 1972, as amended
CMS Capital
CMS Capital, L.L.C., a wholly owned subsidiary of CMS Energy
CMS Energy
CMS Energy Corporation and its consolidated subsidiaries, unless otherwise noted; the parent of Consumers and CMS Enterprises
CMS Enterprises
CMS Enterprises Company, a wholly owned subsidiary of CMS Energy
CMS ERM
CMS Energy Resource Management Company, formerly known as CMS MST, a wholly owned subsidiary of CMS Enterprises
CMS Field Services
CMS Field Services, Inc., a former wholly owned subsidiary of CMS Gas Transmission
CMS Gas Transmission
CMS Gas Transmission Company, a wholly owned subsidiary of CMS Enterprises
CMS Land
CMS Land Company, a wholly owned subsidiary of CMS Capital
CMS MST
CMS Marketing, Services and Trading Company, a wholly owned subsidiary of CMS Enterprises, whose name was changed to CMS ERM in 2004
Consumers
Consumers Energy Company and its consolidated subsidiaries, unless otherwise noted; a wholly owned subsidiary of CMS Energy
Consumers 2014 Securitization Funding
Consumers 2014 Securitization Funding LLC, a wholly owned consolidated bankruptcy-remote subsidiary of Consumers and special-purpose entity organized for the sole purpose of purchasing and owning securitization property, issuing securitization bonds, and pledging its interest in securitization property to a trustee to collateralize the securitization bonds
4
Craven
Craven County Wood Energy Limited Partnership, a variable interest entity in which HYDRA-CO Enterprises, Inc., a wholly owned subsidiary of CMS Enterprises, has a
50-percent
interest
CSAPR
The Cross-State Air Pollution Rule of 2011, as amended
DB Pension Plan A
Defined benefit pension plan of CMS Energy and Consumers, including certain present and former affiliates and subsidiaries, created as of December 31, 2017 for active employees who were covered under the defined benefit pension plan that closed in 2005
DB Pension Plan B
Defined benefit pension plan of CMS Energy and Consumers, including certain present and former affiliates and subsidiaries, amended as of December 31, 2017 to include only retired and former employees who were covered under the defined benefit pension plan that closed in 2005
DB Pension Plans
Defined benefit pension plans of CMS Energy and Consumers, comprising DB Pension Plan A and DB Pension Plan B
DB SERP
Defined Benefit Supplemental Executive Retirement Plan
DCCP
Defined Company Contribution Plan
DC SERP
Defined Contribution Supplemental Executive Retirement Plan
DIG
Dearborn Industrial Generation, L.L.C., a wholly owned subsidiary of Dearborn Industrial Energy, L.L.C., a wholly owned subsidiary of CMS Energy
Dodd-Frank Act
Dodd-Frank Wall Street Reform and Consumer Protection Act of 2010
DTE Electric
DTE Electric Company, a non‑affiliated company
EBITDA
Earnings before interest, taxes, depreciation, and amortization
EnerBank
EnerBank USA, a wholly owned subsidiary of CMS Capital
energy waste reduction
The reduction of energy consumption through energy efficiency and demand-side energy conservation, as established under the 2016 Energy Law
Entergy
Entergy Corporation, a non‑affiliated company
5
EPA
U.S. Environmental Protection Agency
EPS
Earnings per share
Exchange Act
Securities Exchange Act of 1934
FDIC
Federal Deposit Insurance Corporation
FERC
The Federal Energy Regulatory Commission
First Mortgage Bond Indenture
The indenture dated as of September 1, 1945 between Consumers and The Bank of New York Mellon, as Trustee, as amended and supplemented
FLI Liquidating Trust
Trust formed in Missouri bankruptcy court to accomplish the liquidation of Farmland Industries, Inc., a non‑affiliated entity
FTR
Financial transmission right
GAAP
U.S. Generally Accepted Accounting Principles
GCC
Gas Customer Choice, which allows gas customers to purchase gas from alternative suppliers
GCR
Gas cost recovery
Genesee
Genesee Power Station Limited Partnership, a variable interest entity in which HYDRA-CO Enterprises, Inc., a wholly owned subsidiary of CMS Enterprises, has a
50-percent
interest
Grayling
Grayling Generating Station Limited Partnership, a variable interest entity in which HYDRA-CO Enterprises, Inc., a wholly owned subsidiary of CMS Enterprises, has a
50-percent
interest
GWh
Gigawatt-hour, a unit of energy equal to one billion watt-hours
Internal Revenue Code
Internal Revenue Code of 1986, as amended
IRP
Integrated resource plan
6
IRS
Internal Revenue Service
kV
Thousand volts, a unit used to measure the difference in electrical pressure along a current
kVA
Thousand volt-amperes, a unit used to reflect the electrical power capacity rating of equipment or a system
kWh
Kilowatt-hour, a unit of energy equal to one thousand watt-hours
LIBOR
The London Interbank Offered Rate
Ludington
Ludington pumped-storage plant, jointly owned by Consumers and DTE Electric
MATS
Mercury and Air Toxics Standards, which limit mercury, acid gases, and other toxic pollution from coal‑fueled and oil‑fueled power plants
mcf
Thousand cubic feet
MCV Facility
A 1,647 MW natural gas-fueled, combined-cycle cogeneration facility operated by the MCV Partnership
MCV Partnership
Midland Cogeneration Venture Limited Partnership
MCV PPA
PPA between Consumers and the MCV Partnership
MDEQ
Michigan Department of Environmental Quality
METC
Michigan Electric Transmission Company, LLC, a non‑affiliated company
MGP
Manufactured gas plant
Michigan Mercury Rule
Michigan Air Pollution Control Rules of 2009, as amended: Part 15, Emission Limitations and Prohibitions — Mercury
MISO
Midcontinent Independent System Operator, Inc.
7
mothball
To place a generating unit into a state of extended reserve shutdown in which the unit is inactive and unavailable for service for a specified period, during which the unit can be brought back into service after receiving appropriate notification and completing any necessary maintenance or other work; generation owners in MISO must request approval to mothball a unit, and MISO then evaluates the request for reliability impacts
MPSC
Michigan Public Service Commission
MRV
Market-related value of plan assets
MW
Megawatt, a unit of power equal to one million watts
MWh
Megawatt-hour, a unit of energy equal to one million watt-hours
NAAQS
National Ambient Air Quality Standards
NERC
The North American Electric Reliability Corporation, a non‑affiliated company responsible for developing and enforcing reliability standards, monitoring the bulk power system, and educating and certifying industry personnel
NPDES
National Pollutant Discharge Elimination System, a permit system for regulating point sources of pollution under the Clean Water Act
NREPA
Part 201 of Michigan’s Natural Resources and Environmental Protection Act of 1994, as amended
NSR
New Source Review, a construction-permitting program under the Clean Air Act
OPEB
Other Post-Employment Benefits
OPEB Plan
Postretirement health care and life insurance plans of CMS Energy and Consumers, including certain present and former affiliates and subsidiaries
OSHA
Occupational Safety and Health Administration
Palisades
Palisades nuclear power plant, sold by Consumers to Entergy in 2007
PBO
Projected benefit obligation
8
PCB
Polychlorinated biphenyl
PHMSA
The U.S. Department of Transportation’s Pipeline and Hazardous Materials Safety Administration
PISP
Performance Incentive Stock Plan
PPA
Power purchase agreement
PSCR
Power supply cost recovery
PURPA
The Public Utility Regulatory Policies Act of 1978
RCRA
The Federal Resource Conservation and Recovery Act of 1976
REC
Renewable energy credit
ROA
Retail Open Access, which allows electric generation customers to choose alternative electric suppliers pursuant to Michigan’s Public Acts 141 and 142 of 2000, as amended
S&P
Standard & Poor’s Financial Services LLC
SEC
U.S. Securities and Exchange Commission
securitization
A financing method authorized by statute and approved by the MPSC which allows a utility to sell its right to receive a portion of the rate payments received from its customers for the repayment of securitization bonds issued by a special-purpose entity affiliated with such utility
Smart Energy
Consumers’ Smart Energy grid modernization project, which includes the installation of smart meters that transmit and receive data, a two-way communications network, and modifications to Consumers’ existing information technology system to manage the data and enable changes to key business processes
TCJA
Tax Cuts and Jobs Act of 2017
T.E.S. Filer City
T.E.S. Filer City Station Limited Partnership, a variable interest entity in which HYDRA-CO Enterprises, Inc., a wholly owned subsidiary of CMS Enterprises, has a
50-percent
interest
9
USW
United Steel, Paper and Forestry, Rubber, Manufacturing, Energy, Allied Industrial and Service Workers International Union, AFL-CIO-CLC
UWUA
Utility Workers Union of America, AFL-CIO
VEBA trust
Voluntary employees’ beneficiary association trusts accounts established specifically to set aside employer-contributed assets to pay for future expenses of the OPEB Plan
10
Filing Format
This combined Form 10‑K is separately filed by CMS Energy and Consumers. Information in this combined Form 10‑K relating to each individual registrant is filed by such registrant on its own behalf. Consumers makes no representation regarding information relating to any other companies affiliated with CMS Energy other than its own subsidiaries. None of CMS Energy, CMS Enterprises, nor any of CMS Energy’s other subsidiaries (other than Consumers) has any obligation in respect of Consumers’ debt securities and holders of such debt securities should not consider the financial resources or results of operations of CMS Energy, CMS Enterprises, nor any of CMS Energy’s other subsidiaries (other than Consumers and its own subsidiaries (in relevant circumstances)) in making a decision with respect to Consumers’ debt securities. Similarly, neither Consumers nor any other subsidiary of CMS Energy has any obligation in respect of debt securities of CMS Energy.
Forward-Looking Statements and Information
This Form 10‑K and other CMS Energy and Consumers disclosures may contain forward-looking statements as defined by the Private Securities Litigation Reform Act of 1995. The use of “might,” “may,” “could,” “should,” “anticipates,” “believes,” “estimates,” “expects,” “intends,” “plans,” “projects,” “forecasts,” “predicts,” “assumes,” and other similar words is intended to identify forward-looking statements that involve risk and uncertainty. This discussion of potential risks and uncertainties is designed to highlight important factors that may impact CMS Energy’s and Consumers’ businesses and financial outlook. CMS Energy and Consumers have no obligation to update or revise forward-looking statements regardless of whether new information, future events, or any other factors affect the information contained in the statements. These forward-looking statements are subject to various factors that could cause CMS Energy’s and Consumers’ actual results to differ materially from the results anticipated in these statements. These factors include, but are not limited to, the following, all of which are potentially significant:
|
•
|
the impact of new regulation by the MPSC, FERC, and other applicable governmental proceedings and regulations, including any associated impact on electric or gas rates or rate structures
|
|
•
|
potentially adverse regulatory treatment, effects of a failure to receive timely regulatory orders affecting Consumers that are or could come before the MPSC, FERC, or other governmental authorities, effects of a government shutdown, or effects of a lack of a quorum of a regulatory body
|
|
•
|
changes in the performance of or regulations applicable to MISO, METC, pipelines, railroads, vessels, or other service providers that CMS Energy, Consumers, or any of their affiliates rely on to serve their customers
|
|
•
|
the adoption of federal or state laws or regulations or challenges to federal or state laws or regulations, or changes in applicable laws, rules, regulations, principles, or practices, or in their interpretation, such as those related to energy policy and ROA, infrastructure integrity or security, gas pipeline safety, gas pipeline capacity, energy waste reduction, the environment, regulation or deregulation, reliability, health care reforms (including comprehensive health care reform enacted in 2010), taxes, accounting matters, climate change, air emissions, renewable energy, potential effects of the Dodd-Frank Act, and other business issues that could have an impact on CMS Energy’s, Consumers’, or any of their affiliates’ businesses or financial results
|
11
|
•
|
factors affecting operations, such as costs and availability of personnel, equipment, and materials; weather conditions; natural disasters; catastrophic weather-related damage; scheduled or unscheduled equipment outages; maintenance or repairs; environmental incidents; failures of equipment or materials; electric transmission and distribution or gas pipeline system constraints; and changes in trade policies or regulations
|
|
•
|
increases in demand for renewable energy by customers seeking to meet sustainability goals
|
|
•
|
the ability of Consumers to execute its cost-reduction strategies
|
|
•
|
potentially adverse regulatory or legal interpretations or decisions regarding environmental matters, or delayed regulatory treatment or permitting decisions that are or could come before the MDEQ, EPA, and/or U.S. Army Corps of Engineers, and potential environmental remediation costs associated with these interpretations or decisions, including those that may affect Bay Harbor or Consumers’ routine maintenance, repair, and replacement classification under NSR regulations
|
|
•
|
changes in energy markets, including availability and price of electric capacity and the timing and extent of changes in commodity prices and availability and deliverability of coal, natural gas, natural gas liquids, electricity, oil, and certain related products
|
|
•
|
the price of CMS Energy common stock, the credit ratings of CMS Energy and Consumers, capital and financial market conditions, and the effect of these market conditions on CMS Energy’s and Consumers’ interest costs and access to the capital markets, including availability of financing to CMS Energy, Consumers, or any of their affiliates
|
|
•
|
the investment performance of the assets of CMS Energy’s and Consumers’ pension and benefit plans, the discount rates, mortality assumptions, and future medical costs used in calculating the plans’ obligations, and the resulting impact on future funding requirements
|
|
•
|
the impact of the economy, particularly in Michigan, and potential future volatility in the financial and credit markets on CMS Energy’s, Consumers’, or any of their affiliates’ revenues, ability to collect accounts receivable from customers, or cost and availability of capital
|
|
•
|
changes in the economic and financial viability of CMS Energy’s and Consumers’ suppliers, customers, and other counterparties and the continued ability of these third parties, including those in bankruptcy, to meet their obligations to CMS Energy and Consumers
|
|
•
|
population changes in the geographic areas where CMS Energy and Consumers conduct business
|
|
•
|
national, regional, and local economic, competitive, and regulatory policies, conditions, and developments
|
|
•
|
loss of customer demand for electric generation supply to alternative electric suppliers, increased use of distributed generation, or energy waste reduction
|
|
•
|
adverse consequences of employee, director, or third-party fraud or non‑compliance with codes of conduct or with laws or regulations
|
|
•
|
federal regulation of electric sales and transmission of electricity, including periodic re‑examination by federal regulators of CMS Energy’s and Consumers’ market-based sales authorizations
|
12
|
•
|
the impact of credit markets, economic conditions, increased competition, and any new banking and consumer protection regulations on EnerBank
|
|
•
|
the availability, cost, coverage, and terms of insurance, the stability of insurance providers, and the ability of Consumers to recover the costs of any insurance from customers
|
|
•
|
the effectiveness of CMS Energy’s and Consumers’ risk management policies, procedures, and strategies, including strategies to hedge risk related to interest rates and future prices of electricity, natural gas, and other energy-related commodities
|
|
•
|
factors affecting development of electric generation projects and gas and electric transmission and distribution infrastructure replacement, conversion, and expansion projects, including factors related to project site identification, construction material pricing, schedule delays, availability of qualified construction personnel, permitting, acquisition of property rights, and government approvals
|
|
•
|
potential disruption to, interruption of, or other impacts on facilities, utility infrastructure, operations, or backup systems due to accidents, explosions, physical disasters, cyber incidents, vandalism, war, or terrorism, and the ability to obtain or maintain insurance coverage for these events
|
|
•
|
changes or disruption in fuel supply, including but not limited to supplier bankruptcy and delivery disruptions
|
|
•
|
potential costs, lost revenues, or other consequences resulting from misappropriation of assets or sensitive information, corruption of data, or operational disruption in connection with a cyber attack or other cyber incident
|
|
•
|
potential disruption to, interruption or failure of, or other impacts on information technology backup or disaster recovery systems
|
|
•
|
technological developments in energy production, storage, delivery, usage, and metering
|
|
•
|
the ability to implement technology successfully
|
|
•
|
the impact of CMS Energy’s and Consumers’ integrated business software system and its effects on their operations, including utility customer billing and collections
|
|
•
|
adverse consequences resulting from any past, present, or future assertion of indemnity or warranty claims associated with assets and businesses previously owned by CMS Energy or Consumers, including claims resulting from attempts by foreign or domestic governments to assess taxes on or to impose environmental liability associated with past operations or transactions
|
|
•
|
the outcome, cost, and other effects of any legal or administrative claims, proceedings, investigations, or settlements
|
|
•
|
the reputational impact on CMS Energy and Consumers of operational incidents, violations of corporate policies, regulatory violations, inappropriate use of social media, and other events
|
|
•
|
restrictions imposed by various financing arrangements and regulatory requirements on the ability of Consumers and other subsidiaries of CMS Energy to transfer funds to CMS Energy in the form of cash dividends, loans, or advances
|
13
|
•
|
earnings volatility resulting from the application of fair value accounting to certain energy commodity contracts or interest rate contracts
|
|
•
|
changes in financial or regulatory accounting principles or policies
|
|
•
|
other matters that may be disclosed from time to time in CMS Energy’s and Consumers’ SEC filings, or in other public documents
|
All forward-looking statements should be considered in the context of the risk and other factors described above and as detailed from time to time in CMS Energy’s and Consumers’ SEC filings. For additional details regarding these and other uncertainties, see
Item 1A. Risk Factors
;
Item 7. Management’s Discussion and Analysis of Financial Condition and Results of Operations—Outlook
; and
Item 8. Financial Statements and Supplementary Data—Notes to the Consolidated Financial Statements—
Note 3, Regulatory Matters
and
Note 4, Contingencies and Commitments
.
14
Part I
Item 1.
Business
General
CMS Energy
CMS Energy was formed as a corporation in Michigan in 1987 and is an energy company operating primarily in Michigan.
It is the parent holding company of several subsidiaries, including Consumers, an electric and gas utility, and CMS Enterprises, primarily a domestic independent power producer and marketer.
Consumers serves individuals and businesses operating in the alternative energy, automotive, chemical, food, and metal products industries, as well as a diversified group of other industries.
CMS Enterprises, through its subsidiaries and equity investments,
is engaged
in domestic independent power production, including the development and operation of renewable generation, and the marketing of independent power production
.
CMS Energy manages its businesses by the nature of services each provides, and
operates principally in three business segments: electric utility; gas utility; and enterprises, its non‑utility operations and investments.
Consumers’ consolidated operations account for the substantial majority of CMS Energy’s total assets, income, and operating revenue. CMS Energy’s consolidated operating revenue was
$6.9 billion
in
2018
,
$6.6 billion
in
2017
, and
$6.4 billion
in
2016
.
For further information about operating revenue, income, and assets and liabilities attributable to all of CMS Energy’s business segments and operations, see
Item 6. Selected Financial Data
and
Item 8. Financial Statements and Supplementary Data—CMS Energy Consolidated Financial Statements
and
Notes to the Consolidated Financial Statements
.
Consumers
Consumers has served Michigan customers since 1886. Consumers was incorporated in Maine in 1910 and became a Michigan corporation in 1968.
Consumers owns and operates electric generation, transmission, and distribution facilities
and
gas transmission, storage, and distribution
facilities. It provides electricity and/or natural gas to 6.7 million of Michigan’s 10 million residents. Consumers’ rates and certain other aspects of its business are subject to the jurisdiction of the MPSC and FERC, as well as to NERC reliability standards, as described in
Item 1. Business—CMS Energy and Consumers Regulation
.
Consumers’ consolidated operating revenue was
$6.5 billion
in
2018
,
$6.2 billion
in
2017
, and
$6.1 billion
in
2016
. For further information about operating revenue, income, and assets and liabilities attributable to Consumers’ electric and gas utility operations, see
Item 6. Selected Financial Data
and
Item 8. Financial Statements and Supplementary Data—Consumers Consolidated Financial Statements
and
Notes to the Consolidated Financial Statements
.
Consumers owns its principal properties in fee, except that most electric lines and gas mains are located below or adjacent to public roads or on land owned by others and are accessed by Consumers through easements and other rights. Almost all of Consumers’ properties are subject to the lien of its First Mortgage Bond Indenture. For additional information on Consumers’ properties, see
Item 1. Business—Business Segments
—
Consumers Electric Utility—Electric Utility Properties
and
Business Segments—Consumers Gas Utility—Gas Utility Properties
.
15
In
2018
, Consumers served
1.8 million
electric customers and
1.8 million
gas customers in Michigan’s Lower Peninsula. Presented in the following map are Consumers’ service territories:

|
|||
|
Electric Service Territory
|
|||
|
|
|
||
|
Gas Service Territory
|
|||
|
|
|
||
|
Combination Electric and
Gas Service Territory
|
|||
|
|
|||
|
•
|
Electric Generation Facilities
|
||
CMS Energy and Consumers
–
The Triple Bottom Line
For information regarding CMS Energy’s and Consumers’ purpose and impact on the “triple bottom line” of people, planet, and profit, see
Item 7. Management’s Discussion and Analysis of Financial Condition and Results of Operations—Executive Overview
.
Business Segments
Consumers Electric Utility
Electric Utility Operations:
Consumers’ electric utility operations, which include
the generation, purchase, transmission, distribution, and sale of electricity
, generated operating revenue of
$4.6 billion
in
2018
,
$4.4 billion
in
2017
, and
$4.4 billion
in
2016
. Consumers’ electric utility customer base consists of a mix of primarily residential, commercial, and diversified industrial customers in Michigan’s Lower Peninsula.
16
Presented in the following illustration is Consumers’
2018
electric utility operating revenue of
$4.6 billion
by customer class:

Consumers’ electric utility operations are not dependent on a single customer, or even a few customers, and the loss of any one or even a few of Consumers’ largest customers is not reasonably likely to have a material adverse effect on Consumers’ financial condition.
In
2018
, Consumers’ electric deliveries were
38 billion
kWh, which included ROA deliveries of four billion kWh, resulting in net bundled sales of 34 billion kWh. In
2017
, Consumers’ electric deliveries were
37 billion
kWh, which included ROA deliveries of three billion kWh, resulting in net bundled sales of 34 billion kWh.
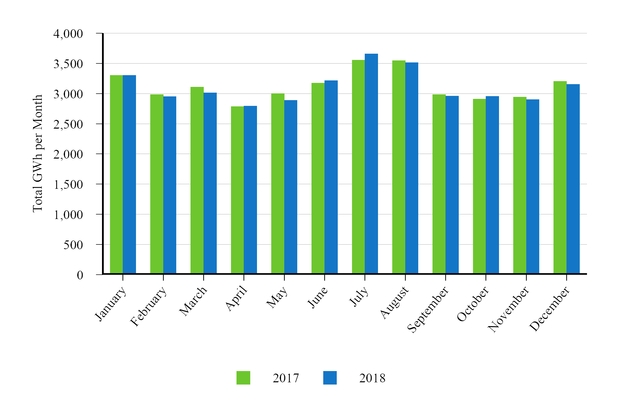
Consumers’ electric utility operations are seasonal.
The consumption of electric energy typically increases in the summer months, due primarily to the use of air conditioners and other cooling equipment
.
17
Presented in the following illustration are Consumers’ monthly weather-normalized electric deliveries (deliveries adjusted to reflect normal weather conditions) to its customers, including ROA deliveries, during
2018
and
2017
:
Consumers’
2018
summer peak demand was 8,084 MW, which included ROA demand of 516 MW. For the
2017
-
2018
winter season, Consumers’ peak demand was 5,863 MW, which included ROA demand of 463 MW. As required by MISO reserve margin requirements, Consumers owns or controls, through long-term PPAs and short-term capacity purchases, all of the capacity required to supply its projected firm peak load and necessary reserve margin for summer
2019
.
Electric Utility Properties
:
Consumers owns and operates electric generation, transmission, and distribution facilities
. For details about Consumers’ electric generation facilities, see the
Electric Utility Generation and Supply Mix
section that follows this
Electric Utility Properties
section. Consumers’ transmission and distribution systems consist of:
|
•
|
214 miles of transmission overhead lines operating at 138 kV
|
|
•
|
195 miles of high-voltage distribution overhead lines operating at 138 kV
|
|
•
|
4 miles of high-voltage distribution underground lines operating at 138 kV
|
|
•
|
4,435 miles of high-voltage distribution overhead lines operating at 46 kV and 69 kV
|
|
•
|
19 miles of high-voltage distribution underground lines operating at 46 kV
|
|
•
|
56,152 miles of electric distribution overhead lines
|
|
•
|
10,817 miles of underground distribution lines
|
|
•
|
substations with an aggregate transformer capacity of 26 million kVA
|
|
•
|
a battery facility with storage capacity of 1 MW
|
Consumers is interconnected to the interstate high-voltage electric transmission system owned by METC and operated by MISO. Consumers is also interconnected to neighboring utilities and to other transmission systems.
18
Electric Utility Generation and Supply Mix
:
Presented in the following table are details about Consumers’
2018
electric generation and supply mix:
|
2018
|
|
2018
|
|
||||
|
Number of Units and Year Entered Service
|
Generation
Capacity |
|
1
|
Electric
Supply |
|
||
|
Name and Location (Michigan)
|
(MW)
|
|
(GWh)
|
|
|||
|
Coal steam generation
|
|||||||
|
J.H. Campbell 1 & 2 – West Olive
|
2 Units, 1962-1967
|
608
|
|
2,535
|
|
||
|
J.H. Campbell 3 – West Olive
2
|
1 Unit, 1980
|
782
|
|
4,911
|
|
||
|
D.E. Karn 1 & 2 – Essexville
|
2 Units, 1959-1961
|
515
|
|
2,358
|
|
||
|
1,905
|
|
9,804
|
|
||||
|
Oil/Gas steam generation
|
|||||||
|
D.E. Karn 3 & 4 – Essexville
|
2 Units, 1975-1977
|
1,203
|
|
43
|
|
||
|
Hydroelectric
|
|||||||
|
Ludington – Ludington
|
6 Units, 1973
|
1,097
|
|
3
|
(325
|
)
|
4
|
|
Conventional hydro generation – various locations
|
35 Units, 1906-1949
|
77
|
|
445
|
|
||
|
1,174
|
|
120
|
|
||||
|
Gas combined cycle
|
|||||||
|
Jackson – Jackson
|
1 Unit, 2002
|
543
|
|
2,075
|
|
||
|
Zeeland – Zeeland
|
3 Units, 2002
|
526
|
|
2,797
|
|
||
|
1,069
|
|
4,872
|
|
||||
|
Gas/Oil combustion turbine
|
|||||||
|
Zeeland (simple cycle) – Zeeland
|
2 Units, 2001
|
315
|
|
360
|
|
||
|
Various plants – various locations
5
|
8 Units, 1966-1971
|
—
|
|
2
|
|
||
|
315
|
|
362
|
|
||||
|
Wind generation
|
|||||||
|
Cross Winds
®
Energy Park – Tuscola County
|
81 Turbines,
2014 and 2018 |
22
|
|
493
|
|
||
|
Lake Winds
®
Energy Park – Mason County
|
56 Turbines, 2012
|
14
|
|
243
|
|
||
|
36
|
|
736
|
|
||||
|
Solar generation
|
|||||||
|
Solar Gardens – Allendale and Kalamazoo
|
15,100 Panels, 2016
|
2
|
|
6
|
|
||
|
Total owned generation
|
5,704
|
|
15,943
|
|
|||
|
Purchased power
6
|
|||||||
|
Coal generation – primarily T.E.S. Filer City
|
60
|
|
511
|
|
|||
|
Gas generation – MCV Facility
7
|
1,240
|
|
5,530
|
|
|||
|
Other gas generation – various locations
|
173
|
|
1,182
|
|
|||
|
Nuclear generation – Palisades
7
|
791
|
|
6,749
|
|
|||
|
Wind generation – various locations
|
62
|
|
1,056
|
|
|||
|
Other renewable generation – various locations
|
231
|
|
1,323
|
|
|||
|
2,557
|
|
16,351
|
|
||||
|
Net interchange power
8
|
—
|
|
4,953
|
|
|||
|
Total purchased and interchange power
|
2,557
|
|
21,304
|
|
|||
|
Total supply
|
8,261
|
|
37,247
|
|
|||
|
Less generation and transmission use/loss
|
2,794
|
|
|||||
|
Total net bundled sales
|
34,453
|
|
|||||
|
1
|
Represents generation capacity during the summer months. For wind and solar generation, the amount represents the effective load-carrying capability.
|
19
|
2
|
Represents Consumers’ share of the capacity of the J.H. Campbell 3 unit, net of the
6.69-percent
ownership interest of the Michigan Public Power Agency and Wolverine Power Supply Cooperative, Inc.
|
|
3
|
Represents Consumers’
51-percent
share of the capacity of Ludington. DTE Electric holds the remaining
49-percent
ownership interest.
|
|
4
|
Represents Consumers’ share of net pumped-storage generation.
The pumped-storage facility consumes electricity to pump water during off-peak hours for storage in order to generate electricity later during peak‑demand hours.
|
|
5
|
Consumers retired these gas/oil combustion turbine generating units in 2018.
|
|
6
|
Represents purchases under long-term PPAs.
|
|
7
|
For information about Consumers’ long-term PPAs related to the MCV Facility and Palisades, see
Item 8. Financial Statements and Supplementary Data—Notes to the Consolidated Financial Statements—
Note 4, Contingencies and Commitments—Contractual Commitments
.
|
|
8
|
Represents purchases from the MISO energy market.
|
Consumers’ generation capacity is a measure of the maximum electric output that Consumers has available to meet peak load requirements. As shown in the following illustration, Consumers’
2018
generation capacity of
8,261
MW, including purchased capacity of
2,557
MW, relied on a variety of fuel sources:

20
Presented in the following table are the sources of Consumers’ electric supply for the last three years:
|
GWh
|
||||||
|
Years Ended December 31
|
2018
|
|
2017
|
|
2016
|
|
|
Owned generation
|
||||||
|
Coal
|
9,804
|
|
10,098
|
|
9,739
|
|
|
Gas
|
5,272
|
|
5,190
|
|
6,194
|
|
|
Renewable energy
|
1,187
|
|
1,078
|
|
1,083
|
|
|
Oil
|
5
|
|
12
|
|
8
|
|
|
Net pumped storage
1
|
(325
|
)
|
(290
|
)
|
(316
|
)
|
|
Total owned generation
|
15,943
|
|
16,088
|
|
16,708
|
|
|
Purchased power
2
|
||||||
|
Gas generation
|
6,712
|
|
5,521
|
|
6,139
|
|
|
Nuclear generation
|
6,749
|
|
6,780
|
|
6,927
|
|
|
Renewable energy generation
|
2,379
|
|
2,288
|
|
2,229
|
|
|
Coal generation
|
511
|
|
491
|
|
512
|
|
|
Net interchange power
3
|
4,953
|
|
4,384
|
|
3,688
|
|
|
Total purchased and interchange power
|
21,304
|
|
19,464
|
|
19,495
|
|
|
Total supply
|
37,247
|
|
35,552
|
|
36,203
|
|
|
1
|
Represents Consumers’ share of net pumped-storage generation.
During
2018
, the pumped-storage facility consumed
1,132
GWh of electricity to pump water during off-peak hours for storage in order to generate
807
GWh of electricity later during peak-demand hours.
|
|
2
|
Represents purchases under long-term PPAs.
|
|
3
|
Represents purchases from the MISO energy market.
|
During
2018
, Consumers acquired
57 percent
of the electricity it provided to customers through long-term PPAs and the MISO energy market. Consumers offers its generation into the MISO energy market on a day-ahead and real-time basis and bids for power in the market to serve the demand of its customers. Consumers is a net purchaser of power and supplements its generation capability with purchases from the MISO energy market to meet its customers’ needs during peak demand periods.
At
December 31, 2018
, Consumers had unrecognized future commitments (amounts for which, in accordance with GAAP, liabilities have not been recorded on its balance sheet) to purchase capacity and energy under long-term PPAs with various generating plants. These contracts require monthly capacity payments based on the plants’ availability or deliverability. The payments for 2019 through 2036 are estimated to total $10.0 billion and, for each of the next five years, range from $0.6 billion to $1.1 billion annually. These amounts may vary depending on plant availability and fuel costs. For further information about Consumers’ future capacity and energy purchase obligations, see
Item 7. Management’s Discussion and Analysis of Financial Condition and Results of Operations—Capital Resources and Liquidity—Contractual Obligations
and
Item 8. Financial Statements and Supplementary Data—Notes to the Consolidated Financial Statements—
Note 4, Contingencies and Commitments—Contractual Commitments
.
During
2018
,
26 percent
of the energy Consumers provided to customers was generated by its coal-fueled generating units, which burned six million tons of coal and produced a combined total of
9,804
GWh of electricity. In order to obtain the coal it needs, Consumers enters into physical coal supply contracts.
21
At
December 31, 2018
, Consumers had unrecognized future commitments to purchase coal through December 2021; payment obligations under these contracts totaled $121 million. Most of Consumers’ rail-supplied coal contracts have fixed prices, although some contain market-based pricing. Consumers’ vessel-supplied coal contracts have fixed base prices that are adjusted monthly to reflect changes to the fuel cost of vessel transportation. At
December 31, 2018
, Consumers had 92 percent of its
2019
expected coal requirements under contract, as well as a 36-day supply of coal on hand.
In conjunction with its coal supply contracts, Consumers leases a fleet of railcars and has transportation contracts with various companies to provide rail and vessel services for delivery of purchased coal to Consumers’ generating facilities. Consumers’ coal transportation contracts are unrecognized future commitments and expire on various dates through December 2024; payment obligations under these contracts totaled $523 million at
December 31, 2018
.
During
2018
,
14 percent
of the energy Consumers provided to customers was generated by its natural gas‑fueled generating units, which burned 39 bcf of natural gas and produced a combined total of
5,272
GWh of electricity.
In order to obtain the gas it needs for electric generation fuel, Consumers’ electric utility purchases gas from the market near the time of consumption, at prices that allow it to compete in the electric wholesale market. For units 3 and 4 of D.E. Karn and for the Jackson and Zeeland plants, Consumers utilizes an agent that owns firm transportation rights to each plant to purchase gas from the market and transport the gas to the facilities.
Electric Utility Competition:
Consumers’ electric utility business is subject to actual and potential competition from many sources, in both the wholesale and retail markets, as well as in electric generation, electric delivery, and retail services.
Michigan law
allows electric customers in Consumers’ service territory to buy electric generation service from alternative electric suppliers in an aggregate amount capped at ten percent, with certain exceptions, of Consumers’ weather-normalized retail sales of the preceding calendar year.
At
December 31, 2018
, electric deliveries under the ROA program were
at the ten-percent limit
. Of Consumers’
1.8 million
electric customers,
287
customers, or
0.02 percent
, purchased electric generation service under the ROA program.
For additional information, see
Item 7. Management’s Discussion and Analysis of Financial Condition and Results of Operations—Outlook—Consumers Electric Utility Outlook and Uncertainties
.
Consumers also faces competition or potential competition associated with industrial customers relocating all or a portion of their production capacity outside of Consumers’ service territory for economic reasons; municipalities owning or operating competing electric delivery systems; and customer self-generation. Consumers addresses this competition in various ways, including:
|
•
|
aggressively controlling operating, maintenance, and fuel costs and passing savings on to customers
|
|
•
|
providing renewable energy options
|
|
•
|
providing competitive rate-design options, particularly for large energy-intensive customers
|
|
•
|
offering tariff-based incentives that support economic development
|
|
•
|
providing non‑energy services and value to customers
|
|
•
|
monitoring activity in adjacent geographical areas
|
22
Consumers Gas Utility
Gas Utility Operations:
Consumers’ gas utility operations, which include
the purchase, transmission, storage, distribution, and sale of natural gas
, generated operating revenue of
$1.9 billion
in
2018
,
$1.8 billion
in
2017
, and
$1.7 billion
in
2016
. Consumers’ gas utility customer base consists of a mix of primarily residential, commercial, and diversified industrial customers in Michigan’s Lower Peninsula.
Presented in the following illustration is Consumers’
2018
gas utility operating revenue of
$1.9 billion
by customer class:

Consumers’ gas utility operations are not dependent on a single customer, or even a few customers, and the loss of any one or even a few of Consumers’ largest customers is not reasonably likely to have a material adverse effect on Consumers’ financial condition.
In
2018
, deliveries of natural gas through Consumers’ pipeline and distribution network, including off-system transportation deliveries, totaled
386
bcf, which included GCC deliveries of 44 bcf. In
2017
, deliveries of natural gas through Consumers’ pipeline and distribution network, including off-system transportation deliveries, totaled
352
bcf, which included GCC deliveries of 42 bcf. Consumers’ gas utility operations are seasonal. The consumption of natural gas typically increases in the winter, due primarily
to colder temperatures and the resulting use of natural gas as heating fuel
. Consumers injects natural gas into storage during the summer months for use during the winter months. During
2018
, 41 percent of the natural gas supplied to all customers during the winter months was supplied from storage.
23
Presented in the following illustration are Consumers’ monthly weather-normalized natural gas deliveries (deliveries adjusted to reflect normal weather conditions) to its customers, including GCC deliveries, during
2018
and
2017
:

Gas Utility Properties
:
Consumers’
gas transmission, storage, and distribution
system consists of:
|
•
|
1,666 miles of transmission lines
|
|
•
|
15 gas storage fields with a total storage capacity of 309 bcf and a working gas volume of 151 bcf
|
|
•
|
28,404 miles of distribution mains
|
|
•
|
eight compressor stations with a total of 171,129 installed and available horsepower
|
24
Gas Utility Supply:
In
2018
, Consumers purchased 82 percent of the gas it delivered from U.S. producers. The remaining 18 percent was purchased from authorized GCC suppliers and delivered by Consumers to customers in the GCC program. Presented in the following illustration are the supply arrangements for the gas Consumers delivered to GCC and GCR customers during
2018
:

Firm gas transportation or firm city-gate contracts are those that define a fixed amount, price, and delivery time frame. Consumers’ firm gas transportation contracts are with Panhandle Eastern Pipe Line Company and Trunkline Gas Company, LLC, each a non‑affiliated company. Under these contracts, Consumers purchases and transports gas to Michigan for ultimate delivery to its customers. Consumers’ firm gas transportation contracts expire on various dates through 2023 and provide for the delivery of 39 percent of Consumers’ total gas supply requirements in
2019
. Consumers purchases the balance of its required gas supply under firm city-gate contracts and through authorized suppliers under the GCC program.
Gas Utility Competition:
Competition exists in various aspects of Consumers’ gas utility business. Competition comes from GCC and from alternative fuels and energy sources, such as propane, oil, and electricity.
Enterprises Segment—Non-Utility Operations and Investments
CMS Energy’s enterprises segment, through various subsidiaries and certain equity investments, is engaged in domestic independent power production, including the development and operation of renewable generation, and the marketing of independent power production. The enterprises segment’s operating revenue was
$252 million
in
2018
,
$229 million
in
2017
, and
$215 million
in
2016
.
25
Independent Power Production
:
Presented in the following table is information about the independent power plants in which CMS Energy had an ownership interest at
December 31, 2018
:
|
Ownership Interest
|
Gross Capacity
1
|
|
2018 Net Generation
|
|
||
|
Location
|
(%)
|
Primary Fuel Type
|
(MW)
|
|
(GWh)
|
|
|
Dearborn, Michigan
|
100
|
Natural gas
|
770
|
|
4,855
|
|
|
Gaylord, Michigan
|
100
|
Natural gas
|
156
|
|
4
|
|
|
Paulding County, Ohio
2
|
100
|
Wind
|
105
|
|
94
|
|
|
Comstock, Michigan
|
100
|
Natural gas
|
76
|
|
10
|
|
|
Delta Township, Michigan
3
|
100
|
Solar
|
24
|
|
14
|
|
|
Phillips, Wisconsin
|
100
|
Solar
|
3
|
|
4
|
|
|
Filer City, Michigan
|
50
|
Coal
|
73
|
|
506
|
|
|
New Bern, North Carolina
|
50
|
Wood waste
|
50
|
|
301
|
|
|
Flint, Michigan
|
50
|
Wood waste
|
40
|
|
78
|
|
|
Grayling, Michigan
|
50
|
Wood waste
|
38
|
|
176
|
|
|
Total
|
1,335
|
|
6,042
|
|
||
|
1
|
Represents the intended full-load sustained output of each plant. The amount of capacity relating to CMS Energy’s ownership interest was
1,234
MW at
December 31, 2018
.
|
|
2
|
Began operation in September 2018.
|
|
3
|
Represents two solar generation projects that began operation in June 2018 and August 2018.
|
The operating revenue from independent power production was
$19 million
in
2018
,
$16 million
in
2017
, and
$16 million
in
2016
.
Energy Resource Management:
CMS ERM purchases and sells energy commodities in support of CMS Energy’s generating facilities with a focus on optimizing CMS Energy’s independent power production portfolio. In
2018
, CMS ERM marketed five bcf of natural gas and 5,896 GWh of electricity. Electricity marketed by CMS ERM was generated by independent power production of the enterprises segment and by unrelated third parties. CMS ERM’s operating revenue was
$233 million
in
2018
,
$213 million
in
2017
, and
$199 million
in
2016
.
Enterprises Segment Competition:
The enterprises segment competes with other independent power producers. The needs of this market are driven by electric demand and the generation available.
Other Businesses
EnerBank:
EnerBank is a Utah state-chartered, FDIC-insured industrial bank providing
primarily unsecured consumer installment loans for financing home improvements
. EnerBank’s operating revenue was
$157 million
in
2018
,
$132 million
in
2017
, and
$120 million
in
2016
.
26
CMS Energy and Consumers Regulation
CMS Energy, Consumers, and their subsidiaries are subject to regulation by various federal, state, and local governmental agencies, including those described in the following sections.
FERC and NERC
FERC has exercised limited jurisdiction over several independent power plants and exempt wholesale generators in which CMS Enterprises has ownership interests, as well as over CMS ERM, CMS Gas Transmission, and DIG. FERC’s jurisdiction includes, among other things, acquisitions, operations, disposals of certain assets and facilities, services provided and rates charged, and conduct among affiliates. FERC also has limited jurisdiction over holding company matters with respect to CMS Energy. FERC, in connection with NERC and with regional reliability organizations, also regulates generation and transmission owners and operators, load serving entities, purchase and sale entities, and others with regard to reliability of the bulk power system.
FERC regulates limited aspects of Consumers’ gas business, principally compliance with FERC capacity release rules, shipping rules, the prohibition against certain buy/sell transactions, and the price-reporting rule.
FERC also regulates certain aspects of Consumers’ electric operations, including compliance with FERC accounting rules, wholesale and transmission rates, operation of licensed hydroelectric generating plants, transfers of certain facilities, corporate mergers, and issuances of securities.
MPSC
Consumers is subject to the jurisdiction of the MPSC, which regulates public utilities in Michigan with respect to retail utility rates, accounting, utility services, certain facilities, certain asset transfers, corporate mergers, and other matters.
The Michigan Attorney General, ABATE, the MPSC Staff, and certain other parties typically participate in MPSC proceedings concerning Consumers
.
These parties often challenge various aspects of those proceedings, including the prudence of Consumers’ policies and practices, and seek cost disallowances and other relief. The parties also have appealed significant MPSC orders.
Rate Proceedings:
For information regarding open rate proceedings, see
Item 7. Management’s Discussion and Analysis of Financial Condition and Results of Operations—Outlook
and
Item 8. Financial Statements and Supplementary Data—Notes to the Consolidated Financial Statements—
Note 3, Regulatory Matters
.
Other Regulation
The U.S. Secretary of Energy regulates imports and exports of natural gas and has delegated various aspects of this jurisdiction to FERC and the U.S. Department of Energy’s Office of Fossil Fuels.
The U.S. Department of Transportation’s Office of Pipeline Safety regulates the safety and security of gas pipelines through the Natural Gas Pipeline Safety Act of 1968 and subsequent laws.
EnerBank is regulated by the Utah Department of Financial Institutions and the FDIC.
27
Energy Legislation
Consumers is subject to various rulemaking matters, including the 2016 Energy Law. Among other things, the 2016 Energy Law:
|
•
|
raised the renewable energy standard from the present ten-percent requirement to
12.5 percent in 2019
and
15 percent in 2021
|
|
•
|
established a goal of 35 percent combined renewable energy and energy waste reduction by 2025
|
|
•
|
authorized incentives for demand response programs and expanded existing incentives for energy efficiency programs, referring to the combined initiatives as energy waste reduction programs
|
|
•
|
authorized incentives for new PPAs with non‑affiliates
|
|
•
|
established an integrated planning process for new generation resources
|
|
•
|
shortened from 12 months to ten months the time by which the MPSC must issue a final order in general rate cases, but prohibited electric and gas utilities from filing general rate cases for increases in rates more often than once every 12 months
|
|
•
|
eliminated utilities’ self-implementation of rates in general rate cases filed after the effective date of the 2016 Energy Law
|
|
•
|
required the MPSC to implement equitable cost-of-service rates for customers participating in a net metering program
|
The 2016 Energy Law also
established a path to ensure that forward capacity is secured for all electric customers in Michigan, including customers served by alternative electric suppliers under ROA.
Michigan law
allows electric customers in Consumers’ service territory to buy electric generation service from alternative electric suppliers in an aggregate amount capped at ten percent, with certain exceptions, of Consumers’ weather-normalized retail sales of the preceding calendar year.
For additional information, see
Item 7. Management’s Discussion and Analysis of Financial Condition and Results of Operations—Outlook—Consumers Electric Utility Outlook and Uncertainties
.
CMS Energy and Consumers Environmental Strategy and Compliance
CMS Energy and Consumers are committed to protecting the environment; this commitment extends beyond compliance with applicable laws and regulations. CMS Energy and Consumers continue to focus on opportunities to reduce their carbon footprint in electric generation. In 2016, Consumers retired 33 percent of its owned coal-fueled generating capacity; this has resulted in a 38‑percent decrease in Consumers’ self-generated electric supply from coal-fueled facilities since 2015.
During 2018, Consumers provided 10 percent of its electricity (self-generated and purchased) from renewable sources. Consumers owns and operates two wind farms: Lake Winds
®
Energy Park and Cross Winds
®
Energy Park. Presently, Consumers is expanding its Cross Winds
®
Energy Park; an additional phase began operations in January 2018 and a third phase is under construction, with operations expected to begin in 2020. Consumers expects to begin construction, subject to MPSC approval, of another wind project in Gratiot County, Michigan in 2019, with operations expected to begin in 2020.
Additionally, CMS Energy, through its enterprises businesses,
completed the development and construction of two solar generation projects
in Michigan and purchased a wind generation project in northwest Ohio; all of these projects became operational during 2018. For additional information on stewardship goals, see
Item 7. Management’s Discussion and Analysis of Financial Condition and Results of Operations—Executive Overview
.
28
CMS Energy, Consumers, and their subsidiaries are subject to various federal, state, and local environmental regulations for air and water quality, solid waste management, and other matters. Consumers expects to recover costs to comply with environmental regulations in customer rates, but cannot guarantee this result. For additional information concerning environmental matters, see
Item 1A. Risk Factors
,
Item 7. Management’s Discussion and Analysis of Financial Condition and Results of Operations—Outlook
, and
Item 8. Financial Statements and Supplementary Data—Notes to the Consolidated Financial Statements—
Note 4, Contingencies and Commitments
.
CMS Energy has recorded a
$46 million
liability for its subsidiaries’ obligations associated with Bay Harbor and Consumers has recorded a
$73 million
liability for its obligations at a number of former MGP sites. For additional information, see
Item 1A. Risk Factors
and
Item 8. Financial Statements and Supplementary Data—Notes to the Consolidated Financial Statements—
Note 4, Contingencies and Commitments
.
Solid Waste Disposal:
Costs related to the construction, operation, and closure of solid waste disposal facilities for coal ash are significant. Consumers’ solid waste disposal areas are regulated under Michigan’s solid waste rules and by the EPA’s rules regulating CCRs, such as coal ash. In order to address some of the requirements of these rules, Consumers has converted all of its fly ash handling systems to dry systems. In addition, Consumers’ ash facilities have programs designed to protect the environment and are subject to quarterly MDEQ inspections. Consumers’ estimate of capital and cost of removal expenditures to comply with regulations relating to ash disposal is
$188 million
from
2019
through
2023
.
Water:
Consumers uses substantial amounts of water to operate and cool its electric generating plants. Water discharge quality is regulated and administered by the MDEQ under the federal NPDES program. To comply with such regulation, Consumers’ facilities have discharge monitoring programs. The EPA issued final regulations for wastewater discharges from electric generating plants in 2015 and amended them in September 2017. Consumers’ estimate of capital expenditures to comply with these regulations as presently promulgated is
$56 million
from
2019
through
2023
.
In 2014, the EPA finalized its cooling water intake rule, which requires Consumers to evaluate the biological impact of its cooling water intake systems and ensure that it is using the best technology available to minimize adverse environmental impacts. Consumers’ preliminary estimate of capital expenditures to comply with these regulations is
$42 million
from
2019
through
2023
.
Air:
Consumers is subject to federal and state environmental regulations that require extensive reductions in nitrogen oxides, sulfur dioxides, particulate matter, and mercury emissions. To comply with these regulations, Consumers has invested in emissions control equipment at its electric generating plants. Consumers’ estimate of additional capital expenditures to comply with these regulations is
$3 million
from
2019
through
2023
.
Consumers’ future costs to comply with solid waste disposal, water, and air environmental regulations may vary depending on future legislation, litigation, or rulemaking.
For further information concerning estimated capital expenditures related to solid waste disposal, water, and air, see
Item 7. Management’s Discussion and Analysis of Financial Condition and Results of Operations—Outlook—Consumers Electric Utility Outlook and Uncertainties—Electric Environmental Outlook
.
29
Insurance
CMS Energy and its subsidiaries, including Consumers, maintain insurance coverage generally similar to comparable companies in the same lines of business. The insurance policies are subject to terms, conditions, limitations, and exclusions that might not fully compensate CMS Energy or Consumers for all losses. A portion of each loss is generally assumed by CMS Energy or Consumers in the form of deductibles and self-insured retentions that, in some cases, are substantial. As CMS Energy or Consumers renews its policies, it is possible that some of the present insurance coverage may not be renewed or obtainable on commercially reasonable terms due to restrictive insurance markets.
Employees
Presented in the following table are the number of employees of CMS Energy and Consumers:
|
December 31
|
2018
|
|
2017
|
|
2016
|
|
|
CMS Energy, including Consumers
1
|
||||||
|
Full-time employees
|
7,957
|
|
7,822
|
|
7,699
|
|
|
Seasonal employees
2
|
603
|
|
74
|
|
52
|
|
|
Part-time employees
|
65
|
|
56
|
|
49
|
|
|
Total employees
|
8,625
|
|
7,952
|
|
7,800
|
|
|
Consumers
1
|
||||||
|
Full-time employees
|
7,504
|
|
7,408
|
|
7,301
|
|
|
Seasonal employees
2
|
603
|
|
74
|
|
52
|
|
|
Part-time employees
|
14
|
|
14
|
|
13
|
|
|
Total employees
|
8,121
|
|
7,496
|
|
7,366
|
|
|
1
|
For information about CMS Energy’s and Consumers’ collective bargaining agreements, see
Item 8. Financial Statements and Supplementary Data—Notes to the Consolidated Financial Statements—
Note 12, Retirement Benefits
.
|
|
2
|
Consumers’ seasonal workforce peaked at
614
employees during
2018
,
598
employees during
2017
, and
522
employees during
2016
. Seasonal employees work primarily during the construction season and are subject to yearly layoffs. Typically, yearly layoffs occur in December; that did not happen in 2018.
|
30
CMS Energy and Consumers Executive Officers
Presented in the following table are the company positions held during the last five years for each of CMS Energy’s and Consumers’ executive officers as of February 1, 2019:
|
Name, Age, Position(s)
|
Period
|
|
Patricia K. Poppe (age 50)
|
|
|
CMS Energy
|
|
|
President and CEO
|
7/2016 – Present
|
|
Director
|
5/2016 – Present
|
|
Senior Vice President
|
3/2015 – 7/2016
|
|
Consumers
|
|
|
President and CEO
|
7/2016 – Present
|
|
Director
|
5/2016 – Present
|
|
Senior Vice President
|
3/2015 – 7/2016
|
|
Vice President
|
1/2011 – 3/2015
|
|
CMS Enterprises
|
|
|
Chairman of the Board, CEO, and Director
|
7/2016 – Present
|
|
President
|
7/2016 – 9/2017
|
|
Rejji P. Hayes (age 44)
1
|
|
|
CMS Energy
|
|
|
Executive Vice President and CFO
|
5/2017 – Present
|
|
Consumers
|
|
|
Executive Vice President and CFO
|
5/2017 – Present
|
|
CMS Enterprises
|
|
|
Executive Vice President, CFO, and Director
|
5/2017 – Present
|
|
Jean-Francois Brossoit (age 51)
2
|
|
|
CMS Energy
|
|
|
Senior Vice President
|
4/2017 – Present
|
|
Vice President
|
11/2016 – 4/2017
|
|
Consumers
|
|
|
Senior Vice President
|
4/2017 – Present
|
|
Vice President
|
11/2016 – 4/2017
|
|
Catherine A. Hendrian (age 50)
|
|
|
CMS Energy
|
|
|
Senior Vice President
|
4/2017 – Present
|
|
Vice President
|
3/2015 – 4/2017
|
|
Director of Human Resources
|
10/2012 – 3/2015
|
|
Consumers
|
|
|
Senior Vice President
|
4/2017 – Present
|
|
Vice President
|
3/2015 – 4/2017
|
|
Director of Human Resources
|
10/2012 – 3/2015
|
31
|
Name, Age, Position(s)
|
Period
|
|
Brandon J. Hofmeister (age 42)
|
|
|
CMS Energy
|
|
|
Senior Vice President
|
7/2017 – Present
|
|
Consumers
|
|
|
Senior Vice President
|
7/2017 – Present
|
|
Vice President
|
7/2016 – 7/2017
|
|
Executive Director, Policy Research, Analysis, and Public Affairs
|
6/2015 – 7/2016
|
|
Executive Director, Policy Research and Analysis
|
9/2013 – 6/2015
|
|
CMS Enterprises
|
|
|
Senior Vice President
|
9/2017 – Present
|
|
Venkat Dhenuvakonda Rao (age 48)
|
|
|
CMS Energy
|
|
|
Senior Vice President
|
9/2016 – Present
|
|
Vice President
|
7/2012 – 9/2016
|
|
Consumers
|
|
|
Senior Vice President
|
9/2016 – Present
|
|
Vice President
|
7/2012 – 9/2016
|
|
CMS Enterprises
|
|
|
Director
|
11/2017 – Present
|
|
Senior Vice President
|
9/2016 – Present
|
|
Vice President
|
7/2012 – 9/2016
|
|
Catherine M. Reynolds (age 61)
|
|
|
CMS Energy
|
|
|
Senior Vice President and General Counsel
|
10/2013 – Present
|
|
Consumers
|
|
|
Senior Vice President and General Counsel
|
10/2013 – Present
|
|
CMS Enterprises
|
|
|
Director
|
1/2014 – Present
|
|
Senior Vice President and General Counsel
|
1/2014 - 10/2018
|
|
Vice President and Secretary
|
9/2006 – 1/2014
|
|
Brian F. Rich (age 44)
3
|
|
|
CMS Energy
|
|
|
Senior Vice President and Chief Information Officer
|
7/2016 – Present
|
|
Vice President and Chief Information Officer
|
7/2014 – 7/2016
|
|
Consumers
|
|
|
Senior Vice President and Chief Information Officer
|
7/2016 – Present
|
|
Vice President and Chief Information Officer
|
7/2014 – 7/2016
|
|
Garrick J. Rochow (age 44)
|
|
|
CMS Energy
|
|
|
Senior Vice President
|
7/2016 – Present
|
|
Vice President
|
3/2015 – 7/2016
|
|
Consumers
|
|
|
Senior Vice President
|
7/2016 – Present
|
|
Vice President
|
10/2010 – 7/2016
|
32
|
Name, Age, Position(s)
|
Period
|
|
Glenn P. Barba (age 53)
|
|
|
CMS Energy
|
|
|
Vice President, Controller, and CAO
|
2/2003 – Present
|
|
Consumers
|
|
|
Vice President, Controller, and CAO
|
1/2003 – Present
|
|
CMS Enterprises
|
|
|
Vice President, Controller, and CAO
|
11/2007 – Present
|
|
1
|
Prior to joining CMS Energy and Consumers, Mr. Hayes was executive vice president and CFO for ITC Holdings Corp., a non‑affiliated company, from May 2014 through November 2016. Mr. Hayes started with ITC Holdings Corp. in 2012 as vice president of finance and treasurer.
|
|
2
|
Prior to joining CMS Energy and Consumers, Mr. Brossoit was vice president of manufacturing operations for United Technologies Corp., a non‑affiliated company. Mr. Brossoit started with United Technologies Corp. in 2006.
|
|
3
|
Prior to joining CMS Energy and Consumers, Mr. Rich was vice president of business technology for Pacific Gas and Electric Company, a non‑affiliated company. Mr. Rich started with Pacific Gas and Electric Company in 2010.
|
There are no family relationships among executive officers and directors of CMS Energy or Consumers. The list of directors and their biographies are included in CMS Energy’s and Consumers’ definitive proxy statement for their
2019
Annual Meetings of Shareholders to be held
May 3, 2019
. The term of office of each of the executive officers extends to the first meeting of the Board of Directors of CMS Energy and Consumers after the next annual election of Directors of CMS Energy and Consumers (to be held on
May 3, 2019
).
Available Information
CMS Energy’s internet address is www.cmsenergy.com. CMS Energy routinely posts important information on its website and considers the Investor Relations section, www.cmsenergy.com/investor-relations, a channel of distribution. Information contained on CMS Energy’s website is not incorporated herein. CMS Energy’s and Consumers’ annual reports on Form 10‑K, quarterly reports on Form 10‑Q, current reports on Form 8-K, and any amendments to those reports filed pursuant to Section 13(a) or 15(d) of the Exchange Act are accessible free of charge on CMS Energy’s website. These reports are available soon after they are electronically filed with the SEC. Also on CMS Energy’s website are CMS Energy’s and Consumers’:
|
•
|
Corporate Governance Principles
|
|
•
|
Articles of Incorporation
|
|
•
|
Bylaws
|
|
•
|
Charters and Codes of Conduct (including the Charters of the Audit Committee, Compensation and Human Resources Committee, Finance Committee, and Governance, Sustainability and Public Responsibility Committee, as well as the Employee, Boards of Directors, EnerBank, and Third Party Codes of Conduct)
|
CMS Energy will provide this information in print to any stockholder who requests it.
The SEC maintains an internet site that contains reports, proxy and information statements, and other information regarding issuers that file electronically with the SEC. The address is www.sec.gov.
33
Item 1A.
Risk Factors
Actual results in future periods for CMS Energy and Consumers could differ materially from historical results and the forward-looking statements contained in this report. Factors that might cause or contribute to these differences include those discussed in the following sections. CMS Energy’s and Consumers’ businesses are influenced by many factors that are difficult to predict, that involve uncertainties that may materially affect results, and that are often beyond their control. Additional risks and uncertainties not presently known or that management believes to be immaterial may also adversely affect CMS Energy or Consumers. The risk factors described in the following sections, as well as the other information included in this report and in other documents filed with the SEC, should be considered carefully before making an investment in securities of CMS Energy or Consumers. Risk factors of Consumers are also risk factors of CMS Energy. All of these risk factors are potentially significant.
CMS Energy depends on dividends from its subsidiaries to meet its debt service obligations.
Due to its holding company structure, CMS Energy depends on dividends from its subsidiaries to meet its debt service and other payment obligations. If sufficient dividends were not paid to CMS Energy by its subsidiaries, CMS Energy might not be able to generate the funds necessary to fulfill its payment obligations, which could have a material adverse effect on CMS Energy’s liquidity and financial condition.
Consumers’ ability to pay dividends or acquire its own stock from CMS Energy is limited by restrictions contained in Consumers’ preferred stock provisions and potentially by other legal restrictions, such as certain terms in its articles of incorporation and FERC requirements.
CMS Energy has indebtedness that could limit its financial flexibility and its ability to meet its debt service obligations.
The level of CMS Energy’s present and future indebtedness could have several important effects on its future operations, including, among others, that:
|
•
|
a significant portion of CMS Energy’s cash flow from operations could be dedicated to the payment of principal and interest on its indebtedness and would not be available for other purposes
|
|
•
|
covenants contained in CMS Energy’s existing debt arrangements, which require it to meet certain financial tests, could affect its flexibility in planning for, and reacting to, changes in its business
|
|
•
|
CMS Energy’s ability to obtain additional financing for working capital, capital expenditures, acquisitions, and general corporate and other purposes could become limited
|
|
•
|
CMS Energy could be placed at a competitive disadvantage to its competitors that are less leveraged
|
|
•
|
CMS Energy’s vulnerability to adverse economic and industry conditions could increase
|
|
•
|
CMS Energy’s future credit ratings could fluctuate
|
CMS Energy’s ability to meet its debt service obligations and to reduce its total indebtedness will depend on its future performance, which will be subject to general economic conditions, industry cycles, changes in laws or regulatory decisions, and financial, business, and other factors affecting its operations, many of which are beyond its control. CMS Energy cannot make assurances that its businesses will continue to generate sufficient cash flow from operations to service its indebtedness. If CMS Energy were unable to generate sufficient cash flows from operations, it could be required to sell assets or obtain additional financing.
34
CMS Energy and Consumers have financing needs and could be unable to obtain bank financing or access the capital markets.
CMS Energy and Consumers may be subject to liquidity demands under commercial commitments, guarantees, indemnities, letters of credit, and other contingent liabilities. Consumers’ capital requirements are expected to be substantial over the next several years as it decommissions older facilities and invests in electric grid modernization technology, construction or acquisition of power generation, environmental controls, conversions and expansions, and other electric and gas infrastructure to upgrade delivery systems. Those requirements may increase if additional laws or regulations are adopted or implemented.
CMS Energy and Consumers rely on the capital markets, as well as on bank syndications, to meet their financial commitments and short-term liquidity needs if sufficient internal funds are not available from Consumers’ operations and, in the case of CMS Energy, from dividends paid by Consumers and its other subsidiaries. CMS Energy and Consumers also use letters of credit issued under certain of their revolving credit facilities to support certain operations and investments.
Disruptions in the capital and credit markets as a result of uncertainty, changing or increased regulation, or failures of significant financial institutions could adversely affect CMS Energy’s and Consumers’ access to liquidity needed for their businesses. Consumers’ inability to obtain prior FERC authorization for any securities issuances, including publicly offered debt, as is required under the Federal Power Act, could adversely affect Consumers’ access to liquidity. Any liquidity disruption could require CMS Energy and Consumers to take measures to conserve cash. These measures could include, but are not limited to, deferring capital expenditures, changing CMS Energy’s and Consumers’ commodity purchasing strategy to avoid collateral-posting requirements, and reducing or eliminating future share repurchases, dividend payments, or other discretionary uses of cash.
CMS Energy continues to explore financing opportunities to supplement its financial strategy. These potential opportunities include refinancing and/or issuing new debt, preferred stock and/or common equity, commercial paper, and bank financing. Similarly, Consumers may seek funds through the capital markets, commercial lenders, and leasing arrangements. Entering into new financings is subject in part to capital market receptivity to utility industry securities in general and to CMS Energy’s and Consumers’ securities in particular. CMS Energy and Consumers cannot guarantee the capital markets’ acceptance of their securities or predict the impact of factors beyond their control, such as actions of rating agencies.
Certain of CMS Energy’s and Consumers’ securities and those of their affiliates are rated by various credit rating agencies. A reduction or withdrawal of one or more of its credit ratings could have a material adverse impact on CMS Energy’s or Consumers’ ability to access capital on acceptable terms and maintain commodity lines of credit, could increase its cost of borrowing, and could cause CMS Energy or Consumers to reduce capital expenditures. If it were unable to maintain commodity lines of credit, CMS Energy or Consumers might have to post collateral or make prepayments to certain suppliers under existing contracts. Further, since Consumers provides dividends to CMS Energy, any adverse developments affecting Consumers that result in a lowering of its credit ratings could have an adverse effect on CMS Energy’s credit ratings. CMS Energy and Consumers cannot guarantee that any of their present ratings will remain in effect for any given period of time or that a rating will not be lowered or withdrawn entirely by a rating agency.
If CMS Energy or Consumers were unable to obtain bank financing or access the capital markets to incur or refinance indebtedness, or were unable to obtain commercially reasonable terms for any financing, this could have a material adverse effect on its liquidity, financial condition, and results of operations.
35
There are risks associated with Consumers’ substantial capital investment program planned for the next five years.
Consumers’ planned investments include the construction or acquisition of power generation, electric and gas infrastructure, conversions and expansions, environmental controls, electric grid modernization technology, and other electric and gas investments to upgrade delivery systems, as well as decommissioning of older facilities. The success of these capital investments depends on or could be affected by a variety of factors that include, but are not limited to:
|
•
|
effective pre-acquisition evaluation of asset values, future operating costs, potential environmental and other liabilities, and other factors beyond Consumers’ control
|
|
•
|
effective cost and schedule management of new capital projects
|
|
•
|
availability of qualified construction personnel
|
|
•
|
changes in commodity and other prices
|
|
•
|
governmental approvals and permitting
|
|
•
|
operational performance
|
|
•
|
changes in environmental, legislative, and regulatory requirements
|
|
•
|
regulatory cost recovery
|
It is possible that adverse events associated with these factors could have a material adverse effect on Consumers’ liquidity, financial condition, and results of operations.
Changes to ROA could have a material adverse effect on CMS Energy’s and Consumers’ businesses.
The 2016 Energy Law
allows electric customers in Consumers’ service territory to buy electric generation service from alternative electric suppliers in an aggregate amount capped at ten percent, with certain exceptions, of Consumers’ weather-normalized retail sales of the preceding calendar year.
Lower natural gas prices due to a large supply of natural gas on the market and continued growth of renewable energy resources, coupled with low capacity prices in the electric supply market, are placing increasing competitive pressure on the cost of Consumers’ electric supply. Presently, Consumers’ electric rates are above the Midwest average, while the ROA level on Consumers’ system is
at the ten-percent limit
and the proportion of Consumers’ electric deliveries under the ROA program and on the ROA waiting list is 26 percent. If the ROA limit were increased or if electric generation service in Michigan were deregulated, it could have a material adverse effect on Consumers’ financial results and operations.
CMS Energy and Consumers are subject to rate regulation, which could have an adverse effect on financial results.
CMS Energy and Consumers are subject to rate regulation. Consumers’ electric and gas retail rates are set by the MPSC and cannot be changed without regulatory authorization. If rate regulators fail to provide adequate rate relief, it could have a material adverse effect on Consumers or Consumers’ plans for making significant capital investments. Regulators seeking to avoid or minimize rate increases could resist raising customer rates sufficiently to permit Consumers to recover the full cost of these investments. In addition, because there are statutory requirements mandating that regulators allow Consumers to recover from customers certain costs, such as resource additions to meet Michigan’s renewable resource standard, energy waste reduction, and environmental compliance, regulators could be more inclined to oppose rate increases for other requested items and investments. Rate regulators could also face pressure to avoid or limit rate increases for a number of reasons, including an economic downturn in the state or diminishment of Consumers’ customer base. Additionally, future orders of the MPSC related to Consumers’ remeasurement of its deferred income taxes as a result of the TCJA could require accelerated customer refunds. In addition to its potential effects on Consumers’ investment program, any limitation of cost
36
recovery through rates or any acceleration of customer refunds could have a material adverse effect on Consumers’ liquidity, financial condition, and results of operations.
Orders of the MPSC could limit recovery of costs of providing service including, but not limited to, environmental and safety related expenditures for coal-fueled plants and other utility properties, regulatory assets, power supply and natural gas supply costs, operating and maintenance expenses, additional utility-based investments, sunk investment in mothballed or retired generating plants, costs associated with the proposed retirement and decommissioning of facilities, depreciation expense, MISO energy and transmission costs, costs associated with energy waste reduction investments and state or federally mandated renewable resource standards, or expenditures subject to tracking mechanisms. These orders could also result in adverse regulatory treatment of other matters. For example, MPSC orders could prevent or curtail Consumers from shutting off non‑paying customers, could prevent or curtail the implementation of a gas revenue mechanism, or could require Consumers to refund previously self-implemented rates.
FERC authorizes certain subsidiaries of CMS Energy to sell electricity at market-based rates. Failure of these subsidiaries to maintain this FERC authority could have a material adverse effect on CMS Energy’s and Consumers’ liquidity, financial condition, and results of operations. Transmission rates are also set by FERC. FERC orders related to transmission costs could have a material adverse effect on Consumers’ liquidity, financial condition, and results of operations.
The various risks associated with the MPSC and FERC regulation of CMS Energy’s and Consumers’ businesses, which include the risk of adverse decisions in any number of rate or regulatory proceedings before either agency, as well as judicial proceedings challenging any agency decisions, could have a material adverse effect on CMS Energy’s and Consumers’ liquidity, financial condition, investment plans, and results of operations.
Utility regulation, state or federal legislation, and compliance could have a material adverse effect on CMS Energy’s and Consumers’ businesses.
CMS Energy and Consumers are subject to, or affected by, extensive utility regulation and state and federal legislation. CMS Energy and Consumers believe that they comply with applicable laws and regulations. If it were determined that they failed to comply, CMS Energy or Consumers could become subject to fines, penalties, or disallowed costs, or be required to implement additional compliance, cleanup, or remediation programs, the cost of which could be material. Adoption of new laws, rules, regulations, principles, or practices by federal or state agencies, or challenges or changes to present laws, rules, regulations, principles, or practices and the interpretation of any adoption or change, could have a material adverse effect on CMS Energy’s and Consumers’ liquidity, financial condition, and results of operations. Furthermore, any state or federal legislation concerning CMS Energy’s or Consumers’ operations could have a similar effect.
Utility regulation could be impacted by various matters, such as electric industry restructuring, hydro relicensing, asset reclassification, gas pipeline capacity and gas storage, new generation facilities or investments, transmission charges, environmental controls, climate change, air emissions, renewable energy, energy policy and ROA, regulation or deregulation, energy capacity standards or markets, reliability, and safety. CMS Energy and Consumers cannot predict the impact of these matters on their liquidity, financial condition, and results of operations.
FERC, through NERC, oversees reliability of certain portions of the electric grid. FERC orders regarding electric system reliability could have a material adverse effect on CMS Energy’s or Consumers’ liquidity, financial condition, and results of operations.
37
Government-mandated power purchases from renewable energy projects may have an adverse effect on CMS Energy’s and Consumers’ businesses.
PURPA requires Consumers to purchase power from qualifying cogeneration and small power production facilities at a price approved by the MPSC that is meant to represent Consumers’ “avoided cost” of generating power or purchasing power from another source. In November 2017, the MPSC issued an order establishing a new avoided-cost methodology for determining the price that Consumers must pay to purchase power under PURPA. Among other things, the MPSC’s order changes the basis of Consumers’ avoided cost from the cost of coal-fueled generating units to that of natural gas-fueled generating units. The MPSC order also assigns more capacity value to qualifying facilities that are consistently able to generate electricity during peak times.
The MPSC is considering Consumers’ IRP, which presents Consumers’ current outlook and plans for its electric generation supply portfolio out to 2040. Consumers’ potential need for additional electric generation, and the corresponding cost to build or purchase that generation, can be used by the MPSC to determine Consumers’ avoided costs pursuant to PURPA. The MPSC orders in these proceedings
could result in mandated purchases of generation, potentially at above-market prices, and reduce Consumers’ need for new owned generation. This in turn could have a material adverse effect on Consumers’ capital investment plan
,
the affordability of future customer rates
, and CMS Energy’s and Consumers’ liquidity, financial condition, investment plans, and results of operations.
CMS Energy and Consumers could incur substantial costs to comply with environmental requirements.
CMS Energy and Consumers are subject to costly and stringent environmental regulations that will likely require additional significant capital expenditures for emissions control equipment, CCR disposal and storage, cooling water intake equipment, effluent treatment, and PCB remediation. Present and reasonably anticipated state and federal environmental statutes and regulations, including but not limited to the Clean Air Act, the Clean Water Act, RCRA, CERCLA, and NREPA, will continue to have a material effect on CMS Energy and Consumers.
CMS Energy and Consumers have interests in fossil-fuel-fired power plants and other types of power plants that produce greenhouse gases. Federal and state environmental laws and rules, as well as international accords and treaties, could require CMS Energy and Consumers to install additional equipment for emission controls, purchase carbon emissions allowances, curtail operations, invest in generating capacity with fewer carbon dioxide emissions, or take other significant steps to manage or lower the emission of greenhouse gases.
In August 2018, the EPA proposed the “Affordable Clean Energy” rule as a replacement for the EPA’s 2015 Clean Power Plan, which the U.S. Supreme Court stayed in 2016. This proposed rule requires individual states to evaluate fossil-fuel-fired power plants for heat-rate improvements that could be undertaken to increase overall plant efficiency. There is also a proposal to modify the Clean Air Act permitting requirements to promote these efficiency projects. Consumers does not expect that the Affordable Clean Energy rule will have an adverse impact on its environmental strategy.
38
The following risks related to climate change, emissions, and environmental regulations could also have a material adverse impact on CMS Energy’s and Consumers’ liquidity, financial condition, and results of operations:
|
•
|
litigation originated by third parties against CMS Energy or Consumers due to CMS Energy’s or Consumers’ greenhouse gas or other emissions or CCR disposal and storage
|
|
•
|
impairment of CMS Energy’s or Consumers’ reputation due to their greenhouse gas or other emissions and public perception of their response to potential environmental regulations, rules, and legislation
|
|
•
|
extreme weather conditions, such as severe storms, that may affect customer demand, company operations, or assets
|
Consumers retired
seven
smaller coal-fueled electric generating units
in 2016
. Consumers may encounter previously unknown environmental conditions that will need to be addressed in a timely fashion with state and federal environmental regulators as facilities and equipment on these sites are taken out of service.
Consumers expects to collect fully from its customers, through the ratemaking process, expenditures incurred to comply with environmental regulations, but cannot guarantee this outcome. If Consumers were unable to recover these expenditures from customers in rates, it could negatively affect CMS Energy’s and/or Consumers’ liquidity, results of operations, and financial condition and CMS Energy and/or Consumers could be required to seek significant additional financing to fund these expenditures.
For additional information regarding compliance with environmental regulations, see
Item 1. Business—CMS Energy and Consumers Environmental Strategy and Compliance
and
Item 7. Management’s Discussion and Analysis of Financial Condition and Results of Operations—Outlook—Consumers Electric Utility Outlook and Uncertainties
.
CMS Energy’s and Consumers’ businesses could be affected adversely by any delay in meeting environmental requirements.
A delay or failure by CMS Energy or Consumers to obtain or maintain any necessary environmental permits or approvals to satisfy any applicable environmental regulatory requirements or install emission control equipment could:
|
•
|
prevent the construction of new facilities
|
|
•
|
prevent the continued operation and sale of energy from existing facilities
|
|
•
|
prevent the suspension of operations at existing facilities
|
|
•
|
prevent the modification of existing facilities
|
|
•
|
result in significant additional costs that could have a material adverse effect on their liquidity, financial condition, and results of operations
|
CMS Energy and Consumers expect to incur additional substantial costs related to remediation of legacy environmental sites.
Consumers expects to incur additional substantial costs related to the remediation of its former MGP sites. Based upon prior MPSC orders, Consumers expects to be able to recover the costs of these cleanup activities through its gas rates, but cannot guarantee that outcome.
Consumers also expects to incur remediation and other response activity costs at a number of other sites under NREPA and CERCLA. Consumers believes these costs should be recoverable in rates, but cannot guarantee that outcome.
39
In addition, certain CMS Energy subsidiaries retained environmental remediation obligations for the collection, treatment, and discharge of leachate at Bay Harbor after selling their interests in the development in 2002. Leachate is produced when water enters into cement kiln dust piles left over from former cement plant operations at the site. Certain CMS Energy subsidiaries have signed agreements with the EPA and the MDEQ relating to Bay Harbor. If these CMS Energy subsidiaries were unable to meet their commitments under these agreements, or if unanticipated events occurred, these CMS Energy subsidiaries could incur additional material costs relating to their Bay Harbor remediation obligations.
CMS Energy and Consumers could be affected adversely by legacy litigation and retained liabilities.
CMS Energy, CMS MST, CMS Field Services, Cantera Natural Gas, Inc., and Cantera Gas Company were named as defendants in various lawsuits arising as a result of alleged inaccurate natural gas price reporting. Remaining allegations include price-fixing conspiracies, restraint of trade, and artificial inflation of natural gas retail prices in Kansas and Wisconsin. CMS Energy cannot predict the outcome of these lawsuits or the amount of damages for which CMS Energy may be liable. It is possible that the outcome of the lawsuits could have a material adverse effect on CMS Energy’s liquidity, financial condition, and results of operations.
The agreements that CMS Energy and Consumers enter into for the sale of assets customarily include provisions whereby they are required to:
|
•
|
retain specified preexisting liabilities, such as for taxes, pensions, or environmental conditions
|
|
•
|
indemnify the buyers against specified risks, including the inaccuracy of representations and warranties that CMS Energy and Consumers make
|
|
•
|
make payments to the buyers depending on the outcome of post-closing adjustments, litigation, audits, or other reviews, including claims resulting from attempts by foreign or domestic governments to assess taxes on past operations or transactions
|
Many of these contingent liabilities can remain open for extended periods of time after the sales are closed. Depending on the extent to which the buyers might ultimately seek to enforce their rights under these contractual provisions, and the resolution of any disputes concerning them, there could be a material adverse effect on CMS Energy’s or Consumers’ liquidity, financial condition, and results of operations.
In 2002, CMS Energy sold its oil, gas, and methanol investments in Equatorial Guinea. The government of Equatorial Guinea claims that, in connection with the sale, CMS Energy owes
$152 million
in taxes, plus substantial penalties and interest that could be up to the amount of the taxes claimed. In 2015, the matter was proceeding to formal arbitration; however, since then, the government of Equatorial Guinea has stopped communicating. CMS Energy has concluded that the government’s tax claim is without merit and will continue to contest the claim, but cannot predict the financial impact or outcome of the matter. An unfavorable outcome could have a material adverse effect on CMS Energy’s liquidity, financial condition, and results of operations.
CMS Energy’s and Consumers’ energy sales and operations are affected by seasonal factors and varying weather conditions from year to year.
CMS Energy’s and Consumers’ utility operations are seasonal.
The consumption of electric energy typically increases in the summer months, due primarily to the use of air conditioners and other cooling equipment
, while
peak demand for natural gas typically occurs in the winter due
to colder temperatures and the resulting use of natural gas as heating fuel
.
In addition, Consumers’ electric rates, which follow a seasonal rate design, are higher in the summer months than in the remaining months of the year.
Accordingly, CMS Energy’s and Consumers’ overall results may fluctuate substantially on a seasonal
40
basis. Mild temperatures during the summer cooling season and winter heating season as well as the impact of extreme weather events on Consumers’ system could have a material adverse effect on CMS Energy’s and Consumers’ liquidity, financial condition, and results of operations.
Consumers is exposed to risks related to general economic conditions in its service territories.
Consumers’ electric and gas utility businesses are affected by the economic conditions impacting the customers they serve. If the Michigan economy becomes sluggish or declines, Consumers could experience reduced demand for electricity or natural gas that could result in decreased earnings and cash flow. In addition, economic conditions in Consumers’ service territory affect its collections of accounts receivable and levels of lost or stolen gas, which in turn impact its liquidity, financial condition, and results of operations.
CMS Energy and Consumers are subject to information security risks, risks of unauthorized access to their systems, and technology failures.
In the regular course of business, CMS Energy and Consumers handle a range of sensitive security and customer information. CMS Energy and Consumers are subject to laws and rules issued by various agencies concerning safeguarding and maintaining the confidentiality of this information. A security breach of CMS Energy’s and Consumers’ information or control systems could involve theft or the inappropriate release of certain types of information, such as confidential customer information or, separately, system operating information. These events could disrupt operations, subject CMS Energy and Consumers to possible financial liability, damage their reputation and diminish the confidence of customers, and have a material adverse effect on CMS Energy’s and Consumers’ liquidity, financial conditions, and results of operations.
CMS Energy and Consumers operate in a highly regulated industry that requires the continued operation of sophisticated information and control technology systems and network infrastructure. Despite implementation of security measures, technology systems, including disaster recovery and backup systems, are vulnerable to failure, cyber crime, unauthorized access, and being disabled. These events could impact the reliability of electric generation and electric and gas delivery and also subject CMS Energy and Consumers to financial harm. Cyber crime, which includes the use of malware, computer viruses, and other means for disruption or unauthorized access against companies, including CMS Energy and Consumers, has increased in frequency, scope, and potential impact in recent years. While CMS Energy and Consumers have not been subject to cyber crime incidents that have had a material impact on their operations to date, their security measures in place may be insufficient to prevent a major cyber incident in the future. If technology systems, including disaster recovery and backup systems, were to fail or be breached, CMS Energy and Consumers might not be able to fulfill critical business functions, and sensitive confidential and proprietary data could be compromised, which could have a material adverse effect on CMS Energy’s and Consumers’ liquidity, financial condition, and results of operations. In addition, because CMS Energy’s and Consumers’ generation, transmission, and distribution systems are part of an interconnected system, a disruption caused by a cyber incident at another utility, electric generator, system operator, or commodity supplier could also adversely affect CMS Energy’s or Consumers’ businesses, financial condition, and results of operations.
A variety of technological tools and systems, including both company-owned information technology and technological services provided by outside parties, support critical functions. The failure of these technologies, including backup systems, or the inability of CMS Energy and Consumers to have these technologies supported, updated, expanded, or integrated into other technologies, could hinder their business operations and materially adversely affect their liquidity, financial condition, and results of operations. A breach or failure of technology, including disaster recovery or backup systems, could also have a negative impact on CMS Energy’s banking subsidiary, EnerBank.
41
CMS Energy’s and Consumers’ businesses have liability risks.
Consumers’ electric and gas delivery systems, power plants, gas infrastructure including storage facilities, wind energy or solar equipment, energy products, and the independent power plants owned in whole or in part by CMS Energy could be involved in incidents, failures, or accidents that result in injury, loss of life, or property loss to customers, employees, or the public. Although CMS Energy and Consumers have insurance coverage for many potential incidents (subject to deductibles, limitations, and self-insurance amounts that could be material), depending upon the nature or severity of any incident, failure, or accident, CMS Energy or Consumers could suffer financial loss, reputational damage, and negative repercussions from regulatory agencies or other public authorities.
CMS Energy’s and Consumers’ revenues and results of operations are subject to risks that are beyond their control, including but not limited to natural disasters, terrorist attacks and related acts of war, cyber incidents, vandalism, and other catastrophic events.
The impact of natural disasters, severe weather, wars, terrorist acts, vandalism, cyber incidents, pandemics, and other catastrophic events on the facilities and operations of CMS Energy and Consumers could have a material adverse effect on CMS Energy’s and Consumers’ liquidity, financial condition, and results of operations. These events could result in severe damage to CMS Energy’s and Consumers’ assets beyond what could be recovered through insurance policies (which are subject to deductibles and limits), could require CMS Energy and Consumers to incur significant upfront costs, and could severely disrupt operations, resulting in loss of service to customers. There is also a risk that regulators could, after the fact, conclude that Consumers’ preparedness or response to such an event was inadequate and take adverse actions as a result.
CMS Energy and Consumers are exposed to significant reputational risks.
CMS Energy and Consumers could suffer negative impacts to their reputations as a result of operational incidents, violations of corporate policies, regulatory violations, inappropriate use of social media, or other events. Reputational damage could have a material adverse effect on CMS Energy’s and Consumers’ liquidity, financial condition, and results of operations. It could also result in negative customer perception and increased regulatory oversight.
Consumers is exposed to changes in customer usage that could impact financial results.
Distributed electricity generation:
Technology advances, government incentives and subsidies, and recent regulatory decisions could increase the cost effectiveness of customer-owned methods of producing electricity, such as fuel cells, microturbines, wind turbines, and solar photovoltaics, resulting in reduced load, cross subsidization, and increased costs. This could have a material adverse effect on CMS Energy’s and Consumers’ liquidity, financial condition, and results of operations.
Energy waste reduction:
Customers could reduce their consumption through demand-side energy conservation and energy waste reduction programs. These reductions could have a material adverse effect on CMS Energy’s and Consumers’ liquidity, financial condition, and results of operations.
Energy risk management strategies might not be effective in managing fuel and electricity pricing risks, which could result in unanticipated liabilities to CMS Energy and Consumers or increased volatility in their earnings.
Consumers is exposed to changes in market prices for natural gas, coal, electric capacity, electric energy, emission allowances, gasoline, diesel fuel, and RECs. Prices for these commodities may fluctuate substantially over relatively short periods of time and expose Consumers to price risk. A substantial portion of Consumers’ operating expenses for its electric generating plants and vehicle fleet consists of
42
the costs of obtaining these commodities. The contracts associated with Consumers’ fuel and purchased power costs are executed in conjunction with the PSCR mechanism, which is designed to allow Consumers to recover prudently incurred costs associated with those positions. If the MPSC determined that any of these contracts or related contracting policies were imprudent, recovery of these costs could be disallowed. Consumers manages commodity price risk using established policies and procedures, and it may use various contracts to manage this risk, including swaps, options, futures, and forward contracts. No assurance can be made that these strategies will be successful in managing Consumers’ pricing risk or that they will not result in net liabilities to Consumers as a result of future volatility in these markets.
Natural gas prices in particular have been historically volatile. Consumers routinely enters into contracts to mitigate exposure to the risks of demand, market effects of weather, and changes in commodity prices associated with its gas distribution business. These contracts are executed in conjunction with the GCR mechanism, which is designed to allow Consumers to recover prudently incurred costs associated with those positions. If the MPSC determined that any of these contracts or related contracting policies were imprudent, recovery of these costs could be disallowed. Consumers does not always hedge the entire exposure of its operations from commodity price volatility. Furthermore, the ability to hedge exposure to commodity price volatility depends on liquid commodity markets. As a result, to the extent the commodity markets are illiquid, Consumers might not be able to execute its risk management strategies, which could result in larger unhedged positions than preferred at a given time. To the extent that unhedged positions exist, fluctuating commodity prices could have a negative effect on CMS Energy’s and Consumers’ liquidity, financial condition, and results of operations. Changes in laws that limit Consumers’ ability to hedge could also have a negative effect on CMS Energy’s and Consumers’ liquidity, financial condition, and results of operations.
CMS Energy and Consumers are exposed to counterparty risk.
Adverse economic conditions or financial difficulties experienced by counterparties with whom CMS Energy and Consumers do business could impair the ability of these counterparties to pay for CMS Energy’s and Consumers’ services and/or fulfill their contractual obligations, including performance and payment of damages. CMS Energy and Consumers depend on these counterparties to remit payments and perform contracted services in a timely fashion. Any delay or default in payment or performance of contractual obligations could have a material adverse effect on CMS Energy’s and Consumers’ liquidity, financial condition, and results of operations.
Volatility and disruptions in capital and credit markets could have a negative impact on CMS Energy’s and Consumers’ lenders, vendors, contractors, suppliers, customers, and other counterparties, causing them to fail to meet their obligations. Adverse economic conditions could also have a negative impact on the loan portfolio of CMS Energy’s banking subsidiary, EnerBank.
Consumers might not be able to obtain an adequate supply of natural gas or coal, which could limit its ability to operate its electric generation facilities or serve its natural gas customers.
Consumers has natural gas and coal supply and transportation contracts in place for the natural gas and coal it requires for its electric generating capacity. Consumers also has interstate transportation and supply agreements in place to facilitate delivery of natural gas to its customers. Apart from the contractual and monetary remedies available to Consumers in the event of a counterparty’s failure to perform under any of these contracts, there can be no assurances that the counterparties to these contracts will fulfill their obligations to provide natural gas or coal to Consumers. The counterparties under the agreements could experience financial or operational problems that inhibit their ability to fulfill their obligations to Consumers. In addition, counterparties under these contracts might not be required to supply natural gas or coal to Consumers under certain circumstances, such as in the event of a natural disaster or severe weather.
43
If, for its electric generating capacity, Consumers were unable to obtain its natural gas or coal requirements under existing or future natural gas and coal supply and transportation contracts, or to obtain resources under existing or future PPAs, it could be required to purchase natural gas or coal at higher prices or forced to purchase electricity from higher-cost generating resources in the MISO energy market. If, for natural gas delivery to its customers, Consumers were unable to obtain its natural gas supply requirements under existing or future natural gas supply and transportation contracts, it could be required to purchase natural gas at higher prices from other sources or implement its natural gas curtailment program filed with the MPSC. These alternatives could increase Consumers’ working capital requirements and could decrease its revenues.
Market performance and other changes could decrease the value of employee benefit plan assets, which then could require substantial funding.
The performance of the capital markets affects the value of assets that are held in trust to satisfy future obligations under CMS Energy’s and Consumers’ pension and postretirement benefit plans. CMS Energy and Consumers have significant obligations under these plans and hold significant assets in these trusts. These assets are subject to market fluctuations and will yield uncertain returns, which could fall below CMS Energy’s and Consumers’ forecasted return rates. A decline in the market value of the assets or a change in the level of interest rates used to measure the required minimum funding levels could significantly increase the funding requirements of these obligations. Also, changes in demographics, including an increased number of retirements or changes in life expectancy assumptions, could significantly increase the funding requirements of the obligations related to the pension and postretirement benefit plans. If CMS Energy and Consumers were unable to manage their pension and postretirement plan assets successfully, it could have a material adverse effect on their liquidity, financial condition, and results of operations.
A work interruption or other union actions could adversely affect Consumers.
Unions represent
37 percent
of Consumers’ employees. Consumers’ union agreements expire in
2020
. If these employees were to engage in a strike, work stoppage, or other slowdown, Consumers could experience a significant disruption in its operations and higher ongoing labor costs.
Failure to attract and retain an appropriately qualified workforce could adversely impact CMS Energy’s and Consumers’ results of operations.
The workforce of CMS Energy and Consumers is aging and a number of employees will become eligible to retire within the next few years. In some areas, competition for skilled employees is high and if CMS Energy and Consumers were unable to match skill sets to future needs, they could encounter operating challenges and increased costs. These challenges could include a lack of resources, loss of knowledge, and delays in skill development. Additionally, higher costs could result from the use of contractors to replace employees, loss of productivity, and safety incidents. Failing to train replacement employees adequately and to transfer internal knowledge and expertise could adversely affect CMS Energy’s and Consumers’ ability to manage and operate their businesses. If CMS Energy and Consumers were unable to attract and retain an appropriately qualified workforce, their financial condition and results of operations could be affected negatively.
Unplanned power plant outages could be costly for Consumers.
Unforeseen maintenance of Consumers’ power plants may be required for many reasons, including catastrophic events such as fires, explosions, extreme weather, floods or other acts of God, failures of equipment or materials, operator error, or the need to comply with environmental or safety regulations. When unplanned maintenance work is required on power plants or other equipment, Consumers will not
44
only incur unexpected maintenance expenses, but it may also have to make spot market purchases of replacement electricity that exceed Consumers’ costs of generation or be forced to retire a given unit if the cost or timing of the maintenance is not reasonable and prudent. Additionally, unplanned maintenance work could reduce the capacity credit Consumers receives from MISO and could cause Consumers to incur additional capacity costs in future years. If Consumers were unable to recover any of these increased costs in rates, it could have a material adverse effect on Consumers’ liquidity, financial condition, and results of operations.
Changes in taxation as well as the inherent difficulty in quantifying potential tax effects of business decisions could negatively impact CMS Energy and Consumers.
CMS Energy and Consumers are required to make judgments regarding the potential tax effects of various financial transactions and results of operations in order to estimate their obligations to taxing authorities. The tax obligations include income taxes, real estate taxes, sales and use taxes, employment-related taxes, and ongoing issues related to these tax matters. The judgments include determining reserves for potential adverse outcomes regarding tax positions that have been taken and may be subject to challenge by the IRS and/or other taxing authorities. Unfavorable settlements of any of the issues related to these reserves or other tax matters at CMS Energy or Consumers could have a material adverse effect on their liquidity, financial condition, and results of operations.
CMS Energy and Consumers are subject to changing tax laws. Changes in federal, state, or local tax rates or other changes in tax laws could have adverse impacts on their liquidity, financial condition, and results of operations.
In December 2017, President Trump signed the TCJA, which changed existing federal tax law and included numerous provisions that affect businesses. CMS Energy and Consumers made reasonable estimates in measuring and accounting for the effects of the TCJA and did not recognize any material changes to their estimates during the year ended December 31, 2018. Given expected changes to U.S. Treasury regulations and interpretations of the TCJA by the U.S. Treasury, the final transition impacts of the TCJA may differ from the estimates provided elsewhere in this report.
CMS Energy and its subsidiaries, including Consumers and EnerBank, must comply with the Dodd-Frank Act and its related regulations, which are subject to change and could involve material costs or affect operations.
Regulations that are intended to implement the Dodd-Frank Act have been and are still being adopted by the appropriate agencies. The Dodd-Frank Act added a new Section 13 to the Bank Holding Company Act. Known, together with its implementing regulations, as the Volcker Rule, it generally restricts certain banking entities (such as EnerBank) and their subsidiaries or affiliates from engaging in proprietary trading activities and from owning equity in or sponsoring any private equity or hedge fund. The activities of CMS Energy and its subsidiaries (including EnerBank) are not expected to be materially affected by the Volcker Rule; however, they will be restricted from engaging in proprietary trading, investing in third‑party hedge or private equity funds, and sponsoring these funds in the future unless CMS Energy qualifies for an exemption from the rule. CMS Energy and its subsidiaries are also subject to certain ongoing compliance requirements pursuant to the regulations. In May 2018, the federal agencies that are responsible for the Volcker Rule approved a notice of proposed rulemaking that proposes significant revisions to the Volcker Rule implementing regulations. The revisions would leave intact the core restrictions on proprietary trading and private equity and hedge fund activities; however, the revisions would make certain significant changes to the proprietary trading restrictions and compliance program requirements. CMS Energy cannot predict the full impact of the Volcker Rule, including any impact resulting from changes to implementing regulations, on CMS Energy’s or EnerBank’s operations or financial condition.
45
All companies that directly or indirectly control an FDIC-insured bank are required to serve as a source of financial strength for that institution. As a result, CMS Energy could be called upon by the FDIC to infuse additional capital into EnerBank to the extent that EnerBank fails to satisfy its capital requirements. In addition, CMS Energy is contractually required (i) to make cash capital contributions to EnerBank in the event that EnerBank does not maintain required minimum capital ratios and (ii) to provide EnerBank financial support, in an amount and duration as may be necessary for EnerBank to meet the cash needs of its depositors and other operations. EnerBank has exceeded these requirements historically and exceeded them as of January 31, 2019.
In addition, the Dodd-Frank Act provides for regulation by the Commodity Futures Trading Commission of certain commodity-related contracts. Although CMS Energy, Consumers, EnerBank, and certain subsidiaries of CMS Enterprises qualify for an end-user exception from mandatory clearing of commodity-related swaps, these regulations could affect the ability of these entities to participate in these markets and could add additional regulatory oversight over their contracting activities.
Item 1B.
Unresolved Staff Comments
None.
Item 2.
Properties
Descriptions of CMS Energy’s and Consumers’ properties are found in the following sections of
Item 1. Business
, all of which are incorporated by reference in this Item 2:
|
•
|
General—CMS Energy
|
|
•
|
General—Consumers
|
|
•
|
Business Segments—Consumers Electric Utility—Electric Utility Properties
|
|
•
|
Business Segments—Consumers Gas Utility—Gas Utility Properties
|
|
•
|
Business Segments—Enterprises Segment—Non-Utility Operations and Investments—Independent Power Production
|
Item 3.
Legal Proceedings
For information regarding CMS Energy’s and Consumers’ significant pending administrative and judicial proceedings involving regulatory, operating, transactional, environmental, and other matters, see
Item 8. Financial Statements and Supplementary Data—Notes to the Consolidated Financial Statements—
Note 3, Regulatory Matters
and
Note 4, Contingencies and Commitments
.
CMS Energy, Consumers, and certain of their affiliates are also parties to routine lawsuits and administrative proceedings incidental to their businesses involving, for example, claims for personal injury and property damage, contractual matters, various taxes, and rates and licensing.
Item 4.
Mine Safety Disclosures
Not applicable.
46
Part II
Item 5.
Market For Registrant’s Common Equity, Related Stockholder Matters and Issuer Purchases of Equity Securities
CMS Energy
CMS Energy’s common stock is traded on the New York Stock Exchange under the symbol CMS. Market prices for CMS Energy’s common stock and related security holder matters are contained in
Item 6. Selected Financial Data
, which is incorporated by reference herein. At
January 14, 2019
, the number of registered holders of CMS Energy’s common stock totaled 29,620, based on the number of record holders.
For additional information regarding securities authorized for issuance under equity compensation plans, see
Item 8. Financial Statements and Supplementary Data—Notes to the Consolidated Financial Statements—
Note 13, Stock-Based Compensation
and
Item 12. Security Ownership of Certain Beneficial Owners and Management and Related Stockholder Matters
. For additional information regarding dividends and dividend restrictions, see
Item 8. Financial Statements and Supplementary Data—Notes to the Consolidated Financial Statements—
Note 5, Financings and Capitalization
.
47
Comparison of Five-Year Cumulative Total Return
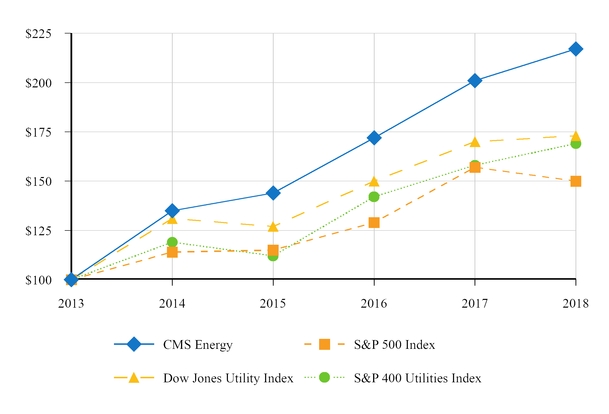
|
Five-Year Cumulative Total Return
|
||||||||||||||||||||||||
|
Company/Index
|
2013
|
2014
|
2015
|
2016
|
2017
|
2018
|
||||||||||||||||||
|
CMS Energy
|
$
|
100
|
|
$
|
135
|
|
$
|
144
|
|
$
|
172
|
|
$
|
201
|
|
$
|
217
|
|
||||||
|
S&P 500 Index
|
100
|
|
114
|
|
115
|
|
129
|
|
157
|
|
150
|
|
||||||||||||
|
Dow Jones Utility Index
|
100
|
|
131
|
|
127
|
|
150
|
|
170
|
|
173
|
|
||||||||||||
|
S&P 400 Utilities Index
|
100
|
|
119
|
|
112
|
|
142
|
|
158
|
|
169
|
|
||||||||||||
These cumulative total returns assume reinvestments of dividends.
Consumers
Consumers’ common stock is privately held by its parent, CMS Energy, and does not trade in the public market.
48
Issuer Repurchases of Equity Securities
Presented in the following table are CMS Energy’s repurchases of equity securities for the three months ended
December 31, 2018
:
|
Period
|
Total Number
of Shares
Purchased
1
|
Average
Price Paid
per Share
|
Total Number of
Shares Purchased as
Part of Publicly
Announced Plans or
Programs
|
Maximum Number of
Shares That May Yet Be
Purchased Under
Publicly Announced
Plans or Programs
|
||||||||||
|
October 1, 2018 to
|
||||||||||||||
|
October 31, 2018
|
816
|
|
$
|
49.21
|
|
—
|
|
—
|
|
|||||
|
November 1, 2018 to
|
||||||||||||||
|
November 30, 2018
|
62
|
|
52.09
|
|
—
|
|
—
|
|
||||||
|
December 1, 2018 to
|
||||||||||||||
|
December 31, 2018
|
87
|
|
51.17
|
|
—
|
|
—
|
|
||||||
|
Total
|
965
|
|
$
|
49.57
|
|
—
|
|
—
|
|
|||||
|
1
|
All of the common shares were repurchased to satisfy the minimum statutory income tax withholding obligation for common shares that have vested under the PISP. The value of shares repurchased is based on the market price on the vesting date.
|
Unregistered Sales of Equity Securities
None.
49
Item 6.
Selected Financial Data
CMS Energy Corporation
|
2018
|
|
2017
|
|
2016
|
|
2015
|
|
2014
|
|
|||||
|
Operating revenue (in millions)
|
($)
|
6,873
|
|
6,583
|
|
6,399
|
|
6,456
|
|
7,179
|
|
|||
|
Income from equity method investees (in millions)
|
($)
|
9
|
|
15
|
|
13
|
|
14
|
|
15
|
|
|||
|
Net income (in millions)
1
|
($)
|
659
|
|
462
|
|
553
|
|
525
|
|
479
|
|
|||
|
Net income available to common stockholders (in millions)
|
($)
|
657
|
|
460
|
|
551
|
|
523
|
|
477
|
|
|||
|
Average common shares outstanding (in thousands)
|
282,171
|
|
280,025
|
|
277,851
|
|
275,600
|
|
270,580
|
|
||||
|
Earnings per average common share
|
||||||||||||||
|
CMS Energy
|
—
|
Basic
|
($)
|
2.33
|
|
1.64
|
|
1.99
|
|
1.90
|
|
1.76
|
|
|
|
—
|
Diluted
|
($)
|
2.32
|
|
1.64
|
|
1.98
|
|
1.89
|
|
1.74
|
|
||
|
Cash provided by operations (in millions)
|
($)
|
1,703
|
|
1,705
|
|
1,629
|
|
1,640
|
|
1,481
|
|
|||
|
Capital expenditures, excluding assets placed under capital lease (in millions)
|
($)
|
2,074
|
|
1,665
|
|
1,672
|
|
1,564
|
|
1,577
|
|
|||
|
Total assets (in millions)
|
($)
|
24,529
|
|
23,050
|
|
21,622
|
|
20,299
|
|
19,143
|
|
|||
|
Long-term debt, excluding current portion (in millions)
|
($)
|
10,615
|
|
9,123
|
|
8,640
|
|
8,400
|
|
7,974
|
|
|||
|
Non-current portion of capital leases and financing obligation (in millions)
|
($)
|
69
|
|
91
|
|
110
|
|
118
|
|
123
|
|
|||
|
Cash dividends declared per common share
|
($)
|
1.43
|
|
1.33
|
|
1.24
|
|
1.16
|
|
1.08
|
|
|||
|
Market price of common stock at year-end
|
($)
|
49.65
|
|
47.30
|
|
41.62
|
|
36.08
|
|
34.75
|
|
|||
|
Book value per common share at year-end
|
($)
|
16.78
|
|
15.77
|
|
15.23
|
|
14.21
|
|
13.33
|
|
|||
|
Total employees at year-end
|
8,625
|
|
7,952
|
|
7,800
|
|
7,804
|
|
7,747
|
|
||||
|
Electric Utility Statistics
|
||||||||||||||
|
Sales (billions of kWh)
|
38
|
|
37
|
|
38
|
|
37
|
|
38
|
|
||||
|
Customers (in thousands)
|
1,831
|
|
1,826
|
|
1,805
|
|
1,803
|
|
1,793
|
|
||||
|
Average sales rate per kWh
|
(¢)
|
11.78
|
|
11.98
|
|
11.63
|
|
11.39
|
|
12.04
|
|
|||
|
Gas Utility Statistics
|
||||||||||||||
|
Sales and transportation deliveries (bcf)
|
386
|
|
352
|
|
358
|
|
356
|
|
373
|
|
||||
|
Customers (in thousands)
2
|
1,784
|
|
1,776
|
|
1,772
|
|
1,741
|
|
1,733
|
|
||||
|
Average sales rate per mcf
|
($)
|
7.44
|
|
7.51
|
|
7.31
|
|
7.89
|
|
8.83
|
|
|||
|
1
|
Includes income attributable to noncontrolling interests of $2 million in each period.
|
|
2
|
Excludes off-system transportation customers.
|
50
Consumers Energy Company
|
2018
|
|
2017
|
|
2016
|
|
2015
|
|
2014
|
|
|||
|
Operating revenue (in millions)
|
($)
|
6,464
|
|
6,222
|
|
6,064
|
|
6,165
|
|
6,800
|
|
|
|
Net income (in millions)
|
($)
|
705
|
|
632
|
|
616
|
|
594
|
|
567
|
|
|
|
Net income available to common stockholder (in millions)
|
($)
|
703
|
|
630
|
|
614
|
|
592
|
|
565
|
|
|
|
Cash provided by operations (in millions)
|
($)
|
1,449
|
|
1,715
|
|
1,681
|
|
1,794
|
|
1,354
|
|
|
|
Capital expenditures, excluding assets placed under capital lease (in millions)
|
($)
|
1,822
|
|
1,632
|
|
1,656
|
|
1,537
|
|
1,573
|
|
|
|
Total assets (in millions)
|
($)
|
22,025
|
|
21,099
|
|
19,946
|
|
18,635
|
|
17,824
|
|
|
|
Long-term debt, excluding current portion (in millions)
|
($)
|
6,779
|
|
5,561
|
|
5,253
|
|
5,183
|
|
5,131
|
|
|
|
Non-current portion of capital leases and financing obligation (in millions)
|
($)
|
69
|
|
91
|
|
110
|
|
118
|
|
123
|
|
|
|
Total preferred stock (in millions)
|
($)
|
37
|
|
37
|
|
37
|
|
37
|
|
37
|
|
|
|
Number of preferred stockholders at year-end
|
1,017
|
|
1,056
|
|
1,095
|
|
1,156
|
|
1,191
|
|
||
|
Total employees at year-end
|
8,121
|
|
7,496
|
|
7,366
|
|
7,394
|
|
7,388
|
|
||
|
Electric Utility Statistics
|
||||||||||||
|
Sales (billions of kWh)
|
38
|
|
37
|
|
38
|
|
37
|
|
38
|
|
||
|
Customers (in thousands)
|
1,831
|
|
1,826
|
|
1,805
|
|
1,803
|
|
1,793
|
|
||
|
Average sales rate per kWh
|
(¢)
|
11.78
|
|
11.98
|
|
11.63
|
|
11.39
|
|
12.04
|
|
|
|
Gas Utility Statistics
|
||||||||||||
|
Sales and transportation deliveries (bcf)
|
386
|
|
352
|
|
358
|
|
356
|
|
373
|
|
||
|
Customers (in thousands)
1
|
1,784
|
|
1,776
|
|
1,772
|
|
1,741
|
|
1,733
|
|
||
|
Average sales rate per mcf
|
($)
|
7.44
|
|
7.51
|
|
7.31
|
|
7.89
|
|
8.83
|
|
|
|
1
|
Excludes off-system transportation customers.
|
51
Item 7.
Management’s Discussion and Analysis of Financial Condition and Results of Operations
This Management’s Discussion and Analysis of Financial Condition and Results of Operations is a combined report of CMS Energy and Consumers.
Executive Overview
CMS Energy is an energy company operating primarily in Michigan.
It is the parent holding company of several subsidiaries, including Consumers, an electric and gas utility, and CMS Enterprises, primarily a domestic independent power producer and marketer.
Consumers’ electric utility operations include
the generation, purchase, transmission, distribution, and sale of electricity
, and Consumers’ gas utility operations include
the purchase, transmission, storage, distribution, and sale of natural gas
. Consumers’ customer base consists of a mix of residential, commercial, and diversified industrial customers.
CMS Enterprises, through its subsidiaries and equity investments,
is engaged
in domestic independent power production, including the development and operation of renewable generation, and the marketing of independent power production
.
CMS Energy and Consumers manage their businesses by the nature of services each provides. CMS Energy
operates principally in three business segments: electric utility; gas utility; and enterprises, its non‑utility operations and investments.
Consumers operates principally in two business segments: electric utility and gas utility. CMS Energy’s and Consumers’ businesses are affected primarily by:
|
•
|
regulation and regulatory matters
|
|
•
|
state and federal legislation
|
|
•
|
economic conditions
|
|
•
|
weather
|
|
•
|
energy commodity prices
|
|
•
|
interest rates
|
|
•
|
their securities’ credit ratings
|
The Triple Bottom Line
CMS Energy’s and Consumers’ purpose is to achieve world class performance while delivering hometown service. In support of this purpose, the companies employ the “Consumers Energy Way,” a lean operating model designed to improve safety, quality, cost, delivery, and employee morale.
CMS Energy and Consumers measure their progress toward the purpose by considering their impact on the “triple bottom line” of people, planet, and profit, which is underpinned by performance; this consideration takes into account not only the economic value that the companies create for customers and investors, but also their responsibility to social and environmental goals. The triple bottom line balances the interests of the companies’ employees, customers, suppliers, regulators, creditors, Michigan’s residents, the investment community, and other stakeholders, and it reflects the broader societal impacts of the companies’ activities.

52
Consumers’ Sustainability Report, which is available to the public, describes the company’s progress toward world class performance measured in the areas of people, planet, and profit.
People:
The people element of the triple bottom line represents CMS Energy’s and Consumers’ commitment to their employees, their customers, the residents of local communities in which the companies do business, and other stakeholders.
The safety of employees, customers, and the general public is a priority of CMS Energy and Consumers. Accordingly, CMS Energy and Consumers have worked to integrate a set of safety principles into their business operations and culture. These principles include complying with applicable safety, health, and security regulations and implementing programs and processes aimed at continually improving safety and security conditions. Presented in the following illustration are Consumers’ OSHA recordable incident rates over the last ten years:

CMS Energy and Consumers also place a high priority on customer value and on providing a hometown customer experience. Consumers’ customer-driven investment program is aimed at improving safety and increasing electric and gas reliability, which has resulted in measurable improvements in customer satisfaction.
Central to Consumers’ commitment to its customers are the initiatives it has undertaken to keep electricity and natural gas affordable, including:
|
•
|
replacement of coal-fueled generation with cleaner and more efficient natural gas-fueled generation, renewable energy, and energy waste reduction and demand response programs
|
|
•
|
targeted infrastructure investment, including the installation of smart meters
|
|
•
|
information and control system efficiencies
|
|
•
|
employee and retiree health care cost sharing
|
|
•
|
workforce productivity enhancements
|
53
In addition, Consumers’ gas commodity costs declined by 60 percent from 2008 through 2018, due not only to a decrease in market prices but also to Consumers’ improvements to its gas infrastructure and optimization of its gas purchasing and storage strategy. These gas commodity savings are passed on to customers.
Planet:
The planet element of the triple bottom line represents CMS Energy’s and Consumers’ commitment to protect the environment; this commitment extends beyond complying with the various state and federal environmental and health and safety laws and regulations to which CMS Energy and Consumers are subject. Management considers climate change risk and other environmental risks in the companies’ strategy development, business planning, and enterprise risk management processes. In November 2018, CMS Energy published a climate assessment report of the long-term impacts on the company’s portfolio, of public policies and technological advances that are consistent with limiting global warming to no more than two degrees Celsius over pre-industrial levels.
CMS Energy and Consumers continue to focus on opportunities to protect the environment and to reduce their carbon footprint. As a result of actions already taken by CMS Energy and Consumers, including the retirement of
seven
of Consumers’ coal-fueled electric generating units
in 2016
, the companies have decreased their combined percentage of electric supply (self-generated and purchased) from coal by 18 percentage points since 2015. Presented in the following illustration are CMS Energy’s, including Consumers’, sources of electric supply in 2018:
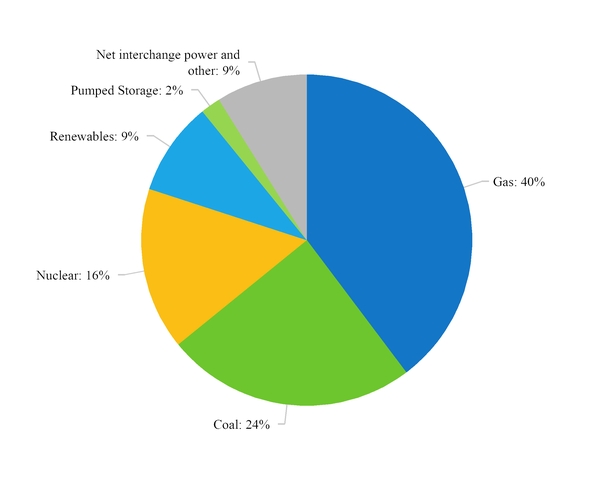
54
The companies have also:
|
•
|
reduced carbon dioxide emissions by over 35 percent since 2005
|
|
•
|
reduced the amount of water used to generate electricity by over 35 percent since 2012
|
|
•
|
reduced landfill waste disposal by over one million cubic yards since 1992
|
Additionally, over the last 20 years, Consumers has reduced its sulfur dioxide, nitrogen oxide, particulate matter, and mercury emissions by 90 percent.
The 2016 Energy Law:
|
•
|
raised the renewable energy standard from the present ten-percent requirement to
12.5 percent in 2019
and
15 percent in 2021
|
|
•
|
established a goal of 35 percent combined renewable energy and energy waste reduction by 2025
|
|
•
|
authorized incentives for demand response programs and expanded existing incentives for energy efficiency programs, referring to the combined initiatives as energy waste reduction programs
|
|
•
|
established an integrated planning process for new generation resources
|
Consumers filed an IRP with the MPSC in June 2018,
detailing its long-term strategy for delivering reliable and affordable energy to its customers through the increased use of energy efficiency and customer demand management programs and additional renewable energy.
In its IRP, Consumers details how it will meet the requirements of the 2016 Energy Law using its clean and lean strategy, which focuses on increasing the generation of renewable energy, helping customers use less energy, and offering demand response programs to reduce demand during critical peak times. Further, Consumers details its plans to replace all of its coal-fueled generation with investment in renewable energy, proposing renewable energy levels of 25 percent by 2025, over 35 percent by 2030, and over 40 percent by 2040. The attainment of these renewable energy levels will enable Consumers to meet and exceed the 2016 Energy Law renewable energy requirements and fulfill increasing customer demand for renewable energy. The IRP supports the following clean energy goals, which Consumers announced during 2018:
|
•
|
a
breakthrough goal to reduce carbon emissions by 80 percent and to eliminate the use of coal to generate electricity by 2040
|
|
•
|
a target of at least 50 percent combined renewable energy and energy waste reduction by 2030
|
Additionally, in an effort to advance its environmental stewardship in Michigan and to minimize the impact of future regulations, Consumers announced these five-year targets during 2018:
|
•
|
to reduce its water use by one billion gallons; in 2018, Consumers reduced its water usage by 180 million gallons
|
|
•
|
to reduce the amount of waste taken to landfills by 35 percent; in 2018, Consumers reduced its waste to landfills by 12 percent
|
|
•
|
to enhance, restore, or protect 5,000 acres of land; in 2018, Consumers enhanced, restored, or protected nearly 800 acres of land
|
CMS Energy, through its non‑utility businesses, continues to pursue further opportunities for the development of renewable generation projects. In 2018, CMS Enterprises
completed the development and construction of two solar generation projects
totaling 24 MW in
Michigan; energy produced by these projects is sold under 25‑year PPAs to the Lansing Board of Water and Light, a non‑affiliated utility.
CMS Enterprises also
purchased a 105-MW wind generation project in northwest Ohio, and the project became operational in September 2018. Renewable energy produced by the wind generation project has been committed to General Motors LLC, a non‑affiliated company, under a 15-year PPA.
55
CMS Energy and Consumers are monitoring numerous legislative, policy, and regulatory initiatives, including those to regulate greenhouse gases, and related litigation. While CMS Energy and Consumers cannot predict the outcome of these matters, which could have a material effect on the companies, they intend to continue to move forward with their clean and lean strategy.
Profit:
The profit element of the triple bottom line represents CMS Energy’s and Consumers’ commitment to meeting financial objectives and providing economic development opportunities and benefits in the communities in which they do business. CMS Energy’s and Consumers’ financial strength allows them to maintain solid investment-grade credit ratings and thereby reduce funding costs for the benefit of customers and investors, to preserve and create jobs, and to reinvest in the communities they serve.
In
2018
, CMS Energy’s
net income available to common stockholders
was
$657 million
, and diluted EPS were
$2.32
. This compares with
net income available to common stockholders
of
$460 million
and diluted EPS of
$1.64
in
2017
. In
2018
, rate increases, higher sales, and the absence of the impacts of the TCJA were offset partially by higher depreciation and maintenance and other operating expenses. A more detailed discussion of the factors affecting CMS Energy’s and Consumers’ performance can be found in the
Results of Operations
section that follows this
Executive Overview
.
Consumers projects that its electric weather-normalized deliveries will
remain stable
and gas weather-normalized deliveries will
increase slightly
through 2023. This outlook reflects
growth in electric demand offset by the effects of energy waste reduction programs
, and
growth in gas demand offset partially by
energy efficiency and conservation
.
Performance: Impacting the Triple Bottom Line
CMS Energy and Consumers remain committed to achieving world class performance while delivering hometown service. Leveraging the Consumers Energy Way, CMS Energy and Consumers accomplished the following during 2018:
|
•
|
achieved record-breaking performance in the area of on-time delivery commitments
|
|
•
|
attracted 101 MW of new or expanding load in Consumers’ service territory
|
|
•
|
announced clean energy goals and filed an IRP in support of those goals
|
|
•
|
expanded CMS Enterprises’ renewable portfolio
|
|
•
|
enhanced or restored nearly 800 acres of land in Michigan
|
|
•
|
finished first overall across the electric utility sector in cyber security testing
|
CMS Energy and Consumers will continue to utilize the Consumers Energy Way to enable them to achieve world class performance and positively impact the triple bottom line. Consumers’ investment plan and the regulatory environment in which it operates also drive its ability to impact the triple bottom line.
Investment Plan:
Consumers expects to make significant expenditures on infrastructure upgrades and replacements and electric supply projects from 2019 through 2028. While it has a large number of potential investment opportunities that would add customer value, Consumers has prioritized its spending based on the criteria of enhancing public safety, increasing reliability, maintaining affordability for its customers, and advancing its environmental stewardship. Consumers’ investment program is expected to result in annual rate-base growth of six to eight percent. This rate-base growth, together with cost-control initiatives, should allow Consumers to maintain affordable customer prices.
56
Presented in the following illustration are planned capital expenditures of
$11.2 billion
that Consumers expects to make from 2019 through 2023:

Consumers plans to spend $9.3 billion over the next five years to maintain and upgrade its gas infrastructure and electric distribution systems in order to enhance safety and reliability, improve customer satisfaction, and reduce energy waste on those systems. The gas infrastructure projects comprise $5.1 billion to sustain deliverability and enhance pipeline integrity and safety. These projects, which involve replacement of mains and services and enhancement of transmission and storage systems, should reduce the minor quantity of methane emissions released as gas is transported. The electric distribution projects comprise $4.2 billion to strengthen circuits and substations and replace poles. Consumers also expects to spend $1.9 billion on electric supply projects, representing new generation, including renewable generation, and environmental investments needed to comply with state and federal laws and regulations.
57
Regulation:
Regulatory matters are a key aspect of Consumers’ business, particularly rate cases and regulatory proceedings before the MPSC, which permit recovery of new investments while helping to ensure that customer rates are fair and affordable. Important regulatory events and developments not already discussed are summarized below.
|
•
|
2017 Electric Rate Case:
In March 2017, Consumers filed an application with the MPSC seeking an annual rate increase of
$173 million
, based on a
10.5 percent
authorized return on equity. The filing requested authority to recover new investment in system reliability, environmental compliance, and technology enhancements. In September 2017, Consumers reduced its requested annual rate increase to
$148 million
.
The MPSC issued an order in March 2018, authorizing an annual rate increase of
$66 million
, based on a
10.0 percent
authorized return on equity. In June 2018, as a result of a petition for rehearing filed by Consumers, the MPSC issued an order adjusting the authorized annual rate increase to
$72 million
by allowing recovery of additional retirement benefit plan costs.
|
|
•
|
2018 Electric Rate Case:
In May 2018, Consumers filed an application with the MPSC seeking an annual rate increase of
$58 million
, based on a
10.75 percent
authorized return on equity. In October 2018, Consumers reduced its requested annual rate increase to
$44 million
. The filing requested authority to recover new investment in system reliability, environmental compliance, and technology enhancements. In January 2019, the MPSC approved a settlement agreement authorizing an annual rate decrease of
$24 million
, based on a
10.0 percent
authorized return of equity. With the elimination of the
$113 million
TCJA credit to customer bills, the approved settlement agreement results in an
$89 million
increase in annual rates. In lieu of the investment recovery mechanism requested by Consumers, the settlement agreement provides for deferred accounting treatment for distribution-related capital investments exceeding certain amounts. Consumers also agreed to not file a new electric rate case prior to January 2020.
|
|
•
|
2017 Gas Rate Case:
In October 2017, Consumers filed an application with the MPSC seeking an annual rate increase of
$178 million
, based on a
10.5 percent
authorized return on equity. In March 2018, Consumers reduced its requested revenue requirement to
$145 million
, before taking into consideration any impact of the TCJA. Consumers further reduced its requested revenue requirement to
$83 million
to reflect the impact of the TCJA, offset partially by an increase in the authorized return of equity to
10.75 percent
to compensate for the anticipated negative effects of tax reform on Consumers’ cash flows from operating activities.
In August 2018, the MPSC approved a settlement agreement authorizing an annual rate increase of
$11 million
, based on a
10.0 percent
authorized return on equity. With the elimination of the
$49 million
TCJA credit to customer bills, the approved settlement agreement results in a
$60 million
increase in annual rates.
|
The MPSC also approved two rate adjustment mechanisms: a revenue decoupling mechanism and an investment recovery mechanism. The revenue decoupling mechanism will annually reconcile Consumers’ actual weather-normalized non‑fuel revenues with the revenues approved by the MPSC. The investment recovery mechanism will provide for an additional annual rate increase of
$9 million
beginning in July 2019 and another
$10 million
beginning in July 2020 for incremental investments that Consumers plans to make in those years, subject to reconciliation. The investment recovery surcharge will remain in effect until rates are reset in a subsequent general rate case.
|
•
|
2018 Gas Rate Case:
In November 2018, Consumers filed an application with the MPSC seeking an annual rate increase of $229 million, based on a 10.75 percent authorized return on equity.
The filing also seeks approval of two rate adjustment mechanisms: a revenue decoupling mechanism and an investment recovery mechanism. The revenue decoupling mechanism would
|
58
annually reconcile Consumers’ actual weather-normalized non-fuel revenues with the revenues approved by the MPSC.
The investment recovery mechanism would provide for additional annual rate increases of $11 million beginning in October 2020 and another $11 million beginning in October 2021 for incremental investments that Consumers plans to make in those years, subject to reconciliation. These future investments are intended to help ensure adequate system capacity and deliverability.
The MPSC previously approved an investment recovery mechanism in August 2018; that mechanism will remain in effect until rates are changed in this proceeding.
|
•
|
Tax Cuts and Jobs Act:
The TCJA, which changed existing federal tax law and included numerous provisions that affect businesses, was signed into law in December 2017.
In early 2018, the MPSC ordered Consumers to file various proceedings to determine the reduction in its electric and gas revenue requirements as a result of the reduction in the corporate income tax rate, and to implement bill credits to reflect that reduction until customer rates could be adjusted through Consumers’ general rate cases. Consumers filed, and the MPSC approved, such proceedings throughout 2018, resulting in credits to customer bills during 2018 to reflect reductions in Consumers’ electric and gas revenue requirements. Additionally, Consumers filed an application to address the December 31, 2017 remeasurement of its deferred income taxes and other base rate impacts of the TCJA on customers. For details on these proceedings, see
Item 8. Financial Statements and Supplementary Data—Notes to the Consolidated Financial Statements—
Note 3, Regulatory Matters
.
|
Looking Forward
CMS Energy and Consumers will continue to consider the impact on the triple bottom line of people, planet, and profit in their daily operations as well as in their long-term strategic decisions. Consumers will continue to seek fair and timely regulatory treatment that will support its customer-driven investment plan, while pursuing cost-control initiatives that will allow it to maintain sustainable customer base rates. The Consumers Energy Way is an important means of realizing CMS Energy’s and Consumers’ purpose of achieving world class performance while delivering hometown service.
59
Results of Operations
CMS Energy Consolidated Results of Operations
|
In Millions, Except Per Share Amounts
|
||||||||||||
|
Years Ended December 31
|
2018
|
2017
|
2016
|
|||||||||
|
Net Income Available to Common Stockholders
|
$
|
657
|
|
$
|
460
|
|
$
|
551
|
|
|||
|
Basic Earnings Per Average Common Share
|
$
|
2.33
|
|
$
|
1.64
|
|
$
|
1.99
|
|
|||
|
Diluted Earnings Per Average Common Share
|
$
|
2.32
|
|
$
|
1.64
|
|
$
|
1.98
|
|
|||
|
In Millions
|
||||||||||||||||||||||||
|
Years Ended December 31
|
2018
|
2017
|
Change
|
2017
|
2016
|
Change
|
||||||||||||||||||
|
Electric utility
|
$
|
535
|
|
$
|
455
|
|
$
|
80
|
|
$
|
455
|
|
$
|
458
|
|
$
|
(3
|
)
|
||||||
|
Gas utility
|
169
|
|
173
|
|
(4
|
)
|
173
|
|
155
|
|
18
|
|
||||||||||||
|
Enterprises
|
34
|
|
(27
|
)
|
61
|
|
(27
|
)
|
17
|
|
(44
|
)
|
||||||||||||
|
Corporate interest and other
|
(81
|
)
|
(141
|
)
|
60
|
|
(141
|
)
|
(79
|
)
|
(62
|
)
|
||||||||||||
|
Net Income Available to Common Stockholders
|
$
|
657
|
|
$
|
460
|
|
$
|
197
|
|
$
|
460
|
|
$
|
551
|
|
$
|
(91
|
)
|
||||||
60
Presented in the following table are specific after-tax changes to net income available to common stockholders for
2018
versus
2017
:
|
In Millions
|
||||||||
|
Year Ended December 31, 2017
|
$
|
460
|
|
|||||
|
Reasons for the change
|
||||||||
|
Consumers electric utility and gas utility
|
||||||||
|
Electric sales
|
$
|
43
|
|
|||||
|
Gas sales
|
20
|
|
||||||
|
Electric rate increase
|
42
|
|
||||||
|
Gas rate increase
|
36
|
|
||||||
|
OPEB Plan changes
|
41
|
|
||||||
|
Deferred income tax adjustments due to the TCJA, primarily the absence of the 2017 adjustment
1
|
32
|
|
||||||
|
Depreciation and amortization
|
(32
|
)
|
||||||
|
Increased distribution, transmission, and customer operations expenses
|
(30
|
)
|
||||||
|
Absence of state income tax benefit in 2017
|
(16
|
)
|
||||||
|
Other, including absence of 2017 intercompany gain of $9 million
|
(60
|
)
|
$
|
76
|
|
|||
|
Enterprises
|
||||||||
|
Deferred income tax adjustments due to the TCJA, primarily the absence of the 2017 adjustment
1
|
62
|
|
||||||
|
Reduction of corporate income tax rate due to the impacts of the TCJA
|
6
|
|
||||||
|
Higher expenses from legacy obligations, net
|
(4
|
)
|
||||||
|
Lower earnings from operations and equity method investees
|
(3
|
)
|
61
|
|
||||
|
Corporate interest and other
|
||||||||
|
Deferred income tax adjustments due to the TCJA, primarily the absence of the 2017 adjustment
1
|
58
|
|
||||||
|
2017 Elimination of an intercompany gain on the donation of CMS Energy stock
2
|
9
|
|
||||||
|
Lower fixed charges and administrative and other expenses
|
2
|
|
||||||
|
Lower tax benefit due to the impacts of the TCJA
|
(9
|
)
|
60
|
|
||||
|
Year Ended December 31, 2018
|
$
|
657
|
|
|||||
|
1
|
See
Note 14, Income Taxes
.
|
|
2
|
Gain at segment is eliminated on CMS Energy’s consolidated statements of income.
|
61
Presented in the following table are specific after-tax changes to net income available to common stockholders for
2016
versus
2017
:
|
In Millions
|
||||||||
|
Year Ended December 31, 2016
|
$
|
551
|
|
|||||
|
Reasons for the change
|
||||||||
|
Consumers electric utility and gas utility
|
||||||||
|
Electric sales
|
$
|
(15
|
)
|
|||||
|
Gas sales
|
14
|
|
||||||
|
Electric rate increase
|
50
|
|
||||||
|
Gas rate increase
|
16
|
|
||||||
|
State income tax benefit in 2017
|
15
|
|
||||||
|
Retirement of coal-fueled power plants in 2016
|
12
|
|
||||||
|
Voluntary separation program costs in 2016
|
7
|
|
||||||
|
Employee benefit costs
|
1
|
|
||||||
|
Depreciation and amortization
|
(42
|
)
|
||||||
|
Deferred income tax adjustment due to the TCJA
1
|
(34
|
)
|
||||||
|
Donations
|
(8
|
)
|
||||||
|
Other
|
(1
|
)
|
$
|
15
|
|
|||
|
Enterprises
|
||||||||
|
Deferred income tax adjustment due to the TCJA
1
|
(57
|
)
|
||||||
|
Higher prices for capacity and demand revenue from DIG
|
13
|
|
(44
|
)
|
||||
|
Corporate interest and other
|
||||||||
|
Deferred income tax adjustment due to the TCJA
1
|
(57
|
)
|
||||||
|
Elimination of an intercompany gain on the donation of CMS Energy stock
2
|
(9
|
)
|
||||||
|
2016 Settlement with Michigan Department of Treasury
|
(5
|
)
|
||||||
|
Higher earnings at EnerBank
|
3
|
|
||||||
|
Lower fixed charges and administrative and other expenses
|
6
|
|
(62
|
)
|
||||
|
Year Ended December 31, 2017
|
$
|
460
|
|
|||||
|
1
|
See
Note 14, Income Taxes
.
|
|
2
|
Gain at segment is eliminated on CMS Energy’s consolidated statements of income.
|
62
Consumers Electric Utility Results of Operations
For the year ended
December 31, 2018
, Consumers electric utility’s
net income available to common stockholders
was
$535 million
. This compares with
net income available to common stockholders
of
$455 million
for the year ended
December 31, 2017
. In 2018, higher net income was due primarily to a rate increase and higher sales as a result of favorable weather. These increases were offset partially by higher maintenance and other operating expenses and higher depreciation on increased plant in service.
Consumers incurred higher maintenance and other operating expenses due to the execution of additional work in 2018.
Lower tax expense in 2018 resulting from the TCJA was offset fully by a reduction in revenue to reflect the pass-through of TCJA-related benefits to customers. Presented in the following table are the detailed changes to the electric utility’s
net income available to common stockholders
for
2018
versus
2017
:
63
|
In Millions
|
||||||||
|
Year Ended December 31, 2017
|
$
|
455
|
|
|||||
|
Reasons for the change
|
||||||||
|
Electric deliveries
1
and rate increases
|
||||||||
|
Rate increase, including the impacts of the March 2018 order
|
$
|
63
|
|
|||||
|
Higher sales due primarily to favorable weather in 2018
|
59
|
|
||||||
|
Higher energy waste reduction program revenues
|
33
|
|
||||||
|
Increase in other revenues
|
4
|
|
$
|
159
|
|
|||
|
Revenue reserve and lower rates related to the TCJA
2
|
(143
|
)
|
||||||
|
Maintenance and other operating expenses
|
||||||||
|
Higher energy waste reduction program costs
|
(33
|
)
|
||||||
|
Increased distribution, transmission, and customer operations expenses
|
(22
|
)
|
||||||
|
Increase in generation operating expenses
|
(17
|
)
|
||||||
|
Higher service restoration costs
|
(4
|
)
|
||||||
|
Higher other maintenance and operating expenses
|
(4
|
)
|
(80
|
)
|
||||
|
Depreciation and amortization
|
||||||||
|
Increased plant in service, reflecting higher capital spending
|
(28
|
)
|
||||||
|
General taxes
|
||||||||
|
Settlement of a property tax appeal related to the Campbell plant in 2018
|
9
|
|
||||||
|
Settlement of a property tax appeal related to the Zeeland plant in 2017
|
(10
|
)
|
||||||
|
Higher property tax, reflecting higher capital spending
|
(3
|
)
|
||||||
|
Higher other general taxes
|
(3
|
)
|
(7
|
)
|
||||
|
Other income, net of expenses
|
||||||||
|
Impact of OPEB Plan changes approved in November 2017
|
35
|
|
||||||
|
Lower donations
|
33
|
|
||||||
|
2017 Gain on the donation of CMS Energy stock
3
|
(9
|
)
|
||||||
|
Lower other income, net of expenses
|
(7
|
)
|
52
|
|
||||
|
Interest charges – Due primarily to higher average borrowings
|
(9
|
)
|
||||||
|
Impacts of the TCJA on income taxes
|
||||||||
|
Reduction of the corporate income tax rate
|
109
|
|
||||||
|
Deferred income tax adjustments, primarily the absence of the 2017 adjustment
4
|
24
|
|
133
|
|
||||
|
Other changes in income taxes
|
||||||||
|
Lower electric utility pre-tax earnings
|
18
|
|
||||||
|
Research and development tax credits, net
4
|
9
|
|
||||||
|
Absence of 2017 state income tax benefit
4
|
(11
|
)
|
||||||
|
Absence of 2017 tax benefit associated with deductible lobbying expenses
|
(6
|
)
|
||||||
|
Higher other income taxes
|
(7
|
)
|
3
|
|
||||
|
Year Ended December 31, 2018
|
$
|
535
|
|
|||||
|
1
|
Deliveries to end-use customers were 38.2 billion kWh in
2018
and 37.4 billion kWh in
2017
.
|
|
2
|
See
Note 3, Regulatory Matters
.
|
|
3
|
Gain at segment is eliminated on CMS Energy’s consolidated statements of income.
|
|
4
|
See
Note 14, Income Taxes
.
|
For the year ended
December 31, 2017
, Consumers electric utility’s
net income available to common stockholders
was
$455 million
. This compares with
net income available to common stockholders
of
$458 million
for the year ended
December 31, 2016
. In 2017, rate increases were offset fully by lower
64
sales due primarily to mild weather and higher depreciation on increased plant in service. In addition, reductions in state and other income taxes were offset primarily by the recognition of the impacts of the TCJA. Presented in the following table are the detailed changes to the electric utility’s
net income available to common stockholders
for
2017
versus
2016
:
|
In Millions
|
||||||||
|
Year Ended December 31, 2016
|
$
|
458
|
|
|||||
|
Reasons for the change
|
||||||||
|
Electric deliveries
1
and rate increases
|
||||||||
|
Rate increase, including the impacts of the March 2017 order and the October 2017 self-implemented rate increase
|
$
|
82
|
|
|||||
|
Higher energy waste reduction program revenues and financial incentives
|
23
|
|
||||||
|
Lower sales and other revenue, due primarily to mild weather in 2017
|
(50
|
)
|
$
|
55
|
|
|||
|
Power supply costs and related revenue
|
3
|
|
||||||
|
Maintenance and other operating expenses
|
||||||||
|
Higher service restoration costs following severe storms
|
(15
|
)
|
||||||
|
Higher energy waste reduction program costs
|
(13
|
)
|
||||||
|
Higher information technology and other operating and maintenance expenses
|
(11
|
)
|
||||||
|
Higher demand response program costs
|
(6
|
)
|
||||||
|
Absence of a 2016 Michigan use tax settlement benefit
|
(4
|
)
|
||||||
|
Lower coal-fueled electric generating plant costs due to retirement of plants in 2016
|
19
|
|
||||||
|
Lower postretirement benefit costs
|
10
|
|
||||||
|
Lower meter reading expense, reflecting the implementation of smart meters
|
7
|
|
||||||
|
Absence of a 2016 voluntary separation program
|
6
|
|
(7
|
)
|
||||
|
Depreciation and amortization
|
||||||||
|
Increased plant in service, reflecting higher capital spending
|
(51
|
)
|
||||||
|
General taxes
|
||||||||
|
Settlement of property tax appeal related to the Zeeland plant in 2017
|
10
|
|
||||||
|
Higher property taxes, reflecting higher capital spending
|
(4
|
)
|
6
|
|
||||
|
Other income, net of expenses
|
||||||||
|
Reduction in nonoperating retirement benefits credits
|
(15
|
)
|
||||||
|
Higher donations
|
(10
|
)
|
||||||
|
2017 Gain on the donation of CMS Energy stock
2
|
9
|
|
||||||
|
Retirement benefit plan changes
|
6
|
|
||||||
|
Higher other income, net of expenses
|
6
|
|
(4
|
)
|
||||
|
Interest charges
|
||||||||
|
Higher PSCR interest expense and other interest charges
|
(6
|
)
|
(6
|
)
|
||||
|
Income taxes
|
||||||||
|
Reduction in effective state income tax rate
3
|
11
|
|
||||||
|
Lower non‑deductible donations
|
10
|
|
||||||
|
Lower electric utility earnings and other income taxes
|
5
|
|
||||||
|
Deferred income tax adjustment due to the TCJA
3
|
(25
|
)
|
1
|
|
||||
|
Year Ended December 31, 2017
|
$
|
455
|
|
|||||
|
1
|
Deliveries to end-use customers were 37.4 billion kWh in
2017
and 37.9 billion kWh in
2016
.
|
|
2
|
Gain at segment is eliminated on CMS Energy’s consolidated statements of income.
|
|
3
|
See
Note 14, Income Taxes
.
|
65
Consumers Gas Utility Results of Operations
For the year ended
December 31, 2018
, Consumers gas utility’s
net income available to common stockholders
was
$169 million
. This compares with
net income available to common stockholders
of
$173 million
for the year ended
December 31, 2017
. In 2018, lower net income was due primarily to higher maintenance and other operating expenses and depreciation on increased plant in service. These decreases were offset partially by a rate increase and higher sales as a result of favorable weather.
Consumers incurred higher maintenance and other operating expenses due to the execution of additional work in 2018.
Lower tax expense in 2018 resulting from the TCJA was offset fully by a reduction in revenue to reflect the pass-through of TCJA-related benefits to customers. Presented in the following table are the detailed changes to the gas utility’s
net income available to common stockholders
for
2018
versus
2017
:
|
In Millions
|
||||||||
|
Year Ended December 31, 2017
|
$
|
173
|
|
|||||
|
Reasons for the change
|
||||||||
|
Gas deliveries
1
and rate increases
|
||||||||
|
Rate increase, including the impacts of the September 2018 order
|
$
|
53
|
|
|||||
|
Higher sales due primarily to favorable weather in 2018
|
31
|
|
||||||
|
Higher energy waste reduction program revenues
|
23
|
|
||||||
|
Decrease in other revenues
|
(2
|
)
|
$
|
105
|
|
|||
|
Revenue reserve and lower rates related to the TCJA
2
|
(66
|
)
|
||||||
|
Maintenance and other operating expenses
|
||||||||
|
Increased distribution, transmission, and customer operations expenses
|
(28
|
)
|
||||||
|
Higher energy waste reduction program costs
|
(23
|
)
|
||||||
|
Increased expenses related to pipeline integrity
|
(21
|
)
|
||||||
|
Higher cost associated with leak repair and survey
|
(5
|
)
|
||||||
|
Increased expense associated with the retirement of gas compressor stations
|
(3
|
)
|
||||||
|
Higher other maintenance and operating expenses
|
(15
|
)
|
(95
|
)
|
||||
|
Depreciation and amortization
|
||||||||
|
Increased plant in service, reflecting higher capital spending
|
(20
|
)
|
||||||
|
General taxes
|
||||||||
|
Higher property tax, reflecting higher capital spending
|
(11
|
)
|
||||||
|
Other income, net of expenses
|
||||||||
|
Impact of OPEB Plan changes approved in November 2017
|
27
|
|
||||||
|
Lower donations
|
6
|
|
||||||
|
2017 Gain on the donation of CMS Energy stock
3
|
(5
|
)
|
||||||
|
Lower other income, net of expenses
|
(2
|
)
|
26
|
|
||||
|
Interest charges
|
(6
|
)
|
||||||
|
Impacts of the TCJA on income taxes
|
||||||||
|
Reduction of the corporate income tax rate
|
36
|
|
||||||
|
Deferred income tax adjustments, primarily the absence of the 2017 adjustment
4
|
8
|
|
44
|
|
||||
|
Other changes in income taxes
|
||||||||
|
Lower gas utility pre-tax earnings
|
25
|
|
||||||
|
Absence of a 2017 state income tax benefit
|
(3
|
)
|
||||||
|
Higher other income taxes
|
(3
|
)
|
19
|
|
||||
|
Year Ended December 31, 2018
|
$
|
169
|
|
|||||
|
1
|
Deliveries to end-use customers were 310 bcf in
2018
and 287 bcf in
2017
.
|
66
|
2
|
See
Note 3, Regulatory Matters
.
|
|
3
|
Gain at segment is eliminated on CMS Energy’s consolidated statements of income.
|
|
4
|
See
Note 14, Income Taxes
.
|
For the year ended
December 31, 2017
, Consumers gas utility’s
net income available to common stockholders
was
$173 million
. This compares with
net income available to common stockholders
of
$155 million
for the year ended
December 31, 2016
. In 2017, higher net income was due primarily to increased sales resulting from higher deliveries and a rate increase. These increases were offset partially by the recognition of the impacts of the TCJA and higher depreciation on increased plant in service. Presented in the following table are the detailed changes to the gas utility’s
net income available to common stockholders
for
2017
versus
2016
:
|
In Millions
|
||||||||
|
Year Ended December 31, 2016
|
$
|
155
|
|
|||||
|
Reasons for the change
|
||||||||
|
Gas deliveries
1
and rate increases
|
||||||||
|
Rate increase
|
$
|
27
|
|
|||||
|
Higher sales due primarily to higher deliveries
|
20
|
|
||||||
|
Higher other revenues
|
6
|
|
||||||
|
Higher financial incentive associated with energy waste reduction program
|
3
|
|
||||||
|
Lower energy waste reduction program revenues
|
(5
|
)
|
$
|
51
|
|
|||
|
Maintenance and other operating expenses
|
||||||||
|
Lower postretirement benefit costs
|
8
|
|
||||||
|
Lower energy waste reduction program costs
|
5
|
|
||||||
|
Absence of a 2016 voluntary separation program
|
4
|
|
||||||
|
Lower other operating and maintenance expenses
|
4
|
|
21
|
|
||||
|
Depreciation and amortization
|
||||||||
|
Increased plant in service, reflecting higher capital spending
|
(18
|
)
|
||||||
|
General taxes
|
||||||||
|
Higher property tax, reflecting higher capital spending
|
(5
|
)
|
||||||
|
Other income, net of expenses
|
||||||||
|
Reduction in nonoperating retirement benefits credits
|
(11
|
)
|
||||||
|
Higher donations
|
(3
|
)
|
||||||
|
Higher other expenses
|
(3
|
)
|
||||||
|
2017 Gain on the donation of CMS Energy stock
2
|
5
|
|
||||||
|
Retirement benefit plan changes
|
4
|
|
(8
|
)
|
||||
|
Interest charges
|
(2
|
)
|
||||||
|
Income taxes
|
||||||||
|
Higher gas utility earnings
|
(15
|
)
|
||||||
|
Deferred income tax adjustment due to the TCJA
3
|
(9
|
)
|
||||||
|
Higher other income taxes
|
(1
|
)
|
||||||
|
Reduction in effective state income tax rate
3
|
4
|
|
(21
|
)
|
||||
|
Year Ended December 31, 2017
|
$
|
173
|
|
|||||
|
1
|
Deliveries to end-use customers were 287 bcf in
2017
and 282 bcf in
2016
.
|
|
2
|
Gain at segment is eliminated on CMS Energy’s consolidated statements of income.
|
|
3
|
See
Note 14, Income Taxes
.
|
67
Enterprises Results of Operations
Presented in the following table are the detailed after-tax changes to the enterprises segment’s
net income available to common stockholders
for
2018
versus
2017
:
|
In Millions
|
||||||
|
Year Ended December 31, 2017
|
$
|
(27
|
)
|
|||
|
Reason for the change
|
||||||
|
Deferred income tax adjustments due to the TCJA, primarily the absence of the 2017 adjustment
1
|
$
|
62
|
|
|||
|
Reduction of corporate income tax rate due to the impacts of the TCJA
|
6
|
|
||||
|
Higher expenses from legacy obligations, net
|
(4
|
)
|
||||
|
Lower earnings from operations and equity method investees
|
(3
|
)
|
||||
|
Year Ended December 31, 2018
|
$
|
34
|
|
|||
|
1
|
See
Note 14, Income Taxes
.
|
Presented in the following table are the detailed changes to the enterprises segment’s
net income available to common stockholders
for
2017
versus
2016
:
|
In Millions
|
||||||
|
Year Ended December 31, 2016
|
$
|
17
|
|
|||
|
Reason for the change
|
||||||
|
Deferred income tax adjustment due to the TCJA
1
|
$
|
(57
|
)
|
|||
|
Higher prices for capacity and demand revenue from DIG
|
13
|
|
||||
|
Year Ended December 31, 2017
|
$
|
(27
|
)
|
|||
|
1
|
See
Note 14, Income Taxes
.
|
68
Corporate Interest and Other Results of Operations
Presented in the following table are the detailed after-tax changes to corporate interest and other results for
2018
versus
2017
:
|
In Millions
|
||||||
|
Year Ended December 31, 2017
|
$
|
(141
|
)
|
|||
|
Reasons for the change
|
||||||
|
Deferred income tax adjustments due to the TCJA, primarily the absence of the 2017 adjustment
1
|
$
|
58
|
|
|||
|
2017 Elimination of an intercompany gain on the donation of CMS Energy stock
|
9
|
|
||||
|
Lower fixed charges and administrative and other expenses
|
2
|
|
||||
|
Lower tax benefit due to the impacts of the TCJA
|
(9
|
)
|
||||
|
Year Ended December 31, 2018
|
$
|
(81
|
)
|
|||
|
1
|
See
Note 14, Income Taxes
.
|
Presented in the following table are the detailed after-tax changes to corporate interest and other results for
2017
versus
2016
:
|
In Millions
|
||||||
|
Year Ended December 31, 2016
|
$
|
(79
|
)
|
|||
|
Reasons for the change
|
|
|
||||
|
Deferred income tax adjustment due to the TCJA
1
|
$
|
(57
|
)
|
|||
|
Elimination of an intercompany gain on the donation of CMS Energy stock
2
|
(9
|
)
|
||||
|
Absence of 2016 settlement with the Michigan Department of Treasury
|
(5
|
)
|
||||
|
Higher earnings at EnerBank
|
3
|
|
||||
|
Lower fixed charges and administrative and other expenses
|
6
|
|
||||
|
Year Ended December 31, 2017
|
$
|
(141
|
)
|
|||
|
1
|
See
Note 14, Income Taxes
.
|
|
2
|
Eliminated on CMS Energy’s consolidated statements of income.
|
69
Cash Position, Investing, and Financing
At
December 31, 2018
, CMS Energy had
$175 million
of consolidated cash and cash equivalents, which included
$22 million
of restricted cash and cash equivalents. At
December 31, 2018
, Consumers had
$56 million
of consolidated cash and cash equivalents, which included
$17 million
of restricted cash and cash equivalents.
Operating Activities
Presented in the following table are specific components of
net cash provided by operating activities
for
2018
versus
2017
:
|
In Millions
|
||||
|
CMS Energy, including Consumers
|
||||
|
Year Ended December 31, 2017
|
$
|
1,705
|
|
|
|
Reasons for the change
|
||||
|
Higher net income
|
$
|
197
|
|
|
|
Non-cash transactions,
1
which included the impacts of the TCJA
|
(238
|
)
|
||
|
Higher postretirement benefits contributions
|
(240
|
)
|
||
|
Favorable impact of changes in core working capital,
2
due to the receipt of alternative minimum tax credit refunds, lower purchases of coal and gas, and higher collections from customers
|
114
|
|
||
|
Favorable impact of changes in other assets and liabilities, including higher collections from customers
|
165
|
|
||
|
Year Ended December 31, 2018
|
$
|
1,703
|
|
|
|
Consumers
|
||||
|
Year Ended December 31, 2017
|
$
|
1,715
|
|
|
|
Reasons for the change
|
||||
|
Higher net income
|
$
|
73
|
|
|
|
Non-cash transactions,
1
which included the impacts of the TCJA
|
(37
|
)
|
||
|
Higher postretirement benefits contributions
|
(234
|
)
|
||
|
Favorable impact of changes in core working capital,
2
due to lower purchases of coal and gas and higher collections from customers
|
66
|
|
||
|
Unfavorable impact of changes in other assets and liabilities, due primarily to higher income tax payments to CMS Energy, offset partially by higher collections from customers
|
(134
|
)
|
||
|
Year Ended December 31, 2018
|
$
|
1,449
|
|
|
|
1
|
Non-cash transactions comprise depreciation and amortization, changes in deferred income taxes, bad debt expense, and other non‑cash operating activities and reconciling adjustments.
|
|
2
|
Core working capital comprises accounts receivable, notes receivable, accrued revenue, inventories, accounts payable, and accrued rate refunds.
|
70
Presented in the following table are specific components of
net cash provided by operating activities
for
2017
versus
2016
:
|
In Millions
|
||||
|
CMS Energy, including Consumers
|
||||
|
Year Ended December 31, 2016
|
$
|
1,629
|
|
|
|
Reasons for the change
|
||||
|
Lower net income
|
$
|
(91
|
)
|
|
|
Non-cash transactions,
1
which included the impacts of the TCJA
|
252
|
|
||
|
Lower postretirement benefits contributions
|
96
|
|
||
|
Unfavorable impact of changes in core working capital,
2
largely due to gas purchased at higher prices, offset partially by higher collections from customers
|
(113
|
)
|
||
|
Unfavorable impact of changes in other assets and liabilities, due primarily to increased spending on environmental remediation activities
|
(68
|
)
|
||
|
Year Ended December 31, 2017
|
$
|
1,705
|
|
|
|
Consumers
|
||||
|
Year Ended December 31, 2016
|
$
|
1,681
|
|
|
|
Reasons for the change
|
||||
|
Higher net income
|
$
|
16
|
|
|
|
Non-cash transactions,
1
which included the impacts of the TCJA
|
(25
|
)
|
||
|
Lower postretirement benefits contributions
|
90
|
|
||
|
Unfavorable impact of changes in core working capital,
2
largely due to gas purchased at higher prices, offset partially by higher collections from customers
|
(129
|
)
|
||
|
Favorable impact of changes in other assets and liabilities, due primarily to lower income tax payments to CMS Energy, offset partially by increased spending on environmental remediation activities
|
82
|
|
||
|
Year Ended December 31, 2017
|
$
|
1,715
|
|
|
|
1
|
Non-cash transactions comprise depreciation and amortization, changes in deferred income taxes, bad debt expense, and other non‑cash operating activities and reconciling adjustments.
|
|
2
|
Core working capital comprises accounts receivable, notes receivable, accrued revenue, inventories, accounts payable, and accrued rate refunds.
|
71
Investing Activities
Presented in the following table are specific components of
net cash used in investing activities
for
2018
versus
2017
:
|
In Millions
|
||||
|
CMS Energy, including Consumers
|
||||
|
Year Ended December 31, 2017
|
$
|
(1,868
|
)
|
|
|
Reasons for the change
|
||||
|
Higher capital expenditures
|
$
|
(409
|
)
|
|
|
Changes in EnerBank notes receivable, reflecting growth in consumer lending
|
(169
|
)
|
||
|
Purchase of notes receivable by EnerBank in 2018
|
(225
|
)
|
||
|
Proceeds from DB SERP investments in 2018
1
|
146
|
|
||
|
Proceeds from the sale of EnerBank notes receivable in 2017
|
(50
|
)
|
||
|
Other investing activities, primarily higher costs to retire property
|
(31
|
)
|
||
|
Year Ended December 31, 2018
|
$
|
(2,606
|
)
|
|
|
Consumers
|
||||
|
Year Ended December 31, 2017
|
$
|
(1,751
|
)
|
|
|
Reasons for the change
|
||||
|
Higher capital expenditures
|
$
|
(190
|
)
|
|
|
Other investing activities, primarily higher costs to retire property
|
(30
|
)
|
||
|
Year Ended December 31, 2018
|
$
|
(1,971
|
)
|
|
|
1
|
See
Note 7, Financial Instruments
.
|
Presented in the following table are specific components of
net cash used in investing activities
for
2017
versus
2016
:
|
In Millions
|
||||
|
CMS Energy, including Consumers
|
||||
|
Year Ended December 31, 2016
|
$
|
(1,915
|
)
|
|
|
Reasons for the change
|
||||
|
Lower capital expenditures
|
$
|
7
|
|
|
|
Changes in EnerBank notes receivable
|
(2
|
)
|
||
|
Proceeds from the sale of EnerBank notes receivable in 2017
|
50
|
|
||
|
Other investing activities, primarily higher costs to retire property
|
(8
|
)
|
||
|
Year Ended December 31, 2017
|
$
|
(1,868
|
)
|
|
|
Consumers
|
||||
|
Year Ended December 31, 2016
|
$
|
(1,768
|
)
|
|
|
Reasons for the change
|
||||
|
Lower capital expenditures
|
$
|
24
|
|
|
|
Other investing activities, primarily higher costs to retire property
|
(7
|
)
|
||
|
Year Ended December 31, 2017
|
$
|
(1,751
|
)
|
|
72
Financing Activities
Presented in the following table are specific components of
net cash provided by (used in) financing activities
for
2018
versus
2017
:
|
In Millions
|
||||
|
CMS Energy, including Consumers
|
||||
|
Year Ended December 31, 2017
|
$
|
110
|
|
|
|
Reasons for the change
|
||||
|
Higher debt issuances
|
$
|
1,134
|
|
|
|
Higher debt retirements
|
(890
|
)
|
||
|
Changes in EnerBank certificates of deposit, reflecting higher borrowings
|
466
|
|
||
|
Lower repayments under Consumers’ commercial paper program
|
155
|
|
||
|
Lower issuances of common stock under the continuous equity offering program
|
(42
|
)
|
||
|
Higher payments of dividends on common and preferred stock
|
(30
|
)
|
||
|
Higher debt prepayment costs
|
(14
|
)
|
||
|
Other financing activities, primarily higher debt issuance costs
|
(15
|
)
|
||
|
Year Ended December 31, 2018
|
$
|
874
|
|
|
|
Consumers
|
||||
|
Year Ended December 31, 2017
|
$
|
(51
|
)
|
|
|
Reasons for the change
|
||||
|
Higher debt issuances
|
$
|
1,272
|
|
|
|
Higher debt retirements
|
(638
|
)
|
||
|
Lower repayments under Consumers’ commercial paper program
|
155
|
|
||
|
Lower stockholder contribution from CMS Energy
|
(200
|
)
|
||
|
Higher payments of dividends on common and preferred stock
|
(9
|
)
|
||
|
Higher debt prepayment costs
|
(16
|
)
|
||
|
Year Ended December 31, 2018
|
$
|
513
|
|
|
73
Presented in the following table are specific components of
net cash provided by (used in) financing activities
for
2017
versus
2016
:
|
In Millions
|
||||
|
CMS Energy, including Consumers
|
||||
|
Year Ended December 31, 2016
|
$
|
255
|
|
|
|
Reasons for the change
|
||||
|
Higher debt issuances
|
$
|
584
|
|
|
|
Higher debt retirements
|
(252
|
)
|
||
|
Changes in EnerBank certificates of deposit, reflecting lower borrowings
|
(53
|
)
|
||
|
Higher repayments under Consumers’ commercial paper program
|
(377
|
)
|
||
|
Higher issuances of common stock under the continuous equity offering program
|
11
|
|
||
|
Higher payments of dividends on common and preferred stock
|
(30
|
)
|
||
|
Higher debt prepayment costs
|
(4
|
)
|
||
|
Other financing activities
|
(24
|
)
|
||
|
Year Ended December 31, 2017
|
$
|
110
|
|
|
|
Consumers
|
||||
|
Year Ended December 31, 2016
|
$
|
168
|
|
|
|
Reasons for the change
|
||||
|
Higher debt issuances
|
$
|
388
|
|
|
|
Higher debt retirements
|
(357
|
)
|
||
|
Higher repayments under Consumers’ commercial paper program
|
(377
|
)
|
||
|
Higher stockholder contribution from CMS Energy
|
175
|
|
||
|
Higher payments of dividends on common and preferred stock
|
(23
|
)
|
||
|
Higher debt prepayment costs
|
(4
|
)
|
||
|
Other financing activities
|
(21
|
)
|
||
|
Year Ended December 31, 2017
|
$
|
(51
|
)
|
|
Capital Resources and Liquidity
CMS Energy uses dividends and tax-sharing payments from its subsidiaries and external financing and capital transactions to invest in its utility and non-utility businesses, retire debt, pay dividends, and fund its other obligations. The ability of CMS Energy’s subsidiaries, including Consumers, to pay dividends to CMS Energy depends upon each subsidiary’s revenues, earnings, cash needs, and other factors. In addition, Consumers’ ability to pay dividends is restricted by certain terms included in its debt covenants and articles of incorporation and potentially by FERC requirements and provisions under the Federal Power Act and the Natural Gas Act. For additional details on Consumers’ dividend restrictions, see
Item 8. Financial Statements and Supplementary Data—Notes to the Consolidated Financial Statements—
Note 5, Financings and Capitalization—Dividend Restrictions
.
For the year ended
December 31, 2018
, Consumers paid
$531 million
in dividends on its common stock to CMS Energy.
As a result of a provision in the TCJA, CMS Energy is required to recover all alternative minimum tax credits over four years through offsets of regular tax and through cash refunds. CMS Energy expects to be able to offset regular tax through the use of federal net operating loss carryforwards and, accordingly, receive alternative minimum tax credit refunds through 2021. Another provision in the TCJA excludes rate-regulated utilities from 100 percent cost expensing of certain property. This provision will cause Consumers to make higher tax-sharing payments to CMS Energy, which in turn might permit CMS Energy to maintain lower levels of debt in order to invest in its businesses, pay dividends, and fund
74
its general obligations. Consumers expects to have sufficient funding sources available to issue credits to customers for all impacts of the TCJA.
In August 2018, CMS Energy entered into an equity offering program under which it may sell, from time to time, shares of CMS Energy common stock having an aggregate sales price of up to
$250 million
. Under this program, CMS Energy may sell its common stock in privately negotiated “at the market” offerings, through forward sales transactions or otherwise.
In November 2018, CMS Energy entered into forward equity sale contracts under this program. These contracts allow CMS Energy to either physically settle the contracts by issuing
2.8 million
shares of its common stock at the then-applicable forward sale price specified by the agreements or net settle through the delivery or receipt of cash or shares. CMS Energy may settle the contracts at any time through May 2020, and presently intends to physically settle the contracts by delivering shares of its common stock.
For more information on the forward sale contracts, see
Item 8. Financial Statements and Supplementary Data—Notes to the Consolidated Financial Statements—
Note 5, Financings and Capitalization
.
In December 2018, CMS Energy entered into a
$300 million
term loan credit agreement. CMS Energy drew the entire amount of the term loan in January 2019.
Consumers uses cash flows generated from operations and external financing transactions, as well as stockholder contributions from CMS Energy, to fund capital expenditures, retire debt, pay dividends, contribute to its employee benefit plans, and fund its other obligations. Accelerated pension funding in prior years and several initiatives to reduce costs have helped improve cash flows from operating activities. Consumers anticipates continued strong cash flows from operating activities for
2019
and beyond.
Access to the financial and capital markets depends on CMS Energy’s and Consumers’ credit ratings and on market conditions. As evidenced by past financing transactions, CMS Energy and Consumers have had ready access to these markets. Barring major market dislocations or disruptions, CMS Energy and Consumers expect to continue to have ready access to the financial and capital markets. If access to these markets were to diminish or otherwise become restricted, CMS Energy and Consumers would implement contingency plans to address debt maturities, which could include reduced capital spending.
At
December 31, 2018
, CMS Energy had
$519 million
of its revolving credit facility available and Consumers had
$843 million
available under its revolving credit facilities. CMS Energy and Consumers use these credit facilities for general working capital purposes and to issue letters of credit. An additional source of liquidity is
Consumers’ commercial paper program
, which allows Consumers to
issue, in one or more placements
, up to
$500 million
in the aggregate in commercial paper notes
with maturities of up to
365
days and that bear interest at fixed or floating rates. These issuances are supported by Consumers’ revolving credit facilities
.
While the amount of outstanding commercial paper does not reduce the available capacity of the revolving credit facilities, Consumers does not intend to issue commercial paper in an amount exceeding the available capacity of the facilities. At
December 31, 2018
,
$97 million
of commercial paper notes
were outstanding under this program
. For additional details on CMS Energy’s and Consumers’ secured revolving credit facilities and commercial paper program, see
Item 8. Financial Statements and Supplementary Data—Notes to the Consolidated Financial Statements—
Note 5, Financings and Capitalization
.
75
Certain of CMS Energy’s and Consumers’ credit agreements, debt indentures, and other facilities contain covenants that require CMS Energy and Consumers to maintain certain financial ratios, as defined therein. At
December 31, 2018
, no default had occurred with respect to any financial covenants contained in CMS Energy’s and Consumers’ credit agreements, debt indentures, or other facilities. CMS Energy and Consumers were each in compliance with these covenants as of
December 31, 2018
, as presented in the following table:
|
December 31, 2018
|
|||
|
Credit Agreement, Indenture, or Facility
|
Limit
|
Actual
|
|
|
CMS Energy, parent only
|
|||
|
Debt to EBITDA
1
|
<
|
6.0 to 1.0
|
4.9 to 1.0
|
|
Debt to EBITDA
2
|
<
|
6.25 to 1.0
|
4.7 to 1.0
|
|
Consumers
|
|||
|
Debt to Capital
3
|
<
|
0.65 to 1.0
|
0.49 to 1.0
|
|
1
|
Applies to CMS Energy’s $
180 million
term loan agreement.
|
|
2
|
Applies to CMS Energy’s
$550 million
revolving credit agreement and its
$300 million
term loan agreement.
|
|
3
|
Applies to Consumers’
$850 million
and
$250 million
revolving credit agreements and its
$35 million
and
$30 million
reimbursement agreements.
|
Components of CMS Energy’s and Consumers’ cash management plan include controlling operating expenses and capital expenditures and evaluating market conditions for financing and refinancing opportunities. CMS Energy’s and Consumers’ present level of cash and expected cash flows from operating activities, together with access to sources of liquidity, are anticipated to be sufficient to fund the companies’ contractual obligations for
2019
and beyond.
76
Contractual Obligations
:
Presented in the following table are CMS Energy’s and Consumers’ contractual obligations. The table excludes all amounts classified as current liabilities on CMS Energy’s and Consumers’ consolidated balance sheets, other than the current portion of long-term debt, capital leases, and financing obligation.
|
In Millions
|
||||||||||||||||||||
|
Payments Due
|
||||||||||||||||||||
|
December 31, 2018
|
Total
|
Less Than One Year
|
One to Three Years
|
Three to Five Years
|
More Than Five Years
|
|||||||||||||||
|
CMS Energy, including Consumers
|
||||||||||||||||||||
|
Long-term debt
|
$
|
11,683
|
|
$
|
974
|
|
$
|
1,317
|
|
$
|
1,692
|
|
$
|
7,700
|
|
|||||
|
Interest payments on long-term debt
|
8,134
|
|
428
|
|
784
|
|
683
|
|
6,239
|
|
||||||||||
|
Capital leases and financing obligation
|
91
|
|
23
|
|
39
|
|
13
|
|
16
|
|
||||||||||
|
Interest payments on capital leases and financing obligation
|
26
|
|
6
|
|
11
|
|
4
|
|
5
|
|
||||||||||
|
Operating leases
|
97
|
|
16
|
|
30
|
|
13
|
|
38
|
|
||||||||||
|
AROs
|
1,487
|
|
27
|
|
52
|
|
47
|
|
1,361
|
|
||||||||||
|
Deferred investment tax credit
|
99
|
|
4
|
|
9
|
|
8
|
|
78
|
|
||||||||||
|
Environmental liabilities
|
135
|
|
16
|
|
45
|
|
17
|
|
57
|
|
||||||||||
|
Purchase obligations
|
||||||||||||||||||||
|
Total PPAs
|
9,930
|
|
1,049
|
|
2,094
|
|
1,382
|
|
5,405
|
|
||||||||||
|
Other
1
|
2,341
|
|
1,276
|
|
568
|
|
254
|
|
243
|
|
||||||||||
|
Total contractual obligations
|
$
|
34,023
|
|
$
|
3,819
|
|
$
|
4,949
|
|
$
|
4,113
|
|
$
|
21,142
|
|
|||||
|
Consumers
|
||||||||||||||||||||
|
Long-term debt
|
$
|
6,862
|
|
$
|
26
|
|
$
|
653
|
|
$
|
1,022
|
|
$
|
5,161
|
|
|||||
|
Interest payments on long-term debt
|
5,233
|
|
269
|
|
503
|
|
452
|
|
4,009
|
|
||||||||||
|
Capital leases and financing obligation
|
91
|
|
23
|
|
39
|
|
13
|
|
16
|
|
||||||||||
|
Interest payments on capital leases and financing obligation
|
26
|
|
6
|
|
11
|
|
4
|
|
5
|
|
||||||||||
|
Operating leases
|
85
|
|
14
|
|
27
|
|
12
|
|
32
|
|
||||||||||
|
AROs
|
1,472
|
|
26
|
|
52
|
|
47
|
|
1,347
|
|
||||||||||
|
Deferred investment tax credit
|
99
|
|
4
|
|
9
|
|
8
|
|
78
|
|
||||||||||
|
Environmental liabilities
|
77
|
|
12
|
|
37
|
|
9
|
|
19
|
|
||||||||||
|
Purchase obligations
|
||||||||||||||||||||
|
PPAs
|
||||||||||||||||||||
|
MCV PPA
|
3,880
|
|
330
|
|
607
|
|
554
|
|
2,389
|
|
||||||||||
|
Palisades PPA
|
1,280
|
|
378
|
|
788
|
|
114
|
|
—
|
|
||||||||||
|
Related-party PPAs
2
|
692
|
|
85
|
|
171
|
|
173
|
|
263
|
|
||||||||||
|
Other PPAs
|
4,078
|
|
256
|
|
528
|
|
541
|
|
2,753
|
|
||||||||||
|
Total PPAs
|
9,930
|
|
1,049
|
|
2,094
|
|
1,382
|
|
5,405
|
|
||||||||||
|
Other
1
|
2,075
|
|
1,237
|
|
521
|
|
227
|
|
90
|
|
||||||||||
|
Total contractual obligations
|
$
|
25,950
|
|
$
|
2,666
|
|
$
|
3,946
|
|
$
|
3,176
|
|
$
|
16,162
|
|
|||||
|
1
|
Long-term
contracts for the purchase of commodities and related services, and construction and service agreements. The commodities and related services include
natural gas and
coal and associated transportation.
|
|
2
|
Long-term PPAs from certain affiliates of CMS Enterprises.
|
77
CMS Energy and Consumers also have recognized non-current liabilities for which the timing of payments cannot be reasonably estimated. These items, which are excluded from the table above, include regulatory liabilities, deferred income taxes, workers’ compensation liabilities, accrued liabilities under renewable energy programs, and other liabilities. Retirement benefits are also excluded from the table above. For details related to benefit payments, see
Item 8. Financial Statements and Supplementary Data—Notes to the Consolidated Financial Statements—
Note 12, Retirement Benefits
.
Off-Balance-Sheet Arrangements
:
CMS Energy, Consumers, and certain of their subsidiaries enter into various arrangements in the normal course of business to facilitate commercial transactions with third parties. These arrangements include indemnities, surety bonds, letters of credit, and financial and performance guarantees. Indemnities are usually agreements to reimburse a counterparty that may incur losses due to outside claims or breach of contract terms. The maximum payment that could be required under a number of these indemnity obligations is not estimable; the maximum obligation under indemnities for which such amounts were estimable was
$153 million
at
December 31, 2018
. While CMS Energy and Consumers believe it is unlikely that they will incur any material losses related to indemnities they have not recorded as liabilities, they cannot predict the impact of these contingent obligations on their liquidity and financial condition. For additional details on these and other guarantee arrangements, see
Item 8. Financial Statements and Supplementary Data—Notes to the Consolidated Financial Statements—
Note 4, Contingencies and Commitments—Guarantees
. For additional details on operating leases, see
Item 8. Financial Statements and Supplementary Data—Notes to the Consolidated Financial Statements—
Note 10, Leases and Palisades Financing
.
Capital Expenditures:
Over the next five years, CMS Energy and Consumers expect to make substantial capital investments. CMS Energy and Consumers may revise their forecasts of capital expenditures periodically due to a number of factors, including environmental regulations, business opportunities, market volatility, economic trends, and the ability to access capital. Presented in the following table are CMS Energy’s and Consumers’ estimated capital expenditures, including lease commitments, for
2019
through
2023
:
|
In Billions
|
||||||||||||||||||||||||
|
2019
|
2020
|
2021
|
2022
|
2023
|
Total
|
|||||||||||||||||||
|
CMS Energy, including Consumers
|
||||||||||||||||||||||||
|
Consumers
|
$
|
2.2
|
|
$
|
2.4
|
|
$
|
2.2
|
|
$
|
2.2
|
|
$
|
2.2
|
|
$
|
11.2
|
|
||||||
|
Enterprises
|
0.1
|
|
0.1
|
|
0.1
|
|
0.1
|
|
0.1
|
|
0.5
|
|
||||||||||||
|
Total CMS Energy
|
$
|
2.3
|
|
$
|
2.5
|
|
$
|
2.3
|
|
$
|
2.3
|
|
$
|
2.3
|
|
$
|
11.7
|
|
||||||
|
Consumers
|
||||||||||||||||||||||||
|
Electric utility operations
|
$
|
1.2
|
|
$
|
1.3
|
|
$
|
1.3
|
|
$
|
1.1
|
|
$
|
1.2
|
|
$
|
6.1
|
|
||||||
|
Gas utility operations
|
1.0
|
|
1.1
|
|
0.9
|
|
1.1
|
|
1.0
|
|
5.1
|
|
||||||||||||
|
Total Consumers
|
$
|
2.2
|
|
$
|
2.4
|
|
$
|
2.2
|
|
$
|
2.2
|
|
$
|
2.2
|
|
$
|
11.2
|
|
||||||
Outlook
Several business trends and uncertainties may affect CMS Energy’s and Consumers’ financial condition and results of operations. These trends and uncertainties could have a material impact on CMS Energy’s and Consumers’ consolidated income, cash flows, or financial position. For additional details regarding these and other uncertainties, see
Forward-Looking Statements and Information
;
Item 1A. Risk Factors
;
Item 8. Financial Statements and Supplementary Data—Notes to the Consolidated Financial Statements—
Note 3, Regulatory Matters
; and
Note 4, Contingencies and Commitments
.
78
Consumers Electric Utility Outlook and Uncertainties
Energy Resource Planning:
While Consumers continues to experience increasing demand for electricity due to Michigan’s growing economy and increased use of air conditioning, consumer electronics, and other electric devices, it expects that increase in demand to be offset by the effects of energy efficiency and conservation.
In June 2018, Consumers filed an IRP with the MPSC
detailing its long-term strategy for delivering reliable and affordable energy to its customers through the increased use of energy efficiency and customer demand management programs and additional renewable energy.
The IRP supports Consumers’ clean energy
breakthrough goal to reduce carbon emissions by 80 percent and to eliminate the use of coal to generate electricity by 2040
.
Specifically, in its IRP filing, Consumers requests the MPSC’s approval of:
|
•
|
the retirement of two coal-fueled generating units, totaling
515
MW, in 2023
|
|
•
|
the retirement of two coal-fueled and two oil- and natural gas-fueled generating units, totaling
1,811
MW, in 2031
|
|
•
|
the retirement of its remaining coal-fueled generating unit, totaling
782
MW, in 2039
|
Consumers proposes replacing the capacity to be retired with:
|
•
|
demand response programs
|
|
•
|
increased energy efficiency
|
|
•
|
increased renewable energy generation
|
|
•
|
grid modernization tools
|
|
•
|
battery storage
|
The IRP proposes renewable energy levels beyond the standard set in the 2016 Energy Law, which
raised the renewable energy standard from the present ten-percent requirement to
15 percent in 2021
. Specifically, the IRP proposes renewable energy levels of 25 percent by 2025, over 35 percent by 2030, and over 40 percent by 2040, to be achieved mainly through the economic development of up to 6,000 MW of solar generation and 550 MW of wind generation.
The IRP filing also included plans for Consumers to purchase additional electricity from the T.E.S. Filer City plant following a proposed conversion of the plant to use natural gas as its primary fuel instead of coal and biomass. In conjunction with the proposal to convert the plant,
T.E.S. Filer City and Consumers had agreed in May 2017 to amend their PPA such that Consumers would purchase the increased capacity and electricity generated by the converted facility for 15 years. The amendment to the PPA was contingent on certain approvals, including a finding by FERC that the converted plant would continue to be an existing qualifying facility under PURPA. In August 2018, FERC concluded that the converted plant would not continue to be an existing qualifying facility under PURPA. As a result, the amendment is no longer effective and the PPA will continue until 2025 under its original terms.
PURPA:
PURPA requires Consumers to purchase power from qualifying cogeneration and small power production facilities at a price approved by the MPSC that is meant to represent Consumers’ “avoided cost” of generating power or purchasing power from another source. In November 2017, the MPSC issued an order establishing a new avoided-cost methodology for determining the price that Consumers must pay to purchase power under PURPA. Among other things, the MPSC’s order changes the basis of Consumers’ avoided cost from the cost of coal-fueled generating units to that of natural gas-fueled generating units. The MPSC order also assigns more capacity value to qualifying facilities that are consistently able to generate electricity during peak times.
Although the costs Consumers incurs to
79
purchase power from qualifying facilities are passed on to customers, the order
could result in mandated purchases of generation, potentially at above-market prices, and reduce Consumers’ need for new owned generation. This in turn could have a material adverse effect on Consumers’ capital investment plan
and
the affordability of future customer rates
.
In December 2017, Consumers filed a petition with the MPSC requesting corrections to the pricing calculations and capacity purchase model set in the order. Subsequently, the MPSC suspended the implementation of the order and reopened the proceeding. In February 2018, the MPSC issued an order limiting Consumers’ obligation to pay the full avoided capacity cost, which is based on the cost of a natural gas combustion turbine under the new avoided-cost formula, to existing qualifying facilities upon the expiration of outstanding contracts and to the first 150 MW of new generation projects that qualify under PURPA. In October 2018, the MPSC issued an order lifting the suspension on the November 2017 order and thereby making effective the avoided-cost formula set at that time; the use of the full avoided-cost formula is still limited to outstanding contracts that expire and the first 150 MW of new qualifying generation projects. All other qualifying generation projects that establish a legally enforceable obligation are eligible to receive a capacity payment equal to the MISO planning resource auction price and a designated energy price approved in the MPSC’s October order. The MPSC also ruled that the determination of Consumers’ future capacity needs shall take place in the IRP proceeding that Consumers filed in June 2018.
In its IRP filing, Consumers proposed a new method of calculating its avoided cost, based on a competitive bidding process, which will enable Consumers to purchase energy from new generation at the lowest cost and mitigate the risk of forced purchases of renewable generation. In accordance with the 2016 Energy Law, Consumers also proposed a financial compensation mechanism to recognize the financial impacts associated with procuring capacity from third parties and enable Consumers to earn a financial incentive on PPAs entered into through the proposed competitive bidding process.
Renewable Energy Plan:
The 2016 Energy Law
raised the renewable energy standard from the present ten-percent requirement to
15 percent in 2021
, with an interim target of
12.5 percent in 2019
. Consumers is required to submit RECs, which represent proof that the associated electricity was generated from a renewable energy resource, in an amount equal to at least the required percentage of Consumers’ electric sales volume each year. Under its renewable energy plan, Consumers expects to meet its renewable energy requirement each year with a combination of newly generated RECs and previously generated RECs carried over from prior years.
In conjunction with its renewable energy plan, Consumers obtained the MPSC’s approval to construct two additional phases at its Cross Winds
®
Energy Park. Phase II of the park, with a nameplate capacity of 44 MW, became operational in January 2018. Consumers began construction of Phase III, with a planned nameplate capacity of 76 MW, in June 2017 and expects it to be operational in 2020. Both phases of the project are expected to qualify for certain federal production tax credits, which are expected to generate cost savings that will be passed on to customers.
In September 2017, Consumers filed amendments to its renewable energy plan with the MPSC, requesting approval to acquire up to 525 MW of new wind generation projects and up to 100 MW of new solar generation projects in order to meet its renewable energy requirement. In May 2018, as a result of requests for proposals issued in 2017 to acquire wind and solar generation projects within MISO’s service territory, Consumers entered into an agreement to purchase a wind generation project under development, with capacity of up to 150 MW, in Gratiot County, Michigan. Consumers expects to begin construction in May 2019 and that the project will be completed and operational in 2020. The agreement is subject to MPSC approval.
80
In June 2018, Consumers issued additional requests for proposals to acquire up to 400 MW of wind generation projects ranging in size from 75 MW to 200 MW and up to 100 MW of solar generation projects at least 10 MW in size. The projects are required to be located in Michigan and operational by 2021. Any contracts entered into as a result of the requests for proposals would be subject to MPSC approval.
Voluntary Large Customer Renewable Energy Program:
In February 2018, Consumers began providing service under a program that provides large full-service electric customers with the opportunity to advance the development of renewable energy beyond the requirements of the 2016 Energy Law. Under the program, customers may match up to 100 percent of their energy use with renewable energy generated from wind resources. In August 2017, the MPSC conditionally approved the program through October 2018 and instructed Consumers to submit the program for review as a voluntary green pricing program under provisions of the 2016 Energy Law. Consumers submitted this program for review and, in October 2018, the MPSC approved it as a voluntary green pricing program.
Electric Customer Deliveries and Revenue:
Consumers’ electric customer deliveries are seasonal and largely dependent on Michigan’s economy.
The consumption of electric energy typically increases in the summer months, due primarily to the use of air conditioners and other cooling equipment
.
In addition, Consumers’ electric rates, which follow a seasonal rate design, are higher in the summer months than in the remaining months of the year.
Consumers expects weather-normalized electric deliveries over the next five years to
remain stable
relative to
2018
. This outlook reflects modest
growth in electric demand offset by the effects of energy waste reduction programs
and appliance efficiency standards. Actual delivery levels will depend on:
|
•
|
energy conservation measures and results of energy waste reduction programs
|
|
•
|
weather fluctuations
|
|
•
|
Michigan’s economic conditions, including utilization, expansion, or contraction of manufacturing facilities, population trends, and housing activity
|
Electric ROA:
Michigan law
allows electric customers in Consumers’ service territory to buy electric generation service from alternative electric suppliers in an aggregate amount capped at ten percent, with certain exceptions, of Consumers’ weather-normalized retail sales of the preceding calendar year.
At
December 31, 2018
, electric deliveries under the ROA program were
at the ten-percent limit
. Of Consumers’
1.8 million
electric customers,
287
customers, or
0.02 percent
, purchased electric generation service under the ROA program.
The 2016 Energy Law
established a path to ensure that forward capacity is secured for all electric customers in Michigan, including customers served by alternative electric suppliers under ROA.
The new law also authorized the MPSC to ensure that alternative electric suppliers have procured enough capacity to cover their anticipated capacity requirements for the four-year forward period. In November 2017, the MPSC issued an order establishing a state reliability mechanism for Consumers. Under this mechanism, beginning June 1, 2018, if an alternative electric supplier does not demonstrate that it has procured its capacity requirements for the four-year forward period, its customers will pay a set charge to the utility for capacity that is not provided by the alternative electric supplier. For the MISO planning year beginning June 1, 2018, all alternative electric suppliers have demonstrated that they have procured their capacity requirements.
In June 2018, the MPSC issued an order requiring all electric suppliers to demonstrate that a portion of the capacity procured to serve customers during peak demand times is located in the MISO footprint in Michigan’s Lower Peninsula. In July 2018, the Michigan Court of Appeals issued a decision that the MPSC does not have statutory authority to implement such a requirement for alternative electric
81
suppliers. Consumers believes the 2016 Energy Law does give such authorization to the MPSC. The MPSC and Consumers have filed applications for leave to appeal the Court of Appeals’ decision to the Michigan Supreme Court. The Michigan Supreme Court has discretion on whether to grant the applications for leave to appeal.
Electric Rate Matters:
Rate matters are critical to Consumers’ electric utility business. For additional details on rate matters, see
Item 8. Financial Statements and Supplementary Data—Notes to the Consolidated Financial Statements—
Note 3, Regulatory Matters
.
2018 Electric Rate Case:
In May 2018, Consumers filed an application with the MPSC seeking an annual rate increase of
$58 million
, based on a
10.75 percent
authorized return on equity. In October 2018, Consumers reduced its requested annual rate increase to
$44 million
. The filing requested authority to recover new investment in system reliability, environmental compliance, and technology enhancements. In January 2019, the MPSC approved a settlement agreement authorizing an annual rate decrease of
$24 million
, based on a
10.0 percent
authorized return of equity. With the elimination of the
$113 million
TCJA credit to customer bills, the approved settlement agreement results in an
$89 million
increase in annual rates. In lieu of the investment recovery mechanism requested by Consumers, the settlement agreement provides for deferred accounting treatment for distribution-related capital investments exceeding certain amounts. Consumers also agreed to not file a new electric rate case prior to January 2020.
PSCR Plan:
Consumers submitted its 2019 PSCR plan to the MPSC in September 2018 and, in accordance with its proposed plan, self-implemented the 2019 PSCR charge beginning in January 2019.
Electric Environmental Outlook
:
Consumers’ operations are subject to various state and federal environmental laws and regulations. Consumers estimates that it will incur capital expenditures of
$0.3 billion
from
2019
through
2023
to continue to comply with RCRA, the Clean Water Act, the Clean Air Act, and numerous state and federal environmental regulations. Consumers expects to recover these costs in customer rates, but cannot guarantee this result. Consumers’ primary environmental compliance focus includes, but is not limited to, the following matters.
Air Quality:
CSAPR, which became effective in 2015, requires Michigan and 27 other states to improve air quality by reducing power plant emissions that, according to EPA computer models, contribute to ground-level ozone and fine particle pollution in other downwind states. In 2016, the EPA finalized new ozone season standards for CSAPR, which became effective in May 2017. CSAPR is presently being litigated; however, any decision will not impact Consumers’ compliance strategy, as Consumers expects its emissions to be within the CSAPR allowance allocations.
In 2012, the EPA published emission standards for electric generating units, based on Section 112 of the Clean Air Act, calling the final rule MATS. Under MATS, all of Consumers’ existing coal-fueled electric generating units were required to add additional controls for hazardous air pollutants. Consumers met the extended deadline of April 2016 for five coal-fueled units and two oil/gas-fueled units it continues to operate and retired its
seven
remaining coal-fueled units. MATS is presently being litigated, and the EPA recently proposed changes to the supporting analysis used to justify MATS, but did not propose any changes to the MATS regulations. Any changes resulting from that litigation or rulemaking are not expected to impact Consumers’ MATS compliance strategy because Consumers is still required to comply with the Michigan Mercury Rule, which has similar requirements to MATS. In addition, Consumers must comply with its settlement agreement with the EPA entered into in 2014 concerning opacity and NSR.
In 2015, the EPA released its new rule to lower the NAAQS for ozone.
The new ozone NAAQS will make it more difficult to construct or modify power plants in areas of the country that have not met the new
ozone standard. In April 2018, the EPA designated certain areas of Michigan as not meeting the new standard with an August 2018 effective date.
None of Consumers’ fossil-fuel-fired generating units are
82
located in these areas. Some of Consumers’ compressor stations are located in areas impacted by the rule, but Consumers expects only minor permitting impacts if those units are modified in the future. The NAAQS for ozone are presently being litigated. Consumers does not expect that any decision will have a material adverse impact on its generating assets.
Consumers’ strategy to comply with air quality regulations, including CSAPR, NAAQS, and MATS, as well as its legal obligations, involved the installation and operation of emission control equipment at some facilities and the suspension of operations at others; however, Consumers continues to evaluate these rules in conjunction with other EPA and MDEQ rulemakings, litigation, and congressional action. This evaluation could result in:
|
•
|
a change in Consumers’ fuel mix
|
|
•
|
changes in the types of generating units Consumers may purchase or build in the future
|
|
•
|
changes in how certain units are used
|
|
•
|
the retirement, mothballing, or repowering with an alternative fuel of some of Consumers’ generating units
|
|
•
|
changes in Consumers’ environmental compliance costs
|
Greenhouse Gases:
There have been numerous legislative and regulatory initiatives at the state, regional, national, and international levels that involve the potential regulation of greenhouse gases. Consumers continues to monitor and comment on these initiatives and to follow litigation involving greenhouse gases.
In 2015, the EPA finalized new rules pursuant to Section 111(b) of the Clean Air Act to limit carbon dioxide emissions from new electric generating units. New coal-fueled units would not be able to meet this limit without installing carbon dioxide control equipment using such methods as carbon capture and sequestration. In addition, the EPA finalized new rules pursuant to Section 111(b) of the Clean Air Act to limit carbon dioxide emissions from modified or reconstructed electric generating units. Both of these rules are being litigated.
In December 2018, the EPA proposed a revised Section 111(b) regulation to replace the 2015 standard rule limiting carbon dioxide emissions from new electric generating units, citing limited availability and high costs of carbon capture and sequestration equipment as reasons to change the 2015 rule. The revised Section 111(b) regulation requires new coal-fueled generating units to meet a highly efficient steam cycle performance standard. Consumers does not expect this proposal to change its existing environmental strategy.
Also in 2015, the EPA published final rules pursuant to Section 111(d) of the Clean Air Act to limit carbon dioxide emissions from existing electric generating units, calling the rules the “Clean Power Plan.” The rules required a 32-percent nationwide reduction in carbon emissions from existing power plants by 2030 (based on 2005 levels), and states choosing not to develop their own implementation plans would be subject to the federal plan. Certain states, corporations, and industry groups initiated litigation opposing the proposed Clean Power Plan, and in 2016, the U.S. Supreme Court stayed the Clean Power Plan while the litigation proceeded. In March 2017, the EPA and other federal agencies were directed to review rules and policies that burden domestic energy production, including the Clean Power Plan. The EPA subsequently filed motions to hold the Section 111(b) and Clean Power Plan litigation in abeyance while it reconsiders the rule. In October 2017, the EPA published a proposal to repeal the Clean Power Plan and is reviewing comments received.
In August 2018, the EPA proposed the “Affordable Clean Energy” rule as a replacement for the EPA’s 2015 Clean Power Plan, which the U.S. Supreme Court stayed in 2016. This proposed rule requires individual states to evaluate fossil-fuel-fired power plants for heat-rate improvements that could be
83
undertaken to increase overall plant efficiency. There is also a proposal to modify the Clean Air Act permitting requirements to promote these efficiency projects. Consumers does not expect that the Affordable Clean Energy rule will have an adverse impact on its environmental strategy.
In 2015, a group of 195 countries, including the U.S., finalized the Paris Agreement, which governs carbon dioxide reduction measures beginning in 2020. Although the U.S. subsequently withdrew from the Paris Agreement, it has stated a desire to renegotiate a new agreement in the future. At this time, Consumers does not expect any adverse changes to its environmental strategy as a result of these events.
While Consumers cannot predict the outcome of changes in U.S. policy or of other legislative or regulatory initiatives involving the potential regulation of greenhouse gases, it intends to continue to move forward with its clean energy plan, its present carbon reduction goal, and its emphasis on supply diversity. Consumers will continue to monitor regulatory and legislative activity and related litigation regarding greenhouse gas emissions standards that may affect electric generating units.
Severe weather events and climate change associated with increasing levels of greenhouse gases could affect the companies’ facilities and energy sales and could have a material impact on the companies’ future results of operations. Consumers is unable to predict these events or their financial impact; however, Consumers plans for adverse weather and takes steps to reduce its potential impact.
Litigation, as well as federal laws, additional EPA regulations regarding greenhouse gases, or similar treaties, state laws, or rules, if enacted or ratified, could ultimately require Consumers to replace equipment, install additional emission control equipment, purchase emission allowances, curtail operations, arrange for alternative sources of supply, or take other steps to manage or lower the emission of greenhouse gases. Although associated capital or operating costs relating to greenhouse gas regulation or legislation could be material and cost recovery cannot be assured, Consumers expects to recover these costs and capital expenditures in rates consistent with the recovery of other reasonable costs of complying with environmental laws and regulations.
CCRs:
In 2015, the EPA published a final rule regulating CCRs, such as coal ash, under RCRA. The final rule adopts minimum standards for beneficially reusing and disposing of non‑hazardous CCRs. The rule establishes new minimum requirements for site location, groundwater monitoring, flood protection, storm water design, fugitive dust control, and public disclosure of information, including any groundwater protection standard exceedances. The rule also sets out conditions under which CCR units would be forced to cease receiving CCR and non‑CCR waste and initiate closure based on the inability to achieve minimum safety standards, meet a location standard, or meet minimum groundwater standards. Consumers has aligned with state regulatory authorities on closure plans and has completed work to close some existing ash ponds and replace them with double-lined ash ponds or concrete infrastructure. Consumers will continue to develop additional work plans for submission to the MDEQ to ensure coordination between federal and state requirements.
Furthermore, Congress passed legislation in 2016 that allows participating states to develop permitting programs for CCRs under RCRA. In July 2018, the EPA published preliminary rulemaking which was intended to amend the 2015 final rule. The rulemaking did not change Consumers’ compliance strategy, but demonstrated the EPA’s willingness to allow states to incorporate flexibility into their permitting processes. However, in August 2018, the D.C. Circuit Court issued a decision in CCR litigation that, while also not impacting Consumers’ compliance strategy, could delay the EPA from amending the 2015 final rule. In December 2018, Michigan adopted a permitting program, which would still require the EPA’s authorization. The MDEQ is currently working on an application requesting such authorization for the Michigan permitting program.
Consumers may need to adjust its recorded ARO associated with coal ash disposal sites depending on the outcome of its submissions to the MDEQ and on a future RCRA permitting program under the MDEQ, if
84
the EPA approves a state-level program. Consumers has historically been authorized to recover in electric rates costs related to coal ash disposal sites.
Water:
The EPA’s rule to regulate existing electric generating plant cooling water intake systems under Section 316(b) of the Clean Water Act became effective in 2014. The rule is aimed at reducing alleged harmful impacts on fish and shellfish. In April 2018, Consumers submitted to the MDEQ for review and approval all required studies and recommended plans to comply with Section 316(b).
In 2015, the EPA released its final effluent limitation guidelines. These guidelines, which are presently being litigated, set stringent new requirements for the discharge from electric generating units into wastewater streams. In August 2017, the EPA announced that it will undertake a rulemaking to replace specific portions of the rule. In September 2017, the EPA proposed delaying the compliance start dates for two years, but maintained the compliance end dates. Rulemaking is expected to conclude in early 2019. Consumers does not expect any adverse changes to its environmental strategy as a result of any revisions to the rule.
In 2015, the EPA and the U.S. Army Corps of Engineers published a final rule redefining “waters of the United States,” which designates the EPA’s jurisdiction under the Clean Water Act. Numerous states and other interested parties, including Michigan’s Attorney General, have filed suits in federal courts to block the rule, which subsequently was stayed in 2015 while litigation ensued. In January 2018, the U.S. Supreme Court unanimously ruled that the federal district courts, not the federal appellate courts, had jurisdiction over challenges to the 2015 rule. Consequently, in February 2018, the U.S. Court of Appeals for the Sixth Circuit lifted the stay of the rule. The EPA has published a notice, called the Applicability Rule, that prevents the 2015 rule from going into effect until February 2020 in an attempt to maintain consistency and provide certainty for regulated entities while the agencies continue to consider possible revisions to the 2015 rule. In August 2018, the U.S. District Court for the District of South Carolina set aside the Applicability Rule nationally and, as a result, the 2015 rule again went into effect in 22 states, including Michigan.
In December 2018, the EPA and the U.S. Army Corps of Engineers released a proposed rule re-defining the term “waters of the United States” under the Clean Water Act. This rule is intended to clarify the scope of the EPA and the Corps’ jurisdiction under the Clean Water Act. In 2015, the EPA under President Obama approved a rule expanding the definition, particularly with respect to tributaries, adjacent waters, and wetlands. The EPA’s recently proposed rule narrows the definition of jurisdictional waters. Consumers is currently evaluating the proposed rule and does not expect any adverse changes to its environmental strategy as a result of this proposal.
The 2015 and 2018 rules change the scope of water and wetlands regulations; however, the EPA has delegated authority to manage the Michigan wetlands program to the MDEQ. As a result, regardless of the 2015 and 2018 rules’ ultimate outcome, Consumers will continue to operate under Michigan’s wetlands regulations, and under the applicable state and federal water jurisdictional regulations. Thus, Consumers does not expect any adverse changes to its environmental strategy as a result of these events.
Many of Consumers’ facilities maintain NPDES permits, which are renewed every five years and are vital to the facilities’ operations. Failure of the MDEQ to renew any NPDES permit, a successful appeal against a permit, or onerous terms contained in a permit could have a significant detrimental effect on the operations of a facility.
Other Matters:
Other electric environmental matters could have a material impact on Consumers’ outlook. For additional details on other electric environmental matters, see
Item 8. Financial Statements and Supplementary Data—Notes to the Consolidated Financial Statements—
Note 4, Contingencies and Commitments—Consumers Electric Utility Contingencies—Electric Environmental Matters
.
85
Consumers Gas Utility Outlook and Uncertainties
Gas Deliveries:
Consumers’ gas customer deliveries are seasonal. The
peak demand for natural gas typically occurs in the winter due
to colder temperatures and the resulting use of natural gas as heating fuel
. Consumers expects weather-normalized gas deliveries over the next five years to
increase slightly
, relative to 2018. This outlook reflects modest
growth in gas demand offset partially by
the predicted effects of
energy efficiency and conservation
. Actual delivery levels from year to year may vary from this expectation due to:
|
•
|
weather fluctuations
|
|
•
|
use by power producers
|
|
•
|
availability and development of renewable energy sources
|
|
•
|
gas price changes
|
|
•
|
Michigan economic conditions, including population trends and housing activity
|
|
•
|
the price of competing energy sources or fuels
|
|
•
|
energy efficiency and conservation impacts
|
Gas Rate Matters:
Rate matters are critical to Consumers’ gas utility business. For additional details on rate matters, see
Item 8. Financial Statements and Supplementary Data—Notes to the Consolidated Financial Statements—
Note 3, Regulatory Matters
.
Gas Rate Case:
In November 2018, Consumers filed an application with the MPSC seeking an annual rate increase of $229 million, based on a 10.75 percent authorized return on equity.
The filing requests authority to recover new infrastructure investment and related costs that will allow Consumers to improve system safety, capacity, and deliverability. Presented in the following table are the components of the requested increase in revenue:
|
In Millions
|
||||
|
Components of the requested rate increase
|
||||
|
Investment in rate base
|
$
|
136
|
|
|
|
Operating and maintenance costs
|
81
|
|
||
|
Cost of capital
|
29
|
|
||
|
Working capital
|
11
|
|
||
|
Gross margin
|
(28
|
)
|
||
|
Total
|
$
|
229
|
|
|
The filing also seeks approval of two rate adjustment mechanisms: a revenue decoupling mechanism and an investment recovery mechanism. The revenue decoupling mechanism would annually reconcile Consumers’ actual weather-normalized non-fuel revenues with the revenues approved by the MPSC.
The investment recovery mechanism would provide for additional annual rate increases of $11 million beginning in October 2020 and another $11 million beginning in October 2021 for incremental investments that Consumers plans to make in those years, subject to reconciliation. These future investments are intended to help ensure adequate system capacity and deliverability.
The MPSC previously approved an investment recovery mechanism in August 2018; that mechanism will remain in effect until rates are changed in this proceeding.
GCR Plan:
Consumers submitted its 2019-2020 GCR plan to the MPSC in December 2018 and, in accordance with its proposed plan, expects to self-implement the 2019-2020 GCR charge beginning in April 2019.
86
Gas Pipeline and Storage Integrity and Safety:
In 2016, PHMSA published a notice of proposed rulemaking that would expand federal safety standards for gas transmission pipelines. The rule could cause Consumers to incur increased capital costs to install and remediate pipelines as well as operating and maintenance costs to expand inspections, maintenance, and monitoring of its existing pipelines. PHMSA expects to publish a final rule in 2019.
Also in 2016, PHMSA published an interim final rule that established minimum federal safety standards for underground natural gas storage facilities. As published, the rule could cause Consumers to incur increased capital and operating and maintenance costs to expand inspections, maintenance, and monitoring of its underground gas storage facilities. PHMSA expects to publish a final rule in 2019.
Although associated capital or operating and maintenance costs relating to these regulations could be material and cost recovery cannot be assured, Consumers would expect to recover such costs and capital expenditures in rates consistent with the recovery of other reasonable costs of complying with laws and regulations. Consumers will continue to monitor gas safety regulations.
Gas Environmental Outlook
:
Consumers expects to incur response activity costs at a number of sites, including
23
former MGP
sites. For additional details, see
Item 8. Financial Statements and Supplementary Data—Notes to the Consolidated Financial Statements—
Note 4, Contingencies and Commitments—Consumers Gas Utility Contingencies—Gas Environmental Matters
.
Consumers Electric Utility and Gas Utility Outlook and Uncertainties
Energy Waste Reduction Plan:
The 2016 Energy Law
authorized incentives for demand response programs and expanded existing incentives for energy efficiency programs, referring to the combined initiatives as energy waste reduction programs
. The 2016 Energy Law:
|
•
|
extended the requirement to achieve annual reductions of 1.0 percent in customers’ electricity use through 2021 and 0.75 percent in customers’ natural gas use indefinitely
|
|
•
|
removed limits on investments under the program and provided for a higher return on those investments; together, these provisions effectively doubled the financial incentives Consumers may earn for exceeding the statutory targets
|
|
•
|
established a goal of 35 percent combined renewable energy and energy waste reduction by 2025
|
Under its energy waste reduction plan, Consumers provides its customers with incentives to reduce usage by offering energy audits, rebates and discounts on purchases of highly efficient appliances, and other incentives and programs.
Enterprises Outlook and Uncertainties
CMS Energy’s primary focus with respect to its enterprises businesses is to maximize the value of generating assets, its share of which represents
1,234
MW of capacity, and to pursue opportunities for the development of renewable generation projects.
In conjunction with a plan to convert its plant to use natural gas as its primary fuel instead of coal and biomass,
T.E.S. Filer City and Consumers had agreed in May 2017 to amend their PPA such that Consumers would purchase the increased capacity and electricity generated by the converted facility for 15 years. The amendment to the PPA was contingent on certain approvals, including a finding by FERC that the converted plant would continue to be an existing qualifying facility under PURPA. In August 2018, FERC concluded that the converted plant would not continue to be an existing qualifying facility under PURPA. As a result, the amendment is no longer effective and the PPA will continue until 2025 under its original terms.
87
In June and August 2018, CMS Enterprises
completed the development and construction of two solar generation projects
totaling 24 MW in
Delta Township,
Michigan; energy produced by these projects is sold under 25‑year PPAs to the Lansing Board of Water and Light, a non‑affiliated utility.
In August 2018, CMS Enterprises
purchased a 105-MW wind generation project in northwest Ohio, and the project became operational in September 2018. Renewable energy produced by the wind generation project has been committed to General Motors LLC, a non‑affiliated company, under a 15-year PPA.
The enterprises segment’s assets may be affected by environmental laws and regulations.
The new ozone NAAQS will make it more difficult to construct or modify power plants in areas of the country that have not met the new
ozone standard. In April 2018, the EPA designated certain areas of Michigan as not meeting the new standard with an August 2018 effective date.
The enterprises segment’s independent power plant located in Dearborn, Michigan is in one such area and, as a result, would be subject to additional permitting restrictions in the event of any future modifications. For additional details regarding the new ozone NAAQS, see Consumers Electric Utility Outlook and Uncertainties-Electric Environmental Outlook.
Trends, uncertainties, and other matters related to the enterprises segment that could have a material impact on CMS Energy’s consolidated income, cash flows, or financial position include:
|
•
|
investment in and financial benefits received from renewable energy and energy storage projects
|
|
•
|
changes in energy and capacity prices
|
|
•
|
changes in commodity prices and interest rates on certain derivative contracts that do not qualify for hedge accounting and must be marked to market through earnings
|
|
•
|
changes in various environmental laws, regulations, principles, or practices, or in their interpretation
|
|
•
|
the outcome of certain legal proceedings, including gas price reporting litigation
|
|
•
|
indemnity and environmental remediation obligations at Bay Harbor
|
|
•
|
obligations related to a tax claim from the government of Equatorial Guinea
|
|
•
|
representations, warranties, and indemnities provided by CMS Energy in connection with previous sales of assets
|
For additional details regarding the enterprises segment’s uncertainties, see
Item 8. Financial Statements and Supplementary Data—Notes to the Consolidated Financial Statements—
Note 4, Contingencies and Commitments
.
Other Outlook and Uncertainties
EnerBank:
EnerBank is a Utah state-chartered, FDIC-insured industrial bank providing
primarily unsecured consumer installment loans for financing home improvements
. EnerBank represented five percent of CMS Energy’s net assets at
December 31, 2018
, and six percent of CMS Energy’s
net income available to common stockholders
for the year ended
December 31, 2018
. The carrying value of EnerBank’s loan portfolio was
$1.9 billion
at
December 31, 2018
. Its loan portfolio was funded primarily by certificates of deposit of $1.8 billion. The 12-month rolling average net default rate on loans held by EnerBank was 1.2 percent at
December 31, 2018
. CMS Energy is required both by law and by contract to provide financial support, including infusing additional capital, to ensure that EnerBank satisfies mandated capital requirements and has sufficient liquidity to operate. With its self-funding plan, EnerBank has exceeded these requirements historically and exceeded them as of
December 31, 2018
.
88
Litigation:
CMS Energy, Consumers, and certain of their subsidiaries are named as parties in various litigation matters, as well as in administrative proceedings before various courts and governmental agencies, arising in the ordinary course of business. For additional details regarding these and other legal matters, see
Item 8. Financial Statements and Supplementary Data—Notes to the Consolidated Financial Statements—
Note 3, Regulatory Matters
and
Note 4, Contingencies and Commitments
.
Critical Accounting Policies and Estimates
The following information is important to understand CMS Energy’s and Consumers’ results of operations and financial condition. For additional accounting policies, see
Item 8. Financial Statements and Supplementary Data—Notes to the Consolidated Financial Statements—
Note 1, Significant Accounting Policies
.
In the preparation of CMS Energy’s and Consumers’ consolidated financial statements, estimates and assumptions are used that may affect reported amounts and disclosures. CMS Energy and Consumers use accounting estimates for asset valuations, unbilled revenue, depreciation, amortization, financial and derivative instruments, employee benefits, stock-based compensation, the effects of regulation, indemnities, and contingencies. Actual results may differ from estimated results due to changes in the regulatory environment, regulatory decisions, lawsuits, competition, and other factors. CMS Energy and Consumers consider all relevant factors in making these assessments.
Accounting for the Effects of Industry Regulation:
Because Consumers has regulated operations, it uses regulatory accounting to recognize the effects of the regulators’ decisions on its financial statements. Consumers continually assesses whether future recovery of its regulatory assets is probable by considering communications and experience with its regulators and changes in the regulatory environment. If Consumers determined that recovery of a regulatory asset were not probable, Consumers would be required to write off the asset and immediately recognize the expense in earnings.
Contingencies:
CMS Energy and Consumers make judgments regarding the future outcome of various matters that give rise to contingent liabilities. For such matters, they record liabilities when they are considered probable and reasonably estimable, based on all available information. In particular, CMS Energy and Consumers are participating in various environmental remediation projects for which they have recorded liabilities. The recorded amounts represent estimates that may take into account such considerations as the number of sites, the anticipated scope, cost, and timing of remediation work, the available technology, applicable regulations, and the requirements of governmental authorities. For
remediation projects in which the timing of estimated expenditures is considered reliably determinable, CMS Energy and Consumers record the liability at its net present value, using a discount rate equal to the interest rate on monetary assets that are essentially risk-free and have maturities comparable to that of the environmental liability.
The amount recorded for any contingency may differ from actual costs incurred when the contingency is resolved. For additional details, see
Item 8. Financial Statements and Supplementary Data—Notes to the Consolidated Financial Statements—
Note 4, Contingencies and Commitments
.
Derivative Instruments:
CMS Energy and Consumers account for certain contracts as derivative instruments. If a contract is a derivative and does not qualify for the normal purchases and sales exception, it is recorded on the consolidated balance sheets at its fair value. Each quarter, the resulting asset or liability is adjusted to reflect any change in the fair value of the contract. CMS Energy and Consumers recognize unrealized gains and losses on derivatives in net income unless cash flow hedge accounting is applied to the transaction.
The criteria used to determine if an instrument qualifies for derivative accounting or for an exception from derivative accounting are complex and often require judgment in application. Changes in business
89
strategies or market conditions, as well as a requirement to apply different interpretations of the derivative accounting literature, could result in changes in accounting for a single contract or groups of contracts, which could have a material impact on CMS Energy’s and Consumers’ financial statements. For additional details on CMS Energy’s and Consumers’ derivatives and how the fair values of derivatives are determined, see
Item 8. Financial Statements and Supplementary Data—Notes to the Consolidated Financial Statements—
Note 6, Fair Value Measurements
.
Income Taxes:
The amount of income taxes paid by CMS Energy is subject to ongoing audits by federal, state, and foreign tax authorities, which can result in proposed assessments. An estimate of the potential outcome of any uncertain tax issue is highly judgmental. CMS Energy believes adequate reserves have been provided for these exposures; however, future results may include favorable or unfavorable adjustments to the estimated tax liabilities in the period the assessments are made or resolved or when statutes of limitation on potential assessments expire. Additionally, CMS Energy’s judgment as to the ability to recover its deferred tax assets may change. CMS Energy believes the valuation allowances related to its deferred tax assets are adequate, but future results may include favorable or unfavorable adjustments. As a result, CMS Energy’s effective tax rate may fluctuate significantly over time. For additional details, see
Item 8. Financial Statements and Supplementary Data—Notes to the Consolidated Financial Statements—
Note 14, Income Taxes
.
Pension and OPEB:
CMS Energy and Consumers provide retirement pension benefits to certain employees under non‑contributory DB Pension Plans, and they provide postretirement health and life benefits to qualifying retired employees under an OPEB Plan.
CMS Energy and Consumers record liabilities for pension and OPEB on their consolidated balance sheets at the present value of the future obligations, net of any plan assets. The calculation of the liabilities and associated expenses requires the expertise of actuaries, and requires many assumptions, including:
|
•
|
life expectancies
|
|
•
|
discount rates
|
|
•
|
expected long-term rate of return on plan assets
|
|
•
|
rate of compensation increases
|
|
•
|
expected health care costs
|
A change in these assumptions could change significantly CMS Energy’s and Consumers’ recorded liabilities and associated expenses.
In July 2018, CMS Energy and Consumers approved an amendment to the OPEB Plan to improve survivor benefits for certain Medicare-eligible retirees, effective January 1, 2019, resulting in a
$26 million
increase in the benefit obligation.
90
Presented in the following table are estimates of costs and cash contributions through 2021 for the DB Pension Plans and OPEB Plan. Actual future costs and contributions will depend on future investment performance, discount rates, and various factors related to the participants of the DB Pension Plans and OPEB Plan. CMS Energy and Consumers will, at a minimum, contribute to the plans as needed to comply with federal funding requirements.
|
In Millions
|
|||||||||||||||||
|
DB Pension Plans
|
OPEB Plan
|
||||||||||||||||
|
Cost
|
Contribution
|
Credit
1
|
Contribution
|
||||||||||||||
|
CMS Energy, including Consumers
|
|||||||||||||||||
|
2019
|
$
|
26
|
|
$
|
—
|
|
$
|
(69
|
)
|
$
|
—
|
|
|||||
|
2020
|
42
|
|
—
|
|
(63
|
)
|
—
|
|
|||||||||
|
2021
|
44
|
|
—
|
|
(64
|
)
|
—
|
|
|||||||||
|
Consumers
2
|
|||||||||||||||||
|
2019
|
$
|
27
|
|
$
|
—
|
|
$
|
(64
|
)
|
$
|
—
|
|
|||||
|
2020
|
42
|
|
—
|
|
(58
|
)
|
—
|
|
|||||||||
|
2021
|
44
|
|
—
|
|
(59
|
)
|
—
|
|
|||||||||
|
1
|
As a result of the amendment made to the OPEB Plan in 2018, the estimate of OPEB Plan credits decreased by $4 million for 2019, 2020, and 2021.
|
|
2
|
Consumers’ pension and OPEB costs are recoverable through its general ratemaking process.
|
Lowering the expected long-term rate of return on the assets of the DB Pension Plans by 25 basis points would increase estimated pension cost for 2019 by $5 million for both CMS Energy and Consumers. Lowering the PBO discount rates by 25 basis points would increase estimated pension cost for 2019 by $4 million for both CMS Energy and Consumers.
Pension and OPEB plan assets are accounted for and disclosed at fair value. Fair value measurements incorporate assumptions that market participants would use in pricing an asset or liability, including assumptions about risk. Development of these assumptions may require judgment.
For additional details on postretirement benefits, including the fair value measurements for the assets of the DB Pension Plans and OPEB Plan, see
Item 8. Financial Statements and Supplementary Data—Notes to the Consolidated Financial Statements—
Note 12, Retirement Benefits
.
Unbilled Revenues:
Consumers’ customers are billed monthly in cycles having billing dates that do not generally coincide with the end of a calendar month. This results in customers having received electricity or natural gas that they have not been billed for as of the month-end. Consumers estimates its unbilled revenues by applying an average billed rate to total unbilled deliveries for each customer class.
For additional information on unbilled revenues, see
Item 8. Financial Statements and Supplementary Data—Notes to the Consolidated Financial Statements—
Note 16, Revenue
.
New Accounting Standards
For details regarding new accounting standards issued but not yet effective, see
Item 8. Financial Statements and Supplementary Data—Notes to the Consolidated Financial Statements—
Note 2, New Accounting Standards
.
91
Item 7A.
Quantitative and Qualitative Disclosures About Market Risk
CMS Energy and Consumers are exposed to market risks including, but not limited to, changes in interest rates, commodity prices, and investment security prices. They may enter into various risk management contracts to mitigate exposure to these risks, including swaps, options, futures, and forward contracts. CMS Energy and Consumers enter into these contracts using established policies and procedures, under the direction of an executive oversight committee consisting of certain officers and a risk committee consisting of those and other officers and business managers.
The following risk sensitivities illustrate the potential loss in fair value, cash flows, or future earnings from financial instruments, assuming a hypothetical adverse change in market rates or prices of ten percent. Potential losses could exceed the amounts shown in the sensitivity analyses if changes in market rates or prices were to exceed ten percent.
Interest-Rate Risk:
CMS Energy and Consumers are exposed to interest-rate risk resulting from issuing fixed-rate and variable-rate financing instruments. CMS Energy and Consumers use a combination of these instruments, and may also enter into interest-rate swap agreements, in order to manage this risk and to achieve a reasonable cost of capital.
Presented in the following table is a sensitivity analysis of interest-rate risk (assuming an adverse change in market interest rates of ten percent):
|
In Millions
|
||||||||
|
December 31
|
2018
|
2017
|
||||||
|
Fixed-rate financing—potential loss in fair value
|
||||||||
|
CMS Energy, including Consumers
|
$
|
465
|
|
$
|
329
|
|
||
|
Consumers
|
330
|
|
213
|
|
||||
The fair value losses in the above table could be realized only if CMS Energy and Consumers transferred all of their fixed-rate financing to other creditors. The annual earnings exposure related to variable-rate financing was immaterial for both CMS Energy and Consumers at
December 31, 2018
and
2017
, assuming an adverse change in market interest rates of ten percent.
Notes Receivable Risk:
CMS Energy is exposed to interest-rate risk resulting from EnerBank’s fixed-rate installment loans. EnerBank provides these loans to homeowners to finance home improvements.
Presented in the following table is a sensitivity analysis of notes receivable (assuming an adverse change in market interest rates of ten percent):
|
In Millions
|
||||||||
|
December 31
|
2018
|
2017
|
||||||
|
CMS Energy, including Consumers
|
||||||||
|
Potential reduction in fair value
|
||||||||
|
Notes receivable
|
$
|
46
|
|
$
|
32
|
|
||
The fair value losses for CMS Energy in the above table could be realized only if EnerBank sold its loans to other parties. For additional details on financial instruments, see
Item 8. Financial Statements and Supplementary Data—Notes to the Consolidated Financial Statements—
Note 7, Financial Instruments
.
92
Item 8.
Financial Statements and Supplementary Data
Index to Financial Statements
93
CMS Energy Corporation
Consolidated Statements of Income
|
In Millions
|
||||||||||||
|
Years Ended December 31
|
2018
|
2017
|
2016
|
|||||||||
|
Operating Revenue
|
$
|
6,873
|
|
$
|
6,583
|
|
$
|
6,399
|
|
|||
|
Operating Expenses
|
||||||||||||
|
Fuel for electric generation
|
528
|
|
505
|
|
499
|
|
||||||
|
Purchased and interchange power
|
1,613
|
|
1,503
|
|
1,508
|
|
||||||
|
Purchased power – related parties
|
81
|
|
86
|
|
86
|
|
||||||
|
Cost of gas sold
|
836
|
|
750
|
|
710
|
|
||||||
|
Maintenance and other operating expenses
|
1,417
|
|
1,236
|
|
1,248
|
|
||||||
|
Depreciation and amortization
|
933
|
|
881
|
|
811
|
|
||||||
|
General taxes
|
303
|
|
284
|
|
281
|
|
||||||
|
Total operating expenses
|
5,711
|
|
5,245
|
|
5,143
|
|
||||||
|
Operating Income
|
1,162
|
|
1,338
|
|
1,256
|
|
||||||
|
Other Income (Expense)
|
||||||||||||
|
Interest income
|
11
|
|
12
|
|
6
|
|
||||||
|
Allowance for equity funds used during construction
|
6
|
|
5
|
|
12
|
|
||||||
|
Income from equity method investees
|
9
|
|
15
|
|
13
|
|
||||||
|
Nonoperating retirement benefits, net
|
90
|
|
24
|
|
41
|
|
||||||
|
Other income
|
2
|
|
6
|
|
8
|
|
||||||
|
Other expense
|
(48
|
)
|
(76
|
)
|
(75
|
)
|
||||||
|
Total other income (expense)
|
70
|
|
(14
|
)
|
5
|
|
||||||
|
Interest Charges
|
||||||||||||
|
Interest on long-term debt
|
412
|
|
406
|
|
411
|
|
||||||
|
Other interest expense
|
49
|
|
34
|
|
29
|
|
||||||
|
Allowance for borrowed funds used during construction
|
(3
|
)
|
(2
|
)
|
(5
|
)
|
||||||
|
Total interest charges
|
458
|
|
438
|
|
435
|
|
||||||
|
Income Before Income Taxes
|
774
|
|
886
|
|
826
|
|
||||||
|
Income Tax Expense
|
115
|
|
424
|
|
273
|
|
||||||
|
Net Income
|
659
|
|
462
|
|
553
|
|
||||||
|
Income Attributable to Noncontrolling Interests
|
2
|
|
2
|
|
2
|
|
||||||
|
Net Income Available to Common Stockholders
|
$
|
657
|
|
$
|
460
|
|
$
|
551
|
|
|||
|
Basic Earnings Per Average Common Share
|
$
|
2.33
|
|
$
|
1.64
|
|
$
|
1.99
|
|
|||
|
Diluted Earnings Per Average Common Share
|
$
|
2.32
|
|
$
|
1.64
|
|
$
|
1.98
|
|
|||
The accompanying notes are an integral part of these statements.
94
CMS Energy Corporation
Consolidated Statements of Comprehensive Income
|
In Millions
|
||||||||||||
|
Years Ended December 31
|
2018
|
2017
|
2016
|
|||||||||
|
Net Income
|
$
|
659
|
|
$
|
462
|
|
$
|
553
|
|
|||
|
Retirement Benefits Liability
|
||||||||||||
|
Net loss arising during the period, net of tax of $(1), $(4), and $(5)
|
(4
|
)
|
(5
|
)
|
(8
|
)
|
||||||
|
Prior service credit adjustment, net of tax of $-, $3, and $-
|
(1
|
)
|
4
|
|
—
|
|
||||||
|
Amortization of net actuarial loss, net of tax of $1, $1, and $-
|
4
|
|
2
|
|
2
|
|
||||||
|
Amortization of prior service credit, net of tax of $(1), $-, and $-
|
(1
|
)
|
(1
|
)
|
(1
|
)
|
||||||
|
Investments
|
||||||||||||
|
Unrealized gain on investments, net of tax of $- for all periods
|
—
|
|
—
|
|
1
|
|
||||||
|
Other-than-temporary impairment included in net income, net of tax of $-, $-, and $2
|
—
|
|
—
|
|
3
|
|
||||||
|
Derivatives
|
||||||||||||
|
Unrealized loss on derivative instruments, net of tax of $- for all periods
|
(2
|
)
|
—
|
|
—
|
|
||||||
|
Other Comprehensive Loss
|
(2
|
)
|
—
|
|
(3
|
)
|
||||||
|
Comprehensive Income
|
657
|
|
462
|
|
550
|
|
||||||
|
Comprehensive Income Attributable to Noncontrolling Interests
|
2
|
|
2
|
|
2
|
|
||||||
|
Comprehensive Income Attributable to CMS Energy
|
$
|
655
|
|
$
|
460
|
|
$
|
548
|
|
|||
The accompanying notes are an integral part of these statements.
95
CMS Energy Corporation
Consolidated Statements of Cash Flows
|
In Millions
|
||||||||||||
|
Years Ended December 31
|
2018
|
2017
|
2016
|
|||||||||
|
Cash Flows from Operating Activities
|
||||||||||||
|
Net income
|
$
|
659
|
|
$
|
462
|
|
$
|
553
|
|
|||
|
Adjustments to reconcile net income to net cash provided by operating activities
|
||||||||||||
|
Depreciation and amortization
|
933
|
|
881
|
|
811
|
|
||||||
|
Deferred income taxes and investment tax credit
|
182
|
|
417
|
|
264
|
|
||||||
|
Bad debt expense
|
54
|
|
49
|
|
50
|
|
||||||
|
Other non-cash operating activities and reconciling adjustments
|
22
|
|
82
|
|
52
|
|
||||||
|
Postretirement benefits contributions
|
(252
|
)
|
(12
|
)
|
(108
|
)
|
||||||
|
Cash provided by (used in) changes in assets and liabilities
|
||||||||||||
|
Accounts and notes receivable and accrued revenue
|
15
|
|
(66
|
)
|
(155
|
)
|
||||||
|
Inventories
|
14
|
|
(46
|
)
|
146
|
|
||||||
|
Accounts payable and accrued rate refunds
|
22
|
|
49
|
|
59
|
|
||||||
|
Other current and non-current assets and liabilities
|
54
|
|
(111
|
)
|
(43
|
)
|
||||||
|
Net cash provided by operating activities
|
1,703
|
|
1,705
|
|
1,629
|
|
||||||
|
Cash Flows from Investing Activities
|
||||||||||||
|
Capital expenditures (excludes assets placed under capital lease)
|
(2,074
|
)
|
(1,665
|
)
|
(1,672
|
)
|
||||||
|
Increase in EnerBank notes receivable
|
(307
|
)
|
(138
|
)
|
(136
|
)
|
||||||
|
Purchase of notes receivable by EnerBank
|
(225
|
)
|
—
|
|
—
|
|
||||||
|
Proceeds from DB SERP investments
|
146
|
|
—
|
|
—
|
|
||||||
|
Proceeds from the sale of EnerBank notes receivable
|
—
|
|
50
|
|
—
|
|
||||||
|
Cost to retire property and other investing activities
|
(146
|
)
|
(115
|
)
|
(107
|
)
|
||||||
|
Net cash used in investing activities
|
(2,606
|
)
|
(1,868
|
)
|
(1,915
|
)
|
||||||
|
Cash Flows from Financing Activities
|
||||||||||||
|
Proceeds from issuance of debt
|
2,767
|
|
1,633
|
|
1,049
|
|
||||||
|
Retirement of debt
|
(1,870
|
)
|
(980
|
)
|
(728
|
)
|
||||||
|
Increase in EnerBank certificates of deposit
|
513
|
|
47
|
|
100
|
|
||||||
|
Increase (decrease) in notes payable
|
(73
|
)
|
(228
|
)
|
149
|
|
||||||
|
Issuance of common stock
|
41
|
|
83
|
|
72
|
|
||||||
|
Payment of dividends on common and preferred stock
|
(407
|
)
|
(377
|
)
|
(347
|
)
|
||||||
|
Debt prepayment costs
|
(36
|
)
|
(22
|
)
|
(18
|
)
|
||||||
|
Payment of capital lease obligations and other financing costs
|
(61
|
)
|
(46
|
)
|
(22
|
)
|
||||||
|
Net cash provided by financing activities
|
874
|
|
110
|
|
255
|
|
||||||
|
Net Decrease in Cash and Cash Equivalents, Including Restricted Amounts
|
(29
|
)
|
(53
|
)
|
(31
|
)
|
||||||
|
Cash and Cash Equivalents, Including Restricted Amounts, Beginning of Period
|
204
|
|
257
|
|
288
|
|
||||||
|
Cash and Cash Equivalents, Including Restricted Amounts, End of Period
|
$
|
175
|
|
$
|
204
|
|
$
|
257
|
|
|||
96
|
In Millions
|
||||||||||||
|
Years Ended December 31
|
2018
|
2017
|
2016
|
|||||||||
|
Other cash flow activities and non-cash investing and financing activities
|
||||||||||||
|
Cash transactions
|
||||||||||||
|
Interest paid (net of amounts capitalized)
|
$
|
458
|
|
$
|
418
|
|
$
|
427
|
|
|||
|
Income taxes paid (refunds received), net
|
(123
|
)
|
5
|
|
32
|
|
||||||
|
Non-cash transactions
|
||||||||||||
|
Capital expenditures not paid
|
158
|
|
172
|
|
138
|
|
||||||
|
Note receivable recorded for future refund of use taxes paid and capitalized
|
—
|
|
—
|
|
29
|
|
||||||
|
Other assets placed under capital lease
|
—
|
|
3
|
|
13
|
|
||||||
The accompanying notes are an integral part of these statements.
97
CMS Energy Corporation
Consolidated Balance Sheets
|
ASSETS
|
||||||||
|
In Millions
|
||||||||
|
December 31
|
2018
|
2017
|
||||||
|
Current Assets
|
||||||||
|
Cash and cash equivalents
|
$
|
153
|
|
$
|
182
|
|
||
|
Restricted cash and cash equivalents
|
21
|
|
17
|
|
||||
|
Accounts receivable and accrued revenue, less allowances of $20 in both periods
|
964
|
|
1,032
|
|
||||
|
Notes receivable, less allowances of $24 in 2018 and $20 in 2017
|
233
|
|
198
|
|
||||
|
Notes receivable held for sale
|
—
|
|
2
|
|
||||
|
Accounts receivable – related parties
|
14
|
|
12
|
|
||||
|
Accrued gas revenue
|
16
|
|
—
|
|
||||
|
Inventories at average cost
|
||||||||
|
Gas in underground storage
|
450
|
|
458
|
|
||||
|
Materials and supplies
|
143
|
|
133
|
|
||||
|
Generating plant fuel stock
|
57
|
|
81
|
|
||||
|
Deferred property taxes
|
279
|
|
257
|
|
||||
|
Regulatory assets
|
37
|
|
20
|
|
||||
|
Prepayments and other current assets
|
101
|
|
83
|
|
||||
|
Total current assets
|
2,468
|
|
2,475
|
|
||||
|
Plant, Property, and Equipment
|
||||||||
|
Plant, property, and equipment, gross
|
24,400
|
|
22,506
|
|
||||
|
Less accumulated depreciation and amortization
|
7,037
|
|
6,510
|
|
||||
|
Plant, property, and equipment, net
|
17,363
|
|
15,996
|
|
||||
|
Construction work in progress
|
763
|
|
765
|
|
||||
|
Total plant, property, and equipment
|
18,126
|
|
16,761
|
|
||||
|
Other Non-current Assets
|
||||||||
|
Regulatory assets
|
1,743
|
|
1,764
|
|
||||
|
Accounts and notes receivable
|
1,645
|
|
1,187
|
|
||||
|
Investments
|
69
|
|
64
|
|
||||
|
Other
|
478
|
|
799
|
|
||||
|
Total other non-current assets
|
3,935
|
|
3,814
|
|
||||
|
Total Assets
|
$
|
24,529
|
|
$
|
23,050
|
|
||
98
|
LIABILITIES AND EQUITY
|
||||||||
|
In Millions
|
||||||||
|
December 31
|
2018
|
2017
|
||||||
|
Current Liabilities
|
||||||||
|
Current portion of long-term debt, capital leases, and financing obligation
|
$
|
996
|
|
$
|
1,103
|
|
||
|
Notes payable
|
97
|
|
170
|
|
||||
|
Accounts payable
|
723
|
|
725
|
|
||||
|
Accounts payable – related parties
|
10
|
|
15
|
|
||||
|
Accrued rate refunds
|
4
|
|
33
|
|
||||
|
Accrued interest
|
94
|
|
103
|
|
||||
|
Accrued taxes
|
398
|
|
360
|
|
||||
|
Regulatory liabilities
|
155
|
|
80
|
|
||||
|
Other current liabilities
|
147
|
|
195
|
|
||||
|
Total current liabilities
|
2,624
|
|
2,784
|
|
||||
|
Non-current Liabilities
|
||||||||
|
Long-term debt
|
10,615
|
|
9,123
|
|
||||
|
Non-current portion of capital leases and financing obligation
|
69
|
|
91
|
|
||||
|
Regulatory liabilities
|
3,681
|
|
3,715
|
|
||||
|
Postretirement benefits
|
436
|
|
766
|
|
||||
|
Asset retirement obligations
|
432
|
|
430
|
|
||||
|
Deferred investment tax credit
|
99
|
|
87
|
|
||||
|
Deferred income taxes
|
1,487
|
|
1,269
|
|
||||
|
Other non-current liabilities
|
294
|
|
307
|
|
||||
|
Total non-current liabilities
|
17,113
|
|
15,788
|
|
||||
|
Commitments and Contingencies
(Notes 3 and 4)
|
|
|
|
|
||||
|
Equity
|
||||||||
|
Common stockholders’ equity
|
||||||||
|
Common stock, authorized 350.0 shares; outstanding 283.4 shares in 2018 and 281.6 shares in 2017
|
3
|
|
3
|
|
||||
|
Other paid-in capital
|
5,088
|
|
5,019
|
|
||||
|
Accumulated other comprehensive loss
|
(65
|
)
|
(50
|
)
|
||||
|
Accumulated deficit
|
(271
|
)
|
(531
|
)
|
||||
|
Total common stockholders’ equity
|
4,755
|
|
4,441
|
|
||||
|
Noncontrolling interests
|
37
|
|
37
|
|
||||
|
Total equity
|
4,792
|
|
4,478
|
|
||||
|
Total Liabilities and Equity
|
$
|
24,529
|
|
$
|
23,050
|
|
||
The accompanying notes are an integral part of these statements.
99
CMS Energy Corporation
Consolidated Statements of Changes in Equity
|
In Millions, Except Number of Shares in Thousands and Per Share Amounts
|
||||||||||||||||||
|
Number of Shares
|
||||||||||||||||||
|
Years Ended December 31
|
2018
|
|
2017
|
|
2016
|
|
2018
|
2017
|
2016
|
|||||||||
|
Total Equity at Beginning of Period
|
$
|
4,478
|
|
$
|
4,290
|
|
$
|
3,975
|
|
|||||||||
|
Common Stock
|
||||||||||||||||||
|
At beginning and end of period
|
3
|
|
3
|
|
3
|
|
||||||||||||
|
Other Paid-in Capital
|
||||||||||||||||||
|
At beginning of period
|
281,647
|
|
279,206
|
|
277,163
|
|
5,019
|
|
4,916
|
|
4,837
|
|
||||||
|
Common stock issued
|
1,554
|
|
2,492
|
|
2,580
|
|
59
|
|
102
|
|
90
|
|
||||||
|
Common stock repurchased
|
(224
|
)
|
(317
|
)
|
(292
|
)
|
(10
|
)
|
(14
|
)
|
(11
|
)
|
||||||
|
Common stock reissued
|
423
|
|
360
|
|
—
|
|
20
|
|
15
|
|
—
|
|
||||||
|
Common stock reacquired
|
(26
|
)
|
(94
|
)
|
(245
|
)
|
—
|
|
—
|
|
—
|
|
||||||
|
At end of period
|
283,374
|
|
281,647
|
|
279,206
|
|
5,088
|
|
5,019
|
|
4,916
|
|
||||||
|
Accumulated Other Comprehensive Loss
|
||||||||||||||||||
|
At beginning of period
|
(50
|
)
|
(50
|
)
|
(47
|
)
|
||||||||||||
|
Retirement benefits liability
|
||||||||||||||||||
|
At beginning of period
|
(50
|
)
|
(50
|
)
|
(43
|
)
|
||||||||||||
|
Cumulative effect of change in accounting principle
|
(11
|
)
|
—
|
|
—
|
|
||||||||||||
|
Net loss arising during the period
|
(4
|
)
|
(5
|
)
|
(8
|
)
|
||||||||||||
|
Prior service credit adjustment
|
(1
|
)
|
4
|
|
—
|
|
||||||||||||
|
Amortization of net actuarial loss
|
4
|
|
2
|
|
2
|
|
||||||||||||
|
Amortization of prior service credit
|
(1
|
)
|
(1
|
)
|
(1
|
)
|
||||||||||||
|
At end of period
|
(63
|
)
|
(50
|
)
|
(50
|
)
|
||||||||||||
|
Investments
|
||||||||||||||||||
|
At beginning of period
|
—
|
|
—
|
|
(4
|
)
|
||||||||||||
|
Unrealized gain on investments
|
—
|
|
—
|
|
1
|
|
||||||||||||
|
Other-than-temporary impairment included in net income
|
—
|
|
—
|
|
3
|
|
||||||||||||
|
At end of period
|
—
|
|
—
|
|
—
|
|
||||||||||||
|
Derivative instruments
|
||||||||||||||||||
|
At beginning of period
|
—
|
|
—
|
|
—
|
|
||||||||||||
|
Unrealized loss on derivative instruments
|
(2
|
)
|
—
|
|
—
|
|
||||||||||||
|
At end of period
|
(2
|
)
|
—
|
|
—
|
|
||||||||||||
|
At end of period
|
(65
|
)
|
(50
|
)
|
(50
|
)
|
||||||||||||
100
|
In Millions, Except Number of Shares in Thousands and Per Share Amounts
|
||||||||||||||||||
|
Number of Shares
|
||||||||||||||||||
|
Years Ended December 31
|
2018
|
|
2017
|
|
2016
|
|
2018
|
2017
|
2016
|
|||||||||
|
Accumulated Deficit
|
||||||||||||||||||
|
At beginning of period
|
(531
|
)
|
(616
|
)
|
(855
|
)
|
||||||||||||
|
Cumulative effect of change in accounting principle
|
8
|
|
—
|
|
33
|
|
||||||||||||
|
Net income attributable to CMS Energy
|
657
|
|
460
|
|
551
|
|
||||||||||||
|
Dividends declared on common stock
|
(405
|
)
|
(375
|
)
|
(345
|
)
|
||||||||||||
|
At end of period
|
(271
|
)
|
(531
|
)
|
(616
|
)
|
||||||||||||
|
Noncontrolling Interests
|
||||||||||||||||||
|
At beginning of period
|
37
|
|
37
|
|
37
|
|
||||||||||||
|
Income attributable to noncontrolling interests
|
2
|
|
2
|
|
2
|
|
||||||||||||
|
Distributions and other changes in noncontrolling interests
|
(2
|
)
|
(2
|
)
|
(2
|
)
|
||||||||||||
|
At end of period
|
37
|
|
37
|
|
37
|
|
||||||||||||
|
Total Equity at End of Period
|
$
|
4,792
|
|
$
|
4,478
|
|
$
|
4,290
|
|
|||||||||
|
|
|
|||||||||||||||||
|
Dividends declared per common share
|
$
|
1.43
|
|
$
|
1.33
|
|
$
|
1.24
|
|
|||||||||
The accompanying notes are an integral part of these statements.
101
Consumers Energy Company
Consolidated Statements of Income
|
In Millions
|
||||||||||||
|
Years Ended December 31
|
2018
|
2017
|
2016
|
|||||||||
|
Operating Revenue
|
$
|
6,464
|
|
$
|
6,222
|
|
$
|
6,064
|
|
|||
|
Operating Expenses
|
||||||||||||
|
Fuel for electric generation
|
407
|
|
398
|
|
393
|
|
||||||
|
Purchased and interchange power
|
1,587
|
|
1,491
|
|
1,486
|
|
||||||
|
Purchased power – related parties
|
83
|
|
90
|
|
88
|
|
||||||
|
Cost of gas sold
|
819
|
|
730
|
|
693
|
|
||||||
|
Maintenance and other operating expenses
|
1,287
|
|
1,113
|
|
1,127
|
|
||||||
|
Depreciation and amortization
|
921
|
|
872
|
|
803
|
|
||||||
|
General taxes
|
295
|
|
276
|
|
277
|
|
||||||
|
Total operating expenses
|
5,399
|
|
4,970
|
|
4,867
|
|
||||||
|
Operating Income
|
1,065
|
|
1,252
|
|
1,197
|
|
||||||
|
Other Income (Expense)
|
||||||||||||
|
Interest income
|
8
|
|
9
|
|
4
|
|
||||||
|
Interest and dividend income – related parties
|
2
|
|
1
|
|
1
|
|
||||||
|
Allowance for equity funds used during construction
|
6
|
|
5
|
|
12
|
|
||||||
|
Nonoperating retirement benefits, net
|
83
|
|
21
|
|
37
|
|
||||||
|
Other income
|
2
|
|
17
|
|
8
|
|
||||||
|
Other expense
|
(30
|
)
|
(58
|
)
|
(55
|
)
|
||||||
|
Total other income (expense)
|
71
|
|
(5
|
)
|
7
|
|
||||||
|
Interest Charges
|
||||||||||||
|
Interest on long-term debt
|
276
|
|
263
|
|
261
|
|
||||||
|
Other interest expense
|
16
|
|
15
|
|
12
|
|
||||||
|
Allowance for borrowed funds used during construction
|
(3
|
)
|
(2
|
)
|
(5
|
)
|
||||||
|
Total interest charges
|
289
|
|
276
|
|
268
|
|
||||||
|
Income Before Income Taxes
|
847
|
|
971
|
|
936
|
|
||||||
|
Income Tax Expense
|
142
|
|
339
|
|
320
|
|
||||||
|
Net Income
|
705
|
|
632
|
|
616
|
|
||||||
|
Preferred Stock Dividends
|
2
|
|
2
|
|
2
|
|
||||||
|
Net Income Available to Common Stockholder
|
$
|
703
|
|
$
|
630
|
|
$
|
614
|
|
|||
The accompanying notes are an integral part of these statements.
102
Consumers Energy Company
Consolidated Statements of Comprehensive Income
|
In Millions
|
||||||||||||
|
Years Ended December 31
|
2018
|
2017
|
2016
|
|||||||||
|
Net Income
|
$
|
705
|
|
$
|
632
|
|
$
|
616
|
|
|||
|
Retirement Benefits Liability
|
||||||||||||
|
Net gain (loss) arising during the period, net of tax of $2, $(1), and $(1)
|
6
|
|
(4
|
)
|
(3
|
)
|
||||||
|
Amortization of net actuarial loss, net of tax of $- for all periods
|
2
|
|
1
|
|
1
|
|
||||||
|
Investments
|
||||||||||||
|
Unrealized gain (loss) on investments, net of tax of $-, $1, and $2
|
(1
|
)
|
3
|
|
3
|
|
||||||
|
Reclassification adjustments included in net income, net of tax of $-, $(6), and $-
|
1
|
|
(9
|
)
|
—
|
|
||||||
|
Other-than-temporary impairment included in net income, net of tax of $-, $-, and $2
|
—
|
|
—
|
|
2
|
|
||||||
|
Other Comprehensive Income (Loss)
|
8
|
|
(9
|
)
|
3
|
|
||||||
|
Comprehensive Income
|
$
|
713
|
|
$
|
623
|
|
$
|
619
|
|
|||
The accompanying notes are an integral part of these statements.
103
Consumers Energy Company
Consolidated Statements of Cash Flows
|
In Millions
|
||||||||||||
|
Years Ended December 31
|
2018
|
2017
|
2016
|
|||||||||
|
Cash Flows from Operating Activities
|
||||||||||||
|
Net income
|
$
|
705
|
|
$
|
632
|
|
$
|
616
|
|
|||
|
Adjustments to reconcile net income to net cash provided by operating activities
|
||||||||||||
|
Depreciation and amortization
|
921
|
|
872
|
|
803
|
|
||||||
|
Deferred income taxes and investment tax credit
|
123
|
|
163
|
|
289
|
|
||||||
|
Bad debt expense
|
29
|
|
29
|
|
31
|
|
||||||
|
Other non-cash operating activities and reconciling adjustments
|
13
|
|
59
|
|
25
|
|
||||||
|
Postretirement benefits contributions
|
(242
|
)
|
(8
|
)
|
(98
|
)
|
||||||
|
Cash provided by (used in) changes in assets and liabilities
|
||||||||||||
|
Accounts and notes receivable and accrued revenue
|
(26
|
)
|
(63
|
)
|
(138
|
)
|
||||||
|
Inventories
|
15
|
|
(45
|
)
|
145
|
|
||||||
|
Accounts payable and accrued rate refunds
|
12
|
|
43
|
|
57
|
|
||||||
|
Other current and non-current assets and liabilities
|
(101
|
)
|
33
|
|
(49
|
)
|
||||||
|
Net cash provided by operating activities
|
1,449
|
|
1,715
|
|
1,681
|
|
||||||
|
Cash Flows from Investing Activities
|
||||||||||||
|
Capital expenditures (excludes assets placed under capital lease)
|
(1,822
|
)
|
(1,632
|
)
|
(1,656
|
)
|
||||||
|
Proceeds from DB SERP investments
|
106
|
|
—
|
|
—
|
|
||||||
|
DB SERP investment in note receivable – related party
|
(106
|
)
|
—
|
|
—
|
|
||||||
|
Cost to retire property and other investing activities
|
(149
|
)
|
(119
|
)
|
(112
|
)
|
||||||
|
Net cash used in investing activities
|
(1,971
|
)
|
(1,751
|
)
|
(1,768
|
)
|
||||||
|
Cash Flows from Financing Activities
|
||||||||||||
|
Proceeds from issuance of debt
|
2,106
|
|
834
|
|
446
|
|
||||||
|
Retirement of debt
|
(1,193
|
)
|
(555
|
)
|
(198
|
)
|
||||||
|
Increase (decrease) in notes payable
|
(73
|
)
|
(228
|
)
|
149
|
|
||||||
|
Stockholder contribution
|
250
|
|
450
|
|
275
|
|
||||||
|
Payment of dividends on common and preferred stock
|
(533
|
)
|
(524
|
)
|
(501
|
)
|
||||||
|
Debt prepayment costs
|
(20
|
)
|
(4
|
)
|
—
|
|
||||||
|
Payment of capital lease obligations and other financing costs
|
(24
|
)
|
(24
|
)
|
(3
|
)
|
||||||
|
Net cash provided by (used in) financing activities
|
513
|
|
(51
|
)
|
168
|
|
||||||
|
Net Increase (Decrease) in Cash and Cash Equivalents, Including Restricted Amounts
|
(9
|
)
|
(87
|
)
|
81
|
|
||||||
|
Cash and Cash Equivalents, Including Restricted Amounts, Beginning of Period
|
65
|
|
152
|
|
71
|
|
||||||
|
Cash and Cash Equivalents, Including Restricted Amounts, End of Period
|
$
|
56
|
|
$
|
65
|
|
$
|
152
|
|
|||
104
|
In Millions
|
||||||||||||
|
Years Ended December 31
|
2018
|
2017
|
2016
|
|||||||||
|
Other cash flow activities and non-cash investing and financing activities
|
||||||||||||
|
Cash transactions
|
||||||||||||
|
Interest paid (net of amounts capitalized)
|
$
|
287
|
|
$
|
266
|
|
$
|
256
|
|
|||
|
Income taxes paid (refunds received), net
|
156
|
|
(1
|
)
|
50
|
|
||||||
|
Non-cash transactions
|
||||||||||||
|
Capital expenditures not paid
|
143
|
|
160
|
|
127
|
|
||||||
|
Note receivable recorded for future refund of use taxes paid and capitalized
|
—
|
|
—
|
|
29
|
|
||||||
|
Other assets placed under capital lease
|
—
|
|
3
|
|
13
|
|
||||||
The accompanying notes are an integral part of these statements.
105
Consumers Energy Company
Consolidated Balance Sheets
|
ASSETS
|
||||||||
|
In Millions
|
||||||||
|
December 31
|
2018
|
2017
|
||||||
|
Current Assets
|
||||||||
|
Cash and cash equivalents
|
$
|
39
|
|
$
|
44
|
|
||
|
Restricted cash and cash equivalents
|
17
|
|
17
|
|
||||
|
Accounts receivable and accrued revenue, less allowances of $20 in both periods
|
855
|
|
885
|
|
||||
|
Notes receivable
|
—
|
|
17
|
|
||||
|
Accounts and notes receivable – related parties
|
15
|
|
2
|
|
||||
|
Accrued gas revenue
|
16
|
|
—
|
|
||||
|
Inventories at average cost
|
||||||||
|
Gas in underground storage
|
450
|
|
458
|
|
||||
|
Materials and supplies
|
137
|
|
128
|
|
||||
|
Generating plant fuel stock
|
52
|
|
76
|
|
||||
|
Deferred property taxes
|
279
|
|
257
|
|
||||
|
Regulatory assets
|
37
|
|
20
|
|
||||
|
Prepayments and other current assets
|
83
|
|
71
|
|
||||
|
Total current assets
|
1,980
|
|
1,975
|
|
||||
|
Plant, Property, and Equipment
|
||||||||
|
Plant, property, and equipment, gross
|
23,963
|
|
22,318
|
|
||||
|
Less accumulated depreciation and amortization
|
6,958
|
|
6,441
|
|
||||
|
Plant, property, and equipment, net
|
17,005
|
|
15,877
|
|
||||
|
Construction work in progress
|
756
|
|
753
|
|
||||
|
Total plant, property, and equipment
|
17,761
|
|
16,630
|
|
||||
|
Other Non-current Assets
|
||||||||
|
Regulatory assets
|
1,743
|
|
1,764
|
|
||||
|
Accounts receivable
|
27
|
|
22
|
|
||||
|
Accounts and notes receivable – related parties
|
104
|
|
—
|
|
||||
|
Other
|
410
|
|
708
|
|
||||
|
Total other non-current assets
|
2,284
|
|
2,494
|
|
||||
|
Total Assets
|
$
|
22,025
|
|
$
|
21,099
|
|
||
106
|
LIABILITIES AND EQUITY
|
||||||||
|
In Millions
|
||||||||
|
December 31
|
2018
|
2017
|
||||||
|
Current Liabilities
|
||||||||
|
Current portion of long-term debt, capital leases, and financing obligation
|
$
|
48
|
|
$
|
365
|
|
||
|
Notes payable
|
97
|
|
170
|
|
||||
|
Accounts payable
|
685
|
|
701
|
|
||||
|
Accounts payable – related parties
|
14
|
|
19
|
|
||||
|
Accrued rate refunds
|
4
|
|
33
|
|
||||
|
Accrued interest
|
59
|
|
67
|
|
||||
|
Accrued taxes
|
436
|
|
542
|
|
||||
|
Regulatory liabilities
|
155
|
|
80
|
|
||||
|
Other current liabilities
|
120
|
|
159
|
|
||||
|
Total current liabilities
|
1,618
|
|
2,136
|
|
||||
|
Non-current Liabilities
|
||||||||
|
Long-term debt
|
6,779
|
|
5,561
|
|
||||
|
Non-current portion of capital leases and financing obligation
|
69
|
|
91
|
|
||||
|
Regulatory liabilities
|
3,681
|
|
3,715
|
|
||||
|
Postretirement benefits
|
392
|
|
711
|
|
||||
|
Asset retirement obligations
|
428
|
|
429
|
|
||||
|
Deferred investment tax credit
|
99
|
|
87
|
|
||||
|
Deferred income taxes
|
1,809
|
|
1,640
|
|
||||
|
Other non-current liabilities
|
230
|
|
241
|
|
||||
|
Total non-current liabilities
|
13,487
|
|
12,475
|
|
||||
|
Commitments and Contingencies
(Notes 3 and 4)
|
|
|
|
|
||||
|
Equity
|
||||||||
|
Common stockholder’s equity
|
||||||||
|
Common stock, authorized 125.0 shares; outstanding 84.1 shares in both periods
|
841
|
|
841
|
|
||||
|
Other paid-in capital
|
4,699
|
|
4,449
|
|
||||
|
Accumulated other comprehensive loss
|
(21
|
)
|
(12
|
)
|
||||
|
Retained earnings
|
1,364
|
|
1,173
|
|
||||
|
Total common stockholder’s equity
|
6,883
|
|
6,451
|
|
||||
|
Cumulative preferred stock, $4.50 series
|
37
|
|
37
|
|
||||
|
Total equity
|
6,920
|
|
6,488
|
|
||||
|
Total Liabilities and Equity
|
$
|
22,025
|
|
$
|
21,099
|
|
||
The accompanying notes are an integral part of these statements.
107
Consumers Energy Company
Consolidated Statements of Changes in Equity
|
In Millions
|
||||||||||||
|
Years Ended December 31
|
2018
|
2017
|
2016
|
|||||||||
|
Total Equity at Beginning of Period
|
$
|
6,488
|
|
$
|
5,939
|
|
$
|
5,546
|
|
|||
|
Common Stock
|
||||||||||||
|
At beginning and end of period
|
841
|
|
841
|
|
841
|
|
||||||
|
Other Paid-in Capital
|
||||||||||||
|
At beginning of period
|
4,449
|
|
3,999
|
|
3,724
|
|
||||||
|
Stockholder contribution
|
250
|
|
450
|
|
275
|
|
||||||
|
At end of period
|
4,699
|
|
4,449
|
|
3,999
|
|
||||||
|
Accumulated Other Comprehensive Loss
|
||||||||||||
|
At beginning of period
|
(12
|
)
|
(3
|
)
|
(6
|
)
|
||||||
|
Retirement benefits liability
|
||||||||||||
|
At beginning of period
|
(24
|
)
|
(21
|
)
|
(19
|
)
|
||||||
|
Cumulative effect of change in accounting principle
|
(5
|
)
|
—
|
|
—
|
|
||||||
|
Net gain (loss) arising during the period
|
6
|
|
(4
|
)
|
(3
|
)
|
||||||
|
Amortization of net actuarial loss
|
2
|
|
1
|
|
1
|
|
||||||
|
At end of period
|
(21
|
)
|
(24
|
)
|
(21
|
)
|
||||||
|
Investments
|
||||||||||||
|
At beginning of period
|
12
|
|
18
|
|
13
|
|
||||||
|
Cumulative effect of change in accounting principle
|
(12
|
)
|
—
|
|
—
|
|
||||||
|
Unrealized gain (loss) on investments
|
(1
|
)
|
3
|
|
3
|
|
||||||
|
Reclassification adjustments included in net income
|
1
|
|
(9
|
)
|
—
|
|
||||||
|
Other-than-temporary impairment included in net income
|
—
|
|
—
|
|
2
|
|
||||||
|
At end of period
|
—
|
|
12
|
|
18
|
|
||||||
|
At end of period
|
(21
|
)
|
(12
|
)
|
(3
|
)
|
||||||
|
Retained Earnings
|
||||||||||||
|
At beginning of period
|
1,173
|
|
1,065
|
|
950
|
|
||||||
|
Cumulative effect of change in accounting principle
|
19
|
|
—
|
|
—
|
|
||||||
|
Net income
|
705
|
|
632
|
|
616
|
|
||||||
|
Dividends declared on common stock
|
(531
|
)
|
(522
|
)
|
(499
|
)
|
||||||
|
Dividends declared on preferred stock
|
(2
|
)
|
(2
|
)
|
(2
|
)
|
||||||
|
At end of period
|
1,364
|
|
1,173
|
|
1,065
|
|
||||||
|
Cumulative Preferred Stock
|
||||||||||||
|
At beginning and end of period
|
37
|
|
37
|
|
37
|
|
||||||
|
Total Equity at End of Period
|
$
|
6,920
|
|
$
|
6,488
|
|
$
|
5,939
|
|
|||
The accompanying notes are an integral part of these statements.
108
CMS Energy Corporation
Consumers Energy Company
Notes to the Consolidated Financial Statements
1
:
Significant Accounting Policies
Principles of Consolidation:
CMS Energy and Consumers prepare their consolidated financial statements in conformity with GAAP. CMS Energy’s consolidated financial statements comprise CMS Energy, Consumers, CMS Enterprises, and all other entities in which CMS Energy has a controlling financial interest or is the primary beneficiary. Consumers’ consolidated financial statements comprise Consumers and all other entities in which it has a controlling financial interest or is the primary beneficiary. CMS Energy uses the equity method of accounting for investments in companies and partnerships that are not consolidated, where they have significant influence over operations and financial policies but are not the primary beneficiary. CMS Energy and Consumers eliminate intercompany transactions and balances.
Use of Estimates:
CMS Energy and Consumers are required to make estimates using assumptions that may affect reported amounts and disclosures. Actual results could differ from those estimates.
Contingencies:
CMS Energy and Consumers record estimated liabilities for contingencies on their consolidated financial statements when it is probable that a liability has been incurred and when the amount of loss can be reasonably estimated. For environmental
remediation projects in which the timing of estimated expenditures is considered reliably determinable, CMS Energy and Consumers record the liability at its net present value, using a discount rate equal to the interest rate on monetary assets that are essentially risk-free and have maturities comparable to that of the environmental liability.
CMS Energy and Consumers expense legal fees as incurred; fees incurred but not yet billed are accrued based on estimates of work performed.
Debt Issuance Costs, Discounts, Premiums, and Refinancing Costs:
Upon the issuance of long-term debt, CMS Energy and Consumers defer issuance costs, discounts, and premiums and amortize those amounts over the terms of the associated debt. Debt issuance costs are presented as a direct deduction from the carrying amount of long-term debt on the balance sheet. Upon the refinancing of long-term debt, Consumers, as a regulated entity, defers any remaining unamortized issuance costs, discounts, and premiums associated with the refinanced debt and amortizes those amounts over the term of the newly issued debt. For the non‑regulated portions of CMS Energy’s business, any remaining unamortized issuance costs, discounts, and premiums associated with extinguished debt are charged to earnings.
Derivative Instruments:
In order to support ongoing operations, CMS Energy and Consumers enter into contracts for the future purchase and sale of various commodities, such as electricity, natural gas, and coal. These forward contracts are generally long-term in nature and result in physical delivery of the commodity at a contracted price. Most of these contracts are not subject to derivative accounting for one or more of the following reasons:
|
•
|
they do not have a notional amount (that is, a number of units specified in a derivative instrument, such as MWh of electricity or bcf of natural gas)
|
|
•
|
they qualify for the normal purchases and sales exception
|
|
•
|
there is not an active market for the commodity
|
109
Consumers also uses FTRs to manage price risk related to electricity transmission congestion. An FTR is a financial instrument that entitles its holder to receive compensation or requires its holder to remit payment for congestion-related transmission charges. Consumers accounts for FTRs as derivatives.
Additionally, CMS Energy uses interest rate swaps to manage its interest rate risk on certain long-term debt transactions.
CMS Energy and Consumers record derivative contracts that do not qualify for the normal purchases and sales exception at fair value on their consolidated balance sheets. Each reporting period, the resulting asset or liability is adjusted to reflect any change in the fair value of the contract. At Consumers, changes in fair value are deferred as regulatory assets or liabilities. At CMS Energy, the changes are reported in earnings or, if the derivative qualifies for cash flow hedge accounting, in AOCI. For details regarding CMS Energy’s and Consumers’ derivative instruments recorded at fair value, see
Note 6, Fair Value Measurements
.
EPS:
CMS Energy calculates basic and diluted EPS using the weighted-average number of shares of common stock and dilutive potential common stock outstanding during the period. Potential common stock, for purposes of determining diluted EPS, includes the effects of nonvested stock awards and forward equity sales. CMS Energy computes the effect on potential common stock using the treasury stock method. Diluted EPS excludes the impact of antidilutive securities, which are those securities resulting in an increase in EPS or a decrease in loss per share. For EPS computations, see
Note 15, Earnings Per Share—CMS Energy
.
Impairment of Long-Lived Assets and Equity Method Investments:
CMS Energy and Consumers perform tests of impairment if certain triggering events occur or if there has been a decline in value that may be other than temporary.
CMS Energy and Consumers evaluate long-lived assets held in use for impairment by calculating the undiscounted future cash flows expected to result from the use of the asset and its eventual disposition. If the undiscounted future cash flows are less than the carrying amount, CMS Energy and Consumers recognize an impairment loss equal to the amount by which the carrying amount exceeds the fair value. CMS Energy and Consumers estimate the fair value of the asset using quoted market prices, market prices of similar assets, or discounted future cash flow analyses.
CMS Energy also assesses equity method investments for impairment whenever there has been a decline in value that is other than temporary. This assessment requires CMS Energy to determine the fair value of the equity method investment. CMS Energy determines fair value using valuation methodologies, including discounted cash flows, and assesses the ability of the investee to sustain an earnings capacity that justifies the carrying amount of the investment. CMS Energy records an impairment if the fair value is less than the carrying amount and the decline in value is considered to be other than temporary.
Investment Tax Credits:
Consumers amortizes its investment tax credits over the life of the related property in accordance with regulatory treatment. CMS Energy’s non‑regulated businesses use the deferral method of accounting for investment tax credits. In 2018, CMS Enterprises qualified for
$13 million
of investment tax credits from placing solar generation projects in service. Under the deferral method, the book basis of the associated assets is reduced by the amount of the credit, resulting in lower depreciation expense over the life of the assets. Furthermore, the tax basis of the assets is reduced by
50 percent
of the related credit, resulting in a net deferred tax asset. CMS Energy recognizes the tax benefit of this basis difference as a reduction to income tax expense in the year in which the plant reaches commercial operation.
110
Inventory:
CMS Energy and Consumers use the weighted-average cost method for valuing working gas, recoverable base gas in underground storage facilities, and materials and supplies inventory. CMS Energy and Consumers also use this method for valuing coal inventory, and they classify these amounts as generating plant fuel stock on their consolidated balance sheets.
CMS Energy and Consumers account for RECs and emission allowances as inventory and use the weighted-average cost method to remove amounts from inventory. RECs and emission allowances are used to satisfy compliance obligations related to the generation of power. CMS Energy and Consumers classify these amounts within other assets on their consolidated balance sheets.
CMS Energy and Consumers evaluate inventory for impairment as required to ensure that its carrying value does not exceed the lower of cost or net realizable value.
MISO Transactions:
MISO requires the submission of hourly day-ahead and real-time bids and offers for energy at locations across the MISO region. CMS Energy and Consumers account for MISO transactions on a net hourly basis in each of the real-time and day-ahead markets, netted across all MISO energy market locations. CMS Energy and Consumers record net hourly purchases in purchased and interchange power and net hourly sales in operating revenue on their consolidated statements of income. They record net billing adjustments upon receipt of settlement statements, record accruals for future net purchases and sales adjustments based on historical experience, and reconcile accruals to actual expenses and sales upon receipt of settlement statements.
Property Taxes:
Property taxes are based on the taxable value of Consumers’ real and personal property assessed by local taxing authorities. Consumers records property tax expense over the fiscal year of the taxing authority for which the taxes are levied. The deferred property tax balance represents the amount of Consumers’ accrued property tax that will be recognized over future governmental fiscal periods.
Renewable Energy Grant:
In 2013, Consumers received a renewable energy cash grant for Lake Winds
®
Energy Park under Section 1603 of the American Recovery and Reinvestment Tax Act of 2009. Upon receipt of the grant, Consumers recorded a regulatory liability, which Consumers is amortizing over the life of Lake Winds
®
Energy Park. Consumers presents the amortization as a reduction to maintenance and other operating expenses on its consolidated statements of income. Consumers recorded the deferred income taxes related to the grant as a reduction of the book basis of Lake Winds
®
Energy Park.
Other:
For additional accounting policies, see:
|
•
|
Note 8, Notes Receivable
|
|
•
|
Note 9, Plant, Property, and Equipment
|
|
•
|
Note 11, Asset Retirement Obligations
|
|
•
|
Note 12, Retirement Benefits
|
|
•
|
Note 14, Income Taxes
|
|
•
|
Note 15, Earnings Per Share—CMS Energy
|
|
•
|
Note 16, Revenue
|
|
•
|
Note 18, Cash and Cash Equivalents
|
2
:
New Accounting Standards
Implementation of New Accounting Standards
ASU 2014-09,
Revenue from Contracts with Customers:
This standard, which was effective on January 1, 2018 for CMS Energy and Consumers, provides new guidance for recognizing revenue from
111
contracts with customers. A primary objective of the standard is to provide a single, comprehensive revenue recognition model that will be applied across entities, industries, and capital markets. The new guidance replaced most of the previous revenue recognition requirements in GAAP, although certain guidance specific to rate-regulated utilities was retained. CMS Energy and Consumers had the option to apply the standard retrospectively to all prior periods presented or retrospectively with the cumulative effect of the standard recorded as an adjustment to beginning retained earnings. They also had the option to apply the standard only to contracts existing on the effective date. CMS Energy and Consumers applied the standard retrospectively to contracts existing on the effective date, and recorded an immaterial cumulative-effect reduction to beginning retained earnings for certain contract costs that can no longer be deferred under the new guidance.
The implementation of this standard did not have a material impact on CMS Energy’s or Consumers’ consolidated net income, cash flows, or financial position. CMS Energy and Consumers did not identify any significant changes to their revenue recognition practices that were required by the new guidance, but in accordance with the standard, they have provided additional disclosures about their revenues in
Note 16, Revenue
.
ASU 2016-01, Recognition and Measurement of Financial Assets and Financial Liabilities:
This standard, which was effective on January 1, 2018 for CMS Energy and Consumers, is intended to improve the accounting for financial instruments. The standard requires investments in equity securities to be measured at fair value, with changes in fair value recognized in net income, except for certain investments such as those that qualify for equity-method accounting. The standard no longer permits unrealized gains and losses for certain equity investments to be recorded in AOCI. There are other targeted changes as well. Entities must apply the standard using a modified retrospective approach, with the cumulative effect of the standard recorded as an adjustment to beginning retained earnings.
The implementation of the standard had no impact on CMS Energy’s consolidated financial statements. In accordance with the standard, as of January 1, 2018, Consumers removed a
$19 million
unrealized gain and the associated deferred taxes on its investment in CMS Energy common stock from AOCI and recorded the gain in retained earnings. In January 2018, Consumers transferred substantially all of its shares in CMS Energy common stock to a related charitable foundation and, in accordance with this standard, recognized all unrealized gains and losses on its remaining shares in net income for the year ended
December 31, 2018
. The accounting treatment for this investment is reflected in Consumers’ consolidated financial statements only, and had no impact on CMS Energy’s consolidated financial statements. For further details on CMS Energy’s and Consumers’ investments in debt and equity securities, see
Note 7, Financial Instruments
.
ASU 2018-02, Reclassification of Certain Tax Effects from Accumulated Other Comprehensive Income:
This standard addresses the income tax effects stranded in AOCI as a result of the TCJA. Existing GAAP requires that the remeasurement of deferred tax assets and liabilities resulting from a change in tax laws or rates be presented in net income from continuing operations, even if the deferred taxes were associated with items that were originally recognized in AOCI. As a result, upon recognizing the effects of the TCJA, the tax effects of items in AOCI (referred to as stranded tax effects) no longer reflected the current income tax rate. To address this matter, this standard permits companies to reclassify to retained earnings the stranded tax effects of the TCJA. The standard is effective on January 1, 2019 for CMS Energy and Consumers, but early adoption is permitted. The new guidance is to be applied either in the period of adoption or retrospectively to each prior period in which the effect of the TCJA was recognized. CMS Energy and Consumers elected to adopt this standard early. Accordingly, as of January 1, 2018, CMS Energy reclassified
$11 million
of stranded tax effects from AOCI to retained earnings, which included
$5 million
reclassified at Consumers. At
December 31, 2018
, CMS Energy and Consumers did not have any material stranded tax effects remaining in AOCI.
112
New Accounting Standards Not Yet Effective
ASU 2016-02, Leases:
This standard establishes a new accounting model for leases. The standard requires entities to recognize lease assets and liabilities on the balance sheet for all leases with a term of more than one year, including operating leases, which are not recorded on the balance sheet under existing standards. The new guidance also amends the definition of a lease to require that a lessee control the use of a specified asset, and not simply control or take the output of the asset. On the statement of income, leases that meet existing capital lease criteria will generally be accounted for under a financing model, while operating leases will generally be accounted for under a straight-line expense model. The standard is effective on January 1, 2019 for CMS Energy and Consumers, but early adoption is permitted.
CMS Energy and Consumers did not adopt the standard early and will elect certain practical expedients permitted by the standard, under which they will not be required to perform lease assessments or reassessments for agreements existing on the effective date. They also will elect a transition method under which they will initially apply the standard on January 1, 2019, without adjusting amounts presented for prior periods. Under this method, the cumulative effect of applying the standard must be recorded as an adjustment to beginning retained earnings. Under the standard, CMS Energy and Consumers will recognize additional lease assets and liabilities on their consolidated balance sheets as of January 1, 2019 for their operating leases. CMS Energy and Consumers are finalizing their implementation of the standard and do not expect it to have a material impact on their consolidated net income or cash flows. See
Note 10, Leases and Palisades Financing
, for more information on CMS Energy’s and Consumers’ operating lease obligations.
ASU 2016-13, Measurement of Credit Losses on Financial Instruments:
This standard, which will be effective January 1, 2020 for CMS Energy and Consumers, provides new guidance for estimating and recording credit losses on financial instruments. The standard will apply to the recognition of loan losses at EnerBank as well as to the recognition of uncollectible accounts expense at Consumers. Entities will apply the standard using a modified retrospective approach, with a cumulative-effect adjustment recorded to beginning retained earnings on the effective date. CMS Energy and Consumers are evaluating the impact of the standard on their consolidated financial statements.
3
:
Regulatory Matters
Regulatory matters are critical to Consumers.
The Michigan Attorney General, ABATE, the MPSC Staff, and certain other parties typically participate in MPSC proceedings concerning Consumers
, such as Consumers’ rate cases and PSCR and GCR processes.
These parties often challenge various aspects of those proceedings, including the prudence of Consumers’ policies and practices, and seek cost disallowances and other relief. The parties also have appealed significant MPSC orders.
Depending upon the specific issues, the outcomes of rate cases and proceedings, including judicial proceedings challenging MPSC orders or other actions, could negatively affect CMS Energy’s and Consumers’ liquidity, financial condition, and results of operations. Consumers cannot predict the outcome of these proceedings.
There are multiple appeals pending that involve various issues concerning cost recovery from customers, the adequacy of the record evidence supporting the recovery of Smart Energy investments, and other matters. Consumers is unable to predict the outcome of these appeals.
Regulatory Assets and Liabilities
Consumers is subject to the actions of the MPSC and FERC and therefore prepares its consolidated financial statements in accordance with the provisions of regulatory accounting. A utility must apply regulatory accounting when its rates are designed to recover specific costs of providing regulated
113
services. Under regulatory accounting, Consumers records regulatory assets or liabilities for certain transactions that would have been treated as expense or revenue by non‑regulated businesses.
Presented in the following table are the regulatory assets and liabilities on Consumers’ consolidated balance sheets:
|
In Millions
|
||||||||||
|
December 31
|
End of Recovery
or Refund Period
|
2018
|
2017
|
|||||||
|
Regulatory assets
|
||||||||||
|
Current
|
||||||||||
|
Energy waste reduction plan incentive
1
|
2019
|
$
|
32
|
|
$
|
18
|
|
|||
|
Other
|
2019
|
5
|
|
2
|
|
|||||
|
Total current regulatory assets
|
$
|
37
|
|
$
|
20
|
|
||||
|
Non-current
|
||||||||||
|
Postretirement benefits
2
|
various
|
$
|
1,028
|
|
$
|
1,028
|
|
|||
|
Securitized costs
3
|
2029
|
273
|
|
298
|
|
|||||
|
ARO
4
|
various
|
175
|
|
161
|
|
|||||
|
MGP sites
4
|
various
|
133
|
|
142
|
|
|||||
|
Unamortized loss on reacquired debt
4
|
various
|
68
|
|
53
|
|
|||||
|
Energy waste reduction plan incentive
1
|
2020
|
34
|
|
31
|
|
|||||
|
Energy waste reduction plan
4
|
various
|
26
|
|
39
|
|
|||||
|
Gas storage inventory adjustments
4
|
various
|
4
|
|
10
|
|
|||||
|
Other
|
various
|
2
|
|
2
|
|
|||||
|
Total non-current regulatory assets
|
$
|
1,743
|
|
$
|
1,764
|
|
||||
|
Total regulatory assets
|
$
|
1,780
|
|
$
|
1,784
|
|
||||
|
Regulatory liabilities
|
||||||||||
|
Current
|
||||||||||
|
TCJA reserve for refund
|
2019
|
$
|
98
|
|
$
|
—
|
|
|||
|
Reserve for customer refunds
|
2019
|
36
|
|
25
|
|
|||||
|
Income taxes, net
|
2019
|
18
|
|
52
|
|
|||||
|
Other
|
2019
|
3
|
|
3
|
|
|||||
|
Total current regulatory liabilities
|
$
|
155
|
|
$
|
80
|
|
||||
|
Non-current
|
||||||||||
|
Cost of removal
|
various
|
$
|
1,966
|
|
$
|
1,844
|
|
|||
|
Income taxes, net
|
various
|
1,537
|
|
1,564
|
|
|||||
|
Renewable energy grant
|
2043
|
54
|
|
56
|
|
|||||
|
Renewable energy plan
|
2028
|
42
|
|
56
|
|
|||||
|
ARO
|
various
|
38
|
|
50
|
|
|||||
|
TCJA reserve for refund
|
various
|
35
|
|
—
|
|
|||||
|
Postretirement benefits
|
various
|
—
|
|
135
|
|
|||||
|
Other
|
various
|
9
|
|
10
|
|
|||||
|
Total non-current regulatory liabilities
|
$
|
3,681
|
|
$
|
3,715
|
|
||||
|
Total regulatory liabilities
|
$
|
3,836
|
|
$
|
3,795
|
|
||||
|
1
|
These regulatory assets have arisen from an alternative revenue program and are not associated with incurred costs or capital investments. Therefore, the MPSC has provided for recovery without a return.
|
|
2
|
This regulatory asset is offset partially by liabilities. The net amount is included in rate base, thereby providing a return.
|
114
|
3
|
The MPSC has authorized a specific return on this regulatory asset.
|
|
4
|
These regulatory assets represent incurred costs for which the MPSC has provided, or Consumers expects, recovery without a return on investment.
|
Regulatory Assets
Energy Waste Reduction Plan Incentive:
In December 2018, the MPSC approved a settlement agreement authorizing Consumers to collect
$31 million
during 2019 as an incentive for exceeding its statutory savings targets in 2017. Consumers recognized incentive revenue under this program of
$31 million
in
2017
.
Consumers also exceeded its statutory savings targets in 2018, achieved certain other goals, and will request the MPSC’s approval to collect
$34 million
, the maximum performance incentive, in the energy waste reduction reconciliation to be filed in 2019. Consumers recognized incentive revenue under this program of
$34 million
in
2018
.
Postretirement Benefits:
As part of the ratemaking process, the MPSC allows Consumers to recover the costs of postretirement benefits. Accordingly, Consumers defers the net impact of actuarial losses and gains as well as prior service costs and credits associated with postretirement benefits as a regulatory asset or liability. The asset or liability will decrease as the deferred items are amortized and recognized as components of net periodic benefit cost. For details about the amortization periods, see
Note 12, Retirement Benefits
.
Securitized Costs:
In 2013, the MPSC issued a securitization financing order authorizing Consumers to issue securitization bonds in order to finance the recovery of the remaining book value of
seven
smaller coal-fueled electric generating units
that Consumers retired
in 2016
and
three
smaller natural gas-fueled electric generating units that Consumers retired in 2015. Upon receipt of the MPSC’s order, Consumers removed the book value of the
ten
units from plant, property, and equipment and recorded this amount as a regulatory asset. Consumers is amortizing the regulatory asset over the life of the related securitization bonds, which it issued through a subsidiary in 2014. For additional details regarding the securitization bonds, see
Note 5, Financings and Capitalization
.
ARO:
The recovery of the underlying asset investments and related removal and monitoring costs of recorded AROs is approved by the MPSC in depreciation rate cases. Consumers records a regulatory asset and a regulatory liability for timing differences between the recognition of AROs for financial reporting purposes and the recovery of these costs from customers. The recovery period approximates the useful life of the assets to be removed.
MGP Sites:
Consumers is incurring environmental remediation and other response activity costs at
23
former MGP
facilities. The MPSC allows Consumers to recover from its natural gas customers over a
ten
-year period the costs incurred to remediate the MGP sites.
Unamortized Loss on Reacquired Debt:
Under regulatory accounting, any unamortized discount, premium, or expense related to debt redeemed with the proceeds of new debt is capitalized and amortized over the life of the new debt.
Energy Waste Reduction Plan:
The MPSC allows Consumers to collect surcharges from customers to fund its energy waste reduction plan. The amount of spending incurred in excess of surcharges collected is recorded as a regulatory asset and amortized as surcharges are collected from customers over the plan period.
115
Gas Storage Inventory Adjustments:
Consumers incurs inventory expenses related to the loss of gas from its natural gas storage fields. The MPSC allows Consumers to recover these costs from its natural gas customers over a
five
-year period.
Regulatory Liabilities
TCJA Reserve for Refund:
In February 2018, the MPSC ordered Consumers to file various proceedings to determine the reduction in its electric and gas revenue requirements as a result of the TCJA.
For further information on the various TCJA proceedings, see the
Consumers Electric Utility and Gas Utility
—
Tax Cuts and Jobs Act
section below.
Reserve for Customer Refunds:
The 2016 Energy Law eliminated utilities’ self-implementation of rates under general rate cases, but provided for more timely processing of general rate cases. Consumers filed an electric rate case in March 2017, prior to the effective date of that law, and as result was allowed to self-implement new energy rates in October 2017, subject to refund with interest and potential penalties. Consumers recognized revenue associated with self-implemented rates, but recorded a provision for revenue subject to refund because it considered it probable that it would be required to refund a portion of its self-implemented rates.
Income Taxes, Net:
Consumers records regulatory assets and liabilities to reflect the difference between deferred income taxes recognized for financial reporting purposes and amounts previously reflected in Consumers’ rates. This net balance will decrease over the remaining life of the related temporary differences and flow through current income tax benefit. For additional details on deferred income taxes, see
Note 14, Income Taxes
.
At December 31, 2017, Consumers measured its deferred tax assets and liabilities using the
21 percent
federal tax rate enacted in the TCJA. Due to the lower corporate tax rate, Consumers reduced its net deferred tax liabilities associated with its utility book-tax temporary differences by
$1.6 billion
and recorded an offsetting regulatory liability. For further information on Consumers’ proposal to return this to customers, see the
Consumers Electric Utility and Gas Utility
—
Tax Cuts and Jobs Act
section below.
Cost of Removal:
The MPSC allows Consumers to collect amounts from customers to fund future asset removal activities. This regulatory liability is reduced as costs of removal are incurred. The refund period of this regulatory liability approximates the useful life of the assets to be removed.
Renewable Energy Grant:
In 2013, Consumers received a
$69 million
renewable energy grant for Lake Winds
®
Energy Park, which began operations in 2012. This grant reduces Consumers’ cost of complying with Michigan’s renewable portfolio standard and, accordingly, reduces the overall renewable energy surcharge to be collected from customers. The regulatory liability recorded for the grant will be amortized over the life of Lake Winds
®
Energy Park.
Renewable Energy Plan:
Consumers has collected surcharges to fund its renewable energy plan. Amounts not yet spent under the plan are recorded as a regulatory liability, which is amortized as incremental costs are incurred to operate and depreciate Consumers’ renewable generation facilities and to purchase RECs under renewable energy purchase agreements. Incremental costs represent costs incurred in excess of amounts recovered through the PSCR process.
Consumers Electric Utility and Gas Utility
Tax Cuts and Jobs Act
:
The TCJA, which changed existing federal tax law and included numerous provisions that affect businesses, was signed into law in December 2017.
In February 2018, the MPSC ordered Consumers to file various proceedings to determine the reduction in its electric and gas revenue
116
requirements as a result of the TCJA.
The MPSC also ordered Consumers to implement bill credits to reflect that reduction until customer rates are adjusted through Consumers’ general rate cases. Consumers filed the first of these proceedings in March 2018, requesting a
$49 million
reduction in its annual gas revenue requirement. The MPSC approved this reduction in June 2018, with credits to customer bills beginning in July 2018; this credit ended with the settlement of the gas rate case in August 2018. Consumers filed the second proceeding in April 2018, requesting a
$113 million
reduction in its annual electric revenue requirement. The MPSC approved this reduction in July 2018, with credits to customer bills beginning in August 2018; this credit ended with the settlement of the electric rate case in January 2019. These credits reduced rates prospectively for the impact of the TCJA but did not include potential refunds associated with Consumers’ remeasurement of its deferred income taxes.
Consumers filed two more proceedings to address amounts collected from customers during 2018 through the implementation of the first two proceedings. Consumers filed the first of these proceedings in August 2018, requesting to refund
$31 million
to gas customers over six months beginning in December 2018. The MPSC approved this refund in November 2018. Consumers filed the second proceeding in September 2018, requesting to refund
$70 million
to electric customers over six months beginning in January 2019. The MPSC approved this refund in December 2018. Consumers has recorded a current regulatory liability in an amount reflecting these approved refunds.
In October 2018, Consumers filed an application to address the December 31, 2017 remeasurement of its deferred income taxes and other base rate impacts of the TCJA on customers. The application requested approval to begin returning
$0.4 billion
of net regulatory tax liabilities through rates to be determined in a future gas proceeding and
$1.2 billion
through the rates determined in Consumers’ next-filed electric rate case. Consumers’ total
$1.6 billion
of net regulatory tax liabilities comprises:
|
•
|
A regulatory tax liability of
$1.7 billion
associated with plant assets that are subject to normalization, which is governed by the Internal Revenue Code. This requires that the regulatory tax liability be returned over the remaining book life of the related plant assets, the average of which is
44 years
for gas plant assets and
27 years
for electric plant assets.
|
|
•
|
A regulatory tax asset of
$0.3 billion
associated with plant assets that are not subject to normalization. Consumers proposed to collect this over
44 years
from gas customers and over
27 years
from electric customers.
|
|
•
|
A regulatory tax liability of
$0.2 billion
, which is primarily related to employee benefits. Consumers proposed to refund this amount to customers over
15 years
.
|
In January 2018, Consumers began to reduce this net regulatory tax liability by crediting income tax expense. Consumers has fully reserved for the eventual refund of these excess deferred taxes that it has credited to income tax expense in a separate non‑current regulatory liability established by reducing revenue, and will continue to do so until these benefits are passed on to customers in accordance with an MPSC order. For additional details on the remeasurement, see
Note 14, Income Taxes
.
Consumers Electric Utility
2017 Electric Rate Case:
In March 2017, Consumers filed an application with the MPSC seeking an annual rate increase of
$173 million
, based on a
10.5 percent
authorized return on equity. The filing requested authority to recover new investment in system reliability, environmental compliance, and technology enhancements. In September 2017, Consumers reduced its requested annual rate increase to
$148 million
. In October 2017, Consumers self-implemented an annual rate increase of
$130 million
, subject to refund with interest and potential penalties.
The MPSC issued an order in March 2018, authorizing an annual rate increase of
$66 million
, based on a
10.0 percent
authorized return on equity. In
117
June 2018, as a result of a petition for rehearing filed by Consumers, the MPSC issued an order adjusting the authorized annual rate increase to
$72 million
by allowing recovery of additional retirement benefit plan costs.
In July 2018, Consumers filed a reconciliation of total revenues collected during self-implementation to those that would have been collected under final rates. The reconciliation indicated that a
$36 million
refund would be required, which was recorded on Consumers’ consolidated balance sheets as a current regulatory liability at
December 31, 2018
. In its filing, Consumers proposed refunding this amount to customers in February 2019.
2018 Electric Rate Case:
In May 2018, Consumers filed an application with the MPSC seeking an annual rate increase of
$58 million
, based on a
10.75 percent
authorized return on equity. In October 2018, Consumers reduced its requested annual rate increase to
$44 million
. The filing requested authority to recover new investment in system reliability, environmental compliance, and technology enhancements. In January 2019, the MPSC approved a settlement agreement authorizing an annual rate decrease of
$24 million
, based on a
10.0 percent
authorized return of equity. With the elimination of the
$113 million
TCJA credit to customer bills, the approved settlement agreement results in an
$89 million
increase in annual rates. In lieu of the investment recovery mechanism requested by Consumers, the settlement agreement provides for deferred accounting treatment for distribution-related capital investments exceeding certain amounts. Consumers also agreed to not file a new electric rate case prior to January 2020.
Consumers Gas Utility
Gas Rate Case:
In October 2017, Consumers filed an application with the MPSC seeking an annual rate increase of
$178 million
, based on a
10.5 percent
authorized return on equity. In March 2018, Consumers reduced its requested revenue requirement to
$145 million
, before taking into consideration any impact of the TCJA. Consumers further reduced its requested revenue requirement to
$83 million
to reflect the impact of the TCJA, offset partially by an increase in the authorized return of equity to
10.75 percent
to compensate for the anticipated negative effects of tax reform on Consumers’ cash flows from operating activities.
In July 2018, Consumers reduced its requested revenue requirement to
$60 million
, based on a
10.0 percent
authorized return on equity.
In August 2018, the MPSC approved a settlement agreement authorizing an annual rate increase of
$11 million
, based on a
10.0 percent
authorized return on equity. With the elimination of the
$49 million
TCJA credit to customer bills, the approved settlement agreement results in a
$60 million
increase in annual rates.
The MPSC also approved two rate adjustment mechanisms: a revenue decoupling mechanism and an investment recovery mechanism. The revenue decoupling mechanism will annually reconcile Consumers’ actual weather-normalized non‑fuel revenues with the revenues approved by the MPSC. The investment recovery mechanism will provide for an additional annual rate increase of
$9 million
beginning in July 2019 and another
$10 million
beginning in July 2020 for incremental investments that Consumers plans to make in those years, subject to reconciliation. The investment recovery surcharge will remain in effect until rates are reset in a subsequent general rate case.
Power Supply Cost Recovery and Gas Cost Recovery
The PSCR and GCR ratemaking processes are designed to allow Consumers to recover all of its power supply and purchased natural gas costs if incurred under reasonable and prudent policies and practices. The MPSC reviews these costs, policies, and practices in annual plan and reconciliation proceedings. Consumers adjusts its PSCR and GCR billing charges monthly in order to minimize the underrecovery or overrecovery amount in the annual reconciliations. Underrecoveries represent probable future revenues that will be recovered from customers; overrecoveries represent previously collected revenues that will be refunded to customers.
118
Presented in the following table are the assets and liabilities for PSCR and GCR underrecoveries and overrecoveries reflected on Consumers’ consolidated balance sheets:
|
In Millions
|
||||||||
|
December 31
|
2018
|
2017
|
||||||
|
Assets
|
||||||||
|
GCR underrecoveries
|
16
|
|
—
|
|
||||
|
Accrued gas revenue
|
$
|
16
|
|
$
|
—
|
|
||
|
Liabilities
|
||||||||
|
PSCR overrecoveries
|
$
|
4
|
|
$
|
27
|
|
||
|
GCR overrecoveries
|
—
|
|
6
|
|
||||
|
Accrued rate refunds
|
$
|
4
|
|
$
|
33
|
|
||
PSCR Plans and Reconciliations:
In June 2018, the MPSC approved a settlement agreement in Consumers’ 2016 PSCR reconciliation, authorizing recovery of
$1.9 billion
of power costs and authorizing Consumers to reflect in its 2017 PSCR reconciliation the overrecovery of
$12 million
.
In March 2018, Consumers filed its 2017 PSCR reconciliation, requesting full recovery of
$1.9 billion
of power costs and authorization to reflect in its 2018 PSCR reconciliation the overrecovery of
$32 million
.
Consumers submitted its 2018 PSCR plan to the MPSC in September 2017 and, in accordance with its proposed plan, self-implemented the 2018 PSCR charge beginning in January 2018.
GCR Plans and Reconciliations:
In May 2018, the MPSC approved a settlement agreement in Consumers’ 2016-2017 GCR reconciliation, authorizing full recovery of
$0.5 billion
of gas costs and authorizing Consumers to reflect in its 2017-2018 GCR reconciliation the overrecovery of
$2 million
.
In June 2018, Consumers filed its 2017-2018 GCR reconciliation, requesting full recovery of
$0.6 billion
of gas costs and authorization to reflect in its 2018-2019 GCR reconciliation the overrecovery of
$1 million
.
In October 2018, the MPSC approved a settlement agreement in Consumers’ 2018-2019 GCR plan, authorizing the 2018-2019 GCR factor that Consumers self-implemented beginning in April 2018.
4
:
Contingencies and Commitments
CMS Energy and Consumers are involved in various matters that give rise to contingent liabilities. Depending on the specific issues, the resolution of these contingencies could negatively affect CMS Energy’s and Consumers’ liquidity, financial condition, and results of operations. In their disclosures of these matters, CMS Energy and Consumers provide an estimate of the possible loss or range of loss when such an estimate can be made. Disclosures that state that CMS Energy or Consumers cannot predict the outcome of a matter indicate that they are unable to estimate a possible loss or range of loss for the matter.
CMS Energy Contingencies
Gas Index Price Reporting Litigation:
CMS Energy, along with CMS MST, CMS Field Services, Cantera Natural Gas, Inc., and Cantera Gas Company, were named as defendants in
four
class action lawsuits and
one
individual lawsuit arising as a result of alleged inaccurate natural gas price reporting to publications that report trade information. Allegations include price-fixing conspiracies, restraint of trade, and artificial inflation of natural gas retail prices in Kansas, Missouri, and Wisconsin. In 2016,
119
CMS Energy entities reached a settlement with the plaintiffs in the Kansas and Missouri class action cases for an amount that was not material to CMS Energy. In August 2017, the federal district court approved the settlement. The following provides more detail on the remaining cases in which CMS Energy or its affiliates were named as parties:
|
•
|
In 2006, a class action complaint, Arandell Corp., et al. v. XCEL Energy Inc., et al., was filed in Wisconsin state court on behalf of Wisconsin commercial entities that purchased natural gas between January 2000 and October 2002. The defendants, including CMS Energy, CMS ERM, and Cantera Gas Company, are alleged to have violated Wisconsin’s antitrust statute. The plaintiffs are seeking full consideration damages, treble damages, costs, interest, and attorneys’ fees.
|
|
•
|
In 2009, a class action complaint, Newpage Wisconsin System v. CMS ERM, et al., was filed in circuit court in Wood County, Wisconsin, against CMS Energy, CMS ERM, Cantera Gas Company, and others. The plaintiff is seeking full consideration damages, treble damages, costs, interest, and attorneys’ fees.
|
|
•
|
In 2005, J.P. Morgan Trust Company, N.A., in its capacity as trustee of the FLI Liquidating Trust, filed an action in Kansas state court against CMS Energy, CMS MST, CMS Field Services, and others. The complaint alleges various claims under the Kansas Restraint of Trade Act. The plaintiff is seeking statutory full consideration damages for its purchases of natural gas in 2000 and 2001, costs, and attorneys’ fees.
|
After removal to federal court, all of the cases were transferred to a single federal district court pursuant to the multidistrict litigation process. In 2010 and 2011, all claims against CMS Energy defendants were dismissed by the district court based on FERC preemption.
In 2013, the U.S. Court of Appeals for the Ninth Circuit reversed the district court decision. The appellate court found that FERC preemption does not apply under the facts of these cases. The appellate court affirmed the district court’s denial of leave to amend to add federal antitrust claims. The matter was appealed to the U.S. Supreme Court, which in 2015 upheld the Ninth Circuit’s decision. The cases were remanded back to the federal district court.
In 2016, the federal district court granted the defendants’ motion for summary judgment in the individual lawsuit filed in Kansas based on a release in a prior settlement involving similar allegations; the order of summary judgment was subsequently appealed. In March 2018, the U.S. Court of Appeals for the Ninth Circuit reversed the lower court’s ruling and remanded the case back to the federal district court.
In March 2017, the federal district court denied plaintiffs’ motion for class certification in the two pending class action cases in Wisconsin. The plaintiffs appealed that decision to the U.S. Court of Appeals for the Ninth Circuit and in August 2018, the Ninth Circuit Court of Appeals reversed and remanded the matter back to the federal district court for further consideration.
In January 2019, the judge in the multidistrict litigation granted motions filed by plaintiffs for Suggestion of Remand of the actions back to the respective transferor courts in Wisconsin and Kansas for further handling. The matter will go to the Judicial Panel on Multidistrict Litigation who will determine if remand is appropriate.
These cases involve complex facts, a large number of similarly situated defendants with different factual positions, and multiple jurisdictions. Presently, any estimate of liability would be highly speculative; the amount of CMS Energy’s reasonably possible loss would be based on widely varying models previously
120
untested in this context. If the outcome after appeals is unfavorable, these cases could negatively affect CMS Energy’s liquidity, financial condition, and results of operations.
Bay Harbor:
CMS Land retained environmental remediation obligations for the collection and treatment of leachate, a liquid consisting of water and other substances, at Bay Harbor after selling its interests in the development in 2002. Leachate is produced when water enters into cement kiln dust piles left over from former cement plant operations at the site. In 2012, CMS Land and the MDEQ finalized an agreement that established the final remedies and the future water quality criteria at the site. CMS Land completed all construction necessary to implement the remedies required by the agreement and will continue to maintain and operate a system to discharge treated leachate into Little Traverse Bay under an NPDES permit issued in 2010 and renewed in 2016. The renewed NPDES permit is valid through September 2020.
Various claims have been brought against CMS Land or its affiliates, including CMS Energy, alleging environmental damage to property, loss of property value, insufficient disclosure of environmental matters, breach of agreement relating to access, or other matters. CMS Land and other parties received a demand for payment from the EPA of over
$8 million
, plus interest and costs. The EPA was seeking recovery under CERCLA of response costs allegedly incurred at Bay Harbor and filed a lawsuit to collect these costs. In December 2018, an agreement was reached to settle the lawsuit for an agreed-upon amount. This payment did not have a material impact on CMS Energy’s financial condition or results of operations.
At
December 31, 2018
, CMS Energy had a recorded liability of
$46 million
for its remaining obligations for environmental remediation. CMS Energy calculated this liability based on discounted projected costs, using a discount rate of
4.34 percent
and an inflation rate of
one
percent on annual operating and maintenance costs. The undiscounted amount of the remaining obligation is
$58 million
. CMS Energy expects to pay the following amounts for long-term liquid disposal and operating and maintenance costs in each of the next five years:
|
In Millions
|
||||||||||||||||||||
|
2019
|
2020
|
2021
|
2022
|
2023
|
||||||||||||||||
|
CMS Energy
|
||||||||||||||||||||
|
Long-term liquid disposal and operating and maintenance costs
|
$
|
4
|
|
$
|
4
|
|
$
|
4
|
|
$
|
4
|
|
$
|
4
|
|
|||||
CMS Energy’s estimate of response activity costs and the timing of expenditures could change if there are changes in circumstances or assumptions used in calculating the liability. Although a liability for its present estimate of remaining response activity costs has been recorded, CMS Energy cannot predict the ultimate financial impact or outcome of this matter.
Equatorial Guinea Tax Claim:
In 2002, CMS Energy sold its oil, gas, and methanol investments in Equatorial Guinea. The government of Equatorial Guinea claims that, in connection with the sale, CMS Energy owes
$152 million
in taxes, plus substantial penalties and interest that could be up to the amount of the taxes claimed. In 2015, the matter was proceeding to formal arbitration; however, since then, the government of Equatorial Guinea has stopped communicating. CMS Energy has concluded that the government’s tax claim is without merit and will continue to contest the claim, but cannot predict the financial impact or outcome of the matter. An unfavorable outcome could have a material adverse effect on CMS Energy’s liquidity, financial condition, and results of operations.
121
Consumers Electric Utility Contingencies
Electric Environmental Matters
:
Consumers’ operations are subject to environmental laws and regulations. Historically, Consumers has generally been able to recover, in customer rates, the costs to operate its facilities in compliance with these laws and regulations.
Cleanup and Solid Waste:
Consumers expects to incur remediation and other response activity costs at a number of sites under the NREPA. Consumers believes that these costs should be recoverable in rates, but cannot guarantee that outcome. Consumers estimates that its liability for NREPA sites for which it can estimate a range of loss will be between
$3 million
and
$4 million
. At
December 31, 2018
, Consumers had a recorded liability of
$3 million
, the minimum amount in the range of its estimated probable NREPA liability, as no amount in the range was considered a better estimate than any other amount.
Consumers is a potentially responsible party at a number of contaminated sites administered under CERCLA. CERCLA liability is joint and several. In 2010, Consumers received official notification from the EPA that identified Consumers as a potentially responsible party for cleanup of PCBs at the Kalamazoo River CERCLA site. The notification claimed that the EPA has reason to believe that Consumers disposed of PCBs and arranged for the disposal and treatment of PCB-containing materials at portions of the site. In 2011, Consumers received a follow-up letter from the EPA requesting that Consumers agree to participate in a removal action plan along with several other companies for an area of lower Portage Creek, which is connected to the Kalamazoo River. All parties, including Consumers, that were asked to participate in the removal action plan declined to accept liability. Until further information is received from the EPA, Consumers is unable to estimate a range of potential liability for cleanup of the river.
Based on its experience, Consumers estimates that its share of the total liability for known CERCLA sites will be between
$3 million
and
$8 million
. Various factors, including the number and creditworthiness of potentially responsible parties involved with each site, affect Consumers’ share of the total liability. At
December 31, 2018
, Consumers had a recorded liability of
$3 million
for its share of the total liability at these sites, the minimum amount in the range of its estimated probable CERCLA liability, as no amount in the range was considered a better estimate than any other amount.
The timing of payments related to Consumers’ remediation and other response activities at its CERCLA and NREPA sites is uncertain. Consumers periodically reviews these cost estimates. A change in the underlying assumptions, such as an increase in the number of sites, different remediation techniques, the nature and extent of contamination, and legal and regulatory requirements, could affect its estimates of NREPA and CERCLA liability.
Ludington PCB:
In 1998, during routine maintenance activities, Consumers identified PCB as a component in certain paint, grout, and sealant materials at Ludington. Consumers removed part of the PCB material and replaced it with non‑PCB material. Consumers has had several communications with the EPA regarding this matter, but cannot predict the financial impact or outcome.
MCV PPA:
In December 2017, the MCV Partnership initiated arbitration against Consumers, asserting a breach of contract associated with the MCV PPA. Under this PPA, Consumers pays the MCV Partnership
a fixed energy charge based on Consumers’ annual average baseload coal generating plant operating and maintenance cost, fuel inventory, and administrative and general expenses
. The MCV Partnership asserts that, under the Clean Air Act, Consumers should have installed pollution control equipment on coal-fueled electric generating units years before they were retired. The MCV Partnership also asserts that Consumers should have installed pollution control equipment earlier on its remaining coal-fueled electric generating units. The assertion claims that these changes would have increased Consumers’ costs to operate and maintain the facilities and, thereby, the fixed energy charge paid to the MCV Partnership.
122
Additionally, the MCV Partnership claims that Consumers improperly characterized certain costs included in the calculation of the fixed energy charge.
In January 2019, an arbitration panel issued an order concluding that the MCV Partnership is not entitled to any damages associated with its claim against Consumers related to the Clean Air Act; the majority of the MCV Partnership’s claim, which estimated damages and interest in excess of
$270 million
, was related to this dismissed claim. Consumers believes that the MCV Partnership’s remaining claims are without merit, but cannot predict the financial impact or outcome of the matter.
Underwater Cables in Straits of Mackinac:
Consumers owns certain underwater electric cables in the Straits of Mackinac, which were de-energized and retired in 1990. Consumers was notified that some of these cables were damaged as a result of vessel activity in April 2018. Following the notification, Consumers located, inspected, sampled, capped, and returned the damaged retired cables to their original location on the lake bottom, and did not find any substantive evidence of environmental contamination. Consumers is collaborating with the State of Michigan, local Native American tribes, and other stakeholders to evaluate the status of the cables and to determine if any additional action is advisable. Consumers cannot predict the outcome of this matter, but if Consumers is required to remove all the cables, it could incur additional costs of up to
$10 million
. Consumers has filed suit against the companies that own the vessels that allegedly caused the damage. Consumers will seek recovery from customers of any costs incurred.
Consumers Gas Utility Contingencies
Gas Environmental Matters
:
Consumers expects to incur remediation and other response activity costs at a number of sites under the NREPA. These sites include
23
former MGP
facilities. Consumers operated the facilities on these sites for some part of their operating lives. For some of these sites, Consumers has no present ownership interest or may own only a portion of the original site.
At
December 31, 2018
, Consumers had a recorded liability of
$73 million
for its remaining obligations for these sites. This amount represents the present value of long-term projected costs, using a discount rate of
2.57 percent
and an inflation rate of
2.5 percent
. The undiscounted amount of the remaining obligation is
$77 million
. Consumers expects to pay the following amounts for remediation and other response activity costs in each of the next five years:
|
In Millions
|
||||||||||||||||||||
|
2019
|
2020
|
2021
|
2022
|
2023
|
||||||||||||||||
|
Consumers
|
||||||||||||||||||||
|
Remediation and other response activity costs
|
$
|
12
|
|
$
|
16
|
|
$
|
21
|
|
$
|
7
|
|
$
|
2
|
|
|||||
Consumers periodically reviews these cost estimates. Any significant change in the underlying assumptions, such as an increase in the number of sites, changes in remediation techniques, or legal and regulatory requirements, could affect Consumers’ estimates of annual response activity costs and the MGP liability.
Pursuant to orders issued by the MPSC, Consumers defers its MGP-related remediation costs and recovers them from its customers over a
ten
-year period. At
December 31, 2018
, Consumers had a regulatory asset of
$133 million
related to the MGP sites.
Consumers estimates that its liability to perform remediation and other response activities at NREPA sites other than the MGP sites could reach
$3 million
. At
December 31, 2018
, Consumers had a recorded
123
liability of less than
$1 million
, the minimum amount in the range of its estimated probable liability, as no amount in the range was considered a better estimate than any other amount.
Guarantees
Presented in the following table are CMS Energy’s and Consumers’ guarantees at
December 31, 2018
:
|
In Millions
|
||||||||||
|
Guarantee Description
|
Issue Date
|
Expiration Date
|
Maximum Obligation
|
Carrying Amount
|
||||||
|
CMS Energy, including Consumers
|
||||||||||
|
Indemnity obligations from stock and asset sale agreements
1
|
various
|
indefinite
|
$
|
153
|
|
$
|
3
|
|
||
|
Guarantees
2
|
various
|
indefinite
|
39
|
|
—
|
|
||||
|
Consumers
|
||||||||||
|
Guarantee
2
|
July 2011
|
indefinite
|
$
|
30
|
|
$
|
—
|
|
||
|
1
|
These obligations arose from stock and asset sale agreements under which CMS Energy or a subsidiary of CMS Energy indemnified the purchaser for losses resulting from various matters, primarily claims related to taxes. CMS Energy believes the likelihood of material loss to be remote for the indemnity obligations not recorded as liabilities.
|
|
2
|
At Consumers, this obligation comprises a guarantee provided to the U.S. Department of Energy in connection with a settlement agreement regarding damages resulting from the department’s failure to accept spent nuclear fuel from nuclear power plants formerly owned by Consumers. At CMS Energy, the guarantee obligations comprise Consumers’ guarantee to the U.S. Department of Energy and CMS Energy’s 1994 guarantee of non‑recourse revenue bonds issued by Genesee. For additional details on this guarantee, see
Note 21, Variable Interest Entities
.
|
Additionally, in the normal course of business, CMS Energy, Consumers, and certain other subsidiaries of CMS Energy have entered into various agreements containing tax and other indemnity provisions for which they are unable to estimate the maximum potential obligation. The carrying value of these indemnity obligations is
$1 million
. CMS Energy and Consumers consider the likelihood that they would be required to perform or incur substantial losses related to these indemnities to be remote.
Other Contingencies
In addition to the matters disclosed in this Note and
Note 3, Regulatory Matters
, there are certain other lawsuits and administrative proceedings before various courts and governmental agencies arising in the ordinary course of business to which CMS Energy, Consumers, and certain other subsidiaries of CMS Energy are parties. These other lawsuits and proceedings may involve personal injury, property damage, contracts, environmental matters, federal and state taxes, rates, licensing, employment, and other matters. Further, CMS Energy and Consumers occasionally self-report certain regulatory non‑compliance matters that may or may not eventually result in administrative proceedings. CMS Energy and Consumers believe that the outcome of any one of these proceedings will not have a material negative effect on their consolidated results of operations, financial condition, or liquidity.
Contractual Commitments
Purchase Obligations:
Purchase obligations arise from long-term
contracts for the purchase of commodities and related services, and construction and service agreements. The commodities and related services include
long-term PPAs,
natural gas and
associated transportation, and
coal and associated
124
transportation.
Related-party PPAs are between Consumers and certain affiliates of CMS Enterprises. Presented in the following table are CMS Energy’s and Consumers’ contractual purchase obligations at
December 31, 2018
for each of the periods shown:
|
In Millions
|
||||||||||||||||||||||||||||
|
Payments Due
|
||||||||||||||||||||||||||||
|
Total
|
2019
|
2020
|
2021
|
2022
|
2023
|
Beyond 2023
|
||||||||||||||||||||||
|
CMS Energy, including Consumers
|
||||||||||||||||||||||||||||
|
Total PPAs
|
$
|
9,930
|
|
$
|
1,049
|
|
$
|
1,051
|
|
$
|
1,043
|
|
$
|
744
|
|
$
|
638
|
|
$
|
5,405
|
|
|||||||
|
Other
|
2,341
|
|
1,276
|
|
405
|
|
163
|
|
137
|
|
117
|
|
243
|
|
||||||||||||||
|
Consumers
|
||||||||||||||||||||||||||||
|
PPAs
|
||||||||||||||||||||||||||||
|
MCV PPA
|
$
|
3,880
|
|
$
|
330
|
|
$
|
318
|
|
$
|
289
|
|
$
|
275
|
|
$
|
279
|
|
$
|
2,389
|
|
|||||||
|
Palisades PPA
|
1,280
|
|
378
|
|
388
|
|
400
|
|
114
|
|
—
|
|
—
|
|
||||||||||||||
|
Related-party PPAs
|
692
|
|
85
|
|
85
|
|
86
|
|
86
|
|
87
|
|
263
|
|
||||||||||||||
|
Other PPAs
|
4,078
|
|
256
|
|
260
|
|
268
|
|
269
|
|
272
|
|
2,753
|
|
||||||||||||||
|
Total PPAs
|
$
|
9,930
|
|
$
|
1,049
|
|
$
|
1,051
|
|
$
|
1,043
|
|
$
|
744
|
|
$
|
638
|
|
$
|
5,405
|
|
|||||||
|
Other
|
2,075
|
|
1,237
|
|
373
|
|
148
|
|
124
|
|
103
|
|
90
|
|
||||||||||||||
MCV PPA:
Consumers has a
35
-year PPA that began in 1990 with the MCV Partnership to purchase
1,240
MW of electricity. The MCV PPA, as amended and restated, provides for:
|
•
|
a capacity charge of
$10.14
per MWh of available capacity
|
|
•
|
a fixed energy charge based on Consumers’ annual average baseload coal generating plant operating and maintenance cost, fuel inventory, and administrative and general expenses
|
|
•
|
a variable energy charge based on the MCV Partnership’s cost of production when the plant is dispatched
|
|
•
|
a
$5 million
annual contribution by the MCV Partnership to a renewable resources program
|
|
•
|
an option for Consumers to extend the MCV PPA for
five
years or purchase the MCV Facility at the conclusion of the MCV PPA’s term in March 2025
|
Capacity and energy charges under the MCV PPA were
$353 million
in
2018
,
$321 million
in
2017
, and
$305 million
in
2016
.
Palisades PPA:
Consumers has a PPA expiring in 2022 with Entergy
to purchase virtually all of the capacity and energy produced by Palisades, up to the annual average capacity of
798
MW.
For all delivered energy, the Palisades PPA has escalating capacity and variable energy charges. Total capacity and energy charges under the Palisades PPA were
$375 million
in
2018
,
$366 million
in
2017
, and
$363 million
in
2016
. For further details about Palisades, see
Note 10, Leases and Palisades Financing
.
Other PPAs:
Consumers has PPAs expiring through 2036 with various counterparties. The majority of the PPAs have capacity and energy charges for delivered energy. Capacity and energy charges under these PPAs were
$350 million
in
2018
,
$349 million
in
2017
, and
$348 million
in
2016
.
125
5
:
Financings and Capitalization
Presented in the following table is CMS Energy’s long-term debt at December 31:
|
In Millions
|
||||||||||||
|
Interest Rate
(%)
|
Maturity
|
2018
|
2017
|
|||||||||
|
CMS Energy, including Consumers
|
||||||||||||
|
CMS Energy, parent only
|
||||||||||||
|
Senior notes
|
8.750
|
2019
|
$
|
—
|
|
$
|
100
|
|
||||
|
6.250
|
2020
|
—
|
|
300
|
|
|||||||
|
5.050
|
2022
|
300
|
|
300
|
|
|||||||
|
3.875
|
2024
|
250
|
|
250
|
|
|||||||
|
3.600
|
2025
|
250
|
|
250
|
|
|||||||
|
3.000
|
2026
|
300
|
|
300
|
|
|||||||
|
2.950
|
2027
|
275
|
|
275
|
|
|||||||
|
3.450
|
2027
|
350
|
|
350
|
|
|||||||
|
4.700
|
2043
|
250
|
|
250
|
|
|||||||
|
4.875
|
2044
|
300
|
|
300
|
|
|||||||
|
Total senior notes
|
$
|
2,275
|
|
$
|
2,675
|
|
||||||
|
Term loans and revolving credit agreements
|
variable
|
1
|
2019
|
180
|
|
405
|
|
|||||
|
variable
|
2
|
2023
|
30
|
|
—
|
|
||||||
|
$
|
210
|
|
$
|
405
|
|
|||||||
|
Junior subordinated notes
|
5.625
|
2078
|
200
|
|
—
|
|
||||||
|
5.875
|
2078
|
280
|
|
—
|
|
|||||||
|
$
|
480
|
|
$
|
—
|
|
|||||||
|
Total CMS Energy, parent only
|
$
|
2,965
|
|
$
|
3,080
|
|
||||||
|
CMS Energy subsidiaries
|
||||||||||||
|
CMS Enterprises, including subsidiaries
|
||||||||||||
|
Term loan facility
|
variable
|
3
|
2025
|
3
|
$
|
98
|
|
$
|
—
|
|
||
|
EnerBank
|
||||||||||||
|
Certificates of deposit
|
2.440
|
4
|
2019-2026
|
1,758
|
|
1,245
|
|
|||||
|
Consumers
|
6,862
|
|
5,940
|
|
||||||||
|
Total principal amount outstanding
|
$
|
11,683
|
|
$
|
10,265
|
|
||||||
|
Current amounts
|
(974
|
)
|
(1,081
|
)
|
||||||||
|
Net unamortized discounts
|
(21
|
)
|
(14
|
)
|
||||||||
|
Unamortized issuance costs
|
(73
|
)
|
(47
|
)
|
||||||||
|
Total long-term debt
|
$
|
10,615
|
|
$
|
9,123
|
|
||||||
|
1
|
Outstanding borrowings bear interest at an annual interest rate of LIBOR plus
0.800 percent
(
3.322 percent
at
December 31, 2018
).
|
|
2
|
Outstanding borrowings bear interest at an annual interest rate of LIBOR plus
0.125 percent
(
3.669 percent
at
December 31, 2018
).
|
|
3
|
A subsidiary of CMS Enterprises issued non‑recourse debt to finance the acquisition of a wind generation project in northwest Ohio. The debt bears interest at an annual interest rate of LIBOR plus
1.500 percent
through October 2022 (
4.303 percent
at
December 31, 2018
).
Beginning in October 2022, the debt will bear interest at an annual interest rate of LIBOR plus
1.750 percent
. The same subsidiary of CMS Enterprises entered into interest rate swaps with the lending banks to fix the interest charges associated with the debt, at a rate of
4.702 percent
|
126
through October 2022 and
4.952 percent
beginning in October 2022. Principal and interest payments are made quarterly.
|
4
|
The weighted-average interest rate for EnerBank’s certificates of deposit was
2.440 percent
at
December 31, 2018
and
1.758 percent
at
December 31, 2017
. EnerBank’s primary deposit product consists of brokered certificates of deposit with varying maturities and having a face value of
$1,000
.
|
Presented in the following table is Consumers’ long-term debt at December 31:
|
In Millions
|
||||||||||||
|
Interest Rate
(%)
|
Maturity
|
2018
|
2017
|
|||||||||
|
Consumers
|
||||||||||||
|
First mortgage bonds
|
5.650
|
2018
|
$
|
—
|
|
$
|
250
|
|
||||
|
6.125
|
2019
|
—
|
|
350
|
|
|||||||
|
6.700
|
2019
|
—
|
|
500
|
|
|||||||
|
5.650
|
2020
|
300
|
|
300
|
|
|||||||
|
3.770
|
2020
|
100
|
|
100
|
|
|||||||
|
2.850
|
2022
|
375
|
|
375
|
|
|||||||
|
5.300
|
2022
|
250
|
|
250
|
|
|||||||
|
3.375
|
2023
|
325
|
|
325
|
|
|||||||
|
3.125
|
2024
|
250
|
|
250
|
|
|||||||
|
3.190
|
2024
|
52
|
|
52
|
|
|||||||
|
3.680
|
2027
|
100
|
|
—
|
|
|||||||
|
3.390
|
2027
|
35
|
|
35
|
|
|||||||
|
3.800
|
2028
|
300
|
|
—
|
|
|||||||
|
3.180
|
2032
|
100
|
|
100
|
|
|||||||
|
5.800
|
2035
|
175
|
|
175
|
|
|||||||
|
3.520
|
2037
|
335
|
|
335
|
|
|||||||
|
4.010
|
2038
|
215
|
|
—
|
|
|||||||
|
6.170
|
2040
|
50
|
|
50
|
|
|||||||
|
4.970
|
2040
|
50
|
|
50
|
|
|||||||
|
4.310
|
2042
|
263
|
|
263
|
|
|||||||
|
3.950
|
2043
|
425
|
|
425
|
|
|||||||
|
4.100
|
2045
|
250
|
|
250
|
|
|||||||
|
3.250
|
2046
|
450
|
|
450
|
|
|||||||
|
3.950
|
2047
|
350
|
|
350
|
|
|||||||
|
4.050
|
2048
|
550
|
|
—
|
|
|||||||
|
4.350
|
2049
|
550
|
|
—
|
|
|||||||
|
3.860
|
2052
|
50
|
|
50
|
|
|||||||
|
4.280
|
2057
|
185
|
|
—
|
|
|||||||
|
4.350
|
2064
|
250
|
|
250
|
|
|||||||
|
Total first mortgage bonds
|
|
|
$
|
6,335
|
|
$
|
5,535
|
|
||||
|
Securitization bonds
|
3.057
|
1
|
2020-2029
|
2
|
277
|
|
302
|
|
||||
|
Revolving credit agreements
|
variable
|
3
|
2020-2023
|
215
|
|
—
|
|
|||||
|
Tax-exempt pollution control revenue bond
|
variable
|
2035
|
35
|
|
103
|
|
||||||
|
Total principal amount outstanding
|
|
$
|
6,862
|
|
$
|
5,940
|
|
|||||
|
Current amounts
|
|
(26
|
)
|
(343
|
)
|
|||||||
|
Net unamortized discounts
|
|
(16
|
)
|
(8
|
)
|
|||||||
|
Unamortized issuance costs
|
(41
|
)
|
(28
|
)
|
||||||||
|
Total long-term debt
|
$
|
6,779
|
|
$
|
5,561
|
|
||||||
127
|
1
|
The weighted-average interest rate for Consumers’ securitization bonds issued through its subsidiary Consumers 2014 Securitization Funding was
3.057 percent
at
December 31, 2018
and
2.913 percent
at
December 31, 2017
.
|
|
2
|
Principal and interest payments are made semiannually.
|
|
3
|
The weighted-average interest rate for Consumers’ revolving credit facilities was
3.331 percent
at
December 31, 2018
. There were
no
outstanding borrowings at
December 31, 2017
.
|
Financings:
Presented in the following table is a summary of major long-term debt transactions during the year ended
December 31, 2018
:
|
Principal
(In Millions)
|
Interest Rate (%)
|
Issue/Retirement
Date
|
Maturity Date
|
||||
|
Debt issuances
|
|||||||
|
CMS Energy, parent only
|
|||||||
|
Junior subordinated notes
1
|
|
$
|
200
|
|
5.625
|
March 2018
|
March 2078
|
|
Junior subordinated notes
1
|
|
250
|
|
5.875
|
September 2018
|
October 2078
|
|
|
Junior subordinated notes
1
|
|
30
|
|
5.875
|
October 2018
|
October 2078
|
|
|
Total CMS Energy, parent only
|
|
$
|
480
|
|
|
|
|
|
CMS Enterprises, including subsidiaries
|
|||||||
|
Term loan facility
|
$
|
100
|
|
variable
2
|
October 2018
|
September 2025
|
|
|
Total CMS Enterprises, including subsidiaries
|
$
|
100
|
|
||||
|
Consumers
|
|||||||
|
First mortgage bonds
|
$
|
550
|
|
4.050
|
May 2018
|
May 2048
|
|
|
First mortgage bonds
|
100
|
|
3.680
|
October 2018
|
October 2027
|
||
|
First mortgage bonds
|
215
|
|
4.010
|
October 2018
|
October 2038
|
||
|
First mortgage bonds
|
185
|
|
4.280
|
October 2018
|
October 2057
|
||
|
First mortgage bonds
|
300
|
|
3.800
|
November 2018
|
November 2028
|
||
|
First mortgage bonds
|
550
|
|
4.350
|
November 2018
|
April 2049
|
||
|
Total Consumers
|
$
|
1,900
|
|
||||
|
Total CMS Energy
|
$
|
2,480
|
|
||||
|
Debt retirements
|
|||||||
|
CMS Energy, parent only
|
|||||||
|
Term loan facility
|
$
|
180
|
|
variable
|
March 2018
|
December 2018
|
|
|
Senior notes
3
|
100
|
|
8.750
|
June 2018
|
June 2019
|
||
|
Term loan facility
|
45
|
|
variable
|
August 2018
|
December 2018
|
||
|
Senior notes
4
|
300
|
|
6.250
|
October 2018
|
February 2020
|
||
|
Total CMS Energy, parent only
|
$
|
625
|
|
||||
|
Consumers
|
|||||||
|
Tax-exempt pollution control revenue bonds
|
$
|
68
|
|
variable
|
April 2018
|
April 2018
|
|
|
First mortgage bonds
|
250
|
|
5.650
|
May 2018
|
September 2018
|
||
|
First mortgage bonds
|
350
|
|
6.125
|
November 2018
|
March 2019
|
||
|
First mortgage bonds
|
500
|
|
6.700
|
November 2018
|
September 2019
|
||
|
Total Consumers
|
$
|
1,168
|
|
||||
|
Total CMS Energy
|
$
|
1,793
|
|
||||
|
1
|
These unsecured obligations rank subordinate and junior in right of payment to all of CMS Energy’s existing and future senior indebtedness.
|
128
|
2
|
A subsidiary of CMS Enterprises entered into interest rate swaps with the lending banks to fix the interest charges associated with the debt.
|
|
3
|
CMS Energy retired these senior notes at a premium and recorded a loss on extinguishment of
$5 million
in other expense on its consolidated statements of income.
|
|
4
|
CMS Energy retired these senior notes at a premium and recorded a loss on extinguishment of
$11 million
in other expense on its consolidated statements of income.
|
Term Loan Credit Agreement:
In December 2018, CMS Energy entered into a
$300 million
term loan credit agreement. CMS Energy drew the entire amount of the term loan in January 2019.
First Mortgage Bonds:
Consumers secures its first mortgage bonds by a mortgage and lien on substantially all of its property. Consumers’ ability to issue first mortgage bonds is restricted by certain provisions in the First Mortgage Bond Indenture and the need for regulatory approvals under federal law. Restrictive issuance provisions in the First Mortgage Bond Indenture include achieving a
two
-times interest coverage ratio and having sufficient unfunded net property additions.
Regulatory Authorization for Financings:
Consumers is required to maintain FERC authorization for financings. Its current authorization terminates on June 30, 2020. Any long-term issuances during the authorization period are exempt from FERC’s competitive bidding and negotiated placement requirements.
Securitization Bonds:
Certain regulatory assets held by Consumers’ subsidiary, Consumers 2014 Securitization Funding, collateralize Consumers’ securitization bonds. The bondholders have no recourse to Consumers’ assets except for those held by the subsidiary that issued the bonds. Consumers collects securitization surcharges to cover the principal and interest on the bonds as well as certain other qualified costs. The surcharges collected are remitted to a trustee and are not available to creditors of Consumers or creditors of Consumers’ affiliates other than the subsidiary that issued the bonds.
Debt Maturities:
At
December 31, 2018
, the aggregate annual contractual maturities for long-term debt for the next five years were:
|
In Millions
|
||||||||||||||||||||
|
2019
|
2020
|
2021
|
2022
|
2023
|
||||||||||||||||
|
CMS Energy, including Consumers
|
||||||||||||||||||||
|
Long-term debt
|
$
|
974
|
|
$
|
1,007
|
|
$
|
310
|
|
$
|
1,146
|
|
$
|
546
|
|
|||||
|
Consumers
|
||||||||||||||||||||
|
Long-term debt
|
$
|
26
|
|
$
|
626
|
|
$
|
27
|
|
$
|
653
|
|
$
|
369
|
|
|||||
Revolving Credit Facilities:
The following revolving credit facilities with banks were available at
December 31, 2018
:
|
In Millions
|
||||||||||||||||
|
Expiration Date
|
Amount of Facility
|
Amount Borrowed
|
Letters of Credit Outstanding
|
Amount Available
|
||||||||||||
|
CMS Energy, parent only
|
||||||||||||||||
|
June 5, 2023
1,2
|
$
|
550
|
|
$
|
30
|
|
$
|
1
|
|
$
|
519
|
|
||||
|
CMS Enterprises, including subsidiaries
|
||||||||||||||||
|
September 30, 2025
3
|
$
|
18
|
|
$
|
—
|
|
$
|
8
|
|
$
|
10
|
|
||||
|
Consumers
4
|
||||||||||||||||
|
June 5, 2023
5
|
$
|
850
|
|
$
|
15
|
|
$
|
7
|
|
$
|
828
|
|
||||
|
November 19, 2020
6
|
250
|
|
200
|
|
35
|
|
15
|
|
||||||||
|
September 9, 2019
|
30
|
|
—
|
|
30
|
|
—
|
|
||||||||
129
|
1
|
During the year ended
December 31, 2018
, CMS Energy’s average borrowings totaled
$15 million
with a weighted-average interest rate of
2.997 percent
. In January 2019, CMS Energy increased its borrowings under this facility to $
73 million
.
|
|
2
|
In June 2018, CMS Energy amended its
$550 million
revolving credit facility, eliminating the security provided by Consumers common stock, and extending the expiration date to June 2023.
|
|
3
|
Under this facility,
$8 million
is available solely for the purpose of issuing letters of credit. Obligations under this facility are secured by the collateral accounts with the lending bank.
|
|
4
|
Obligations under these facilities are secured by first mortgage bonds of Consumers. During the year ended
December 31, 2018
, Consumers’ average borrowings totaled
$3 million
with a weighted-average interest rate of
3.505 percent
.
|
|
5
|
In June 2018, Consumers amended this revolving credit facility by increasing its borrowing capacity to
$850 million
and extending the expiration date to June 2023. In January 2019, Consumers repaid
$15 million
of borrowings under this facility.
|
|
6
|
In November 2018, Consumers amended this revolving credit facility by extending the expiration date to November 2020. In January 2019, Consumers repaid
$200 million
of borrowings under this facility.
|
Short-term Borrowings:
Under
Consumers’ commercial paper program
, Consumers may
issue, in one or more placements
, commercial paper notes
with maturities of up to
365
days and that bear interest at fixed or floating rates. These issuances are supported by Consumers’ revolving credit facilities
and may have an aggregate principal amount outstanding of
up to
$500 million
.
While the amount of outstanding commercial paper does not reduce the available capacity of the revolving credit facilities, Consumers does not intend to issue commercial paper in an amount exceeding the available capacity of the facilities. At
December 31, 2018
,
$97 million
of commercial paper notes
with a weighted-average annual interest rate of
2.913 percent
were outstanding under this program
and were recorded as current notes payable on the consolidated balance sheets of CMS Energy and Consumers.
Dividend Restrictions:
At
December 31, 2018
, payment of dividends by CMS Energy on its common stock was limited to
$4.8 billion
under provisions of the Michigan Business Corporation Act of 1972.
Under the provisions of its articles of incorporation, at
December 31, 2018
, Consumers had
$1.3 billion
of unrestricted retained earnings available to pay dividends on its common stock to CMS Energy. Provisions of the Federal Power Act and the Natural Gas Act appear to restrict dividends payable by Consumers to the amount of Consumers’ retained earnings. Several decisions from FERC suggest that, under a variety of circumstances, dividends from Consumers on its common stock would not be limited to amounts in Consumers’ retained earnings. Any decision by Consumers to pay dividends on its common stock in excess of retained earnings would be based on specific facts and circumstances and would be subject to a formal regulatory filing process.
For the year ended
December 31, 2018
, Consumers paid
$531 million
in dividends on its common stock to CMS Energy.
Capitalization:
The authorized capital stock of CMS Energy consists of:
|
•
|
350 million
shares of CMS Energy Common Stock, par value
$0.01
per share
|
|
•
|
10 million
shares of CMS Energy Preferred Stock, par value
$0.01
per share
|
130
Issuance of Common Stock:
In March 2017, CMS Energy entered into a continuous equity offering program permitting it to sell, from time to time in “at the market” offerings, common stock having an aggregate sales price of up to
$100 million
. Presented in the following table are the transactions that CMS Energy entered into under the program:
|
Number of Shares Issued
|
|
Net Proceeds
(In Millions) |
||||
|
May 2018
|
638,898
|
|
$
|
29
|
|
|
|
June 2017
|
1,494,371
|
|
70
|
|
||
In August 2018, CMS Energy entered into an equity offering program under which it may sell, from time to time, shares of CMS Energy common stock having an aggregate sales price of up to
$250 million
. Under this program, CMS Energy may sell its common stock in privately negotiated “at the market” offerings, through forward sales transactions or otherwise.
In November 2018, CMS Energy entered into forward equity sale contracts under this program. These contracts allow CMS Energy to either physically settle the contracts by issuing
shares of its common stock at the then-applicable forward sale price specified by the agreements or net settle through the delivery or receipt of cash or shares. CMS Energy may settle the contracts at any time through May 2020, and presently intends to physically settle the contracts by delivering shares of its common stock.
Presented in the following table are the details of the forward equity sale contracts:
|
Maturity Date
|
Number of Shares
|
|
Initial Forward Price Per Share
|
|||
|
May 16, 2020
|
2,017,783
|
|
$
|
49.06
|
|
|
|
May 20, 2020
|
777,899
|
|
50.91
|
|
||
The initial forward price in the forward equity sale contracts includes a deduction for commissions and will be adjusted on a daily basis over the term based on an interest rate factor and decreased on certain dates by certain predetermined amounts to reflect expected dividend payments.
No amounts have or will be recorded in CMS Energy’s consolidated balance sheets until settlements of the forward equity sale contracts occur. If CMS Energy had elected to net share settle the contracts as of
December 31, 2018
, CMS Energy would have been required to deliver
463
shares.
Preferred Stock of Subsidiary:
Consumers’ preferred stock is traded on the New York Stock Exchange under the symbol CMS-PB. Presented in the following table are details of Consumers’ preferred stock at
December 31, 2018
and
2017
:
|
Par Value
|
Optional
Redemption
Price
|
Number of Shares Authorized
|
|
Number of
Shares
Outstanding
|
|
|||||||
|
Cumulative, with no mandatory redemption
|
$
|
100
|
|
$
|
110
|
|
7,500,000
|
|
373,148
|
|
||
131
6
:
Fair Value Measurements
Accounting standards define fair value as the price that would be received to sell an asset or paid to transfer a liability in an orderly transaction between market participants. When measuring fair value, CMS Energy and Consumers are required to incorporate all assumptions that market participants would use in pricing an asset or liability, including assumptions about risk. A fair value hierarchy prioritizes inputs used to measure fair value according to their observability in the market. The three levels of the fair value hierarchy are as follows:
|
•
|
Level 1 inputs are unadjusted quoted prices in active markets for identical assets or liabilities.
|
|
•
|
Level 2 inputs are observable, market-based inputs, other than Level 1 prices. Level 2 inputs may include quoted prices for similar assets or liabilities in active markets, quoted prices in inactive markets, and inputs derived from or corroborated by observable market data.
|
|
•
|
Level 3 inputs are unobservable inputs that reflect CMS Energy’s or Consumers’ own assumptions about how market participants would value their assets and liabilities.
|
CMS Energy and Consumers classify fair value measurements within the fair value hierarchy based on the lowest level of input that is significant to the fair value measurement in its entirety.
Assets and Liabilities Measured at Fair Value on a Recurring Basis
Presented in the following table are CMS Energy’s and Consumers’ assets and liabilities recorded at fair value on a recurring basis:
|
In Millions
|
|||||||||||||||||
|
|
CMS Energy, including Consumers
|
Consumers
|
|||||||||||||||
|
December 31
|
2018
|
|
2017
|
|
2018
|
|
2017
|
|
|||||||||
|
Assets
1
|
|||||||||||||||||
|
Cash equivalents
|
$
|
27
|
|
$
|
74
|
|
$
|
—
|
|
$
|
—
|
|
|||||
|
Restricted cash equivalents
|
21
|
|
17
|
|
17
|
|
17
|
|
|||||||||
|
CMS Energy common stock
|
—
|
|
—
|
|
1
|
|
21
|
|
|||||||||
|
Nonqualified deferred compensation plan assets
|
14
|
|
14
|
|
10
|
|
10
|
|
|||||||||
|
DB SERP
|
|||||||||||||||||
|
Cash equivalents
|
1
|
|
5
|
|
—
|
|
4
|
|
|||||||||
|
Debt securities
|
—
|
|
141
|
|
—
|
|
102
|
|
|||||||||
|
Derivative instruments
|
1
|
|
1
|
|
1
|
|
1
|
|
|||||||||
|
Total
|
$
|
64
|
|
$
|
252
|
|
$
|
29
|
|
$
|
155
|
|
|||||
|
Liabilities
1
|
|||||||||||||||||
|
Nonqualified deferred compensation plan liabilities
|
$
|
14
|
|
$
|
14
|
|
$
|
10
|
|
$
|
10
|
|
|||||
|
Derivative instruments
|
3
|
|
1
|
|
—
|
|
—
|
|
|||||||||
|
Total
|
$
|
17
|
|
$
|
15
|
|
$
|
10
|
|
$
|
10
|
|
|||||
|
1
|
All assets and liabilities were classified as Level 1 with the exception of derivative contracts, which were classified as Level 2 or Level 3.
|
132
Cash Equivalents:
Cash equivalents and restricted cash equivalents consist of money market funds with daily liquidity.
Nonqualified Deferred Compensation Plan Assets and Liabilities:
The nonqualified deferred compensation plan assets consist of mutual funds, which are valued using the daily quoted net asset values. CMS Energy and Consumers value their nonqualified deferred compensation plan liabilities based on the fair values of the plan assets, as they reflect the amount owed to the plan participants in accordance with their investment elections. CMS Energy and Consumers report the assets in other non‑current assets and the liabilities in other non‑current liabilities on their consolidated balance sheets.
DB SERP Assets:
The DB SERP cash equivalents consist of a money market fund with daily liquidity and are reported in other non‑current assets on CMS Energy and Consumers’ consolidated balance sheets. The DB SERP debt securities at December 31, 2017 consisted of U.S. Treasury debt securities that were valued at their daily quoted market prices. These debt securities were reported in other non‑current assets on CMS Energy’s and Consumers’ consolidated balance sheets.
In July 2018, CMS Energy and Consumers sold the DB SERP debt securities
. For additional details about this sale, see
Note 7, Financial Instruments
.
Derivative Instruments:
CMS Energy and Consumers value their derivative instruments using either a market approach that incorporates information from market transactions, or an income approach that discounts future expected cash flows to a present value amount. CMS Energy’s and Consumers’ derivatives are classified as Level 2 or Level 3.
The derivatives classified as Level 2 are interest rate swaps at CMS Energy, which are valued using market-based inputs. The majority of derivatives classified as Level 3 are FTRs held by Consumers. Due to the lack of quoted pricing information, Consumers determines the fair value of its FTRs based on Consumers’ average historical settlements. There was no material activity within the Level 3 categories of assets and liabilities during the years presented.
133
7
:
Financial Instruments
Presented in the following table are the carrying amounts and fair values, by level within the fair value hierarchy, of CMS Energy’s and Consumers’ financial instruments that are not recorded at fair value. The table excludes cash, cash equivalents, short-term financial instruments, and trade accounts receivable and payable whose carrying amounts approximate their fair values. For information about assets and liabilities recorded at fair value and for additional details regarding the fair value hierarchy, see
Note 6, Fair Value Measurements
.
|
In Millions
|
|||||||||||||||||||||||||||||||||||||||||
|
December 31, 2018
|
December 31, 2017
|
||||||||||||||||||||||||||||||||||||||||
|
Fair Value
|
Fair Value
|
||||||||||||||||||||||||||||||||||||||||
|
Carrying
|
Level
|
Carrying
|
Level
|
||||||||||||||||||||||||||||||||||||||
|
Amount
|
Total
|
1
|
2
|
3
|
Amount
|
Total
|
1
|
2
|
3
|
||||||||||||||||||||||||||||||||
|
CMS Energy, including Consumers
|
|||||||||||||||||||||||||||||||||||||||||
|
Assets
|
|||||||||||||||||||||||||||||||||||||||||
|
Long-term receivables
1
|
$
|
22
|
|
$
|
22
|
|
$
|
—
|
|
$
|
—
|
|
$
|
22
|
|
$
|
21
|
|
$
|
21
|
|
$
|
—
|
|
$
|
—
|
|
$
|
21
|
|
|||||||||||
|
Notes receivable
2
|
1,857
|
|
1,967
|
|
—
|
|
—
|
|
1,967
|
|
1,371
|
|
1,464
|
|
—
|
|
—
|
|
1,464
|
|
|||||||||||||||||||||
|
Securities held to maturity
|
22
|
|
21
|
|
—
|
|
21
|
|
—
|
|
16
|
|
16
|
|
—
|
|
16
|
|
—
|
|
|||||||||||||||||||||
|
Liabilities
|
|||||||||||||||||||||||||||||||||||||||||
|
Long-term debt
3
|
11,589
|
|
11,630
|
|
459
|
|
9,404
|
|
1,767
|
|
10,204
|
|
10,715
|
|
—
|
|
9,363
|
|
1,352
|
|
|||||||||||||||||||||
|
Long-term payables
4
|
27
|
|
27
|
|
—
|
|
—
|
|
27
|
|
27
|
|
26
|
|
—
|
|
—
|
|
26
|
|
|||||||||||||||||||||
|
Consumers
|
|||||||||||||||||||||||||||||||||||||||||
|
Assets
|
|||||||||||||||||||||||||||||||||||||||||
|
Long-term receivables
1
|
$
|
22
|
|
$
|
22
|
|
$
|
—
|
|
$
|
—
|
|
$
|
22
|
|
$
|
21
|
|
$
|
21
|
|
$
|
—
|
|
$
|
—
|
|
$
|
21
|
|
|||||||||||
|
Notes receivable
5
|
—
|
|
—
|
|
—
|
|
—
|
|
—
|
|
17
|
|
17
|
|
—
|
|
—
|
|
17
|
|
|||||||||||||||||||||
|
Notes receivable – related party
6
|
106
|
|
106
|
|
—
|
|
—
|
|
106
|
|
—
|
|
—
|
|
—
|
|
—
|
|
—
|
|
|||||||||||||||||||||
|
Liabilities
|
|||||||||||||||||||||||||||||||||||||||||
|
Long-term debt
7
|
6,805
|
|
6,833
|
|
—
|
|
5,066
|
|
1,767
|
|
5,904
|
|
6,236
|
|
—
|
|
4,883
|
|
1,353
|
|
|||||||||||||||||||||
|
1
|
Includes current accounts receivable of
$14 million
at
December 31, 2018
and
$14 million
at
December 31, 2017
.
|
|
2
|
Includes current portion of notes receivable of
$233 million
at
December 31, 2018
and
$200 million
at
December 31, 2017
. For further details, see
Note 8, Notes Receivable
.
|
|
3
|
Includes current portion of long-term debt of
$1.0 billion
at
December 31, 2018
and
$1.1 billion
at
December 31, 2017
.
|
|
4
|
Includes current portion of long-term payables of
$1 million
at
December 31, 2018
and
$3 million
at
December 31, 2017
.
|
134
|
5
|
Includes current portion of notes receivable of
$17 million
at
December 31, 2017
.
|
|
6
|
Includes current portion of notes receivable – related party of
$7 million
at
December 31, 2018
. For further details on this note receivable, see the DB SERP discussion below.
|
|
7
|
Includes current portion of long-term debt of
$26 million
at
December 31, 2018
and
$343 million
at
December 31, 2017
.
|
The effects of third-party credit enhancements were excluded from the fair value measurements of long-term debt. The principal amount of CMS Energy’s long-term debt supported by third-party credit enhancements was
$35 million
at
December 31, 2018
and
$103 million
at
December 31, 2017
. The entirety of these amounts was at Consumers.
Presented in the following table are CMS Energy’s and Consumers’ investment securities classified as available for sale or held to maturity:
|
In Millions
|
|||||||||||||||||||||||||||||||||
|
December 31, 2018
|
December 31, 2017
|
||||||||||||||||||||||||||||||||
|
Cost
|
Unrealized
Gains
|
Unrealized
Losses
|
Fair
Value
|
Cost
|
Unrealized
Gains
|
Unrealized
Losses
|
Fair
Value
|
||||||||||||||||||||||||||
|
CMS Energy, including Consumers
|
|||||||||||||||||||||||||||||||||
|
Available for sale
|
|||||||||||||||||||||||||||||||||
|
DB SERP securities
|
$
|
—
|
|
$
|
—
|
|
—
|
|
$
|
—
|
|
$
|
141
|
|
$
|
—
|
|
$
|
—
|
|
$
|
141
|
|
||||||||||
|
Held to maturity
|
|||||||||||||||||||||||||||||||||
|
Debt securities
|
22
|
|
—
|
|
1
|
|
21
|
|
16
|
|
—
|
|
—
|
|
16
|
|
|||||||||||||||||
|
Consumers
|
|||||||||||||||||||||||||||||||||
|
Available for sale
|
|||||||||||||||||||||||||||||||||
|
DB SERP securities
|
$
|
—
|
|
$
|
—
|
|
$
|
—
|
|
$
|
—
|
|
$
|
102
|
|
$
|
—
|
|
$
|
—
|
|
$
|
102
|
|
|||||||||
|
CMS Energy common stock
|
—
|
|
—
|
|
—
|
|
—
|
|
2
|
|
19
|
|
—
|
|
21
|
|
|||||||||||||||||
DB SERP Securities:
The DB SERP securities classified as available for sale at
December 31, 2017
were U.S. Treasury debt securities with maturities ranging from
one
to
ten
years. Presented in the following table is a summary of the sales activity for investment securities held within the DB SERP and classified as available for sale:
|
In Millions
|
||||||||||||
|
Years Ended December 31
|
2018
|
2017
|
2016
|
|||||||||
|
CMS Energy, including Consumers
|
||||||||||||
|
Proceeds from sales of investment securities
|
$
|
142
|
|
$
|
145
|
|
$
|
6
|
|
|||
|
Consumers
|
||||||||||||
|
Proceeds from sales of investment securities
|
$
|
103
|
|
$
|
105
|
|
$
|
4
|
|
|||
In July 2018, CMS Energy and Consumers sold the DB SERP debt securities
and CMS Energy issued a
$146 million
demand note payable to the DB SERP rabbi trust.
The demand note bears interest at an annual rate of
4.10 percent
and has a maturity date of 2028.
The demand note payable and associated DB SERP investment were eliminated on CMS Energy’s consolidated balance sheets.
The portion of the demand note attributable to Consumers was recorded as a note receivable – related party on Consumers’ consolidated balance sheets at
December 31, 2018
.
135
During 2017, CMS Energy and Consumers sold mutual fund securities held within the DB SERP and used the proceeds to purchase the debt securities, which were later sold in 2018. CMS Energy reclassified gains of
$2 million
(
$1 million
, net of tax) from AOCI and included this amount in other income on the consolidated statements of income. This amount included Consumers’ gains of
$2 million
(
$1 million
, net of tax). During
2016
, realized gains and losses on the sales were immaterial for CMS Energy and Consumers.
Held-to-maturity Debt Securities:
Debt securities classified as held to maturity consisted primarily of mortgage-backed securities and Utah Housing Corporation bonds held by EnerBank.
CMS Energy Common Stock:
In January 2018, Consumers implemented ASU 2016-01,
Recognition and Measurement of Financial Assets and Financial Liabilities
. In accordance with the standard, as of January 1, 2018, Consumers removed a
$19 million
unrealized gain on its investment in CMS Energy common stock from AOCI and recorded the gain in retained earnings.
In January 2018, Consumers transferred substantially all of its shares in CMS Energy common stock to a related charitable foundation. Consumers’ remaining equity investment in CMS Energy common stock was
$1 million
at
December 31, 2018
. In accordance with the new standard, as of January 1, 2018, Consumers’ investment in CMS Energy common stock was no longer classified as available for sale. Therefore, this amount is not presented in the table above. There were no material changes in the fair value of Consumers’ investment in CMS Energy common stock during the year ended
December 31, 2018
. For further details on CMS Energy’s and Consumers’ accounting for this new standard, see
Note 2, New Accounting Standards
.
Consumers recognized a gain of
$14 million
in
2017
from transferring shares of CMS Energy common stock to a related charitable foundation. The gains reflected the excess of fair value over cost of the stock donated and were recorded in other income on Consumers’ consolidated statements of income. The gains were eliminated on CMS Energy’s consolidated statements of income.
136
8
:
Notes Receivable
Presented in the following table are details of CMS Energy’s and Consumers’ current and non‑current notes receivable:
|
In Millions
|
||||||||
|
December 31
|
2018
|
2017
|
||||||
|
CMS Energy, including Consumers
|
||||||||
|
Current
|
||||||||
|
EnerBank notes receivable, net of allowance for loan losses
|
$
|
233
|
|
$
|
178
|
|
||
|
EnerBank notes receivable held for sale
|
—
|
|
2
|
|
||||
|
Michigan tax settlement
|
—
|
|
20
|
|
||||
|
Non-current
|
||||||||
|
EnerBank notes receivable
|
1,624
|
|
1,171
|
|
||||
|
Total notes receivable
|
$
|
1,857
|
|
$
|
1,371
|
|
||
|
Consumers
|
||||||||
|
Current
|
||||||||
|
Michigan tax settlement
|
$
|
—
|
|
$
|
17
|
|
||
|
DB SERP note receivable – related party
|
7
|
|
—
|
|
||||
|
Non-current
|
||||||||
|
DB SERP note receivable – related party
|
99
|
|
—
|
|
||||
|
Total notes receivable
|
$
|
106
|
|
$
|
17
|
|
||
EnerBank notes receivable are
primarily unsecured consumer installment loans for financing home improvements
. EnerBank records its notes receivable at cost, less an allowance for loan losses. During
2017
, EnerBank completed sales of notes receivable, receiving proceeds of
$52 million
and recording immaterial gains.
During
2018
, EnerBank purchased a portfolio of secured and unsecured consumer retail installment contracts with a principal value of
$205 million
at
December 31, 2018
.
Authorized contractors pay fees to EnerBank to provide borrowers with same-as-cash, zero interest, or reduced interest loans. Unearned income associated with the loan fees, which is recorded as a reduction to notes receivable on CMS Energy’s consolidated balance sheets, was
$102 million
at
December 31, 2018
and
$84 million
at
December 31, 2017
.
The allowance for loan losses is a valuation allowance to reflect estimated credit losses. The allowance is increased by the provision for loan losses and decreased by loan charge-offs net of recoveries. Management estimates the allowance balance required by taking into consideration historical loan loss experience, the nature and volume of the portfolio, economic conditions, and other factors. Loan losses are charged against the allowance when the loss is confirmed, but no later than the point at which a loan becomes
120
days past due.
137
Presented in the following table are the changes in the allowance for loan losses:
|
In Millions
|
||||||||
|
Years Ended December 31
|
2018
|
2017
|
||||||
|
Balance at beginning of period
|
$
|
20
|
|
$
|
16
|
|
||
|
Charge-offs
|
(24
|
)
|
(19
|
)
|
||||
|
Recoveries
|
3
|
|
3
|
|
||||
|
Provision for loan losses
|
25
|
|
20
|
|
||||
|
Balance at end of period
|
$
|
24
|
|
$
|
20
|
|
||
Loans that are
30
days or more past due are considered delinquent. The balance of EnerBank’s delinquent consumer loans was
$21 million
at
December 31, 2018
and
$14 million
at
December 31, 2017
.
At
December 31, 2018
and
December 31, 2017
,
$1 million
of EnerBank’s loans had been modified as troubled debt restructurings.
For additional details about the DB SERP note receivable – related party, see
Note 7, Financial Instruments
.
138
9
:
Plant, Property, and Equipment
Presented in the following table are details of CMS Energy’s and Consumers’ plant, property, and equipment:
|
In Millions
|
|||||||||||
|
December 31
|
Estimated
Depreciable
Life in Years
|
2018
|
2017
|
||||||||
|
CMS Energy, including Consumers
|
|||||||||||
|
Plant, property, and equipment, gross
|
|||||||||||
|
Consumers
|
3
|
—
|
125
|
$
|
23,963
|
|
$
|
22,318
|
|
||
|
Enterprises
|
|||||||||||
|
Independent power production
|
3
|
—
|
35
|
410
|
|
163
|
|
||||
|
Other
|
3
|
—
|
5
|
2
|
|
4
|
|
||||
|
Other
|
1
|
—
|
7
|
25
|
|
21
|
|
||||
|
Plant, property, and equipment, gross
|
$
|
24,400
|
|
$
|
22,506
|
|
|||||
|
Construction work in progress
|
763
|
|
765
|
|
|||||||
|
Accumulated depreciation and amortization
|
(7,037
|
)
|
(6,510
|
)
|
|||||||
|
Total plant, property, and equipment
|
$
|
18,126
|
|
$
|
16,761
|
|
|||||
|
Consumers
|
|||||||||||
|
Plant, property, and equipment, gross
|
|||||||||||
|
Electric
|
|||||||||||
|
Generation
|
22
|
—
|
125
|
$
|
6,305
|
|
$
|
6,025
|
|
||
|
Distribution
|
20
|
—
|
75
|
7,957
|
|
7,603
|
|
||||
|
Transmission
|
46
|
—
|
75
|
154
|
|
66
|
|
||||
|
Other
|
5
|
—
|
50
|
1,316
|
|
1,229
|
|
||||
|
Assets under capital leases and financing obligation
1
|
295
|
|
298
|
|
|||||||
|
Gas
|
|||||||||||
|
Distribution
|
20
|
—
|
85
|
4,651
|
|
4,182
|
|
||||
|
Transmission
|
17
|
—
|
75
|
1,521
|
|
1,278
|
|
||||
|
Underground storage facilities
2
|
27
|
—
|
75
|
910
|
|
842
|
|
||||
|
Other
|
5
|
—
|
50
|
823
|
|
764
|
|
||||
|
Capital leases
1
|
14
|
|
14
|
|
|||||||
|
Other non‑utility property
|
3
|
—
|
51
|
17
|
|
17
|
|
||||
|
Plant, property, and equipment, gross
|
$
|
23,963
|
|
$
|
22,318
|
|
|||||
|
Construction work in progress
|
756
|
|
753
|
|
|||||||
|
Accumulated depreciation and amortization
|
(6,958
|
)
|
(6,441
|
)
|
|||||||
|
Total plant, property, and equipment
3
|
$
|
17,761
|
|
$
|
16,630
|
|
|||||
|
1
|
For information regarding the amortization terms of Consumers’ assets under capital leases and financing obligation, see
Note 10, Leases and Palisades Financing
.
|
|
2
|
Underground storage includes base natural gas of
$26 million
at
December 31, 2018
and
2017
. Base natural gas is not subject to depreciation.
|
|
3
|
For the year ended
December 31, 2018
, Consumers’ plant additions were
$1.8 billion
and plant retirements were
$190 million
. For the year ended
December 31, 2017
, Consumers’ plant additions were
$1.7 billion
and plant retirements were
$214 million
.
|
139
Capitalization:
CMS Energy and Consumers record plant, property, and equipment at original cost when placed into service. The cost includes labor, material, applicable taxes, overhead such as pension and other benefits, and AFUDC, if applicable. Consumers’ plant, property, and equipment is generally recoverable through its general rate making process.
With the exception of utility property for which the remaining book value has been securitized, mothballed utility property stays in rate base and continues to be depreciated at the same rate as before the mothball period. When utility property is retired or otherwise disposed of in the ordinary course of business, Consumers records the original cost to accumulated depreciation, along with associated cost of removal, net of salvage. CMS Energy and Consumers recognize gains or losses on the retirement or disposal of non‑regulated assets in income. Consumers records cost of removal collected from customers, but not spent, as a regulatory liability.
Software:
CMS Energy and Consumers capitalize the costs to purchase and develop internal-use computer software. These costs are expensed evenly over the estimated useful life of the internal-use computer software. If computer software is integral to computer hardware, then its cost is capitalized and depreciated with the hardware.
AFUDC:
Consumers capitalizes AFUDC on regulated major construction projects, except pollution control facilities on its fossil-fuel-fired power plants. AFUDC represents the estimated cost of debt and authorized return-on-equity funds used to finance construction additions. Consumers records the offsetting credit as a reduction of interest for the amount representing the borrowed funds component and as other income for the equity funds component on the consolidated statements of income. When construction is completed and the property is placed in service, Consumers depreciates and recovers the capitalized AFUDC from customers over the life of the related asset. Presented in the following table are Consumers’ average AFUDC capitalization rates:
|
Years Ended December 31
|
2018
|
|
2017
|
|
2016
|
|
|
Electric
|
6.9
|
%
|
6.8
|
%
|
7.3
|
%
|
|
Gas
|
5.9
|
|
6.0
|
|
6.2
|
|
Assets Under Capital Leases and Financing Obligation:
Presented in the following table are further details about changes in Consumers’ assets under capital leases and financing obligation:
|
In Millions
|
||||||||
|
Years Ended December 31
|
2018
|
2017
|
||||||
|
Consumers
|
||||||||
|
Balance at beginning of period
|
$
|
312
|
|
$
|
310
|
|
||
|
Additions
|
—
|
|
3
|
|
||||
|
Net retirements and other adjustments
|
(3
|
)
|
(1
|
)
|
||||
|
Balance at end of period
|
$
|
309
|
|
$
|
312
|
|
||
Assets under capital leases and financing obligation are presented as gross amounts. Accumulated amortization of assets under capital leases and financing obligation was
$212 million
at
December 31, 2018
and
$193 million
at
December 31, 2017
for Consumers.
140
Depreciation and Amortization:
Presented in the following table are further details about CMS Energy’s and Consumers’ accumulated depreciation and amortization:
|
In Millions
|
||||||||
|
December 31
|
2018
|
2017
|
||||||
|
CMS Energy, including Consumers
|
||||||||
|
Utility plant assets
|
$
|
6,956
|
|
$
|
6,439
|
|
||
|
Non-utility plant assets
|
81
|
|
71
|
|
||||
|
Consumers
|
||||||||
|
Utility plant assets
|
$
|
6,956
|
|
$
|
6,439
|
|
||
|
Non-utility plant assets
|
2
|
|
2
|
|
||||
Consumers depreciates utility property on an asset-group basis, in which it applies a single MPSC-approved depreciation rate to the gross investment in a particular class of property within the electric and gas segments. Consumers performs depreciation studies periodically to determine appropriate group lives. Presented in the following table are the composite depreciation rates for Consumers’ segment properties:
|
Years Ended December 31
|
2018
|
2017
|
2016
|
||||||
|
Electric utility property
|
3.9
|
%
|
3.9
|
%
|
3.9
|
%
|
|||
|
Gas utility property
|
2.9
|
|
2.9
|
|
2.9
|
|
|||
|
Other property
|
10.1
|
|
10.0
|
|
9.8
|
|
|||
CMS Energy and Consumers record property repairs and minor property replacement as maintenance expense. CMS Energy and Consumers record planned major maintenance activities as operating expense unless the cost represents the acquisition of additional long-lived assets or the replacement of an existing long-lived asset.
Presented in the following table are the components of CMS Energy’s and Consumers’ depreciation and amortization expense:
|
In Millions
|
||||||||||||
|
Years Ended December 31
|
2018
|
2017
|
2016
|
|||||||||
|
CMS Energy, including Consumers
|
||||||||||||
|
Depreciation expense – plant, property, and equipment
|
$
|
778
|
|
$
|
739
|
|
$
|
687
|
|
|||
|
Amortization expense
|
||||||||||||
|
Software
|
127
|
|
114
|
|
96
|
|
||||||
|
Other intangible assets
|
3
|
|
3
|
|
3
|
|
||||||
|
Securitized regulatory assets
|
25
|
|
25
|
|
25
|
|
||||||
|
Total depreciation and amortization expense
|
$
|
933
|
|
$
|
881
|
|
$
|
811
|
|
|||
|
Consumers
|
||||||||||||
|
Depreciation expense – plant, property, and equipment
|
$
|
768
|
|
$
|
732
|
|
$
|
680
|
|
|||
|
Amortization expense
|
||||||||||||
|
Software
|
125
|
|
112
|
|
95
|
|
||||||
|
Other intangible assets
|
3
|
|
3
|
|
3
|
|
||||||
|
Securitized regulatory assets
|
25
|
|
25
|
|
25
|
|
||||||
|
Total depreciation and amortization expense
|
$
|
921
|
|
$
|
872
|
|
$
|
803
|
|
|||
141
Presented in the following table is CMS Energy’s and Consumers’ estimated amortization expense on intangible assets for each of the next five years:
|
In Millions
|
||||||||||||||||||||
|
2019
|
2020
|
2021
|
2022
|
2023
|
||||||||||||||||
|
CMS Energy, including Consumers
|
||||||||||||||||||||
|
Intangible asset amortization expense
|
$
|
132
|
|
$
|
122
|
|
$
|
108
|
|
$
|
95
|
|
$
|
74
|
|
|||||
|
Consumers
|
||||||||||||||||||||
|
Intangible asset amortization expense
|
$
|
130
|
|
$
|
120
|
|
$
|
106
|
|
$
|
94
|
|
$
|
74
|
|
|||||
Intangible Assets:
Included in net plant, property, and equipment are intangible assets. Presented in the following table are details about CMS Energy’s and Consumers’ intangible assets:
|
In Millions
|
||||||||||||||||||||
|
December 31, 2018
|
December 31, 2017
|
|||||||||||||||||||
|
Description
|
Amortization
Life in Years
|
Gross Cost
1
|
Accumulated
Amortization
|
Gross Cost
1
|
Accumulated
Amortization
|
|||||||||||||||
|
CMS Energy, including Consumers
|
||||||||||||||||||||
|
Software development
|
1
|
—
|
15
|
$
|
1,024
|
|
$
|
603
|
|
$
|
950
|
|
$
|
481
|
|
|||||
|
Rights of way
|
50
|
—
|
85
|
167
|
|
52
|
|
162
|
|
50
|
|
|||||||||
|
Franchises and consents
|
5
|
—
|
30
|
15
|
|
9
|
|
14
|
|
8
|
|
|||||||||
|
Leasehold improvements
|
various
2
|
9
|
|
7
|
|
9
|
|
7
|
|
|||||||||||
|
Other intangibles
|
various
|
27
|
|
15
|
|
23
|
|
15
|
|
|||||||||||
|
Total
|
$
|
1,242
|
|
$
|
686
|
|
$
|
1,158
|
|
$
|
561
|
|
||||||||
|
Consumers
|
||||||||||||||||||||
|
Software development
|
3
|
—
|
15
|
$
|
1,009
|
|
$
|
595
|
|
$
|
937
|
|
$
|
475
|
|
|||||
|
Rights of way
|
50
|
—
|
85
|
167
|
|
52
|
|
162
|
|
50
|
|
|||||||||
|
Franchises and consents
|
5
|
—
|
30
|
15
|
|
9
|
|
14
|
|
8
|
|
|||||||||
|
Leasehold improvements
|
various
2
|
9
|
|
7
|
|
9
|
|
7
|
|
|||||||||||
|
Other intangibles
|
various
|
26
|
|
15
|
|
21
|
|
15
|
|
|||||||||||
|
Total
|
$
|
1,226
|
|
$
|
678
|
|
$
|
1,143
|
|
$
|
555
|
|
||||||||
|
1
|
For the year ended
December 31, 2018
, Consumers’ intangible asset additions were
$90 million
and intangible asset retirements were
$7 million
. For the year ended
December 31, 2017
, Consumers’ intangible asset additions were
$100 million
and there were
no
intangible asset retirements.
|
|
2
|
Leasehold improvements are amortized over the life of the lease, which may change whenever the lease is renewed or extended.
|
142
Jointly Owned Regulated Utility Facilities
Presented in the following table are Consumers’ investments in jointly owned regulated utility facilities at
December 31, 2018
:
|
In Millions, Except Ownership Share
|
||||||||||||
|
J.H. Campbell Unit 3
|
Ludington
|
Other
|
|
|||||||||
|
Ownership share
|
93.3
|
%
|
51.0
|
%
|
various
|
|
||||||
|
Utility plant in service
|
$
|
1,688
|
|
$
|
411
|
|
$
|
226
|
|
|||
|
Accumulated depreciation
|
(670
|
)
|
(155
|
)
|
(70
|
)
|
||||||
|
Construction work in progress
|
23
|
|
110
|
|
16
|
|
||||||
|
Net investment
|
$
|
1,041
|
|
$
|
366
|
|
$
|
172
|
|
|||
Consumers includes its share of the direct expenses of the jointly owned plants in operating expenses. Consumers shares operation, maintenance, and other expenses of these jointly owned utility facilities in proportion to each participant’s undivided ownership interest. Consumers is required to provide only its share of financing for the jointly owned utility facilities.
10
:
Leases and Palisades Financing
CMS Energy and Consumers lease various assets, including railcars, service vehicles, gas pipeline capacity, and buildings. In addition, CMS Energy and Consumers account for a number of their PPAs as capital and operating leases.
Operating leases for coal-carrying railcars have original lease terms ranging from
seven
to
15
years, expiring without extension provisions over the next
five
years and with extension provisions over the next
eight
years. These leases contain fair market value extension and buyout provisions. Capital leases for Consumers’ vehicle fleet operations have a maximum term of
120
months with some having end-of-lease rental adjustment clauses based on the proceeds received from the sale or disposition of the vehicles, and others having fair market value purchase options.
Consumers has capital leases for gas transportation pipelines to the D.E. Karn generating complex and Zeeland. The capital lease for the gas transportation pipeline into the generating complex has a term of
15
years with a provision to extend the contract from month to month. The remaining term of the contract was
three
years at
December 31, 2018
. The capital lease for the gas transportation pipeline to Zeeland was extended in 2017 for
five
years pursuant to a renewal provision in the contract, with additional renewal provisions of
five
to
ten
years. The remaining terms of Consumers’ long-term PPAs accounted for as leases range between
one
and
15
years. Most of these PPAs contain provisions at the end of the initial contract terms to renew the agreements annually.
143
Presented in the following table are Consumers’ minimum lease expense and contingent rental expense. For each of the years ended
December 31, 2018
,
2017
, and
2016
, all of CMS Energy’s minimum lease expense and contingent rental expense were attributable to Consumers.
|
In Millions
|
||||||||||||
|
Years Ended December 31
|
2018
|
2017
|
2016
|
|||||||||
|
Consumers
|
||||||||||||
|
Minimum operating lease expense
|
||||||||||||
|
PPAs
|
$
|
4
|
|
$
|
5
|
|
$
|
6
|
|
|||
|
Other agreements
|
11
|
|
15
|
|
14
|
|
||||||
|
Contingent rental expense
1
|
101
|
|
96
|
|
82
|
|
||||||
|
1
|
Contingent rental expense is related to capital and operating lease PPAs and is based on delivery of energy and capacity in excess of minimum lease payments.
|
Consumers is authorized by the MPSC to record operating lease payments as operating expense and recover the total cost from customers.
Presented in the following table are the minimum annual rental commitments under Consumers’ non‑cancelable leases at
December 31, 2018
.
|
In Millions
|
||||||||||||
|
Capital Leases
|
Palisades
Financing
|
Operating Leases
|
||||||||||
|
CMS Energy, including Consumers
|
||||||||||||
|
2019
|
$
|
14
|
|
$
|
15
|
|
$
|
16
|
|
|||
|
2020
|
11
|
|
14
|
|
15
|
|
||||||
|
2021
|
11
|
|
14
|
|
15
|
|
||||||
|
2022
|
8
|
|
3
|
|
8
|
|
||||||
|
2023
|
6
|
|
—
|
|
5
|
|
||||||
|
2024 and thereafter
|
21
|
|
—
|
|
38
|
|
||||||
|
Total minimum lease payments
|
$
|
71
|
|
$
|
46
|
|
$
|
97
|
|
|||
|
Less imputed interest
|
22
|
|
4
|
|
||||||||
|
Present value of net minimum lease payments
|
$
|
49
|
|
$
|
42
|
|
||||||
|
Less current portion
|
9
|
|
13
|
|
||||||||
|
Non-current portion
|
$
|
40
|
|
$
|
29
|
|
||||||
|
Consumers
|
||||||||||||
|
2019
|
$
|
14
|
|
$
|
15
|
|
$
|
14
|
|
|||
|
2020
|
11
|
|
14
|
|
14
|
|
||||||
|
2021
|
11
|
|
14
|
|
13
|
|
||||||
|
2022
|
8
|
|
3
|
|
7
|
|
||||||
|
2023
|
6
|
|
—
|
|
5
|
|
||||||
|
2024 and thereafter
|
21
|
|
—
|
|
32
|
|
||||||
|
Total minimum lease payments
|
$
|
71
|
|
$
|
46
|
|
$
|
85
|
|
|||
|
Less imputed interest
|
22
|
|
4
|
|
||||||||
|
Present value of net minimum lease payments
|
$
|
49
|
|
$
|
42
|
|
||||||
|
Less current portion
|
9
|
|
13
|
|
||||||||
|
Non-current portion
|
$
|
40
|
|
$
|
29
|
|
||||||
144
Palisades Financing
In 2007, Consumers sold Palisades to Entergy and entered into a
15
-year PPA
to purchase virtually all of the capacity and energy produced by Palisades, up to the annual average capacity of
798
MW.
Consumers accounted for this transaction as a financing because of its continuing involvement with Palisades through security provided to Entergy for the PPA obligation and other arrangements. Palisades has therefore remained on Consumers’ consolidated balance sheets and Consumers has continued to depreciate it. At the time of the sale, Consumers recorded the sales proceeds as a financing obligation, and has subsequently recorded a portion of the payments under the PPA as interest expense and as a reduction of the financing obligation. Total amortization and interest charges under the financing were
$16 million
for the year ended
December 31, 2018
,
$17 million
for the year ended
December 31, 2017
, and
$17 million
for the year ended
December 31, 2016
. At
December 31, 2018
, the Palisades asset and financing obligation both had a balance of
$42 million
.
11
:
Asset Retirement Obligations
CMS Energy and Consumers record the fair value of the cost to remove assets at the end of their useful lives, if there is a legal obligation to remove them. If a reasonable estimate of fair value cannot be made in the period in which the ARO is incurred, such as for assets with indeterminate lives, the liability is recognized when a reasonable estimate of fair value can be made. CMS Energy and Consumers have not recorded liabilities for assets that have immaterial cumulative disposal costs, such as substation batteries.
CMS Energy and Consumers calculate the fair value of ARO liabilities using an expected present-value technique that reflects assumptions about costs and inflation, and uses a credit-adjusted risk-free rate to discount the expected cash flows. CMS Energy’s ARO liabilities are primarily at Consumers. As a regulated entity, Consumers defers the effects of any changes in assumptions on the fair values of its ARO liabilities, adjusting the associated regulatory assets or liabilities rather than recognizing such effects in earnings.
Presented below are the categories of assets that CMS Energy and Consumers have legal obligations to remove at the end of their useful lives and for which they have an ARO liability recorded:
|
Company and ARO Description
|
In-Service Date
|
Long-Lived Assets
|
|
CMS Energy, including Consumers
|
|
|
|
Closure of gas treating plant and gas wells
|
various
|
Gas transmission and storage
|
|
Closure of coal ash disposal areas
|
various
|
Generating plants coal ash areas
|
|
Gas distribution cut, purge, and cap
|
various
|
Gas distribution mains and services
|
|
Asbestos abatement
|
1973
|
Electric and gas utility plant
|
|
Closure of renewable generation assets
|
various
|
Wind and solar generation facilities
|
|
Consumers
|
|
|
|
Closure of coal ash disposal areas
|
various
|
Generating plants coal ash areas
|
|
Gas distribution cut, purge, and cap
|
various
|
Gas distribution mains and services
|
|
Asbestos abatement
|
1973
|
Electric and gas utility plant
|
|
Closure of renewable generation assets
|
various
|
Wind and solar generation facilities
|
No assets have been restricted for purposes of settling AROs.
145
Presented in the following tables are the changes in CMS Energy’s and Consumers’ ARO liabilities:
|
In Millions
|
||||||||||||||||||||||||
|
ARO
Liability
|
Cash Flow Revisions
|
ARO
Liability
|
||||||||||||||||||||||
|
Company and ARO Description
|
12/31/2017
|
Incurred
|
Settled
|
Accretion
|
12/31/2018
|
|||||||||||||||||||
|
CMS Energy, including Consumers
|
||||||||||||||||||||||||
|
Consumers
|
$
|
429
|
|
$
|
17
|
|
$
|
(40
|
)
|
$
|
22
|
|
$
|
—
|
|
$
|
428
|
|
||||||
|
Gas treating plant and gas wells
|
1
|
|
—
|
|
—
|
|
—
|
|
—
|
|
1
|
|
||||||||||||
|
Renewable generation assets
|
—
|
|
3
|
|
—
|
|
—
|
|
—
|
|
3
|
|
||||||||||||
|
Total CMS Energy
|
$
|
430
|
|
$
|
20
|
|
$
|
(40
|
)
|
$
|
22
|
|
$
|
—
|
|
$
|
432
|
|
||||||
|
Consumers
|
||||||||||||||||||||||||
|
Coal ash disposal areas
|
$
|
191
|
|
$
|
—
|
|
$
|
(20
|
)
|
$
|
8
|
|
$
|
—
|
|
$
|
179
|
|
||||||
|
Gas distribution cut, purge, and cap
|
186
|
|
17
|
|
(9
|
)
|
11
|
|
—
|
|
205
|
|
||||||||||||
|
Asbestos abatement
|
42
|
|
—
|
|
(11
|
)
|
2
|
|
—
|
|
33
|
|
||||||||||||
|
Renewable generation assets
|
10
|
|
—
|
|
—
|
|
1
|
|
—
|
|
11
|
|
||||||||||||
|
Total Consumers
|
$
|
429
|
|
$
|
17
|
|
$
|
(40
|
)
|
$
|
22
|
|
$
|
—
|
|
$
|
428
|
|
||||||
|
In Millions
|
|||||||||||||||||||||||
|
ARO
Liability
|
Cash Flow Revisions
|
ARO
Liability
|
|||||||||||||||||||||
|
Company and ARO Description
|
12/31/2016
|
Incurred
|
Settled
|
Accretion
|
12/31/2017
|
||||||||||||||||||
|
CMS Energy, including Consumers
|
|||||||||||||||||||||||
|
Consumers
|
$
|
446
|
|
$
|
5
|
|
$
|
(45
|
)
|
$
|
23
|
|
—
|
|
$
|
429
|
|
||||||
|
Gas treating plant and gas wells
|
1
|
|
—
|
|
—
|
|
—
|
|
—
|
|
1
|
|
|||||||||||
|
Total CMS Energy
|
$
|
447
|
|
$
|
5
|
|
$
|
(45
|
)
|
$
|
23
|
|
—
|
|
$
|
430
|
|
||||||
|
Consumers
|
|||||||||||||||||||||||
|
Coal ash disposal areas
|
$
|
201
|
|
$
|
—
|
|
$
|
(18
|
)
|
$
|
8
|
|
—
|
|
$
|
191
|
|
||||||
|
Gas distribution cut, purge, and cap
|
182
|
|
3
|
|
(11
|
)
|
12
|
|
—
|
|
186
|
|
|||||||||||
|
Asbestos abatement
|
56
|
|
—
|
|
(16
|
)
|
2
|
|
—
|
|
42
|
|
|||||||||||
|
Renewable generation assets
|
7
|
|
2
|
|
—
|
|
1
|
|
—
|
|
10
|
|
|||||||||||
|
Total Consumers
|
$
|
446
|
|
$
|
5
|
|
$
|
(45
|
)
|
$
|
23
|
|
—
|
|
$
|
429
|
|
||||||
12
:
Retirement Benefits
Benefit Plans:
CMS Energy and Consumers provide pension, OPEB, and other retirement benefits to employees under a number of different plans. These plans include:
|
•
|
non‑contributory, qualified DB Pension Plans (closed to new non‑union participants as of July 1, 2003 and closed to new union participants as of September 1, 2005)
|
|
•
|
a non‑contributory, qualified DCCP for employees hired on or after July 1, 2003
|
|
•
|
benefits to certain management employees under a non‑contributory, nonqualified DB SERP (closed to new participants as of March 31, 2006)
|
|
•
|
a non‑contributory, nonqualified DC SERP for certain management employees hired or promoted on or after April 1, 2006
|
|
•
|
a contributory, qualified defined contribution 401(k) plan
|
|
•
|
health care and life insurance benefits under an OPEB Plan
|
146
DB Pension Plans:
Participants in the pension plans include present and former employees of CMS Energy and Consumers, including certain present and former affiliates and subsidiaries. Pension plan trust assets are not distinguishable by company. Effective
December 31, 2017
, CMS Energy’s and Consumers’ then-existing pension plan was amended to include only retired and former employees already covered; this amended plan is referred to as DB Pension Plan B. Also effective
December 31, 2017
, active employees were moved to a newly created pension plan, referred to as DB Pension Plan A, whose benefits mirror those provided under DB Pension Plan B. Maintaining separate plans for the two groups will allow CMS Energy and Consumers to employ a more targeted investment strategy and will provide additional opportunities to mitigate risk and volatility.
DCCP:
CMS Energy and Consumers provide an employer contribution to the DCCP 401(k) plan for employees hired on or after July 1, 2003. The contribution ranges from
five
to
seven
percent of base pay, depending on years of service. Employees are not required to contribute in order to receive the plan’s employer contribution. DCCP expense for CMS Energy, including Consumers, was
$26 million
for the year ended
December 31, 2018
,
$23 million
for the year ended
December 31, 2017
, and
$20 million
for the year ended
December 31, 2016
. DCCP expense for Consumers was
$25 million
for the year ended
December 31, 2018
,
$22 million
for the year ended
December 31, 2017
, and
$19 million
for the year ended
December 31, 2016
.
DB SERP:
The DB SERP is a nonqualified plan as defined by the Internal Revenue Code. DB SERP benefits are paid from a rabbi trust established in 1988. The trust assets are not considered plan assets under ASC 715. DB SERP rabbi trust earnings are taxable. Presented in the following table are the fair values of trust assets, ABO, and contributions for CMS Energy’s and Consumers’ DB SERP:
|
In Millions
|
||||||||
|
Years Ended December 31
|
2018
|
2017
|
||||||
|
CMS Energy, including Consumers
|
||||||||
|
Trust assets
|
$
|
147
|
|
$
|
146
|
|
||
|
ABO
|
137
|
|
149
|
|
||||
|
Contributions
|
8
|
|
7
|
|
||||
|
Consumers
|
||||||||
|
Trust assets
|
$
|
106
|
|
$
|
106
|
|
||
|
ABO
|
98
|
|
107
|
|
||||
|
Contributions
|
5
|
|
6
|
|
||||
DC SERP:
On April 1, 2006, CMS Energy and Consumers implemented a DC SERP and froze further new participation in the DB SERP. The DC SERP provides participants benefits ranging from
5 percent
to
15 percent
of total compensation. The DC SERP requires a minimum of
five
years of participation before vesting. CMS Energy’s and Consumers’ contributions to the plan, if any, are placed in a grantor trust. For CMS Energy and Consumers, trust assets were
$5 million
at
December 31, 2018
and
$5 million
at
December 31, 2017
. DC SERP assets are included in other non‑current assets on CMS Energy’s and Consumers’ consolidated balance sheets. CMS Energy’s and Consumers’ DC SERP expense was
$1 million
for each of the years ended
December 31, 2018
and 2017 and less than
$1 million
for the year ended December 31,
2016
.
401(k) Plan:
The 401(k) plan employer match equals
100 percent
of eligible contributions up to the first
three
percent of an employee’s wages and
50 percent
of eligible contributions up to the next
two
percent of an employee’s wages. The total 401(k) plan cost for CMS Energy, including Consumers, was
$27 million
for the year ended
December 31, 2018
,
$26 million
for the year ended
December 31, 2017
, and
$24 million
for the year ended
December 31, 2016
. The total 401(k) plan cost for Consumers was
147
$26 million
for the year ended
December 31, 2018
,
$25 million
for the year ended
December 31, 2017
, and
$23 million
for the year ended
December 31, 2016
.
OPEB Plan:
Participants in the OPEB Plan include all regular full-time employees covered by the employee health care plan on the day before retirement from either CMS Energy or Consumers at age
55
or older with at least
ten
full years of applicable continuous service. Regular full-time employees who qualify for disability retirement under the DB Pension Plans or are disabled and covered by the DCCP and who have
15
years of applicable continuous service may also participate in the OPEB Plan. Retiree health care costs were based on the assumption that costs would increase
7.00 percent
in 2019 and
7.50 percent
in 2018 for those under 65 and would increase
7.75 percent
in 2019 and
8.00 percent
in 2018 for those over 65. The rate of increase was assumed to decline to
4.75 percent
by
2027
and thereafter for all retirees.
In November 2017, CMS Energy and Consumers approved certain amendments to the OPEB Plan. Under these amendments, effective January 1, 2019, certain Medicare-eligible retirees will purchase health care plans from private Medicare exchanges. CMS Energy and Consumers performed a remeasurement of the OPEB Plan as of October 31, 2017, resulting in a significant reduction in the benefit obligation.
In July 2018, CMS Energy and Consumers approved an amendment to the OPEB Plan to improve survivor benefits for certain Medicare-eligible retirees, effective January 1, 2019, resulting in a
$26 million
increase in the benefit obligation.
The assumptions used in the health care cost-trend rate affect service cost, interest cost, and the PBO. Presented in the following table are the effects of a one-percentage-point change in the health care cost-trend assumption:
|
In Millions
|
||||||||
|
Year Ended December 31, 2018
|
One Percentage
Point Increase
|
One Percentage
Point Decrease
|
||||||
|
CMS Energy, including Consumers
|
||||||||
|
Effect on total service and interest cost component
|
$
|
2
|
|
$
|
(2
|
)
|
||
|
Effect on PBO
|
30
|
|
(26
|
)
|
||||
|
Consumers
|
||||||||
|
Effect on total service and interest cost component
|
$
|
2
|
|
$
|
(2
|
)
|
||
|
Effect on PBO
|
28
|
|
(25
|
)
|
||||
148
Assumptions:
Presented in the following table are the weighted-average assumptions used in CMS Energy’s and Consumers’ retirement benefits plans to determine benefit obligations and net periodic benefit cost:
|
December 31
|
2018
|
|
2017
|
|
2016
|
|
|
CMS Energy, including Consumers
|
||||||
|
Weighted average for benefit obligations
1
|
||||||
|
Discount rate
2
|
||||||
|
DB Pension Plan A
3
|
4.48
|
%
|
3.78
|
%
|
||
|
DB Pension Plan B
3
|
4.32
|
|
3.64
|
|
||
|
DB SERP
|
4.32
|
|
3.65
|
|
4.16
|
%
|
|
OPEB Plan
|
4.42
|
|
3.74
|
|
4.49
|
|
|
Rate of compensation increase
|
||||||
|
DB Pension Plan A
3
|
3.50
|
|
3.50
|
|
||
|
DB SERP
|
5.50
|
|
5.50
|
|
5.50
|
|
|
Weighted average for net periodic benefit cost
1
|
||||||
|
Service cost discount rate
2,4
|
||||||
|
DB Pension Plan A
3
|
3.85
|
|
|
|
|
|
|
DB SERP
|
3.83
|
|
4.51
|
|
4.87
|
|
|
OPEB Plan
|
3.93
|
|
4.89
|
|
4.75
|
|
|
Interest cost discount rate
2,4
|
||||||
|
DB Pension Plan A
3
|
3.39
|
|
||||
|
DB Pension Plan B
3
|
3.24
|
|
|
|
|
|
|
DB SERP
|
3.26
|
|
3.51
|
|
3.64
|
|
|
OPEB Plan
|
3.35
|
|
3.79
|
|
3.89
|
|
|
Expected long-term rate of return on plan assets
5
|
||||||
|
DB Pension Plans
|
7.00
|
|
7.25
|
|
7.25
|
|
|
OPEB Plan
|
7.00
|
|
7.25
|
|
7.25
|
|
|
Rate of compensation increase
|
||||||
|
DB Pension Plan A
3
|
3.50
|
|
|
|
|
|
|
DB SERP
|
5.50
|
|
5.50
|
|
5.50
|
|
|
1
|
The mortality assumption for benefit obligations was based on the RP-2014 mortality table, with projection scales MP-2018 for
2018
, MP-2017 for
2017
, and MP-2016 for
2016
. The mortality assumption for net periodic benefit cost for
2018
,
2017
, and
2016
was based on the RP-2014 mortality table, with projection scales MP-2017 for
2018
, MP-2016 for
2017
, and MP-2015 for
2016
.
|
|
2
|
The discount rate reflects the rate at which benefits could be effectively settled and is equal to the equivalent single rate resulting from a yield-curve analysis. This analysis incorporated the projected benefit payments specific to CMS Energy’s and Consumers’ DB Pension Plans and OPEB Plan and the yields on high-quality corporate bonds rated Aa or better.
|
|
3
|
Effective
December 31, 2017
, CMS Energy’s and Consumers’ existing defined benefit pension plan was amended to include only retired or inactive employees; this amended plan is referred to as DB Pension Plan B. Active employees were moved to a newly created pension plan, referred to as DB Pension Plan A.
|
The assumptions used to measure the plan obligation of the previous defined benefit pension plan at
December 31, 2016
were:
|
•
|
discount rate of
4.30 percent
|
|
•
|
weighted-average rate of compensation increase of
3.60 percent
|
149
The assumptions used to measure the plan cost of the previous defined benefit pension plan were:
|
•
|
service cost discount rate of
4.53
percent at
December 31, 2017
and
4.79
percent at
December 31, 2016
|
|
•
|
interest cost discount rate of
3.56
percent at
December 31, 2017
and
3.66
percent at
December 31, 2016
|
|
•
|
weighted-average rate of compensation increase of
3.60
percent at
December 31, 2017
and
3.00
percent at
December 31, 2016
|
|
4
|
In 2016, CMS Energy and Consumers changed the method they use to determine the discount rate used to calculate the service cost and interest cost components of net periodic benefit costs for the DB Pension and OPEB Plans. Historically, the discount rate used for this purpose represented a single weighted-average rate derived from the yield curve used to determine the benefit obligation. CMS Energy and Consumers have elected to use instead a full-yield-curve approach in the estimation of service cost and interest cost; this approach is more accurate in that it applies individual spot rates along the yield curve to future projected benefit payments based on the time of payment.
|
|
5
|
CMS Energy and Consumers determined the long-term rate of return using historical market returns, the present and expected future economic environment, the capital market principles of risk and return, and the expert opinions of individuals and firms with financial market knowledge. CMS Energy and Consumers considered the asset allocation of the portfolio in forecasting the future expected total return of the portfolio. The goal was to determine a long-term rate of return that could be incorporated into the planning of future cash flow requirements in conjunction with the change in the liability. Annually, CMS Energy and Consumers review for reasonableness and appropriateness the forecasted returns for various classes of assets used to construct an expected return model. CMS Energy’s and Consumers’ expected long-term rate of return on the assets of the DB Pension Plans was
7.00 percent
in
2018
. The actual return (loss) on the assets of the DB Pension Plans was
(6.7) percent
in
2018
,
18.0 percent
in
2017
, and
8.0 percent
in
2016
.
|
Costs:
Presented in the following table are the costs (credits) and other changes in plan assets and benefit obligations incurred in CMS Energy’s and Consumers’ retirement benefits plans:
|
In Millions
|
|||||||||||||||||||||||||
|
DB Pension Plans and DB SERP
|
OPEB Plan
|
||||||||||||||||||||||||
|
Years Ended December 31
|
2018
|
2017
|
2016
|
2018
|
2017
|
2016
|
|||||||||||||||||||
|
CMS Energy, including Consumers
|
|||||||||||||||||||||||||
|
Net periodic cost (credit)
|
|||||||||||||||||||||||||
|
Service cost
|
$
|
48
|
|
$
|
45
|
|
$
|
42
|
|
$
|
17
|
|
$
|
19
|
|
$
|
18
|
|
|||||||
|
Interest cost
|
95
|
|
93
|
|
90
|
|
34
|
|
51
|
|
46
|
|
|||||||||||||
|
Expected return on plan assets
|
(149
|
)
|
(153
|
)
|
(147
|
)
|
(97
|
)
|
(90
|
)
|
(85
|
)
|
|||||||||||||
|
Amortization of:
|
|||||||||||||||||||||||||
|
Net loss
|
76
|
|
82
|
|
71
|
|
15
|
|
29
|
|
21
|
|
|||||||||||||
|
Prior service cost (credit)
|
3
|
|
5
|
|
4
|
|
(67
|
)
|
(40
|
)
|
(41
|
)
|
|||||||||||||
|
Net periodic cost (credit)
|
$
|
73
|
|
$
|
72
|
|
$
|
60
|
|
$
|
(98
|
)
|
$
|
(31
|
)
|
$
|
(41
|
)
|
|||||||
|
Consumers
|
|||||||||||||||||||||||||
|
Net periodic cost (credit)
|
|||||||||||||||||||||||||
|
Service cost
|
$
|
47
|
|
$
|
44
|
|
$
|
41
|
|
$
|
16
|
|
$
|
19
|
|
$
|
17
|
|
|||||||
|
Interest cost
|
88
|
|
90
|
|
87
|
|
33
|
|
49
|
|
45
|
|
|||||||||||||
|
Expected return on plan assets
|
(139
|
)
|
(149
|
)
|
(143
|
)
|
(91
|
)
|
(84
|
)
|
(80
|
)
|
|||||||||||||
|
Amortization of:
|
|||||||||||||||||||||||||
|
Net loss
|
73
|
|
79
|
|
68
|
|
16
|
|
29
|
|
22
|
|
|||||||||||||
|
Prior service cost (credit)
|
3
|
|
4
|
|
4
|
|
(65
|
)
|
(39
|
)
|
(40
|
)
|
|||||||||||||
|
Net periodic cost (credit)
|
$
|
72
|
|
$
|
68
|
|
$
|
57
|
|
$
|
(91
|
)
|
$
|
(26
|
)
|
$
|
(36
|
)
|
|||||||
150
Presented in the following table are the estimated net loss and prior service cost (credit) that will be amortized into net periodic benefit cost in 2019 from or to the associated regulatory asset and AOCI:
|
In Millions
|
||||||||
|
DB Pension Plans
|
OPEB Plan
|
|||||||
|
CMS Energy, including Consumers
|
||||||||
|
Regulatory asset
|
$
|
47
|
|
$
|
(35
|
)
|
||
|
AOCI
|
3
|
|
(1
|
)
|
||||
|
Consumers
|
||||||||
|
Regulatory asset
|
$
|
47
|
|
$
|
(35
|
)
|
||
CMS Energy and Consumers amortize net gains and losses in excess of
ten percent
of the greater of the PBO or the MRV over the average remaining service period for DB Pension Plan A and the OPEB Plan and over the average remaining life expectancy of participants for DB Pension Plan B. For DB Pension Plan A, the estimated period of amortization of gains and losses was
nine
years for the years ended
December 31, 2018
and
2017
. For DB Pension Plan B, the estimated period of amortization of gains and losses was
20
years for the years ended
December 31, 2018
and
2017
. For the year ended
December 31, 2016
, the estimated period of amortization of gains and losses for both DB Pension Plans was
ten
years. For the OPEB Plan, the estimated amortization period was
ten
years for the year ended
December 31, 2018
and
11
years for the years ended
December 31, 2017
and
2016
.
Prior service cost (credit) amortization is established in the year in which the prior service cost (credit) first occurred, and is based on the same amortization period for all future years until the prior service cost (credit) is fully amortized. CMS Energy and Consumers had new prior service costs (credits) for OPEB in
2018
and
2017
. The estimated period of amortization of these new prior service costs (credits) for CMS Energy and Consumers is
nine
years.
CMS Energy and Consumers determine the MRV for the assets of the DB Pension Plans as the fair value of plan assets on the measurement date, adjusted by the gains or losses that will not be admitted into the MRV until future years. CMS Energy and Consumers reflect each year’s gain or loss in the MRV in equal amounts over a
five
-year period beginning on the date the original amount was determined. CMS Energy and Consumers determine the MRV for OPEB Plan assets as the fair value of assets on the measurement date.
151
Reconciliations:
Presented in the following table are reconciliations of the funded status of CMS Energy’s and Consumers’ retirement benefits plans with their retirement benefits plans’ liabilities:
|
In Millions
|
|||||||||||||||||||||||||||
|
DB Pension Plans
|
DB SERP
|
OPEB Plan
|
|||||||||||||||||||||||||
|
Years Ended December 31
|
2018
|
2017
|
2018
|
2017
|
2018
|
2017
|
|||||||||||||||||||||
|
CMS Energy, including Consumers
|
|||||||||||||||||||||||||||
|
Benefit obligation at beginning of period
|
$
|
2,780
|
|
$
|
2,562
|
|
$
|
154
|
|
$
|
151
|
|
$
|
1,097
|
|
$
|
1,408
|
|
|||||||||
|
Service cost
|
48
|
|
45
|
|
—
|
|
—
|
|
17
|
|
19
|
|
|||||||||||||||
|
Interest cost
|
90
|
|
88
|
|
5
|
|
5
|
|
34
|
|
51
|
|
|||||||||||||||
|
Plan amendments
|
—
|
|
—
|
|
—
|
|
—
|
|
26
|
|
(309
|
)
|
|||||||||||||||
|
Actuarial (gain) loss
|
(258
|
)
|
1
|
241
|
|
1
|
(10
|
)
|
7
|
|
(74
|
)
|
1
|
(24
|
)
|
1
|
|||||||||||
|
Benefits paid
|
(148
|
)
|
(156
|
)
|
(9
|
)
|
(9
|
)
|
(55
|
)
|
(48
|
)
|
|||||||||||||||
|
Benefit obligation at end of period
|
$
|
2,512
|
|
$
|
2,780
|
|
$
|
140
|
|
$
|
154
|
|
$
|
1,045
|
|
$
|
1,097
|
|
|||||||||
|
Plan assets at fair value at beginning of period
|
$
|
2,305
|
|
$
|
2,101
|
|
$
|
—
|
|
$
|
—
|
|
$
|
1,420
|
|
$
|
1,264
|
|
|||||||||
|
Actual return on plan assets
|
(150
|
)
|
360
|
|
—
|
|
—
|
|
(86
|
)
|
203
|
|
|||||||||||||||
|
Company contribution
|
240
|
|
—
|
|
9
|
|
9
|
|
—
|
|
—
|
|
|||||||||||||||
|
Actual benefits paid
|
(148
|
)
|
(156
|
)
|
(9
|
)
|
(9
|
)
|
(54
|
)
|
(47
|
)
|
|||||||||||||||
|
Plan assets at fair value at end of period
|
$
|
2,247
|
|
$
|
2,305
|
|
$
|
—
|
|
$
|
—
|
|
$
|
1,280
|
|
$
|
1,420
|
|
|||||||||
|
Funded status
|
$
|
(265
|
)
|
2
|
$
|
(475
|
)
|
2
|
$
|
(140
|
)
|
$
|
(154
|
)
|
$
|
235
|
|
$
|
323
|
|
|||||||
|
Consumers
|
|||||||||||||||||||||||||||
|
Benefit obligation at beginning of period
|
$
|
112
|
|
$
|
109
|
|
$
|
1,053
|
|
$
|
1,365
|
|
|||||||||||||||
|
Service cost
|
—
|
|
—
|
|
16
|
|
19
|
|
|||||||||||||||||||
|
Interest cost
|
4
|
|
4
|
|
33
|
|
49
|
|
|||||||||||||||||||
|
Plan amendments
|
—
|
|
—
|
|
25
|
|
(303
|
)
|
|||||||||||||||||||
|
Actuarial (gain) loss
|
(8
|
)
|
5
|
|
(70
|
)
|
1
|
(31
|
)
|
1
|
|||||||||||||||||
|
Benefits paid
|
(7
|
)
|
(6
|
)
|
(53
|
)
|
(46
|
)
|
|||||||||||||||||||
|
Benefit obligation at end of period
|
$
|
101
|
|
$
|
112
|
|
$
|
1,004
|
|
$
|
1,053
|
|
|||||||||||||||
|
Plan assets at fair value at beginning of period
|
$
|
—
|
|
$
|
—
|
|
$
|
1,329
|
|
$
|
1,184
|
|
|||||||||||||||
|
Actual return on plan assets
|
—
|
|
—
|
|
(80
|
)
|
190
|
|
|||||||||||||||||||
|
Company contribution
|
7
|
|
6
|
|
—
|
|
—
|
|
|||||||||||||||||||
|
Actual benefits paid
|
(7
|
)
|
(6
|
)
|
(52
|
)
|
(45
|
)
|
|||||||||||||||||||
|
Plan assets at fair value at end of period
|
$
|
—
|
|
$
|
—
|
|
$
|
1,197
|
|
$
|
1,329
|
|
|||||||||||||||
|
Funded status
|
$
|
(101
|
)
|
$
|
(112
|
)
|
$
|
193
|
|
$
|
276
|
|
|||||||||||||||
|
1
|
The actuarial gain for
2018
for the DB Pension Plans was primarily the result of higher discount rates. The actuarial loss for
2017
was primarily the result of lower discount rates. The actuarial gain for
2018
for the OPEB Plan was primarily the result of higher discount rates. The actuarial gain for
2017
was primarily the result of better claim experience in calculating the plan’s funded status.
|
152
|
2
|
At
December 31, 2018
,
$246 million
of the total funded status of the DB Pension Plans was attributable to Consumers, based on an allocation of expenses. At
December 31, 2017
,
$455 million
of the total funded status of the DB Pension Plans was attributable to Consumers, based on an allocation of expenses.
|
Presented in the following table is the classification of CMS Energy’s and Consumers’ retirement benefit plans’ assets and liabilities:
|
In Millions
|
||||||||
|
December 31
|
2018
|
2017
|
||||||
|
CMS Energy, including Consumers
|
||||||||
|
Non-current assets
|
||||||||
|
DB Pension Plans
|
$
|
38
|
|
$
|
143
|
|
||
|
OPEB Plan
|
235
|
|
323
|
|
||||
|
Current liabilities
|
||||||||
|
DB SERP
|
10
|
|
9
|
|
||||
|
Non-current liabilities
|
|
|
|
|
||||
|
DB Pension Plans
|
303
|
|
618
|
|
||||
|
DB SERP
|
130
|
|
145
|
|
||||
|
Consumers
|
||||||||
|
Non-current assets
|
||||||||
|
DB Pension Plans
|
$
|
49
|
|
$
|
147
|
|
||
|
OPEB Plan
|
193
|
|
276
|
|
||||
|
Current liabilities
|
||||||||
|
DB SERP
|
7
|
|
7
|
|
||||
|
Non-current liabilities
|
|
|
|
|
||||
|
DB Pension Plans
|
295
|
|
602
|
|
||||
|
DB SERP
|
94
|
|
105
|
|
||||
The ABO for the DB Pension Plans was
$2.2 billion
at
December 31, 2018
and
$2.4 billion
at
December 31, 2017
. Presented in the following table is information related to the defined benefit pension plan for which the PBO and the ABO exceed plan assets:
|
In Millions
|
||||||||
|
December 31
|
2018
|
|
2017
|
|
||||
|
CMS Energy, including Consumers
|
||||||||
|
PBO
|
$
|
1,363
|
|
$
|
1,511
|
|
||
|
ABO
|
1,091
|
|
1,164
|
|
||||
|
Fair value of plan assets
|
1,059
|
|
893
|
|
||||
153
Items Not Yet Recognized as a Component of Net Periodic Benefit Cost:
Presented in the following table are the amounts recognized in regulatory assets, regulatory liabilities, and AOCI that have not been recognized as components of net periodic benefit cost. For additional details on regulatory assets and liabilities, see
Note 3, Regulatory Matters
.
|
In Millions
|
|||||||||||||||||
|
DB Pension Plans
and DB SERP
|
OPEB Plan
|
||||||||||||||||
|
Years Ended December 31
|
2018
|
2017
|
2018
|
2017
|
|||||||||||||
|
CMS Energy, including Consumers
|
|||||||||||||||||
|
Regulatory assets (liabilities)
|
|||||||||||||||||
|
Net loss
|
$
|
978
|
|
$
|
1,017
|
|
$
|
402
|
|
$
|
316
|
|
|||||
|
Prior service cost (credit)
|
9
|
|
11
|
|
(361
|
)
|
(451
|
)
|
|||||||||
|
Regulatory assets (liabilities)
|
$
|
987
|
|
$
|
1,028
|
|
$
|
41
|
|
$
|
(135
|
)
|
|||||
|
AOCI
|
|||||||||||||||||
|
Net loss (gain)
|
90
|
|
97
|
|
2
|
|
(6
|
)
|
|||||||||
|
Prior service cost (credit)
|
—
|
|
1
|
|
(9
|
)
|
(12
|
)
|
|||||||||
|
Total amounts recognized in regulatory assets (liabilities) and AOCI
|
$
|
1,077
|
|
$
|
1,126
|
|
$
|
34
|
|
$
|
(153
|
)
|
|||||
|
Consumers
|
|||||||||||||||||
|
Regulatory assets (liabilities)
|
|||||||||||||||||
|
Net loss
|
$
|
978
|
|
$
|
1,017
|
|
$
|
402
|
|
$
|
316
|
|
|||||
|
Prior service cost (credit)
|
9
|
|
11
|
|
(361
|
)
|
(451
|
)
|
|||||||||
|
Regulatory assets (liabilities)
|
$
|
987
|
|
$
|
1,028
|
|
$
|
41
|
|
$
|
(135
|
)
|
|||||
|
AOCI
|
|||||||||||||||||
|
Net loss
|
27
|
|
36
|
|
—
|
|
—
|
|
|||||||||
|
Total amounts recognized in regulatory assets (liabilities) and AOCI
|
$
|
1,014
|
|
$
|
1,064
|
|
$
|
41
|
|
$
|
(135
|
)
|
|||||
Plan Assets:
Presented in the following tables are the fair values of the assets of CMS Energy’s DB Pension Plans and OPEB Plan, by asset category and by level within the fair value hierarchy. For additional details regarding the fair value hierarchy, see
Note 6, Fair Value Measurements
.
|
In Millions
|
|||||||||||||||||||||||||
|
DB Pension Plans
|
|||||||||||||||||||||||||
|
December 31, 2018
|
December 31, 2017
|
||||||||||||||||||||||||
|
Total
|
Level 1
|
Level 2
|
Total
|
Level 1
|
Level 2
|
||||||||||||||||||||
|
CMS Energy, including Consumers
|
|||||||||||||||||||||||||
|
Cash and short-term investments
|
$
|
242
|
|
$
|
242
|
|
$
|
—
|
|
$
|
21
|
|
$
|
21
|
|
$
|
—
|
|
|||||||
|
U.S. government and agencies securities
|
11
|
|
—
|
|
11
|
|
4
|
|
—
|
|
4
|
|
|||||||||||||
|
Corporate debt
|
400
|
|
—
|
|
400
|
|
336
|
|
—
|
|
336
|
|
|||||||||||||
|
State and municipal bonds
|
6
|
|
—
|
|
6
|
|
9
|
|
—
|
|
9
|
|
|||||||||||||
|
Foreign corporate bonds
|
35
|
|
—
|
|
35
|
|
31
|
|
—
|
|
31
|
|
|||||||||||||
|
Mutual funds
|
552
|
|
552
|
|
—
|
|
662
|
|
662
|
|
—
|
|
|||||||||||||
|
$
|
1,246
|
|
$
|
794
|
|
$
|
452
|
|
$
|
1,063
|
|
$
|
683
|
|
$
|
380
|
|
||||||||
|
Pooled funds
|
1,001
|
|
1,242
|
|
|||||||||||||||||||||
|
Total
|
$
|
2,247
|
|
$
|
2,305
|
|
|||||||||||||||||||
154
|
In Millions
|
|||||||||||||||||||||||||
|
OPEB Plan
|
|||||||||||||||||||||||||
|
December 31, 2018
|
December 31, 2017
|
||||||||||||||||||||||||
|
Total
|
Level 1
|
Level 2
|
Total
|
Level 1
|
Level 2
|
||||||||||||||||||||
|
CMS Energy, including Consumers
|
|||||||||||||||||||||||||
|
Cash and short-term investments
|
$
|
36
|
|
$
|
36
|
|
$
|
—
|
|
$
|
16
|
|
$
|
16
|
|
$
|
—
|
|
|||||||
|
U.S. government and agencies securities
|
2
|
|
—
|
|
2
|
|
1
|
|
—
|
|
1
|
|
|||||||||||||
|
Corporate debt
|
55
|
|
—
|
|
55
|
|
50
|
|
—
|
|
50
|
|
|||||||||||||
|
State and municipal bonds
|
1
|
|
—
|
|
1
|
|
1
|
|
—
|
|
1
|
|
|||||||||||||
|
Foreign corporate bonds
|
5
|
|
—
|
|
5
|
|
4
|
|
—
|
|
4
|
|
|||||||||||||
|
Common stocks
|
41
|
|
41
|
|
—
|
|
40
|
|
40
|
|
—
|
|
|||||||||||||
|
Mutual funds
|
594
|
|
594
|
|
—
|
|
647
|
|
647
|
|
—
|
|
|||||||||||||
|
$
|
734
|
|
$
|
671
|
|
$
|
63
|
|
$
|
759
|
|
$
|
703
|
|
$
|
56
|
|
||||||||
|
Pooled funds
|
546
|
|
661
|
|
|||||||||||||||||||||
|
Total
|
$
|
1,280
|
|
$
|
1,420
|
|
|||||||||||||||||||
Cash and Short-Term Investments:
Cash and short-term investments consist of money market funds with daily liquidity.
U.S. Government and Agencies Securities:
U.S. government and agencies securities consist of U.S. Treasury notes and other debt securities backed by the U.S. government and related agencies. These securities are valued based on quoted market prices.
Corporate Debt:
Corporate debt investments consist of investment grade bonds of U.S. issuers from diverse industries. These securities are valued based on quoted market prices, when available, or yields available on comparable securities of issuers with similar credit ratings.
State and Municipal Bonds:
State and municipal bonds are valued using a matrix-pricing model that incorporates Level 2 market-based information. The fair value of the bonds is derived from various observable inputs, including benchmark yields, reported securities trades, broker/dealer quotes, bond ratings, and general information on market movements for investment grade state and municipal securities normally considered by market participants when pricing such debt securities.
Foreign Corporate Bonds:
Foreign corporate debt securities are valued based on quoted market prices, when available, or on yields available on comparable securities of issuers with similar credit ratings.
Common Stocks:
Common stocks in the OPEB Plan consist of equity securities that are actively managed and tracked to the S&P 500 Index. These securities are valued at their quoted closing prices.
Mutual Funds:
Mutual funds represent shares in registered investment companies that are priced based on the daily quoted net asset values that are publicly available and are the basis for transactions to buy or sell shares in the funds.
Pooled Funds:
Pooled funds include both common and collective trust funds as well as special funds that contain only employee benefit plan assets from two or more unrelated benefit plans. These funds primarily consist of U.S. and foreign equity securities, but also include U.S. and foreign fixed-income securities and multi-asset investments. Since these investments are valued at their net asset value as a practical expedient, they are not classified in the fair value hierarchy.
155
Asset Allocations:
Presented in the following table are the investment components of the assets of CMS Energy’s DB Pension Plans and OPEB Plan as of
December 31, 2018
:
|
DB Pension Plans
|
OPEB Plan
|
|||||
|
Equity securities
|
52
|
%
|
50
|
%
|
||
|
Fixed-income securities
|
42
|
|
31
|
|
||
|
Multi-asset investments
|
6
|
|
19
|
|
||
|
100
|
%
|
100
|
%
|
|||
CMS Energy’s target asset allocation for the assets of the DB Pension Plans is
53 percent
equity,
41 percent
fixed income, and
6 percent
multi-asset investments. This target asset allocation is expected to continue to maximize the long-term return on plan assets, while maintaining a prudent level of risk. The level of acceptable risk is a function of the liabilities of the plan. Equity investments are diversified mostly across the S&P 500 Index, with lesser allocations to the S&P MidCap and SmallCap Indexes and Foreign Equity Funds. Fixed-income investments are diversified across investment grade instruments of government and corporate issuers as well as high-yield and global bond funds. Multi-assets are diversified across absolute return investment approaches and global tactical asset allocation, such as inflation protected securities, real estate investment trusts, commodities, currency, and preferred stock. CMS Energy uses annual liability measurements, quarterly portfolio reviews, and periodic asset/liability studies to evaluate the need for adjustments to the portfolio allocation.
CMS Energy established union and non‑union VEBA trusts to fund future retiree health and life insurance benefits. These trusts are funded through the ratemaking process for Consumers and through direct contributions from the non‑utility subsidiaries. CMS Energy’s target asset allocation for the health trusts is
50 percent
equity,
30 percent
fixed income, and
20 percent
multi-asset investments. CMS Energy’s target asset allocation for the life trusts is
42 percent
equity,
28 percent
fixed income, and
30 percent
multi-asset investments. These target allocations are expected to continue to maximize the long-term return on plan assets, while maintaining a prudent level of risk. The level of acceptable risk is a function of the liabilities of the plans. Equity investments are diversified mostly across the S&P 500 Index, with lesser allocations to the S&P SmallCap Index and Foreign Equity Funds. Fixed-income investments are diversified across investment grade instruments of government and corporate issuers. Multi-assets are diversified across absolute return investment approaches and global tactical asset allocation, such as inflation protected securities, real estate investment trusts, commodities, currency and preferred stock. CMS Energy uses annual liability measurements, quarterly portfolio reviews, and periodic asset/liability studies to evaluate the need for adjustments to the portfolio allocation.
Contributions:
Presented in the following table are the contributions to CMS Energy’s and Consumers’ OPEB Plan and DB Pension Plans:
|
In Millions
|
||||||||
|
Years Ended December 31
|
2018
|
2017
|
||||||
|
CMS Energy, including Consumers
|
||||||||
|
OPEB Plan
|
$
|
—
|
|
$
|
—
|
|
||
|
DB Pension Plans
|
240
|
|
—
|
|
||||
|
Consumers
|
||||||||
|
OPEB Plan
|
$
|
—
|
|
$
|
—
|
|
||
|
DB Pension Plans
|
234
|
|
—
|
|
||||
Contributions comprise required amounts and discretionary contributions. Neither CMS Energy nor Consumers plans to contribute to the OPEB Plan or DB Pension Plans in 2019. Actual future
156
contributions will depend on future investment performance, discount rates, and various factors related to the participants of the DB Pension Plans and OPEB Plan. CMS Energy and Consumers will, at a minimum, contribute to the plans as needed to comply with federal funding requirements.
Benefit Payments:
Presented in the following table are the expected benefit payments for each of the next five years and the five-year period thereafter:
|
In Millions
|
||||||||||||
|
DB Pension Plans
|
DB SERP
|
OPEB Plan
|
||||||||||
|
CMS Energy, including Consumers
|
||||||||||||
|
2019
|
$
|
159
|
|
$
|
10
|
|
$
|
59
|
|
|||
|
2020
|
162
|
|
10
|
|
61
|
|
||||||
|
2021
|
164
|
|
10
|
|
64
|
|
||||||
|
2022
|
165
|
|
10
|
|
65
|
|
||||||
|
2023
|
165
|
|
10
|
|
66
|
|
||||||
|
2024-2028
|
823
|
|
46
|
|
328
|
|
||||||
|
Consumers
|
||||||||||||
|
2019
|
$
|
149
|
|
$
|
7
|
|
$
|
57
|
|
|||
|
2020
|
152
|
|
7
|
|
59
|
|
||||||
|
2021
|
154
|
|
7
|
|
61
|
|
||||||
|
2022
|
155
|
|
7
|
|
62
|
|
||||||
|
2023
|
155
|
|
7
|
|
63
|
|
||||||
|
2024-2028
|
777
|
|
31
|
|
315
|
|
||||||
Collective Bargaining Agreements:
At
December 31, 2018
, unions represented
35 percent
of CMS Energy’s employees and
37 percent
of Consumers’ employees. The UWUA represents Consumers’ operating, maintenance, construction, and call center employees. The USW represents Zeeland employees. Union contracts expire in 2020.
13
:
Stock-Based Compensation
CMS Energy and Consumers provide a PISP to officers, employees, and non‑employee directors based on their contributions to the successful management of the company. The PISP has a
ten
-year term, expiring in May 2024.
In
2018
, all awards were in the form of restricted stock or restricted stock units. The PISP also allows for unrestricted common stock, stock options, stock appreciation rights, phantom shares, performance units, and incentive options,
none
of which was granted in
2018
,
2017
, or
2016
.
Shares awarded or subject to stock options, phantom shares, or performance units may not exceed
6.5 million
shares from June 2014 through May 2024, nor may such awards to any recipient exceed
500,000
shares in any calendar year. CMS Energy and Consumers may issue awards of up to
3,714,544
shares of common stock under the PISP as of
December 31, 2018
. Shares for which payment or exercise is in cash, as well as shares that expire, terminate, or are canceled or forfeited, may be awarded or granted again under the PISP.
All awards under the PISP vest fully upon death. Upon a change of control of CMS Energy or termination under an officer separation agreement, the awards will vest in accordance with specific officer agreements. If stated in the award, for restricted stock recipients who terminate employment due to
157
retirement or disability, a pro-rata portion of the award will vest upon termination, with any market-based award also contingent upon the outcome of the market condition and any performance-based award contingent upon the outcome of the performance condition. The pro-rata portion is equal to the portion of the service period served between the award grant date and the employee’s termination date. The remaining portion of the awards will be forfeited. All awards for directors vest fully upon retirement. Restricted shares may be forfeited if employment terminates for any other reason or if the minimum service requirements are not met, as described in the award document.
Restricted Stock Awards:
Restricted stock awards for employees under the PISP are in the form of performance-based, market-based, and time-lapse restricted stock. Award recipients receive shares of CMS Energy common stock that have dividend and voting rights. The dividends on time-lapse restricted stock are paid in cash or in CMS Energy common stock. The dividends on performance-based and market-based restricted stock are paid in restricted shares equal to the value of the dividends. These additional restricted shares are subject to the same vesting conditions as the underlying restricted stock shares.
Performance-based restricted stock vesting is contingent on meeting at least a
36
-month service requirement and a performance condition. The performance condition is based on an adjusted measure of CMS Energy’s EPS growth relative to a peer group over a
three
-year period. The awards granted in
2018
,
2017
, and
2016
require a
38
-month service period. Market-based restricted stock vesting is generally contingent on meeting a
three
-year service requirement and a market condition. The market condition is based on a comparison of CMS Energy’s total shareholder return with the median total shareholder return of a peer group over the same
three
-year period. Depending on the outcome of the performance condition or the market condition, a recipient may earn a total award ranging from
zero
to
200 percent
of the initial grant. Time-lapse restricted stock generally vests after a service period of
three
years.
Restricted Stock Units:
In
2018
,
2017
, and
2016
, CMS Energy and Consumers granted restricted stock units to certain non‑employee directors who elected to defer their restricted stock awards. The restricted stock units generally vest after a service period of
one
year or, if earlier, at the next annual meeting. The restricted stock units will be distributed to the recipients as shares in accordance with the directors’ deferral agreements. Restricted stock units do not have voting rights, but do have dividend rights. In lieu of cash dividend payments, the dividends on restricted stock units are paid in additional units equal to the value of the dividends. These additional restricted stock units are subject to the same vesting and distribution conditions as the underlying restricted stock units.
No
restricted stock units were forfeited during
2018
.
158
Presented in the following tables is the activity for restricted stock and restricted stock units under the PISP:
|
CMS Energy, including Consumers
|
Consumers
|
|||||||||||||
|
Year Ended December 31, 2018
|
Number of
Shares
|
|
Weighted-Average
Grant Date Fair Value
per Share
|
Number of
Shares
|
|
Weighted-Average
Grant Date Fair Value
per Share
|
||||||||
|
Nonvested at beginning of period
|
1,193,266
|
|
$
|
38.48
|
|
1,145,122
|
|
$
|
38.50
|
|
||||
|
Granted
|
||||||||||||||
|
Restricted stock
|
642,390
|
|
26.49
|
|
607,749
|
|
26.51
|
|
||||||
|
Restricted stock units
|
12,450
|
|
41.77
|
|
11,934
|
|
42.01
|
|
||||||
|
Vested
|
||||||||||||||
|
Restricted stock
|
(597,636
|
)
|
23.08
|
|
(567,154
|
)
|
23.15
|
|
||||||
|
Restricted stock units
|
(12,686
|
)
|
40.99
|
|
(12,260
|
)
|
40.98
|
|
||||||
|
Forfeited – restricted stock
|
(26,555
|
)
|
39.73
|
|
(26,555
|
)
|
39.73
|
|
||||||
|
Nonvested at end of period
|
1,211,229
|
|
$
|
39.70
|
|
1,158,836
|
|
$
|
39.71
|
|
||||
|
Year Ended December 31, 2018
|
CMS Energy, including
Consumers
|
|
Consumers
|
|
|
Granted
|
||||
|
Time-lapse awards
|
122,615
|
|
117,029
|
|
|
Market-based awards
|
134,179
|
|
126,558
|
|
|
Performance-based awards
|
134,179
|
|
126,558
|
|
|
Restricted stock units
|
11,196
|
|
10,792
|
|
|
Dividend equivalents on market-based awards
|
21,154
|
|
20,077
|
|
|
Dividend equivalents on performance-based awards
|
25,925
|
|
24,583
|
|
|
Dividend equivalents on restricted stock units
|
1,254
|
|
1,142
|
|
|
Additional market-based shares based on achievement of condition
|
88,987
|
|
84,025
|
|
|
Additional performance-based shares based on achievement of condition
|
115,351
|
|
108,919
|
|
|
Total granted
|
654,840
|
|
619,683
|
|
CMS Energy and Consumers charge the fair value of the restricted stock awards to expense over the required service period and charge the fair value of the restricted stock units to expense immediately. For performance-based awards, CMS Energy and Consumers estimate the number of shares expected to vest at the end of the performance period based on the probable achievement of the performance objective. Performance-based and market-based restricted stock awards have graded vesting features for retirement-eligible employees, and CMS Energy and Consumers recognize expense for those awards on a graded vesting schedule over the required service period. Expense for performance-based and market-based restricted stock awards for non‑retirement-eligible employees and time-lapse awards is recognized on a straight-line basis over the required service period.
The fair value of performance-based and time-lapse restricted stock and restricted stock units is based on the price of CMS Energy’s common stock on the grant date. The fair value of market-based restricted stock awards is calculated on the grant date using a Monte Carlo simulation. CMS Energy and Consumers base expected volatilities on the historical volatility of the price of CMS Energy common stock. The risk-free rate for valuation of the market-based restricted stock awards was based on the
three
-year U.S. Treasury yield at the award grant date.
159
Presented in the following table are the most important assumptions used to estimate the fair value of the market-based restricted stock awards:
|
Years Ended December 31
|
2018
|
|
2017
|
|
2016
|
|
|
Expected volatility
|
16.7
|
%
|
18.0
|
%
|
16.7
|
%
|
|
Expected dividend yield
|
2.8
|
|
3.0
|
|
3.2
|
|
|
Risk-free rate
|
2.1
|
|
1.5
|
|
1.0
|
|
Presented in the following table is the weighted-average grant-date fair value of all awards under the PISP:
|
Years Ended December 31
|
2018
|
2017
|
2016
|
|||||||||
|
CMS Energy, including Consumers
|
||||||||||||
|
Weighted-average grant-date fair value per share
|
||||||||||||
|
Restricted stock granted
|
$
|
26.49
|
|
$
|
28.61
|
|
$
|
31.74
|
|
|||
|
Restricted stock units granted
|
41.77
|
|
41.98
|
|
39.12
|
|
||||||
|
Consumers
|
||||||||||||
|
Weighted-average grant-date fair value per share
|
||||||||||||
|
Restricted stock granted
|
$
|
26.51
|
|
$
|
28.67
|
|
$
|
31.77
|
|
|||
|
Restricted stock units granted
|
42.01
|
|
41.97
|
|
39.12
|
|
||||||
Presented in the following table are amounts related to restricted stock awards and restricted stock units:
|
In Millions
|
||||||||||||
|
Years Ended December 31
|
2018
|
|
2017
|
|
2016
|
|
||||||
|
CMS Energy, including Consumers
|
||||||||||||
|
Fair value of shares that vested during the year
|
$
|
27
|
|
$
|
37
|
|
$
|
31
|
|
|||
|
Compensation expense recognized
|
17
|
|
17
|
|
16
|
|
||||||
|
Income tax benefit recognized
|
1
|
|
7
|
|
7
|
|
||||||
|
Consumers
|
||||||||||||
|
Fair value of shares that vested during the year
|
$
|
26
|
|
$
|
35
|
|
$
|
30
|
|
|||
|
Compensation expense recognized
|
16
|
|
16
|
|
16
|
|
||||||
|
Income tax benefit recognized
|
1
|
|
7
|
|
6
|
|
||||||
At
December 31, 2018
,
$19.4 million
of total unrecognized compensation cost was related to restricted stock for CMS Energy, including Consumers, and
$18.6 million
of total unrecognized compensation cost was related to restricted stock for Consumers. CMS Energy and Consumers expect to recognize this cost over a weighted-average period of
two
years.
160
14
:
Income Taxes
CMS Energy and its subsidiaries file a consolidated U.S. federal income tax return as well as a Michigan Corporate Income Tax return for the unitary business group and various other state unitary group combined income tax returns. Income taxes are allocated based on each company’s separate taxable income in accordance with the CMS Energy tax sharing agreement.
In December 2017, President Trump signed the TCJA, which changed existing federal tax law and included numerous provisions that affect businesses. Provisions significantly impacting CMS Energy and Consumers include:
|
•
|
Reduction of the corporate income tax rate from
35 percent
to
21 percent
|
|
•
|
Repeal of the alternative minimum tax along with a provision requiring companies to recover alternative minimum tax credit carryforwards over the
four
-year period ending in 2021
|
|
•
|
Limitation on the use of net operating loss carryforwards arising after
December 31, 2017
to
80 percent
of a company’s taxable income with an indefinite carryforward
|
|
•
|
A provision allowing companies to expense
100 percent
of the cost of certain property when placed in service
|
|
•
|
Limitation on the deduction for net interest expense to
30 percent
of adjusted taxable income
|
|
•
|
A requirement to use a normalization method of accounting for excess tax reserves associated with public utility property
|
As a rate-regulated utility, in taxable years beginning after 2017, Consumers is excluded from certain provisions of the TCJA, including those allowing companies to expense 100 percent of the cost of certain property and those limiting the amount of interest expense companies may deduct.
In November 2018, the IRS issued proposed regulations that allow all interest expense of a consolidated group to be deductible as long as a public utility comprises at least 90 percent of the total consolidated business. Under these proposed regulations, CMS Energy expects to meet the
de minimis
safe harbor rule in 2018 and therefore, the full amount of CMS Energy’s 2018 consolidated interest expense would be deductible.
Substantially all of the tax law changes enacted by the TCJA were effective for taxable years beginning after
December 31, 2017
. Under GAAP (ASC 740), companies must recognize the effects of a tax law change in the period of enactment. The staff of the SEC issued guidance in Staff Accounting Bulletin No. 118 that clarified accounting for income taxes under ASC 740 if information is not yet available or complete and provided for up to a one-year period in which to complete the required analyses and accounting. CMS Energy and Consumers made reasonable estimates in measuring and accounting for the effects of the TCJA in the
December 31, 2017
financial statements. The measurement period provided by Staff Accounting Bulletin No. 118 is now complete. CMS Energy recorded a
$5 million
increase to income tax expense, including a
$1 million
increase at Consumers, representing a true-up of their estimates during the year ended
December 31, 2018
.
161
Presented in the following table is the difference between actual income tax expense on continuing operations and income tax expense computed by applying the statutory U.S. federal income tax rate:
|
In Millions, Except Tax Rate
|
||||||||||||
|
Years Ended December 31
|
2018
|
2017
|
2016
|
|||||||||
|
CMS Energy, including Consumers
|
||||||||||||
|
Income from continuing operations before income taxes
|
$
|
774
|
|
$
|
886
|
|
$
|
826
|
|
|||
|
Income tax expense at statutory rate
|
163
|
|
310
|
|
289
|
|
||||||
|
Increase (decrease) in income taxes from:
|
||||||||||||
|
State and local income taxes, net of federal effect
1
|
46
|
|
26
|
|
37
|
|
||||||
|
Accelerated flow-through of regulatory tax benefits
2
|
(39
|
)
|
(39
|
)
|
(39
|
)
|
||||||
|
TCJA excess deferred taxes
3
|
(26
|
)
|
—
|
|
—
|
|
||||||
|
Production tax credits
|
(14
|
)
|
(8
|
)
|
(9
|
)
|
||||||
|
Research and development tax credits, net
4
|
(11
|
)
|
(1
|
)
|
(2
|
)
|
||||||
|
Impact of the TCJA
5
|
(4
|
)
|
148
|
|
—
|
|
||||||
|
Other, net
|
—
|
|
(12
|
)
|
(3
|
)
|
||||||
|
Income tax expense
|
$
|
115
|
|
$
|
424
|
|
$
|
273
|
|
|||
|
Effective tax rate
|
14.9
|
%
|
47.9
|
%
|
33.1
|
%
|
||||||
|
Consumers
|
||||||||||||
|
Income from continuing operations before income taxes
|
$
|
847
|
|
$
|
971
|
|
$
|
936
|
|
|||
|
Income tax expense at statutory rate
|
178
|
|
340
|
|
328
|
|
||||||
|
Increase (decrease) in income taxes from:
|
||||||||||||
|
State and local income taxes, net of federal effect
1
|
51
|
|
30
|
|
44
|
|
||||||
|
Accelerated flow-through of regulatory tax benefits
2
|
(39
|
)
|
(39
|
)
|
(39
|
)
|
||||||
|
TCJA excess deferred taxes
3
|
(26
|
)
|
—
|
|
—
|
|
||||||
|
Production tax credits
|
(12
|
)
|
(8
|
)
|
(9
|
)
|
||||||
|
Research and development tax credits, net
4
|
(11
|
)
|
(1
|
)
|
(2
|
)
|
||||||
|
Impact of the TCJA
5
|
1
|
|
33
|
|
—
|
|
||||||
|
Other, net
|
—
|
|
(16
|
)
|
(2
|
)
|
||||||
|
Income tax expense
|
$
|
142
|
|
$
|
339
|
|
$
|
320
|
|
|||
|
Effective tax rate
|
16.8
|
%
|
34.9
|
%
|
34.2
|
%
|
||||||
|
1
|
In September 2017, CMS Energy completed the evaluation of its methodology for the state apportionment of Consumers’ electricity sales to MISO, taking into account recent state tax law developments in the electric utility sector. To recognize the anticipated refund and the impact of the expected lower effective tax rate on their deferred state tax liabilities, CMS Energy, including Consumers, recorded a
$14 million
income tax benefit in
2017
. These tax benefits were net of reserves for uncertain tax positions and primarily attributable to Consumers. In April 2018, CMS Energy amended its 2013 Michigan Corporate Income Tax return and submitted a refund claim for taxes previously paid. In November 2018, the refund claim was denied by the State of Michigan. CMS Energy has submitted a petition for informal conference.
|
|
2
|
In 2013, the MPSC issued an order authorizing Consumers to accelerate the flow-through to electric and gas customers of certain income tax benefits associated primarily with the cost of removal of plant placed in service before 1993. Consumers implemented this regulatory treatment beginning in 2014. This change, which also accelerates Consumers’ recognition of the income tax benefits, reduced Consumers’ income tax expense by
$39 million
for each of the years ended
December 31, 2018
,
2017
, and
2016
.
|
|
3
|
In December 2017, Consumers remeasured its deferred tax assets and liabilities at the new federal tax rate enacted by the TCJA and recorded a
$1.8 billion
regulatory liability. This regulatory liability relates to the excess deferred taxes arising from accelerated tax depreciation on assets in rate base that are governed by normalization provisions of the Internal Revenue Code. The normalization provisions require that the
|
162
excess deferred taxes be refunded to customers over the remaining average service life of the associated assets. In January 2018, Consumers began to reduce this regulatory liability by crediting income tax expense. Consumers has fully reserved for the eventual refund of these excess deferred taxes that it has credited to income tax expense in a separate regulatory liability established by reducing revenue, and will continue to do so until these benefits are passed on to customers in accordance with an MPSC order, expected to be issued in 2019. At
December 31, 2018
, this reserve for refund of these excess deferred taxes totaled
$35 million
.
|
4
|
In March 2018, Consumers finalized a study of research and development tax credits for the tax years 2012 through 2016. As a result, Consumers recognized an
$8 million
increase in the credit, net of reserves for uncertain tax positions.
|
|
5
|
In December 2017, CMS Energy and Consumers recorded a reasonable estimate to measure and account for the impact of the TCJA. The 2018 amount includes the true-up of their estimate and elimination of
$9 million
valuation allowance on the sequestration of alternative minimum tax credits.
|
Presented in the following table are the significant components of income tax expense on continuing operations:
|
In Millions
|
||||||||||||
|
Years Ended December 31
|
2018
|
2017
|
2016
|
|||||||||
|
CMS Energy, including Consumers
|
||||||||||||
|
Current income taxes
|
||||||||||||
|
Federal
|
$
|
(67
|
)
|
$
|
—
|
|
$
|
—
|
|
|||
|
State and local
|
—
|
|
6
|
|
9
|
|
||||||
|
$
|
(67
|
)
|
$
|
6
|
|
$
|
9
|
|
||||
|
Deferred income taxes
|
||||||||||||
|
Federal
|
$
|
112
|
|
$
|
368
|
|
$
|
200
|
|
|||
|
State and local
|
58
|
|
36
|
|
47
|
|
||||||
|
$
|
170
|
|
$
|
404
|
|
$
|
247
|
|
||||
|
Deferred income tax credit
|
12
|
|
14
|
|
17
|
|
||||||
|
Tax expense
|
$
|
115
|
|
$
|
424
|
|
$
|
273
|
|
|||
|
Consumers
|
||||||||||||
|
Current income taxes
|
||||||||||||
|
Federal
|
$
|
6
|
|
$
|
159
|
|
$
|
9
|
|
|||
|
State and local
|
13
|
|
17
|
|
22
|
|
||||||
|
$
|
19
|
|
$
|
176
|
|
$
|
31
|
|
||||
|
Deferred income taxes
|
||||||||||||
|
Federal
|
$
|
60
|
|
$
|
120
|
|
$
|
227
|
|
|||
|
State and local
|
51
|
|
29
|
|
45
|
|
||||||
|
$
|
111
|
|
$
|
149
|
|
$
|
272
|
|
||||
|
Deferred income tax credit
|
12
|
|
14
|
|
17
|
|
||||||
|
Tax expense
|
$
|
142
|
|
$
|
339
|
|
$
|
320
|
|
|||
For the year ended
December 31, 2017
, the impact of the TCJA was a
$148 million
increase in deferred income tax expense at CMS Energy, including Consumers, and a
$33 million
increase in deferred income tax expense at Consumers. The TCJA had no impact on current income tax expense in 2017.
163
Presented in the following table are the principal components of deferred income tax assets (liabilities) recognized:
|
In Millions
|
||||||||
|
December 31
|
2018
|
2017
|
||||||
|
CMS Energy, including Consumers
|
||||||||
|
Deferred income tax assets
|
||||||||
|
Tax loss and credit carryforwards
|
$
|
385
|
|
$
|
453
|
|
||
|
Net regulatory tax liability
|
395
|
|
411
|
|
||||
|
Reserves and accruals
|
39
|
|
40
|
|
||||
|
Total deferred income tax assets
|
$
|
819
|
|
$
|
904
|
|
||
|
Valuation allowance
|
(8
|
)
|
(15
|
)
|
||||
|
Total deferred income tax assets, net of valuation allowance
|
$
|
811
|
|
$
|
889
|
|
||
|
Deferred income tax liabilities
|
||||||||
|
Plant, property, and equipment
|
$
|
(1,955
|
)
|
$
|
(1,891
|
)
|
||
|
Employee benefits
|
(165
|
)
|
(96
|
)
|
||||
|
Securitized costs
|
(65
|
)
|
(71
|
)
|
||||
|
Gas inventory
|
(35
|
)
|
(37
|
)
|
||||
|
Other
|
(78
|
)
|
(63
|
)
|
||||
|
Total deferred income tax liabilities
|
$
|
(2,298
|
)
|
$
|
(2,158
|
)
|
||
|
Total net deferred income tax liabilities
|
$
|
(1,487
|
)
|
$
|
(1,269
|
)
|
||
|
Consumers
|
||||||||
|
Deferred income tax assets
|
||||||||
|
Net regulatory tax liability
|
$
|
395
|
|
$
|
411
|
|
||
|
Tax loss and credit carryforwards
|
64
|
|
101
|
|
||||
|
Reserves and accruals
|
21
|
|
21
|
|
||||
|
Total deferred income tax assets
|
$
|
480
|
|
$
|
533
|
|
||
|
Deferred income tax liabilities
|
||||||||
|
Plant, property, and equipment
|
$
|
(1,943
|
)
|
$
|
(1,901
|
)
|
||
|
Employee benefits
|
(172
|
)
|
(105
|
)
|
||||
|
Securitized costs
|
(65
|
)
|
(71
|
)
|
||||
|
Gas inventory
|
(35
|
)
|
(37
|
)
|
||||
|
Other
|
(74
|
)
|
(59
|
)
|
||||
|
Total deferred income tax liabilities
|
$
|
(2,289
|
)
|
$
|
(2,173
|
)
|
||
|
Total net deferred income tax liabilities
|
$
|
(1,809
|
)
|
$
|
(1,640
|
)
|
||
Deferred tax assets and liabilities are recognized for the estimated future tax effect of temporary differences between the tax basis of assets or liabilities and the reported amounts on CMS Energy’s and Consumers’ consolidated financial statements. At
December 31, 2017
, CMS Energy and Consumers remeasured their deferred tax assets and liabilities and related valuation allowances using the
21 percent
federal tax rate enacted in the TCJA. To reflect the lower income tax rate, Consumers reduced its net deferred tax liabilities associated with its utility book-tax temporary differences by
$1.6 billion
for the year ended
December 31, 2017
. Of this amount, Consumers recognized deferred tax expense of
$33 million
related to nonrecoverable net deferred tax assets, with the remaining amount being recorded as a net regulatory tax liability. For further details on Consumers’ net regulatory tax liability, see
Note 3, Regulatory Matters
.
164
In addition to the amounts recorded at Consumers at
December 31, 2017
, CMS Energy reduced its net deferred tax assets associated with its non‑utility book-tax temporary differences by
$239 million
. In total, CMS Energy, including Consumers, reduced its net deferred tax liabilities by
$1.3 billion
for the year ended
December 31, 2017
.
Presented in the following table are the tax loss and credit carryforwards at
December 31, 2018
:
|
In Millions
|
|||||||||
|
Gross Amount
|
Tax Attribute
|
Expiration
|
|||||||
|
CMS Energy, including Consumers
|
|||||||||
|
Federal net operating loss carryforward
|
$
|
603
|
|
$
|
126
|
|
2034 – 2036
|
||
|
Local net operating loss carryforwards
|
406
|
|
4
|
|
2023 – 2036
|
||||
|
General business credits
|
184
|
|
184
|
|
2018 – 2038
|
||||
|
Alternative minimum tax credits
|
68
|
|
68
|
|
Not applicable
|
||||
|
Federal capital loss carryover
|
12
|
|
2
|
|
2023
|
||||
|
State capital loss carryover
|
10
|
|
1
|
|
2023
|
||||
|
Total tax attributes
|
$
|
385
|
|
||||||
|
Consumers
|
|||||||||
|
Federal net operating loss carryforward
|
$
|
222
|
|
$
|
47
|
|
2034 – 2036
|
||
|
General business credits
|
17
|
|
17
|
|
2032 – 2038
|
||||
|
Total tax attributes
|
$
|
64
|
|
||||||
CMS Energy has provided a valuation allowance of
$2 million
for the local tax loss carryforward,
$3 million
for federal and state capital loss carryforward, and
$3 million
for general business credits. The TCJA repealed the corporate alternative minimum tax and requires companies to recover (through offsets of regular tax and through cash refunds) all alternative minimum tax credits over the
four
-year period ending in 2021. In December 2018, the Office of Management and Budget announced such recovery will not be subject to sequestration for taxable years beginning after
December 31, 2017
. As a result, CMS Energy eliminated a valuation allowance of
$9 million
for sequestration of cash refunds of alternative minimum tax credits at
December 31, 2018
. Additionally, CMS Energy reclassified
$68 million
of alternative minimum tax credits to a current receivable.
CMS Energy and Consumers expect to utilize fully their tax loss and credit carryforwards for which no valuation allowance has been provided. It is reasonably possible that further adjustments will be made to the valuation allowances within one year.
165
Presented in the following table is a reconciliation of the beginning and ending amount of uncertain tax benefits:
|
In Millions
|
||||||||||||
|
Years Ended December 31
|
2018
|
2017
|
2016
|
|||||||||
|
CMS Energy, including Consumers
|
|
|
|
|
|
|
||||||
|
Balance at beginning of period
|
$
|
14
|
|
$
|
5
|
|
$
|
6
|
|
|||
|
Additions for current-year tax positions
|
1
|
|
10
|
|
—
|
|
||||||
|
Additions for prior-year tax positions
|
4
|
|
—
|
|
—
|
|
||||||
|
Reductions for prior-year tax positions
|
—
|
|
(1
|
)
|
—
|
|
||||||
|
Settlements
|
—
|
|
—
|
|
(1
|
)
|
||||||
|
Balance at end of period
|
$
|
19
|
|
$
|
14
|
|
$
|
5
|
|
|||
|
Consumers
|
|
|
|
|
|
|
||||||
|
Balance at beginning of period
|
$
|
21
|
|
$
|
5
|
|
$
|
6
|
|
|||
|
Additions for current-year tax positions
|
2
|
|
17
|
|
—
|
|
||||||
|
Additions for prior-year tax positions
|
5
|
|
—
|
|
—
|
|
||||||
|
Reductions for prior-year tax positions
|
—
|
|
(1
|
)
|
—
|
|
||||||
|
Settlements
|
—
|
|
—
|
|
(1
|
)
|
||||||
|
Balance at end of period
|
$
|
28
|
|
$
|
21
|
|
$
|
5
|
|
|||
If recognized, all of these uncertain tax benefits would affect CMS Energy’s and Consumers’ annual effective tax rates in future years.
CMS Energy and Consumers recognize accrued interest and penalties, where applicable, as part of income tax expense. CMS Energy, including Consumers, recognized
no
interest or penalties for the years ended
December 31, 2018
,
2017
, or
2016
.
In 2018, the Michigan Department of Treasury completed its audit of the Michigan business tax returns of CMS Energy and its subsidiaries for 2008 through 2011. The audit resulted in a
$1 million
refund of tax.
The amount of income taxes paid is subject to ongoing audits by federal, state, local, and foreign tax authorities, which can result in proposed assessments. CMS Energy’s federal income tax returns for 2015 and subsequent years remain subject to examination by the IRS. CMS Energy’s Michigan Corporate Income Tax returns for 2013 and subsequent years remain subject to examination by the State of Michigan. CMS Energy’s and Consumers’ estimate of the potential outcome for any uncertain tax issue is highly judgmental. CMS Energy and Consumers believe that their accrued tax liabilities at
December 31, 2018
were adequate for all years.
166
15
:
Earnings Per Share—CMS Energy
Presented in the following table are CMS Energy’s basic and diluted EPS computations based on net income:
|
In Millions, Except Per Share Amounts
|
||||||||||||
|
Years Ended December 31
|
2018
|
2017
|
2016
|
|||||||||
|
Income available to common stockholders
|
||||||||||||
|
Net income
|
$
|
659
|
|
$
|
462
|
|
$
|
553
|
|
|||
|
Less income attributable to noncontrolling interests
|
2
|
|
2
|
|
2
|
|
||||||
|
Net income available to common stockholders – basic and diluted
|
$
|
657
|
|
$
|
460
|
|
$
|
551
|
|
|||
|
Average common shares outstanding
|
||||||||||||
|
Weighted-average shares – basic
|
282.2
|
|
280.0
|
|
277.9
|
|
||||||
|
Add dilutive nonvested stock awards
|
0.7
|
|
0.8
|
|
1.0
|
|
||||||
|
Weighted-average shares – diluted
|
282.9
|
|
280.8
|
|
278.9
|
|
||||||
|
Net income per average common share available to common stockholders
|
||||||||||||
|
Basic
|
$
|
2.33
|
|
$
|
1.64
|
|
$
|
1.99
|
|
|||
|
Diluted
|
2.32
|
|
1.64
|
|
1.98
|
|
||||||
Nonvested Stock Awards
CMS Energy’s nonvested stock awards are composed of participating and non‑participating securities. The participating securities accrue cash dividends when common stockholders receive dividends. Since the recipient is not required to return the dividends to CMS Energy if the recipient forfeits the award, the nonvested stock awards are considered participating securities. As such, the participating nonvested stock awards were included in the computation of basic EPS. The non‑participating securities accrue stock dividends that vest concurrently with the stock award. If the recipient forfeits the award, the stock dividends accrued on the non‑participating securities are also forfeited. Accordingly, the non‑participating awards and stock dividends were included in the computation of diluted EPS, but not in the computation of basic EPS.
Forward Equity Sale Contracts
In November 2018, CMS Energy entered into forward equity sale contracts. These forward equity sale contracts are non‑participating securities. While the forward sale price in the forward equity sale contract is decreased on certain dates by certain predetermined amounts to reflect expected dividend payments, these price adjustments were set upon inception of the agreement and the forward contract does not give the owner the right to participate in undistributed earnings. Accordingly, the forward equity sale contracts were included in the computation of diluted EPS, but not in the computation of basic EPS. For the year ended
December 31, 2018
, the forward equity sale contracts had an immaterial impact on diluted EPS. For further details on the forward equity sale contracts, see
Note 5, Financings and Capitalization
.
167
16
:
Revenue
Presented in the following tables are the components of operating revenue:
|
In Millions
|
||||||||||||||||||||
|
Year Ended December 31, 2018
|
Electric Utility
|
Gas Utility
|
Enterprises
1
|
Other Reconciling
2
|
Consolidated
|
|||||||||||||||
|
CMS Energy, including Consumers
|
||||||||||||||||||||
|
Consumers utility revenue
|
$
|
4,528
|
|
$
|
1,882
|
|
$
|
—
|
|
$
|
—
|
|
$
|
6,410
|
|
|||||
|
Other
|
—
|
|
—
|
|
92
|
|
—
|
|
92
|
|
||||||||||
|
Revenue recognized from contracts with customers
|
4,528
|
|
1,882
|
|
92
|
|
—
|
|
6,502
|
|
||||||||||
|
Leasing income
|
—
|
|
—
|
|
160
|
|
—
|
|
160
|
|
||||||||||
|
Financing income
|
10
|
|
5
|
|
—
|
|
157
|
|
172
|
|
||||||||||
|
Consumers alternative revenue programs
|
23
|
|
16
|
|
—
|
|
—
|
|
39
|
|
||||||||||
|
Total operating revenue – CMS Energy
|
$
|
4,561
|
|
$
|
1,903
|
|
$
|
252
|
|
$
|
157
|
|
$
|
6,873
|
|
|||||
|
Consumers
|
||||||||||||||||||||
|
Consumers utility revenue
|
|
|
|
|
|
|
|
|
|
|
||||||||||
|
Residential
|
$
|
2,049
|
|
$
|
1,284
|
|
$
|
—
|
|
$
|
—
|
|
$
|
3,333
|
|
|||||
|
Commercial
|
1,545
|
|
367
|
|
—
|
|
—
|
|
1,912
|
|
||||||||||
|
Industrial
|
674
|
|
55
|
|
—
|
|
—
|
|
729
|
|
||||||||||
|
Other
|
260
|
|
176
|
|
—
|
|
—
|
|
436
|
|
||||||||||
|
Revenue recognized from contracts with customers
|
4,528
|
|
1,882
|
|
—
|
|
—
|
|
6,410
|
|
||||||||||
|
Leasing income
|
—
|
|
—
|
|
—
|
|
—
|
|
—
|
|
||||||||||
|
Financing income
|
10
|
|
5
|
|
—
|
|
—
|
|
15
|
|
||||||||||
|
Alternative revenue programs
|
23
|
|
16
|
|
—
|
|
—
|
|
39
|
|
||||||||||
|
Total operating revenue – Consumers
|
$
|
4,561
|
|
$
|
1,903
|
|
$
|
—
|
|
$
|
—
|
|
$
|
6,464
|
|
|||||
|
1
|
Amounts represent the enterprises segment’s operating revenue from independent power production and CMS ERM’s sales of energy commodities in support of the independent power production portfolio.
|
|
2
|
Amount represents EnerBank’s operating revenue from providing
primarily unsecured consumer installment loans for financing home improvements
.
|
Electric and Gas Utilities
Consumers Utility Revenue:
Consumers recognizes revenue primarily from the sale of electric and gas utility services at tariff-based rates regulated by the MPSC. Consumers’ customer base consists of a mix of residential, commercial, and diversified industrial customers. Consumers’ tariff-based sales performance obligations are described below.
|
•
|
Consumers has performance obligations for the service of standing ready to deliver electricity or natural gas to customers, and it satisfies these performance obligations over time. Consumers recognizes revenue at a fixed rate as it provides these services. These arrangements generally do not have fixed terms and remain in effect as long as the customer consumes the utility service. The rates are set by the MPSC through the rate-making process and represent the stand-alone selling price of Consumers’ service to stand ready to deliver.
|
|
•
|
Consumers has performance obligations for the service of delivering the commodity of electricity or natural gas to customers, and it satisfies these performance obligations upon delivery.
|
168
Consumers recognizes revenue at a price per unit of electricity or natural gas delivered, based on the tariffs established by the MPSC. These arrangements generally do not have fixed terms and remain in effect as long as the customer consumes the utility service. The rates are set by the MPSC through the rate-making process and represent the stand-alone selling price of a bundled product comprising the commodity, electricity or natural gas, and the service of delivering such commodity.
In some instances, Consumers has specific fixed-term contracts with large commercial and industrial customers to provide electricity or gas at certain tariff rates or to provide gas transportation services at contracted rates. The amount of electricity and gas to be delivered under these contracts and the associated future revenue to be received are generally dependent on the customers’ needs. Accordingly, Consumers recognizes revenues at the tariff or contracted rate as electricity or gas is delivered to the customer. Consumers also has other miscellaneous contracts with customers related to pole and other property rentals, appliance service plans, and utility contract work. Generally, these contracts are short term or evergreen in nature.
EnerBank:
EnerBank provides
four
types of unsecured consumer installment loans: same-as-cash, zero interest, reduced interest, and traditional. Under EnerBank’s same-as-cash programs, authorized contractors pay EnerBank a fee to provide a borrower with the option to pay off the loan interest-free during the same-as-cash period.
EnerBank recognizes the fee on a straight-line basis over the same-as-cash period, which typically ranges from three to 24 months.
If a borrower does not exercise its option to pay off its loan interest-free during the same-as-cash period, EnerBank charges the borrower accrued interest at the loan’s contractual rate on the outstanding balance from the origination date. Under the zero interest and reduced interest programs, authorized contractors pay EnerBank a fee to provide a borrower with no interest or reduced rates of interest for the entire term of the loan.
EnerBank recognizes the fee using the interest method over the term of the loan, which ranges from one to 12 years.
EnerBank recognizes interest income using the interest method and amortizes loan origination fees, net of certain direct origination costs, over the loan term. EnerBank ceases recognizing interest income when a loan loss is confirmed or when a loan becomes
120
days past due, at which time the loan principal is charged against the allowance for loan losses. At that time, EnerBank recognizes any interest accrued but not received for such loan losses as a reversal of interest income.
Alternative-Revenue Programs:
The energy waste reduction incentive mechanism provides a financial incentive if the energy savings of Consumers’ customers exceed annual targets established by the MPSC. The maximum incentive that Consumers may earn under this mechanism is
20 percent
of the amount it spends on energy waste reduction programs. Consumers accounts for this program as an alternative-revenue program that meets the criteria for recognizing revenue related to the incentive as soon as energy savings exceed the annual targets established by the MPSC.
Under a gas revenue decoupling mechanism authorized by the MPSC, Consumers is allowed to adjust future gas rates for differences between Consumers’ actual weather-normalized non‑fuel revenues and the revenues approved by the MPSC. Consumers accounts for this program as an alternative-revenue program that meets the criteria for recognizing the effects of decoupling adjustments on revenue as gas is delivered.
Consumers does not reclassify revenue from its alternative-revenue programs to revenue from contracts with customers at the time the amounts are collected from customers.
Accounts Receivable and Unbilled Revenues:
Accounts receivable comprise trade receivables and unbilled receivables. CMS Energy and Consumers record their accounts receivable at cost, which approximates fair value. CMS Energy and Consumers establish an allowance for uncollectible accounts
169
based on historical losses, management’s assessment of existing economic conditions, customer payment trends, and other factors. CMS Energy and Consumers assess late payment fees on trade receivables based on contractual past-due terms established with customers. CMS Energy and Consumers charge off accounts deemed uncollectible to operating expense. Uncollectible expense for CMS Energy, including Consumers, was
$29 million
for the year ended
December 31, 2018
. Uncollectible expense for Consumers was
$29 million
for the year ended
December 31, 2018
.
Consumers’ customers are billed monthly in cycles having billing dates that do not generally coincide with the end of a calendar month. This results in customers having received electricity or natural gas that they have not been billed for as of the month-end. Consumers estimates its unbilled revenues by applying an average billed rate to total unbilled deliveries for each customer class.
Unbilled revenues, which are recorded as accounts receivable on CMS Energy’s and Consumers’ consolidated balance sheets, were
$409 million
at
December 31, 2018
and
$481 million
at
December 31, 2017
.
17
:
Other Income and Other Expense
Presented in the following table are the components of other income and other expense at CMS Energy and Consumers:
|
In Millions
|
||||||||||||
|
Years Ended December 31
|
2018
|
2017
|
2016
|
|||||||||
|
CMS Energy, including Consumers
|
||||||||||||
|
Other income
|
||||||||||||
|
Fee income
|
$
|
—
|
|
$
|
—
|
|
$
|
6
|
|
|||
|
All other
|
2
|
|
6
|
|
2
|
|
||||||
|
Total other income – CMS Energy
|
$
|
2
|
|
$
|
6
|
|
$
|
8
|
|
|||
|
Consumers
|
||||||||||||
|
Other income
|
||||||||||||
|
Gain on CMS Energy common stock
|
$
|
—
|
|
$
|
14
|
|
$
|
—
|
|
|||
|
Fee income
|
—
|
|
—
|
|
6
|
|
||||||
|
All other
|
2
|
|
3
|
|
2
|
|
||||||
|
Total other income – Consumers
|
$
|
2
|
|
$
|
17
|
|
$
|
8
|
|
|||
|
CMS Energy, including Consumers
|
||||||||||||
|
Other expense
|
||||||||||||
|
Donations
|
$
|
(13
|
)
|
$
|
(31
|
)
|
$
|
(23
|
)
|
|||
|
Civic and political expenditures
|
(6
|
)
|
(27
|
)
|
(21
|
)
|
||||||
|
Loss on reacquired and extinguished debt
|
(16
|
)
|
(18
|
)
|
(18
|
)
|
||||||
|
Unrealized investment loss
|
—
|
|
—
|
|
(5
|
)
|
||||||
|
All other
|
(13
|
)
|
—
|
|
(8
|
)
|
||||||
|
Total other expense – CMS Energy
|
$
|
(48
|
)
|
$
|
(76
|
)
|
$
|
(75
|
)
|
|||
|
Consumers
|
||||||||||||
|
Other expense
|
||||||||||||
|
Donations
|
$
|
(13
|
)
|
$
|
(31
|
)
|
$
|
(23
|
)
|
|||
|
Civic and political expenditures
|
(6
|
)
|
(27
|
)
|
(21
|
)
|
||||||
|
Unrealized investment loss
|
—
|
|
—
|
|
(4
|
)
|
||||||
|
All other
|
(11
|
)
|
—
|
|
(7
|
)
|
||||||
|
Total other expense – Consumers
|
$
|
(30
|
)
|
$
|
(58
|
)
|
$
|
(55
|
)
|
|||
170
18
:
Cash and Cash Equivalents
Presented in the following table are the components of total cash and cash equivalents, including restricted amounts, and their location on CMS Energy’s and Consumers’ consolidated balance sheets:
|
In Millions
|
||||||||
|
December 31
|
2018
|
2017
|
||||||
|
CMS Energy, including Consumers
|
||||||||
|
Cash and cash equivalents
|
$
|
153
|
|
$
|
182
|
|
||
|
Restricted cash and cash equivalents
|
21
|
|
17
|
|
||||
|
Other non‑current assets
|
1
|
|
5
|
|
||||
|
Cash and cash equivalents, including restricted amounts
|
$
|
175
|
|
$
|
204
|
|
||
|
Consumers
|
||||||||
|
Cash and cash equivalents
|
$
|
39
|
|
$
|
44
|
|
||
|
Restricted cash and cash equivalents
|
17
|
|
17
|
|
||||
|
Other non‑current assets
|
—
|
|
4
|
|
||||
|
Cash and cash equivalents, including restricted amounts
|
$
|
56
|
|
$
|
65
|
|
||
Cash and Cash Equivalents:
Cash and cash equivalents include short-term, highly liquid investments with original maturities of three months or less.
Restricted Cash and Cash Equivalents:
Restricted cash and cash equivalents are held primarily for the repayment of securitization bonds and funds held in escrow. Cash and cash equivalents may also be restricted to pay other contractual obligations such as leasing of coal railcars. These amounts are classified as current assets since they relate to payments that could or will occur within one year.
Other Non-current Assets:
The cash equivalents classified as other non‑current assets represent an investment in a money market fund held in the DB SERP rabbi trust. See
Note 6, Fair Value Measurements
and
Note 12, Retirement Benefits
for more information regarding the DB SERP.
19
:
Reportable Segments
Reportable segments consist of business units defined by the products and services they offer. CMS Energy and Consumers evaluate the performance of each segment based on its contribution to net income available to CMS Energy’s common stockholders.
Accounting policies for CMS Energy’s and Consumers’ segments are as described in
Note 1, Significant Accounting Policies
. The consolidated financial statements reflect the assets, liabilities, revenues, and expenses of the individual segments when appropriate. Accounts are allocated among the segments when common accounts are attributable to more than one segment. The allocations are based on certain measures of business activities, such as revenue, labor dollars, customers, other operating and maintenance expense, construction expense, leased property, taxes, or functional surveys. For example, customer receivables are allocated based on revenue, and pension provisions are allocated based on labor dollars.
Inter-segment sales and transfers are accounted for at current market prices and are eliminated in consolidated net income available to common stockholders by segment.
171
CMS Energy
The reportable segments for CMS Energy are:
|
•
|
electric utility, consisting of regulated activities associated with
the generation, purchase, transmission, distribution, and sale of electricity
in Michigan
|
|
•
|
gas utility, consisting of regulated activities associated with
the purchase, transmission, storage, distribution, and sale of natural gas
in Michigan
|
|
•
|
enterprises, consisting of various subsidiaries engaging
in domestic independent power production, including the development and operation of renewable generation, and the marketing of independent power production
.
|
CMS Energy presents EnerBank, corporate interest and other expenses, and Consumers’ other consolidated entities within other reconciling items.
Consumers
The reportable segments for Consumers are:
|
•
|
electric utility, consisting of regulated activities associated with
the generation, purchase, transmission, distribution, and sale of electricity
in Michigan
|
|
•
|
gas utility, consisting of regulated activities associated with
the purchase, transmission, storage, distribution, and sale of natural gas
in Michigan
|
Consumers’ other consolidated entities are presented within other reconciling items.
Presented in the following tables is financial information by reportable segment:
|
In Millions
|
||||||||||||
|
Years Ended December 31
|
2018
|
2017
|
2016
|
|||||||||
|
CMS Energy, including Consumers
|
||||||||||||
|
Operating revenue
|
||||||||||||
|
Electric utility
|
$
|
4,561
|
|
$
|
4,448
|
|
$
|
4,379
|
|
|||
|
Gas utility
|
1,903
|
|
1,774
|
|
1,685
|
|
||||||
|
Enterprises
|
252
|
|
229
|
|
215
|
|
||||||
|
Other reconciling items
|
157
|
|
132
|
|
120
|
|
||||||
|
Total operating revenue – CMS Energy
|
$
|
6,873
|
|
$
|
6,583
|
|
$
|
6,399
|
|
|||
|
Consumers
|
||||||||||||
|
Operating revenue
|
||||||||||||
|
Electric utility
|
$
|
4,561
|
|
$
|
4,448
|
|
$
|
4,379
|
|
|||
|
Gas utility
|
1,903
|
|
1,774
|
|
1,685
|
|
||||||
|
Total operating revenue – Consumers
|
$
|
6,464
|
|
$
|
6,222
|
|
$
|
6,064
|
|
|||
|
CMS Energy, including Consumers
|
||||||||||||
|
Depreciation and amortization
|
||||||||||||
|
Electric utility
|
$
|
682
|
|
$
|
654
|
|
$
|
603
|
|
|||
|
Gas utility
|
239
|
|
218
|
|
200
|
|
||||||
|
Enterprises
|
8
|
|
6
|
|
5
|
|
||||||
|
Other reconciling items
|
4
|
|
3
|
|
3
|
|
||||||
|
Total depreciation and amortization – CMS Energy
|
$
|
933
|
|
$
|
881
|
|
$
|
811
|
|
|||
172
|
In Millions
|
||||||||||||
|
Years Ended December 31
|
2018
|
2017
|
2016
|
|||||||||
|
Consumers
|
||||||||||||
|
Depreciation and amortization
|
||||||||||||
|
Electric utility
|
$
|
682
|
|
$
|
654
|
|
$
|
603
|
|
|||
|
Gas utility
|
239
|
|
218
|
|
200
|
|
||||||
|
Total depreciation and amortization – Consumers
|
$
|
921
|
|
$
|
872
|
|
$
|
803
|
|
|||
|
CMS Energy, including Consumers
|
||||||||||||
|
Income from equity method investees
1
|
||||||||||||
|
Enterprises
|
$
|
9
|
|
$
|
15
|
|
$
|
13
|
|
|||
|
Total income from equity method investees – CMS Energy
|
$
|
9
|
|
$
|
15
|
|
$
|
13
|
|
|||
|
CMS Energy, including Consumers
|
||||||||||||
|
Interest charges
|
||||||||||||
|
Electric utility
|
$
|
209
|
|
$
|
201
|
|
$
|
196
|
|
|||
|
Gas utility
|
79
|
|
74
|
|
72
|
|
||||||
|
Enterprises
|
2
|
|
—
|
|
1
|
|
||||||
|
Other reconciling items
|
168
|
|
163
|
|
166
|
|
||||||
|
Total interest charges – CMS Energy
|
$
|
458
|
|
$
|
438
|
|
$
|
435
|
|
|||
|
Consumers
|
||||||||||||
|
Interest charges
|
||||||||||||
|
Electric utility
|
$
|
209
|
|
$
|
201
|
|
$
|
196
|
|
|||
|
Gas utility
|
79
|
|
74
|
|
72
|
|
||||||
|
Other reconciling items
|
1
|
|
1
|
|
—
|
|
||||||
|
Total interest charges – Consumers
|
$
|
289
|
|
$
|
276
|
|
$
|
268
|
|
|||
|
CMS Energy, including Consumers
|
||||||||||||
|
Income tax expense (benefit)
|
||||||||||||
|
Electric utility
|
$
|
109
|
|
$
|
245
|
|
$
|
246
|
|
|||
|
Gas utility
|
33
|
|
96
|
|
74
|
|
||||||
|
Enterprises
|
2
|
|
72
|
|
10
|
|
||||||
|
Other reconciling items
|
(29
|
)
|
11
|
|
(57
|
)
|
||||||
|
Total income tax expense – CMS Energy
|
$
|
115
|
|
$
|
424
|
|
$
|
273
|
|
|||
|
Consumers
|
||||||||||||
|
Income tax expense (benefit)
|
||||||||||||
|
Electric utility
|
$
|
109
|
|
$
|
245
|
|
$
|
246
|
|
|||
|
Gas utility
|
33
|
|
96
|
|
74
|
|
||||||
|
Other reconciling items
|
—
|
|
(2
|
)
|
—
|
|
||||||
|
Total income tax expense – Consumers
|
$
|
142
|
|
$
|
339
|
|
$
|
320
|
|
|||
|
CMS Energy, including Consumers
|
||||||||||||
|
Net income (loss) available to common stockholders
|
||||||||||||
|
Electric utility
|
$
|
535
|
|
$
|
455
|
|
$
|
458
|
|
|||
|
Gas utility
|
169
|
|
173
|
|
155
|
|
||||||
|
Enterprises
|
34
|
|
(27
|
)
|
17
|
|
||||||
|
Other reconciling items
|
(81
|
)
|
(141
|
)
|
(79
|
)
|
||||||
|
Total net income available to common stockholders – CMS Energy
|
$
|
657
|
|
$
|
460
|
|
$
|
551
|
|
|||
173
|
In Millions
|
||||||||||||
|
Years Ended December 31
|
2018
|
2017
|
2016
|
|||||||||
|
Consumers
|
||||||||||||
|
Net income available to common stockholder
|
||||||||||||
|
Electric utility
|
$
|
535
|
|
$
|
455
|
|
$
|
458
|
|
|||
|
Gas utility
|
169
|
|
173
|
|
155
|
|
||||||
|
Other reconciling items
|
(1
|
)
|
2
|
|
1
|
|
||||||
|
Total net income available to common stockholder – Consumers
|
$
|
703
|
|
$
|
630
|
|
$
|
614
|
|
|||
|
CMS Energy, including Consumers
|
||||||||||||
|
Plant, property, and equipment, gross
|
||||||||||||
|
Electric utility
2
|
$
|
16,027
|
|
$
|
15,221
|
|
$
|
14,540
|
|
|||
|
Gas utility
2
|
7,919
|
|
7,080
|
|
6,283
|
|
||||||
|
Enterprises
|
412
|
|
167
|
|
157
|
|
||||||
|
Other reconciling items
|
42
|
|
38
|
|
30
|
|
||||||
|
Total plant, property, and equipment, gross – CMS Energy
|
$
|
24,400
|
|
$
|
22,506
|
|
$
|
21,010
|
|
|||
|
Consumers
|
||||||||||||
|
Plant, property, and equipment, gross
|
||||||||||||
|
Electric utility
2
|
$
|
16,027
|
|
$
|
15,221
|
|
$
|
14,540
|
|
|||
|
Gas utility
2
|
7,919
|
|
7,080
|
|
6,283
|
|
||||||
|
Other reconciling items
|
17
|
|
17
|
|
15
|
|
||||||
|
Total plant, property, and equipment, gross – Consumers
|
$
|
23,963
|
|
$
|
22,318
|
|
$
|
20,838
|
|
|||
|
CMS Energy, including Consumers
|
||||||||||||
|
Investments in equity method investees
1
|
||||||||||||
|
Enterprises
|
$
|
69
|
|
$
|
64
|
|
$
|
62
|
|
|||
|
Other reconciling items
|
—
|
|
—
|
|
3
|
|
||||||
|
Total investments in equity method investees – CMS Energy
|
$
|
69
|
|
$
|
64
|
|
$
|
65
|
|
|||
|
CMS Energy, including Consumers
|
||||||||||||
|
Total assets
|
||||||||||||
|
Electric utility
2
|
$
|
14,079
|
|
$
|
13,906
|
|
$
|
13,429
|
|
|||
|
Gas utility
2
|
7,806
|
|
7,139
|
|
6,446
|
|
||||||
|
Enterprises
|
540
|
|
342
|
|
269
|
|
||||||
|
Other reconciling items
|
2,104
|
|
1,663
|
|
1,478
|
|
||||||
|
Total assets – CMS Energy
|
$
|
24,529
|
|
$
|
23,050
|
|
$
|
21,622
|
|
|||
|
Consumers
|
||||||||||||
|
Total assets
|
||||||||||||
|
Electric utility
2
|
$
|
14,143
|
|
$
|
13,907
|
|
$
|
13,430
|
|
|||
|
Gas utility
2
|
7,853
|
|
7,139
|
|
6,446
|
|
||||||
|
Other reconciling items
|
29
|
|
53
|
|
70
|
|
||||||
|
Total assets – Consumers
|
$
|
22,025
|
|
$
|
21,099
|
|
$
|
19,946
|
|
|||
|
CMS Energy, including Consumers
|
||||||||||||
|
Capital expenditures
3
|
||||||||||||
|
Electric utility
|
$
|
865
|
|
$
|
882
|
|
$
|
1,007
|
|
|||
|
Gas utility
|
958
|
|
800
|
|
611
|
|
||||||
|
Enterprises
|
246
|
|
33
|
|
10
|
|
||||||
|
Other reconciling items
|
12
|
|
7
|
|
5
|
|
||||||
|
Total capital expenditures – CMS Energy
|
$
|
2,081
|
|
$
|
1,722
|
|
$
|
1,633
|
|
|||
174
|
In Millions
|
||||||||||||
|
Years Ended December 31
|
2018
|
2017
|
2016
|
|||||||||
|
Consumers
|
||||||||||||
|
Capital expenditures
3
|
||||||||||||
|
Electric utility
|
$
|
865
|
|
$
|
882
|
|
$
|
1,007
|
|
|||
|
Gas utility
|
958
|
|
800
|
|
611
|
|
||||||
|
Other reconciling items
|
2
|
|
1
|
|
—
|
|
||||||
|
Total capital expenditures – Consumers
|
$
|
1,825
|
|
$
|
1,683
|
|
$
|
1,618
|
|
|||
|
1
|
Consumers had no significant equity method investments.
|
|
2
|
Amounts include a portion of Consumers’ other common assets attributable to both the electric and gas utility businesses.
|
|
3
|
Amounts include purchase of capital lease additions. Amounts also include a portion of Consumers’ capital expenditures for plant and equipment attributable to both the electric and gas utility businesses.
|
20
:
Related-Party Transactions—Consumers
Consumers enters into a number of transactions with related parties. These transactions include:
|
•
|
purchases of electricity from affiliates of CMS Enterprises
|
|
•
|
payments to and from CMS Energy related to parent company overhead costs
|
|
•
|
investment in CMS Energy common stock
|
Transactions involving power supply purchases from certain affiliates of CMS Enterprises are based on avoided costs under PURPA, state law, and competitive bidding. The payment of parent company overhead costs is based on the use of accepted industry allocation methodologies. These payments are for costs that occur in the normal course of business.
Presented in the following table is Consumers’ expense recorded from related-party transactions for the years ended December 31:
|
In Millions
|
|||||||||||||
|
Description
|
Related Party
|
2018
|
2017
|
2016
|
|||||||||
|
Purchases of capacity and energy
|
Affiliates of CMS Enterprises
|
$
|
83
|
|
$
|
90
|
|
$
|
88
|
|
|||
Amounts payable to related parties for purchased power and other services were
$20 million
at
December 31, 2018
and
$27 million
at
December 31, 2017
. Accounts receivable from related parties were
$13 million
at
December 31, 2018
and
$2 million
at
December 31, 2017
.
In July 2018, CMS Energy and Consumers sold the DB SERP debt securities
and CMS Energy issued a
$146 million
demand note payable to the DB SERP rabbi trust.
The portion of the demand note attributable to Consumers was recorded as a note receivable – related party on Consumers’ consolidated balance sheets at
December 31, 2018
. For additional details about the note receivable – related party, see
Note 7, Financial Instruments
and
Note 8, Notes Receivable
.
Consumers owned shares of CMS Energy common stock with a fair value of
$1 million
at
December 31, 2018
and
$21 million
at
December 31, 2017
. For additional details on Consumers’ investment in CMS Energy common stock, see
Note 7, Financial Instruments
.
175
In January 2019, Consumers renewed a short-term credit agreement with CMS Energy, permitting Consumers to borrow up to
$300 million
. At
December 31, 2018
, there were
no
outstanding loans under the agreement.
21
:
Variable Interest Entities
CMS Energy has variable interests in T.E.S. Filer City, Grayling, Genesee, and Craven. CMS Energy is not the primary beneficiary of any of these partnerships because decision making is shared among unrelated parties, and no one party has the ability to direct activities, such as operations and maintenance, plant dispatch, and fuel strategy, that most significantly impact the entities’ economic performance. The partners must agree on all major decisions for each of the partnerships.
Presented in the following table is information about these partnerships:
|
Name (Ownership Interest)
|
Nature of the Entity
|
Financing of Partnership
|
|
T.E.S. Filer City (50%)
|
Coal-fueled power generator
|
Line of credit secured by T.E.S. Filer City’s coal inventory.
|
|
Grayling (50%)
|
Wood waste-fueled power generator
|
The partnership has no debt.
|
|
Genesee (50%)
|
Wood waste-fueled power generator
|
Sale of revenue bonds that mature in 2021 and bear interest at fixed rates. The debt is non-recourse to the partners and secured by a CMS Energy guarantee capped at $3 million annually.
|
|
Craven (50%)
|
Wood waste-fueled power generator
|
Line of credit secured by Craven’s property, plant, and equipment.
|
CMS Energy has operating and management contracts with Grayling, Genesee, and Craven. Additionally, Consumers is the primary purchaser of power from T.E.S. Filer City, Grayling, and Genesee through long-term PPAs. Consumers also has reduced dispatch agreements with Grayling and Genesee, which allow these facilities to be dispatched based on the market price of power compared with the cost of production of the plants. This results in fuel cost savings that each partnership shares with Consumers’ customers.
CMS Energy’s investment in these partnerships is included in investments on its consolidated balance sheets in the amount of
$69 million
as of
December 31, 2018
and
$64 million
as of
December 31, 2017
. The creditors of these partnerships do not have recourse to the general credit of CMS Energy or Consumers, except through a guarantee provided by CMS Energy of
$3 million
annually on behalf of Genesee. Additionally, CMS Energy has deferred collections on certain receivables owed by Genesee. CMS Energy’s maximum exposure to loss from these receivables is
$9 million
. Consumers has not provided any financial or other support during the periods presented that was not previously contractually required.
176
|
22
:
|
Quarterly Financial and Common Stock Information (Unaudited)
|
|
In Millions, Except Per Share Amounts
|
||||||||||||||||
|
2018
|
||||||||||||||||
|
Quarters Ended
|
March 31
|
June 30
|
Sept 30
|
Dec 31
|
||||||||||||
|
CMS Energy, including Consumers
|
||||||||||||||||
|
Operating revenue
|
$
|
1,953
|
|
$
|
1,492
|
|
$
|
1,599
|
|
$
|
1,829
|
|
||||
|
Operating income
|
363
|
|
255
|
|
294
|
|
250
|
|
||||||||
|
Net income
|
241
|
|
140
|
|
169
|
|
109
|
|
||||||||
|
Income attributable to noncontrolling interests
|
—
|
|
1
|
|
—
|
|
1
|
|
||||||||
|
Net income available to common stockholders
|
241
|
|
139
|
|
169
|
|
108
|
|
||||||||
|
Basic earnings per average common share
1
|
0.86
|
|
0.49
|
|
0.60
|
|
0.38
|
|
||||||||
|
Diluted earnings per average common share
1
|
0.86
|
|
0.49
|
|
0.59
|
|
0.38
|
|
||||||||
|
Consumers
|
||||||||||||||||
|
Operating revenue
|
$
|
1,855
|
|
$
|
1,395
|
|
$
|
1,502
|
|
$
|
1,712
|
|
||||
|
Operating income
|
334
|
|
229
|
|
271
|
|
231
|
|
||||||||
|
Net income
|
242
|
|
152
|
|
180
|
|
131
|
|
||||||||
|
Preferred stock dividends
|
—
|
|
1
|
|
—
|
|
1
|
|
||||||||
|
Net income available to common stockholder
|
242
|
|
151
|
|
180
|
|
130
|
|
||||||||
|
In Millions, Except Per Share Amounts
|
||||||||||||||||
|
2017
|
||||||||||||||||
|
Quarters Ended
|
March 31
|
June 30
|
Sept 30
|
Dec 31
|
||||||||||||
|
CMS Energy, including Consumers
|
||||||||||||||||
|
Operating revenue
|
$
|
1,829
|
|
$
|
1,449
|
|
$
|
1,527
|
|
$
|
1,778
|
|
||||
|
Operating income
|
388
|
|
241
|
|
330
|
|
379
|
|
||||||||
|
Net income (loss)
|
199
|
|
93
|
|
172
|
|
(2
|
)
|
||||||||
|
Income attributable to noncontrolling interests
|
—
|
|
1
|
|
—
|
|
1
|
|
||||||||
|
Net income (loss) available to common stockholders
|
199
|
|
92
|
|
172
|
|
(3
|
)
|
||||||||
|
Basic earnings (loss) per average common share
1
|
0.71
|
|
0.33
|
|
0.61
|
|
(0.01
|
)
|
||||||||
|
Diluted earnings (loss) per average common share
1
|
0.71
|
|
0.33
|
|
0.61
|
|
(0.01
|
)
|
||||||||
|
Consumers
|
||||||||||||||||
|
Operating revenue
|
$
|
1,737
|
|
$
|
1,362
|
|
$
|
1,437
|
|
$
|
1,686
|
|
||||
|
Operating income
|
359
|
|
222
|
|
308
|
|
363
|
|
||||||||
|
Net income
|
211
|
|
104
|
|
181
|
|
136
|
|
||||||||
|
Preferred stock dividends
|
—
|
|
1
|
|
—
|
|
1
|
|
||||||||
|
Net income available to common stockholder
|
211
|
|
103
|
|
181
|
|
135
|
|
||||||||
|
1
|
The sum of the quarters may not equal annual EPS due to changes in the number of shares outstanding.
|
177
23
:
Subsequent Event
On January 30, 2019, Consumers experienced a fire at the Ray Compressor Station, which resulted in the Ray Storage Field being off-line or operating at significantly reduced capacity, which negatively affected Consumers’ natural gas supply and delivery capacity. This incident, which occurred during the extreme polar vortex weather condition, required Consumers to request voluntary reductions in customer load, to implement contingency gas supply purchases, and to implement a curtailment of natural gas deliveries for industrial and large commercial customers pursuant to Consumers’ MPSC curtailment tariff. Consumers is investigating the incident. The curtailment and request for voluntary reductions of customer loads were canceled as of midnight, February 1. At this time, Consumers cannot predict the ultimate financial impact of the incident or other gas-related incidents, but they could have a material adverse effect on Consumers’ results of operations, financial condition, or liquidity, and could subject Consumers’ gas utility to increased regulatory scrutiny.
178
(This page intentionally left blank)
179
Report of Independent Registered Public Accounting Firm
To the Board of Directors and Stockholders of CMS Energy Corporation
Opinions on the Financial Statements and Internal Control over Financial Reporting
We have audited the accompanying consolidated balance sheets of CMS Energy Corporation and its subsidiaries (the “Company”) as of
December 31, 2018
and
2017
, and the related consolidated statements of income, comprehensive income, changes in equity and cash flows for each of the three years in the period ended
December 31, 2018
, including the related notes and financial statement schedules listed in the index appearing under Item 15 (collectively referred to as the “consolidated financial statements”). We also have audited the Company’s internal control over financial reporting as of
December 31, 2018
, based on criteria established in
Internal Control — Integrated Framework
(2013) issued by the Committee of Sponsoring Organizations of the Treadway Commission (COSO).
In our opinion, the consolidated financial statements referred to above present fairly, in all material respects, the financial position of the Company as of
December 31, 2018
and
2017
, and the results of its operations and its cash flows for each of the three years in the period ended
December 31, 2018
in conformity with accounting principles generally accepted in the United States of America. Also in our opinion, the Company maintained, in all material respects, effective internal control over financial reporting as of
December 31, 2018
, based on criteria established in
Internal Control — Integrated Framework
(2013) issued by the COSO.
Basis for Opinions
The Company’s management is responsible for these consolidated financial statements, for maintaining effective internal control over financial reporting, and for its assessment of the effectiveness of internal control over financial reporting, included in Management’s Annual Report on Internal Control over Financial Reporting appearing under Item 9A. Our responsibility is to express opinions on the Company’s consolidated financial statements and on the Company’s internal control over financial reporting based on our audits. We are a public accounting firm registered with the Public Company Accounting Oversight Board (United States) (PCAOB) and are required to be independent with respect to the Company in accordance with the U.S. federal securities laws and the applicable rules and regulations of the Securities and Exchange Commission and the PCAOB.
We conducted our audits in accordance with the standards of the PCAOB. Those standards require that we plan and perform the audits to obtain reasonable assurance about whether the consolidated financial statements are free of material misstatement, whether due to error or fraud, and whether effective internal control over financial reporting was maintained in all material respects.
Our audits of the consolidated financial statements included performing procedures to assess the risks of material misstatement of the consolidated financial statements, whether due to error or fraud, and performing procedures that respond to those risks. Such procedures included examining, on a test basis, evidence regarding the amounts and disclosures in the consolidated financial statements. Our audits also included evaluating the accounting principles used and significant estimates made by management, as well as evaluating the overall presentation of the consolidated financial statements. Our audit of internal control over financial reporting included obtaining an understanding of internal control over financial reporting, assessing the risk that a material weakness exists, and testing and evaluating the design and operating effectiveness of internal control based on the assessed risk. Our audits also included performing such other procedures as we considered necessary in the circumstances. We believe that our audits provide a reasonable basis for our opinions.
180
Definition and Limitations of Internal Control over Financial Reporting
A company’s internal control over financial reporting is a process designed to provide reasonable assurance regarding the reliability of financial reporting and the preparation of financial statements for external purposes in accordance with generally accepted accounting principles. A company’s internal control over financial reporting includes those policies and procedures that (i) pertain to the maintenance of records that, in reasonable detail, accurately and fairly reflect the transactions and dispositions of the assets of the company; (ii) provide reasonable assurance that transactions are recorded as necessary to permit preparation of financial statements in accordance with generally accepted accounting principles, and that receipts and expenditures of the company are being made only in accordance with authorizations of management and directors of the company; and (iii) provide reasonable assurance regarding prevention or timely detection of unauthorized acquisition, use, or disposition of the company’s assets that could have a material effect on the financial statements.
Because of its inherent limitations, internal control over financial reporting may not prevent or detect misstatements. Also, projections of any evaluation of effectiveness to future periods are subject to the risk that controls may become inadequate because of changes in conditions, or that the degree of compliance with the policies or procedures may deteriorate.
/s/ PricewaterhouseCoopers LLP
Detroit, Michigan
February 5, 2019
We have served as the Company’s auditor since 2007.
181
Report of Independent Registered Public Accounting Firm
To the Board of Directors and Stockholder of Consumers Energy Company
Opinions on the Financial Statements and Internal Control over Financial Reporting
We have audited the accompanying consolidated balance sheets of Consumers Energy Company and its subsidiaries (the “Company”) as of
December 31, 2018
and
2017
, and the related consolidated statements of income, comprehensive income, changes in equity and cash flows for each of the three years in the period ended
December 31, 2018
, including the related notes and financial statement schedule listed in the index appearing under Item 15 (collectively referred to as the “consolidated financial statements”). We also have audited the Company’s internal control over financial reporting as of
December 31, 2018
, based on criteria established in
Internal Control — Integrated Framework
(2013) issued by the Committee of Sponsoring Organizations of the Treadway Commission (COSO).
In our opinion, the consolidated financial statements referred to above present fairly, in all material respects, the financial position of the Company as of
December 31, 2018
and
2017
, and the results of its operations and its cash flows for each of the three years in the period ended
December 31, 2018
in conformity with accounting principles generally accepted in the United States of America. Also in our opinion, the Company maintained, in all material respects, effective internal control over financial reporting as of
December 31, 2018
, based on criteria established in
Internal Control — Integrated Framework
(2013) issued by the COSO.
Basis for Opinions
The Company’s management is responsible for these consolidated financial statements, for maintaining effective internal control over financial reporting, and for its assessment of the effectiveness of internal control over financial reporting, included in Management’s Annual Report on Internal Control over Financial Reporting appearing under Item 9A. Our responsibility is to express opinions on the Company’s consolidated financial statements and on the Company’s internal control over financial reporting based on our audits. We are a public accounting firm registered with the Public Company Accounting Oversight Board (United States) (PCAOB) and are required to be independent with respect to the Company in accordance with the U.S. federal securities laws and the applicable rules and regulations of the Securities and Exchange Commission and the PCAOB.
We conducted our audits in accordance with the standards of the PCAOB. Those standards require that we plan and perform the audits to obtain reasonable assurance about whether the consolidated financial statements are free of material misstatement, whether due to error or fraud, and whether effective internal control over financial reporting was maintained in all material respects.
Our audits of the consolidated financial statements included performing procedures to assess the risks of material misstatement of the consolidated financial statements, whether due to error or fraud, and performing procedures that respond to those risks. Such procedures included examining, on a test basis, evidence regarding the amounts and disclosures in the consolidated financial statements. Our audits also included evaluating the accounting principles used and significant estimates made by management, as well as evaluating the overall presentation of the consolidated financial statements. Our audit of internal control over financial reporting included obtaining an understanding of internal control over financial reporting, assessing the risk that a material weakness exists, and testing and evaluating the design and operating effectiveness of internal control based on the assessed risk. Our audits also included performing such other procedures as we considered necessary in the circumstances. We believe that our audits provide a reasonable basis for our opinions.
182
Definition and Limitations of Internal Control over Financial Reporting
A company’s internal control over financial reporting is a process designed to provide reasonable assurance regarding the reliability of financial reporting and the preparation of financial statements for external purposes in accordance with generally accepted accounting principles. A company’s internal control over financial reporting includes those policies and procedures that (i) pertain to the maintenance of records that, in reasonable detail, accurately and fairly reflect the transactions and dispositions of the assets of the company; (ii) provide reasonable assurance that transactions are recorded as necessary to permit preparation of financial statements in accordance with generally accepted accounting principles, and that receipts and expenditures of the company are being made only in accordance with authorizations of management and directors of the company; and (iii) provide reasonable assurance regarding prevention or timely detection of unauthorized acquisition, use, or disposition of the company’s assets that could have a material effect on the financial statements.
Because of its inherent limitations, internal control over financial reporting may not prevent or detect misstatements. Also, projections of any evaluation of effectiveness to future periods are subject to the risk that controls may become inadequate because of changes in conditions, or that the degree of compliance with the policies or procedures may deteriorate.
/s/ PricewaterhouseCoopers LLP
Detroit, Michigan
February 5, 2019
We have served as the Company’s auditor since 2007.
183
Item 9.
Changes in and Disagreements with Accountants on Accounting and Financial Disclosure
None.
Item 9A.
Controls and Procedures
CMS Energy
Conclusion Regarding the Effectiveness of Disclosure Controls and Procedures:
Under the supervision and with the participation of management, including its CEO and CFO, CMS Energy conducted an evaluation of its disclosure controls and procedures (as such term is defined in Rules 13a-15(e) and 15d-15(e) under the Exchange Act). Based on such evaluation, CMS Energy’s CEO and CFO have concluded that its disclosure controls and procedures were effective as of
December 31, 2018
.
Management’s Annual Report on Internal Control Over Financial Reporting:
CMS Energy’s management is responsible for establishing and maintaining adequate internal control over financial reporting, as defined in Exchange Act Rules 13a-15(f) and 15d-15(f). CMS Energy’s internal control over financial reporting is a process designed to provide reasonable assurance regarding the reliability of financial reporting and the preparation of financial statements for external purposes in accordance with GAAP and includes policies and procedures that:
|
•
|
pertain to the maintenance of records that, in reasonable detail, accurately and fairly reflect the transactions and dispositions of the assets of CMS Energy
|
|
•
|
provide reasonable assurance that transactions are recorded as necessary to permit preparation of financial statements in accordance with GAAP, and that receipts and expenditures of CMS Energy are being made only in accordance with authorizations of management and directors of CMS Energy
|
|
•
|
provide reasonable assurance regarding prevention or timely detection of unauthorized acquisition, use, or disposition of CMS Energy’s assets that could have a material effect on its financial statements
|
Management, including its CEO and CFO, does not expect that its internal controls will prevent or detect all errors and all fraud. A control system, no matter how well designed and operated, can provide only reasonable, not absolute, assurance that the objectives of the control system are met. Further, the design of a control system must reflect the fact that there are resource constraints, and the benefits of controls must be considered relative to their costs. In addition, any evaluation of the effectiveness of controls is subject to risks that those internal controls may become inadequate in future periods because of changes in business conditions, or that the degree of compliance with the policies or procedures deteriorates.
Under the supervision and with the participation of management, including its CEO and CFO, CMS Energy conducted an evaluation of the effectiveness of its internal control over financial reporting as of
December 31, 2018
. In making this evaluation, management used the criteria set forth in the framework in Internal Control—Integrated Framework (2013) issued by the COSO. Based on such evaluation, CMS Energy’s management concluded that its internal control over financial reporting was effective as of
December 31, 2018
. The effectiveness of CMS Energy’s internal control over financial reporting as of
December 31, 2018
has been audited by PricewaterhouseCoopers LLP, an independent
184
registered public accounting firm, as stated in their report which appears under
Item 8. Financial Statements and Supplementary Data
.
Changes in Internal Control over Financial Reporting:
There have been no changes in CMS Energy’s internal control over financial reporting during the most recently completed fiscal quarter that have materially affected, or are reasonably likely to materially affect, its internal control over financial reporting.
Consumers
Conclusion Regarding the Effectiveness of Disclosure Controls and Procedures:
Under the supervision and with the participation of management, including its CEO and CFO, Consumers conducted an evaluation of its disclosure controls and procedures (as such term is defined in Rules 13a-15(e) and 15d-15(e) under the Exchange Act). Based on such evaluation, Consumers’ CEO and CFO have concluded that its disclosure controls and procedures were effective as of
December 31, 2018
.
Management’s Annual Report on Internal Control Over Financial Reporting:
Consumers’ management is responsible for establishing and maintaining adequate internal control over financial reporting, as defined in Exchange Act Rules 13a-15(f) and 15d-15(f). Consumers’ internal control over financial reporting is a process designed to provide reasonable assurance regarding the reliability of financial reporting and the preparation of financial statements for external purposes in accordance with GAAP and includes policies and procedures that:
|
•
|
pertain to the maintenance of records that, in reasonable detail, accurately and fairly reflect the transactions and dispositions of the assets of Consumers
|
|
•
|
provide reasonable assurance that transactions are recorded as necessary to permit preparation of financial statements in accordance with GAAP, and that receipts and expenditures of Consumers are being made only in accordance with authorizations of management and directors of Consumers
|
|
•
|
provide reasonable assurance regarding prevention or timely detection of unauthorized acquisition, use, or disposition of Consumers’ assets that could have a material effect on its financial statements
|
Management, including its CEO and CFO, does not expect that its internal controls will prevent or detect all errors and all fraud. A control system, no matter how well designed and operated, can provide only reasonable, not absolute, assurance that the objectives of the control system are met. Further, the design of a control system must reflect the fact that there are resource constraints, and the benefits of controls must be considered relative to their costs. In addition, any evaluation of the effectiveness of controls is subject to risks that those internal controls may become inadequate in future periods because of changes in business conditions, or that the degree of compliance with the policies or procedures deteriorates.
Under the supervision and with the participation of management, including its CEO and CFO, Consumers conducted an evaluation of the effectiveness of its internal control over financial reporting as of
December 31, 2018
. In making this evaluation, management used the criteria set forth in the framework in Internal Control—Integrated Framework (2013) issued by the COSO. Based on such evaluation, Consumers’ management concluded that its internal control over financial reporting was effective as of
December 31, 2018
. The effectiveness of Consumers’ internal control over financial reporting as of
December 31, 2018
has been audited by PricewaterhouseCoopers LLP, an independent registered public accounting firm, as stated in their report which appears under
Item 8. Financial Statements and Supplementary Data
.
185
Changes in Internal Control over Financial Reporting:
There have been no changes in Consumers’ internal control over financial reporting during the most recently completed fiscal quarter that have materially affected, or are reasonably likely to materially affect, its internal control over financial reporting.
Item 9B.
Other Information
None.
Part III
Item 10.
Directors, Executive Officers and Corporate Governance
CMS Energy
Information that is required in Item 10 of this Form 10‑K regarding executive officers is included in the
Item 1. Business—CMS Energy and Consumers Executive Officers
section, which is incorporated by reference herein.
Information that is required in Item 10 of this Form 10‑K regarding directors, executive officers, and corporate governance is incorporated by reference from CMS Energy’s and Consumers’ definitive proxy statement for their
2019
Annual Meetings of Shareholders to be held
May 3, 2019
. The proxy statement will be filed with the SEC, pursuant to Regulation 14A under the Exchange Act, within 120 days after the end of the fiscal year covered by this Form 10‑K, all of which information is hereby incorporated by reference in, and made part of, this Form 10‑K.
Code of Ethics
CMS Energy has adopted an employee code of ethics, entitled “CMS Energy 2019 Code of Conduct and Guide to Ethical Business Behavior” (“Employee Code”) that applies to its CEO, CFO, and CAO, as well as all other officers and employees of CMS Energy and its affiliates, except for EnerBank, which has its own code of conduct. The Employee Code is administered by the Chief Compliance Officer of CMS Energy, who reports directly to the Audit Committee of the Board of Directors of CMS Energy. CMS Energy has also adopted a director code of ethics entitled “Board of Directors Code of Conduct” (“Director Code”) that applies to its directors. The Director Code is administered by the Audit Committee of the Board of Directors of CMS Energy. Any alleged violation of the Director Code by a director will be investigated by disinterested members of the Audit Committee of the Board of Directors of CMS Energy, or if none, by disinterested members of the entire Board of Directors of CMS Energy. The Employee Code and Director Code and any waivers of, or amendments or exceptions to, a provision of the Employee Code that applies to CMS Energy’s CEO, CFO, CAO or persons performing similar functions and any waivers of, or amendments or exceptions to, a provision of CMS Energy’s Director Code will be disclosed on CMS Energy’s website at www.cmsenergy.com/corporate-governance/compliance-and-ethics.
Consumers
Information that is required in Item 10 of this Form 10‑K regarding executive officers is included in the
Item 1. Business—CMS Energy and Consumers Executive Officers
section, which is incorporated by reference herein.
186
Information that is required in Item 10 of this Form 10‑K regarding directors, executive officers, and corporate governance is incorporated by reference from CMS Energy’s and Consumers’ definitive proxy statement for their
2019
Annual Meetings of Shareholders to be held
May 3, 2019
. The proxy statement will be filed with the SEC, pursuant to Regulation 14A under the Exchange Act, within 120 days after the end of the fiscal year covered by this Form 10‑K, all of which information is hereby incorporated by reference in, and made part of, this Form 10‑K.
Code of Ethics
Consumers has adopted an employee code of ethics, entitled “CMS Energy 2019 Code of Conduct and Guide to Ethical Business Behavior” (“Employee Code”) that applies to its CEO, CFO, and CAO, as well as all other officers and employees of Consumers and its affiliates, except for EnerBank, which has its own code of conduct. The Employee Code is administered by the Chief Compliance Officer of Consumers, who reports directly to the Audit Committee of the Board of Directors of Consumers. Consumers has also adopted a director code of ethics entitled “Board of Directors Code of Conduct” (“Director Code”) that applies to its directors. The Director Code is administered by the Audit Committee of the Board of Directors of Consumers. Any alleged violation of the Director Code by a director will be investigated by disinterested members of the Audit Committee of the Board of Directors of Consumers, or if none, by disinterested members of the entire Board of Directors of Consumers. The Employee Code and Director Code and any waivers of, or amendments or exceptions to, a provision of the Employee Code that applies to Consumers’ CEO, CFO, CAO or persons performing similar functions and any waivers of, or amendments or exceptions to, a provision of Consumers’ Director Code will be disclosed on Consumers’ website at www.cmsenergy.com/corporate-governance/compliance-and-ethics.
Item 11.
Executive Compensation
See the note below.
Item 12.
Security Ownership of Certain Beneficial Owners and Management and Related Stockholder Matters
Securities Authorized for Issuance Under Equity Compensation Plans
Presented in the following table is information regarding CMS Energy’s equity compensation plans as of
December 31, 2018
:
|
(a)
|
|
(b)
|
(c)
|
|
||||
|
Plan Category
|
Number of securities to
be issued upon exercise
of outstanding options,
warrants, and rights
|
|
Weighted-average
exercise price of
outstanding options,
warrants, and rights
|
Number of securities remaining
available for future issuance under
equity compensation plans (excluding
securities reflected in column (a))
|
|
|||
|
Equity compensation plan approved by shareholders
|
—
|
|
$
|
—
|
|
3,714,544
|
|
|
Also see the note below.
187
Item 13.
Certain Relationships and Related Transactions, and Director Independence
See the note below.
Item 14.
Principal Accountant Fees and Services
See the note below.
NOTE:
Information that is required by Part III—Items 11, 12, 13, and 14 of this Form 10‑K is incorporated by reference from CMS Energy’s and Consumers’ definitive proxy statement for their
2019
Annual Meetings of Shareholders to be held
May 3, 2019
. The proxy statement will be filed with the SEC, pursuant to Regulation 14A under the Exchange Act, within 120 days after the end of the fiscal year covered by this Form 10‑K, all of which information is hereby incorporated by reference in, and made part of, this Form 10‑K.
188
Part IV
Item 15.
Exhibits and Financial Statement Schedules
The following financial statements are filed as part of this report under
Item 8. Financial Statements and Supplementary Data
:
|
•
|
Consolidated Statements of Income
of CMS Energy for the years ended
December 31, 2018
,
2017
, and
2016
|
|
•
|
Consolidated Statements of Comprehensive Income
of CMS Energy for the years ended
December 31, 2018
,
2017
, and
2016
|
|
•
|
Consolidated Statements of Cash Flows
of CMS Energy for the years ended
December 31, 2018
,
2017
, and
2016
|
|
•
|
Consolidated Balance Sheets
of CMS Energy at
December 31, 2018
and
2017
|
|
•
|
Consolidated Statements of Changes in Equity
of CMS Energy for the years ended
December 31, 2018
,
2017
, and
2016
|
|
•
|
Consolidated Statements of Income
of Consumers for the years ended
December 31, 2018
,
2017
, and
2016
|
|
•
|
Consolidated Statements of Comprehensive Income
of Consumers for the years ended
December 31, 2018
,
2017
, and
2016
|
|
•
|
Consolidated Statements of Cash Flows
of Consumers for the years ended
December 31, 2018
,
2017
, and
2016
|
|
•
|
Consolidated Balance Sheets
of Consumers at
December 31, 2018
and
2017
|
|
•
|
Consolidated Statements of Changes in Equity
of Consumers for the years ended
December 31, 2018
,
2017
, and
2016
|
|
•
|
Notes to the Consolidated Financial Statements
|
|
•
|
Report of Independent Registered Public Accounting Firm for CMS Energy
|
|
•
|
Report of Independent Registered Public Accounting Firm for Consumers
|
The following financial statement schedules are included below:
|
•
|
Schedule I — Condensed Financial Information of Registrant, CMS Energy—Parent Company at
December 31, 2018
and
2017
and for the years ended
December 31, 2018
,
2017
, and
2016
|
|
•
|
Schedule II — Valuation and Qualifying Accounts and Reserves of CMS Energy for the years ended
December 31, 2018
,
2017
, and
2016
|
|
•
|
Schedule II — Valuation and Qualifying Accounts and Reserves of Consumers for the years ended
December 31, 2018
,
2017
, and
2016
|
189
Schedule I — Condensed Financial Information of Registrant
CMS Energy—Parent Company
Condensed Statements of Income
|
In Millions
|
||||||||||||
|
Years Ended December 31
|
2018
|
2017
|
2016
|
|||||||||
|
Operating Expenses
|
||||||||||||
|
Other operating expenses
|
$
|
(7
|
)
|
$
|
(9
|
)
|
$
|
(14
|
)
|
|||
|
Total operating expenses
|
(7
|
)
|
(9
|
)
|
(14
|
)
|
||||||
|
Operating Loss
|
(7
|
)
|
(9
|
)
|
(14
|
)
|
||||||
|
Other Income (Expense)
|
||||||||||||
|
Equity earnings of subsidiaries
|
780
|
|
633
|
|
660
|
|
||||||
|
Nonoperating retirement benefits, net
|
(1
|
)
|
(1
|
)
|
(1
|
)
|
||||||
|
Interest income
|
2
|
|
1
|
|
1
|
|
||||||
|
Other income
|
—
|
|
2
|
|
—
|
|
||||||
|
Other expense
|
(17
|
)
|
(31
|
)
|
(19
|
)
|
||||||
|
Total other income
|
764
|
|
604
|
|
641
|
|
||||||
|
Interest Charges
|
||||||||||||
|
Interest on long-term debt
|
135
|
|
143
|
|
150
|
|
||||||
|
Intercompany interest expense and other
|
7
|
|
3
|
|
1
|
|
||||||
|
Total interest charges
|
142
|
|
146
|
|
151
|
|
||||||
|
Income Before Income Taxes
|
615
|
|
449
|
|
476
|
|
||||||
|
Income Tax Benefit
|
(42
|
)
|
(11
|
)
|
(75
|
)
|
||||||
|
Net Income Available to Common Stockholders
|
$
|
657
|
|
$
|
460
|
|
$
|
551
|
|
|||
The accompanying notes are an integral part of these statements.
190
Schedule I — Condensed Financial Information of Registrant (Continued)
CMS Energy—Parent Company
Condensed Statements of Cash Flows
|
In Millions
|
||||||||||||
|
Years Ended December 31
|
2018
|
2017
|
2016
|
|||||||||
|
Cash Flows from Operating Activities
|
||||||||||||
|
Net cash provided by operating activities
|
$
|
702
|
|
$
|
433
|
|
$
|
422
|
|
|||
|
Cash Flows from Investing Activities
|
||||||||||||
|
Investment in subsidiaries
|
(363
|
)
|
(447
|
)
|
(275
|
)
|
||||||
|
Proceeds from DB SERP investments
|
22
|
|
—
|
|
—
|
|
||||||
|
Net cash used in investing activities
|
(341
|
)
|
(447
|
)
|
(275
|
)
|
||||||
|
Cash Flows from Financing Activities
|
||||||||||||
|
Proceeds from issuance of debt
|
560
|
|
799
|
|
603
|
|
||||||
|
Issuance of common stock
|
41
|
|
83
|
|
72
|
|
||||||
|
Retirement of long-term debt
|
(675
|
)
|
(425
|
)
|
(530
|
)
|
||||||
|
Debt prepayment costs
|
(16
|
)
|
(18
|
)
|
(18
|
)
|
||||||
|
Payment of dividends on common stock
|
(405
|
)
|
(375
|
)
|
(345
|
)
|
||||||
|
Debt issuance costs and financing fees
|
(8
|
)
|
(3
|
)
|
(5
|
)
|
||||||
|
Change in notes payable - intercompany
|
142
|
|
(47
|
)
|
76
|
|
||||||
|
Net cash provided by (used in) financing activities
|
(361
|
)
|
14
|
|
(147
|
)
|
||||||
|
Net Increase in Cash and Cash Equivalents, Including Restricted Amounts
|
—
|
|
—
|
|
—
|
|
||||||
|
Cash and Cash Equivalents, Including Restricted Amounts, Beginning of Period
|
—
|
|
—
|
|
—
|
|
||||||
|
Cash and Cash Equivalents, Including Restricted Amounts, End of Period
|
$
|
—
|
|
$
|
—
|
|
$
|
—
|
|
|||
The accompanying notes are an integral part of these statements.
191
Schedule I — Condensed Financial Information of Registrant (Continued)
CMS Energy—Parent Company
Condensed Balance Sheets
|
ASSETS
|
||||||||
|
In Millions
|
||||||||
|
December 31
|
2018
|
2017
|
||||||
|
Current Assets
|
||||||||
|
Notes and accrued interest receivable
|
$
|
2
|
|
$
|
5
|
|
||
|
Accounts receivable - intercompany and related parties
|
7
|
|
7
|
|
||||
|
Federal income tax receivable
|
44
|
|
77
|
|
||||
|
Accrued taxes
|
26
|
|
57
|
|
||||
|
Prepayments and other current assets
|
1
|
|
1
|
|
||||
|
Total current assets
|
80
|
|
147
|
|
||||
|
Other Non-current Assets
|
||||||||
|
Deferred income taxes
|
180
|
|
269
|
|
||||
|
Investments in subsidiaries
|
7,706
|
|
7,202
|
|
||||
|
Other investments – DB SERP
|
3
|
|
25
|
|
||||
|
Other
|
10
|
|
2
|
|
||||
|
Total other non-current assets
|
7,899
|
|
7,498
|
|
||||
|
Total Assets
|
$
|
7,979
|
|
$
|
7,645
|
|
||
192
|
LIABILITIES AND EQUITY
|
||||||||
|
In Millions
|
||||||||
|
December 31
|
2018
|
2017
|
||||||
|
Current Liabilities
|
||||||||
|
Current portion of long-term debt
|
$
|
180
|
|
$
|
225
|
|
||
|
Accounts and notes payable - intercompany
|
113
|
|
87
|
|
||||
|
Accrued interest, including intercompany
|
32
|
|
34
|
|
||||
|
Other current liabilities
|
7
|
|
5
|
|
||||
|
Total current liabilities
|
332
|
|
351
|
|
||||
|
Non-current Liabilities
|
||||||||
|
Long-term debt
|
2,750
|
|
2,830
|
|
||||
|
Notes payable - intercompany
|
116
|
|
—
|
|
||||
|
Postretirement benefits
|
17
|
|
21
|
|
||||
|
Other non-current liabilities
|
9
|
|
2
|
|
||||
|
Total non-current liabilities
|
2,892
|
|
2,853
|
|
||||
|
Equity
|
||||||||
|
Common stockholders’ equity
|
4,755
|
|
4,441
|
|
||||
|
Total Liabilities and Equity
|
$
|
7,979
|
|
$
|
7,645
|
|
||
The accompanying notes are an integral part of these statements.
193
Schedule I — Condensed Financial Information of Registrant (Continued)
CMS Energy—Parent Company
Notes to the Condensed Financial Statements
|
1:
|
Basis of Presentation
|
CMS Energy’s condensed financial statements have been prepared on a parent-only basis. In accordance with Rule 12-04 of Regulation S-X, these parent-only financial statements do not include all of the information and notes required by GAAP for annual financial statements, and therefore these parent-only financial statements and other information included should be read in conjunction with CMS Energy’s audited consolidated financial statements contained within
Item 8. Financial Statements and Supplementary Data
.
|
2:
|
Guarantees
|
CMS Energy has issued guarantees with a maximum potential obligation of
$433 million
on behalf of some of its wholly owned subsidiaries and related parties. CMS Energy’s maximum potential obligation consists primarily of potential payments:
|
•
|
to third parties under certain commodity purchase and swap agreements entered into with CMS ERM
|
|
•
|
to third parties under certain agreements entered into with Grand River Wind LLC, a wholly owned subsidiary of CMS Enterprises
|
|
•
|
to third parties in support of non‑recourse revenue bonds issued by Genesee
|
|
•
|
to the MDEQ on behalf of CMS Land and CMS Capital, for environmental remediation obligations at Bay Harbor
|
|
•
|
to the U.S. Department of Energy on behalf of Consumers, in connection with Consumers’ 2011 settlement agreement with the U.S. Department of Energy regarding damages resulting from the department’s failure to accept spent nuclear fuel from nuclear power plants formerly owned by Consumers
|
The expiry dates of these guarantees vary, depending upon contractual provisions or upon the statute of limitations under the relevant governing law.
194
|
3:
|
Note Payable
—
Intercompany
|
In July 2018, CMS Energy issued a demand note payable to the DB SERP rabbi trust, of which
$124 million
was attributable to CMS Energy’s subsidiaries.
The demand note bears interest at an annual rate of
4.10 percent
and has a maturity date of 2028.
This note payable is not recorded at fair value; however, its carrying value approximates fair value at
December 31, 2018
. This fair value measurement is classified in Level 3 within the fair value hierarchy.
Schedule II — Valuation and Qualifying Accounts and Reserves
CMS Energy Corporation
Years Ended
December 31, 2018
,
2017
, and
2016
|
In Millions
|
||||||||||||||||||||
|
Description
|
Balance at Beginning of Period
|
Charged to Expense
|
Charged to Other Accounts
|
Deductions
|
Balance at End of Period
|
|||||||||||||||
|
Allowance for uncollectible accounts
1
|
||||||||||||||||||||
|
2018
|
$
|
20
|
|
$
|
29
|
|
$
|
—
|
|
$
|
29
|
|
$
|
20
|
|
|||||
|
2017
|
24
|
|
29
|
|
—
|
|
33
|
|
20
|
|
||||||||||
|
2016
|
28
|
|
31
|
|
—
|
|
35
|
|
24
|
|
||||||||||
|
Deferred tax valuation allowance
|
||||||||||||||||||||
|
2018
|
$
|
15
|
|
$
|
2
|
|
$
|
—
|
|
$
|
9
|
|
$
|
8
|
|
|||||
|
2017
|
5
|
|
10
|
|
—
|
|
—
|
|
15
|
|
||||||||||
|
2016
|
4
|
|
1
|
|
—
|
|
—
|
|
5
|
|
||||||||||
|
Allowance for notes receivable
1
|
||||||||||||||||||||
|
2018
|
$
|
20
|
|
$
|
25
|
|
$
|
—
|
|
$
|
21
|
|
$
|
24
|
|
|||||
|
2017
|
16
|
|
20
|
|
—
|
|
16
|
|
20
|
|
||||||||||
|
2016
|
9
|
|
19
|
|
—
|
|
12
|
|
16
|
|
||||||||||
|
1
|
Deductions represent write-offs of uncollectible accounts, net of recoveries.
|
195
Consumers Energy Company
Years Ended
December 31, 2018
,
2017
, and
2016
|
In Millions
|
||||||||||||||||||||
|
Description
|
Balance at Beginning of Period
|
Charged to Expense
|
Charged to Other Accounts
|
Deductions
|
Balance at End of Period
|
|||||||||||||||
|
Allowance for uncollectible accounts
1
|
||||||||||||||||||||
|
2018
|
$
|
20
|
|
$
|
29
|
|
$
|
—
|
|
$
|
29
|
|
$
|
20
|
|
|||||
|
2017
|
24
|
|
29
|
|
—
|
|
33
|
|
20
|
|
||||||||||
|
2016
|
28
|
|
31
|
|
—
|
|
35
|
|
24
|
|
||||||||||
|
1
|
Deductions represent write-offs of uncollectible accounts, net of recoveries.
|
196
Exhibit Index
The agreements included as exhibits to this Form 10-K filing are included solely to provide information regarding the terms of the agreements and are not intended to provide any other factual or disclosure information about CMS Energy, Consumers, or other parties to the agreements. The agreements may contain representations and warranties made by each of the parties to each of the agreements that were made exclusively for the benefit of the parties involved in each of the agreements and should not be treated as statements of fact. The representations and warranties were made as a way to allocate risk if one or more of those statements prove to be incorrect. The statements were qualified by disclosures of the parties to each of the agreements that may not be reflected in each of the agreements. The agreements may apply standards of materiality that are different than standards applied to other investors. Additionally, the statements were made as of the date of the agreements or as specified in the agreements and have not been updated.
The representations and warranties may not describe the actual state of affairs of the parties to each agreement. Additional information about CMS Energy and Consumers may be found in this filing, at www.cmsenergy.com, at www.consumersenergy.com, and through the SEC’s website at www.sec.gov.
|
Previously Filed
|
|||||
|
Exhibits
|
With File
Number
|
As
Exhibit
Number
|
|
Description
|
|
|
3.1
1
|
1-9513
|
(3)(a)
|
|
—
|
|
|
3.2
1
|
1-9513
|
3.2
|
|
—
|
|
|
3.3
|
1-5611
|
3(c)
|
|
—
|
|
|
3.4
|
1-5611
|
3.2
|
|
—
|
|
|
4.1
|
2-65973
|
(b)(1) – 4
|
|
—
|
Indenture dated as of September 1, 1945 between Consumers and Chemical Bank (successor to Manufacturers Hanover Trust Company), as Trustee, including therein indentures supplemental thereto through the Forty-third Supplemental Indenture dated as of May 1, 1979 (Form S-16 filed November 13, 1979)
|
|
Indentures Supplemental thereto:
|
|||||
|
4.1.a
|
1-5611
|
4.2
|
|
—
|
|
|
4.1.b
|
1-5611
|
4.2
|
|
—
|
|
|
4.1.c
|
1-5611
|
4.1
|
|
—
|
|
|
4.1.d
|
1-5611
|
4.1
|
|
—
|
|
|
4.1.e
|
1-5611
|
4.1
|
|
—
|
|
|
4.1.f
|
1-5611
|
4.1
|
|
—
|
|
|
4.1.g
|
1-5611
|
4.1
|
|
—
|
|
|
4.1.h
|
1-5611
|
4.1
|
|
—
|
|
|
4.1.i
|
1-5611
|
4.1
|
|
—
|
|
|
4.1.j
|
1-5611
|
4.1
|
|
—
|
|
197
|
Previously Filed
|
|||||
|
Exhibits
|
With File
Number
|
As
Exhibit
Number
|
|
Description
|
|
|
4.1.k
|
1-5611
|
4.1
|
|
—
|
|
|
4.1.l
|
1-5611
|
4.1
|
|
—
|
|
|
4.1.m
|
1-5611
|
4.1
|
|
—
|
|
|
4.1.n
|
1-5611
|
4.1
|
|
—
|
|
|
4.1.o
|
1-5611
|
4.1
|
|
—
|
|
|
4.1.p
|
1-5611
|
4.1
|
|
—
|
|
|
4.1.q
|
1-5611
|
4.1
|
|
—
|
|
|
4.1.r
|
1-5611
|
4.1
|
|
—
|
|
|
4.1.s
|
1-5611
|
4.1
|
|
—
|
|
|
4.1.t
|
1-5611
|
4.1
|
|
—
|
|
|
4.1.u
|
1-5611
|
4.1
|
|
—
|
|
|
4.1.v
|
1-5611
|
4.1
|
|
—
|
|
|
4.1.w
|
1-5611
|
4.1
|
|
—
|
|
|
4.2
|
1-5611
|
(4)(b)
|
|
—
|
|
|
4.3
|
1-5611
|
(4)(c)
|
|
—
|
|
|
4.4
1
|
33-47629
|
(4)(a)
|
|
—
|
Indenture dated as of September 15, 1992 between CMS Energy and NBD Bank, as Trustee (Form S-3 filed May 1, 1992)
|
|
Indentures Supplemental thereto:
|
|||||
|
4.4.a
1
|
1-9513
|
4.1
|
|
—
|
|
|
4.4.b
1
|
1-9513
|
4.1
|
|
—
|
|
|
4.4.c
1
|
1-9513
|
4.1
|
|
—
|
|
|
4.4.d
1
|
1-9513
|
4.2
|
|
—
|
|
|
4.4.e
1
|
1-9513
|
4.1
|
|
—
|
|
|
4.4.f
1
|
1-9513
|
4.1
|
|
—
|
|
|
4.4.g
1
|
1-9513
|
4.1
|
|
—
|
|
|
4.4.h
1
|
1-9513
|
4.1
|
|
—
|
|
|
4.5
1
|
1-9513
|
(4a)
|
|
—
|
|
|
Indentures Supplemental thereto:
|
|||||
|
4.5.a
1
|
1-9513
|
4.5.a
|
|
—
|
|
|
4.5.b
1
|
1-9513
|
4.1
|
|
—
|
|
|
4.5.c
1
|
1-9513
|
4.1
|
|
—
|
|
|
10.1
2
|
1-9513
|
(10)(g)
|
|
—
|
|
|
10.2
2
|
1-9513
|
10.1
|
|
—
|
|
|
10.3
2
|
—
|
||||
198
|
Previously Filed
|
|||||
|
Exhibits
|
With File
Number
|
As
Exhibit
Number
|
|
Description
|
|
|
10.4
2
|
1-9513
|
10.5
|
|
—
|
|
|
10.5
2
|
1-9513
|
10.6
|
|
—
|
|
|
10.6
2
|
1-9513
|
10.7.a
|
|
—
|
|
|
10.7
2
|
|||||
|
10.8
2
|
1-9513
|
10.8
|
|
—
|
|
|
10.9
1
|
1-9513
|
(10)(y)
|
|
—
|
Environmental Agreement dated as of June 1, 1990 made by CMS Energy to The Connecticut National Bank and Others (Form 10-K for the fiscal year ended December 31, 1990)
|
|
10.10
1,2
|
1-9513
|
(10)(a)
|
|
—
|
|
|
10.11
2
|
1-5611
|
(10)(b)
|
|
—
|
|
|
10.12
2
|
—
|
||||
|
10.13
2
|
1-9513
|
10.1
|
|
—
|
|
|
10.14
2
|
—
|
||||
|
10.15
1
|
1-9513
|
10.1
|
|
—
|
|
|
10.16
|
1-5611
|
10.2
|
|
—
|
|
|
10.17
1
|
1-9513
|
10.3
|
|
—
|
|
|
10.18
|
1-5611
|
10.1
|
|
—
|
|
|
10.19
2
|
1-9513
|
10.1
|
|
—
|
|
199
|
Previously Filed
|
|||||
|
Exhibits
|
With File
Number
|
As
Exhibit
Number
|
|
Description
|
|
|
10.20
1
|
1-9513
|
10.1
|
|
—
|
|
|
10.20.a
1
|
1-9513
|
10.3
|
|
—
|
|
|
10.20.b
1
|
1-9513
|
10.4
|
|
—
|
|
|
10.21
|
1-5611
|
10.1
|
|
—
|
|
|
10.22
|
1-5611
|
10.1
|
|
—
|
|
|
10.23
1
|
1-9513
|
10.1
|
|
—
|
|
|
10.24
|
1-5611
|
10.3
|
|
—
|
|
|
10.25
1
|
1-9513
|
10.1
|
|
—
|
|
|
21.1
|
—
|
||||
|
23.1
|
—
|
||||
|
23.2
|
—
|
||||
|
31.1
|
—
|
||||
|
31.2
|
—
|
||||
|
31.3
|
—
|
||||
|
31.4
|
—
|
||||
|
32.1
|
—
|
||||
|
32.2
|
—
|
||||
|
99.1
1
|
333-221134
|
99.1
|
|
—
|
|
|
101.INS
|
—
|
XBRL Instance Document
|
|||
|
101.SCH
|
—
|
XBRL Taxonomy Extension Schema
|
|||
|
101.CAL
|
—
|
XBRL Taxonomy Extension Calculation Linkbase
|
|||
|
101.DEF
|
—
|
XBRL Taxonomy Extension Definition Linkbase
|
|||
|
101.LAB
|
—
|
XBRL Taxonomy Extension Labels Linkbase
|
|||
|
101.PRE
|
—
|
XBRL Taxonomy Extension Presentation Linkbase
|
|||
200
|
1
|
Obligations of CMS Energy or its subsidiaries, but not of Consumers.
|
|
2
|
Management contract or compensatory plan or arrangement.
|
Exhibits that have been previously filed with the SEC, designated above, are incorporated herein by reference and made a part hereof.
Item 16.
Form 10-K Summary
None.
201
Signatures
Pursuant to the requirements of Section 13 or 15(d) of the Securities Exchange Act of 1934, CMS Energy Corporation has duly caused this Annual Report to be signed on its behalf by the undersigned, thereunto duly authorized, on the 5
th
day of
February 2019
.
|
CMS ENERGY CORPORATION
|
||
|
By:
|
/s/ Patricia K. Poppe
|
|
|
Patricia K. Poppe
|
||
|
President and Chief Executive Officer
|
||
Pursuant to the requirements of the Securities Exchange Act of 1934, this Annual Report has been signed below by the following persons on behalf of CMS Energy Corporation and in the capacities indicated and on the 5
th
day of
February 2019
.
|
/s/ Patricia K. Poppe
|
/s/ Jon E. Barfield
|
|
|
Patricia K. Poppe
|
Jon E. Barfield, Director
|
|
|
President and Chief Executive Officer, and Director
|
||
|
/s/ Deborah H. Butler
|
||
|
(Principal Executive Officer)
|
Deborah H. Butler, Director
|
|
|
/s/ Kurt L. Darrow
|
||
|
/s/ Rejji P. Hayes
|
Kurt L. Darrow, Director
|
|
|
Rejji P. Hayes
|
||
|
Executive Vice President and Chief Financial Officer
|
/s/ Stephen E. Ewing
|
|
|
Stephen E. Ewing, Director
|
||
|
(Principal Financial Officer)
|
||
|
/s/ William D. Harvey
|
||
|
William D. Harvey, Director
|
||
|
/s/ Glenn P. Barba
|
||
|
Glenn P. Barba
|
/s/ John G. Russell
|
|
|
Vice President, Controller, and Chief Accounting Officer
|
John G. Russell, Director
|
|
|
(Controller)
|
/s/ Suzanne F. Shank
|
|
|
Suzanne F. Shank, Director
|
||
|
/s/ Myrna M. Soto
|
||
|
Myrna M. Soto, Director
|
||
|
/s/ John G. Sznewajs
|
||
|
John G. Sznewajs, Director
|
||
|
/s/ Laura H. Wright
|
||
|
Laura H. Wright, Director
|
||
202
Signatures
Pursuant to the requirements of Section 13 or 15(d) of the Securities Exchange Act of 1934, Consumers Energy Company has duly caused this Annual Report to be signed on its behalf by the undersigned, thereunto duly authorized, on the 5
th
day of
February 2019
.
|
|
CONSUMERS ENERGY COMPANY
|
|
|
|
||
|
|
By:
|
/s/ Patricia K. Poppe
|
|
|
Patricia K. Poppe
|
|
|
|
President and Chief Executive Officer
|
|
Pursuant to the requirements of the Securities Exchange Act of 1934, this Annual Report has been signed below by the following persons on behalf of Consumers Energy Company and in the capacities indicated and on the 5
th
day of
February 2019
.
|
/s/ Patricia K. Poppe
|
/s/ Jon E. Barfield
|
|
|
Patricia K. Poppe
|
Jon E. Barfield, Director
|
|
|
President and Chief Executive Officer, and Director
|
||
|
/s/ Deborah H. Butler
|
||
|
(Principal Executive Officer)
|
Deborah H. Butler, Director
|
|
|
/s/ Kurt L. Darrow
|
||
|
/s/ Rejji P. Hayes
|
Kurt L. Darrow, Director
|
|
|
Rejji P. Hayes
|
||
|
Executive Vice President and Chief Financial Officer
|
/s/ Stephen E. Ewing
|
|
|
Stephen E. Ewing, Director
|
||
|
(Principal Financial Officer)
|
||
|
/s/ William D. Harvey
|
||
|
William D. Harvey, Director
|
||
|
/s/ Glenn P. Barba
|
||
|
Glenn P. Barba
|
/s/ John G. Russell
|
|
|
Vice President, Controller, and Chief Accounting Officer
|
John G. Russell, Director
|
|
|
(Controller)
|
/s/ Suzanne F. Shank
|
|
|
Suzanne F. Shank, Director
|
||
|
/s/ Myrna M. Soto
|
||
|
Myrna M. Soto, Director
|
||
|
/s/ John G. Sznewajs
|
||
|
John G. Sznewajs, Director
|
||
|
/s/ Laura H. Wright
|
||
|
Laura H. Wright, Director
|
||
203
TABLE OF CONTENTS
Part IItem 1. BusinessItem 6. Selected Financial DataItem 8. Financial Statements and Supplementary Data Cms Energy Consolidated Financial StatementsItem 1. Business Cms Energy and Consumers RegulationItem 8. Financial Statements and Supplementary Data Consumers Consolidated Financial StatementsItem 1. Business Business SegmentsItem 7. Management S Discussion and Analysis Of Financial Condition and Results Of Operations Executive OverviewItem 8. Financial Statements and Supplementary Data Notes To The Consolidated Financial StatementsNote 4, Contingencies and Commitments Contractual CommitmentsItem 7. Management S Discussion and Analysis Of Financial Condition and Results Of Operations OutlookNote 3, Regulatory MattersItem 1A. Risk FactorsNote 4, Contingencies and CommitmentsNote 12, Retirement BenefitsItem 1. Business Cms Energy and Consumers Environmental Strategy and ComplianceItem 1B. Unresolved Staff CommentsItem 2. PropertiesItem 3. Legal ProceedingsItem 4. Mine Safety DisclosuresPart IIItem 5. Market For Registrant S Common Equity, Related Stockholder Matters and Issuer Purchases Of Equity SecuritiesNote 13, Stock-based CompensationItem 12. Security Ownership Of Certain Beneficial Owners and Management and Related Stockholder MattersNote 5, Financings and CapitalizationItem 7. Management S Discussion and Analysis Of Financial Condition and Results Of OperationsNote 14, Income TaxesNote 7, Financial InstrumentsNote 5, Financings and Capitalization Dividend RestrictionsNote 4, Contingencies and Commitments GuaranteesNote 10, Leases and Palisades FinancingNote 4, Contingencies and Commitments Consumers Electric Utility Contingencies Electric Environmental MattersNote 4, Contingencies and Commitments Consumers Gas Utility Contingencies Gas Environmental MattersNote 1, Significant Accounting PoliciesNote 6, Fair Value MeasurementsNote 16, RevenueNote 2, New Accounting StandardsItem 7A. Quantitative and Qualitative Disclosures About Market RiskItem 8. Financial Statements and Supplementary DataNote 15, Earnings Per Share Cms EnergyNote 8, Notes ReceivableNote 9, Plant, Property, and EquipmentNote 11, Asset Retirement ObligationsNote 18, Cash and Cash EquivalentsNote 21, Variable Interest EntitiesItem 9. Changes in and Disagreements with Accountants on Accounting and Financial DisclosureItem 9A. Controls and ProceduresItem 9B. Other InformationPart IIIItem 10. Directors, Executive Officers and Corporate GovernanceItem 1. Business Cms Energy and Consumers Executive OfficersItem 11. Executive CompensationItem 13. Certain Relationships and Related Transactions, and Director IndependenceItem 14. Principal Accountant Fees and ServicesPart IVItem 15. Exhibits and Financial Statement SchedulesItem 16. Form 10-k Summary