COMTECH TELECOMMUNICATIONS CORP /DE/
10-Ks and 10-Qs
|
|
|
|
|
|
|
|
|
|
|
|
|
|
|
|
|
|
|
|
|
|
|
|
|
|
|
|
|
|
|
|
|
|
|
|
|
|
|
|
|
|
|
|
|
|
|
|
|
|
UNITED STATES SECURITIES AND EXCHANGE COMMISSION
Washington, D.C. 20549
|
FORM 10-K
|
(Mark One)

|
Annual Report Pursuant to Section 13 or 15(d) of the Securities Exchange Act of 1934
|
For the fiscal year ended
July 31, 2012
|
|
Transition Report Pursuant to Section 13 or 15(d) of the Securities Exchange Act of 1934
|
Commission File Number: 0-7928

(Exact name of registrant as specified in its charter)
|
Delaware
|
|
11-2139466
|
|
(State or other jurisdiction of incorporation /organization)
|
|
(I.R.S. Employer Identification Number)
|
|
68 South Service Road, Suite 230,
Melville, NY
|
|
11747 |
|
(Address of principal executive offices)
|
|
(Zip Code)
|
|
(631) 962-7000
|
|
(Registrant’s telephone number, including area code)
|
Securities registered pursuant to Section 12(b) of the Act:
|
Title of each class
|
|
Name of each exchange on which registered
|
|
Common Stock, par value $.10 per share
|
|
NASDAQ Stock Market LLC
|
|
Series A Junior Participating Cumulative
|
|
|
|
Preferred Stock, par value $.10 per share
|
|
NASDAQ Stock Market LLC
|
Securities registered pursuant to Section 12(g) of the Act:
None
(Title of class)
Indicate by check mark if the registrant is a well-known seasoned issuer, as defined in Rule 405 of the Securities Act.
No
Indicate by check mark if the registrant is not required to file reports pursuant to Section 13 of Section 15(d) of the Act.
No
Indicate by check mark whether the registrant (1) has filed all reports required to be filed by Section 13 or 15(d) of the Securities Exchange Act of 1934 during the preceding 12 months (or for such shorter period that the registrant was required to file such reports), and (2) has been subject to such filing requirements for the past 90 days.
Yes
Indicate by check mark whether the registrant has submitted electronically and posted on its corporate Web site, if any, every Interactive Data file required to be submitted and posted pursuant to Rule 405 of Regulation S-T (§ 232.405 of this chapter) during the preceding 12 months (or for such shorter period that the registrant was required to submit and post such files).
Yes
Indicate by check mark if disclosure of delinquent filers pursuant to Item 405 of Regulation S-K (§ 229.405 of this chapter) is not contained herein, and will not be contained, to the best of registrant’s knowledge, in definitive proxy or information statements incorporated by reference in Part III of this Form 10-K or any amendment to this Form 10-K.

Indicate by check mark whether the registrant is a large accelerated filer, an accelerated filer, a non-accelerated filer, or a smaller reporting company. See the definitions of “large accelerated filer,” “accelerated filer” and “smaller reporting company” in Rule 12b-2 of the Exchange Act.
|
Large accelerated filer
|
|
Accelerated filer
|
|
|
Non-accelerated filer
|
|
Smaller reporting company
|
|
Indicate by check mark whether registrant is a shell c
ompany (as defined in Rule 12b-2 of the Exchange Act).
No
The aggregate market value of the registrant’s voting stock held by non-affiliates of the registrant, computed by reference to the closing sales price as quoted on the NASDAQ National Market on
January 31, 2012
was approximately
$583,157,000
.
The number of shares of the registrant’s common stock outstanding on
September 21, 2012
was
17,369,120
.
DOCUMENTS INCORPORATED BY REFERENCE.
Certain portions of the document listed below have been incorporated by reference into the indicated Part of this Annual Report on Form 10-K:
Proxy Statement for
2012
Annual Meeting of Stockholders - P
art III
|
INDEX
|
||
|
PART I
|
||
|
ITEM 1.
|
||
|
|
|
|
|
|
||
|
|
||
|
|
||
|
|
||
|
|
||
|
|
||
|
|
||
|
|
||
|
|
||
|
|
||
|
|
||
|
|
||
|
|
||
|
|
||
|
|
||
|
|
||
|
|
|
|
|
ITEM 1A.
|
||
|
|
|
|
|
ITEM 1B.
|
||
|
|
|
|
|
ITEM 2.
|
||
|
|
|
|
|
ITEM 3.
|
||
|
ITEM 4.
|
||
|
|
|
|
|
PART II
|
||
|
|
|
|
|
ITEM 5.
|
||
|
|
|
|
|
|
||
|
|
||
|
|
||
|
|
||
|
|
||
|
|
|
|
|
ITEM 6.
|
||
|
|
|
|
i
|
ITEM 7.
|
||
|
|
|
|
|
|
||
|
|
||
|
|
||
|
|
||
|
|
||
|
|
||
|
|
||
|
|
||
|
|
||
|
|
|
|
|
ITEM 7A.
|
||
|
|
|
|
|
ITEM 8.
|
||
|
|
|
|
|
ITEM 9.
|
||
|
|
|
|
|
ITEM 9A.
|
||
|
|
|
|
|
ITEM 9B.
|
||
|
PART III
|
||
|
ITEM 10.
|
||
|
|
|
|
|
ITEM 11.
|
||
|
|
|
|
|
ITEM 12.
|
||
|
|
|
|
|
ITEM 13.
|
||
|
|
|
|
|
ITEM 14.
|
||
|
PART IV
|
||
|
ITEM 15.
|
||
|
|
|
|
|
|
|
|
ii
Note:
As used in this Annual Report on Form 10-K, the terms “Comtech,” “we,” “us,” “our” and “our Company” mean Comtech Telecommunications Corp. and Comtech’s subsidiaries.
We design, develop, produce and market innovative products, systems and services for advanced communications solutions. We believe many of our solutions play a vital role in providing or enhancing communication capabilities when terrestrial communications infrastructure is unavailable, inefficient or too expensive. We conduct our business through three complementary segments: telecommunications transmission, RF microwave amplifiers and mobile data communications. We sell our products to a diverse customer base in the global commercial and government communications markets. We believe we are a leader in the market segments that we serve.
For the past several years, we have operated our business in extremely challenging adverse macroeconomic and political environments. During this time, we have focused on long-term organic growth opportunities that we believe exist in each of our three business segments.
During fiscal 2012, we reported consolidated net sales of
$425.1 million
and consolidated operating income of
$51.3 million
. In addition, during fiscal 2012, we completed the repositioning of our mobile data communications segment to align with our expectations of materially lower levels of future net sales and operating income in this segment. This repositioning included targeted actions to adjust our cost structure and eliminate certain product lines, including our microsatellite product line. In connection with this repositioning, we recorded a restructuring charge of
$2.6 million
and anticipate additional charges of approximately $1.0 million in fiscal 2013.
As of July 31, 2012, we had cash and cash equivalents of
$367.9 million
. We expect to supplement organic growth opportunities by making one or more acquisitions.
Our Internet website is
www.comtechtel.com
and we make available on our website; our annual reports, quarterly reports, current reports and any related amendments. Unless specifically noted, the reference to our website address does n
ot constitute incorporation by reference of the information contained therein into this Form 10-K. In addition, any materials filed with the SEC may be read and copied by the public at the SEC’s Public Reference Room at 100 F Street, N.E., Washington, DC 20549. The public may obtain information on the operation of the Public Reference Room by calling the SEC at 1-800-SEC-0330.
We are incorporated in the state of Delaware and were founded in 1967.
Business Conditions and Industry Background
We participate in the global commercial and government communications markets which are characterized by rapid technological advances and constant changes.
For the past several years, our customers and the end-markets that we serve have been significantly impacted by adverse global economic conditions. In the past few years, European monetary issues and concerns have intensified, raising concern of another possible worldwide credit crisis. Although the impact, severity and duration of these conditions are impossible to predict with precision, we believe the current economic environment has resulted, and may continue to result, in: (i) changes to our commercial and government customers’ historical spending priorities, (ii) reduced military budgets and (iii) extreme pressures on government budgets throughout the world.
In addition to operating in a difficult global economic environment, some of our end customers are located in emerging countries that are currently undergoing sweeping political changes. We believe that the aggregation of these conditions has resulted in the current suppression of end-market demand for many of the products that we sell and services that we provide.
1
Although it is uncertain how long the current adverse global economic conditions will last, we believe that both we and our end-markets will ultimately experience long-term growth due to many factors, including the following:
|
•
|
Continued Reliance on Communications Systems
. Businesses, governments and consumers around the world have become increasingly reliant upon advanced communications systems to communicate with their customers, suppliers, and employees. In particular, there has been a significant increase in global demand for products and services that are utilized for wireless and cellular-based communications, broadcasting (including high definition television (“HDTV”) for cable and over-the-air broadcast), Internet Protocol (“IP”)-based communications (including voice, broadband video and data), long distance telephony and highly secure defense applications. Because of the continued reliance on communications systems and increased utilization of satellite transponders, communications network providers have been forced to increase their investments in new and updated satellite-based transmission systems in order to maintain the quality and availability of their services.
|
|
•
|
Growing Demand for Increased Cost Efficiencies.
We expect that the insatiable global demand for voice, broadband video and data communications will cause increased satellite transponder utilization that will, over time, result in increased transponder costs in many areas of the world. Particularly in light of current adverse global economic conditions, we believe that communications network providers and end-users will seek solutions that increase the efficiency of their networks in order to reduce operating costs. In light of the relatively high cost of satellite transmission versus other transmission channels, we believe that communications network providers will make their vendor selections based upon the operating efficiency and quality of the products and solutions they offer.
|
|
•
|
The Shift to Information-Based, Network-Centric Warfare.
Militaries around the world, including the United States (“U.S.”) military, have become increasingly reliant on information and communications technology to provide critical advantages in battlefield, support and logistics operations. Situational awareness, defined as knowledge of the location and strength of friendly and unfriendly forces during battle, can increase the likelihood of success during a conflict. As evidenced by the conflicts in Iraq and Afghanistan, stretched battle and supply lines have used satellite-based (including mobile satellite-based) and over-the-horizon microwave communications solutions to span distances that normal radio communications, such as terrestrial-based systems, are unable to cover.
|
|
•
|
The Need for Developing Countries to Upgrade Their Commercial and Defense Communication Systems.
We believe many developing countries will be required to further develop and upgrade their commercial and defense communications systems. Many of these countries lack the financial resources to install extensive land-based networks, particularly where they have large geographic areas or unfriendly terrain that make the installation of land-based networks more costly. We believe satellite-based and over-the-horizon microwave technologies often provide affordable and effective solutions to meet the requirements for communications services in these countries.
|
Although the health of the global economy and political stability directly impacts the speed at which industry advances and changes, we expect that we will be able to participate in the industry’s expected long-term growth by focusing research and development resources across all three of our business segments to produce secure, scalable and reliable technologies to meet these evolving market needs.
Corporate Strategies
We manage our business with the following principal corporate business strategies:
|
•
|
Seek leadership positions in markets where we can provide specialized products and services;
|
|
•
|
Identify and participate in emerging technologies that enhance or expand our product portfolio;
|
|
•
|
Operate business segments flexibly to maximize responsiveness to our customers;
|
|
•
|
Strengthen our diversified and balanced customer base; and
|
|
•
|
Pursue acquisiti
ons of businesses and technologies.
|
We believe that, as a result of these business strategies, we are well positioned to continue to capitalize on growth opportunities in the global commercial and government communications markets.
2
Competitive Strengths
The successful execution of our principal corporate strategies is based on our competitive strengths, which are briefly described below:
Leadership Positions in All Three Business Segments –
In our telecommunications transmission segment, we believe we are the leading provider of single channel per carrier (“SCPC”) satellite earth station modems and over-the-horizon microwave systems. Many of our products incorporate Turbo Product Code (“TPC”) forward error correction technology and our licensed DoubleTalk
®
Carrier-in-Carrier
®
bandwidth compression technology which enable our customers to optimize their satellite network by either reducing their satellite transponder lease costs or increasing data throughput. In our RF microwave amplifiers segment, we believe we are a leader in the satellite earth station traveling wave tube amplifier market and one of the largest independent suppliers of broadband, high-power, high-performance RF microwave amplifiers. In our mobile data communications segment, we are a key legacy supplier to the U.S. Army’s war-fighter orientated satellite-based, tracking and communications system known as Blue-Force Tracking-1 (“BFT-1”).
Innovative Leader with Emphasis on Research and Development –
We have established a leading technology position in our fields through internal and customer-funded research and development activities. We believe we were the first company to begin full-scale deployment of TPC forward error correction technology and licensed DoubleTalk
®
Carrier-in-Carrier
®
bandwidth compression technology in digital satellite earth station modems. Our field-proven over-the-horizon microwave systems utilize a proprietary 16 megabits per second (“Mbps”) adaptive digital modem and we have developed a troposcatter modem that can exceed 22 Mbps. In our RF microwave amplifiers segment, we are incorporating Gallium Nitride technology into our products which allows us to offer customers more powerful and higher efficiency RF microwave amplifiers. In addition, our traveling wave tube amplifiers have built-in block up converters (“BUCs”) that significantly reduce operating costs for domestic and international broadcasters. In our mobile data communications segment, we believe that our internally developed BFT-1 technologies are critical components of the U.S. Army’s satellite communications network.
Diverse Customer Base with Long-Standing Relationships –
We have established long-standing relationships with leading domestic and international system and network suppliers in the satellite, defense, broadcast and aerospace industries, as well as the U.S. government and foreign governments. Our products are in service around the globe and we continue to expand our geographic distribution. For instance, our satellite earth station products and our high-power amplifiers are used by hundreds of mobile cellular network providers and governments around the world. We believe that our customers recognize our ability to develop new technologies and to meet stringent program requirements. In recent years, we have expanded our relationships with several agencies of the U.S. government. For instance, our high-power amplifiers will be used in a major network expansion for the U.S. Air Force.
Core Manufacturing Expertise That Can Support All Three Business Segments –
Our high-volume technology manufacturing center located in Tempe, Arizona utilizes state-of-the-art design and production techniques, including analog, digital and RF microwave production, hardware assembly and full-service engineering. All three of our business segments have utilized this manufacturing center for certain high-volume production which allows us to secure volume discounts on key components, control the quality of our manufacturing processes and maximize the utilization of our manufacturing capacity. Because of our expert capability and quality reputation, several prime contractors to the U.S. government have outsourced a portion of their manufacturing to us. Although revenue from outsourced manufacturing has historically been modest, we are actively seeking appropriate opportunities to expand this part of our business.
Successful and Disciplined Acquisition Track Record –
We have demonstrated that we can successfully integrate acquired businesses, achieve increased efficiencies and capitalize on market and technological synergies. We believe that our disciplined approach in identifying, integrating and capitalizing on acquisitions provides us with a proven platform for additional growth. The Radyne acquisition that we completed in fiscal 2009 was the largest acquisition in our history and we achieved all of the strategic goals and operating efficiency targets that we originally established when we announced the acquisition.
3
Our Three Business Segments
We conduct our business through three complementary business segments: telecommunications transmission, RF microwave amplifiers and mobile data communications. By operating independently, our business segments are able to maintain a high level of focus on their respective businesses, activities and customers. Our corporate senior management team supports the business segments by, among other things, actively seeking to exploit synergies that exist between the segments, including areas such as manufacturing, technology, sales, marketing and customer support. Financial information about our business segments is provided in
“Notes to Consolidated Financial Statements – Note (13) Segment Information”
included in
“Part II — Item 8. — Financial Statements and Supplementary Data.”
Telecommunications Transmission Segment
Overview
Our telecommunications transmission segment provides equipment and systems that are used to enhance satellite transmission efficiency and that enable wireless communications in environments where terrestrial communications are unavailable, inefficient or too expensive. These products and systems are used in a wide variety of commercial and government applications including the backhaul of wireless and cellular traffic, broadcasting (including HDTV), IP-based communications traffic, long distance telephony and highly secure defense applications.
Products, Services and Applications
The following are the key products and systems, along with related markets and applications, for our telecommunications transmission segment:
Satellite Earth Station Equipment and Systems
– We provide customers a one-stop shopping approach by offering a broad range of satellite earth station equipment. Our product offerings include satellite earth station modems, BUCs, power amplifiers, frequency converters, transceivers, access devices, voice gateways, IP encapsulators and media routers. We market our products under a variety of brand names including Comtech EF Data, Radyne, Vipersat, Memotec, AHA, Verso and Stampede. Our satellite earth station modems and products include:
|
•
|
CDM-600
– One of our all-time best selling modems, the CDM-600 includes an option that allows end-users to incorporate our patented TPC, a forward error correction technology which can significantly reduce satellite transponder lease costs or increase satellite earth station modem data throughput. The CDM-600 provides connectivity up to 20 Mbps.
|
|
•
|
CDM-625
– The CDM-625 was our first modem to combine advanced forward error correction (“FEC”), such as VersaFEC
®
and low density parity check (“LDPC”) codes with DoubleTalk
®
Carrier-in-Carrier
®
bandwidth compression, a technique that allows satellite earth stations to transmit and receive at the same frequency, effectively reducing transponder bandwidth requirements by 50%. The packet processor enables efficient IP networking and transport over satellite by adding routing capability with very low overhead encapsulation, header compression, payload compression and Quality of Service ("QoS") to the CDM-625. The advanced QoS combined with header and payload compression ensures the highest quality of service with minimal jitter and latency for real-time traffic, priority treatment of mission critical applications and maximum bandwidth efficiency. The CDM-625 is marketed to users who require connectivity up to 25 Mbps and we continue to add new features to meet customer needs.
|
|
•
|
CDM-750 Advanced High-Speed Trunking Modem –
The CDM-750, which received the 2011 Next Generation Networks (“NGN”) Magazine Leadership award, accommodates the most demanding Internet Service Provider (“ISP”) and telecommunications backhaul links by offering users an advanced combination of space segment saving capabilities while minimizing the need for unnecessary overhead.
|
|
•
|
Advanced Very Small Aperture Terminal ("VSAT") Series of Products
– Launched in March 2010, this growing product suite includes our CDM-800 Gateway Router, CDM-840 Remote Router, the CDD-880 Multi-Receiver Router, the CXU-810 RAN Optimizer and our Stampede FX series and is ideally suited for cellular backhaul, universal service obligation networks and other applications which require high performance in a hub-spoke environment. These products incorporate Radio Access Network Optimization and other advanced FEC and modulation techniques. Our Stampede FX series includes WAN optimization that uses content reduction techniques and acceleration techniques that can significantly reduce access time to data.
|
4
|
•
|
DMD20
– Because it has been designed to minimize configuration changes, the DMD20 modem can be used by virtually our entire global customer base. The DMD20 is compatible with our CDM-600 and, with an optional communication link, allows network operators to monitor and control their BUCs. The DMD now offers DoubleTalk
®
Carrier-in-Carrier
®
bandwidth compression.
|
|
•
|
SLM-5650A
– Fully compliant with key U.S. military standards, our SLM-5650A can transmit data up to 155 Mbps and can also be integrated with our Vipersat Management System ("VMS") to provide fully automated network and capacity management. An AES-256 TRANSEC module, compliant with the FIPS-140-2 NIST standard is also available as an option. All traffic (including overhead and all VMS control traffic) is encrypted when using the TRANSEC module.
|
|
•
|
DMD2050E
– Designed for the U.S. Department of Defense ("DoD") and compliant with a wide range of U.S. government and commercial standards, this modem also offers DoubleTalk
®
Carrier-in-Carrier
®
bandwidth compression, which can reduce the DoD's transponder bandwidth requirements by 50%.
|
|
•
|
CDM-570
– An entry level modem that provides performance and flexibility at a lower price point; it is marketed to users who require connectivity up to 5 Mbps.
|
Many of our satellite earth station modems are available with customer selectable features including LDPC, DoubleTalk
®
Carrier-in-Carrier
®
, VersaFEC
®
and optional IP modules which can provide advanced features and bandwidth efficiencies. Our satellite earth station equipment and systems also include frequency conversion and amplifier solutions for indoor and outdoor environments. Our products are deployed globally by commercial and government users, supporting a variety of fixed and mobile/transportable applications. We offer new Low Power Outdoor (“LPOD”) and High Power Outdoor (“HPOD”) amplifiers which feature a versatile chassis, field replaceable supplies and phase combining for higher power.
Our global commercial and government customers are increasingly looking for integrated solutions to meet their operational needs. In recent years we have expanded our product offerings. We offer our customers pre-integrated network management systems which allow them to locally or remotely manage our Advanced VSAT series of network products using a single graphical user interface and which incorporates industry-leading optimization. For instance, in fiscal 2012, we were awarded a contract to deploy our Advanced VSAT solution to Harris CapRock Communications in five of their operational hubs and onboard its maritime customer's vessels. We also offer customers our Vipersat and SkyWire™ managed bandwidth products.
Over-the-Horizon Microwave Equipment and Systems
– We design, develop, produce and market over-the-horizon microwave (also known as troposcatter) communications equipment and systems that can readily transmit digitized voice, video and data over unfriendly or inaccessible terrain from 20 to 200 miles by reflecting transmitted signals off of the troposphere, an atmospheric layer located approximately seven miles above the earth’s surface. Over-the-horizon microwave communication is a cost-effective, secure alternative to satellite communication as it does not require the leasing of expensive satellite transponder space with its attendant recurring costs. Traditional end-users of our equipment have included the U.S. government and foreign governments and militaries who use our over-the-horizon microwave systems to, among other things, transmit radar tracking, Command, Control, Communications, Computers, Intelligence, Surveillance and Reconnaissance information (also known as “C4ISR”) and air defense information as well as connecting remote border locations. Additionally, energy companies use our systems to enable communication links for offshore oil rigs and other remote locations as well as exploration activities. Over the past several years, we have introduced the following digital troposcatter modems:
|
•
|
CS6716
– With speeds up to 16 Mbps, our CS6716 modem includes advanced features such as forward error correction technology and embedded TPC. Our digital troposcatter modem upgrade kit is based on the CS6716 and has been purchased by the U.S. military to enhance the capability of its AN/TRC-170 digital troposcatter terminals which are used to transmit C4ISR information.
|
|
•
|
CS6716A
– A more advanced 22 Mbps version of the CS6716, incorporating most of the capabilities of the CS67200 modem with the addition of backward compatibility to existing U.S. military troposcatter assets.
|
|
•
|
CS67200i
– Our 22 Mbps digital troposcatter modem is a state-of-the-art modem whose performance, we believe, exceeds any digital troposcatter modem on the market. It is IP-ready and supports Voice over Internet Protocol ("VoIP"), data and video transmission. Under certain conditions, because it has built-in redundancy, it can be configured to reach transmission capacities of up to 40 Mbps. This modem offers a more compact design, lighter weight and 70% less power consumption than our earlier S575 modem. Additionally, its powerful forward error correction capabilities enhance efficiency and its built in transmit power control system monitors and maintains the power of a troposcatter terminal to reduce the possibility of interception and interference.
|
5
Recently, we introduced our Modular Tactical Transmission System ("MTTS"), a high capacity, beyond line of sight modular communications system designed for easy and rapid deployment. The MTTS solution delivers high-throughput capacity to enable mission-critical surveillance, situational awareness and real-time data to remote, infrastructure-challenged locations. Our MTTS allows direct transmission between sites, eliminates recurring costs, and reduces the complexity and delay in satellite communications currently used today. The MTTS solution enhances communications capabilities with seamless compatibility and interoperability with legacy-fielded troposcatter systems used currently by the U.S. military, including the AN/TRC-170. MTTS, the first truly modular, rapidly deployable, transit case-based troposcatter system, represents a major advancement in rapidly deployable troposcatter systems. The MTTS cases are designed to be used in line-of-sight ("LOS"), beyond-line-of-sight ("BLOS") dual diversity, and full over-the-horizon microwave quad diversity applications. The U.S. Army has recently deployed Secret Internet Protocol Router and Non-secure Internet Protocol Router Access Point ("SNAP") Tactical Transportable TROPO ("3T") and deployable communication equipment that incorporates our MTTS systems.
Our telecommunications transmission segment operates our high-volume technology manufacturing center located in Tempe, Arizona which has been utilized by all three of our business segments and, to a much lesser extent, by third-party commercial customers, including prime contractors to the U.S. government, who have outsourced a portion of their manufacturing to us. This allows us to secure volume discounts on key components, better control the quality of our manufacturing process and maximize the utilization of our manufacturing capacity. Accordingly, our telecommunications transmission segment’s operating results are impacted positively or negatively by the level of utilization of our high-volume technology manufacturing center. Our telecommunications transmission segment also markets data compression integrated circuits based, in part, on our forward error correction technology.
Business Strategies
Our telecommunications transmission segment business strategies are as follows:
Expand Leadership Position in Satellite Earth Station Market –
Our satellite earth station modems, which incorporate leading technologies and standards such as TPC, LDPC, Digital Video Broadcasting Standard 2 (“DVB-S2”) and DoubleTalk
®
Carrier-in-Carrier
®
bandwidth compression and Adaptive Coding and Modulation (“ACM”) have established us as a leading provider to domestic and international commercial satellite systems and network customers, as well as U.S. and foreign governments. A majority of our satellite earth station products have historically been deployed by our customers for use with applications that require a SCPC transmission mode which, in non-technical terms, refers to using satellite bandwidth in a dedicated manner. Because information is being transmitted continuously, the backhauling of wireless and cellular traffic and the broadcasting of HDTV and satellite radio are ideal applications for SCPC-based transmission. Our bandwidth compression technologies allow customers to reduce recurring satellite transponder costs. Thus, we are increasingly developing products to compress and optimize IP-based traffic to provide increased value to our customers and facilitate ongoing and incremental demand for our products. We continue to share forward error correction and licensed technology across all of our branded product lines, and over time, we expect our individual brands to become less distinguishable from each other. We are continuing to market integrated product offerings that include access devices and voice gateways which allow our customers to consolidate multi-service network traffic such as voice, video and data. When combined with our satellite earth station modems, the solution is ideal for backhauling cellular traffic using satellites, which can significantly reduce bandwidth requirements. We expect to continue expanding our leadership position by offering new products and integrated solutions to meet the expected increased demand from commercial, government and defense customers.
Participate in the Anticipated Growth of Wireless and Cellular Backhaul Applications
– Our satellite earth station equipment enables mobile cellular network providers to cost-effectively backhaul wireless and cellular traffic from main cities to more remote cities via satellite. We believe that demand for our satellite earth station equipment will continue to grow for many years because of the important role it plays in facilitating increasing wireless and mobile phone usage, particularly in developing areas of the world such as China, Russia, Latin America, the Middle East and Africa, where fiber or terrestrial-based systems are generally more expensive to deploy. Our marketing in this area focuses on our modems which incorporate DoubleTalk
®
Carrier-in-Carrier
®
bandwidth compression.
Continue our Marketing and Sales Efforts to the U.S. Government –
Although the U.S. government budget is under extreme spending pressures, we believe that long-term demand by the U.S. government for our equipment will be strong due to a number of factors, including the ever increasing amount of C4ISR information that is being generated. For instance, in fiscal 2012, we were awarded a $1.8 million contract by the U.S. military for our DMD2050 MIL-STD-188-165A modem, our first order with the U.S. government that includes our DoubleTalk
®
Carrier-in-Carrier
®
bandwidth compression technology. The DoubleTalk
®
Carrier-in-Carrier
®
technology allows transmit and receive carriers of a duplex link to share the same transponder space, which can reduce bandwidth utilization by 50%. The modems purchased on this contract will be utilized in deployable terminals to support a satellite-based network expansion for battlefield communications.
6
Capitalize on Increased Demand for Over-the-Horizon Microwave Systems and Upgrades –
We have designed, manufactured and sold over-the-horizon microwave products and systems for approximately forty years and believe we are the leading supplier in this specialized product line. Over-the-horizon microwave systems are sometimes referred to as troposcatter systems and are extremely reliable and secure when compared to satellite-based systems. These products have an extremely long sales cycle due to the complexity of the overall network that they must operate with. Our over-the-horizon microwave systems, which include our patented TPC forward error correction technology, are able to transmit video and other broadband applications at throughput speeds in excess of 20 Mbps (and when deployed in dual-mode, can reach speeds in excess of 40 Mbps). In connection with these large troposcatter system deployments, we offer related equipment and systems to our customers for their network needs. To date, the largest single end-customer for our over-the-horizon microwave systems has been a North African country. In fiscal 2012, we were awarded a $55.0 million contract to design and furnish a telecommunications system for use in this country's communications network and we expect to record related revenue over the next three years. We believe that, over time, we will be able to obtain additional large contracts to support the U.S. and other militaries. In the past few years, the DoD purchased our 16 Mbps adaptive digital modem upgrade kits to be used on a portion of the DoD’s inventory of AN/TRC-170 digital troposcatter terminals. We recently entered into a teaming agreement with TeleCommunication Systems, Inc. to offer the U.S. military a troposcatter system in a transportable flyaway configuration (known as "SNAP-3T") which is capable of providing seamless compatibility and interoperability with legacy-fielded over-the-horizon microwave systems. To date, we have shipped forty-eight of our MTTS systems for deployment by the U.S. Army in its SNAP-3T communication equipment. As a result of our historical successes in North Africa and with the U.S. DoD in Iraq and Afghanistan, other foreign countries and militaries have shown interest in our over-the-horizon microwave systems technology and we believe the overall market for these products and systems is expanding.
Continue to Develop, License or Acquire Technology for Efficient Bandwidth Utilization –
Because we expect long-term demand for satellite bandwidth to increase, we intend to develop, license or acquire technology (including complementary products) to provide affordable bandwidth solutions for our customers. Specifically, we expect to develop next-generation advances of our forward error correction technology and believe this will have important utility in responding to the increasing demand for satellite bandwidth utilization, particularly by the U.S. military, security and intelligence agencies. We intend to continue to enhance our Internet, TDMA and SCPC-based software and products which enable customers to utilize bandwidth management techniques to facilitate, among others, applications such as video teleconferencing, distance learning, telemedicine and Internet content delivery. We have incorporated our licensed DoubleTalk
®
Carrier-in-Carrier
®
technology into many of our products and are combining it with other technologies such as VersaFEC
®
, a next-generation forward error correction technology. In recent years, we have expanded our satellite earth station product offerings and began selling IP encapsulators and media routers, that, when combined with our bandwidth efficient satellite earth station modems, can reduce operating expenses for service providers delivering IP-based broadcast connectivity. We also expect to continue to offer NetPerformer products which combine the functionality of voice gateway and data routers and provide data compression over a single wide area network, thereby enabling our customers to potentially bypass toll costs on public networks. Through our distribution channel, we also continue to market Skywire™ products that combine SCPC-based systems with TDMA-like bandwidth efficiency.
RF Microwave Amplifiers Segment
Overview
We believe we are one of the leading companies designing, developing, manufacturing and marketing satellite earth station traveling wave tube amplifiers (“TWTA”) and solid-state, high-power, narrow and broadband amplifiers (“SSPA”). All of our amplifiers reproduce signals with high power and are extremely complex and critical to the performance of the systems into which they are incorporated.
Our TWTA and narrow-band SSPA products can boost the strength of a signal prior to transmission to satellites, which are often more than 22,000 miles from the surface of the earth. Our broadband SSPA products can efficiently increase the power of broadband radio frequency signals with high degrees of clarity to provide for effective jamming and communication power capability required by sophisticated defense programs including those used to counter remote controlled improvised explosive devices.
We sell our amplifiers to domestic and foreign commercial and government users and market our products under a variety of brand names including Comtech XICOM Technology, Comtech PST and Hill Engineering.
7
Products, Services and Applications
Our RF microwave amplifiers are generally built-to-order and are used in the following markets and applications:
Broadcast and Broadband Satellite Communication Applications –
We offer our customers TWTA products for use in a variety of telecommunications applications used to transmit and amplify signals from satellite earth stations throughout the world. Our amplifiers can provide power levels that are vital to satellite communication applications including traditional broadcast, direct-to-home broadcast, satellite newsgathering and the broadband communications markets, specifically in the emerging High Throughput Satellite systems. Through programs such as the Light Multi-Band Satellite Terminal and Ground Multi-Band Terminal, our amplifiers support high capacity U.S. military satellite systems such as the Wideband Global Satellite Constellation. Our narrow-band SSPA products are a key component in communications systems used to support U.S. special operations forces around the world.
Electronic Warfare and Other Defense Applications –
U.S. and foreign military customers use our amplifiers in a variety of telecommunications systems (such as transmitting and boosting signals) and electronic warfare systems (such as simulation, communications, radar, jamming and in identification friend or foe (“IFF”) systems). The U.S. military also uses our amplifiers in systems designed to help protect U.S. troops from radio-controlled roadside bombs. We have delivered thousands of amplifiers and switches in support of the Counter Remote Controlled Improvised Explosive Device Electronic Warfare (“CREW”) Program as well as low rate production and engineering development model amplifiers and switches for the CREW 3.2 and 3.3 programs, respectively. Our amplifiers are also used in the U.S. military's Communications Electronic Attack with Surveillance and Reconnaissance ("CEASAR") system. CEASAR is a pod-mounted electronic attack system which provides U.S. troops with a "jammer-on-demand" capability. Our TWTA and SSPA amplifiers are used by military customers throughout the world for mobile applications, including those on helicopters and ships and in support of U.S. Special Forces. We believe that the recent focus on mobile and special operations by the U.S. military and heightened homeland security concerns should result in continuing demand for our amplifier products.
Sophisticated Commercial Applications –
Our amplifiers are key components in sophisticated commercial applications. For example, our amplifiers are used in oncology treatment systems that allow doctors to give patients, who are suffering from cancer, higher doses of radiation while focusing more closely on the tumors, thereby avoiding damage to healthy tissue. In addition, our amplifiers are used to amplify signals carrying voice, video or data for air-to-satellite-to-ground communications. For example, our amplifiers, when incorporated into an aircraft satellite communication system, can provide passengers with email, Internet access and video conferencing.
Business Strategies
We manage our RF microwave amplifiers segment with the following principal strategies:
Continue to Develop a One-Stop Shopping Approach for RF Microwave Amplifiers
– In recent years, we have expanded our product line of RF microwave amplifiers to include both TWTA and SSPA technologies, and today we are one of only a few companies to offer both technologies. We intend to continue this effort and over time, we believe that we can offer customers a one-stop shopping approach by offering a broad range of RF microwave amplifier equipment for use in commercial and government applications. This strategy will include maintaining our internal research and development activities as well as pursuing customer funded research and development to fuel new product development. We expect this emphasis on research and development to enable us to enhance our existing product lines, develop new capabilities and solidify and strengthen our position in our principal markets. In order to fully develop a global one-stop shop approach, we may also seek to expand our product line through acquisitions.
Continue to Penetrate the Market for Outsourced Amplifier Production –
Because solid-state, high-power, broadband amplifiers are important to the performance and quality of the larger systems into which they are incorporated, many large systems companies have historically preferred to manufacture these amplifiers in-house. We believe that our focus on and expertise in designing and manufacturing solid-state, high-power, broadband amplifiers, as well as our high-volume manufacturing capability, often makes us a cost-effective and technologically superior alternative to such in-house manufacturing. Some of the companies who have outsourced amplifier production to us include Rockwell Collins, Inc., Thales Group, European Aeronautic Defense and Space Company (“EADS”), Telephonics Corporation, Northrop Grumman Corporation, BAE Systems PLC, Exelis Inc. (formerly part of ITT Corporation) and Raytheon Company.
8
Secure Additional Business Related to Next Generation CREW Programs –
In the past few years, a significant portion of our sales in our RF microwave amplifiers segment had come from our participation in the CREW 2.1 program. The CREW 2.1 program uses our broadband, solid-state high-power radio signal jamming amplifiers and switches in systems to help protect U.S. troops from the ever-evolving threat of radio-controlled roadside bombs. We expect to ship the remaining CREW 2.1 backlog we had as of July 31, 2012 in early fiscal 2013.
Although the U.S. government budget remains under significant pressure and the U.S. government has initiated and continues to plan on troop withdrawals from Iraq and Afghanistan, we believe the remaining troops, as well as troops deployed in other areas in the future, will ultimately require upgraded systems that will need to be purchased. We expect that the CREW 3.3 program will be the program of choice to address the ongoing threat of improvised explosive devices. We have delivered on design and development contracts from a prime contractor to the U.S. military in support of the CREW 3.3 program and have been selected as the sole source and/or primary amplifier supplier for a variety of different CREW 3.3 amplifier configurations. Although we initially believed CREW 3.3 production would commence in fiscal 2013, for reasons unrelated to our product offerings, we now expect CREW 3.3 sales to begin to ramp up in fiscal 2014.
Continue our Marketing and Sales Efforts in the Defense Market –
In addition to the CREW program, we believe there are a number of other long-term opportunities in the defense markets, particularly electronic warfare applications, and that we can increase our share of this market through partnering arrangements with prime contractors. For instance, in fiscal 2011, we received a multi-year award to provide certain of our high-power satellite amplifiers which will be used in a major network expansion for the U.S. Air Force. We believe this award represents a testament to the quality and high reliability of our amplifiers and we intend to seek additional sales in the market.
Continue to Expand our Presence in the Mobile Military Satellite Communications Market
– Over the last decade, the military satellite communications (“Milsatcom”) market for mobile systems has increased significantly. While programs we've historically participated in , such as the Lightweight Multi-Band Satellite Terminal (used by the U.S. Air Force, Army and Marines) and Ground Multi-Band Terminal (used by the U.S. Air Force), have now been largely completed, we expect to continue our strong presence in the mobile military communications market by participating in new programs such as the U.S. Army's Warfighter Information Network-Tactical Program ("WIN-T") and the Family of Terminals program (used by the U.S. Special Operations Command ("SOCOM")). We intend to increase our focus on these types of programs and believe that we can increase our penetration into both mobile ground and airborne Milsatcom markets.
Mobile Data Communications Segment
Overview
Our mobile data communications segment provides government and commercial customers with integrated solutions to enable global satellite-based communications when mobile, real-time, secure transmission is required.
The vast majority of sales in this segment have historically come from sales relating to two U.S. military programs known as the U.S. Army’s Movement Tracking System (“MTS”) program and the Force XXI Battle Command, Brigade and Below (“FBCB2”) command and control system's Blue Force Tracking (“BFT-1”) program. Our combined MTS and BFT-1 sales for fiscal 2010 through 2012 were as follows:
|
|
Net
Sales
(in millions)
|
Percentage of
Mobile Data
Communications
Segment Net Sales
|
Percentage of
Consolidated
Net Sales
|
|||||||
|
2012
|
$
|
87.8
|
|
78.0
|
%
|
20.6
|
%
|
|||
|
2011
|
248.6
|
|
86.2
|
%
|
40.6
|
%
|
||||
|
2010
|
423.2
|
|
94.8
|
%
|
54.4
|
%
|
||||
We have supplied mobile satellite transceivers, vehicle and command center application software, third-party produced ruggedized computers and satellite earth station network gateways and associated installation, training and maintenance to the MTS program which now operates under the auspices of the BFT-1 program under the direction of the FBCB2-BFT program office. Our MTS-related services also included the monitoring of satellite packet data networks.
9
In July 2010, a third party vendor was selected by the U.S. Army to develop a next generation BFT program known as BFT-2. The U.S. Army has stated that it expects to transition to BFT-2 as quickly as possible. We expect that future MTS and BFT-1 orders and related sales will largely be dependent on the ability and speed of the U.S. Army to transition to the BFT-2 system.
Products, Services and Applications
Our mobile data satellite transceivers and related proprietary technology have been installed on a variety of U.S. military vehicles (both logistics-centric and war-fighter-centric) including: Abrams tanks, Bradley Fighting Vehicles, helicopters such as the Apache, Black Hawk and Chinook and High Mobility Multipurpose Wheeled Vehicles (“HMMWV”). When equipped with this technology, soldiers operating these vehicles are able to be continually tracked and, at the same time, are able to maintain communications with a command center as well as fellow soldiers in the field. Our extremely reliable proprietary network service employs full end-to-end path redundancy as well as back-up capability in the event of a major catastrophe or service interruption, and we can maintain and/or operate a 24 x 7 network operations and customer care center that provides customers with ongoing support any time, day and night.
Our mobile data satellite transceiver products and related proprietary technology can also be used to facilitate communications in the event that natural disasters or other situations, such as a terrorist attack, disable or limit existing terrestrial communications. In the past, the Army National Guard has purchased our mobile data communication products to better prepare for and react to disaster recovery operations at the local, state and national levels.
Our Sensor Enabled Notification System ("SENS") technology-based solutions offer customers a low-cost, spread-spectrum technology-based system which can remotely track a large number of remote assets via low earth-orbit satellites and miniaturized satellite transmitters. The information received is processed and distributed to users through an Internet Portal at
www.assetview.comtechmobile.com
. Messages can be retrieved via several methods including the Internet, email, voice or fax and can be forwarded to a user-designated site. Our SENS technology is integrated with a variety of mapping solutions and can provide our
customers with features such as geo-fencing which allows customers to track whether or not their assets or vehicles stay within pre-defined boundaries.
Our geoOps
™
Enterprise Location Management System (“geoOps
™
”) is a configurable network and web-based software platform that provides an integrated capability to command, control and manage mobile ground vehicles. Our geoOps
™
software baseline is incorporated into the North Atlantic Treaty Organization’s (“NATO”) International Security Assistance Force Tracking System (
“NATO IFTS”), a multi-national satellite-based friendly force tracking system.
BFT-1 Sustainment Activities
We are currently providing BFT-1 sustainment services pursuant to a three-year indefinite delivery/indefinite quantity (“IDIQ”) BFT-1 sustainment contract that we were awarded in March 2012. This three-year contract has a not-to-exceed value of $80.7 million and a base performance period that began April 1, 2012 and ends March 31, 2013. The contract provides for two twelve-month option periods exercisable by the U.S. Army and, except for a fixed annual intellectual property license ("IP license") fee of $10.0 million, the three-year $80.7 million contract value is subject to finalization and downward negotiation. Effective July 1, 2012, we are no longer procuring satellite bandwidth for the U.S. Army.
Under the terms of the BFT-1 sustainment contract, we agreed to perform certain satellite network and related engineering services (including program management) on a cost-plus-fixed-fee basis. In addition, the contract allows the U.S. Army to purchase certain mobile satellite transceivers on a firm fixed-price basis. Specific terms and conditions related to the IP license are covered by a separate licensing agreement that provides for annual renewals, at the U.S. Army's option, for up to a five-year period, after which time the U.S. Army will have a limited non-exclusive right to use certain of our IP for no additional IP licensing fee. Payments of annual IP license fees beyond the base year are contingent upon the U.S. Army's exercise of optional performance periods.
In connection with the initial three-year $80.7 million IDIQ BFT-1 sustainment contract award, we received a funded order for the initial base year of $17.0 million, of which $10.0 million was designated for payment of the first year IP license fee and $7.0 million was designated for engineering services, program management and satellite network operations. Pricing for the engineering services, program management and satellite network operations has not yet been finalized and it is possible that we can receive incremental funding of up to $8.6 million upon finalization.
10
Our BFT-1 sustainment contract can be terminated by the government at any time and is not subject to automatic renewal. Except for orders received to date, the U.S. Army is not obligated to purchase any additional equipment or services under this IDIQ contract. We believe that any future MTS and BFT-1 orders and related sales will largely be dependent on the ability and speed of the U.S. Army to transition to the BFT-2 system and we expect future annual sales (and related operating income) from both of these programs to materially decline from current levels.
Business Strategies
Although we expect materially lower annual BFT-1 and MTS revenues in future years and have discontinued sales of our microsatellite products (which, in fiscal 2012 accounted for $17.7 million or 4.2% of consolidated net sales), we are focusing on long-term growth opportunities and will:
Work Cooperatively with the U.S. Army to Support Its Planned Transition to BFT-2 –
We believe that the reliable and effective performance of our MTS and BFT-1 solutions has demonstrated to the U.S. Army the value of our mobile, global satellite-based communications network when near real-time, secure transmissions are required. Although we do not have specific visibility into the U.S. Army’s BFT-2 transition plan, the U.S. Army has indicated to us that it may require certain sustaining network engineering related services and our intellectual property for several years. We intend to support the U.S. Army through our existing three-year BFT-1 contract.
Leverage our Current Installed Base into Other Military Commands and the Civil Government Market –
In the past, we have demonstrated that there are a number of opportunities for us to market our products and solutions to other military commands, both in the U.S. and internationally. For example, the Army National Guard has received funding in the past to purchase our products and services. Our geoOps™ software platform has also been incorporated into NATO’s IFTS, a satellite-based friendly force tracking system. We currently provide mobile tracking solutions to the U.S. Department of State and U.S. Department of Homeland Security. During fiscal 2013, we intend to invest modest amounts in resea
rch and development and sales and marketing to develop and market new solutions in a methodical way and target them to those potential customers whose needs would be well met by our technology offerings. We do not, however, expect a significant amount of sales in new markets or to new customers in fiscal
2013
.
11
Summary of Key Products, Systems and Services by Business Segment
|
Business
Segment
|
Products/Systems
and Services
|
Representative
Customers
|
End-User
Applications
|
|||
|
Telecommunications transmission
|
Satellite earth station equipment and systems including: modems, frequency converters, power amplifiers, transceivers, access devices, voice gateways and network management systems
|
Satellite systems integrators, wireless and other communication service providers, broadcasters and defense contractors as well as U.S. and foreign governments. End-customers include AT&T Inc., BT Group plc., China Mobile Limited, Embratel Participações S.A., Harris Corporation, Intelsat, Ltd., Globecomm Systems, Inc., L-3 Communications and Rockwell Collins, Inc.
|
Commercial and defense applications including the transmission of voice, video and data over the Internet, broadband, long distance telephone, broadcast (including high-definition television) and cable, distance learning and telemedicine
|
|||
|
Over-the-horizon microwave systems and adaptive modems
|
U.S. government customers, foreign governments such as Middle Eastern and North African customers and related prime contractors, systems integrators, as well as oil companies such as Shell Oil Company
|
Secure defense applications, such as transmission of U.S. military digital voice and data, modular tactical transmission systems ("MTTS") which have been incorporated into the U.S military's SNAP communication equipment, and commercial applications such as the transmission of IP-based communications to and from oil platforms
|
||||
|
RF microwave amplifiers
|
Traveling wave tube amplifiers and solid-state amplifiers
|
Domestic and international defense customers, prime contractors and system suppliers such as L-3 Communications, Harris Corporation, General Dynamics Corporation, ViaSat Inc. and satellite broadcasters such as The DIRECTV Group and EchoStar Corporation
|
Satellite broadcast and broadband satellite communications and defense applications
|
|||
|
|
Solid-state, high-power, broadband RF microwave amplifiers
|
Domestic and international defense customers, prime contractors and system suppliers such as Raytheon Company, Exelis Inc., EADS and Thales Group, medical equipment companies such as Varian Medical Systems, Inc., and aviation industry system integrators such as Rockwell Collins, Inc.
|
Defense applications including communications, radar, jamming and IFF and commercial applications such as medical applications (oncology treatment systems) and satellite communications (including air-to-satellite-to-ground communications)
|
|||
|
Mobile data communications
|
Mobile satellite transceivers, satellite network services, installation, training and maintenance and SENS technology-based products
|
U.S. Army logistics community, the U.S. Army war-fighter community, foreign governments, and prime contractors to the U.S. Armed Forces, NATO and commercial customers
|
Two-way satellite-based mobile tracking, messaging services (U.S. Army’s MTS), battlefield command and control applications (BFT-1) and RFID applications
|
|||
12
Acquisitions
We have made acquisitions of businesses and enabling technologies over the past several years and have followed a disciplined approach in identifying, executing and capitalizing on these acquisitions.
On August 1, 2008 (the beginning of our fiscal 2009), we acquired Radyne, the largest acquisition in our history which we believe strengthened our leadership position in our satellite earth station product lines in our telecommunications transmission segment, more than doubled the size of our RF microwave amplifiers segment and further diversified our overall global customer base and expanded our addressable markets.
None of our other recent tactical and product line acquisitions, either individually, or in the aggregate, were material to our results of operations and the effects of those acquisitions, either individually, or in the aggregate, were not material to our historical consolidated financial statements.
Sales, Marketing and Customer Support
Sales and marketing strategies vary with particular markets served and include direct sales through sales, marketing and engineering personnel and indirect sales through independent representatives, value-added resellers or a combination of the foregoing. We devote time to evaluating and responding to requests for proposals by governmental agencies around the world, and as needed, we employ the use of specialized consultants to develop our proposals and bids.
We intend to continue to expand international marketing efforts by engaging additional independent sales representatives, distributors and value-added resellers and by establishing additional foreign sales offices.
Our management, technical and marketing personnel establish and maintain relationships with customers. Our strategy includes a commitment to provide ongoing customer support for our systems and equipment. This support involves providing direct access to engineering staff or trained technical representatives to resolve technical or operational issues. As appropriate and as guided by corporate senior management, our three business segments capitalize on manufacturing, technology, sales, marketing and customer support synergies between them.
Our over-the-horizon microwave systems, amplifier product lines, satellite earth station products and mobile data communications products and services that use relatively new technology have long sales cycles. Once a product is designed into a system, customers may be reluctant to change the incumbent supplier due to the extensive qualification process and potential redesign required in using alternative sources. Accordingly, management is actively involved in key aspects of relations with our major customers.
Sales by geography and customer type, as a percentage of consolidated net sales, are as follows:
|
|
Fiscal Years Ended July 31,
|
||||||||
|
|
2012
|
2011
|
2010
|
||||||
|
United States
|
|
|
|
||||||
|
U.S. government
|
48.9
|
%
|
61.7
|
%
|
71.1
|
%
|
|||
|
Commercial customers
|
12.4
|
%
|
8.1
|
%
|
6.0
|
%
|
|||
|
Total United States
|
61.3
|
%
|
69.8
|
%
|
77.1
|
%
|
|||
|
International
|
38.7
|
%
|
30.2
|
%
|
22.9
|
%
|
|||
Sales to U.S. government customers include sales to the DoD
and intelligence and civilian agencies, as well as sales directly to or through prime contractors. International sales for fiscal
2012
,
2011
and
2010
, which include sales to U.S. domestic companies for inclusion in products that will be sold to international customers, were
$164.5 million
,
$184.8 million
and
$178.5 million
, respectively. When we sell internationally, we primarily price our contracts in U.S. dollars. Some of our exports are paid for by letters of credit, with the balance carried either on an open account or on an installment note basis. Significant international contracts generally require us to provide performance guarantees. For fiscal
2012
,
2011
and
2010
, except for sales to the U.S. government which include sales to prime contractors of the U.S. government, no other customer or individual country, including sales to U.S. domestic companies for inclusion in products that will be sold to a foreign country, represented more than 10% of consolidated net sales.
13
Backlog
Our backlog a
s of
July 31, 2012
and
2011
was
$153.9 million
and
$145.0 million
, respectively. Included in these amounts, as of
July 31, 2012
and
2011
, is approximately
$16.6 million
and
$38.9 million
, respectively, related to our BFT-1 sustainment activities. We expect that a majority of the backlog as of
July 31, 2012
will be recognized as sales during fiscal
2013
.
At
July 31, 2012
,
36.2%
of the backlog consisted of U.S. government contracts, subcontracts and government funded programs,
53.0%
consisted of orders for use by international customers (including sales to U.S. companies for inclusion in products that will be sold to international customers) and
10.8%
consisted of orders for use by U.S. commercial customers.
Our backlog consists solely of orders that we believe to be firm; however, almost all of the contracts in our backlog are subject to cancellation at the convenience of the customer or for default in the event that we are unable to perform under the contract. Backlog that is derived from U.S. government orders relates to U.S. government contracts that have been awarded, signed and funded. Backlog for our U.S. government customers includes amounts appropriated by Congress and allotted to the contract by the procuring government agency. Our backlog does not include the value of options that may be exercised in the future on multi-year contracts, nor does it include the value of additional purchase orders that we may receive under IDIQ contracts or basic ordering agreements.
In fiscal
2012
, 86.2% of our consolidated U.S. government net sales were derived from firm fixed-price contracts. Under these types of contracts, we perform for an agreed-upon price and we can derive benefits from cost savings, but bear the risk of cost overruns. Our cost-plus-fixed-fee contracts, which to date have not been a significant percentage of our consolidated net sales, typically provide for reimbursement of allowable costs incurred plus a negotiated fee.
Variations in backlog from time to time are attributable, in part, to changes in product mix, the timing of contract proposals, and the timing of contract awards and delivery schedules on specific contracts. Our satellite earth station equipment and our traveling wave tube amplifier product lines operate under short lead times and usually generate sales out of inventory. Our mobile data communications backlog is highly influenced by the nature and timing of orders received from the U.S. government which is subject to unpredictable funding, deployment and technology decisions. As a result, we believe our backlog at any point in the fiscal year is not necessarily indicative of the total sales anticipated for any particular future period.
Manufacturing and Service
Our manufacturing operations consist principally of the assembly and testing of electronic products that we design and build from purchased fabricated parts, printed circuits and electronic components.
We operate a high-volume technology manufacturing center located in Tempe, Arizona, which has been utilized by all three of our business segments for certain high-volume production. Use of our high-volume technology manufacturing center allows us to secure volume discounts on key components, better control the quality of our manufacturing process and maximize the utilization of our manufacturing capacity.
We consider our facilities to be well maintained and adequate for current and planned production requirements. All of our manufacturing facilities, including those that serve the military market, must comply with stringent customer specifications. We employ formal quality management programs and other training programs, including the International Standard Organization’s (“ISO’s”) quality procedure registration programs.
Our ability to deliver products to customers on a timely basis is dependent, in part, upon the availability and timely delivery by subcontractors and suppliers (including the U.S. government) of the components and subsystems that we use in manufacturing our products. Electronic components and raw materials used in our products are generally obtained from independent suppliers. Some components are standard items and are available from a number of suppliers. Others are manufactured to our specifications by subcontractors. Although we obtain certain components and subsystems from a single source or a limited number of sources, we believe that most components and equipment are available from multiple sources. Certain U.S. government contracts may require us to incorporate government furnished parts into our products. Delays in receipt of such parts can adversely impact the timing of our performance on the related contracts.
14
Research and Development
We reported research and development expenses for financial reporting purposes of
$38.5
million,
$43.5
million and
$46.2
million in fiscal
2012
,
2011
and
2010
, respectively, representing
9.1%
,
7.1%
and
5.9%
of total consolidated net sales, respectively, for these periods. A portion of our research and development efforts relate to the adaptation of our basic technology to specialized customer requirements and is recoverable under contracts, and such expenditures are not reflected in our research and development expenses for financial reporting purposes, but are included in net sales with the related costs included in cost of sales. During fiscal
2012
,
2011
and
2010
, we were reimbursed by customers for such activities in the amounts of
$5.7
million,
$10.7
million and
$12.6
million, respectively.
Our aggregate research and development expenditures (internal and customer funded) were
$44.2
million,
$54.2
million and
$58.8
million or
10.4%
,
8.9%
and
7.6%
of total consolidated net sales in fiscal
2012
,
2011
and
2010
, respectively.
Intellectual Property
We rely upon trade secrets, technical know-how and continuing technological innovation to develop and maintain our competitive position. The products we sell require significant engineering design and manufacturing expertise. The majority of these technological capabilities, however, are not protected by patents and licenses. We rely on the expertise of our employees and our learned experiences in both the design and manufacture of our products and the delivery of our services.
Some of our key telecommunications transmission technology is protected by patents, which are significant to protecting our proprietary technology. We have been issued several U.S. patents relating to forward error correction technology that is utilized in our TPC-enabled satellite modems. Due to our market leadership position, we do not expect that upon expiration of these patents, our future results will be negatively impacted. Our DoubleTalk
®
Carrier-in-Carrier
®
bandwidth compression technology is licensed by us from a third party.
Almost all of the products and services we sell to the U.S. government include technology and other technical know-how that we have internally developed. Historically, almost all of our U.S. government contracts have not provided for government-purpose rights which generally include the right to permit other companies, including our competitors, to use our technology to develop products for the U.S. government.
In past instances where we have provided government-purpose rights, to our knowledge, the U.S. government has not exercised any of these rights. To the extent that we have provided or will provide government-purpose rights in the future, we believe that given the rapidly changing nature of our technology, our future success will depend primarily on the technical competence and creative skill of our personnel, rather than any contractual protection.
Competition
Our businesses are highly competitive and are characterized by rapid technological change. Some of our competitors are substantially larger, have significantly greater financial, marketing, research and development, technological and operating resources and broader product lines than us. A significant technological breakthrough by others, including new companies, our existing competitors and our customers, could have a material adverse effect on our business. Our growth and financial condition depends on, among other things, our ability to keep pace with such changes and developments and to respond to the increasing variety of electronic equipment users and transmission technologies.
Some large defense-based companies such as Raytheon Company and Northrop Grumman Corporation have subsidiaries or divisions that compete against us in one or more business segments. In addition, new and potential competitors are always emerging. Certain of our customers, such as prime contractors who currently outsource their engineering and manufacturing requirements to us, have technological capabilities in our product areas and could choose to replace our products with their own. In some cases, we partner or team with companies (both large and mid-tier) to compete against other teams for large defense programs. In some cases, these same companies may be competitors.
15
Listed, in alphabetical order below, are some of our competitors in each of our three business segments:
Telecommunications transmission – Advantech AMT, Datum Systems, Inc., Gilat Satellite Networks Ltd., Harris Corporation, iDirect, Inc., Paradise Datacom LLC (a subsidiary of Teledyne Corporation), Telefonaktiebolaget LM Ericsson and ViaSat, Inc.
RF microwave amplifiers – Aethercomm, Inc., CPI International, Inc., E2V Technologies Ltd., Empower RF Systems, Inc., Herley Industries, Inc. (a subsidiary of Kratos Defense & Security Solutions, Inc.) and Miteq, Inc.
Mobile data communications – Alico Systems, Inc., Globalstar, Inc., Northrop Grumman Corporation, Orbital Sciences Corporation, Qualcomm, Inc. and ViaSat, Inc.
We believe that competition in all of our markets is based primarily on technology innovation, product performance, reputation, delivery times, customer support and price. Due to our flexible organizational structure and proprietary know-how, we believe we have the ability to develop, produce and deliver products on a cost-effective basis faster than many of our competitors.
Employees
At
July 31, 2012
, w
e had 1,244 employees (including temporary employees and contractors), 592 of whom were engaged in production and production support, 381 in research and development and other engineering support and 271 in marketing and administrative functions. Through the date of this filing, we have reduced our workforce by approximately 76 employees, due to cost reduction actions that we took, including the wind-down of our mobile data communications segment's microsatellite product line.
None of our U.S. based employees are represented by a labor union. We believe that our employee relations are good
.
16
U.S. Government Contracts and Security Clearances
The U.S. government operates on an October-to-September fiscal year. Generally, in February of each year, the President of the United States presents to the U.S. Congress (“Congress”) the proposed budget for the upcoming fiscal year and from February through September of each year, the appropriations and authorization committees of Congress review the President’s budget proposals and establish the funding levels for the upcoming fiscal year. Once these levels are enacted into law, the Executive Office of the President administers the funds to the agencies. Thereafter, we can receive orders pursuant to sole-source or competitively awarded contracts.
The U.S. government may be unable to complete its budget process before the end of any given government fiscal year and when the fiscal budget is not approved in a timely manner, the U.S. government is required either to shut down or be funded pursuant to a “continuing resolution” that authorizes agencies of the U.S. government to continue operations but does not authorize new spending initiatives, either of which could result in reduced or delayed orders or payments for products and services we provide. If the U.S. government budget process results in a shutdown or prolonged operation under a continuing resolution, it may have a material adverse effect on our business, operating results or financial condition.
Sole-source contracts are generally awarded to a single contractor without a formal competition when a single contractor is deemed to have an expertise or technology superior to that of competing contractors or when there is an urgent need by the U.S. government that cannot wait for a full competitive process. Potential suppliers compete informally through research and development and marketing efforts. Competitively-bid contracts are awarded based on a formal proposal evaluation established by the procuring agency and interested contractors prepare a bid. Competitively-bid contracts are awarded after a formal bid and proposal competition among suppliers.
The U.S. government has a stated policy direction to reduce the number of sole-source contract awards across all procuring agencies. In addition, the U.S. government is increasing the use of a strategy to award multiple-award IDIQ contracts to increase their procurement options. IDIQ contracts allow the U.S. government to select a group of eligible contractors for the same program. When the government awards IDIQ contracts to multiple bidders under the same program, a company must compete to be selected as a participant in the program and subsequently compete for individual delivery orders. As a result of the aforementioned changes, although we expect competition for all future U.S. government contracts to increase, at the same time, we may be able to participate in other program areas that we do not currently participate in.
As a U.S. government contractor and subcontractor, we are subject to a variety of rules and regulations, such as the Federal Acquisition Regulations (“FAR”). Individual agencies can also have acquisition regulations. For example, the Department of Defense implements the FAR through the Defense Federal Acquisition Regulation supplement (commonly known as DFARs). For all federal government entities, the FAR regulates the phases of any product or service acquisition, including: acquisition planning, competition requirements, contractor qualifications, protection of source selection and vendor information, and acquisition procedures. In addition, the FAR addresses the allowability of our costs, while Cost Accounting Standards address how those costs can be allocated to contracts. The FAR also subjects us to audits and other government reviews. These reviews cover issues such as cost, performance and accounting practices relating to our contracts. The government may challenge our costs and fees. We are also required to comply with the National Industrial Security Program Operating Manual ("NISPOM") which relates to rules and requirements regarding classified materials and programs. If we do not comply with the various regulations, we may lose and/or be ineligible for facility security clearances and/or classified programs.
Regulatory Matters
In addition to the rules and regulations that pertain to us as a U.S. government contractor and subcontractor, we are also subject to a variety of local, state and federal governmental regulations. Our products that are incorporated into wireless communications systems must comply with various governmental regulations, including those of the Federal Communications Commission (“FCC”). Our manufacturing facilities, which may store, handle, emit, generate and dispose of hazardous substances that are used in the manufacture of our products, are subject to a variety of local, state and federal regulations, including those issued by the Environmental Protection Agency. Our financial reporting, corporate governance, public disclosure and compliance practices are governed by laws such as the Sarbanes-Oxley Act of 2002 and rules and regulations issued by the Securities and Exchange Commission (“SEC”). In addition, we are subject to European Union (“EU”) directives related to the recycling of electrical and electronic equipment. Our international sales are subject to U.S. and foreign regulations such as the International Traffic in Arms Regulations (“ITAR”) and Export Administration Regulations (“EAR”) and may require licenses from U.S. government agencies, including the payment of certain tariffs. Our ability to export in the future is dependent upon our ability to obtain the export authorization from the appropriate U.S. government agency. If we are unable to receive the appropriate export authorization, we may be prohibited from selling our products and services internationally which may limit our sales and may have a material adverse effect on our business, results of operations and financial condition.
17
Forward-Looking Statements
This Form 10-K contains “forward-looking statements” including statements concerning the future of our industry, product development, business strategy, continued acceptance of our products, market growth, and dependence on significant customers. These statements can be identified by the use of forward-looking terminology such as “may,” “will,” “should,” “could,” “would,” “expect,” “plan,” “anticipate,” “believe”, “estimate,” “predict,” “potential,” “continue,” the negative of these terms, or other similar words or comparable terminology. All statements in this report, other than statements of historical fact, are forward-looking information. When considering forward-looking statements, you should keep in mind the risk factors and other cautionary statements in this Form 10-K. However, the risks described in this Form 10-K are not the only risks that we face. Additional risks and uncertainties, not currently known to us or that do not currently appear to be material, may also materially adversely affect our business, financial condition and/or operating results in the future. The risk factors noted below and other factors noted throughout this Form 10-K could cause our business outlook, actual financial condition or results to differ significantly from those contained in any forward-looking statement.
The continued effects of the adverse global economic climate could have a material adverse impact on our business outlook, our business, operating results and financial condition.
We participate in the global commercial and government communications markets, which are characterized by rapid technological advances and constant changes. For the past several years, our customers and the end-markets that we serve have been significantly impacted by adverse global economic conditions. The impact, severity and duration of these conditions are impossible to predict with precision. These conditions have already resulted in: (i) changes to our commercial and government customers’ historical spending priorities, (ii) reduced military budgets, and (iii) extreme pressures on government budgets throughout the world. In addition to operating in a difficult global economic environment, some of our end customers are located in emerging countries that are currently undergoing sweeping political changes. Global international monetary issues and concerns continue to be unsettled and it is possible that a worldwide credit crisis could occur. We believe that the aggregation of these conditions has resulted in the current suppression of end-market demand for many of the products that we sell and services that we provide. Although we believe that we will ultimately experience long-term growth, these adverse conditions could last for many years.
We believe that nearly all of our customers will continue to face capital and operating budget constraints and a much tighter credit environment. None of our three operating segments have been immune to these adverse conditions and each continues to face an uncertain economic environment. These adverse conditions have impacted, and may continue to impact, our businesses in a number of ways, including:
|
•
|
Difficulty in forecasting our results of operations
–
It is difficult to accurately forecast our results of operations as we cannot predict the severity, or the duration, of the current adverse economic environment or the impact it will have on our current and prospective customers. If our current or prospective customers materially postpone, reduce or even forgo purchases of our products and services to a greater extent than we anticipate, our business outlook will prove to be inaccurate.
|
|
•
|
Additional reductions in telecommunications equipment and systems spending may occur
– Our businesses have been negatively affected, both currently and in the past, by uncertain economic environments both in the overall market and, more specifically, in the telecommunications sector. Our customers have reduced their budgets for spending on telecommunications equipment and systems and in some cases postponed or reduced the purchase of our products and systems. These reductions have impacted all three of our business segments. The overall business environment remains challenging. As a result of the ongoing difficult global economic environment, our customers may further reduce their spending on telecommunications equipment and systems which would negatively impact all three of our business segments. If this occurs, it would adversely affect our business outlook, revenues, profitability and the recoverability of our assets, including intangible assets such as goodwill.
|
|
•
|
Our customers may not be able to obtain financing
– Although many of our products are relatively inexpensive when compared to the total systems or networks that they are incorporated into, our sales are affected by our customers’ ability to obtain the sufficient financing they may require to build out their networks, fund operations and ultimately make purchases from us. Our customers’ inability to obtain sufficient financing would adversely affect our revenues. In addition, if the current economic environment and lack of financing results in insolvencies for our customers, it would adversely impact the recoverability of our accounts receivable which would, in turn, adversely impact our results of operations.
|
18
|
•
|
Our ability to maintain affordable credit insurance may become more difficult
–
In the normal course of our business, we purchase credit insurance to mitigate some of our domestic and international credit risk. Although credit insurance remains generally available, upon renewal, it may become more expensive to obtain and might require higher deductibles than in the past. There can be no assurance that, in the future, we will be able to obtain adequate credit insurance consistent with our past practices.
|
Our
2013
business outlook and operating results are difficult to forecast, as operating results are subject to significant fluctuations and are likely to be volatile.
We have experienced, and will experience in the future, significant fluctuations in new orders, net sales and operating results, including our net income and earnings per share from period-to-period. For instance, a large portion of our telecommunications transmission and RF microwave amplifiers segments’ net sales are derived from products such as satellite earth station equipment and satellite earth station traveling wave tube amplifiers, respectively, that generally have short-lead times. As a result, bookings and backlog related to these products are extremely sensitive to short-term fluctuations in customer demand. The remaining portion of our telecommunications transmission and our RF microwave amplifiers segments’ net sales are generally derived from large contracts or military program opportunities that are subject to lengthy sales cycles and therefore difficult to predict. As discussed elsewhere in this Form 10-K, our mobile data communications segment is expected to experience a material decline in revenues and related operating income in fiscal
2013
as compared to fiscal 2012.
Our new orders, net sales and operating results, including our net income and earnings per share, may vary significantly from period-to-period because of other factors including: the financial performance of acquisitions; new accounting standards relating to acquisitions and revenue recognition; product mix sold; fluctuating market demand; price competition; new product introductions by our competitors; fluctuations in foreign currency exchange rates; unexpected changes in the timing of delivery of components or subsystems; political instability; regulatory developments; changes in income tax rates or tax credits; the price and expected volatility of our stock (which will impact, among other items, the amount of stock-based compensation expense we may record); and general global economic conditions.
Changes in government policy could have a material adverse effect on us.
In past years, we benefited from increased Department of Defense (“DoD”) spending relating to the ongoing military conflicts in Iraq and Afghanistan. This trend is not expected to continue. We believe the U.S. government policies related to troop withdrawals and reductions in Iraq and Afghanistan will result in a reduction of future orders for our products and services. Historical spending patterns, for the types of communication products that we sell, are therefore not meaningful when estimating future product demand. These policies or future changes in these or other policies or priorities could have a negative impact on our business and results of operations. A shifting political environment makes it more difficult than usual to estimate our future income and expenses. The future direction of the political environment, including potential changes in policies relating to the ongoing military conflict in Afghanistan, could have a material adverse effect on our business, results of operations and financial condition.
Our business, results of operations, liquidity and financial condition depend on our ability to obtain future business with the U.S. government.
In past years, our business has depended, in large part, on U.S. government business. Our sales to the U.S. government (including sales to prime contractors to the U.S. government) accounted for approximately
48.9%
, 61.7%, and 71.1% of our consolidated net sales for the fiscal years ended
July 31, 2012
,
2011
and
2010
, respectively. Approximately
36.2%
of our backlog at
July 31, 2012
consisted of orders from U.S. government contracts, U.S. government subcontracts and U.S. government funded programs. Our U.S. government business exposes us to various risks, including:
|
•
|
unexpected contract or project terminations or suspensions;
|
|
•
|
unpredictable order placements, reductions, delays or cancellations;
|
|
•
|
reductions in government funds available for our projects due to government policy changes, budget cuts and other spending priorities;
|
|
•
|
higher than expected final costs, particularly relating to software and hardware development, for work performed under contracts where we commit to specified deliveries for a fixed price; and
|
|
•
|
unpredictable cash collections of unbilled receivables that may be subject to acceptance of contract deliverables by the customer and contract close out procedures, including government audit and approval of final indirect rates.
|
19
All of our U.S. government contracts can be terminated by the U.S. government for its convenience. Termination for convenience provisions provide only for our recovery of costs incurred or costs committed, settlement expenses and profit on work completed prior to termination. In addition to the U.S. government’s right to terminate, U.S. government contracts are conditioned upon the continuing approval by Congress of the necessary funding. Congress usually appropriates funds for a given program on a fiscal year basis even though contract performance may take more than one year. Consequently, at the beginning of a major program, the contract may not be fully funded, and additional monies are normally committed to the contract only if, and when, appropriations are made by Congress for future fiscal years.
Delays or changes in funding can impact the timing of awards or lead to changes in program content. Also, we obtain certain of our U.S. government contracts through a competitive bidding process. There can be no assurance that we will win additional contracts or that actual contracts that are awarded will ultimately be profitable.
The outcome of ongoing U.S. government investigations are difficult to predict.
In June 2012, certain officers and employees of the Company received subpoenas issued by the United States District Court for the Eastern District of New York (“EDNY”) seeking certain documents and records relating to our Chief Executive Officer (“CEO”). Although the EDNY subpoenas make no specific allegations, we believe the subpoenas relate to a grand jury investigation stemming from our CEO's contacts with a scientific attaché to the Israeli Purchasing Mission in the United States who our CEO met in connection with the sale of our equipment to the State of Israel during the 1980's. This scientific attaché was later alleged to have conducted intelligence operations in the U.S. In August 2012, we were informed by the U.S. government that our CEO's security clearance was suspended. In order to maintain our qualification for government contracts requiring facility security clearance, we have made certain internal organizational realignments. These changes restrict access to classified information to other Comtech senior executives, management and other employees who maintain the required level of clearance.
Separately, in connection with an investigation by the Securities and Exchange Commission (“SEC”) into trading in securities of CPI International, Inc. (“CPI”), we and our CEO, among others, have received subpoenas for documents from the SEC concerning transactions in CPI stock by our CEO and other persons (including one subsidiary employee). Our CEO purchased CPI stock in November 2010, after the September 2010 termination of our May 2010 agreement to acquire CPI.
We and our CEO are cooperating with the U.S. government regarding the above matters. The independent members of our Board of Directors are monitoring these matters with the assistance of independent counsel.
The outcome of any investigation is inherently difficult, if not impossible, to predict. However, based on our work to date in respect of the subpoenas in each matter, we do not believe that it is likely that either investigation will result in a legal proceeding against our CEO or the Company. If either of these investigations results in a legal proceeding, it could have a material adverse effect on our business and results of operations.
Government contract audits could have an adverse financial impact on us.
All of our U.S. government contracts can be audited by the Defense Contract Audit Agency (“DCAA”) and we can be subject to penalties arising from post-award contract audits or cost audits in which the value of our contracts may be reduced. As discussed in
“Notes to Consolidated Financial Statements - Note (14)(b) Legal Proceedings and Other Matters”
included in
“Part II - Item 8. - Financial Statements and Supplementary Data,”
in May 2011, we were informed by the DCAA that it selected our BFT-1 contract for a post-award audit. We had previously been informed that the DCAA would issue its report by September 2012. The DCAA has not yet rendered its report and we do not currently know the timing of the issuance of this report. Through
July 31, 2012
, we received
$377.0 million
in total funded orders under our $384.0 million BFT-1 contract that expired December 31, 2011. Ultimately, if the DCAA issues a report and the U.S. government determines that a cost or price adjustment for our BFT-1 contract is appropriate, we may be required to refund certain monies to the U.S. government, with interest. These amounts could have a material adverse effect on our results of operations and financial condition.
We could be negatively impacted by a security breach, through cyber-attack, cyber intrusion or otherwise, other significant disruption of our IT networks and related systems or of those we operate for certain customers.
We face the risk of a security breach, whether through cyber-attack or cyber intrusion via the Internet, malware, computer viruses, attachments to e-mails, or other significant disruption of our IT networks and related systems. Our IT network and systems are constantly under attack and we face an added risk of a security breach or other significant disruption of the IT networks and related systems that we operate and maintain for certain of our customers, which may involve managing and protecting information relating to national security and other sensitive government functions. Our customers' systems are also frequently under attack.
20
The risk of a security breach or disruption, particularly through cyber-attack or cyber intrusion, including by computer hackers, foreign governments and cyber terrorists, has increased as the number, intensity and sophistication of attempted attacks and intrusions from around the world have increased.
As a communications company, and particularly as a government contractor, we face a heightened risk of a security breach or disruption from threats to gain unauthorized access to our and our customers’ proprietary or classified information on our IT networks and related systems and to the IT networks and related systems that we operate and maintain for certain of our customers. These types of information and IT networks and related systems are critical to the operation of our business and essential to our ability to perform day-to-day operations, and, in some cases, are critical to the operations of certain of our customers. Although we make significant efforts to maintain the security and integrity of these types of information and IT networks and related systems, and we have implemented various measures to manage the risk of a security breach or disruption, there can be no assurance that our security efforts and measures will be effective or that attempted security breaches or disruptions would not be successful or damaging. Even the most well protected information, networks, systems and facilities remain potentially vulnerable because attempted security breaches, particularly cyber-attacks and intrusions, or disruptions will occur in the future, and because the techniques used in such attempts are constantly evolving and generally are not recognized until launched against a target, and in some cases are designed not to be detected and, in fact, may not be detected. In some cases, the resources of foreign governments may be behind such attacks. Accordingly, we may be unable to anticipate these techniques or to implement adequate security barriers or other preventative measures, and thus it is virtually impossible for us to entirely mitigate this risk. A security breach or other significant disruption involving these types of information and IT networks and related systems could:
|
•
|
Disrupt the proper functioning of these networks and systems and therefore our operations and/or those of certain of our customers;
|
|
•
|
Result in the unauthorized access to, and destruction, loss, theft, misappropriation or release of proprietary, confidential, sensitive or otherwise valuable information of ours or our customers, including trade secrets, which others could use to compete against us or for disruptive, destructive or otherwise harmful purposes and outcomes;
|
|
•
|
Compromise national security and other sensitive government functions;
|
|
•
|
Require significant management attention and resources to remedy the damages that result;
|
|
•
|
Subject us to claims for contract breach, damages, credits, penalties or termination; and
|
|
•
|
Damage our reputation with our customers (particularly agencies of the U.S. government) and the public generally.
|
In addition, the cost of continually defending against cyber-attacks and breaches may significantly increase and any or all of the foregoing could have a material adverse effect on our business and results of operations.
Terrorist attacks and threats, and government responses thereto, and threats of war could have a material adverse effect on us.
Terrorist attacks, the U.S. and other governments’ responses thereto, and threats of war could also adversely impact our business, results of operations and financial condition. Any escalation in these events or similar or future events may disrupt our operations or those of our customers or suppliers and may affect the availability of materials needed to manufacture our products or the means to transport those materials to manufacturing facilities and finished products to customers.
Reductions in spending or changes in spending priorities to reduce the U.S. Department of Defense (“DoD”) budget and the U.S. Government’s debt could have a material adverse effect on us.
We believe that the budget for the U.S. DoD will be reduced from current levels over the next decade. In addition to debt reduction efforts already authorized, it is possible that the U.S. government could reduce or further delay its spending on, or reprioritize its spending away from, government programs which we participate in.
Debt-ceiling reduction legislation that was enacted in 2011 requires reductions of approximately $487.0 billion in Pentagon and national security agency budgets over the next ten years. On November 23, 2011, the Joint Select Committee on Deficit Reduction (commonly referred to as the Super Committee which was established as part of the Budget Control Act of 2011) failed to recommend legislation that would reduce net U.S. government spending by at least $1.2 trillion over the next 10 years. As of September 26, 2012, Congress has not yet identified the required spending reductions and as a result, it is possible that there will be an automatic sequestration of discretionary appropriations for U.S. defense programs. Although the types of communications products and services we offer appear to be a funding priority over the long term, a significant decline in defense spending or a shift in funding priorities may have a negative effect on future orders, sales, income and cash flows depending on the platforms and programs affected by such budget reductions or shifts in funding priorities.
21
Ultimately, the U.S. government may be unable to timely complete its budget process or fully agree upon spending priorities. If the U.S. government budget process results in a shutdown or prolonged operation under a continuing resolution, we may experience delayed orders, delayed payments, declines in revenues, profitability and cash flows. In addition, we may experience related supply chain delays, disruptions or other problems associated with financial constraints faced by our suppliers and subcontractors. All of the aforementioned conditions could have a material adverse effect on our fiscal
2013
business and financial outlook, our operating results or our financial condition.
We may not be able to maintain our expected levels of mobile data communications segment revenues in future years.
As discussed elsewhere in this Form 10-K, we expect revenues and related operating income in our mobile data communications segment to materially decline in fiscal 2013 as compared to fiscal 2012. As a result, we have initiated and have implemented targeted actions to align our cost structure and are continuing the process of refining our mobile data communications segment’s business strategies.
We are currently providing sustainment services to the U.S. Army's MTS and BFT-1 programs under a three-year IDIQ contract. The base performance period on this contract is April 1, 2012 to March 31, 2013. The contract provides for two twelve-month option periods exercisable by the U.S. Army and, except for a fixed annual intellectual property (“IP”) license fee of $10.0 million, the three-year $80.7 million contract value is subject to finalization and downward negotiation. Payments of annual IP license fees beyond the base year are contingent upon the U.S. Army's exercise of optional performance periods. Because this contract is an IDIQ contract, it can be terminated at any time and the U.S. Army is not obligated to purchase any additional equipment or services.
Sales for MTS and BFT-1 products and services in fiscal
2012
were approximately
$87.8 million
and our business outlook assumes a material decline in such revenues in fiscal
2013
. As further described below, given the various uncertainties related to our BFT-1 sustainment activities, our operating results in fiscal
2013
and beyond are likely to be more volatile and it will be more difficult than in the past to accurately project gross margins and our related operating income, net income and earnings per share in any particular future period.
Our ability to accurately predict BFT-1 sustainment activities in fiscal
2013
and beyond is subject to a number of future events, including new orders, new contracts, contract extensions (including the exercise of optional performance periods), contract ceiling increases, unpredictable funding, as well as deployment and technology decisions by the U.S. government. We believe that the U.S. Army may have begun deploying BFT-2 equipment in Korea and according to published reports on the U.S. Army's website, will also begin deploying BFT-2 equipment in Afghanistan in our fiscal 2013. As such, if the U.S. Army does not exercise the optional performance periods and we do not receive new orders, new contracts, contract extensions or contract ceiling increases, our mobile data communications segment's revenues in future periods will decline significantly, which would have a material adverse effect on our 2013 business outlook, our future business outlook, and our current and future operating results.
We believe that by seeking to work collaboratively with the U.S. Army to ensure that its short-term and long-term needs are addressed, we will enhance our competitive positioning for a potential new award in the future. Ultimately, we may not be successful and our business outlook could be negatively impacted.
Noncompliance with numerous domestic and international laws, regulations and restrictions (including those pertaining to income taxes) could materially impact our business, results of operations and financial condition.
Our business operations are primarily located in the U.S.; however, we must comply with certain international, as well as domestic, laws, regulations and restrictions. Our products are incorporated into wireless communications systems that must comply with various U.S. government regulations, including those of the FCC, as well as similar international laws and regulations. Because the laws and regulations pertaining to our business are relatively complex, our business faces increased risks including the following:
|
•
|
We could be disqualified as a supplier to the U.S. government
–
As a supplier to the U.S. government, we must comply with numerous regulations, including those governing security, contracting practices and classified information. Failure to comply with these regulations and practices could result in fines being imposed against us or our suspension for a period of time from eligibility for bidding on, or for award of, new government contracts. If we are disqualified as a supplier to government agencies, we would lose most, if not all, of our U.S. government customers and revenues from sales of our products would decline significantly. Among the potential causes for disqualification are violations of various statutes, including those related to procurement integrity, export control, U.S. government security regulations, employment practices, protection of the environment, accuracy of records in the recording of costs, and the Foreign Corrupt Practices Act.
|
22
The government could investigate and make inquiries of our business practices and conduct audits of contract performance and cost accounting. Based on the results of such audits, the U.S. government could adjust our contract-related costs and fees. Depending on the results of these audits and investigations, the government could make claims against us and, if it were to prevail, certain incurred costs would not be recoverable by us.
|
•
|
Adverse regulatory changes could impair our ability to sell products
– Regulatory changes, including changes in the allocation and availability of frequency spectrum, and in the military standards and specifications that define the current satellite networking environment, could materially harm our business by: (i) restricting development efforts by us and our customers, (ii) making our current products less attractive or obsolete, or (iii) increasing the opportunity for additional competition. The increasing demand for wireless communications has exerted pressure on regulatory bodies worldwide to adopt new standards and reassign bandwidth for these products and services. The reduced number of available frequencies for other products and services and the time delays inherent in the government approval process of new products and services have caused, and may continue to cause, our customers to cancel, postpone or reschedule their installation of communications systems including their satellite, over-the-horizon microwave, or terrestrial line-of-sight microwave communication systems. This, in turn, could have a material adverse effect on our sales of products to our customers. Changes in, or our failure to comply with, applicable laws and regulations could materially harm our business.
|
|
•
|
We may be subject to environmental liabilities
– We engage in manufacturing and are subject to a variety of local, state and federal governmental regulations relating to the storage, discharge, handling, emission, generation, manufacture and disposal of toxic or other hazardous substances used to manufacture our products. We are also subject to the Restriction of Hazardous Substance ("RoHS") directive which restricts the use of lead, mercury and other substances in electrical and electronic products. The failure to comply with current or future environmental requirements could result in the imposition of substantial fines, suspension of production, alteration of our manufacturing processes or cessation of operations that could have a material adverse effect on our business, results of operations and financial condition. In addition, the handling, treatment or disposal of hazardous substances by us or our predecessors may have resulted, or could in the future result, in contamination requiring investigation or remediation, or leading to other liabilities, any of which could have a material adverse effect on our business, results of operations and financial condition.
|
|
•
|
Tax audits could result in a material tax assessment
– Our U.S. federal, state and foreign tax returns are subject to audit and a resulting tax assessment or settlement could have a material adverse effect on our results of operations and financial condition. Significant judgment is required in determining the provision for income taxes. The final determination of tax examinations and any related litigation could be materially different than what is reflected in historical income tax provisions and accruals. Our federal income tax returns for fiscal 2010, fiscal 2011 and fiscal 2012 are subject to potential future Internal Revenue Service (“IRS”) audit. Although adjustments relating to past audits of our federal tax returns were immaterial, a resulting tax assessment or settlement for other periods or other jurisdictions that may be selected for future audit could have a material adverse effect on our results of operations and financial condition.
|
Our investments in recorded goodwill and other intangible assets could be impaired as a result of future business conditions, further deterioration of the global economy or if we change our reporting unit structure.
As of
July 31, 2012
, we have goodwill and intangible assets of $176.2 million recorded on our consolidated balance sheet of which $129.6 million and $46.6 million relates to our telecommunications transmission and RF microwave amplifiers segments, respectively.
For purposes of reviewing impairment and the recoverability of goodwill and other intangible assets, each of our three operating segments constitutes a reporting unit and we must make various assumptions regarding estimated future cash flows and other factors in determining the fair values of the reporting unit. We perform an annual impairment review in the first quarter of each fiscal year, unless there are other indicators of impairment. Based on our annual impairment review performed as of
August 1, 2012
, we concluded that our RF microwave amplifiers and our telecommunications transmission reporting units had an estimated fair value in excess of total asset book value of approximately
84.0%
and
7.0%
, respectively.
The annual impairment test is based on several factors requiring judgment and is based on how our President and Chief Executive Officer manages the business. If these estimates or their related assumptions change in the future, or if we change our future reporting structure, we may be required to record impairment charges in future periods.
If global conditions continue to deteriorate from current levels, or if the market value of our equity or assets significantly declines, or we are not successful in achieving our expected sales levels, or if other events or changes in circumstances occur that indicate that the carrying amount of our assets may not be recoverable, our goodwill and other intangible assets may become impaired.
23
Although we performed our fiscal
2013
impairment testing on
August 1, 2012
and determined that there was no impairment of our goodwill, changes in our future operating performance or business conditions, in general, could result in an impairment of goodwill in future operating periods. Any impairment charges that we may record in the future could be material to our results of operations and financial condition.
All of our business activities are subject to rapid technological change requiring us to continuously develop technology and/or obtain licensed technology in order to compete successfully.
We are engaged in business activities characterized by rapid technological change, evolving industry standards, frequent new product announcements and enhancements, and changing customer demands. The introduction of products and services on future industry standards embodying new technologies such as TDMA-based technologies and the emergence of industry standards such as WiMAX could render any of our products and services obsolete or non-competitive.
The technology used in our products and services evolves rapidly, and our business position depends, in large part, on the continuous refinement of our scientific and engineering expertise and the development, either through internal research and development or acquisitions of businesses or licenses, of new or enhanced products and technologies. We may not have the economic or technological resources to be successful in such efforts and we may not be able to identify and respond to technological improvements made by our competitors in a timely or cost-effective fashion.
Our DoubleTalk
®
Carrier-in-Carrier
®
bandwidth compression technology is licensed by us from a third party who maintains patents associated with the technology.
A significant technological breakthrough by others, including smaller competitors or new firms, or an unsuccessful outcome of defending our rights to licensed technologies, could have a material adverse impact on our business, results of operations and financial condition.
Ongoing compliance with the provisions of securities laws, related regulations and financial reporting standards could unexpectedly materially increase our costs and compliance related expenses.
Because we are a publicly traded company, we are required to comply with provisions of securities laws, related regulations and financial reporting. Because securities laws, related regulations and financial reporting standards pertaining to our business are relatively complex, our business faces increased risks including the following:
|
•
|
If we identify a material weakness in the future, our costs will unexpectedly increase
– Pursuant to Section 404 of the Sarbanes-Oxley Act of 2002 and related SEC rules, we are required to furnish a report of management’s assessment of the effectiveness of our internal controls as part of our Annual Report on Form 10-K. Our independent registered public accountants are required to attest to and report on management’s assessment, as well as provide a separate opinion. To issue our report, we document our internal control design and the testing processes that support our evaluation and conclusion, and then we test and evaluate the results. There can be no assurance, however, that we will be able to remediate material weaknesses, if any, that may be identified in future periods, or maintain all of the controls necessary for continued compliance. There likewise can be no assurance that we will be able to retain sufficient skilled finance and accounting personnel, especially in light of the increased demand for such personnel among publicly traded companies.
|
|
•
|
Stock-based compensation accounting standards could negatively impact our stock
– Since our inception, we have used stock-based awards
as a fundamental component of our employee compensation packages. We believe that stock-based awards
directly motivate our employees to maximize long-term stockholder value and, through the use of long-term vesting, encourage employees to remain with us. Since fiscal 2006, we have applied the provisions of Accounting Standards Codification (“ASC”) 718, “Compensation – Stock Compensation,” which requires us to record compensation expense in our statement of operations for employee and director stock-based awards
using a fair value method. The adoption of the standard had a significant effect on our reported earnings, and could adversely impact our ability to provide accurate guidance on our future reported financial results due to the variability of the factors used to estimate the value of stock-based awards. The ongoing application of this standard could impact the future value of our common stock and may result in greater stock price volatility. To the extent that this accounting standard makes it less attractive to grant stock-based awards to employees, we may incur increased compensation costs, change our equity compensation strategy or find it difficult to attract, retain and motivate employees, each of which could have a material adverse effect on our business, results of operations and financial condition.
|
24
|
•
|
Changes in securities laws, regulations and financial reporting standards are increasing our costs
– The Sarbanes-Oxley Act of 2002 required changes in some of our corporate governance, public disclosure and compliance practices. These changes resulted in increased costs and as we grow, we expect to see our costs increase. The SEC has passed, promulgated and proposed new rules on a variety of subjects including the requirement to use the interactive data format eXtensible Business Reporting Language (commonly referred to as “XBRL”) in our financial statements, which we began including in our quarterly reports filed with the SEC in the first quarter of fiscal 2011 and the possibility that we would be required to adopt International Financial Reporting Standards (“IFRS”). We may have to add additional accounting staff, engage consultants or change our internal practices, standards and policies which could significantly increase our costs to comply with IFRS requirements. In addition, the NASDAQ Stock Market LLC (“NASDAQ”) has revised its requirements for companies, such as us, that are listed on NASDAQ. These changes are increasing our legal and financial compliance costs including making it more difficult and more expensive for us to obtain director and officer liability insurance or maintain our current liability coverage. We believe that these new and proposed laws and regulations could make it more difficult for us to attract and retain qualified members of our Board of Directors, particularly to serve on our Audit Committee, and qualified executive officers.
|
|
•
|
We may incur additional expenses and not be able to comply with SEC reporting requirements related to conflict minerals
– In August 2012, the SEC adopted new rules establishing additional disclosure and reporting requirements regarding a company's use of conflict minerals. These new SEC rules could result in us incurring additional costs to document and perform supplier due diligence. As these rules will likely impact our suppliers, the availability of raw materials used in our operations could be negatively impacted and or raw material prices could increase. We may also have difficulty verifying the supply of conflict minerals to their source and, therefore, may not be able to comply with the SEC's conflict minerals reporting requirement.
|
We could be adversely affected if we violate International Traffic in Arms Regulations (“ITAR”).
In the past, we have self-reported violations of ITAR to the Office of Defense Trade Controls Compliance (“DDTC”) of the U.S. Department of State and had an ITAR compliance audit performed by an independent auditor at the request of the DDTC. Although the audit found no violations of ITAR, we committed to the DDTC that we would enhance certain policies and procedures including establishing a company-wide Office of Trade Compliance.
We continue to implement policies and procedures to ensure that we comply with ITAR and related regulations. We may be subjected to ITAR compliance audits in the future that may uncover improper or illegal activities that would subject us to material remediation costs, civil and criminal fines and/or penalties and/or an injunction. In addition, we could suffer serious reputational harm if allegations of impropriety were made against us. Each of these outcomes could, individually or in the aggregate, have a material adverse effect on our business, results of operations and financial condition.
Our dependence on sales to international customers exposes us to risks, including U.S. export restrictions.
Sales for use by international customers (including sales to U.S. companies for inclusion in products that will be sold to international customers) represented approximately
38.7%
,
30.2%
and
22.9%
of our consolidated net sales for the fiscal years ended
July 31, 2012
,
2011
and
2010
, respectively, and we expect that international sales will continue to be a substantial portion of our consolidated net sales for the foreseeable future. These sales expose us to certain risks, including barriers to trade, fluctuations in foreign currency exchange rates (which may make our products less price-competitive), political and economic instability, exposure to public health epidemics, availability of suitable export financing, tariff regulations, and other U.S. and foreign regulations that may apply to the export of our products. Although we take steps to mitigate our risk with respect to international sales, we may not be able to do so in every instance for any of the following reasons, among others:
|
•
|
We may not be able to continue to structure our international contracts to reduce risk
– We attempt to reduce the risk of doing business in foreign countries by seeking subcontracts with large systems suppliers, contracts denominated in U.S. dollars, advance or milestone payments and irrevocable letters of credit in our favor. However, we may not be able to reduce the economic risk of doing business in foreign countries in all instances. In such cases, billed and unbilled receivables relating to international sales are subject to increased collectability risk and may result in significant write-offs, which could have a material adverse effect on our business, results of operations and financial condition. In addition, foreign defense contracts generally contain provisions relating to termination at the convenience of the government.
|
25
|
•
|
We rely on a limited number of international sales agents
– In some countries, we rely upon one or a small number of sales agents, exposing us to risks relating to our contracts with, and related performance of, those agents. We attempt to reduce our risk with respect to sales agents by establishing additional foreign sales offices where it is practical and by engaging, where practicable, more than one independent sales representative in a territory. It is our policy to require all sales agents to operate in compliance with applicable laws, rules and regulations. Violations of any of these laws, rules or regulations, and other business practices that are regarded as unethical, could interrupt the sales of our products and services, result in the cancellation of orders or the termination of customer relationships, and could damage our reputation, any of which developments could have a material adverse effect on our net sales and results of operations.
|
|
•
|
We may not be able to obtain export licenses from the U.S. government
– Certain of our products and systems may require licenses from U.S. government agencies for export from the U.S., and some of our products are not permitted to be exported. In addition, in certain cases, U.S. export controls also severely limit unlicensed technical discussions, such as discussions with any persons who are not U.S. citizens or permanent residents. As a result, in cases where we may need a license, our ability to compete against a non-U.S. domiciled foreign company that may not be subject to the same U.S. laws may be adversely affected. We cannot be certain that we will be able to obtain necessary export licenses and failure to obtain required licenses would adversely affect our sales outside the U.S.
|
We have significant operations in Arizona, Florida, California and other locations which could be materially and adversely impacted in the event of a natural disaster or other significant disruption.
Our telecommunications transmission segment designs and manufactures our over-the-horizon microwave equipment and systems in Florida, where major hurricanes have occurred in the past. Our RF microwave amplifiers segment manufactures and designs traveling wave tube amplifiers in Santa Clara, California, close to major earthquake fault lines and also manufactures amplifiers in Melville, New York, an area subject to hurricanes.
Our operations in these and other locations (such as in our high-volume technology manufacturing center located in Tempe, Arizona and our mobile data communication segment’s network operations center located in Germantown, Maryland), could be subject to natural disasters or other significant disruptions, including hurricanes, tornadoes, typhoons, tsunamis, floods, earthquakes, fires, water shortages, other extreme weather conditions, medical epidemics, acts of terrorism, power shortages and blackouts, telecommunications failures, and other natural and man-made disasters or disruptions.
In the event of any such disaster or other disruption, we could experience disruptions or interruptions to our operations or the operations of our suppliers, distributors, resellers or customers; destruction of facilities; and/or loss of life, all of which could materially increase our costs and expenses and materially adversely affect our business, results of operations and financial condition.
Our dependence on component availability, government furnished equipment, subcontractors and key suppliers, including the core manufacturing expertise of our high-volume technology manufacturing center located in Tempe, Arizona, exposes us to risk.
Although we obtain certain components and subsystems from a single source or a limited number of sources, we believe that most components and subsystems are available from alternative suppliers and subcontractors. A significant interruption in the delivery of such items, however, could have a material adverse effect on our business, results of operations and financial condition.
Company-wide, we depend on our high-volume technology manufacturing center located in Tempe, Arizona, which is part of our telecommunications transmission segment, to manufacture certain products and components for all three of our business segments. Intersegment sales in fiscal
2012
,
2011
and
2010
by the telecommunications transmission segment to the RF microwave amplifiers segment were
$5.4 million
,
$3.8 million
and
$7.2 million
, respectively. In fiscal
2012
,
2011
and
2010
, intersegment sales by the telecommunications transmission segment to the mobile data communications segment were
$11.2 million
,
$37.0 million
and
$82.2 million
, respectively.
We intend to maximize the use of our high-volume technology manufacturing center by continuing to seek contracts with third parties to outsource a portion of their manufacturing to us. If a natural disaster or other business interruption occurred with respect to our high-volume technology manufacturing center, we do not have immediate access to other manufacturing facilities and, as a result, our business would suffer. In addition, if our high-volume technology manufacturing center is unable to produce sufficient product or maintain quality, it could have a material adverse effect on all three of our business segments, results of operations and financial condition.
26
In the past, the U.S. government experienced delays in the receipt of certain components that are ultimately provided to us for incorporation into our satellite transceivers that we ship to the U.S. government. If we do not receive these or other government furnished components in a timely manner, we could experience delays in fulfilling orders from our customers.
Our backlog is subject to customer cancellation or modification and such cancellation could result in a decline in sales and increased provisions for excess and obsolete inventory.
We currently have a backlog of orders, mostly under contracts that the customer may modify or terminate. Almost all of the contracts in our backlog (including firm orders previously received from the U.S. government) are subject to cancellation at the convenience of the customer or for default in the event that we are unable to perform under the contract. We can give no assurance that our backlog will result in net sales.
We record a provision for excess and obsolete inventory based on historical and future usage trends and other factors including the consideration of the amount of backlog we have on hand at any particular point in time. If our backlog is canceled or modified, our estimates of future product demand may prove to be inaccurate, in which case we may have understated the provision required for excess and obsolete inventory. In the future, if we determine that our inventory is overvalued, we will be required to recognize such costs in our financial statements at the time of such determination. Any such charges could be materially adverse to our results of operations and financial condition.
Contract cost growth on our fixed price contracts and other contracts that cannot be justified as an increase in contract value due from customers exposes us to reduced profitability and the potential loss of future business and other risks.
A substantial portion of our products and services are sold under fixed price contracts. This means that we bear the risk of unanticipated technological, manufacturing, supply or other problems, price increases or other increases in the cost of performance. Operating margin is adversely affected when contract costs that cannot be billed to the customer are incurred. This cost growth can occur if initial estimates used for calculating the contract price were incorrect, or if estimates to complete increase.
The cost estimation process requires significant judgment and expertise. Reasons for cost growth may include unavailability and productivity of labor, the nature and complexity of the work to be performed, the effect of change orders, the availability of materials, the effect of any delays in performance, availability and timing of funding from the customer, natural disasters, and the inability to recover any claims included in the estimates to complete. A significant change in an estimate on one or more programs could have a material impact on our business, results of operations and financial condition.
We face a number of risks relating to the expected long-term growth of our business. Our business and operating results may be negatively impacted if we are unable to manage this growth.
These risks include:
|
•
|
The loss of key technical or management personnel could adversely affect our business
–
Our future success depends on the continued contributions of key technical management personnel, including the key corporate and operating unit management at each of our subsidiaries. Many of our key personnel, particularly the key engineers at our subsidiaries, would be difficult to replace, and are not subject to employment or non-competition agreements. Our expected long-term growth and future success will depend, in large part, upon our ability to attract and retain highly qualified engineering, sales and marketing personnel. Competition for such personnel from other companies, academic institutions, government entities and other organizations is intense. Although we believe that we have been successful to date in recruiting and retaining key personnel, we may not be successful in attracting and retaining the personnel we will need to grow and operate profitably. Also, the management skills that have been appropriate for us in the past may not continue to be appropriate if we grow and diversify.
|
|
•
|
We may not be able to improve our processes and systems to keep pace with anticipated growth
–
Certain of our businesses have experienced periods of rapid growth that have placed, and may continue to place, significant demands on our managerial, operational and financial resources. In order to manage this growth, we must continue to improve and expand our management, operational and financial systems and controls. We also need to continue to recruit and retain personnel and train and manage our employee base. We must carefully manage research and development capabilities and production and inventory levels to meet product demand, new product introductions and product and technology transitions. If we are not able to timely and effectively manage our growth and maintain the quality standards required by our existing and potential customers, we could experience a material adverse effect on our business, results of operations and financial condition.
|
27
|
•
|
Our markets are highly competitive and there can be no assurance that we can continue our success
–
The markets for our products are highly competitive. There can be no assurance that we will be able to continue to compete successfully or that our competitors will not develop new technologies and products that are more effective than our own. We expect the DoD’s increased use of commercial off-the-shelf products and components in military equipment will encourage new competitors to enter the market. Also, although the implementation of advanced telecommunications services is in its early stages in many developing countries, we believe competition will continue to intensify as businesses and foreign governments realize the market potential of telecommunications services. Many of our competitors have financial, technical, marketing, sales and distribution resources greater than ours.
|
Future acquisitions and investments may divert our resources and management attention, and the benefits from such acquisitions and investments may fall short of expectations.
We intend to continue pursuing acquisitions or investments in businesses, technologies and product lines. Future acquisitions or investments may result in the use of significant amounts of cash, potentially dilutive issuances of equity securities, incurrence of additional debt, increases to amortization expenses and the future write-off of intangibles acquired. Such acquisitions or investments may also conflict with our
$100.0 million
secured revolving credit facility (“Credit Facility”), thereby limiting our ability to draw on the Credit Facility or requiring us to repay the Credit Facility. Acquisitions involve other operational risks, including:
|
•
|
difficulties in the integration of the operations, technologies, products and personnel of an acquired business, including the loss of key employees or customers of any acquired business;
|
|
•
|
diversion of management’s attention from other business concerns; and
|
|
•
|
increased expenses associated with acquired businesses including managing the growth of such businesses.
|
There can be no assurance that our future acquisitions and investments will be successful and will not adversely affect our business, results of operations or financial condition.
Our revolving credit facility contains restrictions that could limit our ability to implement our business plan.
We have a committed
$100.0 million
, secured revolving credit facility (“Credit Facility”) with a syndicate of bank lenders that expires on
April 30, 2014
but may be extended by us to
December 31, 2016
, subject to certain conditions. The Credit Facility contains certain covenants, including covenants limiting certain debt, certain liens on assets, certain sales of assets and receivables, certain payments (including dividends), certain repurchases of equity securities, certain sale and leaseback transactions, certain guaranties and certain investments. The Credit Facility also contains financial condition covenants requiring that we: (i) not exceed a maximum ratio of consolidated total indebtedness to Consolidated Adjusted EBITDA (each as defined in the Credit Facility); (ii) not exceed a maximum ratio of consolidated senior secured indebtedness to Consolidated Adjusted EBITDA (each as defined in the Credit Facility); (iii) maintain a minimum fixed charge ratio (as defined in the Credit Facility); (iv) maintain a minimum consolidated net worth; in each case measured on the last day of each fiscal quarter, and (v) in the event total consolidated indebtedness (as defined in the Credit Facility) is less than
$200.0 million
, we maintain a minimum level of Consolidated Adjusted EBITDA (as defined in the Credit Facility).
Our Credit Facility, as amended, also contains certain events of default, including: failure to make payments, failure to perform or observe terms, or a change of control (as defined in the agreement). If an event of default occurs, the lenders may, among other things, terminate their commitments and declare all outstanding borrowings, if any, to be immediately due and payable together with accrued interest and fees. These restrictions and covenants may limit our ability to implement our business plan, finance future operations, respond to changing business and economic conditions, secure additional financing, and engage in certain strategic transactions. In addition, if we fail to meet the covenants contained in our Credit Facility, our ability to borrow under our Credit Facility may be restricted.
If we have significant borrowings under the agreement and we violate a covenant or an event of default occurs and the lenders accelerate the maturity of any outstanding borrowings and terminate their commitment to make future loans, it could have a material adverse effect on our business, results of operations and financial condition. In addition, an event of default under our Credit Facility could constitute an event of default under our 3.0% senior convertible notes, requiring us to repay the outstanding principal amount of the notes and accrued and unpaid interest on the notes. There can be no assurance that we will be able to comply with our financial or other covenants or that any covenant violations will be waived. In addition, if we fail to comply with our financial or other covenants, we may need additional financing in order to service or extinguish our indebtedness. In the future, we may not be able to obtain financing or refinancing on terms acceptable to us, if at all.
28
If we are unable to pay quarterly dividends at the annual targeted level, our reputation and stock price may be harmed.
In September 2011, our Board of Directors approved an annual targeted dividend of $1.10 per common share. We have paid quarterly dividends for eight straight quarters and, in fiscal
2012
, we paid
$22.6 million
of cash dividends to our shareholders.
The dividend program requires the use of a portion of our cash flow. Our ability to continue to pay quarterly dividends will depend on our ability to generate sufficient cash flows from operations in the future. This ability may be subject to certain economic, financial, competitive and other factors that are beyond our control. Our Board of Directors may, at its discretion, decrease the targeted annual dividend amount or entirely discontinue the payment of dividends at any time. Any failure to pay dividends after we have announced our intention to do so may negatively impact our reputation, investor confidence in us and negatively impact our stock price.
Protection of our intellectual property is limited and we are subject to the risk that third parties may claim our products or systems infringe their intellectual property rights.
Our businesses rely, in large part, upon our proprietary scientific and engineering know-how and production techniques. Historically, patents have not been an important part of the protection of our intellectual property rights as competitors routinely develop similar but non-infringing products. We rely upon the laws of unfair competition and restrictions in licensing agreements and confidentiality agreements to protect our intellectual property.
The departure of any of our key management and technical personnel, the breach of their confidentiality and non-disclosure obligations to us or the failure to achieve our intellectual property objectives may have a material adverse effect on our business, results of operations and financial condition. Our ability to compete successfully and achieve future revenue growth will depend, in part, on our ability to protect our proprietary technology and operate without infringing upon the rights of others. We may fail to do so. In addition, the laws of certain countries in which our products are or may be sold may not protect our products or intellectual property rights to the same extent as the laws of the U.S.
From time to time, we receive correspondence alleging that a product or other part of our business infringes the intellectual property rights of a third party. We believe that we own or have licensed all intellectual property rights necessary for the operation of our businesses as currently contemplated.
If any technology we use is found to infringe on protected technology, we could be required to change our business practices, license the protected technology, and/or pay damages or other compensation to the infringed party and/or our customers who have incorporated our products into their systems or businesses. If we are unable to license protected technology that we use in our business or if we are required to change our business practices, we could be prohibited from making and selling some of our products or providing certain telecommunications services.
Provisions in our corporate documents and Delaware law could delay or prevent a change in control of Comtech.
We have taken a number of actions that could have the effect of discouraging, delaying or preventing a merger or acquisition involving Comtech that our stockholders may consider favorable.
For example, we have a classified board and the employment contract with our chief executive officer and agreements with other of our executive officers provide for substantial payments in certain circumstances or in the event of a change of control of Comtech. In the future, we may adopt a stockholder rights plan which could cause substantial dilution to a stockholder, and substantially increase the cost paid by a stockholder, who attempts to acquire us on terms not approved by our Board of Directors.
In addition, we are subject to the provisions of Section 203 of the Delaware General Corporation Law, an anti-takeover law. In general, this statute provides that, except in certain limited circumstances, a corporation shall not engage in any “business combination” with an “interested stockholder” for a period of three years after the date of the transaction in which the person became an interested stockholder, unless the business combination is approved in a prescribed manner.
A “business combination” includes mergers, asset sales and other transactions resulting in a financial benefit to the interested stockholder. Subject to certain exceptions, for purposes of Section 203 of the Delaware General Corporation Law, an “interested stockholder” is a person who, together with affiliates, owns, or within three years did own, 15% or more of the corporation’s voting stock. This provision could have the effect of delaying or preventing a change in control of Comtech.
29
Our debt service obligations may adversely affect our cash flow.
Our 3.0% convertible senior notes are convertible into shares of our common stock at any time prior to the close of business on the second scheduled trading day immediately preceding the maturity date, subject to adjustment in certain circumstances (such as the declaration of cash dividends on our common stock) and contain certain restrictions and covenants. We can provide no assurances that we will not default on these or other debt obligations. We may, at our option, redeem some or all of the 3.0% convertible senior notes on or after May 5, 2014. Holders of the 3.0% convertible senior notes will have the right to require us to repurchase some or all of the outstanding 3.0% convertible senior notes, solely for cash, on May 1, 2014, May 1, 2019 and May 1, 2024 and upon certain events, including a change in control. If not redeemed by us or repaid pursuant to the holders’ right to require repurchase, the 3.0% convertible senior notes mature on May 1, 2029. If the holders of our 3.0% convertible senior notes require us to repurchase some or all of the outstanding notes that they own, there can be no assurance that we will be able to generate sufficient cash flow to repay the 3.0% convertible senior notes or that future working capital, borrowings or equity financing will be available to pay or refinance them. The level of our indebtedness, among other things, could: make it difficult for us to make payments on our debt; make it difficult for us to obtain any necessary financing in the future for working capital, acquisitions, capital expenditures, debt service requirements or other purposes; limit our flexibility in planning for, or reacting to, changes in our business and the industry in which we compete; and make us more vulnerable in the event of a downturn in our business.
Our stock price is volatile.
The stock market in general and the stock prices of technology-based companies, in particular, has experienced extreme volatility that often has been unrelated to the operating performance of any specific public company. The market price of our common stock has fluctuated significantly in the past and is likely to fluctuate significantly in the future as well. Factors that could have a significant impact on the market price of our stock are described throughout the Risk Factors section and include, among others:
|
•
|
strategic transactions, such as acquisitions and divestures;
|
|
•
|
issuance of potentially dilutive equity or equity-type securities;
|
|
•
|
future announcements concerning us or our competitors;
|
|
•
|
receipt or non-receipt of substantial orders for products and services;
|
|
•
|
quality deficiencies in services or products;
|
|
•
|
results of technological innovations;
|
|
•
|
new commercial products;
|
|
•
|
changes in recommendations of securities analysts;
|
|
•
|
government regulations;
|
|
•
|
changes in the status or outcome of government audits;
|
|
•
|
proprietary rights or product or patent litigation;
|
|
•
|
changes in U.S. government policies;
|
|
•
|
changes related to ongoing military conflicts;
|
|
•
|
changes in economic conditions generally, particularly in the telecommunications sector;
|
|
•
|
changes in securities market conditions, generally;
|
|
•
|
changes in the status of litigation and legal matters (including changes in the status of export matters);
|
|
•
|
changes in the status of U.S government investigations relating to our CEO;
|
|
•
|
cyber-attacks;
|
|
•
|
energy blackouts;
|
|
•
|
acts of terrorism or war;
|
|
•
|
inflation or deflation; and
|
|
•
|
rumors or allegations regarding our financial disclosures or practices.
|
Shortfalls in our sales or earnings in any given period relative to the levels expected by securities analysts could immediately, significantly and adversely affect the trading price of our common stock.
None.
30
Historically, we have not owned any material properties or facilities and have relied upon a strategy of leasing. Our properties and facilities are noted below:
|
•
|
Our corporate headquarters are located in an office building complex in Melville, New York. The lease, which is for 9,600 square feet, provides for our use of the premises through August 2013.
|
|
•
|
Our RF microwave amplifiers segment manufactures our solid-state, high-power, broadband amplifiers, in a 45,000 square foot engineering and manufacturing facility on more than two acres of land in Melville, New York and a 6,000 square foot facility in Topsfield, Massachusetts. We lease the New York facility from a partnership controlled by our Chairman, Chief Executive Officer and President. The lease provides for our use of the premises as they exist through December 2021 with an option for an additional ten-year period. In connection with the lease renewal in September 2011, our Nominating and Governance Committee of the Board of Directors obtained written reports from three independent commercial real estate firms regarding prevailing rents for comparable facilities. Based on this assessment, and the continued suitability of the facility for our current operations, the annual rent of the facility was reduced to $580,000 for calendar 2012 and is subject to customary adjustments. We have a right of first refusal in the event of a sale of the facility.
|
|
•
|
Our RF microwave amplifiers segment also manufactures our amplifiers in a leased manufacturing facility located in Santa Clara, California. This facility is approximately 47,000 square feet and is subject to a lease agreement that expires in April 2019. Our RF microwave amplifiers segment also operates a small office in the United Kingdom that expires in 2016.
|
|
•
|
Although primarily used for our satellite earth station product lines, which are part of the telecommunications transmission segment, all three of our business segments utilize our high-volume technology manufacturing facilities located in Tempe, Arizona. These manufacturing facilities, comprising 195,000 square feet, utilize state-of-the-art design and production techniques, including analog, digital and RF microwave production, hardware assembly and full service engineering. Leases comprising 186,000 square feet expire in fiscal 2016 with the remaining 9,000 square feet expiring in fiscal 2014. We have the option to extend the lease terms for up to an additional five-year period through fiscal 2021 for 170,000 square feet related to these leases. As a result of the August 1, 2008 Radyne acquisition, we also assumed a lease for approximately 75,000 square feet of building space in Phoenix, Arizona. The lease for this building expires in October 2018. In connection with our Radyne-acquisition restructuring plan we vacated and subleased this building space through October 2015.
|
|
•
|
Our telecommunications transmission segment leases an additional twelve facilities, six of which are located in the U.S. The U.S. facilities (excluding our Arizona-based facilities) aggregate 105,000 square feet and are primarily utilized for manufacturing, engineering, and general office use. Our telecommunications transmission segment also operates six small offices in Canada, China, India, North Africa, Singapore and the United Kingdom, all of which aggregate 22,000 square feet and are primarily utilized for customer support, engineering and sales.
|
|
•
|
Our mobile data communications segment operates two main facilities aggregating 51,000 square feet. We lease a 26,000 square foot facility located in Germantown, Maryland which contains our main network operations center. This lease expires in March 2018. Our mobile data communications segment also maintains a 25,000 square foot facility in Ashburn, Virginia that expires in October 2013 and was used to support the design, sales and manufacture of our microsatellite products. We also lease a small office located in Colorado that is primarily used for engineering capabilities. In connection with the wind-down of our microsatellite product line, we vacated approximately 12,000 square feet of the Ashburn, Virginia building space as of July 31, 2012 and expect to vacate all of our microsatellite-related facilities during fiscal 2013.
|
The terms for all of our leased facilities are generally for multi-year periods and w
e believe that we will be able to renew these leases or find comparable facilities elsewhere.
Information regarding legal proceedings is incorporated herein by reference to the “
Notes to Consolidated Financial Statements –
Note (14)(b) Commitments and Contingencies – Legal Proceedings and Other Matters
” included in
“Part II— Item 8.— Financial Statements and Supplementary Data,”
included in this Annual Report on Form 10-K.
31
Not applicable.
Stock Performance Graph and Cumulative Total Return
The graph below compares the cumulative total stockholder return on our common stock with the cumulative total return on the S&P’s 500 Index and the NASDAQ Telecommunications Index for each of the last five fiscal years ended July 31, assuming an investment of $100 at the beginning of such period and the reinvestment of any dividends. The comparisons in the graphs below are based upon historical data and are not indicative of, nor intended to forecast, future performance of our common stock.
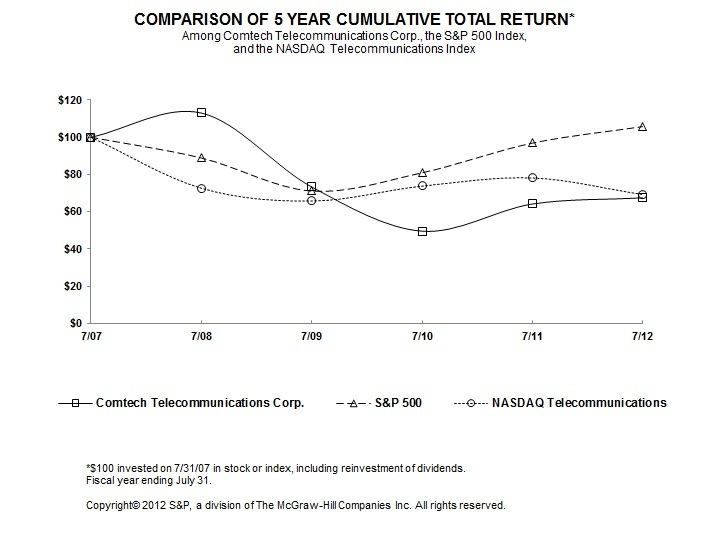
Our common stock trades on the NASDAQ Stock Market LLC (“NASDAQ”) under the symbol “CMTL.”
32
The following table shows the quarterly range of the high and low sale prices for our common stock as reported by the NASDAQ. Such prices do not include retail markups, markdowns or commissions.
|
|
Common Stock
|
||||||
|
|
High
|
Low
|
|||||
|
Fiscal Year Ended July 31, 2011
|
|
|
|||||
|
First Quarter
|
$
|
31.48
|
|
20.19
|
|
||
|
Second Quarter
|
32.00
|
|
25.75
|
|
|||
|
Third Quarter
|
29.94
|
|
25.46
|
|
|||
|
Fourth Quarter
|
29.80
|
|
23.51
|
|
|||
|
Fiscal Year Ended July 31, 2012
|
|
|
|
|
|||
|
First Quarter
|
$
|
34.08
|
|
24.04
|
|
||
|
Second Quarter
|
35.65
|
|
27.88
|
|
|||
|
Third Quarter
|
34.89
|
|
30.66
|
|
|||
|
Fourth Quarter
|
31.75
|
|
26.51
|
|
|||
Dividends
On September 27, 2011, our Board of Directors raised our annual targeted dividend from $1.00 per common share to $1.10 per common share.
During the fiscal year ended
July 31, 2012
, we declared four quarterly cash dividends of $0.275 per common share, each of which was paid to our stockholders on
November 22, 2011
,
February 22, 2012
,
May 22, 2012
and
August 20, 2012
.
On
September 26, 2012
, our Board of Directors declared a dividend of $0.275 per common share, payable on
November 20, 2012
to shareholders of record at the close of business on
October 19, 2012
.
While future dividends will be subject to Board of Directors approval, we currently expect that comparable cash dividends will continue to be paid to our stockholders in future periods. The declaration and payment of dividends in the future will depend upon our earnings, capital requirements, financial condition, compliance with our Credit Facility, and other factors considered relevant by our Board of Directors.
Recent Sales of Unregistered Securities
None.
33
Purchases of Equity Securities by the Issuer and Affiliated Purchasers
The number and average price of shares purchased during the fiscal year ended
July 31, 2012
are set forth in the table below:
|
|
Total Number
of Shares
Purchased
|
Average Price
Paid per Share
|
Total Number
of Shares Purchased as
part of Publicly
Announced
Program
|
Approximate Dollar Value
of Shares that May Yet Be Purchased Under the Program
|
||||||||||
|
August 1 – August 31, 2011
|
476,866
|
|
$
|
26.23
|
|
476,866
|
|
$
|
116,004,000
|
|
||||
|
September 1 – September 30, 2011
|
479,492
|
|
27.78
|
|
479,492
|
|
202,693,000
|
|
||||||
|
October 1 – October 31, 2011
|
1,771,035
|
|
31.42
|
|
1,761,035
|
|
147,402,000
|
|
||||||
|
November 1 – November 30, 2011
|
1,284,625
|
|
33.69
|
|
1,284,625
|
|
104,144,000
|
|
||||||
|
December 1 – December 31, 2011
|
643,494
|
|
29.09
|
|
643,494
|
|
85,440,000
|
|
||||||
|
January 1 – January 31, 2012
|
420,780
|
|
29.92
|
|
420,780
|
|
72,858,000
|
|
||||||
|
February 1 – February 29, 2012
|
245,363
|
|
32.62
|
|
245,363
|
|
64,858,000
|
|
||||||
|
March 1 – March 31, 2012
|
269,358
|
|
32.69
|
|
269,358
|
|
56,058,000
|
|
||||||
|
April 1 – April 30, 2012
|
473,009
|
|
32.79
|
|
473,009
|
|
40,560,000
|
|
||||||
|
May 1 – May 31, 2012
|
331,199
|
|
30.19
|
|
331,199
|
|
30,569,000
|
|
||||||
|
June 1 – June 30, 2012
|
490,528
|
|
28.74
|
|
490,528
|
|
16,480,000
|
|
||||||
|
July 1 – July 31, 2012
|
179,865
|
|
29.00
|
|
179,865
|
|
11,268,000
|
|
||||||
|
Total
|
7,065,614
|
|
30.81
|
|
7,055,614
|
|
11,268,000
|
|
||||||
In September 2011, our Board of Directors authorized a $250.0 million stock repurchase program. There is no time restriction on this authorization an
d repurchases may be made in open-market or privately negotiated transactions and may be made pursuant to SEC Rule 10b5-1 trading plans.
During the fiscal year ended
July 31, 2012
, we repurchased
7,055,614
shares in open-market transactions for an aggregate cost of
$217,374,000
(including transaction costs) with an average price per share of
$30.81
. In addition, during the period October 1, 2011 through October 31, 2011, an “affiliated purchaser,” as defined in Rule 10b-18(a)(3), purchased
10,000
shares at an average price per share of
$31.51
. As of
July 31, 2012
, we are authorized to repurchase up to an additional
$11,268,000
of our common stock, excluding transaction costs.
See
“Notes to Consolidated Financial Statements – Note (8) Credit Facility,”
included in
“Part II - Item 8. - Financial Statements and Supplementary Data,”
for a description of certain restrictions on equity security repurchases.
Approximate Number of Equity Security Holders
As of
September 21, 2012
, there were approximately
720
holders of our common stock. Such number of record owners was determined from our shareholder records and does not include beneficial owners of our common stock held in the name of various security holders, dealers and clearing agencies.
34
The following table shows selected historical consolidated financial data for our Company.
Detailed historical financial information is included in the audited consolidated financial statements for fiscal
2012
,
2011
and
2010
.
|
|
Fiscal Years Ended July 31,
(In thousands, except per share amounts)
|
|||||||||||||||
|
|
2012
|
2011
|
2010
|
2009
|
2008
|
|||||||||||
|
Consolidated Statement of Operations Data:
|
|
|
|
|
|
|||||||||||
|
Net sales
|
$
|
425,070
|
|
612,379
|
|
778,205
|
|
586,372
|
|
531,627
|
|
|||||
|
Cost of sales
|
241,561
|
|
371,333
|
|
507,607
|
|
345,472
|
|
296,687
|
|
||||||
|
Gross profit
|
183,509
|
|
241,046
|
|
270,598
|
|
240,900
|
|
234,940
|
|
||||||
|
Expenses:
|
|
|
|
|
|
|
|
|
|
|
||||||
|
Selling, general and administrative
|
87,106
|
|
94,141
|
|
99,883
|
|
100,171
|
|
85,967
|
|
||||||
|
Research and development
|
38,489
|
|
43,516
|
|
46,192
|
|
50,010
|
|
40,472
|
|
||||||
|
In-process research and development
|
—
|
|
—
|
|
—
|
|
6,200
|
|
—
|
|
||||||
|
Amortization of intangibles
|
6,637
|
|
8,091
|
|
7,294
|
|
7,592
|
|
1,710
|
|
||||||
|
Impairment of goodwill
|
—
|
|
—
|
|
13,249
|
|
—
|
|
—
|
|
||||||
|
Merger termination fee, net
|
—
|
|
(12,500
|
)
|
—
|
|
—
|
|
—
|
|
||||||
|
|
132,232
|
|
133,248
|
|
166,618
|
|
163,973
|
|
128,149
|
|
||||||
|
Operating income
|
51,277
|
|
107,798
|
|
103,980
|
|
76,927
|
|
106,791
|
|
||||||
|
Other expenses (income):
|
|
|
|
|
|
|
|
|
|
|
||||||
|
Interest expense
|
8,832
|
|
8,415
|
|
7,888
|
|
6,396
|
|
7,100
|
|
||||||
|
Interest income and other
|
(1,595
|
)
|
(2,421
|
)
|
(1,210
|
)
|
(2,738
|
)
|
(14,065
|
)
|
||||||
|
Income before provision for income taxes
|
44,040
|
|
101,804
|
|
97,302
|
|
73,269
|
|
113,756
|
|
||||||
|
Provision for income taxes
|
11,624
|
|
33,909
|
|
36,672
|
|
25,744
|
|
40,106
|
|
||||||
|
Net income
|
$
|
32,416
|
|
67,895
|
|
60,630
|
|
47,525
|
|
73,650
|
|
|||||
|
Net income per share:
|
|
|
|
|
|
|
|
|
|
|
||||||
|
Basic
|
$
|
1.62
|
|
2.53
|
|
2.14
|
|
1.81
|
|
3.05
|
|
|||||
|
Diluted
|
$
|
1.42
|
|
2.22
|
|
1.91
|
|
1.73
|
|
2.76
|
|
|||||
|
Weighted average number of common shares outstanding – basic
|
19,995
|
|
26,842
|
|
28,270
|
|
26,321
|
|
24,138
|
|
||||||
|
Weighted average number of common and common equivalent shares outstanding – diluted
|
25,991
|
|
32,623
|
|
34,074
|
|
29,793
|
|
28,278
|
|
||||||
|
Dividends declared per issued and outstanding common share as of the applicable dividend record date
|
$
|
1.10
|
|
1.00
|
|
—
|
|
—
|
|
—
|
|
|||||
35
|
|
Fiscal Years Ended July 31,
(In thousands)
|
|||||||||||||||
|
|
2012
|
2011
|
2010
|
2009
|
2008
|
|||||||||||
|
Other Consolidated Operating Data:
|
|
|
|
|
|
|||||||||||
|
Backlog at period-end
|
$
|
153,939
|
|
145,029
|
|
338,107
|
|
549,833
|
|
201,122
|
|
|||||
|
New orders
|
433,980
|
|
419,301
|
|
567,457
|
|
883,750
|
|
603,705
|
|
||||||
|
Research and development expenditures - internal and customer funded
|
44,153
|
|
54,219
|
|
58,803
|
|
64,955
|
|
48,224
|
|
||||||
|
|
As of July 31,
(In thousands)
|
|||||||||||||||
|
|
2012
|
2011
|
2010
|
2009
|
2008
|
|||||||||||
|
Consolidated Balance Sheet Data:
|
|
|
|
|
|
|||||||||||
|
Total assets
|
$
|
719,778
|
|
937,509
|
|
1,066,562
|
|
938,671
|
|
652,723
|
|
|||||
|
Working capital
|
434,221
|
|
627,008
|
|
686,600
|
|
596,525
|
|
484,454
|
|
||||||
|
Convertible senior notes
|
200,000
|
|
200,000
|
|
200,000
|
|
200,000
|
|
91,946
|
|
||||||
|
Other long-term obligations
|
5,098
|
|
6,360
|
|
2,518
|
|
2,283
|
|
—
|
|
||||||
|
Stockholders’ equity
|
429,401
|
|
629,180
|
|
701,632
|
|
629,129
|
|
450,773
|
|
||||||
On November 13, 2009, we filed a Report on Form 8-K with the SEC which contains our financial statements for the historical fiscal years ended July 31, 2005 through July 31, 2009, as retroactively adjusted for the adoption of FASB ASC 470-20, “Debt - Debt With Conversion and Other Options.” The periods presented herein reflect the retroactive adjustment for this adoption.
FINANCIAL CONDITION AND RESULTS OF OPERATIONS
Overview
We design, develop, produce and market innovative products, systems and services for advanced communications solutions. We believe many of our solutions play a vital role in providing or enhancing communication capabilities when terrestrial communications infrastructure is unavailable, inefficient or too expensive. We conduct our business through three complementary operating segments: telecommunications transmission, RF microwave amplifiers and mobile data communications. We sell our products to a diverse customer base in the global commercial and government communications markets. We believe we are a leader in the market segments that we serve.
Our telecommunications transmission segment provides sophisticated equipment and systems that are used to enhance satellite transmission efficiency and that enable wireless communications in environments where terrestrial communications are unavailable, inefficient or too expensive. Our telecommunications transmission segment also operates our high-volume technology manufacturing center that can be utilized, in part, by our RF microwave amplifiers and mobile data communications segments and to a much lesser extent by third-party commercial customers who outsource a portion of their manufacturing to us. Accordingly, our telecommunications transmission segment’s operating results are impacted positively or negatively by the level of utilization of our high-volume manufacturing center.
Our RF microwave amplifiers segment designs, manufactures and markets traveling wave tube amplifiers and solid-state amplifiers, including high-power, broadband RF microwave amplifier products.
Our mobile data communications segment provides customers with integrated solutions, including mobile satellite transceivers and satellite network support, to enable global satellite-based communications when mobile, real-time, secure transmission is required for applications including logistics, support and battlefield command and control. The vast majority of sales in our mobile data communications segment have historically been derived from indefinite delivery/indefinite quantity (“IDIQ”) contracts to support two U.S. military programs known as Movement Tracking System (“MTS”) and Blue Force Tracking (“BFT-1”). As discussed in this Annual Report on Form 10-K (“Form 10-K”), in fiscal 2013 and beyond, we expect revenues in this segment to be at materially lower levels than we achieved in fiscal 2012 because the BFT-1 program is in a sustainment mode (See "
BFT-1 Sustainment Activities"
below). Also, during fiscal 2012, we adopted a plan to wind-down our mobile data communications segment's microsatellite product line. In connection with this decision, we recorded a $2.6 million restructuring charge, of which $1.3 million is reflected in cost of sales and $1.3 million is reflected in selling, general and administrative expenses.
36
Quarterly and period-to-period sales and operating results may be significantly affected by either short-term or long-term contracts with our customers. In addition, our gross profit is affected by a variety of factors, including the mix of products, systems and services sold, production efficiencies, estimates of warranty expense, price competition and general economic conditions. Our gross profit may also be affected by the impact of any cumulative adjustments to contracts that are accounted for under the percentage-of-completion method.
Our contracts with the U.S. government can be terminated at any time and orders are subject to unpredictable funding, deployment and technology decisions by the U.S. government. Some of these contracts, such as the BFT-1 sustainment contract, are IDIQ contracts, and as such, the U.S. government is not obligated to purchase any equipment or services under these contracts. We have in the past experienced and we continue to expect significant fluctuations in sales and operating results from quarter-to-quarter and period-to-period. As such, comparisons between periods and our current results may not be indicative of a trend or future performance.
As further discussed below, under
“Critical Accounting Policies,
” revenue from the sale of our products is generally recognized when the earnings process is complete, upon shipment or customer acceptance. Revenue from contracts relating to the design, development or manufacture of complex electronic equipment to a buyer’s specification or to provide services relating to the performance of such contracts is generally recognized in accordance with accounting standards that have been codified into Financial Accounting Standards Board (“FASB”) Accounting Standards Codification (“ASC”) 605-35, “Revenue Recognition - Construction-Type and Production-Type Contracts” (“ASC 605-35”). Revenue from contracts that contain multiple elements that are not accounted for under FASB ASC 605-35 is generally accounted for in accordance with FASB ASC 605-25, “Revenue Recognition - Multiple Element Arrangements,” which, among other things, requires revenue associated with multiple element arrangements to be allocated to each element based on the relative selling price method.
BFT-1 Sustainment Activities
The vast majority of sales in our mobile data communications segment have historically come from sales relating to U.S. military programs known as the U.S. Army’s Movement Tracking System (“MTS”) program and the Force XXI Battle Command, Brigade and Below (“FBCB2”) command and control system's Blue Force Tracking (“BFT-1”) program. Our combined MTS and BFT-1 sales for fiscal
2010
through fiscal
2012
were as follows:
|
|
Net
Sales
(in millions)
|
Percentage of
Mobile Data
Communications
Segment Net Sales
|
Percentage of
Consolidated
Net Sales
|
|||||||
|
2012
|
$
|
87.8
|
|
78.0
|
%
|
20.6
|
%
|
|||
|
2011
|
248.6
|
|
86.2
|
%
|
40.6
|
%
|
||||
|
2010
|
423.2
|
|
94.8
|
%
|
54.4
|
%
|
||||
We have supplied mobile satellite transceivers, vehicle and command center application software, third-party produced ruggedized computers and satellite earth station network gateways and associated installation, training and maintenance to the MTS program which now operates under the auspices of the BFT-1 program under the direction of the FBCB2-BFT program office. Our MTS-related services also included the monitoring of satellite packet data networks.
In July 2010, a third party vendor was selected by the U.S. Army to develop a next generation BFT program known as BFT-2. The U.S. Army has stated that it expects to transition to BFT-2 as quickly as possible. We expect that future MTS and BFT-1 orders and related sales will largely be dependent on the ability and speed of the U.S. Army to transition to the BFT-2 system. As a result, we expect future annual sales (and related operating income) from both of these programs to materially decline from current levels.
We are currently providing BFT-1 sustainment services pursuant to a three-year IDIQ BFT-1 sustainment contract that we were awarded in March 2012. This three-year contract has a not-to-exceed value of $80.7 million and a base performance period that began April 1, 2012 and ends March 31, 2013. The contract provides for two twelve-month option periods exercisable by the U.S. Army and, except for a fixed annual intellectual property license ("IP license") fee of $10.0 million, the three-year $80.7 million contract value is subject to finalization and downward negotiation. Effective July 1, 2012, we are no longer procuring satellite bandwidth for the U.S. Army.
37
Under the terms of the BFT-1 sustainment contract, we agreed to perform certain satellite network and related engineering services (including program management) on a cost-plus-fixed-fee basis. In addition, the contract allows the U.S. Army to purchase certain mobile satellite transceivers on a firm fixed-price basis. Specific terms and conditions related to the IP license are covered by a separate licensing agreement that provides for annual renewals, at the U.S. Army's option, for up to a five-year period, after which time the U.S. Army will have a limited non-exclusive right to use certain of our IP for no additional IP licensing fee. Payments of annual IP license fees beyond the base year are contingent upon the U.S. Army's exercise of optional performance periods.
In connection with the initial three-year $80.7 million IDIQ BFT-1 sustainment contract award, we received a funded order for the initial base year of $17.0 million, of which $10.0 million was designated for payment of the first year IP license fee and $7.0 million was designated for engineering services, program management and satellite network operations. Pricing for the engineering services, program management and satellite network operations has not yet been finalized and it is possible that we can receive incremental funding of up to $8.6 million upon finalization.
Our BFT-1 sustainment contract can be terminated by the government at any time and is not subject to automatic renewal. Except for orders received to date, the U.S. Army is not obligated to purchase any additional equipment or services under this IDIQ contract. We believe that any future MTS and BFT-1 orders and related sales will largely be dependent on the ability and speed of the U.S. Army to transition to the BFT-2 system and we expect future annual sales (and related operating income) from both of these programs to materially decline from current levels.
Critical Accounting Policies
We consider certain accounting policies to be critical due to the estimation process involved in each.
Revenue Recognition on Long-Term Contracts.
Revenues and related costs from long-term contracts relating to the design, development or manufacture of complex electronic equipment to a buyer’s specification or to provide services relating to the performance of such contracts are recognized in accordance with FASB ASC 605, “Revenue Recognition - Construction-Type and Production-Type Contracts” (“ASC 605-35”). We primarily apply the percentage-of-completion accounting method and generally recognize revenue based on the relationship of total costs incurred to total projected costs, or, alternatively, based on output measures, such as units delivered or produced. Profits expected to be realized on such contracts are based on total estimated sales for the contract compared to total estimated costs, including warranty costs, at completion of the contract.
Direct costs which include materials, labor and overhead are charged to work-in-progress (including our contracts-in-progress) inventory or cost of sales. Indirect costs relating to long-term contracts, which include expenses such as general and administrative, are charged to expense as incurred and are not included in our work-in-process (including our contracts-in-progress) inventory or cost of sales. Total estimates are reviewed and revised periodically throughout the lives of the contracts, and adjustments to profits resulting from such revisions are made cumulative to the date of the change. Estimated losses on long-term contracts are recorded in the period in which the losses become evident. Long-term U.S. government cost-reimbursable type contracts are also specifically covered by FASB ASC 605-35.
We have been engaged in the production and delivery of goods and services on a continual basis under contractual arrangements for many years. Historically, we have demonstrated an ability to accurately estimate total revenues and total expenses relating to our long-term contracts. However, there exist inherent risks and uncertainties in estimating revenues, expenses and progress toward completion, particularly on larger or longer-term contracts. If we do not accurately estimate the total sales, related costs and progress towards completion on such contracts, the estimated gross margins may be significantly impacted or losses may need to be recognized in future periods. Any such resulting changes in margins or contract losses could be material to our results of operations and financial condition.
In addition, most government contracts have termination for convenience clauses that provide the customer with the right to terminate the contract at any time. Such terminations could impact the assumptions regarding total contract revenues and expenses utilized in recognizing profit under the percentage-of-completion method of accounting. Changes to these assumptions could materially impact our results of operations and financial condition. Historically, we have not experienced material terminations of our long-term contracts. We also address customer acceptance provisions in assessing our ability to perform our contractual obligations under long-term contracts. Our inability to perform on our long-term contracts could materially impact our results of operations and financial condition. Historically, we have been able to perform on our long-term contracts.
Accounting for Stock-Based Compensation
.
As discussed further in
“Notes to Consolidated Financial Statements – Note (1)(j) Accounting for Stock-Based Compensation”
included in
“Part II — Item 8 — Financial Statements and Supplementary Data,”
we issue stock-based awards to certain of our employees and our Board of Directors and we recognize related stock-based compensation for both equity and liability-classified stock-based awards in our consolidated financial statements.
38
We have used and expect to continue to use the Black-Scholes option pricing model to compute the estimated fair value of certain stock-based awards. The Black-Scholes option pricing model includes assumptions regarding dividend yield, expected volatility, expected option term and risk-free interest rates. The assumptions used in computing the fair value of stock-based awards reflect our best estimates, but involve uncertainties relating to market and other conditions, many of which are outside of our control.
The expected dividend yield is the expected annual dividend as a percentage of the fair market value of the stock on the date of grant. We estimate expected volatility by considering the historical volatility of our stock, the implied volatility of publicly traded call options on our stock, the implied volatility from call options embedded in our 3.0% convertible senior notes and our expectations of volatility for the expected life of stock options. The expected option term is the number of years that we estimate that stock options will be outstanding prior to exercise based upon exercise patterns. The risk-free interest rate is based on the U.S. treasury yield curve in effect at the time of grant for an instrument which closely approximates the expected option term. As a result, if other assumptions or estimates had been used for stock options granted, stock-based compensation expense that was recorded could have been materially different. Furthermore, if different assumptions are used in future periods, stock-based compensation expense could be materially impacted in the future.
Impairment of Goodwill and Other Intangible Assets
.
As of
July 31, 2012
, our goodwill and other intangible assets aggregated
$176.2 million
(of which $
107.8 million
relates to goodwill allocated to our telecommunications transmission segment and $
29.6 million
relates to goodwill allocated to our RF microwave amplifiers segment).
For purposes of reviewing impairment and the recoverability of goodwill and other intangible assets, each of our three operating segments constitutes a reporting unit and we must make various assumptions regarding estimated future cash flows and other factors in determining the fair values of the reporting unit. If these estimates or their related assumptions change in the future, or if we change our reporting structure, we may be required to record impairment charges. If global economic conditions deteriorate from current levels, or if the market value of our equity or assets declines significantly, or if we are not successful in achieving our expected sales levels or if other events or changes in circumstances occur that indicate that the carrying amount of our assets may not be recoverable, our goodwill may become impaired.
We perform an annual impairment review in the first quarter of each fiscal year. On August 1, 2012, we performed our annual impairment review for fiscal 2013 and determined that none of the goodwill recorded on our Consolidated Balance Sheet was impaired.
Based on the review performed as of
August 1, 2012
, we concluded that our telecommunications transmission reporting unit had an estimated fair value in excess of total asset book value of at least
7.0%
. Given current adverse business conditions in our telecommunications transmission reporting unit’s end-markets, we considered, for sensitivity purposes only, a revenue growth rate that is below our actual fiscal 2013 expectations. If our telecommunications transmission reporting unit does not ultimately achieve the expectations of revenues and operating income that we utilized in our sensitivity analysis, a portion or all of the $
107.8 million
of goodwill in this reporting unit may be impaired in future periods.
Based on the review performed as of
August 1, 2012
, we concluded that our RF microwave amplifiers reporting unit had an estimated fair value in excess of total asset book value of approximately
84.0%
. For sensitivity purposes only, we assumed a revenue growth rate for this reporting unit that is below our actual fiscal 2013 expectations. If our RF microwave amplifiers reporting unit does not ultimately achieve the expectations of revenues and operating income that we utilized in our sensitivity analysis, a portion or all of the $
29.6 million
of goodwill in this reporting unit may be impaired in future periods.
Unless there are future indicators of impairment, such as a significant adverse change in our future financial performance, our next impairment review for goodwill will be performed and completed in the first quarter of fiscal 2014. Any impairment charges that we may take in the future could be material to our results of operations and financial condition.
Provision for Warranty Obligations.
We provide warranty coverage for most of our products, including products under long-term contracts, for a period of at least one year from the date of shipment. We record a liability for estimated warranty expense based on historical claims, product failure rates and other factors. Costs associated with some of our warranties that are provided under long-term contracts are incorporated into our estimates of total contract costs.
There exist inherent risks and uncertainties in estimating warranty expenses, particularly on larger or longer-term contracts. As such, if we do not accurately estimate our warranty costs, any changes to our original estimates could be material to our results of operations and financial condition.
39
Accounting for Income Taxes.
Our deferred tax assets and liabilities are determined based on temporary differences between financial reporting and tax bases of assets and liabilities, and applying enacted tax rates expected to be in effect for the year in which the differences are expected to reverse. Our provision for income taxes is based on domestic (including federal and state) and international statutory income tax rates in the tax jurisdictions where we operate, permanent differences between financial reporting and tax reporting and available credits and incentives. We recognize interest and penalties related to uncertain tax positions in income tax expense. The U.S. federal government is our most significant income tax jurisdiction.
Significant judgment is required in determining income tax provisions and tax positions. We may be challenged upon review by the applicable taxing authority and positions taken by us may not be sustained. We recognize all or a portion of the benefit of income tax positions only when we have made a determination that it is more-likely-than-not that the tax position will be sustained upon examination, based upon the technical merits of the position and other factors. For tax positions that are determined as more-likely-than-not to be sustained upon examination, the tax benefit recognized is the largest amount of benefit that is greater than 50% likely of being realized upon ultimate settlement. The development of reserves for income tax positions requires consideration of timing and judgments about tax issues and potential outcomes, and is a subjective critical estimate. In certain circumstances, the ultimate outcome of exposures and risks involves significant uncertainties. If actual outcomes differ materially from these estimates, they could have a material impact on our results of operations and financial condition.
Provisions for Excess and Obsolete Inventory.
We record a provision for excess and obsolete inventory based on historical and future usage trends. Other factors may also influence our provision, including decisions to exit a product line, technological change and new product development. These factors could result in a change in the amount of excess and obsolete inventory on hand. Additionally, our estimates of future product demand may prove to be inaccurate, in which case we may have understated or overstated the provision required for excess and obsolete inventory. In the future, if we determine that our inventory was overvalued, we would be required to recognize such costs in our financial statements at the time of such determination. Any such charge could be material to our results of operations and financial condition.
Allowance for Doubtful Accounts.
We perform credit evaluations of our customers and adjust credit limits based upon customer payment history and current creditworthiness, as determined by our review of our customers’ current credit information. Generally, we will require cash in advance or payment secured by irrevocable letters of credit before an order is accepted from an international customer that we do not do business with regularly. In addition, we seek to obtain insurance for certain domestic and international customers.
We monitor collections and payments from our customers and maintain an allowance for doubtful accounts based upon our historical experience and any specific customer collection issues that we have identified. In light of ongoing tight credit market conditions, we continue to see requests from our customers for higher credit limits and longer payment terms. Because of our strong cash position and the nominal amount of interest we are earning on our cash and cash equivalents, we have, on a limited basis, approved certain customer requests.
We continue to monitor our accounts receivable credit portfolio and have not had any significant negative customer credit experiences to date. While our credit losses have historically been within our expectations of the allowances established, we cannot guarantee that we will continue to experience the same credit loss rates that we have in the past, especially in light of the current global economic conditions and much tighter credit environment. Measurement of credit losses requires consideration of historical loss experience, including the need to adjust for current conditions, and judgments about the probable effects of relevant observable data, including present economic conditions such as delinquency rates and the financial health of specific customers. Changes to the estimated allowance for doubtful accounts could be material to our results of operations and financial condition.
40
Results of Operations
The following table sets forth, for the periods indicated, certain income and expense items expressed as a percentage of our consolidated net sales:
|
|
Fiscal Years Ended July 31,
|
||||||||
|
|
2012
|
2011
|
2010
|
||||||
|
Net sales
|
100.0
|
%
|
100.0
|
%
|
100.0
|
%
|
|||
|
Gross margin
|
43.2
|
|
39.4
|
|
34.8
|
|
|||
|
Selling, general and administrative expenses
|
20.5
|
|
15.4
|
|
12.8
|
|
|||
|
Research and development expenses
|
9.1
|
|
7.1
|
|
5.9
|
|
|||
|
Amortization of intangibles
|
1.6
|
|
1.3
|
|
0.9
|
|
|||
|
Impairment of goodwill
|
—
|
|
—
|
|
1.7
|
|
|||
|
Merger termination fee, net
|
—
|
|
(2.0
|
)
|
—
|
|
|||
|
Operating income
|
12.1
|
|
17.6
|
|
13.4
|
|
|||
|
Interest expense (income) and other, net
|
1.7
|
|
1.0
|
|
0.9
|
|
|||
|
Income before provision for income taxes
|
10.4
|
|
16.6
|
|
12.5
|
|
|||
|
Net income
|
7.6
|
|
11.1
|
|
7.8
|
|
|||
Business Outlook for Fiscal
2013
Total consolidated net sales in fiscal
2013
are expected to be lower than the
$425.1
million we achieved in fiscal 2012, almost entirely due to lower expected net sales in our mobile data communications segment. We anticipate revenue growth in our telecommunications transmission segment in fiscal 2013 and believe that sales in our RF microwave amplifiers segment in fiscal 2013 will be comparable to the amount we achieved in fiscal 2012.
During fiscal 2013, we expect a materially lower level of sales in our mobile data communications segment, as compared to fiscal 2012, due to lower expected sales to the U.S. Army for the BFT-1 program and because we are no longer offering microsatellite products to our customers (which accounted for $17.7 million of revenues in fiscal 2012). Our business outlook for fiscal 2013 assumes that the U.S. Army will exercise the twelve month option period beginning April 2013 pursuant to our existing three-year BFT-1 sustainment contract. However, if the U.S. Army does not exercise this option, it is possible that we may not generate any revenues from the BFT-1 program beyond March 31, 2013.
In response to our expectations of lower consolidated net sales in fiscal
2013
, we have taken, and continue to take, a number of cost reduction actions throughout our operating segments and we expect to continue to refine our cost structure going forward. Our business outlook assumes that we will likely record a $1.0 million restructuring charge during the first quarter of fiscal 2013 in connection with the wind-down of our microsatellite product line.
As of July 31, 2012, we had cash and cash equivalents of
$367.9 million
. We expect to supplement organic growth opportunities by making one or more acquisitions.
Our business outlook for fiscal
2013
is difficult to predict as we continue to operate our business in an environment of challenging global economic conditions and U.S. and foreign government budget constraints.
On November 23, 2011, the Joint Select Committee on Deficit Reduction (commonly referred to as the Super Committee which was established as part of the Budget Control Act of 2011) failed to recommend legislation that would reduce net U.S. government spending by at least $1.2 trillion over the next 10 years. As of
September 26, 2012
, Congress has not yet identified the required spending reductions and, as a result, it is possible that there will be an automatic sequestration of discretionary appropriations for U.S. defense programs. Although we believe that the majority of our products and services are well aligned with national defense and other national priorities, we cannot predict the outcome of final budget deliberations, other actions of Congress, or the extent to which any reductions in spending may impact total funding and/or individual funding for programs in which we participate and the resulting impact to our business and financial outlook and actual results.
41
To date, largely as a result of overall challenging macroeconomic conditions and significant U.S. and foreign government budget constraints, we have experienced delays in customer orders and reductions in customer spending. If business conditions further deteriorate or our current or prospective customers materially postpone, reduce or even forgo purchases of our products and services to a greater extent than we currently anticipate, our business outlook will be adversely affected.
Additional information related to our fiscal
2013
business outlook on certain income statement line items and recent operating segment booking trends is included in the below section entitled
“Comparison of Fiscal
2012
and
2011
.”
Comparison of Fiscal
2012
and
2011
Net Sales.
Consolidated net sales were
$425.1
million and
$612.4
million for fiscal
2012
and
2011
, respectively, representing a
decrease
of
$187.3
million, or
30.6%
. As further discussed below, the significant period-over-period
decrease
reflects lower net sales in our telecommunications transmission segment, and more notably in our mobile data communications segment, partially offset by higher sales in our RF microwave amplifiers segment.
Telecommunications transmission
Net sales in our telecommunications transmission segment were
$210.0
million and
$232.0
million for fiscal
2012
and
2011
, respectively, a
decrease
of
$22.0
million, or
9.5%
. This
decrease
reflects significantly lower sales in our over-the-horizon microwave systems product line and, to a lesser extent, lower sales in our satellite earth station product line.
Sales of our satellite earth station products were lower during fiscal
2012
as compared to fiscal
2011
. Although sales related to international customers were higher in fiscal 2012 as compared to fiscal 2011, sales related to the U.S. government were lower due to U.S. government budget pressures. Based on our current backlog and the anticipated timing of orders we expect to receive, we expect annual sales in this product line in fiscal
2013
to be higher than the level we achieved in fiscal
2012
. However, if business conditions deteriorate from current levels and we do not receive expected orders, we may not be able to achieve our expected level of fiscal
2013
sales.
Sales of our over-the-horizon microwave systems significantly decreased during fiscal
2012
as compared to fiscal
2011
, primarily as a result of lower sales related to a nearly completed $36.3 million contract whose end-user is a North African government, and a completed $11.0 million contract whose end-user is a Middle Eastern government. These decreases were offset, in part, by shipments related to orders for our Modular Transportable Troposcatter System ("MTTS") for end-use by the U.S. Army. In fiscal 2012, we began recording revenue related to a $55.0 million contract we received in June 2012 from a domestic prime contractor to design and furnish a telecommunications system for use in a North African government's communications network. Revenue from this contract is expected to be recognized over a three-year performance period. Based on our current backlog and the anticipated receipt of future orders (including additional orders for our MTTS equipment), we expect annual sales in this product line in fiscal
2013
to be significantly higher than the level we achieved in fiscal
2012
. If we do not receive additional MTTS and other expected orders, we may not be able to achieve our expected level of sales in fiscal
2013
.
Our telecommunications transmission segment represented
49.4%
of consolidated net sales for fiscal
2012
as compared to
37.9%
for fiscal
2011
. Bookings, sales and profitability in our telecommunications transmission segment can fluctuate from period-to-period due to many factors, including the book and ship nature of our satellite earth station product business, the current adverse conditions in the global economy and the timing of, and our related performance on, contracts from the U.S. government and international customers for our over-the-horizon microwave systems.
RF microwave amplifiers
Net sales in our RF microwave amplifiers segment were
$102.5
million for fiscal
2012
, as compared to
$92.0
million for fiscal
2011
, an
increase
of
$10.5
million, or
11.4%
. This
increase
primarily reflects higher sales of our traveling wave tube amplifiers.
Bookings in our RF microwave amplifiers segment for fiscal
2012
were significantly higher as compared to fiscal
2011
. Although overall market conditions remain challenging and the ability to predict the timing of additional awards remains difficult, we continue to see relatively strong demand for both our traveling wave tube and solid-state high-power amplifier product lines. Based on our current backlog and the anticipated timing of orders we expect to receive, we expect annual net sales in this segment in fiscal
2013
to be comparable to the level we achieved in fiscal
2012
. However, if business conditions further deteriorate and we do not receive expected orders, we may not be able to achieve our expected level of sales in fiscal
2013
.
Our RF microwave amplifiers segment represented
24.1%
of consolidated net sales for fiscal
2012
as compared to
15.0%
for fiscal
2011
. Bookings, sales and profitability in our RF microwave amplifiers segment can fluctuate from period-to-period due to many factors, including the challenging business conditions and U.S. and international military budget constraints that currently exist, and the timing of, and our related performance on, contracts from the U.S. government and international customers.
42
Mobile data communications
Net sales in our mobile data communications segment were
$112.6
million for fiscal
2012
as compared to $
288.4
million for fiscal
2011
, a substantial
decrease
of $
175.8
million, or
61.0%
. This
decrease
is attributable to a substantial anticipated decline in combined MTS and BFT-1 sales to the U.S. Army and, to a lesser extent, lower sales related to the design and manufacture of microsatellites.
Sales to the U.S. Army for both the MTS and BFT-1 programs during fiscal
2012
were
$87.8 million
, or
78.0%
of our mobile data communications segment's sales, as compared to $
248.6 million
, or
86.2%
, during fiscal 2011. MTS and BFT-1 program sales for fiscal
2012
reflect lower revenues resulting from the U.S. Army's July 2010 decision to award a third party a contract for the next-generation BFT-2 network and its related decision to combine the MTS program with the BFT-1 program.
Sales related to the design and manufacture of microsatellites for fiscal
2012
were
$17.7 million
, a significant decrease from the
$30.5 million
we achieved in fiscal
2011
. This decline is almost entirely attributable to lower revenues related to our large contract to deliver a spacecraft bus to the U.S. Navy's Naval Research Laboratory. Pursuant to an agreement with our customer, we substantially ceased work related to this contract in June
2012
. As a result of the extreme pressures on our U.S. government customer to reduce spending, and the lack of bookings and the uncertainty of future orders relating to our microsatellite product line, in the fourth quarter of fiscal
2012
, we adopted a plan to wind-down our microsatellite product line. In connection with this plan, and as further discussed below, we recorded a $2.6 million restructuring charge in fiscal 2012. As a result, we expect virtually no revenue to be generated from the sale of microsatellite products in fiscal 2013.
As discussed in the above section entitled “
BFT-1 Sustainment Activities,
” we currently anticipate that the majority of future sales in our mobile data communications segment will be generated from sales of MTS and BFT-1 equipment and services pursuant to our three-year IDIQ contract. Based on the timing of our performance on orders currently in our backlog and additional orders we expect to receive, and due to the cessation of sales of microsatellite products, we expect sales in our mobile data communications segment to be materially lower in fiscal
2013
as compared to the level we achieved in fiscal
2012
.
Our mobile data communications segment represented
26.5%
of consolidated net sales for fiscal
2012
as compared to
47.1%
for fiscal
2011
. Bookings, sales and profitability in our mobile data communications segment can fluctuate dramatically from period-to-period due to many factors, including unpredictable funding, deployment and technology decisions by the U.S. government. As such, period-to-period comparisons of our results may not be indicative of a trend or future performance.
Geography and Customer Type
Sales to the U.S. government (including sales to prime contractors of the U.S. government) represented
48.9%
and
61.7%
of consolidated net sales for fiscal
2012
and
2011
, respectively. International sales (which include sales to U.S. companies for inclusion in products that are sold to international customers) represented
38.7%
and
30.2%
of consolidated net sales for fiscal
2012
and
2011
, respectively. Domestic commercial sales represented
12.4%
and
8.1%
of consolidated net sales for fiscal
2012
and
2011
, respectively.
The lower percentage of consolidated net sales to the U.S. government during fiscal
2012
reflects substantially lower sales to the U.S. Army for the MTS and BFT-1 programs. In light of the decline in MTS and BFT-1 program sales that is expected to occur in fiscal
2013
and our decision to wind-down our microsatellite product line, we expect both our domestic commercial and international sales in fiscal
2013
, as a percentage of consolidated net sales, to increase as compared to fiscal
2012
.
Gross Profit.
Gross profit was
$183.5
million and $
241.0
million for fiscal
2012
and
2011
, respectively, representing a
decrease
of $
57.5
million which was primarily driven by the significant decline in consolidated net sales.
Despite the decline in gross profit dollars during fiscal
2012
, our gross profit, as a percentage of consolidated net sales, increased from
39.4%
for fiscal
2011
to
43.2%
for fiscal
2012
. During fiscal
2012
, our gross profit benefited by approximately
$5.6
million related to the finalization of pricing for certain previously received MTS and BFT-1 orders, partially offset by a charge of
$1.3
million in cost of sales related to our plan to wind-down our microsatellite product line. Excluding this net benefit, gross profit, as a percentage of consolidated net sales for fiscal
2012
, would have been
42.7%
as compared to the
39.4%
we achieved for fiscal
2011
. This increase primarily reflects a significantly higher percentage of consolidated net sales occurring in our telecommunications transmission segment which generally has a higher gross profit percentage than our other two reportable operating segments and an overall better mix of products in our RF microwave amplifiers segment. We expect our gross profit, as a percentage of net sales, in fiscal 2013 to increase from the percentage we achieved in fiscal 2012. Gross profit, as a percentage of related segment sales is further discussed below.
43
Our telecommunications transmission segment's gross profit, as a percentage of related net sales, for fiscal
2012
, was higher than the percentage achieved for fiscal
2011
. This
increase
is primarily attributable to better than expected performance related to our North African government and Middle Eastern government over-the-horizon microwave system contracts and an overall favorable product mix. Gross margins in our telecommunications transmission segment during fiscal
2012
reflect lower production, as compared to fiscal
2011
, of MTS and BFT-1 products for our mobile data communications segment which, in turn, sells them to the U.S. Army. Based on the nature and type of orders that are currently in our backlog and anticipated orders we expect to receive, we expect the gross profit percentage in our telecommunications transmission segment, in fiscal
2013
, to be slightly lower than the level this segment achieved in fiscal
2012
.
Our RF microwave amplifiers segment experienced a higher gross profit, both in dollars and as a percentage of related net sales, for fiscal
2012
as compared to fiscal
2011
. This increase is attributable to an improvement in overall product mix, including fewer developmental projects in fiscal 2012 as compared to fiscal 2011. Based on the nature and type of orders that are currently in our backlog and anticipated orders we expect to receive, we expect gross profit, both in dollars and as a percentage of related net sales in this segment in fiscal
2013
to be slightly lower than the level we achieved in fiscal
2012
.
Our mobile data communications segment's gross profit, as a percentage of related net sales, for fiscal
2012
was slightly higher as compared to fiscal
2011
. During fiscal
2012
, this segment's gross profit benefited by approximately
$5.6
million related to the finalization of pricing for certain previously received MTS and BFT-1 orders. Excluding this benefit, our mobile data communications segment's gross profit, as a percentage of related net sales, for fiscal
2012
would have been lower than the level we achieved for fiscal
2011
, primarily due to a change in overall product mix and a charge of
$1.3
million of the
$2.6 million
restructuring charge associated with our decision to wind-down our microsatellite product line. Our fiscal
2012
gross profit in this segment also reflects the benefit from the four months of revenue we recorded related to our $10.0 million annual intellectual property license ("IP license") fee that we collected in fiscal 2012 pursuant to a three-year BFT-1 IDIQ sustainment contract with the U.S. Army. Looking forward, the exact amount of our gross profit percentage expected in this segment in fiscal 2013 is difficult to quantify because, as discussed in the above section entitled “
BFT-1 Sustainment Activities,
” the pricing and terms for various other contracted products and services has not yet been finalized and the U.S. Army is not obligated to order any additional products. Significant period-to-period fluctuations in our gross profit percentage and gross margins can occur in our mobile data communications segment as a result of the nature, timing and mix of actual deliveries which are primarily driven by the U.S. Army's requirements.
Included in consolidated cost of sales for fiscal
2012
and
2011
are provisions for excess and obsolete inventory of
$3.9 million
and
$4.1 million
, respectively. As discussed in our
“Item 2. Management's Discussion and Analysis of Financial Condition and Results of Operations - Critical Accounting Policies - Provisions for Excess and Obsolete Inventory,”
we regularly review our inventory and record a provision for excess and obsolete inventory based on historical and projected usage assumptions.
It is always difficult to predict sales and product mix for each individual segment; as such it is difficult to estimate consolidated gross profit, as a percentage of consolidated net sales in future periods. Nevertheless, based on orders currently in our backlog and orders we expect to receive, we anticipate that our consolidated gross profit, as a percentage of consolidated net sales will be higher in fiscal 2013 as compared to fiscal 2012.
Selling, General and Administrative Expenses
.
Selling, general and administrative expenses were $
87.1
million and $
94.1
million for fiscal
2012
and
2011
, respectively, representing a
decrease
of $
7.0
million, or
7.4%
.
In fiscal
2012
, our selling, general and administrative expenses reflect
$1.3
million of restructuring charges (including $0.7 million of accelerated depreciation) of the
$2.6 million
restructuring charge associated with our decision to wind-down our microsatellite product line. In addition, selling, general and administrative expenses in fiscal 2012 reflect
$2.6
million of costs related to a contested proxy solicitation in connection with our fiscal
2011
annual meeting of stockholders. This contested proxy solicitation was initiated by a third party who publicly announced, on November 18, 2011, that it would not proceed with its proxy solicitation. There was no agreement with, consideration paid to, or any accommodation granted to this third party by us.
Excluding the
$3.9
million of restructuring and proxy solicitation costs discussed above, our selling, general and administrative expenses for fiscal
2012
decreased by $
10.9
million as compared to fiscal
2011
. This decrease was primarily driven by a decrease in (i) compensation-related expenses associated with a lower level of consolidated net sales during fiscal 2012 and (ii) lower depreciation expense related to certain mobile data communications segment fixed assets fully depreciated in fiscal 2011 due to the expiration of our MTS contract. This decrease was partially offset by increased legal costs and professional fees associated with legal proceedings and other matters, including those specifically discussed in
“Notes to Consolidated Financial Statements - Note (14)(b) Commitments and Contingencies - Legal Proceedings and Other Matters”
included in
“Part II - Item 8. - Financial Statements and Supplementary Data.”
44
Amortization of stock-based compensation expense recorded as selling, general and administrative expenses decreased to $
2.7 million
in fiscal
2012
from $
4.0 million
in fiscal
2011
.
As a percentage of consolidated net sales, selling, general and administrative expenses were
20.5%
and
15.4%
for fiscal
2012
and
2011
, respectively. This increase is primarily attributable to the significantly lower level of consolidated net sales during fiscal
2012
as compared to fiscal
2011
.
Selling, general and administrative expenses, in dollars, are currently expected to decrease in fiscal
2013
as compared to fiscal
2012
. As a percentage of consolidated net sales, we expect selling, general and administrative expenses to increase. We also expect to record approximately $1.0 million of additional microsatellite product line restructuring charges during the first quarter of fiscal 2013, at which time efforts related to this product line are expected to cease. As previously discussed in our earlier SEC filings, we have taken and continue to take cost reduction actions in all of our reportable operating segments.
Research and Development Expenses.
Research and development expenses were $
38.5
million and $
43.5
million for fiscal
2012
and
2011
, respectively, representing a
decrease
of $
5.0
million, or
11.5%
.
For fiscal
2012
and
2011
, research and development expenses of $
28.2
million and $
27.6
million, respectively, related to our telecommunications transmission segment, $
8.7
million and $
8.8
million, respectively, related to our RF microwave amplifiers segment, $
1.0
million and $
6.1
million, respectively, related to our mobile data communications segment, with the remaining expenses related to the amortization of stock-based compensation expense which is not allocated to our three operating segments.
Amortization of stock-based compensation expense recorded as research and development expenses was $
0.6 million
and $
1.0 million
for fiscal
2012
and
2011
, respectively.
As a percentage of consolidated net sales, research and development expenses were
9.1%
and
7.1%
for fiscal
2012
and
2011
, respectively. The increase in research and development expenses, as a percentage of consolidated net sales, is attributable to the significantly lower level of consolidated net sales during fiscal
2012
as compared to fiscal
2011
. We expect research and development expenses, in dollars, for fiscal
2013
to be comparable to the amount we invested during fiscal
2012
and, as a percentage of consolidated net sales, to increase.
As an investment for the future, we are continually enhancing our existing products and developing new products and technologies. Whenever possible, we seek customer funding for research and development to adapt our products to specialized customer requirements. During fiscal
2012
and
2011
, customers reimbursed us
$5.7
million and
$10.7
million, respectively, which is not reflected in the reported research and development expenses, but is included in net sales with the related costs included in cost of sales.
Amortization of Intangibles.
Amortization relating to intangible assets with finite lives was $
6.6
million and $
8.1
million in fiscal 2012 and
2011
, respectively. The
decrease
is primarily attributable to certain intangible assets that were fully amortized in fiscal
2011
and 2012.
Excluding the impact of any acquisitions that we may make in fiscal
2013
, amortization of intangibles with finite lives for fiscal
2013
is currently anticipated to approximate
$6.3 million
.
Merger Termination Fee.
During fiscal 2011, we benefited from the receipt of a net merger termination fee of $12.5 million related to a Termination and Release Agreement dated September 7, 2010, by which we and CPI International, Inc. ("CPI") terminated a previously announced Merger Agreement dated May 8, 2010.
Operating Income.
Operating income for fiscal
2012
and
2011
was $
51.3
million, or
12.1%
of consolidated net sales, and $
107.8
million, or
17.6%
of consolidated net sales, respectively.
Excluding the net benefit to operating income during fiscal
2012
associated with the previously discussed finalization of pricing and increased funding for certain MTS and BFT-1 orders, the
$2.6
million of costs associated with the withdrawn contested proxy solicitation and the
$2.6
million of microsatellite product line restructuring charges, operating income approximated $
50.9
million, or
12.1%
of consolidated net sales for fiscal
2012
. Excluding the net merger termination fee of $12.5 million recorded in the first quarter of fiscal 2011, operating income approximated $
95.3
million or
15.6%
of consolidated net sales for fiscal 2011.
The decline in operating income (both in dollars and as a percentage of consolidated net sales) is attributable to the significantly lower level of consolidated net sales we achieved during fiscal
2012
as compared to fiscal
2011
. Operating income, by segment, is discussed further below.
45
Operating income in our telecommunications transmission segment was $
41.7
million or
19.9%
of related net sales for fiscal
2012
as compared to $
49.9
million or
21.5%
of related net sales for fiscal
2011
. This decrease in operating income, both in dollars and as a percentage of related net sales, is primarily attributable to the decrease in this segment's net sales and slightly higher research and development expenses, as discussed above. Operating income in this segment, during fiscal
2012
, also reflects increased legal fees and professional costs associated with legal proceedings and other matters, including those discussed in
“Notes to Consolidated Financial Statements - Note (14)(b) Commitments and Contingencies - Legal Proceedings and Other Matters”
included in
“Part II - Item 8. - Financial Statements and Supplementary Data.”
Our RF microwave amplifiers segment generated operating income of $
7.6
million or
7.4%
of related net sales for fiscal
2012
as compared to $
1.1
million or
1.2%
of related net sales for fiscal
2011
. This increase in operating income, both in dollars and as a percentage of related net sales, is primarily due to higher net sales and a higher gross profit as a percentage of related net sales, as discussed above.
Our mobile data communications segment generated operating income of $
20.0
million or
17.7%
of related net sales for fiscal
2012
as compared to $
64.9
million or
22.5%
of related net sales for fiscal
2011
. The decrease in operating income, both in dollars and as a percentage of related net sales, was primarily due to this segment's lower net sales, partially offset by the increase in the gross profit percentage (including the fiscal
2012
benefit associated with the finalization of pricing related to certain MTS and BFT-1 orders), and lower operating expenses, as discussed above. Operating income in this segment, in fiscal 2012, also reflects $2.6 million of charges related to our microsatellite product line restructuring plan. A further breakdown of these charges is discussed in
“Notes to Consolidated Financial Statements - Note (7) Cost Reduction Actions”
included in
“Part II - Item 8. - Financial Statements and Supplementary Data.”
Unallocated operating expenses were $
18.0
million for fiscal
2012
as compared to $
8.1
million for fiscal
2011
. Excluding the aforementioned $2.6 million of proxy solicitation costs recorded as selling, general and administrative expenses and the previously discussed receipt of a $12.5 million net merger termination fee associated with the termination of the CPI acquisition agreement, unallocated operating expenses were $
15.4
million and $
20.6
million for fiscal
2012
and
2011
, respectively. This $
5.2
million
decrease
is primarily attributable to a decline in selling, general and administrative expenses associated with the lower level of consolidated net sales, as discussed above. In addition, unallocated operating expenses in fiscal 2012 reflect legal fees and professional costs associated with certain legal proceedings and other matters, including those specifically discussed in
“Notes to Consolidated Financial Statements - Note (14)(b) Commitments and Contingencies - Legal Proceedings and Other Matters”
included in
“Part II - Item 8. - Financial Statements and Supplementary Data.”
Amortization of stock-based compensation expense, which is included in unallocated operating expenses, was $
3.6 million
in fiscal
2012
as compared to $
5.4 million
in fiscal
2011
.
Because the pricing for various products and services we have agreed to provide to the U.S. Army has not yet been finalized and it remains difficult to predict our overall consolidated sales product mix, it is difficult to precisely estimate future operating margins as a percentage of related net sales. Nevertheless, based on the orders currently in our backlog and orders we expect to receive, our consolidated operating income, as a percentage of consolidated net sales, for fiscal
2013
is expected to be in the range of 13.0% to 14.0%.
Interest Expense.
Interest expense was $
8.8
million and $
8.4
million for fiscal
2012
and
2011
, respectively. The
increase
in interest expense is primarily due to (i) accelerated amortization of deferred financing costs related to lowering our borrowing capacity on our secured revolving credit facility from $150.0 million to $100.0 million, (ii) higher unused credit facility fees and (iii) a full year of accretion of interest on the contingent earn-out liability related to our October 2010 acquisition of technology assets from Stampede.
Interest Income and Other.
Interest income and other for fiscal
2012
was $
1.6
million as compared to $
2.4
million for fiscal
2011
. The
decrease
of $
0.8
million is primarily attributable to lower cash balances as a result of repurchases of our common stock and dividend payments. All of our available cash and cash equivalents are currently invested in bank deposits, money market mutual funds, certificates of deposit, and short-term U.S. Treasury securities which, at this time, are currently yielding a blended annual interest rate of approximately 0.38%.
46
Provision for Income Taxes.
The provision for income taxes was $
11.6
million and $
33.9
million for fiscal
2012
and
2011
, respectively. Our effective tax rate was
26.4%
for fiscal 2012 compared to
33.3%
for fiscal
2011
.
Our effective tax rate for fiscal
2012
reflects a net discrete tax benefit of approximately $3.8 million, of which $2.8 million relates to the effective settlement of certain federal and state income tax audits with the remaining amount principally relating to the reversal of previously recorded tax liabilities no longer required due to the expiration of applicable statutes of limitation. Our effective tax rate for fiscal
2011
reflects net discrete tax benefits of approximately $1.7 million, primarily relating to the reversal of tax contingencies no longer required due to the expiration of applicable statutes of limitation, the passage of legislation that included the retroactive extension of the federal research and experimentation credit, and a reduction in expenses that were previously deemed to be non-deductible for tax purposes. For both fiscal
2012
and
2011
, excluding discrete tax items in both periods, our effective tax rate was approximately 35.0%.
Excluding the impact of discrete tax items, our fiscal 2013 estimated effective tax rate is expected to approximate 34.5%. This rate reflects anticipated changes in the geographic mix of our earnings and increased domestic manufacturing deductions, offset, in part, by the expiration of the federal research and experimentation credit on December 31, 2011.
Our federal income tax returns for fiscal 2010, 2011 and 2012 are subject to potential future IRS audit. Future tax assessments or settlements for other potential later periods, or for other tax jurisdictions, could have a material adverse effect on our consolidated results of operations and financial condition.
Comparison of Fiscal 2011 and 2010
Net Sales.
Consolidated net sales were $612.4 million and $778.2 million for fiscal 2011 and 2010, respectively, representing a decrease of $165.8 million, or 21.3%. The period-over-period decrease in net sales is attributable to lower net sales in both our mobile data communications and RF microwave amplifiers segments offset, in part, by higher sales in our telecommunications transmission segment.
Telecommunications transmission
Net sales in our telecommunications transmission segment were $232.0 million and $219.7 million for fiscal 2011 and 2010, respectively, an increase of $12.3 million, or 5.6%. Net sales in this segment reflect significantly higher sales of our over-the-horizon microwave systems, which were partially offset by lower sales of our satellite earth station products.
Sales of our satellite earth station products during fiscal 2011 were lower as compared to fiscal 2010. During fiscal 2011, our sales and bookings were negatively impacted by adverse global business conditions and volatile political conditions in certain end-customer markets. In addition, we experienced lower sales and bookings from our U.S. government customers who are under extreme pressure to reduce overall spending.
Sales of our over-the-horizon microwave systems for fiscal 2011 were significantly higher than sales for fiscal 2010. The increase was primarily driven by our performance on our $36.3 million contract (including $0.9 million of additional orders received in fiscal 2011) for our North African country end-customer and our $11.0 million contract whose end-user is a Middle Eastern government.
Our telecommunications transmission segment represented 37.9% of consolidated net sales for fiscal 2011 as compared to 28.2% for fiscal 2010.
RF microwave amplifiers
Net sales in our RF microwave amplifiers segment were $92.0 million for fiscal 2011, as compared to $112.0 million for fiscal 2010, a decrease of $20.0 million, or 17.9%. During fiscal 2011, our sales and bookings for both solid-state high-power amplifiers and traveling wave tube amplifiers were negatively impacted by adverse global business conditions and volatile political conditions in certain foreign markets. In addition, we experienced lower sales and bookings from our U.S. and international government customers who are under extreme pressure to reduce overall spending.
Our RF microwave amplifiers segment represented 15.0% of consolidated net sales for fiscal 2011 as compared to 14.4% for fiscal 2010.
Mobile data communications
Net sales in our mobile data communications segment were $288.4 million and $446.5 million for fiscal 2011 and 2010, respectively, a decrease of $158.1 million, or 35.4%. This decrease is primarily attributable to a significant decline in sales to the U.S. Army partially offset by increased sales related to the design and manufacture of microsatellites.
47
Sales to the U.S. Army for both the MTS and BFT-1 program during fiscal 2011 were $248.6 million, or 86.2% of our mobile data communication’s segment’s sales, as compared to $423.2 million, or 94.8%, during fiscal 2010. Sales to these programs declined in fiscal 2011 as compared to fiscal 2010 primarily as a result of lower shipments for certain large orders related to MTS ruggedized computers and related accessories in fiscal 2011 as compared to fiscal 2010. During fiscal 2011, our MTS contract expired and the program was consolidated into BFT-1.
Sales in our mobile data communications segment include sales related to the design and manufacture of microsatellites. Sales of this product line were
$30.5 million
in fiscal 2011 as compared to
$12.6 million
in fiscal 2010. This increase was primarily driven by our efforts to deliver a spacecraft bus to the U.S. Navy’s Naval Research Laboratory pursuant to a contract award that we received in March 2010.
Our mobile data communications segment represented 47.1% of consolidated net sales for fiscal 2011 as compared to 57.4% for fiscal 2010.
Geography and Customer Type
Sales to the U.S. government (including sales to prime contractors of the U.S. government) represented 61.7% and 71.1% of consolidated net sales for fiscal 2011 and 2010, respectively. International sales (which include sales to U.S. companies for inclusion in products that are sold to international customers) represented 30.2% and 22.9% of consolidated net sales for fiscal 2011 and 2010, respectively. Domestic commercial sales represented 8.1% and 6.0% of consolidated net sales for fiscal 2011 and 2010, respectively.
Gross Profit.
Gross profit was $241.0 million and $270.6 million for fiscal 2011 and 2010, respectively, representing a decrease of $29.6 million. This decrease was driven by lower consolidated net sales that were partially offset by an increase in our gross profit as a percentage of consolidated net sales. Gross profit as a percentage of consolidated net sales was 39.4% for fiscal 2011 as compared to 34.8% for fiscal 2010. The increase in gross profit as a percentage of consolidated net sales during fiscal 2011 was primarily attributable to a higher percentage of consolidated net sales occurring in our telecommunications transmission segment. Our telecommunications transmission segment generally has a higher gross profit percentage than our other two reportable operating segments. In addition, our gross profit as a percentage of consolidated net sales was impacted by changes in product mix, as further discussed below.
Our telecommunications transmission segment’s gross profit, as a percentage of related sales, for fiscal 2011 was lower than the gross profit percentage we achieved in fiscal 2010. This decline was driven by increased sales related to lower gross margins for certain over-the-horizon microwave system contracts. In addition, our gross profit percentage in fiscal 2011 reflects lower overall usage of our high-volume technology manufacturing center, located in Tempe, Arizona, that was primarily driven by lower production of MTS and BFT-1 products for our mobile data communications segment, which in turn, sells them to the U.S. Army.
Our RF microwave amplifiers segment experienced a lower gross profit, as a percentage of related net sales, during fiscal 2011 as compared to fiscal 2010, primarily due to lower overhead absorption associated with the lower RF microwave amplifiers net sales as discussed above, as well as reserves, primarily related to certain developmental projects.
Our mobile data communications segment experienced a significantly higher gross profit, as a percentage of related net sales, during fiscal 2011 as compared to fiscal 2010, due to changes in overall product mix. During fiscal 2011, we benefited from the sale of high gross margin MTS software license seats to the U.S. Army and we also benefited from the finalization and completed delivery of certain MTS orders.
Included in cost of sales for fiscal 2011 and 2010 are provisions for excess and obsolete inventory of $4.1 million and $7.7 million, respectively. During fiscal 2010, we recorded a write-down of approximately $2.6 million of older generation MTS computers that we had in our inventories. As discussed in our Item 7.
“Management’s Discussion and Analysis of Financial Condition and Results of Operations – Critical Accounting Policies – Provisions for Excess and Obsolete Inventory,”
we regularly review our inventory and record a provision for excess and obsolete inventory based on historical and projected usage assumptions.
Selling, General and Administrative Expenses
.
Selling, general and administrative expenses were $94.1 million and $99.9 million for fiscal 2011 and 2010, respectively, representing a decrease of $5.8 million, or 5.8%. As a percentage of consolidated net sales, selling, general and administrative expenses were 15.4% and 12.8% for fiscal 2011 and 2010, respectively.
48
The decrease in selling, general and administrative expenses during fiscal 2011 as compared to fiscal 2010 was driven by (i) lower overall spending resulting from cost reduction actions, (ii) lower amortization of stock-based compensation and (iii) the reversal of approximately $2.0 million of certain cost contingencies which were no longer required. This decrease was offset, in part, by the acceleration of depreciation expense related to certain fixed assets no longer expected to be utilized by our mobile data communications segment as a result of the expiration of our MTS contract in July 2011.
Amortization of stock-based compensation expense recorded as selling, general and administrative expenses decreased to $4.0 million in fiscal 2011 from $6.3 million in fiscal 2010. Our stock-based compensation expense for fiscal 2010 included incremental expense associated with the extension of contractual lives for certain previously granted stock-based awards. There was no such modification in fiscal 2011.
Research and Development Expenses.
Research and development expenses were $43.5 million and $46.2 million for fiscal 2011 and 2010, respectively, representing a decrease of $2.7 million, or 5.8%.
For fiscal 2011 and 2010, research and development expenses of $27.6 million and $27.7 million, respectively, related to our telecommunications transmission segment, $8.8 million and $10.9 million, respectively, related to our RF microwave amplifiers segment and $6.1 million and $6.0 million, respectively, related to our mobile data communications segment, with the remaining expenses related to the amortization of stock-based compensation expense which is not allocated to our three reportable operating segments.
Amortization of stock-based compensation expense recorded as research and development expenses was $1.0 million and $1.6 million for fiscal 2011 and 2010, respectively. Our stock-based compensation expense for fiscal 2010 included the incremental expense related to the extension of contractual lives for certain previously granted stock-based awards. There was no such modification in fiscal 2011.
As a percentage of consolidated net sales, research and development expenses were 7.1% and 5.9% for fiscal 2011 and 2010, respectively. The increase in research and development expenses, as a percentage of consolidated net sales, is attributable to the significantly lower level of consolidated net sales during fiscal 2011 as compared to fiscal 2010.
During fiscal 2011 and 2010, customers reimbursed us $10.7 million and $12.6 million, respectively, which is not reflected in the reported research and development expenses, but is included in net sales with the related costs included in cost of sales.
Amortization of Intangibles.
Amortization relating to intangible assets with finite lives was $8.1 million and $7.3 million for fiscal 2011 and 2010, respectively. Amortization for fiscal 2011 includes amortization expense associated with our October 2010 purchase of technology assets from Stampede.
Impairment of Goodwill.
In fiscal 2010,
we
recorded a $13.2 million goodwill impairment charge in our mobile data communications segment. There was no impairment of goodwill in fiscal 2011.
Merger Termination Fee.
During fiscal 2011, we benefited from the receipt of a merger termination fee of $12.5 million (net of certain directly related expenses) related to a Termination and Release Agreement dated September 7, 2010, by which we and CPI terminated a previously announced Merger Agreement dated May 8, 2010.
Operating Income.
Operating income for fiscal 2011 and 2010 was $107.8 million, or 17.6% of consolidated net sales, and $104.0 million, or 13.4% of consolidated net sales, respectively. As further discussed below, excluding the net merger termination fee of $12.5 million recorded in fiscal 2011 and the goodwill impairment charge of $13.2 million recorded in fiscal 2010, operating income would have approximated 15.6% of fiscal 2011 consolidated net sales as compared to 15.1% of fiscal 2010 consolidated net sales.
Operating income in our telecommunications transmission segment was $49.9 million or 21.5% of related net sales, for fiscal 2011 as compared to $47.5 million or 21.6% of related net sales for fiscal 2010. The slight decrease in operating income, as a percentage of related net sales is primarily attributed to a lower gross profit percentage, as discussed above.
Our RF microwave amplifiers segment generated operating income of $1.1 million, or 1.2% of related net sales, for fiscal 2011 as compared to $9.8 million or 8.8% of related net sales for fiscal 2010. The decrease in operating income, as a percentage of related net sales, is primarily due to this segment’s decline in net sales and gross profit percentage, as discussed above, partially offset by lower operating expenses.
49
Operating income in our mobile data communications segment was $64.9 million, or 22.5% of related net sales, for fiscal 2011 as compared to $75.5 million or 16.9% of related net sales for fiscal 2010. The increase in operating income, as a percentage of related net sales, was driven by the significant increase in the gross profit percentage, as discussed above. This increase was partially offset by additional depreciation expense related to certain fixed assets, as discussed above. Operating income in fiscal 2010 includes an expense of $13.2 million for goodwill impairment.
Unallocated operating expenses were $8.1 million for fiscal 2011 as compared to $28.8 million for fiscal 2010. Excluding the net merger termination fee of $12.5 million, unallocated operating expenses for fiscal 2011 were $20.6 million, which represents a decrease of $8.2 million as compared to fiscal 2010. The significant decrease was primarily due to lower overall spending as a result of our cost reduction efforts and lower stock-based compensation expense and the reversal of approximately $2.0 million related to certain cost contingencies that were no longer required.
Amortization of stock-based compensation expense, which is included in unallocated operating expenses, was $5.4 million in fiscal 2011 as compared to $8.7 million in fiscal 2010.
Interest Expense.
Interest expense was $8.4 million and $7.9 million for fiscal 2011 and 2010, respectively. The increase in interest expense is primarily due to the (i) accretion of interest on the contingent earn-out liability related to our October 2010 acquisition of technology assets from Stampede and (ii) incremental interest expense associated with our unsecured revolving credit facility which was increased in August 2010 from $100.0 million to $150.0 million.
Interest Income and Other.
Interest income and other for fiscal 2011 was $2.4 million, as compared to $1.2 million for fiscal 2010. The increase of $1.2 million is primarily attributable to an increase in year-over-year interest rates that we earned.
Provision for Income Taxes.
The provision for income taxes was $33.9 million and $36.7 million for fiscal 2011 and 2010, respectively. Our effective tax rate was 33.3% for fiscal 2011 compared to 37.7% for fiscal 2010.
Our effective tax rate for fiscal 2011 reflects net discrete tax benefits of approximately $1.7 million, primarily relating to the reversal of tax contingencies no longer required due to the expiration of applicable statutes of limitation, the passage of legislation which included the retroactive extension of the federal research and experimentation credit, and a reduction in expenses that were previously deemed to be non-deductible for tax purposes. Our effective tax rate for fiscal 2010 reflects a net discrete tax benefit of approximately $0.1 million. In addition, our fiscal 2010 effective tax rate reflects the fact that a portion of our $13.2 million expense for the impairment of our mobile data communications segment’s goodwill was non-deductible for income tax purposes.
Excluding all of the aforementioned items in both periods, our effective tax rate for fiscal 2011 was approximately 35.0% as compared to 36.0% for fiscal 2010. The decrease is primarily attributable to the retroactive extension of the federal research and experimentation credit (whose related legislation was extended in December 2010), and the increased benefit of our domestic production activities deduction (resulting from the scheduled phase-in of the related legislation).
Liquidity and Capital Resources
Our unrestricted cash and cash equivalents decreased to $
367.9 million
at
July 31, 2012
from $
558.8 million
at
July 31, 2011
, representing a decrease of $
190.9 million
. The decrease in cash and cash equivalents during fiscal
2012
was driven by the following:
|
•
|
Net cash provided by operating activities was $
53.5 million
for fiscal
2012
as compared to $
97.4 million
for fiscal
2011
. The decrease was primarily attributable to lower operating income (due in part to a $12.5 million net merger termination fee we received during fiscal 2011), offset, in part, by a decrease in net working capital requirements during fiscal
2012
. Although we expect to generate net cash from operating activities for fiscal
2013
, we are unable to accurately predict the amount, which will be impacted by the timing of working capital requirements associated with our overall sales efforts, including our efforts relating to our $55.0 million over-the-horizon microwave system contract.
|
|
•
|
Net cash used in investing activities for fiscal
2012
was $
6.4 million
as compared to $
10.0 million
for fiscal
2011
. During fiscal
2012
, we spent $
6.4 million
to purchase property, plant and equipment, including expenditures relating to ongoing equipment upgrades and enhancements to our high-volume technology manufacturing center in Tempe, Arizona.
|
|
•
|
Net cash used in financing activities was $
238.0 million
for fiscal
2012
as compared to $
136.1 million
for fiscal
2011
. During fiscal
2012
, we used $
219.4 million
for the repurchase of our common stock pursuant to our current $250.0 million stock repurchase program. In addition, during fiscal
2012
, we paid $
22.6 million
in cash dividends to our stockholders.
|
50
Our investment policy relating to our unrestricted cash and cash equivalents is intended to minimize principal loss while at the same time maximize the income we receive without significantly increasing risk. To minimize risk, we generally invest our cash and cash equivalents in money market mutual funds (both government and commercial), certificates of deposit, bank deposits, and U.S. Treasury securities. Many of our money market mutual funds invest in direct obligations of the U.S. government, bank securities guaranteed by the Federal Deposit Insurance Corporation, certificates of deposit and commercial paper and other securities issued by other companies. While we cannot predict future market conditions or market liquidity or the ultimate outcome of the current European monetary issues and related concerns, we believe our investment policies are appropriate in the current environment. Ultimately, the availability of our cash and cash equivalents is dependent on a well-functioning liquid market.
At
July 31, 2012
, we had $
367.9 million
of cash and cash equivalents. As of
July 31, 2012
, our material short-term cash requirements primarily consist of cash necessary to fund: (i) our ongoing working capital needs, including income tax payments, (ii) anticipated quarterly dividends, (iii) repurchases of our common stock that we may make pursuant to our stock repurchase program, and (iv) contingent earn-out payments we expect to make through October 2013 related to our acquisition of Stampede. In addition, in future periods, we may also redeploy a large portion of our cash and cash equivalents for one or more acquisitions.
We are currently authorized by our Board of Directors to repurchase our stock pursuant to a $250.0 million stock repurchase program. Pursuant to this authorization, during fiscal
2012
, we purchased approximately
7.1 million
shares of our common stock in open-market transactions with an average price per share of
$30.81
and at an aggregate cost of
$217.4 million
(including transaction costs) and in fiscal 2011, we purchased approximately 0.8 million shares with an average price per share of $28.87, at an aggregate cost of $21.5 million (including transaction costs). As of
July 31, 2012
,
$11.3 million
remains available for purchases from the $250.0 million stock repurchase program authorized by our Board of Directors.
Pursuant to a $100.0 million stock repurchase program established in September 2010, during fiscal 2011 we purchased approximately 3.5 million shares with an average price per share of $28.18 and at an aggregate cost of $100.1 million (including transaction costs). This program was completed in July 2011.
In September 2011, our Board of Directors raised our annual targeted dividend from
$1.00
per common share to
$1.10
per common share. During fiscal
2012
, our Board of Directors declared quarterly dividends of
$0.275
per common share on
September 27, 2011
, totaling $6.1 million, on
December 8, 2011
, totaling $5.4 million, on
March 8, 2012
, totaling $5.1 million, and
June 7, 2012
, totaling $4.8 million, which were paid on
November 22, 2011
,
February 22, 2012
,
May 22, 2012
and
August 20, 2012
, respectively. On
September 26, 2012
, our Board of Directors declared our fifth consecutive quarterly dividend of
$0.275
per common share payable on
November 20, 2012
to shareholders of record at the close of business on
October 19, 2012
. Future dividends are subject to Board approval.
Our material long-term cash requirements primarily consist of the possible use of cash to repay $200.0 million of our 3.0% convertible senior notes and payments relating to our operating leases. In addition, we expect to make future cash payments of approximately
$4.3 million
related to our 2009 Radyne-related restructuring plan.
We have historically met both our short-term and long-term cash requirements with funds provided by a combination of cash and cash equivalent balances, cash generated from operating activities and cash generated from financing transactions.
In June 2012, we amended our secured revolving credit facility. The amended agreement allows us to borrow up to
$100.0 million
, has lower fees, provides an option to extend the agreement beyond
April 30, 2014
and continues to provide us the flexibility to repurchase additional shares of our common stock.
In light of ongoing tight credit market conditions and overall adverse business conditions, we continue to receive requests from our customers for higher credit limits and longer payment terms. Because of our strong cash position and the nominal amount of interest we are earning on our cash and cash equivalents, we have, on a limited basis, approved certain customer requests. We continue to monitor our accounts receivable credit portfolio and have not had any material negative customer credit experiences to date. Based on our anticipated level of future sales and operating income, we believe that our existing cash and cash equivalent balances and our cash generated from operating activities will be sufficient to meet both our currently anticipated short-term and long-term operating cash requirements.
Although it is difficult in the current economic and credit environment to predict the terms and conditions of financing that may be available in the future, should our short-term or long-term cash requirements increase beyond our current expectations, we believe that we would have sufficient access to credit from financial institutions and/or financing from public and private debt and equity markets.
51
As discussed in “
Notes to Consolidated Financial Statements –
Note (14)(b) Commitments and Contingencies – Legal Proceedings and Other Matters”
included in
“Part II — Item 8. — Financial Statements and Supplementary Data,”
we are incurring legal fees and professional costs associated with legal proceedings and other matters. The outcome of these legal proceedings and investigations is inherently difficult to predict and an adverse outcome in one or more matters could have a material adverse effect on our consolidated financial condition and results of operations in the period of such determination.
We currently expect capital expenditures for fiscal
2013
to be approximately $8.0 million to $10.0 million.
Financing Arrangements
In May 2009, we issued
$200.0 million
of our 3.0% convertible senior notes in a private offering pursuant to Rule 144A under the Securities Act of 1933, as amended. The net proceeds from this transaction were approximately
$194.5 million
after deducting the initial purchasers’ discount and transaction costs. For further information, see
“Notes to Consolidated Financial Statements – Note (9) 3.0% Convertible Senior Notes”
included in
“Part II — Item 8. — Financial Statements and Supplementary Data.”
We have a committed
$100.0 million
secured revolving credit facility ("Credit Facility") with a syndicate of bank lenders, as amended June 6, 2012. The Credit Facility expires on
April 30, 2014
but may be extended by us to
December 31, 2016
, subject to certain conditions relating primarily to the repurchase, redemption or conversion of our 3.0% convertible senior notes and compliance with all other Credit Facility covenants. The Credit Facility provides for the extension of credit to us in the form of revolving loans, including letters of credit, at any time and from time to time during its term, in the aggregate principal amount at any time outstanding not to exceed
$100.0 million
for both revolving loans and letters of credit, with sub-limits of
$15.0 million
for commercial letters of credit and
$35.0 million
for standby letters of credit. Subject to certain limitations as defined, the Credit Facility may be used for acquisitions, stock repurchases, dividends, working capital and other general corporate purposes. The Credit Facility also contains financial condition covenants requiring that we: (i) not exceed a maximum ratio of consolidated total indebtedness to Consolidated Adjusted EBITDA (each as defined in the Credit Facility); (ii) not exceed a maximum ratio of consolidated senior secured indebtedness to Consolidated Adjusted EBITDA (each as defined in the Credit Facility); (iii) maintain a minimum fixed charge ratio (as defined in the Credit Facility); and (iv) maintain a minimum consolidated net worth; in each case measured on the last day of each fiscal quarter. The Credit Facility also requires that, in the event total consolidated indebtedness (as defined in the Credit Facility) is less than
$200.0 million
, we maintain a minimum level of Consolidated Adjusted EBITDA (as defined in the Credit Facility). See
“Notes to Consolidated Financial Statements – Note (8) Credit Facility”
included in
“Part II — Item 8. — Financial Statements and Supplementary Data.”
At
July 31, 2012
, we have approximately
$1.5 million
of standby letters of credit outstanding under this Credit Facility relating to the guarantee of future performance on certain customer contracts and no commercial letters of credit outstanding.
Off-Balance Sheet Arrangements
As of
July 31, 2012
, we did not have any off-balance sheet arrangements as defined in Item 303(a)(4) of Regulation S-K.
Commitments
Except as disclosed in the below table, in the normal course of business, we routinely enter into binding and non-binding purchase obligations primarily covering anticipated purchases of inventory and equipment. We do not expect that these commitments, as of
July 31, 2012
, will materially adversely affect our liquidity.
At
July 31, 2012
, we had contractual cash obligations relating to: (i) our operating lease commitments; (ii) satellite lease expenditures, in fiscal 2013, for our mobile data communications segment's commercial asset tracking products, such as our SENS products; and (iii) the potential cash repayment of our 3.0% convertible senior notes. At
July 31, 2012
, payments due under these long-term obligations, excluding interest on the 3.0% convertible senior notes, are as follows:
|
|
Obligations Due by Fiscal Years or Maturity Date (in thousands)
|
|||||||||||||||
|
|
Total
|
2013
|
2014
and 2015 |
2016
and 2017 |
After
2017 |
|||||||||||
|
Operating lease commitments
|
$
|
35,386
|
|
9,088
|
|
10,864
|
|
8,493
|
|
6,941
|
|
|||||
|
3.0% convertible senior notes
|
200,000
|
|
—
|
|
—
|
|
—
|
|
200,000
|
|
||||||
|
Total contractual cash obligations
|
235,386
|
|
9,088
|
|
10,864
|
|
8,493
|
|
206,941
|
|
||||||
|
Less contractual sublease payments
|
(4,103
|
)
|
(1,224
|
)
|
(2,555
|
)
|
(324
|
)
|
—
|
|
||||||
|
Net contractual cash obligations
|
$
|
231,283
|
|
7,864
|
|
8,309
|
|
8,169
|
|
206,941
|
|
|||||
52
As discussed further in
“Notes to Consolidated Financial Statements – Note (9) 3.0% Convertible Senior Notes”
included in
“Part II — Item 8. — Financial Statements and Supplementary Data,”
on
May 8, 2009
, we issued
$200.0 million
of our 3.0% convertible senior notes. Holders of the notes will have the right to require us to repurchase some or all of the outstanding notes, solely for cash, on
May 1, 2014
,
May 1, 2019
and
May 1, 2024
and upon certain events, including a change in control. If not redeemed by us or repaid pursuant to the holders’ right to require repurchase, the notes mature on
May 1, 2029
.
As discussed further in
“Notes to Consolidated Financial Statements – Note (17) Stockholders’ Equity,”
included in
“Part II — Item 8. — Financial Statements and Supplementary Data,”
on
September 26, 2012
, our Board of Directors declared a cash dividend of
$0.275
per common share to be paid on
November 20, 2012
to our shareholders of record at the close of business on
October 19, 2012
. Future dividends are subject to Board approval. No dividend amounts are included in the above table.
At
July 31, 2012
, we have approximately
$1.5 million
of standby letters of credit agreements outstanding under our Credit Facility related to the guarantee of future performance on certain contracts and no commercial letters of credit outstanding. Such amounts are not included in the above table.
In October 2010, we acquired the WAN optimization technology assets and assumed certain liabilities of Stampede for
$5.3 million
, of which
$1.7 million
was paid as of
July 31, 2012
. The estimated fair value of the remaining contingent earn-out payments which we expect to make through October 1, 2013, is
$3.5 million
. Such amounts are not included in the above table.
In the ordinary course of business we include indemnification provisions in certain of our customer contracts. Pursuant to these agreements, we have agreed to indemnify, hold harmless and reimburse the indemnified party for losses suffered or incurred by the indemnified party, including but not limited to losses related to third-party intellectual property claims. To date, there have not been any material costs or expenses incurred in connection with such indemnification clauses. Our insurance policies may not cover the cost of defending indemnification claims or providing indemnification. As a result if a claim were asserted against us by any party that we have agreed to indemnify, we could incur future legal costs and damages.
We have change of control agreements and indemnification agreements with certain of our executive officers and certain key employees. All of these agreements may require payments by us, in certain circumstances, including, but not limited to, a change in control of our Company.
During fiscal 2012, pursuant to an indemnification agreement with our CEO (see Exhibit 10.1, "Form of Indemnification Agreement" in our Current Report on Form 8-K filed with the Securities and Exchange Commission ("SEC") on March 8, 2007), our Board of Directors agreed to pay, on behalf of our CEO, expenses incurred by him in connection with an investigation currently being conducted by the SEC and an investigation by the United States Attorney for the Eastern District Court of New York, on the condition that Mr. Kornberg repay such amounts to the extent that it is ultimately determined that he is not entitled to be indemnified by us. To date, legal expenses paid on behalf of our CEO have been nominal; however we have incurred approximately $1.0 million of expenses, in fiscal 2012, responding to the subpoenas. See
“Notes to Consolidated Financial Statements - Note (14)(b) Commitments and Contingencies - Legal Proceedings and Other Matters”
included in
“Part II - Item 8. - Financial Statements and Supplementary Data.”
Any amounts that may be advanced to our CEO in the future are not included in the above table.
Our consolidated balance sheet at
July 31, 2012
includes total liabilities of
$2.6 million
for uncertain tax positions, including interest, all of which may result in cash payment. The future payments related to uncertain tax positions have not been presented in the table above due to the uncertainty of the amounts and timing of cash settlement with the taxing authorities.
53
Recent Accounting Pronouncements
As further discussed in
“Notes to Consolidated Financial Statements – Note (1)(o) Adoption of New Accounting Standards”
included in
“Part II — Item 8. — Financial Statements and Supplementary Data,”
during fiscal 2012, we adopted:
|
•
|
Financial Accounting Standards Board (“FASB”) Accounting Standards Updates (“ASU”) No. 2010-06, which amends the disclosure requirements of FASB ASC 820-10, “Fair Value Measurements and Disclosures - Overall,” and requires that information about purchases, sales, issuances and settlements be presented separately, on a gross basis, in Level 3 fair value measurement reconciliations.
|
|
•
|
FASB ASU No. 2010-20, which amends ASC 310, “Receivables” by requiring additional disclosures regarding troubled debt restructurings and FASB ASU No. 2011-02, which amends previously issued guidance on evaluation of whether or not a restructuring constitutes a troubled debt restructuring.
|
|
•
|
FASB ASU No. 2010-28, which amends the factors considered in determining if goodwill is impaired in FASB ASC 350, “Intangibles - Goodwill and Other,” requires entities that have reporting units with carrying amounts that are zero or negative to assess whether it is more likely than not that the reporting unit's goodwill is impaired and, if an impairment is likely, to perform Step 2 of the goodwill impairment test for the reporting unit(s).
|
|
•
|
FASB ASU No. 2010-29, which amends the presentation and disclosure requirements of FASB ASC 805, “Business Combinations,” and requires a public entity that presents comparative financial statements to disclose revenue and earnings of the combined entity as though the business combination(s) that occurred during the current year had occurred as of the beginning of the comparable prior annual reporting period only. This ASU also expands the supplemental proforma disclosures required.
|
|
•
|
FASB ASU No. 2011-04, which amends the fair value measurement and disclosure requirements of FASB ASC 820, “Fair Value Measurements,” clarifies, among other things, the intent of the application of existing fair value requirements, including those related to highest and best use concepts, and also expands the disclosure requirements for fair value measurements categorized within Level 3 of the fair value hierarchy.
|
|
•
|
FASB ASU No. 2011-05, which eliminates the option to present components of other comprehensive income as part of the statement of changes in stockholders' equity and provides the ability to present the total of comprehensive income, the components of net income and the components of other comprehensive income either in a single continuous statement
of comprehensive income, or in two separate but consecutive statements.
|
|
•
|
FASB ASU No. 2011-08, which provides, subject to certain conditions, an entity the option to first assess qualitative factors to determine whether it is more likely than not that the fair value of a reporting unit is less than its carrying amount as a basis for determining whether it is necessary to perform the two-step goodwill impairment test described in ASC 350, “Intangibles - Goodwill and Other.”
|
|
•
|
FASB ASU No. 2012-02, which provides, subject to certain conditions, an entity the option to first assess qualitative factors to determine whether it is more likely than not that an indefinite-lived intangible asset is impaired as a basis for determining whether it is necessary to perform the quantitative impairment test in accordance with ASC 350-30, “Intangibles - Goodwill and Other - General Intangibles Other than Goodwill.”
|
The adoption of these accounting standards did not have any material impact on our consolidated statement of operations or financial position.
In addition, the following FASB ASU has been issued and incorporated into the FASB ASC and is applicable to us:
|
•
|
FASB ASU No. 2011-11, issued in December 2011, which requires entities to disclose both gross and net information about both instruments and transactions eligible for offset in the statement of financial position and instruments and transactions subject to an agreement similar to a master netting agreement. The objective of this ASU is to facilitate comparison between those entities that prepare their financial statements on the basis of U.S. GAAP and those entities that prepare their financial statements on the basis of International Financial Reporting Standards (“IFRS”). This ASU is effective in our third quarter of fiscal year 2013 and should be applied retrospectively for all comparable periods presented. We currently do not have any master netting agreements and do not believe this ASU will have any impact on our consolidated financial statements.
|
54
Our earnings and cash flows are subject to fluctuations due to changes in interest rates primarily from our investment of available cash balances. Under our current policies, we do not use interest rate derivative instruments to manage exposure to interest rate changes.
As of
July 31, 2012
, we had unrestricted cash and cash equivalents of
$367.9 million
, which consisted of cash and highly-liquid money market mutual funds, certificates of deposit, bank deposits and U.S. Treasury securities. Many of these investments are subject to fluctuations in interest rates, which could impact our results. Based on our investment portfolio balance as of
July 31, 2012
, a hypothetical change in interest rates of 10% would have a $0.1 million impact on interest income over a one-year period. Ultimately, the availability of our cash and cash equivalents is dependent on a well-functioning liquid market.
Our 3.0% convertible senior notes bear a fixed rate of interest. As such, our earnings and cash flows are not sensitive to changes in interest rates on our long-term debt. As of
July 31, 2012
, we estimate the fair market value on our 3.0% convertible senior notes to be
$211.9 million
based on quoted market prices in an active market.
Reports of Independent Registered Public Accounting Firm, Consolidated Financial Statements, Notes to Consolidated Financial Statements and Related Financial Schedule are listed in the Index to Consolidated Financial Statements and Schedule annexed hereto.
ACCOUNTING AND FINANCIAL DISCLOSURE
None.
55
Evaluation of Disclosure Controls and Procedures
As of the end of the period covered by this Annual Report on Form 10-K, an evaluation of the effectiveness of the design and operation of our disclosure controls and procedures was carried out by us under the supervision and with the participation of our management, including our Chief Executive Officer and Chief Financial Officer. Based on that evaluation, our Chief Executive Officer and Chief Financial Officer concluded that our disclosure controls and procedures were effective as of the end of the period covered by the report to provide reasonable assurance that the information required to be disclosed by us in reports filed under the Securities Exchange Act of 1934, as amended, is recorded, processed, summarized and reported, within the time periods specified in the SEC’s rules and forms. A system of controls, no matter how well designed and operated, cannot provide absolute assurance that the objectives of the system of controls are met, and no evaluation of controls can provide absolute assurance that all control issues and instances of fraud, if any, within a company have been detected.
Management’s Report on Internal Control Over Financial Reporting
Management is responsible for establishing and maintaining adequate internal control over financial reporting as defined in Rules 13a-15(f) and 15d-15(f) under the Securities Exchange Act of 1934. Our internal control over financial reporting is a process designed to provide reasonable assurance regarding the reliability of financial reporting and the preparation of financial statements for external purposes in accordance with generally accepted accounting principles. All internal control systems, no matter how well designed, have inherent limitations. Therefore, even those systems determined to be effective can provide only reasonable assurance with respect to financial statement preparation and presentation. Also, projections of any evaluation of effectiveness to future periods are subject to the risk that controls may become inadequate because of changes in conditions, or that the degree of compliance with the policies or procedures may deteriorate.
Management assessed the effectiveness of our internal control over financial reporting as of
July 31, 2012
. In making this assessment, we used the criteria set forth by the Committee of Sponsoring Organizations of the Treadway Commission (“COSO”) in Internal Control – Integrated Framework. Based on our assessment, we determined that, as of
July 31, 2012
, our internal control over financial reporting was effective based on those criteria.
KPMG LLP (“KPMG”), our independent registered public accounting firm, has performed an audit of our internal control over financial reporting as of
July 31, 2012
based on criteria established in Internal Control – Integrated Framework issued by the COSO. This audit is required to be performed in accordance with the standards of the Public Company Accounting Oversight Board (United States). Our independent auditors were given unrestricted access to all financial records and related data. KPMG’s audit reports appear on pages F-2 and F-3 of this annual report.
Changes In Internal Control Over Financial Reporting
There have been no changes in our internal control over financial reporting as defined in Rules 13a-15(f) and 15d-15(f) under the Exchange Act that occurred during our fiscal quarter ended
July 31, 2012
, that have materially affected, or are reasonably likely to materially affect, our internal control over financial reporting.
Not applicable.
56
Certain information concerning directors and officers is incorporated by reference to our Proxy Statement for the Annual Meeting of Stockholders (the “Proxy Statement”) which will be filed with the Securities and Exchange Commission no more than 120 days after the close of our fiscal year.
Information regarding executive compensation is incorporated by reference to the Proxy Statement, which will be filed with the Securities and Exchange Commission no more than 120 days after the close of our fiscal year.
AND MANAGEMENT AND RELATED STOCKHOLDER MATTERS
Information regarding securities authorized for issuance under equity compensation plans and certain information regarding security ownership of certain beneficial owners and management is incorporated by reference to the Proxy Statement, which will be filed with the Securities and Exchange Commission no more than 120 days after the close of our fiscal year.
AND DIRECTOR INDEPENDENCE
Information regarding certain relationships and related transactions is incorporated by reference to the Proxy Statement, which will be filed with the Securities and Exchange Commission no more than 120 days after the close of our fiscal year.
Information regarding principal accountant fees and services is incorporated by reference to the Proxy Statement, which will be filed with the Securities and Exchange Commission no more than 120 days after the close of our fiscal year.
57
|
(a)
|
(1) The Registrant’s financial statements together with a separate index are annexed hereto.
|
|
|
(2) The Financial Statement Schedule listed in a separate index is annexed hereto.
|
||
|
(3) Exhibits required by Item 601 of Regulation S-K are listed below.
|
||
|
Exhibit
Number
|
Description of Exhibit
|
Incorporated By
Reference to Exhibit
|
||
|
3(a)(i)
|
Restated Certificate of Incorporation of the Registrant
|
Exhibit 3(a)(i) to the Registrant’s 2006 Form 10-K
|
||
|
3(a)(ii)
|
Second Amended and Restated By-Laws of the Registrant
|
Exhibit 3(ii) to the Registrant’s Form 8-K dated January 18, 2012
|
||
|
4(a)
|
Indenture, dated May 8, 2009, between Comtech Telecommunications Corp. and The Bank of New York Mellon, as trustee
|
Exhibit 4.1 to the Registrant's Form 8-K dated May 13, 2009
|
||
|
10(a)*
|
Third Amended and Restated Employment Agreement dated August 1, 2011, between the Registrant and Fred Kornberg
|
Exhibit 10(a) to the Registrant’s Form 8-K filed August 2, 2011
|
||
|
10(b)(1)*
|
Amended and Restated Form of Change in Control Agreement (Tier 2) between the Registrant and Named Executive Officers (other than the CEO) and Certain Other Executive Officers
|
Exhibit 10(b)(1) to the Registrant’s 2008 Form 10-K
|
||
|
10(b)(2)*
|
Amended and Restated Form of Change in Control Agreement (Tier 3) between the Registrant and Certain Non-Executive Officers
|
Exhibit 10(b)(2) to the Registrant’s 2008 Form 10-K
|
||
|
10(c)*
|
2000 Stock Incentive Plan, Amended and Restated, Effective September 21, 2011
|
Exhibit 10 to the Registrant’s Form 8-K filed January 18, 2012
|
||
|
10(d)*
|
Form of Stock Option Agreement pursuant to the 2000 Stock Incentive Plan
|
Exhibit 10(f)(7) to the Registrant’s 2005 Form 10-K
|
||
|
10(e)*
|
Form of Stock Option Agreement for Non-employee Directors pursuant to the 2000 Stock Incentive Plan
|
Exhibit 10(f)(8) to the Registrant’s 2006 Form 10-K
|
||
|
10(f)*
|
2001 Employee Stock Purchase Plan
|
Appendix B to the Registrant’s Proxy Statement dated November 6, 2000
|
||
|
10(g)*
|
Lease agreement dated September 23, 2011 on the Melville, New York Facility
|
Exhibit 10(s) to the Registrant's 2011 Form 10-K
|
||
|
10(h)*
|
Form of Indemnification Agreement between the Registrant and the Named Executive Officers and Certain Other Executive Officers
|
Exhibit 10.1 to Registrant’s Form 8-K filed on March 8, 2007
|
||
|
10(i)
|
Credit Facility, dated as of June 24, 2009, by and among Comtech Telecommunications Corp. and Citibank, N.A., as Administrative Agent and The Lenders Party Hereto+
|
Exhibit 10.2 to the Registrant's Form 10-Q filed March 3, 2010
|
||
|
10(j)
|
Amendment to Credit Facility, dated as of June 24, 2009, by and among Comtech Telecommunications Corp. and Citibank, N.A., as Administrative Agent and The Lenders Party Hereto
|
Exhibit 10.1 to the Registrant’s Form 10-Q filed June 3, 2010
|
||
58
|
Exhibit
Number
|
Description of Exhibit
|
Incorporated By
Reference to Exhibit
|
||
|
10(k)
|
Second Amendment to Credit Facility, dated as of June 24, 2009 (as amended by the Amendment dated as of August 20, 2010), by and among Comtech Telecommunications Corp. and Citibank, N.A., as Administrative Agent and The Lenders Party Hereto
|
Exhibit 10.1 to the Registrant’s Form 8-K filed August 23, 2010
|
||
|
10(l)
|
Termination and Release Agreement, dated as of September 7, 2010, among Comtech Telecommunications Corp., Angels Acquisition Corp., and CPI International, Inc.
|
Exhibit 10.1 to the Registrant’s Form 8-K filed September 8, 2010
|
||
|
10(m)
|
Third Amendment to Credit Facility, dated as of June 24, 2009 (as amended by the Amendment dated as of September 21, 2010), by and among Comtech Telecommunications Corp. and Citibank, N.A., as Administrative Agent and The Lenders Party Hereto
|
Exhibit 10(r) to the Registrant’s 2010 Form 10-K
|
||
|
10(n)
|
Fourth Amendment to Credit Facility, dated as of June 24, 2009 (as amended by the Amendment dated as of July 12, 2011), by and among Comtech Telecommunications Corp. and Citibank, N.A., as Administrative Agent and the Lenders Party Hereto
|
Exhibit 10.1 to the Registrant’s Form 8-K filed July 12, 2011
|
||
|
10(o)
|
Fifth Amendment to Credit Facility, dated as of June 24, 2009 (as amended by the Amendment dated as of October 31, 2011), by and among Comtech Telecommunications Corp. and Citibank, N.A., as Administrative Agent and the Lenders Party Hereto
|
Exhibit 10.1 to the Registrant's Form 8-K filed November 4, 2011
|
||
|
10(p)*
|
Form of Stock Unit Agreement for Non-employee Directors pursuant to the 2000 Stock Incentive Plan
|
Exhibit 10.1 to the Registrant's Form 10-Q filed June 6, 2012
|
||
|
10(q)*
|
Form of Restricted Stock Unit Agreement for Non-employee Directors pursuant to the 2000 Stock Incentive Plan
|
Exhibit 10.2 to the Registrant's Form 10-Q filed June 6, 2012
|
||
|
10(r)
|
Blue Force Tracking System Contract between Comtech Mobile Datacom Corporation and the U.S. Army CECOM dated March 29, 2012+
|
Exhibit 10.3 to the Registrant's Form 10-Q filed June 6, 2012
|
||
|
|
||||
|
|
||||
|
|
|
|||
|
|
|
|||
|
|
|
|||
|
|
|
|||
|
|
|
|||
59
|
Exhibit
Number
|
Description of Exhibit
|
Incorporated By
Reference to Exhibit
|
||
|
|
|
|||
|
101.INS
|
XBRL Instance Document
|
|
||
|
101.SCH
|
XBRL Taxonomy Extension Schema Document
|
|
||
|
101.CAL
|
XBRL Taxonomy Extension Calculation Linkbase Document
|
|
||
|
101.LAB
|
XBRL Taxonomy Extension Labels Linkbase Document
|
|
||
|
101.PRE
|
XBRL Taxonomy Extension Presentation Linkbase Document
|
|
||
|
101.DEF
|
XBRL Taxonomy Extension Definition Linkbase Document
|
|
||
* Management contract or compensatory plan or arrangement.
+Certain portions of this agreement have been omitted and filed separately with the Securities and Exchange Commission pursuant to a request for confidential treatment.
Exhibits to this Annual Report on Form 10-K are available from the Company upon request and payment to the Company for the cost of reproduction. The information is also available on our Internet website at
www.comtechtel.com
.
60
SIGNATURES
Pursuant to the requirements of Section 13 or 15(d) of the Securities and Exchange Act of 1934, the registrant has duly caused this report to be signed on its behalf by the undersigned, thereunto duly authorized.
|
|
COMTECH TELECOMMUNICATIONS CORP.
|
|
|
|
|
September 26, 2012
|
By: /s/Fred Kornberg
|
|
(Date)
|
Fred Kornberg, Chairman of the Board
|
|
|
and Chief Executive Officer
|
Pursuant to the requirements of the Securities Exchange Act of 1934, this report has been signed below by the following persons on behalf of the registrant and in the capacities and on the dates indicated.
|
|
Signature
|
Title
|
|
|
|
|
|
September 26, 2012
|
/s/Fred Kornberg
|
Chairman of the Board
|
|
(Date)
|
Fred Kornberg
|
Chief Executive Officer and President
(Principal Executive Officer)
|
|
|
|
|
|
|
|
|
|
September 26, 2012
|
/s/Michael D. Porcelain
|
Senior Vice President and
|
|
(Date)
|
Michael D. Porcelain
|
Chief Financial Officer
(Principal Financial and Accounting Officer)
|
|
|
|
|
|
September 26, 2012
|
/s/Richard L. Goldberg
|
Director
|
|
(Date)
|
Richard L. Goldberg
|
|
|
|
|
|
|
|
|
|
|
September 26, 2012
|
/s/Edwin Kantor
|
Director
|
|
(Date)
|
Edwin Kantor
|
|
|
|
|
|
|
|
|
|
|
September 26, 2012
|
/s/Ira Kaplan
|
Director
|
|
(Date)
|
Ira Kaplan
|
|
|
|
|
|
|
|
|
|
|
September 26, 2012
|
/s/Robert G. Paul
|
Director
|
|
(Date)
|
Robert G. Paul
|
|
|
|
|
|
|
|
|
|
|
September 26, 2012
|
/s/Stanton Sloane
|
Director
|
|
(Date)
|
Stanton Sloane
|
|
61
COMTECH TELECOMMUNICATIONS CORP. AND SUBSIDIARIES
Index to Consolidated Financial Statements and Schedule
|
Page
|
|
|
Consolidated Financial Statements:
|
|
|
Additional Financial Information Pursuant to the Requirements of Form 10-K:
|
|
|
Schedules not listed above have been omitted because they are either not applicable or the required information has been provided elsewhere in the consolidated financial statements or notes thereto.
|
|
F-1

Report of Independent Registered Public Accounting Firm
The Board of Directors and Stockholders of Comtech Telecommunications Corp.:
We have audited the accompanying consolidated balance sheets of Comtech Telecommunications Corp. and subsidiaries as of July 31, 2012 and 2011, and the related consolidated statements of operations, stockholders’ equity and cash flows for each of the years in the three-year period ended July 31, 2012. In connection with our audits of the consolidated financial statements, we also have audited the financial statement schedule listed in the accompanying index. These consolidated financial statements and the financial statement schedule are the responsibility of the Company’s management. Our responsibility is to express an opinion on these consolidated financial statements and the financial statement schedule based on our audits.
We conducted our audits in accordance with the standards of the Public Company Accounting Oversight Board (United States). Those standards require that we plan and perform the audit to obtain reasonable assurance about whether the financial statements are free of material misstatement. An audit includes examining, on a test basis, evidence supporting the amounts and disclosures in the financial statements. An audit also includes assessing the accounting principles used and significant estimates made by management, as well as evaluating the overall financial statement presentation. We believe that our audits provide a reasonable basis for our opinion.
In our opinion, the consolidated financial statements referred to above present fairly, in all material respects, the financial position of Comtech Telecommunications Corp. and subsidiaries as of July 31, 2012 and 2011, and the results of their operations and their cash flows for each of the years in the three-year period ended July 31, 2012, in conformity with U.S. generally accepted accounting principles. Also in our opinion, the related financial statement schedule, when considered in relation to the basic consolidated financial statements taken as a whole, presents fairly, in all material respects, the information set forth therein.
We also have audited, in accordance with the standards of the Public Company Accounting Oversight Board (United States), Comtech Telecommunications Corp.’s internal control over financial reporting as of July 31, 2012, based on criteria established in Internal Control—Integrated Framework issued by the Committee of Sponsoring Organizations of the Treadway Commission (COSO), and our report dated September 26, 2012 expressed an unqualified opinion on the effectiveness of the Company’s internal control over financial reporting.

Melville, New York
September 26, 2012
F-2
Report of Independent Registered Public Accounting Firm
The Board of Directors and Stockholders of Comtech Telecommunications Corp.:
We have audited Comtech Telecommunications Corp. and subsidiaries internal control over financial reporting as of July 31, 2012, based on criteria established in Internal Control—Integrated Framework issued by the Committee of Sponsoring Organizations of the Treadway Commission (COSO). Comtech Telecommunications Corp. and subsidiaries' management is responsible for maintaining effective internal control over financial reporting and for its assessment of the effectiveness of internal control over financial reporting, included in the accompanying Management’s Report on Internal Control Over Financial Reporting. Our responsibility is to express an opinion on the Company’s internal control over financial reporting based on our audit.
We conducted our audit in accordance with the standards of the Public Company Accounting Oversight Board (United States). Those standards require that we plan and perform the audit to obtain reasonable assurance about whether effective internal control over financial reporting was maintained in all material respects. Our audit included obtaining an understanding of internal control over financial reporting, assessing the risk that a material weakness exists, and testing and evaluating the design and operating effectiveness of internal control based on the assessed risk. Our audit also included performing such other procedures as we considered necessary in the circumstances. We believe that our audit provides a reasonable basis for our opinion.
A company’s internal control over financial reporting is a process designed to provide reasonable assurance regarding the reliability of financial reporting and the preparation of financial statements for external purposes in accordance with generally accepted accounting principles. A company’s internal control over financial reporting includes those policies and procedures that (1) pertain to the maintenance of records that, in reasonable detail, accurately and fairly reflect the transactions and dispositions of the assets of the company; (2) provide reasonable assurance that transactions are recorded as necessary to permit preparation of financial statements in accordance with generally accepted accounting principles, and that receipts and expenditures of the company are being made only in accordance with authorizations of management and directors of the company; and (3) provide reasonable assurance regarding prevention or timely detection of unauthorized acquisition, use, or disposition of the company’s assets that could have a material effect on the financial statements.
Because of its inherent limitations, internal control over financial reporting may not prevent or detect misstatements. Also, projections of any evaluation of effectiveness to future periods are subject to the risk that controls may become inadequate because of changes in conditions, or that the degree of compliance with the policies or procedures may deteriorate.
In our opinion, Comtech Telecommunications Corp. and subsidiaries maintained, in all material respects, effective internal control over financial reporting as of July 31, 2012, based on criteria established in Internal Control—Integrated Framework issued by the Committee of Sponsoring Organizations of the Treadway Commission (COSO).
We also have audited, in accordance with the standards of the Public Company Accounting Oversight Board (United States), the consolidated balance sheets of Comtech Telecommunications Corp. and subsidiaries as of July 31, 2012 and 2011, and the related consolidated statements of operations, stockholders’ equity and cash flows for each of the years in the three-year period ended July 31, 2012, and our report dated September 26, 2012, expressed an unqualified opinion on those consolidated financial statements.
Melville, New York
September 26, 2012
F-3
COMTECH TELECOMMUNICATIONS CORP.
AND SUBSIDIARIES
Consolidated Balance Sheets
As of July 31, 2012 and 2011
|
Assets
|
2012
|
2011
|
|||||
|
Current assets:
|
|||||||
|
Cash and cash equivalents
|
$
|
367,894,000
|
|
558,804,000
|
|
||
|
Accounts receivable, net
|
56,242,000
|
|
70,801,000
|
|
|||
|
Inventories, net
|
72,361,000
|
|
74,661,000
|
|
|||
|
Prepaid expenses and other current assets
|
8,196,000
|
|
7,270,000
|
|
|||
|
Deferred tax asset, net
|
12,183,000
|
|
11,529,000
|
|
|||
|
Total current assets
|
516,876,000
|
|
723,065,000
|
|
|||
|
Property, plant and equipment, net
|
22,832,000
|
|
26,638,000
|
|
|||
|
Goodwill
|
137,354,000
|
|
137,354,000
|
|
|||
|
Intangibles with finite lives, net
|
38,833,000
|
|
45,470,000
|
|
|||
|
Deferred tax asset, net, non-current
|
438,000
|
|
—
|
|
|||
|
Deferred financing costs, net
|
2,487,000
|
|
3,823,000
|
|
|||
|
Other assets, net
|
958,000
|
|
1,159,000
|
|
|||
|
Total assets
|
$
|
719,778,000
|
|
937,509,000
|
|
||
|
Liabilities and Stockholders’ Equity
|
|
|
|
|
|||
|
Current liabilities:
|
|
|
|
|
|||
|
Accounts payable
|
$
|
20,967,000
|
|
23,501,000
|
|
||
|
Accrued expenses and other current liabilities
|
40,870,000
|
|
49,858,000
|
|
|||
|
Dividends payable
|
4,773,000
|
|
6,100,000
|
|
|||
|
Customer advances and deposits
|
14,516,000
|
|
11,011,000
|
|
|||
|
Interest payable
|
1,529,000
|
|
1,531,000
|
|
|||
|
Income taxes payable
|
—
|
|
4,056,000
|
|
|||
|
Total current liabilities
|
82,655,000
|
|
96,057,000
|
|
|||
|
Convertible senior notes
|
200,000,000
|
|
200,000,000
|
|
|||
|
Other liabilities
|
5,098,000
|
|
6,360,000
|
|
|||
|
Income taxes payable
|
2,624,000
|
|
3,811,000
|
|
|||
|
Deferred tax liability
|
—
|
|
2,101,000
|
|
|||
|
Total liabilities
|
290,377,000
|
|
308,329,000
|
|
|||
|
Commitments and contingencies (See Note 14)
|
|
|
|
|
|||
|
Stockholders’ equity:
|
|
|
|
|
|||
|
Preferred stock, par value $.10 per share; shares authorized and unissued 2,000,000
|
—
|
|
—
|
|
|||
|
Common stock, par value $.10 per share; authorized 100,000,000 shares; issued 28,931,679 shares and 28,731,265 shares at July 31, 2012 and 2011, respectively
|
2,893,000
|
|
2,873,000
|
|
|||
|
Additional paid-in capital
|
361,458,000
|
|
355,001,000
|
|
|||
|
Retained earnings
|
404,227,000
|
|
393,109,000
|
|
|||
|
|
768,578,000
|
|
750,983,000
|
|
|||
|
Less:
|
|
|
|
|
|||
|
Treasury stock, at cost (shares 11,564,059 and 4,508,445 shares at July 31, 2012 and 2011, respectively)
|
(339,177,000
|
)
|
(121,803,000
|
)
|
|||
|
Total stockholders’ equity
|
429,401,000
|
|
629,180,000
|
|
|||
|
Total liabilities and stockholders’ equity
|
$
|
719,778,000
|
|
937,509,000
|
|
||
See accompanying notes to consolidated financial statements.
F-4
COMTECH TELECOMMUNICATIONS CORP.
AND SUBSIDIARIES
Consolidated Statements of Operations
Fiscal Years Ended July 31, 2012, 2011 and 2010
|
|
2012
|
2011
|
2010
|
|||||||
|
Net sales
|
$
|
425,070,000
|
|
612,379,000
|
|
778,205,000
|
|
|||
|
Cost of sales
|
241,561,000
|
|
371,333,000
|
|
507,607,000
|
|
||||
|
Gross profit
|
183,509,000
|
|
241,046,000
|
|
270,598,000
|
|
||||
|
Expenses:
|
|
|
|
|
|
|
||||
|
Selling, general and administrative
|
87,106,000
|
|
94,141,000
|
|
99,883,000
|
|
||||
|
Research and development
|
38,489,000
|
|
43,516,000
|
|
46,192,000
|
|
||||
|
Amortization of intangibles
|
6,637,000
|
|
8,091,000
|
|
7,294,000
|
|
||||
|
Impairment of goodwill
|
—
|
|
—
|
|
13,249,000
|
|
||||
|
Merger termination fee, net
|
—
|
|
(12,500,000
|
)
|
—
|
|
||||
|
|
132,232,000
|
|
133,248,000
|
|
166,618,000
|
|
||||
|
Operating income
|
51,277,000
|
|
107,798,000
|
|
103,980,000
|
|
||||
|
Other expenses (income):
|
|
|
|
|
|
|
||||
|
Interest expense
|
8,832,000
|
|
8,415,000
|
|
7,888,000
|
|
||||
|
Interest income and other
|
(1,595,000
|
)
|
(2,421,000
|
)
|
(1,210,000
|
)
|
||||
|
Income before provision for income taxes
|
44,040,000
|
|
101,804,000
|
|
97,302,000
|
|
||||
|
Provision for income taxes
|
11,624,000
|
|
33,909,000
|
|
36,672,000
|
|
||||
|
Net income
|
$
|
32,416,000
|
|
67,895,000
|
|
60,630,000
|
|
|||
|
Net income per share (See Note 1(i)):
|
|
|
|
|
|
|
||||
|
Basic
|
$
|
1.62
|
|
2.53
|
|
2.14
|
|
|||
|
Diluted
|
$
|
1.42
|
|
2.22
|
|
1.91
|
|
|||
|
Weighted average number of common shares outstanding – basic
|
19,995,000
|
|
26,842,000
|
|
28,270,000
|
|
||||
|
Weighted average number of common and common equivalent shares outstanding – diluted
|
25,991,000
|
|
32,623,000
|
|
34,074,000
|
|
||||
|
Dividends declared per issued and outstanding common share as of the applicable dividend record date
|
$
|
1.10
|
|
1.00
|
|
—
|
|
|||
See accompanying notes to consolidated financial statements.
F-5
COMTECH TELECOMMUNICATIONS CORP.
AND SUBSIDIARIES
Consolidated Statements of Stockholders’ Equity
Fiscal Years Ended July 31, 2012, 2011 and 2010
|
Common Stock
|
Additional
Paid-in
Capital
|
Retained Earnings
|
Treasury Stock
|
Stockholders'
Equity
|
||||||||||||||||||||||
|
Shares
|
Amount
|
Shares
|
Amount
|
|||||||||||||||||||||||
|
Balance as of July 31, 2009
|
28,390,855
|
|
$
|
2,839,000
|
|
$
|
335,656,000
|
|
$
|
290,819,000
|
|
210,937
|
|
$
|
(185,000
|
)
|
$
|
629,129,000
|
|
|||||||
|
Equity-classified stock award compensation
|
—
|
|
—
|
|
8,639,000
|
|
—
|
|
—
|
|
—
|
|
8,639,000
|
|
||||||||||||
|
Proceeds from exercise of options
|
103,478
|
|
10,000
|
|
1,661,000
|
|
—
|
|
—
|
|
—
|
|
1,671,000
|
|
||||||||||||
|
Proceeds from issuance of employee stock purchase plan shares
|
48,202
|
|
5,000
|
|
1,301,000
|
|
—
|
|
—
|
|
—
|
|
1,306,000
|
|
||||||||||||
|
Excess income tax benefit from stock-based award exercises
|
—
|
|
—
|
|
257,000
|
|
—
|
|
—
|
|
—
|
|
257,000
|
|
||||||||||||
|
Net income
|
—
|
|
—
|
|
—
|
|
60,630,000
|
|
—
|
|
—
|
|
60,630,000
|
|
||||||||||||
|
Balance as of July 31, 2010
|
28,542,535
|
|
2,854,000
|
|
347,514,000
|
|
351,449,000
|
|
210,937
|
|
(185,000
|
)
|
701,632,000
|
|
||||||||||||
|
Equity-classified stock award compensation
|
—
|
|
—
|
|
5,366,000
|
|
—
|
|
—
|
|
—
|
|
5,366,000
|
|
||||||||||||
|
Proceeds from exercise of options
|
139,885
|
|
14,000
|
|
2,824,000
|
|
—
|
|
—
|
|
—
|
|
2,838,000
|
|
||||||||||||
|
Proceeds from issuance of employee stock purchase plan shares
|
48,845
|
|
5,000
|
|
1,135,000
|
|
—
|
|
—
|
|
—
|
|
1,140,000
|
|
||||||||||||
|
Cash dividends declared
|
—
|
|
—
|
|
—
|
|
(26,235,000
|
)
|
—
|
|
—
|
|
(26,235,000
|
)
|
||||||||||||
|
Net income tax shortfall from stock-based award exercises
|
—
|
|
—
|
|
(53,000
|
)
|
—
|
|
—
|
|
—
|
|
(53,000
|
)
|
||||||||||||
|
Reversal of deferred tax assets associated with expired and unexercised stock-based awards
|
—
|
|
—
|
|
(1,785,000
|
)
|
—
|
|
—
|
|
—
|
|
(1,785,000
|
)
|
||||||||||||
|
Repurchases of common stock
|
—
|
|
—
|
|
—
|
|
—
|
|
4,297,508
|
|
(121,618,000
|
)
|
(121,618,000
|
)
|
||||||||||||
|
Net income
|
—
|
|
—
|
|
—
|
|
67,895,000
|
|
—
|
|
—
|
|
67,895,000
|
|
||||||||||||
|
Balance as of July 31, 2011
|
28,731,265
|
|
2,873,000
|
|
355,001,000
|
|
393,109,000
|
|
4,508,445
|
|
(121,803,000
|
)
|
629,180,000
|
|
||||||||||||
|
Equity-classified stock award compensation
|
—
|
|
—
|
|
3,519,000
|
|
—
|
|
—
|
|
—
|
|
3,519,000
|
|
||||||||||||
|
Proceeds from exercise of options
|
155,145
|
|
15,000
|
|
3,187,000
|
|
—
|
|
—
|
|
—
|
|
3,202,000
|
|
||||||||||||
|
Proceeds from issuance of employee stock purchase plan shares
|
45,269
|
|
5,000
|
|
1,083,000
|
|
—
|
|
—
|
|
—
|
|
1,088,000
|
|
||||||||||||
|
Cash dividends declared
|
—
|
|
—
|
|
—
|
|
(21,298,000
|
)
|
—
|
|
—
|
|
(21,298,000
|
)
|
||||||||||||
|
Net excess income tax benefit from stock-based award exercises
|
—
|
|
—
|
|
45,000
|
|
—
|
|
—
|
|
—
|
|
45,000
|
|
||||||||||||
|
Reversal of deferred tax assets associated with expired and unexercised stock-based awards
|
—
|
|
—
|
|
(1,377,000
|
)
|
—
|
|
—
|
|
—
|
|
(1,377,000
|
)
|
||||||||||||
|
Repurchases of common stock
|
—
|
|
—
|
|
—
|
|
—
|
|
7,055,614
|
|
(217,374,000
|
)
|
(217,374,000
|
)
|
||||||||||||
|
Net income
|
—
|
|
—
|
|
—
|
|
32,416,000
|
|
—
|
|
—
|
|
32,416,000
|
|
||||||||||||
|
Balance as of July 31, 2012
|
28,931,679
|
|
$
|
2,893,000
|
|
$
|
361,458,000
|
|
$
|
404,227,000
|
|
11,564,059
|
|
$
|
(339,177,000
|
)
|
$
|
429,401,000
|
|
|||||||
See accompanying notes to consolidated financial statements.
F-6
|
COMTECH TELECOMMUNICATIONS CORP.
AND SUBSIDIARIES
Consolidated Statements of Cash Flows
Fiscal Years Ended July 31, 2012, 2011 and 2010
|
||||||||||
|
|
2012
|
2011
|
2010
|
|||||||
|
Cash flows from operating activities:
|
|
|
|
|||||||
|
Net income
|
$
|
32,416,000
|
|
67,895,000
|
|
60,630,000
|
|
|||
|
Adjustments to reconcile net income to net cash provided by operating activities:
|
|
|
|
|
|
|
||||
|
Depreciation and amortization of property, plant and equipment
|
10,205,000
|
|
14,253,000
|
|
11,773,000
|
|
||||
|
Amortization of intangible assets with finite lives
|
6,637,000
|
|
8,091,000
|
|
7,294,000
|
|
||||
|
Amortization of stock-based compensation
|
3,572,000
|
|
5,357,000
|
|
8,716,000
|
|
||||
|
Impairment of goodwill
|
—
|
|
—
|
|
13,249,000
|
|
||||
|
Deferred financing costs
|
1,652,000
|
|
1,391,000
|
|
1,386,000
|
|
||||
|
Change in fair value of contingent earn-out liability
|
(918,000
|
)
|
—
|
|
—
|
|
||||
|
Loss on disposal of property, plant and equipment
|
14,000
|
|
7,000
|
|
116,000
|
|
||||
|
Provision for allowance for doubtful accounts
|
458,000
|
|
244,000
|
|
219,000
|
|
||||
|
Provision for excess and obsolete inventory
|
3,862,000
|
|
4,091,000
|
|
7,744,000
|
|
||||
|
Excess income tax benefit from stock-based award exercises
|
(231,000
|
)
|
(225,000
|
)
|
(250,000
|
)
|
||||
|
Deferred income tax (benefit) expense
|
(4,570,000
|
)
|
761,000
|
|
(7,311,000
|
)
|
||||
|
Changes in assets and liabilities, net of effects of acquisitions and sale of certain assets and liabilities:
|
|
|
|
|
|
|
||||
|
Accounts receivable
|
14,101,000
|
|
64,795,000
|
|
(56,582,000
|
)
|
||||
|
Inventories
|
(4,407,000
|
)
|
(5,224,000
|
)
|
12,015,000
|
|
||||
|
Prepaid expenses and other current assets
|
1,427,000
|
|
1,606,000
|
|
4,789,000
|
|
||||
|
Other assets
|
201,000
|
|
737,000
|
|
(1,340,000
|
)
|
||||
|
Accounts payable
|
(2,534,000
|
)
|
(54,343,000
|
)
|
58,611,000
|
|
||||
|
Accrued expenses and other current liabilities
|
(5,221,000
|
)
|
(4,866,000
|
)
|
484,000
|
|
||||
|
Customer advances and deposits
|
3,505,000
|
|
(1,927,000
|
)
|
(6,684,000
|
)
|
||||
|
Other liabilities
|
877,000
|
|
789,000
|
|
235,000
|
|
||||
|
Interest payable
|
(2,000
|
)
|
—
|
|
113,000
|
|
||||
|
Income taxes payable
|
(7,551,000
|
)
|
(6,072,000
|
)
|
9,313,000
|
|
||||
|
Net cash provided by operating activities
|
53,493,000
|
|
97,360,000
|
|
124,520,000
|
|
||||
|
Cash flows from investing activities:
|
|
|
|
|
|
|
||||
|
Purchases of property, plant and equipment
|
(6,413,000
|
)
|
(7,138,000
|
)
|
(7,402,000
|
)
|
||||
|
Purchases of other intangibles with finite lives
|
—
|
|
(50,000
|
)
|
(113,000
|
)
|
||||
|
Proceeds from sale of certain assets and liabilities
|
—
|
|
—
|
|
2,038,000
|
|
||||
|
Payments for business acquisitions
|
—
|
|
(2,850,000
|
)
|
—
|
|
||||
|
Net cash used in investing activities
|
(6,413,000
|
)
|
(10,038,000
|
)
|
(5,477,000
|
)
|
||||
|
Cash flows from financing activities:
|
|
|
|
|
|
|
||||
|
Repurchases of common stock
|
(219,375,000
|
)
|
(119,617,000
|
)
|
—
|
|
||||
|
Cash dividends paid
|
(22,625,000
|
)
|
(20,135,000
|
)
|
—
|
|
||||
|
Proceeds from exercises of stock options
|
3,202,000
|
|
2,838,000
|
|
1,671,000
|
|
||||
|
Proceeds from issuance of employee stock purchase plan shares
|
1,088,000
|
|
1,140,000
|
|
1,306,000
|
|
||||
|
Excess income tax benefit from stock-based award exercises
|
231,000
|
|
225,000
|
|
250,000
|
|
||||
|
Payment of contingent consideration related to business acquisition
|
(195,000
|
)
|
(24,000
|
)
|
—
|
|
||||
|
(Continued)
|
|
|||||||||
F-7
|
COMTECH TELECOMMUNICATIONS CORP.
AND SUBSIDIARIES
Consolidated Statements of Cash Flows (continued)
Fiscal Years Ended July 31, 2012, 2011 and 2010
|
||||||||||
|
|
2012
|
2011
|
2010
|
|||||||
|
Fees related to line of credit
|
(316,000
|
)
|
(539,000
|
)
|
(8,000
|
)
|
||||
|
Transaction costs related to issuance of convertible senior notes
|
—
|
|
—
|
|
(118,000
|
)
|
||||
|
Net cash (used in) provided by financing activities
|
(237,990,000
|
)
|
(136,112,000
|
)
|
3,101,000
|
|
||||
|
Net (decrease) increase in cash and cash equivalents
|
$
|
(190,910,000
|
)
|
(48,790,000
|
)
|
122,144,000
|
|
|||
|
Cash and cash equivalents at beginning of period
|
558,804,000
|
|
607,594,000
|
|
485,450,000
|
|
||||
|
Cash and cash equivalents at end of period
|
$
|
367,894,000
|
|
558,804,000
|
|
607,594,000
|
|
|||
|
Supplemental cash flow disclosure
|
|
|
|
|||||||
|
Cash paid during the period for:
|
|
|
|
|||||||
|
Interest
|
$
|
6,509,000
|
|
6,407,000
|
|
6,219,000
|
|
|||
|
Income taxes
|
$
|
23,746,000
|
|
39,498,000
|
|
35,107,000
|
|
|||
|
Non-cash investing and financing activities:
|
|
|
|
|||||||
|
Business acquisition liabilities (See Note 2)
|
$
|
—
|
|
4,170,000
|
|
1,350,000
|
|
|||
|
Cash dividends declared
|
$
|
4,773,000
|
|
6,100,000
|
|
—
|
|
|||
|
Accrued repurchases of common stock
|
$
|
—
|
|
2,001,000
|
|
—
|
|
|||
See accompanying notes to consolidated financial statements.
F-8
(1)
Summary of Significant Accounting and Reporting Policies
|
(a)
|
Principles of Consolidation
|
The accompanying consolidated financial statements include the accounts of Comtech Telecommunications Corp. and its subsidiaries (“Comtech,” “we,” “us,” or “our”), all of which are wholly-owned. All significant intercompany balances and transactions have been eliminated in consolidation.
|
(b)
|
Nature of Business
|
We design, develop, produce and market innovative products, systems and services for advanced communications solutions.
Our business is highly competitive and characterized by rapid technological change. Our growth and financial position depends, among other things, on our ability to keep pace with such changes and developments and to respond to the sophisticated requirements of an increasing variety of electronic equipment users. Many of our competitors are substantially larger, and have significantly greater financial, marketing and operating resources and broader product lines than us. A significant technological breakthrough by others, including smaller competitors or new companies, could have a material adverse effect on our business. In addition, certain of our customers have technological capabilities in our product areas and could choose to replace our products with their own.
International sales expose us to certain risks, including barriers to trade, fluctuations in foreign currency exchange rates (which may make our products less price competitive), political and economic instability, availability of suitable export financing, export license requirements, tariff regulations, and other United States (“U.S.”) and foreign regulations that may apply to the export of our products, as well as the generally greater difficulties of doing business abroad. We attempt to reduce the risk of doing business in foreign countries by seeking contracts denominated in U.S. dollars, advance or milestone payments, credit insurance and irrevocable letters of credit in our favor.
The vast majority of sales in our mobile data communications segment have historically come from sales relating to the U.S. Army's MTS and BFT-1 programs. Our combined MTS and BFT-1 sales for fiscal
2010
through fiscal
2012
were as follows:
|
Net Sales
|
Percentage of
Mobile Data
Communications
Segment Net Sales
|
Percentage of
Consolidated
Net Sales
|
||||||||
|
2012
|
$
|
87,769,000
|
|
78.0
|
%
|
20.6
|
%
|
|||
|
2011
|
248,578,000
|
|
86.2
|
%
|
40.6
|
%
|
||||
|
2010
|
423,213,000
|
|
94.8
|
%
|
54.4
|
%
|
||||
We are currently providing both MTS and BFT-1 sustainment services pursuant to a
three
-year IDIQ contract that we were awarded in March 2012. This three-year contract has a not-to-exceed value of
$80,731,000
and a base performance period that began
April 1, 2012
and ends
March 31, 2013
. The contract provides for
two
twelve-month option periods exercisable by the U.S. Army and, except for a fixed annual intellectual property license ("IP license") fee of
$10,000,000
, the three-year
$80,731,000
contract value is subject to finalization and downward negotiation. Payments of annual IP license fees beyond the base year are contingent upon the U.S. Army's exercise of optional performance periods.
F-9
COMTECH TELECOMMUNICATIONS CORP.
AND SUBSIDIARIES
Notes to Consolidated Financial Statements, Continued
|
(c)
|
Revenue Recognition
|
Revenue is generally recognized when the earnings process is complete, upon shipment or customer acceptance. Revenue from contracts relating to the design, development or manufacture of complex electronic equipment to a buyer’s specification or to provide services relating to the performance of such contracts is generally recognized in accordance with Financial Accounting Standards Board’s (“FASB”) Accounting Standards Codification (“ASC”) 605-35 “Revenue Recognition — Construction-Type and Production-Type Contracts” (“ASC 605-35”). We primarily apply the percentage-of-completion method and generally recognize revenue based on the relationship of total costs incurred to total projected costs, or, alternatively, based on output measures, such as units delivered or produced. In the case of our mobile data communications segment’s MTS and BFT-1 contracts with the U.S. Army, we utilize the percentage-of-completion method. Profits expected to be realized on such contracts are based on total estimated sales for the contract compared to total estimated costs, including warranty costs, at completion of the contract. These estimates are reviewed and revised periodically throughout the lives of the contracts, and adjustments to profits resulting from such revisions are made cumulative to the date of the change. Provision for anticipated losses on uncompleted contracts is made in the period in which such losses become evident. Long-term, U.S. government, cost-reimbursable type contracts are also specifically covered by FASB ASC 605-35.
We have historically demonstrated an ability to estimate contract revenues and expenses in applying the percentage-of-completion method of accounting. However, there exist inherent risks and uncertainties in estimating future revenues and expenses, particularly on larger or longer-term contracts. Changes to such estimates could have a material effect on our consolidated financial condition and results of operations.
Revenue recognized in excess of amounts billable under long-term contracts accounted for under the percentage-of-completion method are recorded as unbilled receivables in the accompanying consolidated balance sheets. Unbilled receivables are billable upon various events, including the attainment of performance milestones, delivery of hardware, submission of progress bills based on time and materials, or completion of the contract. We do not recognize revenue, or record unbilled receivables, until we receive fully funded orders.
In fiscal
2012
,
86.2%
of our consolidated U.S. government net sales were derived from firm fixed-price contracts. Under these types of contracts, we perform for an agreed-upon price and derive benefits from cost savings, but bear the risk of cost overruns. Our cost-plus-fixed-fee contracts, which to date have not been significant, typically provide for reimbursement of allowable costs incurred plus a negotiated fee.
Most government contracts have ter
mination for convenience clauses that provide the customer with the right to terminate the contract at any time. Historically, we have not experienced material contract terminations or write-offs of unbilled receivables. We address customer acceptance provisions in assessing our ability to perform our contractual obligations under long-term contracts. Historically, we have been able to perform on our long-term contracts.
Revenues from contracts that contain multiple elements that are not accounted for under the percentage-of-completion method are accounted for in accordance with FASB ASC 605-25 “Revenue Recognition — Multiple Element Arrangements,” as amended by FASB Accounting Standards Update (“ASU”) No. 2009-13, which, among other things, requires revenue to be allocated to each element based on the relative selling price method.
|
(d)
|
Cash and Cash Equivalents
|
Our cash equivalents are short-term, highly liquid investments that are both readily convertible to known amounts of cash and have insignificant risk of change in value as a result of changes in interest rates. Our cash and cash equivalents, as of
July 31, 2012
and
2011
, amounted to
$367,894,000
and
$558,804,000
, respectively, and primarily consist of money market mutual funds (both government and commercial), certificates of deposit, bank deposits and U.S. Treasury securities (with maturities at the time of purchase of three months or less). Many of our money market mutual funds invest in direct obligations of the U.S. government, bank securities guaranteed by the Federal Deposit Insurance Corporation, certificates of deposits and commercial paper and other securities issued by other companies. None of our cash equivalents include municipal auction-rate securities. Cash equivalents are carried at cost, which approximates fair market value.
F-10
COMTECH TELECOMMUNICATIONS CORP.
AND SUBSIDIARIES
Notes to Consolidated Financial Statements, Continued
|
(e)
|
Inventories
|
Work-in-process inventory reflects all accumulated production costs, which are comprised of direct production costs and overhead, and is reduced by amounts recorded in cost of sales as the related revenue is recognized. These inventories are reduced to their estimated net realizable value by a charge to cost of sales in the period such excess costs are determined. Indirect costs relating to long-term contracts, which include expenses such as general and administrative, are charged to expense as incurred and are not included in our work-in-process (including our contracts-in-progress) inventory or cost of sales.
Raw materials and components and finished goods inventory are stated at the lower of cost or market, computed on the first-in, first-out (“FIFO”) method.
|
(f)
|
Long-Lived Assets
|
Our machinery and equipment, which are recorded at cost, are depreciated or amortized over their estimated useful lives (
three
to
eight
years) under the straight-line method. Capitalized values of properties and leasehold improvements under leases are amortized over the life of the lease or the estimated life of the asset, whichever is less.
Goodwill represents the excess cost of a business acquisition over the fair value of the net assets acquired. In accordance with the FASB ASC 350, “Intangibles – Goodwill and Other,” goodwill is not amortized. We periodically, at least on an annual basis in the first quarter of each fiscal year, review goodwill, considering factors such as projected cash flows and revenue and earnings multiples, to determine whether the carrying value of the goodwill is impaired. If the goodwill is deemed to be impaired, the difference between the carrying amount reflected in the financial statements and the estimated fair value is recognized as an expense in the period in which the impairment occurs. We define our reporting units to be the same as our operating segments.
We assess the recoverability of the carrying value of our other long-lived assets, including identifiable intangible assets with finite useful lives, whenever events or changes in circumstances indicate that the carrying amount of the assets may not be recoverable. We evaluate the recoverability of such assets based upon the expectations of undiscounted cash flows from such assets. If the sum of the expected future undiscounted cash flows were less than the carrying amount of the asset, a loss would be recognized for the difference between the fair value and the carrying amount.
We performed our annual impairment testing for fiscal
2013
on August 1,
2012
(the start of our first quarter of fiscal
2013
) and we determined that there was no impairment of goodwill. Unless there are future indicators of impairment, such as a significant adverse change in our future financial performance, our next impairment review for goodwill will be performed and completed in the first quarter of fiscal
2013
. Any impairment charges that we may take in the future could be material to our results of operations and financial condition.
We performed our annual impairment testing for fiscal
2012
on August 1,
2011
(the start of our first quarter of fiscal
2012
) and we determined that there was no impairment of goodwill.
During the fourth quarter of fiscal 2010, we were advised by the U.S. Army that we were not selected as the vendor and program manager for the BFT-2 program. As a result, we experienced a significant and sustained decline in our stock price and we determined that it was appropriate to conduct an interim impairment test for all three of our reporting units. Based on our interim goodwill impairment review, we determined that, as of July 31, 2010, the carrying value of our goodwill in our mobile data communications reporting unit was fully impaired. Accordingly, we recorded a goodwill impairment charge of
$13,249,000
for the fiscal year ended July 31, 2010.
|
(g)
|
Research and Development Costs
|
We charge research and development costs to operations as incurred, except in those cases in which such costs are reimbursable under customer funded contracts. In fiscal
2012
,
2011
and
2010
, we were reimbursed by customers for such activities in the amount of
$5,665,000
,
$10,703,000
and
$12,611,000
, respectively.
F-11
COMTECH TELECOMMUNICATIONS CORP.
AND SUBSIDIARIES
Notes to Consolidated Financial Statements, Continued
|
(h)
|
Income Taxes
|
Income taxes are accounted for under the asset and liability method. Deferred tax assets and liabilities are recognized for the future tax consequences attributable to differences between the financial statement carrying amounts of existing assets and liabilities and their respective tax bases and operating loss and tax credit carryforwards. Deferred tax assets and liabilities are measured using the enacted tax rates expected to apply to taxable income in the years in which those temporary differences are expected to be recovered or settled. The effect on deferred tax assets and liabilities of a change in tax rates is recognized in income in the period that includes the enactment date.
We determine the uncertain tax positions taken or expected to be taken in income tax returns in accordance with the provisions of FASB ASC 740-10-25, which prescribes a two-step evaluation process for tax positions. The first step is recognition based on a determination of whether it is more-likely-than-not that a tax position will be sustained upon examination, including resolution of any related appeals or litigation processes, based on the technical merits of the position. The second step is to measure a tax position that meets the more-likely-than-not threshold. The tax position is measured as the largest amount of benefit that is greater than
50%
likely of being realized upon ultimate settlement. If a tax position does not meet the more-likely-than-not recognition threshold, the benefit of that position is not recognized in the financial statements. Our policy is to recognize interest and penalties related to uncertain tax positions in income tax expense.
|
(i)
|
Earnings Per Share
|
Our basic earnings per share (“EPS”) is computed based on the weighted average number of shares, including fully-vested stock units, outstanding during each respective period. Our diluted EPS reflects the dilution from potential common stock issuable pursuant to the exercise of equity-classified stock-based awards and convertible senior notes, if dilutive, outstanding during each respective period. When calculating our diluted earnings per share, we consider (i) the amount an employee must pay upon assumed exercise of stock-based awards; (ii) the amount of stock-based compensation cost attributed to future services and not yet recognized; and (iii) the amount of excess tax benefits, if any, that would be credited to additional paid-in capital assuming exercise of in-the-money stock-based awards. This excess tax benefit is the amount resulting from a tax deduction for compensation in excess of compensation expense, based on the Black Scholes option pricing model, recognized for financial reporting purposes.
Equity-classified stock-based awards to purchase
2,169,000
,
2,486,000
and
2,148,000
shares for fiscal
2012
,
2011
and
2010
, respectively, were not included in our diluted EPS calculation because their effect would have been anti-dilutive. Liability-classified stock-based awards do not impact and are not included in the denominator for EPS calculations.
In addition, the weighted-average basic and diluted shares outstanding for the fiscal years ended July 31,
2012
and
2011
reflect a reduction of approximately
4,350,000
and
1,781,000
shares as a result of the repurchase of our common shares during the respective periods. See Note (17) – “
Stockholders’ Equity
” for more information on the stock repurchase program.
F-12
COMTECH TELECOMMUNICATIONS CORP.
AND SUBSIDIARIES
Notes to Consolidated Financial Statements, Continued
The following table reconciles the numerators and denominators used in the basic and diluted EPS calculations:
|
|
Fiscal Years Ended July 31,
|
|||||||||
|
2012
|
2011
|
2010
|
||||||||
|
Numerator:
|
|
|
|
|||||||
|
Net income for basic calculation
|
$
|
32,416,000
|
|
67,895,000
|
|
60,630,000
|
|
|||
|
Effect of dilutive securities:
|
|
|
|
|
|
|
||||
|
Interest expense (net of tax) on 3.0% convertible senior notes
|
4,468,000
|
|
4,468,000
|
|
4,468,000
|
|
||||
|
Numerator for diluted calculation
|
36,884,000
|
|
72,363,000
|
|
65,098,000
|
|
||||
|
Denominator:
|
|
|
|
|
|
|
||||
|
Denominator for basic calculation
|
19,995,000
|
|
26,842,000
|
|
28,270,000
|
|
||||
|
Effect of dilutive securities:
|
|
|
|
|
|
|
||||
|
Stock options
|
228,000
|
|
215,000
|
|
316,000
|
|
||||
|
Conversion of 3.0% convertible senior notes
|
5,768,000
|
|
5,566,000
|
|
5,488,000
|
|
||||
|
Denominator for diluted calculation
|
25,991,000
|
|
32,623,000
|
|
34,074,000
|
|
||||
|
(j)
|
Accounting for Stock-Based Compensation
|
We issue stock-based awards to certain of our employees and our Board of Directors and we recognize related stock-based compensation for both equity and liability-classified stock-based awards in our consolidated financial statements. These awards are issued pursuant to our 2000 Stock Incentive Plan and our 2001 Employee Stock Purchase Plan (the “ESPP”).
Stock-based compensation for equity-classified awards is measured at the date of grant, based on an estimate of the fair value of the award and is generally expensed over the vesting period of the grant. Stock-based compensation for liability-classified awards is determined the same way, except that the fair value of liability-classified awards is remeasured at the end of each reporting period until the award is settled, with changes in fair value recognized pro-rata for the portion of the requisite service period rendered.
Stock-based compensation for awards issued is reflected in the following line items in our Consolidated Statements of Operations:
|
|
Fiscal Years Ended July 31,
|
|||||||||
|
|
2012
|
2011
|
2010
|
|||||||
|
Cost of sales
|
$
|
284,000
|
|
410,000
|
|
828,000
|
|
|||
|
Selling, general and administrative expenses
|
2,716,000
|
|
3,976,000
|
|
6,317,000
|
|
||||
|
Research and development expenses
|
572,000
|
|
971,000
|
|
1,571,000
|
|
||||
|
Stock-based compensation expense before income tax benefit
|
3,572,000
|
|
5,357,000
|
|
8,716,000
|
|
||||
|
Income tax benefit
|
(1,308,000
|
)
|
(1,913,000
|
)
|
(3,201,000
|
)
|
||||
|
Net stock-based compensation expense
|
$
|
2,264,000
|
|
3,444,000
|
|
5,515,000
|
|
|||
Of the total stock-based compensation expense before income tax benefit recognized in fiscal
2012
,
2011
and
2010
,
$232,000
,
$270,000
and
$307,000
, respectively, related to stock-based awards issued pursuant to our ESPP.
F-13
COMTECH TELECOMMUNICATIONS CORP.
AND SUBSIDIARIES
Notes to Consolidated Financial Statements, Continued
Included in total stock-based compensation expense before income tax benefit in fiscal
2012
,
2011
and
2010
is a benefit of
$16,000
,
$52,000
and
$41,000
, respectively, as a result of the required fair value re-measurement of our liability-classified stock appreciation rights (“SARs”) at the end of each of the respective reporting periods.
Stock-based compensation that was capitalized and included in ending inventory at July 31,
2012
,
2011
and
2010
was
$48,000
,
$117,000
and
$159,000
, respectively.
Included in total stock-based compensation expense before income tax benefit for fiscal
2010
, was an expense of approximately
$1,396,000
which represents the estimated fair value of an increase in the respective contractual terms of
601,875
previously granted stock-based awards for
seventy-eight
employees. These stock-based awards were fully vested and their respective contractual lives were nearing expiration. In determining the fair value of the increase in contractual terms, we utilized the following weighted average assumptions: (i) expected life in years of
1.59
; (ii) expected volatility of
40.98%
; (iii) risk free interest rate of
0.47%
; and (iv) expected dividend yield of
0%
. There was no material expense relating to modifications recorded in fiscal
2012
or fiscal
2011
.
We estimate the fair value of certain stock-based awards using the Black-Scholes option pricing model. The Black-Scholes option pricing model includes assumptions regarding dividend yield, expected volatility, expected option term and risk-free interest rates. The assumptions used in computing the fair value of stock-based awards reflect our best estimates, but involve uncertainties relating to market and other conditions, many of which are outside of our control. Estimates of fair value are not intended to predict actual future events or the value ultimately realized by the employees who receive stock-based awards.
The per share weighted average grant-date fair value of stock options granted during fiscal
2012
,
2011
and
2010
was
$6.53
,
$6.51
and
$10.47
, respectively. In addition to the exercise and grant-date prices of these awards, we utilized certain weighted average assumptions to estimate the initial fair value of stock-based awards.
Weighted average assumptions related to our stock options are listed in the table below:
|
|
Fiscal Years Ended July 31,
|
||||||||
|
|
2012
|
2011
|
2010
|
||||||
|
Expected dividend yield
|
3.76
|
%
|
3.62
|
%
|
0.00
|
%
|
|||
|
Expected volatility
|
36.63
|
%
|
36.31
|
%
|
38.00
|
%
|
|||
|
Risk-free interest rate
|
0.64
|
%
|
1.58
|
%
|
1.99
|
%
|
|||
|
Expected life (years)
|
5.29
|
|
5.10
|
|
5.01
|
|
|||
The expected dividend yield is the expected annual dividend as a percentage of the fair market value of the stock on the date of grant. For the stock options granted during fiscal 2012 and 2011, the expected dividend yield was equal to our targeted annual dividend of
$1.10
per share and
$1.00
per share, respectively, divided by the quoted market price of our common stock on the date of the grant. We estimate expected volatility by considering the historical volatility of our stock, the implied volatility of publicly traded call options on our stock, the implied volatility of call options embedded in our 3.0% convertible senior notes and our expectations of volatility for the expected life of stock options. The risk-free interest rate is based on the U.S. Treasury yield curve in effect at the time of grant for an instrument which closely approximates the expected option term. The expected option term is the number of years we estimate that stock options will be outstanding prior to exercise. The expected life of awards issued is determined by employee groups with sufficiently distinct behavior patterns.
Stock options and SARs granted have exercise prices equal to the fair market value of the stock on the date of grant, a contractual term of
five
or
ten years
and a vesting period of
three
or
five years
. We settle employee stock option exercises with new shares. All SARs granted through
July 31, 2012
may only be settled with cash. Included in accrued expenses at
July 31, 2012
,
2011
and
2010
is
$6,000
,
$22,000
and
$74,000
, respectively, relating to the potential cash settlement of SARs.
Stock units granted are fully-vested on the date of grant and are convertible into shares of our common stock on a one-for-one basis for no cash consideration, generally at the time of termination or earlier, under certain specific circumstances.
F-14
COMTECH TELECOMMUNICATIONS CORP.
AND SUBSIDIARIES
Notes to Consolidated Financial Statements, Continued
During fiscal 2012,
410
fully-vested stock units were granted with a weighted average grant-date market value of
$30.48
per share. Included in total stock-based compensation expense before income tax benefit for the fiscal year ended July 31, 2012 is an expense of
$12,000
related to these stock units. There were no stock units granted or related stock-based compensation expense recognized in fiscal 2011 and 2010. We expect to settle stock units with new shares.
Restricted Stock Units ("RSUs") granted are subject to certain terms, have a vesting period of
three years
, and are convertible into shares of our common stock on a one-for-one basis for no cash consideration, generally at the time of termination or earlier, under certain specific circumstances. During fiscal 2012,
12,668
RSUs were granted with a vesting period of three years. The fair value of the awards was
$26.23
per share, based on the closing market price of our common stock on the date of grant, net of the present value of the dividends using the applicable risk-free interest rate, as these RSUs are not entitled to dividend equivalents while unvested and unissued. Included in total stock-based compensation expense before income tax benefit for the fiscal year ended July 31, 2012 is an expense of
$13,000
related to these RSUs. There were no RSUs granted or related stock-based compensation expense recognized in fiscal 2011 and 2010. We expect to settle RSUs with new shares.
Performance shares granted are subject to certain terms and restrictions and vest following the achievement of requisite pre-established performance goals. During fiscal 2012,
35,003
performance shares were granted. The fair value of these awards was
$26.25
per share, based on the closing market price of our common stock on the date of grant, net of the present value of the dividends using the applicable risk-free interest rate, as these performance shares are not entitled to dividend equivalents while unvested and unissued. Once the performance goals are attained, these awards will vest over a
5.3
year period beginning on the date of grant and each of these awards will be convertible into shares of our common stock on a one-for-one basis at the end of each vesting tranche for no cash consideration. As of July 31, 2012, we expect that the performance goal relating to awards granted in fiscal 2012 will be attained. As a result, we recorded a compensation expense of
$52,000
related to performance shares, which is included in total stock-based compensation expense before income tax benefit for the fiscal year ended
July 31, 2012
. There were no performance shares issued or related stock-based compensation expense recognized in fiscal 2011 and 2010.
The following table provides the components of the actual income tax benefit recognized for tax deductions relating to the exercise of stock-based awards:
|
|
Fiscal Years Ended July 31,
|
|||||||||
|
|
2012
|
2011
|
2010
|
|||||||
|
Actual income tax benefit recorded for the tax deductions relating to the exercise of stock-based awards
|
$
|
438,000
|
|
306,000
|
|
484,000
|
|
|||
|
Less: Tax benefit initially recognized on exercised stock-based awards vesting subsequent to the adoption of accounting standards that require us to expense stock-based awards, excluding income tax shortfalls
|
(197,000
|
)
|
(81,000
|
)
|
(227,000
|
)
|
||||
|
Excess income tax benefit recorded as an increase to additional paid-in capital
|
241,000
|
|
225,000
|
|
257,000
|
|
||||
|
Less: Tax benefit initially disclosed but not previously recognized on exercised equity-classified stock-based awards vesting prior to the adoption of accounting standards that require us to expense stock-based awards
|
(10,000
|
)
|
—
|
|
(7,000
|
)
|
||||
|
Excess income tax benefit from exercised equity-classified stock-based awards reported as a cash flow from financing activities in our Consolidated Statements of Cash Flows
|
$
|
231,000
|
|
225,000
|
|
250,000
|
|
|||
At
July 31, 2012
, total remaining unrecognized compensation cost related to unvested stock-based awards was
$9,200,000
, net of estimated forfeitures of
$700,000
. The net cost is expected to be recognized over a weighted average period of
3.8
years.
F-15
COMTECH TELECOMMUNICATIONS CORP.
AND SUBSIDIARIES
Notes to Consolidated Financial Statements, Continued
As of
July 31, 2012
and
2011
, the amount of hypothetical tax benefits related to stock-based awards was
$22,786,000
and
$24,118,000
, respectively. During fiscal
2012
and
2011
, we recorded
$1,377,000
and
$1,785,000
, respectively, as a reduction to additional paid-in capital, which represented the reversal of unrealized deferred tax assets associated with certain vested equity-classified stock-based awards that expired during the period. There was no such reduction to additional paid-in capital or similar reversal of unrealized deferred tax assets during fiscal 2010.
|
(k)
|
Fair Value Measurements and Financial Instruments
|
In accordance with FASB ASC 825, “Financial Instruments,” we determined that, as of
July 31, 2012
and
2011
, the fair value of our 3.0% convertible senior notes was approximately
$211,920,000
and
$207,680,000
, respectively, based on quoted market prices in an active market. Our 3.0% convertible senior notes are not marked-to-market and are shown on the accompanying balance sheet at their original issuance value. As such, changes in the estimated fair value of our 3.0% convertible senior notes are not recorded in our consolidated financial statements.
As of
July 31, 2012
and
2011
, we had approximately
$84,610,000
and
$152,878,000
, respectively, of money market mutual funds which are classified as cash and cash equivalents in our Consolidated Balance Sheets. These money market mutual funds are recorded at their current fair value. FASB ASC 820, “Fair Value Measurements and Disclosures,” requires us to define fair value as the price that would be received from the sale of an asset or paid to transfer a liability in an orderly transaction between market participants at the measurement date. As such, using the fair value hierarchy described in FASB ASC 820, we valued our money market mutual funds using Level 1 inputs that were based on quoted market prices.
At July 31, 2012, we had a contingent earn-out liability relating to our acquisition of Stampede Technologies, Inc. (“Stampede”) (See Note 2 - "
Acquisitions
") that is recorded at current fair value using Level 3 inputs, primarily management's estimates of future sales and cash flows relating to the earn-out, which also incorporated market participant expectations.
As of
July 31, 2012
and
2011
, other than our cash and cash equivalents and our contingent earn-out liability , we had no other assets or liabilities included in our Consolidated Balance Sheets recorded at current fair value. If we acquire different types of assets or incur different types of liabilities in the future, we might be required to use different FASB ASC fair value methodologies.
|
(l)
|
Use of Estimates
|
The preparation of financial statements in conformity with accounting principles generally accepted in the United States of America requires management to make estimates and assumptions that affect the reported amount of assets and liabilities, and disclosure of contingent assets and liabilities, at the date of the financial statements and the reported amounts of revenues and expenses during the reported period. We make significant estimates in many areas of our accounting, including but not limited to the following: long-term contracts, stock-based compensation, intangible assets including goodwill, provision for excess and obsolete inventory, allowance for doubtful accounts, warranty obligations and income taxes. Actual results may differ from those estimates.
|
(m)
|
Comprehensive Income
|
In accordance with FASB ASC 220, “Comprehensive Income,” we report all changes in equity during a period, except those resulting from investment by owners and distribution to owners, for the period in which they are recognized. Comprehensive income is the total of net income and all other non-owner changes in equity (or other comprehensive income) such as unrealized gains/losses on securities classified as available-for-sale, foreign currency translation adjustments and minimum pension liability adjustments. Comprehensive income was the same as net income in fiscal
2012
,
2011
and
2010
.
|
(n)
|
Reclassifications
|
Certain reclassifications have been made to previously reported consolidated financial statements to conform to the fiscal
2012
presentation.
F-16
COMTECH TELECOMMUNICATIONS CORP.
AND SUBSIDIARIES
Notes to Consolidated Financial Statements, Continued
|
(o)
|
Adoption of New Accounting Standards
|
The Financial Accounting Standards Board’s (“FASB”) Accounting Standards Codification (“ASC”) is subject to updates by FASB, which are known as Accounting Standards Updates (“ASU”). The following are FASB ASUs which have been issued and incorporated into the FASB ASC and were adopted by us in fiscal 2012:
FASB ASU No. 2010-06, which amends the disclosure requirements of FASB ASC 820-10, “Fair Value Measurements and Disclosures - Overall.” This FASB ASU requires that information about purchases, sales, issuances and settlements be presented separately, on a gross basis, in Level 3 fair value measurement reconciliations. Our adoption of this ASU did not have any impact on our consolidated financial statements, other than disclosure relating to the valuation techniques and inputs used to develop fair value measurements of certain assets and liabilities that are recorded in our Consolidated Balance Sheets at fair value.
FASB ASU No. 2010-28, which amends the factors considered in determining if goodwill is impaired in FASB ASC 350, “Intangibles - Goodwill and Other.” This ASU requires entities that have reporting units with carrying amounts that are zero or negative to assess whether it is more likely than not that the reporting unit's goodwill is impaired and, if an impairment is likely, to perform Step 2 of the goodwill impairment test for the reporting unit(s). On August 1, 2011, the date we performed our annual goodwill impairment test for fiscal 2012, none of our reporting units with goodwill had a zero or negative carrying value and, as such, our adoption of this ASU did not have any impact on our consolidated financial statements.
FASB ASU No. 2010-29, which amends the presentation and disclosure requirements of FASB ASC 805, “Business Combinations.” This ASU requires a public entity that presents comparative financial statements to disclose revenue and earnings of the combined entity as though the business combination(s) that occurred during the current year had occurred as of the beginning of the comparable prior annual reporting period only. This ASU also expands the supplemental proforma disclosures required. Our adoption of this ASU did not have any impact on our consolidated financial statements, as we did not acquire any businesses during the twelve months ended July 31, 2012.
FASB ASU No. 2010-20, which amends ASC 310, “Receivables” by requiring additional disclosures regarding troubled debt restructuring. In addition, we also adopted FASB ASU No. 2011-02, which amends the previously issued guidance on evaluation of whether or not a restructuring constitutes a troubled debt restructuring. Our adoption of these ASUs did not have any impact on our consolidated financial statements given that substantially all of our receivables are classified as trade receivables.
FASB ASU No. 2011-04, which amends the fair value measurement and disclosure requirements of FASB ASC 820, “Fair Value Measurements.” This ASU clarifies, among other things, the intent of the application of existing fair value requirements, including those related to highest and best use concepts, and also expands the disclosure requirements for fair value measurements categorized within Level 3 of the fair value hierarchy. Our adoption of this FASB ASU did not have any impact on our consolidated financial statements.
FASB ASU No. 2011-05, which eliminates the option to present components of other comprehensive income as part of the statement of changes in stockholders' equity. In addition, this ASU provides the ability to present the total of comprehensive income, the components of net income and the components of other comprehensive income either in a single continuous statement of comprehensive income, or in two separate but consecutive statements. In both choices, the entity is required to present each component of net income along with total net income, each component of other comprehensive income along with a total for other comprehensive income, and a total amount for comprehensive income. In December 2011, FASB issued ASU 2011-12, which defers certain provisions in the new guidance related to the presentation of reclassification adjustments. Our adoption of this FASB ASU did not have any impact on our consolidated financial statements, including additional disclosures, because we did not have any component of other comprehensive income in our consolidated financial statements other than net income for the twelve months ended July 31, 2012, 2011 and 2010, respectively.
F-17
COMTECH TELECOMMUNICATIONS CORP.
AND SUBSIDIARIES
Notes to Consolidated Financial Statements, Continued
FASB ASU No. 2011-08, which provides, subject to certain conditions, an entity the option to first assess qualitative factors to determine whether it is more likely than not that the fair value of a reporting unit is less than its carrying amount as a basis for determining whether it is necessary to perform the two-step goodwill impairment test described in ASC 350, “Intangibles - Goodwill and Other,” which may reduce complexity and costs of testing goodwill for impairment. Our adoption of this FASB ASU did not have any impact on our consolidated financial statements.
FASB ASU No. 2012-02, which provides, subject to certain conditions, an entity the option to first assess qualitative factors to determine whether it is more likely than not that an indefinite-lived intangible asset is impaired as a basis for determining whether it is necessary to perform the quantitative impairment test in accordance with ASC 350-30, “Intangibles - Goodwill and Other - General Intangibles Other than Goodwill.”
(2)
Acquisitions
Stampede
In
October 2010
, we acquired the WAN optimization techn
ology assets and assumed certain liabilities of
Stampede
for an estimated total purchase price of approximately
$5,303,000
. Almost all of the purchase price for Stampede was allocated to the estimated fair value of technologies acquired and was assigned an estimated amortizable life of
five years
.
As of
July 31, 2012
, we maintain a liability on our Consolidated Balance Sheet of approximately
$3,519,000
related to contingent earn-out payments which we expect to pay based on our belief that certain revenue and related gross margin milestones will be met in future periods. Such payments are expected to be made through
October 1, 2013
. We estimated this liability based on a number of factors, primarily the likelihood of meeting these milestones based on forecasted revenues. We review our estimates and updated forecasts on a quarterly basis and record adjustments as required. Any adjustments are included in selling, general and administrative expenses in our Consolidated Statement of Operations and are recorded in the period in which we make such a change.
Of the remaining
$3,519,000
contingent earn-out liability as of
July 31, 2012
,
$1,752,000
is included in accrued expenses and other current liabilities and
$1,767,000
is included in other long-term liabilities in our Consolidated Balance Sheet. As of
July 31, 2012
, we paid
$1,719,000
of the total purchase price in cash, including
$219,000
of earn-out payments. Interest accreted on the contingent earn-out liability for the years ended
July 31, 2012
and
2011
was
$462,000
and
$391,000
, respectively, and total interest accreted through
July 31, 2012
was
$853,000
.
Stampede was immediately combined with our existing business and is now part of the telecommunications transmission reportable operating segment. Sales and income related to the Stampede acquisition were not material to our results of operations for the fiscal years ended
July 31, 2012
and
2011
and the effects of the acquisition would
not have been material to our historical consolidated financial statements.
(3)
Accounts Receivable
Accounts receivable consist of the following at
July 31, 2012
and
2011
:
|
|
2012
|
2011
|
|||||
|
Billed receivables from commercial customers
|
$
|
41,139,000
|
|
38,245,000
|
|
||
|
Billed receivables from the U.S. government and its agencies
|
11,927,000
|
|
22,075,000
|
|
|||
|
Unbilled receivables on contracts-in-progress
|
4,764,000
|
|
11,701,000
|
|
|||
|
Total accounts receivable
|
57,830,000
|
|
72,021,000
|
|
|||
|
Less allowance for doubtful accounts
|
1,588,000
|
|
1,220,000
|
|
|||
|
Accounts receivable, net
|
$
|
56,242,000
|
|
70,801,000
|
|
||
Unbilled receivables on contracts-in-progres
s include
$3,320,000
and
$4,487,000
at
July 31, 2012
and
2011
, respectively, due from the U.S. government and its agencies. There was
$13,000
and
$28,000
of retainage included in unbilled receivables at
July 31, 2012
and
July 31, 2011
, respectively. In the opinion of management, substantially all of the unbilled balances will be billed and collected within one year.
F-18
COMTECH TELECOMMUNICATIONS CORP.
AND SUBSIDIARIES
Notes to Consolidated Financial Statements, Continued
(4)
Inventories
Inventories consist of the following at
July 31, 2012
and
2011
:
|
|
2012
|
2011
|
|||||
|
Raw materials and components
|
$
|
55,404,000
|
|
53,678,000
|
|
||
|
Work-in-process and finished goods
|
33,243,000
|
|
34,299,000
|
|
|||
|
Total inventories
|
88,647,000
|
|
87,977,000
|
|
|||
|
Less reserve for excess and obsolete inventories
|
16,286,000
|
|
13,316,000
|
|
|||
|
Inventories, net
|
$
|
72,361,000
|
|
74,661,000
|
|
||
At
July 31, 2012
and
2011
, the amount of total inventory directly related to long-term contracts (including contracts-in-progress) was
$2,041,000
and
$8,041,000
, respectively.
As of
July 31, 2012
,
$1,146,000
of our long-term contract inventory relates to BFT-1 sustainment activities with the U.S. Army. Our BFT-1 contract is known as “indefinite delivery/indefinite quantity” type contract; thus, the U.S. Army is not obligated to purchase any additional products or services from us in the future. Almost all of our BFT-1 inventory relates to BFT-1 orders already in our backlog. The remaining portion is expected to be used for incidental purchases and customer repairs. If we are left with inventories of unusable parts, we would likely have to write-off the remaining balance in the period that we make such determination.
At
July 31, 2012
and
2011
,
$1,070,000
and
$1,339,000
, respectively, of the inventory balance above related to contracts from third party commercial customers who outsource thei
r manufacturing to us.
(5)
Property, Plant and Equipment
Property, plant and equipment consist of the following at
July 31, 2012
and
2011
:
|
|
2012
|
2011
|
|||||
|
Machinery and equipment
|
$
|
101,272,000
|
|
96,976,000
|
|
||
|
Leasehold improvements
|
11,162,000
|
|
9,904,000
|
|
|||
|
|
112,434,000
|
|
106,880,000
|
|
|||
|
Less accumulated depreciation and amortization
|
89,602,000
|
|
80,242,000
|
|
|||
|
Property, plant and equipment, net
|
$
|
22,832,000
|
|
26,638,000
|
|
||
Depreciati
on and amortization expense on property, plant and equipment amounted to
$10,205,000
,
$14,253,000
and
$11,773,000
for the fiscal years ended
July 31, 2012
,
2011
and
2010
, respectively.
F-19
COMTECH TELECOMMUNICATIONS CORP.
AND SUBSIDIARIES
Notes to Consolidated Financial Statements, Continued
(6)
Accrued Expenses and Other Current Liabilities
Accrued expenses and other current liabilities consist of the following at
July 31, 2012
and
2011
:
|
|
2012
|
2011
|
|||||
|
Accrued wages and benefits
|
$
|
16,467,000
|
|
19,751,000
|
|
||
|
Accrued warranty obligations
|
7,883,000
|
|
9,120,000
|
|
|||
|
Accrued commissions and royalties
|
3,946,000
|
|
3,295,000
|
|
|||
|
Accrued business acquisition payments
|
1,752,000
|
|
726,000
|
|
|||
|
Other
|
10,822,000
|
|
16,966,000
|
|
|||
|
Accrued expenses and other current liabilities
|
$
|
40,870,000
|
|
49,858,000
|
|
||
We provide warranty coverage for most of our products for a period of at least
one year
from the date of shipment. We record a liability for estimated warranty expense based on historical claims, product failure rates and other factors. Some of our product warranties are provided under long-term contracts, the costs of which are incorporated into our estimates of total contract costs.
Changes in our product warranty liability during the fiscal years ended
July 31, 2012
and
2011
were as follows:
|
|
2012
|
2011
|
|||||
|
Balance at beginning of period
|
$
|
9,120,000
|
|
10,562,000
|
|
||
|
Provision for warranty obligations
|
5,598,000
|
|
8,203,000
|
|
|||
|
Reversal of warranty liability
|
—
|
|
(1,120,000
|
)
|
|||
|
Charges incurred
|
(6,835,000
|
)
|
(8,525,000
|
)
|
|||
|
Balance at end of period
|
$
|
7,883,000
|
|
9,120,000
|
|
||
(7)
Cost Reduction Actions
Fiscal 2011 and 2012 Cost Reduction Actions
In fiscal 2011 and 2012, we implemented certain cost reduction actions in all of our reportable operating segments. In our mobile data communications segment, we aligned staffing levels with expected future business activity. We reduced our manufacturing headcount in our telecommunications transmission segment to align with the expected lower level of manufacturing of products for our mobile data communications segment. In our RF microwave amplifiers segment we reduced headcount and deferred certain merit raises. In our unallocated or corporate segment, we reduced headcount and substantially reduced the use of outside consultants.
In fiscal 2012, due to ongoing and anticipated future pressure on our U.S. government customer to reduce its spending, we adopted a restructuring plan to wind-down our mobile data communications segment's microsatellite product line. In connection with this plan, we recorded
$2,577,000
of pre-tax restructuring charges in fiscal 2012, as follows:
|
Fiscal Year-Ended
|
|||
|
July 31, 2012
|
|||
|
Accelerated depreciation expense
|
$
|
680,000
|
|
|
Inventory write-downs
|
553,000
|
|
|
|
Write-down of other assets and charges
|
538,000
|
|
|
|
Facility exit costs
|
496,000
|
|
|
|
Severance and related costs
|
310,000
|
|
|
|
Total
|
$
|
2,577,000
|
|
F-20
COMTECH TELECOMMUNICATIONS CORP.
AND SUBSIDIARIES
Notes to Consolidated Financial Statements, Continued
Of the
$2,577,000
pre-tax restructuring charge,
$1,270,000
is reflected in cost of sales and the remainder is reflected in selling, general and administrative expenses. Of the
$2,577,000
,
$1,136,000
is included in accrued expenses and other current liabilities in our Consolidated Balance Sheet at July 31, 2012, which primarily relates to facility exit costs, severance and related costs and estimated losses on customer contracts relating to the wind-down of our microsatellite product line. We expect to record additional restructuring charges of approximately
$1,000,000
during the first quarter of fiscal 2013. These additional costs primarily relate to facility exit costs for remaining leased spaces associated with our microsatellite product line, which we expect to fully vacate by October 31, 2012.
Other than the aforementioned pre-tax restructuring charges related to the wind-down of our microsatellite product line, costs associated with our fiscal 2012 and 2011 cost reduction actions, almost all of which were related to severance and are included in our Consolidated Statement of Operations for the fiscal years ended July 31, 2012 and 2011, were not material.
Fiscal 2010 Cost Reduction Actions
In August 2009, in connection with cost reduction actions we adopted in July 2009, we sold a small product line to a third party for
$2,038,000
.
Radyne Acquisition-Related Restructuring Plan
In connection with our August 1, 2008 acquisition of Radyne, we immediately adopted a restructuring plan to achieve operating synergies for which we recorded
$2,713,000
of estimated restructuring costs. Of this amount,
$613,000
relates to severance for Radyne employees which was paid in fiscal 2009. The remaining estimated amounts relate to facility exit costs and were determined as follows:
|
At August 1, 2008
|
|||
|
Total non-cancelable lease obligations
|
$
|
12,741,000
|
|
|
Less: Estimated sublease income
|
8,600,000
|
|
|
|
Total net estimated facility exit costs
|
4,141,000
|
|
|
|
Less: Interest expense to be accreted
|
2,041,000
|
|
|
|
Present value of estimated facility exit costs
|
$
|
2,100,000
|
|
Our total non-cancelable lease obligations were based on the actual lease term which runs from November 1, 2008 through
October 31, 2018
. We estimated sublease income based on (i) the terms of a fully executed sublease agreement, whose lease term runs from November 1, 2008 through
October 31, 2015
and (ii) our assessment of future uncertainties relating to the commercial real estate market. Based on our assessment of commercial real estate market conditions, we currently believe that it is not probable that we will be able to sublease the facility beyond the current sublease terms. As such, in accordance with grandfathered accounting standards that were not incorporated into the FASB’s ASC, we recorded these costs, at fair value, as assumed liabilities as of August 1, 2008, with a corresponding increase to goodwill.
As of
July 31, 2012
, the amount of the acquisition-related restructuring reserve is as follows:
|
|
Cumulative Activity Through July 31, 2012
|
||
|
Present value of estimated facility exit costs at August 1, 2008
|
$
|
2,100,000
|
|
|
Cash payments made
|
(4,301,000
|
)
|
|
|
Cash payments received
|
4,498,000
|
|
|
|
Accreted interest recorded
|
619,000
|
|
|
|
Net liability as of July 31, 2012
|
2,916,000
|
|
|
|
Amount recorded as prepaid expenses in the Consolidated Balance Sheet
|
415,000
|
|
|
|
Amount recorded as other liabilities in the Consolidated Balance Sheet
|
$
|
3,331,000
|
|
F-21
COMTECH TELECOMMUNICATIONS CORP.
AND SUBSIDIARIES
Notes to Consolidated Financial Statements, Continued
As of
July 31, 2011
, the present value of the estimated facility exit costs was
$2,518,000
. During the fiscal year ended
July 31, 2012
, we made cash payments of
$1,005,000
and we received cash payments of
$1,214,000
. Interest accreted for the fiscal years ended
July 31, 2012
,
2011
and
2010
was
$189,000
,
$161,000
and
$150,000
, respectively, and is included in interest expense for each respective fiscal period.
As of
July 31, 2012
, future cash payments associated with our restructuring plan are summarized below:
|
|
As of July 31, 2012
|
||
|
Future lease payments to be made in excess of anticipated sublease payments
|
$
|
3,331,000
|
|
|
Less net cash to be received in next twelve months
|
(415,000
|
)
|
|
|
Interest expense to be accreted in future periods
|
1,421,000
|
|
|
|
Total remaining net cash payments
|
$
|
4,337,000
|
|
(8)
Credit Facility
We have a committed
$100,000,000
secured revolving credit facility (the “Credit Facility”) with a syndicate of bank lenders, as amended on June 6, 2012. The Credit Facility expires on
April 30, 2014
but may be extended by us to
December 31, 2016
, subject to certain conditions relating primarily to the repurchase, redemption or conversion of our 3.0% convertible senior notes and compliance with all other Credit Facility covenants.
The Credit Facility provides for the extension of credit to us in the form of revolving loans, including letters of credit, at any time and from time to time during its term, in an aggregate principal amount at any time outstanding not to exceed
$100,000,000
for both revolving loans and letters of credit, with sub-limits of
$15,000,000
for commercial letters of credit and
$35,000,000
for standby letters of credit. The Credit Facility may be used for acquisitions, equity securities repurchases, dividends, working capital and other general corporate purposes.
At our election, borrowings under the Credit Facility will bear interest either at LIBOR plus an applicable margin or at the base rate plus an applicable margin, as amended. The interest rate margin over LIBOR ranges from
1.75 percent
up to a maximum amount of
2.50 percent
. The base rate is a fluctuating rate equal to the highest of (i) the Prime Rate; (ii) the Federal Funds Effective Rate from time to time plus
0.50 percent
; and (iii)
two hundred (200) basis points
in excess of the floating rate of interest determined, on a daily basis, in accordance with the terms of the agreement. The interest rate margin over the base rate ranges from
0.75 percent
up to a maximum amount of
1.50 percent
. In both cases, the applicable interest rate margin is based on the ratio of our consolidated total indebtedness to our consolidated earnings before interest, taxes, depreciation and amortization (“Consolidated Adjusted EBITDA”). As defin
ed in the Credit Facility, Consolidated Adjusted EBITDA is adjusted for certain items and, in the event of an acquisition with a purchase price in excess of
$10,000,000
, provides for the inclusion of the last twelve months of consolidated EBITDA of a target.
The Credit Facility contains covenants, including covenants limiting certain debt, certain liens on assets, certain sales of assets and receivables, certain payments (including dividends), certain repurchases of equity securities, certain sale and leaseback transactions, certain guaranties and certain investments. The Credit Facility also contains financial condition covenants requiring that we (i) not exceed a maximum ratio of consolidated total indebtedness to Consolidated Adjusted EBITDA (each as defined in the Credit Facility); (ii) not exceed a maximum ratio of consolidated senior secured indebtedness to Consolidated Adjusted EBITDA (each as defined in the Credit Facility); (iii) maintain a minimum fixed charge ratio (as defined in the Credit Facility); (iv) maintain a minimum consolidated net worth; in each case measured on the last day of each fiscal quarter and (v) in the event total consolidated indebtedness (as defined in the Credit Facility) is less than
$200,000,000
, we maintain a minimum level of Consolidated Adjusted EBITDA (as defined in the Credit Facility).
F-22
COMTECH TELECOMMUNICATIONS CORP.
AND SUBSIDIARIES
Notes to Consolidated Financial Statements, Continued
At
July 31, 2012
, we had
$1,489,000
of standby letters of credit outstanding related to our guarantees of future performance on certain customer contracts and no outstanding commercial letters of credit.
At
July 31, 2012
, had borrowings been outstanding under the Credit Facility, the applicable interest rate margin above LIBOR and base rate borrowings would have been
2.50 percent
and
1.50 percent
, respectively. We are also subject to an undrawn line fee based on the ratio of our consolidated total indebtedness to our Consolidated Adjusted EBITDA, as defined and adjusted for certain items in the Credit Facility. Interest expense, including amortization of deferred financing costs, related to our credit facility recorded during fiscal
2012
,
2011
and
2010
was
$1,089,000
,
$752,000
and
$625,000
respectively.
At
July 31, 2012
, based on our Consolidated Adjusted EBITDA (as defined in the Credit Facility) an
d our business outlook and related business plans, we believe we will be able to meet or obtain waivers for the applicable financial covenants that we are required to maintain.
(9)
3.0% Convertible Senior Notes
In
May 2009
, we issued
$200,000,000
of our 3.0% convertible senior notes in a private offering pursuant to Rule 144A under the Securities Act of 1933, as amended. The net proceeds from this transaction were
$194,541,000
after deducting the initial purchasers' discount and other transaction costs of
$5,459,000
.
The 3.0% convertible senior notes bear interest at an annual rate of
3.0%
. Pursuant to the terms of the 3.0% convertible senior notes indenture, cash dividends require an adjustment to the conversion rate, effective on the record date. Effective July 20, 2012 (the record date of our dividend declared on June 7, 2012), the 3.0% convertible senior notes are convertible into shares of our common stock at a conversion price of
$33.91
per share (a conversion rate of
29.4863
shares per
$1,000
original principal amount of notes) at any time prior to the close of business on the second scheduled trading day immediately preceding the maturity date, subject to adjustment in certain circumstances.
We may, at our option, redeem some or all of the 3.0% convertible senior notes on or after
May 5, 2014
. Holders of the 3.0% convertible senior notes will have the right to require us to repurchase some or all of the outstanding 3.0% convertible senior notes, solely for cash, on
May 1, 2014
,
May 1, 2019
and
May 1, 2024
and upon certain events, including a change in control. If not redeemed by us or repaid pursuant to the holders' right to require repurchase, the 3.0% convertible senior notes mature on
May 1, 2029
.
The 3.0% convertible notes are senior unsecured obligations of Comtech.
(10)
Income Taxes
Income before provision for income taxes consists of the following:
|
|
Fiscal Years Ended July 31,
|
|||||||||
|
|
2012
|
2011
|
2010
|
|||||||
|
U.S.
|
$
|
44,930,000
|
|
102,159,000
|
|
97,217,000
|
|
|||
|
Foreign
|
(890,000
|
)
|
(355,000
|
)
|
85,000
|
|
||||
|
|
$
|
44,040,000
|
|
101,804,000
|
|
97,302,000
|
|
|||
F-23
COMTECH TELECOMMUNICATIONS CORP.
AND SUBSIDIARIES
Notes to Consolidated Financial Statements, Continued
The provision for income taxes included in the accompanying consolidated statements of operations consists of the following:
|
|
Fiscal Years Ended July 31,
|
|||||||||
|
|
2012
|
2011
|
2010
|
|||||||
|
Federal – current
|
$
|
14,389,000
|
|
29,735,000
|
|
39,448,000
|
|
|||
|
Federal – deferred
|
(4,194,000
|
)
|
683,000
|
|
(7,180,000
|
)
|
||||
|
State and local – current
|
2,045,000
|
|
3,683,000
|
|
5,448,000
|
|
||||
|
State and local – deferred
|
(380,000
|
)
|
62,000
|
|
(651,000
|
)
|
||||
|
Foreign – current
|
(240,000
|
)
|
(270,000
|
)
|
(406,000
|
)
|
||||
|
Foreign – deferred
|
4,000
|
|
16,000
|
|
13,000
|
|
||||
|
|
$
|
11,624,000
|
|
33,909,000
|
|
36,672,000
|
|
|||
The provision for income taxes differed from the amounts computed by applying the U.S. Federal income tax rate as a result of the following:
|
|
Fiscal Years Ended July 31,
|
||||||||||||||||||
|
|
2012
|
2011
|
2010
|
||||||||||||||||
|
|
Amount
|
Rate
|
Amount
|
Rate
|
Amount
|
Rate
|
|||||||||||||
|
Computed “expected” tax expense
|
$
|
15,414,000
|
|
35.0
|
%
|
35,632,000
|
|
35.0
|
%
|
34,056,000
|
|
35.0
|
%
|
||||||
|
Increase (reduction) in income taxes resulting from:
|
|
|
|
|
|
|
|
|
|
|
|
|
|||||||
|
State and local income taxes, net of Federal benefit
|
995,000
|
|
2.3
|
|
2,614,000
|
|
2.6
|
|
3,118,000
|
|
3.2
|
|
|||||||
|
Impairment of goodwill
|
—
|
|
—
|
|
—
|
|
—
|
|
1,666,000
|
|
1.7
|
|
|||||||
|
Nondeductible stock-based compensation
|
86,000
|
|
0.2
|
|
94,000
|
|
0.1
|
|
167,000
|
|
0.2
|
|
|||||||
|
Domestic production activities deduction
|
(1,436,000
|
)
|
(3.3
|
)
|
(2,893,000
|
)
|
(2.9
|
)
|
(2,086,000
|
)
|
(2.2
|
)
|
|||||||
|
Research and experimentation credits
|
(241,000
|
)
|
(0.5
|
)
|
(1,255,000
|
)
|
(1.3
|
)
|
(137,000
|
)
|
(0.1
|
)
|
|||||||
|
Change in the beginning of the year valuation allowance for deferred tax assets
|
—
|
|
—
|
|
—
|
|
—
|
|
(50,000
|
)
|
(0.1
|
)
|
|||||||
|
Audit settlements
|
(2,841,000
|
)
|
(6.5
|
)
|
20,000
|
|
0.1
|
|
(302,000
|
)
|
(0.3
|
)
|
|||||||
|
Foreign income taxes
|
99,000
|
|
0.2
|
|
151,000
|
|
0.2
|
|
9,000
|
|
0.1
|
|
|||||||
|
Other
|
(452,000
|
)
|
(1.0
|
)
|
(454,000
|
)
|
(0.5
|
)
|
231,000
|
|
0.2
|
|
|||||||
|
|
$
|
11,624,000
|
|
26.4
|
%
|
33,909,000
|
|
33.3
|
%
|
36,672,000
|
|
37.7
|
%
|
||||||
F-24
COMTECH TELECOMMUNICATIONS CORP.
AND SUBSIDIARIES
Notes to Consolidated Financial Statements, Continued
The tax effects of temporary differences that give rise to significant portions of the deferred tax assets and liabilities at
July 31, 2012
and
2011
are presented below.
|
|
2012
|
2011
|
|||||
|
Deferred tax assets:
|
|
|
|||||
|
Allowance for doubtful accounts receivable
|
$
|
576,000
|
|
436,000
|
|
||
|
Inventory and warranty reserves
|
7,684,000
|
|
6,998,000
|
|
|||
|
Compensation and commissions
|
1,890,000
|
|
1,273,000
|
|
|||
|
State research and experimentation credits
|
1,691,000
|
|
1,449,000
|
|
|||
|
Stock-based compensation
|
10,133,000
|
|
10,606,000
|
|
|||
|
Net operating losses
|
101,000
|
|
663,000
|
|
|||
|
Other
|
4,922,000
|
|
4,970,000
|
|
|||
|
Less valuation allowance
|
(1,162,000
|
)
|
(1,162,000
|
)
|
|||
|
Total deferred tax assets
|
25,835,000
|
|
25,233,000
|
|
|||
|
Deferred tax liabilities:
|
|
|
|
|
|||
|
Plant and equipment
|
(2,137,000
|
)
|
(3,261,000
|
)
|
|||
|
Intangibles
|
(11,077,000
|
)
|
(12,544,000
|
)
|
|||
|
Total deferred tax liabilities
|
(13,214,000
|
)
|
(15,805,000
|
)
|
|||
|
Net deferred tax assets
|
$
|
12,621,000
|
|
9,428,000
|
|
||
We provide for income taxes under the provisions of FASB ASC 740, “Income Taxes.” FASB ASC 740 requires an asset and liability based approach in accounting for income taxes. In assessing the realizability of deferred tax assets, management considers whether it is more likely than not that some portion or all of them will not be realized. If management determines that it is more likely than not that some or all of its deferred tax assets will not be realized, a valuation allowance will be recorded against such deferred tax assets.
As of
July 31, 2012
and
2011
, our deferred tax assets have been offset by a valuation allowance primarily related to state research and experimentation credits which may not be utilized in future periods. As of
July 31, 2012
, we had a deferred tax asset relating to state net operating losses of approximately
$101,000
, which will expire from fiscal year
2029
through fiscal year
2030
. We believe that it is more likely than not that we will realize these net operating losses before their expiration.
We must generate approximately
$73,000,000
of taxable income in the future to fully utilize our gross deferred tax assets as of
July 31, 2012
. Management believes it is more likely than not that the results of future operations will generate sufficient taxable income to realize the net deferred tax assets. In addition, as of
July 31, 2012
, we had a hypothetical additional paid-in capital (“APIC”) pool related to stock-based compensation of approximately
$22,786,000
. To the extent that previously issued and outstanding stock-based awards either expire unexercised or are exercised for an intrinsic value less than the original fair-market value recorded at the time of issuance, the difference between the related deferred tax asset amount originally recorded and the actual tax benefit would be recorded against the hypothetical APIC pool. Once this hypothetical APIC pool is reduced to zero, future shortfalls would be recorded as income tax expense in the period of stock-based award expiration or exercise.
At
July 31, 2012
and
2011
, the total unrecognized tax benefits, excluding interest, were
$2,529,000
and
$6,763,000
, respectively. Of these amounts,
$1,990,000
and
$5,719,000
, respectively, net of the reversal of the federal benefit recognized as a deferred tax asset relating to state reserves, would positively impact our effective tax rate, if recognized. Unrecognized tax benefits result from income tax positions taken or expected to be taken on our income tax returns for which a tax benefit has not been recorded in our financial statements. Of the total unrecognized tax benefits,
$2,624,000
and
$3,811,000
, including interest, were recorded as non-current income taxes payable in our Consolidated Balance Sheets at
July 31, 2012
and
2011
, respectively.
F-25
COMTECH TELECOMMUNICATIONS CORP.
AND SUBSIDIARIES
Notes to Consolidated Financial Statements, Continued
Our policy is to recognize interest and penalties relating to uncertain tax positions in income tax expense. At
July 31, 2012
and
2011
, interest accrued relating to income taxes was
$60,000
and
$545,000
, respectively, net of the related income tax benefit. The following table summarizes the activity related to our unrecognized tax benefits for fiscal years
2012
and
2011
:
|
|
2012
|
2011
|
|||||
|
Balance as of July 31
|
$
|
6,763,000
|
|
7,056,000
|
|
||
|
Increase related to fiscal 2012
|
432,000
|
|
639,000
|
|
|||
|
Increase related to prior periods
|
417,000
|
|
601,000
|
|
|||
|
Expiration of statute of limitations
|
(1,401,000
|
)
|
(1,087,000
|
)
|
|||
|
Decrease related to prior periods
|
(3,309,000
|
)
|
(446,000
|
)
|
|||
|
Settlements with taxing authorities
|
(373,000
|
)
|
—
|
|
|||
|
Balance as of July 31
|
$
|
2,529,000
|
|
6,763,000
|
|
||
In August 2011, we reached an effective settlement with the IRS relating to its audit of our federal income tax returns for fiscal 2007, 2008 and 2009. Although adjustments relating to the settlement of our prior year completed audits were immaterial, a resulting tax assessment or settlement for other potential later periods, or for other tax jurisdictions, could have a material adverse effect on our consolidated results of operations and financial condition. Our federal income tax returns for fiscal 2010, 2011 and 2012 are subject to potential future IRS audit.
(11)
Stock Option Plan and Employee Stock Purchase Plan
We issue stock-based awards pursuant to the following plan:
2000 Stock Incentive Plan
– The 2000 Stock Incentive Plan, as amended, provides for the granting to all employees and consultants of Comtech (including prospective employees and consultants) non-qualified stock options, SARs, restricted stock, restricted stock units (“RSUs”), stock units, performance shares, performance units and other stock-based awards. In addition, our employees are eligible to be granted incentive stock options. Our non-employee directors are eligible to receive non-discretionary grants of non-qualified stock options, restricted stock, RSUs, stock units and other stock-based awards, subject to certain limitations. The aggregate number of shares of common stock which may be issued may not exceed
8,962,500
. Grants of incentive and non-qualified stock awards may not have a term exceeding
ten years
or, in the case of an incentive stock award granted to a stockholder who owns stock representing more than
10.0%
of the voting power, no more than
five years
.
Stock options and SARs granted to date have exercise prices equal to the fair market value of our common stock on the date of grant. RSUs, stock units and performance shares, which are convertible into shares of our common stock, are initially valued at the closing fair market value of our common stock at the grant date.
As of
July 31, 2012
, we had granted stock-based awards representing the right to purchase and/or acquire an aggregate of
7,237,694
shares (net of
1,665,865
canceled awards), of which
3,506,484
were outstanding at
July 31, 2012
. Stock options and SARS were granted at prices ranging between
$3.13
-
$51.65
. As of
July 31, 2012
,
3,731,210
stock-based awards have been exercised, of which
750
were SARs. No stock units, RSUs or performance shares have been converted as of July 31, 2012.
F-26
COMTECH TELECOMMUNICATIONS CORP.
AND SUBSIDIARIES
Notes to Consolidated Financial Statements, Continued
The following table summarizes certain stock option plan activity during the three years ended
July 31, 2012
:
|
|
Number of
Shares Underlying
Stock-Based Awards
|
Weighted Average
Exercise Price
|
Weighted Average
Remaining Contractual
Term (Years)
|
Aggregate
Intrinsic Value
|
|||||||||
|
Outstanding at July 31, 2009
|
3,065,245
|
|
$
|
33.26
|
|
|
|
||||||
|
Granted
|
653,000
|
|
28.90
|
|
|
|
|||||||
|
Expired/canceled
|
(94,100
|
)
|
40.85
|
|
|
|
|||||||
|
Exercised
|
(103,478
|
)
|
16.15
|
|
|
|
|||||||
|
Outstanding at July 31, 2010
|
3,520,667
|
|
32.75
|
|
|
|
|||||||
|
Granted
|
680,750
|
|
27.64
|
|
|
|
|||||||
|
Expired/canceled
|
(481,364
|
)
|
35.79
|
|
|
|
|||||||
|
Exercised
|
(139,885
|
)
|
20.29
|
|
|
|
|||||||
|
Outstanding at July 31, 2011
|
3,580,168
|
|
31.86
|
|
|
|
|||||||
|
Granted
|
471,609
|
|
26.26
|
|
|
|
|||||||
|
Expired/canceled
|
(390,148
|
)
|
35.71
|
|
|
|
|||||||
|
Exercised
|
(155,145
|
)
|
20.64
|
|
|
|
|||||||
|
Outstanding at July 31, 2012
|
3,506,484
|
|
$
|
31.17
|
|
4.33
|
$
|
4,682,000
|
|
||||
|
Exercisable at July 31, 2012
|
2,237,495
|
|
$
|
33.29
|
|
2.15
|
$
|
3,365,000
|
|
||||
|
Vested and expected to vest at July 31, 2012
|
3,426,823
|
|
$
|
31.25
|
|
4.24
|
$
|
4,633,000
|
|
||||
RSUs, stock units and performance shares are convertible into shares of our common stock, are subject to certain terms and restrictions, do not require the recipient to pay an exercise price and are not subject to expiration. As such, for these awards, the weighted average exercise price and the weighted average remaining contractual term reflected in the above table assumes a zero dollar exercise price and no expiration, respectively.
Included in the number of shares underlying stock-based awards outstanding at
July 31, 2012
, in the above table, are
26,000
SARs and,
410
stock units, all of which are vested, and
12,668
RSUs and
35,003
performance shares, all of which are unvested, with a combined aggregate intrinsic value of
$1,314,000
.
The total intrinsic value of stock-based awards exercised during the years ended
July 31, 2012
,
2011
and
2010
was
$1,654,000
,
$1,177,000
and
$1,671,000
, respectively.
2001 Employee Stock Purchase Plan
– The ESPP was approved by the shareholders on December 12, 2000, and
675,000
shares of our common stock were reserved for issuance. The ESPP is intended to provide our eligible employees the opportunity to acquire our common stock at
85%
of fair market value at the date of issuance through participation in the payroll-deduction based ESPP. Through fiscal
2012
, we issued
474,018
shares of our common stock to participating employees in connection with the ESPP.
F-27
COMTECH TELECOMMUNICATIONS CORP.
AND SUBSIDIARIES
Notes to Consolidated Financial Statements, Continued
(12)
Customer and Geographic Information
Sales by geography and customer type, as a percentage of consolidated net sales, are as follows:
|
|
Fiscal Years Ended July 31,
|
||||||||
|
|
2012
|
2011
|
2010
|
||||||
|
United States
|
|
|
|
||||||
|
U.S. government
|
48.9
|
%
|
61.7
|
%
|
71.1
|
%
|
|||
|
Commercial
|
12.4
|
%
|
8.1
|
%
|
6.0
|
%
|
|||
|
Total United States
|
61.3
|
%
|
69.8
|
%
|
77.1
|
%
|
|||
|
International
|
38.7
|
%
|
30.2
|
%
|
22.9
|
%
|
|||
Sales to U.S. government customers include the DoD and intelligence and civilian agencies, as well as sales directly to or through prime contractors. International sales for fiscal
2012
,
2011
and
2010
,
which include sales to U.S. domestic companies for inclusion in products that will be sold to international customers, were
$164,503,000
,
$184,848,000
and
$178,469,000
, respectively.
For fiscal
2012
,
2011
and
2010
, except for sales to U.S. customers, no other customer or individual country, including sales to U.S. domestic companies for inclusion in products that will be sold to a foreign country, represented more than
10%
of consolidated net sales.
(13)
Segment Information
Reportable operating segments are determined based on Comtech’s management approach. The management approach, as defined by accounting standards which have been codified into FASB ASC 280, “Segment Reporting,” is based on the way that the chief operating decision-maker organizes the segments within an enterprise for making decisions about resources to be allocated and assessing their performance. Our chief operating decision-maker is our President and Chief Executive Officer.
While our results of operations are primarily reviewed on a consolidated basis, the chief operating decision-maker also manages the enterprise in
three
operating segments: (i) telecommunications transmission, (ii) RF microwave amplifiers, and (iii) mobile data communications.
Telecommunications transmission products include satellite earth station products (such as analog and digital modems, frequency converters, power amplifiers, transceivers and voice gateways) and over-the-horizon microwave communications products and systems (such as digital troposcatter modems).
RF microwave amplifier products include traveling wave tube amplifiers and solid-state, high-power broadband amplifier products that use the microwave and radio frequency spectrums.
Mobile data communications products include satellite-based mobile location tracking and messaging hardware (such as mobile satellite transceivers and third-party produced ruggedized computers) and related services and the design and production of microsatellites. In fiscal 2012, we adopted a restructuring plan to wind-down our microsatellite product line. Sales related to our microsatellite product line in fiscal 2012 were
$17,737,000
and are expected to be virtually none in fiscal 2013.
F-28
COMTECH TELECOMMUNICATIONS CORP.
AND SUBSIDIARIES
Notes to Consolidated Financial Statements, Continued
Corporate management defines and reviews segment profitability based on the same allocation methodology as presented in the segment data tables below:
|
|
Fiscal Year Ended July 31, 2012
|
||||||||||||||||
|
|
Telecommunications
Transmission
|
RF Microwave
Amplifiers
|
Mobile Data
Communications
|
Unallocated
|
Total
|
||||||||||||
|
Net sales
|
$
|
210,006,000
|
|
102,497,000
|
|
112,567,000
|
|
—
|
|
$
|
425,070,000
|
|
|||||
|
Operating income (loss)
|
41,709,000
|
|
7,622,000
|
|
19,924,000
|
|
(17,978,000
|
)
|
51,277,000
|
|
|||||||
|
Interest income and other (expense)
|
42,000
|
|
(21,000
|
)
|
30,000
|
|
1,544,000
|
|
1,595,000
|
|
|||||||
|
Interest expense
|
651,000
|
|
—
|
|
—
|
|
8,181,000
|
|
8,832,000
|
|
|||||||
|
Depreciation and amortization
|
10,088,000
|
|
4,395,000
|
|
2,173,000
|
|
3,758,000
|
|
20,414,000
|
|
|||||||
|
Expenditure for long-lived assets, including intangibles
|
5,490,000
|
|
733,000
|
|
190,000
|
|
—
|
|
6,413,000
|
|
|||||||
|
Total assets at July 31, 2012
|
244,285,000
|
|
98,864,000
|
|
11,217,000
|
|
365,412,000
|
|
719,778,000
|
|
|||||||
|
|
Fiscal Year Ended July 31, 2011
|
||||||||||||||||
|
|
Telecommunications
Transmission
|
RF Microwave
Amplifiers
|
Mobile Data
Communications
|
Unallocated
|
Total
|
||||||||||||
|
Net sales
|
$
|
231,957,000
|
|
91,973,000
|
|
288,449,000
|
|
—
|
|
$
|
612,379,000
|
|
|||||
|
Operating income (loss)
|
49,913,000
|
|
1,063,000
|
|
64,945,000
|
|
(8,123,000
|
)
|
107,798,000
|
|
|||||||
|
Interest income and other (expense)
|
89,000
|
|
(8,000
|
)
|
43,000
|
|
2,297,000
|
|
2,421,000
|
|
|||||||
|
Interest expense
|
562,000
|
|
—
|
|
10,000
|
|
7,843,000
|
|
8,415,000
|
|
|||||||
|
Depreciation and amortization
|
11,241,000
|
|
4,576,000
|
|
6,282,000
|
|
5,602,000
|
|
27,701,000
|
|
|||||||
|
Expenditure for long-lived assets, including intangibles
|
10,607,000
|
|
1,069,000
|
|
922,000
|
|
43,000
|
|
12,641,000
|
|
|||||||
|
Total assets at July 31, 2011
|
252,839,000
|
|
98,261,000
|
|
31,265,000
|
|
555,144,000
|
|
937,509,000
|
|
|||||||
|
|
Fiscal Year Ended July 31, 2010
|
||||||||||||||||
|
|
Telecommunications
Transmission
|
RF Microwave
Amplifiers
|
Mobile Data
Communications
|
Unallocated
|
Total
|
||||||||||||
|
Net sales
|
$
|
219,701,000
|
|
111,959,000
|
|
446,545,000
|
|
—
|
|
$
|
778,205,000
|
|
|||||
|
Operating income (loss)
|
47,493,000
|
|
9,808,000
|
|
75,506,000
|
|
(28,827,000
|
)
|
103,980,000
|
|
|||||||
|
Interest income and other
|
73,000
|
|
15,000
|
|
47,000
|
|
1,075,000
|
|
1,210,000
|
|
|||||||
|
Interest expense
|
171,000
|
|
—
|
|
—
|
|
7,717,000
|
|
7,888,000
|
|
|||||||
|
Depreciation and amortization
|
10,821,000
|
|
4,630,000
|
|
3,403,000
|
|
8,929,000
|
|
27,783,000
|
|
|||||||
|
Expenditure for long-lived assets, including intangibles
|
3,490,000
|
|
1,288,000
|
|
3,887,000
|
|
200,000
|
|
8,865,000
|
|
|||||||
|
Total assets at July 31, 2010
|
253,212,000
|
|
101,290,000
|
|
105,698,000
|
|
606,362,000
|
|
1,066,562,000
|
|
|||||||
F-29
COMTECH TELECOMMUNICATIONS CORP.
AND SUBSIDIARIES
Notes to Consolidated Financial Statements, Continued
Operating income in our mobile data communications segment for fiscal 2012 includes a
$2,577,000
restructuring charge related to the wind-down of our microsatellite product line. See Note (7) – “
Cost Reduction Actions
.” Operating income in our mobile data communications segment for fiscal 2010 includes a
$13,249,000
charge relating to the impairment of goodwill. See Note (1)(f) – “
Summary of Significant Accounting and Reporting Policies – Long-Lived Assets.
”
Unallocated operating loss for fiscal 2012 includes
$2,638,000
of costs related to a contested proxy solicitation in connection with our fiscal 2011 annual meeting of stockholders. This contested proxy solicitation was initiated by a third party who publicly announced, on November 18, 2011, that it would not proceed with its proxy solicitation. There was no agreement with, consideration paid to, or any accommodation granted to this third party by us. Unallocated operating loss during fiscal 2011 includes the receipt of a net termination fee of
$12,500,000
related to a Termination and Release Agreement dated September 7, 2010, by which we and CPI International, Inc. (“CPI”) terminated a previously announced Merger Agreement dated May 8, 2010.
Unallocated expenses result from such corporate expenses as legal, accounting and executive compensation. In addition, for fiscal
2012
,
2011
and
2010
, unallocated expenses include
$3,572,000
,
$5,357,000
and
$8,716,000
, respectively, of stock-based compensation expense. Interest expense (which includes amortization of deferred financing costs) associated with our convertible senior notes and our Credit Facility is not allocated to the operating segments. Depreciation and amortization includes amortization of stock-based compensation. Unallocated assets consist principally of cash, deferred financing costs and deferred tax assets. Substantially all of our long-lived assets are located in the U.S.
Intersegment sales in fiscal
2012
,
2011
and
2010
by the telecommunications transmission segment to the RF microwave amplifiers segment were
$5,378,000
,
$3,810,000
and
$7,172,000
, respectively.
Intersegment sales in fiscal
2012
,
2011
and
2010
by the telecommunications transmission segment to the mobile data communications segment were
$11,161,000
,
$36,959,000
and
$82,170,000
, respectively.
Intersegment sales in fiscal
2012
,
2011
and
2010
by the RF microwave amplifiers segment to the telecommunications transmission segment were
$382,000
,
$90,000
and
$436,000
, respectively.
All intersegment sales have been eliminated from the tables above.
(14)
Commitments and Contingencies
(a)
Operating Leases
We are obligated under non-cancellable operating lease agreements, including satellite lease expenditures in fiscal 2013 relating to our mobile data communications segment's commercial asset tracking products, such as our Sensor Enabled Notification System ("SENS") products. At July 31, 2012, the future minimum lease payments, net of subleases, under operating leases are as follows:
|
2013
|
$
|
7,864,000
|
|
|
2014
|
4,372,000
|
|
|
|
2015
|
3,937,000
|
|
|
|
2016
|
4,407,000
|
|
|
|
2017
|
3,762,000
|
|
|
|
Thereafter
|
6,941,000
|
|
|
|
Total
|
$
|
31,283,000
|
|
Lease expense charged to operations was
$7,060,000
,
$6,891,000
and
$7,665,000
in fiscal
2012
,
2011
and
2010
, respectively. Lease expense excludes satellite lease expenditures incurred of
$40,827,000
,
$46,356,000
and
$35,928,000
in fiscal
2012
,
2011
and
2010
, respectively, relating to our mobile data communications segment. Satellite lease expenditures are allocated to individual contracts and expensed to cost of sales.
F-30
COMTECH TELECOMMUNICATIONS CORP.
AND SUBSIDIARIES
Notes to Consolidated Financial Statements, Continued
We lease our Melville, New York production facility from a partnership controlled by our Chairman, Chief Executive Officer and President. Lease payments made in fiscal
2012
were
$599,000
. The current lease provides for our use of the premises as they exist through
December 1, 2021
with an option for an additional
10 years
. In connection with the lease, our Nominating and Governance Committee of the Board of Directors obtained written reports from three independent commercial real estate firms regarding prevailing rents for comparable facilities. Based on this assessment, and the continued suitability of the facility for our current operations, the annual rent of the facility is
$598,000
for calendar 2013 and is subject to customary adjustments. We have a right of first refusal in the event of a sale of the facility.
(b)
Legal Proceedings and Other Matters
U.S. Government Investigations
In June 2012, certain officers and employees of the Company received subpoenas issued by the United States District Court for the Eastern District of New York (“EDNY”) seeking certain documents and records relating to our Chief Executive Officer (“CEO”). Although the EDNY subpoenas make no specific allegations, we believe the subpoenas relate to a grand jury investigation stemming from our CEO's contacts with a scientific attaché to the Israeli Purchasing Mission in the United States who our CEO met in connection with the sale of our equipment to the State of Israel during the 1980's. This scientific attaché was later alleged to have conducted intelligence operations in the U.S. In August 2012, we were informed by the U.S. government that our CEO's security clearance was suspended. In order to maintain our qualification for government contracts requiring facility security clearance, we have made certain internal organizational realignments. These changes restrict access to classified information to other Comtech senior executives, management and other employees who maintain the required level of clearance.
Separately, in connection with an investigation by the Securities and Exchange Commission (“SEC”) into trading in securities of CPI International, Inc. (“CPI”), we and our CEO, and other persons, have received subpoenas for documents from the SEC concerning transactions in CPI stock by our CEO and other persons (including one subsidiary employee). Our CEO purchased CPI stock in November 2010 which was after the September 2010 termination of our May 2010 agreement to acquire CPI.
We and our CEO are cooperating with the U.S. government regarding the above matters. The independent members of our Board of Directors are monitoring these matters with the assistance of independent counsel.
The outcome of any investigation is inherently difficult, if not impossible, to predict. However, based on our work to date in respect of the subpoenas in each matter, we do not believe that it is likely that either investigation will result in a legal proceeding against our CEO or the Company. If either of these investigations results in a legal proceeding, it could have a material adverse effect on our business and results of operations.
Defense Contract Audit Agency (“DCAA”) Audit
U.S. government agencies, including the DCAA, routinely audit costs and performance on contracts, as well as accounting and general business practices. Based on the results of the audit, the U.S. government may adjust contract related costs and fees, including allocated indirect costs. In addition, under U.S. government purchasing regulations, some of our costs may not be reimbursable. Until such audits are completed, the ultimate profit on these contracts cannot be determined; however, it is management’s belief that the final contract settlements will not have a material adverse effect on our consolidated financial condition or results of operations.
In May 2011, we were notified that our BFT-1 contract which expired on December 31, 2011 was selected for a post award audit by the DCAA. A post award audit (sometimes referred to as a Truth in Negotiations Act or “TINA” audit) generally focuses on whether the contractor disclosed current, accurate and complete cost or pricing data in the contract negotiation process pursuant to Federal Acquisition Regulations (“FAR”). We received
$376,987,000
in total orders under our BFT-1 contract.
F-31
COMTECH TELECOMMUNICATIONS CORP.
AND SUBSIDIARIES
Notes to Consolidated Financial Statements, Continued
In January 2012, the Defense Contract Management Agency (“DCMA”) advised us that the fiscal 2008 award of the BFT-1 contract triggered full coverage under the Cost Accounting Standards (“CAS”), which are a set of specialized rules and standards that the U.S. government uses for determining costs on large, negotiated contracts. The DCMA also requested that we submit an initial CAS disclosure statement that would describe our cost accounting practices. We have informed the DCMA that we had addressed this issue with them shortly after we were awarded the BFT-1 contract in fiscal 2008. We believed then, as we do now, that the BFT-1 contract does not trigger full CAS coverage. In response to this issue being raised again, we provided information to the DCMA to support our view that the BFT-1 contract is subject to a CAS exemption for fixed price commercial contract line items (such as our mobile satellite transceivers).
In March 2012, we were awarded a new three-year indefinite delivery/indefinite quantity (“IDIQ”) BFT-1 sustainment contract with the U.S. Army to provide the same type of commercial equipment and services that we previously provided under the aforementioned BFT-1 contract. This new contract incorporates specific FAR Part 12 clauses, which specify that the equipment provided under the contract is commercial (as that term is defined in the FAR). We believe that the commercial designation in our new contract also applies to the original BFT-1 contract and that our original BFT-1 contract was not subject to full coverage under CAS.
In May 2012, the DCAA informed us that it is finalizing its post award audit in accordance with 41 U.S.C. 254b and FAR 52.215-10 and that it anticipated it will issue its audit report by September 2012. As of the date of this Annual Report on Form 10-K, the DCAA has not rendered its report to us and we do not currently know the timing of the issuance of this report. In addition, after having provided additional information to DCMA, it has not yet commented on whether or not we are required to provide a CAS disclosure statement or whether or not it believes the BFT-1 contract was subject to full coverage under CAS.
Although we believe that our BFT-1 contract was not subject to full coverage under CAS and that our equipment is commercial (as that term is defined), the outcome of both the DCAA audit and the DCMA matter are difficult to predict. If it is ultimately determined that a cost or price adjustment for our BFT-1 contract is appropriate, we may be required to refund monies to the U.S. government, with interest. These amounts could have a material adverse effect on our results of operations and financial condition.
Other Proceedings
There are certain other pending and threatened legal actions, which arise in the normal course of business. Although the ultimate outcome of litigation is difficult to accurately predict, we believe that the outcome of these other pending and threatened actions will not have a material adverse effect on our consolidated financial condition or results of operations.
(c)
Employment Change of Control and Indemnification Agreements
We have an employment agreement with our Chairman of the Board, Chief Executive Officer and President. The employment agreement generally provides for an annual salary and bonus award. We have also entered into change of control agreements with certain of our executive officers and certain key employees. All of these agreements may require payments by us, in certain circumstances, including, but not limited to, a change in control of our Company.
During fiscal 2012, pursuant to an indemnification agreement with our CEO (see Exhibit 10.1, "Form of Indemnification Agreement" in our Current Report on Form 8-K filed with the Securities and Exchange Commission ("SEC") on March 8, 2007), our Board of Directors agreed to pay, on behalf of our CEO, expenses incurred by him in connection with an investigation currently being conducted by the SEC and an investigation by the United States Attorney for the Eastern District Court of New York, on the condition that Mr. Kornberg repay such amounts to the extent that it is ultimately determined that he is not entitled to be indemnified by us. To date, legal expenses paid on behalf of our CEO have been nominal; however, we have incurred approxi
mately
$1,000,000
of expenses in fiscal 2012 responding to the subpoenas. See Note (14)(b) – "
Legal Proceedings and Other Matters
." Any amounts that may be a
dvanced to our CEO in the future may be material.
F-32
COMTECH TELECOMMUNICATIONS CORP.
AND SUBSIDIARIES
Notes to Consolidated Financial Statements, Continued
(15)
Goodwill
The carrying amount of goodwill by segment as of
July 31, 2012
and
2011
are as follows:
|
Telecommunications
Transmission
|
RF Microwave
Amplifiers
|
Mobile Data
Communications
|
Total
|
|||||||||||
|
Goodwill
|
$
|
107,779,000
|
|
29,575,000
|
|
13,249,000
|
|
$
|
150,603,000
|
|
||||
|
Accumulated impairment
|
—
|
|
—
|
|
(13,249,000
|
)
|
(13,249,000
|
)
|
||||||
|
Balance
|
$
|
107,779,000
|
|
29,575,000
|
|
—
|
|
$
|
137,354,000
|
|
||||
For purposes of reviewing impairment and the recoverability of goodwill and other intangible assets, each of our three operating segments constitutes a reporting unit and we must make various assumptions regarding estimated future cash flows and other factors in determining the fair values of the reporting unit. We perform an annual impairment review in the first quarter of each fiscal year.
Based on our annual impairment review performed on August 1,
2012
(the start of our first quarter of fiscal
2013
), we determined that none of the goodwill recorded on our consolidated balance sheet was impaired. Unless there are future indicators of impairment, such as a significant adverse change in our future financial performance, our next impairment review for goodwill will be performed and completed in the first quarter of fiscal
2014
. Any impairment charges that we may record in the future could be material to our results of operations and financial condition.
We performed our annual impairment reviews on August 1,
2011
and
2010
(the start of our first quarter of fiscal
2012
and
2011
, respectively) and we determined that none of the goodwill recorded on our Consolidated Balance Sheets was impaired. During fiscal
2012
, there were no indicators of impairment which would have required us to perform an interim impairment test in accordance with FASB ASC 350, “Intangibles – Goodwill and Other.”
During the fourth quarter of our fiscal 2010, we were notified by the U.S. Army that we were not selected as the vendor or program manager for the BFT-2 program. As a result, we experienced a significant and sustained decline in our stock price and we determined that it was appropriate to conduct an interim impairment test for all three of our reporting units in that fiscal quarter. Based on that interim impairment analysis, we determined that all of our mobile data communications reporting unit’s goodwill was impaired. As a result, we recorded a goodwill impairment charge of
$13,249,000
for the fiscal year ended July 31, 2010.
F-33
COMTECH TELECOMMUNICATIONS CORP.
AND SUBSIDIARIES
Notes to Consolidated Financial Statements, Continued
(16)
Intangible Assets
Intangible assets with finite lives as of
July 31, 2012
and
2011
are as follows:
|
|
July 31, 2012
|
||||||||||||
|
|
Weighted Average
Amortization Period
|
Gross Carrying
Amount
|
Accumulated
Amortization
|
Net Carrying
Amount
|
|||||||||
|
Technologies
|
11.7
|
$
|
47,694,000
|
|
30,321,000
|
|
$
|
17,373,000
|
|
||||
|
Customer relationships
|
10.0
|
29,931,000
|
|
12,231,000
|
|
17,700,000
|
|
||||||
|
Trademarks and other
|
20.0
|
6,044,000
|
|
2,284,000
|
|
3,760,000
|
|
||||||
|
Total
|
|
$
|
83,669,000
|
|
44,836,000
|
|
$
|
38,833,000
|
|
||||
|
|
July 31, 2011
|
||||||||||||
|
|
Weighted Average
Amortization Period
|
Gross Carrying
Amount
|
Accumulated
Amortization
|
Net Carrying
Amount
|
|||||||||
|
Technologies
|
10.2
|
$
|
47,694,000
|
|
27,000,000
|
|
$
|
20,694,000
|
|
||||
|
Customer relationships
|
10.0
|
29,931,000
|
|
9,281,000
|
|
20,650,000
|
|
||||||
|
Trademarks and other
|
18.6
|
6,044,000
|
|
1,918,000
|
|
4,126,000
|
|
||||||
|
Total
|
|
$
|
83,669,000
|
|
38,199,000
|
|
$
|
45,470,000
|
|
||||
The weighted average amortization period in
the above table excludes fully amortized intangible assets. Amortization expense for the years ended
July 31, 2012
,
2011
and
2010
was
$6,637,000
,
$8,091,000
and
$7,294,000
, respectively. The estimated amortization expense for the fiscal years ending
July 31, 2013
,
2014
,
2015
,
2016
and
2017
is
$6,327,000
,
$6,285,000
,
$6,211,000
,
$4,962,000
and
$4,782,000
, respectively.
(17)
Stockholders’ Equity
Stock Repurchase Program
In September 2010, our Board of Directors authorized a
$100,000,000
stock repurchase program that we completed in July 2011. Also in July 2011, our Board of Directors authorized an additional stock repurchase program for
$150,000,000
which was increased to
$250,000,000
on September 27, 2011. There is no time restriction on this authorization and repurchases may be made in open-market or privately negotiated transactions and may be made pursuant to SEC Rule10b5-1 trading plans.
During the fiscal year ended
July 31, 2012
, we repurchased
7,055,614
shares in open-market transaction for an aggregate cost of
$217,374,000
(including transaction costs), with an average price per share of
$30.81
. As of
July 31, 2012
, we can repurchase up to an additional
$11,268,000
of our common stock pursuant to our current $250,000,000 authorization. During fiscal 2012, we paid
$2,001,000
for repurchases of our common stock which was accrued as of
July 31, 2011
.
During the fiscal year ended
July 31, 2011
, we repurchased
4,297,508
shares in open-market transactions for an aggregate cost of
$121,618,000
(including transaction costs), with an average price per share of
$28.30
.
Dividends
In September 2011, our Board of Directors raised our annual targeted dividend from
$1.00
per common share to
$1.10
per common share. During the fiscal year ended
July 31, 2012
, our Board of Directors declared
four
quarterly dividends of
$0.275
per common share on
September 27, 2011
,
December 8, 2011
,
March 8, 2012
, and
June 7, 2012
which were paid on
November 22, 2011
,
February 22, 2012
,
May 22, 2012
and
August 20, 2012
, respectively. During the fiscal year ended
July 31, 2011
, our Board of Directors declared
four
quarterly cash dividends of
$0.25
per common share.
On
September 26, 2012
, our Board of Directors declared a dividend of
$0.275
per common share payable on
November 20, 2012
to shareholders of record at the close of business on
October 19, 2012
.
F-34
COMTECH TELECOMMUNICATIONS CORP.
AND SUBSIDIARIES
Notes to Consolidated Financial Statements, Continued
(18)
Unaudited Quarterly Financial Data
The following is a summary of unaudited quarterly operating results:
|
Fiscal 2012
|
First Quarter
|
Second Quarter
|
Third Quarter
|
Fourth Quarter
|
Total
|
|
||||||||||||
|
Net sales
|
$
|
113,361,000
|
|
99,141,000
|
|
99,793,000
|
|
112,775,000
|
|
425,070,000
|
|
|
||||||
|
Gross profit
|
51,280,000
|
|
41,416,000
|
|
41,678,000
|
|
49,135,000
|
|
183,509,000
|
|
|
|||||||
|
Net income
|
12,601,000
|
|
5,821,000
|
|
6,066,000
|
|
7,928,000
|
|
32,416,000
|
|
|
|||||||
|
Diluted income per share
|
0.47
|
|
0.27
|
|
0.29
|
|
0.38
|
|
1.42
|
|
*
|
|||||||
|
Fiscal 2011
|
First Quarter
|
Second Quarter
|
Third Quarter
|
Fourth Quarter
|
Total
|
|
||||||||||||
|
Net sales
|
$
|
178,160,000
|
|
162,811,000
|
|
131,081,000
|
|
140,327,000
|
|
612,379,000
|
|
|
||||||
|
Gross profit
|
64,234,000
|
|
60,910,000
|
|
56,971,000
|
|
58,931,000
|
|
241,046,000
|
|
|
|||||||
|
Net income
|
25,656,000
|
|
16,096,000
|
|
14,255,000
|
|
11,888,000
|
|
67,895,000
|
|
|
|||||||
|
Diluted income per share
|
0.79
|
|
0.52
|
|
0.47
|
|
0.42
|
|
2.22
|
|
*
|
|||||||
|
Fiscal 2010
|
First Quarter
|
Second Quarter
|
Third Quarter
|
Fourth Quarter
|
Total
|
|
||||||||||||
|
Net sales
|
$
|
133,816,000
|
|
171,132,000
|
|
216,303,000
|
|
256,954,000
|
|
778,205,000
|
|
|
||||||
|
Gross profit
|
49,774,000
|
|
63,501,000
|
|
74,791,000
|
|
82,532,000
|
|
270,598,000
|
|
|
|||||||
|
Net income
|
9,032,000
|
|
16,333,000
|
|
21,796,000
|
|
13,469,000
|
|
60,630,000
|
|
|
|||||||
|
Diluted income per share
|
0.30
|
|
0.51
|
|
0.67
|
|
0.43
|
|
1.91
|
|
*
|
|||||||
* Income per share information for the full fiscal year may not equal the total of the quarters within the year.
F-35
Schedule II
COMTECH TELECOMMUNICATIONS CORP.
AND SUBSIDIARIES
Valuation and Qualifying Accounts and Reserves
Fiscal Years Ended July 31, 2012, 2011 and 2010
|
Column A
|
Column B
|
Column C Additions
|
Column D
|
|
Column E
|
||||||||||||||||||
|
Description
|
Balance at
beginning of
period
|
Charged to
cost and
expenses
|
|
Charged to
other accounts
- describe
|
Transfers
(deductions)
- describe
|
|
Balance at
end of
period
|
||||||||||||||||
|
Allowance for doubtful accounts receivable:
|
|
|
|
|
|
|
|
||||||||||||||||
|
Year ended July 31,
|
|
|
|
|
|
|
|
||||||||||||||||
|
2012
|
$
|
1,220,000
|
|
458,000
|
|
(A)
|
—
|
|
(90,000
|
)
|
(B)
|
$
|
1,588,000
|
|
|||||||||
|
2011
|
1,127,000
|
|
244,000
|
|
(A)
|
—
|
|
(151,000
|
)
|
(B)
|
1,220,000
|
|
|||||||||||
|
2010
|
1,252,000
|
|
219,000
|
|
(A)
|
—
|
|
(344,000
|
)
|
(B)
|
1,127,000
|
|
|||||||||||
|
Inventory reserves:
|
|
|
|
|
|
|
|
|
|
|
|
|
|||||||||||
|
Year ended July 31,
|
|
|
|
|
|
|
|
|
|
|
|
|
|||||||||||
|
2012
|
$
|
13,316,000
|
|
3,862,000
|
|
(C)
|
2,776,000
|
|
(D)
|
(3,668,000
|
)
|
(E)
|
$
|
16,286,000
|
|
||||||||
|
2011
|
13,791,000
|
|
4,091,000
|
|
(C)
|
—
|
|
(4,566,000
|
)
|
(E)
|
13,316,000
|
|
|||||||||||
|
2010
|
11,744,000
|
|
7,744,000
|
|
(C)
|
—
|
|
(5,697,000
|
)
|
(E)
|
13,791,000
|
|
|||||||||||
|
Valuation allowance for deferred tax assets:
|
|
|
|
|
|
|
|
|
|
|
|
|
|||||||||||
|
Year ended July 31,
|
|
|
|
|
|
|
|
|
|
|
|
|
|||||||||||
|
2012
|
$
|
1,162,000
|
|
—
|
|
|
—
|
|
—
|
|
|
$
|
1,162,000
|
|
|||||||||
|
2011
|
1,162,000
|
|
—
|
|
|
—
|
|
—
|
|
|
1,162,000
|
|
|||||||||||
|
2010
|
1,212,000
|
|
—
|
|
|
—
|
|
(50,000
|
)
|
(F)
|
1,162,000
|
|
|||||||||||
|
(A)
|
Provision for doubtful accounts.
|
|
(B)
|
Write-off of uncollectible receivables.
|
|
(C)
|
Provision for excess and obsolete inventory.
|
|
(D)
|
Reclassification of contract loss accrued in fiscal 2011.
|
|
(E)
|
Write-off of inventory.
|
|
(F)
|
Change in valuation allowance.
|
S-1
TABLE OF CONTENTS
Part IItem 1. BusinessItem 1A. Risk FactorsItem 1B. Unresolved Staff CommentsItem 2. PropertiesItem 3. Legal ProceedingsItem 4. Mine Safety DisclosuresPart IIItem 5. Market For Registrant S Common Equity, Related Stockholder Matters and Issuer Purchases Of Equity SecuritiesItem 6. Selected Consolidated Financial DataItem 7. Management S Discussion and Analysis OfItem 7A. Quantitative and Qualitative Disclosures About Market RiskItem 8. Financial Statements and Supplementary DataItem 9. Changes in and Disagreements with Accountants onItem 9A. Controls and ProceduresItem 9B. Other InformationPart IIIItem 10. Directors, Executive Officers and Corporate GovernanceItem 11. Executive CompensationItem 12. Security Ownership Of Certain Beneficial OwnersItem 13. Certain Relationships and Related Transactions,Item 14. Principal Accounting Fees and ServicesPart IVItem 15. Exhibits, Financial Statement Schedules