COMTECH TELECOMMUNICATIONS CORP /DE/
10-Ks and 10-Qs
|
|
|
|
|
|
|
|
|
|
|
|
|
|
|
|
|
|
|
|
|
|
|
|
|
|
|
|
|
|
|
|
|
|
|
|
|
|
|
|
|
|
|
|
|
|
|
|
|
|
UNITED STATES SECURITIES AND EXCHANGE COMMISSION
Washington, D.C. 20549
|
FORM 10-K
|
(Mark One)

|
Annual Report Pursuant to Section 13 or 15(d) of the Securities Exchange Act of 1934
|
For the fiscal year ended
July 31, 2018

|
Transition Report Pursuant to Section 13 or 15(d) of the Securities Exchange Act of 1934
|
Commission File Number: 0-7928

(Exact name of registrant as specified in its charter)
|
Delaware
|
|
11-2139466
|
|
(State or other jurisdiction of incorporation /organization)
|
|
(I.R.S. Employer Identification Number)
|
|
68 South Service Road, Suite 230,
Melville, NY
|
|
11747 |
|
(Address of principal executive offices)
|
|
(Zip Code)
|
|
(631) 962-7000
|
|
(Registrant's telephone number, including area code)
|
Securities registered pursuant to Section 12(b) of the Act:
|
Title of each class
|
|
Name of each exchange on which registered
|
|
Common Stock, par value $.10 per share
|
|
NASDAQ Stock Market LLC
|
|
Series A Junior Participating Cumulative
|
|
|
Securities registered pursuant to Section 12(g) of the Act:
None
(Title of class)
Indicate by check mark if the registrant is a well-known seasoned issuer, as defined in Rule 405 of the Securities Act.
Yes
No
Indicate by check mark if the registrant is not required to file reports pursuant to Section 13 of Section 15(d) of the Act.
Yes
No
Indicate by check mark whether the registrant (1) has filed all reports required to be filed by Section 13 or 15(d) of the Securities Exchange Act of 1934 during the preceding 12 months (or for such shorter period that the registrant was required to file such reports), and (2) has been subject to such filing requirements for the past 90 days.
Yes
No
Indicate by check mark whether the registrant has submitted electronically and posted on its corporate Web site, if any, every Interactive Data file required to be submitted and posted pursuant to Rule 405 of Regulation S-T (§ 232.405 of this chapter) during the preceding 12 months (or for such shorter period that the registrant was required to submit and post such files).
Yes
No
Indicate by check mark if disclosure of delinquent filers pursuant to Item 405 of Regulation S-K (§ 229.405 of this chapter) is not contained herein, and will not be contained, to the best of registrant’s knowledge, in definitive proxy or information statements incorporated by reference in Part III of this Form 10-K or any amendment to this Form 10-K.
Indicate by check mark whether the registrant is a large accelerated filer, an accelerated filer, a non-accelerated filer, a smaller reporting company, or an emerging growth company. See the definitions of "large accelerated filer," "accelerated filer," "smaller reporting company," and "emerging growth company" in Rule 12b-2 of the Exchange Act.
|
Large accelerated filer
|
|
Accelerated filer
|
|
Emerging growth company
|
|
|
Non-accelerated filer
|
|
Smaller reporting company
|
|
||
If an emerging growth company, indicate by check mark if the registrant has elected not to use the extended transition period for complying with any new or revised financial accounting standards provided pursuant to Section 13(a) of the Exchange Act.
Indicate by check mark whether registrant is a shell company (as defined in Rule 12b-2 of the Exchange Act).
Yes
No
The aggregate market value of the registrant’s voting stock held by non-affiliates of the registrant, computed by reference to the closing sales price as quoted on the NASDAQ Global Market on
January 31, 2018
was approximately
$500,523,000
.
The number of shares of the registrant’s common stock outstanding on
September 21, 2018
was
23,853,761
.
DOCUMENTS INCORPORATED BY REFERENCE.
Certain portions of the document listed below have been incorporated by reference into the indicated Part of this Annual Report on Form 10-K:
Proxy Statement for
2018
Annual Meeting of Stockholders - Part III
|
INDEX
|
||
|
PART I
|
||
|
ITEM 1.
|
||
|
|
|
|
|
|
||
|
|
||
|
|
||
|
|
||
|
|
||
|
|
||
|
|
||
|
|
||
|
|
||
|
|
||
|
|
||
|
|
||
|
|
||
|
|
|
|
|
ITEM 1A.
|
||
|
|
|
|
|
ITEM 1B.
|
||
|
|
|
|
|
ITEM 2.
|
||
|
|
|
|
|
ITEM 3.
|
||
|
ITEM 4.
|
||
|
|
|
|
|
PART II
|
||
|
|
|
|
|
ITEM 5.
|
||
|
|
|
|
|
|
||
|
|
||
|
|
||
|
|
||
|
|
||
|
|
|
|
|
ITEM 6.
|
||
|
|
|
|
i
|
ITEM 7.
|
||
|
|
|
|
|
|
||
|
|
||
|
|
||
|
|
||
|
|
||
|
|
||
|
|
||
|
|
||
|
|
|
|
|
ITEM 7A.
|
||
|
|
|
|
|
ITEM 8.
|
||
|
|
|
|
|
ITEM 9.
|
||
|
|
|
|
|
ITEM 9A.
|
||
|
|
|
|
|
ITEM 9B.
|
||
|
PART III
|
||
|
ITEM 10.
|
||
|
|
|
|
|
ITEM 11.
|
||
|
|
|
|
|
ITEM 12.
|
||
|
|
|
|
|
ITEM 13.
|
||
|
|
|
|
|
ITEM 14.
|
||
|
PART IV
|
||
|
ITEM 15.
|
||
|
|
|
|
|
|
|
|
ii
Note:
As used in this Annual Report on Form 10-K, the terms "Comtech," "we," "us," "our" and "our Company" mean Comtech Telecommunications Corp. and its subsidiaries.
Note About Forward-Looking Statements
This Form 10-K contains "forward-looking statements," including statements concerning the future of our industry, product development, business strategy, continued acceptance of our products, market growth, and dependence on significant customers. These statements can be identified by the use of forward-looking terminology such as "may," "will," "should," "could," "would," "expect," "plan," "anticipate," "believe," "estimate," "predict," "potential," "continue," the negative of these terms, or other similar words or comparable terminology. All statements in this report, other than statements of historical fact, are forward-looking information. When considering forward-looking statements, you should keep in mind the risk factors and other cautionary statements included in this Form 10-K. However, the risks described in this Form 10-K are not the only risks that we face. Additional risks and uncertainties, not currently known to us or that do not currently appear to be material, may also materially adversely affect our business, financial condition and/or operating results in the future. We describe risks and uncertainties that could cause actual results and events to differ materially in
"Risk Factors"
(Part I, Item 1A of this Form 10-K),
"Quantitative and Qualitative Disclosures about Market Risk"
(Part II, Item 7A of this Form 10-K), and
"Management’s Discussion and Analysis of Financial Condition and Results of Operations"
(Part II, Item 7 of this Form 10-K). We undertake no obligation to update or revise publicly any forward-looking statements, whether because of new information, future events, or otherwise.
We are a leading provider of advanced communications solutions for both commercial and government customers worldwide. Our solutions fulfill our customers’ needs for secure wireless communications in some of the most demanding environments, including those where traditional communications are unavailable or cost-prohibitive, and in mission-critical scenarios where performance is crucial.
As more fully described throughout this Form 10-K, fiscal
2018
was a successful year for Comtech. It was the third consecutive year of net sales and second consecutive year of Adjusted EBITDA (a Non-GAAP financial measure) growth and we achieved consolidated net sales of
$570.6 million
, consolidated net income of
$29.8 million
and Adjusted EBITDA of
$78.4 million
. We generated significant cash flows from operations and significantly reduced our total indebtedness. Entering fiscal 2019 with a record high backlog and strong business momentum in each of our two operating segments, we are confident that fiscal 2019 will be another successful year.
Our Business Outlook for Fiscal
2019
is discussed further in
Part II -
"
Item 7. Management's Discussion and Analysis of Financial Condition and Results of Operations - Business Outlook for Fiscal
2019
.
" For a definition and explanation of Adjusted EBITDA, see
Part II -
"
Item 7. Management’s Discussion and Analysis of Financial Condition and Results of Operations - Comparison of Fiscal 2018 and 2017 - Adjusted EBITDA."
Our Internet website is
www.comtechtel.com
and we make available on our website: our filings with the Securities and Exchange Commission ("SEC"), including annual reports, quarterly reports, current reports and any amendments to those filings. The reference to our website address does not constitute incorporation by reference of the information contained therein into this Form 10-K. We also use our website to disseminate other material information to our investors (on the Home Page and in the "Investor Relations" section). Among other things, we post on our website our press releases and information about our public conference calls (including the scheduled dates, times and the methods by which investors and others can listen to those calls), and we make available for replay webcasts of those calls and other presentations.
We also use social media channels to communicate with customers and the public about our Company, our products, services and other issues, and we use social media and the Internet to communicate with investors, including information about our stockholder meetings. Information and updates about our Annual Meetings will continue to be posted on our website at
www.comtechtel.com
in the "Investor Relations" section.
Any materials filed with the SEC may be read and copied by the public at the SEC’s Public Reference Room at 100 F Street, N.E., Washington, DC 20549. The public may obtain information on the operation of the Public Reference Room by calling the SEC at 1-800-SEC-0330.
We are incorporated in the state of Delaware and were founded in 1967.
1
Corporate Strategies
We intend to manage our business with the following principal corporate strategies:
|
•
|
Seek leadership positions in markets where we can provide differentiated products and technology solutions;
|
|
•
|
Identify and participate in emerging technologies that enhance or expand our product portfolio;
|
|
•
|
Maximize responsiveness to our customers, including offering more integrated systems and solutions;
|
|
•
|
Expand and further penetrate our diversified and balanced customer base; and
|
|
•
|
Pursue acquisitions of complementary businesses and technologies.
|
Competitive Strengths
The successful execution of our principal corporate strategies is based on our competitive strengths, including the following:
|
(1)
|
We Have Significant Exposure to Large, Growing End Markets
|
We believe Comtech is well positioned to capitalize on some of the most significant emerging technology trends occurring worldwide and that customers around the world will increasingly turn to us to fulfill their needs for secure wireless communications in some of the most demanding environments, including those where traditional communications are unavailable or cost-prohibitive, and in mission-critical scenarios where performance is crucial. These important emerging technology trends include growth in global wireless penetration and mobile data consumption, proliferation of mobile applications requiring trusted location data, the need for public safety agencies to seamlessly connect individuals with first responders, widespread deployment of in-flight connectivity solutions by airlines worldwide, and the rapidly expanding breadth of High Definition ("HD") and 4K broadcasting content, all of which we believe will result in an increase in global voice, video and data usage that will, in turn, result in increased demand for the secure wireless and satellite communication solutions that we provide.
|
(2)
|
We Believe We Are a Market Leader in the End-Markets That We Serve
|
Commercial Solutions Segment
Communication Technologies -
We believe we are the leading provider of Single Channel per Carrier ("SCPC") satellite earth station modems. Many of our key satellite earth station products incorporate Turbo Product Code ("TPC") forward error correction technology and our licensed DoubleTalk
®
Carrier-in-Carrier
®
bandwidth compression technology which enables our customers to optimize their satellite networks by either reducing their satellite transponder lease costs or increasing data throughput. We believe we are a leader in the traveling wave tube amplifiers ("TWTA") market and we differentiate our product offerings by our ability to develop the most efficient size, weight and power profile. Our TWTA products are vital to satellite communication applications such as traditional broadcast, direct-to-home ("DTH") broadcast and satellite newsgathering. We provide solid-state amplifiers that are also used to amplify signals carrying voice, video or data for air-to-satellite-to-ground communications. For example, our amplifiers, when incorporated into an aircraft satellite communication system, can provide passengers with email, Internet access and video conferencing. Certain of our high-powered amplifiers are AS-900 (an airborne quality standard) certified. We believe we are a leader in providing amplifiers for the growing in-flight connectivity market.
Safety and Security Technologies
- We believe that we are a leader in public safety communication technologies used for delivery of 911 calls. We believe we have significant market share in the routing of U.S. wireless 911 calls, Voice over Internet Protocol ("VoIP") 911 calls and Text to 911 deployments. We believe we are one of two companies fulfilling the Federal Communications Commission ("FCC") requirements for Enhanced 911 ("E911") call-routing to public safety answering points ("PSAPs") for wireless and VoIP network operators. E911 refers to 911 calls for both wireline and wireless telephones that are enhanced to provide location information of the caller. We are focusing our marketing and research and development efforts to meet system standards for next generation 911 ("NG911"), which refers to an Internet Protocol ("IP") based system that allows digital information (e.g., voice, photos, videos, text messages) to flow seamlessly from the public, through the 911 network and on to emergency responders.
2
Enterprise Technologies
- Our Short-Messaging Service ("SMS") Center software has been used by wireless carrier subscribers to send and receive text or data messages to and from wireless devices for almost two decades. We provide ongoing operational support for our installed base of systems, including administration of system components, system optimization and configuration management. Our systems include our Location Trust Score technology, a unique process we developed to reliably identify a mobile location by generating a "Location Trust Score." Additionally, we offer Location Studio
TM
,
a complete end-to-end location-based services platform for mobile carriers, application developers and enterprises. The platform consists of multiple modular technology suites that provide a rich set of functionalities, including indoor and outdoor positioning, geolocation, mapping, search, routing, navigation, real-time message updates and analytics
.
This platform includes Look4
TM
geo-services which enable customers to build their own applications powered by our location-based technology and a cloud-based positioning engine. We believe the positioning of Location Studio
TM
is unique in the industry and is an appealing alternative to free consumer-based mapping services which are subject to change by the supplier and which may not meet an enterprise’s privacy and security requirements.
Government Solutions Segment
Command and Control Technologies
- We are a key supplier to the U.S. Army for mission critical command and control technology solutions and field support services. We are a prime contractor under several indefinite delivery, indefinite quantity ("IDIQ") defense contract vehicles or task orders, including the: (i) Army’s Global Tactical Advanced Communications Systems ("GTACS") contract, (ii) Defense Information Systems Agency’s Custom SATCOM Solutions ("CS2") contract and (iii) Complex Commercial SATCOM Solutions ("CS3") contract from the General Services Administration. We also provide the U.S. Department of Defense ("DoD") personnel with curriculum development and training services to support cybersecurity workforce development. We currently provide sustainment services to the U.S. Army’s AN/TSC-198 family of communication systems that are commonly referred to as "SNAP" (Secret Internet Protocol Router ("SIPR") and Non-secure Internet Protocol Router ("NIPR") Access Point) Very Small Aperture Terminals ("VSATs"). Additionally, we continue to work with the U.S. Army to deploy our next generation MT-2025 mobile satellite transceivers, which are also known as the Blue Force Tracker-2 High Capacity ("BFT-2-HC") satellite transceivers. The MT-2025 transceivers meet BFT-2 protocols, provide best-in-class reliability and are fully backward compatible with the Blue Force Tracking-1 ("BFT-1") system. Comtech previously shipped over 100,000 BFT-1 mobile satellite transceivers and currently provides sustaining support for the older BFT-1 system.
Troposcatter Technologies
- We have designed, manufactured and sold over-the-horizon microwave products and systems for approximately forty years and believe we are the leading supplier in this specialized product market. We believe we offer the only available adaptive troposcatter modem operating at 50 Mbps. Our Modular Tactical Transmission System ("MTTS") provides a high capacity, beyond-line-of-sight modular communications system designed for easy and rapid deployment. Our MTTS also offers seamless compatibility and interoperability with legacy-fielded troposcatter systems currently used by the U.S. military, including all versions of the AN/TRC-170.
RF Power & Switching Technologies -
We are one of the largest independent suppliers of broadband, high-power, high-performance RF microwave amplifiers, which reproduce signals with high power and are extremely complex and critical to the performance of the systems into which they are incorporated. Many of these amplifiers are produced in-house by large companies; however, our expertise has created a cost-effective and technologically superior alternative to in-house sourcing. Some of the companies who have outsourced amplifier production to us include Rockwell Collins, Inc., Thales Group, European Aeronautic Defense and Space Company ("EADS"), Telephonics Corporation, Northrop Grumman Corporation, BAE Systems PLC and Raytheon Company. Our amplifiers are also used in oncology treatment systems that allow physicians to give cancer patients higher doses of radiation that are more closely focused on cancerous tissue, thereby minimizing damage to healthy tissue.
|
(3)
|
We Believe We Provide Industry Leading Innovation, Capabilities and Solutions
|
We have established a leading position of technology innovation in our fields through internal and customer-funded research and development activities, which have yielded significant advances. Examples of our industry-leading innovation include:
Our HEIGHTS
TM
Networking Platform -
Our HEIGHTS
TM
networking platform ("HEIGHTS") is the cornerstone of our current research and development efforts and is increasingly becoming a focus of satellite earth station equipment sales and marketing efforts. HEIGHTS is an advanced networking platform that combines our most efficient waveforms, compression engines and the ability to provide dynamic bandwidth and power management to meet the demands of customers operating on traditional fixed satellite service systems ("FSS") while providing advantages for customers who plan to transition to high throughput satellite ("HTS") systems in the future. Our HEIGHTS networking platform, a successor to our advanced VSAT series of products, is ideally suited for cellular backhaul, universal service obligation networks and other applications that require high performance in a hub-spoke environment. Our HEIGHTS Dynamic Network Access Technology solutions are designed to deliver the highest Internet Protocol bits per Hertz in its class.
3
Our SLM-5650B Satellite Modems
- During fiscal 2018, the U.S. Space and Naval Warfare System Command, in support of the Program Executive Office for Command, Control, Communications, Computer and Intelligence, awarded us a strategically important multi-year $59.0 million contract to procure our SLM-5650B satellite modems, upgrade kits and related services. This IDIQ sole-source contract has five one-year ordering periods. There are over eight-hundred older generation modems currently utilized by multiple Navy programs. We believe that no other competitor responded to the NAVY’s initial Request for Proposal ("RFP") and we believe our modems and related upgrade kits will meet critical Navy requirements.
Our Gallium Nitride Based Amplifiers
- These amplifiers, which incorporate Gallium Nitride ("GaN") technology, offer customers smaller size, more power and higher efficiency. With continued technology evolution in the GaN semiconductor marketplace, we have successfully developed GaN based products with our GaN semiconductor partners that are achieving higher power levels than previously available in solid state amplifiers. We believe this will create opportunities to replace difficult to utilize amplifiers which use antiquated technology and are more expensive to operate. In recent years, we have developed a new series of high-power GaN Solid State Power Amplifiers ("SSPA") which we believe are more compact and significantly more efficient than other SSPAs on the market, making them ideal for transportable and mobile applications where power draw matters. These new SSPAs include: our new XTLIN200K SSPA which covers 13.75 to 14.5 GHz Ku-band with a minimum of 200W of linear power; our new XTLIN-100K SSPA which also covers 13.75 to 14.5 GHz Ku-band but with a minimum of 100W of linear power and which allows easy conversion from X-band to Ku-band; and our new XTLIN-200X SSPA which can be used for tactical X-band and which offers a minimum of 200W of linear power. Our ground-based amplifiers are built with modular components for rapid deployment and easy scaling up in power. Products at different frequency bands share common physical designs, which saves manufacturing cost and allows easy conversion for tactical military customers to transmit up to 200W of linear power in either X-band or Ku-band depending on regional satellite availability. GaN technology is also incorporated into our airborne products and we have introduced products in both Ku-band and Ka-band to address the growing demand for satellite-based inflight connectivity on commercial aircrafts. We believe these products will meet the needs of our customers for many years ahead.
Our Trusted Location Technology Solutions
- In order to determine a cellular phone user’s location, many companies utilize technology that combines wireless network-derived location data with data from the phone’s on-board global positioning system receiver. In 2016, we were issued a U.S. patent for our Location Trust Score technology. This patent grants us important intellectual property protection and licensing opportunities for a unique process that identifies the reliability of a stated mobile location by generating a "Location Trust Score." We believe this technology is a major breakthrough in providing secure, accurate and reliable information and a powerful tool for identifying fraud, preventing "false positive" denials of service and confirming location compliance for regulated industries.
|
(4)
|
We Have a Diverse Global Customer Base
|
We have established long-standing relationships with hundreds of customers worldwide. Our customers include leading system and network suppliers in the global satellite, defense, broadcast and aerospace industries, as well as the U.S. federal government, U.S. state and local governments, and foreign governments.
Our satellite earth station products and our high-power amplifiers are used by hundreds of international customers including mobile cellular network providers and governments around the world. We also have ongoing relationships with the U.S. Air Force, U.S. Navy, U.S. Army and other government agencies. Our global commercial and government customers are increasingly seeking integrated solutions to meet their operational needs. We believe that our customers recognize our ability to develop improved technologies and to meet stringent program requirements.
We have long-standing relationships with U.S.-based telecommunications companies, including Verizon Wireless and AT&T, through various divisions, directly and through channels.
We believe the TCS acquisition has further strengthened our relationship with the U.S. government given its prime position on key contracts. Prior to the acquisition, Comtech and TCS had worked together for a number of years to offer the U.S. military a troposcatter system in a transportable flyaway configuration (known as the AN/TCS-198(V3) or SNAP-3T) which is capable of providing seamless compatibility and interoperability with legacy-fielded over-the-horizon microwave systems. Over time, we hope to utilize these prime contracts to facilitate procurement by the U.S. government for our satellite earth station and over-the-horizon microwave equipment and systems, given the ever-increasing amount of Command, Control, Communications, Computers, Intelligence, Surveillance and Reconnaissance (also known as "C4ISR") information that is being generated.
4
Our Two Business Segments
We manage our business through two reportable operating segments: Commercial Solutions and Government Solutions. Our corporate senior management team supports the business segments by, among other things, actively seeking to exploit potential synergies that exist between the segments, including in areas such as manufacturing, technology, sales, marketing and customer support.
In fiscal
2018
, our Commercial Solutions segment contributed
60.5%
of our consolidated net sales and our Government Solutions segment contributed
39.5%
of our consolidated net sales. Additional financial information about our business segments, including net sales, operating income, Adjusted EBITDA (a Non-GAAP financial measure), total assets, and our operations outside the United States, is provided in "
Notes to Consolidated Financial Statements - Note (13) Segment Information
"
included in "
Part II - Item 8. - Financial Statements and Supplementary Data.
"
Commercial Solutions Segment
Overview
Our Commercial Solutions segment serves commercial customers and smaller government customers, such as state and local governments, that require advanced communication technologies to meet their needs. This segment also serves certain large government customers (including the U.S. government) that have requirements for off-the-shelf commercial equipment. We believe this segment is a leading provider of satellite communications (such as satellite earth station modems and TWTAs), public safety systems (such as NG911 technologies) and enterprise application technologies (such as messaging and trusted location-based technologies).
Key Markets and Technology Solutions
Communication Technologies
We offer communication technologies with particular expertise in the satellite communications industry, which is undergoing a period of significant growth and rapid technological change. Our Commercial Solutions segment manufactures most of the satellite-based communication equipment we sell to our customers including equipment sold by our Government Solutions segment.
We believe that the overall satellite ground station equipment industry will grow over the next few years. This growth is expected to occur as a result of wide-sweeping deployment and upgrades of ground-based systems, including satellite earth stations, as well as integration of high-performance amplifiers used for high-performance systems necessary to meet emerging demand for high-performance applications of satellite communications technologies, such as satellite-based wireless backhaul, direct-to-home ("DTH"), high definition ("HD") and 4K broadcasting and in-flight connectivity.
We believe that Comtech is well positioned to capitalize on this industry growth and change through sales of our market leading, high-performance communication technologies and products, including our SCPC satellite modems, solid-state amplifiers and our HEIGHTS networking platform. Examples of end-market applications that are driving demand for our satellite-based communication technologies include:
|
•
|
Satellite-Based Cellular Backhaul.
Demand for satellite-based cellular backhaul services is anticipated to grow rapidly as a result of the increased penetration of smart cellular phones and network upgrades to 3G and 4G in developing regions of the world. Ultimately, 5G services will be deployed and mobile data services will become more critical. As mobile data penetration expands and mobile data consumption increases, wireless carriers must invest in their mobile network infrastructure and businesses will require back-up communications. In developing regions of the world and in remote areas where terrestrial network infrastructure is lacking, wireless network operators often backhaul, or transport, their wireless data traffic using satellite-based networking technologies. Comtech is well positioned to serve the high-performance, high availability needs of satellite-based cellular backhaul through sales of our leading SCPC modems, our HEIGHTS networking platform and solid-state amplifiers.
|
|
•
|
New High Throughput Satellites.
There are more than 100 new High Throughput Satellite ("HTS") payloads expected to launch over the next decade which we believe is expected to lead to increasingly complex satellite networks. As service providers work to offer connectivity to these high-speed, high-bandwidth satellites and expand their networks to handle the demand for new HTS applications, we believe our HEIGHTS networking platform will be incorporated into many new installations and necessary upgrades of equipment.
|
5
|
•
|
High Definition and Ultra-High Definition Broadcasting.
Reports indicate that in recent years, consumers have purchased millions of High Definition televisions and Ultra-High Definition or "4K" televisions. We believe this will require a significant amount of satellite bandwidth, which will require satellite service providers to upgrade equipment and find new ways to manage the cost and transmission efficiency of their networks. We believe that these requirements will drive increased demand for new SCPC-based modems, our Ka-frequency based 500 Watt TWTA, our HEIGHTS products and our SuperPower
TM
TWTAs, which can double TWTA output power and provide direct replacement for bandwidth deficient KPAs.
|
|
•
|
In-Flight Connectivity.
Consumer demand for anytime, anywhere connectivity is rapidly rising. As a result, airlines worldwide are deploying in-flight connectivity and entertainment systems. The deployment of in-flight connectivity and entertainment systems by airlines around the world is creating opportunities for us to serve as a key supplier of amplifier components used for in-flight Ku-band connectivity systems.
As airlines move to offer higher speed satellite-based connectivity, we believe this market will experience solid demand over the next few years.
|
Safety and Security Technologies
We offer safety and security technology solutions that enable 911 call routing via cellular, over the Internet using VoIP, and across next generation technology. When someone places an emergency call using one of these technologies, our software, which is utilized by certain telecommunication carriers, can identify the call as an emergency call, accesses the user’s location information from the wireless network and routes the call to the assigned public safety jurisdiction.
We intend to continue to invest in and upgrade our 911 capabilities as we believe this market will grow from current levels. We believe our existing customer base has a need for NG911 systems, including 911 text messaging services, advanced data, real-time photos and other types of information sharing over IP networks. We believe the Commerce Department’s FirstNet system, a nationwide LTE broadband network for over five million first responders, which encompasses police departments, fire departments, the National Guard, and other emergency service providers will facilitate demand for new NG911 systems. Additionally, over time, we believe we can provide systems integration, satellite and location infrastructure terminals, and linkage to NG911 Emergency Services IP Networks ("ESInet"). Although the sales cycle is lengthy and difficult to predict, we believe the market for NG911 products will grow from current levels. As the U.S. adopts NG911 solutions, we believe that other countries will do so as well. Our NG911 solutions have been deployed since 2006 and are utilized by literally millions of people in more than 30 states. Key E911 capability upgrades include: Text-to-911, indoor location accuracy and multimedia messaging.
Enterprise & Trusted Location
™
Technologies
We offer enterprise application technologies including location-based technology such as Trusted Location
TM
, Look4
TM
, Indoor Location and text messaging platforms. These technologies are included in some of our Safety and Security Technologies solutions as well.
Leveraging our leading location-based technology expertise, we have developed a wide range of commercial solutions to help address mapping, routing and geolocation to help reduce cybercrime and fraud, as well as enhance public safety. Our Trusted Location
TM
product is a software-based scoring system that allows providers to accurately determine mobile location and identify fraudulent behavior (e.g., location spoofing) and other security risks, including risks arising from mobile-based financial transactions. Our Location Studio
TM
platform allows customers to build their own applications with end-customer functionality such as maps, search, geocoding, routing and navigation using their brand. We believe that enterprise customers are increasingly looking for an alternative to free mapping services that are subject to change by the provider and may not meet the enterprise’s privacy and security requirements. Our Indoor Location solution enables the determination of a cell phone user’s geospatial position in environments where traditional Global Positioning System ("GPS"), global navigation satellite systems and cellular technologies do not work well (such as office buildings). The FCC has mandated that emergency services must incorporate this technology (and we believe other markets will follow) which utilizes more precise location information in mobile applications as well as in driverless cars and C4ISR systems. We provide services to support these applications, and our platform is used to provide "Connected Car" connectivity. Our Specifix
TM
application is an advanced data rights platform that allows operators to manage and monetize their location data, while securing user privacy and complying with consumer privacy laws. Our text messaging platforms are used by wireless carriers to provide SMS to their end-customers and are also used to communicate with 911 PSAPs through major network operators. For our installed base of systems, we provide ongoing operational support, including administration of system components, system optimization and configuration management. Maintenance services include tracking customer support issues, troubleshooting and developing and installing maintenance releases.
6
Government Solutions Segment
Overview
Our Government Solutions segment serves large government end-users (including those of foreign countries) that require mission-critical technologies and systems. We believe this segment is a leading provider of command and control applications (such as the design, installation and operation of data networks that integrate computing and communications, including both satellite and terrestrial links), ongoing network operation and management support services (including project management and fielding and maintenance solutions related to satellite ground terminals), troposcatter communications (such as digital troposcatter multiplexers, digital over-the-horizon modems, troposcatter systems and frequency converter systems) and RF power and switching technologies (such as solid-state high-power broadband amplifiers, enhanced position location reporting system (commonly known as "EPLRS") amplifier assemblies, identification friend or foe ("IFF") amplifiers and amplifiers used in the counteraction of improvised explosive devices).
Key Markets and Technology Solutions
Our Government Solutions segment offers integrated satellite equipment and designs, installs and operates data networks that integrate computing and communications (including both satellite and terrestrial links). In addition, our Government Solutions segment provides ongoing network operation and management support services including project management, field support and maintenance solutions related to satellite ground terminals and related systems.
Command & Control (C4ISR) Technologies
With persistent threats from state and non-state actors, governments seek to mitigate these threats using information to increase decision-makers’ situational awareness. This information is collected through various surveillance platforms, such as radars and unmanned aerial vehicles ("UAVs") and transferred and processed through secure communications networks.
We offer a variety of command and control solutions to help close the security gap in an era of information-based, network-centric warfare. These solutions include the supply and support of satellite networks (including the supply of hardware such as satellite transceivers, ruggedized routers and solid-state drives), sustainment services for the AN/TSC-198A SNAP (Secret Internet Protocol Router ("SIPR") and Non-classified Internet Protocol Router ("NIPR") Access Point), Very Small Aperture Terminals ("VSATs") and managed satellite services and integrated global support. We also provide a variety of in-class and on-line training services to our customers to help them protect command and control networks (and other sophisticated networks) from cyber-attacks. Command and control networks depend on global suppliers who can provide value-added support services and we are recognized as an industry leader and global supplier of high reliability products and supply chain services for the U.S. military and aerospace market. These services include the procurement of space components, antenna systems, high reliability Electrical, Electronic and Electromechanical ("EEE") parts in support of critical NASA programs and the design, development and installation of multiple launch vehicle tracking stations in the South Pacific for an international space agency.
Our mobile satellite transceivers have been installed on a variety of U.S. military vehicles (both logistics-centric and war-fighter-centric) including: Abrams tanks, Bradley Fighting Vehicles, helicopters such as the Apache, Black Hawk and Chinook and High Mobility Multipurpose Wheeled Vehicles. When equipped with this technology, soldiers operating these vehicles are able to be continually tracked and, at the same time, are able to maintain communications with a command center and fellow soldiers in the field. Our mobile satellite transceivers can also be used to facilitate communications in the event that natural disasters or other situations, such as a terrorist attack, disable or limit existing terrestrial communications. Since fiscal 2010, we have provided sustainment support services for the older BFT-1 system while a third party vendor selected by the U.S. Army developed and deployed the next generation BFT program known as BFT-2. We believe that the BFT-2 system can benefit from more reliable satellite transceivers and in fiscal 2018, we received a contract to support the U.S. Army Project Manager Mission Command ("PM MC") and the BFT-2 program to port additional waveforms onto the current BFT-2 transceivers. Separately, we received an initial $11.7 million contract to deploy several thousands of our MT-2025 mobile satellite transceivers, which are also known as the Blue Force Tracker-2 High Capacity ("BFT-2-HC") satellite transceivers. The MT-2025 transceivers meet BFT-2 protocols, provide best-in-class reliability and are fully backward compatible with the BFT-1 system. We previously shipped over 100,000 BFT-1 mobile satellite transceivers. These satellite transceivers are manufactured in our high-volume manufacturing center located in Tempe, Arizona which is operated by our Commercial Solutions segment. We began initial shipments of MT-2025 transceivers in fiscal 2018 and expect to continue shipments in fiscal 2019. Although the timing of awards is difficult to predict and subject to availability of U.S. government funding, we remain optimistic that we will receive additional orders for our MT-2025 transceivers. Ultimately, in light of technological advances and additional requirements, we believe the U.S. Army will procure a next generation BFT-3 system and we believe we can play a large role in meeting the U.S. Army’s operational needs.
7
Troposcatter Technologies
Over-the-horizon microwave systems, sometimes referred to as troposcatter systems, are extremely reliable and secure. Over-the-horizon microwave communication is a cost-effective, secure alternative to satellite communication as it does not require the leasing of expensive satellite transponder space with its attendant recurring costs. U.S. and foreign governments use our over-the-horizon microwave systems to, among other things, transmit radar tracking, run C4ISR applications and to connect remote border locations. Additionally, energy companies use our systems to enable communication links for offshore oil rigs and other remote locations, as well as for exploration activities. Our over-the-horizon microwave systems, which include our patented forward error correction technology, can transmit video and other broadband applications at throughputs of up to 50 megabits per second ("Mbps").
We believe our over-the-horizon microwave technologies often provide affordable and effective solutions to meet the requirements for communications services and that long-term demand will increase. We recently submitted a proposal to supply a significant quantity of our over-the-horizon microwave systems to the U.S. Army. We teamed with a large prime contractor who is providing other required hardware and services and are hopeful that we can win this multi-million dollar award in fiscal 2019.
Our MTTS, the first truly modular, rapidly deployable transit case-based troposcatter system, which has recently been purchased by the U.S. Army, has been incorporated into the SNAP family of products used by the U.S. military and called the Tactical Transportable TROPO ("SNAP 3T") or AN/TRC 198(V3). Numerous SNAP 3T terminals have been deployed by the U.S. Army in recent years and we believe that the U.S. Army intends to deploy a significant number of units in the future. We are currently developing next generation troposcatter modems that will provide significant reductions in size, weight and power as compared to currently available models. We believe these next generation modems will facilitate further market expansion over the next several years.
RF Power and Switching Technologies
Our high-power solid-state amplifiers and related technologies are utilized in several critical applications including: electronic warfare, communications, radar, IFF and medical applications. We believe the demand for our RF power and switching technologies is growing.
In the electronic warfare marketplace, we support legacy systems and are participating in the ongoing migration to platforms that require smaller and lighter amplifiers. We expect the U.S. DoD to fund initial proof of concept systems and fund production of small airborne platforms to meet the need for improved data link systems with manned and unmanned platforms. Our solutions increase the flexibility of systems by providing wider bandwidth capabilities to address communication needs.
We also believe that the desire for increased situational awareness of the airspace may create opportunities for our radar and IFF products, which are used by government customers around the world. Our high power and highly reliable GaN amplifier technology is increasingly being used both to update existing radar systems for improved sensitivity and range as well as for new radar installations. In addition to technologies that enhance performance of primary radars, we also supply solutions for IFF systems that provide positive identification of radar targets. Governing bodies are requiring the implementation of spectrum friendly systems which, in turn, is driving market need for new hardware for our advanced performance systems.
The medical industry is also making use of our technologies in oncology and hypothermic cancer treatment systems. These systems improve treatment precision, reduce marginal costs and allow for higher insurance reimbursement rates. These increased reimbursement levels are strong incentives to upgrade facilities with the latest available technologies.
8
Summary of Key Products, Systems and Services by Business Segment
The diagram below illustrates how our advanced technology solutions are organized by our two reportable operating segments:
|
Commercial Solutions Segment Technologies
|
Government Solutions Segment Technologies
|
|||||||||
|
Communication Technologies
|
Safety and Security Technologies
|
Enterprise Technologies
|
Command and Control Technologies
|
Troposcatter Technologies
|
RF Power and Switching Technologies
|
|||||
|
Satellite Earth Station Products
•
Ground-based equipment such as single channel per carrier modems and solid-state amplifiers that facilitate the transmission of voice, video and data over satellite links
Traveling Wave Tube Amplifiers
•
High power narrow-band amplifiers used to amplify signals from satellite earth stations
|
Safety and Security
•
Wireless/
VoIP 911 service for network operators
•
NextGen 911 solutions
•
ESInet (Emergency Services IP Network)
•
Call Handling applications for public safety answering points ("PSAPs")
|
Application Solutions
•
Software and equipment for Iocation-based and messaging infrastructure
•
Managed "cIoud-services"
•
Trusted Location
TM
•
Indoor Location
|
C4ISR
•
Tactical communications, managed networks, logistics, end-to-end integration
Cyber Intelligence Solutions
•
Cybersecurity training
•
Computer network operations
Mobile Data Communications
•
Secure, satellite
-
based mobile communications and tracking systems
|
Over-the
-
Horizon Microwave Systems
•
Equipment and systems that can transmit digitized voice
,
video and data over unfriendly or inaccessible terrain over distances from 20 to 200 miles using the troposphere
|
Solid State Power Amplifiers
•
Solid state high power broadband amplifiers designed for radar, electronic warfare
,
jamming, medical and aviation applications
|
|||||
|
Commercial Solutions Segment Representative Customers
|
Government Solutions Segment Representative Customers
|
|||||||||
|
Satellite systems integrators, wireless and other communication service providers and broadcasters.
Domestic and international defense customers, as well as U.S. and foreign governments, prime contractors and system suppliers such as Harris Corporation, General Dynamics Corporation, L-3 Communications, Raytheon Company and ViaSat Inc.
Satellite broadcasters, such as The DIRECTV Group and EchoStar Corporation.
End-customers also include Verizon Communications Inc., AT&T Inc., BT Group plc., China Mobile Limited, Century Link, Comcast Corporation, Intelsat, Ltd., Speed Cast International Limited, Nokia Corporation, O3b Networks, Qualcomm Incorporated and Sprint Corporation.
|
U.S. Army logistics community, the U.S. Army war-fighter community, foreign governments, the U.S. Navy, prime contractors to the U.S. Armed Forces and NATO.
Domestic and international defense customers, prime contractors and system suppliers such as Raytheon Company, The Boeing Company, Lockheed Martin Corporation, Telephonics, Inc. and Thales Group.
Medical equipment companies, such as Varian Medical Systems, Inc., and aviation industry system integrators such as Rockwell Collins, Inc.
U.S. government customers in the Middle East, Europe, North Africa and Latin America and related prime contractors and systems integrators.
Oil companies such as Shell Oil Company and Petronas.
|
|||||||||
9
Acquisitions
In the past, we have acquired businesses and enabling technologies.
Our most recent acquisition occurred on February 23, 2016, when we acquired TCS, a leading provider of commercial solutions (such as public safety systems and enterprise application technologies) and government solutions (such as command and control ("C4ISR") applications). The TCS acquisition had an aggregate purchase price for accounting purposes of
$340.4 million
(also referred to as the transaction equity value) and an enterprise value of
$423.6 million
.
The TCS acquisition was the largest acquisition in our history and resulted in Comtech entering complementary markets and expanding our domestic and international commercial offerings. TCS is a wholly-owned subsidiary of Comtech. Our financial results for each of fiscal 2018 and 2017 include a full year of TCS operations and for fiscal 2016 include approximately five months of TCS operations. See "
Item 7. Management's Discussion and Analysis of Financial Condition and Results of Operations"
for further discussion
.
Because our historical results prior to February 23, 2016 do not include TCS, you should not rely on period-to-period comparisons as an indicator of our future performance as these comparisons may not be meaningful.
In order to position ourselves to take advantage of additional growth opportunities and meet our strategic objectives, we have followed and will continue to follow a disciplined approach in identifying, executing and capitalizing on acquisitions.
Sales, Marketing and Customer Support
Sales and marketing strategies vary with particular markets served and include direct sales through sales, marketing and engineering personnel, indirect sales through independent representatives, value-added resellers, and sales through a combination of the foregoing. We devote resources to evaluating and responding to requests for proposals by governmental agencies around the world and, as needed, we employ the use of specialized consultants to develop our proposals and bids.
We intend to continue to expand international marketing efforts by engaging additional independent sales representatives, distributors and value-added resellers and by establishing additional foreign sales offices. In addition, we also leverage our relationships with larger companies (such as prime contractors to the U.S. government and large mobile wireless operators) to market our technology solutions.
We are pre-qualified as an approved vendor for certain government contracts, and some of our products and services are available to government customers via the General Services Administration’s Information Technology Schedule 70, GTACS, CS2, CS3 and the Space and Naval Warfare Foreign Military Sales contract vehicles. We collaborate in sales efforts under various arrangements with integrators. Our marketing efforts also include advertising, public relations, speaking engagements and attending and sponsoring industry conferences.
Our management, technical and marketing personnel establish and maintain relationships with customers. Our sales strategies include a commitment to providing ongoing customer support for our systems and equipment. This support involves providing direct access to engineering staff or trained technical representatives to resolve technical or operational issues.
Our products and services in many of our product lines have long sales cycles. Once a product is designed into a system, customers may be reluctant to change the incumbent supplier due to the extensive qualification process and potential redesign required in using alternative sources. In addition, in recent years, we have found that overall sales cycles for each of our product lines have significantly increased.
Sales by geography and customer type, as a percentage of consolidated net sales, are as follows:
|
|
Fiscal Years Ended July 31,
|
||||||||||||||||||||||||||
|
|
2018
|
2017
|
2016
|
2018
|
2017
|
2016
|
2018
|
2017
|
2016
|
||||||||||||||||||
|
Commercial Solutions
|
Government Solutions
|
Consolidated
|
|||||||||||||||||||||||||
|
U.S. government
|
18.1
|
%
|
15.1
|
%
|
25.0
|
%
|
62.2
|
%
|
59.2
|
%
|
65.0
|
%
|
35.5
|
%
|
32.7
|
%
|
40.8
|
%
|
|||||||||
|
Domestic
|
54.6
|
%
|
54.4
|
%
|
40.6
|
%
|
14.9
|
%
|
15.5
|
%
|
11.6
|
%
|
38.9
|
%
|
38.9
|
%
|
29.2
|
%
|
|||||||||
|
Total U.S.
|
72.7
|
%
|
69.5
|
%
|
65.6
|
%
|
77.1
|
%
|
74.7
|
%
|
76.6
|
%
|
74.4
|
%
|
71.6
|
%
|
70.0
|
%
|
|||||||||
|
International
|
27.3
|
%
|
30.5
|
%
|
34.4
|
%
|
22.9
|
%
|
25.3
|
%
|
23.4
|
%
|
25.6
|
%
|
28.4
|
%
|
30.0
|
%
|
|||||||||
|
Total
|
100.0
|
%
|
100.0
|
%
|
100.0
|
%
|
100.0
|
%
|
100.0
|
%
|
100.0
|
%
|
100.0
|
%
|
100.0
|
%
|
100.0
|
%
|
|||||||||
10
Sales to U.S. government customers include sales to the U.S. Department of Defense ("DoD"), intelligence and civilian agencies, as well as sales directly to or through prime contractors.
Domestic sales include sales to commercial customers, as well as to U.S. state and local governments.
Included in domestic sales, are sales to Verizon Communications Inc. ("Verizon"),
which represented
10.0%
of consolidated net sales for fiscal
2018
. Sales to Verizon were less than 10.0% of consolidated net sales for fiscal
2017
and
2016
.
International sales for fiscal
2018
,
2017
and
2016
(which include sales to U.S. domestic companies for inclusion in products that are sold to international customers) were
$145.8 million
,
$156.5 million
and
$123.5 million
, respectively. When we sell internationally, we denominate virtually all of our contracts in U.S. dollars. Some of our sales to international customers are paid for by letters of credit or on an open account. From time to time, some of our international customers may require us to provide performance guarantees.
Except for the U.S., no individual country (including sales to U.S. domestic companies for inclusion in products that are sold to a foreign country) represented more than
10%
of consolidated net sales for fiscal
2018
,
2017
and
2016
.
Backlog
Our backlog as of
July 31, 2018
was
$630.7 million
(of which $403.1 million was attributed to the Commercial Solutions segment and $227.6 million was attributed to the Government Solutions segment). We expect that a significant portion of the backlog as of
July 31, 2018
will be recognized as sales during fiscal
2019
.
At
July 31, 2018
,
25.4%
of our backlog consisted of U.S. government contracts, subcontracts and government funded programs,
21.9%
consisted of orders for use by international customers (including sales to U.S. domestic companies for inclusion in products that will be sold to international customers) and
52.7%
consisted of orders for use by U.S. commercial customers.
Our backlog consists of orders (sometimes referred to herein as bookings) that we believe to be firm; however, almost all of the contracts in our backlog (including firm orders previously received from the U.S. government) are subject to modification, cancellation at the convenience of the customer or for default in the event that we are unable to perform under the contract. Backlog that is derived from U.S. government orders relates to U.S. government contracts that have been awarded, signed and funded. Backlog for our U.S. government customers also includes amounts appropriated by Congress and allotted to the contract by the procuring government agency. Our backlog does not include the value of options that may be exercised in the future on multi-year contracts, nor does it include the value of additional purchase orders that we may receive under indefinite delivery/indefinite quantity ("IDIQ") contracts or basic ordering agreements.
In some cases, such as contracts received from large U.S. based telecommunication companies, our backlog is computed by multiplying the most recent month’s contract or revenue by the months remaining under the existing long-term agreements, which we consider to be the best available information for anticipating revenue under those agreements.
A significant portion of the backlog from our U.S. commercial customers relates to large, multi-year contracts to provide state and local governments (and their agencies) with safety and security solutions. Although the contracts themselves represent legal, binding obligations of these governments, funding is often subject to the approval of budgets (for example, on an annual or bi-annual basis). Although funding for these multi-year contracts are dependent on future budgets being approved, we include the full estimated value of these large, multi-year contracts in our backlog given the critical nature of the services being provided and the positive historical experience of our state and local government customers passing their respective budgets.
There can be no assurance that our backlog will result in actual revenue in any particular period, or at all, or that any contract included in backlog will be profitable. There is a higher degree of risk in this regard with respect to unfunded backlog. The actual receipt and timing of any revenue is subject to various contingencies, many of which are beyond our control. The actual recognition of revenue on contracts included in backlog may never occur or may change because a program schedule could change, the program could be canceled, a contract could be reduced, modified or terminated early, funding may not be included in future budgets, or an option that we had assumed would be exercised is not exercised.
11
Variations in backlog from time to time are attributable, in part, to changes in sales mix, the timing of contract proposals, and the timing of contract awards and delivery schedules on specific contracts. A large majority of the solutions in our communication technologies product line operate under short lead times. Our Government Solutions segment backlog is highly influenced by the nature and timing of orders received from the U.S. government, which is subject to unpredictable funding, deployment and technology decisions. As a result, we believe our backlog and orders, at any point in time, are not necessarily indicative of the total sales anticipated for any particular future period.
Manufacturing and Service
Our manufacturing operations consist principally of the assembly and testing of electronic products that we design and build from purchased fabricated parts, printed circuits and electronic components. We consider our facilities to be well maintained and adequate for current and planned production requirements. All of our manufacturing facilities, including those that serve the military market, must comply with stringent customer specifications. We employ formal quality management programs and other training programs, including the International Standard Organization’s quality procedure registration programs.
We operate a high-volume technology manufacturing center located in Tempe, Arizona. This manufacturing center is operated by our Commercial Solutions segment and can be utilized, in part, by our Government Solutions segment and by third-party commercial customers, including prime contractors to the U.S. government, who can outsource a portion of their product manufacturing to us. Increased usage of our high-volume technology manufacturing center allows us to secure volume discounts on key components, better control the quality of our manufacturing process and maximize the utilization of our manufacturing capacity.
Our ability to deliver products to customers on a timely basis is dependent, in part, upon the availability and timely delivery by subcontractors and suppliers (including, at times, the U.S. government) of the components and subsystems that we use in manufacturing our products. Electronic components and raw materials used in our products are generally obtained from independent suppliers. Some components are standard items and are available from a number of suppliers. Others are manufactured to our specifications by subcontractors. Although we obtain certain components and subsystems from a single source or a limited number of sources, we believe that most components and equipment are available from multiple sources. Certain U.S. government contracts may require us to incorporate government furnished parts into our products. Delays in receipt of such parts can adversely impact the timing of our performance on the related contracts.
Research and Development
We have established a leading technology position in our fields through internal and customer-funded research and development activities.
Internal research and development expenses are reported as research and development expenses for financial reporting purposes and were
$53.9
million,
$54.3
million and
$42.2
million in fiscal
2018
,
2017
and
2016
, respectively, representing
9.4%
,
9.9%
and
10.3%
of total consolidated net sales, respectively, for these periods. Customer-funded research and development activities relate to the adaptation of our basic technology to specialized customer requirements which is recoverable under contracts and is reflected in net sales with the related costs included in cost of sales. Certain of our government customers contract with us from time to time to conduct research on telecommunications software, equipment and systems. During fiscal
2018
,
2017
and
2016
, we were reimbursed by customers for such activities in the amounts of
$16.9
million,
$27.1
million and
$17.4
million, respectively.
Intellectual Property
We rely upon trade secrets, technical know-how, continuing technological innovation and, with respect to certain technologies, patents to develop and maintain our competitive position. The products we sell require significant engineering design and manufacturing expertise. For these technological capabilities that are not protected by patents or licenses, we generally rely on the expertise of our employees and our learned experiences in both the design and manufacture of our products and the delivery of our services.
Some of our key Commercial Solutions segment technology is protected by patents that are significant to protecting our proprietary technology. We have been issued several U.S. patents relating to forward error correction technology that is utilized in our TPC-enabled satellite modems. Due to our market leadership position, we do not expect that upon expiration of these patents, our future results will be negatively impacted. Our DoubleTalk
®
Carrier-in-Carrier
®
bandwidth compression technology is licensed by us from a third party.
12
We have a portfolio of several hundred patents worldwide relating to wireless location-based services, text messaging, GPS ephemeris data, emergency public safety data routing, electronic commerce and other areas. To-date, our strategy has been to avoid offensive and defensive patent litigation and focus on building meaningful partnerships with other companies through direct licensing, cross licensing, and other forms of agreements. We do not believe that any single patent or group of patents, patent application or patent license agreement is material to the Company’s operations.
We have filed additional patent applications for certain apparatus and processes we believe we have invented covering key features of the location services, wireless text alerts, SMS Center, mobile-originated data and E911 network software. There is no assurance that our patent applications will result in a patent being issued by the U.S. Patent and Trademark Office or other patent offices, nor is there any guarantee that any issued patent will be valid and enforceable. Additionally, foreign patent rights may or may not be available or pursued in any technology area for which U.S. patent applications have been filed.
Almost all of the products and services we sell to the U.S. government include technology and other technical know-how that we have internally developed. In past instances where we have provided government-purpose rights, to our knowledge, the U.S. government has not exercised any of these rights. To the extent that we have provided or will provide government-purpose rights in the future, we believe that given the rapidly changing nature of our technology, our future success will depend primarily on the technical competence and creative skill of our personnel, rather than any contractual protection.
Competition
Our businesses are highly competitive and are characterized by rapid technological change. Some of our competitors are substantially larger, have significantly greater financial, marketing, research and development, technological and operating resources and broader product lines than we have. Other companies are developing new technologies and the shift towards open standards such as IP-based satellite networks will likely result in increased competition. A significant technological breakthrough by others, including new companies, our existing competitors and our customers, could have a material adverse effect on our business. Our growth and financial condition depends on, among other things, our ability to keep pace with such changes and developments and to respond to the increasing variety of electronic equipment users and transmission technologies.
Some large defense-based companies, such as Northrop Grumman Corporation, have subsidiaries or divisions that compete against us in one or more business segments. In addition, new and potential competitors are always emerging. Certain of our customers, such as prime contractors who currently outsource their engineering and manufacturing requirements to us, have technological capabilities in our product areas and could choose to replace our products with products they develop. In some cases, we partner or team with companies (both large and mid-tier) to compete against other teams for large defense programs. In some cases, these same companies may be among our competitors.
Listed below, in alphabetical order, are some of our competitors in each of our two business segments:
Commercial Solutions
- Advantech Wireless Inc., CalAmp Corp., CPI International, Inc., Datum Systems, Inc., 8x8 Inc., Ericsson LM Telephone Co., Gilat Satellite Networks Ltd., Google Inc., Harris Corporation, Here Technologies, Honeywell Aerospace, iDirect, Inc., Infinite Convergence Solutions, Inc., Intermap Technologies Corp., Iridium Communications Inc., KVH Industries Inc., Motorola Solutions, Inc., Newtec, Nokia Networks, NovelSat, Orbcomm, Inc., Paradise Datacom LLC (a subsidiary of Teledyne Technologies, Inc.), Solacom Technologies Inc., Telenav, Inc., Tom Tom NV, ViaSat, Inc. and West Corporation.
Government Solutions
- Aethercomm, Inc., CACI International Inc., CalAmp Corp., DB Control Corp. (a subsidiary of HEICO Corp.), DXC Technology, Empower RF Systems, Inc., General Dynamics Corporation, Harris Corporation, L3 Technologies, Inc., Mercury Systems, Inc., NeuStar, Inc., Northrop Grumman Corporation, Orbital ATK, Inc., Raytheon Company, Teledyne Technologies, Inc., The KEYW Holding Corporation, Ultra Electronics Holdings PLC and ViaSat, Inc.
We believe that competition in all of our markets is based primarily on technology innovation, product performance, reputation, delivery times, customer support and price. Due to our proprietary know-how, we believe we have the ability to develop, produce and deliver products and services on a cost-effective basis faster than many of our competitors.
13
Employees
At
July 31, 2018
, we had 1,852 employees (including temporary employees and contractors), 1,109 of whom were engaged in production and production support, 391 in research and development and other engineering support, and 352 in marketing and administrative functions. None of our U.S. based employees are represented by a labor union. We believe that our employee relations are good.
U.S. Government Contracts and Security Clearances
The U.S. government operates on an October-to-September fiscal year. Generally, in February of each year, the President of the United States presents to the U.S. Congress ("Congress") the proposed budget for the upcoming fiscal year and from February through September of each year, the appropriations and authorization committees of Congress review the President’s budget proposals and establish the funding levels for the upcoming fiscal year. Once these levels are enacted into law, the Executive Office of the President administers the funds to the agencies. Thereafter, we can receive orders pursuant to sole-source or competitively awarded contracts, which we describe below.
The U.S. government may be unable to complete its budget process before the end of any given government fiscal year and when the fiscal budget is not approved in a timely manner, the U.S. government is required either to shut down or be funded pursuant to a so-called "continuing resolution" that authorizes agencies of the U.S. government to continue operations but does not authorize new spending initiatives, either of which could result in reduced or delayed orders or payments for products and services we provide.
Sole-source contracts are generally awarded to a single contractor without a formal competition when a single contractor is deemed to have an expertise or technology superior to that of competing contractors or when there is an urgent need by the U.S. government that cannot wait for a full competitive process. Potential suppliers compete informally through research and development and marketing efforts. Competitively-bid contracts are awarded based on a formal proposal evaluation established by the procuring agency and interested contractors prepare bids. Competitively-bid contracts are awarded after a formal bid and proposal competition among suppliers.
The U.S. government has a stated policy direction to reduce the number of sole-source contract awards across all procuring agencies. In addition, the U.S. government is increasing the use of multiple-award IDIQ contracts to increase its procurement options. IDIQ contracts allow the U.S. government to select a group of eligible contractors for the same program. When the government awards IDIQ contracts to multiple bidders under the same program, a company that has already competed to be selected as a participant in the program must subsequently compete for individual delivery orders. As a result of this U.S. government shift toward multiple award IDIQ contracts, we expect to face greater competition for future U.S. government contracts and, at the same time, greater opportunities for us to participate in program areas that we do not currently participate in.
As a U.S. government contractor and subcontractor, we are subject to a variety of rules and regulations, such as the Federal Acquisition Regulations ("FAR"). Individual agencies can also have acquisition regulations. For example, the Department of Defense implements the FAR through the Defense Federal Acquisition Regulation supplement (commonly known as "DFARs"). For all Federal government entities, the FAR regulates the phases of any product or service acquisition, including: acquisition planning, competition requirements, contractor qualifications, protection of source selection and vendor information, and acquisition procedures. In addition, the FAR addresses the allowability of supplier costs, while Cost Accounting Standards address how those costs can be allocated to contracts. The FAR also subjects suppliers to audits and other government reviews. These reviews cover issues such as cost, performance and accounting practices relating to our contracts. The government may challenge a supplier's costs and fees. Suppliers are also required to comply with the National Industrial Security Program Operating Manual which relates to requirements regarding classified materials and programs. Suppliers who do not comply with these various regulations may lose and/or become ineligible for facility security clearances and/or participation in classified programs.
Under firm fixed-price contracts, we perform for an agreed-upon price and we can derive benefits from cost savings, but bear the risk of cost overruns. Our cost-reimbursable type contracts typically provide for reimbursement of allowable costs incurred plus a negotiated fee. Cost-plus-incentive-fee orders typically provide for sharing with the U.S. government savings accrued from orders performed for less than the target costs and costs incurred in excess of targets up to a negotiated ceiling price (which is higher than the target cost), and for the supplier to carry the entire burden of costs exceeding the negotiated ceiling price.
14
In fiscal
2018
,
$202.7 million
or
35.5%
of our consolidated net sales were to the U.S. government (including sales to prime contractors to the U.S. government). Of this amount, firm fixed-price and cost-reimbursable type contracts (including fixed-fee, incentive-fee and time and material type contracts) accounted for approximately
$152.5 million
and
$50.2 million
, respectively.
15
Regulatory Matters
In addition to the rules and regulations that pertain to us as a U.S. government contractor and subcontractor, we are also subject to a variety of local, state and federal governmental regulations.
Our products that are incorporated into wireless communications systems must comply with various government regulations, including those of the FCC. Our manufacturing facilities, which may store, handle, emit, generate and dispose of hazardous substances that are used in the manufacture of our products, are subject to a variety of local, state and federal regulations, including those issued by the Environmental Protection Agency. Our products are also subject to European Union directives related to the recycling of electrical and electronic equipment.
Our international sales are subject to U.S. and foreign regulations such as the Arms Export Control Act, the International Emergency Economic Powers Act ("IEEPA"), the International Traffic in Arms Regulations ("ITAR"), the Export Administration Regulations ("EAR") and the trade sanctions laws and regulations administered by the U.S. Department of the Treasury’s Office of Foreign Assets Control ("OFAC") as well as other applicable laws relating to trade, export controls and foreign corrupt practices, the violation of which could adversely affect our operations. We cannot be certain that we will be able to obtain necessary export licenses, and such failure would materially adversely affect our operations. If we are unable to receive appropriate export authorizations in the future, we may be prohibited from selling our products and services internationally, which may limit our sales and have a material adverse effect on our business, results of operations and financial condition. We must comply with all applicable export control laws and regulations of the U.S. and other countries. Certain of our products and systems may require licenses from U.S. government agencies for export from the U.S., and some of our products are not permitted to be exported. In addition, in certain cases, U.S. export controls also severely limit unlicensed technical discussions, such as discussions with any persons who are not U.S. citizens or permanent residents. As a result, in cases where we may need an export license, our ability to compete against a non-U.S. domiciled foreign company that may not be subject to the same U.S. laws may be materially adversely affected. In addition, we are subject to the Foreign Corrupt Practices Act ("FCPA") and other local laws that generally bar bribes or unreasonable gifts to foreign governments or officials. Violations of these laws or regulations could result in significant sanctions, including disgorgement of profits, fines, and criminal sanctions against us, our officers, our directors, or our employees, more onerous compliance requirements, more extensive debarments from export privileges or loss of authorizations needed to conduct aspects of our international business. A violation of any of the regulations enumerated above could materially adversely affect our business, financial condition and results of operations. Additionally, changes in regulatory requirements which could further restrict our ability to deliver services to our international customers, including the addition of a country to the list of sanctioned countries under the IEEPA or similar legislation could negatively impact our business.
In the past, we have self-reported violations of ITAR to the U.S. Department of State, Directorate of Defense Trade Controls ("DDTC") and had an ITAR compliance audit performed by an independent auditor at the request of the DDTC. Although the audit found no violations of ITAR, we committed to the DDTC that we would enhance and maintain certain policies and procedures and we have established a company-wide Office of Trade Compliance.
In October 2014, we disclosed to OFAC that we learned during a self-assessment of our export transactions that a shipment of modems sent to a Canadian customer by Comtech EF Data Corp. was incorporated into a communication system, the ultimate end user of which was the Sudan Civil Aviation Authority. The sales value of this equipment was approximately $288,000. At the time of shipment, OFAC regulations prohibited U.S. persons from doing business directly or indirectly with Sudan. In late 2015, OFAC issued an administrative subpoena seeking further information about the disclosed transaction. We have responded to the subpoena, including alerting OFAC to Comtech’s repair of three modems for a customer in Lebanon who may have rerouted the modems from Lebanon to Sudan without the required U.S. licensing authorization. Subsequently, in October 2017, U.S. sanctions with respect to Sudan were revoked. Consistent with the revocation of the Sudan Sanction Regulations ("SSR"), shipments to the Sudan Civil Aviation Authority by U.S. persons are now permissible. We are not able to predict when OFAC will complete its review, nor whether it will take any enforcement action against us in light of the recent revocation of the SSR. If OFAC determines that we have violated U.S. trade sanctions, civil and criminal penalties could apply, and we may suffer reputational harm. Even though we take precautions to avoid engaging in transactions that may violate U.S. trade sanctions, those measures may not be effective in every instance.
16
In May 2018, we were informed by the Office of Export Enforcement ("OEE") of the Department of Commerce ("DoC") that it was forwarding to the DoC's Office of Chief Counsel, the results of its audit of international shipments by Comtech Xicom Technology, Inc. for further review and possible determination of an administrative penalty. We fully cooperated with the OEE in their audit and, based on our self-assessment of the approximately 7,800 individual transactions audited, have determined that six (6) transactions may not have been fully in compliance with the EAR. These six (6) items, for which export licenses were not obtained, were either spares or repaired power amplifier subassembly components valued at less than $100,000 (in aggregate) and were shipped to Brazil, Italy, Russia, Thailand and the United Arab Emirates. The EAR provides an exception to the requirement to obtain an export license for the replacement of a defective or damaged component. During our self-assessment, we determined that we inadvertently did not obtain export licenses for the spares, or had evidence of the return or destruction of the defective or damaged components necessary to authorize our use of the export license exception for the replacements. Since discovering this issue, we have implemented additional controls and procedures and have increased awareness of these specific export requirements throughout the Company to help avoid similar occurrences in the future. Administrative penalties under the EAR can range from a warning letter to a denial of export privileges. Given the lapsed legal status of the Export Administration Act ("EAA") itself, administrative penalties under the EAR are currently determined pursuant to the IEEPA, which can reach the greater of twice the amount of the transaction that is the basis of the violation or approximately $300,000 per violation. We have not recorded an accrual related to a possible administrative penalty and continue to work cooperatively with the OEE.
Our financial reporting, corporate governance, public disclosure and compliance practices are governed by laws such as the Sarbanes-Oxley Act of 2002, Dodd-Frank Act of 2010, and rules and regulations issued by the SEC. The SEC has adopted rules which require, among other things, public companies to conduct certain inquiries to determine whether or not Conflict Minerals (as that term is defined in the SEC rules) that are necessary to the functionality of their manufactured products or their product's production processes originated in a Covered Country (as that term is defined in the SEC rules) and ultimately file a report with the SEC. Conflict Minerals are widely used in many industries, including the telecommunications industry and almost all of our products include component parts purchased from third party suppliers and we must rely heavily on information received from suppliers to determine the origin of those materials. We have implemented a due diligence program consistent with the Organization for Economic Co-operation and Development guidelines to collect information concerning the country of origin of Conflict Minerals and in that regard, have adopted a policy that requires our suppliers (both public and private) to commit to a code of conduct relating to the responsible sourcing of minerals and to establish a policy to reasonably assure that the products they manufacture do not contain Conflict Minerals that originated in a Covered Country. Efforts to comply with this SEC rule have resulted in additional costs to us and, we believe, to our suppliers. As such, the availability of raw materials used in our operations could be negatively impacted and/or raw material prices could increase. Further, if we are unable to certify that our products are conflict free, we may face challenges with our customers, which could place us at a competitive disadvantage and could harm our reputation.
Recently, there has been a number of laws and regulations enacted that affect companies conducting business on the Internet, including the European General Data Protection Regulation ("GDPR"). The GDPR imposes certain privacy related requirements on companies that receive or process personal data of residents of the European Union that are currently different than those in the United States and include significant penalties for non-compliance. Similarly, there are a number of legislative proposals in the United States, at both the federal and state level, that could impose new obligations in areas affecting our business, such as liability for copyright infringement by third parties. In addition, some countries are considering or have passed legislation implementing data protection requirements or requiring local storage and processing of data or similar requirements that could increase the cost and complexity of delivering our services. Our costs to comply with the GDPR as well any other similar laws and regulations that emerge may negatively impact our business.
17
Forward-Looking Statements
The following describes major risks to our business and should be considered carefully. Any of these factors could significantly and negatively affect our business, prospects, financial condition, or operating results, which could cause the trading prices of our equity securities to decline. The risks described below are not the only risks we may face. Additional risks and uncertainties not presently known to us, or risks that we currently consider immaterial, could also negatively affect us.
Risks Related to our Business
Our fiscal 2019 business outlook is difficult to forecast and operating results are subject to significant fluctuations and are likely to be volatile.
Customer orders (sometimes referred to herein as bookings), net sales and operating results may vary significantly from period to period due to a number of factors including: sales mix; fluctuating market demand; price competition; new product introductions by our competitors; changing customer partnering procurement strategies; fluctuations in foreign currency exchange rates; unexpected changes in the timing of delivery of components or subsystems; the financial performance of acquisitions; new accounting standards such as those relating to acquisitions, revenue recognition and leasing; political instability; regulatory developments; changes in income tax rates or tax credits; the price and expected volatility of our stock (which will impact, among other items, the amount of stock-based compensation expense we may record); and general global economic conditions.
We have experienced, and will experience in the future, significant fluctuations in bookings, net sales and operating results from period to period. For example, a sudden change in global economic conditions could have an immediate impact on a large portion of our Commercial Solutions segment net sales, a large amount of which are derived from products such as satellite earth station equipment and certain traveling wave tube amplifier products that generally have short lead times. Similarly, sales of certain of our enterprise technology solutions and safety and security technology solutions are subject to sudden changes in wireless carrier procurement strategies, including decisions to sole-source such solutions. As a result of any such conditions or changes, bookings and backlog related to these solutions are extremely sensitive to short-term fluctuations in customer demand.
A large portion of our Government Solutions segment net sales are derived in part from large U.S. Government programs or large foreign government opportunities that are subject to lengthy sales cycles (including funding requirements) and are therefore difficult to predict. In addition, we continue to execute on our Government Solutions segment's shift away from bidding on large commodity service contracts and toward pursuing contracts for our niche products with higher margins. Although we believe this tactical shift will ultimately yield higher operating income, in dollars, as well as higher operating income as a percentage of net sales, this shift could result in fluctuations in our business, results of operations and financial condition that we may not be able to accurately forecast.
Although the integration of the fiscal 2016 TeleCommunication Systems, Inc. ("TCS") acquisition into our business is largely complete, ongoing activity may continue to divert our resources and management's attention.
In February 2016, in connection with the acquisition of TCS, we reorganized our business into two reportable operating segments: Commercial Solutions and Government Solutions and integrated TCS businesses into each segment. Although this integration is largely complete, we may further change our business and organizational structure and streamline and further consolidate certain business processes to achieve greater operating efficiencies.
The acquisition of TCS has significantly expanded the types of products and services that we sell, expanded the businesses in which we engage, and increased the number of facilities we operate, thereby presenting us with significant challenges in managing the substantial increase in scale of our business. These challenges include the integration of a large number of systems, both operational and administrative. We have also made a number of management changes in certain TCS product lines. We may not be able to successfully manage these organizational changes and the unanticipated disruption to our business that might result from these changes could have a material adverse effect on our business, results of operations and financial condition. In addition, the diversion of our management’s attention to these matters and away from other business concerns could have a material adverse effect on our business, results of operations and financial condition.
The ongoing success of the TCS acquisition will depend on maintaining the efficiencies and cost savings we have achieved to-date, and no assurances can be given that we will be able to continue to do so.
18
If global economic business and political conditions deteriorate as compared to the current environment, it could have a material adverse impact on our business outlook and our business, operating results and financial condition.
For the past several years, many of the end-markets for our products and services have been significantly impacted by adverse global economic conditions. For example, many of our international end-customers are located in emerging and developing countries that continue to undergo sweeping economic and political changes. Many governments around the world have also cut their spending budgets and are under pressure to further reduce them. In recent years, global oil and natural gas prices plunged, significantly impairing the ability of our customers in the oil and gas producing regions of the world to invest in telecommunications products and infrastructure. Additionally, the relative strength of the U.S. dollar against many international currencies, as compared to several years ago, has negatively impacted the purchasing power for many of our international end-customers because virtually all of our sales are denominated in U.S. dollars. We generate significant sales from Brazil, Russia, India and China as well as other emerging and developing countries.
The business environment in the past several years resulted in the suppression of end-market demand for many of our satellite earth station products. Although economic conditions have improved, we continue to believe that nearly all of our customers are challenged by capital and operating budget constraints and a difficult credit environment. The impact, severity and duration of these conditions are impossible to predict with precision. Many of our international customers (including our Middle Eastern and African customers) rely on European bank financing to procure funding for large systems, many of which include our equipment. We believe that European financing has been and continues to be difficult to obtain. Volatility of interest rates may cause our customers to be reluctant to spend funds required to purchase our equipment or projects could be postponed or canceled.
In 2016, the U.K. held a referendum in which voters approved an exit from the European Union, commonly referred to as "Brexit." As a result of the referendum, it is expected that the British government will negotiate the terms of the U.K.’s future relationships with European Union member states. Adverse consequences concerning Brexit or the European Union could include deterioration in global economic conditions, instability in global financial markets, political uncertainty, volatility in currency exchange rates, or adverse changes in the cross-border agreements currently in place, any of which could have an adverse impact on our financial results in the future.
In the past, our overall business has not been immune from adverse economic conditions. Although business conditions improved in fiscal 2018 as compared to prior years and were relatively strong, if U.S. or global economic conditions deteriorate, or political conditions become unstable, or additional economic sanctions are imposed on some of our end-customers, it could adversely impact our business in a number of ways, including:
|
•
|
Difficulty in forecasting our results of operations
- It is difficult to accurately forecast our results of operations during periods of adverse conditions as we cannot predict the severity or the duration of such conditions or the impact it could have on our current and prospective customers. If our current or prospective customers materially postpone, reduce or even forgo purchases of our products and services to a greater extent than we anticipate, our business outlook will prove to be inaccurate.
|
|
•
|
Additional reductions in telecommunications equipment and systems spending may occur
- In the past, our businesses have been negatively affected by uncertain economic environments in the overall market and, more specifically, in the telecommunications sector. Our customers have reduced their budgets for spending on telecommunications equipment and systems and in some cases postponed or reduced the purchase of our products and systems. In the future, our customers may again reduce their spending on telecommunications equipment and systems which would negatively impact both of our operating segments. If this occurs, it would adversely affect our business outlook, net sales, profitability and the recoverability of our assets, including intangible assets such as goodwill.
|
|
•
|
Our customers may not be able to obtain financing
- Although many of our products are relatively inexpensive when compared to the total systems or networks that they are incorporated into, our sales are affected by our customers' ability to obtain the financing they may require to build out their total systems or networks and fund ongoing operations. Many of our emerging market customers obtain financing for network build-outs from European commercial banks and/or governments. Our customers' inability to obtain sufficient financing would adversely affect our net sales. In addition, if the economic environment and lack of financing results in insolvencies for our customers, it would adversely impact the recoverability of our accounts receivable which would, in turn, adversely impact our results of operations.
|
19
We have incurred indebtedness under a Secured Credit Facility, and may not be able to service that debt in the future and we must maintain compliance with various covenants that impose restrictions on our business.
We have a Secured Credit Facility, as amended June 6, 2017, which provides for borrowing availability of up to $400.0 million and is secured by substantially all of our assets. As of
July 31, 2018
, we had
$168.7 million
of borrowings under the Secured Credit Facility, as amended, of which
$120.1 million
is from an original
$250.0 million
Term Loan A and
$48.6 million
of drawings under a $150.0 million revolving credit line.
The Secured Credit Facility, as amended, requires quarterly payments and repayment in full by February 23, 2021. If we do not have sufficient funds to repay our debt when due, it may be necessary to refinance our debt through additional debt or equity financings. If, at the time of any refinancing, prevailing interest rates or other factors result in higher interest rates on such refinancing, increases in interest expense could have a material adverse effect on our business, results of operations and financial condition.
Our Secured Credit Facility, as amended, contains various affirmative and negative covenants that may restrict our ability to, among other things, permit liens on our property, change the nature of our business, transact business with affiliates and/or merge or consolidate with any other person or sell or convey certain of our assets to any one person.
As of July 31, 2018, our Leverage Ratio (as defined in the Secured Credit Facility, as amended) was
2.19
x trailing twelve month ("TTM") Consolidated EBITDA (as defined in the Secured Credit Facility, as amended) compared to the maximum allowable Leverage Ratio of
3.00
x TTM Consolidated EBITDA.
Our Fixed Charge Coverage Ratio (as defined in the Secured Credit Facility, as amended) as of July 31, 2018 was
2.33
x compared to the minimum required Fixed Charge Coverage Ratio of
1.25
x.
Given our expected future business performance, we anticipate maintaining compliance with the terms and financial covenants in our Secured Credit Facility, as amended, for the foreseeable future. However, there can be no assurance that we will be able to meet such covenants. Our ability to comply with these provisions may be affected by events beyond our control. Failure to comply with these covenants could result in an event of default, which, if not cured or waived, could accelerate our repayment obligations. Our substantial debt obligations could impede, restrict or delay the implementation of our business strategy or prevent us from entering into transactions that would otherwise benefit our business. For example:
|
•
|
we may be required to dedicate a substantial portion of our cash flows from operations to payments on our indebtedness, thereby reducing the availability of our cash flows for other purposes, including business development efforts, capital expenditures, dividends or strategic acquisitions;
|
|
•
|
if we are not able to generate sufficient cash flows to meet our substantial debt service obligations or to fund our other liquidity needs, we may have to take actions such as selling assets or raising additional equity or reducing or delaying capital expenditures, strategic acquisitions, investments and joint ventures, or restructuring our debt;
|
|
•
|
we may not be able to fund future working capital, capital investments and other business activities;
|
|
•
|
we may not be able to pay dividends or make certain other distributions;
|
|
•
|
we may become more vulnerable in the event of a downturn in our business or a worsening of general economic or industry-specific conditions; and
|
|
•
|
our flexibility in planning for, or reacting to, changes in our business and industry may be limited, thereby placing us at a competitive disadvantage compared to our competitors that have less indebtedness.
|
20
Future acquisitions of companies and investments could prove difficult to integrate, disrupt our business, dilute stockholder value or adversely affect operating results or the market price of our common stock.
We expect to continue to consider future acquisitions and investments as part of our growth plans. Future acquisitions or investments may result in the use of significant amounts of cash, potentially dilutive issuances of equity securities, incurrence of large amounts of debt, increases to amortization expense and future write-offs of intangibles acquired. Acquisitions and investments involve risks that include failing to:
|
•
|
properly evaluate the technology;
|
|
•
|
accurately forecast the financial impact of the transaction, including accounting charges and transaction expenses;
|
|
•
|
integrate the technologies, products and services, research and development, sales and marketing, support and other operations;
|
|
•
|
integrate and retain key management personnel and other key employees;
|
|
•
|
retain and cross-sell to acquired customers; and
|
|
•
|
combine potentially different corporate cultures.
|
Acquisitions and investments could also:
|
•
|
divert management’s attention away from the operation of our businesses;
|
|
•
|
result in significant goodwill and intangibles write-offs in the event an acquisition or investment does not meet expectations; and
|
|
•
|
increase expenses, including expenses of managing the growth of such acquired businesses.
|
There can be no assurance that any future acquisition or investment will be successful within the anticipated time frame, or at all, will be as valuable as the amount we eventually pay to acquire it, and will not adversely affect our business, results of operations or financial condition. In addition, if we consummate future acquisitions using our equity securities or securities convertible into our equity securities, existing stockholders may be diluted, which could have a material adverse effect on the market price of our common stock.
Our business is highly dependent on the budgetary decisions of our government customers, including the U.S. government (including prime contractors to the U.S. government), and changes in the U.S. government’s fiscal policies or budgetary priorities may have a material adverse effect on our business, operating results and financial condition.
During our fiscal years ended July 31,
2018
,
2017
and
2016
, sales to the U.S. government (including sales to prime contractors to the U.S. government) were
$202.7 million
, $180.0 million and $167.5 million or
35.5%
, 32.7% and 40.8% of our consolidated net sales, respectively. In addition, a large portion of our existing backlog consists of orders related to U.S. government contracts and our Business Outlook for Fiscal 2019 and beyond depends, in part, on new orders from the U.S. government, which is currently under extreme budgetary pressures.
We rely on particular levels of U.S. government spending on our communication solutions, and our receipt of future orders depends in large part on continued funding by the U.S. government for the programs in which we participate. These spending levels are not generally correlated with any specific economic cycle, but rather follow the cycle of general public policy and political support for this type of spending. Government contracts are conditioned upon the continuing availability of congressional appropriations and Congress’s failure to appropriate funds, or Congress’s actions to reduce or delay spending on, or reprioritize its spending away from, U.S. government programs which we participate in, could negatively affect our results of operations. Because many of the items we sell to the U.S. government are included in large programs realized over a period of several years, it is difficult, if not impossible, to determine specific amounts that are or will be appropriated for our products and services. As such, our assessments relating to the impact of changes in U.S. government spending may prove to be incorrect.
21
The federal debt limit continues to be actively debated as plans for long-term national fiscal policy are discussed. The outcome of these debates could have a significant impact on defense spending broadly and programs we support in particular. The failure of Congress to approve future budgets and/or increase the debt ceiling of the U.S. on a timely basis could delay or result in the loss of contracts for the procurement of our products and services and we may be asked or required to continue to perform for some period of time on certain of our U.S. government contracts, even if the U.S. government is unable to make timely payments. A decrease in Department of Defense or Department of Homeland Security expenditures, the elimination or curtailment of a material program in which we are involved, or changes in payment patterns of our customers as a result of changes in U.S. government spending could have a material adverse effect on our business, results of operations and financial condition. Considerable uncertainty exists regarding how budget reductions will be applied and what challenges the reductions will present.
Ultimately the U.S. government may be unable to timely complete its budget process or fully agree upon spending priorities. If the U.S. government budget process results in a prolonged shutdown or prolonged operation under a continuing resolution, we may experience delayed orders, delayed payments and declines in net sales, profitability and cash flows. We may experience related supply chain delays, disruptions or other problems associated with financial constraints faced by our suppliers and subcontractors. All of the aforementioned conditions and factors could, in the aggregate, have a material adverse effect on our business, results of operations and financial condition. Additionally, cost cutting, efficiency initiatives, reprioritization, other affordability analyses, and changes in budgetary priorities by our governmental customers, including the U.S. government, could adversely impact both of our operating segments. We are unable to predict the impact these or similar events could have on our business, financial position, results of operations or cash flows.
Our contracts with the U.S. government are subject to unique business, commercial and government audit risks.
We depend on the U.S. government for a significant portion of our revenues. Our contracts with the U.S. government are subject to unique business and commercial risks, including:
|
•
|
unexpected contract or project terminations or suspensions;
|
|
•
|
unpredictable order placements, reductions, delays or cancellations;
|
|
•
|
higher than expected final costs, particularly relating to software and hardware development, for work performed under contracts where we commit to specified deliveries for a fixed-price; and
|
|
•
|
unpredictable cash collections of unbilled receivables that may be subject to acceptance of contract deliverables by the customer and contract close out procedures, including government audit and approval of final indirect rates.
|
Although we take steps to mitigate our risk with respect to contracts with the U.S. government, we may not be able to do so in every instance for any of the following reasons, among others:
|
•
|
Our U.S. government contracts can easily be terminated by the U.S. government
- Our U.S. government contracts can be terminated by the U.S. government for its convenience or upon an event of default by us. Termination for convenience provisions provide us with little to no recourse related to: our potential recovery of costs incurred or costs committed, potential settlement expenses and hypothetical profit on work completed prior to termination.
|
|
•
|
Our U.S. government contracts are subject to funding by the U.S. Congress
- U.S. government contracts are conditioned upon the continuing approval by Congress of the necessary funding. Congress usually appropriates funds for a given program on a fiscal year basis even though contract performance may take more than one year. Consequently, at the beginning of a major program, the contract may not be fully funded, and additional monies are normally committed to the contract only if, and when, appropriations are made by Congress for future fiscal years. Delays or changes in funding can impact the timing of awards or lead to changes in program content. We obtain certain of our U.S. government contracts through a competitive bidding process. There can be no assurance that we will win additional contracts or that actual contracts that are awarded will ultimately be profitable.
|
|
•
|
We can be disqualified as a supplier to the U.S. government
- As a supplier to the U.S. government, we must comply with numerous regulations, including those governing security, contracting practices and classified information. Failure to comply with these regulations and practices could result in fines being imposed against us or our suspension for a period of time from eligibility for bidding on, or for award of, new government contracts. If we are disqualified as a supplier to government agencies, we would lose most, if not all, of our U.S. government customers and revenues from sales of our products would decline significantly.
|
22
In addition, all of our U.S. government contracts can be audited by the Defense Contract Audit Agency ("DCAA") and other U.S. government agencies and we can be subject to penalties arising from post-award contract audits (sometimes referred to as a Truth in Negotiations Act or "TINA" audit) or cost audits in which the value of our contracts may be reduced. If costs are found to be improperly allocated to a specific contract, those costs will not be reimbursed, and any such costs already reimbursed would be required to be refunded. Although we record contract revenues based upon costs we expect to realize upon final audit, we cannot predict the outcome of any such future audits and adjustments and we may be required to materially reduce our revenues or profits upon completion and final negotiation of audits. Negative audit findings could also result in termination of a contract, forfeiture of profits, suspension of payments, fines and suspension or debarment from U.S. government contracting or subcontracting for a period of time.
Our dependence on sales to international customers exposes us to unique business, commercial and export compliance audit risks.
Sales for use by international customers (including sales to U.S. companies for inclusion in products that will be sold to international customers) represented approximately
25.6%
, 28.4% and 30.0% of our consolidated net sales for the fiscal years ended July 31,
2018
,
2017
and
2016
, respectively, and we expect that international sales will continue to be a significant portion of our consolidated net sales for the foreseeable future. These sales expose us to certain risks, including barriers to trade, fluctuations in foreign currency exchange rates (which may make our products less price-competitive), political and economic instability, exposure to public health epidemics, availability of suitable export financing, tariff regulations, and other U.S. and foreign regulations that may apply to the export of our products. Although we take steps to mitigate our risk with respect to international sales, we may not be able to do so in every instance for any of the following reasons, among others:
|
•
|
We may not be able to continue to structure our international contracts to reduce risk
- We attempt to reduce the risk of doing business in foreign countries by seeking subcontracts with large systems suppliers, contracts denominated in U.S. dollars, advance or milestone payments and irrevocable letters of credit in our favor. However, we may not be able to reduce the economic risk of doing business in foreign countries in all instances. In such cases, billed and unbilled receivables relating to international sales are subject to increased collectability risk and may result in significant write-offs, which could have a material adverse effect on our business, results of operations and financial condition. In addition, foreign defense contracts generally contain provisions relating to termination at the convenience of the government.
|
|
•
|
We rely on a limited number of international sales agents
- In some countries, we rely upon one or a small number of sales agents, exposing us to risks relating to our contracts with, and related performance of, those agents. We attempt to reduce our risk with respect to sales agents by establishing additional foreign sales offices where it is practical and by engaging, where practicable, more than one independent sales representative in a territory. It is our policy to require all sales agents to operate in compliance with applicable laws, rules and regulations. Violations of any of these laws, rules or regulations, and other business practices that are regarded as unethical, could interrupt the sales of our products and services, result in the cancellation of orders or the termination of customer relationships, and could damage our reputation, any of which developments could have a material adverse effect on our business, results of operations and financial condition.
|
|
•
|
We currently price virtually all of our products in U.S. dollars
- Today, virtually all of our sales are denominated in U.S. dollars. Over the last few years, the U.S. dollar has strengthened significantly against many international currencies. As such, many of our international customers experienced a drop in their purchasing power as it relates to their ability to purchase our products. To-date, we have not materially changed our selling prices and have experienced lower sales volumes. Although monetary conditions in fiscal 2018 improved as compared to recent years, it is possible, that the U.S. dollar will strengthen from current levels against many international currencies. If this occurs, our customers may reduce their spending or postpone purchases of our products and services to a greater extent than we currently anticipate which could have a material adverse effect on our business, results of operations and financial condition.
|
|
•
|
We must comply with all applicable export control laws and regulations of the U.S. and other countries
- Certain of our products and systems may require licenses from U.S. government agencies for export from the U.S., and some of our products are not permitted to be exported. In addition, in certain cases, U.S. export controls also severely limit unlicensed technical discussions, such as discussions with any persons who are not U.S. citizens or permanent residents. As a result, in cases where we may need a license, our ability to compete against a non-U.S. domiciled foreign company that may not be subject to the same U.S. laws may be materially adversely affected. U.S. laws and regulations applicable to us include the Arms Export Control Act, the International Emergency Economic Powers Act ("IEEPA"), the ITAR, the EAR and the trade sanctions laws and regulations administered by the U.S. Treasury Department's Office of Foreign Asset Control ("OFAC").
|
23
|
•
|
We must comply with the FCPA and similar laws elsewhere
- We are subject to the FCPA and other foreign laws prohibiting corrupt payments to government officials, which generally bar bribes or unreasonable gifts to foreign governments or officials. Violations of these laws or regulations could result in significant sanctions, including disgorgement of profits, fines, criminal sanctions against us, our officers, our directors, or our employees, more onerous compliance requirements, more extensive debarments from export privileges or loss of authorizations needed to conduct aspects of our international business. A violation of any of the regulations enumerated above could materially adversely affect our business, financial condition and results of operations. Although we have implemented policies and procedures designed to ensure compliance with these laws and regulations, there can be no assurance that our employees, contractors, agents, or subsidiaries will not violate our policies. Additionally, changes in regulatory requirements which could restrict our ability to deliver services to our international customers, including the addition of a country to the list of sanctioned countries under the IEEPA or similar legislation could negatively impact our business. For the fiscal years ended July 31, 2018, 2017 and 2016, we have conducted virtually no business with states designated as sponsors of terrorism.
|
|
•
|
We must maintain a company-wide Office of Trade Compliance
- In the past, we have self-reported violations of ITAR to the DDTC and had an ITAR compliance audit performed by an independent auditor at the request of the DDTC. Although the audit found no violations of ITAR, we committed to the DDTC that we would enhance and maintain certain policies and procedures and we have established a company-wide Office of Trade Compliance.
|
In October 2014, we disclosed to OFAC that we learned during a self-assessment of our export transactions that a shipment of modems sent to a Canadian customer by Comtech EF Data Corp. was incorporated into a communication system, the ultimate end user of which was the Sudan Civil Aviation Authority. The sales value of this equipment was approximately $288,000. At the time of shipment, OFAC regulations prohibited U.S. persons from doing business directly or indirectly with Sudan. In late 2015, OFAC issued an administrative subpoena seeking further information about the disclosed transaction. We have responded to the subpoena, including alerting OFAC to Comtech’s repair of three modems for a customer in Lebanon who may have rerouted the modems from Lebanon to Sudan without the required U.S. licensing authorization. Subsequently, in October 2017, U.S. sanctions with respect to Sudan were revoked. Consistent with the revocation of the Sudan Sanction Regulations ("SSR"), shipments to the Sudan Civil Aviation Authority by U.S. persons are now permissible. We are not able to predict when OFAC will complete its review, nor whether it will take any enforcement action against us in light of the recent revocation of the SSR. If OFAC determines that we have violated U.S. trade sanctions, civil and criminal penalties could apply, and we may suffer reputational harm. Even though we take precautions to avoid engaging in transactions that may violate U.S. trade sanctions, those measures may not be effective in every instance.
In May 2018, we were informed by the Office of Export Enforcement ("OEE") of the Department of Commerce ("DoC") that it was forwarding to the DoC's Office of Chief Counsel, the results of its audit of international shipments by Comtech Xicom Technology, Inc. for further review and possible determination of an administrative penalty. We fully cooperated with the OEE in their audit and, based on our self-assessment of the approximately 7,800 individual transactions audited, have determined that six (6) transactions may not have been fully in compliance with the EAR. These six (6) items, for which export licenses were not obtained, were either spares or repaired power amplifier subassembly components valued at less than $100,000 (in aggregate) and were shipped to Brazil, Italy, Russia, Thailand and the United Arab Emirates. The EAR provides an exception to the requirement to obtain an export license for the replacement of a defective or damaged component. During our self-assessment, we determined that we inadvertently did not obtain export licenses for the spares, or had evidence of the return or destruction of the defective or damaged components necessary to authorize our use of the export license exception for the replacements. Since discovering this issue, we have implemented additional controls and procedures and have increased awareness of these specific export requirements throughout the Company to help avoid similar occurrences in the future. Administrative penalties under the EAR can range from a warning letter to a denial of export privileges. Given the lapsed legal status of the Export Administration Act ("EAA") itself, administrative penalties under the EAR are currently determined pursuant to the IEEPA, which can reach the greater of twice the amount of the transaction that is the basis of the violation or approximately $300,000 per violation. We have not recorded an accrual related to a possible administrative penalty and continue to work cooperatively with the OEE.
24
|
•
|
We may be subject to future export compliance audits
- We continue to implement policies and procedures to ensure that we comply with all applicable export control laws and regulations. We may be subjected to compliance audits in the future that may uncover improper or illegal activities that would subject us to material remediation costs, civil and criminal fines and/or penalties and/or an injunction. In addition, we could suffer serious reputational harm if allegations of impropriety were made against us. Each of these outcomes could, individually or in the aggregate, have a material adverse effect on our business, results of operations and financial condition. The absence of comparable restrictions on competitors in other countries may adversely affect our competitive position. In addition, in order to ship our products into and implement our services in some countries, the products must satisfy the technical requirements of that particular country. If we were unable to comply with such requirements with respect to a significant quantity of our products, our sales in those countries could be restricted, which could have a material adverse effect on our business, results of operations and financial condition.
|
Our investments in recorded goodwill and other intangible assets could be impaired as a result of future business conditions, a deterioration of the global economy or if we change our reporting unit structure.
As of July 31, 2018, goodwill recorded on our Consolidated Balance Sheet aggregated
$290.6 million
. Additionally, as of July 31, 2018, net intangibles recorded on our Consolidated Balance Sheet aggregated
$240.8 million
.
For purposes of reviewing impairment and the recoverability of goodwill and other intangible assets, our Government Solutions and Commercial Solutions segment each constitute a reporting unit and we must make various assumptions in determining their estimated fair values. Reporting units are defined by how our President and Chief Executive Officer ("CEO") manages the business, which includes resource allocation decisions. We may, in the future, change our management approach which in turn may change the way we define our reporting units, as such term is defined by Financial Accounting Standards Board ("FASB") Accounting Standards Codification ("ASC") 350 "
Intangibles - Goodwill and Other.
" A change to our management approach may require us to perform an interim goodwill impairment test and possibly record impairment charges in a future period.
In accordance with FASB ASC 350, we perform a goodwill impairment analysis at least annually (in the first fiscal quarter of each fiscal year), unless indicators of impairment exist in interim periods. If we fail the quantitative assessment of goodwill impairment ("quantitative assessment"), pursuant to our adoption of FASB ASU No. 2017-04 in fiscal 2017, we would be required to recognize an impairment loss equal to the amount that a reporting unit's carrying value exceeded its fair value; however, any loss recognized should not exceed the total amount of goodwill allocated to that reporting unit.
On August 1, 2018 (the first day of our fiscal 2019), we performed our annual quantitative assessment and estimated the fair value of each of our reporting units using a combination of the income and market approaches. Based on our quantitative evaluation, we determined that our Commercial Solutions and Government Solutions reporting units had estimated fair values in excess of their carrying values of at least
42.5%
and
105.5%
, respectively, and concluded that our goodwill was not impaired and that neither of our two reporting units was at risk of failing the quantitative assessment. It is possible that, during fiscal 2019 or beyond, business conditions (both in the U.S. and internationally) could deteriorate from the current state, our current or prospective customers could materially postpone, reduce or even forgo purchases of our products and services to a greater extent than we currently anticipate, or our common stock price could decline. A significant decline in our customers' spending that is greater than we anticipate or a shift in funding priorities may also have a negative effect on future orders, sales, income and cash flows and we might be required to perform a quantitative assessment during fiscal 2019 or beyond. If assumed net sales and cash flow projections are not achieved in future periods or our common stock price significantly declines from current levels, our Commercial Solutions or Government Solutions reporting units could be at risk of failing the quantitative assessment and goodwill and intangibles assigned to the respective reporting units could be impaired.
In any event, we are required to perform the next annual goodwill impairment analysis on August 1, 2019 (the start of our fiscal 2020). If our assumptions and related estimates change in the future, or if we change our reporting unit structure or other events and circumstances change (e.g., a sustained decrease in the price of our common stock (considered on both absolute terms and relative to peers)), we may be required to record impairment charges when we perform these tests, or in other future periods. In addition to our impairment analysis of goodwill, we also review net intangibles with finite lives when an event occurs indicating the potential for impairment. We believe that the carrying values of our net intangibles were recoverable as of July 31, 2018. Any impairment charges that we may record in the future could be material to our results of operations and financial condition.
25
We could be negatively impacted by a systems failure or security breach through cyber-attack, cyber intrusion or otherwise, by other significant disruption of our IT networks or those we operate for certain customers, or third party data center facilities, servers and related systems.
Similar to all companies in our industry, we are under constant cyber-attack and are subject to an ongoing risk of security breaches and disruptions of our IT networks and related systems, including third party data center facilities, whether through actual breaches, cyber-attacks or cyber intrusions via the Internet, malware, computer viruses, attachments to e-mails, persons inside our organization or persons with access to systems inside our organization. Actual security breaches or disruption, particularly through cyber-attack or cyber intrusion, including by computer hackers, foreign governments and cyber terrorists, have increased in recent years and have become more complex. Our IT network and systems, as well as third party data center facilities, have been and, we believe, continue to be under constant attack. We face an added risk of a security breach or other significant disruption to certain of our equipment used on some of our customer’s IT networks and related systems which may involve managing and protecting information relating to national security and other sensitive government functions. We may incur significant costs to prevent and respond to actual breaches, cyber-attacks and other systems disruptions.
As a communications company, and particularly as a government contractor and a provider of 911 systems, we face a heightened risk of a security breach or disruption from actual breaches, cyber-attacks and other threats to gain unauthorized access to our and our customers' proprietary or classified information on our IT networks, third party data center facilities and related systems and to certain of our equipment used on some of our customer’s IT networks and related systems. These types of information and IT networks and related systems are critical to the operation of our business and essential to our ability to perform day-to-day operations, and, in some cases, are critical to the operations of certain of our customers. Although we make significant efforts to maintain the security and integrity of these types of information and IT networks and related systems, and we have implemented various measures to manage the risk of a security breach or disruption, there can be no assurance that our security efforts and measures will be effective or that actual security breaches or disruptions will not be successful or damaging. Even the most well protected information, networks, data centers, systems and facilities remain potentially vulnerable because security breaches, particularly cyber-attacks and intrusions, and disruptions have occurred and will occur again in the future. Techniques used in such breaches and cyber-attacks are constantly evolving and generally are not recognized until launched against a target, and in some cases are designed not to be detected and, in fact, may not be detected. In some cases, the resources of foreign governments may be behind such attacks. Accordingly, we may be unable to anticipate these techniques or to implement adequate security barriers or other preventative measures, and thus it is virtually impossible for us to entirely mitigate this risk.
A security breach or other significant disruption involving these types of information and IT networks and related systems could:
|
•
|
Disrupt the proper functioning of these networks, data center facilities and systems and therefore our operations and/or those of certain of our customers;
|
|
•
|
Result in the unauthorized access to, and destruction, loss, theft, misappropriation or release of, proprietary, confidential, sensitive or otherwise valuable information of ours or our customers, including trade secrets, which others could use to compete against us or for disruptive, destructive or otherwise harmful purposes and outcomes;
|
|
•
|
Compromise national security and other sensitive government functions;
|
|
•
|
Require significant management attention and resources to remedy the damage that results; and
|
|
•
|
Damage our reputation with our customers (particularly agencies of the U.S. government) and the public generally.
|
In addition, the cost of continually defending against cyber-attacks and actual breaches has increased in recent years and future costs and any or all of the foregoing could have a material adverse effect on our business, results of operations and financial condition.
26
The measures we have implemented to secure information we collect and store or enable access to may be breached, which could cause us to breach agreements with our partners and expose us to potential investigation and penalties by authorities and potential claims for contract breach, product liability damages, credits, penalties or termination by persons whose information was disclosed.
We take reasonable steps to protect the security, integrity and confidentiality of the information we collect and store and to prevent unauthorized access to third party data to which we enable access through our products, but there is no guarantee that inadvertent or unauthorized disclosure will not occur or that third parties will not gain unauthorized access despite our efforts. If such unauthorized disclosure or access does occur, we may be required to notify persons whose information was disclosed or accessed under existing and proposed laws. Because the techniques used to obtain unauthorized access, disable or degrade service, or sabotage systems change frequently and are often not recognized until launched against a target, we may be unable to anticipate these techniques or implement adequate preventative measures. We also may be subject to claims of breach of contract for such disclosure, investigation and penalties by regulatory authorities and potential claims by persons whose information was disclosed. If there is a security breach or if there is an inappropriate disclosure of any of these types of information, we could be exposed to investigations, litigation, fines and penalties. Remediation of and liability for loss or misappropriation of end user or employee personal information could have a material adverse effect on our business, results of operations and financial condition. Even if we were not held liable for such event, a security breach or inappropriate disclosure of personal, private or confidential information could harm our reputation and our relationships with current and potential customers and end users. Even the perception of a security risk could inhibit market acceptance of our products and services. We may be required to invest additional resources to protect against damage caused by any actual or perceived disruptions of our services. We may also be required to provide information about the location of an end user’s mobile device to government authorities, which could result in public perception that we are providing the government with intelligence information and deter some end users from using our services. Any of these developments could have a material adverse effect on our business, results of operations and financial condition.
Our U.S. federal, state and foreign tax returns are subject to audit and a resulting tax assessment or settlement could have a material adverse effect on our business, results of operations and financial condition. Significant judgment is required in determining the provision for income taxes.
The final determination of tax examinations and any related litigation could be materially different than what is reflected in historical income tax provisions and accruals. Since November 2017, our federal income tax return for fiscal 2016 has been under audit by the Internal Revenue Service ("IRS"). The audit is ongoing and we are unaware of any proposed adjustments by the IRS. Our federal income tax returns for fiscal 2015 and 2017 are also subject to potential future IRS audit. None of our state income tax returns prior to fiscal 2014 are subject to audit. TCS' federal income tax returns for tax years 2014 and 2015 and the tax period from January 1, 2016 to February 23, 2016 are subject to potential future IRS audit. None of TCS' state income tax returns prior to calendar year 2013 are subject to audit. In addition to income tax audits, TCS is subject to ongoing state and local excise tax audits by the Washington State Department of Revenue. Although adjustments relating to past audits of our federal income tax returns (including the recent audit of fiscal 2014) were immaterial, a resulting tax assessment or settlement for other periods or other jurisdictions that may be selected for future audit could have a material adverse effect on our business, consolidated results of operations and financial condition.
We have significant operations in Arizona, Florida, California, Washington State, New York and other locations which could be materially and adversely impacted in the event of a terrorist attack and government responses thereto or significant disruptions (including natural disasters) to our business.
Terrorist attacks, the U.S. and other governments' responses thereto, and threats of war could materially adversely impact our business, results of operations and financial condition. For example, our 911 hosted location-based services and satellite teleport services operations depend on our ability to maintain our computer and equipment and systems in effective working order, and to protect our systems against damage from fire, natural disaster, power loss, telecommunications failure, sabotage, unauthorized access to our system or similar events.
Although all of our mission-critical systems and equipment are designed with built-in redundancy and security, any unanticipated interruption or delay in our operations or breach of security could have a material adverse effect on our business, results of operations and financial condition. Our property and business interruption insurance may not be adequate to compensate us for any losses that may occur in the event of a terrorist attack, threat, system failure or a breach of security. Insurance may not be available to us at all or, if available, may not be available to us on commercially reasonable terms.
27
We operate a high-volume technology manufacturing center located in Tempe, Arizona. We expect intercompany manufacturing to increase from current levels in future periods and we intend to maximize the use of our high-volume technology manufacturing center by continuing to seek contracts with third parties to outsource a portion of their manufacturing to us. A terrorist attack or similar future event may disrupt our operations or those of our customers or suppliers and may affect the availability of materials needed to manufacture our products or the means to transport those materials to manufacturing facilities and finished products to customers. If a natural disaster or other business interruption occurred with respect to our high-volume technology manufacturing center, we do not have immediate access to other manufacturing facilities and, as a result, our business, results of operations and financial condition would be materially adversely affected.
We design and manufacture our over-the-horizon microwave equipment and systems in Florida, where major hurricanes have occurred in the past, and traveling wave tube amplifiers in Santa Clara, California, an area close to major earthquake fault lines, and also manufacture amplifiers in Melville, New York, an area subject to hurricanes. Additionally, certain of our Commercial Solutions segment activities are conducted in Washington State which is also near a fault line. Our operations in these and other locations (such as in our high-volume technology manufacturing center located in Tempe, Arizona), could be subject to natural disasters or other significant disruptions, including hurricanes, tornadoes, typhoons, tsunamis, floods, earthquakes, fires, water shortages, other extreme weather conditions, medical epidemics, acts of terrorism, power shortages and blackouts, telecommunications failures, and other natural and man-made disasters or disruptions.
We cannot be sure that our systems will operate appropriately if we experience hardware or software failure, intentional disruptions of service by third parties, an act of God or an act of war. A failure in our systems could cause delays in transmitting data, and as a result we may lose customers or face litigation that could involve material costs and distract management from operating our business.
In the event of any such disaster or other disruption, we could experience disruptions or interruptions to our operations or the operations of our suppliers, distributors, resellers or customers; destruction of facilities; and/or loss of life, all of which could materially increase our costs and expenses and materially adversely affect our business, results of operations and financial condition.
We may be subject to environmental liabilities.
We engage in manufacturing and are subject to a variety of local, state and federal laws and regulations relating to the storage, discharge, handling, emission, generation, manufacture and disposal of toxic or other hazardous substances used to manufacture our products. We are also subject to the Restriction of Hazardous Substance ("RoHS") directive which restricts the use of lead, mercury and other substances in electrical and electronic products. The failure to comply with current or future environmental requirements could result in the imposition of substantial fines, suspension of production, alteration of our manufacturing processes or cessation of operations that could have a material adverse effect on our business, results of operations and financial condition. In addition, the handling, treatment or disposal of hazardous substances by us or our predecessors may have resulted, or could in the future result, in contamination requiring investigation or remediation, or lead to other liabilities, any of which could have a material adverse effect on our business, results of operations and financial condition.
The success of our business is dependent on compliance with FCC rules and regulations and similar foreign laws and regulations.
Many of our products are incorporated into wireless communications systems that must comply with various U.S. government regulations, including those of the FCC, as well as similar international laws and regulations. As a result, our business faces increased risks including the following:
|
•
|
We must obtain various licenses from the FCC
- We operate FCC licensed teleports that are subject to the Communications Act of 1934, as amended, or the FCC Act, and the rules and regulations of the FCC. We cannot guarantee that the FCC will grant renewals when our existing licenses expire, nor are we assured that the FCC will not adopt new or modified technical requirements that will require us to incur expenditures to modify or upgrade our equipment as a condition of retaining our licenses. We may, in the future, be required to seek FCC or other government approval if foreign ownership of our stock exceeds certain specified criteria. Failure to comply with these policies could result in an order to divest the offending foreign ownership, fines, denial of license renewal and/or license revocation proceedings against the licensee by the FCC, or denial of certain contracts from other U.S. government agencies.
|
28
|
•
|
We are dependent on the allocation and availability of frequency spectrum
- Adverse regulatory changes related to the allocation and availability of frequency spectrum and in the military standards and specifications that define the current satellite networking environment, could materially harm our business by: (i) restricting development efforts by us and our customers, (ii) making our current products less attractive or obsolete, or (iii) increasing the opportunity for additional competition. The increasing demand for wireless communications has exerted pressure on regulatory bodies worldwide to adopt new standards and reassign bandwidth for these products and services. The reduced number of available frequencies for other products and services and the time delays inherent in the government approval process of new products and services have caused, and may continue to cause, our customers to cancel, postpone or reschedule their installation of communications systems including their satellite, over-the-horizon microwave, or terrestrial line-of-sight microwave communication systems. This, in turn, could have a material adverse effect on our sales of products to our customers. Changes in, or our failure to comply with, applicable laws and regulations could materially adversely harm our business, results of operations, and financial condition.
|
|
•
|
Our future growth is dependent, in part, on developing NG911 compliant products
- The FCC requires that certain location information be provided to network operators for public safety answering points when a subscriber makes a 911 call. Technical failures, greater regulation by federal, state or foreign governments or regulatory authorities, time delays or the significant costs associated with developing or installing improved location technology could slow down or stop the deployment of our mobile location products. If deployment of improved location technology is delayed, stopped or never occurs, market acceptance of our products and services may be materially adversely affected. Because we rely on some third-party location technology instead of developing all of the technology ourselves, we have little or no influence over its improvement. The technology employed with NG911 services generally anticipates a migration to internet-protocol ("IP") based communication. Since many companies are proficient in IP-based communication protocols, the barriers to entry to providing NG911 products and services are lower than exist for the traditional switch-based protocols. If we are unable to develop unique and proprietary solutions that are superior to and more cost effective than other market offers, our 911 business could get replaced by new market entrants, resulting in a material adverse effect on our business, results of operations and financial condition.
|
|
•
|
Under the FCC’s mandate, our 911 business is dependent on state and local governments
- Under the FCC’s mandate, wireless carriers are required to provide 911 services only if state and local governments request the service. As part of a state or local government’s decision to request 911, they have the authority to develop cost recovery mechanisms. However, cost recovery is no longer a condition to wireless carriers’ obligation to deploy the service. If state and local governments do not widely request that 911 services be provided or we become subject to significant pressures from wireless carriers with respect to pricing of 911 services, our 911 business would be harmed and future growth of our business would be reduced.
|
Regulation of the mobile industry and VoIP is evolving, and unfavorable changes or our failure to comply with existing and potential new legislation or regulations could harm our business and operating results.
As the mobile industry continues to evolve, we believe greater regulation by federal, state or foreign governments or regulatory authorities is likely and we face certain risks including:
|
•
|
We must adhere to existing and potentially new privacy rules
- We believe increased regulation is likely in the area of data privacy, and laws and regulations applying to the solicitation, collection, processing or use of personal or consumer information could affect our customers’ ability to use and share data, potentially reducing our ability to utilize this information in the resale of certain of our products. In order for mobile location products and services to function properly, wireless carriers must locate their subscribers and store information on each subscriber’s location. Although data regarding the location of the wireless user resides only on the wireless carrier’s systems, users may not feel comfortable with the idea that the wireless carrier knows and can track their location. Carriers will need to obtain subscribers’ permission to gather and use the subscribers’ personal information, or they may not be able to provide customized mobile location services which those subscribers might otherwise desire. If subscribers view mobile location services as an annoyance or a threat to their privacy, that could reduce demand for our products and services and have a material adverse effect on our business, results of operations and financial condition.
|
29
Recently, there has been a number of laws and regulations enacted that affect companies conducting business on the Internet, including the European General Data Protection Regulation ("GDPR"). The GDPR imposes certain privacy related requirements on companies that receive or process personal data of residents of the European Union that are currently different than those in the United States and include significant penalties for non-compliance. Similarly, there are a number of legislative proposals in the United States, at both the federal and state level, that could impose new obligations in areas affecting our business, such as liability for copyright infringement by third parties. In addition, some countries are considering or have passed legislation implementing data protection requirements or requiring local storage and processing of data or similar requirements that could increase the cost and complexity of delivering our services. Our costs to comply with the GDPR as well any other similar laws and regulations that emerge may negatively impact our business.
|
•
|
We may face increased compliance costs in connection with health and safety requirements for mobile devices
- If wireless handsets pose health and safety risks, we may be subject to new regulations and demand for our products and services may decrease. Media reports have suggested that certain radio frequency emissions from wireless handsets may be linked to various health concerns, including cancer, and may interfere with various electronic medical devices, including hearing aids and pacemakers. Concerns over radio frequency emissions may have the effect of discouraging the use of wireless handsets, which would decrease demand for our services. In recent years, the FCC and foreign regulatory agencies have updated the guidelines and methods they use for evaluating radio frequency emissions from radio equipment, including wireless handsets. In addition, interest groups have requested that the FCC investigate claims that wireless technologies pose health concerns and cause interference with airbags, hearing aids and other medical devices. There also are some safety risks associated with the use of wireless handsets while driving. Concerns over these safety risks and the effect of any legislation that may be adopted in response to these risks could limit our ability to market and sell our products and services.
|
|
•
|
The regulatory environment for VoIP services is developing
- The FCC has determined that VoIP services are not subject to the same regulatory scheme as traditional wireline and wireless telephone services. If the regulatory environment for VoIP services evolves in a manner other than the way we anticipate, our 911 business would be significantly harmed and future growth of our business would be significantly reduced. For example, the regulatory scheme for wireless and wireline service providers requires those carriers to allow service providers such as us to have access to certain databases that make the delivery of a 911 call possible. No such requirements exist for VoIP service providers, so carriers could prevent us from continuing to provide VoIP 911 service by denying us access to the required databases.
|
All of our business activities are subject to rapid technological change, new entrants, the introduction of other distribution models and long development and testing periods each of which may harm our competitive position, render our product or service offerings obsolete and require us to continuously develop technology and/or obtain licensed technology in order to compete successfully.
We are engaged in business activities characterized by rapid technological change, evolving industry standards, frequent new product announcements and enhancements, and changing customer demands. The introduction of products and services on future industry standards embodying new technologies such as multi-frequency time-division multiple access ("MF-TDMA") based technologies could render any of our products and services obsolete or non-competitive. The successful execution of our business strategy is contingent upon wireless network operators launching and maintaining mobile location services, our ability to maintain a technically skilled development and engineering team, our ability to create new network software products and adapt our existing products to rapidly changing technologies, industry standards and customer needs. As a result of the complexities inherent in our product offerings, new technologies may require long development and testing periods. Additionally, new products may not achieve market acceptance or our competitors could develop alternative technologies that gain broader market acceptance than our products. If we are unable to develop and introduce technologically advanced products that respond to evolving industry standards and customer needs, or if we are unable to complete the development and introduction of these products on a timely and cost effective basis, it could have a material adverse effect on our business, results of operations and financial condition or could result in our technology becoming obsolete.
New entrants seeking to gain market share by introducing new technology and new products may make it more difficult for us to sell our products and services and could create increased pricing pressure, reduced profit margins, increased sales and marketing expenses, or the loss of market share or expected market share, any of which could have a material adverse effect on our business, results of operations and financial condition. For example, many companies are developing new technologies and the shift towards open standards such as IP-based satellite networks will likely result in increased competition and some of our products may become commoditized. Our DoubleTalk® Carrier-in-Carrier® bandwidth compression technology is licensed by us from a third party that maintains patents associated with the technology. Other competitors have developed similar technologies and some may have also licensed parts or all of this compression technology.
30
Our Commercial Solutions segment provides various technologies that are utilized on mobile phones. Applications from competitors for location-based or text-based messaging platforms may be preloaded on mobile devices by original equipment manufacturers, or OEMs, or offered by OEMs directly. Increased competition from providers of location-based services which do not rely on a wireless carrier may result in fewer wireless carrier subscribers electing to purchase their wireless carrier’s branded location-based services, which could harm our business and revenue. In addition, these location-based or text-based services may be offered for free or on a onetime fee basis, which could force us to reduce monthly subscription fees or migrate to a onetime fee model to remain competitive. We may also lose end users or face erosion in our average revenue per user if these competitors deliver their products without charge to the consumer by generating revenue from advertising or as part of other applications or services.
Our expected growth and our financial position depends on, among other things, our ability to keep pace with such changes and developments and to respond to the increasing variety of electronic equipment users and transmission technologies. We may not have the financial or technological resources to keep pace with such changes and developments or be successful in our research and development and we may not be able to identify and respond to technological improvements made by our competitors in a timely or cost-effective fashion. Any delays could result in increased costs of development or redirect resources from other projects. In addition, we cannot provide assurances that the markets for our products, systems, services or technologies will develop as we currently anticipate. The failure of our products, systems, services or technologies to gain market acceptance could significantly reduce our net sales and harm our business.
Our business is highly competitive, we are reliant upon the success of our partners, and some of our competitors have significantly greater resources than we do, which could result in a loss of customers, market share and/or market acceptance.
Our business is highly competitive. We will continue to invest in research and development for the introduction of new and enhanced products and services designed to improve capacity, data processing rates and features. We must also continue to develop new features and to improve functionality of our software. Research and development in our industry is complex, expensive and uncertain. We believe that we must continue to dedicate a significant amount of resources to research and development efforts to maintain our competitive position. If we continue to expend a significant amount of resources on research and development, but our efforts do not lead to the successful introduction of product and service enhancements that are competitive in the marketplace, our business, results of operations and financial condition could be materially adversely affected.
Several of our potential competitors are substantially larger than we are and have greater financial, technical and marketing resources than we do. In particular, larger competitors have certain advantages over us which could cause us to lose customers and impede our ability to attract new customers, including: larger bases of financial, technical, marketing, personnel and other resources; more established relationships with wireless carriers and government customers; more funds to deploy products and services; and the ability to lower prices (or not charge any price) of competitive products and services because they are selling larger volumes. Furthermore, we cannot be sure that our competitors will not develop competing products, systems, services or technologies that gain market acceptance in advance of our products, systems, services or technologies, or that our competitors will not develop new products, systems, services or technologies that cause our existing products, systems, services or technologies to become non-competitive or obsolete, which could adversely affect our results of operations.
Our Commercial Solutions segment provides Safety and Security Technologies to various state and local municipalities and to a large extent, we are reliant on the success of our wireless partners and distributors to meet our growth objectives. In some cases, our wireless partners may have different objectives or our distributors may not be successful. For example, in February 2016, AT&T, one of our largest partners publicly announced a new nationwide service that is focused on the adoption of NG911 services and that such new service will be deployed in collaboration with a competitor. In fiscal 2018, we were informed by two of our large distributors that they did not win two large programs which included our NG911 solutions and that AT&T was awarded both programs. Going forward, we intend to continue to work with our partners and expand our direct and indirect sales and distribution channel in this area. If we are not successful in doing so, we may not be able to achieve our long-term business goals.
31
Contract cost growth on our fixed price contracts, including most of our government contracts, cost reimbursable type contracts and other contracts that cannot be justified as an increase in contract value due from customers exposes us to reduced profitability and the potential loss of future business and other risks.
A substantial portion of our products and services are sold under fixed-price contracts. Fixed-price contracts inherently have more risk than flexibly priced contracts. This means that we bear the risk of unanticipated technological, manufacturing, supply or other problems, price increases or other increases in the cost of performance. Future events could result in either upward or downward adjustments to those estimates which could negatively impact our profitability. Operating margin is materially adversely affected when contract costs that cannot be billed to the customer are incurred. This cost growth can occur if initial estimates used for calculating the contract price were incorrect, or if estimates to complete increase. To a lesser extent, we provide products and services under cost reimbursable type contracts which carry the entire burden of costs exceeding a negotiated contract ceiling price.
The cost estimation process requires significant judgment and expertise. Reasons for cost growth may include unavailability and productivity of labor, the nature and complexity of the work to be performed, the effect of change orders, the availability of materials, the effect of any delays in performance, availability and timing of funding from the customer, natural disasters, and the inability to recover any claims included in the estimates to complete. A significant change in an estimate on one or more programs could have a material adverse effect on our business, results of operations and financial condition.
Ongoing compliance with the provisions of securities laws, related regulations and financial reporting standards could unexpectedly materially increase our costs and compliance related expenses.
Because we are a publicly traded company, we are required to comply with provisions of securities laws, related regulations and financial reporting standards. Because securities laws, related regulations and financial reporting standards pertaining to our business are relatively complex, our business faces increased risks including the following:
|
•
|
If we identify a material weakness in the future, our costs may unexpectedly increase
- Pursuant to Section 404 of the Sarbanes-Oxley Act of 2002 and related SEC rules, we are required to furnish a report of management’s assessment of the effectiveness of our internal controls as part of our Annual Report on Form 10-K. Our independent registered public accountants are required to attest to and provide a separate opinion. To issue our report, we document our internal control design and the testing processes that support our evaluation and conclusion, and then we test and evaluate the results. There can be no assurance, however, that we will be able to remediate material weaknesses, if any, that may be identified in future periods, or maintain all of the controls necessary for continued compliance. There likewise can be no assurance that we will be able to retain sufficient skilled finance and accounting personnel, especially in light of the increased demand for such personnel among publicly traded companies.
|
|
•
|
Stock-based compensation accounting standards could negatively impact our stock
- Since our inception, we have used stock-based awards as a fundamental component of our employee compensation packages. We believe that stock-based awards directly motivate our employees to maximize long-term stockholder value and, through the use of long-term vesting, encourage employees to remain with us. We apply the provisions of ASC 718, "
Compensation - Stock Compensation,
" which requires us to record compensation expense in our statement of operations for employee and director stock-based awards using a fair value method. In the first quarter of fiscal 2018, we adopted FASB ASU No. 2016-09 which modified certain aspects of ASC 718, including the requirement to recognize excess tax benefits and shortfalls in the income statement. The ongoing application of this standard will have a significant effect on our reported earnings, and could adversely impact our ability to provide accurate guidance on our future reported financial results due to the variability of the factors used to estimate the value of stock-based awards (including long-term performance shares which are subject to the achievement of three-year goals which are based on several performance metrics). The ongoing application of this standard could impact the future value of our common stock and may result in greater stock price volatility. To the extent that this accounting standard makes it less attractive to grant stock-based awards to employees, we may incur increased compensation costs, change our equity compensation strategy or find it difficult to attract, retain and motivate employees, each of which could have a material adverse effect on our business, results of operations and financial condition.
|
32
|
•
|
We must maintain compliance with new complex revenue recognition rules
- The accounting rules and regulations that we must comply with are complex. Accounting rules and regulations are continually changing in ways that could materially impact our financial statements. As further discussed in "
Notes to Consolidated Financial Statements - Note (1)(c) - Summary of Significant Accounting and Reporting Policies - Revenue Recognition
" included in "
Part II - Item 8. - Financial Statements and Supplementary Data,
" on August 1, 2018 (our first quarter of fiscal 2019), we adopted FASB Accounting Standards Update ("ASU") No. 2014-09
"Revenue from Contracts with Customers (Topic 606),"
which replaces numerous requirements in U.S. GAAP, including industry specific requirements, and provides a single revenue recognition model for contracts with customers. The ASU applies to all open contracts existing as of August 1, 2018. We adopted this ASU using the modified retrospective method and there was no material impact on our business, results of operations and financial condition. In fiscal 2019, we expect to recognize a significant portion of our contracts over time, as there is a continuous transfer of control to the customer over the contractual period of performance. The remainder of our contracts will be recognized at a point in time. Both of these methods are similar to what we did prior to August 1, 2018. We must comply with these new revenue recognition rules on a go-forward basis. Because of the uncertainties of the estimates, judgments and assumptions associated with these new accounting policies, as well as with any future guidance or interpretations related to the new standard, we may incur additional costs and cannot provide any assurances that we will be able to comply with such complex revenue recognition rules.
|
Our costs to comply with the aforementioned and other regulations continue to increase and we may have to add additional accounting staff, engage consultants or change our internal practices, standards and policies which could significantly increase our costs to comply with ongoing or future requirements. In addition, the NASDAQ Stock Market LLC ("NASDAQ") routinely changes its requirements for companies, such as us, that are listed on NASDAQ. These changes (and potential future changes) have increased and may increase our legal and financial compliance costs, including making it more difficult and more expensive for us to obtain director and officer liability insurance or maintain our current liability coverage. We believe that these new and proposed laws and regulations could make it more difficult for us to attract and retain qualified members of our Board of Directors, particularly to serve on our Audit Committee, and qualified executive officers.
Our backlog is subject to customer cancellation or modification and such cancellation could result in a decline in sales and increased provisions for excess and obsolete inventory.
We currently have a backlog of orders, mostly under contracts that our customers may modify or terminate. Almost all of the contracts in our backlog (including firm orders previously received from the U.S. government) are subject to cancellation at the convenience of the customer or for default in the event that we are unable to perform under the contract. A portion of our backlog is determined based on contracts received from our customers (such as the U.S. government and large wireless carriers) and in certain cases, is computed by multiplying the most recent month’s contract or revenue by the months remaining under the existing long-term agreements, which we consider to be the best available information for anticipating revenue under those agreements. There can be no assurance that our backlog will result in actual revenue in any particular period, or at all, or that any contract included in backlog will be profitable. As such, there is a higher degree of risk in this regard with respect to backlog. The actual receipt and timing of any revenue is subject to various contingencies, many of which are beyond our control. The actual receipt of revenue on contracts included in backlog may never occur or may change because a program schedule could change, the program could be canceled, a contract could be reduced, modified or terminated early, or an option that we had assumed would be exercised is not exercised.
A significant portion of the backlog from our U.S. commercial customers relates to large, multi-year contracts to provide state and local governments (and their agencies) with safety and security solutions. Although the contracts themselves represent legal, binding obligations of these governments, funding is often subject to the approval of budgets (for example, on an annual or bi-annual basis). Although funding for these multi-year contracts are dependent on future budgets being approved, we include the full estimated value of these large, multi-year contracts in our backlog given the critical nature of the services being provided and the positive historical experience of our state and local government customers passing their respective budgets.
We record a provision for excess and obsolete inventory based on historical and future usage trends and other factors, including the consideration of the amount of backlog we have on hand at any particular point in time. If orders in our backlog are canceled or modified, our estimates of future product demand may prove to be inaccurate, in which case we may have understated the provision required for excess and obsolete inventory. In the future, if we determine that our inventory is overvalued, we will be required to recognize such costs in our financial statements at the time of such determination. Any such charges could be materially adverse to our results of operations and financial condition.
33
We face a number of risks relating to the expected growth of our business. Our business and operating results may be negatively impacted if we are unable to manage this growth.
These risks include:
|
•
|
The loss of key technical or management personnel could adversely affect our business
- Our future success depends on the continued contributions of key technical management personnel. Many of our key technical management personnel would be difficult to replace, and are not subject to employment or non-competition agreements. We currently have research and development employees in areas that are located a great distance away from our U.S. headquarters. Managing remote product development operations is difficult and we may not be able to manage the employees in these remote centers successfully. Our expected growth and future success will depend, in large part, upon our ability to attract and retain highly qualified engineering, sales and marketing personnel. Competition for such personnel from other companies, academic institutions, government entities and other organizations is intense. Although we believe that we have been successful to-date in recruiting and retaining key personnel, we may not be successful in attracting and retaining the personnel we will need to grow and operate profitably. Also, the management skills that have been appropriate for us in the past may not continue to be appropriate if we grow and diversify.
|
|
•
|
We may not be able to improve our processes and systems to keep pace with anticipated growth
- The future growth of our business may place significant demands on our managerial, operational and financial resources. In order to manage that growth, we must be prepared to improve and expand our management, operational and financial systems and controls. We also need to continue to recruit and retain personnel and train and manage our employee base. We must carefully manage research and development capabilities and production and inventory levels to meet product demand, new product introductions and product and technology transitions. If we are not able to timely and effectively manage our growth and maintain the quality standards required by our existing and potential customers, it could have a material adverse effect on our business, results of operations and financial condition.
|
|
•
|
Our markets are highly competitive and there can be no assurance that we can continue to compete effectively
- The markets for our products are highly competitive. There can be no assurance that we will be able to continue to compete successfully on price or other terms, or that our competitors will not develop new technologies and products that are more effective than our own. We expect the Department of Defense’s increased use of commercial off-the-shelf products and components in military equipment will encourage new competitors to enter the market. Also, although the implementation of advanced telecommunications services is in its early stages in many developing countries, we believe competition will continue to intensify as businesses and foreign governments realize the market potential of telecommunications services. Many of our competitors have financial, technical, marketing, sales and distribution resources greater than ours. Recently, we have seen increased requests for proposals from large wireless carriers for sole-source solutions and have responded to several such requests including those from AT&T and Verizon. In order to induce retention of existing customer contracts and obtain business on a sole-source basis, we may ultimately agree to adjust pricing on a retroactive basis. If our sole-source proposals are rejected in favor of a competitor’s proposal, it could result in the termination of existing contracts, which could have a material adverse effect on our business, results of operations and financial condition.
|
|
•
|
We may not be able to obtain sufficient components to meet expected demand
- Our dependence on component availability, government furnished equipment, subcontractors and key suppliers, including the core manufacturing expertise of our high-volume technology manufacturing center located in Tempe, Arizona, exposes us to risk. Although we obtain certain components and subsystems from a single source or a limited number of sources, we believe that most components and subsystems are available from alternative suppliers and subcontractors. During fiscal 2018, and as a result of overall increased industry-wide demand, lead times for many components have increased. In addition, threats of or actual tariffs could limit our ability to obtain certain parts on a cost-effective basis, or at all. A significant interruption in the delivery of such items could have a material adverse effect on our business, results of operations and financial condition. In addition, if our high-volume technology manufacturing center located in Tempe, Arizona is unable to produce sufficient product or maintain quality, it could have a material adverse effect on our business, results of operations and financial condition.
|
|
•
|
Our ability to maintain affordable credit insurance may become more difficult
- In the normal course of our business, we purchase credit insurance to mitigate some of our domestic and international credit risk. Although credit insurance remains generally available, upon renewal, it may become more expensive to obtain or may not be available for existing or new customers in certain international markets and it might require higher deductibles than in the past. If we acquire a company with a different customer base, we may not be able to obtain credit insurance for those sales. As such, there can be no assurance that, in the future, we will be able to obtain credit insurance on a basis consistent with our past practices.
|
34
We rely upon various third party companies and their technology to provide services to our customers and if we are unable to obtain such services at reasonable prices, or at all, our gross margins and our ability to provide the services of our wireless applications business could be materially adversely affected.
Risks from our reliance with these third parties include:
|
•
|
The loss of mapping and third party content
- The wireless data services provided to our customers are dependent on real-time, continuous feeds from map data, points of interest data, traffic information, gas prices, theater, event and weather information from vendors and others. Any disruption of this third-party content from our satellite feeds or backup landline feeds or other disruption could result in delays in our subscribers’ ability to receive information. We obtain this data that we sell to our customers from companies owned by current and potential competitors, who may act in a manner that is not in our best interest. If our suppliers of this data or content were to enter into exclusive relationships with other providers of location-based services or were to discontinue providing such information and we were unable to replace them cost effectively, or at all, our ability to provide the services of our wireless applications business would be materially adversely affected. Our gross margins may also be materially adversely affected if the cost of third party data and content increases substantially.
|
|
•
|
Third party data centers or third party networks may fail
- Many products and services of our advanced communication solutions, in particular our public safety and enterprise technology solutions, are provided through a combination of our servers, which we house at third party data centers, and the networks of our wireless carrier partners. Certain of our data centers are currently hosted in cloud based applications operated by third parties such as Amazon Web Services and Microsoft or third party facilities located in Irvine, California, San Francisco, California, Dallas, Texas and Raleigh, North Carolina, and we may use others as required. We also use third party data center facilities in the Phoenix, Arizona area to provide for disaster recovery. As such, our business relies to a significant degree on the efficient and uninterrupted operation of the third party data centers we use. Network failures, disruptions or capacity constraints in our third-party data center facilities or in our servers maintained at their location could affect the performance of the products and services of our wireless applications and 911 business and harm our reputation and our revenue. The ability of our subscribers to receive critical location and business information requires timely and uninterrupted connections with our wireless network carriers. Any disruption from our satellite feeds or backup landline feeds could also result in delays in our subscribers’ ability to receive information.
|
|
•
|
We must integrate our technologies and routinely upgrade them
- We may not be able to upgrade our location-based services platform to support certain advanced features and functionality without obtaining technology licenses from third parties. Obtaining these licenses may be costly and may delay the introduction of such features and functionality, and these licenses may not be available on commercially favorable terms, or at all. Problems and delays in development or delivery as a result of issues with respect to design, technology, licensing and patent rights, labor, learning curve assumptions, or materials and components could prevent us from achieving contractual obligations. In addition, our products cannot be tested and proven in all situations and are otherwise subject to unforeseen problems. The inability to offer advanced features or functionality, or a delay in our ability to upgrade our location-based services platform, may materially adversely affect demand for our products and services and, consequently, have a material adverse effect on our business, results of operations and financial condition.
|
|
•
|
We rely upon "open-source" software
- We have incorporated some types of open-source software into our products, allowing us to enhance certain solutions without incurring substantial additional research and development costs. Thus far, we have encountered no unanticipated material problems arising from our use of open-source software. However, as the use of open-source software becomes more widespread, certain open-source technology could become competitive with our proprietary technology, which could cause sales of our products to decline or force us to reduce the fees we charge for our products, which could have a material adverse effect on our business, results of operations and financial condition.
|
Indemnification provisions in our contracts could have a material adverse effect on our consolidated results of operations, financial position, or cash flows.
In the ordinary course of business, we include indemnification provisions in certain of our customer contracts. Pursuant to these agreements, we have agreed to indemnify, hold harmless and reimburse the indemnified party for losses suffered or incurred by the indemnified party, including but not limited to losses related to third-party intellectual property claims. Some customers seek indemnification under their contractual arrangements with the Company for claims and other costs associated with defending lawsuits alleging infringement of patents through their use of our products and services, and the use of our products and services in combination with products and services of other vendors.
35
In some cases, we have agreed to assume the defense of the case. In others, the Company will negotiate with these customers in good faith because the Company believes its technology does not infringe the cited patents and due to specific clauses within the customer contractual arrangements that may or may not give rise to an indemnification obligation. It is not possible to determine the maximum potential amount the Company may spend under these agreements due to the unique facts and circumstances involved in each particular agreement.
For example, we have accrued certain costs related to Vehicle IP, LLC ("Vehicle IP") which filed a patent infringement lawsuit in the U.S. District Court for the District of Delaware (the "District Court"). For additional information, see "
Notes to Consolidated Financial Statements - Note (14)(b) - Commitments and Contingencies - Legal Proceedings and Other Matters
" included in "
Part II - Item 8.- Financial Statements and Supplementary Data
," included in this Annual Report on Form 10-K.
The Company's assessments related to indemnification provisions are based on estimates and assumptions that have been deemed reasonable by management, but that may prove to be incomplete or inaccurate, and unanticipated events and circumstances may occur that might cause the Company to change those estimates and assumptions. Therefore, it is possible that an unfavorable resolution of one or more of these matters could have a material adverse effect on the Company's consolidated financial statements in a future fiscal period.
We are, from time to time, and could become a party to additional litigation or subject to claims, including product liability claims, relating to our software, government investigations and other proceedings that could cause us to incur unanticipated expenses and otherwise have a material adverse effect on our business, results of operations and financial condition
.
We are, from time to time, involved in commercial disputes and civil litigation relating to our businesses. Our agreements with customers may require us to indemnify such customers. Direct claims against us or claims against our customers may relate to defects in or non-conformance of our products, or our own acts of negligence and non-performance. Occasionally, we are called upon also to provide information in connection with litigation involving other parties or government investigations. Product liability and other forms of insurance are expensive and may not be available in the future. We cannot be sure that we will be able to maintain or obtain insurance coverage at acceptable costs or in sufficient amounts or that our insurer will not disclaim coverage as to a future claim. In many cases, we are unable to obtain insurance and are self-insured. Any such claim could have a material adverse effect on our business, results of operations and financial condition.
Because our software may contain defects or errors, and our hardware products may incorporate defective components, our sales could decrease if these defects or errors adversely affect our reputation or delay shipments of our products.
Products as complex as ours are likely to contain undetected errors or defects, especially when first introduced or when new versions are released. Our products may not be error or defect free after delivery to customers, which could damage our reputation, cause revenue losses, result in the rejection of our products or services, divert development resources and increase service and warranty costs, each of which could have a material adverse effect on our business, results of operations and financial condition.
Software products, such as our 911 call handling software solution, must meet stringent customer technical requirements and we must satisfy our warranty obligations to our customers. Our 911 call handling software solution is a small product line developed by TCS more than ten years ago. Such solution was licensed to customers prior to our acquisition of TCS and older versions of this software solution remain deployed by certain end-customers. In fiscal 2016, AT&T, a distributor of this small TCS product line, informed us that they did not believe we met certain contractual specifications related to performance and usability of the software solution. During fiscal 2018, we entered into a full and final warranty settlement with AT&T, pursuant to which we issued thirty-six credits to AT&T of $0.2 million, which AT&T can apply on a monthly basis to purchases of solutions from us, beginning October 2017 through September 2020. For additional information related to this warranty settlement, see "
Notes to Consolidated Financial Statements - Note (6) - Accrued Expenses and Other Current Liabilities
" included in "
Part II - Item 8.- Financial Statements and Supplementary Data
," included in this Annual Report on Form 10-K. Our current accrued warranty obligations at July 31, 2018 include
$4.7 million
of warranty obligations for the TCS 911 call handling software solution. Our warranty liability associated with this issue was determined based on a review of contractual obligations, estimates of costs to enhance the software and include the terms of settlement with AT&T. We believe our customer support plan, which includes an intention to continue to support end-customers in exchange for an annual customer support fee, has mitigated the negative reputational impact of this issue. In fiscal 2018 and 2017, 911 call handling software solution sales were $7.0 million and $5.5 million, respectively. A significant portion of such sales were derived from our relationship with AT&T. Sales in fiscal 2019 for this product line are currently expected to be similar to the amounts achieved in fiscal 2018 and 2017.
Our hardware products are also subject to warranty obligations and integrate a wide variety of components from different vendors.
36
Protection of our intellectual property is limited and pursuing infringers of our patents and other intellectual property rights can be costly.
Our businesses rely, in large part, upon our proprietary scientific and engineering know-how and production techniques. We rely on a combination of patent, copyright, trademark, service mark, trade secret and unfair competition laws, restrictions in licensing agreements, confidentiality provisions and various other contractual provisions to protect our intellectual property and related proprietary rights, but these legal means provide only limited protection. Although a number of patents have been issued to us and we have obtained a number of other patents as a result of our acquisitions, we cannot assure you that our issued patents will be upheld if challenged by another party. Additionally, with respect to any patent applications which we have filed, we cannot assure you that any patents will be issued as a result of these applications.
The departure of any of our key management and technical personnel, the breach of their confidentiality and non-disclosure obligations to us or the failure to achieve our intellectual property objectives could have a material adverse effect on our business, results of operations and financial condition. Our ability to compete successfully and achieve future revenue growth will depend, in part, on our ability to protect our proprietary technology and operate without infringing upon the rights of others. We may fail to do so. In addition, the laws of certain countries in which our products are or may be sold may not protect our products or intellectual property rights to the same extent as the laws of the U.S.
Our ability to protect our intellectual property rights is also subject to the terms of future government contracts. We cannot assure you that the federal government will not demand greater intellectual property rights or restrict our ability to disseminate intellectual property. We are also a member of standards-setting organizations and have agreed to license some of our intellectual property to other members on fair and reasonable terms to the extent that the license is required to develop non-infringing products.
Pursuing infringers of our proprietary rights could result in significant litigation costs, and any failure to pursue infringers could result in our competitors utilizing our technology and offering similar products, potentially resulting in loss of a competitive advantage and decreased revenues. Despite our efforts to protect our proprietary rights, existing patent, copyright, trademark and trade secret laws afford only limited protection. In addition, the laws of some foreign countries do not protect our proprietary rights to the same extent as do the laws of the U.S. Protecting our know-how is difficult especially after our employees or those of our third-party contract service providers end their employment or engagement. Attempts may be made to copy or reverse-engineer aspects of our products or to obtain and use information that we regard as proprietary. Accordingly, we may not be able to prevent the misappropriation of our technology or prevent others from developing similar technology. Furthermore, policing the unauthorized use of our products is difficult and expensive. Litigation may be necessary in the future to enforce our intellectual property rights or to determine the validity and scope of the proprietary rights of others. The costs and diversion of resources could significantly harm our business. If we fail to protect our intellectual property, we may not receive any return on the resources expended to create the intellectual property or generate any competitive advantage based on it.
Third parties may claim we are infringing their intellectual property rights and we could be prevented from selling our products, or suffer significant litigation expense, even if these claims have no merit.
Our competitive position is driven in part by our intellectual property and other proprietary rights. Third parties, however, may claim that we, our products, operations or any products or technology we obtain from other parties are infringing their intellectual property rights, and we may be unaware of intellectual property rights of others that may cover some of our assets, technology and products. From time to time we receive letters from third parties who allege we are infringing their intellectual property and ask us to license such intellectual property. We review the merits of each such letter and respond as we deem appropriate.
From time to time our customers are parties to allegations of intellectual property infringement claims based on our customers’ incorporation and use of our products and services, which may lead to demands from our customers for us to indemnify them for costs in defending those allegations. Any litigation regarding patents, trademarks, copyrights or intellectual property rights, even those without merit, and the related indemnification demands of our customers, can be costly and time consuming, and divert our management and key personnel from operating our business. The complexity of the technology involved and inherent uncertainty and cost of intellectual property litigation increases our risks. If any third party has a meritorious or successful claim that we are infringing its intellectual property rights, we may be forced to change our products or enter into licensing arrangements with third parties, which may be costly or impractical. This also may require us to stop selling our products as currently engineered, which could harm our competitive position. We also may be subject to significant damages or injunctions that prevent the further development and sale of certain of our products or services and may result in a material loss of revenue.
37
From time to time, there have been claims challenging the ownership of open source software against companies that incorporate open source software into their products. As a result, we could be subject to suits by parties claiming ownership of what we believe to be open source software. Some open source licenses contain requirements that we make available source code for modifications or derivative works under the terms of a particular open source license or other license granting third parties certain rights of further use. If we combine our proprietary software products with open source software in a certain manner, we could under certain of the open source licenses, be required to release our proprietary source code. Open source license terms may be ambiguous and many of the risks associated with usage of open source software cannot be eliminated, and could if not properly addressed, negatively affect our business. If we were found to have inappropriately used open source software, we may be required to release our proprietary source code, re-engineer our products and client applications, discontinue the sale of our products or services in the event re-engineering cannot be accomplished on a timely basis or take other remedial action that may divert resources away from our development efforts, any of which could materially adversely affect our business, results of operations, and financial condition.
A change in our relationship with our large wireless carrier customers could have a material adverse effect.
Although we have a long history of providing services to many of our wireless carrier partners, a change in purchasing or procurement strategies by a wireless carrier partner could result in the loss of business from that partner. Additionally, from time to time, we routinely perform services without a multi-period contract while we negotiate new and extended contract terms and pricing. These negotiations are complex and may take long periods of time. Even when we successfully negotiate a multi-period contract, our wireless carrier contracts, such as the ones with Verizon and AT&T, provide for terminations with notice and provide a mechanism for the wireless carrier to renegotiate lower fees and/or change services. Fee pressure from these carriers are constant and ongoing. Thus, even when we obtain a multi-period contract term, our revenues could be suddenly and materially reduced.
Competitors offer technology that has functionality similar to ours for free, under different business models. Competition from these free offerings may reduce our revenue and harm our business. If our wireless carrier partners can offer these location-based services to their subscribers for free, they may elect to cease their relationships with us, alter or reduce the manner or extent to which they market or offer our services or require us to substantially reduce our subscription fees or pursue other business strategies that may not prove successful for us and could have a material adverse effect on our business, results of operations and financial condition.
Potential future business combinations among wireless network operators could result in a loss of revenue for our business.
The telecommunications industry generally is currently undergoing a consolidation phase. For example, T-Mobile US, Inc. ("T-Mobile") and Sprint Corporation have announced a merger. We currently generate revenue from both of these companies and we are uncertain of the impact that this merger may have on us in the future. Many of our customers, specifically wireless carrier customers of our Commercial Solutions segment, have or may become the target of acquisitions. If the number of our customers is significantly reduced as a result of this consolidation trend, or if the resulting companies do not utilize our product offerings, our business, results of operations and financial condition could be materially adversely affected.
If our wireless carrier partners change the pricing and other terms by which they offer our products to their end-customers or do not continue to provide our services at all or renegotiate lower fees with us, our business, results of operations, and financial condition could be suddenly and materially adversely affected.
We generate a significant portion of our revenue from customers that are wireless carriers, such as Verizon and AT&T. In addition, a portion of our revenue is derived from subscription fees that we receive from our wireless carrier partners for end-users who subscribe to our service on a standalone basis or in a bundle with other services. To-date, a relatively small number of end-users have subscribed for our services in connection with their wireless plans compared to the total number of mobile phone users. Our future growth depends, in part, on achieving significantly increased subscriber adoption of the wireless communication solutions we sell either through standalone subscriptions to our solutions or as part of bundles from our existing wireless carrier partners. Our success also depends on achieving widespread deployment of our solutions by attracting and retaining wireless carrier partners. Future revenue will depend on the pricing and quality of those services and subscriber demand for those services, which may vary by market, and the level of subscriber turnover experienced by our wireless carrier partners. If subscriber turnover increases more than we anticipate, our financial results could be materially adversely affected.
Poor performance in or disruptions of the services included in our advanced communication solutions could harm our reputation, delay market acceptance of our services and subject us to liabilities (including breach of contract claims brought by our customers and third-party damages claims brought by end-users). Our wireless carrier agreements and certain customers require us to meet specific requirements including operational uptime requirements or be subject to penalties.
38
If we are unable to meet contractual requirements with our wireless carrier partners, such as Verizon and AT&T, they could terminate our agreements or we may be required to refund a portion of monthly subscriptions fees they have paid us.
Risks Related to our Common Stock
Our stock price is volatile.
The stock market in general and the stock prices of technology-based companies, in particular, experience extreme volatility that often is unrelated to the operating performance of any specific public company. The market price of our common stock has fluctuated significantly in the past and is likely to fluctuate significantly in the future as well. Factors that could have a significant impact on the market price of our stock include, among others:
|
•
|
our ability to successfully integrate TCS and manage our combined company;
|
|
•
|
strategic transactions, such as acquisitions and divestures;
|
|
•
|
issuance of potentially dilutive equity or equity-type securities;
|
|
•
|
issuance of debt;
|
|
•
|
future announcements concerning us or our competitors;
|
|
•
|
receipt or non-receipt of substantial orders for products and services;
|
|
•
|
quality deficiencies in services or products;
|
|
•
|
results of technological innovations;
|
|
•
|
new commercial products;
|
|
•
|
changes in recommendations of securities analysts;
|
|
•
|
government regulations;
|
|
•
|
changes in the status or outcome of government audits;
|
|
•
|
proprietary rights or product or patent litigation;
|
|
•
|
changes in U.S. government policies;
|
|
•
|
changes in economic conditions generally, particularly in the telecommunications sector;
|
|
•
|
changes in securities market conditions, generally;
|
|
•
|
changes in the status of litigation and legal matters (including changes in the status of export matters);
|
|
•
|
cyber-attacks;
|
|
•
|
energy blackouts;
|
|
•
|
acts of terrorism or war;
|
|
•
|
inflation or deflation; and
|
|
•
|
rumors or allegations regarding our financial disclosures or practices.
|
Shortfalls in our sales or earnings in any given period relative to the levels expected by securities analysts could immediately, significantly and adversely affect the trading price of our common stock.
Future issuances of our shares of common stock could dilute a stockholder's ownership interest in Comtech and reduce the market price of our shares of common stock.
In the future, we may issue additional securities to raise capital. We may also acquire interests in other companies by using a combination of cash and our common stock or just our common stock. We may also issue securities convertible into our common stock. Any of these events may dilute a stockholder's ownership interest in Comtech and have an adverse impact on the price of our common stock.
Provisions in our corporate documents and Delaware law could delay or prevent a change in control of Comtech.
We have taken a number of actions that could have the effect of discouraging, delaying or preventing a merger or acquisition involving Comtech that our stockholders may consider favorable.
For example, we have a classified board and the employment contract with our President and CEO, and agreements with other of our executive officers, provide for substantial payments in certain circumstances or in the event of a change of control of Comtech. In the future, we may adopt a stockholder rights plan which could cause substantial dilution to a stockholder, and substantially increase the cost paid by a stockholder who attempts to acquire us on terms not approved by our Board of Directors.
39
In addition, we are subject to the provisions of Section 203 of the Delaware General Corporation Law, an anti-takeover law. In general, this statute provides that, except in certain limited circumstances, a corporation shall not engage in any "business combination" with an "interested stockholder" for a period of three years after the date of the transaction in which the person became an interested stockholder, unless the business combination is approved in a prescribed manner.
A "business combination" includes mergers, asset sales and other transactions resulting in a financial benefit to the interested stockholder. Subject to certain exceptions, for purposes of Section 203 of the Delaware General Corporation Law, an "interested stockholder" is a person who, together with affiliates, owns, or within three years did own, 15% or more of the corporation's voting stock. This provision could have the effect of delaying or preventing a change in control of Comtech.
A disruption in our dividend program could negatively impact our stock price.
We have paid quarterly dividends every quarter since September 2010.
Our ability to continue to pay quarterly dividends will depend on our ability to generate sufficient cash flows from operations in the future and maintain compliance with our Secured Credit Facility, as amended. This ability may be subject to certain economic, financial, competitive and other factors that are beyond our control. Future dividends remain subject to compliance with financial covenants under the Company's Secured Credit Facility, as amended, as well as Board approval. Our Board of Directors may, at its discretion, decrease the targeted annual dividend amount or entirely discontinue the payment of dividends at any time.
Additionally, our ability to declare and pay dividends and make other distributions with respect to our capital stock may also be restricted by the terms of our Secured Credit Facility, as amended, and may be restricted by the terms of financing arrangements that we enter into in the future.
None.
Historically, we have not owned any material properties or facilities and have relied upon a strategy of leasing. The following table lists our primary leased facilities at July 31, 2018:
|
Location
|
Property Type
|
|
Square Footage
|
|
Lease Expiration
|
||||
|
Commercial Solutions Segment
|
|||||||||
|
Tempe, Arizona
|
(A)
|
Manufacturing and Engineering
|
152,000
|
|
February 2021
|
||||
|
Phoenix, Arizona
|
(B)
|
General office (currently vacated)
|
75,000
|
|
October 2018
|
||||
|
Seattle, Washington
|
|
(C)
|
Network Operations, R&D, Engineering and Sales
|
|
57,000
|
|
|
December 2022
|
|
|
Santa Clara, California
|
(D)
|
Manufacturing and Engineering
|
47,000
|
|
April 2026
|
||||
|
Various facilities
|
(E)
|
Engineering and General Office
|
34,000
|
|
Various
|
||||
|
Lake Forest, California
|
|
(F)
|
R&D and Engineering
|
|
18,000
|
|
|
July 2023
|
|
|
Greenwood Village, Colorado
|
|
(F)
|
Network Operations
|
|
17,000
|
|
|
July 2020
|
|
|
Moscow, Idaho
|
(G)
|
Support, Engineering and Sales
|
13,000
|
|
February 2020
|
||||
|
Annapolis, Maryland
|
|
(F)
|
Support, Engineering and Sales
|
|
13,000
|
|
|
July 2026
|
|
|
Fremont, California
|
(G)
|
Support, Engineering and Sales
|
10,000
|
|
April 2020
|
||||
|
Germantown, Maryland
|
(H)
|
Engineering and General Office
|
6,000
|
|
May 2025
|
||||
|
442,000
|
|
||||||||
|
Government Solutions Segment
|
|||||||||
|
Orlando, Florida
|
(I)
|
Manufacturing and Engineering
|
99,000
|
|
April 2026
|
||||
|
Tampa, Florida
|
|
(F)
|
Manufacturing
|
|
46,000
|
|
|
April 2022
|
|
|
Melville, New York
|
(J)
|
Manufacturing and Engineering
|
45,000
|
|
December 2021
|
||||
|
Cypress, California
|
|
(F)
|
Support, Engineering and Sales
|
|
28,000
|
|
|
July 2025
|
|
|
Germantown, Maryland
|
(H)
|
Engineering and General Office
|
26,000
|
|
May 2025
|
||||
|
Various facilities
|
(K)
|
Support, Engineering and Sales
|
14,000
|
|
Various
|
||||
|
Richardson, Texas
|
|
(F)
|
R&D and Engineering
|
|
13,000
|
|
|
July 2020
|
|
|
Annapolis, Maryland
|
|
(F)
|
Support, Engineering and Sales
|
|
9,000
|
|
|
July 2026
|
|
|
280,000
|
|
||||||||
|
Corporate
|
|||||||||
|
Annapolis, Maryland
|
|
(F)
|
General Office and common areas
|
|
5,000
|
|
|
July 2026
|
|
|
Melville, New York
|
(L)
|
Corporate headquarters and general office
|
9,600
|
|
August 2027
|
||||
|
14,600
|
|
||||||||
|
Total Square Footage
|
|
|
736,600
|
|
|
|
|||
|
(A)
|
Although primarily used for our satellite earth station product lines, which are part of the Commercial Solutions segment, both of our business segments utilize, from time to time, our high-volume technology manufacturing facilities located in Tempe, Arizona. These manufacturing facilities utilize state-of-the-art design and production techniques, including analog, digital and RF microwave production, hardware assembly and full service engineering. Our leases for these facilities expire from fiscal 2019 through fiscal 2021. We have the option to extend the lease terms for up to an additional five-year period.
|
|
(B)
|
As a result of the August 1, 2008 Radyne acquisition, we also assumed a lease of building space in Phoenix, Arizona that was previously used for manufacturing. In connection with our fiscal 2009 Radyne acquisition restructuring plan, we vacated and subleased this space through October 2015. We expect to surrender the property upon expiration of the lease.
|
|
(C)
|
Our office in Seattle, Washington is used primarily for servicing and hosting our wireless and VoIP E911 public safety support services.
|
40
|
(D)
|
Our Commercial Solutions segment manufactures our traveling wave tube amplifiers in a leased manufacturing facility located in Santa Clara, California. Our Commercial Solutions segment also operates a small office in the United Kingdom with a lease that expires in October 2021.
|
|
(E)
|
Our Commercial Solutions segment also leases an additional twelve facilities, three of which are located in the U.S. The U.S. facilities aggregate 6,000 square feet and are primarily utilized for engineering and general office use. Our Commercial Solutions segment also operates nine small offices in Brazil, Canada, China, India, Singapore, Australia and the United Kingdom, all of which aggregate 28,000 square feet and are primarily utilized for customer support, engineering and sales.
|
|
(F)
|
We have leases for facilities in Annapolis, Maryland, Lake Forest, California and Greenwood Village, Colorado used primarily for the design and development of our software based systems and applications and network operations. Major manufacturing and engineering facilities for our Government Solutions segment include Tampa, Florida, Cypress, California and Richardson, Texas. As part of our cost reduction initiatives in our Government Solutions segment, we are in the process of migrating our manufacturing and engineering activities from our Tampa, Florida facility to our Orlando, Florida facility. Although we expect to use the building for storage of certain goods or seek a sublease, the migration of operations is expected to be complete in fiscal 2019. As the lease on the Tampa, Florida facility expires in fiscal 2022, we are seeking opportunities to sublease the space for the duration of the lease.
|
|
(G)
|
Our offices in Moscow, Idaho and Fremont, California are primarily used for research and development, engineering and sales of our satellite earth station products.
|
|
(H)
|
Our Government Solutions segment leases a 32,000 square foot facility located in Germantown, Maryland, which is primarily used to support the U.S. Army's Blue Force Tracker-2 High Capacity ("BFT-2-HC") satellite transceiver order and related activities, BFT-1 sustainment activities, engineering and general office use. Our Government Solutions segment occupies 26,000 feet of the facility with the remainder utilized by our Commercial Solutions segment.
|
|
(I)
|
Our Government Solutions segment engineers and manufactures our over-the-horizon microwave systems in a leased facility in Orlando, Florida. This business also leases a small office in North Africa.
|
|
(J)
|
Our Government Solutions segment manufactures our solid-state, high-power, broadband amplifiers in a 45,000 square foot engineering and manufacturing facility on more than two acres of land in Melville, New York and an 8,000 square foot facility in Topsfield, Massachusetts. We lease the New York facility from a partnership controlled by our President and CEO. The lease provides for our use of the premises as they exist through December 2021 with an option to renew for an additional ten-year period. We have a right of first refusal in the event of a sale of the facility. Our Massachusetts lease is currently on a month-to-month basis.
|
|
(K)
|
Our Government Solutions segment also leases an additional four facilities located in the U.S. that are primarily used for engineering, sales and software development. Of these facilities, we are currently subleasing 6,000 square foot of the Suwanee, GA facility through August 2020. Our leases for these facilities expire from fiscal 2019 through fiscal 2021.
|
|
(L)
|
Our corporate headquarters are located in an office building complex in Melville, New York. The lease provides for our use of the premises through August 2027.
|
The terms for all of our leased facilities are generally for multi-year periods and we believe that we will be able to renew these leases or find comparable facilities elsewhere.
41
Information regarding legal proceedings is incorporated herein by reference to the "
Notes to Consolidated Financial Statements –
Note (14)(b) - Commitments and Contingencies – Legal Proceedings and Other Matters
" included in "
Part II - Item 8.- Financial Statements and Supplementary Data,
" included in this Annual Report on Form 10-K.
Not applicable.
42
Stock Performance Graph and Cumulative Total Return
The graph below compares the cumulative total stockholder return on our common stock with the cumulative total return on the S&P’s 500 Index and the NASDAQ Telecommunications Index for each of the last five fiscal years ended July 31, assuming an investment of $100 at the beginning of such period and the reinvestment of any dividends. The comparisons in the graphs below are based upon historical data and are not indicative of, nor intended to forecast, future performance of our common stock.
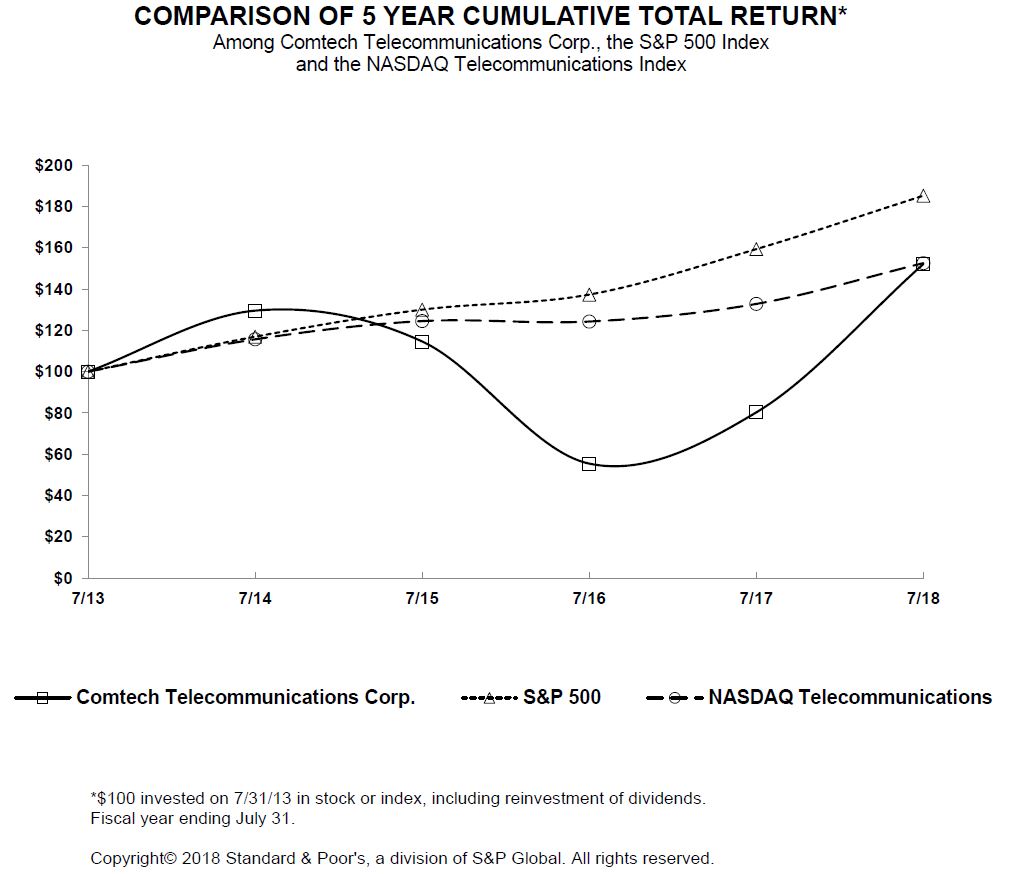
Our common stock trades on the NASDAQ Stock Market LLC ("NASDAQ") under the symbol "CMTL."
43
The following table shows the quarterly range of the high and low sale prices for our common stock as reported by the NASDAQ. Such prices do not include retail markups, markdowns or commissions.
|
|
Common Stock
|
||||||
|
|
High
|
Low
|
|||||
|
Fiscal Year Ended July 31, 2017
|
|
|
|||||
|
First Quarter
|
$
|
13.84
|
|
9.84
|
|
||
|
Second Quarter
|
12.81
|
|
9.52
|
|
|||
|
Third Quarter
|
15.25
|
|
10.53
|
|
|||
|
Fourth Quarter
|
19.80
|
|
13.75
|
|
|||
|
Fiscal Year Ended July 31, 2018
|
|
|
|
|
|||
|
First Quarter
|
$
|
22.90
|
|
17.11
|
|
||
|
Second Quarter
|
23.90
|
|
19.30
|
|
|||
|
Third Quarter
|
32.94
|
|
20.62
|
|
|||
|
Fourth Quarter
|
35.38
|
|
29.36
|
|
|||
Dividends
Since September 2010, we have paid quarterly dividends. On
September 27, 2017
,
December 6, 2017
,
March 7, 2018
and
June 6, 2018
, our Board of Directors declared a dividend of
$0.10
per common share, which were paid on
November 17, 2017
,
February 16, 2018
,
May 18, 2018
and
August 17, 2018
, respectively. On
September 26, 2018
, our Board of Directors declared a dividend of
$0.10
per common share, payable on
November 16, 2018
to stockholders of record at the close of business on
October 17, 2018
.
The Board of Directors is currently targeting fiscal 2019 quarterly dividend payments of $0.10 per common share. Future dividends remain subject to compliance with financial covenants under our Secured Credit Facility, as amended, as well as Board approval.
Recent Sales of Unregistered Securities
None.
Purchases of Equity Securities by the Issuer and Affiliated Purchasers
We did not repurchase any of our equity securities during the fiscal year ended
July 31, 2018
.
As of
July 31, 2018
and
September 25, 2018
, we were authorized to repurchase up to an additional
$8.7 million
of our common stock, pursuant to a
$100.0 million
stock repurchase program that was authorized by our Board of Directors. The
$100.0 million
stock repurchase program has no time restrictions and repurchases may be made in open-market or privately negotiated transactions and may be made pursuant to SEC Rule 10b5-1 trading plans.
Approximate Number of Equity Security Holders
As of
September 21, 2018
, there were approximately
759
holders of our common stock. Such number of record owners was determined from our stockholder records and does not include beneficial owners whose shares of our common stock are held in the name of various security holders, dealers and clearing agencies.
44
The following table shows selected historical consolidated financial data for our Company.
Detailed historical financial information is included in the audited consolidated financial statements for fiscal
2018
,
2017
and
2016
.
|
|
Fiscal Years Ended July 31,
(In thousands, except per share amounts)
|
|||||||||||||||
|
|
2018
|
2017
|
2016
|
2015
|
2014
|
|||||||||||
|
Consolidated Statement of Operations Data:
|
|
|
|
|
|
|||||||||||
|
Net sales
|
$
|
570,589
|
|
550,368
|
|
411,004
|
|
307,289
|
|
347,150
|
|
|||||
|
Cost of sales
|
346,648
|
|
332,183
|
|
239,767
|
|
168,405
|
|
195,712
|
|
||||||
|
Gross profit
|
223,941
|
|
218,185
|
|
171,237
|
|
138,884
|
|
151,438
|
|
||||||
|
Expenses:
|
|
|
|
|
|
|
|
|
|
|
||||||
|
Selling, general and administrative
|
113,922
|
|
116,080
|
|
94,932
|
|
62,680
|
|
67,147
|
|
||||||
|
Research and development
|
53,869
|
|
54,260
|
|
42,190
|
|
35,916
|
|
34,108
|
|
||||||
|
Amortization of intangibles
|
21,075
|
|
22,823
|
|
13,415
|
|
6,211
|
|
6,285
|
|
||||||
|
Settlement of intellectual property litigation
|
—
|
|
(12,020
|
)
|
—
|
|
—
|
|
—
|
|
||||||
|
Acquisition plan expenses
|
—
|
|
—
|
|
21,276
|
|
—
|
|
—
|
|
||||||
|
|
188,866
|
|
181,143
|
|
171,813
|
|
104,807
|
|
107,540
|
|
||||||
|
Operating income (loss)
|
35,075
|
|
37,042
|
|
(576
|
)
|
34,077
|
|
43,898
|
|
||||||
|
Other expenses (income):
|
|
|
|
|
|
|
|
|
|
|
||||||
|
Interest expense
|
10,195
|
|
11,629
|
|
7,750
|
|
479
|
|
6,304
|
|
||||||
|
Interest (income) and other
|
254
|
|
(68
|
)
|
(134
|
)
|
(405
|
)
|
(913
|
)
|
||||||
|
Income (loss) before (benefit from) provision for income taxes
|
24,626
|
|
25,481
|
|
(8,192
|
)
|
34,003
|
|
38,507
|
|
||||||
|
(Benefit from) provision for income taxes
|
(5,143
|
)
|
9,654
|
|
(454
|
)
|
10,758
|
|
13,356
|
|
||||||
|
Net income (loss)
|
$
|
29,769
|
|
15,827
|
|
(7,738
|
)
|
23,245
|
|
25,151
|
|
|||||
|
Net income (loss) per share:
|
|
|
|
|
|
|
|
|
|
|
||||||
|
Basic
|
$
|
1.25
|
|
0.68
|
|
(0.46
|
)
|
1.43
|
|
1.58
|
|
|||||
|
Diluted
|
$
|
1.24
|
|
0.67
|
|
(0.46
|
)
|
1.42
|
|
1.37
|
|
|||||
|
Weighted average number of common shares outstanding – basic
|
23,825
|
|
23,433
|
|
16,972
|
|
16,203
|
|
15,943
|
|
||||||
|
Weighted average number of common and common equivalent shares outstanding – diluted
|
24,040
|
|
23,489
|
|
16,972
|
|
16,418
|
|
20,906
|
|
||||||
|
Dividends declared per issued and outstanding common share as of the applicable dividend record date
|
$
|
0.40
|
|
0.60
|
|
1.20
|
|
1.20
|
|
1.175
|
|
|||||
45
|
|
Fiscal Years Ended July 31,
(In thousands)
|
|||||||||||||||
|
|
2018
|
2017
|
2016
|
2015
|
2014
|
|||||||||||
|
Other Consolidated Operating Data:
|
|
|
|
|
|
|||||||||||
|
Backlog at period-end
|
$
|
630,695
|
|
446,230
|
|
484,005
|
|
117,744
|
|
133,412
|
|
|||||
|
New orders
|
755,054
|
|
512,593
|
|
451,278
|
|
291,621
|
|
290,820
|
|
||||||
|
Research and development expenditures - internal and customer funded
|
70,793
|
|
81,310
|
|
59,622
|
|
45,144
|
|
47,211
|
|
||||||
|
Adjusted EBITDA
|
78,374
|
|
70,705
|
|
48,062
|
|
51,761
|
|
61,336
|
|
||||||
|
|
As of July 31,
(In thousands)
|
|||||||||||||||
|
|
2018
|
2017
|
2016
|
2015
|
2014
|
|||||||||||
|
Consolidated Balance Sheet Data:
|
|
|
|
|
|
|||||||||||
|
Total assets
|
$
|
845,157
|
|
832,063
|
|
921,196
|
|
473,877
|
|
473,852
|
|
|||||
|
Working capital
|
114,477
|
|
96,833
|
|
119,493
|
|
236,419
|
|
224,656
|
|
||||||
|
Debt, including capital leases and other obligations
|
167,899
|
|
195,802
|
|
258,649
|
|
—
|
|
—
|
|
||||||
|
Other long-term obligations
|
4,117
|
|
2,655
|
|
4,105
|
|
3,633
|
|
4,364
|
|
||||||
|
Stockholders’ equity
|
505,684
|
|
480,150
|
|
470,401
|
|
401,409
|
|
396,925
|
|
||||||
Non-GAAP Financial Data
This Annual Report on Form 10-K contains a Non-GAAP financial metric for the Company titled Adjusted EBITDA, which represents earnings (loss) before income taxes, interest (income) and other expense, interest expense, amortization of stock-based compensation, amortization of intangibles, depreciation expense, settlement of intellectual property litigation, acquisition plan expenses, restructuring (benefits) charges related to the wind-down of the microsatellite product line and strategic alternatives analysis expenses and other. In future periods, we expect to incur expenses similar to the aforementioned items and investors should not infer from our presentation of Adjusted EBITDA that these costs are unusual, infrequent or non-recurring. These items, while periodically affecting our results, may vary significantly from period to period and may have a disproportionate effect in a given period, thereby affecting the comparability of results.
Adjusted EBITDA is a Non-GAAP financial measure used by management in assessing Comtech’s operating results. Although closely aligned, Comtech's definition of Adjusted EBITDA is different than the Consolidated EBITDA (as such term is defined in our Secured Credit Facility, as amended) utilized for financial covenant calculations and also may differ from the definition of EBITDA or Adjusted EBITDA used by other companies and therefore, may not be comparable to similarly titled measures used by other companies. Our Adjusted EBITDA is also a measure frequently requested by Comtech’s investors and analysts. We believe that investors and analysts may use Adjusted EBITDA, along with other information contained in our SEC filings, in assessing our performance and comparability of our results with other companies.
Non-GAAP financial measures have limitations as an analytical tool as they exclude the financial impact of transactions necessary to conduct our business, such as the granting of equity compensation awards, and are not intended to be an alternative to financial measures prepared in accordance with GAAP. Non-GAAP financial measures should be considered in addition to, and not as a substitute for or superior to, financial measures determined in accordance with GAAP. Investors are advised to carefully review the GAAP financial results that are disclosed in our SEC filings.
46
The following is a reconciliation of net income (loss), the most comparable GAAP measure, to Adjusted EBITDA:
|
Fiscal Years Ended July 31,
(In thousands)
|
||||||||||||||||
|
2018
|
2017
|
2016
|
2015
|
2014
|
||||||||||||
|
Adjusted EBITDA:
|
||||||||||||||||
|
Net income (loss)
|
$
|
29,769
|
|
15,827
|
|
(7,738
|
)
|
23,245
|
|
25,151
|
|
|||||
|
Income taxes
|
(5,143
|
)
|
9,654
|
|
(454
|
)
|
10,758
|
|
13,356
|
|
||||||
|
Interest (income) and other expense
|
254
|
|
(68
|
)
|
(134
|
)
|
(405
|
)
|
(913
|
)
|
||||||
|
Interest expense
|
10,195
|
|
11,629
|
|
7,750
|
|
479
|
|
6,304
|
|
||||||
|
Amortization of stock-based compensation
|
8,569
|
|
8,506
|
|
4,117
|
|
4,363
|
|
4,263
|
|
||||||
|
Amortization of intangibles
|
21,075
|
|
22,823
|
|
13,415
|
|
6,211
|
|
6,285
|
|
||||||
|
Depreciation
|
13,655
|
|
14,354
|
|
9,830
|
|
6,525
|
|
6,721
|
|
||||||
|
Settlement of intellectual property litigation
|
—
|
|
(12,020
|
)
|
—
|
|
—
|
|
—
|
|
||||||
|
Acquisition plan expenses
|
—
|
|
—
|
|
21,276
|
|
—
|
|
—
|
|
||||||
|
Strategic alternatives analysis and other
|
—
|
|
—
|
|
—
|
|
585
|
|
225
|
|
||||||
|
Restructuring (benefits) charges related to the wind-down of microsatellite product line
|
—
|
|
—
|
|
—
|
|
—
|
|
(56
|
)
|
||||||
|
Adjusted EBITDA
|
$
|
78,374
|
|
70,705
|
|
48,062
|
|
51,761
|
|
61,336
|
|
|||||
Our historical results prior to February 23, 2016 do not include TCS; as such, you should not rely on period-to-period comparisons as an indicator of future performance as these comparisons may not be meaningful.
FINANCIAL CONDITION AND RESULTS OF OPERATIONS
Overview
We are a leading provider of advanced communications solutions for both commercial and government customers worldwide. Our solutions fulfill our customers' needs for secure wireless communications in some of the most demanding environments, including those where traditional communications are unavailable or cost-prohibitive, and in mission-critical and other scenarios where performance is crucial.
We manage our business through two reportable operating segments:
|
•
|
Commercial Solutions
- serves commercial customers and smaller governments, such as state and local governments, that require advanced communication technologies to meet their needs. This segment also serves certain large government customers (including the U.S. government) that have requirements for off-the-shelf commercial equipment. We believe this segment is a leading provider of satellite communications (such as satellite earth station modems and traveling wave tube amplifiers ("TWTA")), public safety systems (such as next generation 911 ("NG911") technologies) and enterprise application technologies (such as a messaging and trusted location-based technologies).
|
|
•
|
Government Solutions
- serves large government end-users (including those of foreign countries) that require mission critical technologies and systems. We believe this segment is a leading provider of command and control applications (such as the design, installation and operation of data networks that integrate computing and communications (including both satellite and terrestrial links)), ongoing network operation and management support services including project management and fielding and maintenance solutions related to satellite ground terminals), troposcatter communications (such as digital troposcatter multiplexers, digital over-the-horizon modems, troposcatter systems, and frequency converter systems) and RF power and switching technologies (such as solid state high-power broadband amplifiers, enhanced position location reporting system (or commonly known as "EPLRS") amplifier assemblies, identification friend or foe amplifiers, and amplifiers used in the counteraction of improvised explosive devices).
|
47
Our Quarterly Financial Information
Quarterly and period-to-period sales and operating results may be significantly affected by either short-term or long-term contracts with our customers. In addition, our gross profit is affected by a variety of factors, including the mix of products, systems and services sold, production efficiencies, estimates of warranty expense, price competition and general economic conditions. Our gross profit may also be affected by the impact of any cumulative adjustments to contracts that are accounted for over time.
Our contracts with the U.S. government can be terminated for convenience by it at any time and orders are subject to unpredictable funding, deployment and technology decisions by the U.S. government. Some of these contracts are indefinite delivery/indefinite quantity ("IDIQ") contracts and, as such, the U.S. government is not obligated to purchase any equipment or services under these contracts. We have, in the past, experienced and we continue to expect significant fluctuations in sales and operating results from quarter-to-quarter and period-to-period. As such, comparisons between periods and our current results may not be indicative of a trend or future performance.
Our historical results prior to February 23, 2016 do not include TeleCommunication Systems, Inc. ("TCS"). Given the integration of TCS into our business and the joint marketing of our products, historical sales patterns and mix trends are not relevant. As a result, period-to-period comparisons of sales, margins, operating income and Adjusted EBITDA contributions between TCS and Comtech legacy products will not be meaningful and you should not rely on period-to-period comparisons as an indicator of future performance.
Critical Accounting Policies
We consider certain accounting policies to be critical due to the estimation process involved in each.
Revenue Recognition.
We earn revenue from the sale of advanced communication solutions to customers around the world. Sales of advanced communication solutions can consist of any one or a combination of items required by our customer including hardware, technology platforms and related support. A large portion of our revenue from advanced communication solutions is derived from contracts relating to the design, development or manufacture of complex electronic equipment to a buyer’s specification or to provide services relating to the performance of such contracts and is recognized in accordance with Financial Accounting Standards Board ("FASB") Accounting Standards Codification ("ASC") 605-35. For these contracts, we primarily apply the percentage-of-completion accounting method and generally recognize revenue based on the relationship of total costs incurred to total projected costs, or, alternatively, based on output measures, such as units delivered or produced. Profits expected to be realized on such contracts are based on total estimated sales for the contract compared to total estimated costs, including warranty costs, at completion of the contract.
Direct costs which include materials, labor and overhead are charged to work-in-progress (including our contracts-in-progress) inventory or cost of sales. Indirect costs relating to long-term contracts, which include expenses such as general and administrative, are charged to expense as incurred and are not included in our work-in-process (including our contracts-in-progress) inventory or cost of sales. Total estimates are reviewed and revised periodically throughout the lives of the contracts, and adjustments to profits resulting from such revisions are made cumulative to the date of the change. Estimated losses on long-term contracts are recorded in the period in which the losses become evident. Long-term U.S. government cost-reimbursable type contracts are also specifically covered by FASB ASC 605-35.
We have been engaged in the production and delivery of goods and services on a continual basis under contractual arrangements for many years. Historically, we have demonstrated an ability to accurately estimate total revenues and total expenses relating to our long-term contracts. However, there exist inherent risks and uncertainties in estimating revenues, expenses and progress toward completion, particularly on larger or longer-term contracts. If we do not accurately estimate the total sales, related costs and progress towards completion on such contracts, the estimated gross margins may be significantly impacted or losses may need to be recognized in future periods. Any such resulting changes in margins or contract losses could be material to our results of operations and financial condition.
In addition, most government contracts have termination for convenience clauses that provide the customer with the right to terminate the contract at any time. Such terminations could impact the assumptions regarding total contract revenues and expenses utilized in recognizing profit under the percentage-of-completion method of accounting. Changes to these assumptions could materially impact our results of operations and financial condition. Historically, we have not experienced material terminations of our long-term contracts. We also address customer acceptance provisions in assessing our ability to perform our contractual obligations under long-term contracts. Our inability to perform on our long-term contracts could materially impact our results of operations and financial condition. Historically, we have been able to perform on our long-term contracts.
48
We also derive a portion of our revenues for advanced communication solutions from contracts and purchase orders where revenue is recorded on delivery of products or performance of services. Such revenues are recognized in accordance with the authoritative guidance contained in FASB ASC 605-25 "
Revenue Recognition - Multiple Deliverable Revenue Arrangements
" ("FASB ASC 605-25") and, as applicable, FASB ASC 605-20 "
Revenue Recognition - Services
" ("FASB ASC 605-20") and Accounting Standards Update ("ASU") No. 2009-14 (FASB ASC Topic 985) "
Certain Revenue Arrangements That Include Software Elements
." Revenue recognition for multiple-element arrangements requires judgment to determine if multiple elements exist, whether elements can be accounted for as separate units of accounting, and if so, the fair value for each of the elements. In summary, we recognize revenue for each separate unit of accounting when the applicable revenue recognition criteria for each element have been met. We allocate revenue to each separate unit of accounting in a multi-element arrangement based on the relative fair value of each element, using vendor-specific objective evidence ("VSOE") of their fair values, if available. VSOE is generally determined based on the price charged when an element is sold separately. In the absence of VSOE of fair value, the fee is allocated among each element based on third-party evidence ("TPE") of fair value, which is determined based on competitor pricing for similar deliverables when sold separately. When we are unable to establish fair value using VSOE or TPE, we use estimated selling price ("ESP") to allocate value to each element. The objective of ESP is to determine the price at which we would transact a sale if the product or service were sold separately. We determine ESP for deliverables by considering multiple factors including, but not limited to, prices we charge for similar offerings, market conditions, competitive landscape, and pricing practices. For multiple element arrangements that contain only software and software-related elements, we allocate the fees to each element based on the VSOE of fair value of each element. Due to the nature of some of the agreements it may be difficult to establish VSOE of separate elements of an agreement; in these circumstances the appropriate recognition of revenue may require the use of judgment based on the particular facts and circumstances.
As further discussed in "
Notes to Consolidated Financial Statements - Note (1)(c) - Summary of Significant Accounting and Reporting Policies - Revenue Recognition
" included in "
Part II - Item 8. - Financial Statements and Supplementary Data,
" on August 1, 2018 (the start of our first quarter of fiscal 2019), we adopted FASB ASU No. 2014-09 "
Revenue from Contracts with Customers (Topic 606),
" which replaces numerous requirements in U.S. GAAP, including industry specific requirements, and provides a single revenue recognition model for contracts with customers. The ASU applies to all open contracts existing as of August 1, 2018. As provided by the ASU, we adopted the new revenue recognition model using the modified retrospective method and there was no material impact on our business, results of operations and financial condition. In fiscal 2019, we expect to recognize a significant portion of our contracts over time, as there is a continuous transfer of control to the customer over the contractual period of performance. The remainder of our contracts will be recognized at a point in time. Both of these methods are similar to what we did prior to August 1, 2018.
Impairment of Goodwill and Other Intangible Assets
.
As of
July 31, 2018
, total goodwill recorded on our Consolidated Balance Sheet aggregated
$290.6 million
(of which
$231.4 million
relates to our Commercial Solutions segment and
$59.2 million
relates to our Government Solutions segment). Additionally, as of
July 31, 2018
, net intangibles recorded on our Consolidated Balance Sheet aggregated
$240.8 million
(of which $199.0 million relates to our Commercial Solutions segment and $41.8 million relates to our Government Solutions segment). Each of our two operating segments constitutes a reporting unit and we must make various assumptions in determining their estimated fair values.
In accordance with FASB ASC 350 "
Intangibles - Goodwill and Other,"
we perform a goodwill impairment analysis at least annually (in the first quarter of each fiscal year), unless indicators of impairment exist in interim periods. If we fail the quantitative assessment of goodwill impairment ("quantitative assessment"), pursuant to our adoption of FASB ASU No. 2017-04 in fiscal 2017, we would be required to recognize an impairment loss equal to the amount that a reporting unit's carrying value exceeded its fair value; however, any loss recognized should not exceed the total amount of goodwill allocated to that reporting unit.
On August 1, 2018 (the first day of our fiscal 2019), we performed our annual quantitative assessment using market participant assumptions to determine if the fair value of each of our reporting units with goodwill exceeded its carrying value. In making this assessment, we considered, among other things, expectations of projected net sales and cash flows, assumptions impacting the weighted average cost of capital, trends in trading multiples of comparable companies, changes in our stock price and changes in the carrying values of our reporting units with goodwill. We also considered overall business conditions.
49
In performing the quantitative assessment, we estimated the fair value of each of our reporting units using a combination of the income and market approaches. The income approach, also known as the discounted cash flow ("DCF") method, utilizes the present value of cash flows to estimate fair value. The future cash flows for our reporting units were projected based on our estimates, at that time, of future revenues, operating income and other factors (such as working capital and capital expenditures). For purposes of conducting our impairment analysis, we assumed revenue growth rates and cash flow projections that are below our actual long-term expectations. The discount rates used in our DCF method were based on a weighted-average cost of capital ("WACC") determined from relevant market comparisons, adjusted upward for specific reporting unit risks (primarily the uncertainty of achieving projected operating cash flows). A terminal value growth rate was applied to the final year of the projected period and reflected our estimate of stable, perpetual growth. We then calculated a present value of the respective cash flows for each reporting unit to arrive at an estimate of fair value under the income approach. Under the market approach, we estimated a fair value based on comparable companies' market multiples of revenues and earnings before interest, taxes, depreciation and amortization and factored in a control premium. Finally, we compared our estimates of fair values to our August 1, 2018 total public market capitalization and assessed implied control premiums based on our common stock price of
$33.70
as of August 1, 2018.
Based on our quantitative evaluation, we determined that our Commercial Solutions and Government Solutions reporting units had estimated fair values in excess of their carrying values of at least
42.5%
and
105.5%
, respectively, and concluded that our goodwill was not impaired and that neither of our
two
reporting units was at risk of failing the quantitative assessment. It is possible that, during fiscal 2019 or beyond, business conditions (both in the U.S. and internationally) could deteriorate from the current state, our current or prospective customers could materially postpone, reduce or even forgo purchases of our products and services to a greater extent than we currently anticipate, or our common stock price could decline. A significant decline in our customers' spending that is greater than we anticipate or a shift in funding priorities may also have a negative effect on future orders, sales, income and cash flows and we might be required to perform a quantitative assessment during fiscal 2019 or beyond. If assumed net sales and cash flow projections are not achieved in future periods or our common stock price significantly declines from current levels, our Commercial Solutions and Government Solutions reporting units could be at risk of failing the quantitative assessment and goodwill and intangibles assigned to the respective reporting units could be impaired.
In any event, we are required to perform the next annual goodwill impairment analysis on August 1, 2019 (the start of our fiscal 2020). If our assumptions and related estimates change in the future, or if we change our reporting unit structure or other events and circumstances change (e.g., a sustained decrease in the price of our common stock (considered on both absolute terms and relative to peers)), we may be required to record impairment charges when we perform these tests, or in other future periods. In addition to our impairment analysis of goodwill, we also review net intangible assets with finite lives when an event occurs indicating the potential for impairment. We believe that the carrying values of our net intangible assets were recoverable as of July 31, 2018. Any impairment charges that we may record in the future could be material to our results of operations and financial condition.
Provision for Warranty Obligations.
We provide warranty coverage for most of our products, including products under long-term contracts, for a period of at least one year from the date of shipment. We record a liability for estimated warranty expense based on historical claims, product failure rates and other factors. Costs associated with some of our warranties that are provided under long-term contracts are incorporated into our estimates of total contract costs. There exist inherent risks and uncertainties in estimating warranty expenses, particularly on larger or longer-term contracts. If we do not accurately estimate our warranty costs, any changes to our original estimates could be material to our results of operations and financial condition.
Accounting for Income Taxes.
Our deferred tax assets and liabilities are determined based on temporary differences between financial reporting and tax bases of assets and liabilities, and applying enacted tax rates expected to be in effect for the year in which we expect the differences to reverse. Our provision for income taxes is based on domestic (including federal and state) and international statutory income tax rates in the tax jurisdictions where we operate, permanent differences between financial reporting and tax reporting and available credits and incentives. We recognize interest and penalties related to uncertain tax positions in income tax expense. The U.S. federal government is our most significant income tax jurisdiction.
50
Significant judgment is required in determining income tax provisions and tax positions. We may be challenged upon review by the applicable taxing authority and positions taken by us may not be sustained. We recognize all or a portion of the benefit of income tax positions only when we have made a determination that it is more likely than not that the tax position will be sustained upon examination, based upon the technical merits of the position and other factors. For tax positions that are determined as more likely than not to be sustained upon examination, the tax benefit recognized is the largest amount of benefit that is greater than 50% likely of being realized upon ultimate settlement. The development of valuation allowances for deferred tax assets and reserves for income tax positions requires consideration of timing and judgments about future taxable income, tax issues and potential outcomes, and are subjective critical estimates. A portion of our deferred tax assets consist of federal net operating losses and federal research and experimentation tax credit carryforwards, most of which was acquired in connection with our acquisition of TCS. No valuation allowance has been established on these deferred tax assets based on our evaluation that our ability to realize such assets has met the criteria of "more likely than not." We continuously evaluate additional facts representing positive and negative evidence in determining our ability to realize these deferred tax assets. In certain circumstances, the ultimate outcome of exposures and risks involves significant uncertainties. If actual outcomes differ materially from these estimates, they could have a material impact on our results of operations and financial condition.
On December 22, 2017, H.R.1, also known as the Tax Cuts and Jobs Act ("Tax Reform") was enacted in the U.S. Tax Reform significantly revised the U.S. tax code and lowered the amount of our current and future income tax expense primarily due to the reduction in the U.S. statutory income tax rate from 35.0% to 21.0%. This provision went into effect on January 1, 2018 and required us to remeasure our deferred tax assets and liabilities. In fiscal 2019 and beyond, Tax Reform will result in the loss of our ability to take the domestic production activities deduction, which has been repealed, and is likely to result in lower tax deductions for certain executive compensation expenses.
During the fiscal year ended
July 31, 2018
, we recorded an estimated net discrete tax benefit of $11.8 million which, as a result of Tax Reform, primarily related to the remeasurement of deferred tax liabilities associated with non-deductible amortization related to intangible assets. The remeasurement was recorded pursuant to ASC 740
"Income Taxes"
and SEC Staff Accounting Bulletin ("SAB") 118. All amounts recorded were based on available guidance on interpretation of Tax Reform and what we believe to be reasonable approaches to estimating its impact; however, such amounts are provisional estimates at this time and are subject to adjustment as future guidance becomes available, additional facts become known or estimation approaches are refined. See
"Notes to Consolidated Financial Statements - Note (10) - Income Taxes"
included in
"Part II - Item 8.- Financial Statements and Supplementary Data,"
included in this Annual Report on Form 10-K, for further information on the provisions of Tax Reform and its currently expected impact on our business. The overall actual impact of Tax Reform is currently uncertain, and could have a material adverse effect on our consolidated results of operations and financial condition.
Since November 2017, our federal income tax return for fiscal 2016 has been under audit by the IRS. The audit is ongoing and we are unaware of any proposed adjustments by the IRS. Our federal income tax returns for fiscal 2015 and 2017 are also subject to potential future IRS audit. None of our state income tax returns prior to fiscal 2014 are subject to audit. TCS' federal income tax returns for tax years 2014 and 2015 and tax period from January 1, 2016 to February 23, 2016 are subject to potential future IRS audit. None of TCS' state income tax returns prior to calendar year 2013 are subject to audit. The results of the IRS tax audit for fiscal 2016, future tax assessments or settlements could have a material adverse effect on our consolidated results of operations and financial condition.
Research and Development Costs.
We generally expense all research and development costs. Research and development expenses include payroll, employee benefits, stock-based compensation expense, and other personnel-related expenses associated with product development. Research and development expenses also include third-party development and programming costs. Costs incurred internally in researching and developing software to be sold are charged to expense until technological feasibility has been established for the software. Judgment is required in determining when technological feasibility of a product is established. Technological feasibility for our advanced communication software solutions is generally reached after all high-risk development issues have been resolved through coding and testing. Generally, this occurs shortly before the products are released to customers and when we are able to validate the marketability of such product. Once technological feasibility is established, all software costs are capitalized until the product is available for general release to customers. To-date, we have not capitalized any of our internally developed software costs.
Provisions for Excess and Obsolete Inventory.
We record a provision for excess and obsolete inventory based on historical and future usage trends. Other factors may also influence our provision, including decisions to exit a product line, technological change and new product development. These factors could result in a change in the amount of excess and obsolete inventory on hand. Additionally, our estimates of future product demand may prove to be inaccurate, in which case we may have understated or overstated the provision required for excess and obsolete inventory. In the future, if we determine that our inventory was overvalued, we would be required to recognize such costs in our financial statements at the time of such determination. Any such charge could be material to our results of operations and financial condition.
51
Allowance for Doubtful Accounts.
We perform credit evaluations of our customers and adjust credit limits based upon customer payment history and current creditworthiness, as determined by our review of our customers’ current credit information. Generally, we will require cash in advance or payment secured by irrevocable letters of credit before an order is accepted from an international customer that we do not do business with regularly. In addition, we seek to obtain insurance for certain domestic and international customers.
We monitor collections and payments from our customers and maintain an allowance for doubtful accounts based upon our historical experience and any specific customer collection issues that we have identified. In light of ongoing tight credit market conditions, we continue to see requests from our customers for higher credit limits and longer payment terms. Because of our strong cash position and the nominal amount of interest we are earning on our cash and cash equivalents, we have, on a limited basis, approved certain customer requests.
We continue to monitor our accounts receivable credit portfolio. Our overall credit losses have historically been within our expectations of the allowances established; however, we cannot guarantee that we will continue to experience the same credit loss rates that we have in the past. Measurement of credit losses requires consideration of historical loss experience, including the need to adjust for changing business conditions, and judgments about the probable effects of relevant observable data, including present economic conditions such as delinquency rates and the financial health of specific customers. Changes to the estimated allowance for doubtful accounts could be material to our results of operations and financial condition.
Results of Operations
The following table sets forth, for the periods indicated, certain income and expense items expressed as a percentage of our consolidated net sales:
|
|
Fiscal Years Ended July 31,
|
||||||||
|
|
2018
|
2017
|
2016
|
||||||
|
Gross margin
|
39.2
|
%
|
39.6
|
%
|
41.7
|
%
|
|||
|
Selling, general and administrative expenses
|
20.0
|
%
|
21.1
|
%
|
23.1
|
%
|
|||
|
Research and development expenses
|
9.4
|
%
|
9.9
|
%
|
10.3
|
%
|
|||
|
Settlement of intellectual property litigation
|
—
|
%
|
(2.2
|
)%
|
—
|
%
|
|||
|
Acquisition plan expenses
|
—
|
%
|
—
|
%
|
5.2
|
%
|
|||
|
Amortization of intangibles
|
3.7
|
%
|
4.1
|
%
|
3.3
|
%
|
|||
|
Operating income (loss)
|
6.2
|
%
|
6.7
|
%
|
(0.1
|
)%
|
|||
|
Interest expense (income) and other, net
|
1.8
|
%
|
2.1
|
%
|
1.9
|
%
|
|||
|
Income (loss) before (benefit from) provision for income taxes
|
4.3
|
%
|
4.6
|
%
|
(2.0
|
)%
|
|||
|
Net income (loss)
|
5.2
|
%
|
2.9
|
%
|
(1.9
|
)%
|
|||
|
Adjusted EBITDA (a Non-GAAP measure)
|
13.7
|
%
|
12.8
|
%
|
11.7
|
%
|
|||
For a definition and explanation of Adjusted EBITDA, see "
Item 6. Selected Consolidated Financial Data - Non-GAAP Financial Data"
and "
Item 7. Management’s Discussion and Analysis of Financial Condition and Results of Operations - Comparison of Fiscal
2018
and
2017
- Adjusted EBITDA."
52
Business Outlook for Fiscal
2019
In almost every respect, fiscal 2018 exceeded our expectations and we generated consolidated:
|
•
|
Net sales of
$570.6 million
;
|
|
•
|
Operating income of
$35.1 million
;
|
|
•
|
Net income of
$29.8 million
;
|
|
•
|
Cash flows from operating activities of
$50.3 million
; and
|
|
•
|
Adjusted EBITDA (a Non-GAAP financial measure discussed below) of
$78.4 million
.
|
Our fiscal 2018 results reflect the impact of strong demand for almost all of our products.
Our pipeline of opportunities remains strong and overall business activity is at the highest level it has been in several years. During fiscal
2018
, we achieved a consolidated book-to-bill ratio (a measure defined as bookings divided by net sales) of
1.32
and finished fiscal 2018 with a record high consolidated backlog of
$630.7 million
. Our backlog, as more fully defined in
"Part I - Item 1. Business"
included in this Annual Report on Form 10-K, generally consists of funded and firm contract orders and does not include the unfunded portions of multi-year U.S. government contracts. As such, the total value of multi-year contracts that we have received is substantially higher than our reported backlog.
As of July 31, 2018, our cash and cash equivalents were
$43.5 million
and our total debt outstanding was
$171.3 million
(excluding unamortized deferred financing costs). Given our strong fiscal 2018 operating cash flows, we have successfully reduced the level of our total indebtedness since the beginning of our fiscal year by
$29.2 million
.
Looking forward, we believe that fiscal 2019 will be even better and have established the following consolidated financial targets:
|
•
|
Net sales goal with a range of approximately $600.0 million to $625.0 million.
|
|
•
|
Achievement of a consolidated fiscal 2019 book-to-bill ratio in excess of 1.0.
|
|
•
|
Total annual amortization of intangibles to approximate $17.2 million.
|
|
•
|
Total depreciation expense is expected to range from $13.0 million to $14.0 million.
|
|
•
|
Total amortization of stock-based compensation is expected to range from approximately $10.0 million to $12.0 million, which represents an increase from the $8.6 million amortized in fiscal 2018.
|
|
•
|
GAAP operating income, as a percentage of net sales, to be higher than the 6.2% we achieved in fiscal 2018.
|
|
•
|
Our interest expense rate (including amortization of deferred financing costs) is expected to range from 6.0% to 6.4% and our current cash borrowing rate is approximately 4.5%.
|
|
•
|
Our effective income tax rate (excluding discrete tax items in fiscal 2019) is expected to approximate 23.25% and reflects the full year benefit of the reduced U.S. statutory income tax rate resulting from Tax Reform. If the Internal Revenue Service issues clarifying or interpretive guidance, and/or new information becomes available, our estimated effective tax rate may change.
|
|
•
|
Adjusted EBITDA goal in a range of approximately $80.0 million to $86.0 million.
|
Given our strong growth prospects and the opportunities we see, we expect to continue making investments in sales, marketing and research and development efforts. In particular, we continue to invest in our HEIGHTS technology as well as our NG911 solutions. The markets for these technologies are expected to grow for many years ahead. In addition, we believe that fiscal 2019 will show the financial benefits of our tactical shift in strategy in our Government Solutions segment away from bidding on large commodity-type service contracts and toward pursuing contracts for our niche solutions with higher margins. In this regard, net sales in our Government Solutions segment are expected to increase both in dollars and as a percentage of our consolidated net sales.
53
Comparable to Comtech's business cycle for the past several years, financial performance in the second half of fiscal 2019 is expected to be higher than the first half of fiscal 2019. In addition, given the straight-line amortization expense associated with intangible assets with finite lives, we expect to report GAAP operating income slightly above break-even in the first quarter of fiscal 2019, with each of the remaining fiscal 2019 quarters achieving GAAP operating income. Our GAAP operating income and Adjusted EBITDA in our first quarter of fiscal 2019 are expected to be a bit better than the amounts we achieved in the first quarter of fiscal 2018. After considering the impact of expected fiscal 2019 interest expense and income taxes, like in fiscal 2018, we expect to report a slight GAAP net loss in the first quarter of fiscal 2019 and GAAP net income for the remainder of the year.
In addition, based on the anticipated timing of shipments and performance related to orders currently in our backlog and the timing of expected new orders, consolidated net sales and Adjusted EBITDA for each of our first three quarters of fiscal 2019 are expected to be a bit better when compared to the respective quarters of fiscal 2018. Our fourth quarter of fiscal 2019 is expected to be the peak quarter, by far, for consolidated net sales, operating income and Adjusted EBITDA.
Our revenue goal reflects our adoption of the Financial Accounting Standards Board's Accounting Standards Codification Topic 606 - "
Revenue from Contracts with Customers
," the impact of which was not material. In fiscal 2019, we expect to recognize a significant portion of our contracts over time, as there is a continuous transfer of control to the customer over the contractual period of performance. The remainder of our contracts will be recognized at a point in time. Both of these methods are similar to what we did prior to August 1, 2018. Although the amount and timing of orders are difficult to predict, we expect to receive at least one additional order for our Blue Force Tracker-2 High Capacity ("BFT-2-HC") mobile satellite transceivers in fiscal 2019. If we receive and can ship multiple or very large orders for our BFT-2-HC mobile satellite transceivers, actual fiscal 2019 net sales, operating income and Adjusted EBITDA could ultimately be higher.
If order flow remains strong and we are able to achieve all of our fiscal 2019 business goals, it is possible that financial results could be higher than our targeted amounts.
Our Business Outlook for Fiscal
2019
and related targets reflect the following:
|
•
|
Our Commercial Solutions segment is expected to benefit from increased sales of satellite earth station products (which include satellite modems and solid-state power amplifiers ("SSPAs")). In fiscal 2018, we experienced significant growth in our sales to U.S. government customers and we expect demand to remain strong. During fiscal 2018, we received a multi-year follow-on contract with a potential value of up to $19.1 million to provide the U.S. Navy's Space and Naval Warfare Systems Command with Advanced Time Division Multiple Access ("TDMA") Interface Processor ("ATIP") production terminals. We also recently received a strategic $59.0 million multi-year contract award from the U.S. Navy to purchase our SLM-5650B satellite modems, upgrade kits and related services. During fiscal 2019, we expect to receive additional funding against this IDIQ contract and make additional shipments during the second half of fiscal 2019.
|
|
•
|
In addition to increased demand from our U.S. government customers, we believe we will benefit from increased sales of our HEIGHTS solutions which continue to gain traction. During fiscal 2018, Orange Business Services, one of the largest telecommunications operators and IT services companies in the world, selected HEIGHTS to support relief projects in two African countries. This award is a testament to our HEIGHTS products and bodes well for future orders from this and other similar customers. Although the sales cycle for this product is longer than our historical satellite earth station product line, during fiscal 2018, we continued to seed and invest in the market. During fiscal 2019, HEIGHTS will continue to be a focus of our marketing and sales efforts. We also expect incremental fiscal 2019 revenue contributions from our new high-frequency amplifier products which support high-speed satellite networks. We believe we have a market leading technology and recently received an award of over $20.0 million from a systems integrator for these products. This is the first large scale deployment of this technology and we expect such products to be delivered over the next two fiscal years. All-in-all, after several years of sequentially lower sales, we believe that fiscal 2019 will be our second consecutive year of revenue growth for our satellite earth station product line.
|
54
|
•
|
Our Commercial Solutions segment sales contributions from enterprise technology solutions (such as our location and messaging platforms) and safety and security technology solutions (such as our wireless and next generation 911 ("NG911") platforms) in fiscal 2019 are expected to be similar to what we achieved in fiscal 2018. These technologies have been deployed around the U.S., are used by wireless carriers to provide Short-Message-Service ("SMS") texts to end-customers and are also used to communicate with 911 public safety answering points ("PSAPs"). During fiscal 2018, we were awarded several large multi-year strategic contracts. We were awarded a contract valued at $134.0 million to provide safety and security technology solutions to one of the largest wireless carriers in the U.S. As a result of this contract, we will become the leading provider to this wireless carrier for enhanced 911 ("E911") services for its nationwide 3G, 4G and 5G networks. We were also awarded a $10.1 million multi-year contract to provide this same wireless carrier with a hosted, advanced location services platform which leverages our Position Determining Engine ("PDE"). Under this competitively awarded contract, the U.S. wireless carrier is expected to migrate existing location services from a competing solution to our more advanced, secure and reliable technologies. Additionally, we received an aggregate of $96.2 million of contracts from AT&T, which provide for a variety of safety and security technology and enterprise technology solutions including NG911 public safety Call Handling and Emergency Services IP Network ("ESInet") and E911 solutions. We were also awarded multi-year contract renewals worth $19.5 million for various SMS related services and applications, of which $14.2 million was received during the fourth quarter of fiscal 2018. In our view, all of these contract awards validate that our enterprise technology solutions and safety and security technology solutions are more advanced, secure and reliable than any existing competitive technology. We believe that market conditions for safety and security technology solutions and enterprise technology solutions remain favorable, but they have long sales cycles and are subject to difficult-to-predict changes in the overall procurement strategies of wireless carrier customers.
|
|
•
|
Our Government Solutions segment is anticipated to show significant revenue growth and improvement in operating income margins as a result of our tactical shift in strategy toward pursuing contracts for our niche solutions with higher margins, rather than large commodity-type service contracts. During fiscal 2018, we achieved a book-to-bill ratio of 1.31 in this segment and booked a number of important orders, including a three-year $123.6 million IDIQ contract from the U.S. Army to provide ongoing sustainment services for the AN/TSC-198A SNAP (Secret Internet Protocol Router ("SIPR") and Non-classified Internet Protocol Router ("NIPR") Access Point), Very Small Aperture Terminals ("VSATs"). In fiscal 2018, we received $33.5 million of funded orders related to such contract. We also received over $65.0 million of orders during fiscal 2018 to supply Manpack Satellite Terminals and networking equipment and other advanced VSAT products pursuant to our Global Tactical Advanced Communication Systems ("GTACS") contract with the U.S. Army's PM Tactical Network, which has a remaining contract value of $123.5 million as of July 31, 2018. Additionally, bookings in fiscal 2018 reflect an increase in orders from a major U.S. space contractor to source and test space level Electrical, Electronic and Electromechanical ("EEE") parts in support of critical NASA programs. Fiscal 2019 is expected to reflect sales and operating income contributions from these orders. We are also named as a final awardee on a ten-year, $2.5 billion IDIQ contract commonly referred to as "Complex Commercial SATCOM Solutions" (or "CS3") from the General Services Administration, which allows U.S. federal agencies to purchase end-to-end, turnkey solutions which incorporate commercial satellite solutions. Over time, we would expect to secure new orders from the CS3 contract.
|
|
•
|
In our Government Solutions segment, our field-proven technologies and support services are ideally suited to meet the U.S. DoD’s C4ISR needs and we are actively pursuing many opportunities. During fiscal 2018, in addition to those orders discussed above, we received $5.0 million of funding from the Consortium Management Group ("CMG") to support the U.S. Army Project Manager Mission Command ("PM MC") and the Blue Force Tracking-2 ("BFT-2") program to port additional waveforms onto the current BFT-2 transceivers. Separately, we continue to work with the U.S. Army to deploy several thousand of our next generation MT-2025 mobile satellite transceivers, which are also known as the Blue Force Tracker-2 High Capacity ("BFT-2-HC") satellite transceivers. The MT-2025 transceivers meet BFT-2 protocols, provide best-in-class reliability and are fully backward compatible with the BFT-1 system. Comtech currently provides sustaining support for the BFT-1 system and previously shipped over 100,000 BFT-1 mobile satellite transceivers. Shipments of our MT-2025 transceivers against our initial $11.7 million order began during the fourth quarter of fiscal 2018 and are expected to continue in fiscal 2019. Additional orders for our MT-2025 transceivers are ultimately expected. Although the amount and timing of orders are difficult to predict, we believe we will receive at least one additional order for our MT-2025 transceivers in fiscal 2019.
|
55
|
•
|
Our Government Solutions segment is expected to benefit from continued strong demand from customers for our over-the-horizon microwave systems and products. During the fourth quarter of fiscal 2018, we were awarded an order valued at $31.0 million for our Modular Transportable Transmission System ("MTTS") troposcatter terminals to be utilized as part of a deployable communications network for an Asia Pacific military service. In September 2018, we also just announced the receipt of a $9.1 million contract to supply another foreign military customer with our over-the-horizon microwave systems. We are also awaiting feedback from the U.S. government in response to a large multi-year RFP for the supply of new troposcatter communications equipment to replace hundreds of the U.S. DoD’s AN/TRC-170 terminals. Although an award of this program is not expected to generate significant revenue or operating income in fiscal 2019, if the award is received, we would expect it to make significant contributions to revenue and operating income in subsequent years.
|
Our Business Outlook for Fiscal
2019
depends, in large part, on timely deliveries and the receipt of and performance on orders from our customers and could be adversely impacted if orders and/or deliveries are delayed, business conditions deteriorate or our current or prospective customers materially postpone, reduce or even forgo purchases of our products and services. Additionally, we continue to evaluate cost reduction initiatives in our business. Such actions primarily relate to reducing the size and cost of our facilities. Our Business Outlook for Fiscal
2019
does not consider the financial impact of any actions we may take.
On
September 26, 2018
, our Board of Directors declared a dividend of
$0.10
per common share, payable on
November 16, 2018
to stockholders of record at the close of business on
October 17, 2018
. Future dividends remain subject to compliance with financial covenants under our Secured Credit Facility, as amended, as well as Board approval.
Additional information related to our Business Outlook for Fiscal
2019
and a definition and explanation of Adjusted EBITDA
is included in the below section
"Item 7. Management’s Discussion and Analysis of Financial Condition and Results of Operations - Comparison of Fiscal
2018
and
2017
."
Comparison of Fiscal
2018
and
2017
Net Sales.
Consolidated net sales were
$570.6
million and
$550.4
million for fiscal
2018
and
2017
, respectively, representing an
increase
of
$20.2
million, or
3.7%
. The period-over-period increase in net sales was due to higher net sales in both our Commercial Solutions and Government Solutions segments. Net sales by operating segment are discussed below.
Commercial Solutions
Net sales in our Commercial Solutions segment were
$345.1
million for fiscal
2018
, as compared to
$330.9
million for fiscal
2017
, an
increase
of
$14.2
million, or
4.3%
. Our Commercial Solutions segment represented
60.5%
of consolidated net sales for fiscal
2018
as compared to
60.1%
for fiscal
2017
.
Bookings in fiscal 2018 were strong and reflect strength in almost all of our Commercial Solutions product lines. Our book-to-bill ratio (a measure defined as bookings divided by net sales) in this segment for fiscal
2018
was 1.33 and, as further discussed below, we have a growing pipeline of opportunities.
Net sales of our satellite earth station products (which include SSPAs) in fiscal 2018 were higher than fiscal 2017, as we experienced significant growth in our sales to government customers. During fiscal 2018, we received a strategic $59.0 million multi-year contract award from the U.S. Navy to purchase our SLM-5650B satellite modems, upgrade kits and related services. Given the U.S. Navy's pressing operational needs, we shipped most of the SLM-5650B satellite modems during fiscal 2018, which positively impacted our operating income. Although timing for U.S. government orders are generally difficult to predict, we are optimistic that we will receive and ship additional orders for this equipment in fiscal 2019, as there are over eight-hundred older generation modems currently utilized by multiple Navy programs. We also received a multi-year follow-on contract with a potential value of up to $19.1 million to provide the U.S. Navy's Space and Naval Warfare Systems Command with Advanced Time Division Multiple Access ("TDMA") Interface Processor ("ATIP") production terminals. While international markets have become more volatile of late (including the unknown impact of ongoing international trade discussions) and we experienced lower sales to international customers in fiscal 2018 as compared to fiscal 2017, we do expect an increase in international sales in fiscal 2019. Our Heights
TM
Dynamic Network Access Technology ("HEIGHTS" or "HDNA") solutions experienced year-over-year revenue growth in fiscal 2018. Although the sales cycle for this product is longer than our historical satellite earth station product line, we believe this growth trend will continue into fiscal 2019.
56
Net sales in fiscal 2018 of both enterprise technology solutions (such as our location and messaging platforms) and safety and security technology solutions (such as our wireless and next generation 911 ("NG911") platforms) were higher as compared to the net sales we achieved in fiscal 2017. During fiscal 2018, we were awarded several large multi-year strategic contracts which are expected to contribute to fiscal 2019 sales. For instance, we were awarded a contract valued at $134.0 million to provide safety and security technology solutions to one of the largest wireless carriers in the U.S. As a result of this contract, we will become the leading provider to this wireless carrier for enhanced 911 ("E911") services for its nationwide 3G, 4G and 5G networks. We were also awarded a $10.1 million multi-year contract to provide this same wireless carrier with a hosted, advanced location services platform which leverages our Position Determining Engine ("PDE"). Under this competitively awarded contract, the U.S. wireless carrier is expected to migrate existing location services from a competing solution to our more advanced, secure and reliable technologies. Additionally, we received an aggregate of $96.2 million of contracts from AT&T, which provide for a variety of safety and security technology and enterprise technology solutions including NG911 public safety Call Handling and Emergency Services IP Network ("ESInet") and E911 solutions. We were also awarded multi-year contract renewals worth $19.5 million for various SMS related services and applications, of which $14.2 million was received during the fourth quarter of fiscal 2018. In our view, all of these contract awards validate that our enterprise technology solutions and safety and security technology solutions are more advanced, secure and reliable than any existing competitive technology. We believe that market conditions for safety and security technology solutions and enterprise technology solutions remain favorable and expect related net sales in fiscal 2019 to increase as compared to the level achieved in fiscal 2018. However, they have long sales cycles and are subject to difficult-to-predict changes in the overall procurement strategies of wireless carrier customers.
Bookings, sales and profitability in our Commercial Solutions segment can fluctuate from period-to-period due to many factors, including changes in the general business environment. As such, period-to-period comparisons of our results may not be indicative of a trend or future performance.
Government Solutions
Net sales in our Government Solutions segment were
$225.5
million for fiscal
2018
as compared to $
219.5
million for fiscal
2017
, an
increase
of $
6.0
million or
2.7%
. Our Government Solutions segment represented
39.5%
of consolidated net sales for fiscal
2018
, as compared to
39.9%
for fiscal
2017
.
The increase in net sales primarily reflects significantly higher net sales of our command and control solutions offset, in part, by significantly lower net sales of over-the-horizon microwave systems products and the absence of $6.7 million of BFT-1 intellectual property license fees in fiscal 2018.
Bookings in fiscal 2018 were strong and reflect strength in almost all of our Government Solutions product lines. Our book-to-bill ratio (a measure defined as bookings divided by net sales) in this segment for fiscal 2018 was 1.31 and, as further discussed below, we have a growing pipeline of opportunities.
We believe we are seeing benefits of our tactical shift in strategy in our Government Solutions segment away from bidding on large commodity-type service contracts and toward pursuing contracts for our niche solutions with higher margins. We believe our field-proven technologies and support services are ideally suited to meet the U.S. DoD’s C4ISR needs and we are actively pursuing many opportunities in this area. During fiscal 2018, we booked a number of important orders. For instance, we received $33.5 million of orders to provide ongoing sustainment services for the AN/TSC-198A SNAP (Secret Internet Protocol Router ("SIPR") and Non-classified Internet Protocol Router ("NIPR") Access Point), Very Small Aperture Terminals ("VSATs"). These orders were issued pursuant to a three-year $123.6 million IDIQ contract that we received in fiscal 2018 from the U.S. Army. SNAP terminals provide quick and mobile satellite communications capability to personnel in the field and Comtech is the sole provider to the U.S. Army of these sustainment services. We also received over $65.0 million of orders during fiscal 2018 related to our $223.4 million Global Tactical Advanced Communication Systems ("GTACS") contract with the U.S. Army's PM Tactical Network, which has a remaining contract value of $123.5 million as of July 31, 2018. These GTACS orders principally call for the supply of Manpack Satellite Terminals and networking equipment and other advanced VSAT products. Additionally, bookings and net sales in fiscal 2018 reflect an increase in orders from a major U.S. space contractor to source and test space level Electrical, Electronic and Electromechanical ("EEE") parts in support of critical NASA programs, as well as our performance on a contract with an international space agency for the design, development and installation of multiple launch vehicle tracking stations in the South Pacific.
57
Our Government Solutions segment received $5.0 million of funding in fiscal 2018 from the Consortium Management Group ("CMG") to support the U.S. Army Project Manager Mission Command ("PM MC") and the Blue Force Tracking-2 ("BFT-2") program to port additional waveforms onto the current BFT-2 transceivers. The BFT-2 system, which is part of the U.S. Army's JBC-P program, provides global real-time situational awareness and networking capabilities for U.S. warfighters and is the successor to the BFT-1 system. Separately, we continue to work with the U.S. Army to deploy several thousand of our next generation MT-2025 mobile satellite transceivers, which are also known as the Blue Force Tracker-2 High Capacity ("BFT-2-HC") satellite transceivers. The MT-2025 transceivers meet BFT-2 protocols, provide best-in-class reliability and are fully backward compatible with the BFT-1 system. Comtech currently provides sustaining support for the BFT-1 system and previously shipped over 100,000 BFT-1 mobile satellite transceivers. Shipments of our MT-2025 transceivers against our initial $11.7 million order began during the fourth quarter of fiscal 2018 and are expected to continue in fiscal 2019. Although the amount and timing of orders are difficult to predict, we expect to receive at least one additional order for our MT-2025 transceivers in fiscal 2019.
Although net sales of our over-the-horizon microwave systems products for fiscal 2018 were significantly lower than fiscal 2017, business activity in this product line picked up. Our marketing and sales efforts and investments to expand this product line and the level of our international business into new countries are yielding positive results. Earlier in fiscal 2018, we received $8.5 million in contracts to supply our Modular Transportable Transmission System ("MTTS") troposcatter terminals to two new international customers. During the fourth quarter of fiscal 2018, we were awarded an order valued at $31.0 million for our MTTS troposcatter terminals to be utilized as part of a deployable communications network for an Asia Pacific military service. Also, we announced in September 2018 the receipt of a $9.1 million contract to supply another foreign military with our over-the-horizon microwave systems. We believe demand for our over-the-horizon microwave systems will continue to increase. Teaming with a large prime contractor, we recently submitted a proposal to supply a significant quantity of our over-the-horizon microwave systems to the U.S. Army, and are hopeful that we can win this multi-million dollar award in fiscal 2019.
Backlog for this segment is at the highest level since our acquisition of TCS in February 2016. We see a growing pipeline of potential orders from large government end-users (including those of foreign countries) who have a growing need to mitigate threats using command and control technology solutions to increase decision-maker’s situational awareness. Based on the mix and anticipated timing of performance on orders in backlog and expected new orders, we anticipate that fiscal 2019 net sales for our Government Solutions segment will be significantly higher than fiscal 2018.
Bookings, sales and profitability in our Government Solutions segment can fluctuate dramatically from period-to-period due to many factors, including unpredictable funding, deployment and technology decisions by our U.S. and international government customers. As such, period-to-period comparisons of our results may not be indicative of a trend or future performance.
Geography and Customer Type
Sales by geography and customer type, as a percentage of related sales, for the fiscal years ended July 31,
2018
and
2017
are as follows:
|
|
Fiscal Years Ended July 31,
|
|||||||||||||||||
|
2018
|
2017
|
2018
|
2017
|
2018
|
2017
|
|||||||||||||
|
|
Commercial Solutions
|
Government Solutions
|
Consolidated
|
|||||||||||||||
|
U.S. government
|
18.1
|
%
|
15.1
|
%
|
62.2
|
%
|
59.2
|
%
|
35.5
|
%
|
32.7
|
%
|
||||||
|
Domestic
|
54.6
|
%
|
54.4
|
%
|
14.9
|
%
|
15.5
|
%
|
38.9
|
%
|
38.9
|
%
|
||||||
|
Total U.S.
|
72.7
|
%
|
69.5
|
%
|
77.1
|
%
|
74.7
|
%
|
74.4
|
%
|
71.6
|
%
|
||||||
|
International
|
27.3
|
%
|
30.5
|
%
|
22.9
|
%
|
25.3
|
%
|
25.6
|
%
|
28.4
|
%
|
||||||
|
Total
|
100.0
|
%
|
100.0
|
%
|
100.0
|
%
|
100.0
|
%
|
100.0
|
%
|
100.0
|
%
|
||||||
Sales to U.S. government customers include sales to the U.S. Department of Defense ("DoD"), intelligence and civilian agencies, as well as sales directly to or through prime contractors.
Domestic sales include sales to commercial customers, as well as to U.S. state and local governments. Included in domestic sales, are sales to Verizon Communications Inc. ("Verizon"), which represented
10.0%
of consolidated net sales for fiscal
2018
. There were no customers that represented more than
10%
of consolidated net sales for fiscal
2017
.
58
International sales for fiscal
2018
and
2017
(which include sales to U.S. domestic companies for inclusion in products that are sold to international customers) were
$145.8 million
and
$156.5 million
, respectively. Except for the U.S., no individual country (including sales to U.S. domestic companies for inclusion in products that are sold to a foreign country) represented more than
10%
of consolidated net sales for fiscal
2018
and
2017
.
Gross Profit.
Gross profit was
$223.9
million and $
218.2
million for fiscal
2018
and
2017
, respectively. The
increase
of $
5.7
million in gross profit dollars was largely driven by higher net sales and increased gross margins in our Commercial Solutions segment, partially offset by lower gross profit contributions from the Government Solutions segment. Gross profit in fiscal 2018 also benefited from a $0.7 million favorable warranty settlement and a $1.0 million favorable sales and use tax settlement, both of which are reflected in our unallocated segment. Gross profit, as a percentage of consolidated net sales, for fiscal
2018
was
39.2%
(or 38.9% when excluding the aforementioned favorable settlements), which was slightly lower than the
39.6%
achieved in fiscal
2017
. This decrease was primarily driven by lower gross margins in our Government Solutions segment that was partially offset by an improvement in gross margins in our Commercial Solutions segment and the aforementioned favorable settlements. Gross profit, as a percentage of related segment net sales, is further discussed below.
Our Commercial Solutions segment's gross profit, as a percentage of related segment net sales, for fiscal 2018 was higher than fiscal 2017. The increase was primarily due to higher net sales and overall favorable product mix changes. Our Business Outlook for Fiscal 2019 assumes we continue to seed and invest in the market for our HEIGHTS solutions and that related sales will grow significantly from the level we achieved in fiscal 2018. Today, HEIGHTS solutions have lower gross margins than our traditional Single Channel per Carrier ("SCPC") satellite earth station modems and given expected sales growth, our gross profit, as a percentage of satellite earth station product sales in fiscal 2019, will be lower as compared to fiscal 2018. Overtime, we believe that margins will improve as HEIGHTS volume increases. Overall, looking forward, based on the mix and anticipated timing of shipments and performance related to orders currently in our backlog and the mix and timing of expected new orders, gross profit for this segment, as a percentage of related segment net sales, for fiscal 2019 is expected to be lower than the level achieved in fiscal 2018.
Our Government Solutions segment's gross profit, as a percentage of related segment net sales, for fiscal 2018 was lower than fiscal 2017. The decrease was primarily driven by significantly lower net sales of over-the-horizon microwave systems products and the absence of $6.7 million of BFT-1 intellectual property license fees. Based on the mix and anticipated timing of shipments and performance related to orders currently in our backlog and the mix and timing of expected new orders, gross profit for this segment, as a percentage of related segment net sales, for fiscal 2019 is expected to be comparable to the level achieved in fiscal 2018.
Included in consolidated cost of sales for fiscal
2018
and
2017
are provisions for excess and obsolete inventory of
$5.6 million
and
$2.9 million
, respectively. As discussed in "
Item 7. Management's Discussion and Analysis of Financial Condition and Results of Operations - Critical Accounting Policies - Provisions for Excess and Obsolete Inventory,
"
we regularly review our inventory and record a provision for excess and obsolete inventory based on historical and projected usage assumptions.
Because our consolidated gross profit, as a percentage of consolidated net sales, depends on the volume of sales, sales mix and related gross profit for each individual segment, it is inherently difficult to forecast. Nevertheless, based on expected bookings, expected timing of our performance on orders, the absence of favorable settlements recorded in fiscal 2018 and the increase of Government Solutions segment sales as a percentage of consolidated net sales, we currently expect our consolidated gross profit, as a percentage of consolidated net sales, for fiscal 2019 to be similar to the percentage we achieved in fiscal 2018.
Selling, General and Administrative Expenses
.
Selling, general and administrative expenses were $
113.9
million and $
116.1
million for fiscal
2018
and
2017
, respectively, representing a
decrease
of $
2.2
million. As a percentage of consolidated net sales, selling, general and administrative expenses were
20.0%
and
21.1%
(or 22.1% in fiscal 2017 when excluding $5.5 million of favorable adjustments related to a recovery of legal expenses from a third party and adjustments related to reserves associated with the TCS acquisition that were no longer required). There were no comparable adjustments in fiscal 2018.
The
decrease
in fiscal 2018 spending, both in dollars and as a percentage of consolidated net sales, is primarily attributable to the benefit of cost reduction actions previously initiated and, to a lesser extent, higher consolidated net sales during fiscal
2018
, as discussed above. We continue to evaluate and implement cost reduction initiatives to reduce unnecessary spending, reduce the size and cost of our facilities and improve our productivity. Our Business Outlook for Fiscal 2019 does not consider the financial impact of any actions we may take.
Amortization of stock-based compensation expense recorded as selling, general and administrative expenses was
$6.9 million
in fiscal
2018
as compared to
$7.1 million
in fiscal
2017
. Amortization in fiscal 2018 includes the benefit of a $0.4 million reversal of stock-based compensation expense related to certain performance shares previously expected to be earned.
59
Based on our current spending plans, we expect fiscal 2019 selling, general and administrative expenses, in dollars, to be higher and, as a percentage of consolidated net sales, to be similar to the percentage recorded in fiscal 2018.
Research and Development Expenses.
Research and development expenses were $
53.9
million and $
54.3
million for fiscal
2018
and
2017
, respectively, representing a
decrease
of $
0.4
million, or
0.7%
. As a percentage of consolidated net sales, research and development expenses were
9.4%
and
9.9%
for fiscal
2018
and
2017
, respectively.
For fiscal
2018
and
2017
, research and development expenses of $
46.0
million and $
44.7
million, respectively, related to our Commercial Solutions segment, and $
7.0
million and
$8.9
million, respectively, related to our Government Solutions segment. The remaining research and development expenses of
$0.9
million and $0.7 million in fiscal
2018
and
2017
, respectively, related to the amortization of stock-based compensation expense.
Whenever possible, we seek customer funding for research and development to adapt our products to specialized customer requirements. During fiscal
2018
and
2017
, customers reimbursed us
$16.9
million and
$27.1
million, respectively, which is not reflected in the reported research and development expenses, but is included in net sales with the related costs included in cost of sales.
We continue to invest in enhancements to existing products as well as in new products across almost all of our product lines. Based on our current spending plans, we expect fiscal 2019 research and development expenses, in dollars, to be higher and, as a percentage of consolidated net sales, to be comparable to fiscal 2018.
Amortization of Intangibles.
Amortization relating to intangible assets with finite lives was
$21.1
million (of which $17.7 million was for the Commercial Solutions segment and $3.4 million was for the Government Solutions segment) for fiscal
2018
and
$22.8
million (of which $17.7 million was for the Commercial Solutions segment and $5.1 million was for the Government Solutions segment) for fiscal
2017
. The decrease in fiscal 2018 amortization was the result of certain intangibles in our Government Solutions segment that became fully amortized in fiscal 2017. Looking forward to fiscal 2019, we currently anticipate amortization of intangibles to further decline from
$21.1
million to approximately $17.2 million (with all of the decline occurring the Commercial Solutions segment).
Settlement of Intellectual Property Litigation.
In fiscal 2017, we recorded favorable adjustments to operating income of $12.0 million, net of estimated legal fees, to reflect lower losses than originally estimated for TCS intellectual property matters which were settled during that period. There was no comparable adjustments in fiscal 2018.
Operating Income.
Operating income for fiscal
2018
was $
35.1
million as compared $
37.0
million for fiscal
2017
. Operating income by reportable segment is shown in the table below:
|
Fiscal Years Ended July 31,
|
||||||||||||||||||||||||||||||||
|
2018
|
2017
|
2018
|
2017
|
2018
|
2017
|
2018
|
2017
|
|||||||||||||||||||||||||
|
($ in millions)
|
Commercial Solutions
|
Government Solutions
|
Unallocated
|
Consolidated
|
||||||||||||||||||||||||||||
|
Operating income (loss)
|
$
|
40.8
|
|
$
|
33.2
|
|
$
|
11.0
|
|
$
|
9.4
|
|
$
|
(16.7
|
)
|
$
|
(5.6
|
)
|
$
|
35.1
|
|
$
|
37.0
|
|
||||||||
|
Percentage of related net sales
|
11.8
|
%
|
10.0
|
%
|
4.9
|
%
|
4.3
|
%
|
NA
|
|
NA
|
|
6.2
|
%
|
6.7
|
%
|
||||||||||||||||
The increase in our Commercial Solutions segment’s operating income, in dollars and as a percentage of related segment net sales, was primarily due to higher net sales, overall favorable product mix changes and the benefit of cost reduction actions previously initiated, as discussed above. Looking forward, we expect fiscal 2019 operating income, in dollars to be higher and, as a percentage of related segment net sales, to be similar to fiscal 2018.
The increase in our Government Solutions segment’s operating income, in dollars and as a percentage of related segment net sales, was primarily due to lower operating expenses (including lower amortization of intangibles) that was partially offset by lower gross profit contributions, as discussed above. Looking forward, we expect fiscal 2019 operating income, in dollars and as a percentage of related segment net sales, to be significantly higher as compared to fiscal 2018.
60
Unallocated operating expenses for fiscal 2018 were $16.7 million and were offset by a $0.7 million favorable warranty settlement and a $1.0 million favorable sales and use tax settlement, as discussed above. Excluding these adjustments, unallocated operating expenses for fiscal 2018 would have been $18.4 million. Unallocated operating expenses for fiscal 2017 were $5.6 million and were offset by a number of items that aggregated $18.8 million and included: (i) a $12.0 million favorable adjustment related to the settlement of certain TCS intellectual property matters; (ii) $5.5 million of favorable adjustments which related to a recovery of legal expenses from a third party and reserves associated with the TCS acquisition that were no longer required; and (iii) a $1.3 million benefit (as compared to fiscal 2016) associated with our decision to pay certain fiscal 2017 incentive compensation awards in the form of share units. Excluding these adjustments, unallocated operating expenses for fiscal 2017 would have been $24.4 million. The decrease to $18.4 million in fiscal 2018 from the $24.4 million in fiscal 2017 primarily relates to lower spending. Unallocated expenses for fiscal 2018 and 2017 include amortization of stock-based compensation of $8.6 million and $8.5 million, respectively.
Looking forward, unallocated operating expenses are expected to be higher in fiscal 2019 as compared to the $18.4 million discussed above. This expected increase is primarily due to anticipated changes in compensation costs and other increased spending. Amortization of stock-based compensation expense (which is not allocated to our two reportable operating segments) is expected to increase to a range of $10.0 million to $12.0 million in fiscal 2019 as compared to the $8.6 million amortized in fiscal 2018. This increase is largely due to an increase in the number and value of annual non-equity incentive awards expected to be granted in fiscal 2019 as a result of anticipated increased operating income contributions from each of our two reportable operating segments. Like we did in fiscal 2018 and fiscal 2017, our Business Outlook for Fiscal 2019 assumes we continue to pay certain annual non-equity incentive awards in the form of fully vested share units. If we do not achieve our fiscal 2019 business goals, amortization of stock-based compensation expense would be lower than our current expected fiscal 2019 range.
Excluding the aforementioned $1.7 million and $18.8 million of favorable adjustments in fiscal 2018 and 2017, respectively, consolidated operating income for fiscal 2018 and 2017 would have been $33.4 million, or 5.9% of consolidated net sales, and $18.2 million, or 3.3% of consolidated net sales, respectively. This improvement from 3.3% to 5.9% is largely due to the benefit of cost reductions made and changes in gross profit mix and operating expenses, as discussed above. Based on expected sales growth, mix and anticipated timing of shipments and performance related to orders currently in our backlog and the mix and timing of expected new orders, our consolidated operating income (in dollars) in fiscal 2019 is anticipated to be higher than the $35.1 million we achieved in fiscal 2018 and we are targeting to achieve operating income, as a percentage of consolidated net sales, to be higher than the 6.2% we achieved in fiscal 2018.
Interest Expense and Other.
Interest expense was
$10.2
million and
$11.6
million for fiscal
2018
and
2017
, respectively. The decline in interest expense primarily reflects lower total indebtedness (excluding unamortized deferred financing costs), which declined from
$200.6 million
as of July 31, 2017 to
$171.3 million
as of July 31, 2018. Interest expense for both periods primarily reflects interest on our Secured Credit Facility, as amended. Our effective interest rate (including amortization of deferred financing costs) in fiscal 2018 was approximately 5.4%. Based on the type, terms, amount of outstanding debt (including capital leases and other obligations) and current interest rates, our effective interest rate (including amortization of deferred financing costs) in fiscal 2019 is anticipated to range from 6.0% to 6.4%. Our current cash borrowing rate (which excludes the amortization of deferred financing costs) is approximately 4.5%.
Interest (Income) and Other.
Interest (income) and other for both fiscal
2018
and
2017
was nominal. All of our available cash and cash equivalents are currently invested in bank deposits and money market deposit accounts which, at this time, are currently yielding a blended annual interest rate of approximately 0.6%.
(Benefit from) Provision for Income Taxes.
The benefit from income taxes was
$5.1
million for fiscal
2018
as compared to a tax provision of
$9.7
million for fiscal
2017
.
During fiscal 2018, we recorded a net discrete tax benefit of $11.8 million which, as a result of Tax Reform, primarily related to the remeasurement of deferred tax liabilities associated with non-deductible amortization related to intangible assets and discrete tax benefits associated with stock-based awards that were settled in fiscal 2018. These benefits were offset, in part, by the finalization of certain tax deductions in connection with the filing of our federal and state income tax returns for fiscal 2017. Excluding discrete tax items for fiscal
2018
, our effective tax rate was 27.0%.
During fiscal 2017, we recorded a net discrete tax expense of $0.5 million, primarily related to the finalization of certain tax deductions in connection with the filing of our federal and state income tax returns for fiscal 2016, offset, in part, by the reversal of tax contingencies no longer required due to the settlement of the fiscal 2014 federal income tax audit and the expiration of applicable statutes of limitation. Our effective tax rate excluding discrete tax items for fiscal
2017
was 35.75%.
61
The decrease from 35.75% to 27.0% is principally attributable to the passage of Tax Reform which reduced the statutory income tax rate from 35.0% to 21.0%, or a blended income tax rate of approximately 27.0%. Looking forward, our effective tax rate in fiscal 2019, excluding discrete items, is expected to approximate 23.25%. If the Internal Revenue Service ("IRS") issues clarifying or interpretive guidance, and/or new information becomes available, our estimated effective tax rate may change.
Since November 2017, our federal income tax return for fiscal 2016 has been under audit by the IRS. The audit is ongoing and we are unaware of any proposed adjustments by the IRS. Our federal income tax returns for fiscal 2015 and 2017 are also subject to potential future IRS audit. None of our state income tax returns prior to fiscal 2014 are subject to audit. TCS' federal income tax returns for tax years 2014 and 2015 and the tax period from January 1, 2016 to February 23, 2016 are subject to potential future IRS audit. None of TCS' state income tax returns prior to calendar year 2013 are subject to audit. The results of the IRS tax audit for fiscal 2016, future tax assessments or settlements could have a material adverse effect on our consolidated results of operations and financial condition.
Net Income.
During fiscal
2018
, consolidated net income was
$29.8
million as compared to
$15.8
million during fiscal
2017
.
Adjusted EBITDA.
Adjusted EBITDA (both in dollars and as a percentage of related net sales) for both fiscal
2018
and
2017
are shown in the table below (numbers in the table may not foot due to rounding):
|
Fiscal Years Ended July 31,
|
||||||||||||||||||||||||||
|
2018
|
2017
|
2018
|
2017
|
2018
|
2017
|
2018
|
2017
|
|||||||||||||||||||
|
($ in millions)
|
Commercial Solutions
|
Government Solutions
|
Unallocated
|
Consolidated
|
||||||||||||||||||||||
|
Net income (loss)
|
$
|
40.3
|
|
32.9
|
|
10.8
|
|
9.4
|
|
(21.4
|
)
|
(26.5
|
)
|
$
|
29.8
|
|
15.8
|
|
||||||||
|
Provision for (benefit from) income taxes
|
0.3
|
|
0.3
|
|
—
|
|
—
|
|
(5.4
|
)
|
9.4
|
|
(5.1
|
)
|
9.7
|
|
||||||||||
|
Interest (income) and other
|
0.2
|
|
(0.1
|
)
|
0.1
|
|
—
|
|
—
|
|
0.1
|
|
0.3
|
|
(0.1
|
)
|
||||||||||
|
Interest expense
|
0.1
|
|
0.2
|
|
—
|
|
—
|
|
10.1
|
|
11.4
|
|
10.2
|
|
11.6
|
|
||||||||||
|
Amortization of stock-based compensation
|
—
|
|
—
|
|
—
|
|
—
|
|
8.6
|
|
8.5
|
|
8.6
|
|
8.5
|
|
||||||||||
|
Amortization of intangibles
|
17.7
|
|
17.7
|
|
3.4
|
|
5.1
|
|
—
|
|
—
|
|
21.1
|
|
22.8
|
|
||||||||||
|
Depreciation
|
9.5
|
|
9.9
|
|
3.1
|
|
2.9
|
|
1.1
|
|
1.5
|
|
13.7
|
|
14.4
|
|
||||||||||
|
Settlement of intellectual property litigation
|
—
|
|
—
|
|
—
|
|
—
|
|
—
|
|
(12.0
|
)
|
—
|
|
(12.0
|
)
|
||||||||||
|
Adjusted EBITDA
|
$
|
68.0
|
|
60.9
|
|
17.4
|
|
17.5
|
|
(7.1
|
)
|
(7.6
|
)
|
$
|
78.4
|
|
70.7
|
|
||||||||
|
Percentage of related net sales
|
19.7
|
%
|
18.4
|
%
|
7.7
|
%
|
8.0
|
%
|
NA
|
|
NA
|
|
13.7
|
%
|
12.8
|
%
|
||||||||||
The increase in consolidated Adjusted EBITDA during fiscal
2018
as compared to fiscal
2017
is primarily attributable to higher net sales and overall favorable product mix changes in our Commercial Solutions segment (which historically achieves higher gross margins than our Government Solutions segment), the benefit of cost reduction actions previously taken and the $1.7 million of benefits in fiscal 2018 that resulted from the favorable warranty and sales and use tax settlements, as discussed above.
The increase in our Commercial Solutions segment's Adjusted EBITDA, in dollars and as a percentage of related segment net sales, was primarily attributable to higher net sales, overall favorable product mix changes and the benefit of cost reduction actions previously initiated, as discussed above.
The decrease in our Government Solutions segment's Adjusted EBITDA, in dollars and as a percentage of related segment net sales, was primarily driven by significantly lower net sales of over-the-horizon microwave systems products and the absence of $6.7 million of BFT-1 intellectual property license fees, as discussed above.
Looking forward, based on the mix and anticipated timing of shipments and performance related to orders currently in our backlog and the mix and timing of expected new orders, we are targeting consolidated Adjusted EBITDA to be higher than fiscal 2018 and in a range from to $80.0 million to $86.0 million. As a percentage of consolidated net sales, Adjusted EBITDA in fiscal 2019 is expected to be similar to the amount we achieved in fiscal 2018.
If order flow remains strong and we are able to achieve all of our fiscal 2019 business goals, it is possible that our fiscal 2019 Adjusted EBITDA could be higher than our targeted amount.
62
Our Adjusted EBITDA is a Non-GAAP measure that represents earnings (loss) before income taxes, interest (income) and other expense, interest expense, amortization of stock-based compensation, amortization of intangibles, depreciation expense, settlement of intellectual property litigation, acquisition plan expenses or strategic alternatives analysis expenses and other. Our definition of Adjusted EBITDA may differ from the definition of EBITDA used by other companies and therefore may not be comparable to similarly titled measures used by other companies. Adjusted EBITDA is also a measure frequently requested by our investors and analysts. We believe that investors and analysts may use Adjusted EBITDA, along with other information contained in our SEC filings, in assessing our performance and comparability of our results with other companies. These Non-GAAP financial measures have limitations as an analytical tool as they exclude the financial impact of transactions necessary to conduct our business, such as the granting of equity compensation awards, and are not intended to be an alternative to financial measures prepared in accordance with GAAP. These measures are adjusted as described in the reconciliation of GAAP to Non-GAAP in the above table, but these adjustments should not be construed as an inference that all of these adjustments or costs are unusual, infrequent or non-recurring. Non-GAAP financial measures should be considered in addition to, and not as a substitute for or superior to, financial measures determined in accordance with GAAP. Investors are advised to carefully review the GAAP financial results that are disclosed in our SEC filings. We have not quantitatively reconciled our fiscal 2019 Adjusted EBITDA target to the most directly comparable GAAP measure because items such as stock-based compensation, adjustments to the provision for income taxes, amortization of intangibles and interest expense, which are specific items that impact these measures, have not yet occurred, are out of our control, or cannot be predicted. For example, quantification of stock-based compensation expense requires inputs such as the number of shares granted and market price that are not currently ascertainable. Accordingly, reconciliations to the Non-GAAP forward looking metrics are not available without unreasonable effort and such unavailable reconciling items could significantly impact our financial results.
Comparison of Fiscal 2017 and 2016
Net Sales.
Consolidated net sales were $550.4 million and $411.0 million for fiscal 2017 and 2016, respectively, representing an increase of $139.4 million, or 33.9%. As TCS was acquired on February 23, 2016, fiscal 2017 includes a full year of TCS operations as compared to fiscal 2016 which only included approximately five months. The year-over-year increase in net sales was driven by incremental sales of $147.1 million from TCS products lines. Net sales by operating segment are discussed below.
Commercial Solutions
Net sales in our Commercial Solutions segment were $330.9 million for fiscal 2017, as compared to $249.0 million for fiscal 2016, an increase of $81.9 million, or 32.9%. The year-over-year increase in net sales reflects incremental sales of $82.3 million from TCS product lines (which include enterprise technology solutions such as our location and messaging platforms and safety and security technology solutions such as our wireless and next generation 911 ("NG911") platforms). Our Commercial Solutions segment represented 60.1% of consolidated net sales for fiscal 2017 as compared to 60.6% for fiscal 2016.
Our book-to-bill ratio (a measure defined as bookings divided by net sales) in this segment for fiscal 2017 was 0.89.
Net sales of our satellite earth station products in fiscal 2017 were lower than fiscal 2016. Although market conditions in fiscal 2017 for our international satellite earth station customers improved and related sales to these customers increased, sales and bookings from our U.S. government customers in fiscal 2017 were significantly lower as compared to fiscal 2016. We attribute this decline to delays in awarding and/or funding certain programs and a lull in ordering that resulted from political and budget uncertainty. During the second half of fiscal 2017, we saw a noticeable improvement in sales to U.S. government customers.
Net sales in fiscal 2017 of both enterprise technology solutions and safety and security technology solutions were higher than fiscal 2016, primarily due to the contribution of twelve months of TCS operations as compared to only five months in fiscal 2016.
Bookings, sales and profitability in our Commercial Solutions segment can fluctuate from period-to-period due to many factors, including changes in the general business environment. As such, period-to-period comparisons of our results may not be indicative of a trend or future performance.
Government Solutions
Net sales in our Government Solutions segment were $219.5 million for fiscal 2017 as compared to $162.0 million for fiscal 2016, an increase of $57.5 million or 35.5%. The year-over-year increase in net sales primarily reflects incremental sales of $64.8 million from TCS product lines (which include our advanced communication solutions such as field support, space components and cyber-training). Our Government Solutions segment represented 39.9% of consolidated net sales for fiscal 2017, as compared to 39.4% for fiscal 2016.
63
Our book-to-bill ratio (a measure defined as bookings divided by net sales) in this segment for fiscal 2017 was approximately 1.00.
Net sales of legacy Comtech products (which include over-the-horizon microwave system products, high-power broadband amplifiers and BFT-1 sustainment support services) were, in the aggregate, lower in fiscal 2017 than in fiscal 2016, primarily as a result of lower BFT-1 related sales. Net sales for fiscal 2017 and 2016 include $6.7 million and $10.0 million, respectively, of sales related to a BFT-1 intellectual property license contract which expired on March 31, 2017.
Bookings, sales and profitability in our Government Solutions segment can fluctuate dramatically from period-to-period due to many factors, including unpredictable funding, deployment and technology decisions by our U.S. and international government customers. As such, period-to-period comparisons of our results may not be indicative of a trend or future performance.
Geography and Customer Type
Sales by geography and customer type, as a percentage of related sales, for the fiscal years ended July 31, 2017 and 2016 are as follows:
|
|
Fiscal Years Ended July 31,
|
|||||||||||||||||
|
2017
|
2016
|
2017
|
2016
|
2017
|
2016
|
|||||||||||||
|
|
Commercial Solutions
|
Government Solutions
|
Consolidated
|
|||||||||||||||
|
U.S. government
|
15.1
|
%
|
25.0
|
%
|
59.2
|
%
|
65.0
|
%
|
32.7
|
%
|
40.8
|
%
|
||||||
|
Domestic
|
54.4
|
%
|
40.6
|
%
|
15.5
|
%
|
11.6
|
%
|
38.9
|
%
|
29.2
|
%
|
||||||
|
Total U.S.
|
69.5
|
%
|
65.6
|
%
|
74.7
|
%
|
76.6
|
%
|
71.6
|
%
|
70.0
|
%
|
||||||
|
International
|
30.5
|
%
|
34.4
|
%
|
25.3
|
%
|
23.4
|
%
|
28.4
|
%
|
30.0
|
%
|
||||||
|
Total
|
100.0
|
%
|
100.0
|
%
|
100.0
|
%
|
100.0
|
%
|
100.0
|
%
|
100.0
|
%
|
||||||
Sales to U.S. government customers include sales to the U.S. DoD, intelligence and civilian agencies, as well as sales directly to or through prime contractors. Domestic sales include sales to U.S. state and local governments. International sales include sales to U.S. companies for inclusion in products that are sold to international customers.
Gross Profit.
Gross profit was $218.2 million and $171.2 million for fiscal 2017 and 2016, respectively, representing an increase of $47.0 million. This increase in gross profit dollars was driven by higher consolidated net sales as discussed above. Gross profit, as a percentage of consolidated net sales decreased from 41.7% for fiscal 2016 to 39.6% for fiscal 2017. This decrease is attributable to overall product mix changes resulting primarily from the TCS acquisition, in particular, the inclusion of net sales related to TCS government solutions, which have historically had lower gross margins than Comtech’s legacy products. Gross profit, as a percentage of related segment net sales is further discussed below.
Our Commercial Solutions segment's gross profit, as a percentage of related segment net sales, for fiscal 2017 was higher than in fiscal 2016. This increase was primarily driven by the inclusion of net sales related to TCS commercial solutions during fiscal 2017, which had higher gross margins than Comtech's legacy products. Gross margin, as a percentage of related net sales for Comtech’s legacy products, also increased primarily due to overall mix changes.
Our Government Solutions segment's gross profit, as a percentage of related segment net sales, for fiscal 2017 was significantly lower than in fiscal 2016. This decrease was primarily driven by the inclusion of net sales related to TCS government solutions during fiscal 2017, which have significantly lower gross margins than Comtech's legacy products. Gross profit in this segment, for fiscal 2017 and 2016 includes $6.7 million and $10.0 million, respectively, related to a prior BFT-1 intellectual property license contract which expired on March 31, 2017.
Included in consolidated cost of sales for fiscal 2017 and 2016 are provisions for excess and obsolete inventory of $2.9 million and $2.8 million, respectively. As discussed in "
Item 7. Management's Discussion and Analysis of Financial Condition and Results of Operations - Critical Accounting Policies - Provisions for Excess and Obsolete Inventory,
"
we regularly review our inventory and record a provision for excess and obsolete inventory based on historical and projected usage assumptions.
64
Selling, General and Administrative Expenses
.
Selling, general and administrative expenses were $116.1 million and $94.9 million for fiscal 2017 and 2016, respectively, representing an increase of $21.2 million. The increase in spending is primarily attributable to incremental expenses associated with the increased size of our business as a result of the TCS acquisition which was partially offset by $5.5 million of favorable adjustments related to a recovery of legal expenses from a third party and adjustments related to reserves associated with the TCS acquisition that were no longer required. As a percentage of consolidated net sales, selling, general and administrative expenses were 21.1% and 23.1% for fiscal 2017 and 2016, respectively. This decrease in percentage is primarily due to higher consolidated net sales during fiscal 2017, the aforementioned $5.5 million of favorable adjustments, and the benefit of cost reduction actions previously initiated.
Amortization of stock-based compensation expense recorded as selling, general and administrative expenses was $7.1 million in fiscal 2017 as compared to $3.4 million in fiscal 2016. This increase is primarily related to the type and timing of stock-based awards. In fiscal 2017, we paid certain annual incentive compensation awards in the form of share units whereas in fiscal 2016, such annual incentives were paid in cash. The benefit of this change resulted in lower overall company-wide compensation expense of approximately $1.3 million in fiscal 2017.
Research and Development Expenses.
Research and development expenses were $54.3 million and $42.2 million for fiscal 2017 and 2016, respectively, representing an increase of $12.1 million, or 28.7%. The increase in spending is primarily attributable to incremental expenses associated with the TCS product lines. As a percentage of consolidated net sales, research and development expenses were 9.9% and 10.3% for fiscal 2017 and 2016.
For fiscal 2017 and 2016, research and development expenses of $44.7 million and $33.8 million, respectively, related to our Commercial Solutions segment, and $8.9 million and $8.0 million, respectively, related to our Government Solutions segment. The remaining research and development expenses of $0.7 million and $0.4 million in fiscal 2017 and 2016, respectively, related to the amortization of stock-based compensation expense.
Whenever possible, we seek customer funding for research and development to adapt our products to specialized customer requirements. During fiscal 2017 and 2016, customers reimbursed us $27.1 million and $17.4 million, respectively, which is not reflected in the reported research and development expenses, but is included in net sales with the related costs included in cost of sales.
Amortization of Intangibles.
Amortization relating to intangible assets with finite lives was $22.8 million (of which $17.7 million was for the Commercial Solutions segment and $5.1 million was for the Government Solutions segment) for fiscal 2017 and $13.4 million (of which $10.6 million was for the Commercial Solutions segment and $2.8 million was for the Government Solutions segment) for fiscal 2016. The significant increase in amortization of intangibles is a result of our acquisition of TCS on February 23, 2016.
Settlement of Intellectual Property Litigation.
During fiscal 2017, we recorded favorable adjustments to operating income of $12.0 million, net of estimated legal fees, to reflect lower losses than originally estimated for TCS intellectual property matters which were settled during fiscal 2017. There were no comparable adjustments in fiscal 2016.
Acquisition Plan Expenses.
Acquisition plan expenses during fiscal 2016 were $21.3 million and primarily consist of transaction costs related to our acquisition of TCS on February 23, 2016. There were no comparable expenses during fiscal 2017.
Operating Income (Loss).
Operating income for fiscal 2017 was $37.0 million as compared to a loss of $0.6 million for fiscal 2016. Operating income by reportable segment is shown in the table below:
|
Fiscal Years Ended July 31,
|
||||||||||||||||||||||||||||||||
|
2017
|
2016
|
2017
|
2016
|
2017
|
2016
|
2017
|
2016
|
|||||||||||||||||||||||||
|
($ in millions)
|
Commercial Solutions
|
Government Solutions
|
Unallocated
|
Consolidated
|
||||||||||||||||||||||||||||
|
Operating income (loss)
|
$
|
33.2
|
|
$
|
23.3
|
|
$
|
9.4
|
|
$
|
23.0
|
|
$
|
(5.6
|
)
|
$
|
(46.8
|
)
|
$
|
37.0
|
|
$
|
(0.6
|
)
|
||||||||
|
Percentage of related net sales
|
10.0
|
%
|
9.3
|
%
|
4.3
|
%
|
14.2
|
%
|
NA
|
|
NA
|
|
6.7
|
%
|
NA
|
|
||||||||||||||||
The increase in our Commercial Solutions segment’s operating income, in dollars, is primarily due to an increase in this segment's net sales during fiscal 2017, substantially offset by incremental amortization of intangibles associated with the TCS acquisition. The increase in operating income, as a percentage of related segment net sales, is primarily due to increased operating income contribution from Comtech's legacy products.
65
The decrease in our Government Solutions segment’s operating income, in dollars, was primarily driven by lower operating income contribution from TCS' government solutions' net sales (which includes the impact of incremental amortization of intangibles associated with the TCS acquisition) and lower operating income contribution from Comtech’s legacy products. The decrease in operating income, as a percentage of related segment net sales, is primarily due to the inclusion of TCS government solutions' net sales and operating results, including the impact of incremental amortization of intangibles associated with the TCS acquisition.
Unallocated operating expenses for fiscal 2017 were $5.6 million. During fiscal 2017, unallocated operating expenses were offset by a number of items throughout the fiscal year, which aggregated $18.8 million. Such items include: (i) a $12.0 million favorable adjustment related to the settlement of certain TCS intellectual property matters, as discussed above; (ii) $5.5 million of favorable adjustments which related to a recovery of legal expenses from a third party and reserves associated with the TCS acquisition that were no longer required; and (iii) a $1.3 million benefit associated with our decision (which is further described below) to pay certain fiscal 2017 incentive compensation awards in the form of share units. Unallocated operating expenses for fiscal 2016 were $46.8 million and included $21.3 million of acquisition plan expenses, as discussed above. Excluding the $18.8 million and $21.3 million amounts, unallocated operating expenses for fiscal 2017 and 2016 would have been $24.4 million and $25.5 million, respectively.
Unallocated expenses for fiscal 2017 and 2016 include amortization of stock-based compensation of $8.5 million and $4.1 million, respectively. The increase in fiscal 2017 related to our decision to pay certain fiscal 2017 non-equity incentive awards in the form of fully vested share units, whereas in fiscal 2016 our non-equity incentive awards were settled in cash. Although this change resulted in higher amortization of stock-based compensation in fiscal 2017 as compared to fiscal 2016, the overall impact of this decision resulted in lower company-wide compensation expense of approximately $1.3 million for fiscal 2017.
Excluding the $18.8 million of favorable adjustments described above, consolidated operating income for fiscal 2017 would have been $18.2 million, or 3.3% of consolidated net sales.
Interest Expense and Other.
Interest expense was $11.6 million and $7.8 million for fiscal 2017 and 2016, respectively. Interest expense for both periods primarily reflects interest on our Secured Credit Facility, as amended. The increase in interest expense and other was primarily due to a full-year of outstanding borrowings in fiscal 2017 related to the TCS as compared to five months of outstanding borrowings in fiscal 2016.
Interest Income and Other.
Interest income and other for both fiscal 2017 and 2016 was nominal. All of our available cash and cash equivalents are currently invested in bank deposits and money market deposit accounts which, at this time, are currently yielding a blended annual interest rate of approximately 0.56%.
Provision for Income Taxes.
The provision for income taxes was $9.7 million for fiscal 2017 as compared to a tax benefit of $0.5 million during fiscal 2016. Our effective tax rate was 37.9% for fiscal 2017, as compared to 5.5% for fiscal 2016.
During fiscal 2017, we recorded a net discrete tax expense of $0.5 million, primarily related to the finalization of certain tax deductions in connection with the filing of our federal and state income tax returns for fiscal 2016, offset, in part, by the reversal of tax contingencies no longer required due to the settlement of the fiscal 2014 federal income tax audit and the expiration of applicable statutes of limitation. Our effective tax rate excluding discrete tax items for fiscal 2017 was 35.75%.
During fiscal 2016, we recorded a net discrete tax expense of approximately $1.0 million, primarily related to the establishment of tax contingencies for uncertain tax positions relating to the payment of certain expenses associated with the TCS acquisition, offset, in part, by the reversal of tax contingencies no longer required due to the expiration of applicable statutes of limitation; and the passage of legislation that included the permanent retroactive extension of the federal research and experimentation credit from December 31, 2014. Our effective tax rate excluding discrete tax items for fiscal 2016 was 18.0%.
The increase from 18.0% to 35.75% is principally attributable to the non-deductibility of certain transaction costs relating to the acquisition of TCS, which were incurred during fiscal 2016.
Since November 2017, our federal income tax return for fiscal 2016 has been under audit by the IRS. The audit is ongoing and we are unaware of any proposed adjustments by the IRS. Our federal income tax returns for fiscal 2015 and 2017 are also subject to potential future IRS audit. None of our state income tax returns prior to fiscal 2014 are subject to audit. TCS' federal income tax returns for tax years 2014 and 2015 and the tax period from January 1, 2016 to February 23, 2016 are subject to potential future IRS audit. None of TCS' state income tax returns prior to calendar year 2013 are subject to audit. The results of the IRS tax audit for fiscal 2016, future tax assessments or settlements could have a material adverse effect on our consolidated results of operations and financial condition.
66
Net Loss (Income).
During fiscal 2017, consolidated net income was $15.8 million as compared to a consolidated net loss of $7.7 million during fiscal 2016.
Adjusted EBITDA.
Our Adjusted EBITDA, a Non-GAAP financial measure, represents earnings before income taxes, interest (income) and other expense, interest expense, amortization of stock-based compensation, amortization of intangibles, depreciation expense, settlement of intellectual property litigation and acquisition plan expenses. These items, while periodically affecting our results, may vary significantly from period-to-period and may have a disproportionate effect in a given period, thereby affecting the comparability of our results. Our Adjusted EBITDA is also used by our management in assessing the Company's operating results. Although closely aligned, the Company's definition of Adjusted EBITDA is different than the Consolidated EBITDA (as such term is defined in our Secured Credit Facility, as amended) utilized for financial covenant calculations and also may differ from the definition of EBITDA or Adjusted EBITDA used by other companies and, therefore, may not be comparable to similarly titled measures used by other companies. Our Adjusted EBITDA is also a measure frequently requested by the Company's investors and analysts. We believe that investors and analysts may use our Adjusted EBITDA, along with other information contained in our SEC filings, in assessing our performance and comparability of our results with other companies.
Adjusted EBITDA (both in dollars and as a percentage of related net sales) for both fiscal 2017 and 2016 are shown in the table below (numbers in the table may not foot due to rounding):
|
Fiscal Years Ended July 31,
|
||||||||||||||||||||||||||
|
2017
|
2016
|
2017
|
2016
|
2017
|
2016
|
2017
|
2016
|
|||||||||||||||||||
|
($ in millions)
|
Commercial Solutions
|
Government Solutions
|
Unallocated
|
Consolidated
|
||||||||||||||||||||||
|
Net income (loss)
|
$
|
32.9
|
|
22.8
|
|
9.4
|
|
23.0
|
|
(26.5
|
)
|
(53.5
|
)
|
$
|
15.8
|
|
(7.7
|
)
|
||||||||
|
Income taxes
|
0.3
|
|
0.1
|
|
—
|
|
—
|
|
9.4
|
|
(0.5
|
)
|
9.7
|
|
(0.5
|
)
|
||||||||||
|
Interest (income) and other expense
|
(0.1
|
)
|
0.1
|
|
—
|
|
—
|
|
0.1
|
|
(0.2
|
)
|
(0.1
|
)
|
(0.1
|
)
|
||||||||||
|
Interest expense
|
0.2
|
|
0.3
|
|
—
|
|
—
|
|
11.4
|
|
7.5
|
|
11.6
|
|
7.8
|
|
||||||||||
|
Amortization of stock-based compensation
|
—
|
|
—
|
|
—
|
|
—
|
|
8.5
|
|
4.1
|
|
8.5
|
|
4.1
|
|
||||||||||
|
Amortization of intangibles
|
17.7
|
|
10.6
|
|
5.1
|
|
2.8
|
|
—
|
|
—
|
|
22.8
|
|
13.4
|
|
||||||||||
|
Depreciation
|
9.9
|
|
7.1
|
|
2.9
|
|
2.0
|
|
1.5
|
|
0.8
|
|
14.4
|
|
9.8
|
|
||||||||||
|
Settlement of intellectual property litigation
|
—
|
|
—
|
|
—
|
|
—
|
|
(12.0
|
)
|
—
|
|
(12.0
|
)
|
—
|
|
||||||||||
|
Acquisition plan expenses
|
—
|
|
—
|
|
—
|
|
—
|
|
—
|
|
21.3
|
|
—
|
|
21.3
|
|
||||||||||
|
Adjusted EBITDA
|
$
|
60.9
|
|
40.9
|
|
17.5
|
|
27.8
|
|
(7.6
|
)
|
(20.7
|
)
|
$
|
70.7
|
|
48.1
|
|
||||||||
|
Percentage of related net sales
|
18.4
|
%
|
16.4
|
%
|
8.0
|
%
|
17.2
|
%
|
NA
|
|
NA
|
|
12.8
|
%
|
11.7
|
%
|
||||||||||
The increase in consolidated Adjusted EBITDA, in dollars and as a percentage of consolidated net sales, during fiscal 2017 as compared to fiscal 2016 is primarily attributable to earnings contributions associated with the TCS acquisition, period-to-period changes in sales mix and gross margin contributions and lower unallocated expenses during fiscal 2017, all of which are discussed above. The increase in our Commercial Solutions segment's Adjusted EBITDA, in dollars and as a percentage of related segment net sales, was primarily attributable to an increase in this segment's net sales and higher gross margins, as discussed above. The decrease in our Government Solutions segment's Adjusted EBITDA, in dollars and as a percentage of related segment net sales, was primarily driven by the inclusion of net sales related to TCS government solutions, which have historically had significantly lower gross margins than Comtech’s legacy products, as discussed above.
67
Liquidity and Capital Resources
Our cash and cash equivalents increased to
$43.5 million
at
July 31, 2018
from
$41.8 million
at
July 31, 2017
, an increase of
$1.6 million
. The increase in cash and cash equivalents during fiscal
2018
was driven by the following:
|
•
|
Net cash provided by operating activities was
$50.3 million
for fiscal
2018
as compared to $
66.9 million
for fiscal
2017
. The period-over-period decrease in cash flow from operating activities is attributable to overall changes in net working capital requirements, principally the timing of shipments, billings and payments.
|
|
•
|
Net cash used in investing activities for fiscal
2018
was
$8.6 million
as compared to
$8.2 million
for fiscal
2017
. Both of these amounts primarily represent expenditures relating to ongoing equipment upgrades and enhancements.
|
|
•
|
Net cash used in financing activities was
$40.1 million
for fiscal
2018
as compared to
$83.7 million
for fiscal
2017
. During fiscal
2018
, we made
$8.8 million
of net payments under our Revolving Loan Facility and
$21.8 million
of principal repayments related to our Term Loan Facility and capital lease and other obligations. During fiscal
2017
, we made
$26.5 million
of net payments under our Revolving Loan Facility and
$37.2 million
of principal repayments related to our Term Loan Facility and capital lease and other obligations. During fiscal
2018
and
2017
, we paid
$9.5 million
and
$18.9 million
, respectively, in cash dividends to our stockholders. We also made
$1.1 million
and
$0.3 million
, respectively, of payments to remit employees' statutory tax withholding requirements related to the net settlement of stock-based awards during fiscal 2018 and 2017.
|
Our investment policy relating to our cash and cash equivalents is intended to minimize principal loss while at the same time maximize the income we receive without significantly increasing risk. To minimize risk, we generally invest our cash and cash equivalents in money market mutual funds (both government and commercial), certificates of deposit, bank deposits, and U.S. Treasury securities. Many of our money market mutual funds invest in direct obligations of the U.S. government, bank securities guaranteed by the Federal Deposit Insurance Corporation, certificates of deposit and commercial paper and other securities issued by other companies. While we cannot predict future market conditions or market liquidity, we believe our investment policies are appropriate in the current environment. Ultimately, the availability of our cash and cash equivalents is dependent on a well-functioning liquid market.
The Secured Credit Facility, as amended, is discussed below and in
"Notes to Consolidated Financial Statements - Note (8) - Secured Credit Facility"
included in
"Part II - Item 8. - Financial Statements and Supplementary Data."
As of
July 31, 2018
, our material short-term cash requirements primarily consist of: (i) fiscal 2019 mandatory principal repayments of $17.2 million associated with our Term Loan Facility and related interest payments of approximately $5.2 million; (ii) estimated interest payments for fiscal 2019 under our Revolving Loan Facility; (iii) payments related to our capital lease and other obligations; (iv) operating lease commitments; (v) our ongoing working capital needs, including income tax payments; and (vi) payment of accrued quarterly dividends.
In June 2016, we sold
7.1 million
shares of our common stock in a public offering at a price of
$14.00
per share, resulting in proceeds to us of
$95.0 million
, net of underwriting discounts and commissions. As of
July 31, 2018
and
September 26, 2018
, an aggregate registered amount of $75.0 million under our existing shelf registration statement filed with the SEC remains available for sale of various types of securities, including debt.
As of
July 31, 2018
and
September 26, 2018
, we were authorized to repurchase up to an additional
$8.7 million
of our common stock, pursuant to our current
$100.0 million
stock repurchase program. Our stock repurchase program has no time restrictions and repurchases may be made in open-market or privately negotiated transactions and may be made pursuant to SEC Rule 10b5-1 trading plans. There were no repurchases of our common stock during fiscal
2018
and
2017
.
On
September 27, 2017
,
December 6, 2017
,
March 7, 2018
and
June 6, 2018
, our Board of Directors declared a dividend of
$0.10
per common share, which were paid on
November 17, 2017
,
February 16, 2018
,
May 18, 2018
and
August 17, 2018
, respectively. On
September 26, 2018
, our Board of Directors declared a dividend of
$0.10
per common share, payable on
November 16, 2018
to stockholders of record at the close of business on
October 17, 2018
. Future dividends remain subject to compliance with financial covenants under our Secured Credit Facility, as amended, as well as Board approval.
Our material long-term cash requirements primarily consist of: (i) mandatory interest payments and principal repayments pursuant to our Secured Credit Facility, as amended; (ii) payments relating to our capital lease and other obligations and (iii) operating lease commitments.
68
We continue to receive (and approve on a limited basis) requests from our customers for higher credit limits and longer payment terms. We also continue to monitor our accounts receivable credit portfolio and have not had material negative customer credit experiences historically.
We have historically met both our short-term and long-term cash requirements with funds provided by a combination of cash and cash equivalent balances, cash generated from operating activities and cash generated from financing transactions. Based on our anticipated level of future sales and operating income, we believe that our existing cash and cash equivalent balances, our cash generated from operating activities and amounts potentially available under the Revolving Loan Facility under our Secured Credit Facility, as amended, will be sufficient to meet both our currently anticipated short-term and long-term operating cash requirements.
Although it is difficult in the current economic and credit environment to predict the terms and conditions of financing that may be available in the future, should our short-term or long-term cash requirements increase beyond our current expectations, we believe that we would have sufficient access to credit from financial institutions and/or financing from public and private debt and equity markets.
Secured Credit Facility
On February 23, 2016, in connection with our acquisition of TCS, we entered into a $400.0 million secured credit facility (the "Secured Credit Facility") with a syndicate of lenders. The Secured Credit Facility, as amended June 6, 2017 (the "June 2017 Amendment"), comprises a senior secured term loan A facility of $250.0 million (the "Term Loan Facility") and a secured revolving loan facility of up to $150.0 million, including a $25.0 million letter of credit sublimit (the "Revolving Loan Facility"), and, together with the Term Loan Facility, matures on February 23, 2021. The proceeds of these borrowings were primarily used to finance our acquisition of TCS, including the repayment of certain existing indebtedness of TCS. The Term Loan Facility requires quarterly repayments. During the fiscal year ended
July 31, 2018
and
2017
, we repaid
$19.0 million
and
$33.6 million
, respectively, principal amount of borrowings under the Term Loan Facility. The repayments in the fiscal year ended July 31, 2017 include a payment of
$22.5 million
made in connection with the June 2017 amendment to reduce the balloon or final payment of the Term Loan Facility, which is discussed further below. Under the Revolving Loan Facility, we had outstanding balances ranging from
$34.9 million
to
$66.8 million
during the fiscal year ended
July 31, 2018
.
The Revolving Loan Facility is primarily used for working capital and other general corporate purposes of the Company and its subsidiaries, including the issuance of letters of credit. Borrowings under the Secured Credit Facility, pursuant to terms defined in the Secured Credit Facility, shall be either (i) Alternate Base Rate ("ABR") borrowings, which bear interest from the applicable borrowing date at a rate per annum equal to (x) the greatest of (a) the Prime Rate in effect on such day, (b) the Federal Funds Effective Rate in effect on such day plus 0.50% per annum and (c) the Adjusted LIBO Rate on such day (or, if such day is not a business day, the immediately preceding business day) plus 1.00% per annum (provided that if the LIBO Rate is less than 1.00%, then the LIBO Rate shall be deemed to be 1.00%), plus (y) the Applicable Rate, or (ii) Eurodollar borrowings, which bear interest from the applicable borrowing date at a rate per annum equal to (x) the Adjusted LIBO Rate for such interest period (provided that if the LIBO Rate is less than 1.00%, then the LIBO Rate shall be deemed to be 1.00%) plus (y) the Applicable Rate. The Applicable Rate is determined based on a pricing grid that is dependent upon our leverage ratio as of the end of each fiscal quarter. The Secured Credit Facility contains customary representations, warranties and affirmative covenants and customary negative covenants, subject to negotiated exceptions, on (i) liens, (ii) investments, (iii) indebtedness, (iv) significant corporate changes, including mergers and acquisitions, (v) dispositions, (vi) restricted payments, including stockholder dividends, and (vii) certain other restrictive agreements. The Secured Credit Facility also contains certain financial covenants and customary events of default (subject to grace periods, as appropriate), such as payment defaults, cross-defaults to other material indebtedness, bankruptcy and insolvency, the occurrence of a defined change in control and the failure to observe the negative covenants and other covenants related to the operation of our business.
We believe the June 2017 Amendment provides increased operating and acquisition flexibility and simplifies the calculations of our financial covenants. In particular, the June 2017 Amendment provides, among other things, that the:
|
(i)
|
Consolidated EBITDA definition more closely aligns with our Adjusted EBITDA metric by eliminating favorable adjustments to operating income related to settlements of TCS intellectual property matters;
|
|
(ii)
|
Leverage Ratio is calculated on a "gross" basis using the quotient of Total Indebtedness (excluding unamortized deferred financing costs) divided by our trailing twelve month ("TTM") Consolidated EBITDA. The prior Leverage Ratio was calculated on a "net" basis but did not include a reduction for any cash or cash equivalents above
$50.0 million
;
|
|
(iii)
|
Fixed Charge Coverage Ratio includes a deduction for all cash dividends, regardless of the amount of our cash and cash equivalents and the related allowable Quarterly Dividend Amount, as defined, now aligns with our current quarterly dividend target of
$0.10
per common share;
|
69
|
(iv)
|
Balloon or final payment of the Term Loan Facility, which is not due until February 23, 2021, was reduced by
$22.5 million
through increased borrowings from the Revolving Loan Facility, which does not expire until February 23, 2021; and
|
|
(v)
|
Leverage Ratios will be adjusted, in certain conditions, to provide for additional flexibility for us to make acquisitions.
|
In connection with the June 2017 Amendment, there were no changes to: (i) the committed borrowing capacity; (ii) the maturity date; or (iii) interest rates payable (except that the interest rate pricing grid is now based on the new Leverage Ratio). Also, the June 2017 Amendment did not result in an extinguishment for accounting purposes (as such term is defined in ASC 470 "
Debt"
); instead, the June 2017 Amendment was accounted for as a debt modification. As a result, deferred financing costs (including incremental fees for the June 2017 Amendment) will continue to be amortized over the remaining maturity term of the Secured Credit Facility.
As of
July 31, 2018
, our Leverage Ratio was
2.19
x TTM Consolidated EBITDA compared to the maximum allowable Leverage Ratio of
3.00
x TTM Consolidated EBITDA. Our Fixed Charge Coverage Ratio as of
July 31, 2018
was
2.33
x compared to the minimum required Fixed Charge Coverage Ratio of
1.25
x. Given our expected future business performance, we anticipate maintaining compliance with the terms and financial covenants in our Secured Credit Facility, as amended, for the foreseeable future.
The obligations under the Secured Credit Facility, as amended, are guaranteed by certain of our domestic subsidiaries (the "Subsidiary Guarantors"). As collateral security for amounts outstanding under our Secured Credit Facility, as amended, and the guarantees thereof, we and our Subsidiary Guarantors have granted to an administrative agent, for the benefit of the lenders, a lien on, and first priority security interest in, substantially all of our tangible and intangible assets.
Capitalized terms used but not defined herein have the meanings set forth for such terms in the Secured Credit Facility, dated as of
February 23, 2016
, and the First Amendment of the Secured Credit Facility, dated as of June 6, 2017, both of which have been documented and filed with the SEC.
Off-Balance Sheet Arrangements
As of
July 31, 2018
, we did not have any off-balance sheet arrangements as defined in Item 303(a)(4) of Regulation S-K.
Commitments
In the normal course of business, other than as discussed below, we routinely enter into binding and non-binding purchase obligations primarily covering anticipated purchases of inventory and equipment. We do not expect that these commitments, as of
July 31, 2018
, will materially adversely affect our liquidity.
At
July 31, 2018
, cash payments due under long-term obligations (including estimated interest expense on our Secured Credit Facility), excluding purchase orders that we entered into in our normal course of business, are as follows:
|
|
Obligations Due by Fiscal Years or Maturity Date (in thousands)
|
|||||||||||||||
|
|
Total
|
2019
|
2020
and 2021 |
2022
and 2023 |
After
2023 |
|||||||||||
|
Secured Credit Facility - principal payments
|
$
|
168,725
|
|
17,211
|
|
151,514
|
|
—
|
|
—
|
|
|||||
|
Secured Credit Facility - interest payments
|
16,919
|
|
7,211
|
|
9,708
|
|
—
|
|
—
|
|
||||||
|
Operating lease commitments
|
51,283
|
|
11,246
|
|
17,750
|
|
11,527
|
|
10,760
|
|
||||||
|
Capital lease and other obligations
|
2,752
|
|
1,972
|
|
780
|
|
—
|
|
—
|
|
||||||
|
Net contractual cash obligations
|
$
|
239,679
|
|
37,640
|
|
179,752
|
|
11,527
|
|
10,760
|
|
|||||
As discussed further in "
Notes to Consolidated Financial Statements - Note (8) - Secured Credit Facility
" included in "
Part II — Item 8. - Financial Statements and Supplementary Data,
" on June 6, 2017, we entered into the June 2017 Amendment to our Secured Credit Facility. In connection with this amendment, the balloon or final payment of the Term Loan Facility, which is not due until February 23, 2021, was reduced by
$22.5 million
through increased borrowings from the Revolving Loan Facility which is not required to be repaid in full until February 23, 2021.
70
As discussed further in "
Notes to Consolidated Financial Statements - Note (17) - Stockholders’ Equity
" included in "
Part II - Item 8. - Financial Statements and Supplementary Data,
" on
September 26, 2018
, our Board of Directors declared a dividend of
$0.10
per common share, payable on
November 16, 2018
to stockholders of record at the close of business on
October 17, 2018
. Future dividends remain subject to compliance with financial covenants under our Secured Credit Facility, as amended, as well as Board approval.
At
July 31, 2018
, we have approximately
$3.2 million
of standby letters of credit outstanding under our Secured Credit Facility, as amended, related to our guarantees of future performance on certain customer contracts. Such amounts are not included in the above table.
During fiscal 2018, we entered into a full and final warranty settlement with AT&T, the largest customer/distributor of a small product line that we refer to as the TCS 911 call handling software solution. AT&T had previously informed us that they did not believe we met certain contractual specifications related to performance and usability and had requested a refund of certain payments made by them. As discussed in
"Notes to Consolidated Financial Statements - Note (6) - Accrued Expenses and Other Current Liabilities,"
included in "
Part II - Item 8.- Financial Statements and Supplementary Data
," included in this Annual Report on Form 10-K, in addition to this settlement, we agreed to issue thirty-six credits to AT&T of $0.2 million which AT&T can apply on a monthly basis to purchases of solutions from us, beginning October 2017 through September 2020. As of July 31, 2018, the total present value of these monthly credits is
$3.6 million
, of which
$1.6 million
is included in accrued expenses and other current liabilities and
$2.0 million
is reflected in other liabilities (non-current) on our Consolidated Balance Sheet. These amounts are not shown in the above commitment table.
In the ordinary course of business, we include indemnification provisions in certain of our customer contracts. Pursuant to these agreements, we have agreed to indemnify, hold harmless and reimburse the indemnified party for losses suffered or incurred by the indemnified party, including but not limited to losses related to third-party intellectual property claims. It is not possible to determine the maximum potential amount under these agreements due to a history of nominal claims in the Comtech legacy business and the unique facts and circumstances involved in each particular agreement. As discussed further in "
Notes to
Consolidated Financial Statements - Note (14) - Commitments and Contingencies,
" TCS is a party to a number of indemnification matters and we are incurring ongoing legal expenses in connection with these matters. Our insurance policies may not cover the cost of defending indemnification claims or providing indemnification. As a result, pending or future claims asserted against us by a party that we have agreed to indemnify could result in legal costs and damages that could have a material adverse effect on our consolidated results of operations and financial condition.
We have change in control agreements, severance agreements and indemnification agreements with certain of our executive officers and certain key employees. All of these agreements may require payments by us, in certain circumstances, including, but not limited to, a change in control of our Company or an involuntary termination of employment without cause.
Our consolidated balance sheet at
July 31, 2018
includes total liabilities of
$9.3 million
for uncertain tax positions, including interest, any or all of which may result in a cash payment. The future payments related to uncertain tax positions have not been presented in the table above due to the uncertainty of the amounts and timing of any potential cash settlement with the taxing authorities.
Recent Accounting Pronouncements
We are required to prepare our consolidated financial statements in accordance with the Financial Accounting Standards Board ("FASB") Accounting Standards Codification ("ASC") which is the source for all authoritative U.S. generally accepted accounting principles, which is commonly referred to as "GAAP." The FASB ASC is subject to updates by the FASB, which are known as Accounting Standards Updates ("ASUs").
As further discussed in "
Notes to Consolidated Financial Statements – Note (1)(n) - Adoption of Accounting Standards and Updates
" included in "
Part II - Item 8. - Financial Statements and Supplementary Data,
" during fiscal
2018
, we adopted:
|
•
|
FASB ASU No. 2016-09, which amends several aspects of the accounting for and reporting of share-based payment transactions. Our adoption of this ASU, on August 1, 2017, did not have a material impact on our consolidated financial statements. See "
Notes to Consolidated Financial Statements – Note (11) - Stock-Based Compensation
" included in "
|
71
|
•
|
FASB ASU No. 2016-15, which amends the guidance on the following cash flow related issues: debt prepayment or debt extinguishment costs; settlement of zero-coupon and similar type debt instruments; contingent consideration payments made after a business combination; proceeds from the settlement of insurance claims (including those related to certain life insurance policies); distributions received from equity method investees; beneficial interests in securitization transactions; and cash receipts or payments with more than one class of cash flows. Our adoption of this ASU on February 1, 2018 did not have any impact on our consolidated financial statements.
|
|
•
|
FASB ASU No. 2017-09, which provides guidance about which changes to the terms or conditions of a share-based payment award require an entity to apply modification accounting in ASC Topic 718. An entity would not be required to account for changes to the terms or conditions of a share-based payment award as a modification if there were no changes to the award’s fair value, vesting conditions and classification. Our adoption of this ASU on February 1, 2018 did not have any impact on our consolidated financial statements.
|
|
•
|
FASB ASU Nos. 2016-01 and 2018-03, which address certain aspects of recognition, measurement, presentation and disclosure of financial instruments, such as: amending the initial and subsequent measurement requirements for certain equity investments; eliminating the disclosure requirements related to the methods and significant assumptions used to estimate the fair value of financial instruments measured at amortized cost on the balance sheet; requiring the use of the exit price notion when measuring the fair value of financial instruments for disclosure purposes; and requiring separate presentation of financial assets and financial liabilities by measurement category and form of financial asset or liability on the balance sheet or the accompanying notes to the financial statements. Adoption of these ASUs did not have a material impact on our consolidated financial statements and disclosures.
|
In addition, the following FASB ASUs have been issued and incorporated into the FASB ASC and have not yet been adopted by us as of
July 31, 2018
:
|
•
|
FASB ASU No. 2014-09
"Revenue from Contracts with Customers (Topic 606),"
issued in May 2014, which replaces numerous requirements in U.S. GAAP, including industry specific requirements, and provides a single revenue recognition model for contracts with customers. The core principle of the new standard is that a company should record revenue to depict the transfer of promised goods or services to customers in an amount that reflects the consideration to which the company expects to be entitled in exchange for those goods or services. In August 2015, FASB ASU No. 2015-14
"Revenue from Contracts with Customers (Topic 606): Deferral of the Effective Date"
was issued to defer the effective date of FASB ASU No. 2014-09 by one year. Additionally, FASB ASU 2016-08
"Revenue from Contracts with Customers (Topic 606): Principal Versus Agent Considerations (Reporting Revenue Gross Versus Net),"
2016-10
"Revenue from Contracts with Customers (Topic 606): Identifying Performance Obligations and Licensing,"
2016-12
"Revenue from Contracts with Customers (Topic 606): Narrow-Scope Improvements and Practical Expedients"
and 2017-05
"Other Income - Gains and Losses from the Derecognition of Nonfinancial Assets (Subtopic 610-20): Clarifying the Scope of Asset Derecognition Guidance and Accounting for Partial Sales of Nonfinancial Assets"
were issued, respectively, to clarify certain implementation matters related to the new revenue standard. Such clarifications were effective upon our adoption of ASU No. 2014-09 which, as further discussed in
"Notes to Consolidated Financial Statements - Note (1)(c) - Summary of Significant Accounting and Reporting Policies - Revenue Recognition"
included in
"Part II - Item 8. - Financial Statements and Supplementary Data,"
was on August 1, 2018 (our first quarter of fiscal 2019) using the modified retrospective method. There was no material impact on our business, results of operations and financial condition upon such adoption. In fiscal 2019, we expect to recognize a significant portion of our contracts over time, as there is a continuous transfer of control to the customer over the contractual period of performance. The remainder of our contracts will be recognized at a point in time. Both of these methods are similar to what we did prior to August 1, 2018.
|
72
|
•
|
FASB ASU No. 2016-02, issued in February 2016, which requires lessees to recognize the following for all leases (with the exception of short-term leases): (i) a lease liability, which is a lessee's obligation to make lease payments arising from a lease, initially measured at the present value of the lease payments; and (ii) a right-of-use asset, which is an asset that represents the lessee's right to use a specified asset for the lease term. Under the new guidance, lessor accounting is largely unchanged. In January 2018, FASB ASU No. 2018-01 was issued to permit an entity to elect an optional transition practical expedient to not evaluate under Topic 842 land easements that exist or expired before the entity’s adoption of Topic 842. In July 2018, the FASB issued ASU Nos. 2018-10 and 2018-11, which provide further codification improvements and relieves the requirement to present prior comparative year results when adopting the new lease standard. Instead, companies can choose to recognize the cumulative-effect of applying the new standard to leased assets and liabilities as an adjustment to opening retained earnings. These ASUs are effective for fiscal years beginning after December 15, 2018 (our fiscal year beginning on August 1, 2019), including interim periods within those fiscal years and should be applied with a modified retrospective approach. Early adoption is permitted. We are evaluating the impact of these ASUs on our consolidated financial statements and disclosures.
|
|
•
|
FASB ASU No. 2016-13, issued in June 2016, which requires the measurement of expected credit losses for financial assets held at the reporting date to be based on historical experience, current conditions and reasonable and supportable forecasts. This ASU is effective for fiscal years beginning after December 15, 2019 (our fiscal year beginning on August 1, 2020), including interim periods within those fiscal years. All entities may adopt the amendments in this ASU earlier as of the fiscal years beginning after December 15, 2018, including interim periods within those fiscal years. Except for a prospective transition approach required for debt securities for which an other-than-temporary impairment had been recognized before the effective date, an entity will apply the amendments in this ASU through a cumulative-effect adjustment to retained earnings as of the beginning of the first reporting period in which the guidance is effective (that is, on a modified-retrospective approach). We are evaluating the impact of this ASU on our consolidated financial statements and disclosures.
|
|
•
|
FASB ASU No. 2016-16 issued in October 2016, which eliminates a prior exception and now requires an entity to recognize the income tax consequences of an intra-entity transfer of an asset other than inventory (for example, intellectual property and property, plant and equipment) when the transfer occurs. This ASU is effective for fiscal years beginning after December 15, 2017 (our fiscal year beginning on August 1, 2018), and interim periods within those fiscal years and shall be applied on a modified retrospective basis through a cumulative-effect adjustment directly to retained earnings as of the beginning of the period of adoption. We adopted this ASU on August 1, 2018. There was no material impact to our consolidated financial statements (including any cumulative-effect adjustment) and disclosures upon such adoption.
|
|
•
|
FASB ASU No. 2017-11, issued in July 2017, which provides guidance on the accounting for certain financial instruments with embedded features that result in the strike price of the instrument or embedded conversion option being reduced on the basis of the pricing of future equity offerings (commonly referred to as "down round" features). This ASU is effective for fiscal years, and interim periods within those fiscal years, beginning after December 15, 2018 (our fiscal year beginning on August 1, 2019) and early adoption is permitted, including adoption in an interim period. This ASU should be applied retrospectively in accordance with the provisions of the ASU. We are evaluating the impact of this ASU on our consolidated financial statements and disclosures.
|
|
•
|
FASB ASU No. 2017-12, issued in August 2017, which expands and refines hedge accounting for both nonfinancial and financial risk components and simplifies and aligns the recognition and presentation of the effects of the hedging instrument and the hedged item in the financial statements. This ASU is effective for fiscal years beginning after December 15, 2018 (our fiscal year beginning on August 1, 2019) and for interim periods therein, with early adoption permitted. We are evaluating the impact of this ASU on the consolidated financial statements and disclosures; however, we do not expect the adoption to have any effect given that we historically have not engaged in hedge transactions.
|
|
•
|
FASB ASU No. 2018-07, issued in June 2018, which expands the scope of Topic 718 to include certain share-based payment transactions for acquiring goods and services from nonemployees. This ASU is effective for fiscal years beginning after December 15, 2018 (our fiscal year beginning on August 1, 2019), including interim periods within that fiscal year. Early adoption is permitted, but no earlier than an entity’s adoption date of Topic 606. An entity should only remeasure liability-classified awards that have not been settled by the date of adoption and equity-classified awards for which a measurement date has not been established through a cumulative-effect adjustment to retained earnings as of the beginning of the fiscal year of adoption. We are evaluating the impact of this ASU on our consolidated financial statements and disclosures; however, we do not expect the adoption to have any effect given that we historically have not engaged in such types of transactions with nonemployees.
|
73
|
•
|
FASB ASU No. 2018-13, issued in August 2018, which modifies the disclosure requirements for fair value measurements in Topic 820. This ASU is effective for fiscal years, and interim periods within those fiscal years, beginning after December 15, 2019 (our fiscal year beginning on August 1, 2020). Upon their effective date, certain provisions are to be applied prospectively, while others are to be applied retrospectively to all periods presented. An entity is permitted to early adopt any removed or modified disclosures upon issuance of this ASU and delay adoption of the additional disclosures until their effective date. We are evaluating the impact of this ASU on our consolidated financial statement disclosures.
|
|
•
|
FASB ASU No. 2018-15, issued in August 2018, which aligns the requirements for capitalizing implementation costs incurred in a hosting arrangement that is a service contract with the requirements for capitalizing implementation costs incurred to develop or obtain internal-use software (and hosting arrangements that include an internal use software license). The accounting for the service element of a hosting arrangement that is a service contract is not affected by the amendments in this ASU. This ASU is effective for fiscal years beginning after December 15, 2019 (our fiscal year beginning on August 1, 2020), and interim periods within those fiscal years. Early adoption is permitted, including adoption in any interim period. This ASU should be applied either retrospectively or prospectively to all implementation costs incurred after the date of adoption. We are evaluating the impact of this ASU on our consolidated financial statements and disclosures.
|
Our earnings and cash flows are subject to fluctuations due to changes in interest rates primarily from borrowings under our Secured Credit Facility, as amended. Based on the amount of outstanding debt under our Secured Credit Facility, as amended, a hypothetical change in interest rates by 10% would change interest expense by $0.8 million over a one-year period. Although we do not currently use interest rate derivative instruments to manage exposure to interest rate changes, we may choose to do so in the future in connection with our Secured Credit Facility, as amended.
Our earnings and cash flows are also subject to fluctuations due to changes in interest rates on our investment of available cash balances. As of
July 31, 2018
, we had cash and cash equivalents of
$43.5 million
, which consisted of cash and highly-liquid money market deposit accounts. Many of these investments are subject to fluctuations in interest rates, which could impact our results. Based on our investment portfolio balance as of
July 31, 2018
, a hypothetical change in interest rates of 10% would have a nominal impact on interest income over a one-year period. Ultimately, the availability of our cash and cash equivalents is dependent on a well-functioning liquid market.
74
Reports of Independent Registered Public Accounting Firm, Consolidated Financial Statements, Notes to Consolidated Financial Statements and Related Financial Schedule are listed in the Index to Consolidated Financial Statements and Schedule annexed hereto.
ACCOUNTING AND FINANCIAL DISCLOSURE
None.
Evaluation of Disclosure Controls and Procedures
As of the end of the period covered by this Annual Report on Form 10-K, an evaluation of the effectiveness of the design and operation of our disclosure controls and procedures was carried out by us under the supervision and with the participation of our management, including our President, Chief Executive Officer and Chairman and Chief Financial Officer. Based on that evaluation, our President, Chief Executive Officer and Chairman and Chief Financial Officer concluded that our disclosure controls and procedures were effective as of the end of the period covered by the report to provide reasonable assurance that the information required to be disclosed by us in reports filed under the Securities Exchange Act of 1934, as amended, is recorded, processed, summarized and reported, within the time periods specified in the SEC’s rules and forms and is accumulated and communicated to management, as appropriate, to allow timely decisions regarding required disclosure. A system of controls, no matter how well designed and operated, cannot provide absolute assurance that the objectives of the system of controls are met, and no evaluation of controls can provide absolute assurance that all control issues and instances of fraud, if any, within a company have been detected.
Management’s Report on Internal Control Over Financial Reporting
Management is responsible for establishing and maintaining adequate internal control over financial reporting as defined in Rules 13a-15(f) and 15d-15(f) under the Securities Exchange Act of 1934. Our internal control over financial reporting is a process designed to provide reasonable assurance regarding the reliability of financial reporting and the preparation of financial statements for external purposes in accordance with generally accepted accounting principles. All internal control systems, no matter how well designed, have inherent limitations. Therefore, even those systems determined to be effective can provide only reasonable assurance with respect to financial statement preparation and presentation. Also, projections of any evaluation of effectiveness to future periods are subject to the risk that controls may become inadequate because of changes in conditions, or that the degree of compliance with the policies or procedures may deteriorate.
Management assessed the effectiveness of our internal control over financial reporting as of
July 31, 2018
. In making this assessment, we used the criteria set forth by the Committee of Sponsoring Organizations of the Treadway Commission ("COSO") in
Internal Control – Integrated Framework (2013)
. Based on our assessment, we determined that, as of
July 31, 2018
, our internal control over financial reporting was effective based on those criteria.
Deloitte and Touche LLP, our independent registered public accounting firm, has performed an audit of our internal control over financial reporting as of
July 31, 2018
based on criteria established in
Internal Control – Integrated Framework (2013)
issued by the COSO. This audit is required to be performed in accordance with the standards of the Public Company Accounting Oversight Board (United States). Our independent auditors were given unrestricted access to all financial records and related data. Deloitte’s audit reports appear on pages F-2 and F-3 of this annual report.
Changes In Internal Control Over Financial Reporting
There have been no changes in our internal control over financial reporting as defined in Rules 13a-15(f) and 15d-15(f) under the Exchange Act that occurred during our fiscal quarter ended
July 31, 2018
, that have materially affected, or are reasonably likely to materially affect, our internal control over financial reporting.
Not applicable.
75
Certain information concerning directors and officers is incorporated by reference to our Proxy Statement for the Annual Meeting of Stockholders (the "Proxy Statement") which will be filed with the Securities and Exchange Commission no more than 120 days after the close of our fiscal year.
Information regarding executive compensation is incorporated by reference to the Proxy Statement, which will be filed with the Securities and Exchange Commission no more than 120 days after the close of our fiscal year.
AND MANAGEMENT AND RELATED STOCKHOLDER MATTERS
Information regarding securities authorized for issuance under equity compensation plans and certain information regarding security ownership of certain beneficial owners and management is incorporated by reference to the Proxy Statement, which will be filed with the Securities and Exchange Commission no more than 120 days after the close of our fiscal year.
AND DIRECTOR INDEPENDENCE
Information regarding certain relationships and related transactions is incorporated by reference to the Proxy Statement, which will be filed with the Securities and Exchange Commission no more than 120 days after the close of our fiscal year.
Information regarding principal accountant fees and services is incorporated by reference to the Proxy Statement, which will be filed with the Securities and Exchange Commission no more than 120 days after the close of our fiscal year.
76
|
(a)
|
(1) The Registrant’s financial statements together with a separate index are annexed hereto.
|
|
|
(2) The Financial Statement Schedule listed in a separate index is annexed hereto.
|
||
|
(3) Exhibits required by Item 601 of Regulation S-K are listed below.
|
||
|
Exhibit
Number
|
Description of Exhibit
|
Incorporated By
Reference to Exhibit
|
||
|
|
Exhibit 3(a)(i) to the Registrant’s 2006 Form 10-K
|
|||
|
|
Exhibit 3(a)(ii) to the Registrant’s 2017 Form 10-K
|
|||
|
|
Exhibit 10.1 to the Registrant’s Form 10-Q, filed December 7, 2016
|
|||
|
|
Exhibit 10.7 to the Registrant’s Form 8-K, filed June 7, 2017
|
|||
|
Exhibit 10(s) to the Registrant's 2011 Form 10-K
|
||||
|
Appendix B to the Registrant’s Proxy Statement, filed November 3, 2000
|
||||
|
Exhibit 10.1 to the Registrant’s Form 10-Q, filed June 6, 2018
|
||||
|
|
Exhibit 10(f)(7) to the Registrant’s 2005 Form 10-K
|
|||
|
|
Exhibit 10(f)(8) to the Registrant’s 2006 Form 10-K
|
|||
|
|
Exhibit 10(s) to the Registrant’s 2012 Form 10-K
|
|||
|
|
Exhibit 10(z) to the Registrant's 2013 Form 10-K
|
|||
|
Form of Long-Term Performance Share Award Agreement pursuant to the 2000 Stock Incentive Plan - 2014
|
Exhibit 10(ab) to the Registrant's 2014 Form 10-K
|
|||
|
Form of Long-Term Performance Share Award Agreement pursuant to the 2000 Stock Incentive Plan - 2017
|
Exhibit 10.8 to the Registrant's Form 8-K, filed June 7, 2017
|
|||
77
|
Exhibit
Number
|
Description of Exhibit
|
Incorporated By
Reference to Exhibit
|
||
|
|
Exhibit 10(y) to the Registrant’s 2016 Form 10-K
|
|||
|
|
Exhibit 10(ab) to the Registrant’s 2016 Form 10-K
|
|||
|
|
Exhibit 10(h)(1) to the Registrant’s 2017 Form 10-K
|
|||
|
|
Exhibit 10(z) to the Registrant’s 2016 Form 10-K
|
|||
|
|
Exhibit 10(w) to the Registrant's 2013 Form 10-K
|
|||
|
|
Exhibit 10.2 to the Registrant's Form 10-Q, filed June 7, 2012
|
|||
|
|
Exhibit 10(aa) to the Registrant’s 2016 Form 10-K
|
|||
|
|
Exhibit 10(x) to the Registrant's 2013 Form 10-K
|
|||
|
|
Exhibit 10.1 to the Registrant's Form 10-Q, filed June 7, 2012
|
|||
|
|
Exhibit 10(v) to the Registrant's 2013 Form 10-K
|
|||
|
Exhibit 10.2 to the Registrant's Form 10-Q, filed December 9, 2013
|
||||
|
|
||||
|
|
Exhibit 10.1 to Registrant’s Form 8-K, filed on March 8, 2007
|
|||
|
Exhibit 10.2 to the Registrant’s Form 8-K, filed June 7, 2017
|
||||
|
|
Exhibit 10.3 to the Registrant’s Form 8-K, filed June 7, 2017
|
|||
|
Exhibit 10.4 to the Registrant’s Form 8-K, filed June 7, 2017
|
||||
78
|
Exhibit
Number
|
Description of Exhibit
|
Incorporated By
Reference to Exhibit
|
||
|
|
Exhibit 10.5 to the Registrant’s Form 8-K, filed June 7, 2017
|
|||
|
|
Exhibit 10.6 to the Registrant’s Form 8-K, filed June 7, 2017
|
|||
|
|
Exhibit 2.1 to the Registrant’s Form 8-K, filed November 23, 2015
|
|||
|
|
Exhibit 10.1 to the Registrant’s Form 8-K, filed February 29, 2016
|
|||
|
|
Exhibit 10.1 to the Registrant’s Form 8-K, filed June 7, 2017
|
|||
|
|
|
|||
|
|
|
|||
|
|
|
|||
|
|
|
|||
|
|
|
|||
|
|
||||
|
101.INS
|
XBRL Instance Document
|
|
||
|
101.SCH
|
XBRL Taxonomy Extension Schema Document
|
|
||
|
101.CAL
|
XBRL Taxonomy Extension Calculation Linkbase Document
|
|
||
|
101.LAB
|
XBRL Taxonomy Extension Labels Linkbase Document
|
|
||
|
101.PRE
|
XBRL Taxonomy Extension Presentation Linkbase Document
|
|
||
|
101.DEF
|
XBRL Taxonomy Extension Definition Linkbase Document
|
|
||
* Management contract or compensatory plan or arrangement.
79
SIGNATURES
Pursuant to the requirements of Section 13 or 15(d) of the Securities and Exchange Act of 1934, the registrant has duly caused this report to be signed on its behalf by the undersigned, thereunto duly authorized.
|
|
COMTECH TELECOMMUNICATIONS CORP.
|
|
|
|
|
September 26, 2018
|
By: /s/Fred Kornberg
|
|
(Date)
|
Fred Kornberg, Chairman of the Board
Chief Executive Officer and President
|
Pursuant to the requirements of the Securities Exchange Act of 1934, this report has been signed below by the following persons on behalf of the registrant and in the capacities and on the dates indicated.
|
|
Signature
|
Title
|
|
|
|
|
|
September 26, 2018
|
/s/Fred Kornberg
|
Chairman of the Board
|
|
(Date)
|
Fred Kornberg
|
Chief Executive Officer and President
|
|
|
|
(Principal Executive Officer)
|
|
|
|
|
|
September 26, 2018
|
/s/Michael D. Porcelain
|
Senior Vice President and
|
|
(Date)
|
Michael D. Porcelain
|
Chief Financial Officer
(Principal Financial and Accounting Officer)
|
|
|
|
|
|
September 26, 2018
|
/s/Edwin Kantor
|
Director
|
|
(Date)
|
Edwin Kantor
|
|
|
|
|
|
|
|
|
|
|
September 26, 2018
|
/s/Ira S. Kaplan
|
Director
|
|
(Date)
|
Ira S. Kaplan
|
|
|
|
|
|
|
|
|
|
|
September 26, 2018
|
/s/Robert G. Paul
|
Director
|
|
(Date)
|
Robert G. Paul
|
|
|
September 27, 2017
|
/s/Dr. Yacov A. Shamash
|
Director
|
|
(Date)
|
Dr. Yacov A. Shamash
|
|
|
September 26, 2018
|
/s/Lawrence J. Waldman
|
Director
|
|
(Date)
|
Lawrence J. Waldman
|
|
80
COMTECH TELECOMMUNICATIONS CORP. AND SUBSIDIARIES
Index to Consolidated Financial Statements and Schedule
|
Page
|
|
|
Consolidated Financial Statements:
|
|
|
Additional Financial Information Pursuant to the Requirements of Form 10-K:
|
|
|
Schedules not listed above have been omitted because they are either not applicable or the required information has been provided elsewhere in the consolidated financial statements or notes thereto.
|
|
F- 1

REPORT OF INDEPENDENT REGISTERED PUBLIC ACCOUNTING FIRM
To the stockholders and Board of Directors of
Comtech Telecommunications Corp.
Melville, New York
Opinion on the Financial Statements
We have audited the accompanying consolidated balance sheets of Comtech Telecommunications Corp. and subsidiaries (the "Company") as of July 31, 2018 and 2017, the related consolidated statements of operations, stockholders’ equity, and cash flows, for each of the three years in the period ended July 31, 2018, and the related notes and the schedule listed in the Index at Item 15 (collectively referred to as the "financial statements"). In our opinion, the financial statements present fairly, in all material respects, the financial position of the Company as of July 31, 2018 and 2017, and the results of its operations and its cash flows for each of the three years in the period ended July 31, 2018, in conformity with accounting principles generally accepted in the United States of America.
We have also audited, in accordance with the standards of the Public Company Accounting Oversight Board (United States) (PCAOB), the Company’s internal control over financial reporting as of July 31, 2018, based on criteria established in Internal Control-Integrated Framework (2013) issued by the Committee of Sponsoring Organizations of the Treadway Commission and our report dated September 26, 2018, expressed an unqualified opinion on the Company’s internal control over financial reporting.
Basis for Opinion
These financial statements are the responsibility of the Company’s management. Our responsibility is to express an opinion on the Company’s financial statements based on our audits. We are a public accounting firm registered with the PCAOB and are required to be independent with respect to the Company in accordance with the U.S. federal securities laws and the applicable rules and regulations of the Securities and Exchange Commission and the PCAOB.
We conducted our audits in accordance with the standards of the PCAOB. Those standards require that we plan and perform the audit to obtain reasonable assurance about whether the financial statements are free of material misstatement, whether due to error or fraud. Our audits included performing procedures to assess the risks of material misstatement of the financial statements, whether due to error or fraud, and performing procedures that respond to those risks. Such procedures included examining, on a test basis, evidence regarding the amounts and disclosures in the financial statements. Our audits also included evaluating the accounting principles used and significant estimates made by management, as well as evaluating the overall presentation of the financial statements. We believe that our audits provide a reasonable basis for our opinion.
/s/ DELOITTE & TOUCHE LLP
Jericho, New York
September 26, 2018
We have served as the Company's auditor since 2015.
F- 2
REPORT OF INDEPENDENT REGISTERED PUBLIC ACCOUNTING FIRM
To the stockholders and Board of Directors of
Comtech Telecommunications Corp.
Melville, New York
Opinion on Internal Control over Financial Reporting
We have audited the internal control over financial reporting of Comtech Telecommunications Corp. and subsidiaries (the "Company") as of July 31, 2018, based on criteria established in Internal Control - Integrated Framework (2013) issued by the Committee of Sponsoring Organizations of the Treadway Commission (COSO). In our opinion, the Company maintained, in all material respects, effective internal control over financial reporting as of July 31, 2018, based on criteria established in Internal Control - Integrated Framework (2013) issued by COSO.
We have also audited, in accordance with the standards of the Public Company Accounting Oversight Board (United States) (PCAOB), the consolidated financial statements and financial statement schedule as of and for the year ended July 31, 2018, of the Company and our report dated September 26, 2018, expressed an unqualified opinion on those financial statements and financial statement schedule.
Basis for Opinion
The Company's management is responsible for maintaining effective internal control over financial reporting and for its assessment of the effectiveness of internal control over financial reporting, included in the accompanying Management's Report on Internal Control Over Financial Reporting. Our responsibility is to express an opinion on the Company's internal control over financial reporting based on our audit. We are a public accounting firm registered with the PCAOB and are required to be independent with respect to the Company in accordance with the U.S. federal securities laws and the applicable rules and regulations of the Securities and Exchange Commission and the PCAOB.
We conducted our audit in accordance with the standards of the PCAOB. Those standards require that we plan and perform the audit to obtain reasonable assurance about whether effective internal control over financial reporting was maintained in all material respects. Our audit included obtaining an understanding of internal control over financial reporting, assessing the risk that a material weakness exists, testing and evaluating the design and operating effectiveness of internal control based on the assessed risk, and performing such other procedures as we considered necessary in the circumstances. We believe that our audit provides a reasonable basis for our opinion.
Definition and Limitations of Internal Control over Financial Reporting
A company’s internal control over financial reporting is a process designed to provide reasonable assurance regarding the reliability of financial reporting and the preparation of financial statements for external purposes in accordance with generally accepted accounting principles. A company’s internal control over financial reporting includes those policies and procedures that (1) pertain to the maintenance of records that, in reasonable detail, accurately and fairly reflect the transactions and dispositions of the assets of the company; (2) provide reasonable assurance that transactions are recorded as necessary to permit preparation of financial statements in accordance with generally accepted accounting principles, and that receipts and expenditures of the company are being made only in accordance with authorizations of management and directors of the company; and (3) provide reasonable assurance regarding prevention or timely detection of unauthorized acquisition, use, or disposition of the company’s assets that could have a material effect on the financial statements.
Because of its inherent limitations, internal control over financial reporting may not prevent or detect misstatements. Also, projections of any evaluation of effectiveness to future periods are subject to the risk that the controls may become inadequate because of changes in conditions, or that the degree of compliance with the policies or procedures may deteriorate.
/s/ DELOITTE & TOUCHE LLP
Jericho, New York
September 26, 2018
F- 3
COMTECH TELECOMMUNICATIONS CORP.
AND SUBSIDIARIES
Consolidated Balance Sheets
As of July 31, 2018 and 2017
|
Assets
|
2018
|
2017
|
|||||
|
Current assets:
|
|||||||
|
Cash and cash equivalents
|
$
|
43,484,000
|
|
41,844,000
|
|
||
|
Accounts receivable, net
|
147,439,000
|
|
124,962,000
|
|
|||
|
Inventories, net
|
75,076,000
|
|
60,603,000
|
|
|||
|
Prepaid expenses and other current assets
|
13,794,000
|
|
13,635,000
|
|
|||
|
Total current assets
|
279,793,000
|
|
241,044,000
|
|
|||
|
Property, plant and equipment, net
|
28,987,000
|
|
32,847,000
|
|
|||
|
Goodwill
|
290,633,000
|
|
290,633,000
|
|
|||
|
Intangibles with finite lives, net
|
240,796,000
|
|
261,871,000
|
|
|||
|
Deferred financing costs, net
|
2,205,000
|
|
3,065,000
|
|
|||
|
Other assets, net
|
2,743,000
|
|
2,603,000
|
|
|||
|
Total assets
|
$
|
845,157,000
|
|
832,063,000
|
|
||
|
Liabilities and Stockholders’ Equity
|
|
|
|
|
|||
|
Current liabilities:
|
|
|
|
|
|||
|
Accounts payable
|
$
|
43,928,000
|
|
29,402,000
|
|
||
|
Accrued expenses and other current liabilities
|
65,034,000
|
|
68,610,000
|
|
|||
|
Dividends payable
|
2,356,000
|
|
2,343,000
|
|
|||
|
Customer advances and deposits
|
34,452,000
|
|
25,771,000
|
|
|||
|
Current portion of long-term debt
|
17,211,000
|
|
15,494,000
|
|
|||
|
Current portion of capital lease and other obligations
|
1,836,000
|
|
2,309,000
|
|
|||
|
Interest payable
|
499,000
|
|
282,000
|
|
|||
|
Total current liabilities
|
165,316,000
|
|
144,211,000
|
|
|||
|
Non-current portion of long-term debt, net
|
148,087,000
|
|
176,228,000
|
|
|||
|
Non-current portion of capital lease and other obligations
|
765,000
|
|
1,771,000
|
|
|||
|
Income taxes payable
|
2,572,000
|
|
2,515,000
|
|
|||
|
Deferred tax liability, net
|
10,927,000
|
|
17,306,000
|
|
|||
|
Customer advances and deposits, non-current
|
7,689,000
|
|
7,227,000
|
|
|||
|
Other liabilities
|
4,117,000
|
|
2,655,000
|
|
|||
|
Total liabilities
|
339,473,000
|
|
351,913,000
|
|
|||
|
Commitments and contingencies (See Note 14)
|
|
|
|
|
|||
|
Stockholders’ equity:
|
|
|
|
|
|||
|
Preferred stock, par value $.10 per share; shares authorized and unissued 2,000,000
|
—
|
|
—
|
|
|||
|
Common stock, par value $.10 per share; authorized 100,000,000 shares; issued 38,860,571 shares and 38,619,467 shares at July 31, 2018 and 2017, respectively
|
3,886,000
|
|
3,862,000
|
|
|||
|
Additional paid-in capital
|
538,453,000
|
|
533,001,000
|
|
|||
|
Retained earnings
|
405,194,000
|
|
385,136,000
|
|
|||
|
|
947,533,000
|
|
921,999,000
|
|
|||
|
Less:
|
|
|
|
|
|||
|
Treasury stock, at cost (15,033,317 shares at July 31, 2018 and 2017)
|
(441,849,000
|
)
|
(441,849,000
|
)
|
|||
|
Total stockholders’ equity
|
505,684,000
|
|
480,150,000
|
|
|||
|
Total liabilities and stockholders’ equity
|
$
|
845,157,000
|
|
832,063,000
|
|
||
See accompanying notes to consolidated financial statements.
F- 4
COMTECH TELECOMMUNICATIONS CORP.
AND SUBSIDIARIES
Consolidated Statements of Operations
Fiscal Years Ended July 31, 2018, 2017 and 2016
|
|
2018
|
2017
|
2016
|
|||||||
|
Net sales
|
$
|
570,589,000
|
|
550,368,000
|
|
411,004,000
|
|
|||
|
Cost of sales
|
346,648,000
|
|
332,183,000
|
|
239,767,000
|
|
||||
|
Gross profit
|
223,941,000
|
|
218,185,000
|
|
171,237,000
|
|
||||
|
Expenses:
|
|
|
|
|
|
|
||||
|
Selling, general and administrative
|
113,922,000
|
|
116,080,000
|
|
94,932,000
|
|
||||
|
Research and development
|
53,869,000
|
|
54,260,000
|
|
42,190,000
|
|
||||
|
Amortization of intangibles
|
21,075,000
|
|
22,823,000
|
|
13,415,000
|
|
||||
|
Settlement of intellectual property litigation
|
—
|
|
(12,020,000
|
)
|
—
|
|
||||
|
Acquisition plan expenses
|
—
|
|
—
|
|
21,276,000
|
|
||||
|
|
188,866,000
|
|
181,143,000
|
|
171,813,000
|
|
||||
|
Operating income (loss)
|
35,075,000
|
|
37,042,000
|
|
(576,000
|
)
|
||||
|
Other expenses (income):
|
|
|
|
|
|
|
||||
|
Interest expense
|
10,195,000
|
|
11,629,000
|
|
7,750,000
|
|
||||
|
Interest (income) and other
|
254,000
|
|
(68,000
|
)
|
(134,000
|
)
|
||||
|
Income (loss) before (benefit from) provision for income taxes
|
24,626,000
|
|
25,481,000
|
|
(8,192,000
|
)
|
||||
|
(Benefit from) provision for income taxes
|
(5,143,000
|
)
|
9,654,000
|
|
(454,000
|
)
|
||||
|
Net income (loss)
|
$
|
29,769,000
|
|
15,827,000
|
|
(7,738,000
|
)
|
|||
|
Net income (loss) per share:
|
|
|
|
|
|
|
||||
|
Basic
|
$
|
1.25
|
|
0.68
|
|
(0.46
|
)
|
|||
|
Diluted
|
$
|
1.24
|
|
0.67
|
|
(0.46
|
)
|
|||
|
Weighted average number of common shares outstanding – basic
|
23,825,000
|
|
23,433,000
|
|
16,972,000
|
|
||||
|
Weighted average number of common and common equivalent shares outstanding – diluted
|
24,040,000
|
|
23,489,000
|
|
16,972,000
|
|
||||
|
Dividends declared per issued and outstanding common share as of the applicable dividend record date
|
$
|
0.40
|
|
0.60
|
|
1.20
|
|
|||
See accompanying notes to consolidated financial statements.
F- 5
COMTECH TELECOMMUNICATIONS CORP.
AND SUBSIDIARIES
Consolidated Statements of Stockholders’ Equity
Fiscal Years Ended July 31, 2018, 2017 and 2016
|
Common Stock
|
Additional
Paid-in Capital
|
Retained Earnings
|
Treasury Stock
|
Stockholders'
Equity
|
||||||||||||||||||||||
|
Shares
|
Amount
|
Shares
|
Amount
|
|||||||||||||||||||||||
|
Balance as of July 31, 2015
|
31,165,401
|
|
$
|
3,117,000
|
|
$
|
427,083,000
|
|
$
|
413,058,000
|
|
15,033,317
|
|
$
|
(441,849,000
|
)
|
$
|
401,409,000
|
|
|||||||
|
Common stock issued from equity offering, net of issuance costs
|
7,145,000
|
|
715,000
|
|
93,355,000
|
|
—
|
|
—
|
|
—
|
|
94,070,000
|
|
||||||||||||
|
Equity-classified stock award compensation
|
—
|
|
—
|
|
4,076,000
|
|
—
|
|
—
|
|
—
|
|
4,076,000
|
|
||||||||||||
|
Proceeds from issuance of employee stock purchase plan shares
|
45,319
|
|
4,000
|
|
672,000
|
|
—
|
|
—
|
|
—
|
|
676,000
|
|
||||||||||||
|
Net settlement of stock-based awards
|
12,277
|
|
1,000
|
|
(106,000
|
)
|
—
|
|
—
|
|
—
|
|
(105,000
|
)
|
||||||||||||
|
Cash dividends declared
|
—
|
|
—
|
|
—
|
|
(21,549,000
|
)
|
—
|
|
—
|
|
(21,549,000
|
)
|
||||||||||||
|
Accrual of dividend equivalents, net of reversal
|
—
|
|
—
|
|
—
|
|
(155,000
|
)
|
—
|
|
—
|
|
(155,000
|
)
|
||||||||||||
|
Net income tax shortfall from settlement of stock-based awards
|
—
|
|
—
|
|
(27,000
|
)
|
—
|
|
—
|
|
—
|
|
(27,000
|
)
|
||||||||||||
|
Reversal of deferred tax assets associated with expired and unexercised stock-based awards
|
—
|
|
—
|
|
(256,000
|
)
|
—
|
|
—
|
|
—
|
|
(256,000
|
)
|
||||||||||||
|
Net loss
|
—
|
|
—
|
|
—
|
|
(7,738,000
|
)
|
—
|
|
—
|
|
(7,738,000
|
)
|
||||||||||||
|
Balance as of July 31, 2016
|
38,367,997
|
|
3,837,000
|
|
524,797,000
|
|
383,616,000
|
|
15,033,317
|
|
(441,849,000
|
)
|
470,401,000
|
|
||||||||||||
|
Equity-classified stock award compensation
|
—
|
|
—
|
|
8,467,000
|
|
—
|
|
—
|
|
—
|
|
8,467,000
|
|
||||||||||||
|
Proceeds from issuance of employee stock purchase plan shares
|
64,367
|
|
7,000
|
|
687,000
|
|
—
|
|
—
|
|
—
|
|
694,000
|
|
||||||||||||
|
Issuance of restricted stock, net
|
144,988
|
|
14,000
|
|
(14,000
|
)
|
—
|
|
—
|
|
—
|
|
—
|
|
||||||||||||
|
Net settlement of stock-based awards
|
42,115
|
|
4,000
|
|
(266,000
|
)
|
—
|
|
—
|
|
—
|
|
(262,000
|
)
|
||||||||||||
|
Cash dividends declared
|
—
|
|
—
|
|
—
|
|
(14,034,000
|
)
|
—
|
|
—
|
|
(14,034,000
|
)
|
||||||||||||
|
Accrual of dividend equivalents, net of reversal
|
—
|
|
—
|
|
—
|
|
(273,000
|
)
|
—
|
|
—
|
|
(273,000
|
)
|
||||||||||||
|
Net income tax shortfall from settlement of stock-based awards
|
—
|
|
—
|
|
(248,000
|
)
|
—
|
|
—
|
|
—
|
|
(248,000
|
)
|
||||||||||||
|
Reversal of deferred tax assets associated with expired and unexercised stock-based awards
|
—
|
|
—
|
|
(422,000
|
)
|
—
|
|
—
|
|
—
|
|
(422,000
|
)
|
||||||||||||
|
Net income
|
—
|
|
—
|
|
—
|
|
15,827,000
|
|
—
|
|
—
|
|
15,827,000
|
|
||||||||||||
|
Balance as of July 31, 2017
|
38,619,467
|
|
3,862,000
|
|
533,001,000
|
|
385,136,000
|
|
15,033,317
|
|
(441,849,000
|
)
|
480,150,000
|
|
||||||||||||
|
Equity-classified stock award compensation
|
—
|
|
—
|
|
8,605,000
|
|
—
|
|
—
|
|
—
|
|
8,605,000
|
|
||||||||||||
|
Proceeds from exercises of stock options
|
13,100
|
|
1,000
|
|
325,000
|
|
—
|
|
—
|
|
—
|
|
326,000
|
|
||||||||||||
|
Proceeds from issuance of employee stock purchase plan shares
|
44,996
|
|
5,000
|
|
850,000
|
|
—
|
|
—
|
|
—
|
|
855,000
|
|
||||||||||||
|
Forfeiture of restricted stock
|
(10,254
|
)
|
(1,000
|
)
|
1,000
|
|
—
|
|
—
|
|
—
|
|
—
|
|
||||||||||||
|
Net settlement of stock-based awards
|
193,262
|
|
19,000
|
|
(4,329,000
|
)
|
—
|
|
—
|
|
—
|
|
(4,310,000
|
)
|
||||||||||||
|
Cash dividends declared
|
—
|
|
—
|
|
—
|
|
(9,411,000
|
)
|
—
|
|
—
|
|
(9,411,000
|
)
|
||||||||||||
|
Accrual of dividend equivalents, net of reversal
|
—
|
|
—
|
|
—
|
|
(300,000
|
)
|
—
|
|
—
|
|
(300,000
|
)
|
||||||||||||
|
Net income
|
—
|
|
—
|
|
—
|
|
29,769,000
|
|
—
|
|
—
|
|
29,769,000
|
|
||||||||||||
|
Balance as of July 31, 2018
|
38,860,571
|
|
$
|
3,886,000
|
|
$
|
538,453,000
|
|
$
|
405,194,000
|
|
15,033,317
|
|
$
|
(441,849,000
|
)
|
$
|
505,684,000
|
|
|||||||
See accompanying notes to consolidated financial statements.
F- 6
|
COMTECH TELECOMMUNICATIONS CORP.
AND SUBSIDIARIES
Consolidated Statements of Cash Flows
Fiscal Years Ended July 31, 2018, 2017 and 2016
|
|||||||||||
|
|
2018
|
2017
|
2016
|
||||||||
|
Cash flows from operating activities:
|
|
|
|
||||||||
|
Net income (loss)
|
$
|
29,769,000
|
|
15,827,000
|
|
(7,738,000
|
)
|
||||
|
Adjustments to reconcile net income (loss) to net cash provided by operating activities:
|
|
|
|
|
|
|
|||||
|
Depreciation and amortization of property, plant and equipment
|
13,655,000
|
|
14,354,000
|
|
9,830,000
|
|
|||||
|
Amortization of intangible assets with finite lives
|
21,075,000
|
|
22,823,000
|
|
13,415,000
|
|
|||||
|
Amortization of stock-based compensation
|
8,569,000
|
|
8,506,000
|
|
4,117,000
|
|
|||||
|
Amortization of deferred financing costs
|
2,196,000
|
|
1,977,000
|
|
795,000
|
|
|||||
|
Loss (gain) on disposal of property, plant and equipment
|
79,000
|
|
(126,000
|
)
|
(21,000
|
)
|
|||||
|
Provision for allowance for doubtful accounts
|
573,000
|
|
497,000
|
|
907,000
|
|
|||||
|
Provision for excess and obsolete inventory
|
5,628,000
|
|
2,900,000
|
|
2,780,000
|
|
|||||
|
Deferred income tax (benefit) expense
|
(6,379,000
|
)
|
9,056,000
|
|
(3,241,000
|
)
|
|||||
|
Settlement of intellectual property litigation
|
—
|
|
(12,020,000
|
)
|
—
|
|
|||||
|
Change in fair value of contingent liability
|
—
|
|
—
|
|
(359,000
|
)
|
|||||
|
Excess income tax benefit from stock-based award exercises
|
—
|
|
(82,000
|
)
|
(28,000
|
)
|
|||||
|
Changes in assets and liabilities, net of effects of business acquisition:
|
|
|
|
|
|
|
|||||
|
Accounts receivable
|
(24,578,000
|
)
|
25,508,000
|
|
5,806,000
|
|
|||||
|
Inventories
|
(20,065,000
|
)
|
7,812,000
|
|
8,280,000
|
|
|||||
|
Prepaid expenses and other current assets
|
787,000
|
|
(956,000
|
)
|
2,112,000
|
|
|||||
|
Other assets
|
(140,000
|
)
|
666,000
|
|
(86,000
|
)
|
|||||
|
Accounts payable
|
13,728,000
|
|
(4,472,000
|
)
|
(1,255,000
|
)
|
|||||
|
Accrued expenses and other current liabilities
|
(3,374,000
|
)
|
(21,796,000
|
)
|
(13,360,000
|
)
|
|||||
|
Customer advances and deposits
|
9,143,000
|
|
(2,431,000
|
)
|
(6,397,000
|
)
|
|||||
|
Other liabilities, non-current
|
(682,000
|
)
|
(1,442,000
|
)
|
(882,000
|
)
|
|||||
|
Interest payable
|
234,000
|
|
(1,039,000
|
)
|
1,292,000
|
|
|||||
|
Income taxes payable
|
126,000
|
|
1,355,000
|
|
(892,000
|
)
|
|||||
|
Net cash provided by operating activities
|
50,344,000
|
|
66,917,000
|
|
15,075,000
|
|
|||||
|
Cash flows from investing activities:
|
|
|
|
|
|
|
|||||
|
Purchases of property, plant and equipment
|
(8,642,000
|
)
|
(8,150,000
|
)
|
(5,667,000
|
)
|
|||||
|
Payments for business acquisition, net of cash acquired
|
—
|
|
—
|
|
(280,535,000
|
)
|
|||||
|
Net cash used in investing activities
|
(8,642,000
|
)
|
(8,150,000
|
)
|
(286,202,000
|
)
|
|||||
|
Cash flows from financing activities:
|
|
|
|
|
|
|
|||||
|
Repayment of long-term debt under Term Loan Facility
|
(18,960,000
|
)
|
(33,567,000
|
)
|
(77,353,000
|
)
|
|||||
|
Cash dividends paid
|
(9,538,000
|
)
|
(18,872,000
|
)
|
(19,406,000
|
)
|
|||||
|
Net (payments) borrowings under Revolving Loan Facility
|
(8,800,000
|
)
|
(26,500,000
|
)
|
83,904,000
|
|
|||||
|
Repayment of principal amounts under capital lease and other obligations
|
(2,802,000
|
)
|
(3,592,000
|
)
|
(1,753,000
|
)
|
|||||
|
Remittance of employees' statutory tax withholdings for stock awards
|
(1,143,000
|
)
|
(262,000
|
)
|
(105,000
|
)
|
|||||
|
Proceeds from issuance of employee stock purchase plan shares
|
855,000
|
|
694,000
|
|
676,000
|
|
|||||
|
Proceeds from exercises of stock options
|
326,000
|
|
—
|
|
—
|
|
|||||
|
Payment of deferred financing costs
|
—
|
|
(1,085,000
|
)
|
(9,464,000
|
)
|
|||||
|
Payment of issuance costs related to equity offering
|
—
|
|
(626,000
|
)
|
(476,000
|
)
|
|||||
|
Excess income tax benefit from stock-based award exercises
|
—
|
|
82,000
|
|
28,000
|
|
|||||
|
Borrowings of long-term debt under Term Loan Facility
|
—
|
|
—
|
|
250,000,000
|
|
|||||
|
Proceeds received from equity offering
|
—
|
|
—
|
|
95,029,000
|
|
|||||
|
Required payments for debt assumed for business acquisition
|
—
|
|
—
|
|
(134,101,000
|
)
|
|||||
|
Net cash (used in) provided by financing activities
|
(40,062,000
|
)
|
(83,728,000
|
)
|
186,979,000
|
|
|||||
F- 7
|
COMTECH TELECOMMUNICATIONS CORP.
AND SUBSIDIARIES
Consolidated Statements of Cash Flows (continued)
Fiscal Years Ended July 31, 2018, 2017 and 2016
|
|||||||||||
|
|
2018
|
2017
|
2016
|
||||||||
|
(Continued)
|
|
||||||||||
|
Net increase (decrease) in cash and cash equivalents
|
$
|
1,640,000
|
|
(24,961,000
|
)
|
(84,148,000
|
)
|
||||
|
Cash and cash equivalents at beginning of year
|
41,844,000
|
|
66,805,000
|
|
150,953,000
|
|
|||||
|
Cash and cash equivalents at end of year
|
$
|
43,484,000
|
|
41,844,000
|
|
66,805,000
|
|
||||
|
Supplemental cash flow disclosure
|
|
|
|
||||||||
|
Cash paid (received) during the year for:
|
|
|
|
||||||||
|
Interest
|
$
|
7,291,000
|
|
10,424,000
|
|
5,307,000
|
|
||||
|
Income taxes, net
|
$
|
1,112,000
|
|
(758,000
|
)
|
3,678,000
|
|
||||
|
Non-cash investing and financing activities:
|
|
|
|
||||||||
|
Accrued remittance of employees' statutory tax withholdings for fully-vested share units
|
$
|
2,963,000
|
|
—
|
|
—
|
|
||||
|
Cash dividends declared but unpaid (including accrual of dividend equivalents)
|
$
|
2,656,000
|
|
2,616,000
|
|
7,462,000
|
|
||||
|
Capital lease and other obligations incurred (excluding the effect of business acquisition)
|
$
|
1,306,000
|
|
68,000
|
|
373,000
|
|
||||
|
Accrued fixed asset additions
|
$
|
719,000
|
|
1,221,000
|
|
346,000
|
|
||||
|
(Forfeiture) issuance of restricted stock
|
$
|
(1,000
|
)
|
14,000
|
|
—
|
|
||||
|
Accrued issuance costs related to equity offering
|
$
|
—
|
|
—
|
|
636,000
|
|
||||
|
Accrued deferred financing costs
|
$
|
—
|
|
—
|
|
155,000
|
|
||||
See accompanying notes to consolidated financial statements.
F- 8
COMTECH TELECOMMUNICATIONS CORP. AND SUBSIDIARIES
Notes to Consolidated Financial Statements
(1)
Summary of Significant Accounting and Reporting Policies
|
(a)
|
Principles of Consolidation
|
The accompanying consolidated financial statements include the accounts of Comtech Telecommunications Corp. and its subsidiaries ("Comtech," "we," "us," or "our"), all of which are wholly-owned. All significant intercompany balances and transactions have been eliminated in consolidation.
|
(b)
|
Nature of Business
|
We design, develop, produce and market innovative products, systems and services for advanced communications solutions. We conduct our business through
two
reportable operating segments: Commercial Solutions and Government Solutions.
Our business is highly competitive and characterized by rapid technological change. Our growth and financial position depends on our ability to keep pace with such changes and developments and to respond to the sophisticated requirements of an increasing variety of electronic equipment users, among other things. Many of our competitors are substantially larger, and have significantly greater financial, marketing and operating resources and broader product lines than us. A significant technological or sales breakthrough by others, including smaller competitors or new companies, could have a material adverse effect on our business. In addition, certain of our customers have technological capabilities in our product areas and could choose to replace our products with their own.
International sales expose us to certain risks, including barriers to trade, fluctuations in foreign currency exchange rates (which may make our products less price competitive), political and economic instability, availability of suitable export financing, export license requirements, tariff regulations, and other United States ("U.S.") and foreign regulations that may apply to the export of our products, as well as the generally greater difficulties of doing business abroad. We attempt to reduce the risk of doing business in foreign countries by seeking contracts denominated in U.S. dollars, advance or milestone payments, credit insurance and irrevocable letters of credit in our favor.
|
(c)
|
Revenue Recognition
|
Through July 31, 2018 (prior to our adoption of Financial Accounting Standards Board’s ("FASB") Accounting Standards Codification ("ASC") No. 2014-09 "
Revenue from Contracts with Customers (Topic 606)
"), revenue is generally recognized when the earnings process is complete, upon shipment or customer acceptance. Revenue from contracts relating to the design, development or manufacture of complex electronic equipment to a buyer’s specification or to provide services relating to the performance of such contracts is generally recognized in accordance with the FASB ASC 605-35 "
Revenue Recognition - Construction-Type and Production-Type Contracts
" ("FASB ASC 605-35"). We primarily apply the percentage-of-completion method and generally recognize revenue based on the relationship of total costs incurred to total projected costs, or, alternatively, based on output measures, such as units delivered or produced. Profits expected to be realized on such contracts are based on total estimated sales for the contract compared to total estimated costs, including warranty costs, at completion of the contract. These estimates are reviewed and revised periodically throughout the lives of the contracts, and adjustments to profits resulting from such revisions are made cumulative to the date of the change. Provision for anticipated losses on uncompleted contracts is made in the period in which such losses become evident. Long-term, U.S. government, cost-reimbursable type contracts are also specifically covered by FASB ASC 605-35.
We have historically demonstrated an ability to estimate contract revenues and expenses in applying the percentage-of-completion method of accounting. However, there exist inherent risks and uncertainties in estimating future revenues and expenses, particularly on larger or longer-term contracts. Changes to such estimates could have a material effect on our consolidated financial condition and results of operations.
F- 9
COMTECH TELECOMMUNICATIONS CORP. AND SUBSIDIARIES
Notes to Consolidated Financial Statements, Continued
Revenues recognized in excess of amounts billable under long-term contracts accounted for under the percentage-of-completion method are recorded as unbilled receivables in the accompanying consolidated balance sheets. Unbilled receivables are billable upon various events, including the attainment of performance milestones, delivery of hardware, submission of progress bills based on time and materials, finalization of indirect rates or completion of the contract. We do not recognize revenue, or record unbilled receivables, until we receive fully funded orders.
In fiscal
2018
,
75.2%
and
24.8%
of our consolidated U.S. government net sales were derived from firm fixed-price and cost-reimbursable type contracts, respectively. Under firm fixed-price contracts, we perform for an agreed-upon price and we can derive benefits from cost savings, but bear the risk of cost overruns. Our cost-reimbursable type contracts typically provide for reimbursement of allowable costs incurred plus a negotiated fee. Cost-plus-incentive-fee orders typically provide for sharing with the U.S. government savings accrued from orders performed for less than the target costs and costs incurred in excess of targets up to a negotiated ceiling price (which is higher than the target cost), and for the supplier to carry the entire burden of costs exceeding the negotiated ceiling price.
Most government contracts have termination for convenience clauses that provide the customer with the right to terminate the contract at any time. Historically, we have not experienced material contract terminations or write-offs of unbilled receivables. We address customer acceptance provisions in assessing our ability to perform our contractual obligations under long-term contracts. Historically, we have been able to perform on our long-term contracts.
Through July 31, 2018 (prior to our adoption of FASB ASU No. 2014-09 "
Revenue from Contracts with Customers (Topic 606)
"), revenues from contracts that contain multiple elements that are not accounted for under the percentage-of-completion method are accounted for in accordance with FASB ASC 605-25 "
Revenue Recognition - Multiple Element Arrangements
" as amended by FASB ASU No. 2009-13 "
Revenue Recognition (Topic 605): Multiple-Deliverable Revenue Arrangements - a Consensus of the FASB Emerging Issues Task Force
," which, among other things, requires revenue to be allocated to each element based on the relative selling price method.
Adoption of New Revenue Standard
Effective on August 1, 2018 (the start of our first quarter of fiscal 2019), we adopted FASB ASU No. 2014-09 "
Revenue from Contracts with Customers (Topic 606)
," which replaces numerous requirements in U.S. GAAP, including industry specific requirements, and provides a single revenue recognition model for contracts with customers. The core principle of the new standard is that a company should record revenue to depict the transfer of promised goods or services to customers in an amount that reflects the consideration to which the company expects to be entitled in exchange for those goods or services. In March 2016, April 2016, May 2016 and February 2017, FASB ASU Nos. 2016-08 "
Revenue from Contracts with Customers (Topic 606): Principal Versus Agent Considerations (Reporting Revenue Gross Versus Net)
," 2016-10 "
Revenue from Contracts with Customers (Topic 606): Identifying Performance Obligations and Licensing
," 2016-12 "
Revenue from Contracts with Customers (Topic 606): Narrow-Scope Improvements and Practical Expedients
" and 2017-05 "
Other Income - Gains and Losses from the Derecognition of Nonfinancial Assets (Subtopic 610-20): Clarifying the Scope of Asset Derecognition Guidance and Accounting for Partial Sales of Nonfinancial Assets
" were issued, respectively, to clarify certain implementation matters related to the new revenue standard. The effective dates for these ASUs coincide with our August 1, 2018 adoption. As provided by the ASU, we adopted the new revenue recognition model using the modified retrospective method and there was no material impact on our business, results of operations and financial condition. In fiscal 2019, we expect to recognize a significant portion of our contracts over time, as there is a continuous transfer of control to the customer over the contractual period of performance. The remainder of our contracts will be recognized at a point in time. Both of these methods are similar to what we did prior to August 1, 2018.
|
(d)
|
Cash and Cash Equivalents
|
Our cash equivalents are short-term, highly liquid investments that are both readily convertible to known amounts of cash and have insignificant risk of change in value as a result of changes in interest rates. Our cash and cash equivalents, as of
July 31, 2018
and
2017
, amounted to
$43,484,000
and
$41,844,000
, respectively, and primarily consist of bank deposits and money market deposit accounts insured by the Federal Deposit Insurance Corporation. Cash equivalents are carried at cost, which approximates fair value.
|
(e)
|
Inventories
|
Our inventories are stated at the lower of cost and net realizable value, the latter of which is defined as the estimated selling price in the ordinary course of business, less reasonably predictable costs of completion, disposal and transportation. Our inventories are reduced to their estimated net realizable value by a charge to cost of sales in the period such excess costs are determined. Our inventories are principally recorded using either average or standard costing methods.
F- 10
COMTECH TELECOMMUNICATIONS CORP. AND SUBSIDIARIES
Notes to Consolidated Financial Statements, Continued
Work-in-process (including our contracts-in-progress) and finished goods inventory reflect all accumulated production costs, which are comprised of direct production costs and overhead, and is reduced by amounts recorded in cost of sales as the related revenue is recognized. Indirect costs relating to long-term contracts, which include expenses such as general and administrative, are charged to expense as incurred and are not included in our cost of sales or work-in-process (including our contracts-in-progress) and finished goods inventory.
|
(f)
|
Long-Lived Assets
|
Our machinery and equipment, which are recorded at cost, are depreciated or amortized over their estimated useful lives (
three
to
eight
years) under the straight-line method. Capitalized values of properties and leasehold improvements under leases are amortized over the life of the lease or the estimated life of the asset, whichever is less.
Goodwill represents the excess cost of a business acquisition over the fair value of the net assets acquired. In accordance with FASB ASC 350 "
Intangibles - Goodwill and Other
" goodwill is not amortized. We periodically, at least on an annual basis in the first quarter of each fiscal year, review goodwill, considering factors such as projected cash flows and revenue and earnings multiples, to determine whether the carrying value of the goodwill is impaired. If we fail the quantitative assessment of goodwill impairment ("quantitative assessment"), pursuant to our adoption of FASB ASU No. 2017-04 in fiscal 2017, we would be required to recognize an impairment loss equal to the amount that a reporting unit's carrying value exceeded its fair value; however, any loss recognized should not exceed the total amount of goodwill allocated to that reporting unit. We define our reporting units to be the same as our operating segments.
We performed our annual goodwill impairment assessment for fiscal
2019
on August 1,
2018
(the first day of our fiscal
2019
). See
Note (15) -
"
Goodwill
" for more information. Unless there are future indicators that the fair value of a reporting unit is more likely than not less than its carrying value, such as a significant adverse change in our future financial performance, our next impairment assessment for goodwill will be performed and completed in the first quarter of fiscal
2020
. Any impairment charges that we may record in the future could be material to our results of operations and financial condition.
We assess the recoverability of the carrying value of our other long-lived assets, including identifiable intangible assets with finite useful lives, whenever events or changes in circumstances indicate that the carrying amount of the assets may not be recoverable. We evaluate the recoverability of such assets based upon the expectations of undiscounted cash flows from such assets. If the sum of the expected future undiscounted cash flows were less than the carrying amount of the asset, a loss would be recognized for the difference between the fair value and the carrying amount.
|
(g)
|
Research and Development Costs
|
We charge research and development costs to operations as incurred, except in those cases in which such costs are reimbursable under customer funded contracts. In fiscal
2018
,
2017
and
2016
, we were reimbursed by customers for such activities in the amount of
$16,924,000
,
$27,050,000
and
$17,432,000
, respectively. These amounts are not reflected in the reported research and development expenses in each of the respective periods, but are included in net sales with the related costs included in cost of sales in each of the respective periods.
|
(h)
|
Income Taxes
|
Income taxes are accounted for under the asset and liability method. Deferred tax assets and liabilities are recognized for the future tax consequences attributable to differences between the financial statement carrying amounts of existing assets and liabilities and their respective tax bases and operating loss and tax credit carryforwards. Deferred tax assets and liabilities are measured using the enacted tax rates expected to apply to taxable income in the years in which those temporary differences are expected to be recovered or settled. The effect on deferred tax assets and liabilities of a change in tax rates is recognized in income in the period that includes the enactment date.
F- 11
COMTECH TELECOMMUNICATIONS CORP. AND SUBSIDIARIES
Notes to Consolidated Financial Statements, Continued
We determine the uncertain tax positions taken or expected to be taken in income tax returns in accordance with the provisions of FASB ASC 740-10-25 "
Income Taxes
" which prescribes a two-step evaluation process for tax positions. The first step is recognition based on a determination of whether it is more-likely-than-not that a tax position will be sustained upon examination, including resolution of any related appeals or litigation processes, based on the technical merits of the position. The second step is to measure a tax position that meets the more-likely-than-not threshold. The tax position is measured as the largest amount of benefit that is greater than
50%
likely of being realized upon ultimate settlement. If a tax position does not meet the more-likely-than-not recognition threshold, the benefit of that position is not recognized in the financial statements. Our policy is to recognize interest and penalties related to uncertain tax positions in income tax expense.
|
(i)
|
Earnings Per Share
|
Our basic earnings per share ("EPS") is computed based on the weighted average number of common shares (including vested but unissued stock units, share units, performance shares and restricted stock units ("RSUs")), outstanding during each respective period. Our diluted EPS reflects the dilution from potential common stock issuable pursuant to the exercise of equity-classified stock-based awards, if dilutive, outstanding during each respective period. Pursuant to FASB ASC 260 "
Earnings Per Share,
" equity-classified stock-based awards that are subject to performance conditions are not considered in our diluted EPS calculations until the respective performance conditions have been satisfied. When calculating our diluted earnings per share, we consider the amount an employee must pay upon assumed exercise of stock-based awards and the amount of stock-based compensation cost attributed to future services and not yet recognized. On August 1, 2017, we adopted ASU No. 2016-09, which amends several aspects of the accounting for and reporting of share-based payment transactions. As a result of our adoption of ASU No. 2016-09, the amount of excess tax benefits assuming exercise of in-the-money stock-based awards is no longer included in the calculation of diluted earnings per share on a prospective basis and the denominator for our diluted calculation could increase in the future as compared to prior calculations. See
Note (11)
- "
Stock-Based Compensation
" for more information on the impact of adopting ASU No. 2016-09.
Our basic and diluted EPS calculations for fiscal 2018, 2017 and 2016 include the impact of common shares issued from a public offering in June 2016. There were
no
purchases of our common stock during the fiscal years ended July 31,
2018
,
2017
and
2016
. See
Note (17) -
"
Stockholders’ Equity
" for more information.
Weighted average stock options, RSUs and restricted stock outstanding of
1,739,000
,
1,986,000
and
2,350,000
shares for fiscal
2018
,
2017
and
2016
, respectively, were not included in our diluted EPS calculation because their effect would have been anti-dilutive.
Our EPS calculations exclude
258,000
,
228,000
and
147,000
weighted average performance shares outstanding for fiscal
2018
,
2017
and
2016
, respectively, as the performance conditions have not yet been satisfied. However, the compensation expense related to these awards is included in net income (loss) (the numerator) for EPS calculations for each respective period.
The following table reconciles the numerators and denominators used in the basic and diluted EPS calculations:
|
|
Fiscal Years Ended July 31,
|
|||||||||
|
2018
|
2017
|
2016
|
||||||||
|
Numerator:
|
|
|
|
|||||||
|
Net income (loss) for basic calculation
|
$
|
29,769,000
|
|
15,827,000
|
|
(7,738,000
|
)
|
|||
|
Numerator for diluted calculation
|
$
|
29,769,000
|
|
15,827,000
|
|
(7,738,000
|
)
|
|||
|
Denominator:
|
|
|
|
|
|
|
||||
|
Denominator for basic calculation
|
23,825,000
|
|
23,433,000
|
|
16,972,000
|
|
||||
|
Effect of dilutive securities:
|
|
|
|
|
|
|
||||
|
Stock-based awards
|
215,000
|
|
56,000
|
|
—
|
|
||||
|
Denominator for diluted calculation
|
24,040,000
|
|
23,489,000
|
|
16,972,000
|
|
||||
F- 12
COMTECH TELECOMMUNICATIONS CORP. AND SUBSIDIARIES
Notes to Consolidated Financial Statements, Continued
|
(j)
|
Fair Value Measurements and Financial Instruments
|
Using the fair value hierarchy described in FASB ASC 820 "
Fair Value Measurements and Disclosures,"
we valued our cash and cash equivalents using Level 1 inputs that were based on quoted market prices.
We believe that the carrying amounts of our other current financial assets (such as accounts receivable) and other current liabilities (including accounts payable, accrued expenses and the current portions of our Secured Credit Facility and favorable AT&T warranty settlement) approximate their fair values due to their short-term maturities.
The fair value of the non-current portion of our Secured Credit Facility as of
July 31, 2018
approximates its carrying amount due to its variable interest rate and pricing grid that is dependent upon our leverage ratio as of the end of each fiscal quarter. We believe the fair value of our non-current portion of capital lease and other obligations, which currently has a blended interest rate of
6.10%
, would not be materially different than its carrying value as of
July 31, 2018
.
The fair value of the non-current portion of our favorable AT&T warranty settlement would not be materially different than its carrying value as of
July 31, 2018
, given our belief that the present value of such liability reflects market participants' assumptions for a similar junior, unsecured debt instrument. See
Note (6) - "Accrued Expenses and Other Current Liabilities"
for further discussion of the favorable AT&T warranty settlement.
As of
July 31, 2018
and
2017
, other than the financial instruments discussed above, we had no other significant assets or liabilities included in our Consolidated Balance Sheets recorded at fair value, as such term is defined by FASB ASC 820.
|
(k)
|
Use of Estimates
|
The preparation of consolidated financial statements in conformity with accounting principles generally accepted in the United States of America requires management to make estimates and assumptions that affect the reported amount of assets and liabilities, and disclosure of contingent assets and liabilities, at the date of the consolidated financial statements and the reported amounts of net sales and expenses during the reported period. We make significant estimates in many areas of our accounting, including but not limited to the following: long-term contracts, stock-based compensation,
intangible assets including goodwill, provision for excess and obsolete inventory, allowance for doubtful accounts, warranty obligations and income taxes. Actual results may differ from those estimates.
|
(l)
|
Comprehensive Income
|
In accordance with FASB ASC 220 "
Comprehensive Income
," we report all changes in equity during a period, except those resulting from investment by owners and distribution to owners, for the period in which they are recognized. Comprehensive income is the total of net income and all other non-owner changes in equity (or other comprehensive income) such as unrealized gains/losses on securities classified as available-for-sale, foreign currency translation adjustments and minimum pension liability adjustments. Comprehensive income (loss) was the same as our net income (loss) in fiscal
2018
,
2017
and
2016
.
|
(m)
|
Reclassifications
|
Certain reclassifications have been made to previously reported consolidated financial statements to conform to the fiscal
2018
presentation.
F- 13
COMTECH TELECOMMUNICATIONS CORP. AND SUBSIDIARIES
Notes to Consolidated Financial Statements, Continued
|
(n)
|
Adoption of Accounting Standards and Updates
|
We are required to prepare our consolidated financial statements in accordance with the FASB ASC which is the source for all authoritative U.S. generally accepted accounting principles, which are commonly referred to as "GAAP." The FASB ASC is subject to updates by the FASB, which are known as Accounting Standard Updates ("ASUs"). During fiscal
2018
, we adopted:
|
•
|
FASB ASU No. 2016-09, which amends several aspects of the accounting for and reporting of share-based payment transactions. Our adoption of this ASU, on August 1, 2017, did not have a material impact on our consolidated financial statements. See
Note (11) - "Stock-Based Compensation"
for further information regarding our adoption of this ASU.
|
|
•
|
FASB ASU No. 2016-15, which amends the guidance on the following cash flow related issues: debt prepayment or debt extinguishment costs; settlement of zero-coupon and similar type debt instruments; contingent consideration payments made after a business combination; proceeds from the settlement of insurance claims (including those related to certain life insurance policies); distributions received from equity method investees; beneficial interests in securitization transactions; and cash receipts or payments with more than one class of cash flows. Our adoption of this ASU on February 1, 2018 did not have any impact on our consolidated financial statements.
|
|
•
|
FASB ASU No. 2017-09, which provides guidance about which changes to the terms or conditions of a share-based payment award require an entity to apply modification accounting in ASC Topic 718. An entity would not be required to account for changes to the terms or conditions of a share-based payment award as a modification if there were no changes to the award’s fair value, vesting conditions and classification. Our adoption of this ASU on February 1, 2018 did not have any impact on our consolidated financial statements.
|
|
•
|
FASB ASU Nos. 2016-01 and 2018-03, which address certain aspects of recognition, measurement, presentation and disclosure of financial instruments, such as: amending the initial and subsequent measurement requirements for certain equity investments; eliminating the disclosure requirements related to the methods and significant assumptions used to estimate the fair value of financial instruments measured at amortized cost on the balance sheet; requiring the use of the exit price notion when measuring the fair value of financial instruments for disclosure purposes; and requiring separate presentation of financial assets and financial liabilities by measurement category and form of financial asset or liability on the balance sheet or the accompanying notes to the financial statements. Adoption of these ASUs did not have a material impact on our consolidated financial statements and disclosures.
|
(2)
Acquisition
On
February 23, 2016
, we completed the acquisition of TeleCommunication Systems, Inc. ("TCS"), pursuant to the Agreement and Plan of Merger, dated as of
November 22, 2015
(the "Merger Agreement"), among Comtech, TCS and Typhoon Acquisition Corp., a Maryland corporation and a direct, wholly owned subsidiary of Comtech ("Merger Sub"). TCS is now a wholly-owned subsidiary of Comtech.
The acquisition has an aggregate purchase price for accounting purposes of
$340,432,000
(also referred to as the transaction equity value) and an enterprise value of
$423,629,000
. The fair value of consideration transferred in connection with the TCS acquisition was
$280,535,000
in cash, which is net of
$59,897,000
of cash acquired. We funded the acquisition (including transaction and merger related expenditures) and repaid
$134,101,000
of debt assumed in connection with the acquisition by redeploying a significant amount of our combined cash and cash equivalents, with the remaining funds coming from a
$400,000,000
Secured Credit Facility (the "Secured Credit Facility"), which is discussed further in
Note (8) -
"
Secured Credit Facility.
"
The purchase price includes the final estimated fair value of contingent liabilities associated with TCS' intellectual property matters and the warranty obligations for TCS' 911 call handling software, which are discussed in more detail in
Note (6)
"
Accrued Expenses and Other Current Liabilities
" and
Note (14)(b)
"
Commitments and Contingencies - Legal Proceedings and Other Matters
."
These estimated fair values reflect market participant assumptions, as required by FASB ASC 805 "
Business Combinations
" and do not reflect our settlement position or amounts we actually have paid or may pay in the future.
F- 14
COMTECH TELECOMMUNICATIONS CORP. AND SUBSIDIARIES
Notes to Consolidated Financial Statements, Continued
We have incurred transaction and merger related expenditures which include significant amounts primarily for: (i) change-in-control payments, (ii) severance, (iii) costs associated with establishing our Secured Credit Facility, and (iv) professional fees for financial and legal advisors for both Comtech and TCS. For the fiscal year ended
July 31, 2016
, acquisition plan expenses were
$21,276,000
and primarily related to the TCS acquisition. There were
no
such transaction and merger related expenses during fiscal 2018 or
2017
. As discussed in prior SEC filings, we had embarked on a focused acquisition plan which culminated with the closing of the acquisition of TCS on February 23, 2016.
The unaudited pro forma financial information in the table below for the fiscal year ended
July 31, 2016
is presented as if Comtech's acquisition of TCS had occurred on August 1, 2014, and combines Comtech’s historical statement of operations for the fiscal year ended
July 31, 2016
(which includes TCS' results of operations since the acquisition date of February 23, 2016) with TCS' historical statement of operations for the trailing five months ended December 31, 2015 and TCS' historical statement of operations for the stub period beginning January 1, 2016 and ended February 23, 2016. TCS' historical statement of operations for the trailing five months ended December 31, 2015 was derived by taking TCS' historical results of operations for the calendar year ended December 31, 2015 and deducting TCS' historical results of operations for the seven months ended July 31, 2015.
|
(Unaudited)
|
|||
|
For the Fiscal Year Ended
|
|||
|
July 31, 2016
|
|
||
|
Net sales
|
$
|
611,241,000
|
|
|
Net loss
|
(30,750,000
|
)
|
|
|
Basic net loss per share
|
(1.81
|
)
|
|
|
Diluted net loss per share
|
(1.81
|
)
|
|
The pro forma financial information is not indicative of the results of operations that would have been achieved if the acquisition and cash paid had taken place as of August 1, 2014. The pro forma financial information includes adjustments for:
|
•
|
The elimination of historical sales between Comtech and TCS of
$8,601,000
.
|
|
•
|
The reduction to capitalized software amortization of
$2,566,000
, related to the difference between the historical value and the estimated fair value of TCS' capitalized software.
|
|
•
|
The elimination of acquisition plan expenses of
$36,212,000
, due to the assumption that all of the acquisition plan expenses were incurred on August 1, 2014.
|
|
•
|
The incremental amortization expense of
$7,113,000
, associated with the increase in acquired other intangible assets.
|
|
•
|
The increase in interest expense of
$2,339,000
, due to the assumed August 1, 2014 repayment of TCS' legacy debt and related new borrowings under our Secured Credit Facility which was utilized to partially fund the TCS acquisition.
|
|
•
|
The reduction to interest income of
$577,000
, due to the assumed cash payments relating to the TCS acquisition.
|
|
•
|
The related adjustment to the provision for income taxes, based on Comtech’s effective tax rate for the period.
|
F- 15
COMTECH TELECOMMUNICATIONS CORP. AND SUBSIDIARIES
Notes to Consolidated Financial Statements, Continued
(3)
Accounts Receivable
Accounts receivable consist of the following at
July 31, 2018
and
2017
:
|
|
2018
|
2017
|
|||||
|
Billed receivables from commercial and international customers
|
$
|
83,411,000
|
|
71,404,000
|
|
||
|
Unbilled receivables from commercial and international customers
|
19,731,000
|
|
24,668,000
|
|
|||
|
Billed receivables from the U.S. government and its agencies
|
26,251,000
|
|
18,497,000
|
|
|||
|
Unbilled receivables from the U.S government and its agencies
|
19,807,000
|
|
11,693,000
|
|
|||
|
Total accounts receivable
|
149,200,000
|
|
126,262,000
|
|
|||
|
Less allowance for doubtful accounts
|
1,761,000
|
|
1,300,000
|
|
|||
|
Accounts receivable, net
|
$
|
147,439,000
|
|
124,962,000
|
|
||
Unbilled receivables relate to contracts-in-progress for which revenue has been recognized but we have not yet billed the customer for work performed. We had
$134,000
and
$118,000
of retainage included in unbilled receivables at
July 31, 2018
and
2017
, respectively, and management estimates that substantially all of the unbilled receivables at
July 31, 2018
will be billed and collected within one year. Of the unbilled receivables from commercial and international customers at
July 31, 2018
and
2017
, approximately
$1,558,000
and
$2,995,000
, respectively, relates to a large over-the-horizon microwave system contract with our large U.S. prime contractor customer (all of which related to our North African country end-customer).
As of
July 31, 2018
, the U.S. government (and its agencies) and Verizon Communications Inc. (through various divisions and, collectively, "Verizon") represented
30.9%
and
10.1%
, respectively, of total accounts receivable. As of
July 31, 2017
, except for the U.S. government (and its agencies), which represented
23.9%
of total accounts receivable, there were
no
other customers which accounted for greater than
10.0%
of total accounts receivable.
(4)
Inventories
Inventories consist of the following at
July 31, 2018
and
2017
:
|
|
2018
|
2017
|
|||||
|
Raw materials and components
|
$
|
53,649,000
|
|
50,569,000
|
|
||
|
Work-in-process and finished goods
|
38,854,000
|
|
26,053,000
|
|
|||
|
Total inventories
|
92,503,000
|
|
76,622,000
|
|
|||
|
Less reserve for excess and obsolete inventories
|
17,427,000
|
|
16,019,000
|
|
|||
|
Inventories, net
|
$
|
75,076,000
|
|
60,603,000
|
|
||
At
July 31, 2018
and
2017
, the amount of inventory directly related to long-term contracts (including contracts-in-progress) was
$1,249,000
and
$2,148,000
, respectively.
At
July 31, 2018
and
2017
,
$1,310,000
and
$1,718,000
, respectively, of the inventory balance above related to contracts from third party commercial customers who outsource their manufacturing to us.
F- 16
COMTECH TELECOMMUNICATIONS CORP. AND SUBSIDIARIES
Notes to Consolidated Financial Statements, Continued
(5)
Property, Plant and Equipment
Property, plant and equipment consist of the following at
July 31, 2018
and
2017
:
|
|
2018
|
2017
|
|||||
|
Machinery and equipment
|
$
|
154,556,000
|
|
146,459,000
|
|
||
|
Leasehold improvements
|
13,807,000
|
|
13,624,000
|
|
|||
|
|
168,363,000
|
|
160,083,000
|
|
|||
|
Less accumulated depreciation and amortization
|
139,376,000
|
|
127,236,000
|
|
|||
|
Property, plant and equipment, net
|
$
|
28,987,000
|
|
32,847,000
|
|
||
Depreciation and amortization expense on property, plant and equipment amounted to
$13,655,000
,
$14,354,000
and
$9,830,000
for the fiscal years ended
July 31, 2018
,
2017
and
2016
, respectively.
(6)
Accrued Expenses and Other Current Liabilities
Accrued expenses and other current liabilities consist of the following at
July 31, 2018
and
2017
:
|
|
2018
|
2017
|
|||||
|
Accrued wages and benefits
|
$
|
23,936,000
|
|
19,622,000
|
|
||
|
Accrued legal costs
|
6,179,000
|
|
8,402,000
|
|
|||
|
Accrued warranty obligations
|
11,738,000
|
|
17,617,000
|
|
|||
|
Accrued contract costs
|
10,016,000
|
|
8,644,000
|
|
|||
|
Accrued commissions and royalties
|
4,654,000
|
|
3,600,000
|
|
|||
|
Other
|
8,511,000
|
|
10,725,000
|
|
|||
|
Accrued expenses and other current liabilities
|
$
|
65,034,000
|
|
68,610,000
|
|
||
Accrued wages and benefits as of
July 31, 2018
include
$2,963,000
of accrued remittance of employees' statutory tax withholdings related to the net settlement of fully-vested share units, as discussed in more detail in
Note (11)
- "
Stock-Based Compensation.
" There was
no
comparable amount as of July 31, 2017.
Accrued legal costs as of
July 31, 2018
and
2017
include
$3,372,000
and
$4,120,000
, respectively, related to estimated costs associated with certain TCS intellectual property matters. The accrued potential settlement costs do not reflect the final amounts we may actually pay. Ongoing legal costs associated with defending legacy TCS intellectual property matters and the ultimate resolution could vary and have a material adverse effect on our future consolidated results of operations, financial position or cash flows. TCS intellectual property matters are discussed in more detail in
Note (14)(b) -
"
Commitments and Contingencies - Legal Proceedings and Other Matters
."
Accrued contract costs represent direct and indirect costs on contracts as well as estimates of amounts owed for invoices not yet received from vendors or reflected in accounts payable.
Accrued warranty obligations relate to estimated liabilities for warranty coverage that we provide to our customers. We generally provide warranty coverage for some of our products for a period of at least
one year
from the date of delivery. We record a liability for estimated warranty expense based on historical claims, product failure rates, a consideration of contractual obligations, future costs to resolve software issues and other factors. Some of our product warranties are provided under long-term contracts, the costs of which are incorporated into our estimates of total contract costs.
F- 17
COMTECH TELECOMMUNICATIONS CORP. AND SUBSIDIARIES
Notes to Consolidated Financial Statements, Continued
Changes in our accrued warranty obligations during the fiscal years ended
July 31, 2018
and
2017
were as follows:
|
|
2018
|
2017
|
|||||
|
Balance at beginning of year
|
$
|
17,617,000
|
|
15,362,000
|
|
||
|
Provision for warranty obligations
|
5,055,000
|
|
5,394,000
|
|
|||
|
Adjustment to TCS pre-acquisition contingent liability
|
—
|
|
4,200,000
|
|
|||
|
Charges incurred
|
(8,244,000
|
)
|
(7,339,000
|
)
|
|||
|
Warranty settlement and reclass (see below)
|
(2,690,000
|
)
|
—
|
|
|||
|
Balance at end of year
|
$
|
11,738,000
|
|
17,617,000
|
|
||
Our current accrued warranty obligations at
July 31, 2018
and
2017
include
$4,650,000
and
$9,909,000
, respectively, of warranty obligations for a small product line that we refer to as the TCS 911 call handling software solution. This solution was licensed to customers prior to our acquisition of TCS. During the fiscal year ended
July 31, 2018
, we entered into a full and final warranty settlement with AT&T, the largest customer/distributor of this product line, pursuant to which we issued
thirty-six
credits to AT&T of
$153,000
which AT&T can apply on a monthly basis to purchases of solutions from us, beginning October 2017 through September 2020. As of
July 31, 2018
, the total present value of these monthly credits is
$3,616,000
, of which
$1,586,000
is included in our current accrued warranty obligations and
$2,030,000
is reflected in other liabilities (non-current) on our Consolidated Balance Sheet. In connection with this favorable settlement, during the fiscal year ended
July 31, 2018
, we recorded a benefit to cost of sales of
$660,000
.
(7)
Radyne Acquisition-Related Restructuring Plan
In connection with our
August 1, 2008
acquisition of Radyne, we adopted a restructuring plan for which we recorded
$2,713,000
of estimated restructuring costs. Of this amount,
$613,000
related to severance for Radyne employees which was paid in fiscal 2009. The remaining estimated amounts relate to facility exit costs and were determined as follows:
|
At August 1, 2008
|
|||
|
Total non-cancelable lease obligations
|
$
|
12,741,000
|
|
|
Less: Estimated sublease income
|
8,600,000
|
|
|
|
Total net estimated facility exit costs
|
4,141,000
|
|
|
|
Less: Interest expense to be accreted
|
2,041,000
|
|
|
|
Present value of estimated facility exit costs
|
$
|
2,100,000
|
|
Our total non-cancelable lease obligations were based on the actual lease term which runs from
November 1, 2008
through
October 31, 2018
. We estimated sublease income based on the terms of a fully executed sublease agreement that expired on
October 31, 2015
. In accordance with grandfathered accounting standards that were not incorporated into the FASB’s ASC, we recorded these costs, at fair value, as assumed liabilities as of
August 1, 2008
, with a corresponding increase to goodwill.
As of
July 31, 2018
, the amount of the acquisition-related restructuring reserve is as follows:
|
|
Cumulative Activity Through
July 31, 2018 |
||
|
Present value of estimated facility exit costs at August 1, 2008
|
$
|
2,100,000
|
|
|
Cash payments made
|
(12,211,000
|
)
|
|
|
Cash payments received
|
8,600,000
|
|
|
|
Accreted interest recorded
|
1,917,000
|
|
|
|
Liability recorded as of period end as accrued expenses and other current liabilities in the Consolidated Balance Sheet
|
$
|
406,000
|
|
F- 18
COMTECH TELECOMMUNICATIONS CORP. AND SUBSIDIARIES
Notes to Consolidated Financial Statements, Continued
As of
July 31, 2017
, the present value of the estimated facility exit costs was
$1,941,000
. During the fiscal year ended
July 31, 2018
, we made cash payments of
$1,623,000
. Interest accreted for the fiscal years ended
July 31, 2018
,
2017
and
2016
was
$88,000
,
$189,000
and
$278,000
, respectively, and is included in interest expense for each respective fiscal period.
TCS
In connection with our February 23, 2016 acquisition of TCS, we continue to implement a tactical shift in strategy in our Government Solutions segment and have initiated certain cost reduction actions. To-date, we have incurred an immaterial amount of severance and retention costs related to our shift in strategy.
(8)
Secured Credit Facility
On
February 23, 2016
, in connection with our acquisition of TCS, we entered into a
$400,000,000
secured credit facility (the "Secured Credit Facility") with a syndicate of lenders. The Secured Credit Facility, as amended June 6, 2017 (the "June 2017 Amendment"), comprises a senior secured term loan A facility of
$250,000,000
(the "Term Loan Facility") and a secured revolving loan facility of up to
$150,000,000
, including a
$25,000,000
letter of credit sublimit (the "Revolving Loan Facility") and, together, with the Term Loan Facility, matures on
February 23, 2021
. The proceeds of these borrowings were primarily used to finance our acquisition of TCS, including the repayment of certain existing indebtedness of TCS. The Term Loan Facility requires quarterly repayments. During the fiscal years ended
July 31, 2018
and
2017
, we repaid
$18,960,000
and
$33,567,000
, respectively, principal amount of borrowings under the Term Loan Facility. The repayments in the fiscal year ended July 31, 2017 include a payment of
$22,500,000
made in connection with the June 2017 amendment to reduce the balloon or final payment of the Term Loan Facility, which is discussed further below. Under the Revolving Loan Facility, we had outstanding balances ranging from
$34,904,000
to
$66,804,000
during the fiscal year ended
July 31, 2018
.
As of
July 31, 2018
and
2017
, net amounts outstanding under our Secured Credit Facility were as follows:
|
2018
|
2017
|
|||||
|
Term Loan Facility
|
$
|
120,121,000
|
|
139,080,000
|
|
|
|
Less unamortized deferred financing costs related to Term Loan Facility
|
3,427,000
|
|
4,763,000
|
|
||
|
Term Loan Facility, net
|
116,694,000
|
|
134,317,000
|
|
||
|
Revolving Loan Facility
|
48,604,000
|
|
57,405,000
|
|
||
|
Amount outstanding under Secured Credit Facility, net
|
165,298,000
|
|
191,722,000
|
|
||
|
Less current portion of long-term debt
|
17,211,000
|
|
15,494,000
|
|
||
|
Non-current portion of long-term debt
|
$
|
148,087,000
|
|
176,228,000
|
|
|
Interest expense, including amortization of deferred financing costs, recorded during the fiscal years ended
July 31, 2018
,
2017
and
2016
related to the Secured Credit Facility was
$9,614,000
,
$11,106,000
and
$6,933,000
, respectively, and reflects a blended interest rate of approximately
5.40%
,
4.90%
and
5.00%
in fiscal 2018, 2017 and 2016, respectively.
At
July 31, 2018
, we had
$3,166,000
of standby letters of credit outstanding under our Secured Credit Facility, as amended, related to our guarantees of future performance on certain customer contracts and
no
outstanding commercial letters of credit.
F- 19
COMTECH TELECOMMUNICATIONS CORP. AND SUBSIDIARIES
Notes to Consolidated Financial Statements, Continued
The Revolving Loan Facility is primarily used for working capital and other general corporate purposes of the Company and its subsidiaries, including the issuance of letters of credit. Borrowings under the Secured Credit Facility, pursuant to terms defined in the Secured Credit Facility, shall be either (i) Alternate Base Rate ("ABR") borrowings, which bear interest from the applicable borrowing date at a rate per annum equal to (x) the greatest of (a) the Prime Rate in effect on such day, (b) the Federal Funds Effective Rate in effect on such day plus
0.50%
per annum and (c) the Adjusted LIBO Rate on such day (or, if such day is not a business day, the immediately preceding business day) plus
1.00%
per annum (provided that if the LIBO Rate is less than
1.00%
, then the LIBO Rate shall be deemed to be
1.00%
), plus (y) the Applicable Rate, or (ii) Eurodollar borrowings, which bear interest from the applicable borrowing date at a rate per annum equal to (x) the Adjusted LIBO Rate for such interest period (provided that if the LIBO Rate is less than
1.00%
, then the LIBO Rate shall be deemed to be
1.00%
) plus (y) the Applicable Rate. The Applicable Rate is determined based on a pricing grid that is dependent upon our leverage ratio as of the end of each fiscal quarter. The Secured Credit Facility contains customary representations, warranties and affirmative covenants and customary negative covenants, subject to negotiated exceptions, on (i) liens, (ii) investments, (iii) indebtedness, (iv) significant corporate changes, including mergers and acquisitions, (v) dispositions, (vi) restricted payments, including stockholder dividends, and (vii) certain other restrictive agreements. The Secured Credit Facility also contains certain financial covenants and customary events of default (subject to grace periods, as appropriate), such as payment defaults, cross-defaults to other material indebtedness, bankruptcy and insolvency, the occurrence of a defined change in control and the failure to observe the negative covenants and other covenants related to the operation of our business.
We believe the June 2017 Amendment provides increased operating and acquisition flexibility and simplifies the calculations of our financial covenants. In particular, the June 2017 Amendment provides, among other things, that the:
|
(i)
|
Consolidated EBITDA definition more closely aligns with our Adjusted EBITDA metric by eliminating favorable adjustments to operating income related to settlements of TCS intellectual property matters;
|
|
(ii)
|
Leverage Ratio is calculated on a "gross" basis using the quotient of Total Indebtedness (excluding unamortized deferred financing costs) divided by our trailing twelve month ("TTM") Consolidated EBITDA. The prior Leverage Ratio was calculated on a "net" basis but did not include a reduction for any cash or cash equivalents above
$50,000,000
;
|
|
(iii)
|
Fixed Charge Coverage Ratio includes a deduction for all cash dividends, regardless of the amount of our cash and cash equivalents and the related allowable Quarterly Dividend Amount, as defined, now aligns with our current quarterly dividend target of
$0.10
per common share;
|
|
(iv)
|
Balloon or final payment of the Term Loan Facility, (which is not due until February 23, 2021), was reduced by
$22,500,000
through increased borrowings from the Revolving Loan Facility, (which does not expire until February 23, 2021); and
|
|
(v)
|
Leverage Ratios will be adjusted, in certain conditions, to provide for additional flexibility for us to make acquisitions.
|
In connection with the June 2017 Amendment, there were no changes to: (i) the committed borrowing capacity; (ii) the maturity date; or (iii) interest rates payable (except that the interest rate pricing grid is now based on the new Leverage Ratio). Also, the June 2017 Amendment did not result in an extinguishment for accounting purposes (as such term is defined in ASC 470 "
Debt"
); instead, the June 2017 Amendment was accounted for as a debt modification. As a result, deferred financing costs (including incremental fees for the June 2017 Amendment) will continue to be amortized over the remaining maturity term of the Secured Credit Facility.
As of
July 31, 2018
, our Leverage Ratio was
2.19
x TTM Consolidated EBITDA compared to the maximum allowable Leverage Ratio of
3.00
x TTM Consolidated EBITDA. Our Fixed Charge Coverage Ratio as of
July 31, 2018
was
2.33
x compared to the minimum required Fixed Charge Coverage Ratio of
1.25
x. Given our expected future business performance, we anticipate maintaining compliance with the terms and financial covenants in our Secured Credit Facility, as amended, for the foreseeable future.
F- 20
COMTECH TELECOMMUNICATIONS CORP. AND SUBSIDIARIES
Notes to Consolidated Financial Statements, Continued
The obligations under the Secured Credit Facility, as amended, are guaranteed by certain of our domestic subsidiaries (the "Subsidiary Guarantors"). As collateral security for amounts outstanding under our Secured Credit Facility, as amended, and the guarantees thereof, we and our Subsidiary Guarantors have granted to an administrative agent, for the benefit of the lenders, a lien on, and first priority security interest in, substantially all of our tangible and intangible assets.
Capitalized terms used but not defined herein have the meanings set forth for such terms in the Secured Credit Facility, dated as of
February 23, 2016
, and the First Amendment of the Secured Credit Facility, dated as of June 6, 2017, both of which have been documented and filed with the SEC.
(9)
Capital Lease and Other Obligations
We lease certain equipment under capital leases. As of
July 31, 2018
and
2017
, the net book value of the leased assets which collateralize the capital lease and other obligations was
$2,547,000
and
$5,419,000
, respectively, and consisted primarily of machinery and equipment. Depreciation of leased assets is included in depreciation expense.
As of
July 31, 2018
, our capital lease and other obligations reflect a blended interest rate of approximately
6.10%
. Our capital leases generally contain provisions whereby we can purchase the equipment at the end of the lease for a
one
dollar buyout.
Future minimum payments under capital lease and other obligations consisted of the following at
July 31, 2018
:
|
Fiscal 2019
|
$
|
1,972,000
|
|
|
Fiscal 2020
|
780,000
|
|
|
|
Fiscal 2021 and beyond
|
—
|
|
|
|
Total minimum lease payments
|
2,752,000
|
|
|
|
Less: amounts representing interest
|
151,000
|
|
|
|
Present value of net minimum lease payments
|
2,601,000
|
|
|
|
Current portion of capital lease and other obligations
|
1,836,000
|
|
|
|
Non-current portion of capital lease and other obligations
|
$
|
765,000
|
|
(10)
Income Taxes
On December 22, 2017, H.R.1, also known as the Tax Cuts and Jobs Act ("Tax Reform"), was enacted in the U.S. Tax Reform significantly lowered the amount of our current and future income tax expense primarily due to the reduction in the U.S. statutory income tax rate from 35.0% to 21.0%. This provision went into effect on January 1, 2018 and required us to remeasure our deferred tax assets and liabilities. In fiscal 2019 and beyond, Tax Reform will result in the loss of our ability to take the domestic production activities deduction, which has been repealed, and is also likely to result in lower tax deductions for certain executive compensation expenses.
For fiscal 2018, we were subject to a
35.0%
statutory income tax rate with respect to the period August 1, 2017 through December 31, 2017 and a
21.0%
statutory income tax rate with respect to the period January 1, 2018 through July 31, 2018, or a blended statutory income tax rate for fiscal 2018 of approximately
27.0%
. As such, our effective tax rate for accounting purposes in fiscal 2018, excluding discrete items, was
27.0%
. We expect to fully benefit from the lower statutory income tax rate in fiscal 2019 and thereafter.
During fiscal 2018, we recorded a net discrete tax benefit of
$11,792,000
which, as a result of Tax Reform, primarily related to the remeasurement of deferred tax liabilities associated with non-deductible amortization related to intangible assets. The remeasurement was recorded pursuant to ASC 740 "
Income Taxes
" and SEC Staff Accounting Bulletin ("SAB") 118, using estimates based on reasonable and supportable assumptions and available information as of the reporting date. As such, the remeasurement of deferred taxes is an estimate and will be finalized after we file our federal and state income tax returns for fiscal 2018. The estimated impact recorded in fiscal 2018 will change if the timing of the deferred tax impacts shift between fiscal 2018 and fiscal 2019 and beyond. In addition, it is possible that the Internal Revenue Service ("IRS") will issue clarifying or interpretive guidance related to Tax Reform, which may ultimately result in a change to our estimated income tax.
F- 21
COMTECH TELECOMMUNICATIONS CORP. AND SUBSIDIARIES
Notes to Consolidated Financial Statements, Continued
Income (loss) before (benefit from) provision for income taxes consists of the following:
|
|
Fiscal Years Ended July 31,
|
|||||||||
|
|
2018
|
2017
|
2016
|
|||||||
|
U.S.
|
$
|
22,243,000
|
|
23,732,000
|
|
(7,666,000
|
)
|
|||
|
Foreign
|
2,383,000
|
|
1,749,000
|
|
(526,000
|
)
|
||||
|
|
$
|
24,626,000
|
|
25,481,000
|
|
(8,192,000
|
)
|
|||
The (benefit from) provision for income taxes included in the accompanying Consolidated Statements of Operations consists of the following:
|
|
Fiscal Years Ended July 31,
|
|||||||||
|
|
2018
|
2017
|
2016
|
|||||||
|
Federal – current
|
$
|
367,000
|
|
(441,000
|
)
|
2,297,000
|
|
|||
|
Federal – deferred
|
(7,499,000
|
)
|
8,399,000
|
|
(2,930,000
|
)
|
||||
|
State and local – current
|
440,000
|
|
608,000
|
|
408,000
|
|
||||
|
State and local – deferred
|
1,115,000
|
|
659,000
|
|
(310,000
|
)
|
||||
|
Foreign – current
|
429,000
|
|
413,000
|
|
81,000
|
|
||||
|
Foreign – deferred
|
5,000
|
|
16,000
|
|
—
|
|
||||
|
(Benefit from) provision for income taxes
|
$
|
(5,143,000
|
)
|
9,654,000
|
|
(454,000
|
)
|
|||
The (benefit from) provision for income taxes differed from the amounts computed by applying the U.S. Federal income tax rate as a result of the following:
|
|
Fiscal Years Ended July 31,
|
||||||||||||||||||
|
|
2018
|
2017
|
2016
|
||||||||||||||||
|
|
Amount
|
Rate
|
Amount
|
Rate
|
Amount
|
Rate
|
|||||||||||||
|
Computed "expected" tax expense (benefit)
|
$
|
6,615,000
|
|
27.0
|
%
|
8,919,000
|
|
35.0
|
%
|
(2,867,000
|
)
|
35.0
|
%
|
||||||
|
Increase (reduction) in income taxes resulting from:
|
|
|
|
|
|
|
|
|
|
|
|
|
|||||||
|
State and local income taxes, net of federal benefit
|
1,193,000
|
|
4.8
|
|
1,257,000
|
|
4.9
|
|
23,000
|
|
(0.3
|
)
|
|||||||
|
Stock-based compensation
|
(1,112,000
|
)
|
(4.5
|
)
|
78,000
|
|
0.3
|
|
68,000
|
|
(0.8
|
)
|
|||||||
|
Research and experimentation credits
|
(678,000
|
)
|
(2.8
|
)
|
(919,000
|
)
|
(3.6
|
)
|
(1,106,000
|
)
|
13.5
|
|
|||||||
|
Acquisition-related tax contingencies
|
—
|
|
—
|
|
—
|
|
—
|
|
1,962,000
|
|
(24.0
|
)
|
|||||||
|
Nondeductible transaction costs
|
—
|
|
—
|
|
—
|
|
—
|
|
1,279,000
|
|
(15.6
|
)
|
|||||||
|
Tax Reform remeasurement of deferred taxes
|
(11,317,000
|
)
|
(46.0
|
)
|
—
|
|
—
|
|
—
|
|
—
|
|
|||||||
|
Foreign income taxes
|
(221,000
|
)
|
(0.9
|
)
|
(151,000
|
)
|
(0.6
|
)
|
289,000
|
|
(3.5
|
)
|
|||||||
|
Other
|
377,000
|
|
1.4
|
|
470,000
|
|
1.9
|
|
(102,000
|
)
|
1.2
|
|
|||||||
|
(Benefit from) provision for income taxes
|
$
|
(5,143,000
|
)
|
(21.0
|
)%
|
9,654,000
|
|
37.9
|
%
|
(454,000
|
)
|
5.5
|
%
|
||||||
F- 22
COMTECH TELECOMMUNICATIONS CORP. AND SUBSIDIARIES
Notes to Consolidated Financial Statements, Continued
The tax effects of temporary differences that give rise to significant portions of the deferred tax assets and liabilities at
July 31, 2018
and
2017
are presented below:
|
|
2018
|
2017
|
|||||
|
Deferred tax assets:
|
|
|
|||||
|
Inventory and warranty reserves
|
$
|
5,089,000
|
|
7,854,000
|
|
||
|
Compensation and commissions
|
3,511,000
|
|
3,807,000
|
|
|||
|
Federal, state and foreign research and experimentation credits
|
18,816,000
|
|
16,286,000
|
|
|||
|
Federal alternative minimum tax credit
|
3,243,000
|
|
2,652,000
|
|
|||
|
Stock-based compensation
|
5,092,000
|
|
7,767,000
|
|
|||
|
Acquisition-related contingent liabilities
|
2,477,000
|
|
4,687,000
|
|
|||
|
Federal and state net operating losses
|
7,349,000
|
|
19,880,000
|
|
|||
|
Other
|
4,672,000
|
|
8,764,000
|
|
|||
|
Less valuation allowance
|
(11,854,000
|
)
|
(8,633,000
|
)
|
|||
|
Total deferred tax assets
|
38,395,000
|
|
63,064,000
|
|
|||
|
Deferred tax liabilities:
|
|
|
|
|
|||
|
Plant and equipment
|
(1,155,000
|
)
|
(1,309,000
|
)
|
|||
|
Intangibles
|
(48,167,000
|
)
|
(79,061,000
|
)
|
|||
|
Total deferred tax liabilities
|
(49,322,000
|
)
|
(80,370,000
|
)
|
|||
|
Net deferred tax liabilities
|
$
|
(10,927,000
|
)
|
(17,306,000
|
)
|
||
We provide for income taxes under the provisions of FASB ASC 740
"Income Taxes."
FASB ASC 740 requires an asset and liability based approach in accounting for income taxes. In assessing the realizability of deferred tax assets, management considers whether it is more likely than not that some portion or all of them will not be realized. If management determines that it is more likely than not that some or all of its deferred tax assets will not be realized, a valuation allowance will be recorded against such deferred tax assets.
At
July 31, 2018
, we had
$19,069,000
of U.S. federal net operating loss carryforwards reflected in deferred tax assets. Of the total loss carryforwards,
$18,422,000
were generated by TCS in the tax period from January 1, 2016 to February 23, 2016 and will begin to expire in 2035.
$183,000
is the remaining net operating loss carryforwards acquired in an acquisition by TCS in 2001 and will expire in 2021 if unused at that time. The remaining U.S. federal net operating loss carryforwards generated in fiscal year 2016 of
$464,000
will expire in 2036.
At
July 31, 2018
, we had federal alternative minimum tax credit carryforwards of
$3,243,000
, which are available to offset future regular federal taxes. We have federal research and experimentation credits of
$10,948,000
that will begin to expire in 2019. The timing and manner in which we may utilize net operating loss carryforwards and tax credits in future tax years will be limited by the amounts and timing of future taxable income and by the application of the ownership change rules under Section 382 and 383 of the Internal Revenue Code.
We have state net operating loss carryforwards available of
$3,345,000
which expire through 2037, utilization of which will be limited in a manner similar to the federal net operating loss carryforwards. We believe that it is more likely than not that the benefit from certain state net operating loss carryforwards will not be realized. In recognition of this risk, we have provided a valuation allowance of
$3,138,000
on the deferred tax assets relating to these state net operating loss carryforwards. We have state research and experimentation credit carryforwards of
$6,982,000
expiring through 2037. We believe that it is more likely than not that the benefit from certain state research and experimentation credits will not be realized. In recognition of this risk, we have provided a valuation allowance of
$6,771,000
on the deferred tax assets relating to these state credits.
F- 23
COMTECH TELECOMMUNICATIONS CORP. AND SUBSIDIARIES
Notes to Consolidated Financial Statements, Continued
At
July 31, 2018
and
2017
, our foreign deferred tax assets relating to research and experimentation credits have been offset by a valuation allowance as they may not be utilized in a future period. Our foreign earnings and profits are insignificant and, as such, we have not recorded any deferred tax liability on unremitted foreign earnings.
We must generate
$158,700,000
of taxable income in the future to fully utilize our net deferred tax assets as of
July 31, 2018
. Management believes it is more likely than not that the results of future operations will generate sufficient taxable income to realize the net deferred tax assets.
At
July 31, 2018
and
2017
, total unrecognized tax benefits were
$9,339,000
and
$8,681,000
, respectively, including interest of
$202,000
and
$95,000
, respectively. At
July 31, 2018
,
$2,572,000
of our unrecognized tax benefits were recorded as non-current income taxes payable in our Consolidated Balance Sheet. The remaining unrecognized tax benefits of
$6,767,000
were presented as an offset to the associated non-current deferred tax assets in our Consolidated Balance Sheet. At
July 31, 2017
,
$2,515,000
of our unrecognized tax benefits were recorded as non-current income taxes payable in our Consolidated Balance Sheet. The remaining unrecognized tax benefit of
$6,166,000
was presented as an offset to the associated non-current deferred tax assets in our Consolidated Balance Sheet. Of the total unrecognized tax benefits,
$8,563,000
and
$7,727,000
at
July 31, 2018
and
2017
, respectively, net of the reversal of the federal benefit recognized as a deferred tax asset relating to state reserves, would favorably impact our effective tax rate, if recognized. Unrecognized tax benefits result from income tax positions taken or expected to be taken on our income tax returns for which a tax benefit has not been recorded in our financial statements. We do not expect that there will be any significant changes to our total unrecognized tax benefits within the next twelve months.
Our policy is to recognize interest and penalties relating to uncertain tax positions in income tax expense. The following table summarizes the activity related to our unrecognized tax benefits for fiscal years
2018
,
2017
and
2016
(excluding interest):
|
|
2018
|
2017
|
2016
|
|||||||
|
Balance at beginning of period
|
$
|
8,586,000
|
|
9,108,000
|
|
2,728,000
|
|
|||
|
Increase related to current period
|
645,000
|
|
587,000
|
|
2,487,000
|
|
||||
|
Increase related to prior periods
|
49,000
|
|
86,000
|
|
4,490,000
|
|
||||
|
Expiration of statute of limitations
|
(81,000
|
)
|
(404,000
|
)
|
(580,000
|
)
|
||||
|
Decrease related to prior periods
|
(62,000
|
)
|
(791,000
|
)
|
(17,000
|
)
|
||||
|
Balance at end of period
|
$
|
9,137,000
|
|
8,586,000
|
|
9,108,000
|
|
|||
Since November 2017, our federal income tax return for fiscal 2016 has been under audit by the IRS. The audit is ongoing and we are unaware of any proposed adjustments by the IRS. Our federal income tax returns for fiscal 2015 and 2017 are also subject to potential future IRS audit. None of our state income tax returns prior to fiscal 2014 are subject to audit. TCS' federal income tax returns for tax years 2014 and 2015 and the tax period from January 1, 2016 to February 23, 2016 are subject to potential future IRS audit. None of TCS' state income tax returns prior to calendar year 2013 are subject to audit. The results of the IRS tax audit for fiscal 2016, future tax assessments or settlements could have a material adverse effect on our consolidated results of operations and financial condition.
(11)
Stock-Based Compensation
Overview
We issue stock-based awards to certain of our employees and our Board of Directors pursuant to our 2000 Stock Incentive Plan, as amended, (the "Plan") and our 2001 Employee Stock Purchase Plan (the "ESPP") and recognize related stock-based compensation in our consolidated financial statements. The Plan provides for the granting to employees and consultants of Comtech (including prospective employees and consultants): (i) incentive and non-qualified stock options, (ii) restricted stock units ("RSUs"), (iii) RSUs with performance measures (which we refer to as "performance shares"), (iv) restricted stock, (v) stock units (reserved for issuance to non-employee directors) and share units (reserved for issuance to employees) (collectively, "share units") and (vi) stock appreciation rights ("SARs"), among other types of awards. Our non-employee directors are eligible to receive non-discretionary grants of stock-based awards, subject to certain limitations.
F- 24
COMTECH TELECOMMUNICATIONS CORP. AND SUBSIDIARIES
Notes to Consolidated Financial Statements, Continued
On August 1, 2017, we adopted ASU No. 2016-09, which amended several aspects of the accounting for and reporting of our share-based payment transactions, including:
Excess tax benefits and shortfalls
- ASU No. 2016-09 requires that all tax effects related to our share-based awards be recognized in the Consolidated Statement of Operations. ASU No. 2016-09 also removes the prior requirement to delay recognition of excess tax benefits until it reduces current taxes payable; instead, we are now required to recognize excess tax benefits as discrete items in the interim period in which they occur, subject to normal valuation allowance considerations. As ASU No. 2016-09 eliminated the concept of accumulated hypothetical tax benefits, excess tax benefits and shortfalls are no longer recognized in stockholders’ equity. As a result, ASU No. 2016-09 is expected to result in future volatility of our income tax expense (as the future tax effects of share-based awards will be dependent on the price of our common stock at the time of settlement). Additionally, on a prospective basis, excess income tax benefits from the settlement of share-based awards are presented as a cash inflow from operating activities in our Consolidated Statement of Cash Flows.
Diluted earnings per share
- Prior to the adoption of ASU No. 2016-09, in addition to considering the amount an employee must pay upon assumed exercise of stock-based awards and the amount of stock-based compensation cost attributed to future services and not yet recognized, when calculating our diluted earnings per share, the assumed proceeds also included the amount of excess tax benefits, if any, that would have been credited to additional paid-in capital assuming exercise of in-the-money stock-based awards. Effective with our adoption of ASU No. 2016-09, excess tax benefits are to be excluded from the calculation on a prospective basis. As a result, the denominator for our diluted calculations could increase in the future as compared to prior calculations.
Forfeitures
- As permitted by ASU No. 2016-09, we elected to continue to estimate forfeitures of share-based awards.
Statutory Tax Withholding Requirements
- ASU No. 2016-09 now allows us, when net settling share-based awards, to withhold an amount up to the employees’ maximum individual tax rate in the relevant jurisdiction, without resulting in liability classification of the award. To qualify, we must have at least some withholding obligation. This aspect of adopting ASU No. 2016-09 did not have any material impact on us. However, with respect to cash payments that we make to taxing authorities on behalf of employees for such shares withheld, on a retrospective basis, we are required to present such payments as a cash outflow from financing activities in our Consolidated Statements of Cash Flows (as opposed to operating activities).
As of
July 31, 2018
, the aggregate number of shares of common stock which may be issued, pursuant to the Plan, may not exceed
10,362,500
. Stock options granted may not have a term exceeding
ten years
or, in the case of an incentive stock award granted to a stockholder who owns stock representing more than
10.0%
of the voting power, no more than
five years
. We expect to settle all outstanding awards under the Plan and employee purchases under the ESPP with the issuance of new shares of our common stock.
As of
July 31, 2018
, we had granted stock-based awards pursuant to the Plan representing the right to purchase and/or acquire an aggregate of
8,166,820
shares (net of
3,926,429
expired and canceled awards), of which an aggregate of
5,679,407
have been exercised or settled.
As of
July 31, 2018
, the following stock-based awards, by award type, were outstanding:
|
|
July 31, 2018
|
|
|
Stock options
|
1,668,975
|
|
|
Performance shares
|
255,275
|
|
|
RSUs and restricted stock
|
397,412
|
|
|
Share units
|
165,751
|
|
|
Total
|
2,487,413
|
|
Our ESPP provides for the issuance of up to
800,000
shares of our common stock. Our ESPP is intended to provide our eligible employees the opportunity to acquire our common stock at
85%
of fair market value at the date of issuance.
F- 25
COMTECH TELECOMMUNICATIONS CORP. AND SUBSIDIARIES
Notes to Consolidated Financial Statements, Continued
Through
July 31, 2018
, we have cumulatively issued
743,735
shares of our common stock to participating employees in connection with our ESPP.
Stock-based compensation for awards issued is reflected in the following line items in our Consolidated Statements of Operations:
|
|
Fiscal Years Ended July 31,
|
|||||||||
|
|
2018
|
2017
|
2016
|
|||||||
|
Cost of sales
|
$
|
758,000
|
|
760,000
|
|
296,000
|
|
|||
|
Selling, general and administrative expenses
|
6,866,000
|
|
7,071,000
|
|
3,407,000
|
|
||||
|
Research and development expenses
|
945,000
|
|
675,000
|
|
414,000
|
|
||||
|
Stock-based compensation expense before income tax benefit
|
8,569,000
|
|
8,506,000
|
|
4,117,000
|
|
||||
|
Estimated income tax benefit
|
(2,005,000
|
)
|
(3,065,000
|
)
|
(1,434,000
|
)
|
||||
|
Net stock-based compensation expense
|
$
|
6,564,000
|
|
5,441,000
|
|
2,683,000
|
|
|||
Stock-based compensation for equity-classified awards is measured at the date of grant, based on an estimate of the fair value of the award and is generally expensed over the vesting period of the award. At
July 31, 2018
, unrecognized stock-based compensation of
$6,641,000
, net of estimated forfeitures of
$742,000
, is expected to be recognized over a weighted average period of
2.7
years. Total stock-based compensation capitalized and included in ending inventory at
July 31, 2018
and
2017
was
$48,000
and
$12,000
, respectively. There are
no
liability-classified stock-based awards outstanding as of
July 31, 2018
or
2017
.
Stock-based compensation expense, by award type, is summarized as follows:
|
Fiscal Years Ended July 31,
|
||||||||||
|
2018
|
2017
|
2016
|
||||||||
|
Stock options
|
$
|
1,089,000
|
|
1,400,000
|
|
2,353,000
|
|
|||
|
Performance shares
|
1,013,000
|
|
1,607,000
|
|
1,374,000
|
|
||||
|
RSUs and restricted stock
|
1,458,000
|
|
829,000
|
|
227,000
|
|
||||
|
ESPP
|
205,000
|
|
162,000
|
|
163,000
|
|
||||
|
Share units
|
4,804,000
|
|
4,508,000
|
|
—
|
|
||||
|
Stock-based compensation expense before income tax benefit
|
8,569,000
|
|
8,506,000
|
|
4,117,000
|
|
||||
|
Estimated income tax benefit
|
(2,005,000
|
)
|
(3,065,000
|
)
|
(1,434,000
|
)
|
||||
|
Net stock-based compensation expense
|
$
|
6,564,000
|
|
5,441,000
|
|
2,683,000
|
|
|||
ESPP stock-based compensation expense primarily relates to the
15%
discount offered to participants in the ESPP.
The estimated income tax benefit as shown in the above table was computed using income tax rates expected to apply when the awards are settled. Such deferred tax asset was recorded net as part of our non-current deferred tax liability in our Consolidated Balance Sheet as of
July 31, 2018
and
2017
. The actual income tax benefit recognized for tax reporting is based on the fair market value of our common stock at the time of settlement and can significantly differ from the estimated income tax benefit recorded for financial reporting.
F- 26
COMTECH TELECOMMUNICATIONS CORP. AND SUBSIDIARIES
Notes to Consolidated Financial Statements, Continued
Stock Options
The following table summarizes the Plan's activity:
|
|
Awards
(in Shares)
|
Weighted Average
Exercise Price
|
Weighted Average
Remaining Contractual
Term (Years)
|
Aggregate
Intrinsic Value
|
|||||||||
|
Outstanding at July 31, 2015
|
2,119,683
|
|
$
|
29.33
|
|
|
|
||||||
|
Granted
|
552,806
|
|
27.15
|
|
|
|
|||||||
|
Expired/canceled
|
(396,610
|
)
|
28.99
|
|
|
|
|||||||
|
Exercised
|
(19,200
|
)
|
27.24
|
|
|
|
|||||||
|
Outstanding at July 31, 2016
|
2,256,679
|
|
28.87
|
|
|
|
|||||||
|
Expired/canceled
|
(400,804
|
)
|
30.15
|
|
|
|
|||||||
|
Outstanding at July 31, 2017
|
1,855,875
|
|
28.60
|
|
|
|
|||||||
|
Expired/canceled
|
(72,190
|
)
|
27.58
|
|
|
|
|||||||
|
Exercised
|
(114,710
|
)
|
27.44
|
|
|||||||||
|
Outstanding at July 31, 2018
|
1,668,975
|
|
$
|
28.72
|
|
4.53
|
$
|
8,198,000
|
|
||||
|
Exercisable at July 31, 2018
|
1,314,448
|
|
$
|
28.67
|
|
4.07
|
$
|
6,516,000
|
|
||||
|
Vested and expected to vest at July 31, 2018
|
1,632,696
|
|
$
|
28.70
|
|
4.48
|
$
|
8,049,000
|
|
||||
Stock options outstanding as of
July 31, 2018
have exercise prices ranging from
$20.90
-
$33.94
. The total intrinsic value relating to stock options exercised during the fiscal years ended
July 31, 2018
and
2016
was
$469,000
and
$32,000
, respectively. There were
no
stock options exercised during the fiscal year ended
July 31, 2017
. Stock options granted during the fiscal year ended
July 31, 2016
had exercise prices equal to the fair market value of our common stock on the date of grant, a contractual term of
five
or
ten years
and a vesting period of
three
or
five years
. There were
no
stock options granted during the fiscal years ended
July 31, 2018
and
2017
.
During fiscal
2018
, at the election of certain holders of vested stock options,
101,610
stock options were net settled upon exercise. As a result,
8,706
net shares of our common stock were issued during the fiscal year ended
July 31, 2018
, after reduction of shares retained to satisfy the exercise price and statutory tax withholding requirements.
The estimated per-share weighted average grant-date fair value of stock options granted during fiscal
2016
was
$5.50
, which was determined using the Black-Scholes option pricing model, and included the following weighted average assumptions:
|
Fiscal Year Ended July 31,
|
|||||
|
2016
|
|||||
|
Expected dividend yield
|
4.46
|
%
|
|||
|
Expected volatility
|
34.44
|
%
|
|||
|
Risk-free interest rate
|
1.52
|
%
|
|||
|
Expected life (years)
|
5.15
|
|
|||
F- 27
COMTECH TELECOMMUNICATIONS CORP. AND SUBSIDIARIES
Notes to Consolidated Financial Statements, Continued
Expected dividend yield is the expected annual dividend as a percentage of the fair market value of our common stock on the date of grant, based on our Board's annual dividend target at the time of grant. We estimate expected volatility by considering the historical volatility of our stock and the implied volatility of publicly-traded call options on our stock. The risk-free interest rate is based on the U.S. Treasury yield curve in effect at the time of grant for an instrument which closely approximates the expected term. The expected term is the number of years we estimate that awards will be outstanding prior to exercise and is determined by employee groups with sufficiently distinct behavior patterns. Assumptions used in computing the fair value of stock-based awards reflect our best estimates, but involve uncertainties relating to market and other conditions, many of which are outside of our control. Estimates of fair value are not intended to predict actual future events or the value ultimately realized by recipients of stock-based awards.
Performance Shares, RSUs, Restricted Stock and Share Unit Awards
The following table summarizes the Plan's activity relating to performance shares, RSUs, restricted stock and share units:
|
|
|
Awards (in Shares)
|
|
Weighted Average
Grant Date
Fair Value
|
|
Aggregate
Intrinsic Value
|
|||||
|
Outstanding at July 31, 2015
|
224,165
|
|
$
|
28.26
|
|
||||||
|
Granted
|
71,605
|
|
27.45
|
|
|||||||
|
Settled
|
(16,439
|
)
|
26.35
|
|
|||||||
|
Forfeited
|
(62,118
|
)
|
27.62
|
|
|||||||
|
Outstanding at July 31, 2016
|
|
217,213
|
|
28.32
|
|
||||||
|
Granted
|
|
705,241
|
|
14.31
|
|
||||||
|
Settled
|
|
(61,462
|
)
|
26.63
|
|
||||||
|
Forfeited
|
|
(30,795
|
)
|
17.13
|
|
||||||
|
Outstanding at July 31, 2017
|
|
830,197
|
|
16.95
|
|
||||||
|
Granted
|
|
473,005
|
|
22.45
|
|
||||||
|
Settled
|
|
(354,822
|
)
|
17.66
|
|
||||||
|
Canceled/Forfeited
|
|
(129,942
|
)
|
17.26
|
|
||||||
|
Outstanding at July 31, 2018
|
|
818,438
|
|
$
|
19.78
|
|
$
|
27,500,000
|
|
||
|
|
|
||||||||||
|
Vested at July 31, 2018
|
|
207,998
|
|
$
|
28.88
|
|
$
|
6,989,000
|
|
||
|
|
|
||||||||||
|
Vested and expected to vest at July 31, 2018
|
|
785,543
|
|
$
|
19.92
|
|
$
|
26,394,000
|
|
||
The total intrinsic value relating to fully-vested awards settled during the fiscal years ended
July 31, 2018
,
2017
and
2016
was
$10,473,000
,
$1,039,000
and
$660,000
respectively.
Performance shares granted to employees prior to fiscal 2014 generally vest over a
5.3
year period, beginning on the date of grant once pre-established performance goals were attained, and are convertible into shares of our common stock at the time of vesting, on a
one
-for-one basis for no cash consideration. The performance shares granted to employees since fiscal 2014 principally vest over a
three
-year performance period, if pre-established performance goals are attained, or as specified pursuant to the Plan and related agreements. As of
July 31, 2018
, the number of outstanding performance shares included in the above table, and the related compensation expense prior to consideration of estimated pre-vesting forfeitures, assume achievement of the pre-established goals at a target level.
RSUs and restricted stock granted to non-employee directors have a vesting period of
three
years and are convertible into shares of our common stock generally at the time of termination, on a
one
-for-one basis for no cash consideration, or earlier under certain circumstances. RSUs granted to employees have a vesting period of
five
years and are convertible into shares of our common stock generally at the time of vesting, on a
one
-for-one basis for no cash consideration.
F- 28
COMTECH TELECOMMUNICATIONS CORP. AND SUBSIDIARIES
Notes to Consolidated Financial Statements, Continued
Share units granted prior to
July 31, 2017
were vested when issued and are convertible into shares of our common stock, generally at the time of termination, on a
one
-for-one basis for no cash consideration, or earlier under certain circumstances. Share units granted on or after July 31, 2017 were granted to certain employees in lieu of non-equity incentive compensation and are convertible into shares of our common stock on the one-year anniversary of the respective grant date.
On
July 31, 2018
,
160,899
fully vested share units were granted to certain employees in lieu of fiscal
2018
non-equity incentive compensation. Also, on
July 31, 2018
,
247,664
fully vested share units (previously granted in lieu of fiscal 2017 non-equity incentive compensation) were converted into
162,391
shares of our common stock after reduction of shares retained to satisfy employees’ statutory tax withholding requirements. Cumulatively, through
July 31, 2018
,
265,348
share units granted have been settled.
The fair value of performance shares, RSUs, restricted stock and share units is determined using the closing market price of our common stock on the date of grant, less the present value of any estimated future dividend equivalents such awards are not entitled to receive and an applicable estimated discount for post vesting restrictions. RSUs, performance shares and restricted stock granted since fiscal 2013 are entitled to dividend equivalents unless forfeited before vesting occurs; however, performance shares granted in fiscal 2013 were not entitled to such dividend equivalents until our Board of Directors determined that the pre-established performance goals were met. Share units granted prior to fiscal 2014 are not entitled to dividend equivalents. Share units granted since fiscal 2014 are entitled to dividend equivalents while the underlying shares are unissued.
Dividend equivalents are subject to forfeiture, similar to the terms of the underlying stock-based awards, and are payable in cash generally at the time of settlement of the underlying shares into our common stock. During fiscal
2018
,
2017
and
2016
, we accrued
$300,000
,
$273,000
and
$155,000
, respectively, of dividend equivalents (net of forfeitures) and paid out
$141,000
,
$176,000
and
$23,000
, respectively. Accrued dividend equivalents were recorded as a reduction to retained earnings. As of
July 31, 2018
and
2017
, accrued dividend equivalents were
$713,000
and
$554,000
, respectively.
We recorded
$1,193,000
of income tax benefit in our Consolidated Statements of Operations for fiscal
2018
, which primarily represents net excess income tax benefits from the settlement of stock-based awards. During fiscal
2017
and
2016
, net income tax shortfalls from similar items totaled
$670,000
and
$283,000
, pursuant to prior GAAP, were recorded as a reduction to additional paid-in capital.
Subsequent Events
In the first quarter of fiscal
2019
, our Board of Directors authorized the issuance of
152,617
stock-based awards of which
46,305
were performance shares,
10,386
were restricted stock and
95,926
were restricted stock units. Total unrecognized compensation expense related to such awards, net of estimated forfeitures and assuming achievement of the pre-established performance goals at a target level, approximated
$5,057,000
.
F- 29
COMTECH TELECOMMUNICATIONS CORP. AND SUBSIDIARIES
Notes to Consolidated Financial Statements, Continued
(12)
Customer and Geographic Information
Sales by geography and customer type, as a percentage of consolidated net sales, are as follows:
|
|
Fiscal Years Ended July 31,
|
||||||||
|
|
2018
|
2017
|
2016
|
||||||
|
United States
|
|
|
|
||||||
|
U.S. government
|
35.5
|
%
|
32.7
|
%
|
40.8
|
%
|
|||
|
Domestic
|
38.9
|
%
|
38.9
|
%
|
29.2
|
%
|
|||
|
Total United States
|
74.4
|
%
|
71.6
|
%
|
70.0
|
%
|
|||
|
International
|
25.6
|
%
|
28.4
|
%
|
30.0
|
%
|
|||
|
Total
|
100.0
|
%
|
100.0
|
%
|
100.0
|
%
|
|||
Sales to U.S. government customers include sales to the U.S. Department of Defense ("DoD"), intelligence and civilian agencies, as well as sales directly to or through prime contractors.
Domestic sales include sales to commercial customers, as well as to U.S. state and local governments. Included in domestic sales are sales to Verizon which represented
10.0%
of consolidated net sales for fiscal
2018
. Except for the U.S. government, there were no customers that represented more than 10.0% of consolidated net sales during fiscal
2017
and
2016
.
International sales for fiscal
2018
,
2017
and
2016
(which include sales to U.S. domestic companies for inclusion in products that are sold to international customers) were
$145,784,000
,
$156,483,000
and
$123,474,000
, respectively.
Except for the U.S., no individual country (including sales to U.S. domestic companies for inclusion in products that are sold to a foreign country) represented more than
10%
of consolidated net sales for fiscal
2018
,
2017
and
2016
.
(13)
Segment Information
Reportable operating segments are determined based on Comtech’s management approach. The management approach, as defined by FASB ASC 280 "
Segment Reporting
" is based on the way that the chief operating decision-maker ("CODM") organizes the segments within an enterprise for making decisions about resources to be allocated and assessing their performance. Our CODM, for purposes of FASB ASC 280, is our Chief Executive Officer and President.
Our Commercial Solutions segment serves commercial customers and smaller government customers, such as state and local governments, that require advanced communication technologies to meet their needs. This segment also serves certain large government customers (including the U.S. government) that have requirements for off-the-shelf commercial equipment. We believe this segment is a leading provider of satellite communications (such as satellite earth station modems and TWTAs), public safety systems (such as NG911 technologies) and enterprise application technologies (such as messaging and trusted location-based technologies).
F- 30
COMTECH TELECOMMUNICATIONS CORP. AND SUBSIDIARIES
Notes to Consolidated Financial Statements, Continued
Our Government Solutions segment serves large government end-users (including those of foreign countries) that require mission-critical technologies and systems. Government solutions products include command and control applications (such as the design, installation and operation of data networks that integrate computing and communications, including both satellite and terrestrial links), ongoing network operation and management support services (including project management and fielding and maintenance solutions related to satellite ground terminals), troposcatter communications (such as digital troposcatter multiplexers, digital over-the-horizon modems, troposcatter systems and frequency converter systems) and RF power and switching technologies (such as solid-state high-power broadband amplifiers, enhanced position location reporting system (commonly known as "EPLRS") amplifier assemblies, identification friend or foe ("IFF") amplifiers and amplifiers used in the counteraction of improvised explosive devices).
Our CODM primarily uses a metric that we refer to as Adjusted Earnings Before Interest, Taxes, Depreciation and Amortization ("Adjusted EBITDA") to measure an operating segment’s performance and to make decisions about resources to be allocated. Our Adjusted EBITDA metric for the Commercial Solutions and Government Solutions segments do not consider any allocation of indirect expenses, including the following: income taxes, interest (income) and other, interest expense, amortization of stock-based compensation, amortization of intangibles, depreciation expense, settlement of intellectual property litigation, acquisition plan expenses or strategic alternatives analysis expenses and other expenses that relate to our Unallocated segment. These items, while periodically affecting our results, may vary significantly from period to period and may have a disproportionate effect in a given period, thereby affecting the comparability of results. Any amounts shown in the Adjusted EBITDA calculation for our Commercial Solutions and Government Solutions segments are directly attributable to those segments. Our Adjusted EBITDA is also used by our management in assessing the Company's operating results. Although closely aligned, the Company's definition of Adjusted EBITDA is different than the Consolidated EBITDA (as such term is defined in our Secured Credit Facility, as amended) utilized for financial covenant calculations and also may differ from the definition of EBITDA or Adjusted EBITDA used by other companies and, therefore, may not be comparable to similarly titled measures used by other companies.
Operating segment information, along with a reconciliation of segment net income (loss) and consolidated net income (loss) to Adjusted EBITDA is presented in the tables below:
|
|
Fiscal Year Ended July 31, 2018
|
|||||||||||||
|
|
Commercial Solutions
|
Government Solutions
|
Unallocated
|
Total
|
||||||||||
|
Net sales
|
$
|
345,076,000
|
|
225,513,000
|
|
—
|
|
$
|
570,589,000
|
|
||||
|
Operating income (loss)
|
$
|
40,837,000
|
|
10,950,000
|
|
(16,712,000
|
)
|
$
|
35,075,000
|
|
||||
|
Net income (loss)
|
$
|
40,297,000
|
|
10,835,000
|
|
(21,363,000
|
)
|
$
|
29,769,000
|
|
||||
|
Provision for (benefit from) income taxes
|
270,000
|
|
—
|
|
|
(5,413,000
|
)
|
(5,143,000
|
)
|
|||||
|
Interest (income) and other
|
151,000
|
|
112,000
|
|
|
(9,000
|
)
|
254,000
|
|
|||||
|
Interest expense
|
119,000
|
|
3,000
|
|
|
10,073,000
|
|
10,195,000
|
|
|||||
|
Amortization of stock-based compensation
|
—
|
|
—
|
|
|
8,569,000
|
|
8,569,000
|
|
|||||
|
Amortization of intangibles
|
17,699,000
|
|
3,376,000
|
|
|
—
|
|
21,075,000
|
|
|||||
|
Depreciation
|
9,479,000
|
|
3,088,000
|
|
|
1,088,000
|
|
13,655,000
|
|
|||||
|
Adjusted EBITDA
|
$
|
68,015,000
|
|
17,414,000
|
|
(7,055,000
|
)
|
$
|
78,374,000
|
|
||||
|
Purchases of property, plant and equipment
|
$
|
7,151,000
|
|
901,000
|
|
590,000
|
|
$
|
8,642,000
|
|
||||
|
Total assets at July 31, 2018
|
$
|
610,166,000
|
|
195,924,000
|
|
39,067,000
|
|
$
|
845,157,000
|
|
||||
F- 31
COMTECH TELECOMMUNICATIONS CORP. AND SUBSIDIARIES
Notes to Consolidated Financial Statements, Continued
|
|
Fiscal Year Ended July 31, 2017
|
|||||||||||||
|
|
Commercial Solutions
|
Government Solutions
|
Unallocated
|
Total
|
||||||||||
|
Net sales
|
$
|
330,867,000
|
|
219,501,000
|
|
—
|
|
$
|
550,368,000
|
|
||||
|
Operating income (loss)
|
$
|
33,234,000
|
|
9,393,000
|
|
(5,585,000
|
)
|
$
|
37,042,000
|
|
||||
|
Net income (loss)
|
$
|
32,871,000
|
|
9,421,000
|
|
(26,465,000
|
)
|
$
|
15,827,000
|
|
||||
|
Provision for income taxes
|
258,000
|
|
—
|
|
9,396,000
|
|
9,654,000
|
|
||||||
|
Interest (income) and other
|
(108,000
|
)
|
(34,000
|
)
|
74,000
|
|
(68,000
|
)
|
||||||
|
Interest expense
|
213,000
|
|
6,000
|
|
11,410,000
|
|
11,629,000
|
|
||||||
|
Amortization of stock-based compensation
|
—
|
|
—
|
|
8,506,000
|
|
8,506,000
|
|
||||||
|
Amortization of intangibles
|
17,698,000
|
|
5,125,000
|
|
—
|
|
22,823,000
|
|
||||||
|
Depreciation
|
9,938,000
|
|
2,938,000
|
|
1,478,000
|
|
14,354,000
|
|
||||||
|
Settlement of intellectual property litigation
|
—
|
|
—
|
|
(12,020,000
|
)
|
(12,020,000
|
)
|
||||||
|
Adjusted EBITDA
|
$
|
60,870,000
|
|
17,456,000
|
|
(7,621,000
|
)
|
$
|
70,705,000
|
|
||||
|
Purchases of property, plant and equipment
|
$
|
7,007,000
|
|
1,046,000
|
|
97,000
|
|
$
|
8,150,000
|
|
||||
|
Total assets at July 31, 2017
|
$
|
606,436,000
|
|
185,234,000
|
|
40,393,000
|
|
$
|
832,063,000
|
|
||||
|
|
Fiscal Year Ended July 31, 2016
|
|||||||||||||
|
|
Commercial Solutions
|
Government Solutions
|
Unallocated
|
Total
|
||||||||||
|
Net sales
|
$
|
248,955,000
|
|
162,049,000
|
|
—
|
|
$
|
411,004,000
|
|
||||
|
Operating income (loss)
|
$
|
23,255,000
|
|
23,006,000
|
|
(46,837,000
|
)
|
$
|
(576,000
|
)
|
||||
|
Net income (loss)
|
$
|
22,785,000
|
|
23,018,000
|
|
(53,541,000
|
)
|
$
|
(7,738,000
|
)
|
||||
|
Provision for (benefit from) income taxes
|
72,000
|
|
—
|
|
(526,000
|
)
|
(454,000
|
)
|
||||||
|
Interest (income) and other
|
109,000
|
|
(11,000
|
)
|
(232,000
|
)
|
(134,000
|
)
|
||||||
|
Interest expense
|
289,000
|
|
(1,000
|
)
|
7,462,000
|
|
7,750,000
|
|
||||||
|
Amortization of stock-based compensation
|
—
|
|
—
|
|
4,117,000
|
|
4,117,000
|
|
||||||
|
Amortization of intangibles
|
10,592,000
|
|
2,823,000
|
|
—
|
|
13,415,000
|
|
||||||
|
Depreciation
|
7,073,000
|
|
2,006,000
|
|
751,000
|
|
9,830,000
|
|
||||||
|
Acquisition plan expenses
|
—
|
|
—
|
|
21,276,000
|
|
21,276,000
|
|
||||||
|
Adjusted EBITDA
|
$
|
40,920,000
|
|
27,835,000
|
|
(20,693,000
|
)
|
$
|
48,062,000
|
|
||||
|
Purchases of property, plant and equipment
|
$
|
4,614,000
|
|
978,000
|
|
75,000
|
|
$
|
5,667,000
|
|
||||
|
Long-lived assets acquired in connection with the TCS acquisition
|
367,865,000
|
|
82,860,000
|
|
4,359,000
|
|
455,084,000
|
|
||||||
|
Total assets at July 31, 2016
|
$
|
631,936,000
|
|
226,865,000
|
|
62,395,000
|
|
$
|
921,196,000
|
|
||||
Unallocated expenses result from corporate expenses such as executive compensation, accounting, legal and other regulatory compliance related costs and also includes all of our amortization of stock-based compensation. Unallocated expenses reflect favorable adjustments to operating income related to: (i) warranty and sales and use tax settlements in fiscal 2018; and (ii) settlement of certain legacy TCS intellectual property matters in fiscal 2017. During fiscal 2016, unallocated expenses include acquisition plan expenses, most of which related to the February 23, 2016 acquisition of TCS.
F- 32
COMTECH TELECOMMUNICATIONS CORP. AND SUBSIDIARIES
Notes to Consolidated Financial Statements, Continued
Interest expense in fiscal
2018
,
2017
and
2016
includes
$9,614,000
,
$11,106,000
and
$6,933,000
, respectively, related to our Secured Credit Facility, as amended, and includes the amortization of deferred financing costs. See
Note (8) -
"
Secured Credit Facility
" for further discussion of such debt.
Intersegment sales in fiscal
2018
,
2017
and
2016
by the Commercial Solutions segment to the Government Solutions segment were
$9,630,000
,
$12,492,000
and
$6,266,000
, respectively. There were nominal sales by the Government Solutions segment to the Commercial Solutions segment for these fiscal periods. All intersegment sales are eliminated in consolidation and are excluded from the tables above.
Unallocated assets at
July 31, 2018
consist principally of cash and cash equivalents, income taxes receivable, corporate property, plant and equipment and deferred financing costs. Substantially all of our long-lived assets are located in the U.S.
F- 33
COMTECH TELECOMMUNICATIONS CORP. AND SUBSIDIARIES
Notes to Consolidated Financial Statements, Continued
(14)
Commitments and Contingencies
(a)
Operating Leases
At
July 31, 2018
, future minimum lease payments, net of subleases, under non-cancelable operating lease agreements are as follows:
|
Fiscal Year:
|
|||
|
2019
|
$
|
11,246,000
|
|
|
2020
|
9,884,000
|
|
|
|
2021
|
7,866,000
|
|
|
|
2022
|
6,577,000
|
|
|
|
2023
|
4,950,000
|
|
|
|
Thereafter
|
10,760,000
|
|
|
|
Total
|
$
|
51,283,000
|
|
Lease expense charged to operations was
$12,733,000
,
$13,270,000
and
$9,100,000
in fiscal
2018
,
2017
and
2016
, respectively.
We lease our Melville, New York production facility from a partnership controlled by our President, CEO and Chairman. Lease payments made in fiscal
2018
were
$625,000
. The current lease provides for our use of the premises as they exist through
December 2021
with an option for an additional
10 years
. The annual rent of the facility for calendar year
2019
is
$645,000
and is subject to customary adjustments. We have a right of first refusal in the event of a sale of the facility.
(b)
Legal Proceedings and Other Matters
Legacy TCS Intellectual Property Matter - Vehicle IP
In December 2009, Vehicle IP, LLC ("Vehicle IP") filed a patent infringement lawsuit in the U.S. District Court for the District of Delaware (the "District Court"), seeking monetary damages, fees and expenses and other relief from, among others, our customer Verizon Wireless ("Verizon"), based on the VZ Navigator product, and TCS is defending Verizon against Vehicle IP. In 2013, the District Court granted the defendants’ motion for summary judgment on the basis that the products in question did not infringe plaintiff’s patent. Plaintiff appealed that decision and, in 2014, the U.S. Court of Appeals for the Federal Circuit reversed the District Court's claim construction, overturned the District Court's grant of summary judgment of noninfringement, and remanded the case for further proceedings. Fact discovery and expert discovery has closed. Substantive settlement conversations have occurred but, to-date, the parties have been unable to reach a settlement. As discussed in
Note (6) - "Accrued Expenses and Other Current Liabilities,"
we have accrued certain legal and settlement costs related to the Vehicle IP matter. The accrued settlement costs related to this matter do not reflect the final amounts we actually may pay, if any.
On May 30, 2017, we received positive news that the District Court issued a supplemental claim construction order in our favor. As a result, the plaintiff agreed to file a joint status report to the District Court that requested that the District Court cancel the trial date (which was scheduled for July 2017). On July 28, 2017, the parties entered into a stipulation that the defendants’ accused products do not infringe Vehicle IP’s patent under the District Court’s current revised construction of the disputed patent claim term and requested that the District Court therefore enter a judgment of noninfringement. On August 18, 2017, the court entered such a judgment of noninfringement. As expected, following the judgment, Vehicle IP filed a notice of appeal on August 29, 2017. Vehicle IP's opening brief on appeal of the District Court's claim construction was submitted in October 2017. TCS' brief in response was filed on January 19, 2018. Vehicle IP's reply brief was filed on February 23, 2018. Oral argument was held on August 8, 2018 and an appellate ruling may take several months to be issued. If the District Court's current claim construction is ultimately upheld at the appellate level, it is possible that we may not have to go to trial or pay any monetary damages.
Ongoing legal expenses associated with defending this matter and its ultimate resolution could vary and have a material adverse effect on our consolidated results of operations, financial position or cash flows in future periods.
F- 34
COMTECH TELECOMMUNICATIONS CORP. AND SUBSIDIARIES
Notes to Consolidated Financial Statements, Continued
Other Matters
In October 2014, we disclosed to the U.S. Department of the Treasury, Office of Foreign Assets Control ("OFAC") that we learned during a self-assessment of our export transactions that a shipment of modems sent to a Canadian customer by Comtech EF Data Corp. was incorporated into a communication system, the ultimate end user of which was the Sudan Civil Aviation Authority. The sales value of this equipment was approximately
$288,000
. At the time of shipment, OFAC regulations prohibited U.S. persons from doing business directly or indirectly with Sudan. In late 2015, OFAC issued an administrative subpoena seeking further information about the disclosed transaction. We have responded to the subpoena, including alerting OFAC to Comtech’s repair of three modems for a customer in Lebanon who may have rerouted the modems from Lebanon to Sudan without the required U.S. licensing authorization. Subsequently, in October 2017, U.S. sanctions with respect to Sudan were revoked. Consistent with the revocation of the Sudan Sanction Regulations ("SSR"), shipments to the Sudan Civil Aviation Authority by U.S. persons are now permissible. We are not able to predict when OFAC will complete its review, nor whether it will take any enforcement action against us in light of the recent revocation of the SSR. If OFAC determines that we have violated U.S. trade sanctions, civil and criminal penalties could apply, and we may suffer reputational harm. Even though we take precautions to avoid engaging in transactions that may violate U.S. trade sanctions, those measures may not be effective in every instance.
In May 2018, we were informed by the Office of Export Enforcement ("OEE") of the Department of Commerce ("DoC") that it was forwarding to the DoC's Office of Chief Counsel, the results of its audit of international shipments by Comtech Xicom Technology, Inc. for further review and possible determination of an administrative penalty. We fully cooperated with the OEE in their audit and, based on our self-assessment of the approximately
7,800
individual transactions audited, have determined that six (
6
) transactions may not have been fully in compliance with the Export Administration Regulations ("EAR"). These six (
6
) items, for which export licenses were not obtained, were either spares or repaired power amplifier subassembly components valued at less than
$100,000
(in aggregate) and were shipped to Brazil, Italy, Russia, Thailand and the United Arab Emirates. The EAR provides an exception to the requirement to obtain an export license for the replacement of a defective or damaged component. During our self-assessment, we determined that we inadvertently did not obtain export licenses for the spares, or had evidence of the return or destruction of the defective or damaged components necessary to authorize our use of the export license exception for the replacements. Since discovering this issue, we have implemented additional controls and procedures and have increased awareness of these specific export requirements throughout the Company to help avoid similar occurrences in the future. Administrative penalties under the EAR can range from a warning letter to a denial of export privileges. Given the lapsed legal status of the Export Administration Act ("EAA") itself, administrative penalties under the EAR are currently determined pursuant to the International Emergency Economic Powers Act ("IEEPA"), which can reach the greater of twice the amount of the transaction that is the basis of the violation or approximately
$300,000
per violation. We have not recorded an accrual related to a possible administrative penalty and continue to work cooperatively with the OEE.
In the ordinary course of business, we include indemnification provisions in certain of our customer contracts to indemnify, hold harmless and reimburse such customers for certain losses, including but not limited to losses related to third-party claims of intellectual property infringement arising from the customer’s use of our products or services. From time to time, customers seek indemnification under these contractual arrangements and we evaluate such claims as and when they arise. We do not always agree with customers that they are entitled to indemnification and in such cases reject their indemnification claims. However, pending or future claims asserted against us by a party that we agree to indemnify could result in legal costs and damages that could have a material adverse effect on our consolidated results of operations and financial condition.
There are certain other pending and threatened legal actions which arise in the normal course of business. Although the ultimate outcome of litigation is difficult to accurately predict, we believe that the outcome of these other pending and threatened actions will not have a material adverse effect on our consolidated financial condition or results of operations.
(c)
Employment Change of Control and Indemnification Agreements
We have an employment agreement with our CEO and President. The employment agreement generally provides for an annual salary and bonus award. We have also entered into change of control agreements with certain of our executive officers and certain key employees. All of these agreements may require payments by us, in certain circumstances, including, but not limited to, a change in control of our Company.
(15)
Goodwill
The following table represents goodwill by reportable operating segment as of July 31, 2018 and 2017:
|
Commercial Solutions
|
Government Solutions
|
Total
|
|||||||||
|
Goodwill
|
$
|
231,440,000
|
|
59,193,000
|
|
$
|
290,633,000
|
|
|||
In accordance with FASB ASC 350
"Intangibles - Goodwill and Other,"
we perform a goodwill impairment analysis at least annually (in the first quarter of each fiscal year), unless indicators of impairment exist in interim periods. If we fail the quantitative assessment of goodwill impairment ("quantitative assessment"), pursuant to our adoption of FASB ASU No. 2017-04 in fiscal 2017, we would be required to recognize an impairment loss equal to the amount that a reporting unit's carrying value exceeded its fair value; however, any loss recognized should not exceed the total amount of goodwill allocated to that reporting unit.
F- 35
COMTECH TELECOMMUNICATIONS CORP. AND SUBSIDIARIES
Notes to Consolidated Financial Statements, Continued
On August 1, 2018 (the first day of our fiscal 2019), we performed our annual quantitative assessment using market participant assumptions to determine if the fair value of each of our reporting units with goodwill exceeded its carrying value. In making this assessment, we considered, among other things, expectations of projected net sales and cash flows, assumptions impacting the weighted average cost of capital, trends in trading multiples of comparable companies, changes in our stock price and changes in the carrying values of our reporting units with goodwill. We also considered overall business conditions.
In performing the quantitative assessment, we estimated the fair value of each of our reporting units using a combination of the income and market approaches. The income approach, also known as the discounted cash flow ("DCF") method, utilizes the present value of cash flows to estimate fair value. The future cash flows for our reporting units were projected based on our estimates, at that time, of future revenues, operating income and other factors (such as working capital and capital expenditures). For purposes of conducting our impairment analysis, we assumed revenue growth rates and cash flow projections that are below our actual long-term expectations. The discount rates used in our DCF method were based on a weighted-average cost of capital ("WACC") determined from relevant market comparisons, adjusted upward for specific reporting unit risks (primarily the uncertainty of achieving projected operating cash flows). A terminal value growth rate was applied to the final year of the projected period and reflected our estimate of stable, perpetual growth. We then calculated a present value of the respective cash flows for each reporting unit to arrive at an estimate of fair value under the income approach. Under the market approach, we estimated a fair value based on comparable companies' market multiples of revenues and earnings before interest, taxes, depreciation and amortization and factored in a control premium. Finally, we compared our estimates of fair values to our August 1, 2018 total public market capitalization and assessed implied control premiums based on our common stock price of
$33.70
as of August 1, 2018.
Based on our quantitative evaluation, we determined that our Commercial Solutions and Government Solutions reporting units had estimated fair values in excess of their carrying values of at least
42.5%
and
105.5%
, respectively, and concluded that our goodwill was not impaired and that neither of our
two
reporting units was at risk of failing the quantitative assessment. It is possible that, during fiscal 2019 or beyond, business conditions (both in the U.S. and internationally) could deteriorate from the current state, our current or prospective customers could materially postpone, reduce or even forgo purchases of our products and services to a greater extent than we currently anticipate or our common stock price could decline. A significant decline in our customers' spending that is greater than we anticipate or a shift in funding priorities may also have a negative effect on future orders, sales, income and cash flows and we might be required to perform a quantitative assessment during fiscal 2019 or beyond. If assumed net sales and cash flow projections are not achieved in future periods or our common stock price significantly declines from current levels, our Commercial Solutions and Government Solutions reporting units could be at risk of failing the quantitative assessment and goodwill assigned to the respective reporting units could be impaired.
In any event, we are required to perform the next annual goodwill impairment analysis on August 1, 2019 (the start of our fiscal 2020). If our assumptions and related estimates change in the future, or if we change our reporting unit structure or other events and circumstances change (e.g., a sustained decrease in the price of our common stock (considered on both absolute terms and relative to peers)), we may be required to record impairment charges when we perform these tests, or in other future periods. Any impairment charges that we may record in the future could be material to our results of operations and financial condition.
F- 36
COMTECH TELECOMMUNICATIONS CORP. AND SUBSIDIARIES
Notes to Consolidated Financial Statements, Continued
(16)
Intangible Assets
Intangible assets with finite lives as of
July 31, 2018
and
2017
are as follows:
|
|
July 31, 2018
|
||||||||||||
|
|
Weighted Average
Amortization Period
|
Gross Carrying
Amount
|
Accumulated
Amortization
|
Net Carrying
Amount
|
|||||||||
|
Customer relationships
|
21.0
|
$
|
249,831,000
|
|
55,350,000
|
|
$
|
194,481,000
|
|
||||
|
Technologies
|
12.8
|
82,370,000
|
|
54,386,000
|
|
27,984,000
|
|
||||||
|
Trademarks and other
|
16.4
|
28,894,000
|
|
10,563,000
|
|
18,331,000
|
|
||||||
|
Total
|
|
$
|
361,095,000
|
|
120,299,000
|
|
$
|
240,796,000
|
|
||||
|
|
July 31, 2017
|
||||||||||||
|
|
Weighted Average
Amortization Period
|
Gross Carrying
Amount
|
Accumulated
Amortization
|
Net Carrying
Amount
|
|||||||||
|
Customer relationships
|
20.3
|
$
|
249,831,000
|
|
41,923,000
|
|
$
|
207,908,000
|
|
||||
|
Technologies
|
12.3
|
82,370,000
|
|
48,623,000
|
|
33,747,000
|
|
||||||
|
Trademarks and other
|
16.4
|
28,894,000
|
|
8,678,000
|
|
20,216,000
|
|
||||||
|
Total
|
|
$
|
361,095,000
|
|
99,224,000
|
|
$
|
261,871,000
|
|
||||
The weighted average amortization period in the above table excludes fully amortized intangible assets.
Amortization expense for the fiscal years ended
July 31, 2018
,
2017
and
2016
was
$21,075,000
,
$22,823,000
and
$13,415,000
, respectively.
The estimated amortization expense consists of the following for the fiscal years ending July 31:
|
2019
|
$
|
17,155,000
|
|
|
2020
|
17,155,000
|
|
|
|
2021
|
16,196,000
|
|
|
|
2022
|
14,955,000
|
|
|
|
2023
|
14,955,000
|
|
|
We review net intangible assets with finite lives for impairment when an event occurs indicating the potential for impairment. No such event has occurred during the fiscal year ended
July 31, 2018
. We believe that the carrying values of our net intangible assets were recoverable as of
July 31, 2018
. Any impairment charges that we may record in the future could be material to our results of operations and financial condition.
(17)
Stockholders’ Equity
Sale of Common Stock
In June 2016, the Company sold
7,145,000
shares of its common stock in a public offering at a price to the public of
$14.00
per share, resulting in proceeds to the Company of
$95,029,000
, net of underwriting discounts and commissions. During the fiscal year ended
July 31, 2016
, the Company recorded
$1,112,000
of total issuance costs related to this common stock offering,
$959,000
of which was a reduction to the additional paid-in capital included in the Consolidated Balance Sheet as of
July 31, 2016
. As of
July 31, 2018
and
September 26, 2018
, an aggregate registered amount of
$74,970,000
under the Company's existing shelf registration statement filed with the SEC remains available for sale of various types of securities, including debt.
Stock Repurchase Program
As of
July 31, 2018
and
September 26, 2018
, we were authorized to repurchase up to an additional
$8,664,000
of our common stock, pursuant to our current
$100,000,000
stock repurchase program. Our stock repurchase program has no time restrictions and repurchases may be made in open-market or privately negotiated transactions and may be made pursuant to SEC Rule 10b5-1 trading plans. There were
no
repurchases made during the fiscal years ended
July 31, 2018
or
2017
.
Dividends
Since September 2010, we have paid quarterly dividends pursuant to an annual targeted dividend amount that was established by our Board of Directors. On
September 27, 2017
,
December 6, 2017
,
March 7, 2018
and
June 6, 2018
, our Board of Directors declared a dividend of
$0.10
per common share, which were paid on
November 17, 2017
,
February 16, 2018
,
May 18, 2018
and
August 17, 2018
, respectively. On
September 26, 2018
, our Board of Directors declared a dividend of
$0.10
per common share, payable on
November 16, 2018
to stockholders of record at the close of business on
October 17, 2018
.
Future dividends remain subject to compliance with financial covenants under our Secured Credit Facility, as amended, as well as Board approval.
F- 37
COMTECH TELECOMMUNICATIONS CORP. AND SUBSIDIARIES
Notes to Consolidated Financial Statements, Continued
(18)
Unaudited Quarterly Financial Data
The following is a summary of unaudited quarterly operating results. Our historical results prior to February 23, 2016 do not include TCS; as such, you should not rely on period-to-period comparisons as an indicator of future performance as these comparisons may not be meaningful.
|
Fiscal 2018
|
First Quarter
|
Second Quarter
|
Third Quarter
|
Fourth Quarter
|
Total
|
|
|||||||||||||
|
Net sales
|
$
|
121,569,000
|
|
133,731,000
|
|
147,854,000
|
|
167,435,000
|
|
$
|
570,589,000
|
|
|
||||||
|
Gross profit
|
47,716,000
|
|
50,801,000
|
|
62,436,000
|
|
62,988,000
|
|
223,941,000
|
|
|
||||||||
|
Net (loss) income
|
(1,660,000
|
)
|
15,761,000
|
|
8,210,000
|
|
7,458,000
|
|
29,769,000
|
|
|
||||||||
|
Diluted (loss) income per share
|
(0.07
|
)
|
0.66
|
|
0.34
|
|
0.31
|
|
1.24
|
|
|||||||||
|
Fiscal 2017
|
First Quarter
|
Second Quarter
|
Third Quarter
|
Fourth Quarter
|
Total
|
|
|||||||||||||
|
Net sales
|
$
|
135,786,000
|
|
139,028,000
|
|
127,792,000
|
|
147,762,000
|
|
$
|
550,368,000
|
|
|
||||||
|
Gross profit
|
52,108,000
|
|
53,204,000
|
|
52,461,000
|
|
60,412,000
|
|
218,185,000
|
|
|
||||||||
|
Net (loss) income
|
(2,489,000
|
)
|
6,585,000
|
|
4,417,000
|
|
7,314,000
|
|
15,827,000
|
|
|
||||||||
|
Diluted (loss) income per share
|
(0.11
|
)
|
0.28
|
|
0.19
|
|
0.31
|
|
0.67
|
|
|||||||||
|
Fiscal 2016
|
First Quarter
|
Second Quarter
|
Third Quarter
|
Fourth Quarter
|
Total
|
|
|||||||||||||
|
Net sales
|
$
|
64,117,000
|
|
70,323,000
|
|
124,187,000
|
|
152,377,000
|
|
$
|
411,004,000
|
|
|
||||||
|
Gross profit
|
28,202,000
|
|
29,438,000
|
|
51,391,000
|
|
62,206,000
|
|
171,237,000
|
|
|
||||||||
|
Net income (loss)
|
1,439,000
|
|
2,476,000
|
|
(14,355,000
|
)
|
2,702,000
|
|
(7,738,000
|
)
|
|
||||||||
|
Diluted income (loss) per share
|
0.09
|
|
0.15
|
|
(0.89
|
)
|
0.14
|
|
(0.46
|
)
|
*
|
||||||||
* The per share information is computed independently for each quarter and the full year based on the respective weighted average number of common shares outstanding. Therefore, income per share information for the full fiscal year may not equal the total of the quarters within the year.
F- 38
Schedule II
COMTECH TELECOMMUNICATIONS CORP.
AND SUBSIDIARIES
Valuation and Qualifying Accounts and Reserves
Fiscal Years Ended July 31, 2018, 2017 and 2016
|
Column A
|
Column B
|
Column C Additions
|
Column D
|
|
Column E
|
||||||||||||||||||
|
Description
|
Balance at
beginning of
period
|
Charged to
cost and
expenses
|
|
Charged to
other accounts
- describe
|
Transfers
(deductions)
- describe
|
|
Balance at
end of
period
|
||||||||||||||||
|
Allowance for doubtful accounts receivable:
|
|
|
|
|
|
|
|
||||||||||||||||
|
Year ended July 31,
|
|
|
|
|
|
|
|
||||||||||||||||
|
2018
|
$
|
1,300,000
|
|
573,000
|
|
(A)
|
—
|
|
(112,000
|
)
|
(B)
|
$
|
1,761,000
|
|
|||||||||
|
2017
|
1,029,000
|
|
497,000
|
|
(A)
|
—
|
|
(226,000
|
)
|
(B)
|
1,300,000
|
|
|||||||||||
|
2016
|
1,206,000
|
|
907,000
|
|
(A)
|
—
|
|
(1,084,000
|
)
|
(B)
|
1,029,000
|
|
|||||||||||
|
Inventory reserves:
|
|
|
|
|
|
|
|
|
|
|
|
|
|||||||||||
|
Year ended July 31,
|
|
|
|
|
|
|
|
|
|
|
|
|
|||||||||||
|
2018
|
$
|
16,019,000
|
|
5,628,000
|
|
(C)
|
—
|
|
(4,220,000
|
)
|
(D)
|
$
|
17,427,000
|
|
|||||||||
|
2017
|
16,198,000
|
|
2,900,000
|
|
(C)
|
—
|
|
(3,079,000
|
)
|
(D)
|
16,019,000
|
|
|||||||||||
|
2016
|
16,904,000
|
|
2,780,000
|
|
(C)
|
—
|
|
(3,486,000
|
)
|
(D)
|
16,198,000
|
|
|||||||||||
|
Valuation allowance for deferred tax assets:
|
|
|
|
|
|
|
|
|
|
|
|
|
|||||||||||
|
Year ended July 31,
|
|
|
|
|
|
|
|
|
|
|
|
|
|||||||||||
|
2018
|
$
|
8,633,000
|
|
3,221,000
|
|
(E)
|
—
|
|
—
|
|
$
|
11,854,000
|
|
||||||||||
|
2017
|
9,624,000
|
|
324,000
|
|
(E)
|
121,000
|
|
(F)
|
(1,436,000
|
)
|
(F)
|
8,633,000
|
|
||||||||||
|
2016
|
4,442,000
|
|
524,000
|
|
(E)
|
4,658,000
|
|
(F)
|
—
|
|
9,624,000
|
|
|||||||||||
|
(A)
|
Provision for doubtful accounts.
|
|
(B)
|
Write-off of uncollectible receivables.
|
|
(C)
|
Provision for excess and obsolete inventory.
|
|
(D)
|
Write-off of inventory.
|
|
(E)
|
Change in valuation allowance.
|
|
(F)
|
Acquisition related valuation allowance charged to (deducted from) goodwill.
|
S- 1
TABLE OF CONTENTS
Part IItem 1. BusinessPart II -Item 7. Management's Discussion and Analysis Of Financial Condition and Results Of Operations - Business Outlook For FiscalPart II - Item 8. - Financial Statements and Supplementary DataItem 7. Management's Discussion and Analysis Of Financial Condition and Results Of Operations"Item 1A. Risk FactorsPart II - Item 8. - Financial Statements and Supplementary Data,Part II - Item 8. - Financial Statements and Supplementary DataItem 1B. Unresolved Staff CommentsItem 2. PropertiesItem 3. Legal ProceedingsPart II - Item 8. - Financial Statements and Supplementary Data,Item 4. Mine Safety DisclosuresPart IIItem 5. Market For Registrant S Common Equity, Related Stockholder Matters and Issuer Purchases Of Equity SecuritiesItem 6. Selected Consolidated Financial DataItem 7. Management S Discussion and Analysis OfItem 6. Selected Consolidated Financial Data - Non-gaap Financial Data"Item 7. Management S Discussion and Analysis Of Financial Condition and Results Of Operations - Comparison Of FiscalPart II Item 8. - Financial Statements and Supplementary Data,Item 7A. Quantitative and Qualitative Disclosures About Market RiskItem 8. Financial Statements and Supplementary DataItem 9. Changes in and Disagreements with Accountants onItem 9A. Controls and ProceduresItem 9B. Other InformationPart IIIItem 10. Directors, Executive Officers and Corporate GovernanceItem 11. Executive CompensationItem 12. Security Ownership Of Certain Beneficial OwnersItem 13. Certain Relationships and Related Transactions,Item 14. Principal Accounting Fees and ServicesPart IVItem 15. Exhibits, Financial Statement Schedules