|
|
|
|
|
|
|
|
|
|
|
|
|
|
|
|
|
|
|
|
|
|
|
|
|
|
|
|
|
|
|
|
|
|
|
|
|
|
|
|
|
|
|
|
|
|
|
|
|
|
|
|
|
|
|
|
Table of Contents
SECURITIES AND EXCHANGE COMMISSION
SECURITIES EXCHANGE ACT OF 1934
For the fiscal year ended December 31, 2009
OR
[ ] TRANSITION REPORT PURSUANT TO SECTION 13 OR 15(d) OF THE
SECURITIES EXCHANGE ACT OF 1934
For the transition period from to
| Delaware | 36-6169860 | |
| (State or other jurisdiction of | (I.R.S. Employer | |
| incorporation or organization) | Identification No.) | |
| 333 S. Wabash | ||
| Chicago, Illinois | 60604 | |
| (Address of principal executive offices) | (Zip Code) |
| Title of each class | Name of each exchange on which registered | |
| Common Stock | New York Stock Exchange | |
| with a par value | Chicago Stock Exchange | |
| of $2.50 per share |
None
| Item | Page | |||
| Number | Number | |||
|
|
||||
| 1. | 3 | |||
|
|
||||
| 1A. | 8 | |||
|
|
||||
| 1B. | 16 | |||
|
|
||||
| 2. | 16 | |||
|
|
||||
| 3. | 16 | |||
|
|
||||
| 4. | 16 | |||
|
|
||||
|
|
||||
| 5. | 17 | |||
|
|
||||
| 6. | 19 | |||
|
|
||||
| 7. | 20 | |||
|
|
||||
| 7A. | 56 | |||
|
|
||||
| 8. | 61 | |||
|
|
||||
| 9. | 144 | |||
|
|
||||
| 9A. | 144 | |||
|
|
||||
| 9B. | 144 | |||
|
|
||||
|
|
||||
| 10. | 145 | |||
|
|
||||
| 11. | 146 | |||
|
|
||||
| 12. | 146 | |||
|
|
||||
| 13. | 146 | |||
|
|
||||
| 14. | 146 | |||
|
|
||||
|
|
||||
| 15. | 147 |
2
Table of Contents
3
Table of Contents
4
Table of Contents
| Percent of Total | ||||||||||||
| Years ended December 31 | 2009 | 2008 | 2007 | |||||||||
|
California
|
9.1 | % | 9.2 | % | 9.5 | % | ||||||
|
New York
|
6.8 | 6.9 | 7.0 | |||||||||
|
Texas
|
6.6 | 6.2 | 6.1 | |||||||||
|
Florida
|
6.2 | 6.5 | 7.5 | |||||||||
|
Illinois
|
3.8 | 3.8 | 3.8 | |||||||||
|
New Jersey
|
3.7 | 3.8 | 3.7 | |||||||||
|
Missouri
|
3.6 | 3.1 | 2.9 | |||||||||
|
Pennsylvania
|
3.2 | 3.3 | 3.4 | |||||||||
|
All other states, countries or political subdivisions (a)
|
57.0 | 57.2 | 56.1 | |||||||||
|
|
||||||||||||
|
|
||||||||||||
|
Total
|
100.0 | % | 100.0 | % | 100.0 | % | ||||||
|
|
||||||||||||
| (a) |
No other individual state, country or political subdivision accounts for more than 3.0% of
direct written premiums.
|
5
Table of Contents
| Calendar Year Ended | 1999 (a) | 2000 | 2001 (b) | 2002 (c) | 2003 | 2004 | 2005 | 2006 | 2007 | 2008 | 2009 | |||||||||||||||||||||||||||||||||
| (In millions) | ||||||||||||||||||||||||||||||||||||||||||||
|
|
||||||||||||||||||||||||||||||||||||||||||||
|
Originally reported gross
reserves for unpaid claim
and claim adjustment
expenses
|
$ | 26,850 | $ | 26,510 | $ | 29,649 | $ | 25,719 | $ | 31,284 | $ | 31,204 | $ | 30,694 | $ | 29,459 | $ | 28,415 | $ | 27,475 | $ | 26,712 | ||||||||||||||||||||||
|
Originally reported ceded
recoverable
|
6,091 | 7,333 | 11,703 | 10,490 | 13,847 | 13,682 | 10,438 | 8,078 | 6,945 | 6,213 | 5,524 | |||||||||||||||||||||||||||||||||
|
|
||||||||||||||||||||||||||||||||||||||||||||
|
Originally reported net
reserves for unpaid claim
and claim adjustment
expenses
|
$ | 20,759 | $ | 19,177 | $ | 17,946 | $ | 15,229 | $ | 17,437 | $ | 17,522 | $ | 20,256 | $ | 21,381 | $ | 21,470 | $ | 21,262 | $ | 21,188 | ||||||||||||||||||||||
|
|
||||||||||||||||||||||||||||||||||||||||||||
|
|
||||||||||||||||||||||||||||||||||||||||||||
|
Cumulative net paid as of:
|
||||||||||||||||||||||||||||||||||||||||||||
|
One year later
|
$ | 6,547 | $ | 7,686 | $ | 5,981 | $ | 5,373 | $ | 4,382 | $ | 2,651 | $ | 3,442 | $ | 4,436 | $ | 4,308 | $ | 3,930 | $ | - | ||||||||||||||||||||||
|
Two years later
|
11,937 | 11,992 | 10,355 | 8,768 | 6,104 | 4,963 | 7,022 | 7,676 | 7,127 | - | - | |||||||||||||||||||||||||||||||||
|
Three years later
|
15,256 | 15,291 | 12,954 | 9,747 | 7,780 | 7,825 | 9,620 | 9,822 | - | - | - | |||||||||||||||||||||||||||||||||
|
Four years later
|
18,151 | 17,333 | 13,244 | 10,870 | 10,085 | 9,914 | 11,289 | - | - | - | - | |||||||||||||||||||||||||||||||||
|
Five years later
|
19,686 | 17,775 | 13,922 | 12,814 | 11,834 | 11,261 | - | - | - | - | - | |||||||||||||||||||||||||||||||||
|
Six years later
|
20,206 | 18,970 | 15,493 | 14,320 | 12,988 | - | - | - | - | - | - | |||||||||||||||||||||||||||||||||
|
Seven years later
|
21,231 | 20,297 | 16,769 | 15,291 | - | - | - | - | - | - | - | |||||||||||||||||||||||||||||||||
|
Eight years later
|
22,373 | 21,382 | 17,668 | - | - | - | - | - | - | - | - | |||||||||||||||||||||||||||||||||
|
Nine years later
|
23,276 | 22,187 | - | - | - | - | - | - | - | - | - | |||||||||||||||||||||||||||||||||
|
Ten years later
|
23,992 | - | - | - | - | - | - | - | - | - | - | |||||||||||||||||||||||||||||||||
|
|
||||||||||||||||||||||||||||||||||||||||||||
|
Net reserves re-estimated
as of:
|
||||||||||||||||||||||||||||||||||||||||||||
|
End of initial year
|
$ | 20,759 | $ | 19,177 | $ | 17,946 | $ | 15,229 | $ | 17,437 | $ | 17,522 | $ | 20,256 | $ | 21,381 | $ | 21,470 | $ | 21,262 | $ | 21,188 | ||||||||||||||||||||||
|
One year later
|
21,163 | 21,502 | 17,980 | 17,650 | 17,671 | 18,513 | 20,588 | 21,601 | 21,463 | 21,021 | - | |||||||||||||||||||||||||||||||||
|
Two years later
|
23,217 | 21,555 | 20,533 | 18,248 | 19,120 | 19,044 | 20,975 | 21,706 | 21,259 | - | - | |||||||||||||||||||||||||||||||||
|
Three years later
|
23,081 | 24,058 | 21,109 | 19,814 | 19,760 | 19,631 | 21,408 | 21,609 | - | - | - | |||||||||||||||||||||||||||||||||
|
Four years later
|
25,590 | 24,587 | 22,547 | 20,384 | 20,425 | 20,212 | 21,432 | - | - | - | - | |||||||||||||||||||||||||||||||||
|
Five years later
|
26,000 | 25,594 | 22,983 | 21,076 | 21,060 | 20,301 | - | - | - | - | - | |||||||||||||||||||||||||||||||||
|
Six years later
|
26,625 | 26,023 | 23,603 | 21,769 | 21,217 | - | - | - | - | - | - | |||||||||||||||||||||||||||||||||
|
Seven years later
|
27,009 | 26,585 | 24,267 | 21,974 | - | - | - | - | - | - | - | |||||||||||||||||||||||||||||||||
|
Eight years later
|
27,541 | 27,207 | 24,548 | - | - | - | - | - | - | - | - | |||||||||||||||||||||||||||||||||
|
Nine years later
|
28,035 | 27,510 | - | - | - | - | - | - | - | - | - | |||||||||||||||||||||||||||||||||
|
Ten years later
|
28,352 | - | - | - | - | - | - | - | - | - | - | |||||||||||||||||||||||||||||||||
|
|
||||||||||||||||||||||||||||||||||||||||||||
|
Total net (deficiency)
redundancy
|
$ | (7,593 | ) | $ | (8,333 | ) | $ | (6,602 | ) | $ | (6,745 | ) | $ | (3,780 | ) | $ | (2,779 | ) | $ | (1,176 | ) | $ | (228 | ) | $ | 211 | $ | 241 | $ | - | ||||||||||||||
|
|
||||||||||||||||||||||||||||||||||||||||||||
|
|
||||||||||||||||||||||||||||||||||||||||||||
|
Reconciliation to gross
re-estimated reserves:
|
||||||||||||||||||||||||||||||||||||||||||||
|
Net reserves re-estimated
|
$ | 28,352 | $ | 27,510 | $ | 24,548 | $ | 21,974 | $ | 21,217 | $ | 20,301 | $ | 21,432 | $ | 21,609 | $ | 21,259 | $ | 21,021 | $ | - | ||||||||||||||||||||||
|
Re-estimated ceded
recoverable
|
10,511 | 11,277 | 16,756 | 16,107 | 14,468 | 13,349 | 10,727 | 8,444 | 7,113 | 6,101 | - | |||||||||||||||||||||||||||||||||
|
|
||||||||||||||||||||||||||||||||||||||||||||
|
Total gross re-estimated
reserves
|
$ | 38,863 | $ | 38,787 | $ | 41,304 | $ | 38,081 | $ | 35,685 | $ | 33,650 | $ | 32,159 | $ | 30,053 | $ | 28,372 | $ | 27,122 | $ | - | ||||||||||||||||||||||
|
|
||||||||||||||||||||||||||||||||||||||||||||
|
|
||||||||||||||||||||||||||||||||||||||||||||
|
Total gross (deficiency)
redundancy
|
$ | (12,013 | ) | $ | (12,277 | ) | $ | (11,655 | ) | $ | (12,362 | ) | $ | (4,401 | ) | $ | (2,446 | ) | $ | (1,465 | ) | $ | (594 | ) | $ | 43 | $ | 353 | $ | - | ||||||||||||||
|
|
||||||||||||||||||||||||||||||||||||||||||||
|
|
||||||||||||||||||||||||||||||||||||||||||||
|
Net (deficiency)
redundancy related to:
|
||||||||||||||||||||||||||||||||||||||||||||
|
Asbestos claims
|
$ | (1,655 | ) | $ | (1,590 | ) | $ | (818 | ) | $ | (827 | ) | $ | (177 | ) | $ | (123 | ) | $ | (113 | ) | $ | (112 | ) | $ | (107 | ) | $ | (79 | ) | $ | - | ||||||||||||
|
Environmental claims
|
(691 | ) | (635 | ) | (288 | ) | (282 | ) | (209 | ) | (209 | ) | (159 | ) | (159 | ) | (159 | ) | (76 | ) | - | |||||||||||||||||||||||
|
|
||||||||||||||||||||||||||||||||||||||||||||
|
Total asbestos and
environmental
|
(2,346 | ) | (2,225 | ) | (1,106 | ) | (1,109 | ) | (386 | ) | (332 | ) | (272 | ) | (271 | ) | (266 | ) | (155 | ) | - | |||||||||||||||||||||||
|
Other claims
|
(5,247 | ) | (6,108 | ) | (5,496 | ) | (5,636 | ) | (3,394 | ) | (2,447 | ) | (904 | ) | 43 | 477 | 396 | - | ||||||||||||||||||||||||||
|
|
||||||||||||||||||||||||||||||||||||||||||||
|
Total net (deficiency)
redundancy
|
$ | (7,593 | ) | $ | (8,333 | ) | $ | (6,602 | ) | $ | (6,745 | ) | $ | (3,780 | ) | $ | (2,779 | ) | $ | (1,176 | ) | $ | (228 | ) | $ | 211 | $ | 241 | $ | - | ||||||||||||||
|
|
||||||||||||||||||||||||||||||||||||||||||||
6
Table of Contents
| (a) |
Ceded recoverable includes reserves transferred under retroactive reinsurance agreements of
$784 million as of December 31, 1999.
|
|
| (b) |
Effective January 1, 2001, we established a new life insurance company, CNA Group Life
Assurance Company (CNAGLA). Further, on January 1, 2001 $1,055 million of reserves were
transferred from CCC to CNAGLA.
|
|
| (c) |
Effective October 31, 2002, we sold CNA Reinsurance Company Limited. As a result of the
sale, net reserves were reduced by $1,316 million.
|
7
Table of Contents
8
Table of Contents
| • |
standards of solvency including risk-based capital measurements;
|
|
| • |
restrictions on the nature, quality and concentration of investments;
|
|
| • |
restrictions on our ability to withdraw from unprofitable lines of insurance or
unprofitable market areas;
|
|
| • |
the required use of certain methods of accounting and reporting;
|
|
| • |
the establishment of reserves for unearned premiums, losses and other purposes;
|
|
| • |
potential assessments for funds necessary to settle covered claims against impaired,
insolvent or failed private or quasi-governmental insurers;
|
|
| • |
licensing of insurers and agents;
|
|
| • |
approval of policy forms;
|
|
| • |
limitations on the ability of our insurance subsidiaries to pay dividends to us; and
|
|
| • |
limitations on the ability to non-renew, cancel or change terms and conditions in policies.
|
9
Table of Contents
10
Table of Contents
| • |
increases in the number and size of claims relating to injuries from various medical
products including pharmaceuticals;
|
|
| • |
the effects of recessionary economic conditions and financial reporting scandals, which
have resulted in an increase in the number and size of claims, due to corporate failures;
these claims include both directors and officers (D&O) and errors and omissions (E&O)
insurance claims;
|
|
| • |
class action litigation relating to claims handling and other practices;
|
|
| • |
construction defect claims, including claims for a broad range of additional insured
endorsements on policies;
|
|
| • |
clergy abuse claims, including passage of legislation to reopen or extend various statutes
of limitations; and
|
|
| • |
mass tort claims, including bodily injury claims related to welding rods, benzene, lead,
noise induced hearing loss and various other chemical and radiation exposure claims.
|
| • |
coverage issues including whether certain costs are covered under the policies and whether
policy limits apply;
|
|
| • |
inconsistent court decisions and developing legal theories;
|
|
| • |
continuing aggressive tactics of plaintiffs’ lawyers;
|
|
| • |
the risks and lack of predictability inherent in major litigation;
|
11
Table of Contents
| • |
changes in the frequency of asbestos and environmental pollution claims;
|
|
| • |
changes in the severity of claims including bodily injury claims for malignancies arising
out of exposure to asbestos;
|
|
| • |
the impact of the exhaustion of primary limits and the resulting increase in claims on any
umbrella or excess policies we have issued;
|
|
| • |
our ability to recover reinsurance for these claims; and
|
|
| • |
changes in the legal and legislative environment in which we operate.
|
| • |
inconsistency of court decisions and jury attitudes, as well as future court decisions;
|
|
| • |
interpretation of specific policy provisions;
|
|
| • |
allocation of liability among insurers and insureds;
|
|
| • |
missing policies and proof of coverage;
|
|
| • |
the proliferation of bankruptcy proceedings and attendant uncertainties;
|
|
| • |
novel theories asserted by policyholders and their legal counsel;
|
|
| • |
the targeting of a broader range of businesses and entities as defendants;
|
|
| • |
uncertainties in predicting the number of future claims and which other insureds may be
targeted in the future;
|
|
| • |
volatility in frequency of claims and severity of settlement demands;
|
|
| • |
increases in the number of non-impaired claimants and the extent to which they can be
precluded from making claims;
|
|
| • |
the efforts by insureds to obtain coverage that is not subject to aggregate limits;
|
|
| • |
the long latency period between asbestos exposure and disease manifestation, as well as the
resulting potential for involvement of multiple policy periods for individual claims;
|
|
| • |
medical inflation trends;
|
|
| • |
the mix of asbestos-related diseases presented; and
|
|
| • |
the ability to recover reinsurance.
|
12
Table of Contents
| • |
whether cleanup costs are considered damages under the policies (and accordingly whether we
would be liable for these costs);
|
|
| • |
the trigger of coverage and the allocation of liability among triggered policies;
|
|
| • |
the applicability of pollution exclusions and owned property exclusions;
|
|
| • |
the potential for joint and several liability; and
|
|
| • |
the definition of an occurrence.
|
13
Table of Contents
14
Table of Contents
15
Table of Contents
| Amount (Square Feet) of Building | ||||||
| Owned and Occupied or Leased | ||||||
| Location | and Occupied by CNA | Principal Usage | ||||
|
333 S. Wabash Avenue, Chicago, Illinois
|
803,728 | Principal executive offices of CNAF | ||||
|
401 Penn Street, Reading, Pennsylvania
|
171,318 | Property and casualty insurance offices | ||||
|
2405 Lucien Way, Maitland, Florida
|
121,959 | Property and casualty insurance offices | ||||
|
40 Wall Street, New York, New York
|
107,927 | Property and casualty insurance offices | ||||
|
1100 Ward Avenue, Honolulu, Hawaii
|
104,478 | Property and casualty insurance offices | ||||
|
101 S. Phillips Avenue, Sioux Falls, South Dakota
|
83,616 | Property and casualty insurance offices | ||||
|
600 N. Pearl Street, Dallas, Texas
|
70,790 | Property and casualty insurance offices | ||||
|
675 Placentia Avenue, Brea, California
|
63,538 | Property and casualty insurance offices | ||||
|
1249 S. River Road, Cranbury, New Jersey
|
56,100 | Property and casualty insurance offices | ||||
|
4267 Meridian Parkway, Aurora, Illinois
|
46,903 | Data center | ||||
16
Table of Contents
| 2009 | 2008 | |||||||||||||||||||||||
| Dividends | Dividends | |||||||||||||||||||||||
| High | Low | Declared | High | Low | Declared | |||||||||||||||||||
|
Quarter:
|
||||||||||||||||||||||||
|
First
|
$ | 17.43 | $ | 6.41 | - | $ | 35.04 | $ | 23.01 | $ | 0.15 | |||||||||||||
|
Second
|
17.59 | 8.83 | - | 32.15 | 24.34 | 0.15 | ||||||||||||||||||
|
Third
|
26.51 | 13.63 | - | 30.61 | 21.88 | 0.15 | ||||||||||||||||||
|
Fourth
|
25.01 | 20.48 | - | 26.70 | 8.50 | - | ||||||||||||||||||
17
Table of Contents
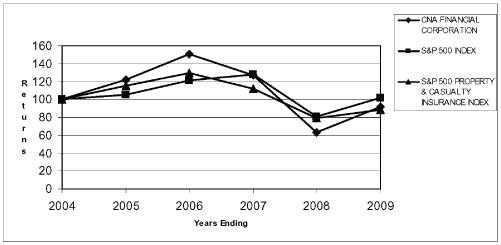
| Company / Index | 2004 | 2005 | 2006 | 2007 | 2008 | 2009 | ||||||||||||||||||
|
|
||||||||||||||||||||||||
|
CNA Financial Corporation
|
100.00 | 122.36 | 150.73 | 127.14 | 62.98 | 91.94 | ||||||||||||||||||
|
S&P 500 Index
|
100.00 | 104.91 | 121.48 | 128.16 | 80.74 | 102.11 | ||||||||||||||||||
|
S&P 500 Property & Casualty Insurance Index
|
100.00 | 115.11 | 129.93 | 111.79 | 78.91 | 88.65 |
18
Table of Contents
| As of and for the Years Ended | ||||||||||||||||||||
| December 31 | 2009 | 2008 | 2007 | 2006 | 2005 | |||||||||||||||
| (In millions, except per share data) | ||||||||||||||||||||
|
|
||||||||||||||||||||
|
Results of Operations:
|
||||||||||||||||||||
|
Revenues
|
$ | 8,472 | $ | 7,799 | $ | 9,885 | $ | 10,376 | $ | 9,862 | ||||||||||
|
|
||||||||||||||||||||
|
|
||||||||||||||||||||
|
Income (loss) from continuing
operations, net of tax
|
$ | 483 | $ | (251 | ) | $ | 905 | $ | 1,181 | $ | 267 | |||||||||
|
Income (loss) from discontinued
operations, net of tax
|
(2 | ) | 9 | (6 | ) | (29 | ) | 21 | ||||||||||||
|
Net income attributable to
noncontrolling interests, net of tax
|
(62 | ) | (57 | ) | (48 | ) | (44 | ) | (24 | ) | ||||||||||
|
|
||||||||||||||||||||
|
Net income (loss) attributable to CNA
|
$ | 419 | $ | (299 | ) | $ | 851 | $ | 1,108 | $ | 264 | |||||||||
|
|
||||||||||||||||||||
|
|
||||||||||||||||||||
|
Basic Earnings (Loss) Per Share
Attributable to CNA Common
Stockholders:
|
||||||||||||||||||||
|
Income (loss) from continuing
operations attributable to CNA
common stockholders
|
$ | 1.11 | $ | (1.21 | ) | $ | 3.15 | $ | 4.17 | $ | 0.68 | |||||||||
|
Income (loss) from discontinued
operations attributable to CNA
common stockholders
|
(0.01 | ) | 0.03 | (0.02 | ) | (0.11 | ) | 0.08 | ||||||||||||
|
|
||||||||||||||||||||
|
|
||||||||||||||||||||
|
Basic earnings (loss) per share
attributable to CNA common
stockholders
|
$ | 1.10 | $ | (1.18 | ) | $ | 3.13 | $ | 4.06 | $ | 0.76 | |||||||||
|
|
||||||||||||||||||||
|
|
||||||||||||||||||||
|
Diluted Earnings (Loss) Per Share
Attributable to CNA Common
Stockholders:
|
||||||||||||||||||||
|
Income (loss) from continuing
operations attributable to CNA
common stockholders
|
$ | 1.11 | $ | (1.21 | ) | $ | 3.15 | $ | 4.16 | $ | 0.68 | |||||||||
|
Income (loss) from discontinued
operations attributable to CNA
common stockholders
|
(0.01 | ) | 0.03 | (0.02 | ) | (0.11 | ) | 0.08 | ||||||||||||
|
|
||||||||||||||||||||
|
|
||||||||||||||||||||
|
Diluted earnings (loss) per share
attributable to CNA common
stockholders
|
$ | 1.10 | $ | (1.18 | ) | $ | 3.13 | $ | 4.05 | $ | 0.76 | |||||||||
|
|
||||||||||||||||||||
|
|
||||||||||||||||||||
|
Dividends declared per common share
|
$ | - | $ | 0.45 | $ | 0.35 | $ | - | $ | - | ||||||||||
|
|
||||||||||||||||||||
|
|
||||||||||||||||||||
|
Financial Condition:
|
||||||||||||||||||||
|
Total investments
|
$ | 41,996 | $ | 35,003 | $ | 41,789 | $ | 44,096 | $ | 39,695 | ||||||||||
|
Total assets
|
55,298 | 51,688 | 56,759 | 60,283 | 59,016 | |||||||||||||||
|
Insurance reserves
|
38,263 | 38,771 | 40,222 | 41,080 | 42,436 | |||||||||||||||
|
Long and short term debt
|
2,303 | 2,058 | 2,157 | 2,156 | 1,690 | |||||||||||||||
|
Total CNA stockholders’ equity
|
10,660 | 6,877 | 10,150 | 9,768 | 8,950 | |||||||||||||||
|
|
||||||||||||||||||||
|
Book value per common share
|
$ | 35.91 | $ | 20.92 | $ | 37.36 | $ | 36.03 | $ | 31.26 | ||||||||||
|
|
||||||||||||||||||||
|
Statutory Surplus:
|
||||||||||||||||||||
|
Combined Continental Casualty
Companies (a)
|
$ | 9,338 | (b) | $ | 7,819 | $ | 8,348 | $ | 8,056 | $ | 6,733 | |||||||||
|
Life company
|
448 | (b) | 487 | 471 | 687 | 627 | ||||||||||||||
| (a) |
Represents the combined statutory surplus of CCC and its subsidiaries, including the Life
company, as determined in accordance with statutory accounting practices as further discussed
in Note L of the Consolidated Financial Statements included under Item 8.
|
|
| (b) |
Preliminary results.
|
19
Table of Contents
| Page No. | ||||
|
Consolidated Operations
|
21 | |||
|
Critical Accounting Estimates
|
23 | |||
|
Reserves – Estimates and Uncertainties
|
25 | |||
|
|
||||
|
Segment Results
|
31 | |||
|
CNA Specialty
|
32 | |||
|
CNA Commercial
|
35 | |||
|
Life & Group Non-Core
|
38 | |||
|
Corporate & Other Non-Core
|
40 | |||
|
Asbestos and Environmental Pollution (A&E) Reserves
|
42 | |||
|
Investments
|
44 | |||
|
Net Investment Income
|
44 | |||
|
Net Realized Investment Gains (Losses)
|
45 | |||
|
Duration
|
47 | |||
|
Asset-Backed Exposure
|
48 | |||
|
Short Term Investments
|
48 | |||
|
Separate Accounts
|
49 | |||
|
Liquidity and Capital Resources
|
50 | |||
|
Cash Flows
|
50 | |||
|
Liquidity
|
51 | |||
|
Commitments, Contingencies and Guarantees
|
52 | |||
|
Ratings
|
52 | |||
|
Accounting Standards Update
|
53 | |||
|
Forward-Looking Statements
|
54 | |||
20
Table of Contents
| Years ended December 31 | 2009 | 2008 | 2007 | |||||||||
| (In millions, except per share data) | ||||||||||||
|
|
||||||||||||
|
Revenues
|
||||||||||||
|
Net earned premiums
|
$ | 6,721 | $ | 7,151 | $ | 7,484 | ||||||
|
Net investment income
|
2,320 | 1,619 | 2,433 | |||||||||
|
Other revenues
|
288 | 326 | 279 | |||||||||
|
|
||||||||||||
|
|
||||||||||||
|
Total operating revenues
|
9,329 | 9,096 | 10,196 | |||||||||
|
|
||||||||||||
|
|
||||||||||||
|
Claims, Benefits and Expenses
|
||||||||||||
|
Net incurred claims and benefits
|
5,267 | 5,703 | 5,995 | |||||||||
|
Policyholders’ dividends
|
23 | 20 | 14 | |||||||||
|
Amortization of deferred acquisition costs
|
1,417 | 1,467 | 1,520 | |||||||||
|
Other insurance related expenses
|
781 | 694 | 733 | |||||||||
|
Other expenses
|
444 | 477 | 401 | |||||||||
|
|
||||||||||||
|
|
||||||||||||
|
Total claims, benefits and expenses
|
7,932 | 8,361 | 8,663 | |||||||||
|
|
||||||||||||
|
|
||||||||||||
|
Operating income from continuing operations before income tax
|
1,397 | 735 | 1,533 | |||||||||
|
Income tax expense on operating income
|
(353 | ) | (145 | ) | (425 | ) | ||||||
|
Net operating income, after-tax, attributable to noncontrolling interests
|
(62 | ) | (57 | ) | (48 | ) | ||||||
|
|
||||||||||||
|
|
||||||||||||
|
Net operating income from continuing operations attributable to CNA
|
982 | 533 | 1,060 | |||||||||
|
|
||||||||||||
|
Net realized investment losses, net of participating policyholders’ interests
|
(857 | ) | (1,297 | ) | (311 | ) | ||||||
|
Income tax benefit on net realized investment losses
|
296 | 456 | 108 | |||||||||
|
Net realized investment (gains) losses, after-tax, attributable to
noncontrolling interests
|
- | - | - | |||||||||
|
|
||||||||||||
|
Net realized investment losses attributable to CNA
|
(561 | ) | (841 | ) | (203 | ) | ||||||
|
|
||||||||||||
|
Income (loss) from continuing operations attributable to CNA
|
421 | (308 | ) | 857 | ||||||||
|
|
||||||||||||
|
Income (loss) from discontinued operations attributable to CNA, net of
income tax (expense) benefit of $0, $9 and $0
|
(2 | ) | 9 | (6 | ) | |||||||
|
|
||||||||||||
|
|
||||||||||||
|
Net income (loss) attributable to CNA
|
$ | 419 | $ | (299 | ) | $ | 851 | |||||
|
|
||||||||||||
21
Table of Contents
22
Table of Contents
23
Table of Contents
24
Table of Contents
| • |
increases in the number and size of claims relating to injuries from various medical
products including pharmaceuticals;
|
||
| • |
the effects of recessionary economic conditions and financial reporting scandals, which
have resulted in an increase in the number and size of claims, due to corporate failures;
these claims include both directors and officers (D&O) and errors and omissions (E&O)
insurance claims;
|
||
| • |
class action litigation relating to claims handling and other practices;
|
||
| • |
construction defect claims, including claims for a broad range of additional insured
endorsements on policies;
|
||
| • |
clergy abuse claims, including passage of legislation to reopen or extend various
statutes of limitations; and
|
||
| • |
mass tort claims, including bodily injury claims related to welding rods, benzene,
lead, noise induced hearing loss and various other chemical and radiation exposure claims.
|
| • |
coverage issues, including whether certain costs are covered under the policies and
whether policy limits apply;
|
||
| • |
inconsistent court decisions and developing legal theories;
|
||
| • |
continuing aggressive tactics of plaintiffs’ lawyers;
|
||
| • |
the risks and lack of predictability inherent in major litigation;
|
||
| • |
changes in the frequency of A&E claims;
|
||
| • |
changes in the severity of claims, including bodily injury claims for malignancies
arising out of exposure to asbestos;
|
||
| • |
the impact of the exhaustion of primary limits and the resulting increase in claims on
any umbrella or excess policies we have issued;
|
||
| • |
our ability to recover reinsurance for A&E claims; and
|
25
Table of Contents
| • |
changes in the legal and legislative environment in which we operate.
|
26
Table of Contents
| • |
Paid Development,
|
||
| • |
Incurred Development,
|
||
| • |
Loss Ratio,
|
||
| • |
Bornhuetter-Ferguson Using Premiums and Paid Loss,
|
||
| • |
Bornhuetter-Ferguson Using Premiums and Incurred Loss,
|
||
| • |
Frequency times Severity, and
|
||
| • |
Stochastic modeling.
|
27
Table of Contents
28
Table of Contents
29
Table of Contents
30
Table of Contents
31
Table of Contents
32
Table of Contents
| Years ended December 31 | 2009 | 2008 | 2007 | |||||||||
| (In millions) | ||||||||||||
|
|
||||||||||||
|
Net written premiums
|
$ | 2,684 | $ | 2,719 | $ | 2,766 | ||||||
|
Net earned premiums
|
2,697 | 2,755 | 2,759 | |||||||||
|
Net investment income
|
526 | 354 | 493 | |||||||||
|
Net operating income
|
591 | 414 | 524 | |||||||||
|
Net realized investment losses, after-tax
|
(123 | ) | (167 | ) | (45 | ) | ||||||
|
Net income
|
468 | 247 | 479 | |||||||||
|
|
||||||||||||
|
Ratios
|
||||||||||||
|
Loss and loss adjustment expense
|
56.9 | % | 61.7 | % | 62.5 | % | ||||||
|
Expense
|
29.3 | 27.3 | 25.8 | |||||||||
|
Dividend
|
0.3 | 0.5 | 0.2 | |||||||||
|
|
||||||||||||
|
|
||||||||||||
|
Combined
|
86.5 | % | 89.5 | % | 88.5 | % | ||||||
|
|
||||||||||||
33
Table of Contents
Claim and Claim Adjustment Expense Reserves
| December 31 | 2009 | 2008 | ||||||
| (In millions) | ||||||||
|
|
||||||||
|
Gross Case Reserves
|
$ | 2,208 | $ | 2,105 | ||||
|
Gross IBNR Reserves
|
4,714 | 4,616 | ||||||
|
|
||||||||
|
|
||||||||
|
Total Gross Carried Claim and Claim Adjustment Expense Reserves
|
$ | 6,922 | $ | 6,721 | ||||
|
|
||||||||
|
|
||||||||
|
Net Case Reserves
|
$ | 1,781 | $ | 1,639 | ||||
|
Net IBNR Reserves
|
4,085 | 3,896 | ||||||
|
|
||||||||
|
|
||||||||
|
Total Net Carried Claim and Claim Adjustment Expense Reserves
|
$ | 5,866 | $ | 5,535 | ||||
|
|
||||||||
34
Table of Contents
| Years ended December 31 | 2009 | 2008 | 2007 | |||||||||
| (In millions) | ||||||||||||
|
|
||||||||||||
|
Net written premiums
|
$ | 3,448 | $ | 3,770 | $ | 4,007 | ||||||
|
Net earned premiums
|
3,432 | 3,787 | 4,104 | |||||||||
|
Net investment income
|
922 | 603 | 1,006 | |||||||||
|
Net operating income
|
506 | 289 | 697 | |||||||||
|
Net realized investment losses, after-tax
|
(232 | ) | (335 | ) | (105 | ) | ||||||
|
Net income (loss)
|
274 | (46 | ) | 592 | ||||||||
|
|
||||||||||||
|
Ratios
|
||||||||||||
|
Loss and loss adjustment expense
|
69.6 | % | 73.0 | % | 66.8 | % | ||||||
|
Expense
|
35.2 | 31.2 | 32.1 | |||||||||
|
Dividend
|
0.3 | - | 0.2 | |||||||||
|
|
||||||||||||
|
|
||||||||||||
|
Combined
|
105.1 | % | 104.2 | % | 99.1 | % | ||||||
|
|
||||||||||||
35
Table of Contents
Claim and Claim Adjustment Expense Reserves
| December 31 | 2009 | 2008 | ||||||
| (In millions) | ||||||||
|
|
||||||||
|
Gross Case Reserves
|
$ | 6,510 | $ | 6,772 | ||||
|
Gross IBNR Reserves
|
6,495 | 6,837 | ||||||
|
|
||||||||
|
|
||||||||
|
Total Gross Carried Claim and Claim Adjustment Expense Reserves
|
$ | 13,005 | $ | 13,609 | ||||
|
|
||||||||
|
|
||||||||
|
Net Case Reserves
|
$ | 5,269 | $ | 5,505 | ||||
|
Net IBNR Reserves
|
5,580 | 5,673 | ||||||
|
|
||||||||
|
|
||||||||
|
Total Net Carried Claim and Claim Adjustment Expense Reserves
|
$ | 10,849 | $ | 11,178 | ||||
|
|
||||||||
36
Table of Contents
37
Table of Contents
| Years ended December 31 | 2009 | 2008 | 2007 | |||||||||
| (In millions) | ||||||||||||
|
|
||||||||||||
|
Net earned premiums
|
$ | 595 | $ | 612 | $ | 618 | ||||||
|
Net investment income
|
664 | 484 | 622 | |||||||||
|
Net operating loss
|
(16 | ) | (108 | ) | (159 | ) | ||||||
|
Net realized investment losses, after-tax
|
(153 | ) | (236 | ) | (36 | ) | ||||||
|
Net loss
|
(169 | ) | (344 | ) | (195 | ) | ||||||
38
Table of Contents
39
Table of Contents
| Years ended December 31 | 2009 | 2008 | 2007 | |||||||||
| (In millions) | ||||||||||||
|
|
||||||||||||
|
Net investment income
|
$ | 208 | $ | 178 | $ | 312 | ||||||
|
Net operating loss
|
(99 | ) | (62 | ) | (2 | ) | ||||||
|
Net realized investment losses, after-tax
|
(53 | ) | (103 | ) | (17 | ) | ||||||
|
Net loss
|
(152 | ) | (165 | ) | (19 | ) | ||||||
Claim and Claim Adjustment Expense Reserves
| December 31 | 2009 | 2008 | ||||||
| (In millions) | ||||||||
|
|
||||||||
|
Gross Case Reserves
|
$ | 1,548 | $ | 1,823 | ||||
|
Gross IBNR Reserves
|
2,458 | 2,578 | ||||||
|
|
||||||||
|
|
||||||||
|
Total Gross Carried Claim and Claim Adjustment Expense Reserves
|
$ | 4,006 | $ | 4,401 | ||||
|
|
||||||||
|
|
||||||||
|
Net Case Reserves
|
$ | 972 | $ | 1,126 | ||||
|
Net IBNR Reserves
|
1,515 | 1,561 | ||||||
|
|
||||||||
|
|
||||||||
|
Total Net Carried Claim and Claim Adjustment Expense Reserves
|
$ | 2,487 | $ | 2,687 | ||||
|
|
||||||||
40
Table of Contents
41
Table of Contents
42
Table of Contents
43
Table of Contents
| Years ended December 31 | 2009 | 2008 | 2007 | |||||||||
| (In millions) | ||||||||||||
|
|
||||||||||||
|
Fixed maturity securities
|
$ | 1,941 | $ | 1,984 | $ | 2,047 | ||||||
|
Short term investments
|
36 | 115 | 186 | |||||||||
|
Limited partnerships
|
315 | (379 | ) | 183 | ||||||||
|
Equity securities
|
49 | 80 | 25 | |||||||||
|
Trading
portfolio – indexed group annuity
|
- | (146 | ) | 10 | ||||||||
|
Trading
portfolio – other
|
23 | (3 | ) | - | ||||||||
|
Other
|
6 | 19 | 35 | |||||||||
|
|
||||||||||||
|
|
||||||||||||
|
Gross investment income
|
2,370 | 1,670 | 2,486 | |||||||||
|
Investment expenses
|
(50 | ) | (51 | ) | (53 | ) | ||||||
|
|
||||||||||||
|
|
||||||||||||
|
Net investment income
|
$ | 2,320 | $ | 1,619 | $ | 2,433 | ||||||
|
|
||||||||||||
44
Table of Contents
| Years ended December 31 | 2009 | 2008 | 2007 | |||||||||
| (In millions) | ||||||||||||
|
|
||||||||||||
|
Fixed maturity securities:
|
||||||||||||
|
U.S. Treasury securities and obligations of government agencies
|
$ | (53 | ) | $ | 235 | $ | 86 | |||||
|
Corporate and other taxable bonds
|
(306 | ) | (643 | ) | (183 | ) | ||||||
|
States,
municipalities and political subdivisions – tax-exempt securities
|
(21 | ) | 53 | 3 | ||||||||
|
Asset-backed securities
|
(778 | ) | (476 | ) | (343 | ) | ||||||
|
Redeemable preferred stock
|
(9 | ) | - | (41 | ) | |||||||
|
|
||||||||||||
|
Total fixed maturity securities
|
(1,167 | ) | (831 | ) | (478 | ) | ||||||
|
|
||||||||||||
|
Equity securities
|
243 | (490 | ) | 117 | ||||||||
|
Derivative securities
|
51 | (19 | ) | 32 | ||||||||
|
Short term investments and other
|
16 | 43 | 18 | |||||||||
|
|
||||||||||||
|
|
||||||||||||
|
Realized investment losses, net of participating policyholders’ interests
|
(857 | ) | (1,297 | ) | (311 | ) | ||||||
|
Income tax benefit
|
296 | 456 | 108 | |||||||||
|
Realized investment (gains) losses, after-tax, attributable to noncontrolling interests
|
- | - | - | |||||||||
|
|
||||||||||||
|
|
||||||||||||
|
Net realized investment gains (losses) attributable to CNA
|
$ | (561 | ) | $ | (841 | ) | $ | (203 | ) | |||
|
|
||||||||||||
45
Table of Contents
| December 31 | 2009 | % | 2008 | % | ||||||||||||
| (In millions) | ||||||||||||||||
|
|
||||||||||||||||
|
U.S. Government and Agencies
|
$ | 3,705 | 10 | % | $ | 4,611 | 16 | % | ||||||||
|
AAA rated
|
5,855 | 17 | 8,494 | 29 | ||||||||||||
|
AA and A rated
|
12,464 | 35 | 8,166 | 29 | ||||||||||||
|
BBB rated
|
10,122 | 28 | 5,029 | 17 | ||||||||||||
|
Non-investment grade
|
3,466 | 10 | 2,587 | 9 | ||||||||||||
|
|
||||||||||||||||
|
|
||||||||||||||||
|
Total
|
$ | 35,612 | 100 | % | $ | 28,887 | 100 | % | ||||||||
|
|
||||||||||||||||
| December 31 | 2009 | % | 2008 | % | ||||||||||||
| (In millions) | ||||||||||||||||
|
BB
|
$ | 1,352 | 39 | % | $ | 1,585 | 61 | % | ||||||||
|
B
|
1,255 | 36 | 754 | 29 | ||||||||||||
|
CCC - C
|
761 | 22 | 232 | 9 | ||||||||||||
|
D
|
98 | 3 | 16 | 1 | ||||||||||||
|
|
||||||||||||||||
|
Total
|
$ | 3,466 | 100 | % | $ | 2,587 | 100 | % | ||||||||
|
|
||||||||||||||||
46
Table of Contents
| Percent of | Percent of | |||||||
| Fair Value | Unrealized Loss | |||||||
|
Due in one year or less
|
3 | % | 4 | % | ||||
|
Due after one year through five years
|
20 | 12 | ||||||
|
Due after five years through ten years
|
36 | 36 | ||||||
|
Due after ten years
|
41 | 48 | ||||||
|
|
||||||||
|
Total
|
100 | % | 100 | % | ||||
|
|
||||||||
| December 31, 2009 | December 31, 2008 | |||||||||||||||
| Effective Duration | Effective Duration | |||||||||||||||
| Fair Value | (In years) | Fair Value | (In years) | |||||||||||||
| (In millions) | ||||||||||||||||
|
|
||||||||||||||||
|
Segregated investments
|
$ | 10,376 | 11.2 | $ | 8,168 | 9.9 | ||||||||||
|
|
||||||||||||||||
|
Other interest sensitive investments
|
29,665 | 4.0 | 25,194 | 4.5 | ||||||||||||
|
|
||||||||||||||||
|
|
||||||||||||||||
|
Total
|
$ | 40,041 | 5.8 | $ | 33,362 | 5.8 | ||||||||||
|
|
||||||||||||||||
47
Table of Contents
| Security Type | ||||||||||||||||
| December 31, 2009 | RMBS (a) | CMBS (b) | Other ABS (c) | Total | ||||||||||||
| (In millions) | ||||||||||||||||
|
|
||||||||||||||||
|
U.S. Government Agencies
|
$ | 3,405 | $ | - | $ | - | $ | 3,405 | ||||||||
|
AAA
|
1,644 | 345 | 626 | 2,615 | ||||||||||||
|
AA
|
307 | 92 | 69 | 468 | ||||||||||||
|
A
|
250 | 81 | 35 | 366 | ||||||||||||
|
BBB
|
226 | 44 | 102 | 372 | ||||||||||||
|
Non-investment grade and equity tranches
|
1,105 | 22 | - | 1,127 | ||||||||||||
|
|
||||||||||||||||
|
Total Fair Value
|
$ | 6,937 | $ | 584 | $ | 832 | $ | 8,353 | ||||||||
|
|
||||||||||||||||
|
Total Amortized Cost
|
$ | 7,469 | $ | 709 | $ | 858 | $ | 9,036 | ||||||||
|
|
||||||||||||||||
|
|
||||||||||||||||
|
Sub-prime (included above)
|
||||||||||||||||
|
Fair Value
|
$ | 602 | $ | - | $ | - | $ | 602 | ||||||||
|
Amortized Cost
|
$ | 709 | $ | - | $ | - | $ | 709 | ||||||||
|
|
||||||||||||||||
|
Alt-A (included above)
|
||||||||||||||||
|
Fair Value
|
$ | 650 | $ | - | $ | - | $ | 650 | ||||||||
|
Amortized Cost
|
$ | 775 | $ | - | $ | - | $ | 775 | ||||||||
| (a) |
Residential mortgage-backed securities (RMBS)
|
|
| (b) |
Commercial mortgage-backed securities (CMBS)
|
|
| (c) |
Other asset-backed securities (Other ABS)
|
| December 31, | December 31, | |||||||
| 2009 | 2008 | |||||||
| (In millions) | ||||||||
|
|
||||||||
|
Short term investments available-for-sale:
|
||||||||
|
Commercial paper
|
$ | 185 | $ | 563 | ||||
|
U.S. Treasury securities
|
3,025 | 2,258 | ||||||
|
Money market funds
|
179 | 329 | ||||||
|
Other
|
560 | 384 | ||||||
|
|
||||||||
|
|
||||||||
|
Total short term investments
|
$ | 3,949 | $ | 3,534 | ||||
|
|
||||||||
48
Table of Contents
| December 31 | 2009 | % | 2008 | % | ||||||||||||
| (In millions) | ||||||||||||||||
|
|
||||||||||||||||
|
U.S. Government Agencies
|
$ | 67 | 18 | % | $ | 67 | 20 | % | ||||||||
|
AAA rated
|
17 | 5 | 53 | 15 | ||||||||||||
|
AA and A rated
|
176 | 46 | 148 | 43 | ||||||||||||
|
BBB rated
|
93 | 24 | 74 | 22 | ||||||||||||
|
Non-investment grade
|
27 | 7 | 1 | - | ||||||||||||
|
|
||||||||||||||||
|
|
||||||||||||||||
|
Total
|
$ | 380 | 100 | % | $ | 343 | 100 | % | ||||||||
|
|
||||||||||||||||
49
Table of Contents
50
Table of Contents
| • |
We do not anticipate changes in our core property and casualty commercial insurance
operations which would significantly impact liquidity and we continue to maintain reinsurance
contracts which limit the impact of potential catastrophic events.
|
|
| • |
We have entered into several settlement agreements and assumed reinsurance contracts that
require collateralization of future payment obligations and assumed reserves if our ratings or
other specific criteria fall below certain thresholds. The ratings triggers are generally
more than one level below our current ratings. A downgrade below our current ratings levels
would also result in additional collateral requirements for derivative contracts for which we
are in a liability position at any given point in time. The maximum potential
collateralization requirements are approximately $70 million.
|
|
| • |
As of December 31, 2009, our holding company held short term investments of $395 million.
Additionally, we have $100 million available through a revolving credit facility as of
December 31, 2009. Our holding company’s ability to meet its debt service and other
obligations is significantly dependent on receipt of dividends from our subsidiaries. The
payment of dividends to us by our insurance subsidiaries without prior approval of the
insurance department of each subsidiary’s domiciliary jurisdiction is limited by formula.
Notwithstanding this limitation, we believe that our holding company has sufficient liquidity
to fund our preferred stock dividend and debt service payments through 2010.
|
51
Table of Contents
| December 31, 2009 | More than 5 | |||||||||||||||||||
| Total | Less than 1 year | 1-3 years | 3-5 years | years | ||||||||||||||||
| (In millions) | ||||||||||||||||||||
|
|
||||||||||||||||||||
|
Debt (a)
|
$ | 3,338 | $ | 144 | $ | 884 | $ | 771 | $ | 1,539 | ||||||||||
|
Lease obligations
|
173 | 39 | 66 | 42 | 26 | |||||||||||||||
|
Claim and claim expense reserves (b)
|
28,310 | 6,042 | 7,347 | 4,061 | 10,860 | |||||||||||||||
|
Future policy benefits reserves (c)
|
12,505 | 177 | 337 | 326 | 11,665 | |||||||||||||||
|
Policyholder funds reserves (c)
|
155 | 19 | 9 | 7 | 120 | |||||||||||||||
|
Guaranteed payment contracts (d)
|
8 | 5 | 3 | - | - | |||||||||||||||
|
Preferred stock dividends (e)
|
500 | 100 | 200 | 200 | - | |||||||||||||||
|
|
||||||||||||||||||||
|
|
||||||||||||||||||||
|
Total (f)
|
$ | 44,989 | $ | 6,526 | $ | 8,846 | $ | 5,407 | $ | 24,210 | ||||||||||
|
|
||||||||||||||||||||
| (a) |
Includes estimated future interest payments.
|
|
| (b) |
Claim and claim adjustment expense reserves are not discounted and represent our estimate of
the amount and timing of the ultimate settlement and administration of gross claims based on
our assessment of facts and circumstances known as of December 31, 2009. See the Reserves –
Estimates and Uncertainties section of this MD&A for further information. Claim and claim
adjustment expense reserves of $19 million related to business which has been 100% ceded to
unaffiliated parties in connection with the sale of our individual life business in 2004 are
not included.
|
|
| (c) |
Future policy benefits and policyholder funds reserves are not discounted and represent our
estimate of the ultimate amount and timing of the settlement of benefits based on our
assessment of facts and circumstances known as of December 31, 2009. Future policy benefit
reserves of $777 million and policyholder fund reserves of $39 million related to business
which has been 100% ceded to unaffiliated parties in connection with the sale of our
individual life business in 2004 are not included. Additional information on future policy
benefits and policyholder funds reserves is included in Note A of the Consolidated Financial
Statements under Item 8.
|
|
| (d) |
Primarily relating to telecommunications and software services.
|
|
| (e) |
Our preferred stock has a minimum dividend rate of 10% due quarterly, if declared. We have
reflected the dividend payment in the table above for a period of 5 years, which may be more
or less than the actual period the preferred stock remains outstanding. As long as the amount
of preferred stock outstanding is $1.0 billion, the minimum dividend payment, if declared, is
$100 million a year.
|
|
| (f) |
Does not include expected estimated contribution of $73 million to the Company’s pension and
postretirement plans in 2010.
|
52
Table of Contents
| Insurance Financial Strength Ratings | Debt Ratings | |||||||
| Property & Casualty | Life | CNAF | Continental | |||||
| CCC Group | CAC | Senior Debt | Senior Debt | |||||
|
A.M. Best
|
A | A- | bbb | Not rated | ||||
|
Moody’s
|
A3 | Not rated | Baa3 | Baa3 | ||||
|
S&P
|
A- | Not rated | BBB- | BBB- | ||||
53
Table of Contents
| • |
conditions in the capital and credit markets including severe levels of
volatility, illiquidity, uncertainty and overall disruption, as well as sharply reduced
economic activity, that may impact the returns, types, liquidity and valuation of our
investments;
|
|
| • |
general economic and business conditions, including recessionary conditions that
may decrease the size and number of our insurance customers and create additional losses to
our lines of business, especially those that provide management and professional liability
insurance, as well as surety bonds, to businesses engaged in real estate, financial services
and professional services, and inflationary pressures on medical care costs, construction
costs and other economic sectors that increase the severity of claims;
|
|
| • |
the effects of the mergers and failures of a number of prominent financial
institutions and government sponsored entities, as well as the effects of accounting and
financial reporting scandals and other major failures in internal controls and governance, on
capital and credit markets, as well as on the markets for directors and officers and errors
and omissions coverages;
|
|
| • |
changes in foreign or domestic political, social and economic conditions;
|
|
| • |
regulatory initiatives and compliance with governmental regulations, judicial
decisions, including interpretation of policy provisions, decisions regarding coverage and
theories of liability, trends in litigation and the outcome of any litigation involving us,
and rulings and changes in tax laws and regulations;
|
|
| • |
regulatory limitations, impositions and restrictions upon us, including the
effects of assessments and other surcharges for guaranty funds and second-injury funds, other
mandatory pooling arrangements and future assessments levied on insurance companies and other
financial industry participants under the Emergency Economic Stabilization Act of 2008
recoupment provisions;
|
|
| • |
the impact of competitive products, policies and pricing and the competitive
environment in which we operate, including changes in our book of business;
|
|
| • |
product and policy availability and demand and market responses, including the
level of ability to obtain rate increases and decline or non-renew under priced accounts, to
achieve premium targets and profitability and to realize growth and retention estimates;
|
|
| • |
development of claims and the impact on loss reserves, including changes in claim
settlement policies;
|
|
| • |
the assertion of “public nuisance” theories of liability, pursuant to which
plaintiffs seek to recover monies spent to administer public health care programs and/or to
abate hazards to public health and safety;
|
|
| • |
the effectiveness of current initiatives by claims management to reduce loss and
expense ratios through more efficacious claims handling techniques;
|
|
| • |
the performance of reinsurance companies under reinsurance contracts with us;
|
|
| • |
conditions in the capital and credit markets that may limit our ability to raise
significant amounts of capital on favorable terms, as well as restrictions on the ability or
willingness of Loews to provide additional capital support to us;
|
54
Table of Contents
| • |
weather and other natural physical events, including the severity and frequency of
storms, hail, snowfall and other winter conditions, natural disasters such as hurricanes and
earthquakes, as well as climate change, including effects on weather patterns, greenhouse
gases, sea, land and air temperatures, sea levels, rain and snow;
|
|
| • |
regulatory requirements imposed by coastal state regulators in the wake of
hurricanes or other natural disasters, including limitations on the ability to exit markets or
to non-renew, cancel or change terms and conditions in policies, as well as mandatory
assessments to fund any shortfalls arising from the inability of quasi-governmental insurers
to pay claims;
|
|
| • |
man-made disasters, including the possible occurrence of terrorist attacks and the
effect of the absence or insufficiency of applicable terrorism legislation on coverages;
|
|
| • |
the unpredictability of the nature, targets, severity or frequency of potential
terrorist events, as well as the uncertainty as to our ability to contain our terrorism
exposure effectively, notwithstanding the extension through December 31, 2014 of the Terrorism
Risk Insurance Act of 2002;
|
|
| • |
the occurrence of epidemics;
|
|
| • |
exposure to liabilities due to claims made by insureds and others relating to
asbestos remediation and health-based asbestos impairments, as well as exposure to liabilities
for environmental pollution, construction defect claims and exposure to liabilities due to
claims made by insureds and others relating to lead-based paint and other mass torts;
|
|
| • |
the risks and uncertainties associated with our loss reserves, as outlined in the
Critical Accounting Estimates and the Reserves – Estimates and Uncertainties sections of this
MD&A, including the sufficiency of the reserves and the possibility for future increases;
|
|
| • |
regulatory limitations and restrictions, including limitations upon our ability to
receive dividends from our insurance subsidiaries imposed by state regulatory agencies and
minimum risk-based capital standards established by the National Association of Insurance
Commissioners;
|
|
| • |
the possibility of changes in our ratings by ratings agencies, including the
inability to access certain markets or distribution channels and the required
collateralization of future payment obligations as a result of such changes, and changes in
rating agency policies and practices; and
|
|
| • |
the actual closing of contemplated transactions and agreements.
|
55
Table of Contents
56
Table of Contents
| Market Risk Scenario 1 | ||||||||||||||||
| Increase (Decrease) | ||||||||||||||||
| Market | Interest | Currency | Equity | |||||||||||||
| December 31, 2009 | Value | Rate Risk | Risk | Risk | ||||||||||||
| (In millions) | ||||||||||||||||
|
|
||||||||||||||||
|
|
||||||||||||||||
|
General account:
|
||||||||||||||||
|
Fixed maturity securities available-for-sale:
|
||||||||||||||||
|
U.S. Treasury securities and obligations of government agencies
|
$ | 199 | $ | (5 | ) | $ | - | $ | - | |||||||
|
Asset-backed securities
|
8,353 | (232 | ) | (2 | ) | - | ||||||||||
|
States, municipalities and political subdivisions – tax-exempt
securities
|
6,993 | (687 | ) | - | - | |||||||||||
|
Corporate and other taxable bonds
|
19,839 | (1,155 | ) | (131 | ) | - | ||||||||||
|
Redeemable preferred stock
|
54 | (3 | ) | - | (2 | ) | ||||||||||
|
|
||||||||||||||||
|
|
||||||||||||||||
|
Total fixed maturity securities available-for-sale
|
35,438 | (2,082 | ) | (133 | ) | (2 | ) | |||||||||
|
|
||||||||||||||||
|
Fixed maturity securities trading
|
174 | (17 | ) | - | - | |||||||||||
|
Equity securities available-for-sale
|
644 | - | - | (65 | ) | |||||||||||
|
Short term investments available-for-sale
|
3,949 | (12 | ) | (32 | ) | - | ||||||||||
|
Limited partnerships
|
1,787 | 1 | - | (59 | ) | |||||||||||
|
Other invested assets
|
4 | 20 | - | - | ||||||||||||
|
|
||||||||||||||||
|
|
||||||||||||||||
|
Total general account
|
41,996 | (2,090 | ) | (165 | ) | (126 | ) | |||||||||
|
|
||||||||||||||||
|
|
||||||||||||||||
|
Separate accounts:
|
||||||||||||||||
|
Fixed maturity securities
|
380 | (15 | ) | - | - | |||||||||||
|
Equity securities
|
32 | - | - | (3 | ) | |||||||||||
|
Short term investments
|
6 | - | - | - | ||||||||||||
|
|
||||||||||||||||
|
|
||||||||||||||||
|
Total separate accounts
|
418 | (15 | ) | - | (3 | ) | ||||||||||
|
|
||||||||||||||||
|
|
||||||||||||||||
|
Derivative financial instruments, included in Other liabilities
|
(11 | ) | 1 | - | - | |||||||||||
|
|
||||||||||||||||
|
|
||||||||||||||||
|
Total securities
|
$ | 42,403 | $ | (2,104 | ) | $ | (165 | ) | $ | (129 | ) | |||||
|
|
||||||||||||||||
|
|
||||||||||||||||
|
Debt (carrying value)
|
$ | 2,303 | $ | (109 | ) | $ | - | $ | - | |||||||
|
|
||||||||||||||||
57
Table of Contents
| Market Risk Scenario 1 | ||||||||||||||||
| Increase (Decrease) | ||||||||||||||||
| Market | Interest | Currency | Equity | |||||||||||||
| December 31, 2008 | Value | Rate Risk | Risk | Risk | ||||||||||||
| (In millions) | ||||||||||||||||
|
|
||||||||||||||||
|
General account:
|
||||||||||||||||
|
Fixed maturity securities available-for-sale:
|
||||||||||||||||
|
U.S. Treasury securities and obligations of government agencies
|
$ | 2,930 | $ | (148 | ) | $ | - | $ | - | |||||||
|
Asset-backed securities
|
7,764 | (542 | ) | (2 | ) | - | ||||||||||
|
States, municipalities and political subdivisions – tax-exempt
securities
|
7,415 | (630 | ) | - | - | |||||||||||
|
Corporate and other taxable bonds
|
10,730 | (597 | ) | (97 | ) | - | ||||||||||
|
Redeemable preferred stock
|
47 | (2 | ) | - | (2 | ) | ||||||||||
|
|
||||||||||||||||
|
|
||||||||||||||||
|
Total fixed maturity securities available-for-sale
|
28,886 | (1,919 | ) | (99 | ) | (2 | ) | |||||||||
|
|
||||||||||||||||
|
Fixed maturity securities trading
|
1 | - | - | - | ||||||||||||
|
Equity securities available-for-sale
|
871 | - | (1 | ) | (87 | ) | ||||||||||
|
Short term investments available-for-sale
|
3,534 | (17 | ) | (13 | ) | - | ||||||||||
|
Limited partnerships
|
1,683 | 1 | - | (38 | ) | |||||||||||
|
Other invested assets
|
28 | - | - | - | ||||||||||||
|
|
||||||||||||||||
|
|
||||||||||||||||
|
Total general account
|
35,003 | (1,935 | ) | (113 | ) | (127 | ) | |||||||||
|
|
||||||||||||||||
|
|
||||||||||||||||
|
Separate accounts:
|
||||||||||||||||
|
Fixed maturity securities
|
343 | (17 | ) | - | - | |||||||||||
|
Equity securities
|
27 | - | - | (2 | ) | |||||||||||
|
Short term investments
|
7 | - | - | - | ||||||||||||
|
|
||||||||||||||||
|
|
||||||||||||||||
|
Total separate accounts
|
377 | (17 | ) | - | (2 | ) | ||||||||||
|
|
||||||||||||||||
|
|
||||||||||||||||
|
Derivative financial instruments, included in Other liabilities
|
(111 | ) | 90 | - | - | |||||||||||
|
|
||||||||||||||||
|
|
||||||||||||||||
|
Total securities
|
$ | 35,269 | $ | (1,862 | ) | $ | (113 | ) | $ | (129 | ) | |||||
|
|
||||||||||||||||
|
|
||||||||||||||||
|
Debt (carrying value)
|
$ | 2,058 | $ | (102 | ) | $ | - | $ | - | |||||||
|
|
||||||||||||||||
58
Table of Contents
| Market Risk Scenario 2 | ||||||||||||||||
| Increase (Decrease) | ||||||||||||||||
| Market | Interest | Currency | Equity | |||||||||||||
| December 31, 2009 | Value | Rate Risk | Risk | Risk | ||||||||||||
| (In millions) | ||||||||||||||||
|
|
||||||||||||||||
|
|
||||||||||||||||
|
General account:
|
||||||||||||||||
|
Fixed maturity securities available-for-sale:
|
||||||||||||||||
|
U.S. Treasury securities and obligations of government agencies
|
$ | 199 | $ | (7 | ) | $ | - | $ | - | |||||||
|
Asset-backed securities
|
8,353 | (318 | ) | (4 | ) | - | ||||||||||
|
States, municipalities and political subdivisions – tax-exempt
securities
|
6,993 | (994 | ) | - | - | |||||||||||
|
Corporate and other taxable bonds
|
19,839 | (1,677 | ) | (261 | ) | - | ||||||||||
|
Redeemable preferred stock
|
54 | (5 | ) | - | (5 | ) | ||||||||||
|
|
||||||||||||||||
|
|
||||||||||||||||
|
Total fixed maturity securities available-for-sale
|
35,438 | (3,001 | ) | (265 | ) | (5 | ) | |||||||||
|
|
||||||||||||||||
|
Fixed maturity securities trading
|
174 | (19 | ) | - | - | |||||||||||
|
Equity securities available-for-sale
|
644 | - | (1 | ) | (161 | ) | ||||||||||
|
Short term investments available-for-sale
|
3,949 | (19 | ) | (64 | ) | - | ||||||||||
|
Limited partnerships
|
1,787 | 1 | - | (148 | ) | |||||||||||
|
Other invested assets
|
4 | 30 | - | - | ||||||||||||
|
|
||||||||||||||||
|
|
||||||||||||||||
|
Total general account
|
41,996 | (3,008 | ) | (330 | ) | (314 | ) | |||||||||
|
|
||||||||||||||||
|
|
||||||||||||||||
|
Separate accounts:
|
||||||||||||||||
|
Fixed maturity securities
|
380 | (22 | ) | - | - | |||||||||||
|
Equity securities
|
32 | - | - | (8 | ) | |||||||||||
|
Short term investments
|
6 | - | - | - | ||||||||||||
|
|
||||||||||||||||
|
|
||||||||||||||||
|
Total separate accounts
|
418 | (22 | ) | - | (8 | ) | ||||||||||
|
|
||||||||||||||||
|
|
||||||||||||||||
|
Derivative financial instruments, included in Other liabilities
|
(11 | ) | - | - | - | |||||||||||
|
|
||||||||||||||||
|
|
||||||||||||||||
|
Total securities
|
$ | 42,403 | $ | (3,030 | ) | $ | (330 | ) | $ | (322 | ) | |||||
|
|
||||||||||||||||
|
|
||||||||||||||||
|
Debt (carrying value)
|
$ | 2,303 | $ | (160 | ) | $ | - | $ | - | |||||||
|
|
||||||||||||||||
59
Table of Contents
| Market Risk Scenario 2 | ||||||||||||||||
| Increase (Decrease) | ||||||||||||||||
| Market | Interest | Currency | Equity | |||||||||||||
| December 31, 2008 | Value | Rate Risk | Risk | Risk | ||||||||||||
| (In millions) | ||||||||||||||||
|
|
||||||||||||||||
|
|
||||||||||||||||
|
General account:
|
||||||||||||||||
|
Fixed maturity securities available-for-sale:
|
||||||||||||||||
|
U.S. Treasury securities and obligations of government
agencies
|
$ | 2,930 | $ | (215 | ) | $ | - | $ | - | |||||||
|
Asset-backed securities
|
7,764 | (845 | ) | (3 | ) | - | ||||||||||
|
States, municipalities and political subdivisions –
tax-exempt securities
|
7,415 | (907 | ) | - | - | |||||||||||
|
Corporate and other taxable bonds
|
10,730 | (865 | ) | (194 | ) | - | ||||||||||
|
Redeemable preferred stock
|
47 | (2 | ) | - | (5 | ) | ||||||||||
|
|
||||||||||||||||
|
|
||||||||||||||||
|
Total fixed maturity securities available-for-sale
|
28,886 | (2,834 | ) | (197 | ) | (5 | ) | |||||||||
|
|
||||||||||||||||
|
Fixed maturity securities trading
|
1 | - | - | - | ||||||||||||
|
Equity securities available-for-sale
|
871 | - | (2 | ) | (218 | ) | ||||||||||
|
Short term investments available-for-sale
|
3,534 | (29 | ) | (26 | ) | - | ||||||||||
|
Limited partnerships
|
1,683 | 1 | - | (94 | ) | |||||||||||
|
Other invested assets
|
28 | - | - | - | ||||||||||||
|
|
||||||||||||||||
|
|
||||||||||||||||
|
Total general account
|
35,003 | (2,862 | ) | (225 | ) | (317 | ) | |||||||||
|
|
||||||||||||||||
|
|
||||||||||||||||
|
Separate accounts:
|
||||||||||||||||
|
Fixed maturity securities
|
343 | (25 | ) | - | - | |||||||||||
|
Equity securities
|
27 | - | - | (7 | ) | |||||||||||
|
Short term investments
|
7 | - | - | - | ||||||||||||
|
|
||||||||||||||||
|
|
||||||||||||||||
|
Total separate accounts
|
377 | (25 | ) | - | (7 | ) | ||||||||||
|
|
||||||||||||||||
|
|
||||||||||||||||
|
Derivative financial instruments, included in Other liabilities
|
(111 | ) | 131 | - | - | |||||||||||
|
|
||||||||||||||||
|
|
||||||||||||||||
|
Total securities
|
$ | 35,269 | $ | (2,756 | ) | $ | (225 | ) | $ | (324 | ) | |||||
|
|
||||||||||||||||
|
|
||||||||||||||||
|
Debt (carrying value)
|
$ | 2,058 | $ | (149 | ) | $ | - | $ | - | |||||||
|
|
||||||||||||||||
60
Table of Contents
| Years ended December 31 | 2009 | 2008 | 2007 | |||||||||
| (In millions, except per share data) | ||||||||||||
|
|
||||||||||||
|
Revenues
|
||||||||||||
|
Net earned premiums
|
$ | 6,721 | $ | 7,151 | $ | 7,484 | ||||||
|
Net investment income
|
2,320 | 1,619 | 2,433 | |||||||||
|
Net realized investment losses, net of participating policyholders’ interests:
|
||||||||||||
|
Other-than-temporary impairment losses
|
(1,657 | ) | (1,484 | ) | (741 | ) | ||||||
|
Portion of other-than-temporary impairment losses recognized in Other
comprehensive income
|
305 | - | - | |||||||||
|
|
||||||||||||
|
|
||||||||||||
|
Net impairment losses recognized in earnings
|
(1,352 | ) | (1,484 | ) | (741 | ) | ||||||
|
Other net realized investment gains
|
495 | 187 | 430 | |||||||||
|
|
||||||||||||
|
|
||||||||||||
|
Net realized investment losses, net of participating policyholders’ interests
|
(857 | ) | (1,297 | ) | (311 | ) | ||||||
|
|
||||||||||||
|
Other revenues
|
288 | 326 | 279 | |||||||||
|
|
||||||||||||
|
|
||||||||||||
|
Total revenues
|
8,472 | 7,799 | 9,885 | |||||||||
|
|
||||||||||||
|
|
||||||||||||
|
Claims, Benefits and Expenses
|
||||||||||||
|
Insurance claims and policyholders’ benefits
|
5,290 | 5,723 | 6,009 | |||||||||
|
Amortization of deferred acquisition costs
|
1,417 | 1,467 | 1,520 | |||||||||
|
Other operating expenses
|
1,097 | 1,037 | 994 | |||||||||
|
Interest
|
128 | 134 | 140 | |||||||||
|
|
||||||||||||
|
|
||||||||||||
|
Total claims, benefits and expenses
|
7,932 | 8,361 | 8,663 | |||||||||
|
|
||||||||||||
|
|
||||||||||||
|
Income (loss) from continuing operations before income tax
|
540 | (562 | ) | 1,222 | ||||||||
|
Income tax (expense) benefit
|
(57 | ) | 311 | (317 | ) | |||||||
|
|
||||||||||||
|
|
||||||||||||
|
Income (loss) from continuing operations
|
483 | (251 | ) | 905 | ||||||||
|
Income (loss) from discontinued operations, net of income tax (expense)
benefit of $0, $9 and $0
|
(2 | ) | 9 | (6 | ) | |||||||
|
|
||||||||||||
|
|
||||||||||||
|
Net income (loss)
|
481 | (242 | ) | 899 | ||||||||
|
Net income attributable to noncontrolling interests
|
(62 | ) | (57 | ) | (48 | ) | ||||||
|
|
||||||||||||
|
|
||||||||||||
|
Net income (loss) attributable to CNA
|
$ | 419 | $ | (299 | ) | $ | 851 | |||||
|
|
||||||||||||
|
|
||||||||||||
|
Income (Loss) Attributable to CNA Common Stockholders
|
||||||||||||
|
|
||||||||||||
|
Income (loss) from continuing operations attributable to CNA
|
$ | 421 | $ | (308 | ) | $ | 857 | |||||
|
Dividends on 2008 Senior Preferred
|
(122 | ) | (19 | ) | - | |||||||
|
|
||||||||||||
|
|
||||||||||||
|
Income (loss) from continuing operations attributable to CNA common
stockholders
|
299 | (327 | ) | 857 | ||||||||
|
Income (loss) from discontinued operations attributable to CNA common
stockholders
|
(2 | ) | 9 | (6 | ) | |||||||
|
|
||||||||||||
|
|
||||||||||||
|
Income (loss) attributable to CNA common stockholders
|
$ | 297 | $ | (318 | ) | $ | 851 | |||||
|
|
||||||||||||
61
Table of Contents
| Years ended December 31 | 2009 | 2008 | 2007 | |||||||||
| (In millions, except per share data) | ||||||||||||
|
|
||||||||||||
|
Basic and Diluted Earnings (Loss)
Per Share Attributable to CNA
Common Stockholders
|
||||||||||||
|
|
||||||||||||
|
Income (loss) from continuing
operations attributable to CNA
common stockholders
|
$ | 1.11 | $ | (1.21 | ) | $ | 3.15 | |||||
|
Income (loss) from discontinued
operations attributable to CNA
common stockholders
|
(0.01 | ) | 0.03 | (0.02 | ) | |||||||
|
|
||||||||||||
|
|
||||||||||||
|
Basic and diluted earnings (loss)
per share attributable to CNA
common stockholders
|
$ | 1.10 | $ | (1.18 | ) | $ | 3.13 | |||||
|
|
||||||||||||
|
|
||||||||||||
|
Weighted Average Outstanding Common
Stock and Common Stock Equivalents
|
||||||||||||
|
|
||||||||||||
|
Basic
|
269.0 | 269.4 | 271.5 | |||||||||
|
|
||||||||||||
|
Diluted
|
269.1 | 269.4 | 271.8 | |||||||||
|
|
||||||||||||
62
Table of Contents
Consolidated Statements of Comprehensive Income (Loss)
| 2009 | 2008 | 2007 | ||||||||||||||||||||||
| Years ended December 31 | Tax | After-tax | Tax | After-tax | Tax | After-tax | ||||||||||||||||||
| (In millions) | ||||||||||||||||||||||||
|
|
||||||||||||||||||||||||
|
Changes in:
|
||||||||||||||||||||||||
|
Net unrealized losses on investments with
other-than-temporary impairments
|
$ | 52 | $ | (95 | ) | $ | - | $ | - | $ | - | $ | - | |||||||||||
|
Net unrealized gains (losses) on other
investments
|
(2,024 | ) | 3,741 | 1,926 | (3,553 | ) | 313 | (579 | ) | |||||||||||||||
|
|
||||||||||||||||||||||||
|
Net unrealized gains (losses) on investments
|
(1,972 | ) | 3,646 | 1,926 | (3,553 | ) | 313 | (579 | ) | |||||||||||||||
|
Net unrealized gains (losses) on discontinued
operations and other
|
(2 | ) | 9 | 6 | (6 | ) | 2 | 3 | ||||||||||||||||
|
Net foreign currency translation adjustment
|
- | 117 | - | (153 | ) | - | 30 | |||||||||||||||||
|
Net pension and postretirement benefit plans
|
(8 | ) | 15 | 194 | (363 | ) | (52 | ) | 97 | |||||||||||||||
|
Allocation to participating policyholders
|
- | (40 | ) | - | 32 | - | 5 | |||||||||||||||||
|
|
||||||||||||||||||||||||
|
|
||||||||||||||||||||||||
|
Other comprehensive income (loss)
|
$ | (1,982 | ) | 3,747 | $ | 2,126 | (4,043 | ) | $ | 263 | (444 | ) | ||||||||||||
|
|
||||||||||||||||||||||||
|
|
||||||||||||||||||||||||
|
Net income (loss)
|
481 | (242 | ) | 899 | ||||||||||||||||||||
|
|
||||||||||||||||||||||||
|
|
||||||||||||||||||||||||
|
Comprehensive income (loss)
|
4,228 | (4,285 | ) | 455 | ||||||||||||||||||||
|
|
||||||||||||||||||||||||
|
Changes in:
|
||||||||||||||||||||||||
|
Net unrealized (gains) losses on investments
attributable to noncontrolling interests
|
(24 | ) | 11 | - | ||||||||||||||||||||
|
Net pension and postretirement benefit plans
attributable to noncontrolling interests
|
(2 | ) | 5 | (2 | ) | |||||||||||||||||||
|
|
||||||||||||||||||||||||
|
Other comprehensive (income) loss attributable to
noncontrolling interests
|
(26 | ) | 16 | (2 | ) | |||||||||||||||||||
|
|
||||||||||||||||||||||||
|
Net income attributable to noncontrolling interests
|
(62 | ) | (57 | ) | (48 | ) | ||||||||||||||||||
|
|
||||||||||||||||||||||||
|
|
||||||||||||||||||||||||
|
Comprehensive income attributable to
noncontrolling interests
|
(88 | ) | (41 | ) | (50 | ) | ||||||||||||||||||
|
|
||||||||||||||||||||||||
|
|
||||||||||||||||||||||||
|
Total comprehensive income (loss) attributable
to CNA
|
$ | 4,140 | $ | (4,326 | ) | $ | 405 | |||||||||||||||||
|
|
||||||||||||||||||||||||
63
Table of Contents
Consolidated Balance Sheets
| December 31 | 2009 | 2008 | ||||||
| (In millions, except share data) | ||||||||
|
|
||||||||
|
Assets
|
||||||||
|
Investments:
|
||||||||
|
Fixed maturity securities at fair value (amortized cost of $35,602 and $34,155)
|
$ | 35,612 | $ | 28,887 | ||||
|
Equity securities at fair value (cost of $633 and $1,016)
|
644 | 871 | ||||||
|
Limited partnership investments
|
1,787 | 1,683 | ||||||
|
Other invested assets
|
4 | 28 | ||||||
|
Short term investments
|
3,949 | 3,534 | ||||||
|
|
||||||||
|
Total investments
|
41,996 | 35,003 | ||||||
|
Cash
|
140 | 85 | ||||||
|
Reinsurance receivables (less allowance for uncollectible receivables of $351 and $366)
|
6,581 | 7,395 | ||||||
|
Insurance receivables (less allowance for doubtful accounts of $202 and $221)
|
1,656 | 1,818 | ||||||
|
Accrued investment income
|
416 | 356 | ||||||
|
Receivables for securities sold and collateral
|
154 | 402 | ||||||
|
Deferred acquisition costs
|
1,108 | 1,125 | ||||||
|
Prepaid reinsurance premiums
|
188 | 237 | ||||||
|
Federal income tax recoverable (includes $320 and $299 due from Loews Corporation)
|
297 | 294 | ||||||
|
Deferred income taxes
|
1,333 | 3,493 | ||||||
|
Property and equipment at cost (less accumulated depreciation of $498 and $641)
|
360 | 393 | ||||||
|
Goodwill and other intangible assets
|
141 | 141 | ||||||
|
Other assets
|
505 | 562 | ||||||
|
Separate account business
|
423 | 384 | ||||||
|
|
||||||||
|
Total assets
|
$ | 55,298 | $ | 51,688 | ||||
|
|
||||||||
|
|
||||||||
|
Liabilities and Equity
|
||||||||
|
Liabilities:
|
||||||||
|
Insurance reserves:
|
||||||||
|
Claim and claim adjustment expenses
|
$ | 26,816 | $ | 27,593 | ||||
|
Unearned premiums
|
3,274 | 3,406 | ||||||
|
Future policy benefits
|
7,981 | 7,529 | ||||||
|
Policyholders’ funds
|
192 | 243 | ||||||
|
Payables for securities purchased
|
242 | 12 | ||||||
|
Participating policyholders’ funds
|
56 | 20 | ||||||
|
Long term debt
|
2,303 | 2,058 | ||||||
|
Reinsurance balances payable
|
281 | 316 | ||||||
|
Other liabilities
|
2,564 | 2,830 | ||||||
|
Separate account business
|
423 | 384 | ||||||
|
|
||||||||
|
Total liabilities
|
44,132 | 44,391 | ||||||
|
|
||||||||
|
|
||||||||
|
Commitments and contingencies (Notes B, C, F, G, I , and K)
|
||||||||
|
|
||||||||
|
Equity:
|
||||||||
|
Preferred stock (12,500,000 shares authorized)
2008 Senior Preferred (no par value; $100,000 stated value; 10,000 and 12,500 shares issued and outstanding held by Loews Corporation) |
1,000 | 1,250 | ||||||
|
Common stock ($2.50 par value; 500,000,000 shares
authorized; 273,040,243 shares issued; and 269,026,759
and 269,024,408 shares outstanding)
|
683 | 683 | ||||||
|
Additional paid-in capital
|
2,177 | 2,174 | ||||||
|
Retained earnings
|
7,264 | 6,845 | ||||||
|
Accumulated other comprehensive loss
|
(325 | ) | (3,924 | ) | ||||
|
Treasury stock (4,013,484 and 4,015,835 shares), at cost
|
(109 | ) | (109 | ) | ||||
|
Notes receivable for the issuance of common stock
|
(30 | ) | (42 | ) | ||||
|
|
||||||||
|
Total CNA stockholders’ equity
|
10,660 | 6,877 | ||||||
|
Noncontrolling interests
|
506 | 420 | ||||||
|
|
||||||||
|
Total equity
|
11,166 | 7,297 | ||||||
|
|
||||||||
|
Total liabilities and equity
|
$ | 55,298 | $ | 51,688 | ||||
|
|
||||||||
64
Table of Contents
Consolidated Statements of Cash Flows
| Years ended December 31 | 2009 | 2008 | 2007 | |||||||||
| (In millions) | ||||||||||||
|
|
||||||||||||
|
Cash Flows from Operating Activities:
|
||||||||||||
|
Net income (loss)
|
$ | 481 | $ | (242 | ) | $ | 899 | |||||
|
Adjustments to reconcile net income (loss) to net cash flows
provided by operating activities:
|
||||||||||||
|
(Income) loss from discontinued operations
|
2 | (9 | ) | 6 | ||||||||
|
Loss on disposal of property and equipment
|
14 | 1 | 1 | |||||||||
|
Deferred income tax expense (benefit)
|
177 | (174 | ) | (99 | ) | |||||||
|
Trading portfolio activity
|
(164 | ) | 644 | (12 | ) | |||||||
|
Net realized investment losses, net of participating
policyholders’ interests
|
857 | 1,297 | 311 | |||||||||
|
Undistributed losses (earnings) of equity method investees
|
(223 | ) | 446 | (99 | ) | |||||||
|
Net amortization of investment discount
|
(198 | ) | (278 | ) | (252 | ) | ||||||
|
Depreciation
|
86 | 78 | 64 | |||||||||
|
Changes in:
|
||||||||||||
|
Receivables, net
|
976 | 987 | 1,386 | |||||||||
|
Accrued investment income
|
(60 | ) | (26 | ) | (17 | ) | ||||||
|
Deferred acquisition costs
|
17 | 36 | 29 | |||||||||
|
Prepaid reinsurance premiums
|
49 | 33 | 72 | |||||||||
|
Federal income taxes recoverable/payable
|
(3 | ) | (287 | ) | (38 | ) | ||||||
|
Insurance reserves
|
(612 | ) | (590 | ) | (830 | ) | ||||||
|
Reinsurance balances payable
|
(35 | ) | (85 | ) | (138 | ) | ||||||
|
Other assets
|
53 | 13 | 42 | |||||||||
|
Other liabilities
|
(139 | ) | (287 | ) | (80 | ) | ||||||
|
Other, net
|
3 | 9 | 7 | |||||||||
|
|
||||||||||||
|
|
||||||||||||
|
Total adjustments
|
800 | 1,808 | 353 | |||||||||
|
|
||||||||||||
|
|
||||||||||||
|
Net cash flows provided by operating activities-continuing
operations
|
$ | 1,281 | $ | 1,566 | $ | 1,252 | ||||||
|
|
||||||||||||
|
Net cash flows used by operating activities-discontinued
operations
|
$ | (23 | ) | $ | (8 | ) | $ | (13 | ) | |||
|
|
||||||||||||
|
Net cash flows provided by operating activities-total
|
$ | 1,258 | $ | 1,558 | $ | 1,239 | ||||||
|
|
||||||||||||
|
|
||||||||||||
|
|
||||||||||||
|
|
||||||||||||
|
Cash Flows from Investing Activities:
|
||||||||||||
|
Purchases of fixed maturity securities
|
$ | (24,189 | ) | $ | (48,404 | ) | $ | (73,157 | ) | |||
|
Proceeds from fixed maturity securities:
|
||||||||||||
|
Sales
|
19,245 | 41,749 | 69,012 | |||||||||
|
Maturities, calls and redemptions
|
3,448 | 4,092 | 4,744 | |||||||||
|
Purchases of equity securities
|
(269 | ) | (205 | ) | (236 | ) | ||||||
|
Proceeds from sales of equity securities
|
901 | 220 | 340 | |||||||||
|
Change in short term investments
|
(327 | ) | 1,032 | 1,347 | ||||||||
|
Change in collateral on loaned securities and derivatives
|
(5 | ) | (57 | ) | (2,788 | ) | ||||||
|
Change in other investments
|
140 | (295 | ) | (168 | ) | |||||||
|
Purchases of property and equipment
|
(63 | ) | (104 | ) | (160 | ) | ||||||
|
Dispositions
|
- | - | 14 | |||||||||
|
Other, net
|
3 | 46 | (69 | ) | ||||||||
|
|
||||||||||||
|
|
||||||||||||
|
Net cash flows used by investing activities-continuing
operations
|
$ | (1,116 | ) | $ | (1,926 | ) | $ | (1,121 | ) | |||
|
|
||||||||||||
|
Net cash flows provided by investing activities-discontinued
operations
|
$ | 23 | $ | 18 | $ | 39 | ||||||
|
|
||||||||||||
|
Net cash flows used by investing activities-total
|
$ | (1,093 | ) | $ | (1,908 | ) | $ | (1,082 | ) | |||
|
|
||||||||||||
65
Table of Contents
| 2009 | 2008 | 2007 | ||||||||||
|
Cash Flows from Financing Activities:
|
||||||||||||
|
Dividends paid to Loews for 2008 Senior Preferred
|
$ | (122 | ) | $ | (19 | ) | $ | - | ||||
|
Dividends paid to common stockholders
|
- | (122 | ) | (95 | ) | |||||||
|
Proceeds from the issuance of debt
|
350 | 250 | - | |||||||||
|
Principal payments on debt
|
(100 | ) | (350 | ) | - | |||||||
|
Return of investment contract account balances
|
(15 | ) | (607 | ) | (122 | ) | ||||||
|
Receipts on investment contract account balances
|
4 | 3 | 3 | |||||||||
|
Payment to redeem 2008 Senior Preferred
|
(250 | ) | - | - | ||||||||
|
Proceeds from the issuance of 2008 Senior Preferred
|
- | 1,250 | - | |||||||||
|
Stock options exercised
|
1 | 1 | 18 | |||||||||
|
Purchase of treasury stock
|
- | (70 | ) | - | ||||||||
|
Other, net
|
12 | 11 | 11 | |||||||||
|
|
||||||||||||
|
|
||||||||||||
|
Net cash flows provided (used) by financing
activities-continuing operations
|
$ | (120 | ) | $ | 347 | $ | (185 | ) | ||||
|
|
||||||||||||
|
Net cash flows provided (used) by financing
activities-discontinued operations
|
$ | - | $ | - | $ | - | ||||||
|
|
||||||||||||
|
Net cash flows provided (used) by financing activities-total
|
$ | (120 | ) | $ | 347 | $ | (185 | ) | ||||
|
|
||||||||||||
|
|
||||||||||||
|
Effect of foreign exchange rate changes on cash-continuing
operations
|
10 | (13 | ) | 5 | ||||||||
|
|
||||||||||||
|
|
||||||||||||
|
Net change in cash
|
55 | (16 | ) | (23 | ) | |||||||
|
Net cash transactions from continuing operations to
discontinued operations
|
- | 17 | 59 | |||||||||
|
Net cash transactions from discontinued operations to
continuing operations
|
- | (17 | ) | (59 | ) | |||||||
|
|
||||||||||||
|
|
||||||||||||
|
|
||||||||||||
|
|
||||||||||||
|
Cash, beginning of year
|
85 | 101 | 124 | |||||||||
|
|
||||||||||||
|
|
||||||||||||
|
Cash, end of year
|
$ | 140 | $ | 85 | $ | 101 | ||||||
|
|
||||||||||||
|
|
||||||||||||
|
|
||||||||||||
|
Cash-continuing operations
|
$ | 140 | $ | 85 | $ | 94 | ||||||
|
Cash-discontinued operations
|
- | - | 7 | |||||||||
|
|
||||||||||||
|
Cash-total
|
$ | 140 | $ | 85 | $ | 101 | ||||||
|
|
||||||||||||
66
Table of Contents
Consolidated Statements of Stockholders’ Equity
| Years ended December 31 | 2009 | 2008 | 2007 | |||||||||
| (In millions) | ||||||||||||
|
Preferred Stock
|
||||||||||||
|
Balance, beginning of period
|
$ | 1,250 | $ | - | $ | - | ||||||
|
Issuance of 2008 Senior Preferred
|
- | 1,250 | - | |||||||||
|
Redemption of 2008 Senior Preferred
|
(250 | ) | - | - | ||||||||
|
|
||||||||||||
|
|
||||||||||||
|
Balance, end of period
|
1,000 | 1,250 | - | |||||||||
|
|
||||||||||||
|
|
||||||||||||
|
Common Stock
|
||||||||||||
|
Balance, beginning and end of period
|
683 | 683 | 683 | |||||||||
|
|
||||||||||||
|
Additional Paid-in Capital
|
||||||||||||
|
Balance, beginning of period
|
2,174 | 2,169 | 2,166 | |||||||||
|
Stock based compensation and other
|
3 | 5 | 3 | |||||||||
|
|
||||||||||||
|
|
||||||||||||
|
Balance, end of period
|
2,177 | 2,174 | 2,169 | |||||||||
|
|
||||||||||||
|
|
||||||||||||
|
Retained Earnings
|
||||||||||||
|
Balance, beginning of period
|
6,845 | 7,285 | 6,529 | |||||||||
|
Cumulative effect adjustment from change in
other-than-temporary impairment accounting guidance
|
122 | - | - | |||||||||
|
Dividends paid to common stockholders
|
- | (122 | ) | (95 | ) | |||||||
|
Dividends paid to Loews Corporation for 2008 Senior Preferred
|
(122 | ) | (19 | ) | - | |||||||
|
Net income (loss) attributable to CNA
|
419 | (299 | ) | 851 | ||||||||
|
|
||||||||||||
|
Balance, end of period
|
7,264 | 6,845 | 7,285 | |||||||||
|
|
||||||||||||
|
|
||||||||||||
|
Accumulated Other Comprehensive Income (Loss)
|
||||||||||||
|
Balance, beginning of period
|
(3,924 | ) | 103 | 549 | ||||||||
|
Cumulative effect adjustment from change in
other-than-temporary impairment accounting guidance
|
(122 | ) | - | - | ||||||||
|
Other comprehensive income (loss) attributable to CNA
|
3,721 | (4,027 | ) | (446 | ) | |||||||
|
|
||||||||||||
|
|
||||||||||||
|
Balance, end of period
|
(325 | ) | (3,924 | ) | 103 | |||||||
|
|
||||||||||||
|
|
||||||||||||
|
Treasury Stock
|
||||||||||||
|
Balance, beginning of period
|
(109 | ) | (39 | ) | (58 | ) | ||||||
|
Purchase of treasury stock
|
- | (70 | ) | - | ||||||||
|
Stock options exercised
|
- | - | 19 | |||||||||
|
|
||||||||||||
|
|
||||||||||||
|
Balance, end of period
|
(109 | ) | (109 | ) | (39 | ) | ||||||
|
|
||||||||||||
|
|
||||||||||||
|
Notes Receivable for the Issuance of Common Stock
|
||||||||||||
|
Balance, beginning of period
|
(42 | ) | (51 | ) | (58 | ) | ||||||
|
Decrease in notes receivable for the issuance of common stock
|
12 | 9 | 7 | |||||||||
|
|
||||||||||||
|
|
||||||||||||
|
Balance, end of period
|
(30 | ) | (42 | ) | (51 | ) | ||||||
|
|
||||||||||||
|
|
||||||||||||
|
Total CNA Stockholders’ Equity
|
10,660 | 6,877 | 10,150 | |||||||||
|
|
||||||||||||
|
|
||||||||||||
|
Noncontrolling Interests
|
||||||||||||
|
Balance, beginning of period
|
420 | 385 | 335 | |||||||||
|
Net income
|
62 | 57 | 48 | |||||||||
|
Other comprehensive income (loss)
|
26 | (16 | ) | 2 | ||||||||
|
Other
|
(2 | ) | (6 | ) | - | |||||||
|
|
||||||||||||
|
|
||||||||||||
|
Balance, end of period
|
506 | 420 | 385 | |||||||||
|
|
||||||||||||
|
|
||||||||||||
|
Total Equity
|
$ | 11,166 | $ | 7,297 | $ | 10,535 | ||||||
|
|
||||||||||||
67
Table of Contents
68
Table of Contents
69
Table of Contents
70
Table of Contents
| December 31, 2009 | Number of Life | Fair Value of Life Settlement | Face Amount of Life Insurance | |||||||||
| Settlement Contracts | Contracts | Policies | ||||||||||
| (In millions) | (In millions) | |||||||||||
|
|
||||||||||||
|
Estimated maturity during:
|
||||||||||||
|
2010
|
100 | $ | 17 | $ | 53 | |||||||
|
2011
|
90 | 15 | 49 | |||||||||
|
2012
|
90 | 13 | 46 | |||||||||
|
2013
|
80 | 11 | 44 | |||||||||
|
2014
|
80 | 10 | 41 | |||||||||
|
Thereafter
|
817 | 64 | 443 | |||||||||
|
|
||||||||||||
|
Total
|
1,257 | $ | 130 | $ | 676 | |||||||
|
|
||||||||||||
71
Table of Contents
72
Table of Contents
73
Table of Contents
74
Table of Contents
75
Table of Contents
76
Table of Contents
| Years ended December 31 | 2009 | 2008 | 2007 | |||||||||
| (In millions) | ||||||||||||
|
|
||||||||||||
|
Fixed maturity securities
|
$ | 1,941 | $ | 1,984 | $ | 2,047 | ||||||
|
Short term investments
|
36 | 115 | 186 | |||||||||
|
Limited partnerships
|
315 | (379 | ) | 183 | ||||||||
|
Equity securities
|
49 | 80 | 25 | |||||||||
|
Trading portfolio – indexed group annuity (a)
|
- | (146 | ) | 10 | ||||||||
|
Trading portfolio – other (b)
|
23 | (3 | ) | - | ||||||||
|
Other
|
6 | 19 | 35 | |||||||||
|
|
||||||||||||
|
|
||||||||||||
|
Gross investment income
|
2,370 | 1,670 | 2,486 | |||||||||
|
Investment expenses
|
(50 | ) | (51 | ) | (53 | ) | ||||||
|
|
||||||||||||
|
|
||||||||||||
|
Net investment income
|
$ | 2,320 | $ | 1,619 | $ | 2,433 | ||||||
|
|
||||||||||||
| Years ended December 31 | 2009 | 2008 | 2007 | |||||||||
| (In millions) | ||||||||||||
|
|
||||||||||||
|
Net realized investment gains (losses):
|
||||||||||||
|
|
||||||||||||
|
Fixed maturity securities:
|
||||||||||||
|
Gross realized gains
|
$ | 500 | $ | 532 | $ | 486 | ||||||
|
Gross realized losses
|
(1,667 | ) | (1,363 | ) | (964 | ) | ||||||
|
|
||||||||||||
|
|
||||||||||||
|
Net realized investment losses on fixed maturity securities
|
(1,167 | ) | (831 | ) | (478 | ) | ||||||
|
|
||||||||||||
|
Equity securities:
|
||||||||||||
|
Gross realized gains
|
473 | 22 | 146 | |||||||||
|
Gross realized losses
|
(230 | ) | (512 | ) | (29 | ) | ||||||
|
|
||||||||||||
|
|
||||||||||||
|
Net realized investment gains (losses) on equity securities
|
243 | (490 | ) | 117 | ||||||||
|
|
||||||||||||
|
Derivatives
|
51 | (19 | ) | 32 | ||||||||
|
Short term investments and other
|
16 | 43 | 18 | |||||||||
|
|
||||||||||||
|
|
||||||||||||
|
Net realized investment losses, net of participating policyholders’ interests
|
$ | (857 | ) | $ | (1,297 | ) | $ | (311 | ) | |||
|
|
||||||||||||
77
Table of Contents
| Years ended December 31 | 2009 | 2008 | 2007 | |||||||||
| (In millions) | ||||||||||||
|
|
||||||||||||
|
Net change in unrealized losses on investments:
|
||||||||||||
|
Fixed maturity securities
|
$ | 5,278 | $ | (5,137 | ) | $ | (847 | ) | ||||
|
Equity securities
|
156 | (347 | ) | (47 | ) | |||||||
|
Other
|
(4 | ) | 5 | 2 | ||||||||
|
|
||||||||||||
|
|
||||||||||||
|
Total net change in unrealized gains (losses) on investments
|
$ | 5,430 | $ | (5,479 | ) | $ | (892 | ) | ||||
|
|
||||||||||||
| Years ended December 31 | 2009 | 2008 | 2007 | |||||||||
| (In millions) | ||||||||||||
|
|
||||||||||||
|
Fixed maturity securities available-for-sale:
|
||||||||||||
|
|
||||||||||||
|
U.S Treasury securities and obligations of government agencies
|
$ | - | $ | 29 | $ | 53 | ||||||
|
|
||||||||||||
|
Asset-backed securities:
|
||||||||||||
|
Residential mortgage-backed securities
|
461 | 222 | 209 | |||||||||
|
Commercial mortgage-backed securities
|
193 | 208 | 65 | |||||||||
|
Other asset-backed securities
|
31 | 35 | 37 | |||||||||
|
|
||||||||||||
|
Total asset-backed securities
|
685 | 465 | 311 | |||||||||
|
|
||||||||||||
|
States, municipalities and political subdivisions – tax-exempt securities
|
79 | 1 | 50 | |||||||||
|
Corporate and other taxable bonds
|
357 | 585 | 260 | |||||||||
|
Redeemable preferred stock
|
9 | 1 | 42 | |||||||||
|
|
||||||||||||
|
|
||||||||||||
|
Total fixed maturity securities available-for-sale
|
1,130 | 1,081 | 716 | |||||||||
|
|
||||||||||||
|
|
||||||||||||
|
Equity securities available-for-sale:
|
||||||||||||
|
Common stock
|
5 | 140 | 24 | |||||||||
|
Preferred stock
|
217 | 263 | 1 | |||||||||
|
|
||||||||||||
|
|
||||||||||||
|
Total equity securities available-for-sale
|
222 | 403 | 25 | |||||||||
|
|
||||||||||||
|
|
||||||||||||
|
Net OTTI losses recognized in earnings
|
$ | 1,352 | $ | 1,484 | $ | 741 | ||||||
|
|
||||||||||||
78
Table of Contents
79
Table of Contents
| Cost or | Gross | Gross Unrealized Losses | Estimated | Unrealized | ||||||||||||||||||||
| Amortized | Unrealized | Less than | 12 Months | Fair | OTTI | |||||||||||||||||||
| December 31, 2009 | Cost | Gains | 12 Months | or Greater | Value | Losses | ||||||||||||||||||
| (In millions) | ||||||||||||||||||||||||
|
|
||||||||||||||||||||||||
|
Fixed maturity securities available-for-sale:
|
||||||||||||||||||||||||
|
U.S. Treasury securities and obligations of
government agencies
|
$ | 184 | $ | 16 | $ | 1 | $ | - | $ | 199 | $ | - | ||||||||||||
|
|
||||||||||||||||||||||||
|
Asset-backed securities:
|
||||||||||||||||||||||||
|
Residential mortgage-backed securities
|
7,469 | 72 | 43 | 561 | 6,937 | 246 | ||||||||||||||||||
|
Commercial mortgage-backed
securities
|
709 | 10 | 1 | 134 | 584 | 3 | ||||||||||||||||||
|
Other asset-backed securities
|
858 | 14 | 1 | 39 | 832 | - | ||||||||||||||||||
|
|
||||||||||||||||||||||||
|
Total asset-backed securities
|
9,036 | 96 | 45 | 734 | 8,353 | 249 | ||||||||||||||||||
|
|
||||||||||||||||||||||||
|
States, municipalities and political
subdivisions – tax-exempt securities
|
7,142 | 201 | 25 | 325 | 6,993 | - | ||||||||||||||||||
|
Corporate and other taxable bonds
|
19,015 | 1,123 | 50 | 249 | 19,839 | 26 | ||||||||||||||||||
|
Redeemable preferred stock
|
51 | 4 | - | 1 | 54 | - | ||||||||||||||||||
|
|
||||||||||||||||||||||||
|
|
||||||||||||||||||||||||
|
Total fixed maturity securities available-for-sale
|
35,428 | 1,440 | 121 | 1,309 | 35,438 | $ | 275 | |||||||||||||||||
|
|
||||||||||||||||||||||||
|
|
||||||||||||||||||||||||
|
Total fixed maturity securities trading
|
174 | - | - | - | 174 | |||||||||||||||||||
|
|
||||||||||||||||||||||||
|
|
||||||||||||||||||||||||
|
Equity securities available-for-sale:
|
||||||||||||||||||||||||
|
Common stock
|
61 | 14 | 1 | 1 | 73 | |||||||||||||||||||
|
Preferred stock
|
572 | 40 | - | 41 | 571 | |||||||||||||||||||
|
|
||||||||||||||||||||||||
|
|
||||||||||||||||||||||||
|
Total equity securities available-for-sale
|
633 | 54 | 1 | 42 | 644 | |||||||||||||||||||
|
|
||||||||||||||||||||||||
|
|
||||||||||||||||||||||||
|
Total
|
$ | 36,235 | $ | 1,494 | $ | 122 | $ | 1,351 | $ | 36,256 | ||||||||||||||
|
|
||||||||||||||||||||||||
| Cost or | Gross | Gross Unrealized Losses | Estimated | |||||||||||||||||
| Amortized | Unrealized | Less than | 12 Months | Fair | ||||||||||||||||
| December 31, 2008 | Cost | Gains | 12 Months | or Greater | Value | |||||||||||||||
| (In millions) | ||||||||||||||||||||
|
|
||||||||||||||||||||
|
Fixed maturity securities available-for-sale:
|
||||||||||||||||||||
|
U.S. Treasury securities and obligations of
government agencies
|
$ | 2,862 | $ | 69 | $ | 1 | $ | - | $ | 2,930 | ||||||||||
|
Asset-backed securities
|
9,670 | 24 | 961 | 969 | 7,764 | |||||||||||||||
|
States, municipalities and political
subdivisions – tax-exempt securities
|
8,557 | 90 | 609 | 623 | 7,415 | |||||||||||||||
|
Corporate and other taxable bonds
|
12,993 | 275 | 1,164 | 1,374 | 10,730 | |||||||||||||||
|
Redeemable preferred stock
|
72 | 1 | 23 | 3 | 47 | |||||||||||||||
|
|
||||||||||||||||||||
|
|
||||||||||||||||||||
|
Total fixed maturity securities
available-for-sale
|
34,154 | 459 | 2,758 | 2,969 | 28,886 | |||||||||||||||
|
|
||||||||||||||||||||
|
|
||||||||||||||||||||
|
Total fixed maturity securities trading
|
1 | - | - | - | 1 | |||||||||||||||
|
|
||||||||||||||||||||
|
|
||||||||||||||||||||
|
Equity securities available-for-sale:
|
||||||||||||||||||||
|
Common stock
|
134 | 190 | 1 | 3 | 320 | |||||||||||||||
|
Preferred stock
|
882 | 5 | 15 | 321 | 551 | |||||||||||||||
|
|
||||||||||||||||||||
|
|
||||||||||||||||||||
|
Total equity securities available-for-sale
|
1,016 | 195 | 16 | 324 | 871 | |||||||||||||||
|
|
||||||||||||||||||||
|
|
||||||||||||||||||||
|
Total
|
$ | 35,171 | $ | 654 | $ | 2,774 | $ | 3,293 | $ | 29,758 | ||||||||||
|
|
||||||||||||||||||||
80
Table of Contents
| Period from | ||||
| (In millions) | April 1, 2009 to | |||
| December 31, 2009 | ||||
|
Beginning balance of credit losses on fixed maturity securities
|
$ | 192 | ||
|
|
||||
|
Additional credit losses for which an OTTI loss was previously recognized
|
93 | |||
|
Additional credit losses for which an OTTI loss was not previously recognized
|
183 | |||
|
Reductions for securities sold during the period
|
(239 | ) | ||
|
Reductions for securities the Company intends to sell or more likely than not will be required to sell
|
(65 | ) | ||
|
|
||||
|
|
||||
|
Ending balance of credit losses on fixed maturity securities
|
$ | 164 | ||
|
|
||||
81
Table of Contents
(In millions)
| Gross | ||||||||||||
| Amortized | Estimated | Unrealized | ||||||||||
| Rating | Cost | Fair Value | Losses | |||||||||
|
|
||||||||||||
|
U.S. Government Agencies
|
$ | 1,814 | $ | 1,782 | $ | 32 | ||||||
|
|
||||||||||||
|
AAA
|
2,350 | 2,052 | 298 | |||||||||
|
|
||||||||||||
|
AA
|
475 | 389 | 86 | |||||||||
|
|
||||||||||||
|
A
|
391 | 325 | 66 | |||||||||
|
|
||||||||||||
|
BBB
|
349 | 279 | 70 | |||||||||
|
|
||||||||||||
|
Non-investment grade and equity tranches
|
1,180 | 953 | 227 | |||||||||
|
|
||||||||||||
|
|
||||||||||||
|
Total
|
$ | 6,559 | $ | 5,780 | $ | 779 | ||||||
|
|
||||||||||||
82
Table of Contents
(In millions)
| Gross | ||||||||||||
| Amortized | Estimated | Unrealized | ||||||||||
| Rating | Cost | Fair Value | Losses | |||||||||
|
|
||||||||||||
|
AAA
|
$ | 1,344 | $ | 1,280 | $ | 64 | ||||||
|
|
||||||||||||
|
AA
|
985 | 849 | 136 | |||||||||
|
|
||||||||||||
|
A
|
492 | 464 | 28 | |||||||||
|
|
||||||||||||
|
BBB
|
519 | 399 | 120 | |||||||||
|
|
||||||||||||
|
Non-investment grade
|
22 | 20 | 2 | |||||||||
|
|
||||||||||||
|
|
||||||||||||
|
Total
|
$ | 3,362 | $ | 3,012 | $ | 350 | ||||||
|
|
||||||||||||
83
Table of Contents
| Estimated | Gross | |||||||||||
| December 31, 2009 | Amortized Cost | Fair Value | Unrealized Losses | |||||||||
| (In millions) | ||||||||||||
|
|
||||||||||||
|
Communications
|
$ | 333 | $ | 327 | $ | 6 | ||||||
|
Consumer, Cyclical
|
409 | 386 | 23 | |||||||||
|
Consumer, Non-cyclical
|
425 | 412 | 13 | |||||||||
|
Energy
|
271 | 259 | 12 | |||||||||
|
Financial
|
1,918 | 1,752 | 166 | |||||||||
|
Industrial
|
364 | 350 | 14 | |||||||||
|
Utilities
|
654 | 614 | 40 | |||||||||
|
Other
|
539 | 514 | 25 | |||||||||
|
|
||||||||||||
|
|
||||||||||||
|
Total
|
$ | 4,913 | $ | 4,614 | $ | 299 | ||||||
|
|
||||||||||||
(In millions)
| Gross | ||||||||||||
| Estimated | Unrealized | |||||||||||
| Rating | Amortized Cost | Fair Value | Losses | |||||||||
|
|
||||||||||||
|
AAA
|
$ | 191 | $ | 183 | $ | 8 | ||||||
|
|
||||||||||||
|
AA
|
344 | 339 | 5 | |||||||||
|
|
||||||||||||
|
A
|
1,161 | 1,103 | 58 | |||||||||
|
|
||||||||||||
|
BBB
|
2,287 | 2,150 | 137 | |||||||||
|
|
||||||||||||
|
Non-investment grade
|
930 | 839 | 91 | |||||||||
|
|
||||||||||||
|
|
||||||||||||
|
Total
|
$ | 4,913 | $ | 4,614 | $ | 299 | ||||||
|
|
||||||||||||
84
Table of Contents
| Contractual Maturity | December 31, 2009 | December 31, 2008 | ||||||||||||||
| Cost or | Estimated | Cost or | Estimated | |||||||||||||
| Amortized | Fair | Amortized | Fair | |||||||||||||
| Cost | Value | Cost | Value | |||||||||||||
| (In millions) | ||||||||||||||||
|
|
||||||||||||||||
|
Due in one year or less
|
$ | 1,240 | $ | 1,219 | $ | 3,105 | $ | 2,707 | ||||||||
|
Due after one year through five years
|
10,046 | 10,244 | 10,295 | 9,210 | ||||||||||||
|
Due after five years through ten years
|
10,646 | 10,538 | 5,929 | 4,822 | ||||||||||||
|
Due after ten years
|
13,496 | 13,437 | 14,825 | 12,147 | ||||||||||||
|
|
||||||||||||||||
|
|
||||||||||||||||
|
Total
|
$ | 35,428 | $ | 35,438 | $ | 34,154 | $ | 28,886 | ||||||||
|
|
||||||||||||||||
85
Table of Contents
86
Table of Contents
87
Table of Contents
| December 31, 2009 | ||||||||||||
| (In millions) | Fair Value of | Maximum Amount of | Weighted | |||||||||
| Credit Default | Future Payments under | Average Years | ||||||||||
| Swaps | Credit Default Swaps | to Maturity | ||||||||||
|
B
|
$ | - | $ | 8 | 3.1 | |||||||
|
|
||||||||||||
|
Total
|
$ | - | $ | 8 | 3.1 | |||||||
|
|
||||||||||||
| December 31, 2008 | ||||||||||||
| (In millions) | Fair Value of | Maximum Amount of | Weighted | |||||||||
| Credit Default | Future Payments under | Average Years | ||||||||||
| Swaps | Credit Default Swaps | to Maturity | ||||||||||
|
AAA/AA/A
|
$ | (8 | ) | $ | 40 | 12.3 | ||||||
|
BBB
|
(4 | ) | 55 | 3.1 | ||||||||
|
B
|
(2 | ) | 8 | 4.1 | ||||||||
|
CCC and lower
|
(29 | ) | 45 | 4.5 | ||||||||
|
|
||||||||||||
|
Total
|
$ | (43 | ) | $ | 148 | 6.1 | ||||||
|
|
||||||||||||
88
Table of Contents
| Years ended December 31 | 2009 | 2008 | 2007 | |||||||||
| (In millions) | ||||||||||||
|
|
||||||||||||
|
Without hedge designation
|
||||||||||||
|
Interest rate swaps
|
$ | 61 | $ | (59 | ) | $ | 11 | |||||
|
Credit default swaps – purchased protection
|
(47 | ) | 86 | 95 | ||||||||
|
Credit default swaps – sold protection
|
3 | (35 | ) | (40 | ) | |||||||
|
Total return swaps
|
(2 | ) | - | - | ||||||||
|
Futures purchased
|
- | - | 7 | |||||||||
|
Futures sold, not yet purchased
|
21 | (11 | ) | (38 | ) | |||||||
|
Currency forwards
|
- | 2 | (4 | ) | ||||||||
|
Options embedded in convertible debt securities
|
- | 1 | 1 | |||||||||
|
Equity warrants
|
- | (2 | ) | - | ||||||||
|
Options written
|
15 | - | - | |||||||||
|
|
||||||||||||
|
Trading activities
|
||||||||||||
|
Futures purchased
|
- | (131 | ) | - | ||||||||
|
Futures sold, not yet purchased
|
(2 | ) | 1 | - | ||||||||
|
|
||||||||||||
|
|
||||||||||||
|
Total
|
$ | 49 | $ | (148 | ) | $ | 32 | |||||
|
|
||||||||||||
89
Table of Contents
| Contractual/ | ||||||||||||
| December 31, 2009 | Notional | Estimated Fair Value | ||||||||||
| (In millions) | Amount | Asset | (Liability) | |||||||||
|
Without hedge designation
|
||||||||||||
|
Credit default swaps – purchased protection
|
$ | 116 | $ | - | $ | (11 | ) | |||||
|
Credit default swaps – sold protection
|
8 | - | - | |||||||||
|
Equity warrants
|
2 | - | - | |||||||||
|
|
||||||||||||
|
Trading activities
|
||||||||||||
|
Futures sold, not yet purchased
|
132 | - | - | |||||||||
|
|
||||||||||||
|
|
||||||||||||
|
Total
|
$ | 258 | $ | - | $ | (11 | ) | |||||
|
|
||||||||||||
| Contractual/ | ||||||||||||
| December 31, 2008 | Notional | Estimated Fair Value | ||||||||||
| (In millions) | Amount | Asset | (Liability) | |||||||||
|
Without hedge designation
|
||||||||||||
|
Interest rate swaps
|
$ | 900 | $ | - | $ | (66 | ) | |||||
|
Credit default swaps – purchased protection
|
405 | 24 | (2 | ) | ||||||||
|
Credit default swaps – sold protection
|
148 | - | (43 | ) | ||||||||
|
Equity warrants
|
4 | - | - | |||||||||
|
|
||||||||||||
|
|
||||||||||||
|
Total
|
$ | 1,457 | $ | 24 | $ | (111 | ) | |||||
|
|
||||||||||||
90
Table of Contents
91
Table of Contents
| Total | ||||||||||||||||
| assets/(liabilities) | ||||||||||||||||
| December 31, 2009 | Level 1 | Level 2 | Level 3 | at fair value | ||||||||||||
| (in millions) | ||||||||||||||||
|
|
||||||||||||||||
|
Assets
|
||||||||||||||||
|
Fixed maturity securities:
|
||||||||||||||||
|
U.S. Treasury securities and obligations of
government agencies
|
$ | 247 | $ | 54 | $ | - | $ | 301 | ||||||||
|
|
||||||||||||||||
|
Asset-backed securities:
|
||||||||||||||||
|
Residential mortgage-backed securities
|
- | 6,308 | 629 | 6,937 | ||||||||||||
|
Commercial mortgage-backed securities
|
- | 461 | 123 | 584 | ||||||||||||
|
Other asset-backed securities
|
- | 484 | 348 | 832 | ||||||||||||
|
|
||||||||||||||||
|
|
||||||||||||||||
|
Total asset-backed securities
|
- | 7,253 | 1,100 | 8,353 | ||||||||||||
|
|
||||||||||||||||
|
States, municipalities and political subdivisions -
tax-exempt securities
|
- | 6,273 | 756 | 7,029 | ||||||||||||
|
Corporate and other taxable bonds
|
139 | 19,127 | 609 | 19,875 | ||||||||||||
|
Redeemable preferred stock
|
3 | 49 | 2 | 54 | ||||||||||||
|
|
||||||||||||||||
|
|
||||||||||||||||
|
Total fixed maturity securities
|
389 | 32,756 | 2,467 | 35,612 | ||||||||||||
|
|
||||||||||||||||
|
Equity securities
|
503 | 130 | 11 | 644 | ||||||||||||
|
Short term investments
|
3,552 | 397 | - | 3,949 | ||||||||||||
|
Life settlement contracts, included in Other assets
|
- | - | 130 | 130 | ||||||||||||
|
Discontinued operations investments, included in Other
liabilities
|
19 | 106 | 16 | 141 | ||||||||||||
|
Separate account business
|
43 | 342 | 38 | 423 | ||||||||||||
|
|
||||||||||||||||
|
|
||||||||||||||||
|
Total assets
|
$ | 4,506 | $ | 33,731 | $ | 2,662 | $ | 40,899 | ||||||||
|
|
||||||||||||||||
|
|
||||||||||||||||
|
Liabilities
|
||||||||||||||||
|
Derivative financial instruments, included in Other
liabilities
|
$ | - | $ | - | $ | (11 | ) | $ | (11 | ) | ||||||
|
|
||||||||||||||||
|
|
||||||||||||||||
|
Total liabilities
|
$ | - | $ | - | $ | (11 | ) | $ | (11 | ) | ||||||
|
|
||||||||||||||||
92
Table of Contents
| Total | ||||||||||||||||
| assets/(liabilities) | ||||||||||||||||
| December 31, 2008 | Level 1 | Level 2 | Level 3 | at fair value | ||||||||||||
| (in millions) | ||||||||||||||||
|
|
||||||||||||||||
|
Assets
|
||||||||||||||||
|
Fixed maturity securities
|
$ | 2,028 | $ | 24,367 | $ | 2,492 | $ | 28,887 | ||||||||
|
Equity securities
|
567 | 94 | 210 | 871 | ||||||||||||
|
Derivative financial instruments, included in Other
invested assets
|
- | - | 24 | 24 | ||||||||||||
|
Short term investments
|
2,926 | 608 | - | 3,534 | ||||||||||||
|
Life settlement contracts, included in Other assets
|
- | - | 129 | 129 | ||||||||||||
|
Discontinued operations investments, included in
Other
liabilities
|
83 | 59 | 15 | 157 | ||||||||||||
|
Separate account business
|
40 | 306 | 38 | 384 | ||||||||||||
|
|
||||||||||||||||
|
Total assets
|
$ | 5,644 | $ | 25,434 | $ | 2,908 | $ | 33,986 | ||||||||
|
|
||||||||||||||||
|
|
||||||||||||||||
|
Liabilities
|
||||||||||||||||
|
Derivative financial instruments, included in Other
liabilities
|
$ | - | $ | - | $ | (111 | ) | $ | (111 | ) | ||||||
|
|
||||||||||||||||
|
Total liabilities
|
$ | - | $ | - | $ | (111 | ) | $ | (111 | ) | ||||||
|
|
||||||||||||||||
93
Table of Contents
| Net realized | ||||||||||||||||||||||||||||||||
| Net realized | investment gains | |||||||||||||||||||||||||||||||
| investment | (losses) and net | |||||||||||||||||||||||||||||||
| gains (losses) | change in | Net unrealized | ||||||||||||||||||||||||||||||
| and net | unrealized | gains (losses) on | ||||||||||||||||||||||||||||||
| change in | appreciation | Level 3 assets | ||||||||||||||||||||||||||||||
| unrealized | (depreciation) | Purchases, | and liabilities | |||||||||||||||||||||||||||||
| appreciation | recognized in | sales, | held at | |||||||||||||||||||||||||||||
| (depreciation) | other | issuances | Transfers | Transfers | Balance at | December 31, | ||||||||||||||||||||||||||
| Balance at | recognized in | comprehensive | and | into | out of | December 31, | 2009 recognized | |||||||||||||||||||||||||
| Level 3 | January 1, 2009 | net income* | income | settlements | Level 3 | Level 3 | 2009 | in net income* | ||||||||||||||||||||||||
| (in millions) | ||||||||||||||||||||||||||||||||
|
|
||||||||||||||||||||||||||||||||
|
Fixed maturity securities:
|
||||||||||||||||||||||||||||||||
|
Asset-backed securities:
|
||||||||||||||||||||||||||||||||
|
Residential mortgage-backed
securities
|
$ | 782 | $ | (32 | ) | $ | 117 | $ | (52 | ) | $ | 71 | $ | (257 | ) | $ | 629 | $ | (12 | ) | ||||||||||||
|
Commercial mortgage-backed
securities
|
186 | (170 | ) | 185 | (24 | ) | 28 | (82 | ) | 123 | (175 | ) | ||||||||||||||||||||
|
Other asset-backed securities
|
139 | (26 | ) | 56 | 180 | 153 | (154 | ) | 348 | - | ||||||||||||||||||||||
|
|
||||||||||||||||||||||||||||||||
|
Total asset-backed securities
|
1,107 | (228 | ) | 358 | 104 | 252 | (493 | ) | 1,100 | (187 | ) | |||||||||||||||||||||
|
|
||||||||||||||||||||||||||||||||
|
States, municipalities and
political
subdivisions - tax-exempt
securities
|
750 | - | 72 | (66 | ) | - | - | 756 | - | |||||||||||||||||||||||
|
Corporate and other taxable bonds
|
622 | (10 | ) | 126 | 75 | 23 | (227 | ) | 609 | (11 | ) | |||||||||||||||||||||
|
Redeemable preferred stock
|
13 | (9 | ) | 9 | 7 | - | (18 | ) | 2 | (9 | ) | |||||||||||||||||||||
|
|
||||||||||||||||||||||||||||||||
|
Total fixed maturity securities
|
2,492 | (247 | ) | 565 | 120 | 275 | (738 | ) | 2,467 | (207 | ) | |||||||||||||||||||||
|
|
||||||||||||||||||||||||||||||||
|
Equity securities
|
210 | - | (1 | ) | 5 | - | (203 | ) | 11 | - | ||||||||||||||||||||||
|
Derivative financial instruments, net
|
(87 | ) | 14 | - | 62 | - | - | (11 | ) | (10 | ) | |||||||||||||||||||||
|
Short term investments
|
- | - | 1 | 7 | - | (8 | ) | - | - | |||||||||||||||||||||||
|
Life settlement contracts
|
129 | 34 | - | (33 | ) | - | - | 130 | 10 | |||||||||||||||||||||||
|
Discontinued operations investments
|
15 | (4 | ) | 7 | (2 | ) | - | - | 16 | - | ||||||||||||||||||||||
|
Separate account business
|
38 | (1 | ) | 5 | (1 | ) | - | (3 | ) | 38 | - | |||||||||||||||||||||
|
|
||||||||||||||||||||||||||||||||
|
Total
|
$ | 2,797 | $ | (204 | ) | $ | 577 | $ | 158 | $ | 275 | $ | (952 | ) | $ | 2,651 | $ | (207 | ) | |||||||||||||
|
|
||||||||||||||||||||||||||||||||
94
Table of Contents
| Net realized | |||||||||||||||||||||||||||||||||
| Net realized | investment gains | ||||||||||||||||||||||||||||||||
| investment | (losses) and net | ||||||||||||||||||||||||||||||||
| gains (losses) | change in | Net unrealized | |||||||||||||||||||||||||||||||
| and net | unrealized | gains (losses) on | |||||||||||||||||||||||||||||||
| change in | appreciation | Level 3 assets | |||||||||||||||||||||||||||||||
| unrealized | (depreciation) | Purchases, | and liabilities | ||||||||||||||||||||||||||||||
| appreciation | recognized in | sales, | held at | ||||||||||||||||||||||||||||||
| Balance at | (depreciation) | other | issuances | Transfers | Transfers | Balance at | December 31, | ||||||||||||||||||||||||||
| January 1, | recognized in | comprehensive | and | into | out of | December 31, | 2008 recognized | ||||||||||||||||||||||||||
| Level 3 | 2008 | net loss* | loss | settlements | Level 3 | Level 3 | 2008 | in net loss* | |||||||||||||||||||||||||
| (in millions) | |||||||||||||||||||||||||||||||||
|
|
|||||||||||||||||||||||||||||||||
|
Fixed maturity securities
|
$ | 2,684 | $ | (379 | ) | $ | (505 | ) | $ | (178 | ) | $ | 1,475 | $ | (605 | ) | $ | 2,492 | $ | (378 | ) | ||||||||||||
|
Equity securities
|
196 | (16 | ) | 6 | 25 | 22 | (23 | ) | 210 | (4 | ) | ||||||||||||||||||||||
|
Derivative financial instruments, net
|
2 | (10 | ) | - | (79 | ) | - | - | (87 | ) | (89 | ) | |||||||||||||||||||||
|
Short term investments
|
85 | - | - | - | - | (85 | ) | - | - | ||||||||||||||||||||||||
|
Life settlement contracts
|
115 | 48 | - | (34 | ) | - | - | 129 | 17 | ||||||||||||||||||||||||
|
Discontinued operations investments
|
42 | (1 | ) | (5 | ) | (4 | ) | - | (17 | ) | 15 | - | |||||||||||||||||||||
|
Separate account business
|
30 | - | - | (18 | ) | 26 | - | 38 | - | ||||||||||||||||||||||||
|
|
|||||||||||||||||||||||||||||||||
|
Total
|
$ | 3,154 | $ | (358 | ) | $ | (504 | ) | $ | (288 | ) | $ | 1,523 | $ | (730 | ) | $ | 2,797 | $ | (454 | ) | ||||||||||||
|
|
|||||||||||||||||||||||||||||||||
95
Table of Contents
| Major Category of Assets and Liabilities | Consolidated Statement of Operations Line Items | |
|
Fixed maturity securities available-for-sale
|
Net realized investment gains (losses)
|
|
|
|
|
|
|
Fixed maturity securities trading
|
Net investment income
|
|
|
|
|
|
|
Equity securities
|
Net realized investment gains (losses)
|
|
|
|
|
|
|
Derivative financial instruments held in a
trading portfolio
|
Net investment income
|
|
|
|
|
|
|
Derivative financial instruments, other
|
Net realized investment gains (losses)
|
|
|
|
|
|
|
Life settlement contracts
|
Other revenues
|
|
96
Table of Contents
97
Table of Contents
| December 31 | 2009 | 2008 | ||||||||||||||
| (In millions) | Carrying | Estimated | Carrying | Estimated | ||||||||||||
| Amount | Fair Value | Amount | Fair Value | |||||||||||||
|
|
||||||||||||||||
|
|
||||||||||||||||
|
Financial assets
|
||||||||||||||||
|
Notes receivable for the issuance of common stock
|
$ | 30 | $ | 29 | $ | 42 | $ | 42 | ||||||||
|
|
||||||||||||||||
|
Financial liabilities
|
||||||||||||||||
|
Premium deposits and annuity contracts
|
$ | 105 | $ | 106 | $ | 111 | $ | 113 | ||||||||
|
Long term debt
|
2,303 | 2,290 | 2,058 | 1,585 | ||||||||||||
98
Table of Contents
| Years ended December 31 | 2009 | 2008 | 2007 | |||||||||
| (In millions) | ||||||||||||
|
Income tax (expense) benefit at statutory rates
|
$ | (189 | ) | $ | 198 | $ | (428 | ) | ||||
|
Tax benefit from tax exempt income
|
119 | 118 | 100 | |||||||||
|
Foreign taxes and credits
|
19 | (2 | ) | (3 | ) | |||||||
|
Other tax (expense) benefit, including IRS settlements
|
(6 | ) | (3 | ) | 14 | |||||||
|
|
||||||||||||
|
|
||||||||||||
|
Effective income tax (expense) benefit
|
$ | (57 | ) | $ | 311 | $ | (317 | ) | ||||
|
|
||||||||||||
99
Table of Contents
| Years ended December 31 | 2009 | 2008 | 2007 | |||||||||
| (In millions) | ||||||||||||
|
Current tax (expense) benefit
|
$ | 120 | $ | 137 | $ | (418 | ) | |||||
|
Tax benefit recognized for uncertainties in the income statement
|
- | - | 2 | |||||||||
|
Deferred tax (expense) benefit
|
(177 | ) | 174 | 99 | ||||||||
|
|
||||||||||||
|
|
||||||||||||
|
Total income tax (expense) benefit
|
$ | (57 | ) | $ | 311 | $ | (317 | ) | ||||
|
|
||||||||||||
| December 31 | 2009 | 2008 | ||||||
| (In millions) | ||||||||
|
Deferred Tax Assets:
|
||||||||
|
Insurance reserves:
|
||||||||
|
Property and casualty claim and claim adjustment expense reserves
|
$ | 606 | $ | 694 | ||||
|
Unearned premium reserves
|
111 | 90 | ||||||
|
Receivables
|
185 | 199 | ||||||
|
Employee benefits
|
279 | 306 | ||||||
|
Life settlement contracts
|
72 | 73 | ||||||
|
Investment valuation differences
|
316 | 496 | ||||||
|
Net unrealized losses
|
- | 1,905 | ||||||
|
Net loss and tax credits carried forward
|
56 | 24 | ||||||
|
Other assets
|
153 | 163 | ||||||
|
|
||||||||
|
Gross deferred tax assets
|
1,778 | 3,950 | ||||||
|
|
||||||||
|
|
||||||||
|
Deferred Tax Liabilities:
|
||||||||
|
Deferred acquisition costs
|
297 | 301 | ||||||
|
Net unrealized gains
|
5 | - | ||||||
|
Other liabilities
|
143 | 156 | ||||||
|
|
||||||||
|
Gross deferred tax liabilities
|
445 | 457 | ||||||
|
|
||||||||
|
|
||||||||
|
Net deferred tax asset
|
$ | 1,333 | $ | 3,493 | ||||
|
|
||||||||
100
Table of Contents
101
Table of Contents
| As of and for the years ended December 31 | 2009 | 2008 | 2007 | |||||||||
| (In millions) | ||||||||||||
|
|
||||||||||||
|
Reserves, beginning of year:
|
||||||||||||
|
Gross
|
$ | 27,593 | $ | 28,588 | $ | 29,636 | ||||||
|
Ceded
|
6,288 | 7,056 | 8,191 | |||||||||
|
|
||||||||||||
|
|
||||||||||||
|
Net reserves, beginning of year
|
21,305 | 21,532 | 21,445 | |||||||||
|
|
||||||||||||
|
|
||||||||||||
|
Net incurred claim and claim adjustment expenses:
|
||||||||||||
|
Provision for insured events of current year
|
4,793 | 5,193 | 4,939 | |||||||||
|
(Decrease) increase in provision for insured events of prior years
|
(240 | ) | (5 | ) | 231 | |||||||
|
Amortization of discount
|
122 | 123 | 120 | |||||||||
|
|
||||||||||||
|
|
||||||||||||
|
Total net incurred (a)
|
4,675 | 5,311 | 5,290 | |||||||||
|
|
||||||||||||
|
|
||||||||||||
|
Net payments attributable to:
|
||||||||||||
|
Current year events
|
917 | 1,034 | 867 | |||||||||
|
Prior year events
|
3,942 | 4,328 | 4,447 | |||||||||
|
Reinsurance recoverable against net reserve transferred under
retroactive reinsurance agreements
|
(3 | ) | (10 | ) | (17 | ) | ||||||
|
|
||||||||||||
|
|
||||||||||||
|
Total net payments
|
4,856 | 5,352 | 5,297 | |||||||||
|
|
||||||||||||
|
|
||||||||||||
|
Foreign currency translation adjustment
|
98 | (186 | ) | 94 | ||||||||
|
|
||||||||||||
|
|
||||||||||||
|
Net reserves, end of year
|
21,222 | 21,305 | 21,532 | |||||||||
|
Ceded reserves, end of year
|
5,594 | 6,288 | 7,056 | |||||||||
|
|
||||||||||||
|
|
||||||||||||
|
Gross reserves, end of year
|
$ | 26,816 | $ | 27,593 | $ | 28,588 | ||||||
|
|
||||||||||||
| (a) |
Total net incurred above does not agree to Insurance claims and policyholders’ benefits as
reflected on the Consolidated Statements of Operations due to expenses incurred related to
uncollectible reinsurance and loss deductible receivables, and benefit expenses related to
future policy benefits and policyholders’ funds, which are not reflected in the table above.
|
| Years ended December 31 | 2009 | 2008 | 2007 | |||||||||
| (In millions) | ||||||||||||
|
|
||||||||||||
|
Asbestos and environmental pollution
|
$ | 155 | $ | 110 | $ | 7 | ||||||
|
Other
|
(396 | ) | (117 | ) | 213 | |||||||
|
|
||||||||||||
|
Property and casualty reserve development
|
(241 | ) | (7 | ) | 220 | |||||||
|
|
||||||||||||
|
Life reserve development in life company
|
1 | 2 | 11 | |||||||||
|
|
||||||||||||
|
|
||||||||||||
|
Total
|
$ | (240 | ) | $ | (5 | ) | $ | 231 | ||||
|
|
||||||||||||
102
Table of Contents
| Gross and Net Carried | |||||||||||||||||||||
| Claim and Claim Adjustment Expense Reserves | Life & | Corporate | |||||||||||||||||||
| CNA | CNA | Group | & Other | ||||||||||||||||||
| (In millions) | Specialty | Commercial | Non-Core | Non-Core | Total | ||||||||||||||||
|
|
|||||||||||||||||||||
|
|
|||||||||||||||||||||
|
Gross Case Reserves
|
$ | 2,208 | $ | 6,510 | $ | 2,502 | $ | 1,548 | $ | 12,768 | |||||||||||
|
Gross IBNR Reserves
|
4,714 | 6,495 | 381 | 2,458 | 14,048 | ||||||||||||||||
|
|
|||||||||||||||||||||
|
|
|||||||||||||||||||||
|
Total Gross Carried Claim and Claim
Adjustment Expense Reserves
|
$ | 6,922 | $ | 13,005 | $ | 2,883 | $ | 4,006 | $ | 26,816 | |||||||||||
|
|
|||||||||||||||||||||
|
|
|||||||||||||||||||||
|
Net Case Reserves
|
$ | 1,781 | $ | 5,269 | $ | 1,765 | $ | 972 | $ | 9,787 | |||||||||||
|
Net IBNR Reserves
|
4,085 | 5,580 | 255 | 1,515 | 11,435 | ||||||||||||||||
|
|
|||||||||||||||||||||
|
|
|||||||||||||||||||||
|
Total Net Carried Claim and Claim
Adjustment Expense Reserves
|
$ | 5,866 | $ | 10,849 | $ | 2,020 | $ | 2,487 | $ | 21,222 | |||||||||||
|
|
|||||||||||||||||||||
|
December 31, 2008
|
|||||||||||||||||||||
| Gross and Net Carried | |||||||||||||||||||||
| Claim and Claim Adjustment Expense Reserves | Life & | Corporate | |||||||||||||||||||
| CNA | CNA | Group | & Other | ||||||||||||||||||
| (In millions) | Specialty | Commercial | Non-Core | Non-Core | Total | ||||||||||||||||
|
|
|||||||||||||||||||||
|
|
|||||||||||||||||||||
|
Gross Case Reserves
|
$ | 2,105 | $ | 6,772 | $ | 2,473 | $ | 1,823 | $ | 13,173 | |||||||||||
|
Gross IBNR Reserves
|
4,616 | 6,837 | 389 | 2,578 | 14,420 | ||||||||||||||||
|
|
|||||||||||||||||||||
|
|
|||||||||||||||||||||
|
Total Gross Carried Claim and Claim
Adjustment Expense Reserves
|
$ | 6,721 | $ | 13,609 | $ | 2,862 | $ | 4,401 | $ | 27,593 | |||||||||||
|
|
|||||||||||||||||||||
|
|
|||||||||||||||||||||
|
Net Case Reserves
|
$ | 1,639 | $ | 5,505 | $ | 1,656 | $ | 1,126 | $ | 9,926 | |||||||||||
|
Net IBNR Reserves
|
3,896 | 5,673 | 249 | 1,561 | 11,379 | ||||||||||||||||
|
|
|||||||||||||||||||||
|
|
|||||||||||||||||||||
|
Total Net Carried Claim and Claim
Adjustment Expense Reserves
|
$ | 5,535 | $ | 11,178 | $ | 1,905 | $ | 2,687 | $ | 21,305 | |||||||||||
|
|
|||||||||||||||||||||
103
Table of Contents
| December 31, 2009 | December 31, 2008 | |||||||||||||||
| Environmental | Environmental | |||||||||||||||
| Asbestos | Pollution | Asbestos | Pollution | |||||||||||||
| (In millions) | ||||||||||||||||
|
|
||||||||||||||||
|
Gross reserves
|
$ | 2,046 | $ | 482 | $ | 2,112 | $ | 392 | ||||||||
|
Ceded reserves
|
(909 | ) | (196 | ) | (910 | ) | (130 | ) | ||||||||
|
|
||||||||||||||||
|
|
||||||||||||||||
|
Net reserves
|
$ | 1,137 | $ | 286 | $ | 1,202 | $ | 262 | ||||||||
|
|
||||||||||||||||
104
Table of Contents
| December 31 | 2009 | 2008 | 2007 | |||||||||
| (In millions) | ||||||||||||
|
|
||||||||||||
|
Beginning net reserves
|
$ | 1,202 | $ | 1,322 | $ | 1,452 | ||||||
|
|
||||||||||||
|
Unfavorable net prior year claim and
claim adjustment expense reserve
development
|
79 | 27 | 6 | |||||||||
|
Paid claims, net of reinsurance recoveries
|
(144 | ) | (147 | ) | (136 | ) | ||||||
|
|
||||||||||||
|
|
||||||||||||
|
Ending net reserves
|
$ | 1,137 | $ | 1,202 | $ | 1,322 | ||||||
|
|
||||||||||||
105
Table of Contents
| December 31 | 2009 | 2008 | 2007 | |||||||||
| (In millions) | ||||||||||||
|
|
||||||||||||
|
Beginning net reserves
|
$ | 262 | $ | 242 | $ | 285 | ||||||
|
|
||||||||||||
|
Unfavorable net prior year claim and
claim adjustment expense reserve
development
|
76 | 83 | 1 | |||||||||
|
Paid claims, net of reinsurance recoveries
|
(52 | ) | (63 | ) | (44 | ) | ||||||
|
|
||||||||||||
|
|
||||||||||||
|
Ending net reserves
|
$ | 286 | $ | 262 | $ | 242 | ||||||
|
|
||||||||||||
106
Table of Contents
| Corporate | |||||||||||||||||||||
| (In millions) | CNA | CNA | & Other Non- | ||||||||||||||||||
| Specialty | Commercial | Core | Total | ||||||||||||||||||
|
|
|||||||||||||||||||||
|
Pretax (favorable) unfavorable net prior year
claim and allocated claim adjustment expense
reserve development:
|
|||||||||||||||||||||
|
|
|||||||||||||||||||||
|
Core (Non-A&E)
|
$ | (218 | ) | $ | (255 | ) | $ | 29 | $ | (444 | ) | ||||||||||
|
A&E
|
- | - | 155 | 155 | |||||||||||||||||
|
|
|||||||||||||||||||||
|
|
|||||||||||||||||||||
|
Pretax (favorable) unfavorable net prior year
development before impact of premium development
|
(218 | ) | (255 | ) | 184 | (289 | ) | ||||||||||||||
|
|
|||||||||||||||||||||
|
|
|||||||||||||||||||||
|
Pretax (favorable) unfavorable premium development
|
(6 | ) | 87 | - | 81 | ||||||||||||||||
|
|
|||||||||||||||||||||
|
|
|||||||||||||||||||||
|
Total pretax (favorable) unfavorable net prior
year development
|
$ | (224 | ) | $ | (168 | ) | $ | 184 | $ | (208 | ) | ||||||||||
|
|
|||||||||||||||||||||
|
2008 Net Prior Year Development
|
|||||||||||||||||||||
| Corporate | |||||||||||||||||||||
| (In millions) | CNA | CNA | & Other Non- | ||||||||||||||||||
| Specialty | Commercial | Core | Total | ||||||||||||||||||
|
|
|||||||||||||||||||||
|
Pretax (favorable) unfavorable net prior year claim and
allocated claim adjustment expense reserve development:
|
|||||||||||||||||||||
|
|
|||||||||||||||||||||
|
Core (Non-A&E)
|
$ | (97 | ) | $ | (101 | ) | $ | 13 | $ | (185 | ) | ||||||||||
|
A&E
|
- | - | 110 | 110 | |||||||||||||||||
|
|
|||||||||||||||||||||
|
|
|||||||||||||||||||||
|
Pretax (favorable) unfavorable net prior year development
before impact of premium development
|
(97 | ) | (101 | ) | 123 | (75 | ) | ||||||||||||||
|
|
|||||||||||||||||||||
|
|
|||||||||||||||||||||
|
Pretax (favorable) unfavorable premium development
|
(9 | ) | 5 | (1 | ) | (5 | ) | ||||||||||||||
|
|
|||||||||||||||||||||
|
|
|||||||||||||||||||||
|
Total pretax (favorable) unfavorable net prior year development
|
$ | (106 | ) | $ | (96 | ) | $ | 122 | $ | (80 | ) | ||||||||||
|
|
|||||||||||||||||||||
107
Table of Contents
| Corporate | ||||||||||||||||
| (In millions) | CNA | CNA | & Other Non- | |||||||||||||
| Specialty | Commercial | Core | Total | |||||||||||||
|
|
||||||||||||||||
|
Pretax (favorable) unfavorable net prior year claim and
allocated claim adjustment expense reserve development:
|
||||||||||||||||
|
|
||||||||||||||||
|
Core (Non-A&E)
|
$ | 35 | $ | (164 | ) | $ | 84 | $ | (45 | ) | ||||||
|
A&E
|
- | - | 7 | 7 | ||||||||||||
|
|
||||||||||||||||
|
|
||||||||||||||||
|
Pretax (favorable) unfavorable net prior year development
before impact of premium development
|
35 | (164 | ) | 91 | (38 | ) | ||||||||||
|
|
||||||||||||||||
|
|
||||||||||||||||
|
Pretax favorable premium development
|
(11 | ) | (19 | ) | (5 | ) | (35 | ) | ||||||||
|
|
||||||||||||||||
|
|
||||||||||||||||
|
Total pretax (favorable) unfavorable net prior year development
|
$ | 24 | $ | (183 | ) | $ | 86 | $ | (73 | ) | ||||||
|
|
||||||||||||||||
108
Table of Contents
109
Table of Contents
110
Table of Contents
111
Table of Contents
112
Table of Contents
113
Table of Contents
| December 31 | 2009 | 2008 | ||||||
| (In millions) | ||||||||
|
|
||||||||
|
Reinsurance receivables related to insurance reserves:
|
||||||||
|
Ceded claim and claim adjustment expenses
|
$ | 5,594 | $ | 6,288 | ||||
|
Ceded future policy benefits
|
859 | 903 | ||||||
|
Ceded policyholders’ funds
|
39 | 39 | ||||||
|
Reinsurance receivables related to paid losses
|
440 | 531 | ||||||
|
|
||||||||
|
Reinsurance receivables
|
6,932 | 7,761 | ||||||
|
Allowance for uncollectible reinsurance
|
(351 | ) | (366 | ) | ||||
|
|
||||||||
|
|
||||||||
|
Reinsurance receivables, net of allowance for uncollectible reinsurance
|
$ | 6,581 | $ | 7,395 | ||||
|
|
||||||||
114
Table of Contents
| Assumed/ | ||||||||||||||||||||
| Direct | Assumed | Ceded | Net | Net % | ||||||||||||||||
| (In millions) | ||||||||||||||||||||
|
|
||||||||||||||||||||
|
2009 Earned Premiums
|
||||||||||||||||||||
|
Property and casualty
|
$ | 8,028 | $ | 67 | $ | 1,968 | $ | 6,127 | 1.1 | % | ||||||||||
|
Accident and health
|
550 | 51 | 7 | 594 | 8.6 | |||||||||||||||
|
Life
|
84 | - | 84 | - | - | |||||||||||||||
|
|
||||||||||||||||||||
|
|
||||||||||||||||||||
|
Total earned premiums
|
$ | 8,662 | $ | 118 | $ | 2,059 | $ | 6,721 | 1.8 | % | ||||||||||
|
|
||||||||||||||||||||
|
|
||||||||||||||||||||
|
2008 Earned Premiums
|
||||||||||||||||||||
|
Property and casualty
|
$ | 8,496 | $ | 164 | $ | 2,121 | $ | 6,539 | 2.5 | % | ||||||||||
|
Accident and health
|
593 | 46 | 28 | 611 | 7.5 | |||||||||||||||
|
Life
|
99 | - | 98 | 1 | - | |||||||||||||||
|
|
||||||||||||||||||||
|
|
||||||||||||||||||||
|
Total earned premiums
|
$ | 9,188 | $ | 210 | $ | 2,247 | $ | 7,151 | 2.9 | % | ||||||||||
|
|
||||||||||||||||||||
|
|
||||||||||||||||||||
|
2007 Earned Premiums
|
||||||||||||||||||||
|
Property and casualty
|
$ | 9,097 | $ | 118 | $ | 2,349 | $ | 6,866 | 1.7 | % | ||||||||||
|
Accident and health
|
660 | 76 | 119 | 617 | 12.3 | |||||||||||||||
|
Life
|
76 | - | 75 | 1 | - | |||||||||||||||
|
|
||||||||||||||||||||
|
|
||||||||||||||||||||
|
Total earned premiums
|
$ | 9,833 | $ | 194 | $ | 2,543 | $ | 7,484 | 2.6 | % | ||||||||||
|
|
||||||||||||||||||||
|
Included in the direct and ceded earned premiums for the years ended December 31, 2009, 2008
and 2007 are $1,385 million, $1,326 million and $1,429 million related to business that is 100%
reinsured as a result of a significant captive program.
|
||||||||||||||||||||
|
Components of Written Premiums
|
||||||||||||||||||||
| Assumed/ | ||||||||||||||||||||
| Direct | Assumed | Ceded | Net | Net % | ||||||||||||||||
| (In millions) | ||||||||||||||||||||
|
|
||||||||||||||||||||
|
2009 Written Premiums
|
||||||||||||||||||||
|
Property and casualty
|
$ | 7,981 | $ | 66 | $ | 1,916 | $ | 6,131 | 1.1 | % | ||||||||||
|
Accident and health
|
539 | 50 | 6 | 583 | 8.6 | |||||||||||||||
|
Life
|
83 | - | 83 | - | - | |||||||||||||||
|
|
||||||||||||||||||||
|
|
||||||||||||||||||||
|
Total written premiums
|
$ | 8,603 | $ | 116 | $ | 2,005 | $ | 6,714 | 1.7 | % | ||||||||||
|
|
||||||||||||||||||||
|
|
||||||||||||||||||||
|
2008 Written Premiums
|
||||||||||||||||||||
|
Property and casualty
|
$ | 8,413 | $ | 182 | $ | 2,109 | $ | 6,486 | 2.8 | % | ||||||||||
|
Accident and health
|
572 | 51 | 18 | 605 | 8.4 | |||||||||||||||
|
Life
|
70 | - | 69 | 1 | - | |||||||||||||||
|
|
||||||||||||||||||||
|
|
||||||||||||||||||||
|
Total written premiums
|
$ | 9,055 | $ | 233 | $ | 2,196 | $ | 7,092 | 3.3 | % | ||||||||||
|
|
||||||||||||||||||||
|
|
||||||||||||||||||||
|
2007 Written Premiums
|
||||||||||||||||||||
|
Property and casualty
|
$ | 8,925 | $ | 123 | $ | 2,272 | $ | 6,776 | 1.8 | % | ||||||||||
|
Accident and health
|
646 | 75 | 113 | 608 | 12.3 | |||||||||||||||
|
Life
|
81 | - | 80 | 1 | - | |||||||||||||||
|
|
||||||||||||||||||||
|
|
||||||||||||||||||||
|
Total written premiums
|
$ | 9,652 | $ | 198 | $ | 2,465 | $ | 7,385 | 2.7 | % | ||||||||||
|
|
||||||||||||||||||||
115
Table of Contents
| Direct | Assumed | Ceded | Net | |||||||||||||
| (In millions) | ||||||||||||||||
|
|
||||||||||||||||
|
2009
|
$ | 9,159 | $ | - | $ | 9,144 | $ | 15 | ||||||||
|
2008
|
$ | 10,805 | $ | - | $ | 10,790 | $ | 15 | ||||||||
|
2007
|
$ | 14,089 | $ | 1 | $ | 14,071 | $ | 19 | ||||||||
116
Table of Contents
| Debt | ||||||||
| December 31 | 2009 | 2008 | ||||||
| (In millions) | ||||||||
|
|
||||||||
|
Variable rate debt:
|
||||||||
|
Credit Facility – variable rate and term, due August 1, 2012
|
$ | 150 | $ | 250 | ||||
|
Debenture – CNA Surety, face amount of $31, due April 29, 2034
|
31 | 31 | ||||||
|
|
||||||||
|
Senior notes:
|
||||||||
|
6.000%, face amount of $400, due August 15, 2011
|
399 | 399 | ||||||
|
8.375%, face amount of $70, due August 15, 2012
|
69 | 69 | ||||||
|
5.850%, face amount of $549, due December 15, 2014
|
547 | 547 | ||||||
|
6.500%, face amount of $350, due August 15, 2016
|
347 | 348 | ||||||
|
6.950%, face amount of $150, due January 15, 2018
|
149 | 149 | ||||||
|
7.350%, face amount of $350, due November 15, 2019
|
347 | - | ||||||
|
Debenture, 7.250%, face amount of $243, due November 15, 2023
|
241 | 241 | ||||||
|
Other debt, 1.000%-6.530%, due through 2019
|
23 | 24 | ||||||
|
|
||||||||
|
|
||||||||
|
Total debt
|
$ | 2,303 | $ | 2,058 | ||||
|
|
||||||||
| Maturity of Debt | ||||
| (In millions) | ||||
|
|
||||
|
2010
|
$ | - | ||
|
2011
|
400 | |||
|
2012
|
220 | |||
|
2013
|
- | |||
|
2014
|
549 | |||
|
Thereafter
|
1,147 | |||
|
Less discount
|
(13 | ) | ||
|
|
||||
|
|
||||
|
Total
|
$ | 2,303 | ||
|
|
||||
117
Table of Contents
118
Table of Contents
| Benefit Obligations and Accrued Benefit Costs | ||||||||||||||||
| Pension Benefits | Postretirement Benefits | |||||||||||||||
| 2009 | 2008 | 2009 | 2008 | |||||||||||||
| (In millions) | ||||||||||||||||
|
|
||||||||||||||||
|
Benefit obligation at January 1
|
$ | 2,529 | $ | 2,503 | $ | 150 | $ | 162 | ||||||||
|
Changes in benefit obligation:
|
||||||||||||||||
|
Service cost
|
17 | 20 | 1 | 1 | ||||||||||||
|
Interest cost
|
153 | 147 | 9 | 9 | ||||||||||||
|
Participants’ contributions
|
- | - | 7 | 7 | ||||||||||||
|
Plan amendments
|
- | 2 | - | - | ||||||||||||
|
Actuarial (gain) loss
|
153 | 27 | 5 | (10 | ) | |||||||||||
|
Benefits paid
|
(156 | ) | (149 | ) | (18 | ) | (19 | ) | ||||||||
|
Foreign currency translation and other
|
6 | (21 | ) | 1 | - | |||||||||||
|
|
||||||||||||||||
|
|
||||||||||||||||
|
Benefit obligations at December 31
|
2,702 | 2,529 | 155 | 150 | ||||||||||||
|
|
||||||||||||||||
|
|
||||||||||||||||
|
Fair value of plan assets at January 1
|
1,884 | 2,331 | - | - | ||||||||||||
|
Change in plan assets:
|
||||||||||||||||
|
Actual return on plan assets
|
316 | (347 | ) | - | - | |||||||||||
|
Company contributions
|
67 | 71 | 11 | 12 | ||||||||||||
|
Participants’ contributions
|
- | - | 7 | 7 | ||||||||||||
|
Benefits paid
|
(156 | ) | (149 | ) | (18 | ) | (19 | ) | ||||||||
|
Foreign currency translation and other
|
6 | (22 | ) | - | - | |||||||||||
|
|
||||||||||||||||
|
|
||||||||||||||||
|
Fair value of plan assets at December 31
|
2,117 | 1,884 | - | - | ||||||||||||
|
|
||||||||||||||||
|
|
||||||||||||||||
|
Funded status
|
$ | (585 | ) | $ | (645 | ) | $ | (155 | ) | $ | (150 | ) | ||||
|
|
||||||||||||||||
|
|
||||||||||||||||
|
Amounts recognized on the Consolidated Balance
Sheets at December 31:
|
||||||||||||||||
|
Other assets
|
$ | 2 | $ | 2 | $ | - | $ | - | ||||||||
|
Other liabilities
|
(587 | ) | (647 | ) | (155 | ) | (150 | ) | ||||||||
|
|
||||||||||||||||
|
Net amount recognized
|
$ | (585 | ) | $ | (645 | ) | $ | (155 | ) | $ | (150 | ) | ||||
|
|
||||||||||||||||
|
|
||||||||||||||||
|
Amounts recognized in Accumulated other
comprehensive income,
not yet recognized in net periodic cost (benefit):
|
||||||||||||||||
|
Prior service credit
|
$ | (1 | ) | $ | (1 | ) | $ | (97 | ) | $ | (113 | ) | ||||
|
Net actuarial loss
|
748 | 792 | 32 | 27 | ||||||||||||
|
|
||||||||||||||||
|
|
||||||||||||||||
|
Net amount recognized
|
$ | 747 | $ | 791 | $ | (65 | ) | $ | (86 | ) | ||||||
|
|
||||||||||||||||
119
Table of Contents
| Pension Benefits | Postretirement Benefits | |||||||||||||||
| December 31 | 2009 | 2008 | 2009 | 2008 | ||||||||||||
|
|
||||||||||||||||
|
Accumulated benefit obligation
|
$ | 2,506 | $ | 2,324 | $ | 155 | $ | 150 | ||||||||
|
Fair value of plan assets
|
1,999 | 1,793 | - | - | ||||||||||||
| Years ended December 31 | 2009 | 2008 | 2007 | |||||||||
| (In millions) | ||||||||||||
|
|
||||||||||||
|
Pension benefits
|
||||||||||||
|
Service cost
|
$ | 17 | $ | 20 | $ | 23 | ||||||
|
Interest cost on projected benefit obligation
|
153 | 147 | 145 | |||||||||
|
Expected return on plan assets
|
(145 | ) | (180 | ) | (174 | ) | ||||||
|
Prior service cost amortization
|
- | - | 2 | |||||||||
|
Actuarial loss amortization
|
25 | 4 | 11 | |||||||||
|
|
||||||||||||
|
|
||||||||||||
|
Net periodic pension cost (benefit)
|
$ | 50 | $ | (9 | ) | $ | 7 | |||||
|
|
||||||||||||
|
|
||||||||||||
|
Postretirement benefits
|
||||||||||||
|
Service cost
|
$ | 1 | $ | 1 | $ | 2 | ||||||
|
Interest cost on projected benefit obligation
|
9 | 9 | 9 | |||||||||
|
Prior service cost amortization
|
(16 | ) | (16 | ) | (18 | ) | ||||||
|
Actuarial loss amortization
|
1 | 1 | 3 | |||||||||
|
|
||||||||||||
|
|
||||||||||||
|
Net periodic postretirement benefit
|
$ | (5 | ) | $ | (5 | ) | $ | (4 | ) | |||
|
|
||||||||||||
| Years ended December 31 | 2009 | 2008 | 2007 | ||||||||||
| (In millions) | |||||||||||||
|
|
|||||||||||||
|
Pension and postretirement benefits
|
|||||||||||||
|
Amounts arising during the period
|
$ | 13 | $ | (546 | ) | $ | 151 | ||||||
|
Reclassification adjustment relating to prior service cost
|
(16 | ) | (16 | ) | (16 | ) | |||||||
|
Reclassification adjustment relating to actuarial loss
|
26 | 5 | 14 | ||||||||||
|
|
|||||||||||||
|
|
|||||||||||||
|
Total increase (decrease) in Other comprehensive income
|
$ | 23 | $ | (557 | ) | $ | 149 | ||||||
|
|
|||||||||||||
| Pension | Postretirement | |||||||
| (In millions) | Benefits | Benefits | ||||||
|
|
||||||||
|
Amortization of prior service cost
|
$ | - | $ | (15 | ) | |||
|
Amortization of actuarial loss
|
23 | 1 | ||||||
|
|
||||||||
|
|
||||||||
|
Total estimated amounts to be recognized
|
$ | 23 | $ | (14 | ) | |||
|
|
||||||||
120
Table of Contents
| December 31 | 2009 | 2008 | ||||||
|
|
||||||||
|
Pension benefits
|
||||||||
|
Discount rate
|
5.700 | % | 6.300 | % | ||||
|
Expected long term rate of return
|
8.000 | 8.000 | ||||||
|
Rate of compensation increases
|
5.030 | 5.830 | ||||||
|
|
||||||||
|
Postretirement benefits
|
||||||||
|
Discount rate
|
5.500 | % | 6.300 | % | ||||
| Years ended December 31 | 2009 | 2008 | 2007 | |||||||||
|
|
||||||||||||
|
|
||||||||||||
|
Pension benefits
|
||||||||||||
|
Discount rate
|
6.300 | % | 6.000 | % | 5.750 | % | ||||||
|
Expected long term rate of return
|
8.000 | 8.000 | 8.000 | |||||||||
|
Rate of compensation increases
|
5.830 | 5.830 | 5.830 | |||||||||
|
|
||||||||||||
|
Postretirement benefits
|
||||||||||||
|
Discount rate
|
6.300 | % | 5.875 | % | 5.625 | % | ||||||
121
Table of Contents
| Total assets at fair | ||||||||||||||||
| December 31, 2009 | Level 1 | Level 2 | Level 3 | value | ||||||||||||
| (In millions) | ||||||||||||||||
|
|
||||||||||||||||
|
Assets
|
||||||||||||||||
|
Fixed maturity securities:
|
||||||||||||||||
|
Asset-backed securities
|
$ | - | $ | 208 | $ | 57 | $ | 265 | ||||||||
|
Corporate and other taxable bonds
|
17 | 352 | - | 369 | ||||||||||||
|
States, municipalities and political
subdivisions – tax-exempt securities
|
- | 10 | - | 10 | ||||||||||||
|
|
||||||||||||||||
|
Total fixed maturity securities
|
17 | 570 | 57 | 644 | ||||||||||||
|
|
||||||||||||||||
|
Equities
|
339 | 54 | 5 | 398 | ||||||||||||
|
Short term investments
|
202 | - | - | 202 | ||||||||||||
|
Limited partnerships
|
- | 466 | 396 | 862 | ||||||||||||
|
Derivatives
|
2 | - | - | 2 | ||||||||||||
|
|
||||||||||||||||
|
Investment contracts with insurance
company
|
- | - | 9 | 9 | ||||||||||||
|
|
||||||||||||||||
|
|
||||||||||||||||
|
Total assets
|
$ | 560 | $ | 1,090 | $ | 467 | $ | 2,117 | ||||||||
|
|
||||||||||||||||
122
Table of Contents
| Actual return | |||||||||||||||||||||||||
| Actual return | on assets sold | ||||||||||||||||||||||||
| on assets still | during the | ||||||||||||||||||||||||
| Balance at | held at | year ended | Purchases, | Balance at | |||||||||||||||||||||
| January 1, | December 31, | December 31, | sales, and | Net transfers in | December 31, | ||||||||||||||||||||
| Level 3 | 2009 | 2009 | 2009 | settlements | (out) of level 3 | 2009 | |||||||||||||||||||
| (In millions) | |||||||||||||||||||||||||
|
|
|||||||||||||||||||||||||
|
Fixed maturity securities:
|
|||||||||||||||||||||||||
|
Asset-backed securities
|
$ | 54 | $ | - | $ | 9 | $ | (6 | ) | $ | - | $ | 57 | ||||||||||||
|
Equities
|
2 | - | - | 5 | (2 | ) | 5 | ||||||||||||||||||
|
Limited partnerships
|
628 | 169 | - | 65 | (466 | ) | 396 | ||||||||||||||||||
|
Investment contracts with
insurance company
|
8 | 1 | - | - | - | 9 | |||||||||||||||||||
|
|
|||||||||||||||||||||||||
|
Total
|
$ | 692 | $ | 170 | $ | 9 | $ | 64 | $ | (468 | ) | $ | 467 | ||||||||||||
|
|
|||||||||||||||||||||||||
| Pension | Postretirement | |||||||
| Benefits | Benefits | |||||||
| (In millions) | ||||||||
|
2010
|
$ | 170 | $ | 11 | ||||
|
2011
|
174 | 12 | ||||||
|
2012
|
176 | 12 | ||||||
|
2013
|
181 | 12 | ||||||
|
2014
|
185 | 12 | ||||||
|
2015-2019
|
983 | 61 | ||||||
123
Table of Contents
| 2009 | ||||||||
| Number | Weight-Average | |||||||
| of Awards | Option Price per Award | |||||||
|
|
||||||||
|
Balance at January 1
|
1,763,550 | $ | 31.43 | |||||
|
Awards granted
|
526,100 | 16.31 | ||||||
|
Awards exercised
|
- | - | ||||||
|
Awards forfeited, cancelled or expired
|
(386,950 | ) | 28.95 | |||||
|
|
||||||||
|
|
||||||||
|
Balance at December 31
|
1,902,700 | $ | 27.76 | |||||
|
|
||||||||
| December 31, 2009 | Awards | Awards | ||||||
| outstanding | exercisable | |||||||
|
|
||||||||
|
|
||||||||
|
Number of shares
|
1,796,268 | 1,254,300 | ||||||
|
Weighted-average exercise prices
|
$ 28.33 | $ 30.63 | ||||||
|
Aggregated intrinsic value
|
$ 3 million | $ - | ||||||
|
Weighted-average remaining contractual term
|
4.64 years | 3.37 years | ||||||
| Years ended December 31 | 2009 | 2008 | 2007 | |||||||||
|
|
||||||||||||
|
|
||||||||||||
|
Weighted-average grant-date fair value
|
$ | 4.69 | $ | 5.45 | $ | 13.83 | ||||||
|
Total intrinsic value of awards exercised
|
$ | - | $ | 10 thousand | $ | 7 million | ||||||
|
Fair value of awards vested
|
$ | 4 million | $ | 3 million | $ | 2 million | ||||||
124
Table of Contents
| Years ended December 31 | 2009 | 2008 | 2007 | |||||||||
|
|
||||||||||||
|
|
||||||||||||
|
Weighted average expected life of the securities granted
|
4.84 years | 4.54 years | 6.25 years | |||||||||
|
Estimates of the underlying common stock’s volatility
|
39.95% | 24.82% | 20.75% | |||||||||
|
Expected dividend yield
|
0.0% | 1.4% | 0.0% | |||||||||
|
Risk free interest rate
|
2.0% | 2.8% | 4.7% | |||||||||
| 2009 | ||||||||
| Weighted- | ||||||||
| Average | ||||||||
| Number | Grant-date | |||||||
| of Awards | Fair value | |||||||
|
|
||||||||
|
Balance at January 1
|
6,665 | $ | 33.76 | |||||
|
Awards granted
|
338,624 | 13.43 | ||||||
|
Awards vested
|
(3,332 | ) | 33.76 | |||||
|
Awards forfeited, cancelled or expired
|
- | - | ||||||
|
|
||||||||
|
|
||||||||
|
Balance at December 31
|
341,957 | $ | 13.63 | |||||
|
|
||||||||
125
Table of Contents
| Future | Future | |||||||
| Minimum | Minimum | |||||||
| Lease | Sublease | |||||||
| Payments | Receipts | |||||||
| (In millions) | ||||||||
|
2010
|
$ | 39 | $ | 3 | ||||
|
2011
|
35 | 3 | ||||||
|
2012
|
31 | 3 | ||||||
|
2013
|
27 | 2 | ||||||
|
2014
|
15 | - | ||||||
|
Thereafter
|
26 | - | ||||||
|
|
||||||||
|
|
||||||||
|
Total
|
$ | 173 | $ | 11 | ||||
|
|
||||||||
126
Table of Contents
127
Table of Contents
| • |
The 2008 Senior Preferred is perpetual and is senior to CNAF’s common stock and any
future preferred stock as to the payment of dividends and amounts payable upon any
liquidation, dissolution or winding up.
|
||
| • |
No dividends may be declared on CNAF’s common stock or any future preferred stock until
the 2008 Senior Preferred has been paid in full. Accordingly, the Company suspended
common stock dividend payments.
|
||
| • |
The 2008 Senior Preferred is not convertible into any other securities and may only be
redeemed upon the mutual agreement of the Company and Loews.
|
||
| • |
The 2008 Senior Preferred accrues cumulative dividends at an initial rate of 10% per
year. On the fifth anniversary of the issuance and every five years thereafter, the
dividend rate will reset to the higher of 10% or the then current 10-year U.S. Treasury
yield plus 700 basis points.
|
||
| • |
Dividends are payable quarterly and any dividends not paid when due will be compounded
quarterly.
|
128
Table of Contents
129
Table of Contents
| Statutory Capital and Surplus | Statutory Net Income (Loss) | |||||||||||||||||||
| December 31 | Years Ended December 31 | |||||||||||||||||||
| 2009 (b) | 2008 | 2009 (b) | 2008 | 2007 | ||||||||||||||||
| (In millions) | ||||||||||||||||||||
|
|
||||||||||||||||||||
|
Combined Continental
Casualty
Companies (a) |
$ | 9,338 | $ | 7,819 | $ | 17 | $ | (172 | ) | $ | 485 | |||||||||
|
Life company
|
448 | 487 | (65 | ) | (51 | ) | 27 | |||||||||||||
| (a) |
|
Represents the combined statutory surplus of CCC and its subsidiaries, including the Life
company.
|
|
|
||
| (b) |
|
Preliminary.
|
130
Table of Contents
| December 31 | 2009 | 2008 | ||||||||||||||
| (In millions) | ||||||||||||||||
| Tax | After-Tax | Tax | After-Tax | |||||||||||||
|
Cumulative foreign currency translation adjustment
|
$ | - | $ | 87 | $ | - | $ | (30 | ) | |||||||
|
Net pension and postretirement benefit plans
|
238 | (444 | ) | 246 | (459 | ) | ||||||||||
|
Net
unrealized gains (losses) on investments with OTTI losses
|
86 | (159 | ) | - | - | |||||||||||
|
Net unrealized gains (losses) on other investments
|
(76 | ) | 198 | 1,918 | (3,454 | ) | ||||||||||
|
|
||||||||||||||||
|
Accumulated other comprehensive (income) loss
attributable to noncontrolling interests
|
- | (7 | ) | - | 19 | |||||||||||
|
|
||||||||||||||||
|
|
||||||||||||||||
|
Accumulated other comprehensive loss
|
$ | 248 | $ | (325 | ) | $ | 2,164 | $ | (3,924 | ) | ||||||
|
|
||||||||||||||||
131
Table of Contents
132
Table of Contents
133
Table of Contents
| CNA | CNA | Life & Group | Corporate & Other | |||||||||||||||||||||
| Year ended December 31, 2009 | Specialty | Commercial | Non-Core | Non-Core | Eliminations | Total | ||||||||||||||||||
| (In millions) | ||||||||||||||||||||||||
|
|
||||||||||||||||||||||||
|
Net written premiums (a)
|
$ | 2,684 | $ | 3,448 | $ | 583 | $ | 1 | $ | (3 | ) | $ | 6,713 | |||||||||||
|
|
||||||||||||||||||||||||
|
|
||||||||||||||||||||||||
|
Revenues
|
||||||||||||||||||||||||
|
Net earned premiums
|
$ | 2,697 | $ | 3,432 | $ | 595 | $ | - | $ | (3 | ) | $ | 6,721 | |||||||||||
|
Net investment income
|
526 | 922 | 664 | 208 | - | 2,320 | ||||||||||||||||||
|
Other revenues
|
206 | 61 | 11 | 10 | - | 288 | ||||||||||||||||||
|
|
||||||||||||||||||||||||
|
Total operating revenues
|
3,429 | 4,415 | 1,270 | 218 | (3 | ) | 9,329 | |||||||||||||||||
|
|
||||||||||||||||||||||||
|
Claims, benefits and expenses
|
||||||||||||||||||||||||
|
Net incurred claims and benefits
|
1,536 | 2,388 | 1,084 | 259 | - | 5,267 | ||||||||||||||||||
|
Policyholders’ dividends
|
9 | 9 | 5 | - | - | 23 | ||||||||||||||||||
|
Amortization of deferred acquisition costs
|
624 | 775 | 18 | - | - | 1,417 | ||||||||||||||||||
|
Other insurance related expenses
|
163 | 435 | 183 | 3 | (3 | ) | 781 | |||||||||||||||||
|
Other expenses
|
179 | 77 | 69 | 119 | - | 444 | ||||||||||||||||||
|
|
||||||||||||||||||||||||
|
Total claims, benefits and expenses
|
2,511 | 3,684 | 1,359 | 381 | (3 | ) | 7,932 | |||||||||||||||||
|
|
||||||||||||||||||||||||
|
Operating income (loss) from continuing operations
before income tax
|
918 | 731 | (89 | ) | (163 | ) | - | 1,397 | ||||||||||||||||
|
Income tax (expense) benefit on operating income (loss)
|
(282 | ) | (208 | ) | 73 | 64 | - | (353 | ) | |||||||||||||||
|
Net operating income, after-tax, attributable to
noncontrolling interests
|
(45 | ) | (17 | ) | - | - | - | (62 | ) | |||||||||||||||
|
|
||||||||||||||||||||||||
|
|
||||||||||||||||||||||||
|
Net operating income (loss) from continuing operations
attributable to CNA
|
591 | 506 | (16 | ) | (99 | ) | - | 982 | ||||||||||||||||
|
|
||||||||||||||||||||||||
|
Net realized investment losses, net of participating
policyholders’ interests
|
(186 | ) | (354 | ) | (235 | ) | (82 | ) | - | (857 | ) | |||||||||||||
|
Income tax benefit on net realized investment losses
|
64 | 121 | 82 | 29 | - | 296 | ||||||||||||||||||
|
Net realized investment (gains) losses, after-tax,
attributable to noncontrolling interests
|
(1 | ) | 1 | - | - | - | - | |||||||||||||||||
|
|
||||||||||||||||||||||||
|
|
||||||||||||||||||||||||
|
Net realized investment losses attributable to CNA
|
(123 | ) | (232 | ) | (153 | ) | (53 | ) | - | (561 | ) | |||||||||||||
|
|
||||||||||||||||||||||||
|
|
||||||||||||||||||||||||
|
Net income (loss) from continuing operations
attributable to CNA
|
$ | 468 | $ | 274 | $ | (169 | ) | $ | (152 | ) | $ | - | $ | 421 | ||||||||||
|
|
||||||||||||||||||||||||
|
|
||||||||||||||||||||||||
| (a) Net written premiums relate to business in property and casualty companies only. | ||||||||||||||||||||||||
|
|
||||||||||||||||||||||||
|
December 31, 2009
|
||||||||||||||||||||||||
|
(In millions)
|
||||||||||||||||||||||||
|
Reinsurance receivables
|
$ | 1,077 | $ | 2,234 | $ | 1,744 | $ | 1,877 | $ | - | $ | 6,932 | ||||||||||||
|
Insurance receivables
|
$ | 613 | $ | 1,234 | $ | 9 | $ | 2 | $ | - | $ | 1,858 | ||||||||||||
|
Deferred acquisition costs
|
$ | 318 | $ | 336 | $ | 454 | $ | - | $ | - | $ | 1,108 | ||||||||||||
|
Insurance reserves
|
||||||||||||||||||||||||
|
Claim and claim adjustment expenses
|
$ | 6,922 | $ | 13,005 | $ | 2,883 | $ | 4,006 | $ | - | $ | 26,816 | ||||||||||||
|
Unearned premiums
|
1,528 | 1,603 | 140 | 3 | - | 3,274 | ||||||||||||||||||
|
Future policy benefits
|
- | - | 7,981 | - | - | 7,981 | ||||||||||||||||||
|
Policyholders’ funds
|
11 | 11 | 170 | - | - | 192 | ||||||||||||||||||
134
Table of Contents
| CNA | CNA | Life & Group | Corporate & Other | |||||||||||||||||||||
| Year ended December 31, 2008 | Specialty | Commercial | Non-Core | Non-Core | Eliminations | Total | ||||||||||||||||||
| (In millions) | ||||||||||||||||||||||||
|
|
||||||||||||||||||||||||
|
Net written premiums (a)
|
$ | 2,719 | $ | 3,770 | $ | 604 | $ | 1 | $ | (4 | ) | $ | 7,090 | |||||||||||
|
|
||||||||||||||||||||||||
|
|
||||||||||||||||||||||||
|
Revenues
|
||||||||||||||||||||||||
|
Net earned premiums
|
$ | 2,755 | $ | 3,787 | $ | 612 | $ | 1 | $ | (4 | ) | $ | 7,151 | |||||||||||
|
Net investment income
|
354 | 603 | 484 | 178 | - | 1,619 | ||||||||||||||||||
|
Other revenues
|
219 | 65 | 28 | 14 | - | 326 | ||||||||||||||||||
|
|
||||||||||||||||||||||||
|
Total operating revenues
|
3,328 | 4,455 | 1,124 | 193 | (4 | ) | 9,096 | |||||||||||||||||
|
|
||||||||||||||||||||||||
|
Claims, benefits and expenses
|
||||||||||||||||||||||||
|
Net incurred claims and benefits
|
1,700 | 2,766 | 1,104 | 133 | - | 5,703 | ||||||||||||||||||
|
Policyholders’ dividends
|
13 | 1 | 6 | - | - | 20 | ||||||||||||||||||
|
Amortization of deferred acquisition costs
|
618 | 836 | 13 | - | - | 1,467 | ||||||||||||||||||
|
Other insurance related expenses
|
137 | 343 | 201 | 17 | (4 | ) | 694 | |||||||||||||||||
|
Other expenses
|
198 | 105 | 24 | 150 | - | 477 | ||||||||||||||||||
|
|
||||||||||||||||||||||||
|
Total claims, benefits and expenses
|
2,666 | 4,051 | 1,348 | 300 | (4 | ) | 8,361 | |||||||||||||||||
|
|
||||||||||||||||||||||||
|
Operating income (loss) from continuing operations
before income tax
|
662 | 404 | (224 | ) | (107 | ) | - | 735 | ||||||||||||||||
|
Income tax (expense) benefit on operating income (loss)
|
(205 | ) | (101 | ) | 116 | 45 | - | (145 | ) | |||||||||||||||
|
Net operating income, after-tax, attributable to
noncontrolling interests
|
(43 | ) | (14 | ) | - | - | - | (57 | ) | |||||||||||||||
|
|
||||||||||||||||||||||||
|
|
||||||||||||||||||||||||
|
Net operating income (loss) from continuing operations
attributable to CNA
|
414 | 289 | (108 | ) | (62 | ) | - | 533 | ||||||||||||||||
|
|
||||||||||||||||||||||||
|
Net realized investment losses, net of participating
policyholders’ interests
|
(257 | ) | (518 | ) | (363 | ) | (159 | ) | - | (1,297 | ) | |||||||||||||
|
Income tax benefit on net realized investment losses
|
90 | 183 | 127 | 56 | - | 456 | ||||||||||||||||||
|
Net realized investment (gains) losses, after-tax,
attributable to noncontrolling interests
|
- | - | - | - | - | - | ||||||||||||||||||
|
|
||||||||||||||||||||||||
|
|
||||||||||||||||||||||||
|
Net realized investment losses attributable to CNA
|
(167 | ) | (335 | ) | (236 | ) | (103 | ) | - | (841 | ) | |||||||||||||
|
|
||||||||||||||||||||||||
|
|
||||||||||||||||||||||||
|
Net income (loss) from continuing operations
attributable to CNA
|
$ | 247 | $ | (46 | ) | $ | (344 | ) | $ | (165 | ) | $ | - | $ | (308 | ) | ||||||||
|
|
||||||||||||||||||||||||
|
|
||||||||||||||||||||||||
| (a) Net written premiums relate to business in property and casualty companies only. | ||||||||||||||||||||||||
|
|
||||||||||||||||||||||||
|
December 31, 2008
|
||||||||||||||||||||||||
|
(In millions)
|
||||||||||||||||||||||||
|
Reinsurance receivables
|
$ | 1,234 | $ | 2,528 | $ | 1,907 | $ | 2,092 | $ | - | $ | 7,761 | ||||||||||||
|
Insurance receivables
|
$ | 603 | $ | 1,426 | $ | 6 | $ | 4 | $ | - | $ | 2,039 | ||||||||||||
|
Deferred acquisition costs
|
$ | 308 | $ | 345 | $ | 472 | $ | - | $ | - | $ | 1,125 | ||||||||||||
|
Insurance reserves
|
||||||||||||||||||||||||
|
Claim and claim adjustment expenses
|
$ | 6,721 | $ | 13,609 | $ | 2,862 | $ | 4,401 | $ | - | $ | 27,593 | ||||||||||||
|
Unearned premiums
|
1,552 | 1,697 | 152 | 5 | - | 3,406 | ||||||||||||||||||
|
Future policy benefits
|
- | - | 7,529 | - | - | 7,529 | ||||||||||||||||||
|
Policyholders’ funds
|
9 | 15 | 219 | - | - | 243 | ||||||||||||||||||
135
Table of Contents
| CNA | CNA | Life & Group | Corporate & Other | |||||||||||||||||||||
| Year ended December 31, 2007 | Specialty | Commercial | Non-Core | Non-Core | Eliminations | Total | ||||||||||||||||||
| (In millions) | ||||||||||||||||||||||||
|
|
||||||||||||||||||||||||
|
Net written premiums (a)
|
$ | 2,766 | $ | 4,007 | $ | 607 | $ | 6 | $ | (4 | ) | $ | 7,382 | |||||||||||
|
|
||||||||||||||||||||||||
|
|
||||||||||||||||||||||||
|
Revenues
|
||||||||||||||||||||||||
|
Net earned premiums
|
$ | 2,759 | $ | 4,104 | $ | 618 | $ | 7 | $ | (4 | ) | $ | 7,484 | |||||||||||
|
Net investment income
|
493 | 1,006 | 622 | 312 | - | 2,433 | ||||||||||||||||||
|
Other revenues
|
186 | 49 | 36 | 8 | - | 279 | ||||||||||||||||||
|
|
||||||||||||||||||||||||
|
Total operating revenues
|
3,438 | 5,159 | 1,276 | 327 | (4 | ) | 10,196 | |||||||||||||||||
|
|
||||||||||||||||||||||||
|
Claims, benefits and expenses
|
||||||||||||||||||||||||
|
Net incurred claims and benefits
|
1,725 | 2,741 | 1,312 | 217 | - | 5,995 | ||||||||||||||||||
|
Policyholders’ dividends
|
6 | 7 | 1 | - | - | 14 | ||||||||||||||||||
|
Amortization of deferred acquisition costs
|
600 | 905 | 15 | - | - | 1,520 | ||||||||||||||||||
|
Other insurance related expenses
|
112 | 413 | 199 | 13 | (4 | ) | 733 | |||||||||||||||||
|
Other expenses
|
168 | 60 | 43 | 130 | - | 401 | ||||||||||||||||||
|
|
||||||||||||||||||||||||
|
Total claims, benefits and expenses
|
2,611 | 4,126 | 1,570 | 360 | (4 | ) | 8,663 | |||||||||||||||||
|
|
||||||||||||||||||||||||
|
Operating income (loss) from continuing operations
before income tax
|
827 | 1,033 | (294 | ) | (33 | ) | - | 1,533 | ||||||||||||||||
|
Income tax (expense) benefit on operating income (loss)
|
(268 | ) | (324 | ) | 135 | 32 | - | (425 | ) | |||||||||||||||
|
Net operating income, after-tax, attributable to
noncontrolling interests
|
(35 | ) | (12 | ) | - | (1 | ) | - | (48 | ) | ||||||||||||||
|
|
||||||||||||||||||||||||
|
|
||||||||||||||||||||||||
|
Net operating income (loss) from continuing operations
attributable to CNA
|
524 | 697 | (159 | ) | (2 | ) | - | 1,060 | ||||||||||||||||
|
|
||||||||||||||||||||||||
|
Net realized investment losses, net of participating
policyholders’ interests
|
(70 | ) | (160 | ) | (56 | ) | (25 | ) | - | (311 | ) | |||||||||||||
|
Income tax benefit on net realized investment losses
|
25 | 55 | 20 | 8 | - | 108 | ||||||||||||||||||
|
Net realized investment (gains) losses, after-tax,
attributable to noncontrolling interests
|
- | - | - | - | - | - | ||||||||||||||||||
|
|
||||||||||||||||||||||||
|
|
||||||||||||||||||||||||
|
Net realized investment losses attributable to CNA
|
(45 | ) | (105 | ) | (36 | ) | (17 | ) | - | (203 | ) | |||||||||||||
|
|
||||||||||||||||||||||||
|
|
||||||||||||||||||||||||
|
Net income (loss) from continuing operations
attributable to CNA
|
$ | 479 | $ | 592 | $ | (195 | ) | $ | (19 | ) | $ | - | $ | 857 | ||||||||||
|
|
||||||||||||||||||||||||
| (a) | Net written premiums relate to business in property and casualty companies only. |
136
Table of Contents
| Revenues by Line of Business | ||||||||||||
| Years ended December 31 | 2009 | 2008 | 2007 | |||||||||
| (In millions) | ||||||||||||
|
|
||||||||||||
|
CNA Specialty
|
||||||||||||
|
Professional & Management Liability
|
$ | 2,339 | $ | 2,140 | $ | 2,462 | ||||||
|
International
|
171 | 163 | 145 | |||||||||
|
Surety
|
474 | 479 | 468 | |||||||||
|
Warranty and Alternative Risks
|
259 | 289 | 293 | |||||||||
|
|
||||||||||||
|
|
||||||||||||
|
CNA Specialty revenues
|
3,243 | 3,071 | 3,368 | |||||||||
|
|
||||||||||||
|
|
||||||||||||
|
CNA Commercial
|
||||||||||||
|
Commercial Insurance
|
2,685 | 2,520 | 3,464 | |||||||||
|
Business Insurance
|
549 | 573 | 628 | |||||||||
|
International
|
617 | 665 | 637 | |||||||||
|
CNA Select Risk
|
210 | 179 | 270 | |||||||||
|
|
||||||||||||
|
|
||||||||||||
|
CNA Commercial revenues
|
4,061 | 3,937 | 4,999 | |||||||||
|
|
||||||||||||
|
|
||||||||||||
|
Life & Group Non-Core
|
||||||||||||
|
Life & Annuity
|
211 | 40 | 257 | |||||||||
|
Health
|
811 | 688 | 911 | |||||||||
|
Other
|
13 | 33 | 52 | |||||||||
|
|
||||||||||||
|
|
||||||||||||
|
Life & Group Non-Core revenues
|
1,035 | 761 | 1,220 | |||||||||
|
|
||||||||||||
|
|
||||||||||||
|
Corporate & Other Non-Core
|
||||||||||||
|
CNA Re
|
39 | 14 | 119 | |||||||||
|
Other
|
97 | 20 | 183 | |||||||||
|
|
||||||||||||
|
|
||||||||||||
|
Corporate & Other Non-Core revenues
|
136 | 34 | 302 | |||||||||
|
|
||||||||||||
|
|
||||||||||||
|
Eliminations
|
(3 | ) | (4 | ) | (4 | ) | ||||||
|
|
||||||||||||
|
|
||||||||||||
|
Total revenues
|
$ | 8,472 | $ | 7,799 | $ | 9,885 | ||||||
|
|
||||||||||||
137
Table of Contents
| Discontinued Operations | ||||||||||||
| Years ended December 31 | 2009 | 2008 | 2007 | |||||||||
| (In millions) | ||||||||||||
|
|
||||||||||||
|
Revenues:
|
||||||||||||
|
Net investment income
|
$ | 6 | $ | 8 | $ | 13 | ||||||
|
Realized investment gains (losses) and other
|
- | 2 | 6 | |||||||||
|
|
||||||||||||
|
Total revenues
|
6 | 10 | 19 | |||||||||
|
Insurance related expenses
|
8 | 10 | 25 | |||||||||
|
|
||||||||||||
|
Income (loss) before income taxes
|
(2 | ) | - | (6 | ) | |||||||
|
Income tax (expense) benefit
|
- | 9 | - | |||||||||
|
|
||||||||||||
|
Income (loss) from discontinued operations, net of tax
|
$ | (2 | ) | $ | 9 | $ | (6 | ) | ||||
|
|
||||||||||||
| Discontinued Operations | ||||||||
| December 31 | 2009 | 2008 | ||||||
| (In millions) | ||||||||
|
|
||||||||
|
Assets:
|
||||||||
|
Investments
|
$ | 141 | $ | 157 | ||||
|
Reinsurance receivables
|
4 | 6 | ||||||
|
Cash
|
- | - | ||||||
|
Other assets
|
2 | 1 | ||||||
|
|
||||||||
|
Total assets
|
147 | 164 | ||||||
|
|
||||||||
|
Liabilities:
|
||||||||
|
Insurance reserves
|
140 | 162 | ||||||
|
Other liabilities
|
8 | 8 | ||||||
|
|
||||||||
|
Total liabilities
|
148 | 170 | ||||||
|
|
||||||||
|
|
||||||||
|
Net liabilities of discontinued operations
|
$ | (1 | ) | $ | (6 | ) | ||
|
|
||||||||
138
Table of Contents
| Quarterly Financial Data | Full | |||||||||||||||||||
| First | Second | Third | Fourth | Year | ||||||||||||||||
| (In millions, except per share data) | ||||||||||||||||||||
|
|
||||||||||||||||||||
|
2009
|
||||||||||||||||||||
|
Revenues
|
$ | 1,638 | $ | 2,096 | $ | 2,340 | $ | 2,398 | $ | 8,472 | ||||||||||
|
|
||||||||||||||||||||
|
|
||||||||||||||||||||
|
Income (loss) from continuing operations,
net of tax
|
(185 | ) | 120 | 278 | 270 | 483 | ||||||||||||||
|
Loss from discontinued operations, net of tax
|
- | (1 | ) | (1 | ) | - | (2 | ) | ||||||||||||
|
Net income attributable to noncontrolling
interests, net of tax
|
(10 | ) | (14 | ) | (14 | ) | (24 | ) | (62 | ) | ||||||||||
|
|
||||||||||||||||||||
|
|
||||||||||||||||||||
|
Net income (loss) attributable to CNA
|
$ | (195 | ) | $ | 105 | $ | 263 | $ | 246 | $ | 419 | |||||||||
|
|
||||||||||||||||||||
|
|
||||||||||||||||||||
|
Basic and Diluted Earnings (Loss) Per Share
|
||||||||||||||||||||
|
|
||||||||||||||||||||
|
Income (loss) from continuing operations
attributable to CNA common stockholders
|
$ | (0.84 | ) | $ | 0.28 | $ | 0.86 | $ | 0.81 | $ | 1.11 | |||||||||
|
Loss from discontinued operations
attributable to CNA common stockholders
|
- | (0.01 | ) | - | - | (0.01 | ) | |||||||||||||
|
|
||||||||||||||||||||
|
|
||||||||||||||||||||
|
Basic and diluted earnings (loss) per share
attributable to CNA common stockholders
|
$ | (0.84 | ) | $ | 0.27 | $ | 0.86 | $ | 0.81 | $ | 1.10 | |||||||||
|
|
||||||||||||||||||||
| Quarterly Financial Data | Full | |||||||||||||||||||
| First | Second | Third | Fourth | Year | ||||||||||||||||
| (In millions, except per share data) | ||||||||||||||||||||
|
|
||||||||||||||||||||
|
2008
|
||||||||||||||||||||
|
Revenues
|
$ | 2,282 | $ | 2,321 | $ | 1,659 | $ | 1,537 | $ | 7,799 | ||||||||||
|
|
||||||||||||||||||||
|
|
||||||||||||||||||||
|
Income (loss) from continuing
operations, net of tax
|
200 | 191 | (324 | ) | (318 | ) | (251 | ) | ||||||||||||
|
Income (loss) from discontinued
operations, net of tax
|
(1 | ) | 2 | 9 | (1 | ) | 9 | |||||||||||||
|
Net income attributable to
noncontrolling interests, net of tax
|
(12 | ) | (12 | ) | (16 | ) | (17 | ) | (57 | ) | ||||||||||
|
|
||||||||||||||||||||
|
|
||||||||||||||||||||
|
Net income (loss) attributable to CNA
|
$ | 187 | $ | 181 | $ | (331 | ) | $ | (336 | ) | $ | (299 | ) | |||||||
|
|
||||||||||||||||||||
|
|
||||||||||||||||||||
|
Basic and Diluted Earnings (Loss) Per
Share
|
||||||||||||||||||||
|
|
||||||||||||||||||||
|
Income (loss) from continuing
operations attributable to CNA common
stockholders
|
$ | 0.70 | $ | 0.66 | $ | (1.26 | ) | $ | (1.31 | ) | $ | (1.21 | ) | |||||||
|
Income (loss) from discontinued
operations attributable to CNA common
stockholders
|
(0.01 | ) | 0.01 | 0.03 | - | 0.03 | ||||||||||||||
|
|
||||||||||||||||||||
|
|
||||||||||||||||||||
|
Basic and diluted earnings (loss) per
share attributable to CNA common
stockholders
|
$ | 0.69 | $ | 0.67 | $ | (1.23 | ) | $ | (1.31 | ) | $ | (1.18 | ) | |||||||
|
|
||||||||||||||||||||
139
Table of Contents
140
Table of Contents
CNA Financial Corporation
Chicago, Illinois
141
Table of Contents
Chicago, Illinois
February 23, 2010
142
Table of Contents
Chicago, Illinois
February 23, 2010
143
Table of Contents
144
Table of Contents
| FIRST | ||||||||
| BECAME | ||||||||
| POSITION AND | EXECUTIVE | |||||||
| OFFICES HELD WITH | OFFICER OF | PRINCIPAL OCCUPATION DURING PAST FIVE | ||||||
| NAME | REGISTRANT | AGE | CNA | YEARS | ||||
|
|
||||||||
| Thomas F. Motamed |
Chief Executive Officer, CNA Financial Corporation
|
61 | 2009 |
Chief Executive Officer of CNA Financial Corporation since January 1, 2009. From December 2002 to June 2008, Vice Chairman and Chief Operating Officer of The Chubb Corporation and President and Chief Operating Officer of Chubb & Son.
|
||||
|
|
||||||||
| D. Craig Mense |
Executive Vice President & Chief Financial Officer, CNA Financial Corporation
|
58 | 2004 |
Executive Vice President and Chief Financial Officer of CNA Financial Corporation.
|
||||
|
|
||||||||
| George R. Fay |
Executive Vice President, Worldwide Property & Casualty Claim of the CNA insurance companies
|
61 | 2010 |
Executive Vice President, Worldwide Property & Casualty Claim of the CNA insurance companies since July 2006. From July 1974 to July 2006, held various positions at The Chubb Corporation including Chief Services Officer.
|
||||
|
|
||||||||
| Larry A. Haefner |
Executive Vice President & Chief Actuary of the CNA insurance companies
|
53 | 2008 |
Executive Vice President & Chief Actuary of the CNA insurance companies since April 2008. From October 2004 to April 2008, Vice President & Chief Actuary, Middle Market Business of The Travelers Insurance Companies.
|
||||
|
|
||||||||
| Jonathan D. Kantor |
Executive Vice President, General Counsel and Secretary, CNA Financial Corporation
|
54 | 1997 |
Executive Vice President, General Counsel and Secretary of CNA Financial Corporation.
|
||||
|
|
||||||||
| Robert A. Lindemann |
President and Chief Operating Officer, CNA Commercial of the CNA insurance companies
|
56 | 2010 |
President and Chief Operating Officer, CNA Commercial of the CNA insurance companies since August 2009. From September 2004 to August 2009, Chief Operating Officer, Commercial Markets and President, Middle Markets of Zurich Financial Services North America.
|
||||
|
|
||||||||
| Thomas Pontarelli |
Executive Vice President & Chief Administration Officer of the CNA insurance companies
|
60 | 2009 |
Executive Vice President & Chief Administration Officer of the CNA insurance companies.
|
||||
|
|
||||||||
| Timothy J. Szerlong |
President, Worldwide Field Operations of the CNA insurance companies
|
57 | 2010 |
President, Worldwide Field Operations of the CNA insurance companies since September 2009. From June 1974 to August 2009, held various positions at The Chubb Corporation including Senior Vice President and Eastern U.S. Field Operations Officer.
|
||||
|
|
||||||||
| Peter W. Wilson |
President and Chief Operating Officer, CNA Specialty of the CNA insurance companies
|
50 | 2009 |
President and Chief Operating Officer, CNA Specialty of the CNA insurance companies since April 2009. From March 2002 to April 2009, Executive Vice President, Global Specialty Lines of the CNA insurance companies.
|
||||
145
Table of Contents
| Number of securities | ||||||||||||
| Number of securities to | remaining available for | |||||||||||
| be issued upon | Weighted average exercise | future issuance under | ||||||||||
| exercise of outstanding | price of outstanding | equity compensation plans | ||||||||||
| options, warrants and | options, warrants and | (excluding securities | ||||||||||
| rights | rights | reflected in column (a)) | ||||||||||
| (a) | (b) | (c) | ||||||||||
|
Plan Category
|
||||||||||||
|
|
||||||||||||
|
Equity compensation plans approved by security holders
|
2,244,657 | $ | 25.61 | 841,594 | ||||||||
|
Equity compensation plans not approved by security holders
|
- | - | - | |||||||||
|
|
||||||||||||
|
|
||||||||||||
|
Total
|
2,244,657 | $ | 25.61 | 841,594 | ||||||||
|
|
||||||||||||
146
Table of Contents
| Page | ||||||||||
| (a) | 1 | FINANCIAL STATEMENTS: | Number | |||||||
|
|
||||||||||
|
|
||||||||||
| Statements of Operations – Years Ended December 31, 2009, 2008, and 2007 | 61 | |||||||||
| Statements of Comprehensive Income (Loss) – Years Ended December 31, 2009, 2008 and 2007 | 63 | |||||||||
| Balance Sheets – December 31, 2009 and 2008 | 64 | |||||||||
| Statements of Cash Flows – Years Ended December 31, 2009, 2008 and 2007 | 65 | |||||||||
| Statements of Stockholders’ Equity – Years Ended December 31, 2009, 2008 and 2007 | 67 | |||||||||
| Notes to Consolidated Financial Statements | 68 | |||||||||
| Report of Independent Registered Public Accounting Firm | 141 | |||||||||
|
|
||||||||||
| (a) | 2 | FINANCIAL STATEMENT SCHEDULES: | ||||||||
|
|
||||||||||
|
|
||||||||||
| Schedule I |
Summary of Investments
|
152 | ||||||||
| Schedule II |
Condensed Financial Information of Registrant (Parent Company)
|
153 | ||||||||
| Schedule III |
Supplementary Insurance Information
|
158 | ||||||||
| Schedule IV |
Reinsurance
|
159 | ||||||||
| Schedule V |
Valuation and Qualifying Accounts
|
159 | ||||||||
| Schedule VI |
Supplemental Information Concerning Property and Casualty Insurance Operations
|
159 | ||||||||
|
|
||||||||||
|
|
||||||||||
| (a) | 3 | EXHIBITS: |
|
|||||||
| Exhibit | ||||||||
| Description of Exhibit | Number | |||||||
| (3) | Articles of incorporation and by-laws: | |||||||
| Certificate of Incorporation of CNA Financial Corporation, as amended May 6, 1987 (Exhibit 3.1 to Form S-8 filed October 9, 1998 incorporated herein by reference) | 3.1 | |||||||
|
|
||||||||
| Certificate of Amendment of Certificate of Incorporation, dated May 14, 1998 (Exhibit 3.1a to 2006 Form 10-K incorporated herein by reference) | 3.1.1 | |||||||
|
|
||||||||
| Certificate of Amendment of Certificate of Incorporation, dated May 10, 1999 (Exhibit 3.1 to 1999 Form 10-K incorporated herein by reference) | 3.1.2 | |||||||
|
|
||||||||
| By-Laws of CNA Financial Corporation, as amended October 24, 2007 (Exhibit 3ii.1 to Form 8-K filed October 29, 2007 incorporated herein by reference) | 3.2 | |||||||
|
|
||||||||
| (4) | Instruments defining the rights of security holders, including indentures:* | |||||||
|
|
||||||||
|
|
||||||||
| Certificate of Designation, as filed with the Secretary of State of the State of Delaware on November 7, 2008, relating to the 2008 Senior Preferred Stock, no par value, of CNA Financial Corporation (Exhibit 3.1 to Form 8-K filed November 12, 2008 incorporated herein by reference) | 4.1 | |||||||
|
|
||||||||
| Registration Rights Agreement, dated August 8, 2006, between CNA Financial Corporation and Loews Corporation (Exhibit 10.1 to August 8, 2006 Form 8-K incorporated herein by reference) | 4.2 | |||||||
147
Table of Contents
| (10) | Material contracts: | |||||||
|
|
||||||||
| Credit Agreement among CNA Financial Corporation, J.P. Morgan Securities Inc., Citibank N.A., Bank of America, N.A., JPMorgan Chase Bank N.A., Wachovia Bank, N.A. and other lenders named therein, dated August 1, 2007 (Exhibit 99.1 to August 1, 2007 Form 8-K incorporated herein by reference) | 10.1 | |||||||
|
|
||||||||
| Federal Income Tax Allocation Agreement, dated February 29, 1980 between CNA Financial Corporation and Loews Corporation (Exhibit 10.2 to 1987 Form 10-K incorporated herein by reference) | 10.2 | |||||||
|
|
||||||||
| Investment Facilities and Services Agreement, dated January 1, 2006, by and among Loews/CNA Holdings, Inc., CNA Financial Corporation and the Participating Subsidiaries (Exhibit 10.3 to 2007 Form 10-K incorporated herein by reference) | 10.3 | |||||||
|
|
||||||||
| Amendment to Investment Facilities and Services Agreement, dated January 1, 2007, by and among Loews/CNA Holdings, Inc. and CNA Financial Corporation (Exhibit 10.3.1 to 2007 Form 10-K incorporated herein by reference) | 10.3.1 | |||||||
|
|
||||||||
| Acknowledgement to Investment Facilities and Services Agreement, dated January 1, 2006, by and among Loews/CNA Holdings, Inc., CNA Financial Corporation, and American Casualty Company of Reading, Pennsylvania (Exhibit 10.3.2 to 2007 Form 10-K incorporated herein by reference) | 10.3.2 | |||||||
|
|
||||||||
| Acknowledgement to Investment Facilities and Services Agreement, dated January 1, 2006, by and among Loews/CNA Holdings, Inc., CNA Financial Corporation, and Columbia Casualty Company (Exhibit 10.3.3 to 2007 Form 10-K incorporated herein by reference) | 10.3.3 | |||||||
|
|
||||||||
| Acknowledgement to Investment Facilities and Services Agreement, dated January 1, 2006, by and among Loews/CNA Holdings, Inc., CNA Financial Corporation, and Continental Assurance Company (Exhibit 10.3.4 to 2007 Form 10-K incorporated herein by reference) | 10.3.4 | |||||||
|
|
||||||||
| Acknowledgement to Investment Facilities and Services Agreement, dated January 1, 2006, by and among Loews/CNA Holdings, Inc., CNA Financial Corporation, and Continental Casualty Company (Exhibit 10.3.5 to 2007 Form 10-K incorporated herein by reference) | 10.3.5 | |||||||
|
|
||||||||
| Acknowledgement to Investment Facilities and Services Agreement, dated January 1, 2006, by and among Loews/CNA Holdings, Inc., CNA Financial Corporation, and National Fire Insurance Company of Hartford (Exhibit 10.3.6 to 2007 Form 10-K incorporated herein by reference) | 10.3.6 | |||||||
|
|
||||||||
| Acknowledgement to Investment Facilities and Services Agreement, dated January 1, 2006, by and among Loews/CNA Holdings, Inc., CNA Financial Corporation, and The Continental Insurance Company (Exhibit 10.3.7 to 2007 Form 10-K incorporated herein by reference) | 10.3.7 | |||||||
|
|
||||||||
| Acknowledgement to Investment Facilities and Services Agreement, dated January 1, 2006, by and among Loews/CNA Holdings, Inc., CNA Financial Corporation, and The Continental Insurance Company of New Jersey (Exhibit 10.3.8 to 2007 Form 10-K incorporated herein by reference) | 10.3.8 | |||||||
148
Table of Contents
| Acknowledgement to Investment Facilities and Services Agreement, dated January 1, 2006, by and among Loews/CNA Holdings, Inc., CNA Financial Corporation, and Transportation Insurance Company (Exhibit 10.3.9 to 2007 Form 10-K incorporated herein by reference) | 10.3.9 | |||||||
|
|
||||||||
| Acknowledgement to Investment Facilities and Services Agreement, dated January 1, 2006, by and among Loews/CNA Holdings, Inc., CNA Financial Corporation, and Valley Forge Insurance Company (Exhibit 10.3.10 to 2007 Form 10-K incorporated herein by reference) | 10.3.10 | |||||||
|
|
||||||||
| Acknowledgment to Investment Facilities and Services Agreement, dated January 1, 2008, by and among Loews/CNA Holdings, Inc., CNA Financial Corporation, and Continental Reinsurance Corporation International Limited (Exhibit 10.5 to March 31, 2008 Form 10-Q incorporated herein by reference) | 10.3.11 | |||||||
|
|
||||||||
| Acknowledgment to Investment Facilities and Services Agreement, dated January 1, 2008, by and among Loews/CNA Holdings, Inc., CNA Financial Corporation, and North Rock Insurance Company Limited (Exhibit 10.6 to March 31, 2008 Form 10-Q incorporated herein by reference) | 10.3.12 | |||||||
|
|
||||||||
| Acknowledgment to Investment Facilities and Services Agreement, dated January 1, 2008, by and among Loews/CNA Holdings, Inc., CNA Financial Corporation, and CNA National Warranty Corporation (Exhibit 10.7 to March 31, 2008 Form 10-Q incorporated herein by reference) | 10.3.13 | |||||||
|
|
||||||||
| Amended and Restated Surplus Note, dated as of December 11, 2008, from Continental Casualty Company to CNA Financial Corporation (Exhibit 10.4 to 2008 Form 10-K incorporated herein by reference) | 10.4 | |||||||
|
|
||||||||
| 2008 Senior Preferred Stock Redemption Agreement, dated November 10, 2009, by and between CNA Financial Corporation and Loews Corporation (Exhibit 10.2 to Form 8-K filed November 13, 2009 incorporated herein by reference) | 10.5 | |||||||
|
|
||||||||
| CNA Financial Corporation 2000 Incentive Compensation Plan, as amended and restated, effective as of February 9, 2005 (Exhibit A to Form DEF 14A, filed March 31, 2005, incorporated herein by reference (as indicated in Form 8-K, filed May 2, 2005, CNAF shareholders voted to approve this plan on April 27, 2005)) | 10.6 | |||||||
|
|
||||||||
| CNA Financial Corporation 2000 Long Term Incentive Plan, dated August 4, 1999 (Exhibit 4.1 to Form S-8 filed August 4, 1999, incorporated herein by reference) | 10.7 | |||||||
|
|
||||||||
| CNA Supplemental Executive Retirement Plan, restated as of January 1, 2009 (Exhibit 10.7 to 2008 Form 10-K incorporated herein by reference) | 10.8 | |||||||
|
|
||||||||
| First Amendment to the CNA Supplemental Executive Retirement Plan, dated December 23, 2009 | 10.8.1 | |||||||
|
|
||||||||
| CNA Supplemental Executive Savings and Capital Accumulation Plan, restated as of January 1, 2009 (Exhibit 10.8 to 2008 Form 10-K incorporated herein by reference) | 10.9 | |||||||
149
Table of Contents
| 2009 Incentive Compensation Awards to Executive Officers (Exhibit 10.9 to 2008 Form 10-K incorporated herein by reference) | 10.10 | |||||||
|
|
||||||||
| Award Letter and Award Terms to Thomas F. Motamed for Stock Appreciation Rights and Restricted Stock Units (Exhibit 10.10 to 2008 Form 10-K incorporated herein by reference) | 10.11 | |||||||
|
|
||||||||
| 2008 Incentive Compensation Awards to Executive Officers (Exhibit 10.9 to 2007 Form 10-K incorporated herein by reference) | 10.12 | |||||||
|
|
||||||||
| Form of Award Letter to Executive Officers for the Long-Term Incentive Cash Plan for the 2005-2007 Long-Term Incentive Cash Plan Cycle (Exhibit 10.1 to March 31, 2008 Form 10-Q incorporated herein by reference) | 10.12.1 | |||||||
|
|
||||||||
| Form of Award Letter to Executive Officers, along with Form of Award Terms, for the Long-Term Incentive Cash Plan for the 2008-2010 Long-Term Incentive Cash Plan Cycle (Exhibit 10.2 to March 31, 2008 Form 10-Q incorporated herein by reference) | 10.12.2 | |||||||
|
|
||||||||
| 2007 Incentive Compensation Awards to Executive Officers (Exhibit 10.23 to March 31, 2007 Form 10-Q incorporated herein by reference) | 10.13 | |||||||
|
|
||||||||
| Form of Award Letter for Long-Term Incentive Cash Award to Executive Officers for the Performance Period Beginning January 1, 2006 and Ending December 31, 2008, Delivered on April 14, 2006 (Exhibit 99.1 to April 19, 2006 Form 8-K incorporated herein by reference) | 10.13.1 | |||||||
|
|
||||||||
| Form of Award Terms for Long-Term Incentive Cash Award to Executive Officers for the Performance Period Beginning January 1, 2006 and Ending December 31, 2008, Delivered on April 14, 2006 (Exhibit 99.2 to April 19, 2006 Form 8-K incorporated herein by reference) | 10.13.2 | |||||||
|
|
||||||||
| Employment Agreement, dated May 22, 2008, by and between CNA Financial Corporation and Thomas F. Motamed (Exhibit 10.1 to June 30, 2008 Form 10-Q incorporated herein by reference) | 10.14 | |||||||
|
|
||||||||
| First Amendment to Employment Agreement, dated October 24, 2008, by and between CNA Financial Corporation and Thomas F. Motamed (Exhibit 10.6 to September 30, 2008 Form 10-Q incorporated herein by reference) | 10.14.1 | |||||||
|
|
||||||||
| Employment Agreement between Continental Casualty Company and D. Craig Mense, dated August 1, 2007 (Exhibit 10.1 to September 30, 2007 Form 10-Q incorporated herein by reference) | 10.15 | |||||||
|
|
||||||||
| Amendment to Employment Agreement, dated July 1, 2008, by and between Continental Casualty Company and D. Craig Mense (Exhibit 10.4 to September 30, 2008 Form 10-Q incorporated herein by reference) | 10.15.1 | |||||||
|
|
||||||||
| Employment Agreement, dated April 1, 2008, by and between Continental Casualty Company and Jonathan D. Kantor (Exhibit 10.2 to September 30, 2008 Form 10-Q incorporated herein by reference) | 10.16 | |||||||
150
Table of Contents
| Letter Agreement, dated June 18, 2007, by and between Continental Casualty Company and Thomas Pontarelli | 10.17 | |||||||
|
|
||||||||
| Letter Agreement, dated August 8, 2008, by and between Continental Casualty Company and Thomas Pontarelli | 10.17.1 | |||||||
|
|
||||||||
| Letter Agreement, dated December 9, 2009, by and between Continental Casualty Company and Thomas Pontarelli | 10.17.2 | |||||||
|
|
||||||||
| Employment Agreement, dated August 24, 2006, by and between Continental Casualty Company and Peter W. Wilson | 10.18 | |||||||
|
|
||||||||
| Amendment to Employment Agreement, dated September 19, 2008, by and between Continental Casualty Company and Peter W. Wilson | 10.18.1 | |||||||
|
|
||||||||
| Subsidiaries of the Registrant | 21.1 | |||||||
|
|
||||||||
| Consent of Independent Registered Public Accounting Firm | 23.1 | |||||||
|
|
||||||||
| Certification of Chief Executive Officer | 31.1 | |||||||
|
|
||||||||
| Certification of Chief Financial Officer | 31.2 | |||||||
|
|
||||||||
| Written Statement of the Chief Executive Officer of CNA Financial Corporation Pursuant to 18 U.S.C. Section 1350 (As adopted by Section 906 of the Sarbanes-Oxley Act of 2002) | 32.1 | |||||||
|
|
||||||||
| Written Statement of the Chief Financial Officer of CNA Financial Corporation Pursuant to 18 U.S.C. Section 1350 (As adopted by Section 906 of the Sarbanes-Oxley Act of 2002) | 32.2 | |||||||
|
|
||||||||
| *CNA Financial Corporation hereby agrees to furnish to the Commission upon request copies of instruments with respect to long term debt, pursuant to Item 601(b)(4) (iii) of Regulation S-K. | ||||||||
|
|
||||||||
|
|
||||||||
| (b) | Exhibits: | |||||||
|
|
||||||||
|
None.
|
||||||||
|
|
||||||||
| (c) | Condensed Financial Information of Unconsolidated Subsidiaries: | |||||||
|
|
||||||||
| None. | ||||||||
151
Table of Contents
152
Table of Contents
Statements of Operations
| Years ended December 31 | 2009 | 2008 | 2007 | |||||||||
| (In millions) | ||||||||||||
|
|
||||||||||||
|
Revenues
|
||||||||||||
|
Net investment income
|
$ | 3 | $ | 16 | $ | 20 | ||||||
|
Realized investment gains (losses)
|
8 | (19 | ) | (6 | ) | |||||||
|
Other income
|
101 | 15 | - | |||||||||
|
|
||||||||||||
|
|
||||||||||||
|
Total revenues
|
112 | 12 | 14 | |||||||||
|
|
||||||||||||
|
|
||||||||||||
|
Expenses
|
||||||||||||
|
Administrative and general
|
2 | 9 | 3 | |||||||||
|
Interest
|
116 | 123 | 131 | |||||||||
|
|
||||||||||||
|
|
||||||||||||
|
Total expenses
|
118 | 132 | 134 | |||||||||
|
|
||||||||||||
|
|
||||||||||||
|
Loss from operations before income taxes and equity in
net income (loss) of subsidiaries
|
(6 | ) | (120 | ) | (120 | ) | ||||||
|
Income tax benefit
|
2 | 42 | 42 | |||||||||
|
|
||||||||||||
|
|
||||||||||||
|
Loss before equity in net income (loss) of subsidiaries
|
(4 | ) | (78 | ) | (78 | ) | ||||||
|
Equity in net income (loss) of subsidiaries
|
423 | (221 | ) | 929 | ||||||||
|
|
||||||||||||
|
|
||||||||||||
|
Net income (loss)
|
$ | 419 | $ | (299 | ) | $ | 851 | |||||
|
|
||||||||||||
153
Table of Contents
Balance Sheets
| December 31 | 2009 | 2008 | ||||||
| (In millions, except share data) | ||||||||
|
|
||||||||
|
Assets
|
||||||||
|
Investment in subsidiaries
|
$ | 11,433 | $ | 7,282 | ||||
|
Fixed maturity securities available-for-sale, at fair value (amortized cost of $4 and $5)
|
4 | 5 | ||||||
|
Equity securities available-for-sale, at fair value (cost of $1 and $1)
|
1 | 1 | ||||||
|
Other invested assets, including derivative financial instruments of $0 and $3
|
- | 3 | ||||||
|
Short term investments
|
395 | 539 | ||||||
|
Receivables for securities sold and collateral
|
- | 16 | ||||||
|
Federal income taxes recoverable
|
24 | 6 | ||||||
|
Amounts due from affiliates
|
10 | 6 | ||||||
|
Surplus note due from affiliate
|
1,000 | 1,000 | ||||||
|
Other assets
|
9 | 14 | ||||||
|
|
||||||||
|
|
||||||||
|
Total assets
|
$ | 12,876 | $ | 8,872 | ||||
|
|
||||||||
|
|
||||||||
|
Liabilities and equity
|
||||||||
|
Liabilities:
|
||||||||
|
Long term debt
|
2,183 | 1,937 | ||||||
|
Other liabilities, including derivative financial instruments of $0 and $31
|
33 | 58 | ||||||
|
|
||||||||
|
|
||||||||
|
Total liabilities
|
2,216 | 1,995 | ||||||
|
|
||||||||
|
|
||||||||
|
Equity:
|
||||||||
|
Preferred stock (12,500,000 shares authorized)
2008 Senior Preferred (no par value; $100,000 stated value; 10,000 and 12,500 shares issued and outstanding held by Loews Corporation) |
1,000 | 1,250 | ||||||
|
Common stock ($2.50 par value; 500,000,000 shares authorized; 273,040,243 shares
issued; and 269,026,759 and 269,024,408 shares outstanding)
|
683 | 683 | ||||||
|
Additional paid-in capital
|
2,177 | 2,174 | ||||||
|
Retained earnings
|
7,264 | 6,845 | ||||||
|
Accumulated other comprehensive loss
|
(325 | ) | (3,924 | ) | ||||
|
Treasury stock (4,013,484 and 4,015,835 shares), at cost
|
(109 | ) | (109 | ) | ||||
|
Notes receivable for the issuance of common stock
|
(30 | ) | (42 | ) | ||||
|
|
||||||||
|
|
||||||||
|
Total equity
|
10,660 | 6,877 | ||||||
|
|
||||||||
|
|
||||||||
|
Total liabilities and equity
|
$ | 12,876 | $ | 8,872 | ||||
|
|
||||||||
154
Table of Contents
Statements of Cash Flows
| Years ended December 31 | 2009 | 2008 | 2007 | |||||||||
| (In millions) | ||||||||||||
|
|
||||||||||||
|
Cash Flows from Operating Activities:
|
||||||||||||
|
Net income (loss)
|
$ | 419 | $ | (299 | ) | $ | 851 | |||||
|
Adjustments to reconcile net income (loss) to net cash flows provided (used) by
operating activities:
|
||||||||||||
|
(Income) loss of subsidiaries
|
(423 | ) | 221 | (929 | ) | |||||||
|
Dividends received from subsidiaries
|
- | 697 | 270 | |||||||||
|
Realized investment (gains) losses
|
(8 | ) | 19 | 6 | ||||||||
|
Other, net
|
(21 | ) | 81 | (54 | ) | |||||||
|
|
||||||||||||
|
|
||||||||||||
|
Total adjustments
|
(452 | ) | 1,018 | (707 | ) | |||||||
|
|
||||||||||||
|
|
||||||||||||
|
Net cash flows provided (used) by operating activities
|
(33 | ) | 719 | 144 | ||||||||
|
|
||||||||||||
|
|
||||||||||||
|
Cash Flows from Investing Activities:
|
||||||||||||
|
Proceeds from fixed maturity securities
|
12 | 1 | 3 | |||||||||
|
Change in short term investments
|
145 | (666 | ) | (63 | ) | |||||||
|
Capital contributions to subsidiaries
|
(3 | ) | (2 | ) | (1 | ) | ||||||
|
Return of capital from subsidiaries
|
- | - | 1 | |||||||||
|
Purchase of surplus note from affiliate
|
- | (1,000 | ) | - | ||||||||
|
Other, net
|
(12 | ) | (3 | ) | (18 | ) | ||||||
|
|
||||||||||||
|
|
||||||||||||
|
Net cash flows provided (used) by investing activities
|
142 | (1,670 | ) | (78 | ) | |||||||
|
|
||||||||||||
|
|
||||||||||||
|
Cash Flows from Financing Activities:
|
||||||||||||
|
Dividends paid to Loews for 2008 Senior Preferred
|
(122 | ) | (19 | ) | - | |||||||
|
Dividends paid to common stockholders
|
- | (122 | ) | (95 | ) | |||||||
|
Proceeds from the issuance of long term debt
|
350 | 250 | - | |||||||||
|
Principal payments on debt
|
(100 | ) | (350 | ) | - | |||||||
|
Payment to redeem 2008 Senior Preferred
|
(250 | ) | - | - | ||||||||
|
Proceeds from issuance of 2008 Senior Preferred
|
- | 1,250 | - | |||||||||
|
Stock options exercised
|
1 | 1 | 18 | |||||||||
|
Purchase of treasury stock
|
- | (70 | ) | - | ||||||||
|
Other, net
|
12 | 11 | 11 | |||||||||
|
|
||||||||||||
|
|
||||||||||||
|
Net cash flows provided (used) by financing activities
|
(109 | ) | 951 | (66 | ) | |||||||
|
|
||||||||||||
|
|
||||||||||||
|
Net change in cash
|
- | - | - | |||||||||
|
Cash, beginning of year
|
- | - | - | |||||||||
|
|
||||||||||||
|
|
||||||||||||
|
Cash, end of year
|
$ | - | $ | - | $ | - | ||||||
|
|
||||||||||||
155
Table of Contents
| December 31 | 2009 | 2008 | ||||||
| (In millions) | ||||||||
|
|
||||||||
|
Variable rate debt:
|
||||||||
|
Credit Facility – variable rate and term, due August 1, 2012
|
$ | 150 | $ | 250 | ||||
|
|
||||||||
|
Senior notes:
|
||||||||
|
6.000%, face amount of $400, due August 15, 2011
|
399 | 399 | ||||||
|
5.850%, face amount of $549, due December 15, 2014
|
547 | 547 | ||||||
|
6.500%, face amount of $350, due August 15, 2016
|
347 | 348 | ||||||
|
6.950%, face amount of $150, due January 15, 2018
|
149 | 149 | ||||||
|
7.350%, face amount of $350, due November 15, 2019
|
347 | - | ||||||
|
Debenture, 7.250%, face amount of $243, due November 15, 2023
|
241 | 241 | ||||||
|
Urban Development Action Grant, 1.00%, due May 7, 2019
|
3 | 3 | ||||||
|
|
||||||||
|
|
||||||||
|
Total
|
$ | 2,183 | $ | 1,937 | ||||
|
|
||||||||
156
Table of Contents
157
Table of Contents
158
Table of Contents
| Balance at | Charged to | Charged to | ||||||||||||||||||
| Beginning | Costs and | Other | Balance at | |||||||||||||||||
| of Period | Expenses | Accounts (a) | Deductions | End of Period | ||||||||||||||||
| (In millions) | ||||||||||||||||||||
|
|
||||||||||||||||||||
|
Year ended December 31, 2009
|
||||||||||||||||||||
|
Deducted from assets:
|
||||||||||||||||||||
|
Allowance for doubtful accounts:
|
||||||||||||||||||||
|
Insurance and reinsurance
receivables
|
$ | 587 | $ | 4 | $ | (1 | ) | $ | (37 | ) | $ | 553 | ||||||||
|
|
||||||||||||||||||||
|
Valuation allowance:
|
||||||||||||||||||||
|
Deferred income taxes
|
$ | - | $ | - | $ | - | $ | - | $ | - | ||||||||||
|
|
||||||||||||||||||||
|
|
||||||||||||||||||||
|
Year ended December 31, 2008
|
||||||||||||||||||||
|
Deducted from assets:
|
||||||||||||||||||||
|
Allowance for doubtful accounts:
|
||||||||||||||||||||
|
Insurance and reinsurance
receivables
|
$ | 773 | $ | (37 | ) | $ | (4 | ) | $ | (145 | ) | $ | 587 | |||||||
|
|
||||||||||||||||||||
|
Valuation allowance:
|
||||||||||||||||||||
|
Deferred income taxes
|
$ | - | $ | - | $ | - | $ | - | $ | - | ||||||||||
|
|
||||||||||||||||||||
|
|
||||||||||||||||||||
|
Year ended December 31, 2007
|
||||||||||||||||||||
|
Deducted from assets:
|
||||||||||||||||||||
|
Allowance for doubtful accounts:
|
||||||||||||||||||||
|
Insurance and reinsurance
receivables
|
$ | 837 | $ | 12 | $ | 2 | $ | (78 | ) | $ | 773 | |||||||||
|
|
||||||||||||||||||||
|
Valuation allowance:
|
||||||||||||||||||||
|
Deferred income taxes
|
$ | - | $ | - | $ | - | $ | - | $ | - | ||||||||||
|
|
||||||||||||||||||||
| (a) | Amount includes effects of foreign currency translation. |
| Consolidated Property and Casualty Operations | ||||||||||||
| As of and for the years ended December 31 | 2009 | 2008 | 2007 | |||||||||
| (In millions) | ||||||||||||
|
|
||||||||||||
|
Deferred acquisition costs
|
$ | 1,108 | $ | 1,125 | ||||||||
|
|
||||||||||||
|
Reserves for unpaid claim and claim adjustment expenses
|
26,712 | 27,475 | ||||||||||
|
|
||||||||||||
|
Discount deducted from claim and claim adjustment expense reserves
above
(based on interest rates ranging from 3.0% to 7.5%) |
1,595 | 1,620 | ||||||||||
|
|
||||||||||||
|
Unearned premiums
|
3,274 | 3,406 | ||||||||||
|
|
||||||||||||
|
Net written premiums
|
6,713 | 7,090 | 7,382 | |||||||||
|
|
||||||||||||
|
Net earned premiums
|
6,720 | 7,149 | 7,481 | |||||||||
|
|
||||||||||||
|
Net investment income
|
2,110 | 1,547 | 2,180 | |||||||||
|
|
||||||||||||
|
Incurred claim and claim adjustment expenses related to current year
|
4,788 | 5,189 | 4,937 | |||||||||
|
|
||||||||||||
|
Incurred claim and claim adjustment expenses related to prior years
|
(241 | ) | (7 | ) | 220 | |||||||
|
|
||||||||||||
|
Amortization of deferred acquisition costs
|
1,417 | 1,467 | 1,520 | |||||||||
|
|
||||||||||||
|
Paid claim and claim adjustment expenses
|
4,841 | 5,327 | 5,282 | |||||||||
159
Table of Contents
| CNA Financial Corporation | ||||
|
Dated: February 23, 2010
|
By | /s/ Thomas F. Motamed | ||
|
|
||||
|
|
Thomas F. Motamed | |||
|
|
Chief Executive Officer | |||
|
|
(Principal Executive Officer) | |||
|
|
By | /s/ D. Craig Mense | ||
|
|
||||
|
|
D. Craig Mense | |||
|
|
Executive Vice President and | |||
|
|
Chief Financial Officer | |||
|
|
(Principal Financial & Accounting Officer) | |||
|
Dated: February 23, 2010
|
By | /s/ Thomas F. Motamed | ||
|
|
||||
|
|
(Thomas F. Motamed, Chief Executive Officer | |||
|
|
and Chairman of the Board of Directors) | |||
|
|
||||
|
Dated: February 23, 2010
|
By | /s/ Paul J. Liska | ||
|
|
||||
|
|
(Paul J. Liska, Director) | |||
|
|
||||
|
Dated: February 23, 2010
|
By | /s/ Jose O. Montemayor | ||
|
|
||||
|
|
(Jose O. Montemayor, Director) | |||
|
|
||||
|
Dated: February 23, 2010
|
By | /s/ Don M. Randel | ||
|
|
||||
|
|
(Don M. Randel, Director) | |||
|
|
||||
|
Dated: February 23, 2010
|
By | /s/ Joseph Rosenberg | ||
|
|
||||
|
|
(Joseph Rosenberg, Director) | |||
|
|
||||
|
Dated: February 23, 2010
|
By | /s/ Andrew H. Tisch | ||
|
|
||||
|
|
(Andrew H. Tisch, Director) | |||
|
|
||||
|
Dated: February 23, 2010
|
By | /s/ James S. Tisch | ||
|
|
||||
|
|
(James S. Tisch, Director) | |||
|
|
||||
|
Dated: February 23, 2010
|
By | /s/ Marvin Zonis | ||
|
|
||||
|
|
(Marvin Zonis, Director) |
160