CNA FINANCIAL CORP
10-Ks and 10-Qs
|
|
|
|
|
|
|
|
|
|
|
|
|
|
|
|
|
|
|
|
|
|
|
|
|
|
|
|
|
|
|
|
|
|
|
|
|
|
|
|
|
|
|
|
|
|
|
|
|
|
|
|
|
|
|
|
UNITED STATES
SECURITIES AND EXCHANGE COMMISSION
Washington, D.C. 20549
FORM 10-K
|
[x] ANNUAL REPORT PURSUANT TO SECTION 13 OR 15(d) OF THE
SECURITIES EXCHANGE ACT OF 1934
|
||
For the fiscal year ended
December 31, 2018
OR
|
[ ] TRANSITION REPORT PURSUANT TO SECTION 13 OR 15(d) OF THE
SECURITIES EXCHANGE ACT OF 1934
|
||
For the transition period from _____ to _____
Commission File Number 1-5823
CNA FINANCIAL CORPORATION
(Exact name of registrant as specified in its charter)
|
Delaware
(State or other jurisdiction of
incorporation or organization)
|
36-6169860
(I.R.S. Employer
Identification No.)
|
|
|
151 N. Franklin
Chicago, Illinois
(Address of principal executive offices)
|
|
60606
(Zip Code)
|
(312) 822-5000
(Registrant's telephone number, including area code)
Securities registered pursuant to Section 12(b) of the Act:
|
Title of each class
Common Stock
with a par value of $2.50 per share
|
Name of each exchange on which registered
New York Stock Exchange
Chicago Stock Exchange
|
|||
Securities registered pursuant to Section 12(g) of the Act:
None
Indicate by check mark if the registrant is a well-known seasoned issuer, as defined in Rule 405 of the Securities Act. Yes [x] No [ ]
Indicate by check mark if the registrant is not required to file reports pursuant to Section 13 or Section 15(d) of the Act. Yes [ ] No [x]
Indicate by check mark whether the registrant (1) has filed all reports required to be filed by Section 13 or 15(d) of the Securities Exchange Act of 1934 during the preceding 12 months (or for such shorter period that the registrant was required to file such reports), and (2) has been subject to such filing requirements for the past 90 days. Yes [x] No [ ]
Indicate by check mark whether the registrant has submitted electronically every Interactive Data File required to be submitted pursuant to Rule 405 of Regulation S-T (§232.405 of this chapter) during the preceding 12 months (or for such shorter period that the registrant was required to submit such files). Yes [x] No [ ]
Indicate by check mark if disclosure of delinquent filers pursuant to Item 405 of Regulation S-K (§229.405 of this chapter) is not contained herein, and will not be contained, to the best of registrant's knowledge, in definitive proxy or information statements incorporated by reference in Part III of this Form 10-K or any amendment to this Form 10-K. [x]
Indicate by check mark whether the registrant is a large accelerated filer, an accelerated filer, a non-accelerated filer, a smaller reporting company, or an emerging growth company. See the definitions of “large accelerated filer,” “accelerated filer,” “smaller reporting company,” and "emerging growth company" in Rule 12b-2 of the Exchange Act.
|
Large accelerated
filer [x]
|
Accelerated filer [ ]
|
Non-accelerated
filer [ ]
|
Smaller reporting company [ ]
|
Emerging growth company [ ]
|
||||
If an emerging growth company, indicate by check mark if the registrant has elected not to use the extended transition period for complying with any new or revised financial accounting standards provided pursuant to Section 13(a) of the Exchange Act. [ ]
Indicate by check mark whether the registrant is a shell company (as defined in Rule 12b-2 of the Act). Yes [ ] No [x]
As of
February 8, 2019
,
271,469,504
shares of common stock were outstanding. The aggregate market value of the common stock held by non-affiliates of the registrant as of
June 29, 2018
was approximately $1,295 million based on the closing price of $45.68 per share of the common stock on the New York Stock Exchange on
June 29, 2018
.
DOCUMENTS INCORPORATED BY REFERENCE:
Portions of the CNA Financial Corporation Proxy Statement prepared for the
2019
annual meeting of shareholders, pursuant to Regulation 14A, are incorporated by reference into Part III of this report.
|
Item Number
|
Page
Number
|
|
|
1.
|
||
|
1A.
|
||
|
1B.
|
||
|
2.
|
||
|
3.
|
||
|
4.
|
||
|
PART II
|
||
|
5.
|
||
|
6.
|
||
|
7.
|
||
|
7A.
|
||
|
8.
|
||
|
9.
|
||
|
9A.
|
||
|
9B.
|
||
|
PART III
|
||
|
10.
|
||
|
11.
|
||
|
12.
|
||
|
13.
|
||
|
14.
|
||
|
PART IV
|
||
|
15.
|
||
2
PART I
ITEM 1. BUSINESS
CNA Financial Corporation (CNAF) was incorporated in 1967 and is an insurance holding company. References to “CNA,” “the Company,” “we,” “our,” “us” or like terms refer to the business of CNAF and its subsidiaries. CNA's property and casualty and remaining life and group insurance operations are primarily conducted by Continental Casualty Company (CCC), The Continental Insurance Company, Western Surety Company, CNA Insurance Company Limited and Hardy Underwriting Bermuda Limited and its subsidiaries (Hardy). Loews Corporation (Loews) owned approximately
89%
of our outstanding common stock as of
December 31, 2018
.
Our insurance products primarily include commercial property and casualty coverages, including surety. Our services include warranty, risk management information services and claims administration. Our products and services are primarily marketed through independent agents, brokers and managing general underwriters to a wide variety of customers, including small, medium and large businesses, insurance companies, associations, professionals and other groups.
Our commercial property and casualty insurance operations are reported in three business segments: Specialty, Commercial and International, which we refer to collectively as Property & Casualty Operations. Our operations outside of Property & Casualty Operations are reported in two business segments: Life & Group and Corporate & Other. Each segment is managed separately due to differences in their markets and product mix. Discussion of each segment, including the products offered, customers served and distribution channels used, is set forth in the Management's Discussion and Analysis (MD&A) included under Item 7 and in Note
O
to the Consolidated Financial Statements included under Item 8.
Competition
The property and casualty insurance industry is highly competitive both as to rate and service. We compete with a large number of stock and mutual insurance companies and other entities for both distributors and customers. Insurers compete on the basis of factors including products, price, services, ratings and financial strength. Accordingly, we must continuously allocate resources to refine and improve our insurance products and services. We are one of the largest commercial property and casualty insurance companies in the United States of America (U.S.).
Current Regulation
The insurance industry is subject to comprehensive and detailed regulation and supervision. Regulatory oversight by applicable agencies is exercised through review of submitted filings and information, examinations (both financial and market conduct), direct inquiries and interviews. Each domestic and foreign jurisdiction has established supervisory agencies with broad administrative powers relative to licensing insurers and agents, approving policy forms, establishing reserve requirements, prescribing the form and content of statutory financial reports and regulating capital adequacy and the type, quality and amount of investments permitted. Such regulatory powers also extend to corporate governance requirements, risk management practices and disclosures and premium rate regulations requiring rates not be excessive, inadequate or unfairly discriminatory. In addition to regulation of dividends by insurance subsidiaries, intercompany transfers of assets or payments may be subject to prior notice or approval by insurance regulators, depending on the size of such transfers and payments in relation to the financial position of the insurance subsidiaries making the transfer or payments.
As our insurance operations are conducted in both domestic and foreign jurisdictions, we are subject to a number of regulatory agency requirements applicable to a portion, or all, of our operations. These include but are not limited to, the State of Illinois Department of Insurance (which is our global group-wide supervisor), the U.K. Prudential Regulatory Authority and Financial Conduct Authority, the Office of Superintendent of Financial Institutions in Canada and the Bermuda Monetary Authority.
Domestic insurers are also required by state insurance regulators to provide coverage to certain insureds who would not otherwise be considered eligible by the insurers. Each state dictates the types of insurance and the level of coverage that must be provided to such involuntary risks. Our share of these involuntary risks is mandatory and generally a function of our respective share of the voluntary market by line of insurance in each state.
3
Further, domestic insurance companies are subject to state guaranty fund and other insurance-related assessments. Guaranty funds are governed by state insurance guaranty associations which levy assessments to meet the funding needs of insolvent insurer estates. Other insurance-related assessments are generally levied by state agencies to fund various organizations, including disaster relief funds, rating bureaus, insurance departments and workers' compensation second injury funds, or by industry organizations that assist in the statistical analysis and ratemaking process, and we have the ability to recoup certain of these assessments from policyholders.
Although the U.S. federal government does not currently directly regulate the business of insurance, federal legislative and regulatory initiatives can affect the insurance industry. These initiatives and legislation include proposals relating to terrorism and natural catastrophe exposures, cybersecurity risk management, federal financial services reforms and certain tax reforms.
The Terrorism Risk Insurance Program Reauthorization Act of 2015 provides for a federal government backstop for insured terrorism risks through 2020. The mitigating effect of such law is part of the analysis of our overall risk posture for terrorism and, accordingly, our risk positioning may change if such law were modified.
We also continue to invest in the security of our systems and network on an enterprise-wide basis. This requires investment of a significant amount of resources by us on an ongoing basis. Potential implications of possible cybersecurity legislation on such current investment, if any, are uncertain.
The foregoing laws, regulations and proposals, either separately or in the aggregate, create a regulatory and legal environment that may require changes in our business plan or significant investment of resources in order to operate in an effective and compliant manner.
Additionally, various legislative and regulatory efforts to reform the tort liability system have, and will continue to, affect our industry. Although there has been some tort reform with positive impact to the insurance industry, new causes of action and theories of damages continue to be proposed in court actions and by federal and state legislatures that continue to expand liability for insurers and their policyholders.
Hardy, a specialized Lloyd's of London (Lloyd's) underwriter, is also supervised by the Council of Lloyd's, which is the franchisor for all Lloyd's operations. The Council of Lloyd's has wide discretionary powers to regulate Lloyd's underwriting, such as establishing the capital requirements for syndicate participation. In addition, the annual business plan of each syndicate is subject to the review and approval of the Lloyd's Franchise Board, which is responsible for business planning and monitoring for all syndicates.
Capital adequacy and risk management regulations, referred to as Solvency II, apply to our European operations and are enacted by the European Commission, the executive body of the European Union (E.U.). Additionally, the International Association of Insurance Supervisors (IAIS) continues to consider regulatory proposals addressing group supervision, capital requirements and enterprise risk management as more fully discussed below.
Regulation Outlook
The IAIS has developed a Common Framework for the Supervision of Internationally Active Insurance Groups (ComFrame) which is focused on the effective group-wide supervision of internationally active insurance groups, such as CNA. As part of ComFrame, the IAIS is developing an international capital standard for insurance groups. While the details of ComFrame, including a global group capital standard and its applicability to CNA, are uncertain at this time, certain jurisdictional regulatory regimes are subject to revision in response to these global developments.
There have also been definitive developments with respect to prudential insurance supervision unrelated to the IAIS activities. On September 22, 2017, the U.S. Treasury Department, the U.S. Trade Representative (USTR) and the E. U. announced they had formally signed a covered agreement on Prudential Measures Regarding Insurance and Reinsurance (U.S.-E.U. Covered Agreement). The U.S.-E.U. Covered Agreement requires U.S. states to prospectively eliminate the requirement that domestic insurance companies must obtain collateral from E.U. reinsurance companies that are not licensed in their state (alien reinsurers) in order to obtain reserve credit under statutory accounting. In exchange, the E.U. will not impose local presence requirements on U.S. firms operating in the E.U., and effectively must defer to U.S. group capital regulation for these firms. On December 18, 2018, the U.S. Treasury Department, the USTR, and the United Kingdom (U.K.) announced they formally signed the Bilateral Agreement on Prudential Measures Regarding Insurance and Reinsurance (U.S.-U.K. Covered
4
Agreement). This Agreement has similar terms as the U.S.-E.U. Covered Agreement, and will become effective upon the U.K.'s exit from the E.U.
Because these covered agreements are not self-executing, U.S. state laws will need to be revised to change reinsurance collateral requirements to conform to the provisions within each of the agreements. Before any such revision to state laws can be advanced, the NAIC must develop a new approach for determination of the appropriate reserve credit under statutory accounting for E.U. and U.K. based alien reinsurers. In addition, the NAIC is currently developing an approach to group capital regulation as the current U.S. regulatory regime is based on legal entity regulation. Both the reinsurance collateral requirement change and adoption of group capital regulation must be effected by the states within five years from the signing of the Covered Agreements, or states risk federal preemption. We will monitor the modification of state laws and regulations in order to comply with the provisions of the Covered Agreements and assess potential effects on our operations and prospects.
Employee Relations
As of
December 31, 2018
, we had approximately 6,100 employees and have experienced satisfactory labor relations. We have never had work stoppages due to labor disputes.
We have comprehensive benefit plans for substantially all of our employees, including retirement and savings plans, disability programs, group life programs and group health care programs. See Note
I
to the Consolidated Financial Statements included under Item 8 for further discussion of our benefit plans.
Available Information
We file annual, quarterly and current reports, proxy statements and other documents with the Securities and Exchange Commission (SEC) under the Securities Exchange Act of 1934 (Exchange Act). The SEC maintains an internet site that contains reports, proxy and information statements and other information regarding issuers, including CNA. The public can obtain any documents that we file with the SEC at
www.sec.gov
.
We also make available free of charge on or through our internet website at
www.cna.com
our Annual Report on Form 10-K, Quarterly Reports on Form 10-Q, Current Reports on Form 8-K and amendments to those reports as soon as reasonably practicable after we electronically file such material with, or furnish it to, the SEC. Copies of these reports may also be obtained, free of charge, upon written request to: CNA Financial Corporation, 151 N. Franklin Street, Chicago, IL 60606, Attn: Scott L. Weber, Executive Vice President and General Counsel.
5
ITEM 1A. RISK FACTORS
Our business faces many risks and uncertainties. These risks and uncertainties could lead to events or circumstances that have a material adverse effect on our results of operations, equity, business and insurer financial strength and corporate debt ratings. We have described below the most significant risks that we face. There may be additional risks that we do not yet know of or that we do not currently perceive to be as significant that may also affect our business. You should carefully consider and evaluate all of the information included in this report and any subsequent reports we may file with the SEC or make available to the public before investing in any securities we issue.
If we determine that our recorded insurance reserves are insufficient to cover our estimated ultimate unpaid liability for claim and claim adjustment expenses, we may need to increase our insurance reserves which would result in a charge to our earnings.
We maintain insurance reserves to cover our estimated ultimate unpaid liability for claim and claim adjustment expenses, including the estimated cost of the claims adjudication process, for reported and unreported claims. Insurance reserves are not an exact calculation of liability but instead are complex management estimates developed utilizing a variety of actuarial reserve estimation techniques as of a given reporting date. The reserve estimation process involves a high degree of judgment and variability and is subject to a number of factors which are highly uncertain. These variables can be affected by both changes in internal processes and external events. Key variables include frequency of claims, claim severity, mortality, morbidity, discount rates, inflation, claim handling policies and procedures, case reserving approach, underwriting and pricing policies, changes in the legal and regulatory environment and the lag time between the occurrence of an insured event and the time of its ultimate settlement. Mortality is the relative incidence of death. Morbidity is the frequency and severity of injury, illness, sickness and diseases contracted.
There is generally a higher degree of variability in estimating required reserves for long-tail coverages, such as general liability and workers' compensation, as they require a relatively longer period of time for claims to be reported and settled. The impact of changes in inflation and medical costs are also more pronounced for long-tail coverages due to the longer settlement period. Certain risks and uncertainties associated with our insurance reserves are outlined in the Critical Accounting Estimates and the Reserves - Estimates and Uncertainties sections of MD&A in Item 7.
We are subject to the uncertain effects of emerging or potential claims and coverage issues that arise as industry practices and legal, judicial, social, economic and other environmental conditions change. These issues have had, and may continue to have, a negative effect on our business by either extending coverage beyond the original underwriting intent or by increasing the number or size of claims, resulting in further increases in our reserves. The effects of unforeseen emerging claim and coverage issues are extremely difficult to predict.
In light of the many uncertainties associated with establishing the estimates and making the judgments necessary to establish reserve levels, we continually review and change our reserve estimates in a regular and ongoing process as experience develops from the actual reporting and settlement of claims and as the legal, regulatory and economic environment evolves. If our recorded reserves are insufficient for any reason, the required increase in reserves would be recorded as a charge against our earnings in the period in which reserves are determined to be insufficient. These charges could be substantial.
Our actual experience could vary from the key assumptions used to determine active life reserves for long term care policies.
Our active life reserves for long term care policies are based on our best estimate assumptions as of December 31, 2015, due to a reserve unlocking at that date. Key assumptions include morbidity, persistency (the percentage of policies remaining in force), discount rate and future premium rate increases. These assumptions, which are critical bases for our reserve estimates, are inherently uncertain. If actual experience varies from these assumptions or the future outlook for these assumptions changes, we may be required to increase our reserves. See the Life & Group Policyholder Reserves portion of Reserves - Estimates and Uncertainties section of MD&A in Item 7 for more information.
6
Estimating future experience for long term care policies is highly uncertain, because the required projection period is very long and there is limited claim history. Morbidity and persistency experience, inclusive of mortality, can be volatile and may be negatively affected by many factors including, but not limited to, policyholder behavior, judicial decisions regarding policy terms, socioeconomic factors, cost of care inflation, changes in health trends and advances in medical care.
A prolonged period during which interest rates remain at levels lower than those anticipated in our reserving would result in shortfalls in investment income on assets supporting our obligations under long term care policies, which may require changes to our reserves. This risk is more significant for our long term care products because the long potential duration of the policy obligations exceeds the duration of the supporting investment assets. Further, changes to the corporate tax code may also affect the rate at which we discount our reserves. In addition, we may not receive regulatory approval for the level of premium rate increases we request. Any adverse deviation between the level of future premium rate increases approved and the level included in our reserving assumptions may require an increase to our reserves.
If our estimated reserves are insufficient for any reason, including changes in assumptions, the required increase in reserves would be recorded as a charge against our earnings in the period in which reserves are determined to be insufficient. These charges could be substantial.
Catastrophe and systemic losses are unpredictable and could result in material losses.
Catastrophe losses are an inevitable part of our business. Various events can cause catastrophe losses. These events can be natural or man-made, and may include hurricanes, windstorms, earthquakes, hail, severe winter weather, fires, floods, riots, strikes, civil commotion, cyber attacks, pandemics and acts of terrorism. The frequency and severity of these catastrophe events are inherently unpredictable. In addition, longer-term natural catastrophe trends may be changing and new types of catastrophe losses may be developing due to climate change, a phenomenon that has been associated with extreme weather events linked to rising temperatures and includes effects on global weather patterns, greenhouse gases, sea, land and air temperatures, sea levels, rain, hail and snow.
The extent of our losses from catastrophes is a function of the total amount of our insured exposures in the affected areas, the frequency and severity of the events themselves, the level of reinsurance coverage, reinsurance reinstatement premiums and state residual market assessments, if any. It can take a long time for the ultimate cost of any catastrophe losses to us to be finally determined, as a multitude of factors contribute to such costs, including evaluation of general liability and pollution exposures, infrastructure disruption, business interruption and reinsurance collectibility. Reinsurance coverage for terrorism events is provided only in limited circumstances, especially in regard to “unconventional” terrorism acts, such as nuclear, biological, chemical or radiological attacks. As a result of the items discussed above, catastrophe losses are particularly difficult to estimate. Additionally, catastrophic events could cause us to exhaust our available reinsurance limits and could adversely affect the cost and availability of reinsurance.
Claim frequency and severity for some lines of business can be correlated to external factors such as economic activity, financial market volatility, increasing health care costs or changes in the legal or regulatory environment. Claim frequency and severity can also be correlated to insureds' use of common business practices, equipment, vendors or software. This can result in multiple insured losses emanating out of the same underlying cause. In these instances, we may be subject to increased claim frequency and severity across multiple policies or lines of business concurrently. While we do not define such systemic losses as catastrophes for financial reporting purposes, they are similar to catastrophes in terms of the uncertainty and potential impact on our results.
We have exposures related to asbestos and environmental pollution (A&EP) claims, which could result in material losses.
Our property and casualty insurance subsidiaries have exposures related to A&EP claims. Our experience has been that establishing claim and claim adjustment expense reserves for casualty coverages relating to A&EP claims is subject to uncertainties that are greater than those presented by other claims. Additionally, traditional actuarial methods and techniques employed to estimate the ultimate cost of claims for more traditional property and casualty exposures are less precise in estimating claim and claim adjustment expense reserves for A&EP. As a result, estimating the ultimate cost of both reported and unreported A&EP claims is subject to a higher degree of variability. On August 31, 2010, we completed a retroactive reinsurance transaction under which substantially all of our legacy
7
A&EP liabilities were ceded to National Indemnity Company (NICO), a subsidiary of Berkshire Hathaway Inc., subject to an aggregate limit of $4 billion (Loss Portfolio Transfer). The cumulative amount ceded under the Loss Portfolio Transfer as of
December 31, 2018
is
$3.1 billion
. If the other parties to the Loss Portfolio Transfer do not fully perform their obligations, net losses incurred on A&EP claims covered by the Loss Portfolio Transfer exceed the aggregate limit of $4 billion, or we determine we have exposures to A&EP claims not covered by the Loss Portfolio Transfer, we may need to increase our recorded net reserves which would result in a charge against our earnings. These charges could be substantial. Additionally, if the A&EP claims exceed the limit of the Loss Portfolio Transfer, we will need to assess whether to purchase additional limit or to reassume claim handling responsibility for A&EP claims from an affiliate of NICO. Any additional reinsurance premium or future claim handling costs would also reduce our earnings.
We use analytical models to assist our decision making in key areas such as pricing, reserving and capital modeling and may be adversely affected if actual results differ materially from the model outputs and related analyses.
We use various modeling techniques and data analytics (e.g., scenarios, predictive, stochastic and/or forecasting) to analyze and estimate exposures, loss trends and other risks associated with our assets and liabilities. This includes both proprietary and third party modeled outputs and related analyses to assist us in decision-making related to underwriting, pricing, capital allocation, reserving, investing, reinsurance and catastrophe risk, among other things. We incorporate numerous assumptions and forecasts about the future level and variability of policyholder behavior, loss frequency and severity, interest rates, equity markets, inflation, capital requirements, and currency exchange rates, among others. The modeled outputs and related analyses from both proprietary models and third parties are subject to various assumptions, uncertainties, model design errors and the inherent limitations of any statistical analysis, including those arising from the use of historical internal and industry data and assumptions.
In addition, the effectiveness of any model can be degraded by operational risks including, but not limited to, the improper use of the model, including input errors, data errors and human error. As a result, actual results may differ materially from our modeled results. The profitability and financial condition of the Company substantially depends on the extent to which our actual experience is consistent with assumptions we use in our models and ultimate model outputs. If, based upon these models or other factors, we misprice our products or fail to appropriately estimate the risks we are exposed to, our business, financial condition, results of operations or liquidity may be materially adversely affected.
We face intense competition in our industry; we may be adversely affected by the cyclical nature of the property and casualty business and the evolving landscape of our distribution network.
All aspects of the insurance industry are highly competitive and we must continuously allocate resources to refine and improve our insurance products and services to remain competitive. We compete with a large number of stock and mutual insurance companies and other entities, some of which may be larger or have greater financial or other resources than we do, for both distributors and customers. This includes agents, brokers and managing general underwriters who may increasingly compete with us to the extent that markets continue to provide them with direct access to providers of capital seeking exposure to insurance risk. Insurers compete on the basis of many factors, including products, price, services, ratings and financial strength. The competitor landscape has evolved substantially in recent years, with significant consolidation and new market entrants, resulting in increased pressures on our ability to remain competitive, particularly in obtaining pricing that is both attractive to our customer base and risk-appropriate to us.
In addition, the property and casualty market is cyclical and has experienced periods characterized by relatively high levels of price competition, resulting in less restrictive underwriting standards and relatively low premium rates, followed by periods of relatively lower levels of competition, more selective underwriting standards and relatively high premium rates. During periods in which price competition is high, we may lose business to competitors offering competitive insurance products at lower prices. As a result, our premium levels and expense ratio could be materially adversely impacted.
We market our insurance products worldwide primarily through independent insurance agents, insurance brokers, and managing general underwriters who also promote and distribute the products of our competitors. Any change in our relationships with our distribution network agents, brokers or managing general underwriters including as
8
a result of consolidation and their increased promotion and distribution of our competitors' products, could adversely affect our ability to sell our products. As a result, our business volume and results of operations could be materially adversely impacted.
We may be adversely affected by technological changes or disruptions in the insurance marketplace.
Technological changes in the way insurance transactions are completed in the marketplace, and our ability to react effectively to such change, may present significant competitive risks. For example, more insurers are utilizing "big data" analytics to make underwriting and other decisions that impact product design and pricing. If such utilization is more effective than how we use similar data and information, we will be at a competitive disadvantage. There can be no assurance that we will continue to compete effectively with our industry peers due to technological changes; accordingly, this may have a material adverse effect on our business and results of operations.
In addition, agents and brokers, technology companies, or other third parties may create alternate distribution channels for commercial business that may adversely impact product differentiation and pricing. For example, they may create a digitally enabled distribution channel that may adversely impact our competitive position. Our efforts or the efforts of agents and brokers with respect to new products or alternate distribution channels, as well as changes in the way agents and brokers utilize greater levels of data and technology, could adversely impact our business relationship with independent agents and brokers who currently market our products, resulting in a lower volume and/or profitability of business generated from these sources.
We may not be able to obtain sufficient reinsurance at a cost or on terms and conditions we deem acceptable, which could result in increased exposure to risk or a decrease in our underwriting commitments.
A primary reason we purchase reinsurance is to manage our exposure to risk. Under our ceded reinsurance arrangements, another insurer assumes a specified portion of our exposure in exchange for a specified portion of policy premiums. Market conditions determine the availability and cost of the reinsurance protection we purchase, which affects the level of our business and profitability, as well as the level and types of risk we retain. If we are unable to obtain sufficient reinsurance at a cost or on terms and conditions we deem acceptable, we may have increased exposure to risk. Alternatively, we may be unwilling to bear the increased risk and would reduce the level of our underwriting commitments.
We may not be able to collect amounts owed to us by reinsurers, which could result in higher net incurred losses.
We have significant amounts recoverable from reinsurers which are reported as receivables on our Consolidated Balance Sheets and are estimated in a manner consistent with claim and claim adjustment expense reserves or future policy benefit reserves. The ceding of insurance does not, however, discharge our primary liability for claims. As a result, we are subject to credit risk relating to our ability to recover amounts due from reinsurers. Certain of our reinsurance carriers could experience credit downgrades by rating agencies within the term of our contractual relationship, which would indicate an increase in the likelihood that we would not be able to recover amounts due. In addition, reinsurers could dispute amounts which we believe are due to us. If the amounts collected from reinsurers, including any collateral, are less than the amounts recorded by us, our net incurred losses will be higher.
We may not be able to collect amounts owed to us by policyholders who hold deductible policies and/or who purchase retrospectively rated policies, which could result in higher net incurred losses.
A portion of our business is written under deductible policies. Under these policies, we are obligated to pay the related insurance claims and are reimbursed by the policyholder to the extent of the deductible, which may be significant. Moreover, certain policyholders purchase retrospectively rated workers' compensation policies (i.e., policies in which premiums are adjusted after the policy period based on the actual loss experience of the policyholder during the policy period). Retrospectively rated policies expose us to additional credit risk to the extent that the adjusted premium is greater than the original premium, which may be significant. As a result, we are exposed to policyholder credit risk. If the amounts collected from policyholders, including any collateral, are less than the amounts recorded by us, our net incurred losses will be higher.
9
We may incur significant realized and unrealized investment losses and volatility in net investment income arising from changes in the financial markets.
Our investment portfolio is exposed to various risks, such as interest rate, credit spread, issuer default, equity prices and foreign currency, which are unpredictable. Financial markets are highly sensitive to changes in economic conditions, monetary policies, tax policies, domestic and international geopolitical issues and many other factors. Changes in financial markets including fluctuations in interest rates, credit, equity prices and foreign currency prices and many other factors beyond our control can adversely affect the value of our investments, the realization of investment income and the rate at which we discount certain liabilities.
We have significant holdings in fixed income investments that are sensitive to changes in interest rates. A decline in interest rates may reduce the returns earned on new fixed income investments, thereby reducing our net investment income, while an increase in interest rates may reduce the value of our existing fixed income investments. The value of our fixed income investments is also subject to risk that certain investments may default or become impaired due to deterioration in the financial condition of issuers of the investments we hold or in the underlying collateral of the security. Any such impairments which we deem to be other-than-temporary would result in a charge to our earnings.
In addition, we invest a portion of our assets in limited partnerships which are subject to greater market volatility than our fixed income investments. Limited partnership investments generally provide a lower level of liquidity than fixed maturity or equity investments which may also limit our ability to withdraw assets.
Further, we hold a portfolio of commercial mortgage loans. We are subject to risk related to the recoverability of loan balances, which is influenced by declines in the estimated cash flows from underlying property leases, fair value of collateral and creditworthiness of tenants of credit tenant loan properties, where lease payments directly service the loan. Collecting amounts from borrowers that are less than the amounts recorded would result in a charge to our earnings.
As a result of these factors, we may not earn an adequate return on our investments, may be required to write down the value of our investments and may incur losses on the disposition of our investments.
Changes in tax laws of jurisdictions in which we operate could adversely impact our results of operations.
Federal, state or foreign tax legislation that would lessen or eliminate some or all of the tax attributes currently affecting us could materially and adversely impact our results of operations, in particular, changes to tax laws governing tax credits. Other potential tax law changes, including further modification of the corporate tax rate and the taxation of interest from municipal bonds, could also adversely affect the value of the tax benefit received on tax exempt municipal investments and thus the rate at which we discount our long term care active life reserves.
Any significant interruption in the operation of our facilities, systems and business functions could result in a materially adverse effect on our operations
.
Our business is highly dependent upon our ability to perform, in an efficient and uninterrupted manner, through our employees or vendor relationships, necessary business functions (such as internet support and 24-hour call centers), processing new and renewal business and processing and paying claims and other obligations. Our facilities and systems could become unavailable, inoperable, or otherwise impaired from a variety of causes, including, without limitation, natural events, such as hurricanes, tornadoes, windstorms, earthquakes, severe winter weather and fires, or other events, such as explosions, terrorist attacks, computer security breaches or cyber attacks, riots, hazardous material releases, medical epidemics, utility outages, interruptions of our data processing and storage systems or the systems of third-party vendors, or unavailability of communications facilities. Likewise, we could experience a significant failure or corruption of one or more of our information technology, telecommunications, or other systems for various reasons, including significant failures that might occur as existing systems are replaced or upgraded.
The shut-down or unavailability of one or more of our systems or facilities for any reason could significantly impair our ability to perform critical business functions on a timely basis. In addition, because our information technology and telecommunications systems interface with and depend on third-party systems, we could experience service denials if demand for such service exceeds capacity or a third-party system fails or experiences an interruption. If sustained or repeated, such events could result in a deterioration of our ability to write and process new and
10
renewal business, provide customer service, pay claims in a timely manner, or perform other necessary business functions, including the ability to issue financial statements in a timely manner. This could result in a materially adverse effect on our business results, prospects and liquidity, as well as damage to customer goodwill.
The foregoing risks could expose us to monetary and reputational damages. Potential exposures include substantially increased compliance costs and required computer system upgrades and security-related investments.
Any significant breach in our data security infrastructure could result in a materially adverse effect on our operations.
A significant breach of our data security infrastructure may result from actions by our employees, vendors, third-party administrators or by unknown third parties. Such a breach could affect our data framework or cause a failure to protect the personal information of our customers, claimants or employees, or sensitive and confidential information regarding our business and may result in operational impairments and financial losses, as well as significant harm to our reputation.
The breach of confidential information also could give rise to legal liability and regulatory action under data protection and privacy laws, as well as evolving regulation in this regard. Any such legal or regulatory action could have a material adverse effect on our operations.
Inability to detect and prevent significant employee or third party service provider misconduct, inadvertent errors and omissions, or exposure relating to functions performed on our behalf could result in a materially adverse effect on our operations.
We may incur losses which arise from employees or third party service providers engaging in intentional misconduct, fraud, errors and omissions, failure to comply with internal guidelines, including with respect to underwriting authority, or failure to comply with regulatory requirements. Our controls may not be able to detect all possible circumstances of employee and third party service provider non-compliant activity and the internal structures in place to prevent this activity may not be effective in all cases. Any losses relating to such non-compliant activity could adversely affect our results of operations.
Portions of our insurance business is underwritten and serviced by third parties. With respect to underwriting, our contractual arrangements with third parties will typically grant them limited rights to write new and renewal policies, subject to contractual restrictions and obligations and requiring them to underwrite within the terms of our licenses. Should these third parties issue policies that exceed these contractual restrictions, we could be deemed liable for such policies and subject to regulatory fines and penalties for any breach of licensing requirements. It is possible that in such circumstance we might not be fully indemnified for such third parties’ contractual breaches.
Additionally, we rely on certain third-party claims administrators, including the administrators of our long term care claims, to perform significant claim administration and claim adjudication functions. Any failure by such administrator to properly perform service functions may result in losses as a result of over-payment of claims, legal claims against us and adverse regulatory enforcement exposure.
We have also licensed certain systems from third parties. We cannot be certain that we will have access to these systems or that our information technology or application systems will continue to operate as intended.
These risks could adversely impact our reputation or client relationships or have a material adverse effect on our financial condition or results of operations.
Loss of key vendor relationships and issues relating to the transitioning of vendor relationships could result in a materially adverse effect on our operations.
In the event that one or more of our vendors suffers a bankruptcy, is sold to another entity, sustains a significant business interruption or otherwise becomes unable to continue to provide products or services at the requisite level, we may be adversely affected. We may suffer operational impairments and financial losses associated with transferring business to a new vendor, assisting a vendor with rectifying operational difficulties, failure by vendors to properly perform service functions or assuming previously outsourced operations ourselves. Our inability to provide for appropriate servicing if a vendor becomes unable to fulfill its contractual obligations to us, either through transitioning to another service provider temporarily or permanently or assuming servicing internally, may have a materially adverse effect on our operations.
11
We face considerable competition within our industry for qualified, specialized talent and any significant inability to attract and retain talent may adversely affect the execution of our business strategies.
The successful execution of our business plan depends on our ability to attract and retain qualified talent. Due to the intense competition in our industry for qualified employees with specialized industry experience, we may encounter obstacles to our ability to attract and retain such employees, which could materially adversely affect our results of operations.
We are controlled by a single stockholder which could result in potential conflicts of interest.
Loews beneficially owned approximately
89%
of our outstanding shares of common stock as of
December 31, 2018
, and is in a position to control actions that require the consent of stockholders, including the election of directors, amendment of our Restated Certificate of Incorporation and any merger or sale of substantially all of our assets. In addition, four officers of Loews currently serve on our Board of Directors. We have also entered into services agreements and a registration rights agreement with Loews, and we may in the future enter into other agreements with Loews. It is possible that potential conflicts of interest could arise in the future for our directors who are also officers of Loews with respect to a number of areas relating to the past and ongoing relationships of Loews and us, including tax and insurance matters, financial commitments and sales of common stock pursuant to registration rights or otherwise.
We are subject to capital adequacy requirements and, if we are unable to maintain or raise sufficient capital to meet these requirements, regulatory agencies may restrict or prohibit us from operating our business.
Insurance companies such as ours are subject to capital adequacy standards set by regulators to help identify companies that merit further regulatory attention. In the U.S., these standards apply specified risk factors to various asset, premium and reserve components of our legal entity statutory basis of accounting financial statements. Current rules, including those promulgated by insurance regulators and specialized markets, such as Lloyd's, require companies to maintain statutory capital and surplus at a specified minimum level determined using the applicable jurisdiction's regulatory capital adequacy formula. If we do not meet these minimum requirements, we may be restricted or prohibited from operating our business in the applicable jurisdictions and specialized markets. If we are required to record a material charge against earnings in connection with a change in estimated insurance reserves, the occurrence of a catastrophic event, or if we incur significant losses related to our investment portfolio, which severely deteriorates our capital position, we may violate these minimum capital adequacy requirements unless we are able to raise sufficient additional capital. We may be limited in our ability to raise significant amounts of capital on favorable terms or at all.
Globally, insurance regulators are working cooperatively to develop a common framework for the supervision of internationally active insurance groups that includes an International Capital Standard (ICS) that may need to be implemented on a group basis. Finalization and adoption of this framework, including the ICS, could increase our prescribed capital requirement, the level at which regulatory scrutiny intensifies, as well as significantly increase our cost of regulatory compliance.
Our insurance subsidiaries, upon whom we depend for dividends in order to fund our corporate obligations, are limited by insurance regulators in their ability to pay dividends.
We are a holding company and are dependent upon dividends, loans and other sources of cash from our subsidiaries in order to meet our obligations. Ordinary dividend payments, or dividends that do not require prior approval by the insurance subsidiaries' domiciliary insurance regulator, are generally limited to amounts determined by formulas that vary by jurisdiction. If we are restricted from paying or receiving intercompany dividends, by regulatory rule or otherwise, we may not be able to fund our corporate obligations and debt service requirements or pay our stockholders dividends from available cash. As a result, we would need to look to other sources of capital which may be more expensive or may not be available at all.
Rating agencies may downgrade their ratings of us and thereby adversely affect our ability to write insurance at competitive rates or at all.
Ratings are an important factor in establishing the competitive position of insurance companies. Our insurance company subsidiaries, as well as our public debt, are rated by rating agencies, including, A.M. Best Company (A.M. Best), Moody's Investors Service, Inc. (Moody's) and Standard & Poor's (S&P). Ratings reflect the rating
12
agency's opinions of an insurance company's or insurance holding company's financial strength, capital adequacy, enterprise risk management practices, operating performance, strategic position and ability to meet its obligations to policyholders and debt holders.
The rating agencies may take action to lower our ratings in the future as a result of any significant financial loss or possible changes in the methodology or criteria applied by the rating agencies. The severity of the impact on our business is dependent on the level of downgrade and, for certain products, which rating agency takes the rating action. Among the adverse effects in the event of such downgrades would be the inability to obtain a material volume of business from certain major insurance brokers, the inability to sell a material volume of our insurance products to certain markets and the required collateralization of certain future payment obligations or reserves.
In addition, it is possible that a significant lowering of the corporate debt ratings of Loews by certain of the rating agencies could result in an adverse effect on our ratings, independent of any change in our circumstances.
We are subject to extensive existing state, local, federal and foreign governmental regulations that restrict our ability to do business and generate revenues; additional regulation or significant modification to existing regulations or failure to comply with regulatory requirements may have a materially adverse effect on our business, our operations and financial condition.
The insurance industry is subject to comprehensive and detailed regulation and supervision. Most insurance regulations are designed to protect the interests of our policyholders and third-party claimants, rather than our investors. Each jurisdiction in which we do business has established supervisory agencies that regulate the manner in which we do business. Any changes in regulation could impose significant burdens on us. In addition, the Lloyd's marketplace sets rules under which its members, including our Hardy syndicate, operate.
These rules and regulations relate to, among other things, the standards of solvency (including risk-based capital measures), government-supported backstops for certain catastrophic events (including terrorism), investment restrictions, accounting and reporting methodology, establishment of reserves and potential assessments of funds to settle covered claims against impaired, insolvent or failed private or quasi-governmental insurers.
Regulatory powers also extend to premium rate regulations which require that rates not be excessive, inadequate or unfairly discriminatory. State jurisdictions ensure compliance with such regulations through market conduct exams, which may result in losses to the extent non-compliance is ascertained, either as a result of failure to document transactions properly or failure to comply with internal guidelines, or otherwise. The jurisdictions in which we do business may also require us to provide coverage to persons whom we would not otherwise consider eligible or restrict us from withdrawing from unprofitable lines of business or unprofitable market areas. Each jurisdiction dictates the types of insurance and the level of coverage that must be provided to such involuntary risks. Our share of these involuntary risks is mandatory and generally a function of our respective share of the voluntary market by line of insurance in each jurisdiction.
Changes in accounting principles and financial reporting requirements could adversely affect our results of operations or financial condition.
We are required to prepare our financial statements in accordance with accounting principles generally accepted in the United States of America (GAAP), as promulgated by the Financial Accounting Standards Board (FASB). It is possible that future accounting standards that we are required to adopt could change the current accounting treatment that we apply to our consolidated financial statements and that such changes could have a material adverse effect on our results of operations and financial condition. For a description of changes in accounting standards that are currently pending and, if known, our estimates of their expected impact, see Note
A
to the Consolidated Financial Statements included under Item 8.
13
ITEM 1B. UNRESOLVED STAFF COMMENTS
None.
ITEM 2. PROPERTIES
We lease office space in various cities throughout the U.S. and in other countries. The following table sets forth certain information with respect to our principal office locations.
|
Location
|
Amount (Square Feet) of Space Leased and Occupied by CNA
|
Principal Usage
|
||
|
151 N. Franklin Street, Chicago, Illinois
|
245,582
|
|
Principal executive offices of CNAF
|
|
|
333 S. Wabash Avenue, Chicago, Illinois
|
104,393
|
|
Corporate offices
|
|
|
500 Colonial Center Parkway, Lake Mary, Florida
|
73,191
|
|
Property and casualty insurance offices
|
|
|
125 S. Broad Street, New York, New York
|
52,341
|
|
Property and casualty insurance offices
|
|
|
101 S. Reid Street, Sioux Falls, South Dakota
|
49,222
|
|
Property and casualty insurance offices
|
|
|
1 Meridian Boulevard, Wyomissing, Pennsylvania
|
47,629
|
|
Property and casualty insurance offices
|
|
|
4150 N. Drinkwater Boulevard, Scottsdale, Arizona
|
43,354
|
|
Property and casualty insurance offices
|
|
|
801 Warrenville Road, #700, Lisle, Illinois
|
28,421
|
|
Property and casualty insurance offices
|
|
|
20 Fenchurch Street, London, U.K.
|
25,641
|
|
Property and casualty insurance offices
|
|
|
66 Wellington Street, Toronto, O.N.
|
24,226
|
|
Property and casualty insurance offices
|
|
We lease all of the office space described above. We consider our properties to be in generally good condition, well maintained and suitable and adequate to carry on our business.
ITEM 3. LEGAL PROCEEDINGS
Information on our legal proceedings is set forth in Note
F
to the Consolidated Financial Statements included under Item 8.
ITEM 4. MINE SAFETY DISCLOSURES
Not applicable.
14
PART II
ITEM 5. MARKET FOR REGISTRANT'S COMMON EQUITY, RELATED STOCKHOLDER MATTERS AND ISSUER PURCHASES OF EQUITY SECURITIES
Our common stock is listed on the New York Stock Exchange and the Chicago Stock Exchange under the symbol CNA.
As of
February 8, 2019
, we had
271,469,504
shares of common stock outstanding and approximately 89% of our outstanding common stock was owned by Loews. We had 936 stockholders of record as of
February 8, 2019
according to the records maintained by our transfer agent.
Our Board of Directors has approved an authorization to purchase, in the open market or through privately negotiated transactions, our outstanding common stock, as our management deems appropriate. No repurchases were made in
2018
or
2017
.
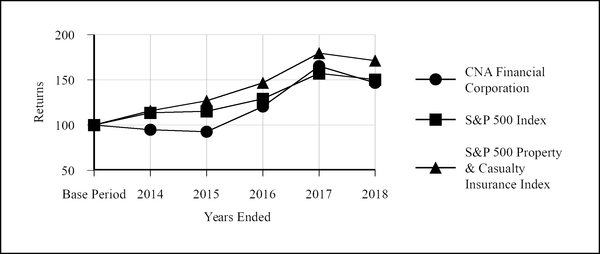
The following graph compares the five-year total return of our common stock, the Standard & Poor's 500 (S&P 500) Index and the S&P 500 Property & Casualty Insurance Index. The graph assumes that the value of the investment in our common stock and each index was $100 at the base period, January 1, 2014, and that dividends, if any, were reinvested.
|
Company / Index
|
Base Period
|
2014
|
2015
|
2016
|
2017
|
2018
|
|||||||||||||||||
|
CNA Financial Corporation
|
$
|
100.00
|
|
$
|
94.76
|
|
$
|
92.57
|
|
$
|
120.56
|
|
$
|
165.09
|
|
$
|
146.66
|
|
|||||
|
S&P 500 Index
|
100.00
|
|
113.69
|
|
115.26
|
|
129.05
|
|
157.22
|
|
150.33
|
|
|||||||||||
|
S&P 500 Property & Casualty Insurance Index
|
100.00
|
|
115.74
|
|
126.77
|
|
146.69
|
|
179.52
|
|
171.10
|
|
|||||||||||
15
ITEM 6. SELECTED CONSOLIDATED FINANCIAL DATA
The following table presents selected consolidated financial data. The table should be read in conjunction with Item 7 Management's Discussion and Analysis of Financial Condition and Results of Operations and Item 8 Financial Statements and Supplementary Data of this Form 10-K.
|
As of or for the years ended December 31
|
|||||||||||||||||||
|
(In millions, except per share data)
|
2018
|
2017
|
2016
|
2015
|
2014
|
||||||||||||||
|
Results of Operations:
|
|||||||||||||||||||
|
Revenues
|
$
|
10,134
|
|
$
|
9,542
|
|
$
|
9,366
|
|
$
|
9,101
|
|
$
|
9,692
|
|
||||
|
Income (loss) from continuing operations, net of tax
|
$
|
813
|
|
$
|
899
|
|
$
|
859
|
|
$
|
479
|
|
$
|
888
|
|
||||
|
(Loss) income from discontinued operations, net of tax
|
—
|
|
—
|
|
—
|
|
—
|
|
(197
|
)
|
|||||||||
|
Net income (loss)
|
$
|
813
|
|
$
|
899
|
|
$
|
859
|
|
$
|
479
|
|
$
|
691
|
|
||||
|
Basic Earnings (Loss) Per Share:
|
|||||||||||||||||||
|
Income (loss) from continuing operations
|
$
|
2.99
|
|
$
|
3.32
|
|
$
|
3.18
|
|
$
|
1.77
|
|
$
|
3.29
|
|
||||
|
(Loss) income from discontinued operations
|
—
|
|
—
|
|
—
|
|
—
|
|
(0.73
|
)
|
|||||||||
|
Basic earnings (loss) per share
|
$
|
2.99
|
|
$
|
3.32
|
|
$
|
3.18
|
|
$
|
1.77
|
|
$
|
2.56
|
|
||||
|
Diluted Earnings (Loss) Per Share:
|
|||||||||||||||||||
|
Income (loss) from continuing operations
|
$
|
2.98
|
|
$
|
3.30
|
|
$
|
3.17
|
|
$
|
1.77
|
|
$
|
3.28
|
|
||||
|
(Loss) income from discontinued operations
|
—
|
|
—
|
|
—
|
|
—
|
|
(0.73
|
)
|
|||||||||
|
Diluted earnings (loss) per share
|
$
|
2.98
|
|
$
|
3.30
|
|
$
|
3.17
|
|
$
|
1.77
|
|
$
|
2.55
|
|
||||
|
Dividends declared per common share
|
$
|
3.30
|
|
$
|
3.10
|
|
$
|
3.00
|
|
$
|
3.00
|
|
$
|
2.00
|
|
||||
|
Financial Condition:
|
|||||||||||||||||||
|
Total investments
|
$
|
44,486
|
|
$
|
46,870
|
|
$
|
45,420
|
|
$
|
44,699
|
|
$
|
46,262
|
|
||||
|
Total assets
|
57,152
|
|
56,567
|
|
55,233
|
|
55,045
|
|
55,564
|
|
|||||||||
|
Insurance reserves
|
36,764
|
|
37,212
|
|
36,431
|
|
36,486
|
|
36,380
|
|
|||||||||
|
Long and short term debt
|
2,680
|
|
2,858
|
|
2,710
|
|
2,560
|
|
2,557
|
|
|||||||||
|
Stockholders' equity
|
11,217
|
|
12,244
|
|
11,969
|
|
11,756
|
|
12,794
|
|
|||||||||
|
Book value per common share
|
$
|
41.32
|
|
$
|
45.15
|
|
$
|
44.25
|
|
$
|
43.49
|
|
$
|
47.39
|
|
||||
16
ITEM 7. MANAGEMENT'S DISCUSSION AND ANALYSIS OF FINANCIAL CONDITION AND RESULTS OF OPERATIONS
Index to this MD&A
Management's discussion and analysis of financial condition and results of operations is comprised of the following sections:
|
Page No.
|
|
17
OVERVIEW
The following discussion should be read in conjunction with Item 1A Risk Factors, Item 6 Selected Financial Data and Item 8 Financial Statements and Supplementary Data of this Form 10-K.
CRITICAL ACCOUNTING ESTIMATES
The preparation of Consolidated Financial Statements in conformity with GAAP requires us to make estimates and assumptions that affect the reported amounts of assets and liabilities and the disclosure of contingent assets and liabilities at the date of the Consolidated Financial Statements and the amount of revenues and expenses reported during the period. Actual results may differ from those estimates.
Our Consolidated Financial Statements and accompanying notes have been prepared in accordance with GAAP applied on a consistent basis. We continually evaluate the accounting policies and estimates used to prepare the Consolidated Financial Statements. In general, our estimates are based on historical experience, evaluation of current trends, information from third-party professionals and various other assumptions that are believed to be reasonable under the known facts and circumstances.
The accounting estimates discussed below are considered by us to be critical to an understanding of our Consolidated Financial Statements as their application places the most significant demands on our judgment. Note
A
to the Consolidated Financial Statements included under Item 8 should be read in conjunction with this section to assist with obtaining an understanding of the underlying accounting policies related to these estimates. Due to the inherent uncertainties involved with these types of judgments, actual results could differ significantly from our estimates and may have a material adverse impact on our results of operations, equity, business, and insurer financial strength and corporate debt ratings.
Insurance Reserves
Insurance reserves are established for both short and long-duration insurance contracts. Short-duration contracts are primarily related to property and casualty insurance policies where the reserving process is based on actuarial estimates of the amount of loss, including amounts for known and unknown claims. Long-duration contracts are primarily related to long term care policies and are estimated using actuarial estimates about morbidity and persistency as well as assumptions about expected investment returns and future premium rate increases. The reserve for unearned premiums represents the portion of premiums written related to the unexpired terms of coverage. The reserving process is discussed in further detail in the Reserves-Estimates and Uncertainties section below.
Reinsurance and Insurance Receivables
Exposure exists with respect to the collectibility of ceded property and casualty and life reinsurance to the extent that any reinsurer is unable to meet its obligations or disputes the liabilities we have ceded under reinsurance agreements. An allowance for uncollectible reinsurance is recorded on the basis of periodic evaluations of balances due from reinsurers, reinsurer solvency, industry experience and current economic conditions. Further information on our reinsurance receivables is in Note
G
to the Consolidated Financial Statements included under Item 8.
Additionally, exposure exists with respect to the collectibility of amounts due from policyholders related to insurance contracts, including amounts due from insureds under high deductible policies and retrospectively rated policies. An allowance for uncollectible insurance receivables is recorded on the basis of periodic evaluations of balances due from insureds, currently as well as in the future, historical business default data, management's experience and current economic conditions.
If actual experience differs from the estimates made by management in determining the allowances for uncollectible reinsurance and insurance receivables, net receivables as reflected on our Consolidated Balance Sheets may not be collected. Therefore, our results of operations or equity could be materially adversely affected.
18
Valuation of Investments and Impairment of Securities
Our fixed maturity and equity securities are carried at fair value on the balance sheet. Fair value represents the price that would be received in a sale of an asset in an orderly transaction between market participants on the measurement date, the determination of which requires us to make a significant number of assumptions and judgments. Securities with the greatest level of subjectivity around valuation are those that rely on inputs that are significant to the estimated fair value and that are not observable in the market or cannot be derived principally from or corroborated by observable market data. These unobservable inputs are based on assumptions consistent with what we believe other market participants would use to price such securities. Further information on our fair value measurements is in Note
C
to the Consolidated Financial Statements included under Item 8.
Our fixed maturity securities are subject to market declines below amortized cost that may be other-than-temporary and therefore result in the recognition of impairment losses in earnings. Factors considered in the determination of whether or not a decline is other-than-temporary include a current intention or need to sell the security or an indication that a credit loss exists. Significant judgment exists regarding the evaluation of the financial condition and expected near-term and long-term prospects of the issuer or the underlying collateral, the relevant industry conditions and trends, and whether we expect to receive cash flows sufficient to recover the entire amortized cost basis of the security. Further information on our process for evaluating impairments is in Note
A
to the Consolidated Financial Statements included under Item 8.
Long Term Care Policies
Future policy benefit reserves for our long term care policies are based on certain assumptions, including morbidity, persistency, inclusive of mortality, discount rates and future premium rate increases. The adequacy of the reserves is contingent upon actual experience and our future expectations related to these key assumptions. If actual or expected future experience differs from these assumptions, the reserves may not be adequate, requiring us to add to reserves.
A prolonged period during which interest rates remain at levels lower than those anticipated in our reserving discount rate assumption could result in shortfalls in investment income on assets supporting our obligations under long term care policies, which may also require an increase to our reserves. In addition, we may not receive regulatory approval for the premium rate increases we request.
These changes to our reserves could materially adversely impact our results of operations and equity. The reserving process is discussed in further detail in the Reserves - Estimates and Uncertainties section below.
Income Taxes
We account for income taxes under the asset and liability method. Under this method, deferred income taxes are recognized for temporary differences between the financial statement and tax return basis of assets and liabilities. Any resulting future tax benefits are recognized to the extent that realization of such benefits is more likely than not, and a valuation allowance is established for any portion of a deferred tax asset that management believes will not be realized. The assessment of the need for a valuation allowance requires management to make estimates and assumptions about future earnings, reversal of existing temporary differences and available tax planning strategies. If actual experience differs from these estimates and assumptions, the recorded deferred tax asset may not be fully realized resulting in an increase to income tax expense in our results of operations. In addition, the ability to record deferred tax assets in the future could be limited, resulting in a higher effective tax rate in that future period.
19
RESERVES - ESTIMATES AND UNCERTAINTIES
The level of reserves we maintain represents our best estimate, as of a particular point in time, of what the ultimate settlement and administration of claims will cost based on our assessment of facts and circumstances known at that time. Reserves are not an exact calculation of liability but instead are complex estimates that we derive, generally utilizing a variety of actuarial reserve estimation techniques, from numerous assumptions and expectations about future events, both internal and external, many of which are highly uncertain. As noted below, we review our reserves for each segment of our business periodically, and any such review could result in the need to increase reserves in amounts which could be material and could adversely affect our results of operations, equity, business and insurer financial strength and corporate debt ratings. Further information on reserves is provided in Note
E
to the Consolidated Financial Statements included under Item 8.
Property and Casualty Claim and Claim Adjustment Expense Reserves
We maintain loss reserves to cover our estimated ultimate unpaid liability for claim and claim adjustment expenses, including the estimated cost of the claims adjudication process, for claims that have been reported but not yet settled (case reserves) and claims that have been incurred but not reported (IBNR). IBNR includes a provision for development on known cases as well as a provision for late reported incurred claims. Claim and claim adjustment expense reserves are reflected as liabilities and are included on the Consolidated Balance Sheets under the heading “Insurance Reserves.” Adjustments to prior year reserve estimates, if necessary, are reflected in results of operations in the period that the need for such adjustments is determined. The carried case and IBNR reserves as of each balance sheet date are provided in the Segment Results section of this MD&A and in Note
E
to the Consolidated Financial Statements included under Item 8.
As discussed in the Risk Factors discussion within Item 1A, there is a risk that our recorded reserves are insufficient to cover our estimated ultimate unpaid liability for claims and claim adjustment expenses. Unforeseen emerging or potential claims and coverage issues are difficult to predict and could materially adversely affect the adequacy of our claim and claim adjustment expense reserves and could lead to future reserve additions.
In addition, our property and casualty insurance subsidiaries also have actual and potential exposures related to A&EP claims, which could result in material losses. To mitigate the risks posed by our exposure to A&EP claims and claim adjustment expenses, we completed a transaction with NICO under which substantially all of our legacy A&EP liabilities were ceded to NICO effective January 1, 2010. See Note
E
to the Consolidated Financial Statements included under Item 8 for further discussion about the transaction with NICO, its impact on our results of operations and the deferred retroactive reinsurance gain.
Establishing Property & Casualty Reserve Estimates
In developing claim and claim adjustment expense (“loss” or “losses”) reserve estimates, our actuaries perform detailed reserve analyses that are staggered throughout the year. The data is organized at a reserve group level. A reserve group can be a line of business covering a subset of insureds such as commercial automobile liability for small or middle market customers, it can encompass several lines of business provided to a specific set of customers such as aging services, or it can be a particular type of claim such as construction defect. Every reserve group is reviewed at least once during the year, but most are reviewed more frequently. The analyses generally review losses gross of ceded reinsurance and apply the ceded reinsurance terms to the gross estimates to establish estimates net of reinsurance. In addition to the detailed analyses, we review actual loss emergence for all products each quarter.
Most of our business can be characterized as long-tail. For long-tail business, it will generally be several years between the time the business is written and the time when all claims are settled. Our long-tail exposures include commercial automobile liability, workers' compensation, general liability, medical professional liability, other professional liability and management liability coverages, assumed reinsurance run-off and products liability. Short-tail exposures include property, commercial automobile physical damage, marine, surety and warranty. Specialty, Commercial and International contain both long-tail and short-tail exposures. Corporate & Other contains run-off long-tail exposures.
Various methods are used to project ultimate losses for both long-tail and short-tail exposures.
20
The paid development method estimates ultimate losses by reviewing paid loss patterns and applying them to accident or policy years with further expected changes in paid losses. Selection of the paid loss pattern may require consideration of several factors, including the impact of inflation on claim costs, the rate at which claims professionals make claim payments and close claims, the impact of judicial decisions, the impact of underwriting changes, the impact of large claim payments and other factors. Claim cost inflation itself may require evaluation of changes in the cost of repairing or replacing property, changes in the cost of medical care, changes in the cost of wage replacement, judicial decisions, legislative changes and other factors. Because this method assumes that losses are paid at a consistent rate, changes in any of these factors can affect the results. Since the method does not rely on case reserves, it is not directly influenced by changes in their adequacy.
For many reserve groups, paid loss data for recent periods may be too immature or erratic for accurate predictions. This situation often exists for long-tail exposures. In addition, changes in the factors described above may result in inconsistent payment patterns. Finally, estimating the paid loss pattern subsequent to the most mature point available in the data analyzed often involves considerable uncertainty for long-tail products such as workers' compensation.
The incurred development method is similar to the paid development method, but it uses case incurred losses instead of paid losses. Since the method uses more data (case reserves in addition to paid losses) than the paid development method, the incurred development patterns may be less variable than paid patterns. However, selection of the incurred loss pattern typically requires analysis of all of the same factors described above. In addition, the inclusion of case reserves can lead to distortions if changes in case reserving practices have taken place, and the use of case incurred losses may not eliminate the issues associated with estimating the incurred loss pattern subsequent to the most mature point available.
The loss ratio method multiplies earned premiums by an expected loss ratio to produce ultimate loss estimates for each accident or policy year. This method may be useful for immature accident or policy periods or if loss development patterns are inconsistent, losses emerge very slowly or there is relatively little loss history from which to estimate future losses. The selection of the expected loss ratio typically requires analysis of loss ratios from earlier accident or policy years or pricing studies and analysis of inflationary trends, frequency trends, rate changes, underwriting changes and other applicable factors.
The Bornhuetter-Ferguson method using paid loss is a combination of the paid development method and the loss ratio method. This method normally determines expected loss ratios similar to the approach used to estimate the expected loss ratio for the loss ratio method and typically requires analysis of the same factors described above. This method assumes that future losses will develop at the expected loss ratio level. The percent of paid loss to ultimate loss implied from the paid development method is used to determine what percentage of ultimate loss is yet to be paid. The use of the pattern from the paid development method typically requires consideration of the same factors listed in the description of the paid development method. The estimate of losses yet to be paid is added to current paid losses to estimate the ultimate loss for each year. For long-tail lines, this method will react very slowly if actual ultimate loss ratios are different from expectations due to changes not accounted for by the expected loss ratio calculation.
The Bornhuetter-Ferguson method using incurred loss is similar to the Bornhuetter-Ferguson method using paid loss except that it uses case incurred losses. The use of case incurred losses instead of paid losses can result in development patterns that are less variable than paid patterns. However, the inclusion of case reserves can lead to distortions if changes in case reserving have taken place, and the method typically requires analysis of the same factors that need to be reviewed for the loss ratio and incurred development methods.
The frequency times severity method multiplies a projected number of ultimate claims by an estimated ultimate average loss for each accident or policy year to produce ultimate loss estimates. Since projections of the ultimate number of claims are often less variable than projections of ultimate loss, this method can provide more reliable results for reserve groups where loss development patterns are inconsistent or too variable to be relied on exclusively. In addition, this method can more directly account for changes in coverage that affect the number and size of claims. However, this method can be difficult to apply to situations where very large claims or a substantial number of unusual claims result in volatile average claim sizes. Projecting the ultimate number of claims may require analysis of several factors, including the rate at which policyholders report claims to us, the impact of judicial decisions, the impact of underwriting changes and other factors. Estimating the ultimate average loss may require
21
analysis of the impact of large losses and claim cost trends based on changes in the cost of repairing or replacing property, changes in the cost of medical care, changes in the cost of wage replacement, judicial decisions, legislative changes and other factors.
Stochastic modeling produces a range of possible outcomes based on varying assumptions related to the particular reserve group being modeled. For some reserve groups, we use models which rely on historical development patterns at an aggregate level, while other reserve groups are modeled using individual claim variability assumptions supplied by the claims department. In either case, multiple simulations using varying assumptions are run and the results are analyzed to produce a range of potential outcomes. The results will typically include a mean and percentiles of the possible reserve distribution which aid in the selection of a point estimate.
For many exposures, especially those that can be considered long-tail, a particular accident or policy year may not have a sufficient volume of paid losses to produce a statistically reliable estimate of ultimate losses. In such a case, our actuaries typically assign more weight to the incurred development method than to the paid development method. As claims continue to settle and the volume of paid loss increases, the actuaries may assign additional weight to the paid development method. For most of our products, even the incurred losses for accident or policy years that are early in the claim settlement process will not be of sufficient volume to produce a reliable estimate of ultimate losses. In these cases, we may not assign much, if any, weight to the paid and incurred development methods. We may use the loss ratio, Bornhuetter-Ferguson and/or frequency times severity methods. For short-tail exposures, the paid and incurred development methods can often be relied on sooner, primarily because our history includes a sufficient number of years to cover the entire period over which paid and incurred losses are expected to change. However, we may also use the loss ratio, Bornhuetter-Ferguson and/or frequency times severity methods for short-tail exposures.
For other more complex reserve groups where the above methods may not produce reliable indications, we use additional methods tailored to the characteristics of the specific situation.
Periodic Reserve Reviews
The reserve analyses performed by our actuaries result in point estimates. Each quarter, the results of the detailed reserve reviews are summarized and discussed with senior management to determine the best estimate of reserves. Senior management considers many factors in making this decision. Our recorded reserves reflect our best estimate as of a particular point in time based upon known facts and circumstances, consideration of the factors cited above and our judgment. The carried reserve differs from the actuarial point estimate as discussed further below.
Currently, our recorded reserves are modestly higher than the actuarial point estimate. For Commercial, Specialty and International, the difference between our reserves and the actuarial point estimate is primarily driven by uncertainty with respect to immature accident years,
claim cost inflation, changes in claims handling, changes to the tort environment which may adversely affect claim costs and the effects from the economy. For Corporate & Other, the difference between our reserves and the actuarial point estimate is primarily driven by the potential tail volatility of run-off exposures.
The key assumptions fundamental to the reserving process are often different for various reserve groups and accident or policy years. Some of these assumptions are explicit assumptions that are required of a particular method, but most of the assumptions are implicit and cannot be precisely quantified. An example of an explicit assumption is the pattern employed in the paid development method. However, the assumed pattern is itself based on several implicit assumptions such as the impact of inflation on medical costs and the rate at which claim professionals close claims. As a result, the effect on reserve estimates of a particular change in assumptions typically cannot be specifically quantified, and changes in these assumptions cannot be tracked over time.
Our recorded reserves are management's best estimate. In order to provide an indication of the variability associated with our net reserves, the following discussion provides a sensitivity analysis that shows the approximate estimated impact of variations in significant factors affecting our reserve estimates for particular types of business. These significant factors are the ones that we believe could most likely materially affect the reserves. This discussion covers the major types of business for which we believe a material deviation to our reserves is reasonably possible. There can be no assurance that actual experience will be consistent with the current assumptions or with the variation indicated by the discussion. In addition, there can be no assurance that other factors and assumptions will not have a material impact on our reserves.
22
The three areas for which we believe a significant deviation to our net reserves is reasonably possible are (i) professional liability, management liability and surety products; (ii) workers' compensation; and (iii) general liability.
Professional liability, management liability and surety products include professional liability coverages provided to various professional firms, including architects, real estate agents, small and mid-sized accounting firms, law firms and other professional firms. They also include directors and officers (D&O), employment practices, fiduciary, fidelity and surety coverages, as well as insurance products serving the healthcare delivery system. The most significant factor affecting reserve estimates for these liability coverages is claim severity. Claim severity is driven by the cost of medical care, the cost of wage replacement, legal fees, judicial decisions, legislative changes and other factors. Underwriting and claim handling decisions, such as the classes of business written and individual claim settlement decisions, can also affect claim severity. If the estimated claim severity increases by 9%, we estimate that net reserves would increase by approximately $400 million. If the estimated claim severity decreases by 3%, we estimate that net reserves would decrease by approximately $150 million. Our net reserves for these products were approximately $4.7 billion as of
December 31, 2018
.
For workers' compensation, since many years will pass from the time the business is written until all claim payments have been made, the most significant factor affecting workers' compensation reserve estimates is claim cost inflation on claim payments. Workers' compensation claim cost inflation is driven by the cost of medical care, the cost of wage replacement, expected claimant lifetimes, judicial decisions, legislative changes and other factors. If estimated workers' compensation claim cost inflation increases by 100 basis points for the entire period over which claim payments will be made, we estimate that our net reserves would increase by approximately $350 million. If estimated workers' compensation claim cost inflation decreases by 100 basis points for the entire period over which claim payments will be made, we estimate that our net reserves would decrease by approximately $300 million. Our net reserves for workers' compensation were approximately $4.0 billion as of
December 31, 2018
.
For general liability, the most significant factor affecting reserve estimates is claim severity. Claim severity is driven by changes in the cost of repairing or replacing property, the cost of medical care, the cost of wage replacement, judicial decisions, legislation and other factors. If the estimated claim severity for general liability increases by 6%, we estimate that our net reserves would increase by approximately $200 million. If the estimated claim severity for general liability decreases by 3%, we estimate that our net reserves would decrease by approximately $100 million. Our net reserves for general liability were approximately $3.4 billion as of
December 31, 2018
.
Given the factors described above, it is not possible to quantify precisely the ultimate exposure represented by claims and related litigation. As a result, we regularly review the adequacy of our reserves and reassess our reserve estimates as historical loss experience develops, additional claims are reported and settled and additional information becomes available in subsequent periods. In reviewing our reserve estimates, we make adjustments in the period that the need for such adjustments is determined. These reviews have resulted in our identification of information and trends that have caused us to change our reserves in prior periods and could lead to our identification of a need for additional material increases or decreases in claim and claim adjustment expense reserves, which could materially affect our results of operations, equity, business and insurer financial strength and corporate debt ratings positively or negatively. See discussion within Note
E
to the Consolidated Financial Statements included under Item 8 for additional information about reserve development and the Ratings section of this MD&A for further information regarding our financial strength and corporate debt ratings.
Life & Group Policyholder Reserves
Our Life & Group segment includes our run-off long term care business as well as structured settlement obligations not funded by annuities related to certain property and casualty claimants. Long term care policies provide benefits for nursing homes, assisted living facilities and home health care subject to various daily and lifetime caps. Generally, policyholders must continue to make periodic premium payments to keep the policy in force and we have the ability to increase policy premiums, subject to state regulatory approval.
We maintain both claim and claim adjustment expense reserves as well as future policy benefit reserves for policyholder benefits for our Life & Group segment. Claim and claim adjustment expense reserves consist of estimated reserves for long term care policyholders that are currently receiving benefits, including claims that have
23
been incurred but are not yet reported. In developing the claim and claim adjustment expense reserve estimates for our long term care policies, our actuaries perform a detailed claim experience study on an annual basis. The study reviews the sufficiency of existing reserves for policyholders currently on claim and includes an evaluation of expected benefit utilization and claim duration. Our recorded claim and claim adjustment expense reserves reflect management's best estimate after incorporating the results of the most recent study. In addition, claim and claim adjustment expense reserves are also maintained for the structured settlement obligations.
Future policy benefit reserves represent the active life reserves related to our long term care policies and are the present value of expected future benefit payments and expenses less expected future premium. The determination of these reserves is fundamental to our financial results and requires management to make estimates and assumptions about expected investment and policyholder experience over the life of the contract. Since many of these contracts may be in force for several decades, these assumptions are subject to significant estimation risk.
The actuarial assumptions that management believes are subject to the most variability are morbidity, persistency, discount rate and anticipated future premium rate increases. Persistency can be affected by policy lapses, benefit reductions and death. Discount rate is influenced by the investment yield on assets supporting long term care reserves which is subject to interest rate and market volatility and may also be affected by changes to the Internal Revenue Code. As a result of this variability, our long term care reserves may be subject to material increases if actual experience develops adversely to our expectations.
Annually, management assesses the adequacy of its long term care future policy benefit reserves by performing a gross premium valuation (GPV) to determine if there is a premium deficiency. Management also uses the GPV process to evaluate the adequacy of the claim and claim adjustment expense reserves for structured settlement obligations. Under the GPV, management estimates required reserves using best estimate assumptions as of the date of the assessment without provisions for adverse deviation. The GPV required reserves are then compared to the recorded reserves. If the GPV required reserves are greater than the existing recorded reserves, the existing assumptions are unlocked and future policy benefit reserves are increased to the greater amount. Any such increase is reflected in our results of operations in the period in which the need for such adjustment is determined, and could materially adversely affect our results of operations, equity and business and insurer financial strength and corporate debt ratings. Periodically, management engages independent third parties to assess the appropriateness of its best estimate assumptions and the associated GPV required reserves. The last independent assessment was performed in
2017
.
Our most recent GPV indicated the future policy benefit reserves for our long term care business were not deficient in the aggregate, but profits are expected to be recognized in early years followed by losses in later years. In that circumstance, future policy benefit reserves are increased in the profitable years by an amount necessary to offset losses that are projected to be recognized in later years. The amount of the additional future policy benefit reserves recorded in each quarterly period is based on the ratio of the present value of future losses divided by the present value of future profits from the most recently completed GPV applied to long term care core income.
24
The GPV process was performed in the
third quarter of 2018
as compared to the fourth quarter in
2017
. The
September 30, 2018
GPV indicated our recorded reserves included a margin of approximately
$182 million
. A summary of the changes in the estimated reserve margin is presented in the table below:
|
Long Term Care Active Life Reserve - Change in estimated reserve margin (In millions)
|
|||
|
2017 Estimated Margin
|
$
|
246
|
|
|
Changes in underlying morbidity assumptions
|
(213
|
)
|
|
|
Changes in underlying persistency assumptions and inforce policy inventory
|
(86
|
)
|
|
|
Changes in underlying discount rate assumptions
|
17
|
|
|
|
Changes in underlying premium rate action assumptions
|
178
|
|
|
|
Changes in underlying expense and other assumptions
|
40
|
|
|
|
2018 Estimated Margin
|
$
|
182
|
|
The decrease in the margin in
2018
was driven by the removal of the future morbidity improvement assumption and extending the period of mortality improvement within the persistency assumptions. These unfavorable drivers were partially offset by higher than expected rate increases on active rate action programs and favorable changes to the underlying expense and discount rate assumptions.
The table below summarizes the estimated pretax impact on our results of operations from various hypothetical revisions to our active life reserve assumptions. The annual GPV process involves updating all assumptions to the then current best estimate, and historically all significant assumptions have been revised each year. In the Hypothetical Revisions table below, we have assumed that revisions to such assumptions would occur in each policy type, age and duration within each policy group and would occur absent any changes, mitigating or otherwise, in the other assumptions. Although such hypothetical revisions are not currently required or anticipated, we believe they could occur based on past variances in experience and our expectations of the ranges of future experience that could reasonably occur. Any required increase in the recorded reserves resulting from the hypothetical revision in the table below would first reduce the margin in our carried reserves before it would affect results of operations. Any actual adjustment would be dependent on the specific policies affected and, therefore, may differ from the estimates summarized below. The estimated impacts to results of operations in the table below are after consideration of the existing margin.
|
2018 GPV
|
|||
|
Estimated reduction to pretax income
|
|||
|
Hypothetical revisions (In millions)
|
|||
|
Morbidity:
|
|||
|
5% increase in morbidity
|
$
|
460
|
|
|
10% increase in morbidity
|
1,103
|
|
|
|
Persistency:
|
|||
|
5% decrease in active life mortality and lapse
|
$
|
31
|
|
|
10% decrease in active life mortality and lapse
|
253
|
|
|
|
Discount Rates:
|
|||
|
50 basis point decline in future interest rates
|
$
|
140
|
|
|
100 basis point decline in future interest rates
|
500
|
|
|
|
Premium Rate Actions:
|
|||
|
50% decrease in anticipated future premium rate increases
|
$
|
—
|
|
25
CATASTROPHES AND RELATED REINSURANCE
We generally define catastrophe loss events in the U.S. consistent with the definition of the Property Claims Service (PCS). PCS defines a catastrophe as an event that causes damage of $25 million or more in direct insured losses to property and affects a significant number of policyholders and insurers. For events outside of the U.S., we define a catastrophe as an industry recognized event that generates an accumulation of claims amounting to more than $1 million for the International segment.
Catastrophes are an inherent risk of the property and casualty insurance business and have contributed to material period-to-period fluctuations in our results of operations and/or equity. We reported catastrophe losses, net of reinsurance, of
$252 million
,
$380 million
and
$165 million
for the years ended
December 31, 2018
,
2017
and
2016
.
|
•
|
Net catastrophe losses for the year ended
December 31, 2018
included
$88 million
related to Hurricane Michael, $
47 million
related to the California wildfires and
$33 million
related to Hurricane Florence. The remaining net catastrophe losses in
2018
resulted primarily from U.S. weather related events.
|
|
•
|
Net catastrophe losses for the year ended
December 31, 2017
included $
256 million
related to Hurricanes Harvey, Irma and Maria and also required reinsurance reinstatement premium of
$4 million
. The remaining net catastrophe losses in
2017
resulted primarily from the California wildfires and U.S. weather related events.
|
|
•
|
Net catastrophe losses for the year ended
December 31, 2016
related primarily to U.S. weather-related events and the Fort McMurray wildfires.
|
We generally seek to manage our exposure to catastrophes through the purchase of catastrophe reinsurance and have catastrophe reinsurance treaties that cover property and workers’ compensation losses. We conduct an ongoing review of our risk and catastrophe coverages and from time to time make changes as we deem appropriate. The following discussion summarizes our most significant catastrophe reinsurance coverage at January 1, 2019.
Group North American Property Treaty
We purchased corporate catastrophe excess-of-loss treaty reinsurance covering our U.S. states and territories and Canadian property exposures underwritten in our North American and European companies. Exposures underwritten through Hardy are excluded. The treaty has a term of January 1, 2019 to May 1, 2020. The 2019 treaty provides coverage for the accumulation of losses from catastrophe occurrences above our per occurrence retention of
$250 million
up to $1.0 billion. There is no co-participation for the treaty term. Losses stemming from terrorism events are covered unless they are due to a nuclear, biological or chemical attack. All layers of the treaty provide for one full reinstatement.
Group Workers' Compensation Treaty
We also purchased corporate Workers' Compensation catastrophe excess-of-loss treaty reinsurance for the period January 1, 2019 to January 1, 2020 providing
$275 million
of coverage for the accumulation of covered losses related to natural catastrophes above our retention of
$25 million
. The treaty also provides
$475 million
of coverage for the accumulation of covered losses related to terrorism events above our retention of
$25 million
. Of this
$475 million
in Terrorism coverage,
$200 million
is provided for nuclear, biological chemical and radiation events. One full reinstatement is available for the first
$275 million
above the retention, regardless of the covered peril. We also purchased a targeted facultative facility to address exposure accumulations in specific peak Terrorism zones.
26
Terrorism Risk Insurance Program Reauthorization Act of 2015 (TRIPRA)
Our principal reinsurance protection against large-scale terrorist attacks, including nuclear, biological, chemical or radiological attacks, is the coverage currently provided through TRIPRA which runs through the end of 2020. TRIPRA provides a backstop for insurance-related losses resulting from any “act of terrorism”, which is certified by the Secretary of Treasury in consultation with the Secretary of Homeland Security for losses that exceed a threshold of $180 million industry-wide for calendar year 2019, with the threshold increasing to $200 million for 2020. Under the current provisions of the program, in 2019, the federal government will reimburse 81% of our covered losses in excess of our applicable deductible up to a total industry program cap of $100 billion. This amount will decrease to 80% in the year 2020. Our deductible is based on eligible commercial property and casualty earned premiums for the preceding calendar year. Based on 2018 earned premiums, our estimated deductible under the program is $1.4 billion for 2019. If an act of terrorism or acts of terrorism result in covered losses exceeding the $100 billion annual industry aggregate limit, Congress would be responsible for determining how additional losses in excess of $100 billion will be paid.
27
CONSOLIDATED OPERATIONS
Results of Operations
The following table includes the consolidated results of our operations including our financial measure, Core income (loss). For more detailed components of our business operations and a discussion of the core income (loss) financial measure, see the segment sections within this MD&A. For further discussion of Net investment income and Net realized investment results, see the Investments section of this MD&A.
|
Years ended December 31
|
|||||||||||
|
(In millions)
|
2018
|
2017
|
2016
|
||||||||
|
Operating Revenues
|
|||||||||||
|
Net earned premiums
|
$
|
7,312
|
|
$
|
6,988
|
|
$
|
6,924
|
|
||
|
Net investment income
|
1,817
|
|
2,034
|
|
1,988
|
|
|||||
|
Non-insurance warranty revenue
(1)
|
1,007
|
|
390
|
|
361
|
|
|||||
|
Other revenues
|
50
|
|
37
|
|
43
|
|
|||||
|
Total operating revenues
|
10,186
|
|
9,449
|
|
9,316
|
|
|||||
|
Claims, Benefits and Expenses
|
|||||||||||
|
Net incurred claims and benefits
|
5,547
|
|
5,288
|
|
5,270
|
|
|||||
|
Policyholders' dividends
|
25
|
|
22
|
|
13
|
|
|||||
|
Amortization of deferred acquisition costs
|
1,335
|
|
1,233
|
|
1,235
|
|
|||||
|
Other insurance related expenses
|
1,039
|
|
1,098
|
|
1,122
|
|
|||||
|
Non-insurance warranty expense
(1)
|
923
|
|
299
|
|
271
|
|
|||||
|
Other expenses
|
301
|
|
292
|
|
318
|
|
|||||
|
Total claims, benefits and expenses
|
9,170
|
|
8,232
|
|
8,229
|
|
|||||
|
Core income before income tax
|
1,016
|
|
1,217
|
|
1,087
|
|
|||||
|
Income tax expense on core income
|
(171
|
)
|
(298
|
)
|
(263
|
)
|
|||||
|
Core income
|
845
|
|
|
919
|
|
824
|
|
||||
|
Net realized investment (losses) gains
|
(52
|
)
|
93
|
|
50
|
|
|||||
|
Income tax benefit (expense) on net realized investment (losses) gains
|
14
|
|
(30
|
)
|
(15
|
)
|
|||||
|
Net realized investment (losses) gains, after tax
|
(38
|
)
|
63
|
|
35
|
|
|||||
|
Net deferred tax asset remeasurement
|
6
|
|
(83
|
)
|
—
|
|
|||||
|
Net income
|
$
|
813
|
|
$
|
899
|
|
$
|
859
|
|
||
|
(1)
|
See Notes A and R to the Consolidated Financial Statements included under Item 8 for further information regarding Non-insurance warranty revenue and Non-insurance warranty expense.
|
On December 22, 2017, H.R.1, “An Act to Provide for Reconciliation Pursuant to Titles II and V of the Concurrent Resolution on the Budget for Fiscal Year 2018,” was signed into law (Tax Reform Legislation). The Tax Reform Legislation provided for a permanent reduction in the Federal corporate income tax rate from 35% to 21% effective January 1, 2018, among other provisions. We were required to recognize the effect of the tax rate change on our deferred tax assets in the period the tax rate change was signed into law. Consequently, we recorded a non-cash increase to Income tax expense of
$83 million
in the Consolidated Statements of Operations for the year ended
December 31, 2017
. Based on the filed
2017
tax return, the effect of the tax rate change decreased Income tax expense by
$6 million
for the year ended
December 31, 2018
.
28
2018
Compared with
2017
Core income decreased
$74 million
in
2018
as compared with
2017
. Excluding the favorable effect of the Federal corporate income tax rate change, core income for our Property & Casualty Operations decreased approximately
$158 million
primarily due to lower net investment income driven by limited partnership returns and lower favorable net prior year loss reserve development partially offset by lower net catastrophe losses. Excluding the unfavorable effect of the Federal corporate income tax rate change which reduced the income tax benefit, core income for our Life & Group segment increased approximately
$42 million
while core loss for our Corporate & Other segment increased approximately
$46 million
.
Pretax net catastrophe losses were
$252 million
in
2018
as compared with
$380 million
in
2017
. Favorable net prior year loss reserve development of
$181 million
and
$308 million
was recorded in
2018
and
2017
related to our Specialty, Commercial, International and Corporate & Other segments. Further information on net prior year loss reserve development is in Note
E
to the Consolidated Financial Statements included under Item 8.
2017
Compared with
2016
Core income increased
$95 million
in
2017
as compared with
2016
. Core income for our Property & Casualty Operations declined
$23 million
primarily driven by higher net catastrophe losses partially offset by improved non-catastrophe current accident year underwriting results. Core loss for our operations outside of Property & Casualty Operations improved
$118 million
driven by lower adverse prior year A&EP reserve development.
Pretax net catastrophe losses were
$380 million
in
2017
as compared with
$165 million
in
2016
. Favorable net prior year loss reserve development of
$308 million
and
$288 million
was recorded in
2017
and
2016
related to our Specialty, Commercial, International and Corporate & Other segments. Further information on net prior year loss reserve development is in Note
E
to the Consolidated Financial Statements included under Item 8.
29
SEGMENT RESULTS
The following discusses the results of operations for our business segments.
Our property and casualty commercial insurance operations are managed and reported in three business segments: Specialty, Commercial and International, which we refer to collectively as Property & Casualty Operations. Specialty provides management and professional liability and other coverages through property and casualty products and services using a network of brokers, independent agencies and managing general underwriters. Commercial works with a network of brokers and independent agents to market a broad range of property and casualty insurance products and services to small, middle-market and large businesses. The International segment underwrites property and casualty coverages on a global basis through its U.K.-based insurance company, a branch operation in Canada as well as through its presence at Lloyd’s of London (Hardy).
Our operations outside of Property & Casualty Operations are managed and reported in two segments: Life & Group and Corporate & Other. Life & Group primarily includes the results of our long term care business that is in run-off. Corporate & Other primarily includes certain corporate expenses, including interest on corporate debt, and the results of certain property and casualty businesses in run-off, including CNA Re and A&EP. Intersegment eliminations are also included in this segment.
Our Property & Casualty Operations field structure in the U.S. consists of 49 underwriting locations. In addition, there are five centralized processing operations which handle policy processing, billing and collection activities and also act as call centers to optimize service. Our claim presence consists of six primary locations where we handle multiple claim types and key business functions. Additionally, regional claim offices are aligned with our underwriting field structure. We also have a presence in Canada and Europe consisting of 17 branch operations and access to business placed at Lloyd's of London through Hardy Syndicate 382.
Core income (loss) is calculated by excluding from net income (loss) the after-tax effects of i) net realized investment gains or losses, ii) income or loss from discontinued operations, iii) any cumulative effects of changes in accounting guidance and iv) deferred tax asset and liability remeasurement as a result of an enacted U.S. Federal tax rate change. The calculation of core income (loss) excludes net realized investment gains or losses because net realized investment gains or losses are generally driven by economic factors that are not necessarily consistent with key drivers of underwriting performance, and are therefore not considered an indication of trends in insurance operations. Management monitors core income (loss) for each business segment to assess segment performance. Presentation of consolidated core income (loss) is deemed to be a non-GAAP financial measure. See further discussion regarding how we manage our business and reconciliations of non-GAAP measures to the most comparable GAAP measures and other information in Note
O
to the Consolidated Financial Statements included under Item 8.
In evaluating the results of our Specialty, Commercial and International segments, we utilize the loss ratio, the expense ratio, the dividend ratio and the combined ratio. These ratios are calculated using GAAP financial results. The loss ratio is the percentage of net incurred claim and claim adjustment expenses to net earned premiums. The expense ratio is the percentage of insurance underwriting and acquisition expenses, including the amortization of deferred acquisition costs, to net earned premiums. The dividend ratio is the ratio of policyholders' dividends incurred to net earned premiums. The combined ratio is the sum of the loss, expense and dividend ratios. In addition, we also utilize renewal premium change, rate, retention and new business in evaluating operating trends. Renewal premium change represents the estimated change in average premium on policies that renew, including rate and exposure changes. Rate represents the average change in price on policies that renew excluding exposure change. Retention represents the percentage of premium dollars renewed in comparison to the expiring premium dollars from policies available to renew. Renewal premium change, rate and retention presented for the prior year are updated to reflect subsequent activity on policies written in the period. New business represents premiums from policies written with new customers and additional policies written with existing customers.
Changes in estimates of claim and claim adjustment expense reserves, net of reinsurance, for prior years are defined as net prior year loss reserve development within this MD&A. These changes can be favorable or unfavorable. Net prior year loss reserve development does not include the effect of related acquisition expenses. Further information on our reserves is provided in Note
E
to the Consolidated Financial Statements included under Item 8.
30
Specialty
Specialty provides management and professional liability and other coverages through property and casualty products and services using a network of brokers, independent agencies and managing general underwriters. Specialty includes the following business groups:
Management & Professional Liability
consists of the following coverages and products:
|
•
|
Professional liability coverages and risk management services to various professional firms, including but not limited to architects, real estate agents, accounting firms, and law firms.
|
|
•
|
D&O, employment practices, fiduciary and fidelity coverages. Specific areas of focus include small and mid-size firms, public as well as privately held firms and not-for-profit organizations.
|
|
•
|
Insurance products to serve the healthcare industry, including professional and general liability as well as associated standard property and casualty coverages. Key customer groups include aging services, allied medical facilities, dentists, physicians, hospitals, nurses and other medical practitioners.
|
Surety
offers small, medium and large contract and commercial surety bonds. Surety provides surety and fidelity bonds in all 50 states.
Warranty and Alternative Risks
provides extended service contracts and insurance products that provide protection from the financial burden associated with mechanical breakdown and other related losses, primarily for vehicles, portable electronic communication devices and other consumer goods. Service contracts are generally distributed by commission-based independent representatives and sold by auto dealerships and retailers in North America to customers in conjunction with the purchase of a new or used vehicle or new consumer goods. Additionally, our insurance companies may issue contractual liability insurance policies or guaranteed asset protection reimbursement insurance policies to cover the liabilities of these service contracts issued by affiliated entities or third parties.
31
The following table details the results of operations for Specialty.
|
Years ended December 31
|
|||||||||||
|
(In millions, except ratios, rate, renewal premium change and retention)
|
2018
|
2017
|
2016
|
||||||||
|
Net written premiums
|
$
|
2,744
|
|
$
|
2,731
|
|
$
|
2,738
|
|
||
|
Net earned premiums
|
2,732
|
|
2,712
|
|
2,743
|
|
|||||
|
Net investment income
|
439
|
|
522
|
|
497
|
|
|||||
|
Core income
|
629
|
|
582
|
|
606
|
|
|||||
|
Other performance metrics:
|
|||||||||||
|
Loss and loss adjustment expense ratio
|
55.9
|
%
|
56.5
|
%
|
54.3
|
%
|
|||||
|
Expense ratio
|
32.1
|
|
32.0
|
|
32.1
|
|
|||||
|
Dividend ratio
|
0.2
|
|
0.2
|
|
0.2
|
|
|||||
|
Combined ratio
|
88.2
|
%
|
88.7
|
%
|
86.6
|
%
|
|||||
|
Rate
|
2
|
%
|
1
|
%
|
1
|
%
|
|||||
|
Renewal premium change
|
3
|
|
3
|
|
2
|
|
|||||
|
Retention
|
84
|
|
89
|
|
88
|
|
|||||
|
New business
|
$
|
353
|
|
$
|
242
|
|
$
|
239
|
|
||
2018
Compared with
2017
Net written premiums for Specialty increased
$13 million
in
2018
as compared with
2017
driven by higher new business and positive renewal premium change partially offset by lower retention. The increase in net earned premiums was consistent with the trend in net written premiums.
Core income increased
$47 million
in
2018
as compared with
2017
. Excluding the favorable effect of the Federal corporate income tax rate change, core income decreased approximately
$60 million
due to lower net investment income driven by limited partnership returns and lower favorable net prior year loss reserve development partially offset by improved non-catastrophe current accident year underwriting results.
The combined ratio of
88.2%
improved
0.5
points in
2018
as compared with
2017
. The loss ratio improved
0.6
points primarily due to an improved current accident year loss ratio partially offset by lower favorable net prior year loss reserve development. Net catastrophe losses were
$26 million
, or
1.0
points of the loss ratio, for
2018
, as compared with
$44 million
, or
1.6
points of the loss ratio, for
2017
. The expense ratio in
2018
was consistent with the same period in
2017
.
Favorable net prior year loss reserve development of
$150 million
and
$174 million
was recorded in
2018
and
2017
. Further information on net prior year loss reserve development is in Note
E
to the Consolidated Financial Statements included under Item 8.
32
The following table summarizes the gross and net carried reserves for Specialty.
|
December 31
|
|||||||
|
(In millions)
|
2018
|
2017
|
|||||
|
Gross case reserves
|
$
|
1,623
|
|
$
|
1,742
|
|
|
|
Gross IBNR reserves
|
3,842
|
|
3,927
|
|
|||
|
Total gross carried claim and claim adjustment expense reserves
|
$
|
5,465
|
|
$
|
5,669
|
|
|
|
Net case reserves
|
$
|
1,483
|
|
$
|
1,600
|
|
|
|
Net IBNR reserves
|
3,348
|
|
3,407
|
|
|||
|
Total net carried claim and claim adjustment expense reserves
|
$
|
4,831
|
|
$
|
5,007
|
|
|
2017
Compared with
2016
Net written premiums for Specialty in
2017
were consistent with
2016
. New business, renewal premium change and retention also remained at consistent levels. The decrease in net earned premiums was consistent with net written premiums.
Core income decreased
$24 million
in
2017
as compared with
2016
, primarily due to lower favorable net prior year loss reserve development and higher net catastrophe losses partially offset by improved non-catastrophe current accident year underwriting results and higher net investment income.
The combined ratio of
88.7%
increased
2.1
points in
2017
as compared with
2016
. The loss ratio increased
2.2
points primarily due to lower favorable net prior year loss reserve development and higher net catastrophe losses. Net catastrophe losses were
$44 million
, or
1.6
points of the loss ratio, for
2017
, as compared with
$17 million
, or
0.6
points of the loss ratio, for
2016
. The loss ratio excluding catastrophes and development improved 1.5 points. The expense ratio in 2017 was consistent with the same period in 2016.
Favorable net prior year loss reserve development of
$174 million
and
$247 million
was recorded in
2017
and
2016
. Further information on net prior year loss reserve development is in Note
E
to the Consolidated Financial Statements included under Item 8.
33
Commercial
Commercial works with a network of brokers and independent agents to market a broad range of property and casualty insurance products and services to small, middle-market and large businesses. Property products include standard and excess property, marine and boiler and machinery coverages. Casualty products include standard casualty insurance products such as workers' compensation, general and product liability, commercial auto and umbrella coverages. Most insurance programs are provided on a guaranteed cost basis; however, we also offer specialized loss-sensitive insurance programs and total risk management services relating to claim and information services to the large commercial insurance marketplace. These property and casualty
products are offered through our Middle Market, Small Business and Other Commercial insurance groups.
The following table details the results of operations for Commercial.
|
Years ended December 31
|
|||||||||||
|
(In millions, except ratios, rate, renewal premium change and retention)
|
2018
|
2017
|
2016
|
||||||||
|
Net written premiums
|
$
|
3,060
|
|
$
|
2,922
|
|
$
|
2,883
|
|
||
|
Net earned premiums
|
3,050
|
|
2,881
|
|
2,840
|
|
|||||
|
Net investment income
|
500
|
|
658
|
|
657
|
|
|||||
|
Core income
|
357
|
|
369
|
|
355
|
|
|||||
|
Other performance metrics:
|
|||||||||||
|
Loss and loss adjustment expense ratio
|
67.3
|
%
|
67.0
|
%
|
67.1
|
%
|
|||||
|
Expense ratio
|
33.1
|
|
35.1
|
|
36.7
|
|
|||||
|
Dividend ratio
|
0.7
|
|
0.6
|
|
0.3
|
|
|||||
|
Combined ratio
|
101.1
|
%
|
102.7
|
%
|
104.1
|
%
|
|||||
|
Rate
|
1
|
%
|
0
|
%
|
(2
|
)%
|
|||||
|
Renewal premium change
|
3
|
|
3
|
|
3
|
|
|||||
|
Retention
|
85
|
|
86
|
|
84
|
|
|||||
|
New business
|
$
|
566
|
|
$
|
568
|
|
$
|
530
|
|
||
2018
Compared with
2017
Net written premiums for Commercial increased
$138 million
in
2018
as compared with
2017
. Premium rate adjustments in Small Business affected both net written premiums and net earned premiums as more fully discussed in Note
F
to the Consolidated Financial Statements included under Item 8. Excluding the effect of the Small Business premium rate adjustments, net written premiums increased
$86 million
driven by positive renewal premium change partially offset by a higher level of ceded reinsurance. The increase in net earned premium was consistent with the trend in net written premiums.
Core income decreased
$12 million
in
2018
as compared with
2017
. Excluding the favorable effect of the Federal corporate income tax rate change and the Small Business premium rate adjustments, core income decreased approximately
$92 million
primarily due to lower net investment income driven by limited partnership returns and lower favorable net prior year loss reserve development partially offset by lower net catastrophe losses.
34
The combined ratio of
101.1%
improved
1.6
points in
2018
as compared with
2017
. The loss ratio increased
0.3
points driven by lower favorable net prior year loss reserve development partially offset by lower net catastrophe losses. Net catastrophe losses were
$193 million
, or
6.4
points of the loss ratio, for
2018
, as compared with
$272 million
, or
9.5
points of the loss ratio, for
2017
. Excluding the Small Business premium rate adjustments, the expense ratio improved 1.5 points driven by lower employee costs and IT spend.
Favorable net prior year loss reserve development of
$25 million
and
$115 million
was recorded in
2018
and
2017
. Further information on net prior year loss reserve development is in Note
E
to the Consolidated Financial Statements included under Item 8.
The following table summarizes the gross and net carried reserves for Commercial.
|
December 31
|
|||||||
|
(In millions)
|
2018
|
2017
|
|||||
|
Gross case reserves
|
$
|
4,181
|
|
$
|
4,427
|
|
|
|
Gross IBNR reserves
|
4,562
|
|
4,337
|
|
|||
|
Total gross carried claim and claim adjustment expense reserves
|
$
|
8,743
|
|
$
|
8,764
|
|
|
|
Net case reserves
|
$
|
3,831
|
|
$
|
4,103
|
|
|
|
Net IBNR reserves
|
4,167
|
|
4,033
|
|
|||
|
Total net carried claim and claim adjustment expense reserves
|
$
|
7,998
|
|
$
|
8,136
|
|
|
2017
Compared with
2016
Net written premiums for Commercial increased
$39 million
in
2017
as compared with
2016
driven by higher new business within Middle Markets, strong retention and positive renewal premium change. This was partially offset by an unfavorable premium rate adjustment within Small Business that is more fully discussed in Note
F
to the Consolidated Financial Statements under Item 8. The increase in net earned premium was consistent with the trend in net written premiums.
Core income increased
$14 million
in
2017
as compared with
2016
due to the favorable period over period effect of net prior year loss reserve development and improved non-catastrophe current accident year underwriting results partially offset by higher net catastrophe losses.
The combined ratio of
102.7%
improved
1.4
points in
2017
as compared with
2016
. The loss ratio improved
0.1
points primarily due to the favorable period over period effect of net prior year loss reserve development partially offset by higher net catastrophe losses. Net catastrophe losses were
$272 million
, or
9.5
points of the loss ratio, for
2017
, as compared with
$117 million
, or
4.1
points of the loss ratio, for
2016
. The loss ratio excluding catastrophes and development improved 1.7 points. The expense ratio improved
1.6
points in
2017
as compared with
2016
, reflecting both our ongoing efforts to improve productivity and the actions undertaken in last year's third and fourth quarters to reduce expenses.
Favorable net prior year loss reserve development of
$115 million
was recorded in
2017
as compared with unfavorable net prior year loss reserve development of
$15 million
in
2016
. Further information on net prior year loss reserve development is in Note
E
to the Consolidated Financial Statements included under Item 8.
35
International
The International segment underwrites property and casualty coverages on a global basis through its U.K.-based insurance company, a branch operation in Canada as well as through its presence at Lloyd’s of London (Hardy). Effective January 1, 2019, European Economic Area (EEA) business will be written through a Luxembourg-based insurance company. Underwriting activities are managed through three business units that operate across all locations: Property and Energy & Marine, Casualty and Specialty. The segment is managed from headquarters in London.
Canada
provides standard commercial and specialty insurance products, primarily in the marine, oil & gas, construction, manufacturing and life science industries.
Europe
provides a diverse range of specialty products as well as commercial insurance products primarily in the marine, property, financial services and healthcare & technology industries throughout Europe on both a domestic and cross-border basis.
Hardy
operates through Lloyd’s Syndicate 382 underwriting primarily short-tail exposures in energy, marine, property, casualty and specialty lines with risks located in many countries around the world. The capacity of, and results from the syndicate, are 100% attributable to CNA.
36
The following table details the results of operations for International.
|
Years ended December 31
|
|||||||||||
|
(In millions, except ratios, rate, renewal premium change and retention)
|
2018
|
2017
|
2016
|
||||||||
|
Net written premiums
|
$
|
1,018
|
|
$
|
881
|
|
$
|
821
|
|
||
|
Net earned premiums
|
1,001
|
|
857
|
|
806
|
|
|||||
|
Net investment income
|
57
|
|
52
|
|
51
|
|
|||||
|
Core (loss) income
|
(19
|
)
|
8
|
|
21
|
|
|||||
|
Other performance metrics:
|
|||||||||||
|
Loss and loss adjustment expense ratio
|
69.8
|
%
|
67.0
|
%
|
61.0
|
%
|
|||||
|
Expense ratio
|
36.7
|
|
37.8
|
|
38.1
|
|
|||||
|
Combined ratio
|
106.5
|
%
|
104.8
|
%
|
99.1
|
%
|
|||||
|
Rate
|
3
|
%
|
0
|
%
|
(1
|
)%
|
|||||
|
Renewal premium change
|
7
|
|
2
|
|
(1
|
)
|
|||||
|
Retention
|
76
|
|
80
|
|
76
|
|
|||||
|
New business
|
$
|
307
|
|
$
|
275
|
|
$
|
240
|
|
||
2018
Compared with
2017
Net written premiums for International increased
$137 million
in
2018
as compared with
2017
. Excluding the effect of foreign currency exchange rates, net written premiums increased
$115 million
or
12.6%
in
2018
as compared with
2017
driven by higher new business, positive renewal premium change and a favorable change in estimate of ultimate premium partially offset by a higher level of ceded reinsurance. The increase in net earned premiums was consistent with the trend in net written premiums.
Core results decreased
$27 million
in
2018
as compared with
2017
driven by non-catastrophe current accident year underwriting results partially offset by lower net catastrophe losses. The effect of the Federal corporate income tax rate change was not significant.
The combined ratio of
106.5%
increased
1.7
points in
2018
as compared with
2017
. The loss ratio increased
2.8
points, primarily due to elevated property losses and professional liability in our London operation and lower favorable net prior year loss reserve development partially offset by lower net catastrophe losses. Net catastrophe losses were
$33 million
, or
3.3
points of the loss ratio, for
2018
, as compared with
$64 million
, or
7.9
points of the loss ratio, for
2017
. The expense ratio improved
1.1
points in
2018
as compared with
2017
primarily driven by higher net earned premiums partially offset by higher acquisition expenses.
Favorable net prior year loss reserve development of
$4 million
and
$9 million
was recorded in
2018
and
2017
. Further information on net prior year loss reserve development is in Note
E
to the Consolidated Financial Statements included under Item 8.
Effective October 1, 2018, Hardy no longer writes property treaty, marine hull, and construction all risk/erection all risk through the Lloyd’s platform. While these three classes combined represented a relatively small component of the International segment’s business, when combined with other underwriting actions, it will result in lower net written premiums within the International segment.
37
The following table summarizes the gross and net carried reserves for International.
|
December 31
|
|||||||
|
(In millions)
|
2018
|
2017
|
|||||
|
Gross case reserves
|
$
|
867
|
|
$
|
744
|
|
|
|
Gross IBNR reserves
|
883
|
|
892
|
|
|||
|
Total gross carried claim and claim adjustment expense reserves
|
$
|
1,750
|
|
$
|
1,636
|
|
|
|
Net case reserves
|
$
|
749
|
|
$
|
640
|
|
|
|
Net IBNR reserves
|
775
|
|
792
|
|
|||
|
Total net carried claim and claim adjustment expense reserves
|
$
|
1,524
|
|
$
|
1,432
|
|
|
2017
Compared with
2016
Net written premiums for International increased $60 million in
2017
as compared with
2016
due to higher new business, positive renewal premium change and higher retention. Excluding the effect of foreign currency exchange rates, net written premiums increased 8.1% in
2017
. The increase in net earned premiums was consistent with the trend in net written premiums.
Core income decreased
$13 million
in
2017
as compared with
2016
driven by lower favorable net prior year loss reserve development and higher net catastrophe losses partially offset by favorable period over period foreign currency exchange results.
The combined ratio of
104.8%
increased
5.7
points in
2017
as compared with
2016
. The loss ratio increased
6.0
points, primarily due to lower favorable net prior year loss reserve development and higher net catastrophe losses partially offset by lower current accident year large losses. Net catastrophe losses were
$64 million
, or
7.9
points of the loss ratio, for 2017, as compared with
$31 million
, or
3.9
points of the loss ratio, for 2016. The loss ratio excluding catastrophes and development improved
3.0
points. The expense ratio improved
0.3
points in 2017 as compared with 2016 primarily due to the higher net earned premiums.
Favorable net prior year loss reserve development of
$9 million
and
$58 million
was recorded in
2017
and
2016
. Further information on net prior year loss reserve development is in Note
E
to the Consolidated Financial Statements included under Item 8.
38
Life & Group
The Life & Group segment primarily includes the results of our long term care business that is in run-off. Long term care policies were sold on both an individual and group basis. New enrollees in existing groups were accepted through February 1, 2016.
The following table summarizes the results of operations for Life & Group.
|
Years ended December 31
|
|||||||||||
|
(In millions)
|
2018
|
2017
|
2016
|
||||||||
|
Net earned premiums
|
$
|
530
|
|
$
|
539
|
|
$
|
536
|
|
||
|
Net investment income
|
801
|
|
782
|
|
767
|
|
|||||
|
Core loss before income tax
|
(14
|
)
|
(82
|
)
|
(125
|
)
|
|||||
|
Income tax benefit on core loss
|
57
|
|
132
|
|
145
|
|
|||||
|
Core income
|
43
|
|
50
|
|
20
|
|
|||||
2018
Compared with
2017
Core income decreased
$7 million
in
2018
as compared with
2017
. Excluding the unfavorable effect of the Federal corporate income tax rate change, core income increased approximately
$42 million
. Persistency continues to benefit from a high proportion of policyholders choosing to reduce benefits in lieu of premium rate increases. The favorable persistency trend was partially offset by a significant number of policies converting to a fully paid-up status with modest future benefits following the termination of a large group account. The reserves associated with these converted policies were, on average, slightly higher than the previously recorded carried reserves, resulting in a negative financial impact. Morbidity continues to trend in line with expectations. Additionally, the release of long term care claim reserves resulting from the annual claims experience study was slightly lower in
2018
compared with
2017
.
39
The following table summarizes policyholder reserves for Life & Group.
|
December 31, 2018
|
|||||||||||
|
(In millions)
|
Claim and claim adjustment expenses
|
Future policy benefits
|
Total
|
||||||||
|
Long term care
|
$
|
2,761
|
|
$
|
9,113
|
|
$
|
11,874
|
|
||
|
Structured settlement annuities
|
530
|
|
—
|
|
530
|
|
|||||
|
Other
|
14
|
|
—
|
|
14
|
|
|||||
|
Total
|
3,305
|
|
9,113
|
|
12,418
|
|
|||||
|
Shadow adjustments
(1)
|
115
|
|
1,250
|
|
1,365
|
|
|||||
|
Ceded reserves
(2)
|
181
|
|
234
|
|
415
|
|
|||||
|
Total gross reserves
|
$
|
3,601
|
|
$
|
10,597
|
|
$
|
14,198
|
|
||
|
December 31, 2017
|
|||||||||||
|
(In millions)
|
Claim and claim adjustment expenses
|
Future policy benefits
|
Total
|
||||||||
|
Long term care
|
$
|
2,568
|
|
$
|
8,959
|
|
$
|
11,527
|
|
||
|
Structured settlement annuities
|
547
|
|
—
|
|
547
|
|
|||||
|
Other
|
16
|
|
—
|
|
16
|
|
|||||
|
Total
|
3,131
|
|
8,959
|
|
12,090
|
|
|||||
|
Shadow adjustments
(1)
|
159
|
|
1,990
|
|
2,149
|
|
|||||
|
Ceded reserves
(2)
|
209
|
|
230
|
|
439
|
|
|||||
|
Total gross reserves
|
$
|
3,499
|
|
$
|
11,179
|
|
$
|
14,678
|
|
||
(1) To the extent that unrealized gains on fixed income securities supporting long term care products and annuity contracts would result in a premium deficiency if those gains were realized, an increase in Insurance reserves is recorded, net of tax, as a reduction of net unrealized gains through Other comprehensive income (loss) (Shadow Adjustments).
(2) Ceded reserves relate to claim or policy reserves fully reinsured in connection with a sale or exit from the underlying business.
2017
Compared with
2016
Core income increased
$30 million
in
2017
as compared with
2016
. This increase was driven by favorable morbidity partially offset by unfavorable persistency in the long term care business. Additionally, the release of long term care claim reserves resulting from the annual claims experience study was higher in 2017 as compared with 2016.
40
Corporate & Other
Corporate & Other primarily includes certain corporate expenses, including interest on corporate debt and the results of certain property and casualty business in run-off, including CNA Re and A&EP.
The following table summarizes the results of operations for the Corporate & Other segment, including intersegment eliminations.
|
Years ended December 31
|
|||||||||||
|
(In millions)
|
2018
|
2017
|
2016
|
||||||||
|
Net investment income
|
$
|
20
|
|
$
|
20
|
|
$
|
16
|
|
||
|
Interest expense
|
135
|
|
152
|
|
155
|
|
|||||
|
Core loss
|
(165
|
)
|
(90
|
)
|
(178
|
)
|
|||||
2018
Compared with
2017
Core loss increased
$75 million
in
2018
as compared with
2017
. Excluding the unfavorable effect of the Federal corporate income tax rate change, core loss increased approximately
$46 million
driven by higher adverse net prior year reserve development recorded in 2018 for A&EP under the Loss Portfolio Transfer and non-recurring costs of $27 million associated with the transition to a new IT infrastructure service provider partially offset by lower interest expense. A&EP is further discussed in Note
E
to the Consolidated Financial Statements included under Item 8.
The following table summarizes the gross and net carried reserves for Corporate & Other.
|
December 31
|
|||||||
|
(In millions)
|
2018
|
2017
|
|||||
|
Gross case reserves
|
$
|
1,208
|
|
$
|
1,371
|
|
|
|
Gross IBNR reserves
|
1,217
|
|
1,065
|
|
|||
|
Total gross carried claim and claim adjustment expense reserves
|
$
|
2,425
|
|
$
|
2,436
|
|
|
|
Net case reserves
|
$
|
96
|
|
$
|
94
|
|
|
|
Net IBNR reserves
|
96
|
|
111
|
|
|||
|
Total net carried claim and claim adjustment expense reserves
|
$
|
192
|
|
$
|
205
|
|
|
2017
Compared with
2016
Core loss improved
$88 million
in
2017
as compared with
2016
, driven by lower adverse net prior year reserve development recorded in 2017 for A&EP under the Loss Portfolio Transfer. This is further discussed in Note
E
to the Consolidated Financial Statements included under Item 8.
41
INVESTMENTS
Net Investment Income
The significant components of Net investment income are presented in the following table. Fixed income securities, as presented, include both fixed maturity securities and non-redeemable preferred stock.
|
Years ended December 31
|
|||||||||||
|
(In millions)
|
2018
|
2017
|
2016
|
||||||||
|
Fixed income securities:
|
|||||||||||
|
Taxable fixed income securities
|
$
|
1,449
|
|
$
|
1,397
|
|
$
|
1,421
|
|
||
|
Tax-exempt fixed income securities
|
384
|
|
427
|
|
405
|
|
|||||
|
Total fixed income securities
|
1,833
|
|
1,824
|
|
1,826
|
|
|||||
|
Limited partnership and common stock investments
|
(42
|
)
|
207
|
|
158
|
|
|||||
|
Other, net of investment expense
|
26
|
|
3
|
|
4
|
|
|||||
|
Pretax net investment income
|
$
|
1,817
|
|
$
|
2,034
|
|
$
|
1,988
|
|
||
|
Fixed income securities, after tax
|
$
|
1,512
|
|
$
|
1,324
|
|
$
|
1,315
|
|
||
|
Net investment income, after tax
|
1,500
|
|
1,462
|
|
1,427
|
|
|||||
|
Effective income yield for the fixed income securities portfolio, pretax
|
4.7
|
%
|
4.7
|
%
|
4.8
|
%
|
|||||
|
Effective income yield for the fixed income securities portfolio, after tax
|
3.9
|
%
|
3.4
|
%
|
3.5
|
%
|
|||||
Pretax net investment income decreased
$217 million
in 2018 as compared with
2017
. The decrease was driven by limited partnership and common stock investments, which returned
(1.9)%
in
2018
as compared with
9.1%
in the prior year. The lower return in 2018 included the change in fair value of common stock investments. See Note A to the Consolidated Financial Statements included under Item 8 for further information regarding the treatment of the change in fair value of common stock investments. Despite the decline in limited partnership income, net investment income, after tax, increased
$38 million
in 2018 as compared with
2017
driven by the lower Federal corporate income tax rate.
Pretax net investment income increased
$46 million
in 2017 as compared with
2016
. The increase was driven by limited partnership and common stock investments, which returned
9.1%
in
2017
as compared with
6.4%
in the prior year.
42
Net Realized Investment Gains (Losses)
The components of Net realized investment results are presented in the following table.
|
Years ended December 31
|
|||||||||||
|
(In millions)
|
2018
|
2017
|
2016
|
||||||||
|
Fixed maturity securities:
|
|||||||||||
|
Corporate and other bonds
|
$
|
26
|
|
$
|
114
|
|
$
|
39
|
|
||
|
States, municipalities and political subdivisions
|
36
|
|
14
|
|
29
|
|
|||||
|
Asset-backed
|
(58
|
)
|
(6
|
)
|
(2
|
)
|
|||||
|
Total fixed maturity securities
|
4
|
|
122
|
|
66
|
|
|||||
|
Equity securities:
|
|||||||||||
|
Common stock
|
—
|
|
—
|
|
(6
|
)
|
|||||
|
Non-redeemable preferred stock
|
(74
|
)
|
—
|
|
1
|
|
|||||
|
Total equity securities
|
(74
|
)
|
—
|
|
(5
|
)
|
|||||
|
Short term and other
|
18
|
|
(29
|
)
|
(11
|
)
|
|||||
|
Net realized investment (losses) gains
|
(52
|
)
|
93
|
|
50
|
|
|||||
|
Income tax benefit (expense) on net realized investment (losses) gains
|
14
|
|
(30
|
)
|
(15
|
)
|
|||||
|
Net realized investment (losses) gains, after tax
|
$
|
(38
|
)
|
$
|
63
|
|
$
|
35
|
|
||
Pretax net realized investment results decreased
$145 million
for
2018
as compared with
2017
. The decrease was driven by lower net realized gains on sales of securities and the decline in fair value of non-redeemable preferred stock. See Note A to the Consolidated Financial Statements included under Item 8 for further information regarding the treatment of the change in fair value of non-redeemable preferred stock. Additionally, 2017 short term and other included a pretax loss of
$42 million
related to the redemption of our $350 million senior notes due November 2019.
Pretax net realized investment gains increased
$43 million
for
2017
as compared with
2016
, driven by lower other than-temporary impairment (OTTI) losses recognized in earnings. Additionally,
2017
included a pretax loss of
$42 million
discussed above.
Further information on our realized gains and losses, including our OTTI losses and derivative gains (losses), as well as our impairment decision process, is set forth in Notes
A
and
B
to the Consolidated Financial Statements included under Item 8.
43
Portfolio Quality
The following table presents the estimated fair value and net unrealized gains (losses) of our fixed maturity securities by rating distribution.
|
December 31
|
2018
|
2017
|
|||||||||||||
|
(In millions)
|
Estimated Fair Value
|
Net Unrealized Gains (Losses)
|
Estimated Fair Value
|
Net Unrealized Gains (Losses)
|
|||||||||||
|
U.S. Government, Government agencies and Government-sponsored enterprises
|
$
|
4,334
|
|
$
|
(24
|
)
|
$
|
4,514
|
|
$
|
21
|
|
|||
|
AAA
|
3,027
|
|
245
|
|
1,954
|
|
152
|
|
|||||||
|
AA
|
6,510
|
|
512
|
|
8,982
|
|
914
|
|
|||||||
|
A
|
8,768
|
|
527
|
|
9,643
|
|
952
|
|
|||||||
|
BBB
|
14,205
|
|
274
|
|
13,554
|
|
1,093
|
|
|||||||
|
Non-investment grade
|
2,702
|
|
(73
|
)
|
2,840
|
|
140
|
|
|||||||
|
Total
|
$
|
39,546
|
|
$
|
1,461
|
|
$
|
41,487
|
|
$
|
3,272
|
|
|||
As of
December 31, 2018
and
2017
,
1%
and 2% of our fixed maturity portfolio was rated internally.
The following table presents available-for-sale fixed maturity securities in a gross unrealized loss position by ratings distribution.
|
December 31, 2018
|
|||||||
|
(In millions)
|
Estimated Fair Value
|
Gross Unrealized Losses
|
|||||
|
U.S. Government, Government agencies and Government-sponsored enterprises
|
$
|
2,889
|
|
$
|
53
|
|
|
|
AAA
|
359
|
|
7
|
|
|||
|
AA
|
788
|
|
12
|
|
|||
|
A
|
2,391
|
|
62
|
|
|||
|
BBB
|
6,971
|
|
262
|
|
|||
|
Non-investment grade
|
1,905
|
|
125
|
|
|||
|
Total
|
$
|
15,303
|
|
$
|
521
|
|
|
The following table presents the maturity profile for these available-for-sale fixed maturity securities. Securities not due to mature on a single date are allocated based on weighted average life.
|
December 31, 2018
|
|||||||
|
(In millions)
|
Estimated Fair Value
|
Gross Unrealized Losses
|
|||||
|
Due in one year or less
|
$
|
218
|
|
$
|
7
|
|
|
|
Due after one year through five years
|
2,409
|
|
57
|
|
|||
|
Due after five years through ten years
|
10,479
|
|
347
|
|
|||
|
Due after ten years
|
2,197
|
|
110
|
|
|||
|
Total
|
$
|
15,303
|
|
$
|
521
|
|
|
44
Duration
A primary objective in the management of the investment portfolio is to optimize return relative to the corresponding liabilities and respective liquidity needs. Our views on the current interest rate environment, tax regulations, asset class valuations, specific security issuer and broader industry segment conditions as well as domestic and global economic conditions, are some of the factors that enter into an investment decision. We also continually monitor exposure to issuers of securities held and broader industry sector exposures and may from time to time adjust such exposures based on our views of a specific issuer or industry sector.
A further consideration in the management of the investment portfolio is the characteristics of the corresponding liabilities and the ability to align the duration of the portfolio to those liabilities and to meet future liquidity needs, minimize interest rate risk and maintain a level of income sufficient to support the underlying insurance liabilities. For portfolios where future liability cash flows are determinable and typically long term in nature, we segregate investments for asset/liability management purposes. The segregated investments support the long term care and structured settlement liabilities in the Life & Group segment.
The effective durations of fixed income securities and short term investments are presented in the following table. Amounts presented are net of payable and receivable amounts for securities purchased and sold, but not yet settled.
|
December 31
|
2018
|
2017
|
|||||||||||
|
(In millions)
|
Estimated Fair Value
|
Effective
Duration
(In years)
|
Estimated Fair Value
|
Effective
Duration
(In years)
|
|||||||||
|
Investments supporting Life & Group
|
$
|
16,212
|
|
8.4
|
|
$
|
16,797
|
|
8.4
|
|
|||
|
Other investments
|
25,428
|
|
4.4
|
|
26,817
|
|
4.4
|
|
|||||
|
Total
|
$
|
41,640
|
|
6.0
|
|
$
|
43,614
|
|
5.9
|
|
|||
The investment portfolio is periodically analyzed for changes in duration and related price risk. Additionally, we periodically review the sensitivity of the portfolio to the level of foreign exchange rates and other factors that contribute to market price changes. A summary of these risks and specific analysis on changes is included in the Quantitative and Qualitative Disclosures About Market Risk included under Item 7A.
Short Term Investments
The carrying value of the components of the Short term investments are presented in the following table.
|
December 31
|
|||||||
|
(In millions)
|
2018
|
2017
|
|||||
|
Short term investments:
|
|||||||
|
Commercial paper
|
$
|
705
|
|
$
|
905
|
|
|
|
U.S. Treasury securities
|
185
|
|
355
|
|
|||
|
Other
|
396
|
|
176
|
|
|||
|
Total short term investments
|
$
|
1,286
|
|
$
|
1,436
|
|
|
45
LIQUIDITY AND CAPITAL RESOURCES
Cash Flows
Our primary operating cash flow sources are premiums and investment income from our insurance subsidiaries. Our primary operating cash flow uses are payments for claims, policy benefits and operating expenses, including interest expense on corporate debt. Additionally, cash may be paid or received for income taxes.
For
2018
, net cash provided by operating activities was
$1,227 million
as compared with
$1,254 million
and
$1,416 million
for
2017
and
2016
. In
2018
, cash provided by operating activities reflected higher income taxes paid and higher net claim payments partially offset by an increase in premiums collected as compared with 2017. Operating cash flows in
2017
reflected higher net claim payments and a lower level of distributions on limited partnerships partially offset by lower IT spend and an increase in premiums collected as compared with 2016. Operating cash flows in
2016
reflected lower income taxes paid and a higher level of distributions on limited partnerships offset by higher net claim and expense payments as compared with 2015.
Cash flows from investing activities include the purchase and disposition of financial instruments, excluding those held as trading, and may include the purchase and sale of businesses, land, buildings, equipment and other assets not generally held for resale.
Net cash used by investing activities was
$177 million
for
2018
, as compared with
$424 million
and
$846 million
for
2017
and
2016
. The cash flow from investing activities is affected by various factors such as the anticipated payment of claims, financing activity, asset/liability management and individual security buy and sell decisions made in the normal course of portfolio management. In the first quarter of 2016, we sold the former principal executive offices of CNAF for
$107 million
.
Cash flows from financing activities may include proceeds from the issuance of debt and equity securities, outflows for stockholder dividends or repayment of debt and outlays to reacquire equity securities.
Net cash used by financing activities was
$1,085 million
,
$755 million
and
$673 million
for
2018
,
2017
and
2016
. Financing activities for the periods presented include:
|
•
|
In the third quarter of 2018, we redeemed the $30 million of subordinated variable rate debt of Hardy due September 15, 2036.
|
|
•
|
In the first quarter of 2018, we paid the $150 million outstanding aggregate principal balance of our 6.950% senior notes due January 15, 2018.
|
|
•
|
In the third quarter of 2017, we issued $500 million of 3.45% senior notes due August 15, 2027 and redeemed the $350 million outstanding aggregate principal balance of our 7.35% senior notes due November 15, 2019.
|
|
•
|
In the first quarter of 2016, we issued $500 million of 4.50% senior notes due March 1, 2026 and redeemed the $350 million outstanding aggregate principal balance of our 6.50% senior notes due August 15, 2016.
|
Liquidity
We believe that our present cash flows from operating, investing and financing activities are sufficient to fund our current and expected working capital and debt obligation needs and we do not expect this to change in the near term. There are currently no amounts outstanding under our $250 million senior unsecured revolving credit facility and no borrowings outstanding through our membership in the Federal Home Loan Bank of Chicago (FHLBC).
CCC paid dividends of
$1,026 million
,
$955 million
and
$765 million
to CNAF during
2018
,
2017
and
2016
.
We have an effective automatic shelf registration statement under which we may publicly issue debt, equity or hybrid securities from time to time.
46
Common Stock Dividends
Dividends of $3.30 per share on our common stock, including a special dividend of $2.00 per share, were declared and paid in
2018
. On
February 8, 2019
, our Board of Directors declared a quarterly dividend of $0.35 per share and a special dividend of $2.00 per share, payable
March 14, 2019
to stockholders of record on
February 25, 2019
. The declaration and payment of future dividends to holders of our common stock will be at the discretion of our Board of Directors and will depend on many factors, including our earnings, financial condition, business needs and regulatory constraints.
Our ability to pay dividends and other credit obligations is significantly dependent on receipt of dividends from our subsidiaries. The payment of dividends to us by our insurance subsidiaries without prior approval of the insurance department of each subsidiary's domiciliary jurisdiction is limited by formula. Dividends in excess of these amounts are subject to prior approval by the respective state insurance departments.
Further information on our dividends from subsidiaries is provided in Note
M
to the Consolidated Financial Statements included under Item 8.
Commitments, Contingencies and Guarantees
We have various commitments, contingencies and guarantees which arose in the ordinary course of business. The impact of these commitments, contingencies and guarantees should be considered when evaluating our liquidity and capital resources.
A summary of our commitments is presented in the following table.
|
December 31, 2018
|
|||||||||||||||||||
|
(In millions)
|
Total
|
Less than 1 year
|
1-3 years
|
3-5 years
|
More than 5 years
|
||||||||||||||
|
Debt (a)
|
$
|
3,324
|
|
$
|
134
|
|
$
|
1,117
|
|
$
|
401
|
|
$
|
1,672
|
|
||||
|
Lease obligations (b)
|
385
|
|
35
|
|
80
|
|
70
|
|
200
|
|
|||||||||
|
Claim and claim adjustment expense reserves (c)
|
23,396
|
|
5,427
|
|
6,131
|
|
3,109
|
|
8,729
|
|
|||||||||
|
Future policy benefit reserves (d)
|
26,920
|
|
(409
|
)
|
(125
|
)
|
597
|
|
26,857
|
|
|||||||||
|
Total (e)
|
$
|
54,025
|
|
$
|
5,187
|
|
$
|
7,203
|
|
$
|
4,177
|
|
$
|
37,458
|
|
||||
|
(a)
|
Includes estimated future interest payments.
|
|
(b)
|
The lease obligations reflected above are not discounted.
|
|
(c)
|
The Claim and claim adjustment expense reserves reflected above are not discounted and represent our estimate of the amount and timing of the ultimate settlement and administration of gross claims based on our assessment of facts and circumstances known as of
December 31, 2018
. See the Reserves - Estimates and Uncertainties section of this MD&A for further information.
|
|
(d)
|
The Future policy benefit reserves reflected above are not discounted and represent our estimate of the ultimate amount and timing of the settlement of benefits based on our assessment of facts and circumstances known as of
December 31, 2018
. See the Reserves - Estimates and Uncertainties section of this MD&A for further information.
|
|
(e)
|
Does not include investment commitments of
$863 million
related to limited partnerships, privately placed debt securities and mortgage loans.
|
Further information on our commitments, contingencies and guarantees is provided in Notes
A
,
B
,
E
,
F
,
H
and
I
to the Consolidated Financial Statements included under Item 8.
47
Ratings
Ratings are an important factor in establishing the competitive position of insurance companies. Our insurance company subsidiaries are rated by major rating agencies and these ratings reflect the rating agency's opinion of the insurance company's financial strength, operating performance, strategic position and ability to meet our obligations to policyholders. Agency ratings are not a recommendation to buy, sell or hold any security and may be revised or withdrawn at any time by the issuing organization. Each agency's rating should be evaluated independently of any other agency's rating. One or more of these agencies could take action in the future to change the ratings of our insurance subsidiaries.
The table below reflects the various group ratings issued by A.M. Best, Moody's and S&P. The table also includes the ratings for CNAF senior debt.
|
December 31, 2018
|
Insurance Financial Strength Ratings
|
Corporate Debt Ratings
|
|||
|
CCC Group
|
Western Surety Group
|
CNAF - Senior Debt
|
|||
|
A.M. Best
|
A
|
A
|
bbb
|
||
|
Moody's
|
A2
|
Not rated
|
Baa2
|
||
|
S&P
|
A
|
A
|
BBB+
|
||
A.M. Best maintains a stable outlook on the Company’s Financial Strength Rating and a positive outlook on the Company’s Long Term Issuer Credit Rating. A.M. Best revised its outlook on the Company's Long Term Issuer Credit Rating from stable to positive in July 2018. Moody’s maintains a stable outlook on the Company. S&P maintains a positive outlook on the Company. S&P revised its outlook on the Company from stable to positive in November 2018.
CNA Insurance Company Limited and CNA Insurance Company (Europe) S.A. are included within the CCC group as part of S&P’s rating. Hardy, through Syndicate 382, benefits from the collective financial strength of Lloyd’s, which is rated A+ by S&P with a negative outlook and A by A.M. Best with a stable outlook.
48
ACCOUNTING STANDARDS UPDATE
For a discussion of Accounting Standards Updates adopted as of January 1,
2018
and that will be adopted in the future, see Note
A
to the Consolidated Financial Statements included under Item 8.
FORWARD-LOOKING STATEMENTS
This report contains a number of forward-looking statements which relate to anticipated future events rather than actual present conditions or historical events. These statements are made pursuant to the safe harbor provisions of the Private Securities Litigation Reform Act of 1995 and generally include words such as “believes,” “expects,” “intends,” “anticipates,” “estimates” and similar expressions. Forward-looking statements in this report include any and all statements regarding expected developments in our insurance business, including losses and loss reserves for long term care, A&EP and other mass tort claims which are more uncertain, and therefore more difficult to estimate than loss reserves respecting traditional property and casualty exposures; the impact of routine ongoing insurance reserve reviews we are conducting; our expectations concerning our revenues, earnings, expenses and investment activities; volatility in investment returns; expected cost savings and other results from our expense reduction activities; and our proposed actions in response to trends in our business. Forward-looking statements, by their nature, are subject to a variety of inherent risks and uncertainties that could cause actual results to differ materially from the results projected in the forward-looking statement. We cannot control many of these risks and uncertainties. These risks and uncertainties include, but are not limited to, the following:
Company-Specific Factors
|
•
|
the risks and uncertainties associated with our insurance reserves, as outlined in the Critical Accounting Estimates and the Reserves - Estimates and Uncertainties sections of this report, including the sufficiency of the reserves and the possibility for future increases, which would be reflected in the results of operations in the period that the need for such adjustment is determined;
|
|
•
|
the risk that the other parties to the transaction in which, subject to certain limitations, we ceded our legacy A&EP liabilities will not fully perform their obligations to CNA, the uncertainty in estimating loss reserves for A&EP liabilities and the possible continued exposure of CNA to liabilities for A&EP claims that are not covered under the terms of the transaction;
|
|
•
|
the performance of reinsurance companies under reinsurance contracts with us; and
|
|
•
|
the risks and uncertainties associated with potential acquisitions and divestitures, including the consummation of such transactions, the successful integration of acquired operations and the potential for subsequent impairment of goodwill or intangible assets.
|
Industry and General Market Factors
|
•
|
the impact of competitive products, policies and pricing and the competitive environment in which we operate, including changes in our book of business;
|
|
•
|
product and policy availability and demand and market responses, including the level of ability to obtain rate increases and decline or non-renew underpriced accounts, to achieve premium targets and profitability and to realize growth and retention estimates;
|
|
•
|
general economic and business conditions, including recessionary conditions that may decrease the size and number of our insurance customers and create additional losses to our lines of business, especially those that provide management and professional liability insurance, as well as surety bonds, to businesses engaged in real estate, financial services and professional services and inflationary pressures on medical care costs, construction costs and other economic sectors that increase the severity of claims;
|
|
•
|
conditions in the capital and credit markets, including uncertainty and instability in these markets, as well as the overall economy, and their impact on the returns, types, liquidity and valuation of our investments;
|
|
•
|
conditions in the capital and credit markets that may limit our ability to raise significant amounts of capital on favorable terms; and
|
|
•
|
the possibility of changes in our ratings by ratings agencies, including the inability to access certain markets or distribution channels and the required collateralization of future payment obligations as a result of such changes, and changes in rating agency policies and practices.
|
49
Regulatory Factors
|
•
|
regulatory and legal initiatives and compliance with governmental regulations and other legal requirements, including with respect to cyber security protocols, legal inquiries by state authorities, judicial interpretations within the regulatory framework, including interpretation of policy provisions, decisions regarding coverage and theories of liability, legislative actions that increase claimant activity, including those revising applicability of statutes of limitations, trends in litigation and the outcome of any litigation involving us and rulings and changes in tax laws and regulations;
|
|
•
|
regulatory limitations, impositions and restrictions upon us, including with respect to our ability to increase premium rates, and the effects of assessments and other surcharges for guaranty funds and second-injury funds, other mandatory pooling arrangements and future assessments levied on insurance companies; and
|
|
•
|
regulatory limitations and restrictions, including limitations upon our ability to receive dividends from our insurance subsidiaries, imposed by regulatory authorities, including regulatory capital adequacy standards;
|
Impact of Catastrophic Events and Related Developments
|
•
|
weather and other natural physical events, including the severity and frequency of storms, hail, snowfall and other winter conditions, natural disasters such as hurricanes and earthquakes, as well as climate change, including effects on global weather patterns, greenhouse gases, sea, land and air temperatures, sea levels, rain, hail and snow;
|
|
•
|
regulatory requirements imposed by coastal state regulators in the wake of hurricanes or other natural disasters, including limitations on the ability to exit markets or to non-renew, cancel or change terms and conditions in policies, as well as mandatory assessments to fund any shortfalls arising from the inability of quasi-governmental insurers to pay claims;
|
|
•
|
man-made disasters, including the possible occurrence of terrorist attacks, the unpredictability of the nature, targets, severity or frequency of such events, and the effect of the absence or insufficiency of applicable terrorism legislation on coverages; and
|
|
•
|
the occurrence of epidemics.
|
Referendum on the United Kingdom's Membership in the European Union
|
•
|
in 2016, the U.K. approved an exit from the E.U., commonly referred to as "Brexit.” Brexit is scheduled to be completed in early 2019. As treaties between the U.K. and the E.U. have not been finalized, as of January 1, 2019, we intend to write business in the E.U. through our recently established European subsidiary in Luxembourg as our U.K.-domiciled subsidiary will presumably no longer provide a platform for our operations throughout the European continent. As a result of such structural changes and modification to our European operations, the complexity and cost of regulatory compliance of our European business has increased and will likely continue to result in elevated expenses.
|
Our forward-looking statements speak only as of the date of the filing of this Annual Report on Form 10-K and we do not undertake any obligation to update or revise any forward-looking statement to reflect events or circumstances after the date of the statement, even if our expectations or any related events or circumstances change.
50
ITEM 7A. QUANTITATIVE AND QUALITATIVE DISCLOSURES ABOUT MARKET RISK
Our financial instruments are exposed to various market risks, such as interest rate risk, equity price risk and foreign currency risk. Due to the level of risk associated with certain invested assets and the level of uncertainty related to changes in the value of these assets, it is possible that changes in these risks in the near term could have a material adverse impact on our results of operations or equity.
Discussions herein regarding market risk focus on only one element of market risk, which is price risk. Price risk relates to changes in the level of prices due to changes in interest rates, equity prices, foreign exchange rates or other factors such as credit spreads. The fair value of our financial instruments is generally adversely affected when interest rates rise, equity markets decline or the dollar strengthens against foreign currency.
Active management of market risk is integral to our operations. We may take the following actions to manage our exposure to market risk within defined tolerance ranges: (1) change the character of future investments purchased or sold or (2) use derivatives to offset the market behavior of existing assets and liabilities or assets expected to be purchased and liabilities to be incurred.
Sensitivity Analysis
We monitor our sensitivity to interest rate changes by revaluing financial assets and liabilities using a variety of different interest rates. The Company uses duration and convexity at the security level to estimate the change in fair value that would result from a change in each security's yield. Duration measures the price sensitivity of an asset to changes in the yield rate. Convexity measures how the duration of the asset changes with interest rates. The duration and convexity analysis takes into account the unique characteristics (e.g., call and put options and prepayment expectations) of each security in determining the hypothetical change in fair value. The analysis is performed at the security level and aggregated up to the asset category levels for reporting in the tables below.
The evaluation is performed by applying an instantaneous change in yield rates of varying magnitudes on a static balance sheet to determine the effect such a change in rates would have on our fair value at risk and the resulting effect on stockholders' equity. The analysis presents the sensitivity of the fair value of our financial instruments to selected changes in capital market rates and index levels. The range of change chosen reflects our view of changes that are reasonably possible over a one-year period. The selection of the range of values chosen to represent changes in interest rates should not be construed as our prediction of future market events, but rather an illustration of the impact of such events.
The sensitivity analysis estimates the decline in the fair value of our interest sensitive assets and liabilities that were held as of
December 31, 2018
and
2017
due to an instantaneous change in the yield of the security at the end of the period of 100 and 150 basis points, with all other variables held constant.
The sensitivity analysis also assumes an instantaneous 10% and 20% decline in the foreign currency exchange rates versus the United States dollar from their levels as of
December 31, 2018
and
2017
, with all other variables held constant.
Equity price risk was measured assuming an instantaneous 10% and 25% decline in the S&P 500 from its level as of
December 31, 2018
and
2017
, with all other variables held constant. Our common stock holdings, which are included in equity securities, were assumed to be highly and positively correlated with the S&P 500 index. The value of limited partnerships are also affected by changes in equity markets, so a model was developed to analyze the observed changes in the value of limited partnerships held by the Company over a multiple year period along with the corresponding changes in the S&P 500 index. The result of the model allowed us to estimate the change in value of limited partnerships due to equity risk.
51
The following tables present the estimated effects on the fair value of our financial instruments as of
December 31, 2018
and
2017
due to an increase in yield rates of 100 basis points, a 10% decline in foreign currency exchange rates and a 10% decline in the S&P 500, with all other variables held constant.
Market Risk Scenario 1
|
December 31, 2018
|
Increase (Decrease)
|
||||||||||||||
|
(In millions)
|
Estimated Fair Value
|
Interest Rate Risk
|
Foreign Currency Risk
|
Equity Price Risk
|
|||||||||||
|
Assets:
|
|||||||||||||||
|
Fixed maturity securities
|
$
|
39,546
|
|
$
|
(2,440
|
)
|
$
|
(203
|
)
|
$
|
—
|
|
|||
|
Equity securities
|
780
|
|
(29
|
)
|
(2
|
)
|
(18
|
)
|
|||||||
|
Limited partnership investments
|
1,982
|
|
—
|
|
—
|
|
(79
|
)
|
|||||||
|
Other invested assets
|
53
|
|
—
|
|
(4
|
)
|
—
|
|
|||||||
|
Mortgage loans
(1)
|
827
|
|
(36
|
)
|
—
|
|
—
|
|
|||||||
|
Short term investments
|
1,286
|
|
(1
|
)
|
(12
|
)
|
—
|
|
|||||||
|
Total assets
|
44,474
|
|
(2,506
|
)
|
(221
|
)
|
(97
|
)
|
|||||||
|
Derivative financial instruments, included in Other liabilities
|
4
|
|
15
|
|
—
|
|
—
|
|
|||||||
|
Total securities
|
$
|
44,478
|
|
$
|
(2,491
|
)
|
$
|
(221
|
)
|
$
|
(97
|
)
|
|||
|
Long term debt
(1)
|
$
|
2,731
|
|
$
|
(120
|
)
|
$
|
—
|
|
$
|
—
|
|
|||
(1) Reported at amortized value in the Consolidated Balance Sheets included under Item 8 and not adjusted for fair value changes.
Market Risk Scenario 1
|
December 31, 2017
|
Increase (Decrease)
|
||||||||||||||
|
(In millions)
|
Estimated Fair Value
|
Interest Rate Risk
|
Foreign Currency Risk
|
Equity Price Risk
|
|||||||||||
|
Assets:
|
|||||||||||||||
|
Fixed maturity securities
|
$
|
41,487
|
|
$
|
(2,559
|
)
|
$
|
(215
|
)
|
$
|
—
|
|
|||
|
Equity securities
|
695
|
|
(26
|
)
|
(2
|
)
|
(6
|
)
|
|||||||
|
Limited partnership investments
|
2,369
|
|
—
|
|
—
|
|
(95
|
)
|
|||||||
|
Other invested assets
|
44
|
|
—
|
|
(3
|
)
|
—
|
|
|||||||
|
Mortgage loans
(1)
|
844
|
|
(40
|
)
|
—
|
|
—
|
|
|||||||
|
Short term investments
|
1,436
|
|
(1
|
)
|
(10
|
)
|
—
|
|
|||||||
|
Total assets
|
46,875
|
|
(2,626
|
)
|
(230
|
)
|
(101
|
)
|
|||||||
|
Derivative financial instruments, included in Other liabilities
|
(3
|
)
|
17
|
|
—
|
|
—
|
|
|||||||
|
Total securities
|
$
|
46,872
|
|
$
|
(2,609
|
)
|
$
|
(230
|
)
|
$
|
(101
|
)
|
|||
|
Long term debt
(1)
|
$
|
2,896
|
|
$
|
(148
|
)
|
$
|
—
|
|
$
|
—
|
|
|||
(1) Reported at amortized value in the Consolidated Balance Sheets included under Item 8 and not adjusted for fair value changes.
52
The following tables present the estimated effects on the fair value of our financial instruments as of
December 31, 2018
and
2017
due to an increase in yield rates of 150 basis points, a 20% decline in foreign currency exchange rates and a 25% decline in the S&P 500, with all other variables held constant.
Market Risk Scenario 2
|
December 31, 2018
|
Increase (Decrease)
|
||||||||||||||
|
(In millions)
|
Estimated Fair Value
|
Interest Rate Risk
|
Foreign Currency Risk
|
Equity Price Risk
|
|||||||||||
|
Assets:
|
|||||||||||||||
|
Fixed maturity securities
|
$
|
39,546
|
|
$
|
(3,659
|
)
|
$
|
(406
|
)
|
$
|
—
|
|
|||
|
Equity securities
|
780
|
|
(43
|
)
|
(3
|
)
|
(46
|
)
|
|||||||
|
Limited partnership investments
|
1,982
|
|
—
|
|
—
|
|
(198
|
)
|
|||||||
|
Other invested assets
|
53
|
|
—
|
|
(9
|
)
|
—
|
|
|||||||
|
Mortgage loans
(1)
|
827
|
|
(54
|
)
|
—
|
|
—
|
|
|||||||
|
Short term investments
|
1,286
|
|
(2
|
)
|
(24
|
)
|
—
|
|
|||||||
|
Total assets
|
44,474
|
|
(3,758
|
)
|
(442
|
)
|
(244
|
)
|
|||||||
|
Derivative financial instruments, included in Other liabilities
|
4
|
|
22
|
|
—
|
|
—
|
|
|||||||
|
Total securities
|
$
|
44,478
|
|
$
|
(3,736
|
)
|
$
|
(442
|
)
|
$
|
(244
|
)
|
|||
|
Long term debt
(1)
|
$
|
2,731
|
|
$
|
(180
|
)
|
$
|
—
|
|
$
|
—
|
|
|||
(1) Reported at amortized value in the Consolidated Balance Sheets included under Item 8 and not adjusted for fair value changes.
Market Risk Scenario 2
|
December 31, 2017
|
Increase (Decrease)
|
||||||||||||||
|
(In millions)
|
Estimated Fair Value
|
Interest Rate Risk
|
Foreign Currency Risk
|
Equity Price Risk
|
|||||||||||
|
Assets:
|
|||||||||||||||
|
Fixed maturity securities
|
$
|
41,487
|
|
$
|
(3,839
|
)
|
$
|
(429
|
)
|
$
|
—
|
|
|||
|
Equity securities
|
695
|
|
(38
|
)
|
(4
|
)
|
(16
|
)
|
|||||||
|
Limited partnership investments
|
2,369
|
|
—
|
|
—
|
|
(237
|
)
|
|||||||
|
Other invested assets
|
44
|
|
—
|
|
(7
|
)
|
—
|
|
|||||||
|
Mortgage loans
(1)
|
844
|
|
(60
|
)
|
—
|
|
—
|
|
|||||||
|
Short term investments
|
1,436
|
|
(2
|
)
|
(20
|
)
|
—
|
|
|||||||
|
Total assets
|
46,875
|
|
(3,939
|
)
|
(460
|
)
|
(253
|
)
|
|||||||
|
Derivative financial instruments, included in Other liabilities
|
(3
|
)
|
25
|
|
—
|
|
—
|
|
|||||||
|
Total securities
|
$
|
46,872
|
|
$
|
(3,914
|
)
|
$
|
(460
|
)
|
$
|
(253
|
)
|
|||
|
Long term debt
(1)
|
$
|
2,896
|
|
$
|
(221
|
)
|
$
|
—
|
|
$
|
—
|
|
|||
(1) Reported at amortized value in the Consolidated Balance Sheets included under Item 8 and not adjusted for fair value changes.
53
ITEM 8. FINANCIAL STATEMENTS AND SUPPLEMENTARY DATA
CNA Financial Corporation
Consolidated Statements of Operations
|
Years ended December 31
|
|||||||||||
|
(In millions, except per share data)
|
2018
|
2017
|
2016
|
||||||||
|
Revenues
|
|||||||||||
|
Net earned premiums
|
$
|
7,312
|
|
$
|
6,988
|
|
$
|
6,924
|
|
||
|
Net investment income
|
1,817
|
|
2,034
|
|
1,988
|
|
|||||
|
Net realized investment (losses) gains:
|
|
|
|||||||||
|
Other-than-temporary impairment losses
|
(21
|
)
|
(14
|
)
|
(81
|
)
|
|||||
|
Other net realized investment (losses) gains
|
(31
|
)
|
107
|
|
131
|
|
|||||
|
Net realized investment (losses) gains
|
(52
|
)
|
93
|
|
50
|
|
|||||
|
Non-insurance warranty revenue (Notes A and R)
|
1,007
|
|
390
|
|
361
|
|
|||||
|
Other revenues
|
50
|
|
37
|
|
43
|
|
|||||
|
Total revenues
|
10,134
|
|
9,542
|
|
9,366
|
|
|||||
|
Claims, Benefits and Expenses
|
|||||||||||
|
Insurance claims and policyholders’ benefits
|
5,572
|
|
5,310
|
|
5,283
|
|
|||||
|
Amortization of deferred acquisition costs
|
1,335
|
|
1,233
|
|
1,235
|
|
|||||
|
Non-insurance warranty expense (Notes A and R)
|
923
|
|
299
|
|
271
|
|
|||||
|
Other operating expenses
|
1,202
|
|
1,229
|
|
1,281
|
|
|||||
|
Interest
|
138
|
|
161
|
|
159
|
|
|||||
|
Total claims, benefits and expenses
|
9,170
|
|
8,232
|
|
8,229
|
|
|||||
|
Income before income tax
|
964
|
|
1,310
|
|
1,137
|
|
|||||
|
Income tax expense
|
(151
|
)
|
(411
|
)
|
(278
|
)
|
|||||
|
Net income
|
$
|
813
|
|
$
|
899
|
|
$
|
859
|
|
||
|
Basic earnings per share
|
$
|
2.99
|
|
$
|
3.32
|
|
$
|
3.18
|
|
||
|
Diluted earnings per share
|
$
|
2.98
|
|
$
|
3.30
|
|
$
|
3.17
|
|
||
|
Weighted Average Outstanding Common Stock and Common Stock Equivalents
|
|||||||||||
|
Basic
|
271.5
|
|
271.1
|
|
270.4
|
|
|||||
|
Diluted
|
272.5
|
|
272.1
|
|
271.1
|
|
|||||
The accompanying Notes are an integral part of these Consolidated Financial Statements.
54
CNA Financial Corporation
Consolidated Statements of Comprehensive (Loss) Income
|
Years ended December 31
|
|||||||||||
|
(In millions)
|
2018
|
2017
|
2016
|
||||||||
|
Comprehen
sive (Loss) Income
|
|||||||||||
|
Net income
|
$
|
813
|
|
$
|
899
|
|
$
|
859
|
|
||
|
Other Comprehensi
ve (Loss) Income, Net
of Tax
|
|||||||||||
|
Changes in:
|
|||||||||||
|
Net unrealized gains on investments with other-than-temporary impairments
|
(14
|
)
|
(5
|
)
|
3
|
|
|||||
|
Net unrealized gains on other investments
|
(798
|
)
|
108
|
|
252
|
|
|||||
|
Net unrealized gains on investments
|
(812
|
)
|
103
|
|
255
|
|
|||||
|
Foreign currency translation adjustment
|
(82
|
)
|
100
|
|
(114
|
)
|
|||||
|
Pension and postretirement benefits
|
—
|
|
2
|
|
1
|
|
|||||
|
Other comprehensive (loss) income, net of tax
|
(894
|
)
|
205
|
|
142
|
|
|||||
|
Total comprehensiv
e (loss) income
|
$
|
(81
|
)
|
$
|
1,104
|
|
$
|
1,001
|
|
||
The accompanying Notes are an integral part of these Consolidated Financial Statements.
55
CNA Financial Corporation
Consolidated Balance Sheets
|
December 31
|
|||||||
|
(In millions, except share data)
|
2018
|
2017
|
|||||
|
Assets
|
|
|
|||||
|
Investments:
|
|
|
|||||
|
Fixed maturity securities at fair value (amortized cost of $38,085 and $38,215)
|
$
|
39,546
|
|
$
|
41,487
|
|
|
|
Equity securities at fair value (cost of $844 and $659)
|
780
|
|
695
|
|
|||
|
Limited partnership investments
|
1,982
|
|
2,369
|
|
|||
|
Other invested assets
|
53
|
|
44
|
|
|||
|
Mortgage loans
|
839
|
|
839
|
|
|||
|
Short term investments
|
1,286
|
|
1,436
|
|
|||
|
Total investments
|
44,486
|
|
46,870
|
|
|||
|
Cash
|
310
|
|
355
|
|
|||
|
Reinsurance receivables (less allowance for uncollectible receivables of $29 and $29)
|
4,426
|
|
4,261
|
|
|||
|
Insurance receivables (less allowance for uncollectible receivables of $42 and $44)
|
2,323
|
|
2,292
|
|
|||
|
Accrued investment income
|
391
|
|
411
|
|
|||
|
Deferred acquisition costs
|
633
|
|
634
|
|
|||
|
Deferred income taxes
|
392
|
|
137
|
|
|||
|
Property and equipment at cost (less accumulated depreciation of $216 and $274)
|
324
|
|
326
|
|
|||
|
Goodwill
|
146
|
|
148
|
|
|||
|
Deferred non-insurance warranty acquisition expense (Note A)
|
2,513
|
|
212
|
|
|||
|
Other assets (includes $8 and $- due from Loews Corporation)
|
1,208
|
|
921
|
|
|||
|
Total assets
|
$
|
57,152
|
|
$
|
56,567
|
|
|
|
Liabilities
|
|
|
|
|
|||
|
Insurance reserves:
|
|
|
|||||
|
Claim and claim adjustment expenses
|
$
|
21,984
|
|
$
|
22,004
|
|
|
|
Unearned premiums
|
4,183
|
|
4,029
|
|
|||
|
Future policy benefits
|
10,597
|
|
11,179
|
|
|||
|
Short term debt
|
—
|
|
150
|
|
|||
|
Long term debt
|
2,680
|
|
2,708
|
|
|||
|
Deferred non-insurance warranty revenue (Note A)
|
3,402
|
|
972
|
|
|||
|
Other liabilities (includes $23 and $143 due to Loews Corporation)
|
3,089
|
|
3,281
|
|
|||
|
Total liabilities
|
45,935
|
|
44,323
|
|
|||
|
Commitments and contingencies (Notes B, F and L)
|
|
|
|
|
|||
|
Stockholders' Equity
|
|
|
|
|
|||
|
Common stock ($2.50 par value; 500,000,000 shares authorized; 273,040,243 shares issued; 271,456,978 and 271,205,390 shares outstanding)
|
683
|
|
683
|
|
|||
|
Additional paid-in capital
|
2,192
|
|
2,175
|
|
|||
|
Retained earnings
|
9,277
|
|
9,414
|
|
|||
|
Accumulated other comprehensive (loss) income
|
(878
|
)
|
32
|
|
|||
|
Treasury stock (1,583,265 and 1,834,853 shares), at cost
|
(57
|
)
|
(60
|
)
|
|||
|
Total stockholders’ equity
|
11,217
|
|
12,244
|
|
|||
|
Total liabilities and stockholders' equity
|
$
|
57,152
|
|
$
|
56,567
|
|
|
The accompanying Notes are an integral part of these Consolidated Financial Statements.
56
CNA Financial Corporation
Consolidated Statements of Cash Flows
|
Years ended December 31
|
|||||||||||
|
(In millions)
|
2018
|
2017
|
2016
|
||||||||
|
Cash Flows from Operating Activities
|
|
|
|||||||||
|
Net income
|
$
|
813
|
|
$
|
899
|
|
$
|
859
|
|
||
|
Adjustments to reconcile net income to net cash flows provided by operating activities:
|
|||||||||||
|
Deferred income tax (benefit) expense
|
(20
|
)
|
168
|
|
136
|
|
|||||
|
Trading portfolio activity
|
—
|
|
9
|
|
(9
|
)
|
|||||
|
Net realized investment losses (gains)
|
52
|
|
(93
|
)
|
(50
|
)
|
|||||
|
Equity method investees
|
330
|
|
84
|
|
238
|
|
|||||
|
Net amortization of investments
|
(70
|
)
|
(40
|
)
|
(27
|
)
|
|||||
|
Depreciation and amortization
|
79
|
|
88
|
|
77
|
|
|||||
|
Changes in:
|
|||||||||||
|
Receivables, net
|
(229
|
)
|
92
|
|
(130
|
)
|
|||||
|
Accrued investment income
|
19
|
|
(4
|
)
|
(3
|
)
|
|||||
|
Deferred acquisition costs
|
(6
|
)
|
(24
|
)
|
(8
|
)
|
|||||
|
Insurance reserves
|
482
|
|
22
|
|
237
|
|
|||||
|
Other assets
|
(192
|
)
|
(158
|
)
|
(95
|
)
|
|||||
|
Other liabilities
|
(98
|
)
|
173
|
|
162
|
|
|||||
|
Other, net
|
67
|
|
38
|
|
29
|
|
|||||
|
Total adjustments
|
414
|
|
355
|
|
557
|
|
|||||
|
Net cash flows provided by operating activities
|
1,227
|
|
1,254
|
|
1,416
|
|
|||||
|
Cash Flows from Investing Activities
|
|
|
|
|
|||||||
|
Dispositions:
|
|||||||||||
|
Fixed maturity securities - sales
|
8,408
|
|
5,438
|
|
5,328
|
|
|||||
|
Fixed maturity securities - maturities, calls and redemptions
|
2,370
|
|
3,641
|
|
3,219
|
|
|||||
|
Equity securities
|
89
|
|
46
|
|
81
|
|
|||||
|
Limited partnerships
|
343
|
|
192
|
|
290
|
|
|||||
|
Mortgage loans
|
128
|
|
26
|
|
207
|
|
|||||
|
Purchases:
|
|||||||||||
|
Fixed maturity securities
|
(10,785
|
)
|
(9,065
|
)
|
(9,827
|
)
|
|||||
|
Equity securities
|
(258
|
)
|
(166
|
)
|
—
|
|
|||||
|
Limited partnerships
|
(419
|
)
|
(171
|
)
|
(252
|
)
|
|||||
|
Mortgage loans
|
(128
|
)
|
(274
|
)
|
(120
|
)
|
|||||
|
Change in other investments
|
(12
|
)
|
(3
|
)
|
7
|
|
|||||
|
Change in short term investments
|
168
|
|
(6
|
)
|
258
|
|
|||||
|
Purchases of property and equipment
|
(99
|
)
|
(102
|
)
|
(146
|
)
|
|||||
|
Disposals of property and equipment
|
—
|
|
—
|
|
107
|
|
|||||
|
Other, net
|
18
|
|
20
|
|
2
|
|
|||||
|
Net cash flows used by investing activities
|
(177
|
)
|
(424
|
)
|
(846
|
)
|
|||||
The accompanying Notes are an integral part of these Consolidated Financial Statements.
57
|
Years ended December 31
|
|
|
|||||||||
|
(In millions)
|
2018
|
2017
|
2016
|
||||||||
|
Cash Flows from Financing Activities
|
|
|
|||||||||
|
Dividends paid to common stockholders
|
$
|
(896
|
)
|
$
|
(842
|
)
|
$
|
(813
|
)
|
||
|
Proceeds from the issuance of debt
|
—
|
|
496
|
|
498
|
|
|||||
|
Repayment of debt
|
(180
|
)
|
(391
|
)
|
(358
|
)
|
|||||
|
Other, net
|
(9
|
)
|
(18
|
)
|
—
|
|
|||||
|
Net cash flows used by financing activities
|
(1,085
|
)
|
|
(755
|
)
|
(673
|
)
|
||||
|
Effect of foreign exchange rate changes on cash
|
(10
|
)
|
9
|
|
(13
|
)
|
|||||
|
Net change in cash
|
(45
|
)
|
84
|
|
(116
|
)
|
|||||
|
Cash, beginning of year
|
355
|
|
271
|
|
387
|
|
|||||
|
Cash, end of year
|
$
|
310
|
|
$
|
355
|
|
$
|
271
|
|
||
The accompanying Notes are an integral part of these Consolidated Financial Statements.
58
CNA Financial Corporation
Consolidated Statements of Stockholders' Equity
|
Years ended December 31
|
|||||||||||
|
(In millions)
|
2018
|
2017
|
2016
|
||||||||
|
Common Stock
|
|||||||||||
|
Balance, beginning of year
|
$
|
683
|
|
$
|
683
|
|
$
|
683
|
|
||
|
Balance, end of year
|
683
|
|
683
|
|
683
|
|
|||||
|
Additional Paid-in Capital
|
|||||||||||
|
Balance, beginning of year
|
2,175
|
|
2,173
|
|
2,153
|
|
|||||
|
Stock-based compensation
|
17
|
|
2
|
|
20
|
|
|||||
|
Balance, end of year
|
2,192
|
|
2,175
|
|
2,173
|
|
|||||
|
Retained Earnings
|
|||||||||||
|
Balance, beginning of year, as previously reported
|
9,414
|
|
9,359
|
|
9,313
|
|
|||||
|
Cumulative effect adjustments from changes in accounting guidance, net of tax
|
(50
|
)
|
—
|
|
—
|
|
|||||
|
Balance, beginning of year, as adjusted
|
9,364
|
|
9,359
|
|
9,313
|
|
|||||
|
Dividends to common stockholders ($3.30, $3.10, and $3.00 per share)
|
(900
|
)
|
(844
|
)
|
(813
|
)
|
|||||
|
Net income
|
813
|
|
899
|
|
859
|
|
|||||
|
Balance, end of year
|
9,277
|
|
9,414
|
|
9,359
|
|
|||||
|
Accumulated Other Comprehensive (Loss) Income
|
|||||||||||
|
Balance, beginning of year, as previously reported
|
32
|
|
(173
|
)
|
(315
|
)
|
|||||
|
Cumulative effect adjustments from changes in accounting guidance, net of tax
|
(16
|
)
|
—
|
|
—
|
|
|||||
|
Balance, beginning of year, as adjusted
|
16
|
|
(173
|
)
|
(315
|
)
|
|||||
|
Other comprehensive (loss) income
|
(894
|
)
|
205
|
|
142
|
|
|||||
|
Balance, end of year
|
(878
|
)
|
32
|
|
(173
|
)
|
|||||
|
Treasury Stock
|
|||||||||||
|
Balance, beginning of year
|
(60
|
)
|
(73
|
)
|
(78
|
)
|
|||||
|
Stock-based compensation
|
3
|
|
13
|
|
5
|
|
|||||
|
Balance, end of year
|
(57
|
)
|
(60
|
)
|
(73
|
)
|
|||||
|
Total stockholders' equity
|
$
|
11,217
|
|
$
|
12,244
|
|
$
|
11,969
|
|
||
The accompanying Notes are an integral part of these Consolidated Financial Statements.
59
CNA Financial Corporation
Notes to Consolidated Financial Statements
Note
A
. Summary of Significant Accounting Policies
Basis of Presentation
The Consolidated Financial Statements include the accounts of CNA Financial Corporation (CNAF) and its subsidiaries. Collectively, CNAF and its subsidiaries are referred to as CNA or the Company. Loews Corporation (Loews) owned approximately
89%
of the outstanding common stock of CNAF as of
December 31, 2018
.
The accompanying Consolidated Financial Statements have been prepared in conformity with GAAP. Intercompany amounts have been eliminated. The preparation of Consolidated Financial Statements in conformity with GAAP requires management to make estimates and assumptions that affect the reported amounts of assets and liabilities and the disclosure of contingent assets and liabilities at the date of the Consolidated Financial Statements and the reported amounts of revenues and expenses during the reporting period. Actual results may differ from those estimates.
Recently Adopted Accounting Standards Updates (ASU)
ASU 2014-09:
In May 2014, the FASB issued ASU No. 2014-09,
Revenue Recognition (Topic 606)
:
Revenue from Contracts with Customers
. The standard excludes from its scope the accounting for insurance contracts, financial instruments, and certain other agreements that are governed under other GAAP guidance, but the standard does apply to certain of the Company's warranty products and services. The updated guidance requires an entity to recognize revenue as performance obligations are met, in an amount that reflects the consideration the entity is entitled to receive for the transfer of the promised goods or services.
On January 1, 2018, the Company adopted the updated guidance using the modified retrospective method applied to all contracts which were not completed as of the date of adoption, with the cumulative effect recognized as an adjustment to the opening balance of Retained earnings. Prior period amounts have not been adjusted and continue to be reported in accordance with the previous accounting guidance.
Under the new guidance, revenue on warranty products and services is recognized more slowly as compared to the historic revenue recognition pattern. In addition, for warranty products where the Company acts as the principal in the transaction, Non-insurance warranty revenue and Non-insurance warranty expense are increased to reflect the gross amount paid by consumers, including the retail seller’s markup which is considered a commission to the Company's agent. This gross-up of revenue and expense also resulted in an increase to Deferred non-insurance warranty acquisition expense and Deferred non-insurance warranty revenue on the Company's Consolidated Balance Sheets as the revenue and expense are recognized over the actuarially determined expected claims emergence pattern.
60
The cumulative effect changes to the Consolidated Balance Sheet for the adoption of the updated guidance on
January 1, 2018
were as follows:
|
(In millions)
|
Balance as of December 31, 2017
|
Adjustments Due to Adoption of Topic 606
|
Balance as of January 1, 2018
|
||||||||
|
Deferred non-insurance warranty acquisition expense
|
$
|
212
|
|
$
|
1,882
|
|
$
|
2,094
|
|
||
|
Deferred non-insurance warranty revenue
|
972
|
|
1,969
|
|
2,941
|
|
|||||
|
Deferred income taxes
|
137
|
|
21
|
|
158
|
|
|||||
|
Retained earnings
|
9,414
|
|
(66
|
)
|
9,348
|
|
|||||
The impact of adoption on the Consolidated Statements of Operations and Balance Sheet was as follows:
|
Year ended December 31, 2018
|
|||||||||||
|
Prior to Adoption
|
Effect of Adoption
|
As Reported
|
|||||||||
|
(In millions)
|
|||||||||||
|
Statement of operations:
|
|||||||||||
|
Non-insurance warranty revenue
|
$
|
420
|
|
$
|
587
|
|
$
|
1,007
|
|
||
|
Total revenues
|
9,547
|
|
587
|
|
10,134
|
|
|||||
|
Non-insurance warranty expense
|
328
|
|
595
|
|
923
|
|
|||||
|
Total claims, benefits and expenses
|
8,575
|
|
595
|
|
9,170
|
|
|||||
|
Income before income tax
|
972
|
|
(8
|
)
|
964
|
|
|||||
|
Income tax expense
|
(153
|
)
|
2
|
|
(151
|
)
|
|||||
|
Net income
|
819
|
|
(6
|
)
|
813
|
|
|||||
|
Balance sheet
(1)
at December 31, 2018:
|
|||||||||||
|
Deferred non-insurance warranty acquisition expense
|
$
|
2,116
|
|
$
|
397
|
|
$
|
2,513
|
|
||
|
Deferred non-insurance warranty revenue
|
2,997
|
|
405
|
|
3,402
|
|
|||||
|
Deferred income taxes
|
390
|
|
2
|
|
392
|
|
|||||
|
Retained earnings
|
9,283
|
|
(6
|
)
|
9,277
|
|
|||||
|
(1)
|
The Prior to Adoption amounts presented in this table include the cumulative effect adjustment at adoption presented in the prior table.
|
See Note
R
to the Consolidated Financial Statements for additional information regarding non-insurance revenues from contracts with customers.
ASU 2016-01:
In January 2016, the FASB issued ASU No. 2016-01,
Financial Instruments - Overall (Subtopic 825-10): Recognition and Measurement of Financial Assets and Financial Liabilities
. The updated accounting guidance requires changes to the reporting model for financial instruments. The guidance primarily changes the model for equity securities by requiring changes in the fair value of equity securities (except those accounted for under the equity method of accounting, those without readily determinable fair values and those that result in consolidation of the investee) to be recognized through the income statement.
The Company adopted the updated guidance on
January 1, 2018
and recognized a cumulative effect adjustment that increased beginning Retained earnings by
$28 million
, net of tax. Prior period amounts have not been adjusted and continue to be reported in accordance with the previous accounting guidance.
For the
year ended December 31, 2018
, the Company recognized
$74 million
in pretax losses within Net realized investment gains (losses) for the change in fair value of non-redeemable preferred stock and
$22 million
in pretax losses within Net investment income for the change in fair value of common stock as a result of this change.
For the
year ended December 31, 2017
, there was a
$32 million
increase in the fair value of non-redeemable preferred stock and a less than
$1 million
increase in the fair value of common stock, both recognized in Other comprehensive income. For the
year ended December 31, 2016
, there was a
$6 million
decrease in the fair value
61
of non-redeemable preferred stock and a
$4 million
increase in the fair value of common stock, both recognized in Other comprehensive income.
ASU 2017-07:
In March 2017, the FASB issued ASU No. 2017-07,
Compensation-Retirement Benefits (Topic 715): Improving the Presentation of Net Periodic Pension Cost and Net Periodic Postretirement Benefit Cost
. The updated accounting guidance requires changes to the presentation of the components of net periodic benefit cost on the income statement by requiring service cost to be presented with other employee compensation costs and other components of net periodic pension cost to be presented outside of any subtotal of operating income. The ASU also stipulates that only the service cost component of net benefit cost is eligible for capitalization. The Company adopted the updated guidance effective January 1, 2018. The guidance was applied on a prospective basis for capitalization of service costs and on a retrospective basis for the presentation of the service cost and other components of net periodic benefit costs in the Company's Consolidated Statements of Operations and in its disclosures. The Company utilized the practical expedient allowing amounts previously disclosed in its Benefit Plans footnote to be used as the estimation basis for prior comparative periods. The Company expanded the related footnote disclosure, Note
I
to the Consolidated Financial Statements, to disclose the amount of service cost and non-service cost components of net periodic benefit cost and the line items in the Consolidated Statements of Operations in which such amounts are reported. The change limiting the costs eligible for capitalization is not material to the Company’s results of operations or financial position.
ASU 2018-02:
In February 2018, the FASB issued ASU No. 2018-02,
Income Statement - Reporting Comprehensive Income (Topic 220): Reclassification of Certain Tax Effects from Accumulated Other Comprehensive Income.
GAAP requires the remeasurement of deferred tax assets and liabilities due to a change in the tax rate to be included in Net income, even if the related income tax effects were originally recognized in Accumulated other comprehensive income (AOCI). The ASU allows a reclassification from AOCI to Retained earnings for stranded tax effects resulting from the new U.S. Federal corporate income tax rate enacted on December 22, 2017. The Company early adopted the updated guidance effective January 1, 2018 and elected to reclassify the stranded income tax effects relating to the reduction in the Federal corporate income tax rate from AOCI to Retained earnings at the beginning of the period of adoption. The net impact of the accounting change resulted in a
$12 million
increase in AOCI and a corresponding decrease in Retained earnings. The
$12 million
increase in AOCI is comprised of a
$142 million
increase in net unrealized gains (losses) on investments partially offset by a
$130 million
decrease in unrecognized pension and postretirement benefits.
The Company releases tax effects from AOCI utilizing the security-by-security approach for Net unrealized gains (losses) on investments with Other-than-temporary impairment (OTTI) losses and Net unrealized gains (losses) on other investments. For Pension and postretirement benefits, tax effects from AOCI are released at enacted tax rates based on the pre-tax adjustments to pension liabilities or assets recognized within OCI.
ASU 2018-13:
In August 2018, the FASB issued ASU No. 2018-13,
Fair Value Measurement (Topic 820) Disclosure Framework - Changes to the Disclosure Requirements for Fair Value Measurement.
The updated accounting guidance requires changes to the disclosures for fair value measurement by adding, removing and modifying disclosures. This guidance is effective for fiscal years beginning after December 15, 2019, including interim periods therein and early adoption is permitted. As of September 30, 2018, the Company adopted the updated guidance and added disclosures on changes in unrealized gains (losses) on Level 3 assets recognized in Other comprehensive income as well as the weighted average rate used to develop significant inputs utilized in the fair value measurements of Level 3 assets. The Company also eliminated disclosures on the amount of transfers between Level 1 and Level 2 assets and the policy for timing of transfers between Levels.
ASU 2018-14:
In August 2018, the FASB issued ASU No. 2018-14,
Compensation -Retirement Benefits - Defined Benefit Plans - General (Subtopic 715-20) Disclosure Framework - Changes to the Disclosure Requirements for Defined Benefit Plans.
The updated accounting guidance modifies the disclosure requirements for employers that sponsor defined benefit pension or other postretirement plans by removing, modifying and adding disclosures. The guidance is effective for annual periods ending after December 15, 2020, and early adoption is permitted. As of December 31, 2018, the Company adopted the updated accounting guidance by eliminating disclosures of the amounts in AOCI expected to be recognized as part of net periodic cost (benefit) during 2019. The Company also added disclosure of the interest crediting rate used in our defined benefit pension plan and a description of significant gains and losses affecting the benefit obligations for the periods presented.
62
Accounting Standards Pending Adoption
In February 2016, the FASB issued ASU No. 2016-02,
Leases (Topic 842): Accounting for Leases.
The updated accounting guidance requires lessees to recognize on the balance sheet assets and liabilities for the rights and obligations created by the majority of leases, including those historically accounted for as operating leases. The guidance is effective for interim and annual periods beginning after December 15, 2018 and prescribes a modified retrospective transition method but allows entities to utilize a practical expedient and apply the guidance prospectively beginning with the adoption date. The Company has decided to utilize the practical expedient. The Company is finalizing its determination of the effect the updated guidance will have on its financial statements, but currently anticipates that asset and liabilities will increase approximately
$230 million
at the adoption date. The Company does not expect the impact of adoption to be material to the Company's results of operations.
In June 2016, the FASB issued ASU No. 2016-13,
Financial Instruments-Credit Losses (Topic 326): Measurement
of Credit Losses on Financial Instruments.
The updated accounting guidance requires changes to the recognition of credit losses on financial instruments not accounted for at fair value through net income. The guidance is effective for interim and annual periods beginning after December 15, 2019. The guidance will be applied using a modified retrospective approach with the cumulative effect recognized as an adjustment to retained earnings. A prospective transition approach is required for debt securities that have recognized an other-than-temporary impairment prior to the effective date. The Company is currently evaluating the effect the guidance will have on the Company's financial statements, but expects the primary changes to be the use of the expected credit loss model for its mortgage loan portfolio, reinsurance and insurance receivables and other financing receivables and the use of the allowance method rather than the write-down method for credit losses within the available-for-sale fixed maturities portfolio. The expected credit loss model will require a financial asset to be presented at the net amount expected to be collected. The allowance method for available-for-sale debt securities will allow the Company to record reversals of credit losses if the estimate of credit losses declines.
In August 2018, the FASB issued ASU 2018-12,
Financial Services-Insurance (Topic 944): Targeted Improvements to the Accounting for Long-Duration Contracts
. The updated accounting guidance requires changes to the measurement and disclosure of long-duration contracts. The guidance requires entities to annually update cash flow assumptions, including morbidity and persistency, and update discount rate assumptions quarterly using an upper-medium grade fixed-income instrument yield. The effect of changes in cash flow assumptions will be recorded in Net income and the effect of changes in discount rate assumptions will be recorded in Other comprehensive income. This guidance is effective for interim and annual periods beginning after December 15, 2020, and requires restatement of the prior periods presented. Early adoption is permitted. The Company is currently evaluating the method and timing of adoption and the effect the updated guidance will have on its financial statements. The annual updating of cash flow assumptions is expected to increase income statement volatility. The quarterly change in discount rate is expected to increase volatility in the Company’s stockholders' equity, but that will be somewhat mitigated because Shadow Adjustments are eliminated under the new guidance. While the requirements of the new guidance represent a material change from existing GAAP, the underlying economics of the business and related cash flows are unchanged.
Insurance Operations
Premiums:
Insurance premiums on property and casualty insurance contracts are recognized in proportion to the underlying risk insured and are principally earned ratably over the term of the policies. Premiums on long term care contracts are earned ratably over the policy year in which they are due. The reserve for unearned premiums represents the portion of premiums written relating to the unexpired terms of coverage.
Insurance receivables include balances due currently or in the future, including amounts due from insureds related to losses under high deductible policies, and are presented at unpaid balances, net of an allowance for uncollectible receivables. Amounts are considered past due based on policy payment terms. The allowance is determined based on periodic evaluations of aged receivables, historical business default data, management's experience and current economic conditions. Insurance receivables and any related allowance are written off after collection efforts are exhausted or a negotiated settlement is reached.
Property and casualty contracts that are retrospectively rated contain provisions that result in an adjustment to the initial policy premium depending on the contract provisions and loss experience of the insured during the experience
63
period. For such contracts, the Company estimates the amount of ultimate premiums that the Company may earn upon completion of the experience period and recognizes either an asset or a liability for the difference between the initial policy premium and the estimated ultimate premium. The Company adjusts such estimated ultimate premium amounts during the course of the experience period based on actual results to date. The resulting adjustment is recorded as either a reduction of or an increase to the earned premiums for the period.
Claim and claim adjustment expense reserves:
Claim and claim adjustment expense reserves, except reserves for structured settlements not associated with A&EP, workers' compensation lifetime claims and long term care claims, are not discounted and are based on i) case basis estimates for losses reported on direct business, adjusted in the aggregate for ultimate loss expectations; ii) estimates of incurred but not reported (IBNR) losses; iii) estimates of losses on assumed reinsurance; iv) estimates of future expenses to be incurred in the settlement of claims; v) estimates of salvage and subrogation recoveries and vi) estimates of amounts due from insureds related to losses under high deductible policies. Management considers current conditions and trends as well as past Company and industry experience in establishing these estimates. The effects of inflation, which can be significant, are implicitly considered in the reserving process and are part of the recorded reserve balance. Ceded claim and claim adjustment expense reserves are reported as a component of Reinsurance receivables on the Consolidated Balance Sheets.
Claim and claim adjustment expense reserves are presented net of anticipated amounts due from insureds related to losses under deductible policies of
$1.2 billion
as of
December 31, 2018
and
2017
. A significant portion of these amounts are supported by collateral. The Company has an allowance for uncollectible deductible amounts, which is presented as a component of the allowance for doubtful accounts included in Insurance receivables on
the Consolidated Balance Sheets.
Structured settlements have been negotiated for certain property and casualty insurance claims. Structured settlements are agreements to provide fixed periodic payments to claimants. The Company's obligations for structured settlements not funded by annuities are included in claim and claim adjustment expense reserves and carried at present values determined using interest rates ranging from to
5.5%
to
8.0%
as of
December 31, 2018
and
2017
. As of
December 31, 2018
and
2017
, the discounted reserves for unfunded structured settlements were
$512 million
and
$527 million
, net of discount of
$760 million
and
$798 million
. For the years ended December 31,
2018
,
2017
and
2016
, the amount of interest recognized on the discounted reserves of unfunded structured settlements was
$40 million
,
$41 million
and
$42 million
, respectively. This interest accretion is presented as a component of Insurance claims and policyholders’ benefits on the Consolidated Statements of Operations, but is excluded from the Company’s disclosure of prior year loss reserve development.
Workers' compensation lifetime claim reserves are calculated using mortality assumptions determined through statutory regulation and economic factors. At
December 31, 2018
and
2017
, workers' compensation lifetime claim reserves are discounted at a
3.5%
interest rate. As of
December 31, 2018
and
2017
, the discounted reserves for workers’ compensation lifetime claim reserves were
$343 million
and
$346 million
, net of discount of
$168 million
and
$190 million
. For the years ended December 31,
2018
,
2017
and
2016
, the amount of interest accretion recognized on the discounted reserves of workers’ compensation lifetime claim reserves was
$16 million
,
$19 million
and
$17 million
, respectively. This interest accretion is presented as a component of Insurance claims and policyholders' benefits on the Consolidated Statements of Operations, but is excluded from the Company's disclosure of prior year loss reserve development.
Long term care claim reserves are calculated using mortality and morbidity assumptions based on Company and industry experience. Long term care claim reserves are discounted at an interest rate of
6.0%
as of
December 31, 2018
and
2017
. As of
December 31, 2018
and
2017
, such discounted reserves totaled
$2.6 billion
and
$2.4 billion
, net of discount of
$460 million
and
$446 million
.
Future policy benefit reserves:
Future policy benefit reserves represent the active life reserves related to the Company's long term care policies and are computed using the net level premium method, which incorporates actuarial assumptions as to morbidity, persistency, inclusive of mortality, discount rate, future premium rate adjustments and expenses. Expense assumptions primarily relate to claim adjudication. The Company's future policy benefit reserves are based on best estimate actuarial assumptions as of the most recent date of loss recognition, which occurred in 2015. If a premium deficiency were to emerge in the future, the assumptions would be unlocked, and the future policy benefit reserves would be adjusted. The GPV process was performed in the third quarter of 2018 as compared to the fourth quarter in 2017. The GPV as of September 30, 2018 and
December 31, 2017
64
indicated the carried reserves were sufficient; therefore, there was no unlocking of assumptions. Interest rates for long term care active life reserves range from
6.6%
to
7.0%
as of September 30, 2018 and
December 31, 2017
.
The Company's most recent GPV indicated the future policy benefit reserves for the long term care business were not deficient in the aggregate, but profits are expected to be recognized in early years followed by losses in later years. In that circumstance, future policy benefit reserves are increased in the profitable years by an amount necessary to offset losses that are projected to be recognized in later years. The amount of the additional future policy benefit reserves recorded in each quarterly period is determined by applying the ratio of the present value of future losses divided by the present value of future profits from the most recently completed GPV to long term care core income in that period.
Guaranty fund and other insurance-related assessments:
Liabilities for guaranty fund and other insurance-related assessments are accrued when an assessment is probable, when it can be reasonably estimated and when the event obligating the entity to pay an imposed or probable assessment has occurred. Liabilities for guaranty funds and other insurance-related assessments are not discounted and are included as part of Other liabilities on the Consolidated Balance Sheets. As of
December 31, 2018
and
2017
, the liability balances were
$108 million
and
$121 million
.
Reinsurance:
Reinsurance accounting allows for contractual cash flows to be reflected as premiums and losses. To qualify for reinsurance accounting, reinsurance agreements must include risk transfer. To meet risk transfer requirements, a reinsurance contract must include both insurance risk, consisting of underwriting and timing risk, and a reasonable possibility of a significant loss for the assuming entity.
Reinsurance receivables related to paid losses are presented at unpaid balances. Reinsurance receivables related to unpaid losses are estimated in a manner consistent with claim and claim adjustment expense reserves or future policy benefit reserves. Reinsurance receivables are reported net of an allowance for uncollectible amounts on the Consolidated Balance Sheets. The cost of reinsurance is primarily accounted for over the life of the underlying reinsured policies using assumptions consistent with those used to account for the underlying policies or over the reinsurance contract period. The ceding of insurance does not discharge the primary liability of the Company.
The Company has established an allowance for uncollectible reinsurance receivables which relates to both amounts already billed on ceded paid losses as well as ceded reserves that will be billed when losses are paid in the future. The allowance for uncollectible reinsurance receivables is estimated on the basis of periodic evaluations of balances due from reinsurers, reinsurer solvency, industry experience and current economic conditions. Reinsurer financial strength ratings are updated and reviewed on an annual basis or sooner if the Company becomes aware of significant changes related to a reinsurer. Because billed receivables generally approximate
5%
or less of total reinsurance receivables, the age of the reinsurance receivables related to paid losses is not a significant input into the allowance analysis. Changes in the allowance for uncollectible reinsurance receivables are presented as a component of Insurance claims and policyholders' benefits on the Consolidated Statements of Operations.
Amounts are considered past due based on the reinsurance contract terms. Reinsurance receivables related to paid losses and any related allowance are written off after collection efforts have been exhausted or a negotiated settlement is reached with the reinsurer. Reinsurance receivables from insolvent insurers related to paid losses are written off when the settlement due from the estate can be reasonably estimated. At the time reinsurance receivables related to paid losses are written off, any required adjustment to reinsurance receivables related to unpaid losses is recorded as a component of Insurance claims and policyholders' benefits on the Consolidated Statements of Operations.
Reinsurance contracts that do not effectively transfer the economic risk of loss on the underlying policies are recorded using the deposit method of accounting, which requires that premium paid or received by the ceding company or assuming company be accounted for as a deposit asset or liability. The Company had
$3 million
and
$8 million
recorded as deposit assets as of
December 31, 2018
and
2017
, and
$3 million
and
$4 million
recorded as deposit liabilities as of
December 31, 2018
and
2017
. Income on reinsurance contracts accounted for under the deposit method is recognized using an effective yield based on the anticipated timing of payments and the remaining life of the contract. When the anticipated timing of payments changes, the effective yield is recalculated to reflect actual payments to date and the estimated timing of future payments. The deposit asset or liability is adjusted to the amount that would have existed had the new effective yield been applied since the inception of the contract.
65
A loss portfolio transfer is a retroactive reinsurance contract. If the cumulative claim and allocated claim adjustment expenses ceded under a loss portfolio transfer exceed the consideration paid, the resulting gain from such excess is deferred and amortized into earnings in future periods in proportion to actual recoveries under the loss portfolio transfer. In any period in which there is a revised estimate of claim and allocated claim adjustment expenses and the loss portfolio transfer is in a gain position, the deferred gain is recalculated as if the revised estimate was available at the inception date of the loss portfolio transfer and the change in the deferred gain is recognized in earnings.
Deferred acquisition costs:
Deferrable acquisition costs include commissions, premium taxes and certain underwriting and policy issuance costs which are incremental direct costs of successful contract acquisitions. Acquisition costs related to property and casualty business are deferred and amortized ratably over the period the related premiums are earned. Deferred acquisition costs are presented net of ceding commissions and other ceded acquisition costs.
The Company evaluates deferred acquisition costs for recoverability. Anticipated investment income is considered in the determination of the recoverability of deferred acquisition costs. Adjustments, if necessary, are recorded in current period results of operations.
Investments in life settlement contracts and related revenue recognition:
The Company formerly held investments in life settlement contracts. The entire portfolio of life settlement contracts was determined to be held for sale as of December 31, 2016. The Company reached an agreement on terms to sell the portfolio and adjusted the fair value to the estimated sales proceeds less cost to sell. This resulted in a
$10 million
loss recognized within Net realized investment gains for the year ended December 31, 2016. The sale was completed during 2017 and the Company recorded the consideration, including a note receivable, which is payable over three years and is carried at amortized cost less any valuation allowance. The note receivable was
$35 million
and
$46 million
as of
December 31, 2018
and
2017
and is included within Other assets on the Consolidated Balance Sheets. Interest income is accreted to the principal balance of the note.
The cash receipts and payments related to the life settlement contracts prior to the sale date are included in Cash Flows from operating activities on the Consolidated Statements of Cash Flows. Cash receipts related to the sale of the life settlement contracts, as well as principal payments on the note receivable, are included in Cash Flows from investing activities.
Investments
The Company classifies its fixed maturity securities as either available-for-sale or trading, and as such, they are carried at fair value. Changes in fair value of trading securities are reported within Net investment income on the Consolidated Statements of Operations. Changes in fair value related to available-for-sale securities are reported as a component of Other comprehensive income. Losses may be recognized within Net realized investment gains (losses) on the Consolidated Statements of Operations when a decline in value is determined by the Company to be other-than-temporary.
The cost of fixed maturity securities classified as available-for-sale is adjusted for amortization of premiums and accretion of discounts, which are included in Net investment income on the Consolidated Statements of Operations. The amortization of premium and accretion of discount for fixed maturity securities takes into consideration call and maturity dates that produce the lowest yield.
For asset-backed securities included in fixed maturity securities, the Company recognizes income using an effective yield based on anticipated prepayments and the estimated economic life of the securities. When estimates of prepayments change, the effective yield is recalculated to reflect actual payments to date and anticipated future payments.
To the extent that unrealized gains on fixed maturity securities supporting long term care products and structured settlements not funded by annuities would result in a premium deficiency if those gains were realized, a related increase in Insurance reserves is recorded, net of tax, as a reduction of net unrealized gains through Other comprehensive income (Shadow Adjustments). Shadow Adjustments, net of tax, decreased
$333 million
and increased
$397 million
for the years ended
December 31, 2018
and
2017
, respectively. As of
December 31, 2018
66
and
2017
, net unrealized gains on investments included in Accumulated other comprehensive income (AOCI) were correspondingly reduced by Shadow Adjustments of
$1,078 million
and
$1,411 million
.
Equity securities are carried at fair value. The Company's non-redeemable preferred stock contain characteristics of debt securities, are priced similarly to bonds and are held primarily for income generation through periodic dividends. While recognition of gains and losses on these securities is not discretionary, management does not consider the changes in fair value of non-redeemable preferred stock to be reflective of our primary operations. As such, the changes in the fair value of these securities are recorded through Net realized investments gains (losses). The Company owns certain common stock with the intention of holding the securities primarily for market appreciation and as such, the changes in the fair value of these securities are recorded through Net investment income. Prior to 2018, equity securities were considered available for sale with changes in fair value reported as a component of Other comprehensive income (loss).
The Company's carrying value of investments in limited partnerships is its share of the net asset value of each partnership, as determined by the general partner. Certain partnerships for which results are not available on a timely basis are reported on a lag, primarily three months or less. Changes in net asset values are accounted for under the equity method and recorded within Net investment income on the Consolidated Statements of Operations.
Mortgage loans are commercial in nature, are carried at unpaid principal balance, net of unamortized fees and any valuation allowance, and are recorded once funded. Interest income from mortgage loans is recognized on an accrual basis using the effective yield method. Mortgage loans are considered to be impaired loans when it is probable that contractual principal and interest payments will not be collected. The Company evaluates loans for impairment on a specific loan basis and identifies loans for evaluation of impairment based on the collection experience of each loan and other credit quality indicators such as debt service coverage ratio and the creditworthiness of the borrower or tenants of credit tenant loan properties. Accrual of income is generally suspended for mortgage loans that are impaired and collection of principal and interest payments is unlikely. Mortgage loans are considered past due when full principal or interest payments have not been received according to contractual terms. As of
December 31, 2018
and
2017
, there were no loans past due or in non-accrual status, and no valuation allowance was recorded.
Other invested assets include overseas deposits. Overseas deposits are valued using the net asset value per share (or equivalent) practical expedient. They are primarily short-term government securities, agency securities and corporate bonds held in trusts that are managed by Lloyd's of London. These funds are required of Lloyd's syndicates to protect policyholders in overseas markets and may be denominated in local currency.
Short term investments are carried at fair value, with the exception of cash accounts earning interest, which are carried at cost and approximate fair value. Changes in fair value are reported as a component of Other comprehensive income.
Purchases and sales of all securities are recorded on the trade date, except for private placement debt securities, including bank loan participations, which are recorded once funded. Realized investment gains and losses are determined on the basis of the cost or amortized cost of the specific securities sold.
In the normal course of investing activities, the Company enters into relationships with variable interest entities (VIEs), as both an investor in limited partnerships and asset-backed securities issued by third-party VIEs. The Company is not the primary beneficiary of these VIEs, and therefore does not consolidate them. The Company determines whether it is the primary beneficiary of a VIE based on a qualitative assessment of the relative power and benefits of the Company and the other participants in the VIE. The Company’s maximum exposure to loss with respect to these investments is limited to the investment carrying values included in the Company’s Consolidated Balance Sheets and any unfunded commitments.
An available for sale security is impaired if the fair value of the security is less than its cost adjusted for accretion, amortization and previously recorded OTTI losses, otherwise defined as an unrealized loss. When a security is impaired, the impairment is evaluated to determine whether it is temporary or other-than-temporary.
Significant judgment is required in the determination of whether an OTTI loss has occurred for a security. The Company follows a consistent and systematic process for determining and recording an OTTI loss, including the evaluation of securities in an unrealized loss position on at least a quarterly basis.
67
The Company’s assessment of whether an OTTI loss has occurred incorporates both quantitative and qualitative information. Fixed maturity securities that the Company intends to sell, or it more likely than not will be required to sell before recovery of amortized cost, are considered to be other-than-temporarily impaired and the entire difference between the amortized cost basis and fair value of the security is recognized as an OTTI loss in earnings. The remaining fixed maturity securities in an unrealized loss position are evaluated to determine if a credit loss exists. The factors considered include (a) the financial condition and near-term and long-term prospects of the issuer, (b) whether the debtor is current on interest and principal payments, (c) credit ratings of the securities and (d) general market conditions and industry or sector specific outlook. The Company also considers results and analysis of cash flow modeling for asset-backed securities, and when appropriate, other fixed maturity securities. The focus of the analysis for asset-backed securities is on assessing the sufficiency and quality of underlying collateral and timing of cash flows based on scenario tests. If the present value of the modeled expected cash flows equals or exceeds the amortized cost of a security, no credit loss is judged to exist and the asset-backed security is deemed to be temporarily impaired. If the present value of the expected cash flows is significantly less than amortized cost, the security is judged to be other-than-temporarily impaired for credit reasons and that shortfall, referred to as the credit component, is recognized as an OTTI loss in earnings. The difference between the adjusted amortized cost basis and fair value, referred to as the non-credit component, is recognized as OTTI in Other comprehensive income. In subsequent reporting periods, a change in intent to sell or further credit impairment on a security whose fair value has not deteriorated will cause the non-credit component originally recorded as OTTI in Other comprehensive income to be recognized as an OTTI loss in earnings. The Company performs the discounted cash flow analysis using stressed scenarios to determine future expectations regarding recoverability. Significant assumptions enter into these cash flow projections including delinquency rates, probable risk of default, loss severity upon a default, over collateralization and interest coverage triggers and credit support from lower level tranches.
Prior to 2018, the Company applied the same impairment model as described above for the majority of its non-redeemable preferred stock securities on the basis that these securities possess characteristics similar to debt securities. For all other equity securities, in determining whether the security was other-than-temporarily impaired, the Company considered a number of factors including, but not limited to: (a) the length of time and the extent to which the fair value has been less than amortized cost, (b) the financial condition and near term prospects of the issuer, (c) the intent and ability of the Company to retain its investment for a period of time sufficient to allow for an anticipated recovery in value and (d) general market conditions and industry or sector specific outlook.
Deferred Non-Insurance Warranty Revenue
Non-insurance warranty revenue is primarily generated from separately-priced service contracts that provide mechanical breakdown and other coverages to vehicle or consumer goods owners. The warranty contracts generally provide coverage from
1 month
to
10 years
. For warranty products where the Company acts as the principal in the transaction, Non-insurance warranty revenues are reported on a gross basis, with amounts paid by customers reported as Non-insurance warranty revenue and commissions paid to agents reported as Non-insurance warranty expense. Non-insurance warranty revenue is reported net of any premiums related to contractual liability coverage issued by the Company's insurance operations. Additionally, the Company provides warranty administration services for dealer and manufacturer obligor warranty products, which include limited warranties and guaranteed automobile protection waivers.
The Company recognizes Non-insurance warranty revenues over the service period in proportion to the actuarially determined expected claims emergence pattern. Customers pay in full at the inception of the warranty contract. The liability for deferred revenue represents the unearned portion of revenue in advance of the Company's performance. The deferred revenue balance includes amounts which are refundable on a pro rata basis upon cancellation.
68
Deferred Non-Insurance Warranty Acquisition Expense
Dealers, retailers and agents earn commission for assisting the Company in obtaining non-insurance warranty contracts. Additionally, the Company utilizes a third-party to perform warranty administrator services for its consumer goods warranties. These costs, which are deferred and recorded as Deferred non-insurance warranty acquisition expense, are amortized to Non-insurance warranty expense consistent with how the related revenue is recognized.
Losses under warranty contracts shall be recognized when it is probable that estimated future costs exceed unrecognized revenue. The Company evaluates deferred costs for recoverability including consideration of anticipated investment income. Adjustments to deferred costs, if necessary, are recorded in the current period results of operations.
Income Taxes
The Company and its eligible subsidiaries (CNA Tax Group) are included in the consolidated federal income tax return of Loews and its eligible subsidiaries. The Company accounts for income taxes under the asset and liability method. Under the asset and liability method, deferred income taxes are recognized for temporary differences between the financial statement and tax return bases of assets and liabilities, based on enacted tax rates and other provisions of the tax law. The effect of a change in tax laws or rates on deferred tax assets and liabilities is recognized in income in the period in which such change is enacted. Future tax benefits are recognized to the extent that realization of such benefits is more likely than not, and a valuation allowance is established for any portion of a deferred tax asset that management believes will not be realized.
Pension and Postretirement Benefits
The Company recognizes the overfunded or underfunded status of its defined benefit plans in Other assets or Other liabilities on the Consolidated Balance Sheets. Changes in funded status related to prior service costs and credits and actuarial gains and losses are recognized in the year in which the changes occur through Other comprehensive income. Annual service cost, interest cost, expected return on plan assets, amortization of prior service costs and credits and amortization of actuarial gains and losses are recognized in the Consolidated Statements of Operations. The vested benefit obligation for the CNA Retirement Plan is determined based on eligible compensation and accrued service for previously entitled employees. Effective June 30, 2015, future benefit accruals under the CNA Retirement Plan were eliminated and the benefit obligations were frozen.
Stock-Based Compensation
The Company records compensation expense using the fair value method for all awards it grants, modifies or cancels primarily on a straight-line basis over the requisite service period, generally
three
years.
Foreign Currency
The Company's foreign subsidiaries' balance sheet accounts are translated at the exchange rates in effect at each reporting date and income statement accounts are either translated at the exchange rates on the date of the transaction or at average exchange rates. Foreign currency translation gains and losses are reflected in Stockholders' equity as a component of AOCI. Foreign currency transaction gains (losses) of less than
$1 million
,
$27 million
and
$(9) million
were included in determining Net income (loss) for the years ended
December 31, 2018
,
2017
and
2016
.
Property and Equipment
Property and equipment are carried at cost less accumulated depreciation. Depreciation is based on the estimated useful lives of the various classes of property and equipment and is determined principally on the straight-line method. Furniture and fixtures are depreciated over
seven
years. Office equipment is depreciated over
five
years. The estimated lives for data processing equipment and software generally range from
three
to
five
years, but can be as long as
ten
years. Leasehold improvements are depreciated over the corresponding lease terms not to exceed the underlying asset life.
69
Goodwill
Goodwill represents the excess of purchase price over the fair value of the net assets of acquired entities and businesses. Goodwill in the International segment may change from period to period as a result of foreign currency translation.
Goodwill is tested for impairment annually or when certain triggering events require such tests. As a result of reviews completed for the year ended
December 31, 2018
, the Company determined that the estimated fair value of the reporting units were in excess of their carrying value including Goodwill. Changes in future periods in assumptions about the level of economic capital, business growth, earnings projections or the weighted average cost of capital could result in a goodwill impairment.
Other Intangible Assets
Other intangible assets are reported within Other assets.
Finite-lived intangible assets are amortized over their estimated useful lives. Indefinite-lived other intangible assets are tested for impairment annually or when certain triggering events require such tests.
Earnings (Loss) Per Share Data
Earnings (loss) per share is based on weighted average number of outstanding common shares. Basic earnings (loss) per share excludes the impact of dilutive securities and is computed by dividing Net income (loss) by the weighted average number of common shares outstanding for the period. Diluted earnings (loss) per share reflects the potential dilution that could occur if securities or other contracts to issue common stock were exercised or converted into common stock.
For the years ended
December 31, 2018
,
2017
and
2016
, approximately
943 thousand
,
988 thousand
and
678 thousand
potential shares attributable to exercises or conversions into common stock under stock-based employee compensation plans were included in the calculation of diluted earnings per share. For those same periods,
6 thousand
, less than
1 thousand
and
102 thousand
potential shares attributable to exercises or conversions into common stock under stock-based employee compensation plans were not included in the calculation of diluted earnings per share because the effect would have been antidilutive.
Supplementary Cash Flow Information
Cash payments made for interest were
$145 million
,
$155 million
and
$157 million
for the years ended
December 31, 2018
,
2017
and
2016
. Cash payments made for income taxes were
$308 million
,
$152 million
and
$170 million
for the years ended
December 31, 2018
,
2017
and
2016
.
70
Note
B
. Investments
The significant components of Net investment income are presented in the following table.
|
Years ended December 31
|
|||||||||||
|
(In millions)
|
2018
|
2017
|
2016
|
||||||||
|
Fixed maturity securities
|
$
|
1,795
|
|
$
|
1,812
|
|
$
|
1,819
|
|
||
|
Equity securities
|
18
|
|
12
|
|
10
|
|
|||||
|
Limited partnership investments
|
(22
|
)
|
207
|
|
155
|
|
|||||
|
Mortgage loans
|
50
|
|
34
|
|
41
|
|
|||||
|
Short term investments
|
26
|
|
15
|
|
8
|
|
|||||
|
Trading portfolio
|
7
|
|
12
|
|
10
|
|
|||||
|
Other
|
4
|
|
1
|
|
4
|
|
|||||
|
Gross investment income
|
1,878
|
|
2,093
|
|
2,047
|
|
|||||
|
Investment expense
|
(61
|
)
|
(59
|
)
|
(59
|
)
|
|||||
|
Net investment income
|
$
|
1,817
|
|
$
|
2,034
|
|
$
|
1,988
|
|
||
For the year ended
December 31, 2018
, Net investment income was reduced by
$24 million
due to the change in fair value of common stock still held as of
December 31, 2018
.
As of
December 31, 2018
the Company held
no
non-income producing fixed maturity securities. As of
December 31, 2017
the Company held
$2 million
of non-income producing fixed maturity securities. As of
December 31, 2018
and
2017
,
no
investments in a single issuer exceeded 10% of stockholders' equity, other than investments in securities issued by the U.S. Treasury and obligations of government-sponsored enterprises.
Net realized investment gains (losses) are presented in the following table.
|
Years ended December 31
|
|||||||||||
|
(In millions)
|
2018
|
2017
|
2016
|
||||||||
|
Net realized investment gains (losses):
|
|||||||||||
|
Fixed maturity securities:
|
|||||||||||
|
Gross realized gains
|
$
|
168
|
|
$
|
186
|
|
$
|
204
|
|
||
|
Gross realized losses
|
(164
|
)
|
(64
|
)
|
(138
|
)
|
|||||
|
Net realized investment gains (losses) on fixed maturity securities
|
4
|
|
122
|
|
66
|
|
|||||
|
Equity securities
|
(74
|
)
|
—
|
|
(5
|
)
|
|||||
|
Derivatives
|
9
|
|
(4
|
)
|
(2
|
)
|
|||||
|
Short term investments and other
|
9
|
|
(25
|
)
|
(9
|
)
|
|||||
|
Net realized investment gains (losses)
|
$
|
(52
|
)
|
$
|
93
|
|
$
|
50
|
|
||
For the year ended
December 31, 2018
, Net realized investment gains (losses) were reduced by
$73 million
due to the change in fair value of non-redeemable preferred stock still held as of
December 31, 2018
. Net realized investment gains (losses) for the year ended
December 31, 2017
included a
$42 million
loss related to the redemption of the Company's
$350 million
senior notes due November 2019.
71
Net change in unrealized gains on investments is presented in the following table.
|
Years ended December 31
|
|||||||||||
|
(In millions)
|
2018
|
2017
|
2016
|
||||||||
|
Net change in unrealized gains on investments:
|
|||||||||||
|
Fixed maturity securities
|
$
|
(1,811
|
)
|
$
|
728
|
|
$
|
225
|
|
||
|
Equity securities
(1)
|
—
|
|
32
|
|
(2
|
)
|
|||||
|
Other
|
—
|
|
(2
|
)
|
1
|
|
|||||
|
Total net change in unrealized gains on investments
|
$
|
(1,811
|
)
|
$
|
758
|
|
$
|
224
|
|
||
|
(1)
|
As of January 1, 2018, the Company adopted ASU 2016-01,
Financial Instruments - Overall (Subtopic 825-10): Recognition and Measurement of Financial Assets and Financial Liabilities
. The change in fair value of equity securities is now recognized through the income statement. See Note A to the Consolidated Financial Statements for additional information.
|
The components of OTTI losses recognized in earnings by asset type are presented in the following table.
|
Years ended December 31
|
|||||||||||
|
(In millions)
|
2018
|
2017
|
2016
|
||||||||
|
Fixed maturity securities available-for-sale:
|
|
||||||||||
|
Corporate and other bonds
|
$
|
12
|
|
$
|
12
|
|
$
|
59
|
|
||
|
Asset-backed
|
9
|
|
1
|
|
13
|
|
|||||
|
Total fixed maturity securities available-for-sale
|
21
|
|
13
|
|
72
|
|
|||||
|
Equity securities available-for-sale
|
—
|
|
1
|
|
9
|
|
|||||
|
OTTI losses recognized in earnings
|
$
|
21
|
|
$
|
14
|
|
$
|
81
|
|
||
72
The following tables present a summary of fixed maturity and equity securities.
|
December 31, 2018
(1)
|
Cost or
Amortized
Cost
|
Gross
Unrealized
Gains
|
Gross
Unrealized
Losses
|
Estimated
Fair
Value
|
Unrealized
OTTI
Losses (Gains)
|
||||||||||||||
|
(In millions)
|
|||||||||||||||||||
|
Fixed maturity securities available-for-sale:
|
|||||||||||||||||||
|
Corporate and other bonds
|
$
|
18,764
|
|
$
|
791
|
|
$
|
395
|
|
$
|
19,160
|
|
$
|
—
|
|
||||
|
States, municipalities and political subdivisions
|
9,681
|
|
1,076
|
|
9
|
|
10,748
|
|
—
|
|
|||||||||
|
Asset-backed:
|
|||||||||||||||||||
|
Residential mortgage-backed
|
4,815
|
|
68
|
|
57
|
|
4,826
|
|
(20
|
)
|
|||||||||
|
Commercial mortgage-backed
|
2,200
|
|
28
|
|
32
|
|
2,196
|
|
—
|
|
|||||||||
|
Other asset-backed
|
1,975
|
|
11
|
|
24
|
|
1,962
|
|
—
|
|
|||||||||
|
Total asset-backed
|
8,990
|
|
107
|
|
113
|
|
8,984
|
|
(20
|
)
|
|||||||||
|
U.S. Treasury and obligations of government-sponsored enterprises
|
156
|
|
3
|
|
—
|
|
159
|
|
—
|
|
|||||||||
|
Foreign government
|
480
|
|
5
|
|
4
|
|
481
|
|
—
|
|
|||||||||
|
Redeemable preferred stock
|
10
|
|
—
|
|
—
|
|
10
|
|
—
|
|
|||||||||
|
Total fixed maturity securities available-for-sale
|
38,081
|
|
1,982
|
|
521
|
|
39,542
|
|
$
|
(20
|
)
|
||||||||
|
Total fixed maturity securities trading
|
4
|
|
—
|
|
—
|
|
4
|
|
|||||||||||
|
Total fixed maturity securities
|
$
|
38,085
|
|
$
|
1,982
|
|
$
|
521
|
|
$
|
39,546
|
|
|||||||
|
December 31, 2017
|
Cost or
Amortized
Cost
|
Gross
Unrealized
Gains
|
Gross
Unrealized
Losses
|
Estimated
Fair
Value
|
Unrealized
OTTI
Losses (Gains)
|
||||||||||||||
|
(In millions)
|
|||||||||||||||||||
|
Fixed maturity securities available-for-sale:
|
|||||||||||||||||||
|
Corporate and other bonds
|
$
|
17,210
|
|
$
|
1,625
|
|
$
|
28
|
|
$
|
18,807
|
|
$
|
—
|
|
||||
|
States, municipalities and political subdivisions
|
12,478
|
|
1,551
|
|
2
|
|
14,027
|
|
(11
|
)
|
|||||||||
|
Asset-backed:
|
|||||||||||||||||||
|
Residential mortgage-backed
|
5,043
|
|
109
|
|
32
|
|
5,120
|
|
(27
|
)
|
|||||||||
|
Commercial mortgage-backed
|
1,840
|
|
46
|
|
14
|
|
1,872
|
|
—
|
|
|||||||||
|
Other asset-backed
|
1,083
|
|
16
|
|
5
|
|
1,094
|
|
—
|
|
|||||||||
|
Total asset-backed
|
7,966
|
|
171
|
|
51
|
|
8,086
|
|
(27
|
)
|
|||||||||
|
U.S. Treasury and obligations of government-sponsored enterprises
|
111
|
|
2
|
|
4
|
|
109
|
|
—
|
|
|||||||||
|
Foreign government
|
437
|
|
9
|
|
2
|
|
444
|
|
—
|
|
|||||||||
|
Redeemable preferred stock
|
10
|
|
1
|
|
—
|
|
11
|
|
—
|
|
|||||||||
|
Total fixed maturity securities available-for-sale
|
38,212
|
|
3,359
|
|
87
|
|
41,484
|
|
$
|
(38
|
)
|
||||||||
|
Total fixed maturity securities trading
|
3
|
|
—
|
|
—
|
|
3
|
|
|||||||||||
|
Equity securities available-for-sale:
|
|||||||||||||||||||
|
Common stock
|
21
|
|
7
|
|
1
|
|
27
|
|
|||||||||||
|
Preferred stock
|
638
|
|
31
|
|
1
|
|
668
|
|
|||||||||||
|
Total equity securities available-for-sale
|
659
|
|
38
|
|
2
|
|
695
|
|
|||||||||||
|
Total fixed maturity and equity securities
|
$
|
38,874
|
|
$
|
3,397
|
|
$
|
89
|
|
$
|
42,182
|
|
|||||||
|
(1)
|
As of January 1, 2018, the Company adopted ASU 2016-01,
Financial Instruments - Overall (Subtopic 825-10): Recognition and Measurement of Financial Assets and Financial Liabilities
. The change in fair value of equity securities is now recognized through the income statement. See Note A to the Consolidated Financial Statements for additional information.
|
73
The following tables present the estimated fair value and gross unrealized losses of fixed maturity and equity securities in a gross unrealized loss position by the length of time in which the securities have continuously been in that position.
|
Less than 12 Months
|
12 Months or Longer
|
Total
|
|||||||||||||||||||||
|
December 31, 2018
(1)
|
Estimated
Fair Value
|
Gross
Unrealized
Losses
|
Estimated
Fair Value
|
Gross
Unrealized
Losses
|
Estimated
Fair Value
|
Gross
Unrealized
Losses
|
|||||||||||||||||
|
(In millions)
|
|||||||||||||||||||||||
|
Fixed maturity securities available-for-sale:
|
|||||||||||||||||||||||
|
Corporate and other bonds
|
$
|
8,543
|
|
$
|
340
|
|
$
|
825
|
|
$
|
55
|
|
$
|
9,368
|
|
$
|
395
|
|
|||||
|
States, municipalities and political subdivisions
|
517
|
|
8
|
|
5
|
|
1
|
|
522
|
|
9
|
|
|||||||||||
|
Asset-backed:
|
|||||||||||||||||||||||
|
Residential mortgage-backed
|
1,932
|
|
23
|
|
1,119
|
|
34
|
|
3,051
|
|
57
|
|
|||||||||||
|
Commercial mortgage-backed
|
728
|
|
10
|
|
397
|
|
22
|
|
1,125
|
|
32
|
|
|||||||||||
|
Other asset-backed
|
834
|
|
21
|
|
125
|
|
3
|
|
959
|
|
24
|
|
|||||||||||
|
Total asset-backed
|
3,494
|
|
54
|
|
1,641
|
|
59
|
|
5,135
|
|
113
|
|
|||||||||||
|
U.S. Treasury and obligations of government-sponsored enterprises
|
21
|
|
—
|
|
19
|
|
—
|
|
40
|
|
—
|
|
|||||||||||
|
Foreign government
|
114
|
|
2
|
|
124
|
|
2
|
|
238
|
|
4
|
|
|||||||||||
|
Total
|
$
|
12,689
|
|
|
$
|
404
|
|
|
$
|
2,614
|
|
|
$
|
117
|
|
|
$
|
15,303
|
|
|
$
|
521
|
|
|
Less than 12 Months
|
12 Months or Longer
|
Total
|
|||||||||||||||||||||
|
December 31, 2017
|
Estimated
Fair Value
|
Gross
Unrealized
Losses
|
Estimated
Fair Value
|
Gross
Unrealized
Losses
|
Estimated
Fair Value
|
Gross
Unrealized
Losses
|
|||||||||||||||||
|
(In millions)
|
|||||||||||||||||||||||
|
Fixed maturity securities available-for-sale:
|
|||||||||||||||||||||||
|
Corporate and other bonds
|
$
|
1,354
|
|
$
|
21
|
|
$
|
168
|
|
$
|
7
|
|
$
|
1,522
|
|
$
|
28
|
|
|||||
|
States, municipalities and political subdivisions
|
72
|
|
1
|
|
85
|
|
1
|
|
157
|
|
2
|
|
|||||||||||
|
Asset-backed:
|
|||||||||||||||||||||||
|
Residential mortgage-backed
|
1,228
|
|
5
|
|
947
|
|
27
|
|
2,175
|
|
32
|
|
|||||||||||
|
Commercial mortgage-backed
|
403
|
|
4
|
|
212
|
|
10
|
|
615
|
|
14
|
|
|||||||||||
|
Other asset-backed
|
248
|
|
3
|
|
18
|
|
2
|
|
266
|
|
5
|
|
|||||||||||
|
Total asset-backed
|
1,879
|
|
12
|
|
1,177
|
|
39
|
|
3,056
|
|
51
|
|
|||||||||||
|
U.S. Treasury and obligations of government-sponsored enterprises
|
49
|
|
2
|
|
21
|
|
2
|
|
70
|
|
4
|
|
|||||||||||
|
Foreign government
|
166
|
|
2
|
|
4
|
|
—
|
|
170
|
|
2
|
|
|||||||||||
|
Total fixed maturity securities available-for-sale
|
3,520
|
|
38
|
|
1,455
|
|
49
|
|
4,975
|
|
87
|
|
|||||||||||
|
Equity securities available-for-sale:
|
|
|
|
|
|
|
|
|
|
|
|
|
|||||||||||
|
Common stock
|
7
|
|
1
|
|
—
|
|
—
|
|
7
|
|
1
|
|
|||||||||||
|
Preferred stock
|
93
|
|
1
|
|
—
|
|
—
|
|
93
|
|
1
|
|
|||||||||||
|
Total equity securities available-for-sale
|
100
|
|
|
2
|
|
|
—
|
|
|
—
|
|
|
100
|
|
|
2
|
|
||||||
|
Total
|
$
|
3,620
|
|
$
|
40
|
|
$
|
1,455
|
|
$
|
49
|
|
$
|
5,075
|
|
$
|
89
|
|
|||||
|
(1)
|
As of January 1, 2018, the Company adopted ASU 2016-01,
Financial Instruments - Overall (Subtopic 825-10): Recognition and Measurement of Financial Assets and Financial Liabilities
. The change in fair value of equity securities is now recognized through the income statement. See Note A to the Consolidated Financial Statements for additional information.
|
74
Based on current facts and circumstances, the Company believes the unrealized losses presented in the
December 31, 2018
securities in a gross unrealized loss position table above are not indicative of the ultimate collectibility of the current amortized cost of the securities, but rather are attributable to changes in interest rates, credit spreads and other factors. The Company has no current intent to sell securities with unrealized losses, nor is it more likely than not that it will be required to sell prior to recovery of amortized cost; accordingly, the Company has determined that there are no additional OTTI losses to be recorded as of
December 31, 2018
.
The following table presents the activity related to the pretax credit loss component reflected in Retained earnings on fixed maturity securities still held as of
December 31, 2018
,
2017
and
2016
for which a portion of an OTTI loss was recognized in Other comprehensive income (loss).
|
Years ended December 31
|
|||||||||||
|
(In millions)
|
2018
|
2017
|
2016
|
||||||||
|
Beginning balance of credit losses on fixed maturity securities
|
$
|
27
|
|
$
|
36
|
|
$
|
53
|
|
||
|
Reductions for securities sold during the period
|
(9
|
)
|
(9
|
)
|
(16
|
)
|
|||||
|
Reductions for securities the Company intends to sell or more likely than not will be required to sell
|
—
|
|
—
|
|
(1
|
)
|
|||||
|
Ending balance of credit losses on fixed maturity securities
|
$
|
18
|
|
$
|
27
|
|
$
|
36
|
|
||
Contractual Maturity
The following table presents available-for-sale fixed maturity securities by contractual maturity.
|
December 31
|
2018
|
2017
|
|||||||||||||
|
(In millions)
|
Cost or
Amortized
Cost
|
Estimated
Fair
Value
|
Cost or
Amortized
Cost
|
Estimated
Fair
Value
|
|||||||||||
|
Due in one year or less
|
$
|
1,350
|
|
$
|
1,359
|
|
$
|
1,135
|
|
$
|
1,157
|
|
|||
|
Due after one year through five years
|
7,979
|
|
8,139
|
|
8,165
|
|
8,501
|
|
|||||||
|
Due after five years through ten years
|
16,859
|
|
16,870
|
|
16,060
|
|
16,718
|
|
|||||||
|
Due after ten years
|
11,893
|
|
13,174
|
|
12,852
|
|
15,108
|
|
|||||||
|
Total
|
$
|
38,081
|
|
$
|
39,542
|
|
$
|
38,212
|
|
$
|
41,484
|
|
|||
Actual maturities may differ from contractual maturities because certain securities may be called or prepaid. Securities not due at a single date are allocated based on weighted average life.
Limited Partnerships
The carrying value of limited partnerships as of
December 31, 2018
and
2017
was
$1,982 million
and
$2,369 million
, which includes net undistributed earnings of
$153 million
and
$539 million
. Limited partnerships comprising
60%
of the total carrying value are reported on a current basis through
December 31, 2018
with no reporting lag,
14%
are reported on a one month lag and the remainder are reported on more than a one month lag. The number of limited partnerships held and the strategies employed provide diversification to the limited partnership portfolio and the overall invested asset portfolio.
Limited partnerships comprising
65%
and
71%
of the carrying value as of
December 31, 2018
and
2017
employ hedge fund strategies. Limited partnerships comprising
30%
and
25%
of the carrying value as of
December 31, 2018
and
2017
were invested in private debt and equity. The remainder was primarily invested in real estate strategies. Hedge fund strategies include both long and short positions in fixed income, equity and derivative instruments. These hedge fund strategies may seek to generate gains from mispriced or undervalued securities, price differentials between securities, distressed investments, sector rotation or various arbitrage disciplines. Within hedge fund strategies, approximately
60%
were equity related,
18%
pursued a multi-strategy approach,
19%
were focused on distressed investments and
3%
were fixed income related as of
December 31, 2018
.
75
The ten largest limited partnership positions held totaled
$876 million
and
$1,136 million
as of
December 31, 2018
and
2017
. Based on the most recent information available regarding the Company’s percentage ownership of the individual limited partnerships, the carrying value reflected on the Consolidated Balance Sheets represents approximately
2%
and
3%
of the aggregate partnership equity as of
December 31, 2018
and
2017
, and the related income reflected on the Consolidated Statements of Operations represents approximately
3%
,
3%
and
4%
of the changes in aggregate partnership equity for the years ended
December 31, 2018
,
2017
and
2016
.
While the Company generally does not invest in highly leveraged partnerships, there are risks inherent in limited partnership investments which may result in losses due to short-selling, derivatives or other speculative investment practices. The use of leverage increases volatility generated by the underlying investment strategies.
The Company’s limited partnership investments contain withdrawal provisions that generally limit liquidity for a period of thirty days up to one year and in some cases do not permit withdrawals until the termination of the partnership. Typically, withdrawals require advance written notice of up to 90 days.
Derivative Financial Instruments
The Company may use derivatives in the normal course of business, primarily in an attempt to reduce its exposure to market risk (principally interest rate risk, credit risk, equity price risk and foreign currency risk) stemming from various assets and liabilities. The Company's principal objective under such strategies is to achieve the desired reduction in economic risk, even if the position does not receive hedge accounting treatment.
The Company may enter into interest rate swaps, futures and forward commitments to purchase securities to manage interest rate risk. The Company may use foreign currency forward contracts to manage foreign currency risk.
Credit exposure associated with non-performance by the counterparties to derivative instruments is generally limited to the uncollateralized fair value of the asset related to the instruments recognized on the Consolidated Balance Sheets. The Company generally requires that all over-the-counter derivative contracts be governed by an International Swaps and Derivatives Association Master Agreement, and exchanges collateral under the terms of these agreements with its derivative investment counterparties depending on the amount of the exposure and the credit rating of the counterparty. Gross estimated fair values of derivative positions are presented in Other invested assets and Other liabilities on the Consolidated Balance Sheets. The Company does not offset derivative positions against the fair value of collateral provided or positions subject to netting arrangements. There would be no significant difference in the balance included in such accounts if the estimated fair values were presented net as of
December 31, 2018
and
2017
.
There was
no
cash collateral provided by the Company as of
December 31, 2018
or
2017
. There was
no
cash collateral received from counterparties held as of
December 31, 2018
or
2017
.
The Company holds an embedded derivative on a funds withheld liability with a notional value of
$172 million
and
$167 million
as of
December 31, 2018
and
2017
and a fair value of
$4 million
and
$(3) million
as of
December 31, 2018
and
2017
. The embedded derivative on the funds withheld liability is accounted for separately and reported with the funds withheld liability in Other liabilities on the Consolidated Balance Sheets.
76
Investment Commitments
As of
December 31, 2018
, the Company had committed approximately
$574 million
to future capital calls from various third-party limited partnership investments in exchange for an ownership interest in the related partnerships.
As of
December 31, 2018
, the Company had mortgage loan commitments of
$59 million
representing signed loan applications received and accepted.
The Company invests in various privately placed debt securities, including bank loans, as part of its overall investment strategy and has committed to additional future purchases, sales and funding. Purchases and sales of privately placed debt securities are recorded once funded. As of
December 31, 2018
, the Company had commitments to purchase or fund additional amounts of
$230 million
and sell
$78 million
under the terms of such securities.
Investments on Deposit
Securities with carrying values of approximately
$2.5 billion
and
$2.6 billion
were deposited by the Company’s insurance subsidiaries under requirements of regulatory authorities and others as of
December 31, 2018
and
2017
.
Cash and securities with carrying values of approximately
$1.0 billion
and
$1.1 billion
were deposited with financial institutions in trust accounts or as collateral for letters of credit to secure obligations with various third parties as of
December 31, 2018
and
2017
.
77
Note
C
. Fair Value
Fair value is the price that would be received upon sale of an asset or paid to transfer a liability in an orderly transaction between market participants at the measurement date. The following fair value hierarchy is used in selecting inputs, with the highest priority given to Level 1, as these are the most transparent or reliable.
Level 1 - Quoted prices for identical instruments in active markets.
Level 2 - Quoted prices for similar instruments in active markets; quoted prices for identical or similar instruments in markets that are not active; and model-derived valuations in which all significant inputs are observable in active markets.
Level 3 - Valuations derived from valuation techniques in which one or more significant inputs are not observable.
Prices may fall within Level 1, 2 or 3 depending upon the methodology and inputs used to estimate fair value for each specific security. In general, the Company seeks to price securities using third-party pricing services. Securities not priced by pricing services are submitted to independent brokers for valuation and, if those are not available, internally developed pricing models are used to value assets using a methodology and inputs the Company believes market participants would use to value the assets. Prices obtained from third-party pricing services or brokers are not adjusted by the Company.
The Company performs control procedures over information obtained from pricing services and brokers to ensure prices received represent a reasonable estimate of fair value and to confirm representations regarding whether inputs are observable or unobservable. Procedures may include i) the review of pricing service methodologies or broker pricing qualifications, ii) back-testing, where past fair value estimates are compared to actual transactions executed in the market on similar dates, iii) exception reporting, where period-over-period changes in price are reviewed and challenged with the pricing service or broker based on exception criteria, iv) deep dives, where the Company performs an independent analysis of the inputs and assumptions used to price individual securities and v) pricing validation, where prices received are compared to prices independently estimated by the Company.
78
Assets and Liabilities Measured at Fair Value
Assets and liabilities measured at fair value on a recurring basis are presented in the following tables. Corporate bonds and other includes obligations of the U.S. Treasury, government-sponsored enterprises, foreign governments and redeemable preferred stock.
|
December 31, 2018
|
|
|
|
Total
Assets/Liabilities
at Fair Value
|
|||||||||||
|
(In millions)
|
Level 1
|
Level 2
|
Level 3
|
||||||||||||
|
Assets
|
|
|
|
|
|||||||||||
|
Fixed maturity securities:
|
|
|
|
|
|||||||||||
|
Corporate bonds and other
|
$
|
196
|
|
$
|
19,396
|
|
$
|
222
|
|
$
|
19,814
|
|
|||
|
States, municipalities and political subdivisions
|
—
|
|
10,748
|
|
—
|
|
10,748
|
|
|||||||
|
Asset-backed
|
—
|
|
8,787
|
|
197
|
|
8,984
|
|
|||||||
|
Total fixed maturity securities
|
196
|
|
38,931
|
|
419
|
|
39,546
|
|
|||||||
|
Equity securities:
|
|||||||||||||||
|
Common stock
|
144
|
|
—
|
|
4
|
|
148
|
|
|||||||
|
Non-redeemable preferred stock
|
48
|
|
570
|
|
14
|
|
632
|
|
|||||||
|
Total equity securities
|
192
|
|
570
|
|
18
|
|
780
|
|
|||||||
|
Short term and other
|
216
|
|
949
|
|
—
|
|
1,165
|
|
|||||||
|
Total assets
|
$
|
604
|
|
$
|
40,450
|
|
|
$
|
437
|
|
|
$
|
41,491
|
|
|
|
Liabilities
|
|
|
|
|
|||||||||||
|
Other liabilities
|
$
|
—
|
|
$
|
(4
|
)
|
$
|
—
|
|
$
|
(4
|
)
|
|||
|
Total liabilities
|
$
|
—
|
|
$
|
(4
|
)
|
$
|
—
|
|
$
|
(4
|
)
|
|||
|
December 31, 2017
|
|
|
|
Total
Assets/Liabilities
at Fair Value
|
|||||||||||
|
(In millions)
|
Level 1
|
Level 2
|
Level 3
|
||||||||||||
|
Assets
|
|
|
|
|
|||||||||||
|
Fixed maturity securities:
|
|
|
|
|
|||||||||||
|
Corporate bonds and other
|
$
|
128
|
|
$
|
19,148
|
|
$
|
98
|
|
$
|
19,374
|
|
|||
|
States, municipalities and political subdivisions
|
—
|
|
14,026
|
|
1
|
|
14,027
|
|
|||||||
|
Asset-backed
|
—
|
|
7,751
|
|
335
|
|
8,086
|
|
|||||||
|
Total fixed maturity securities
|
128
|
|
40,925
|
|
434
|
|
41,487
|
|
|||||||
|
Equity securities:
|
|||||||||||||||
|
Common stock
|
23
|
|
—
|
|
4
|
|
27
|
|
|||||||
|
Non-redeemable preferred stock
|
68
|
|
584
|
|
16
|
|
668
|
|
|||||||
|
Total equity securities
|
91
|
|
584
|
|
20
|
|
695
|
|
|||||||
|
Short term and other
|
396
|
|
958
|
|
—
|
|
1,354
|
|
|||||||
|
Total assets
|
$
|
615
|
|
|
$
|
42,467
|
|
|
$
|
454
|
|
|
$
|
43,536
|
|
|
Liabilities
|
|
|
|
|
|||||||||||
|
Other liabilities
|
$
|
—
|
|
$
|
3
|
|
$
|
—
|
|
$
|
3
|
|
|||
|
Total liabilities
|
$
|
—
|
|
$
|
3
|
|
$
|
—
|
|
$
|
3
|
|
|||
79
The tables below present a reconciliation for all assets and liabilities measured at fair value on a recurring basis using significant unobservable inputs (Level 3).
|
Level 3
(In millions)
|
Corporate bonds and other
|
States, municipalities and political subdivisions
|
Asset-backed
|
Equity securities
|
Derivative financial instruments
|
Total
|
|||||||||||||||||
|
Balance as of January 1, 2018
|
$
|
98
|
|
$
|
1
|
|
$
|
335
|
|
$
|
20
|
|
$
|
—
|
|
$
|
454
|
|
|||||
|
Total realized and unrealized investment gains (losses):
|
|||||||||||||||||||||||
|
Reported in Net realized investment gains (losses)
|
(1
|
)
|
—
|
|
5
|
|
(2
|
)
|
—
|
|
2
|
|
|||||||||||
|
Reported in Net investment income
|
—
|
|
—
|
|
—
|
|
—
|
|
—
|
|
—
|
|
|||||||||||
|
Reported in Other comprehensive income (loss)
|
(4
|
)
|
—
|
|
(8
|
)
|
—
|
|
—
|
|
(12
|
)
|
|||||||||||
|
Total realized and unrealized investment gains (losses)
|
(5
|
)
|
|
—
|
|
|
(3
|
)
|
|
(2
|
)
|
|
—
|
|
(10
|
)
|
|||||||
|
Purchases
|
117
|
|
—
|
|
162
|
|
—
|
|
—
|
|
279
|
|
|||||||||||
|
Sales
|
(5
|
)
|
—
|
|
(72
|
)
|
—
|
|
—
|
|
(77
|
)
|
|||||||||||
|
Settlements
|
(9
|
)
|
(1
|
)
|
(64
|
)
|
—
|
|
—
|
|
(74
|
)
|
|||||||||||
|
Transfers into Level 3
|
35
|
|
—
|
|
42
|
|
—
|
|
—
|
|
77
|
|
|||||||||||
|
Transfers out of Level 3
|
(9
|
)
|
—
|
|
(203
|
)
|
—
|
|
—
|
|
(212
|
)
|
|||||||||||
|
Balance as of December 31, 2018
|
$
|
222
|
|
$
|
—
|
|
$
|
197
|
|
$
|
18
|
|
$
|
—
|
|
$
|
437
|
|
|||||
|
Unrealized gains (losses) on Level 3 assets and liabilities held as of December 31, 2018 recognized in Net income (loss)
|
$
|
—
|
|
$
|
—
|
|
$
|
(2
|
)
|
$
|
(2
|
)
|
$
|
—
|
|
$
|
(4
|
)
|
|||||
|
Unrealized gains (losses) on Level 3 assets and liabilities held as of December 31, 2018 recognized in Other comprehensive income (loss)
|
(5
|
)
|
—
|
|
(4
|
)
|
—
|
|
—
|
|
(9
|
)
|
|||||||||||
|
Level 3
(In millions)
|
Corporate bonds and other
|
States, municipalities and political subdivisions
|
Asset-backed
|
Equity securities
|
Derivative financial instruments
|
Life settlement contracts
|
Total
|
||||||||||||||||||||
|
Balance as of January 1, 2017
|
$
|
130
|
|
$
|
1
|
|
$
|
199
|
|
$
|
19
|
|
$
|
—
|
|
$
|
58
|
|
$
|
407
|
|
||||||
|
Total realized and unrealized investment gains (losses):
|
|
|
|||||||||||||||||||||||||
|
Reported in Net realized investment gains (losses)
|
—
|
|
—
|
|
2
|
|
—
|
|
1
|
|
—
|
|
3
|
|
|||||||||||||
|
Reported in Other revenues
|
—
|
|
—
|
|
—
|
|
—
|
|
—
|
|
6
|
|
6
|
|
|||||||||||||
|
Reported in Other comprehensive income (loss)
|
3
|
|
—
|
|
3
|
|
3
|
|
—
|
|
—
|
|
9
|
|
|||||||||||||
|
Total realized and unrealized investment gains (losses)
|
3
|
|
|
—
|
|
|
5
|
|
|
3
|
|
|
1
|
|
|
6
|
|
18
|
|
||||||||
|
Purchases
|
18
|
|
—
|
|
107
|
|
1
|
|
—
|
|
—
|
|
126
|
|
|||||||||||||
|
Sales
|
(5
|
)
|
—
|
|
—
|
|
(3
|
)
|
(1
|
)
|
(59
|
)
|
(68
|
)
|
|||||||||||||
|
Settlements
|
(54
|
)
|
—
|
|
(43
|
)
|
—
|
|
—
|
|
(5
|
)
|
(102
|
)
|
|||||||||||||
|
Transfers into Level 3
|
16
|
|
—
|
|
153
|
|
—
|
|
—
|
|
—
|
|
169
|
|
|||||||||||||
|
Transfers out of Level 3
|
(10
|
)
|
—
|
|
(86
|
)
|
—
|
|
—
|
|
—
|
|
(96
|
)
|
|||||||||||||
|
Balance as of December 31, 2017
|
$
|
98
|
|
$
|
1
|
|
$
|
335
|
|
$
|
20
|
|
$
|
—
|
|
$
|
—
|
|
$
|
454
|
|
||||||
|
Unrealized gains (losses) on Level 3 assets and liabilities held as of December 31, 2017 recognized in Net income (loss)
|
$
|
—
|
|
$
|
—
|
|
$
|
—
|
|
$
|
—
|
|
$
|
—
|
|
$
|
—
|
|
$
|
—
|
|
||||||
Securities may be transferred in or out of levels within the fair value hierarchy based on the availability of observable market information and quoted prices used to determine the fair value of the security. The availability of observable market information and quoted prices varies based on market conditions and trading volume.
80
Valuation Methodologies and Inputs
The following section describes the valuation methodologies and relevant inputs used to measure different financial instruments at fair value, including an indication of the level in the fair value hierarchy in which the instruments are generally classified.
Fixed Maturity Securities
Level 1 securities include highly liquid and exchange traded bonds and redeemable preferred stock, valued using quoted market prices. Level 2 securities include most other fixed maturity securities as the significant inputs are observable in the marketplace. All classes of Level 2 fixed maturity securities are valued using a methodology based on information generated by market transactions involving identical or comparable assets, a discounted cash flow methodology, or a combination of both when necessary. Common inputs for all classes of fixed maturity securities include prices from recently executed transactions of similar securities, marketplace quotes, benchmark yields, spreads off benchmark yields, interest rates and U.S. Treasury or swap curves. Specifically for asset-backed securities, key inputs include prepayment and default projections based on past performance of the underlying collateral and current market data. Fixed maturity securities are primarily assigned to Level 3 in cases where broker/dealer quotes are significant inputs to the valuation and there is a lack of transparency as to whether these quotes are based on information that is observable in the marketplace. Level 3 securities also include private placement debt securities whose fair value is determined using internal models with inputs that are not market observable.
Equity Securities
Level 1 equity securities include publicly traded securities valued using quoted market prices. Level 2 securities are primarily valued using pricing for similar securities, recently executed transactions and other pricing models utilizing market observable inputs. Level 3 securities are primarily priced using broker/dealer quotes and internal models with inputs that are not market observable.
Short Term and Other Invested Assets
Securities that are actively traded or have quoted prices are classified as Level 1. These securities include money market funds and treasury bills. Level 2 primarily includes commercial paper, for which all inputs are market observable. Fixed maturity securities purchased within one year of maturity are classified consistent with fixed maturity securities discussed above. Short term investments as presented in the tables above differ from the amounts presented on the Consolidated Balance Sheets because certain short term investments, such as time deposits, are not measured at fair value.
As of
December 31, 2018
and
December 31, 2017
, there were approximately $
48 million
and
$39 million
of overseas deposits within other invested assets, which can be redeemed at net asset value in 90 days or less. Overseas deposits are excluded from the fair value hierarchy because their fair value is recorded using the net asset value per share (or equivalent) practical expedient.
Life Settlement Contracts
The Company sold its life settlement contracts to a third party in 2017. The valuation of the life settlement contracts was based on the terms of sale. The contracts were classified as Level 3 as there was not an active market for life settlement contracts.
Derivative Financial Investments
Level 2 investments primarily include the embedded derivative on the funds withheld liability. The embedded derivative on funds withheld liability is valued using the change in fair value of the assets supporting the funds withheld liability, which are fixed maturity securities valued with observable inputs.
81
Significant Unobservable Inputs
The following tables present quantitative information about the significant unobservable inputs utilized by the Company in the fair value measurements of Level 3 assets. Valuations for assets and liabilities not presented in the tables below are primarily based on broker/dealer quotes for which there is a lack of transparency as to inputs used to develop the valuations. The quantitative detail of these unobservable inputs is neither provided nor reasonably available to the Company. The weighted average rate is calculated based on fair value.
|
December 31, 2018
|
Estimated Fair Value
(In millions)
|
Valuation Technique(s)
|
Unobservable Input(s)
|
Range
(Weighted Average)
|
|||||
|
Fixed maturity securities
|
$
|
228
|
|
Discounted cash flow
|
Credit spread
|
1% - 12% (3%)
|
|||
|
December 31, 2017
|
Estimated Fair Value
(In millions) |
Valuation Technique(s)
|
Unobservable Input(s)
|
Range
(Weighted Average)
|
|||||
|
Fixed maturity securities
|
$
|
136
|
|
Discounted cash flow
|
Credit spread
|
1% - 12% (3%)
|
|||
For fixed maturity securities, an increase to the credit spread assumptions would result in a lower fair value measurement.
Financial Assets and Liabilities Not Measured at Fair Value
The carrying amount and estimated fair value of the Company's financial assets and liabilities which are not measured at fair value on the Consolidated Balance Sheets are presented in the following tables.
|
December 31, 2018
|
Carrying
Amount
|
Estimated Fair Value
|
|||||||||||||||||
|
(In millions)
|
Level 1
|
Level 2
|
Level 3
|
Total
|
|||||||||||||||
|
Assets
|
|||||||||||||||||||
|
Mortgage loans
|
$
|
839
|
|
$
|
—
|
|
$
|
—
|
|
$
|
827
|
|
$
|
827
|
|
||||
|
Note receivable
|
35
|
|
—
|
|
—
|
|
35
|
|
35
|
|
|||||||||
|
Liabilities
|
|||||||||||||||||||
|
Long term debt
|
$
|
2,680
|
|
$
|
—
|
|
$
|
2,731
|
|
$
|
—
|
|
$
|
2,731
|
|
||||
|
December 31, 2017
|
Carrying
Amount |
Estimated Fair Value
|
|||||||||||||||||
|
(In millions)
|
Level 1
|
Level 2
|
Level 3
|
Total
|
|||||||||||||||
|
Assets
|
|||||||||||||||||||
|
Mortgage loans
|
$
|
839
|
|
$
|
—
|
|
$
|
—
|
|
$
|
844
|
|
$
|
844
|
|
||||
|
Note receivable
|
46
|
|
—
|
|
—
|
|
46
|
|
46
|
|
|||||||||
|
Liabilities
|
|||||||||||||||||||
|
Short term debt
|
$
|
150
|
|
$
|
—
|
|
$
|
150
|
|
$
|
—
|
|
$
|
150
|
|
||||
|
Long term debt
|
2,708
|
|
—
|
|
2,896
|
|
—
|
|
2,896
|
|
|||||||||
The following methods and assumptions were used to estimate the fair value of these financial assets and liabilities.
The fair values of mortgage loans were based on the present value of the expected future cash flows discounted at the current interest rate for origination of similar quality loans, adjusted for specific loan risk.
The fair value of the note receivable was based on the present value of the expected future cash flows discounted at the current interest rate for origination of similar notes, adjusted for specific credit risk. The note receivable is included within Other assets on the Consolidated Balance Sheets.
The Company's senior notes and debentures were valued based on observable market prices. The fair value for other debt was estimated using discounted cash flows based on current incremental borrowing rates for similar borrowing arrangements.
The carrying amounts reported on the Consolidated Balance Sheets for Cash, Short term investments not carried at fair value, Accrued investment income and certain Other assets and Other liabilities approximate fair value due to the short term nature of these items. These assets and liabilities are not listed in the tables above.
82
Note
D
. Income Taxes
The CNA Tax Group is included in the consolidated federal income tax return of Loews and its eligible subsidiaries. Loews and the Company have agreed that for each taxable year, the Company will 1) be paid by Loews the amount, if any, by which the Loews consolidated federal income tax liability is reduced by virtue of the inclusion of the CNA Tax Group in the Loews consolidated federal income tax return, or 2) pay to Loews an amount, if any, equal to the federal income tax that would have been payable by the CNA Tax Group filing a separate consolidated tax return. In the event that Loews should have a net operating loss in the future computed on the basis of filing a separate consolidated tax return without the CNA Tax Group, the Company may be required to repay tax recoveries previously received from Loews. This agreement may be canceled by either party upon 30 days written notice.
For the years ended
December 31, 2018
,
2017
and
2016
, the Company paid
$275 million
,
$127 million
and
$142 million
to Loews related to federal income taxes.
For
2016
through
2018
, the Internal Revenue Service (IRS) has accepted Loews and the Company into the Compliance Assurance Process (CAP), which is a voluntary program for large corporations. Under CAP, the IRS conducts a real-time audit and works contemporaneously with the Company to resolve any issues prior to the filing of the tax return. The Company believes that this approach should reduce tax-related uncertainties, if any.
As of
December 31, 2018
and
2017
, there were
no
unrecognized tax benefits.
The Company recognizes interest accrued related to: 1) unrecognized tax benefits in Interest expense and 2) tax refund claims in Other revenues on the Consolidated Statements of Operations. The Company recognizes penalties (if any) in Income tax (expense) benefit on the Consolidated Statements of Operations. During
2018
,
2017
and
2016
the Company recognized
no
interest and
no
penalties. There were
no
amounts accrued for interest or penalties as of
December 31, 2018
or
2017
.
On December 22, 2017, H.R.1, “An Act to Provide for Reconciliation Pursuant to Titles II and V of the Concurrent Resolution on the Budget for Fiscal Year 2018,” was signed into law (Tax Reform Legislation).
Shortly after enactment, the Securities and Exchange Commission Staff issued Staff Accounting Bulletin No. 118 (SAB 118) to provide guidance on accounting for the Tax Reform Legislation impacts when the measurements of the income tax effects are complete, incomplete, or incomplete but for which a provisional amount can be estimated. SAB 118 permitted the recognition of provisional amounts, and adjustments to provisional amounts, in subsequent reporting periods within a one year measurement period.
At December 31, 2017, the Company had significant provisional items as set forth below.
|
•
|
The Company re-computed its insurance reserves and the transition adjustment from existing law.
|
|
•
|
The Company computed amounts under special accounting method provisions for recognizing income for Federal income tax purposes no later than for financial accounting purposes and the transition adjustment from existing law.
|
|
•
|
The Company did not record current or deferred taxes with respect to the international provisions since it did not expect to have inclusions in U.S. taxable income for certain earnings of foreign subsidiaries in future years.
|
Adjustments to the Company's provisional amounts for the year ended December 31, 2018 did not impact the effective tax rate.
The Tax Reform Legislation provided for a permanent reduction in the Federal corporate income tax rate from 35% to 21% effective January 1, 2018, among other provisions. The Company was required to recognize the effect of the tax rate change on its deferred tax assets in the period the tax rate change was signed into law. Consequently, the Company recorded a non-cash increase to Income tax expense of
$83 million
in the Consolidated Statements of Operations for the year ended
December 31, 2017
. Based on the filed 2017 tax return, the effect of the tax rate change decreased Income tax expense by
$6 million
for the year ended
December 31, 2018
.
At December 31, 2018, measurement of the income tax effects of the Tax Reform Legislation is complete.
83
The following table presents a reconciliation between the Company's federal income tax expense at statutory rates and the recorded income tax expense.
|
Years ended December 31
|
|||||||||||
|
(In millions)
|
2018
|
2017
|
2016
|
||||||||
|
Income tax expense at statutory rates
|
$
|
(203
|
)
|
$
|
(459
|
)
|
$
|
(398
|
)
|
||
|
Tax benefit from tax exempt income
|
63
|
|
131
|
|
124
|
|
|||||
|
Foreign taxes and credits
|
(1
|
)
|
3
|
|
3
|
|
|||||
|
State income taxes
|
(13
|
)
|
(7
|
)
|
(6
|
)
|
|||||
|
Net deferred tax asset remeasurement
|
6
|
|
(83
|
)
|
—
|
|
|||||
|
Other tax expense
|
(3
|
)
|
4
|
|
(1
|
)
|
|||||
|
Income tax expense
|
$
|
(151
|
)
|
|
$
|
(411
|
)
|
$
|
(278
|
)
|
|
As of
December 31, 2018
,
no
deferred taxes are required on the undistributed earnings of subsidiaries subject to tax.
The following table presents the current and deferred components of the Company's income tax expense.
|
Years ended December 31
|
|||||||||||
|
(In millions)
|
2018
|
2017
|
2016
|
||||||||
|
Current tax expense
|
$
|
(171
|
)
|
$
|
(243
|
)
|
$
|
(142
|
)
|
||
|
Deferred tax benefit (expense)
|
20
|
|
(168
|
)
|
(136
|
)
|
|||||
|
Total income tax expense
|
$
|
(151
|
)
|
$
|
(411
|
)
|
$
|
(278
|
)
|
||
Total income tax presented above includes foreign tax (expense)/benefit of approximately
$(5) million
,
$1 million
and
$(9) million
related to pretax income from foreign operations of approximately
$22 million
,
$39 million
and
$51 million
for the years ended
December 31, 2018
,
2017
and
2016
.
84
The deferred tax effects of the significant components of the Company's deferred tax assets and liabilities are presented in the following table.
|
December 31
|
|||||||
|
(In millions)
|
2018
|
2017
|
|||||
|
Deferred Tax Assets:
|
|||||||
|
Insurance reserves:
|
|||||||
|
Property and casualty claim and claim adjustment expense reserves
|
$
|
108
|
|
$
|
74
|
|
|
|
Unearned premium reserves
|
108
|
|
142
|
|
|||
|
Receivables
|
15
|
|
15
|
|
|||
|
Employee benefits
|
143
|
|
154
|
|
|||
|
Deferred retroactive reinsurance benefit
|
79
|
|
68
|
|
|||
|
Other assets
|
131
|
|
105
|
|
|||
|
Gross deferred tax assets
|
584
|
|
558
|
|
|||
|
Deferred Tax Liabilities:
|
|||||||
|
Investment valuation differences
|
44
|
|
55
|
|
|||
|
Deferred acquisition costs
|
78
|
|
77
|
|
|||
|
Net unrealized gains
|
14
|
|
233
|
|
|||
|
Software and hardware
|
44
|
|
46
|
|
|||
|
Other liabilities
|
12
|
|
10
|
|
|||
|
Gross deferred tax liabilities
|
192
|
|
421
|
|
|||
|
Net deferred tax asset
|
$
|
392
|
|
$
|
137
|
|
|
As of
December 31, 2018
, the CNA Tax Group had
no
loss carryforwards or tax credit carryforwards.
Although realization of deferred tax assets is not assured, management believes it is more likely than not that the recognized net deferred tax asset will be realized through recoupment of ordinary and capital taxes paid in prior carryback years and through future earnings, reversal of existing temporary differences and available tax planning strategies. As a result,
no
valuation allowance was recorded as of
December 31, 2018
or
2017
.
85
Note
E
. Claim and Claim Adjustment Expense Reserves
Property and casualty insurance claim and claim adjustment expense reserves represent the estimated amounts necessary to resolve all outstanding claims, including IBNR claims as of the reporting date. The Company's reserve projections are based primarily on detailed analysis of the facts in each case, the Company's experience with similar cases and various historical development patterns. Consideration is given to historical patterns such as claim reserving trends and settlement practices, loss payments, pending levels of unpaid claims and product mix, as well as court decisions and economic conditions, including inflation, and public attitudes. All of these factors can affect the estimation of claim and claim adjustment expense reserves.
Establishing claim and claim adjustment expense reserves, including claim and claim adjustment expense reserves for catastrophic events that have occurred, is an estimation process. Many factors can ultimately affect the final settlement of a claim and, therefore, the necessary reserve. Changes in the law, results of litigation, medical costs, the cost of repair materials and labor rates can affect ultimate claim costs. In addition, time can be a critical part of reserving determinations since the longer the span between the incidence of a loss and the payment or settlement of the claim, the more variable the ultimate settlement amount can be. Accordingly, short-tail claims, such as property damage claims, tend to be more reasonably estimable than long-tail claims, such as workers' compensation, general liability and professional liability claims. Adjustments to prior year reserve estimates, if necessary, are reflected in the results of operations in the period that the need for such adjustments is determined. There can be no assurance that the Company's ultimate cost for insurance losses will not exceed current estimates.
Liability for Unpaid Claim and Claim Adjustment Expenses
The table below reconciles the net liability for unpaid claim and claim adjustment expenses to the amount presented in the Consolidated Balance Sheets.
|
As of December 31
|
|||
|
(In millions)
|
2018
|
||
|
Net liability for unpaid claim and claim adjustment expenses:
|
|||
|
Specialty
|
$
|
4,831
|
|
|
Commercial
|
7,998
|
|
|
|
International
|
1,524
|
|
|
|
Corporate & Other
|
192
|
|
|
|
Life & Group
(1)
|
3,420
|
|
|
|
Total net claim and claim adjustment expenses
|
17,965
|
|
|
|
Reinsurance receivables:
(2)
|
|||
|
Specialty
|
634
|
|
|
|
Commercial
|
745
|
|
|
|
International
|
226
|
|
|
|
Corporate & Other
(3)
|
2,233
|
|
|
|
Life & Group
|
181
|
|
|
|
Total reinsurance receivables
|
4,019
|
|
|
|
Total gross liability for unpaid claim and claim adjustment expenses
|
$
|
21,984
|
|
(1) The Life & Group segment amounts are primarily related to long term care claim reserves, but also includes amounts related to unfunded structured settlements arising from short duration contracts. Long term care policies are long duration contracts.
(2) Reinsurance receivables presented do not include reinsurance receivables related to paid losses.
(3) The Corporate & Other Reinsurance receivables are primarily related to A&EP claims covered under the Loss Portfolio Transfer.
86
The following table presents a reconciliation between beginning and ending claim and claim adjustment expense reserves, including claim and claim adjustment expense reserves of the Life & Group segment.
|
As of or for the years ended December 31
|
|||||||||||
|
(In millions)
|
2018
|
2017
|
2016
|
||||||||
|
Reserves, beginning of year:
|
|||||||||||
|
Gross
|
$
|
22,004
|
|
$
|
22,343
|
|
$
|
22,663
|
|
||
|
Ceded
|
3,934
|
|
4,094
|
|
4,087
|
|
|||||
|
Net reserves, beginning of year
|
18,070
|
|
18,249
|
|
18,576
|
|
|||||
|
Net incurred claim and claim adjustment expenses:
|
|||||||||||
|
Provision for insured events of current year
|
5,358
|
|
5,201
|
|
5,025
|
|
|||||
|
Decrease in provision for insured events of prior years
|
(179
|
)
|
(381
|
)
|
(342
|
)
|
|||||
|
Amortization of discount
|
176
|
|
179
|
|
175
|
|
|||||
|
Total net incurred
(1)
|
5,355
|
|
4,999
|
|
4,858
|
|
|||||
|
Net payments attributable to:
|
|||||||||||
|
Current year events
|
(1,046
|
)
|
(975
|
)
|
(967
|
)
|
|||||
|
Prior year events
|
(4,285
|
)
|
(4,366
|
)
|
(4,167
|
)
|
|||||
|
Total net payments
|
(5,331
|
)
|
(5,341
|
)
|
(5,134
|
)
|
|||||
|
Foreign currency translation adjustment and other
|
(129
|
)
|
163
|
|
(51
|
)
|
|||||
|
Net reserves, end of year
|
17,965
|
|
18,070
|
|
18,249
|
|
|||||
|
Ceded reserves, end of year
|
4,019
|
|
3,934
|
|
4,094
|
|
|||||
|
Gross reserves, end of year
|
$
|
21,984
|
|
$
|
22,004
|
|
$
|
22,343
|
|
||
|
(1)
|
Total net incurred above does not agree to Insurance claims and policyholders' benefits as reflected on the Consolidated Statements of Operations due to amounts related to retroactive reinsurance deferred gain accounting, uncollectible reinsurance and loss deductible receivables, and benefit expenses related to future policy benefits, which are not reflected in the table above.
|
87
Reserving Methodology
In developing claim and claim adjustment expense (“loss” or “losses”) reserve estimates, the Company's actuaries perform detailed reserve analyses that are staggered throughout the year. Every reserve group is reviewed at least once during the year, but most are reviewed more frequently. The analyses generally review losses gross of ceded reinsurance and apply the ceded reinsurance terms to the gross estimates to establish estimates net of reinsurance. Factors considered include, but are not limited to, the historical pattern and volatility of the actuarial indications, the sensitivity of the actuarial indications to changes in paid and incurred loss patterns, the consistency of claims handling processes, the consistency of case reserving practices, changes in the Company's pricing and underwriting, pricing and underwriting trends in the insurance market and legal, judicial, social and economic trends. In addition to the detailed analyses, the Company reviews actual loss emergence for all products each quarter.
In developing the loss reserve estimates for property and casualty contracts, the Company generally projects ultimate losses using several common actuarial methods as listed below. The Company reviews the various indications from the various methods and applies judgment to select an actuarial point estimate. The carried reserve may differ from the actuarial point estimate as the result of the Company's consideration of the factors noted above as well as the potential volatility of the projections associated with the specific product being analyzed and other factors affecting claims costs that may not be quantifiable through traditional actuarial analysis. The indicated required reserve is the difference between the selected ultimate loss and the inception-to-date paid losses. The difference between the selected ultimate loss and the case incurred or reported loss is IBNR. IBNR includes a provision for development on known cases as well as a provision for late reported incurred claims. Further, the Company does not establish case reserves for allocated loss adjustment expenses (ALAE), therefore ALAE reserves are included in the Company's estimate of IBNR.
The most frequently utilized methods to project ultimate losses include the following:
|
•
|
Paid development:
The paid development method estimates ultimate losses by reviewing paid loss patterns and applying them to accident years with further expected changes in paid loss.
|
|
•
|
Incurred development:
The incurred development method is similar to the paid development method, but it uses case incurred losses instead of paid losses.
|
|
•
|
Loss ratio:
The loss ratio method multiplies premiums by an expected loss ratio to produce ultimate loss estimates for each accident year.
|
|
•
|
Bornhuetter-Ferguson using premiums and paid loss:
The Bornhuetter-Ferguson using premiums and paid loss method is a combination of the paid development approach and the loss ratio approach. This method normally determines expected loss ratios similar to the approach used to estimate the expected loss ratio for the loss ratio method.
|
|
•
|
Bornhuetter-Ferguson using premiums and incurred loss:
The Bornhuetter-Ferguson using premiums and incurred loss method is similar to the Bornhuetter-Ferguson using premiums and paid loss method except that it uses case incurred losses.
|
|
•
|
Frequency times severity:
The frequency times severity method multiplies a projected number of ultimate claims by an estimated ultimate average loss for each accident year to produce ultimate loss estimates.
|
|
•
|
Stochastic modeling:
The stochastic modeling produces a range of possible outcomes based on varying assumptions related to the particular product being modeled.
|
For many exposures, especially those that can be considered long-tail, a particular accident or policy year may not have a sufficient volume of paid losses to produce a statistically reliable estimate of ultimate losses. In such a case, the Company's actuaries typically assign more weight to the incurred development method than to the paid development method. As claims continue to settle and the volume of paid loss increases, the actuaries may assign additional weight to the paid development method. For most of the Company's products, even the incurred losses for accident or policy years that are early in the claim settlement process will not be of sufficient volume to produce a reliable estimate of ultimate losses. In these cases, the Company may not assign any weight to the paid and incurred development methods. The Company will use the loss ratio, Bornhuetter-Ferguson and frequency times severity methods. For short-tail exposures, the paid and incurred development methods can often be relied on sooner, primarily because the Company's history includes a sufficient number of years to cover the entire period over which paid and incurred losses are expected to change. However, the Company may also use the loss ratio,
88
Bornhuetter-Ferguson and frequency times severity methods for short-tail exposures. For other more complex reserve groups where the above methods may not produce reliable indications, the Company uses additional methods tailored to the characteristics of the specific situation.
Certain claim liabilities are more difficult to estimate or have differing methodologies and considerations which are described below.
Mass Tort and A&EP Reserves
The Company's reserving methodologies for mass tort and A&EP are similar as both are based on detailed reviews of large accounts with estimates of ultimate payments based on the facts in each case and the Company's view of applicable law and coverage litigation.
Life & Group
The Life & Group segment includes the run-off long term care business as well as structured settlement obligations not funded by annuities related to certain property and casualty claimants. Long term care policies provide benefits for nursing homes, assisted living facilities and home health care subject to various daily and lifetime caps. Generally, policyholders must continue to make periodic premium payments to keep the policy in force and we have the ability to increase policy premiums, subject to state regulatory approval.
The Company maintains both claim and claim adjustment expense reserves as well as future policy benefit reserves for policyholder benefits for the Life & Group segment. Claim and claim adjustment expense reserves consist of estimated reserves for long term care policyholders that are currently receiving benefits, including claims that have been incurred but are not yet reported. In developing the claim and claim adjustment expense reserve estimates for the long term care policies, the Company's actuaries perform a detailed claim experience study on an annual basis. The study reviews the sufficiency of existing reserves for policyholders currently on claim and includes an evaluation of expected benefit utilization and claim duration. The Company's recorded claim and claim adjustment expense reserves reflect management's best estimate after incorporating the results of the most recent study. In addition, claim and claim adjustment expense reserves are also maintained for the structured settlement obligations. Both elements of the Life & Group reserves are discounted as discussed in Note A to the Consolidated Financial Statements.
89
Gross and Net Carried Reserves
The following tables present the gross and net carried reserves.
|
December 31, 2018
|
Specialty
|
Commercial
|
International
|
Life & Group
|
Corporate & Other
|
Total
|
|||||||||||||||||
|
(In millions)
|
|||||||||||||||||||||||
|
Gross Case Reserves
|
$
|
1,623
|
|
$
|
4,181
|
|
$
|
867
|
|
$
|
3,516
|
|
$
|
1,208
|
|
$
|
11,395
|
|
|||||
|
Gross IBNR Reserves
|
3,842
|
|
4,562
|
|
883
|
|
85
|
|
1,217
|
|
10,589
|
|
|||||||||||
|
Total Gross Carried Claim and Claim Adjustment Expense Reserves
|
$
|
5,465
|
|
$
|
8,743
|
|
$
|
1,750
|
|
$
|
3,601
|
|
$
|
2,425
|
|
$
|
21,984
|
|
|||||
|
Net Case Reserves
|
$
|
1,483
|
|
$
|
3,831
|
|
$
|
749
|
|
$
|
3,364
|
|
$
|
96
|
|
$
|
9,523
|
|
|||||
|
Net IBNR Reserves
|
3,348
|
|
4,167
|
|
775
|
|
56
|
|
96
|
|
8,442
|
|
|||||||||||
|
Total Net Carried Claim and Claim Adjustment Expense Reserves
|
$
|
4,831
|
|
$
|
7,998
|
|
$
|
1,524
|
|
$
|
3,420
|
|
$
|
192
|
|
$
|
17,965
|
|
|||||
|
December 31, 2017
|
Specialty
|
Commercial
|
International
|
Life &
Group
|
Corporate
& Other
|
Total
|
|||||||||||||||||
|
(In millions)
|
|||||||||||||||||||||||
|
Gross Case Reserves
|
$
|
1,742
|
|
$
|
4,427
|
|
$
|
744
|
|
$
|
3,386
|
|
$
|
1,371
|
|
$
|
11,670
|
|
|||||
|
Gross IBNR Reserves
|
3,927
|
|
4,337
|
|
892
|
|
113
|
|
1,065
|
|
10,334
|
|
|||||||||||
|
Total Gross Carried Claim and Claim Adjustment Expense Reserves
|
$
|
5,669
|
|
$
|
8,764
|
|
$
|
1,636
|
|
$
|
3,499
|
|
$
|
2,436
|
|
$
|
22,004
|
|
|||||
|
Net Case Reserves
|
$
|
1,600
|
|
$
|
4,103
|
|
$
|
640
|
|
$
|
3,208
|
|
$
|
94
|
|
$
|
9,645
|
|
|||||
|
Net IBNR Reserves
|
3,407
|
|
4,033
|
|
792
|
|
82
|
|
111
|
|
8,425
|
|
|||||||||||
|
Total Net Carried Claim and Claim Adjustment Expense Reserves
|
$
|
5,007
|
|
$
|
8,136
|
|
$
|
1,432
|
|
$
|
3,290
|
|
$
|
205
|
|
$
|
18,070
|
|
|||||
Net Prior Year Development
Changes in estimates of claim and claim adjustment expense reserves, net of reinsurance, for prior years are defined as net prior year loss reserve development (development). These changes can be favorable or unfavorable. The following table presents development recorded for the Specialty, Commercial, International and Corporate & Other segments.
|
December 31, 2018
|
|||||||||||
|
(In millions)
|
2018
|
2017
|
2016
|
||||||||
|
Pretax (favorable) unfavorable development:
|
|||||||||||
|
Specialty
|
$
|
(150
|
)
|
$
|
(174
|
)
|
$
|
(247
|
)
|
||
|
Commercial
|
(25
|
)
|
(115
|
)
|
15
|
|
|||||
|
International
|
(4
|
)
|
(9
|
)
|
(58
|
)
|
|||||
|
Corporate & Other
|
(2
|
)
|
(10
|
)
|
2
|
|
|||||
|
Total pretax (favorable) unfavorable development
|
$
|
(181
|
)
|
$
|
(308
|
)
|
$
|
(288
|
)
|
||
Favorable net prior year loss reserve development of
$19 million
,
$72 million
and
$46 million
was recorded in the Life & Group segment for the years ended
December 31, 2018
,
2017
and
2016
. The favorable net prior year loss reserve development for the year ended
December 31, 2018
was driven by lower than expected claim severity.
90
Segment Development Tables
For the Specialty, Commercial and International segments, the following tables present further detail and commentary on the development reflected in the financial statements for each of the periods presented. Also presented are loss reserve development tables that illustrate the change over time of reserves established for claim and allocated claim adjustment expenses arising from short duration insurance contracts for certain lines of business within each of these segments. Not all lines of business or segments are presented based on their context to the Company's overall loss reserves, calendar year reserve development, or calendar year net earned premiums. Insurance contracts are considered to be short duration contracts when the contracts are not expected to remain in force for an extended period of time.
The Cumulative Net Incurred Claim and Allocated Claim Adjustment Expenses tables, reading across, show the cumulative net incurred claim and allocated claim adjustment expenses relating to each accident year at the end of the stated calendar year. Changes in the cumulative amount across time are the result of the Company's expanded awareness of additional facts and circumstances that pertain to the unsettled claims. The Cumulative Net Paid Claims and Allocated Claim Adjustment Expenses tables, reading across, show the cumulative amount paid for claims in each accident year as of the end of the stated calendar year. The Net Strengthening or (Releases) of Prior Accident Year Reserves tables, reading across, show the net increase or decrease in the cumulative net incurred accident year claim and allocated claim adjustment expenses during each stated calendar year and indicates whether the reserves for that accident year were strengthened or released.
The information in the tables is reported on a net basis after reinsurance and does not include the effects of discounting. The information contained in calendar years 2017 and prior is unaudited. Information contained in the tables pertaining to the Company's International segment has been presented at the year-end
2018
foreign currency exchange rates for all periods presented to remove the effects of foreign currency exchange rate changes between calendar years. The Company has presented development information for the Hardy business prospectively from the date of acquisition and is presented as a separate table within the Company's International segment. To the extent the Company enters into a commutation, the transaction is reported on a prospective basis. To the extent that the Company enters into a disposition, the effects of the disposition are reported on a retrospective basis by removing the balances associated with the disposed of business.
The amounts reported for the cumulative number of reported claims include direct and assumed open and closed claims by accident year at the claimant level. The number excludes claim counts for claims within a policy deductible where the insured is responsible for payment of losses in the deductible layer. Claim count data for certain assumed reinsurance contracts is unavailable.
IBNR includes reserves for incurred but not reported losses and expected development on case reserves. The Company does not establish case reserves for ALAE, therefore ALAE reserves are also included in the estimate of IBNR.
91
Specialty
The following table presents further detail of the development recorded for the Specialty segment.
|
Years ended December 31
|
|||||||||||
|
(In millions)
|
2018
|
2017
|
2016
|
||||||||
|
Pretax (favorable) unfavorable development:
|
|||||||||||
|
Medical Professional Liability
|
$
|
47
|
|
$
|
30
|
|
$
|
9
|
|
||
|
Other Professional Liability and Management Liability
|
(127
|
)
|
(126
|
)
|
(140
|
)
|
|||||
|
Surety
|
(70
|
)
|
(84
|
)
|
(63
|
)
|
|||||
|
Warranty
|
(10
|
)
|
4
|
|
4
|
|
|||||
|
Other
|
10
|
|
2
|
|
(57
|
)
|
|||||
|
Total pretax (favorable) unfavorable development
|
$
|
(150
|
)
|
$
|
(174
|
)
|
$
|
(247
|
)
|
||
2018
Unfavorable development in medical professional liability was primarily due to higher than expected severity in accident years 2014 and 2017 in our hospitals business. Additionally, there was higher than expected frequency and severity in aging services in accident years 2014 through 2017 combined, partially offset by lower than expected frequency in accident year 2015.
Favorable development in other professional liability and management liability was primarily due to lower than expected claim frequency in recent accident years related to financial institutions and professional liability errors and omissions (E&O), favorable severity in accident years 2015 and prior related to professional liability E&O and favorable outcomes on individual claims in financial institutions in accident years 2013 and prior.
Favorable development in surety was due to lower than expected loss emergence for accident years 2017 and prior.
2017
Unfavorable development in medical professional liability was primarily due to continued higher than expected frequency in aging services and higher than expected severity for hospitals in recent accident years. This was partially offset by favorable development in hospitals in prior accident years as well as favorable development related to unallocated claim adjustment expenses.
Favorable development in other professional liability and management liability was primarily due to favorable settlements on closed claims and a lower frequency of large losses for accident years 2011 through 2015 for professional and management liability, lower than expected claim frequency in accident years 2012 through 2015 for professional liability and lower than expected severity in accident years 2014 through 2015 for professional liability.
Favorable development in surety coverages was primarily due to lower than expected frequency of large losses in accident years 2015 and prior.
2016
Favorable development in other professional liability and management liability was primarily due to favorable settlements on closed claims and lower than expected frequency of claims in accident years 2010 through 2014 related to professional services and financial institutions. This was partially offset by unfavorable development related to a specific financial institutions claim in accident year 2014, higher management liability severities in accident year 2015 and deterioration on credit crises-related claims in accident year 2009.
Favorable development in surety coverages was primarily due to lower than expected frequency of large losses in accident years 2014 and prior.
Favorable development in other coverages provided to Specialty customers was due to better than expected claim frequency and claim severity in commercial lines coverages in accident years 2010 through 2015.
92
Specialty - Line of Business Composition
The table below provides the line of business composition of the net liability for unpaid claim and claim adjustment expenses for the Specialty segment.
|
As of December 31
|
|||
|
(In millions)
|
2018
|
||
|
Net liability for unpaid claim and claim adjustment expenses:
|
|||
|
Medical Professional Liability
|
$
|
1,457
|
|
|
Other Professional Liability and Management Liability
|
2,849
|
|
|
|
Surety
|
379
|
|
|
|
Warranty
|
40
|
|
|
|
Other
|
106
|
|
|
|
Total net liability for unpaid claim and claim adjustment expenses
|
$
|
4,831
|
|
93
Specialty - Medical Professional Liability
Cumulative Net Incurred Claim and Allocated Claim Adjustment Expenses are presented in the following table.
|
As of December 31
|
Calendar Year
|
As of December 31, 2018
|
||||||||||||||||||||||||||||||||||||||||||||
|
(In millions, except reported claims data)
|
2009
(1)
|
2010
(1)
|
2011
(1)
|
2012
(1)
|
2013
(1)
|
2014
(1)
|
2015
(1)
|
2016
(1)
|
2017
(1)
|
2018
|
IBNR
|
Cumulative Number of Claims
|
||||||||||||||||||||||||||||||||||
|
Accident Year
|
||||||||||||||||||||||||||||||||||||||||||||||
|
2009
|
$
|
389
|
|
$
|
390
|
|
$
|
392
|
|
$
|
392
|
|
$
|
366
|
|
$
|
346
|
|
$
|
336
|
|
$
|
309
|
|
$
|
302
|
|
$
|
310
|
|
$
|
—
|
|
14,716
|
|
|||||||||||
|
2010
|
402
|
|
412
|
|
423
|
|
426
|
|
415
|
|
395
|
|
365
|
|
360
|
|
356
|
|
—
|
|
14,615
|
|
||||||||||||||||||||||||
|
2011
|
429
|
|
437
|
|
443
|
|
468
|
|
439
|
|
434
|
|
437
|
|
437
|
|
8
|
|
16,505
|
|
||||||||||||||||||||||||||
|
2012
|
464
|
|
469
|
|
508
|
|
498
|
|
493
|
|
484
|
|
493
|
|
10
|
|
17,691
|
|
||||||||||||||||||||||||||||
|
2013
|
462
|
|
479
|
|
500
|
|
513
|
|
525
|
|
535
|
|
28
|
|
19,442
|
|
||||||||||||||||||||||||||||||
|
2014
|
450
|
|
489
|
|
537
|
|
530
|
|
535
|
|
30
|
|
19,602
|
|
||||||||||||||||||||||||||||||||
|
2015
|
433
|
|
499
|
|
510
|
|
494
|
|
78
|
|
17,835
|
|
||||||||||||||||||||||||||||||||||
|
2016
|
427
|
|
487
|
|
485
|
|
120
|
|
15,427
|
|
||||||||||||||||||||||||||||||||||||
|
2017
|
412
|
|
449
|
|
217
|
|
13,777
|
|
||||||||||||||||||||||||||||||||||||||
|
2018
|
404
|
|
333
|
|
11,205
|
|
||||||||||||||||||||||||||||||||||||||||
|
Total
|
|
$
|
4,498
|
|
$
|
824
|
|
|||||||||||||||||||||||||||||||||||||||
Cumulative Net Paid Claims and Allocated Claim Adjustment Expenses are presented in the following table.
|
As of December 31
|
Calendar Year
|
||||||||||||||||||||||||||||||||||||||
|
(In millions)
|
2009
(1)
|
2010
(1)
|
2011
(1)
|
2012
(1)
|
2013
(1)
|
2014
(1)
|
2015
(1)
|
2016
(1)
|
2017
(1)
|
2018
|
|||||||||||||||||||||||||||||
|
Accident Year
|
|||||||||||||||||||||||||||||||||||||||
|
2009
|
$
|
9
|
|
$
|
63
|
|
$
|
143
|
|
$
|
211
|
|
$
|
247
|
|
$
|
269
|
|
$
|
280
|
|
$
|
288
|
|
$
|
291
|
|
$
|
300
|
|
|||||||||
|
2010
|
10
|
|
86
|
|
173
|
|
257
|
|
306
|
|
326
|
|
337
|
|
346
|
|
350
|
|
|||||||||||||||||||||
|
2011
|
17
|
|
109
|
|
208
|
|
295
|
|
347
|
|
375
|
|
398
|
|
409
|
|
|||||||||||||||||||||||
|
2012
|
14
|
|
117
|
|
221
|
|
323
|
|
388
|
|
427
|
|
457
|
|
|||||||||||||||||||||||||
|
2013
|
17
|
|
119
|
|
255
|
|
355
|
|
414
|
|
462
|
|
|||||||||||||||||||||||||||
|
2014
|
23
|
|
136
|
|
258
|
|
359
|
|
417
|
|
|||||||||||||||||||||||||||||
|
2015
|
22
|
|
101
|
|
230
|
|
313
|
|
|||||||||||||||||||||||||||||||
|
2016
|
18
|
|
121
|
|
246
|
|
|||||||||||||||||||||||||||||||||
|
2017
|
19
|
|
107
|
|
|||||||||||||||||||||||||||||||||||
|
2018
|
21
|
|
|||||||||||||||||||||||||||||||||||||
|
Total
|
|
$
|
3,082
|
|
|||||||||||||||||||||||||||||||||||
|
Net liability for unpaid claim and allocated claim adjustment expenses for the accident years presented
|
$
|
1,416
|
|
||||||||||||||||||||||||||||||||||||
|
Net liability for unpaid claim and claim adjustment expenses for accident years prior to 2009
|
18
|
|
|||||||||||||||||||||||||||||||||||||
|
Liability for unallocated claim adjustment expenses for accident years presented
|
23
|
|
|||||||||||||||||||||||||||||||||||||
|
Total net liability for unpaid claim and claim adjustment expenses
|
$
|
1,457
|
|
||||||||||||||||||||||||||||||||||||
Net strengthening or (releases) of prior accident year reserves is presented in the following table.
|
For the years ended December 31
|
Calendar Year
|
||||||||||||||||||||||||||||||||||||||||
|
(In millions)
|
2010
(1)
|
2011
(1)
|
2012
(1)
|
2013
(1)
|
2014
(1)
|
2015
(1)
|
2016
(1)
|
2017
(1)
|
2018
|
Total
|
|||||||||||||||||||||||||||||||
|
Accident Year
|
|||||||||||||||||||||||||||||||||||||||||
|
2009
|
$
|
1
|
|
$
|
2
|
|
$
|
—
|
|
$
|
(26
|
)
|
$
|
(20
|
)
|
$
|
(10
|
)
|
$
|
(27
|
)
|
$
|
(7
|
)
|
$
|
8
|
|
$
|
(79
|
)
|
|||||||||||
|
2010
|
|
|
10
|
|
11
|
|
3
|
|
(11
|
)
|
(20
|
)
|
(30
|
)
|
(5
|
)
|
(4
|
)
|
(46
|
)
|
|||||||||||||||||||||
|
2011
|
|
|
8
|
|
6
|
|
25
|
|
(29
|
)
|
(5
|
)
|
3
|
|
—
|
|
8
|
|
|||||||||||||||||||||||
|
2012
|
|
|
5
|
|
39
|
|
(10
|
)
|
(5
|
)
|
(9
|
)
|
9
|
|
29
|
|
|||||||||||||||||||||||||
|
2013
|
|
|
17
|
|
21
|
|
13
|
|
12
|
|
10
|
|
73
|
|
|||||||||||||||||||||||||||
|
2014
|
|
|
39
|
|
48
|
|
(7
|
)
|
5
|
|
85
|
|
|||||||||||||||||||||||||||||
|
2015
|
|
|
66
|
|
11
|
|
(16
|
)
|
61
|
|
|||||||||||||||||||||||||||||||
|
2016
|
|
|
60
|
|
(2
|
)
|
58
|
|
|||||||||||||||||||||||||||||||||
|
2017
|
|
|
37
|
|
37
|
|
|||||||||||||||||||||||||||||||||||
|
Total net development for the accident years presented above
|
60
|
|
58
|
|
47
|
|
|||||||||||||||||||||||||||||||||||
|
Total net development for accident years prior to 2009
|
(51
|
)
|
(21
|
)
|
1
|
|
|||||||||||||||||||||||||||||||||||
|
Total unallocated claim adjustment expense development
|
—
|
|
(7
|
)
|
(1
|
)
|
|||||||||||||||||||||||||||||||||||
|
Total
|
$
|
9
|
|
$
|
30
|
|
$
|
47
|
|
||||||||||||||||||||||||||||||||
(1) Data presented for these calendar years is required supplemental information, which is unaudited.
94
Specialty - Other Professional Liability and Management Liability
Cumulative Net Incurred Claim and Allocated Claim Adjustment Expenses are presented in the following table.
|
As of December 31
|
Calendar Year
|
As of December 31, 2018
|
||||||||||||||||||||||||||||||||||||||||||||
|
(In millions, except reported claims data)
|
2009
(1)
|
2010
(1)
|
2011
(1)
|
2012
(1)
|
2013
(1)
|
2014
(1)
|
2015
(1)
|
2016
(1)
|
2017
(1)
|
2018
|
IBNR
|
Cumulative Number of Claims
|
||||||||||||||||||||||||||||||||||
|
Accident Year
|
||||||||||||||||||||||||||||||||||||||||||||||
|
2009
|
$
|
831
|
|
$
|
875
|
|
$
|
908
|
|
$
|
903
|
|
$
|
893
|
|
$
|
903
|
|
$
|
897
|
|
$
|
906
|
|
$
|
904
|
|
$
|
892
|
|
$
|
18
|
|
17,374
|
|
|||||||||||
|
2010
|
828
|
|
828
|
|
848
|
|
848
|
|
847
|
|
837
|
|
824
|
|
827
|
|
821
|
|
19
|
|
17,888
|
|
||||||||||||||||||||||||
|
2011
|
880
|
|
908
|
|
934
|
|
949
|
|
944
|
|
911
|
|
899
|
|
888
|
|
39
|
|
18,728
|
|
||||||||||||||||||||||||||
|
2012
|
923
|
|
909
|
|
887
|
|
878
|
|
840
|
|
846
|
|
833
|
|
41
|
|
18,491
|
|
||||||||||||||||||||||||||||
|
2013
|
884
|
|
894
|
|
926
|
|
885
|
|
866
|
|
863
|
|
65
|
|
17,918
|
|
||||||||||||||||||||||||||||||
|
2014
|
878
|
|
898
|
|
885
|
|
831
|
|
835
|
|
88
|
|
17,515
|
|
||||||||||||||||||||||||||||||||
|
2015
|
888
|
|
892
|
|
877
|
|
832
|
|
194
|
|
17,333
|
|
||||||||||||||||||||||||||||||||||
|
2016
|
901
|
|
900
|
|
900
|
|
279
|
|
17,787
|
|
||||||||||||||||||||||||||||||||||||
|
2017
|
847
|
|
845
|
|
479
|
|
17,780
|
|
||||||||||||||||||||||||||||||||||||||
|
2018
|
850
|
|
726
|
|
16,564
|
|
||||||||||||||||||||||||||||||||||||||||
|
Total
|
|
$
|
8,559
|
|
$
|
1,948
|
|
|||||||||||||||||||||||||||||||||||||||
Cumulative Net Paid Claims and Allocated Claim Adjustment Expenses are presented in the following table.
|
As of December 31
|
Calendar Year
|
||||||||||||||||||||||||||||||||||||||
|
(In millions)
|
2009
(1)
|
2010
(1)
|
2011
(1)
|
2012
(1)
|
2013
(1)
|
2014
(1)
|
2015
(1)
|
2016
(1)
|
2017
(1)
|
2018
|
|||||||||||||||||||||||||||||
|
Accident Year
|
|||||||||||||||||||||||||||||||||||||||
|
2009
|
$
|
37
|
|
$
|
195
|
|
$
|
361
|
|
$
|
553
|
|
$
|
641
|
|
$
|
722
|
|
$
|
772
|
|
$
|
801
|
|
$
|
825
|
|
$
|
844
|
|
|||||||||
|
2010
|
31
|
|
204
|
|
405
|
|
541
|
|
630
|
|
670
|
|
721
|
|
752
|
|
784
|
|
|||||||||||||||||||||
|
2011
|
71
|
|
314
|
|
503
|
|
605
|
|
683
|
|
726
|
|
781
|
|
796
|
|
|||||||||||||||||||||||
|
2012
|
56
|
|
248
|
|
400
|
|
573
|
|
651
|
|
711
|
|
755
|
|
|||||||||||||||||||||||||
|
2013
|
54
|
|
249
|
|
447
|
|
618
|
|
702
|
|
754
|
|
|||||||||||||||||||||||||||
|
2014
|
51
|
|
223
|
|
392
|
|
515
|
|
647
|
|
|||||||||||||||||||||||||||||
|
2015
|
60
|
|
234
|
|
404
|
|
542
|
|
|||||||||||||||||||||||||||||||
|
2016
|
64
|
|
248
|
|
466
|
|
|||||||||||||||||||||||||||||||||
|
2017
|
57
|
|
222
|
|
|||||||||||||||||||||||||||||||||||
|
2018
|
54
|
|
|||||||||||||||||||||||||||||||||||||
|
Total
|
|
$
|
5,864
|
|
|||||||||||||||||||||||||||||||||||
|
Net liability for unpaid claim and allocated claim adjustment expenses for the accident years presented
|
$
|
2,695
|
|
||||||||||||||||||||||||||||||||||||
|
Net liability for unpaid claim and claim adjustment expenses for accident years prior to 2009
|
90
|
|
|||||||||||||||||||||||||||||||||||||
|
Liability for unallocated claim adjustment expenses for accident years presented
|
64
|
|
|||||||||||||||||||||||||||||||||||||
|
Total net liability for unpaid claim and claim adjustment expenses
|
$
|
2,849
|
|
||||||||||||||||||||||||||||||||||||
Net strengthening or (releases) of prior accident year reserves is presented in the following table.
|
For the years ended December 31
|
Calendar Year
|
||||||||||||||||||||||||||||||||||||||||
|
(In millions)
|
2010
(1)
|
2011
(1)
|
2012
(1)
|
2013
(1)
|
2014
(1)
|
2015
(1)
|
2016
(1)
|
2017
(1)
|
2018
|
Total
|
|||||||||||||||||||||||||||||||
|
Accident Year
|
|||||||||||||||||||||||||||||||||||||||||
|
2009
|
|
$
|
44
|
|
$
|
33
|
|
$
|
(5
|
)
|
$
|
(10
|
)
|
$
|
10
|
|
$
|
(6
|
)
|
$
|
9
|
|
$
|
(2
|
)
|
$
|
(12
|
)
|
$
|
61
|
|
||||||||||
|
2010
|
|
|
—
|
|
20
|
|
—
|
|
(1
|
)
|
(10
|
)
|
(13
|
)
|
3
|
|
(6
|
)
|
(7
|
)
|
|||||||||||||||||||||
|
2011
|
|
|
28
|
|
26
|
|
15
|
|
(5
|
)
|
(33
|
)
|
(12
|
)
|
(11
|
)
|
8
|
|
|||||||||||||||||||||||
|
2012
|
|
|
(14
|
)
|
(22
|
)
|
(9
|
)
|
(38
|
)
|
6
|
|
(13
|
)
|
(90
|
)
|
|||||||||||||||||||||||||
|
2013
|
|
|
10
|
|
32
|
|
(41
|
)
|
(19
|
)
|
(3
|
)
|
(21
|
)
|
|||||||||||||||||||||||||||
|
2014
|
|
|
20
|
|
(13
|
)
|
(54
|
)
|
4
|
|
(43
|
)
|
|||||||||||||||||||||||||||||
|
2015
|
|
|
4
|
|
(15
|
)
|
(45
|
)
|
(56
|
)
|
|||||||||||||||||||||||||||||||
|
2016
|
|
|
(1
|
)
|
—
|
|
(1
|
)
|
|||||||||||||||||||||||||||||||||
|
2017
|
|
|
(2
|
)
|
(2
|
)
|
|||||||||||||||||||||||||||||||||||
|
Total net development for the accident years presented above
|
(125
|
)
|
(94
|
)
|
(88
|
)
|
|
|
|||||||||||||||||||||||||||||||||
|
Total net development for accident years prior to 2009
|
(15
|
)
|
(25
|
)
|
(32
|
)
|
|||||||||||||||||||||||||||||||||||
|
Total unallocated claim adjustment expense development
|
—
|
|
(7
|
)
|
(7
|
)
|
|||||||||||||||||||||||||||||||||||
|
Total
|
$
|
(140
|
)
|
$
|
(126
|
)
|
$
|
(127
|
)
|
||||||||||||||||||||||||||||||||
(1) Data presented for these calendar years is required supplemental information, which is unaudited.
95
Specialty - Surety
Cumulative Net Incurred Claim and Allocated Claim Adjustment Expenses are presented in the following table.
|
As of December 31
|
Calendar Year
|
As of December 31, 2018
|
||||||||||||||||||||||||||||||||||||||||||||
|
(In millions, except reported claims data)
|
2009
(1)
|
2010
(1)
|
2011
(1)
|
2012
(1)
|
2013
(1)
|
2014
(1)
|
2015
(1)
|
2016
(1)
|
2017
(1)
|
2018
|
IBNR
|
Cumulative Number of Claims
|
||||||||||||||||||||||||||||||||||
|
Accident Year
|
||||||||||||||||||||||||||||||||||||||||||||||
|
2009
|
$
|
114
|
|
$
|
114
|
|
$
|
103
|
|
$
|
85
|
|
$
|
68
|
|
$
|
59
|
|
$
|
52
|
|
$
|
53
|
|
$
|
53
|
|
$
|
52
|
|
$
|
1
|
|
6,688
|
|
|||||||||||
|
2010
|
112
|
|
112
|
|
111
|
|
84
|
|
76
|
|
66
|
|
63
|
|
59
|
|
61
|
|
1
|
|
5,971
|
|
||||||||||||||||||||||||
|
2011
|
120
|
|
121
|
|
116
|
|
87
|
|
75
|
|
70
|
|
66
|
|
62
|
|
1
|
|
5,808
|
|
||||||||||||||||||||||||||
|
2012
|
120
|
|
122
|
|
98
|
|
70
|
|
52
|
|
45
|
|
39
|
|
2
|
|
5,559
|
|
||||||||||||||||||||||||||||
|
2013
|
120
|
|
121
|
|
115
|
|
106
|
|
91
|
|
87
|
|
6
|
|
5,039
|
|
||||||||||||||||||||||||||||||
|
2014
|
123
|
|
124
|
|
94
|
|
69
|
|
60
|
|
19
|
|
5,036
|
|
||||||||||||||||||||||||||||||||
|
2015
|
131
|
|
131
|
|
104
|
|
79
|
|
36
|
|
4,887
|
|
||||||||||||||||||||||||||||||||||
|
2016
|
124
|
|
124
|
|
109
|
|
60
|
|
5,185
|
|
||||||||||||||||||||||||||||||||||||
|
2017
|
120
|
|
115
|
|
78
|
|
4,936
|
|
||||||||||||||||||||||||||||||||||||||
|
2018
|
114
|
|
101
|
|
3,105
|
|
||||||||||||||||||||||||||||||||||||||||
|
Total
|
|
$
|
778
|
|
$
|
305
|
|
|||||||||||||||||||||||||||||||||||||||
Cumulative Net Paid Claims and Allocated Claim Adjustment Expenses are presented in the following table.
|
As of December 31
|
Calendar Year
|
||||||||||||||||||||||||||||||||||||||
|
(In millions)
|
2009
(1)
|
2010
(1)
|
2011
(1)
|
2012
(1)
|
2013
(1)
|
2014
(1)
|
2015
(1)
|
2016
(1)
|
2017
(1)
|
2018
|
|||||||||||||||||||||||||||||
|
Accident Year
|
|||||||||||||||||||||||||||||||||||||||
|
2009
|
$
|
13
|
|
$
|
24
|
|
$
|
34
|
|
$
|
41
|
|
$
|
43
|
|
$
|
45
|
|
$
|
46
|
|
$
|
47
|
|
$
|
47
|
|
$
|
47
|
|
|||||||||
|
2010
|
13
|
|
34
|
|
50
|
|
55
|
|
57
|
|
58
|
|
55
|
|
52
|
|
52
|
|
|||||||||||||||||||||
|
2011
|
19
|
|
42
|
|
55
|
|
58
|
|
60
|
|
60
|
|
56
|
|
57
|
|
|||||||||||||||||||||||
|
2012
|
5
|
|
32
|
|
34
|
|
35
|
|
35
|
|
36
|
|
37
|
|
|||||||||||||||||||||||||
|
2013
|
16
|
|
40
|
|
69
|
|
78
|
|
78
|
|
78
|
|
|||||||||||||||||||||||||||
|
2014
|
7
|
|
30
|
|
38
|
|
36
|
|
38
|
|
|||||||||||||||||||||||||||||
|
2015
|
7
|
|
26
|
|
38
|
|
40
|
|
|||||||||||||||||||||||||||||||
|
2016
|
5
|
|
37
|
|
45
|
|
|||||||||||||||||||||||||||||||||
|
2017
|
23
|
|
37
|
|
|||||||||||||||||||||||||||||||||||
|
2018
|
5
|
|
|||||||||||||||||||||||||||||||||||||
|
Total
|
|
$
|
436
|
|
|||||||||||||||||||||||||||||||||||
|
Net liability for unpaid claim and allocated claim adjustment expenses for the accident years presented
|
$
|
342
|
|
||||||||||||||||||||||||||||||||||||
|
Net liability for unpaid claim and claim adjustment expenses for accident years prior to 2009
|
7
|
|
|||||||||||||||||||||||||||||||||||||
|
Liability for unallocated claim adjustment expenses for accident years presented
|
30
|
|
|||||||||||||||||||||||||||||||||||||
|
Total net liability for unpaid claim and claim adjustment expenses
|
$
|
379
|
|
||||||||||||||||||||||||||||||||||||
Net strengthening or (releases) of prior accident year reserves is presented in the following table.
|
For the years ended December 31
|
Calendar Year
|
||||||||||||||||||||||||||||||||||||||||
|
(In millions)
|
2010
(1)
|
2011
(1)
|
2012
(1)
|
2013
(1)
|
2014
(1)
|
2015
(1)
|
2016
(1)
|
2017
(1)
|
2018
|
Total
|
|||||||||||||||||||||||||||||||
|
Accident Year
|
|||||||||||||||||||||||||||||||||||||||||
|
2009
|
|
$
|
—
|
|
$
|
(11
|
)
|
$
|
(18
|
)
|
$
|
(17
|
)
|
$
|
(9
|
)
|
$
|
(7
|
)
|
$
|
1
|
|
$
|
—
|
|
$
|
(1
|
)
|
$
|
(62
|
)
|
||||||||||
|
2010
|
—
|
|
(1
|
)
|
(27
|
)
|
(8
|
)
|
(10
|
)
|
(3
|
)
|
(4
|
)
|
2
|
|
(51
|
)
|
|||||||||||||||||||||||
|
2011
|
1
|
|
(5
|
)
|
(29
|
)
|
(12
|
)
|
(5
|
)
|
(4
|
)
|
(4
|
)
|
(58
|
)
|
|||||||||||||||||||||||||
|
2012
|
2
|
|
(24
|
)
|
(28
|
)
|
(18
|
)
|
(7
|
)
|
(6
|
)
|
(81
|
)
|
|||||||||||||||||||||||||||
|
2013
|
1
|
|
(6
|
)
|
(9
|
)
|
(15
|
)
|
(4
|
)
|
(33
|
)
|
|||||||||||||||||||||||||||||
|
2014
|
1
|
|
(30
|
)
|
(25
|
)
|
(9
|
)
|
(63
|
)
|
|||||||||||||||||||||||||||||||
|
2015
|
—
|
|
(27
|
)
|
(25
|
)
|
(52
|
)
|
|||||||||||||||||||||||||||||||||
|
2016
|
—
|
|
(15
|
)
|
(15
|
)
|
|||||||||||||||||||||||||||||||||||
|
2017
|
(5
|
)
|
(5
|
)
|
|||||||||||||||||||||||||||||||||||||
|
Total net development for the accident years presented above
|
(64
|
)
|
(82
|
)
|
(67
|
)
|
|||||||||||||||||||||||||||||||||||
|
Total net development for accident years prior to 2009
|
1
|
|
1
|
|
(3
|
)
|
|||||||||||||||||||||||||||||||||||
|
Total unallocated claim adjustment expense development
|
—
|
|
(3
|
)
|
—
|
|
|||||||||||||||||||||||||||||||||||
|
Total
|
$
|
(63
|
)
|
$
|
(84
|
)
|
$
|
(70
|
)
|
||||||||||||||||||||||||||||||||
(1) Data presented for these calendar years is required supplemental information, which is unaudited.
96
Commercial
The following table presents further detail of the development recorded for the Commercial segment.
|
Years ended December 31
|
|||||||||||
|
(In millions)
|
2018
|
2017
|
2016
|
||||||||
|
Pretax (favorable) unfavorable development:
|
|||||||||||
|
Commercial Auto
|
$
|
1
|
|
$
|
(35
|
)
|
$
|
(47
|
)
|
||
|
General Liability
|
32
|
|
(24
|
)
|
(65
|
)
|
|||||
|
Workers' Compensation
|
(32
|
)
|
(63
|
)
|
145
|
|
|||||
|
Property and Other
|
(26
|
)
|
7
|
|
(18
|
)
|
|||||
|
Total pretax (favorable) unfavorable development
|
$
|
(25
|
)
|
$
|
(115
|
)
|
$
|
15
|
|
||
2018
Unfavorable development in general liability was driven by higher than expected claim severity in unsupported umbrella in accident years 2013 through 2016.
Favorable development in workers’ compensation was driven by lower frequency and severity experience and favorable impacts from California reforms.
Favorable development in property and other was driven by lower than expected claim severity in catastrophes in accident year 2017.
2017
Favorable development in commercial auto was primarily due to lower than expected severity in accident years 2013 through 2016, as well as a large favorable recovery on a claim in accident year 2012.
Favorable development in general liability was due to lower than expected severity in life sciences.
Favorable development in workers’ compensation was primarily related to decreases in frequency and severity in recent accident years, partially attributable to California reforms impacting medical costs. This was partially offset by unfavorable development related to an adverse arbitration ruling on reinsurance recoverables from older accident years as well as the recognition of loss estimates associated with earned premium from a prior exposure year.
2016
Favorable development in commercial auto was primarily due to favorable settlements on claims in accident years 2010 through 2014 and lower than expected severities in accident years 2012 through 2015.
Favorable development in general liability was primarily due to better than expected claim settlements in accident years 2012 through 2014, better than expected severity on umbrella claims in accident years 2010 through 2013, and better than expected severity in medical products liability in accident years 2010 through 2015. This was partially offset by unfavorable development related to an increase in reported claims prior to the closing of the three year window set forth by the Minnesota Child Victims Act in accident years 2006 and prior.
Unfavorable development in workers' compensation was primarily due to higher than expected severity for Defense Base Act contractors that largely resulted from a reduction of expected future recoveries from the US Department of Labor under the War Hazard Act. Further unfavorable development was due to the impact of recent Florida court rulings for accident years 2008 through 2015. These were partially offset by favorable development related to lower than expected frequencies related to our ongoing Middle Market and Small Business results for accident years 2009 through 2014.
Favorable development in property and other was primarily due to better than expected loss frequency in accident years 2013 through 2015. This was partially offset by unfavorable development related to higher than expected severity from a fourth quarter 2015 catastrophe event.
97
Commercial - Line of Business Composition
The table below provides the line of business composition of the net liability for unpaid claim and claim adjustment expenses for the Commercial segment.
|
As of December 31
|
|||
|
(In millions)
|
2018
|
||
|
Net Claim and claim adjustment expenses:
|
|||
|
Commercial Auto
|
$
|
412
|
|
|
General Liability
|
3,195
|
|
|
|
Workers' Compensation
|
3,968
|
|
|
|
Property and Other
|
423
|
|
|
|
Total net liability for claim and claim adjustment expenses
|
$
|
7,998
|
|
98
Commercial - Commercial Auto
Cumulative Net Incurred Claim and Allocated Claim Adjustment Expenses are presented in the following table.
|
As of December 31
|
Calendar Year
|
As of December 31, 2018
|
||||||||||||||||||||||||||||||||||||||||||||
|
(In millions, except reported claims data)
|
2009
(1)
|
2010
(1)
|
2011
(1)
|
2012
(1)
|
2013
(1)
|
2014
(1)
|
2015
(1)
|
2016
(1)
|
2017
(1)
|
2018
|
IBNR
|
Cumulative Number of Claims
|
||||||||||||||||||||||||||||||||||
|
Accident Year
|
||||||||||||||||||||||||||||||||||||||||||||||
|
2009
|
$
|
291
|
|
$
|
276
|
|
$
|
280
|
|
$
|
282
|
|
$
|
285
|
|
$
|
281
|
|
$
|
278
|
|
$
|
276
|
|
$
|
276
|
|
$
|
277
|
|
$
|
—
|
|
48,499
|
|
|||||||||||
|
2010
|
267
|
|
283
|
|
287
|
|
291
|
|
298
|
|
293
|
|
289
|
|
288
|
|
288
|
|
1
|
|
48,030
|
|
||||||||||||||||||||||||
|
2011
|
268
|
|
281
|
|
288
|
|
302
|
|
300
|
|
294
|
|
294
|
|
294
|
|
4
|
|
47,905
|
|
||||||||||||||||||||||||||
|
2012
|
275
|
|
289
|
|
299
|
|
303
|
|
307
|
|
299
|
|
299
|
|
6
|
|
46,288
|
|
||||||||||||||||||||||||||||
|
2013
|
246
|
|
265
|
|
265
|
|
249
|
|
245
|
|
245
|
|
7
|
|
39,429
|
|
||||||||||||||||||||||||||||||
|
2014
|
234
|
|
223
|
|
212
|
|
205
|
|
205
|
|
9
|
|
33,609
|
|
||||||||||||||||||||||||||||||||
|
2015
|
201
|
|
199
|
|
190
|
|
190
|
|
22
|
|
30,388
|
|
||||||||||||||||||||||||||||||||||
|
2016
|
198
|
|
186
|
|
186
|
|
27
|
|
30,342
|
|
||||||||||||||||||||||||||||||||||||
|
2017
|
199
|
|
198
|
|
45
|
|
30,580
|
|
||||||||||||||||||||||||||||||||||||||
|
2018
|
229
|
|
118
|
|
28,602
|
|
||||||||||||||||||||||||||||||||||||||||
|
Total
|
|
$
|
2,411
|
|
$
|
239
|
|
|||||||||||||||||||||||||||||||||||||||
Cumulative Net Paid Claims and Allocated Claim Adjustment Expenses are presented in the following table.
|
As of December 31
|
Calendar Year
|
||||||||||||||||||||||||||||||||||||||
|
(In millions)
|
2009
(1)
|
2010
(1)
|
2011
(1)
|
2012
(1)
|
2013
(1)
|
2014
(1)
|
2015
(1)
|
2016
(1)
|
2017
(1)
|
2018
|
|||||||||||||||||||||||||||||
|
Accident Year
|
|||||||||||||||||||||||||||||||||||||||
|
2009
|
$
|
73
|
|
$
|
130
|
|
$
|
191
|
|
$
|
233
|
|
$
|
261
|
|
$
|
272
|
|
$
|
274
|
|
$
|
274
|
|
$
|
275
|
|
$
|
277
|
|
|||||||||
|
2010
|
74
|
|
141
|
|
203
|
|
246
|
|
271
|
|
281
|
|
286
|
|
287
|
|
287
|
|
|||||||||||||||||||||
|
2011
|
79
|
|
145
|
|
199
|
|
248
|
|
274
|
|
284
|
|
287
|
|
289
|
|
|||||||||||||||||||||||
|
2012
|
78
|
|
160
|
|
220
|
|
259
|
|
282
|
|
285
|
|
290
|
|
|||||||||||||||||||||||||
|
2013
|
74
|
|
135
|
|
168
|
|
200
|
|
225
|
|
234
|
|
|||||||||||||||||||||||||||
|
2014
|
64
|
|
102
|
|
137
|
|
166
|
|
187
|
|
|||||||||||||||||||||||||||||
|
2015
|
52
|
|
96
|
|
130
|
|
153
|
|
|||||||||||||||||||||||||||||||
|
2016
|
52
|
|
93
|
|
126
|
|
|||||||||||||||||||||||||||||||||
|
2017
|
58
|
|
107
|
|
|||||||||||||||||||||||||||||||||||
|
2018
|
66
|
|
|||||||||||||||||||||||||||||||||||||
|
Total
|
|
$
|
2,016
|
|
|||||||||||||||||||||||||||||||||||
|
Net liability for unpaid claim and allocated claim adjustment expenses for the accident years presented
|
$
|
395
|
|
||||||||||||||||||||||||||||||||||||
|
Net liability for unpaid claim and claim adjustment expenses for accident years prior to 2009
|
6
|
|
|||||||||||||||||||||||||||||||||||||
|
Liability for unallocated claim adjustment expenses for accident years presented
|
11
|
|
|||||||||||||||||||||||||||||||||||||
|
Total net liability for unpaid claim and claim adjustment expenses
|
$
|
412
|
|
||||||||||||||||||||||||||||||||||||
Net strengthening or (releases) of prior accident year reserves is presented in the following table.
|
For the years ended December 31
|
Calendar Year
|
||||||||||||||||||||||||||||||||||||||||
|
(In millions)
|
2010
(1)
|
2011
(1)
|
2012
(1)
|
2013
(1)
|
2014
(1)
|
2015
(1)
|
2016
(1)
|
2017
(1)
|
2018
|
Total
|
|||||||||||||||||||||||||||||||
|
Accident Year
|
|||||||||||||||||||||||||||||||||||||||||
|
2009
|
|
$
|
(15
|
)
|
$
|
4
|
|
$
|
2
|
|
$
|
3
|
|
$
|
(4
|
)
|
$
|
(3
|
)
|
$
|
(2
|
)
|
$
|
—
|
|
$
|
1
|
|
$
|
(14
|
)
|
||||||||||
|
2010
|
16
|
|
4
|
|
4
|
|
7
|
|
(5
|
)
|
(4
|
)
|
(1
|
)
|
—
|
|
21
|
|
|||||||||||||||||||||||
|
2011
|
13
|
|
7
|
|
14
|
|
(2
|
)
|
(6
|
)
|
—
|
|
—
|
|
26
|
|
|||||||||||||||||||||||||
|
2012
|
14
|
|
10
|
|
4
|
|
4
|
|
(8
|
)
|
—
|
|
24
|
|
|||||||||||||||||||||||||||
|
2013
|
19
|
|
—
|
|
(16
|
)
|
(4
|
)
|
—
|
|
(1
|
)
|
|||||||||||||||||||||||||||||
|
2014
|
(11
|
)
|
(11
|
)
|
(7
|
)
|
—
|
|
(29
|
)
|
|||||||||||||||||||||||||||||||
|
2015
|
(2
|
)
|
(9
|
)
|
—
|
|
(11
|
)
|
|||||||||||||||||||||||||||||||||
|
2016
|
(12
|
)
|
—
|
|
(12
|
)
|
|||||||||||||||||||||||||||||||||||
|
2017
|
(1
|
)
|
(1
|
)
|
|||||||||||||||||||||||||||||||||||||
|
Total net development for the accident years presented above
|
(37
|
)
|
(41
|
)
|
—
|
|
|
|
|||||||||||||||||||||||||||||||||
|
Total net development for accident years prior to 2009
|
(10
|
)
|
4
|
|
—
|
|
|||||||||||||||||||||||||||||||||||
|
Total unallocated claim adjustment expense development
|
—
|
|
2
|
|
1
|
|
|||||||||||||||||||||||||||||||||||
|
Total
|
$
|
(47
|
)
|
$
|
(35
|
)
|
$
|
1
|
|
||||||||||||||||||||||||||||||||
(1) Data presented for these calendar years is required supplemental information, which is unaudited.
99
Commercial - General Liability
Cumulative Net Incurred Claim and Allocated Claim Adjustment Expenses are presented in the following table.
|
As of December 31
|
Calendar Year
|
As of December 31, 2018
|
||||||||||||||||||||||||||||||||||||||||||||
|
(In millions, except reported claims data)
|
2009
(1)
|
2010
(1)
|
2011
(1)
|
2012
(1)
|
2013
(1)
|
2014
(1)
|
2015
(1)
|
2016
(1)
|
2017
(1)
|
2018
|
IBNR
|
Cumulative Number of Claims
|
||||||||||||||||||||||||||||||||||
|
Accident Year
|
||||||||||||||||||||||||||||||||||||||||||||||
|
2009
|
$
|
662
|
|
$
|
716
|
|
$
|
733
|
|
$
|
755
|
|
$
|
752
|
|
$
|
756
|
|
$
|
755
|
|
$
|
754
|
|
$
|
755
|
|
$
|
755
|
|
$
|
16
|
|
44,934
|
|
|||||||||||
|
2010
|
646
|
|
664
|
|
658
|
|
709
|
|
750
|
|
726
|
|
697
|
|
691
|
|
691
|
|
24
|
|
44,144
|
|
||||||||||||||||||||||||
|
2011
|
591
|
|
589
|
|
631
|
|
677
|
|
676
|
|
681
|
|
670
|
|
669
|
|
26
|
|
39,283
|
|
||||||||||||||||||||||||||
|
2012
|
587
|
|
611
|
|
639
|
|
636
|
|
619
|
|
635
|
|
635
|
|
46
|
|
35,083
|
|
||||||||||||||||||||||||||||
|
2013
|
650
|
|
655
|
|
650
|
|
655
|
|
613
|
|
623
|
|
51
|
|
33,420
|
|
||||||||||||||||||||||||||||||
|
2014
|
653
|
|
658
|
|
654
|
|
631
|
|
635
|
|
71
|
|
27,736
|
|
||||||||||||||||||||||||||||||||
|
2015
|
581
|
|
576
|
|
574
|
|
589
|
|
122
|
|
23,471
|
|
||||||||||||||||||||||||||||||||||
|
2016
|
623
|
|
659
|
|
667
|
|
265
|
|
23,078
|
|
||||||||||||||||||||||||||||||||||||
|
2017
|
632
|
|
632
|
|
412
|
|
19,716
|
|
||||||||||||||||||||||||||||||||||||||
|
2018
|
653
|
|
553
|
|
13,336
|
|
||||||||||||||||||||||||||||||||||||||||
|
Total
|
|
$
|
6,549
|
|
$
|
1,586
|
|
|||||||||||||||||||||||||||||||||||||||
Cumulative Net Paid Claims and Allocated Claim Adjustment Expenses are presented in the following table.
|
As of December 31
|
Calendar Year
|
||||||||||||||||||||||||||||||||||||||
|
(In millions)
|
2009
(1)
|
2010
(1)
|
2011
(1)
|
2012
(1)
|
2013
(1)
|
2014
(1)
|
2015
(1)
|
2016
(1)
|
2017
(1)
|
2018
|
|||||||||||||||||||||||||||||
|
Accident Year
|
|||||||||||||||||||||||||||||||||||||||
|
2009
|
$
|
33
|
|
$
|
124
|
|
$
|
305
|
|
$
|
468
|
|
$
|
576
|
|
$
|
625
|
|
$
|
663
|
|
$
|
701
|
|
$
|
721
|
|
$
|
727
|
|
|||||||||
|
2010
|
27
|
|
145
|
|
280
|
|
429
|
|
561
|
|
611
|
|
642
|
|
652
|
|
656
|
|
|||||||||||||||||||||
|
2011
|
28
|
|
148
|
|
273
|
|
411
|
|
517
|
|
568
|
|
602
|
|
622
|
|
|||||||||||||||||||||||
|
2012
|
28
|
|
132
|
|
247
|
|
374
|
|
454
|
|
510
|
|
559
|
|
|||||||||||||||||||||||||
|
2013
|
31
|
|
128
|
|
240
|
|
352
|
|
450
|
|
510
|
|
|||||||||||||||||||||||||||
|
2014
|
31
|
|
119
|
|
247
|
|
376
|
|
481
|
|
|||||||||||||||||||||||||||||
|
2015
|
19
|
|
110
|
|
230
|
|
357
|
|
|||||||||||||||||||||||||||||||
|
2016
|
32
|
|
163
|
|
279
|
|
|||||||||||||||||||||||||||||||||
|
2017
|
23
|
|
118
|
|
|||||||||||||||||||||||||||||||||||
|
2018
|
33
|
|
|||||||||||||||||||||||||||||||||||||
|
Total
|
|
$
|
4,342
|
|
|||||||||||||||||||||||||||||||||||
|
Net liability for unpaid claim and allocated claim adjustment expenses for the accident years presented
|
$
|
2,207
|
|
||||||||||||||||||||||||||||||||||||
|
Net liability for unpaid claim and claim adjustment expenses for accident years prior to 2009
|
927
|
|
|||||||||||||||||||||||||||||||||||||
|
Liability for unallocated claim adjustment expenses for accident years presented
|
61
|
|
|||||||||||||||||||||||||||||||||||||
|
Total net liability for unpaid claim and claim adjustment expenses
|
$
|
3,195
|
|
||||||||||||||||||||||||||||||||||||
Net strengthening or (releases) of prior accident year reserves is presented in the following table.
|
For the years ended December 31
|
Calendar Year
|
||||||||||||||||||||||||||||||||||||||||
|
(In millions)
|
2010
(1)
|
2011
(1)
|
2012
(1)
|
2013
(1)
|
2014
(1)
|
2015
(1)
|
2016
(1)
|
2017
(1)
|
2018
|
Total
|
|||||||||||||||||||||||||||||||
|
Accident Year
|
|||||||||||||||||||||||||||||||||||||||||
|
2009
|
|
$
|
54
|
|
$
|
17
|
|
$
|
22
|
|
$
|
(3
|
)
|
$
|
4
|
|
$
|
(1
|
)
|
$
|
(1
|
)
|
$
|
1
|
|
$
|
—
|
|
$
|
93
|
|
||||||||||
|
2010
|
18
|
|
(6
|
)
|
51
|
|
41
|
|
(24
|
)
|
(29
|
)
|
(6
|
)
|
—
|
|
45
|
|
|||||||||||||||||||||||
|
2011
|
(2
|
)
|
42
|
|
46
|
|
(1
|
)
|
5
|
|
(11
|
)
|
(1
|
)
|
78
|
|
|||||||||||||||||||||||||
|
2012
|
24
|
|
28
|
|
(3
|
)
|
(17
|
)
|
16
|
|
—
|
|
48
|
|
|||||||||||||||||||||||||||
|
2013
|
5
|
|
(5
|
)
|
5
|
|
(42
|
)
|
10
|
|
(27
|
)
|
|||||||||||||||||||||||||||||
|
2014
|
5
|
|
(4
|
)
|
(23
|
)
|
4
|
|
(18
|
)
|
|||||||||||||||||||||||||||||||
|
2015
|
(5
|
)
|
(2
|
)
|
15
|
|
8
|
|
|||||||||||||||||||||||||||||||||
|
2016
|
36
|
|
8
|
|
44
|
|
|||||||||||||||||||||||||||||||||||
|
2017
|
—
|
|
—
|
|
|||||||||||||||||||||||||||||||||||||
|
Total net development for the accident years presented above
|
(46
|
)
|
(31
|
)
|
36
|
|
|
|
|||||||||||||||||||||||||||||||||
|
Total net development for accident years prior to 2009
|
(19
|
)
|
(1
|
)
|
—
|
|
|||||||||||||||||||||||||||||||||||
|
Total unallocated claim adjustment expense development
|
—
|
|
8
|
|
(4
|
)
|
|||||||||||||||||||||||||||||||||||
|
Total
|
$
|
(65
|
)
|
$
|
(24
|
)
|
$
|
32
|
|
||||||||||||||||||||||||||||||||
(1) Data presented for these calendar years is required supplemental information, which is unaudited.
100
Commercial - Workers' Compensation
Cumulative Net Incurred Claim and Allocated Claim Adjustment Expenses are presented in the following table.
|
As of December 31
|
Calendar Year
|
As of December 31, 2018
|
||||||||||||||||||||||||||||||||||||||||||||
|
(In millions, except reported claims data)
|
2009
(1)
|
2010
(1)
|
2011
(1)
|
2012
(1)
|
2013
(1)
|
2014
(1)
|
2015
(1)
|
2016
(1)
|
2017
(1)
|
2018
|
IBNR
|
Cumulative Number of Claims
|
||||||||||||||||||||||||||||||||||
|
Accident Year
|
||||||||||||||||||||||||||||||||||||||||||||||
|
2009
|
$
|
592
|
|
$
|
599
|
|
$
|
609
|
|
$
|
611
|
|
$
|
616
|
|
$
|
626
|
|
$
|
631
|
|
$
|
638
|
|
$
|
649
|
|
$
|
650
|
|
$
|
46
|
|
51,822
|
|
|||||||||||
|
2010
|
583
|
|
632
|
|
654
|
|
676
|
|
698
|
|
710
|
|
730
|
|
733
|
|
732
|
|
44
|
|
49,106
|
|
||||||||||||||||||||||||
|
2011
|
607
|
|
641
|
|
647
|
|
659
|
|
651
|
|
676
|
|
676
|
|
674
|
|
27
|
|
45,637
|
|
||||||||||||||||||||||||||
|
2012
|
601
|
|
627
|
|
659
|
|
669
|
|
678
|
|
673
|
|
671
|
|
59
|
|
42,477
|
|
||||||||||||||||||||||||||||
|
2013
|
537
|
|
572
|
|
592
|
|
618
|
|
593
|
|
582
|
|
86
|
|
38,665
|
|
||||||||||||||||||||||||||||||
|
2014
|
467
|
|
480
|
|
479
|
|
452
|
|
450
|
|
104
|
|
33,465
|
|
||||||||||||||||||||||||||||||||
|
2015
|
422
|
|
431
|
|
406
|
|
408
|
|
146
|
|
31,828
|
|
||||||||||||||||||||||||||||||||||
|
2016
|
426
|
|
405
|
|
396
|
|
171
|
|
31,905
|
|
||||||||||||||||||||||||||||||||||||
|
2017
|
440
|
|
432
|
|
171
|
|
32,811
|
|
||||||||||||||||||||||||||||||||||||||
|
2018
|
450
|
|
276
|
|
30,399
|
|
||||||||||||||||||||||||||||||||||||||||
|
Total
|
|
$
|
5,445
|
|
$
|
1,130
|
|
|||||||||||||||||||||||||||||||||||||||
Cumulative Net Paid Claims and Allocated Claim Adjustment Expenses are presented in the following table.
|
As of December 31
|
Calendar Year
|
||||||||||||||||||||||||||||||||||||||
|
(In millions)
|
2009
(1)
|
2010
(1)
|
2011
(1)
|
2012
(1)
|
2013
(1)
|
2014
(1)
|
2015
(1)
|
2016
(1)
|
2017
(1)
|
2018
|
|||||||||||||||||||||||||||||
|
Accident Year
|
|||||||||||||||||||||||||||||||||||||||
|
2009
|
$
|
89
|
|
$
|
227
|
|
$
|
321
|
|
$
|
388
|
|
$
|
443
|
|
$
|
476
|
|
$
|
503
|
|
$
|
525
|
|
$
|
549
|
|
$
|
557
|
|
|||||||||
|
2010
|
97
|
|
251
|
|
359
|
|
442
|
|
510
|
|
542
|
|
577
|
|
615
|
|
625
|
|
|||||||||||||||||||||
|
2011
|
99
|
|
249
|
|
358
|
|
438
|
|
478
|
|
522
|
|
564
|
|
571
|
|
|||||||||||||||||||||||
|
2012
|
87
|
|
232
|
|
342
|
|
416
|
|
470
|
|
509
|
|
524
|
|
|||||||||||||||||||||||||
|
2013
|
80
|
|
213
|
|
300
|
|
370
|
|
417
|
|
419
|
|
|||||||||||||||||||||||||||
|
2014
|
61
|
|
159
|
|
215
|
|
258
|
|
282
|
|
|||||||||||||||||||||||||||||
|
2015
|
51
|
|
131
|
|
180
|
|
212
|
|
|||||||||||||||||||||||||||||||
|
2016
|
53
|
|
129
|
|
169
|
|
|||||||||||||||||||||||||||||||||
|
2017
|
63
|
|
151
|
|
|||||||||||||||||||||||||||||||||||
|
2018
|
68
|
|
|||||||||||||||||||||||||||||||||||||
|
Total
|
|
$
|
3,578
|
|
|||||||||||||||||||||||||||||||||||
|
Net liability for unpaid claim and allocated claim adjustment expenses for the accident years presented
|
$
|
1,867
|
|
||||||||||||||||||||||||||||||||||||
|
Net liability for unpaid claim and claim adjustment expenses for accident years prior to 2009
|
2,131
|
|
|||||||||||||||||||||||||||||||||||||
|
Other
(2)
|
(32
|
)
|
|||||||||||||||||||||||||||||||||||||
|
Liability for unallocated claim adjustment expenses for accident years presented
|
2
|
|
|||||||||||||||||||||||||||||||||||||
|
Total net liability for unpaid claim and claim adjustment expenses
|
$
|
3,968
|
|
||||||||||||||||||||||||||||||||||||
Net strengthening or (releases) of prior accident year reserves is presented in the following table.
|
For the years ended December 31
|
Calendar Year
|
||||||||||||||||||||||||||||||||||||||||
|
(In millions)
|
2010
(1)
|
2011
(1)
|
2012
(1)
|
2013
(1)
|
2014
(1)
|
2015
(1)
|
2016
(1)
|
2017
(1)
|
2018
|
Total
|
|||||||||||||||||||||||||||||||
|
Accident Year
|
|||||||||||||||||||||||||||||||||||||||||
|
2009
|
|
$
|
7
|
|
$
|
10
|
|
$
|
2
|
|
$
|
5
|
|
$
|
10
|
|
$
|
5
|
|
$
|
7
|
|
$
|
11
|
|
$
|
1
|
|
$
|
58
|
|
||||||||||
|
2010
|
49
|
|
22
|
|
22
|
|
22
|
|
12
|
|
20
|
|
3
|
|
(1
|
)
|
149
|
|
|||||||||||||||||||||||
|
2011
|
34
|
|
6
|
|
12
|
|
(8
|
)
|
25
|
|
—
|
|
(2
|
)
|
67
|
|
|||||||||||||||||||||||||
|
2012
|
26
|
|
32
|
|
10
|
|
9
|
|
(5
|
)
|
(2
|
)
|
70
|
|
|||||||||||||||||||||||||||
|
2013
|
35
|
|
20
|
|
26
|
|
(25
|
)
|
(11
|
)
|
45
|
|
|||||||||||||||||||||||||||||
|
2014
|
13
|
|
(1
|
)
|
(27
|
)
|
(2
|
)
|
(17
|
)
|
|||||||||||||||||||||||||||||||
|
2015
|
9
|
|
(25
|
)
|
2
|
|
(14
|
)
|
|||||||||||||||||||||||||||||||||
|
2016
|
(21
|
)
|
(9
|
)
|
(30
|
)
|
|||||||||||||||||||||||||||||||||||
|
2017
|
(8
|
)
|
(8
|
)
|
|||||||||||||||||||||||||||||||||||||
|
Total net development for the accident years presented above
|
95
|
|
(89
|
)
|
(32
|
)
|
|
|
|||||||||||||||||||||||||||||||||
|
Adjustment for development on a discounted basis
|
(3
|
)
|
(3
|
)
|
—
|
|
|||||||||||||||||||||||||||||||||||
|
Total net development for accident years prior to 2009
|
53
|
|
28
|
|
7
|
|
|||||||||||||||||||||||||||||||||||
|
Total unallocated claim adjustment expense development
|
—
|
|
1
|
|
(7
|
)
|
|||||||||||||||||||||||||||||||||||
|
Total
|
$
|
145
|
|
$
|
(63
|
)
|
$
|
(32
|
)
|
||||||||||||||||||||||||||||||||
(1) Data presented for these calendar years is required supplemental information, which is unaudited.
(2) Other includes the effect of discounting lifetime claim reserves.
101
International
The following table presents further detail of the development recorded for the International segment.
|
Years ended December 31
|
|||||||||||
|
(In millions)
|
2018
|
2017
|
2016
|
||||||||
|
Pretax (favorable) unfavorable development:
|
|||||||||||
|
Casualty
|
$
|
(17
|
)
|
$
|
9
|
|
$
|
(29
|
)
|
||
|
Property
|
17
|
|
(16
|
)
|
(21
|
)
|
|||||
|
Energy and Marine
|
(19
|
)
|
(12
|
)
|
(18
|
)
|
|||||
|
Specialty
|
27
|
|
12
|
|
19
|
|
|||||
|
Healthcare and Technology
|
(12
|
)
|
(2
|
)
|
(9
|
)
|
|||||
|
Total pretax (favorable) unfavorable development
|
$
|
(4
|
)
|
$
|
(9
|
)
|
$
|
(58
|
)
|
||
2018
Favorable development in casualty was primarily driven by better than expected frequency in the liability portion of the package business in Canada and general liability in Europe.
Unfavorable development in property was primarily driven by higher than expected severity in Canada and higher than expected frequency in Hardy, both in accident year 2017.
Favorable development in energy and marine was primarily driven by better than expected large loss frequency in the energy book in accident year 2017, as well as a reduction in incurred losses within the Europe marine discontinued portfolio.
Unfavorable development in specialty was driven by increased loss severity in the accident year 2017 in Europe professional indemnity.
Favorable development in healthcare and technology was primarily driven by lower than expected frequency in accident years 2015 and prior in Europe.
2017
Favorable development in property and in energy and marine was due to better than expected frequency in accident years 2014 through 2016.
Unfavorable development in specialty was primarily due to higher than expected severity in accident year 2015 arising from the management liability business, partially offset by favorable development in accident years 2014 and prior. Additional unfavorable development was related to adverse large claims experience in the Hardy political risks portfolio, relating largely to accident year 2016.
2016
Favorable development in casualty was primarily due to favorable settlements on claims in accident years 2013 and prior related to our Canadian package business. Additional favorable development in accident year 2013 was primarily due to lower than expected frequency of large losses related to our Europe business.
Favorable development in property and in energy and marine was due to better than expected severity on the December 2015 U.K. floods and better than expected attritional losses and large loss experience on accident years 2013 through 2015 for Hardy business. Additional favorable development was due to a commutation of exposures in marine run-off classes on our Europe business.
Unfavorable development in specialty was primarily due to higher than expected large loss emergence in accident years 2011 through 2015 associated with our Commercial Institutions business, partially offset by favorable settlements on claims in accident years 2013 and prior.
102
International - Line of Business Composition
The table below provides the composition of the net liability for unpaid claim and claim adjustment expenses for the International segment.
|
As of December 31
|
|||
|
(In millions)
|
2018
|
||
|
Net Claim and claim adjustment expenses:
|
|||
|
International excluding Hardy
|
$
|
1,059
|
|
|
Hardy
|
465
|
|
|
|
Total net liability for claim and claim adjustment expenses
|
$
|
1,524
|
|
103
International - Excluding Hardy
Cumulative Net Incurred Claim and Allocated Claim Adjustment Expenses are presented in the following table.
|
As of December 31
|
Calendar Year
|
As of December 31, 2018
|
||||||||||||||||||||||||||||||||||||||||||||
|
(In millions, except reported claims data)
|
2009
(1)
|
2010
(1)
|
2011
(1)
|
2012
(1)
|
2013
(1)
|
2014
(1)
|
2015
(1)
|
2016
(1)
|
2017
(1)
|
2018
|
IBNR
|
Cumulative Number of Claims
|
||||||||||||||||||||||||||||||||||
|
Accident Year
|
||||||||||||||||||||||||||||||||||||||||||||||
|
2009
|
$
|
254
|
|
$
|
251
|
|
$
|
253
|
|
$
|
253
|
|
$
|
239
|
|
$
|
236
|
|
$
|
226
|
|
$
|
218
|
|
$
|
216
|
|
$
|
219
|
|
$
|
8
|
|
20,257
|
|
|||||||||||
|
2010
|
232
|
|
229
|
|
223
|
|
217
|
|
208
|
|
201
|
|
195
|
|
188
|
|
184
|
|
8
|
|
21,949
|
|
||||||||||||||||||||||||
|
2011
|
265
|
|
266
|
|
258
|
|
239
|
|
227
|
|
221
|
|
219
|
|
216
|
|
9
|
|
24,585
|
|
||||||||||||||||||||||||||
|
2012
|
266
|
|
273
|
|
258
|
|
251
|
|
251
|
|
244
|
|
236
|
|
20
|
|
24,975
|
|
||||||||||||||||||||||||||||
|
2013
|
287
|
|
289
|
|
281
|
|
261
|
|
257
|
|
250
|
|
25
|
|
23,909
|
|
||||||||||||||||||||||||||||||
|
2014
|
275
|
|
290
|
|
290
|
|
279
|
|
271
|
|
38
|
|
24,874
|
|
||||||||||||||||||||||||||||||||
|
2015
|
289
|
|
305
|
|
304
|
|
286
|
|
51
|
|
23,239
|
|
||||||||||||||||||||||||||||||||||
|
2016
|
284
|
|
302
|
|
289
|
|
79
|
|
17,557
|
|
||||||||||||||||||||||||||||||||||||
|
2017
|
300
|
|
363
|
|
134
|
|
17,865
|
|
||||||||||||||||||||||||||||||||||||||
|
2018
|
369
|
|
174
|
|
16,565
|
|
||||||||||||||||||||||||||||||||||||||||
|
Total
|
|
$
|
2,683
|
|
$
|
546
|
|
|||||||||||||||||||||||||||||||||||||||
Cumulative Net Paid Claims and Allocated Claim Adjustment Expenses are presented in the following table.
|
As of December 31
|
Calendar Year
|
||||||||||||||||||||||||||||||||||||||
|
(In millions)
|
2009
(1)
|
2010
(1)
|
2011
(1)
|
2012
(1)
|
2013
(1)
|
2014
(1)
|
2015
(1)
|
2016
(1)
|
2017
(1)
|
2018
|
|||||||||||||||||||||||||||||
|
Accident Year
|
|||||||||||||||||||||||||||||||||||||||
|
2009
|
$
|
39
|
|
$
|
92
|
|
$
|
122
|
|
$
|
137
|
|
$
|
153
|
|
$
|
162
|
|
$
|
174
|
|
$
|
185
|
|
$
|
190
|
|
$
|
198
|
|
|||||||||
|
2010
|
48
|
|
96
|
|
119
|
|
133
|
|
146
|
|
156
|
|
164
|
|
167
|
|
169
|
|
|||||||||||||||||||||
|
2011
|
44
|
|
114
|
|
135
|
|
149
|
|
162
|
|
174
|
|
181
|
|
185
|
|
|||||||||||||||||||||||
|
2012
|
43
|
|
112
|
|
144
|
|
164
|
|
180
|
|
191
|
|
201
|
|
|||||||||||||||||||||||||
|
2013
|
49
|
|
112
|
|
138
|
|
155
|
|
169
|
|
179
|
|
|||||||||||||||||||||||||||
|
2014
|
51
|
|
120
|
|
148
|
|
165
|
|
182
|
|
|||||||||||||||||||||||||||||
|
2015
|
55
|
|
131
|
|
161
|
|
181
|
|
|||||||||||||||||||||||||||||||
|
2016
|
66
|
|
131
|
|
157
|
|
|||||||||||||||||||||||||||||||||
|
2017
|
64
|
|
145
|
|
|||||||||||||||||||||||||||||||||||
|
2018
|
90
|
|
|||||||||||||||||||||||||||||||||||||
|
Total
|
$
|
1,687
|
|
||||||||||||||||||||||||||||||||||||
|
Net liability for unpaid claim and allocated claim adjustment expenses for the accident years presented
|
$
|
996
|
|
||||||||||||||||||||||||||||||||||||
|
Net liability for unpaid claim and claim adjustment expenses for accident years prior to 2009
|
39
|
|
|||||||||||||||||||||||||||||||||||||
|
Liability for unallocated claim adjustment expenses for accident years presented
|
24
|
|
|||||||||||||||||||||||||||||||||||||
|
Total net liability for unpaid claim and claim adjustment expenses
|
$
|
1,059
|
|
||||||||||||||||||||||||||||||||||||
Net strengthening or (releases) of prior accident year reserves is presented in the following table.
|
For the years ended December 31
|
Calendar Year
|
||||||||||||||||||||||||||||||||||||||||
|
(In millions)
|
2010
(1)
|
2011
(1)
|
2012
(1)
|
2013
(1)
|
2014
(1)
|
2015
(1)(2)
|
|
2016
(1)(2)
|
2017
(1)(2)
|
2018
(2)
|
Total
(2)
|
||||||||||||||||||||||||||||||
|
Accident Year
|
|||||||||||||||||||||||||||||||||||||||||
|
2009
|
|
$
|
(3
|
)
|
$
|
2
|
|
$
|
—
|
|
$
|
(14
|
)
|
$
|
(3
|
)
|
$
|
(10
|
)
|
$
|
(8
|
)
|
$
|
(2
|
)
|
$
|
3
|
|
$
|
(35
|
)
|
||||||||||
|
2010
|
(3
|
)
|
(6
|
)
|
(6
|
)
|
(9
|
)
|
(7
|
)
|
(6
|
)
|
(7
|
)
|
(4
|
)
|
(48
|
)
|
|||||||||||||||||||||||
|
2011
|
1
|
|
(8
|
)
|
(19
|
)
|
(12
|
)
|
(6
|
)
|
(2
|
)
|
(3
|
)
|
(49
|
)
|
|||||||||||||||||||||||||
|
2012
|
7
|
|
(15
|
)
|
(7
|
)
|
—
|
|
(7
|
)
|
(8
|
)
|
(30
|
)
|
|||||||||||||||||||||||||||
|
2013
|
2
|
|
(8
|
)
|
(20
|
)
|
(4
|
)
|
(7
|
)
|
(37
|
)
|
|||||||||||||||||||||||||||||
|
2014
|
15
|
|
—
|
|
(11
|
)
|
(8
|
)
|
(4
|
)
|
|||||||||||||||||||||||||||||||
|
2015
|
16
|
|
(1
|
)
|
(18
|
)
|
(3
|
)
|
|||||||||||||||||||||||||||||||||
|
2016
|
18
|
|
(13
|
)
|
5
|
|
|||||||||||||||||||||||||||||||||||
|
2017
|
63
|
|
63
|
|
|||||||||||||||||||||||||||||||||||||
(1) Data presented for these calendar years is required supplemental information, which is unaudited.
(2) The amounts included in the loss reserve development tables above are presented at the year-end
2018
foreign currency exchange rates for all periods presented to remove the effects of foreign currency exchange rate fluctuations between calendar years. The amounts included within the table on page 102 presenting the detail of the development recorded within the International segment include the impact of fluctuations in foreign currency exchange rates.
104
International - Hardy
Cumulative Net Incurred Claim and Allocated Claim Adjustment Expenses are presented in the following table.
|
As of December 31
|
Calendar Year
|
As of December 31, 2018
|
||||||||||||||||||||||||||||||||||||||||
|
(In millions, except reported claims data)
|
Net Claim and Allocated Claim Adjustment Expense Reserves at Acquisition
|
Net Incurred Claim and Allocated Claim Adjustment Expenses in 2012
(1)(2)
|
Total Acquired Net Claim and Allocated Claim Adjustment Expense Reserves and 2012 Incurreds
|
2013
(1)
|
2014
(1)
|
2015
(1)
|
2016
(1)
|
2017
(1)
|
2018
|
IBNR
|
Cumulative Number of Claims
|
|||||||||||||||||||||||||||||||
|
Accident Year
|
||||||||||||||||||||||||||||||||||||||||||
|
2009
|
$
|
11
|
|
$
|
—
|
|
$
|
12
|
|
$
|
6
|
|
$
|
(4
|
)
|
$
|
1
|
|
$
|
(2
|
)
|
$
|
(3
|
)
|
$
|
(3
|
)
|
$
|
(2
|
)
|
3,856
|
|
||||||||||
|
2010
|
48
|
|
(9
|
)
|
38
|
|
47
|
|
52
|
|
46
|
|
52
|
|
51
|
|
50
|
|
—
|
|
4,540
|
|
||||||||||||||||||||
|
2011
|
125
|
|
(1
|
)
|
124
|
|
134
|
|
134
|
|
138
|
|
137
|
|
137
|
|
140
|
|
(2
|
)
|
6,252
|
|
||||||||||||||||||||
|
2012
|
33
|
|
71
|
|
104
|
|
104
|
|
112
|
|
119
|
|
113
|
|
113
|
|
115
|
|
1
|
|
6,900
|
|
||||||||||||||||||||
|
2013
|
|
|
|
130
|
|
146
|
|
138
|
|
139
|
|
140
|
|
144
|
|
4
|
|
7,624
|
|
|||||||||||||||||||||||
|
2014
|
|
184
|
|
182
|
|
176
|
|
170
|
|
170
|
|
2
|
|
8,097
|
|
|||||||||||||||||||||||||||
|
2015
|
|
190
|
|
179
|
|
177
|
|
178
|
|
3
|
|
8,968
|
|
|||||||||||||||||||||||||||||
|
2016
|
|
227
|
|
245
|
|
234
|
|
28
|
|
9,536
|
|
|||||||||||||||||||||||||||||||
|
2017
|
|
244
|
|
252
|
|
48
|
|
10,309
|
|
|||||||||||||||||||||||||||||||||
|
2018
|
|
270
|
|
103
|
|
7,563
|
|
|||||||||||||||||||||||||||||||||||
|
|
|
Total
|
|
$
|
1,550
|
|
$
|
185
|
|
|||||||||||||||||||||||||||||||||
Cumulative Net Paid Claims and Allocated Claim Adjustment Expenses are presented in the following table.
|
As of December 31
|
Calendar Year
|
||||||||||||||||||||||||||
|
(In millions)
|
2012
(1)(2)
|
2013
(1)
|
2014
(1)
|
2015
(1)
|
2016
(1)
|
2017
(1)
|
2018
|
||||||||||||||||||||
|
Accident Year
|
|||||||||||||||||||||||||||
|
2009
|
$
|
2
|
|
$
|
(2
|
)
|
$
|
(4
|
)
|
$
|
(4
|
)
|
$
|
(4
|
)
|
$
|
(5
|
)
|
$
|
(4
|
)
|
||||||
|
2010
|
19
|
|
35
|
|
42
|
|
45
|
|
47
|
|
48
|
|
46
|
|
|||||||||||||
|
2011
|
30
|
|
83
|
|
123
|
|
127
|
|
131
|
|
132
|
|
134
|
|
|||||||||||||
|
2012
|
14
|
|
79
|
|
100
|
|
109
|
|
106
|
|
109
|
|
110
|
|
|||||||||||||
|
2013
|
38
|
|
101
|
|
120
|
|
126
|
|
130
|
|
133
|
|
|||||||||||||||
|
2014
|
56
|
|
122
|
|
141
|
|
150
|
|
155
|
|
|||||||||||||||||
|
2015
|
29
|
|
98
|
|
129
|
|
144
|
|
|||||||||||||||||||
|
2016
|
63
|
|
144
|
|
171
|
|
|||||||||||||||||||||
|
2017
|
53
|
|
150
|
|
|||||||||||||||||||||||
|
2018
|
55
|
|
|||||||||||||||||||||||||
|
Total
|
$
|
1,094
|
|
||||||||||||||||||||||||
|
Net liability for unpaid claim and allocated claim adjustment expenses for the accident years presented
|
$
|
456
|
|
||||||||||||||||||||||||
|
Net liability for unpaid claim and claim adjustment expenses for accident years prior to 2009
|
—
|
|
|||||||||||||||||||||||||
|
Liability for unallocated claim adjustment expenses for accident years presented
|
9
|
|
|||||||||||||||||||||||||
|
Total net liability for unpaid claim and claim adjustment expenses
|
$
|
465
|
|
||||||||||||||||||||||||
Net strengthening or (releases) of prior accident year reserves is presented in the following table.
|
For the years ended December 31
|
Calendar Year
|
||||||||||||||||||||||||||||||
|
(In millions)
|
2012
(1)(2)
|
2013
(1)
|
2014
(1)
|
2015
(1)(3)
|
2016
(1)(3)
|
2017
(1)(3)
|
2018
(3)
|
Total
(3)
|
|||||||||||||||||||||||
|
Accident Year
|
|||||||||||||||||||||||||||||||
|
2009
|
$
|
1
|
|
$
|
(6
|
)
|
$
|
(10
|
)
|
$
|
5
|
|
$
|
(3
|
)
|
$
|
(1
|
)
|
$
|
—
|
|
$
|
(14
|
)
|
|||||||
|
2010
|
(10
|
)
|
9
|
|
5
|
|
(6
|
)
|
6
|
|
(1
|
)
|
(1
|
)
|
2
|
|
|||||||||||||||
|
2011
|
(1
|
)
|
10
|
|
—
|
|
4
|
|
(1
|
)
|
—
|
|
3
|
|
15
|
|
|||||||||||||||
|
2012
|
—
|
|
8
|
|
7
|
|
(6
|
)
|
—
|
|
2
|
|
11
|
|
|||||||||||||||||
|
2013
|
16
|
|
(8
|
)
|
1
|
|
1
|
|
4
|
|
14
|
|
|||||||||||||||||||
|
2014
|
(2
|
)
|
(6
|
)
|
(6
|
)
|
—
|
|
(14
|
)
|
|||||||||||||||||||||
|
2015
|
(11
|
)
|
(2
|
)
|
1
|
|
(12
|
)
|
|||||||||||||||||||||||
|
2016
|
18
|
|
(11
|
)
|
7
|
|
|||||||||||||||||||||||||
|
2017
|
8
|
|
8
|
|
|||||||||||||||||||||||||||
(1) Data presented for these calendar years is required supplemental information, which is unaudited.
(2) Data presented for this calendar year is post-acquisition of Hardy.
(3) The amounts included in the loss reserve development tables above are presented at the year-end
2018
foreign currency exchange rates for all periods presented to remove the effects of foreign currency exchange rate fluctuations between calendar years. The amounts included within the table on page 102 presenting the detail of the development recorded within the International segment include the impact of fluctuations in foreign currency exchange rates.
105
The table below presents information about average historical claims duration as of
December 31, 2018
and is presented as required supplementary information, which is unaudited.
|
Average Annual Percentage Payout of Ultimate Net Incurred Claim and Allocated Claim Adjustment Expenses in Year:
|
||||||||||||||||||||||||||||||||
|
1
|
2
|
3
|
4
|
5
|
6
|
7
|
8
|
9
|
10
|
Total
|
||||||||||||||||||||||
|
Specialty
|
||||||||||||||||||||||||||||||||
|
Medical Professional Liability
|
3.8
|
%
|
19.7
|
%
|
24.3
|
%
|
20.1
|
%
|
12.1
|
%
|
7.2
|
%
|
4.5
|
%
|
2.5
|
%
|
1.0
|
%
|
2.9
|
%
|
98.1
|
%
|
||||||||||
|
Other Professional Liability and Management Liability
|
6.2
|
%
|
21.5
|
%
|
21.3
|
%
|
17.4
|
%
|
10.7
|
%
|
6.4
|
%
|
5.8
|
%
|
2.9
|
%
|
3.3
|
%
|
2.1
|
%
|
97.6
|
%
|
||||||||||
|
Surety
(1)
|
21.6
|
%
|
37.9
|
%
|
21.0
|
%
|
7.9
|
%
|
2.1
|
%
|
1.6
|
%
|
(1.7
|
)%
|
(0.5
|
)%
|
—
|
%
|
—
|
%
|
89.9
|
%
|
||||||||||
|
Commercial
|
||||||||||||||||||||||||||||||||
|
Commercial Auto
|
28.0
|
%
|
23.0
|
%
|
18.5
|
%
|
14.2
|
%
|
9.3
|
%
|
3.1
|
%
|
1.3
|
%
|
0.3
|
%
|
0.2
|
%
|
0.7
|
%
|
98.6
|
%
|
||||||||||
|
General Liability
|
4.3
|
%
|
15.9
|
%
|
19.5
|
%
|
20.5
|
%
|
15.7
|
%
|
8.0
|
%
|
5.6
|
%
|
3.2
|
%
|
1.6
|
%
|
0.8
|
%
|
95.1
|
%
|
||||||||||
|
Workers' Compensation
|
13.7
|
%
|
21.1
|
%
|
13.9
|
%
|
10.6
|
%
|
7.5
|
%
|
4.4
|
%
|
4.4
|
%
|
3.2
|
%
|
2.5
|
%
|
1.2
|
%
|
82.5
|
%
|
||||||||||
|
International
|
||||||||||||||||||||||||||||||||
|
International - Excluding Hardy
|
20.5
|
%
|
26.0
|
%
|
11.2
|
%
|
7.1
|
%
|
6.5
|
%
|
4.8
|
%
|
4.3
|
%
|
2.8
|
%
|
1.7
|
%
|
3.7
|
%
|
88.6
|
%
|
||||||||||
|
International - Hardy
(2)
|
24.0
|
%
|
38.9
|
%
|
13.3
|
%
|
6.0
|
%
|
2.9
|
%
|
2.1
|
%
|
87.2
|
%
|
||||||||||||||||||
(1)
Due to the nature of the Surety business, average annual percentage payout of ultimate net incurred claim and allocated claim adjustment expenses has been calculated using only the payouts of mature accident years presented in the loss reserve development tables.
(2) Average historical claims duration for Hardy is presented prospectively beginning with the first full year subsequent to acquisition, 2013.
106
A&EP Reserves
In 2010, CCC together with several of the Company’s insurance subsidiaries completed a transaction with National Indemnity Company (NICO), a subsidiary of Berkshire Hathaway Inc., under which substantially all of the Company’s legacy A&EP liabilities were ceded to NICO through a Loss Portfolio Transfer (LPT). At the effective date of the transaction, the Company ceded approximately
$1.6 billion
of net A&EP claim and allocated claim adjustment expense reserves to NICO under a retroactive reinsurance agreement with an aggregate limit of
$4 billion
. The $
1.6 billion
of claim and allocated claim adjustment expense reserves ceded to NICO was net of
$1.2 billion
of ceded claim and allocated claim adjustment expense reserves under existing third-party reinsurance contracts. The NICO LPT aggregate reinsurance limit also covers credit risk on the existing third-party reinsurance related to these liabilities. The Company paid NICO a reinsurance premium of
$2 billion
and transferred to NICO billed third-party reinsurance receivables related to A&EP claims with a net book value of
$215 million
, resulting in total consideration of
$2.2 billion
.
In years subsequent to the effective date of the LPT, the Company recognized adverse prior year development on its A&EP reserves resulting in additional amounts ceded under the LPT. As a result, the cumulative amounts ceded under the LPT have exceeded the
$2.2 billion
consideration paid, resulting in the NICO LPT moving into a gain position, requiring retroactive reinsurance accounting. Under retroactive reinsurance accounting, this gain is deferred and only recognized in earnings in proportion to actual paid recoveries under the LPT. Over the life of the contract, there is no economic impact as long as any additional losses incurred are within the limit of the LPT. In a period in which the Company recognizes a change in the estimate of A&EP reserves that increases or decreases the amounts ceded under the LPT, the proportion of actual paid recoveries to total ceded losses is affected and the change in the deferred gain is recognized in earnings as if the revised estimate of ceded losses was available at the effective date of the LPT. The effect of the deferred retroactive reinsurance benefit is recorded in Insurance claims and policyholders' benefits in the Consolidated Statements of Operations.
The following table presents the impact of the Loss Portfolio Transfer on the Consolidated Statements of Operations.
|
Years ended December 31
|
|||||||||||
|
(In millions)
|
2018
|
2017
|
2016
|
||||||||
|
Additional amounts ceded under LPT:
|
|||||||||||
|
Net A&EP adverse development before consideration of LPT
|
$
|
178
|
|
$
|
60
|
|
$
|
200
|
|
||
|
Provision for uncollectible third-party reinsurance on A&EP
|
(16
|
)
|
—
|
|
—
|
|
|||||
|
Total additional amounts ceded under LPT
|
162
|
|
60
|
|
|
200
|
|
||||
|
Retroactive reinsurance benefit recognized
|
(114
|
)
|
(68
|
)
|
(107
|
)
|
|||||
|
Pretax impact of deferred retroactive reinsurance
|
$
|
48
|
|
$
|
(8
|
)
|
$
|
93
|
|
||
The Company completed reserve reviews in both the first and fourth quarters of
2018
and, going forward, intends to perform a single annual review in the fourth quarter. Net unfavorable prior year development of
$178 million
,
$60 million
and
$200 million
was recognized before consideration of cessions to the LPT for the years ended
December 31, 2018
,
2017
and
2016
. Additionally, in
2018
, the Company released a portion of its provision for uncollectible third party reinsurance. The
2018
unfavorable development was driven by higher than anticipated defense and indemnity costs on known direct asbestos and environmental accounts and by paid losses on assumed reinsurance exposures. The
2017
unfavorable development of
$60 million
was driven by modestly higher anticipated payouts on claims from known sources of asbestos exposure. The
2016
unfavorable development of
$200 million
was driven by an increase in anticipated future expenses associated with determination of coverage, higher anticipated payouts associated with a limited number of historical accounts having significant asbestos exposures and higher than expected severity on pollution claims.
As of
December 31, 2018
and
2017
, the cumulative amounts ceded under the LPT were
$3.1 billion
and
$2.9 billion
. The unrecognized deferred retroactive reinsurance benefit was
$374 million
and
$326 million
as of
December 31, 2018
and
2017
and is included within Other liabilities on the Consolidated Balance Sheets.
107
NICO established a collateral trust account as security for its obligations to the Company. The fair value of the collateral trust account was
$2.7 billion
and
$3.1 billion
as of
December 31, 2018
and
2017
. In addition, Berkshire Hathaway Inc. guaranteed the payment obligations of NICO up to the aggregate reinsurance limit as well as certain of NICO’s performance obligations under the trust agreement. NICO is responsible for claims handling and billing and collection from third-party reinsurers related to the Company’s A&EP claims.
108
Note
F
.
Legal Proceedings, Contingencies and Guarantees
Small Business Premium Rate Adjustment
In 2016 and 2017, the Company identified rating errors related to its multi-peril package product and workers' compensation policies within its Small Business unit and determined that it would voluntarily issue premium refunds along with interest on affected policies. After the rating errors were identified, written and earned premium were reported net of any impact from the premium rate adjustments.
The policyholder refunds for the multi-peril package product were completed in the third quarter of
2017
. The policyholder refunds for workers’ compensation policies were completed in the fourth quarter of
2018
.
For the year ended
December 31, 2016
, the Company recorded a charge which reduced earned premium by
$16 million
. For the
year ended December 31, 2017
, earned premium was reduced by
$36 million
. For the
year ended December 31, 2018
, earned premium increased by
$6 million
as a result of a change in estimate of the refund payments to policyholders. Additionally, Interest expense recognized for interest due to policyholders on the premium rate adjustments was
$1 million
and
$7 million
for the years ended
December 31, 2018
and
2017
.
Other Litigation
The Company is a party to other routine litigation incidental to its business, which, based on the facts and circumstances currently known, is not material to the Company's results of operations or financial position.
Guarantees
As of
December 31, 2018
and
2017
, the Company had recorded liabilities of approximately
$5 million
related to guarantee and indemnification agreements and management does not believe that any future indemnity claims will be significantly greater than the amounts recorded.
In the course of selling business entities and assets to third parties, the Company agreed to guarantee the performance of certain obligations of previously owned subsidiaries and to indemnify purchasers for losses arising out of breaches of representation and warranties with respect to the business entities or assets sold, including, in certain cases, losses arising from undisclosed liabilities or certain named litigation. Such guarantee and indemnification agreements in effect for sales of business entities, assets and third-party loans may include provisions that survive indefinitely. As of
December 31, 2018
, the aggregate amount related to quantifiable guarantees was
$375 million
and the aggregate amount related to quantifiable indemnification agreements was
$252 million
. In certain cases, should the Company be required to make payments under any such guarantee, it would have the right to seek reimbursement from an affiliate of a previously owned subsidiary.
In addition, the Company has agreed to provide indemnification to third-party purchasers for certain losses associated with sold business entities or assets that are not limited by a contractual monetary amount. As of
December 31, 2018
, the Company had outstanding unlimited indemnifications in connection with the sales of certain of its business entities or assets that included tax liabilities arising prior to a purchaser's ownership of an entity or asset, defects in title at the time of sale, employee claims arising prior to closing and in some cases losses arising from certain litigation and undisclosed liabilities. Certain provisions of the indemnification agreements survive indefinitely, while others survive until the applicable statutes of limitation expire, or until the agreed-upon contract terms expire.
The Company also provided guarantees, if the primary obligor fails to perform, to holders of structured settlement annuities provided by a previously owned subsidiary. As of
December 31, 2018
, the potential amount of future payments the Company could be required to pay under these guarantees was approximately
$1.8 billion
, which will be paid over the lifetime of the annuitants. The Company does not believe any payment is likely under these guarantees, as the Company is the beneficiary of a trust that must be maintained at a level that approximates the discounted reserves for these annuities.
109
Note
G
. Reinsurance
The Company cedes insurance to reinsurers to limit its maximum loss, provide greater diversification of risk, minimize exposures on larger risks and to exit certain lines of business. The ceding of insurance does not discharge the primary liability of the Company. A credit exposure exists with respect to reinsurance ceded to the extent that any reinsurer is unable to meet its obligations. A collectibility exposure also exists to the extent that the reinsurer disputes the liabilities assumed under reinsurance agreements. Property and casualty reinsurance coverages are tailored to the specific risk characteristics of each product line and the Company's retained amount varies by type of coverage. Reinsurance contracts are purchased to protect specific lines of business such as property and workers' compensation. Corporate catastrophe reinsurance is also purchased for property and workers' compensation exposure. The Company also utilizes facultative reinsurance in certain lines. In addition, the Company assumes reinsurance primarily through Hardy and as a member of various reinsurance pools and associations.
The following table presents the amounts receivable from reinsurers.
|
December 31
|
|||||||
|
(In millions)
|
2018
|
2017
|
|||||
|
Reinsurance receivables related to insurance reserves:
|
|||||||
|
Ceded claim and claim adjustment expenses
|
$
|
4,019
|
|
$
|
3,934
|
|
|
|
Ceded future policy benefits
|
233
|
|
230
|
|
|||
|
Reinsurance receivables related to paid losses
|
203
|
|
126
|
|
|||
|
Reinsurance receivables
|
4,455
|
|
4,290
|
|
|||
|
Allowance for uncollectible reinsurance
|
(29
|
)
|
(29
|
)
|
|||
|
Reinsurance receivables, net of allowance for uncollectible reinsurance
|
$
|
4,426
|
|
$
|
4,261
|
|
|
The Company has established an allowance for uncollectible reinsurance receivables related to credit risk. The Company reviews the allowance quarterly and adjusts the allowance as necessary to reflect changes in estimates of uncollectible balances. The allowance may also be reduced by write-offs of reinsurance receivable balances.
The Company attempts to mitigate its credit risk related to reinsurance by entering into reinsurance arrangements with reinsurers that have credit ratings above certain levels and by obtaining collateral. On a limited basis, the Company may enter into reinsurance agreements with reinsurers that are not rated, primarily captive reinsurers. The primary methods of obtaining collateral are through reinsurance trusts, letters of credit and funds withheld balances. Such collateral was approximately
$3.2 billion
and
$2.9 billion
as of
December 31, 2018
and
2017
.
The Company's largest recoverables from a single reinsurer as of
December 31, 2018
, including ceded unearned premium reserves, were approximately
$2.2 billion
from a subsidiary of Berkshire Hathaway Insurance Group,
$278 million
from the Gateway Rivers Insurance Company and
$233 million
from subsidiaries of Wilton Re. These amounts are substantially collateralized. The recoverable from the Berkshire Hathaway Insurance Group includes amounts related to third-party reinsurance for which NICO has assumed the credit risk under the terms of the LPT as discussed in Note
E
to the Consolidated Financial Statements.
110
The effects of reinsurance on earned premiums and written premiums are presented in the following tables.
|
(In millions)
|
Direct
|
Assumed
|
Ceded
|
Net
|
Assumed/
Net %
|
|||||||||||||
|
2018 Earned Premiums
|
||||||||||||||||||
|
Property and casualty
|
$
|
10,857
|
|
$
|
305
|
|
$
|
4,380
|
|
$
|
6,782
|
|
4.5
|
%
|
||||
|
Long term care
|
480
|
|
50
|
|
—
|
|
530
|
|
9.4
|
%
|
||||||||
|
Total earned premiums
|
$
|
11,337
|
|
$
|
355
|
|
$
|
4,380
|
|
$
|
7,312
|
|
4.9
|
%
|
||||
|
2017 Earned Premiums
|
||||||||||||||||||
|
Property and casualty
|
$
|
10,447
|
|
$
|
317
|
|
$
|
4,315
|
|
$
|
6,449
|
|
4.9
|
%
|
||||
|
Long term care
|
489
|
|
50
|
|
—
|
|
539
|
|
9.3
|
%
|
||||||||
|
Total earned premiums
|
$
|
10,936
|
|
$
|
367
|
|
$
|
4,315
|
|
$
|
6,988
|
|
5.3
|
%
|
||||
|
2016 Earned Premiums
|
||||||||||||||||||
|
Property and casualty
|
$
|
10,400
|
|
$
|
258
|
|
$
|
4,270
|
|
$
|
6,388
|
|
4.0
|
%
|
||||
|
Long term care
|
486
|
|
50
|
|
—
|
|
536
|
|
9.3
|
%
|
||||||||
|
Total earned premiums
|
$
|
10,886
|
|
$
|
308
|
|
$
|
4,270
|
|
$
|
6,924
|
|
4.4
|
%
|
||||
|
(In millions)
|
Direct
|
Assumed
|
Ceded
|
Net
|
Assumed/
Net %
|
|||||||||||||
|
2018 Written Premiums
|
||||||||||||||||||
|
Property and casualty
|
$
|
11,094
|
|
$
|
310
|
|
$
|
4,583
|
|
$
|
6,821
|
|
4.5
|
%
|
||||
|
Long term care
|
474
|
|
50
|
|
—
|
|
524
|
|
9.5
|
%
|
||||||||
|
Total written premiums
|
$
|
11,568
|
|
$
|
360
|
|
$
|
4,583
|
|
$
|
7,345
|
|
4.9
|
%
|
||||
|
2017 Written Premiums
|
||||||||||||||||||
|
Property and casualty
|
$
|
10,655
|
|
$
|
327
|
|
$
|
4,449
|
|
$
|
6,533
|
|
5.0
|
%
|
||||
|
Long term care
|
486
|
|
50
|
|
—
|
|
536
|
|
9.3
|
%
|
||||||||
|
Total written premiums
|
$
|
11,141
|
|
$
|
377
|
|
$
|
4,449
|
|
$
|
7,069
|
|
5.3
|
%
|
||||
|
2016 Written Premiums
|
||||||||||||||||||
|
Property and casualty
|
$
|
10,451
|
|
$
|
245
|
|
$
|
4,255
|
|
$
|
6,441
|
|
3.8
|
%
|
||||
|
Long term care
|
495
|
|
52
|
|
—
|
|
547
|
|
9.5
|
%
|
||||||||
|
Total written premiums
|
$
|
10,946
|
|
$
|
297
|
|
$
|
4,255
|
|
$
|
6,988
|
|
4.3
|
%
|
||||
Included in the direct and ceded earned premiums for the years ended
December 31, 2018
,
2017
and
2016
are
$3,740 million
,
$3,864 million
and
$3,865 million
related to property business that is 100% reinsured under a significant third-party captive program. The third-party captives that participate in this program are affiliated with the non-insurance company policyholders, therefore this program provides a means for the policyholders to self-insure this property risk. The Company receives and retains a ceding commission.
Long term care premiums are from long duration contracts; property and casualty premiums are from short duration contracts.
Insurance claims and policyholders' benefits reported on the Consolidated Statements of Operations are net of reinsurance recoveries of
$2,836 million
,
$3,085 million
and
$3,016 million
for the years ended
December 31, 2018
,
2017
and
2016
, including
$1,927 million
,
$2,541 million
and
$2,621 million
, respectively, related to the significant third-party captive program discussed above.
111
Note
H
. Debt
Debt is composed of the following obligations.
|
December 31
|
|||||||
|
(In millions)
|
2018
|
2017
|
|||||
|
Short term debt:
|
|||||||
|
Senior notes of CNAF, 6.950%, face amount of $150, due January 15, 2018
|
$
|
—
|
|
$
|
150
|
|
|
|
Long term debt:
|
|||||||
|
Senior notes of CNAF:
|
|||||||
|
5.875%, face amount of $500, due August 15, 2020
|
499
|
|
498
|
|
|||
|
5.750%, face amount of $400, due August 15, 2021
|
399
|
|
398
|
|
|||
|
3.950%, face amount of $550, due May 15, 2024
|
547
|
|
547
|
|
|||
|
4.500%, face amount of $500, due March 1, 2026
|
498
|
|
498
|
|
|||
|
3.450%, face amount of $500, due August 15, 2027
|
495
|
|
495
|
|
|||
|
Debenture of CNAF, 7.250%, face amount of $243, due November 15, 2023
|
242
|
|
242
|
|
|||
|
Subordinated variable rate debt of Hardy, face amount of $30, due September 15, 2036
(1)
|
—
|
|
30
|
|
|||
|
Total long term debt
|
2,680
|
|
2,708
|
|
|||
|
Total debt
|
$
|
2,680
|
|
$
|
2,858
|
|
|
(1) In the third quarter of 2018, the Company redeemed
$30 million
of subordinated variable rate debt of Hardy due September 15, 2036.
CCC is a member of the FHLBC. FHLBC membership provides participants with access to additional sources of liquidity through various programs and services. As a requirement of membership in the FHLBC, CCC held
$5 million
of FHLBC stock as of
December 31, 2018
giving it immediate access to approximately
$111 million
of additional liquidity. As of
December 31, 2018
and
2017
, CCC had
no
outstanding borrowings from the FHLBC.
During 2015, the Company entered into a
five
-year
$250 million
senior unsecured revolving credit facility with a syndicate of banks which may be used for general corporate purposes. The credit agreement includes several covenants, including maintenance of a minimum consolidated net worth and a defined ratio of consolidated indebtedness to consolidated total capitalization. The minimum consolidated net worth, as defined as of
December 31, 2018
, was
$8.7 billion
. As of
December 31, 2018
and
2017
, the Company had
no
outstanding borrowings under the credit agreement.
The Company's debt obligations contain customary covenants for investment grade issuers. The Company was in compliance with all covenants as of and for the years ended
December 31, 2018
and
2017
.
The combined aggregate maturities for debt as of
December 31, 2018
are presented in the following table.
|
(In millions)
|
|||
|
2019
|
$
|
—
|
|
|
2020
|
500
|
|
|
|
2021
|
400
|
|
|
|
2022
|
—
|
|
|
|
2023
|
243
|
|
|
|
Thereafter
|
1,550
|
|
|
|
Less discount
|
(13
|
)
|
|
|
Total
|
$
|
2,680
|
|
112
Note
I
. Benefit Plans
Pension and Postretirement Health Care Benefit Plans
CNA sponsors noncontributory defined benefit pension plans, primarily through the CNA Retirement Plan, covering certain eligible employees. These plans are closed to new entrants. CNA's funding policy for defined benefit pension plans is to make contributions in accordance with applicable governmental regulatory requirements with consideration of the funded status of the plans.
Effective January 1, 2000, the CNA Retirement Plan was closed to new participants. Existing participants at that time were given a choice to either continue to accrue benefits under the CNA Retirement Plan or to cease accruals effective December 31, 1999. Employees who chose to continue to accrue benefits under the plan received benefits in accordance with plan provisions through June 30, 2015 as discussed further below. Employees who elected to cease accruals effective December 31, 1999 received the present value of their accrued benefit in an accrued pension account that is credited with interest based on the annual rate of interest on 30-year Treasury securities. These employees also receive certain enhanced employer contributions in the CNA 401(k) Plus Plan.
Effective June 30, 2015, the Company eliminated future benefit accruals associated with the CNA Retirement Plan. Participants continuing to accrue benefits under the CNA Retirement Plan at that time were entitled to an accrued benefit payable based on their eligible compensation and accrued service through June 30, 2015. These employees also began receiving enhanced employer contributions in the CNA 401(k) Plus Plan similar to employees who elected to cease accruals effective December 31, 1999. Employees who elected to cease accruals effective December 31, 1999 were not affected by this curtailment.
CNA provides certain health care benefits to eligible retired employees, their covered dependents and their beneficiaries primarily through the CNA Health and Group Benefits Program. These postretirement benefits have largely been eliminated for active employees.
113
The following table presents a reconciliation of benefit obligations and plan assets.
|
Pension Benefits
|
Postretirement Benefits
|
||||||||||||||
|
(In millions)
|
2018
|
2017
|
2018
|
2017
|
|||||||||||
|
Benefit obligation as of January 1
|
$
|
2,749
|
|
$
|
2,729
|
|
$
|
11
|
|
$
|
15
|
|
|||
|
Changes in benefit obligation:
|
|||||||||||||||
|
Service cost
|
—
|
|
—
|
|
—
|
|
—
|
|
|||||||
|
Interest cost
|
93
|
|
103
|
|
—
|
|
—
|
|
|||||||
|
Participants' contributions
|
—
|
|
—
|
|
3
|
|
4
|
|
|||||||
|
Actuarial (gain) loss
|
(187
|
)
|
99
|
|
—
|
|
(1
|
)
|
|||||||
|
Benefits paid
|
(166
|
)
|
(170
|
)
|
(5
|
)
|
(7
|
)
|
|||||||
|
Foreign currency translation and other
|
(7
|
)
|
10
|
|
—
|
|
—
|
|
|||||||
|
Settlements
|
(16
|
)
|
(22
|
)
|
—
|
|
—
|
|
|||||||
|
Benefit obligation as of December 31
|
2,466
|
|
2,749
|
|
|
9
|
|
|
11
|
|
|||||
|
Fair value of plan assets as of January 1
|
2,261
|
|
2,193
|
|
—
|
|
—
|
|
|||||||
|
Change in plan assets:
|
|||||||||||||||
|
Actual return on plan assets
|
(69
|
)
|
221
|
|
—
|
|
—
|
|
|||||||
|
Company contributions
|
23
|
|
29
|
|
2
|
|
3
|
|
|||||||
|
Participants' contributions
|
—
|
|
—
|
|
3
|
|
4
|
|
|||||||
|
Benefits paid
|
(166
|
)
|
(170
|
)
|
(5
|
)
|
(7
|
)
|
|||||||
|
Foreign currency translation and other
|
(8
|
)
|
10
|
|
—
|
|
—
|
|
|||||||
|
Settlements
|
(16
|
)
|
(22
|
)
|
—
|
|
—
|
|
|||||||
|
Fair value of plan assets as of December 31
|
2,025
|
|
2,261
|
|
—
|
|
—
|
|
|||||||
|
Funded status
|
$
|
(441
|
)
|
$
|
(488
|
)
|
$
|
(9
|
)
|
$
|
(11
|
)
|
|||
|
Amounts recognized on the Consolidated Balance Sheets as of December 31:
|
|||||||||||||||
|
Other assets
|
$
|
9
|
|
$
|
4
|
|
$
|
—
|
|
$
|
—
|
|
|||
|
Other liabilities
|
(450
|
)
|
(492
|
)
|
(9
|
)
|
(11
|
)
|
|||||||
|
Net amount recognized
|
$
|
(441
|
)
|
$
|
(488
|
)
|
$
|
(9
|
)
|
$
|
(11
|
)
|
|||
|
Amounts recognized in Accumulated other comprehensive income, not yet recognized in net periodic cost (benefit):
|
|||||||||||||||
|
Prior service credit
|
$
|
—
|
|
$
|
—
|
|
$
|
—
|
|
$
|
(2
|
)
|
|||
|
Net actuarial (gain) loss
|
984
|
|
987
|
|
(3
|
)
|
(4
|
)
|
|||||||
|
Net amount recognized
|
$
|
984
|
|
$
|
987
|
|
$
|
(3
|
)
|
$
|
(6
|
)
|
|||
The accumulated benefit obligation for all defined benefit pension plans was
$2,465 million
and
$2,749 million
as of
December 31, 2018
and
2017
. Changes for years ended December 31, 2018 and 2017 include actuarial (gains) losses of
$(187) million
and
$99 million
respectively, primarily driven by changes in the discount rate used to determine defined benefit pension obligations.
114
The components of net periodic pension cost (benefit) are presented in the following table.
|
Years ended December 31
|
|||||||||||
|
(In millions)
|
2018
|
2017
|
2016
|
||||||||
|
Net periodic pension cost (benefit)
|
|||||||||||
|
Service cost
|
$
|
—
|
|
$
|
—
|
|
$
|
—
|
|
||
|
Non-service cost (benefit):
|
|||||||||||
|
Interest cost on projected benefit obligation
|
93
|
|
103
|
|
113
|
|
|||||
|
Expected return on plan assets
|
(159
|
)
|
(154
|
)
|
(160
|
)
|
|||||
|
Amortization of net actuarial (gain) loss
|
37
|
|
35
|
|
37
|
|
|||||
|
Settlement loss
|
6
|
|
9
|
|
—
|
|
|||||
|
Total non-service cost (benefit)
|
(23
|
)
|
(7
|
)
|
(10
|
)
|
|||||
|
Total net periodic pension cost (benefit)
|
$
|
(23
|
)
|
$
|
(7
|
)
|
$
|
(10
|
)
|
||
For the years ended
December 31, 2018
,
2017
and
2016
, the Company recognized
$8 million
,
$2 million
and
$3 million
of non-service benefit in Insurance claims and policyholders' benefits and
$15 million
,
$5 million
and
$7 million
of non-service benefit in Other operating expenses related to net periodic pension costs (benefit).
The components of net periodic postretirement cost (benefit) are presented in the following table.
|
Years ended December 31
|
|||||||||||
|
(In millions)
|
2018
|
2017
|
2016
|
||||||||
|
Net periodic postretirement cost (benefit)
|
|||||||||||
|
Service cost
|
$
|
—
|
|
$
|
—
|
|
$
|
—
|
|
||
|
Non-service cost (benefit):
|
|||||||||||
|
Amortization of prior service credit
|
(1
|
)
|
(2
|
)
|
(2
|
)
|
|||||
|
Amortization of net actuarial (gain) loss
|
(1
|
)
|
—
|
|
—
|
|
|||||
|
Total non-service cost (benefit)
|
(2
|
)
|
(2
|
)
|
(2
|
)
|
|||||
|
Total net periodic postretirement cost (benefit)
|
$
|
(2
|
)
|
$
|
(2
|
)
|
$
|
(2
|
)
|
||
For the years ended
December 31, 2018
,
2017
and
2016
, the Company recognized
$1 million
of non-service benefit in Insurance claims and policyholders' benefits and
$1 million
of non-service benefit in Other operating expenses related to net periodic postretirement cost (benefit), respectively.
The amounts recognized in Other comprehensive income are presented in the following table.
|
Years ended December 31
|
|||||||||||
|
(In millions)
|
2018
|
2017
|
2016
|
||||||||
|
Pension and postretirement benefits
|
|||||||||||
|
Amounts arising during the period
|
$
|
(41
|
)
|
$
|
(31
|
)
|
$
|
(29
|
)
|
||
|
Settlement
|
6
|
|
9
|
|
(2
|
)
|
|||||
|
Reclassification adjustment relating to prior service credit
|
(2
|
)
|
(2
|
)
|
(2
|
)
|
|||||
|
Reclassification adjustment relating to actuarial loss
|
36
|
|
35
|
|
37
|
|
|||||
|
Total increase (decrease) in Other comprehensive income
|
$
|
(1
|
)
|
$
|
11
|
|
$
|
4
|
|
||
115
Actuarial assumptions used for the CNA Retirement Plan and CNA Health and Group Benefits Program to determine benefit obligations are presented in the following table. The interest crediting rate is the weighted average interest rate applied to the individual pension balances for employees who elected to cease accruals effective December 31, 1999.
|
December 31
|
2018
|
2017
|
|||
|
Pension benefits
|
|||||
|
Discount rate
|
4.250
|
%
|
3.550
|
%
|
|
|
Expected long term rate of return
|
7.500
|
|
7.500
|
|
|
|
Interest crediting rate
|
5.000
|
|
5.000
|
|
|
|
Postretirement benefits
|
|||||
|
Discount rate
|
3.550
|
%
|
2.750
|
%
|
|
Actuarial assumptions used for the CNA Retirement Plan and CNA Health and Group Benefits Program to determine net cost or benefit are presented in the following table.
|
Years ended December 31
|
2018
|
2017
|
2016
|
|||||
|
Pension benefits
|
||||||||
|
Discount rate
|
3.550
|
%
|
3.950
|
%
|
4.150
|
%
|
||
|
Expected long term rate of return
|
7.500
|
|
7.500
|
|
7.500
|
|
||
|
Interest crediting rate
|
5.000
|
|
5.000
|
|
5.000
|
|
||
|
Postretirement benefits
|
||||||||
|
Discount rate
|
2.750
|
%
|
2.750
|
%
|
2.750
|
%
|
||
To determine the discount rate assumption as of the year-end measurement date for the CNA Retirement Plan and CNA Health and Group Benefits Program, the Company considered the estimated timing of plan benefit payments and available yields on high quality fixed income debt securities. For this purpose, high quality is considered a rating of Aa or better by Moody's or a rating of AA or better from S&P. The Company reviewed several yield curves constructed using the cash flow characteristics of the plans as well as bond indices as of the measurement date. The trend of those data points was also considered.
In determining the expected long term rate of return on plan assets assumption for the CNA Retirement Plan, CNA considered the historical performance of the benefit plan investment portfolio as well as long term market return expectations based on the investment mix of the portfolio and the expected investment horizon.
The CNA Health and Group Benefits Program has limited its share of the health care trend rate to a cost-of-living adjustment of
4%
per year. For all participants, the employer subsidy on health care costs will not increase by more than
4%
per year. As a result, the assumed health care cost trend rate used in measuring the accumulated postretirement benefit obligation for the CNA Health and Group Benefits Program was
4%
per year in
2018
,
2017
and
2016
.
CNA employs a total return approach whereby a mix of equity, limited partnerships and fixed maturity securities are used to maximize the long term return of retirement plan assets for a prudent level of risk and to manage cash flows according to plan requirements. The target allocation of plan assets is
40%
to
60%
invested in equity securities and limited partnerships, with the remainder primarily invested in fixed maturity securities. Alternative investments, including limited partnerships, are used to enhance risk adjusted long term returns while improving portfolio diversification. The intent of this strategy is to minimize the Company's expense related to funding the plan by generating investment returns that exceed the growth of the plan liabilities over the long run. Risk tolerance is established after careful consideration of the plan liabilities, plan funded status and corporate financial conditions.
As of
December 31, 2018
, the Plan had committed approximately
$93 million
to future capital calls from various third-party limited partnership investments in exchange for an ownership interest in the related partnerships. Derivatives may be used to gain market exposure in an efficient and timely manner. Investment risk is measured and monitored on an ongoing basis through annual liability measurements, periodic asset/liability studies and quarterly investment portfolio reviews.
116
Pension plan assets measured at fair value on a recurring basis as well as cash are presented in the following tables.
|
December 31, 2018
|
||||||||||||||||
|
(In millions)
|
Level 1
|
Level 2
|
Level 3
|
Total
|
||||||||||||
|
Assets
|
||||||||||||||||
|
Fixed maturity securities:
|
||||||||||||||||
|
Corporate bonds and other
|
$
|
—
|
|
$
|
472
|
|
$
|
10
|
|
$
|
482
|
|
||||
|
States, municipalities and political subdivisions
|
—
|
|
58
|
|
—
|
|
58
|
|
||||||||
|
Asset-backed
|
—
|
|
165
|
|
—
|
|
165
|
|
||||||||
|
Total fixed maturity securities
|
—
|
|
695
|
|
10
|
|
705
|
|
||||||||
|
Equity securities
|
331
|
|
110
|
|
—
|
|
441
|
|
||||||||
|
Short term investments
|
27
|
|
54
|
|
—
|
|
81
|
|
||||||||
|
Other assets
|
—
|
|
9
|
|
—
|
|
9
|
|
||||||||
|
Total assets measured at fair value
|
$
|
358
|
|
$
|
868
|
|
$
|
10
|
|
1,236
|
|
|||||
|
Total limited partnerships measured at net asset value
(1)
|
789
|
|
||||||||||||||
|
Total plan assets
|
$
|
2,025
|
|
|||||||||||||
|
December 31, 2017
|
||||||||||||||||
|
(In millions)
|
Level 1
|
Level 2
|
Level 3
|
Total
|
||||||||||||
|
Assets
|
||||||||||||||||
|
Fixed maturity securities:
|
||||||||||||||||
|
Corporate bonds and other
|
$
|
—
|
|
$
|
522
|
|
$
|
10
|
|
$
|
532
|
|
||||
|
States, municipalities and political subdivisions
|
—
|
|
62
|
|
—
|
|
62
|
|
||||||||
|
Asset-backed
|
—
|
|
180
|
|
—
|
|
180
|
|
||||||||
|
Total fixed maturity securities
|
—
|
|
764
|
|
10
|
|
774
|
|
||||||||
|
Equity securities
|
405
|
|
122
|
|
—
|
|
527
|
|
||||||||
|
Short term investments
|
23
|
|
11
|
|
—
|
|
34
|
|
||||||||
|
Other assets
|
—
|
|
9
|
|
—
|
|
9
|
|
||||||||
|
Cash
|
13
|
|
—
|
|
—
|
|
13
|
|
||||||||
|
Total assets measured at fair value
|
$
|
441
|
|
$
|
906
|
|
$
|
10
|
|
1,357
|
|
|||||
|
Total limited partnerships measured at net asset value
(1)
|
|
|
|
|
|
|
904
|
|
||||||||
|
Total plan assets
|
|
|
|
$
|
2,261
|
|
||||||||||
(1) Certain investments that are measured at fair value using the net asset value per share (or its equivalent) practical expedient have not been classified in the fair value hierarchy. The fair value amounts presented in this table for these investments are intended to permit reconciliation of the fair value hierarchy to the amounts presented in the Plan's Statement of Financial Position.
The limited partnership investments held within the plan are recorded at fair value, which represents the plan's share of net asset value of each partnership, as determined by the general partner. Limited partnerships comprising
81%
and
85%
of the carrying value as of
December 31, 2018
and
2017
employ hedge fund strategies that generate returns through investing in marketable securities in the public fixed income and equity markets and the remainder were primarily invested in private debt and equity. Within hedge fund strategies, approximately
66%
were equity related,
28%
pursued a multi-strategy approach and
6%
were focused on distressed investments as of
December 31, 2018
.
For a discussion of the fair value levels and the valuation methodologies used to measure fixed maturity securities, equities, derivatives and short term investments, see Note
C
to the Consolidated Financial Statements.
117
The table below presents the estimated future minimum benefit payments to participants as of
December 31, 2018
.
|
(In millions)
|
Pension Benefits
|
Postretirement Benefits
|
|||||
|
2019
|
$
|
175
|
|
$
|
2
|
|
|
|
2020
|
174
|
|
2
|
|
|||
|
2021
|
175
|
|
1
|
|
|||
|
2022
|
177
|
|
1
|
|
|||
|
2023
|
177
|
|
1
|
|
|||
|
2024-2028
|
850
|
|
2
|
|
|||
In
2019
, CNA expects to contribute
$8 million
to its pension plans and
$2 million
to its postretirement health care benefit plans.
Savings Plans
CNA sponsors savings plans, which are generally contributory plans that allow most employees to contribute a maximum of
50%
of their eligible compensation, subject to certain limitations prescribed by the IRS. The Company contributes matching amounts to participants, amounting to
70%
of the first
6%
(
35%
of the first
6%
in the first year of employment) of eligible compensation contributed by the employee. Matching contributions vest ratably over participants first
five
years of service.
Eligible employees also receive a Company contribution of
3%
or
5%
of their eligible compensation, depending on their age. In addition, these employees are eligible to receive additional discretionary contributions of up to
2%
of eligible compensation and an additional Company match of up to
80%
of the first
6%
of eligible compensation contributed by the employee. These additional contributions are made at the discretion of management and are contributed to participant accounts in the first quarter of the year following management's determination of the discretionary amounts. Matching contributions vest ratably over participants first
five
years of service.
Benefit expense for the Company's savings plans was
$71 million
,
$76 million
and
$75 million
for the years ended
December 31, 2018
,
2017
and
2016
.
118
Note
J
. Stock-Based Compensation
The current CNAF Incentive Compensation Plan (the Plan) authorizes the grant of stock-based compensation to certain management personnel for up to
11 million
shares of CNAF common stock. The Plan currently provides for awards of stock options, stock appreciation rights (SARs), restricted shares, restricted stock units (RSUs), performance-based RSUs and performance share units. The number of shares available for the granting of stock-based compensation under the Plan as of
December 31, 2018
was approximately
1.8 million
.
The Company recorded stock-based compensation expense related to the Plan of
$32 million
,
$36 million
and
$36 million
for the years ended
December 31, 2018
,
2017
and
2016
. The related income tax benefit recognized was
$8 million
,
$18 million
and
$12 million
for the years ended
December 31, 2018
,
2017
and
2016
. The compensation cost not yet recognized was
$44 million
, and the weighted average period over which it is expected to be recognized is
1.7
years as of
December 31, 2018
.
Equity based compensation that is not fully vested prior to termination is generally forfeited upon termination, except in cases of retirement, death or disability, and as otherwise provided by contractual obligations.
Share Awards
The fair value of share awards is based on the market value of the Company's common stock as of the date of grant, except for awards made to foreign participants, which is based on the current market value of the Company’s common stock. Generally, RSUs vest over a
two
or
three
-year service period following the date of grant. Performance-based RSUs generally become payable within a range of
0%
to
100%
of the number of shares initially granted based upon the attainment of specific annual performance goals and vest ratably over a
four
-year service period following the date of grant. As of
December 31, 2018
and
2017
, the Company does not have any outstanding performance-based RSUs.
In 2016, CNA adopted the Annual Performance Share Plan (PSP). The PSP provides officers with an opportunity to earn an award based upon attainment of specific performance goals achieved over a
one
-year performance period. Awards are granted at the beginning of each performance year and are generally subject to a
two
-year cliff vesting period after the Company’s annual performance has been determined. Prior to the PSP, CNA issued performance share units under the Long Term Incentive Plan (LTI Plan). The LTI Plan had a
three
-year performance period and was settled during 2018. In both plans, the performance share units become payable within a range of
0%
to
200%
of the number of performance share units initially granted.
In 2016, CNA granted Special Supplemental Equity Awards (SSE). The awards consisted of restricted stock units subject to both Company performance in 2016 and service-based vesting up to
two
years. As of
December 31, 2018
, the Company does not have any outstanding SSE restricted stock units.
Payments made under the PSP and SSE are made entirely in shares of common stock, except for awards made to foreign participants, which are paid in cash.
The total fair value of RSUs and performance shares that vested during the years ended
December 31, 2018
,
2017
and
2016
was
$16 million
,
$34 million
and
$12 million
, respectively.
The weighted average grant date fair value for RSUs and performance shares granted during the years ended
December 31, 2018
,
2017
and
2016
was
$51.64
,
$44.20
and
$32.27
, respectively.
The following table presents activity for non-vested RSUs and performance share units under the Plan in
2018
.
|
|
Number of Awards
|
|
Weighted-Average Grant Date Fair Value
|
|||
|
Balance as of January 1, 2018
|
2,070,737
|
|
|
$
|
38.92
|
|
|
Awards granted
|
840,961
|
|
|
51.64
|
|
|
|
Awards vested
|
(463,725
|
)
|
|
38.62
|
|
|
|
Awards forfeited, canceled or expired
|
(307,719
|
)
|
|
40.59
|
|
|
|
Performance-based adjustment
|
63,894
|
|
|
52.00
|
|
|
|
Balance as of December 31, 2018
|
2,204,148
|
|
|
43.98
|
|
|
119
Note
K
. Other Intangible Assets
Other intangible assets are presented in the following table.
|
December 31
|
2018
|
2017
|
|||||||||||||||
|
(In millions)
|
Economic Useful Life
|
Carrying Amount
|
Accumulated Amortization
|
Carrying Amount
|
Accumulated Amortization
|
||||||||||||
|
Finite-lived intangible assets:
|
|||||||||||||||||
|
Trade name
|
8 years
|
$
|
6
|
|
$
|
5
|
|
$
|
7
|
|
$
|
5
|
|
||||
|
Distribution channel
|
15 years
|
10
|
|
4
|
|
11
|
|
4
|
|
||||||||
|
Total finite-lived intangible assets
|
16
|
|
9
|
|
18
|
|
9
|
|
|||||||||
|
Indefinite-lived intangible assets:
|
|||||||||||||||||
|
Syndicate capacity
|
45
|
|
47
|
|
|||||||||||||
|
Agency force
|
16
|
|
16
|
|
|||||||||||||
|
Total indefinite-lived intangible assets
|
61
|
|
63
|
|
|||||||||||||
|
Total other intangible assets
|
$
|
77
|
|
$
|
9
|
|
$
|
81
|
|
$
|
9
|
|
|||||
The Company's other intangible assets primarily relate to the purchase of Hardy, and the amortization of the finite-lived intangible assets is included in the Statement of Operations for the International segment. For the years ended
December 31, 2018
,
2017
and
2016
amortization expense of
$1 million
,
$2 million
and
$1 million
was included in Other operating expenses. The gross carrying amounts and accumulated amortization in the table above may change from period to period as a result of foreign currency translation. Estimated future annual amortization expense for other intangible assets is
$1 million
in years 2019 through 2023.
Note
L
. Operating Leases
The Company occupies office facilities under lease agreements that expire at various dates. In addition, data processing, office and transportation equipment is leased under agreements that expire at various dates. Most leases contain renewal options that provide for rent increases based on prevailing market conditions. Lease expense for the years ended
December 31, 2018
,
2017
and
2016
was
$62 million
,
$66 million
and
$60 million
.
The table below presents the expected future minimum lease payments to be made under non-cancelable operating leases as of
December 31, 2018
.
|
(In millions)
|
Future Minimum Lease Payments
|
||
|
2019
|
$
|
35
|
|
|
2020
|
39
|
|
|
|
2021
|
41
|
|
|
|
2022
|
38
|
|
|
|
2023
|
32
|
|
|
|
Thereafter
|
200
|
|
|
|
Total
|
$
|
385
|
|
120
Note
M
. Stockholders’ Equity and Statutory Accounting Practices
Common Stock Dividends
There are no restrictions on the retained earnings or net income of CNAF with regard to payment of dividends to its stockholders. However, given the holding company nature of CNAF, its ability to pay a dividend is significantly dependent on the receipt of dividends from its subsidiaries, particularly CCC, which directly or indirectly owns all significant subsidiaries. See the Statutory Accounting Practices section below for a discussion of the regulatory restrictions on CCC's availability to pay dividends.
CNAF's ability to pay dividends may be indirectly limited by the minimum consolidated net worth covenant in the Company's line of credit agreement. See Note
H
to the Consolidated Financial Statements for further discussion of the Company's debt obligations.
Statutory Accounting Practices
CNAF’s insurance subsidiaries are domiciled in various jurisdictions. These subsidiaries prepare statutory financial statements in accordance with accounting practices prescribed or permitted by the respective jurisdictions’ insurance regulators. Domestic prescribed statutory accounting practices are set forth in a variety of publications of the National Association of Insurance Commissioners (NAIC) as well as state laws, regulations and general administrative rules. These statutory accounting principles vary in certain respects from GAAP. In converting from statutory accounting principles to GAAP, the more significant adjustments include deferral of policy acquisition costs and the inclusion of net unrealized holding gains or losses in stockholders’ equity relating to certain fixed maturity securities.
The Company has a prescribed practice as it relates to the accounting under Statement of Statutory Accounting Principles No. 62R (SSAP No. 62R),
Property and Casualty Reinsurance
, paragraphs 67 and 68 in conjunction with the 2010 LPT with NICO which is further discussed in Note
E
to the Consolidated Financial Statements. The prescribed practice allows the Company to aggregate all third party A&EP reinsurance balances administered by NICO in Schedule F and to utilize the LPT as collateral for the underlying third party reinsurance balances for purposes of calculating the statutory reinsurance penalty. This prescribed practice increased statutory capital and surplus by
$88 million
and
$63 million
at
December 31, 2018
and
2017
.
The payment of dividends by CNAF's insurance subsidiaries without prior approval of the insurance department of each subsidiary’s domiciliary jurisdiction is generally limited by formula. Dividends in excess of these amounts are subject to prior approval by the respective insurance regulator.
Dividends from CCC are subject to the insurance holding company laws of the State of Illinois, the domiciliary state of CCC. Under these laws, ordinary dividends, or dividends that do not require prior approval by the Illinois Department of Insurance (the Department), are determined based on the greater of the prior year's statutory net income or 10% of statutory surplus as of the end of the prior year, as well as the timing and amount of dividends paid in the preceding twelve months. Additionally, ordinary dividends may only be paid from earned surplus, which is calculated by removing unrealized gains from unassigned surplus. As of
December 31, 2018
, CCC is in a positive earned surplus position. The maximum allowable dividend CCC could pay during
2019
that would not be subject to the Department’s prior approval is
$1,383 million
, less dividends paid during the preceding twelve months measured at that point in time. CCC paid dividends of
$1,026 million
in
2018
. The actual level of dividends paid in any year is determined after an assessment of available dividend capacity, holding company liquidity and cash needs as well as the impact the dividends will have on the statutory surplus of the applicable insurance company.
121
Combined statutory capital and surplus and statutory net income (loss) for the Combined Continental Casualty Companies are presented in the table below, determined in accordance with accounting practices prescribed or permitted by insurance and/or other regulatory authorities
|
Statutory Capital and Surplus
|
Statutory Net Income (Loss)
|
||||||||||||||||||
|
December 31
|
Years ended December 31
|
||||||||||||||||||
|
(In millions)
|
2018
(1)
|
2017
|
2018
(1)
|
2017
|
2016
|
||||||||||||||
|
Combined Continental Casualty Companies
|
$
|
10,411
|
|
$
|
10,726
|
|
$
|
1,405
|
|
$
|
1,029
|
|
$
|
1,033
|
|
||||
(1) Information derived from the statutory-basis financial statements to be filed with insurance regulators.
CNAF’s domestic insurance subsidiaries are subject to risk-based capital (RBC) requirements. RBC is a method developed by the NAIC to determine the minimum amount of statutory capital appropriate for an insurance company to support its overall business operations in consideration of its size and risk profile. The formula for determining the amount of RBC specifies various factors, weighted based on the perceived degree of risk, which are applied to certain financial balances and financial activity. The adequacy of a company's actual capital is evaluated by a comparison to the RBC results, as determined by the formula. Companies below minimum RBC requirements are classified within certain levels, each of which requires specified corrective action.
The statutory capital and surplus presented above for CCC was approximately
266%
and
264%
of company action level RBC as of
December 31, 2018
and
2017
. Company action level RBC is the level of RBC which triggers a heightened level of regulatory supervision. The statutory capital and surplus of the Company's foreign insurance subsidiaries, which is not significant to the overall statutory capital and surplus, also met or exceeded their respective regulatory and other capital requirements.
122
Note
N
. Accumulated Other Comprehensive Income (Loss) by Component
The tables below display the changes in Accumulated other comprehensive income (loss) by component.
|
(In millions)
|
Net unrealized gains (losses) on investments with OTTI losses
|
Net unrealized gains (losses) on other investments
|
Pension and postretirement benefits
|
Cumulative foreign currency translation adjustment
|
Total
|
||||||||||||||
|
Balance as of January 1, 2018, as previously reported
|
$
|
25
|
|
$
|
750
|
|
$
|
(645
|
)
|
$
|
(98
|
)
|
$
|
32
|
|
||||
|
Cumulative effect adjustment from accounting change for adoption of ASU 2018-02
(1)
|
5
|
|
137
|
|
(130
|
)
|
—
|
|
12
|
|
|||||||||
|
Cumulative effect adjustment from accounting change for adoption of ASU 2016-01
(1)
net of tax (expense) benefit of $-, $8, $-, $- and $8
|
—
|
|
(28
|
)
|
—
|
|
—
|
|
(28
|
)
|
|||||||||
|
Balance as of January 1, 2018, as adjusted
|
30
|
|
859
|
|
(775
|
)
|
(98
|
)
|
16
|
|
|||||||||
|
Other comprehensive income (loss) before reclassifications
|
(7
|
)
|
(801
|
)
|
(32
|
)
|
(82
|
)
|
(922
|
)
|
|||||||||
|
Amounts reclassified from accumulated other comprehensive income (loss) net of tax (expense) benefit of $(2), $2, $8, $- and $8
|
7
|
|
(3
|
)
|
(32
|
)
|
—
|
|
(28
|
)
|
|||||||||
|
Other comprehensive income (loss) net of tax (expense) benefit of $4, $211, $1, $- and $216
|
(14
|
)
|
(798
|
)
|
|
—
|
|
(82
|
)
|
(894
|
)
|
||||||||
|
Balance as of December 31, 2018
|
$
|
16
|
|
$
|
61
|
|
$
|
(775
|
)
|
$
|
(180
|
)
|
$
|
(878
|
)
|
||||
|
(1)
|
See Note
A
to the Consolidated Financial Statements for additional information.
|
|
(In millions)
|
Net unrealized gains (losses) on investments with OTTI losses
|
Net unrealized gains (losses) on other investments
|
Pension and postretirement benefits
|
Cumulative foreign currency translation adjustment
|
Total
|
||||||||||||||
|
Balance as of January 1, 2017
|
$
|
30
|
|
$
|
642
|
|
$
|
(647
|
)
|
$
|
(198
|
)
|
$
|
(173
|
)
|
||||
|
Other comprehensive income (loss) before reclassifications
|
(3
|
)
|
190
|
|
(25
|
)
|
100
|
|
262
|
|
|||||||||
|
Amounts reclassified from accumulated other comprehensive income (loss) net of tax (expense) benefit of $(1), $(38), $15, $- and $(24)
|
2
|
|
82
|
|
(27
|
)
|
—
|
|
57
|
|
|||||||||
|
Other comprehensive income (loss) net of tax (expense) benefit of $2, $(68), $(9), $- and $(75)
|
(5
|
)
|
108
|
|
2
|
|
100
|
|
205
|
|
|||||||||
|
Balance as of December 31, 2017
|
$
|
25
|
|
$
|
750
|
|
$
|
(645
|
)
|
$
|
(98
|
)
|
$
|
32
|
|
||||
Amounts reclassified from Accumulated other comprehensive income (loss) shown above are reported in Net income (loss) as follows:
|
Component of AOCI
|
Consolidated Statements of Operations Line Item Affected by Reclassifications
|
|
|
Net unrealized gains (losses) on investments with OTTI losses
|
Net realized investment gains (losses)
|
|
|
Net unrealized gains (losses) on other investments
|
Net realized investment gains (losses)
|
|
|
Pension and postretirement benefits
|
Other operating expenses and Insurance claims and policyholders' benefits
|
|
123
Note
O
. Business Segments
The Company's property and casualty commercial insurance operations are managed and reported in
three
business segments: Specialty, Commercial and International. These
three
segments are collectively referred to as Property & Casualty Operations. Specialty provides management and professional liability and other coverages through property and casualty products and services using a network of brokers, independent agencies and managing general underwriters. Commercial works with a network of brokers and independent agents to market a broad range of property and casualty insurance products and services to small, middle-market and large businesses. The International segment underwrites property and casualty coverages on a global basis through its U.K.-based insurance company, a branch operation in Canada as well as through its presence at Lloyd’s of London (Hardy).
The Company's operations outside of Property & Casualty Operations are managed and reported in
two
segments: Life & Group and Corporate & Other. Life & Group primarily includes the results of the individual and group long term care businesses that are in run-off. Corporate & Other primarily includes certain corporate expenses, including interest on corporate debt, and the results of certain property and casualty business in run-off, including CNA Re and A&EP.
The accounting policies of the segments are the same as those described in Note
A
to the Consolidated Financial Statements. The Company manages most of its assets on a legal entity basis, while segment operations are generally conducted across legal entities. As such, only Insurance and Reinsurance receivables, Insurance reserves, Deferred acquisition costs, Goodwill and Deferred non-insurance warranty acquisition expense and revenue are readily identifiable for individual segments. Distinct investment portfolios are not maintained for every individual segment; accordingly, allocation of assets to each segment is not performed. Therefore, a significant portion of Net investment income and Realized investment gains or losses are allocated primarily based on each segment's net carried insurance reserves, as adjusted. All significant intersegment income and expense have been eliminated. Income taxes have been allocated on the basis of the taxable income of the segments.
Approximately
9.3%
,
7.7%
and
7.9%
of the Company's direct written premiums were derived from outside the United States for the years ended
December 31, 2018
,
2017
and
2016
.
In the following tables, certain financial measures are presented to provide information used by management to monitor the Company's operating performance. Management utilizes these financial measures to monitor the Company's insurance operations and investment portfolio.
The performance of the Company's insurance operations is monitored by management through core income (loss), which is derived from certain income statement amounts. The Company's investment portfolio is monitored by management through analysis of various factors including unrealized gains and losses on securities, portfolio duration and exposure to market and credit risk.
Core income (loss) is calculated by excluding from net income (loss) the after-tax effects of i) net realized investment gains (losses), ii) income or loss from discontinued operations, iii) any cumulative effects of changes in accounting guidance and iv) deferred tax asset and liability remeasurement as a result of an enacted U.S. Federal tax rate change. The calculation of core income (loss) excludes net realized investment gains or losses because net realized investment gains or losses are generally driven by economic factors that are not necessarily consistent with key drivers of underwriting performance, and are therefore not considered an indication of trends in insurance operations.
124
The Company's results of operations and selected balance sheet items by segment are presented in the following tables.
|
Year ended December 31, 2018
|
Specialty
|
Commercial
|
International
|
Life &
Group
|
Corporate
& Other
|
|
|
||||||||||||||||||||
|
(In millions)
|
Eliminations
|
Total
|
|||||||||||||||||||||||||
|
Net written premiums
|
$
|
2,744
|
|
$
|
3,060
|
|
$
|
1,018
|
|
$
|
524
|
|
$
|
—
|
|
$
|
(1
|
)
|
$
|
7,345
|
|
||||||
|
Operating revenues
|
|
|
|||||||||||||||||||||||||
|
Net earned premiums
|
$
|
2,732
|
|
$
|
3,050
|
|
$
|
1,001
|
|
$
|
530
|
|
$
|
—
|
|
$
|
(1
|
)
|
$
|
7,312
|
|
||||||
|
Net investment income
|
439
|
|
500
|
|
57
|
|
801
|
|
20
|
|
—
|
|
1,817
|
|
|||||||||||||
|
Non-insurance warranty revenue
|
1,007
|
|
—
|
|
—
|
|
—
|
|
—
|
|
—
|
|
1,007
|
|
|||||||||||||
|
Other revenues
|
2
|
|
28
|
|
1
|
|
2
|
|
19
|
|
(2
|
)
|
50
|
|
|||||||||||||
|
Total operating revenues
|
4,180
|
|
3,578
|
|
1,059
|
|
1,333
|
|
39
|
|
(3
|
)
|
10,186
|
|
|||||||||||||
|
Claims, benefits and expenses
|
|
|
|
|
|
|
|
|
|
|
|
|
|||||||||||||||
|
Net incurred claims and benefits
|
1,526
|
|
2,053
|
|
699
|
|
1,218
|
|
51
|
|
—
|
|
5,547
|
|
|||||||||||||
|
Policyholders’ dividends
|
5
|
|
20
|
|
—
|
|
—
|
|
—
|
|
—
|
|
25
|
|
|||||||||||||
|
Amortization of deferred acquisition costs
|
599
|
|
505
|
|
231
|
|
—
|
|
—
|
|
—
|
|
1,335
|
|
|||||||||||||
|
Non-insurance warranty expense
|
923
|
|
—
|
|
—
|
|
—
|
|
—
|
|
—
|
|
923
|
|
|||||||||||||
|
Other insurance related expenses
|
279
|
|
505
|
|
135
|
|
122
|
|
(1
|
)
|
(1
|
)
|
1,039
|
|
|||||||||||||
|
Other expenses
|
46
|
|
43
|
|
14
|
|
7
|
|
193
|
|
(2
|
)
|
301
|
|
|||||||||||||
|
Total claims, benefits and expenses
|
3,378
|
|
3,126
|
|
1,079
|
|
1,347
|
|
243
|
|
(3
|
)
|
9,170
|
|
|||||||||||||
|
Core income (loss) before income tax
|
802
|
|
452
|
|
(20
|
)
|
(14
|
)
|
(204
|
)
|
—
|
|
1,016
|
|
|||||||||||||
|
Income tax (expense) benefit on core income (loss)
|
(173
|
)
|
(95
|
)
|
1
|
|
57
|
|
39
|
|
—
|
|
(171
|
)
|
|||||||||||||
|
Core income (loss)
|
$
|
629
|
|
$
|
357
|
|
$
|
(19
|
)
|
$
|
43
|
|
$
|
(165
|
)
|
$
|
—
|
|
845
|
|
|||||||
|
Net realized investment gains (losses)
|
(52
|
)
|
|||||||||||||||||||||||||
|
Income tax (expense) benefit on net realized investment gains (losses)
|
14
|
|
|||||||||||||||||||||||||
|
Net realized investment gains (losses), after tax
|
(38
|
)
|
|||||||||||||||||||||||||
|
Net deferred tax asset remeasurement
|
6
|
|
|||||||||||||||||||||||||
|
Net income
|
$
|
813
|
|
||||||||||||||||||||||||
|
December 31, 2018
|
|||||||||||||||||||||||||||
|
(In millions)
|
|
|
|
|
|
|
|||||||||||||||||||||
|
Reinsurance receivables
|
$
|
649
|
|
$
|
795
|
|
$
|
250
|
|
$
|
414
|
|
$
|
2,347
|
|
$
|
—
|
|
$
|
4,455
|
|
||||||
|
Insurance receivables
|
947
|
|
1,277
|
|
284
|
|
9
|
|
(152
|
)
|
—
|
|
2,365
|
|
|||||||||||||
|
Deferred acquisition costs
|
308
|
|
230
|
|
95
|
|
—
|
|
—
|
|
—
|
|
633
|
|
|||||||||||||
|
Goodwill
|
117
|
|
—
|
|
29
|
|
—
|
|
—
|
|
—
|
|
146
|
|
|||||||||||||
|
Deferred non-insurance warranty acquisition expense
|
2,513
|
|
—
|
|
—
|
|
—
|
|
—
|
|
—
|
|
2,513
|
|
|||||||||||||
|
Insurance reserves
|
|
|
|||||||||||||||||||||||||
|
Claim and claim adjustment expenses
|
5,465
|
|
8,743
|
|
1,750
|
|
3,601
|
|
2,425
|
|
—
|
|
21,984
|
|
|||||||||||||
|
Unearned premiums
|
2,132
|
|
1,454
|
|
475
|
|
122
|
|
—
|
|
—
|
|
4,183
|
|
|||||||||||||
|
Future policy benefits
|
—
|
|
—
|
|
—
|
|
10,597
|
|
—
|
|
—
|
|
10,597
|
|
|||||||||||||
|
Deferred non-insurance warranty revenue
|
3,402
|
|
—
|
|
—
|
|
—
|
|
—
|
|
—
|
|
3,402
|
|
|||||||||||||
125
|
Year ended December 31, 2017
|
Specialty
|
Commercial
|
International
|
Life &
Group
|
Corporate
& Other
|
|
|
||||||||||||||||||||
|
(In millions)
|
Eliminations
|
Total
|
|||||||||||||||||||||||||
|
Net written premiums
|
$
|
2,731
|
|
$
|
2,922
|
|
$
|
881
|
|
$
|
536
|
|
$
|
—
|
|
$
|
(1
|
)
|
$
|
7,069
|
|
||||||
|
Operating revenues
|
|
|
|||||||||||||||||||||||||
|
Net earned premiums
|
$
|
2,712
|
|
$
|
2,881
|
|
$
|
857
|
|
$
|
539
|
|
$
|
—
|
|
$
|
(1
|
)
|
$
|
6,988
|
|
||||||
|
Net investment income
|
522
|
|
658
|
|
52
|
|
782
|
|
20
|
|
—
|
|
2,034
|
|
|||||||||||||
|
Non-insurance warranty revenue
|
390
|
|
—
|
|
—
|
|
—
|
|
—
|
|
—
|
|
390
|
|
|||||||||||||
|
Other revenues
|
1
|
|
32
|
|
—
|
|
2
|
|
2
|
|
—
|
|
37
|
|
|||||||||||||
|
Total operating revenues
|
3,625
|
|
3,571
|
|
909
|
|
1,323
|
|
22
|
|
(1
|
)
|
9,449
|
|
|||||||||||||
|
Claims, benefits and expenses
|
|
|
|
|
|
|
|
|
|||||||||||||||||||
|
Net incurred claims and benefits
|
1,533
|
|
1,930
|
|
575
|
|
1,269
|
|
(19
|
)
|
—
|
|
5,288
|
|
|||||||||||||
|
Policyholders’ dividends
|
4
|
|
18
|
|
—
|
|
—
|
|
—
|
|
—
|
|
22
|
|
|||||||||||||
|
Amortization of deferred acquisition costs
|
590
|
|
481
|
|
162
|
|
—
|
|
—
|
|
—
|
|
1,233
|
|
|||||||||||||
|
Non-insurance warranty expense
|
299
|
|
—
|
|
—
|
|
—
|
|
—
|
|
—
|
|
299
|
|
|||||||||||||
|
Other insurance related expenses
|
279
|
|
530
|
|
162
|
|
129
|
|
(1
|
)
|
(1
|
)
|
1,098
|
|
|||||||||||||
|
Other expenses
|
43
|
|
57
|
|
(7
|
)
|
7
|
|
192
|
|
—
|
|
292
|
|
|||||||||||||
|
Total claims, benefits and expenses
|
2,748
|
|
3,016
|
|
892
|
|
1,405
|
|
172
|
|
(1
|
)
|
8,232
|
|
|||||||||||||
|
Core income (loss) before income tax
|
877
|
|
555
|
|
17
|
|
(82
|
)
|
(150
|
)
|
—
|
|
1,217
|
|
|||||||||||||
|
Income tax (expense) benefit on core income (loss)
|
(295
|
)
|
(186
|
)
|
(9
|
)
|
132
|
|
60
|
|
—
|
|
(298
|
)
|
|||||||||||||
|
Core income (loss)
|
$
|
582
|
|
$
|
369
|
|
$
|
8
|
|
$
|
50
|
|
$
|
(90
|
)
|
$
|
—
|
|
919
|
|
|||||||
|
Net realized investment gains (losses)
|
93
|
|
|||||||||||||||||||||||||
|
Income tax (expense) benefit on net realized investment gains (losses)
|
(30
|
)
|
|||||||||||||||||||||||||
|
Net realized investment gains (losses), after tax
|
63
|
|
|||||||||||||||||||||||||
|
Net deferred tax asset remeasurement
|
(83
|
)
|
|||||||||||||||||||||||||
|
Net income
|
$
|
899
|
|
||||||||||||||||||||||||
|
December 31, 2017
|
|||||||||||||||||||||||||||
|
(In millions)
|
|||||||||||||||||||||||||||
|
Reinsurance receivables
|
$
|
671
|
|
$
|
654
|
|
$
|
212
|
|
$
|
438
|
|
$
|
2,315
|
|
$
|
—
|
|
$
|
4,290
|
|
||||||
|
Insurance receivables
|
969
|
|
1,103
|
|
254
|
|
8
|
|
2
|
|
—
|
|
2,336
|
|
|||||||||||||
|
Deferred acquisition costs
|
318
|
|
223
|
|
93
|
|
—
|
|
—
|
|
—
|
|
634
|
|
|||||||||||||
|
Goodwill
|
117
|
|
—
|
|
31
|
|
—
|
|
—
|
|
—
|
|
148
|
|
|||||||||||||
|
Deferred non-insurance warranty acquisition expense
|
212
|
|
—
|
|
—
|
|
—
|
|
—
|
|
—
|
|
212
|
|
|||||||||||||
|
Insurance reserves
|
|
|
|||||||||||||||||||||||||
|
Claim and claim adjustment expenses
|
5,669
|
|
8,764
|
|
1,636
|
|
3,499
|
|
2,436
|
|
—
|
|
22,004
|
|
|||||||||||||
|
Unearned premiums
|
2,020
|
|
1,409
|
|
472
|
|
128
|
|
—
|
|
—
|
|
4,029
|
|
|||||||||||||
|
Future policy benefits
|
—
|
|
—
|
|
—
|
|
11,179
|
|
—
|
|
—
|
|
11,179
|
|
|||||||||||||
|
Deferred non-insurance warranty revenue
|
972
|
|
—
|
|
—
|
|
—
|
|
—
|
|
—
|
|
972
|
|
|||||||||||||
126
|
Year ended December 31, 2016
|
Specialty
|
Commercial
|
Life &
Group
|
Corporate
& Other
|
|||||||||||||||||||||||
|
(In millions)
|
International
|
Eliminations
|
Total
|
||||||||||||||||||||||||
|
Net written premiums
|
$
|
2,738
|
|
$
|
2,883
|
|
$
|
821
|
|
$
|
547
|
|
$
|
—
|
|
$
|
(1
|
)
|
$
|
6,988
|
|
||||||
|
Operating revenues
|
|
|
|||||||||||||||||||||||||
|
Net earned premiums
|
$
|
2,743
|
|
$
|
2,840
|
|
$
|
806
|
|
$
|
536
|
|
$
|
—
|
|
$
|
(1
|
)
|
$
|
6,924
|
|
||||||
|
Net investment income
|
497
|
|
657
|
|
51
|
|
767
|
|
16
|
|
—
|
|
1,988
|
|
|||||||||||||
|
Non-insurance warranty revenue
|
361
|
|
—
|
|
—
|
|
—
|
|
—
|
|
—
|
|
361
|
|
|||||||||||||
|
Other revenues
|
1
|
|
32
|
|
—
|
|
(2
|
)
|
12
|
|
—
|
|
43
|
|
|||||||||||||
|
Total operating revenues
|
3,602
|
|
3,529
|
|
857
|
|
1,301
|
|
28
|
|
(1
|
)
|
9,316
|
|
|||||||||||||
|
Claims, benefits and expenses
|
|
|
|
|
|
|
|
|
|
|
|||||||||||||||||
|
Net incurred claims and benefits
|
1,489
|
|
1,905
|
|
492
|
|
1,286
|
|
98
|
|
—
|
|
5,270
|
|
|||||||||||||
|
Policyholders’ dividends
|
4
|
|
9
|
|
—
|
|
—
|
|
—
|
|
—
|
|
13
|
|
|||||||||||||
|
Amortization of deferred acquisition costs
|
586
|
|
475
|
|
174
|
|
—
|
|
—
|
|
—
|
|
1,235
|
|
|||||||||||||
|
Non-insurance warranty expense
|
271
|
|
—
|
|
—
|
|
—
|
|
—
|
|
—
|
|
271
|
|
|||||||||||||
|
Other insurance related expenses
|
295
|
|
566
|
|
133
|
|
132
|
|
(3
|
)
|
(1
|
)
|
1,122
|
|
|||||||||||||
|
Other expenses
|
41
|
|
36
|
|
24
|
|
8
|
|
209
|
|
—
|
|
318
|
|
|||||||||||||
|
Total claims, benefits and expenses
|
2,686
|
|
2,991
|
|
823
|
|
1,426
|
|
304
|
|
(1
|
)
|
8,229
|
|
|||||||||||||
|
Core income (loss) before income tax
|
916
|
|
538
|
|
34
|
|
(125
|
)
|
(276
|
)
|
—
|
|
1,087
|
|
|||||||||||||
|
Income tax (expense) benefit on core income (loss)
|
(310
|
)
|
(183
|
)
|
(13
|
)
|
145
|
|
98
|
|
—
|
|
(263
|
)
|
|||||||||||||
|
Core income (loss)
|
$
|
606
|
|
$
|
355
|
|
$
|
21
|
|
$
|
20
|
|
$
|
(178
|
)
|
$
|
—
|
|
824
|
|
|||||||
|
Net realized investment gains (losses)
|
50
|
|
|||||||||||||||||||||||||
|
Income tax (expense) benefit on net realized investment gains (losses)
|
(15
|
)
|
|||||||||||||||||||||||||
|
Net realized investment gains (losses), after tax
|
35
|
|
|||||||||||||||||||||||||
|
Net income
|
$
|
859
|
|
||||||||||||||||||||||||
127
The following table presents operating revenue by line of business for each reportable segment.
|
Years ended December 31
|
|||||||||||
|
(In millions)
|
2018
|
2017
|
2016
|
||||||||
|
Specialty
|
|||||||||||
|
Management & Professional Liability
|
$
|
2,440
|
|
$
|
2,533
|
|
$
|
2,562
|
|
||
|
Surety
|
571
|
|
541
|
|
529
|
|
|||||
|
Warranty & Alternative Risks
(1)
|
1,169
|
|
551
|
|
511
|
|
|||||
|
Specialty revenues
|
4,180
|
|
3,625
|
|
3,602
|
|
|||||
|
Commercial
|
|
|
|
|
|||||||
|
Middle Market
|
2,045
|
|
1,965
|
|
1,823
|
|
|||||
|
Small Business
|
472
|
|
480
|
|
582
|
|
|||||
|
Other Commercial Insurance
|
1,061
|
|
1,126
|
|
1,124
|
|
|||||
|
Commercial revenues
|
3,578
|
|
3,571
|
|
3,529
|
|
|||||
|
International
|
|
|
|
|
|
|
|||||
|
Canada
|
255
|
|
224
|
|
203
|
|
|||||
|
Europe
|
363
|
|
326
|
|
314
|
|
|||||
|
Hardy
|
441
|
|
359
|
|
340
|
|
|||||
|
International revenues
|
1,059
|
|
909
|
|
857
|
|
|||||
|
Life & Group revenues
|
1,333
|
|
1,323
|
|
1,301
|
|
|||||
|
Corporate & Other revenues
|
39
|
|
22
|
|
28
|
|
|||||
|
Eliminations
|
(3
|
)
|
(1
|
)
|
(1
|
)
|
|||||
|
Total operating revenues
|
10,186
|
|
9,449
|
|
9,316
|
|
|||||
|
Net realized investment gains (losses)
|
(52
|
)
|
93
|
|
50
|
|
|||||
|
Total revenues
|
$
|
10,134
|
|
$
|
9,542
|
|
$
|
9,366
|
|
||
|
(1)
|
As of January 1, 2018, the Company adopted ASU 2014-09
Revenue Recognition (Topic 606): Revenue from Contracts with Customers
. See Note A to the Consolidated Financial Statements for additional information.
|
128
Note
P
. Quarterly Financial Data (Unaudited)
The following tables present unaudited quarterly financial data.
|
2018
|
|||||||||||||||||||
|
(In millions, except per share data)
|
First
|
Second
|
Third
|
Fourth
|
Full Year
|
||||||||||||||
|
Revenues
|
$
|
2,535
|
|
$
|
2,574
|
|
$
|
2,622
|
|
$
|
2,403
|
|
$
|
10,134
|
|
||||
|
Net income (loss)
(1)
|
$
|
291
|
|
$
|
270
|
|
$
|
336
|
|
$
|
(84
|
)
|
$
|
813
|
|
||||
|
Basic earnings (loss) per share
|
$
|
1.07
|
|
$
|
0.99
|
|
$
|
1.24
|
|
$
|
(0.31
|
)
|
$
|
2.99
|
|
||||
|
Diluted earnings (loss) per share
|
$
|
1.07
|
|
$
|
0.99
|
|
$
|
1.23
|
|
$
|
(0.31
|
)
|
$
|
2.98
|
|
||||
|
2017
|
|||||||||||||||||||
|
(In millions, except per share data)
|
First
|
Second
|
Third
|
Fourth
|
Full Year
|
||||||||||||||
|
Revenues
|
$
|
2,330
|
|
$
|
2,366
|
|
$
|
2,398
|
|
$
|
2,448
|
|
$
|
9,542
|
|
||||
|
Net income (loss)
(2)(3)
|
$
|
260
|
|
$
|
272
|
|
$
|
144
|
|
$
|
223
|
|
$
|
899
|
|
||||
|
Basic earnings (loss) per share
|
$
|
0.96
|
|
$
|
1.01
|
|
$
|
0.53
|
|
$
|
0.82
|
|
$
|
3.32
|
|
||||
|
Diluted earnings (loss) per share
|
$
|
0.96
|
|
$
|
1.00
|
|
$
|
0.53
|
|
$
|
0.82
|
|
$
|
3.30
|
|
||||
|
(1)
|
Net income (loss) in the fourth quarter of 2018 included a loss on limited partnership and common stock investments of
$109 million
and catastrophe losses, net of reinsurance, of
$107 million
related to Hurricane Michael and the California wildfires.
|
|
(2)
|
Net income (loss) in the third quarter of 2017 included catastrophe losses, net of reinsurance and including reinstatement premiums, of
$188 million
related to Hurricanes Harvey, Irma and Maria.
|
|
(3)
|
Net income (loss) in the fourth quarter of 2017 included a one-time non-cash increase to Income tax expense of
$83 million
as a result of Tax Reform Legislation.
|
Note
Q
. Related Party Transactions
The Company reimburses Loews for, or pays directly, fees and expenses of investment facilities and services provided to the Company. Additionally, beginning in 2018, the Company provides investment-related processing services to Loews. The net amounts incurred by the Company for these fees, expenses and services were
$43 million
for each of the years ended
December 31, 2018
,
2017
and
2016
. Net amounts due to Loews, included in Other liabilities and payable in the first quarter of the subsequent year, were
$23 million
and
$22 million
as of
December 31, 2018
and
2017
. In addition, the Company reimbursed Loews for general corporate services and related travel expenses of less than
$1 million
for the each of the years ended
December 31, 2018
and
2017
. The CNA Tax Group is included in the consolidated federal income tax return of Loews and its eligible subsidiaries. The related receivable from Loews, included in Other assets, was
$8 million
as of
December 31, 2018
. The related payable to Loews, included in Other liabilities, was
$121 million
as of
December 31, 2017
. For a detailed description of the income tax agreement with Loews see Note
D
to the Consolidated Financial Statements. In addition, the Company writes, at standard rates, a limited amount of insurance for Loews and its subsidiaries. The earned premiums for each of the years ended
December 31, 2018
,
2017
and
2016
were
$2 million
.
129
Note R. Non-Insurance Revenues from Contracts with Customers
Non-Insurance revenue is recognized when obligations under the terms of a contract with a customer are satisfied; generally this occurs over time as obligations are fulfilled. Revenue is measured as the amount of consideration the Company expects to receive in exchange for providing services.
Deferred Non-Insurance Warranty Revenue
The Company had deferred non-insurance warranty revenue balances of
$2.9 billion
and
$3.4 billion
reported in Deferred non-insurance warranty revenue as of
January 1, 2018
and
December 31, 2018
. The increase in the deferred revenue balance for the
year ended December 31, 2018
was primarily driven by deferrals outpacing revenue recognized in the period due to growth in the business. For the
year ended December 31, 2018
, the Company recognized
$834 million
of revenues that were included in the deferred revenue balance as of
January 1, 2018
. For the
year ended December 31, 2018
, Non-insurance warranty revenue recognized from performance obligations related to prior periods due to a change in estimate was not material. The Company expects to recognize approximately
$963 million
of the deferred revenue in 2019,
$791 million
in 2020,
$613 million
in 2021 and
$1.0 billion
thereafter.
Cost to Obtain and Fulfill Non-Insurance Warranty Contracts with Customers
As of
December 31, 2018
, capitalized commission costs were
$2.5 billion
and capitalized administrator service costs were
$24 million
. For the
year ended December 31, 2018
, the amount of amortization of capitalized costs was
$673 million
and there was no impairment loss related to the costs capitalized. There were no adjustments to deferred costs recorded for the
year ended December 31, 2018
.
130
REPORT OF INDEPENDENT REGISTERED PUBLIC ACCOUNTING FIRM
To the Board of Directors and Stockholders of
CNA Financial Corporation
Chicago, Illinois
Opinions on the Financial Statements and Internal Control over Financial Reporting
We have audited the accompanying consolidated balance sheets of CNA Financial Corporation (an affiliate of Loews Corporation) and subsidiaries (the "Company") as of
December 31, 2018
and
2017
, the related consolidated statements of operations, comprehensive (loss) income, cash flows, and stockholders' equity, for each of the three years in the period ended
December 31, 2018
, and the related notes and the schedules listed in the Index at Item 15 (collectively referred to as the "financial statements"). We also have audited the Company’s internal control over financial reporting as of
December 31, 2018
, based on criteria established in
Internal Control - Integrated Framework (2013)
issued by the Committee of Sponsoring Organizations of the Treadway Commission (COSO).
In our opinion, the financial statements referred to above present fairly, in all material respects, the financial position of the Company as of
December 31, 2018
and
2017
, and the results of its operations and its cash flows for each of the three years in the period ended
December 31, 2018
, in conformity with accounting principles generally accepted in the United States of America. Also, in our opinion, the Company maintained, in all material respects, effective internal control over financial reporting as of
December 31, 2018
, based on criteria established in
Internal Control - Integrated Framework (2013)
issued by COSO.
Change in Accounting Principle
As discussed in Note A to the financial statements, the Company has changed its method of accounting for recognition and measurement of equity securities in
2018
.
Basis for Opinions
The Company’s management is responsible for these financial statements, for maintaining effective internal control over financial reporting, and for its assessment of the effectiveness of internal control over financial reporting, included in the accompanying Management’s Report on Internal Control over Financial Reporting. Our responsibility is to express an opinion on these financial statements and an opinion on the Company’s internal control over financial reporting based on our audits. We are a public accounting firm registered with the Public Company Accounting Oversight Board (United States) (PCAOB) and are required to be independent with respect to the Company in accordance with the U.S. federal securities laws and the applicable rules and regulations of the Securities and Exchange Commission and the PCAOB.
We conducted our audits in accordance with the standards of the PCAOB. Those standards require that we plan and perform the audits to obtain reasonable assurance about whether the financial statements are free of material misstatement, whether due to error or fraud, and whether effective internal control over financial reporting was maintained in all material respects.
Our audits of the financial statements included performing procedures to assess the risks of material misstatement of the financial statements, whether due to error or fraud, and performing procedures to respond to those risks. Such procedures included examining, on a test basis, evidence regarding the amounts and disclosures in the financial statements. Our audits also included evaluating the accounting principles used and significant estimates made by management, as well as evaluating the overall presentation of the financial statements. Our audit of internal control over financial reporting included obtaining an understanding of internal control over financial reporting, assessing the risk that a material weakness exists, and testing and evaluating the design and operating effectiveness of internal control based on the assessed risk. Our audits also included performing such other procedures as we considered necessary in the circumstances. We believe that our audits provide a reasonable basis for our opinions.
131
Definition and Limitations of Internal Control over Financial Reporting
A company’s internal control over financial reporting is a process designed to provide reasonable assurance regarding the reliability of financial reporting and the preparation of financial statements for external purposes in accordance with generally accepted accounting principles. A company’s internal control over financial reporting includes those policies and procedures that (1) pertain to the maintenance of records that, in reasonable detail, accurately and fairly reflect the transactions and dispositions of the assets of the company; (2) provide reasonable assurance that transactions are recorded as necessary to permit preparation of financial statements in accordance with generally accepted accounting principles, and that receipts and expenditures of the company are being made only in accordance with authorizations of management and directors of the company; and (3) provide reasonable assurance regarding prevention or timely detection of unauthorized acquisition, use, or disposition of the company’s assets that could have a material effect on the financial statements.
Because of its inherent limitations, internal control over financial reporting may not prevent or detect misstatements. Also, projections of any evaluation of effectiveness to future periods are subject to the risk that controls may become inadequate because of changes in conditions, or that the degree of compliance with the policies or procedures may deteriorate.
/s/ DELOITTE & TOUCHE LLP
Chicago, Illinois
February 13, 2019
We have served as the Company's auditor since 1976.
132
MANAGEMENT'S REPORT ON INTERNAL CONTROL OVER FINANCIAL REPORTING
The management of CNA Financial Corporation (CNAF or the Company) is responsible for establishing and maintaining adequate internal control over financial reporting. CNAF's internal control system was designed to provide reasonable assurance to the Company's management, its Audit Committee and Board of Directors regarding the preparation and fair presentation of published financial statements.
There are inherent limitations to the effectiveness of any internal control or system of control, however well designed, including the possibility of human error and the possible circumvention or overriding of such controls or systems. Moreover, because of changing conditions the reliability of internal controls may vary over time. As a result even effective internal controls can provide no more than reasonable assurance with respect to the accuracy and completeness of financial statements and their process of preparation.
CNAF management assessed the effectiveness of the Company's internal control over financial reporting as of
December 31, 2018
. In making this assessment, it has used the criteria set forth by the 2013 Committee of Sponsoring Organizations of the Treadway Commission (COSO) in Internal Control - Integrated Framework. Based on those criteria and our assessment we believe that, as of
December 31, 2018
, the Company's internal control over financial reporting was effective.
CNAF's independent registered public accountant, Deloitte & Touche LLP, has issued an audit report on the Company's internal control over financial reporting. This report appears on page 131.
CNA Financial Corporation
Chicago, Illinois
February 13, 2019
133
ITEM 9. CHANGES IN AND DISAGREEMENTS WITH ACCOUNTANTS ON ACCOUNTING AND FINANCIAL DISCLOSURE
None.
ITEM 9A. CONTROLS AND PROCEDURES
As of
December 31, 2018
, the Company's management, including the Company's Chief Executive Officer (CEO) and Chief Financial Officer (CFO), conducted an evaluation of the effectiveness of the Company's disclosure controls and procedures (as such term is defined in Rules 13a-15(e) and 15d-15(e) under the Securities Exchange Act of 1934, as amended (the “Exchange Act”)). Based on this evaluation, the CEO and CFO have concluded that the Company's disclosure controls and procedures are effective.
Pursuant to Section 404 of the Sarbanes-Oxley Act of 2002, and the implementing rules of the Securities and Exchange Commission, the Company included a report of management's assessment of the design and effectiveness of its internal controls as part of this Annual Report on Form 10-K for the fiscal year ended
December 31, 2018
. Management's report and the independent registered public accounting firm's attestation report are included in Part II, Item 8 under the captions entitled “Management's Report on Internal Control Over Financial Reporting” and “Report of Independent Registered Public Accounting Firm” and are incorporated herein by reference.
There has been no change in the Company’s internal control over financial reporting (as defined in Rules 13a-15
(f) and 15d-15(f) under the Exchange Act) during the quarter ended
December 31, 2018
that has materially affected, or is reasonably likely to materially affect, the Company’s internal control over financial reporting.
ITEM 9B. OTHER INFORMATION
None.
134
PART III
ITEM 10. DIRECTORS, EXECUTIVE OFFICERS AND CORPORATE GOVERNANCE
EXECUTIVE OFFICERS OF THE REGISTRANT
|
NAME
|
POSITION AND OFFICES HELD WITH REGISTRANT
|
AGE
|
FIRST BECAME EXECUTIVE OFFICER OF CNA
|
PRINCIPAL OCCUPATION DURING PAST FIVE YEARS
|
|
Dino E. Robusto
|
Chief Executive Officer, CNA Financial Corporation
|
60
|
2016
|
Chairman of the Board and Chief Executive Officer of CNA Financial Corporation since November 2016. President of Commercial and Specialty Lines of the Chubb Group of Insurance Companies and
Executive Vice President of Chubb Limited from 2013 through November 2015.
|
|
James M. Anderson
(1)
|
Executive Vice President & Chief Financial Officer, CNA Financial Corporation
|
46
|
2018
|
Executive Vice President and Chief Financial Officer of CNA Financial Corporation since August 2018. Senior Vice President, Financial Planning & Analysis of the CNA insurance companies from 2012 to August 2018.
|
|
Elizabeth A. Aguinaga
|
Executive Vice President & Chief Human Resource Officer, CNA insurance companies
|
41
|
2018
|
Executive Vice President and Chief Human Resources Officer of CNA insurance companies since February 2018. Senior Vice President, Chief Human Resources Officer of CNA insurance companies from September 2015 through February 2018. Vice President, Human Resources of CNA insurance companies from September 2010 through September 2015.
|
|
David Brosnan
|
Chief Executive, CNA Europe and Hardy
|
56
|
2015
|
Chief Executive of CNA Europe since August 2014 and Chief Executive of Hardy since February 2014. Senior Vice President, Commercial from May 2013 through February 2014.
|
|
Michael A. Costonis
|
Executive Vice President & Chief Operations Officer of the CNA insurance companies
|
48
|
2018
|
Executive Vice President & Chief Operations Officer of the CNA insurance companies since September 2018. Global Insurance Industry Practice Leader and Senior Managing Director at Accenture from 2014 through September 2018. Managing Director at Accenture from 2002 to 2014.
|
|
Larry A. Haefner
|
Executive Vice President & Chief Actuary of the CNA insurance companies
|
62
|
2008
|
Executive Vice President & Chief Actuary of the CNA insurance companies.
|
|
Kevin Leidwinger
|
President & Chief Operating Officer, Commercial of the CNA insurance companies
|
55
|
2015
|
President and Chief Operating Officer, Commercial of the CNA insurance companies since June 2015. Global Casualty Manager for Chubb Commercial Insurance from April 2013 to June 2015.
|
|
Albert J. Miralles
|
Executive Vice President & Chief Risk Officer of the CNA insurance companies
|
49
|
2014
|
Executive Vice President and Chief Risk Officer of the CNA insurance companies since January 2018. President, Long Term Care of the CNA insurance companies from March 2014 through January 2018. Senior Vice President and Treasurer of the CNA insurance companies from 2011 to March 2014.
|
|
Andrew J. Pinkes
|
Executive Vice President, Worldwide Property & Casualty Claim of the CNA insurance companies
|
56
|
2015
|
Executive Vice President, Worldwide Property & Casualty Claim of the CNA insurance companies since May 2015. Executive Vice President, Global Head of Claims for the XL Group from May 2013 to May 2015.
|
|
Kevin G. Smith
|
President & Chief Operating Officer for Specialty, CNA insurance companies
|
54
|
2017
|
President and Chief Operating Officer for Specialty of CNA insurance companies since May 2017. Executive Vice President, Chubb from May 2016 through May 2017. Senior Vice President, Chicago Regional Branch Manager, Chubb from July 2008 through May 2016.
|
|
Scott Louis Weber
|
Executive Vice President & General Counsel, CNA Financial Corporation
|
50
|
2017
|
Executive Vice President and General Counsel of CNA Financial Corporation since June 2017. Senior Vice President for Worldwide P&C Claim of CNA insurance companies from February 2017 through June 2017. Managing Director for Stroz Friedberg March 2014 through February 2017. Director for Opera Solutions March 2011 through July 2014.
|
135
|
NAME
|
POSITION AND OFFICES HELD WITH REGISTRANT
|
AGE
|
FIRST BECAME EXECUTIVE OFFICER OF CNA
|
PRINCIPAL OCCUPATION DURING PAST FIVE YEARS
|
|
Douglas M. Worman
|
Executive Vice President & Chief Underwriting Officer, CNA insurance companies
|
51
|
2017
|
Executive Vice President and Chief Underwriting Officer of CNA insurance companies since March 2017. Chief Executive Officer, U.S. Insurance, ENH Insurance Company from November 2013 through July 2016.
|
(1)
James M. Anderson assumed this role on August 1, 2018. Prior to this date, D. Craig Mense held this office.
Officers are elected annually and hold office until their successors are elected and qualified, and are subject to removal by the Board of Directors.
Additional information required in Part III, Item 10 has been omitted as we intend to include such information in our definitive proxy statement which will be filed with the Securities and Exchange Commission not later than 120 days after
December 31, 2018
.
136
ITEM 11. EXECUTIVE COMPENSATION
Information required in Part III, Item 11 has been omitted as we intend to include such information in our definitive proxy statement which will be filed with the Securities and Exchange Commission not later than 120 days after
December 31, 2018
.
ITEM 12. SECURITY OWNERSHIP OF CERTAIN BENEFICIAL OWNERS AND MANAGEMENT AND RELATED STOCKHOLDER MATTERS
Equity Compensation Plan
The table below presents the securities authorized for issuance under equity compensation plans. Performance share units are included at the maximum potential payout percentage.
|
December 31, 2018
|
Number of securities to be issued upon exercise of outstanding options, warrants and rights
|
Weighted average exercise price of outstanding options, warrants and rights
|
Number of securities remaining available for future issuance under equity compensation plans (excluding securities reflected in column (a))
|
||||||
|
Plan Category
|
(a)
|
(b)
|
(c)
|
||||||
|
Equity compensation plans approved by security holders
|
3,881,693
|
|
$
|
42.83
|
|
1,837,942
|
|
||
|
Equity compensation plans not approved by security holders
|
—
|
|
—
|
|
—
|
|
|||
|
Total
|
3,881,693
|
|
$
|
42.83
|
|
1,837,942
|
|
||
Additional information required in Part III, Item 12 has been omitted as we intend to include such information in our definitive proxy statement which will be filed with the Securities and Exchange Commission not later than 120 days after
December 31, 2018
.
ITEM 13. CERTAIN RELATIONSHIPS AND RELATED TRANSACTIONS, AND DIRECTOR INDEPENDENCE
Information required in Part III, Item 13 has been omitted as we intend to include such information in our definitive proxy statement which will be filed with the Securities and Exchange Commission not later than 120 days after
December 31, 2018
.
ITEM 14. PRINCIPAL ACCOUNTING FEES AND SERVICES
Information required in Part III, Item 14 has been omitted as we intend to include such information in our definitive proxy statement which will be filed with the Securities and Exchange Commission not later than 120 days after
December 31, 2018
.
137
PART IV
ITEM 15. EXHIBITS, FINANCIAL STATEMENT SCHEDULES
(1) FINANCIAL STATEMENTS:
|
Page Number
|
|||
(2) FINANCIAL STATEMENT SCHEDULES:
|
Schedule I
|
||||
|
Schedule II
|
||||
|
Schedule III
|
||||
|
Schedule IV
|
||||
|
Schedule V
|
||||
|
Schedule VI
|
||||
(3) EXHIBITS:
|
Description of Exhibit
|
Exhibit Number
|
||||
|
(3
|
)
|
Articles of incorporation and by-laws:
|
|||
|
3.1
|
|
||||
|
3.1.1
|
|
||||
|
Certificate of Amendment of Certificate of Incorporation, dated May 10, 1999 (Exhibit 3.1 to 1999 Form 10-K incorporated herein by reference)
|
3.1.2
|
|
**
|
||
|
3.2
|
|
||||
|
(4
|
)
|
Instruments defining the rights of security holders, including indentures:*
|
|||
|
4.1
|
|
||||
138
|
(10
|
)
|
Material contracts:
|
|||
|
10.1
|
|
||||
|
Federal Income Tax Allocation Agreement, dated February 29, 1980 between CNA Financial Corporation and Loews Corporation (Exhibit 10.2 to 1987 Form 10-K incorporated herein by reference)
|
10.2
|
|
**
|
||
|
10.3
|
|
||||
|
10.3.1
|
|
||||
|
10.4
|
|
+
|
|||
|
10.4.1
|
|
||||
|
10.5
|
|
+
|
|||
|
10.6
|
|
+
|
|||
|
10.6.1
|
|
+
|
|||
|
10.6.2
|
|
+
|
|||
|
10.7
|
|
||||
|
10.11
|
|
+
|
|||
|
10.12
|
|
+
|
|||
|
10.13
|
|
||||
139
|
10.14
|
|
||||
|
10.15
|
|
||||
|
10.16
|
|
||||
|
10.17
|
|
||||
|
10.18
|
|
||||
|
10.19
|
|
+
|
|||
|
10.20
|
|
+
|
|||
|
10.21
|
|
+
|
|||
|
(21
|
)
|
Subsidiaries of the Registrant
|
|||
|
21.1
|
|
||||
|
(23
|
)
|
Consent of Experts and Counsel
|
|||
|
23.1
|
|
||||
|
(31
|
)
|
Rule 13a-14(a)/15d-14(a) Certifications
|
|||
|
31.1
|
|
||||
|
|
|
|
|||
|
31.2
|
|
||||
|
|
|
|
|||
140
|
(32
|
)
|
Section 1350 Certifications
|
|||
|
32.1
|
|
||||
|
|
|
|
|||
|
32.2
|
|
||||
|
(101
|
)
|
XBRL - Interactive Data File
|
|||
|
XBRL Instance Document
|
101.INS
|
|
|||
|
XBRL Taxonomy Extension Schema
|
101.SCH
|
|
|||
|
XBRL Taxonomy Extension Calculation Linkbase
|
101.CAL
|
|
|||
|
XBRL Taxonomy Extension Definition Linkbase
|
101.DEF
|
|
|||
|
XBRL Taxonomy Label Linkbase
|
101.LAB
|
|
|||
|
XBRL Taxonomy Extension Presentation Linkbase
|
101.PRE
|
|
|||
|
* CNA Financial Corporation hereby agrees to furnish to the Commission upon request copies of instruments with respect to long term debt, pursuant to Item 601(b)(4) (iii) of Regulation S-K.
|
|||||
|
** Per Item 10(d) of Regulation S-K [17CFR 229.10(d)], these exhibits do not need to be hyperlinked.
|
|||||
|
+
Management contract or compensatory plan or arrangement.
|
|||||
|
Except for Exhibits 21.1, 23.1, 31.1, 31.2, 32.1, 32.2 and the XBRL documents as discussed in the note above, the exhibits above are not included in this report, but are on file with the SEC.
|
|||||
141
SCHEDULE I. SUMMARY OF INVESTMENTS - OTHER THAN INVESTMENTS IN RELATED PARTIES
Incorporated herein by reference to Note
B
to the Consolidated Financial Statements included under Item 8.
SCHEDULE II. CONDENSED FINANCIAL INFORMATION OF REGISTRANT (PARENT COMPANY)
CNA Financial Corporation
Statements of Operations and Comprehensive (Loss) Income
|
Years ended December 31
|
|||||||||||
|
(In millions)
|
2018
|
2017
|
2016
|
||||||||
|
Revenues
|
|||||||||||
|
Net investment income
|
$
|
10
|
|
$
|
6
|
|
$
|
3
|
|
||
|
Net realized investment (losses) gains
|
—
|
|
(42
|
)
|
(7
|
)
|
|||||
|
Total revenues
|
10
|
|
(36
|
)
|
(4
|
)
|
|||||
|
Expenses
|
|||||||||||
|
Administrative and general
|
1
|
|
2
|
|
1
|
|
|||||
|
Interest
|
135
|
|
152
|
|
155
|
|
|||||
|
Total expenses
|
136
|
|
154
|
|
156
|
|
|||||
|
Loss from operations before income taxes and equity in net income of subsidiaries
|
(126
|
)
|
(190
|
)
|
(160
|
)
|
|||||
|
Income tax benefit
|
9
|
|
57
|
|
41
|
|
|||||
|
Loss before equity in net income of subsidiaries
|
(117
|
)
|
(133
|
)
|
(119
|
)
|
|||||
|
Equity in net income of subsidiaries
|
930
|
|
1,032
|
|
978
|
|
|||||
|
Net income
|
813
|
|
899
|
|
859
|
|
|||||
|
Equity in other comprehensive income of subsidiaries
|
(894
|
)
|
205
|
|
142
|
|
|||||
|
Total comprehensive (loss) income
|
$
|
(81
|
)
|
$
|
1,104
|
|
$
|
1,001
|
|
||
See accompanying Notes to Condensed Financial Information as well as the
Consolidated Financial Statements and accompanying Notes.
142
CNA Financial Corporation
Balance Sheets
|
December 31
|
|||||||
|
(In millions, except share data)
|
2018
|
2017
|
|||||
|
Assets
|
|||||||
|
Investment in subsidiaries
|
$
|
13,427
|
|
$
|
14,481
|
|
|
|
Cash
|
1
|
|
1
|
|
|||
|
Short term investments
|
519
|
|
638
|
|
|||
|
Amounts due from affiliates
|
2
|
|
4
|
|
|||
|
Other assets
|
—
|
|
1
|
|
|||
|
Total assets
|
$
|
13,949
|
|
$
|
15,125
|
|
|
|
Liabilities
|
|||||||
|
Short term debt
|
$
|
—
|
|
$
|
150
|
|
|
|
Long term debt
|
2,680
|
|
2,678
|
|
|||
|
Other liabilities
|
52
|
|
53
|
|
|||
|
Total liabilities
|
2,732
|
|
2,881
|
|
|||
|
Stockholders' Equity
|
|||||||
|
Common stock ($2.50 par value; 500,000,000 shares authorized; 273,040,243 shares issued; 271,456,978 and 271,205,390 shares outstanding)
|
683
|
|
683
|
|
|||
|
Additional paid-in capital
|
2,192
|
|
2,175
|
|
|||
|
Retained earnings
|
9,277
|
|
9,414
|
|
|||
|
Accumulated other comprehensive income
|
(878
|
)
|
32
|
|
|||
|
Treasury stock (1,583,265 and 1,834,853 shares), at cost
|
(57
|
)
|
(60
|
)
|
|||
|
Total stockholders' equity
|
11,217
|
|
12,244
|
|
|||
|
Total liabilities and stockholders' equity
|
$
|
13,949
|
|
$
|
15,125
|
|
|
See accompanying Notes to Condensed Financial Information as well as the
Consolidated Financial Statements and accompanying Notes.
143
CNA Financial Corporation
Statements of Cash Flows
|
Years ended December 31
|
|||||||||||
|
(In millions)
|
2018
|
2017
|
2016
|
||||||||
|
Cash Flows from Operating Activities
|
|||||||||||
|
Net income
|
$
|
813
|
|
$
|
899
|
|
$
|
859
|
|
||
|
Adjustments to reconcile net income to net cash flows provided by operating activities:
|
|||||||||||
|
Equity in net income of subsidiaries
|
(930
|
)
|
(1,032
|
)
|
(978
|
)
|
|||||
|
Dividends received from subsidiaries
|
1,026
|
|
955
|
|
765
|
|
|||||
|
Net realized investment losses
|
—
|
|
42
|
|
7
|
|
|||||
|
Other, net
|
16
|
|
36
|
|
21
|
|
|||||
|
Total adjustments
|
112
|
|
1
|
|
(185
|
)
|
|||||
|
Net cash flows provided by operating activities
|
925
|
|
900
|
|
674
|
|
|||||
|
Cash Flows from Investing Activities
|
|||||||||||
|
Change in short term investments
|
130
|
|
(146
|
)
|
(9
|
)
|
|||||
|
Capital contributions to subsidiaries
|
(2
|
)
|
—
|
|
—
|
|
|||||
|
Other, net
|
—
|
|
—
|
|
4
|
|
|||||
|
Net cash flows provided (used) by investing activities
|
128
|
|
(146
|
)
|
(5
|
)
|
|||||
|
Cash Flows from Financing Activities
|
|||||||||||
|
Dividends paid to common stockholders
|
(896
|
)
|
(842
|
)
|
(813
|
)
|
|||||
|
Proceeds from the issuance of debt
|
—
|
|
496
|
|
498
|
|
|||||
|
Repayment of debt
|
(150
|
)
|
(391
|
)
|
(358
|
)
|
|||||
|
Other, net
|
(7
|
)
|
(17
|
)
|
1
|
|
|||||
|
Net cash flows used by financing activities
|
(1,053
|
)
|
(754
|
)
|
(672
|
)
|
|||||
|
Net change in cash
|
—
|
|
—
|
|
(3
|
)
|
|||||
|
Cash, beginning of year
|
1
|
|
1
|
|
4
|
|
|||||
|
Cash, end of year
|
$
|
1
|
|
$
|
1
|
|
$
|
1
|
|
||
See accompanying Notes to Condensed Financial Information as well as the
Consolidated Financial Statements and accompanying Notes.
144
Notes to Condensed Financial Information
A. Summary of Significant Accounting Policies
Basis of Presentation
The condensed financial information of CNA Financial Corporation (CNAF or the Parent Company) should be read in conjunction with the Consolidated Financial Statements and Notes thereto included in Item 8 of this Form 10-K. CNAF’s subsidiaries are accounted for using the equity method of accounting. Equity in net income of these subsidiaries is presented on the Condensed Statements of Operations as Equity in net income of subsidiaries. Loews owned approximately
89%
of the outstanding common stock of CNAF as of
December 31, 2018
.
B. Guarantees
As of
December 31, 2018
and
2017
CNAF had recorded liabilities of approximately
$5 million
related to guarantee agreements. The Parent Company believes that it is not likely that any future indemnity claims will be significantly greater than the amounts recorded.
In the course of selling business entities and assets to third parties, CNAF has agreed to guarantee the performance of certain obligations of both a previously owned subsidiary and a current subsidiary. Such obligations include agreement to indemnify purchasers for losses arising out of breaches of representation and warranties with respect to the business entities or assets sold, including, in certain cases, losses arising from undisclosed liabilities or certain named litigation. The guarantee agreements may include provisions that survive indefinitely. As of
December 31, 2018
, the aggregate amount of quantifiable guarantee agreements in effect for sales of business entities, assets and third-party loans was
$625 million
. Should the company be required to make payments under the guarantee, it would have the right to seek reimbursement in certain cases from an affiliate of a previously owned subsidiary.
In addition, CNAF has agreed to provide indemnification to third-party purchasers for certain losses associated with sold business entities or assets that are not limited by a contractual monetary amount. As of
December 31, 2018
, CNAF had outstanding unlimited indemnifications in connection with the sales of certain of its business entities or assets that included tax liabilities arising prior to a purchaser’s ownership of an entity or asset, defects in title at the time of sale, employee claims arising prior to closing and in some cases losses arising from certain litigation and undisclosed liabilities. These indemnification agreements survive until the applicable statutes of limitation expire or until the agreed upon contract terms expire.
CNAF also provided guarantees, if the primary obligor fails to perform, to holders of structured settlement annuities provided by a previously owned subsidiary. As of
December 31, 2018
, the potential amount of future payments CNAF could be required to pay under these guarantees was approximately
$1.8 billion
, which will be paid over the lifetime of the annuitants. The Parent Company does not believe a payable is likely under these guarantees, as it is the beneficiary of a trust that must be maintained at a level that approximates the discounted reserves for these annuities.
145
SCHEDULE III. SUPPLEMENTARY INSURANCE INFORMATION
Incorporated herein by reference to Note
O
to the Consolidated Financial Statements included under Item 8.
SCHEDULE IV. REINSURANCE
Incorporated herein by reference to Note
G
to the Consolidated Financial Statements included under Item 8.
SCHEDULE V. VALUATION AND QUALIFYING ACCOUNTS
|
(In millions)
|
Balance at Beginning of Period
|
Charged to Costs and Expenses
|
Charged to Other Accounts
(1)
|
Deductions
|
Balance at End of Period
|
||||||||||||||
|
Year ended December 31, 2018
|
|||||||||||||||||||
|
Deducted from assets:
|
|||||||||||||||||||
|
Allowance for doubtful accounts:
|
|||||||||||||||||||
|
Insurance and reinsurance receivables
|
$
|
73
|
|
$
|
4
|
|
$
|
—
|
|
$
|
(6
|
)
|
$
|
71
|
|
||||
|
Year ended December 31, 2017
|
|||||||||||||||||||
|
Deducted from assets:
|
|||||||||||||||||||
|
Allowance for doubtful accounts:
|
|||||||||||||||||||
|
Insurance and reinsurance receivables
|
$
|
83
|
|
$
|
(1
|
)
|
$
|
—
|
|
$
|
(9
|
)
|
$
|
73
|
|
||||
|
Year ended December 31, 2016
|
|||||||||||||||||||
|
Deducted from assets:
|
|||||||||||||||||||
|
Allowance for doubtful accounts:
|
|||||||||||||||||||
|
Insurance and reinsurance receivables
|
$
|
89
|
|
$
|
(2
|
)
|
$
|
(1
|
)
|
$
|
(3
|
)
|
$
|
83
|
|
||||
(1) Amount includes effects of foreign currency translation.
146
SCHEDULE VI. SUPPLEMENTAL INFORMATION CONCERNING PROPERTY AND CASUALTY INSURANCE OPERATIONS
|
As of and for the years ended December 31
|
Consolidated Property and Casualty Operations
|
||||||||||
|
(In millions)
|
2018
|
2017
|
2016
|
||||||||
|
Balance Sheet Data
|
|||||||||||
|
Deferred acquisition costs
|
$
|
632
|
|
$
|
632
|
|
|
|
|||
|
Reserves for unpaid claim and claim adjustment expenses
|
21,984
|
|
22,004
|
|
|
|
|||||
|
Discount deducted from claim and claim adjustment expense reserves above (based on interest rates ranging from 3.5% to 8.0%)
|
1,388
|
|
1,434
|
|
|
|
|||||
|
Unearned premiums
|
4,183
|
|
4,029
|
|
|
|
|||||
|
Statement of Operations Data
|
|||||||||||
|
Net written premiums
|
$
|
7,345
|
|
$
|
7,069
|
|
$
|
6,988
|
|
||
|
Net earned premiums
|
7,312
|
|
6,988
|
|
6,924
|
|
|||||
|
Net investment income
|
1,751
|
|
1,992
|
|
1,952
|
|
|||||
|
Incurred claim and claim adjustment expenses related to current year
|
5,358
|
|
5,201
|
|
5,025
|
|
|||||
|
Incurred claim and claim adjustment expenses related to prior years
|
(179
|
)
|
(381
|
)
|
(342
|
)
|
|||||
|
Amortization of deferred acquisition costs
|
1,335
|
|
1,233
|
|
1,235
|
|
|||||
|
Paid claim and claim adjustment expenses
|
5,331
|
|
5,341
|
|
5,134
|
|
|||||
147
SIGNATURES
Pursuant to the requirements of Section 13 or 15(d) of the Securities Exchange Act of 1934, the registrant has duly caused this report to be signed on its behalf by the undersigned, thereunto duly authorized.
|
CNA Financial Corporation
|
||
|
Dated: February 13, 2019
|
By
|
/s/ Dino E. Robusto
|
|
Dino E. Robusto
Chief Executive Officer
(Principal Executive Officer)
|
||
|
Dated: February 13, 2019
|
By
|
/s/ James M. Anderson
|
|
James M. Anderson
Executive Vice President and
Chief Financial Officer
(Principal Financial & Accounting Officer)
|
||
Pursuant to the requirements of the Securities Exchange Act of 1934, this report has been signed below by the following persons on behalf of the registrant and in the capacities and on the date indicated.
|
Dated: February 13, 2019
|
By
|
/s/ Dino E. Robusto
|
|
(Dino E. Robusto, Chief Executive Officer and Chairman of the Board of Directors)
|
||
|
Dated: February 13, 2019
|
By
|
/s/ Michael A. Bless
|
|
(Michael A. Bless, Director)
|
||
|
Dated: February 13, 2019
|
By
|
/s/ Jose O. Montemayor
|
|
(Jose O. Montemayor, Director)
|
||
|
Dated: February 13, 2019
|
By
|
/s/ Don M. Randel
|
|
(Don M. Randel, Director)
|
||
|
Dated: February 13, 2019
|
By
|
/s/ Andre Rice
|
|
(Andre Rice, Director)
|
||
|
Dated: February 13, 2019
|
By
|
/s/ Andrew H. Tisch
|
|
(Andrew H. Tisch, Director)
|
||
|
Dated: February 13, 2019
|
By
|
/s/ Benjamin J. Tisch
|
|
(Benjamin J. Tisch, Director)
|
||
|
Dated: February 13, 2019
|
By
|
/s/ James S. Tisch
|
|
(James S. Tisch, Director)
|
||
|
Dated: February 13, 2019
|
By
|
/s/ Marvin Zonis
|
|
(Marvin Zonis, Director)
|
||
|
Dated: February 13, 2019
|
By
|
/s/ Jane Wang
|
|
(Jane Wang, Director)
|
||
148
TABLE OF CONTENTS
Part IItem 1. BusinessItem 1A. Risk FactorsItem 1B. Unresolved Staff CommentsItem 2. PropertiesItem 3. Legal ProceedingsItem 4. Mine Safety DisclosuresPart IIItem 5. Market For Registrant's Common Equity, Related Stockholder Matters and Issuer Purchases Of Equity SecuritiesItem 6. Selected Consolidated Financial DataItem 7. Management's Discussion and Analysis Of Financial Condition and Results Of OperationsItem 7A. Quantitative and Qualitative Disclosures About Market RiskItem 8. Financial Statements and Supplementary DataItem 9. Changes in and Disagreements with Accountants on Accounting and Financial DisclosureItem 9A. Controls and ProceduresItem 9B. Other InformationPart IIIItem 10. Directors, Executive Officers and Corporate GovernanceItem 11. Executive CompensationItem 12. Security Ownership Of Certain Beneficial Owners and Management and Related Stockholder MattersItem 13. Certain Relationships and Related Transactions, and Director IndependenceItem 14. Principal Accounting Fees and ServicesPart IVItem 15. Exhibits, Financial Statement Schedules