CENTENE CORP
10-Ks and 10-Qs
|
|
|
|
|
|
|
|
|
|
|
|
|
|
|
|
|
|
|
|
|
|
|
|
|
|
|
|
|
|
|
|
|
|
|
|
|
|
|
|
|
|
|
|
|
|
|
|
|
|
|
|
|
|
|
|
|
|
|
|
|
|
|
|
|
UNITED STATES
SECURITIES AND EXCHANGE COMMISSION
Washington, D.C. 20549
Form 10-K
(Mark One)
|
T
|
ANNUAL REPORT PURSUANT TO SECTION 13 OR 15(d) OF THE SECURITIES EXCHANGE ACT OF 1934
|
For the fiscal year ended December 31, 2010
or
|
£
|
TRANSITION REPORT PURSUANT TO SECTION 13 OR 15(d) OF THE SECURITIES EXCHANGE ACT OF 1934
|
For the transition period from to
Commission file number: 001-31826
Centene Corporation
(Exact name of registrant as specified in its charter)
|
Delaware
|
42-1406317
|
|
|
(State or other jurisdiction of
incorporation or organization)
|
(I.R.S. Employer
Identification Number)
|
|
|
7700 Forsyth Boulevard
|
||
|
St. Louis, Missouri
|
63105
|
|
|
(Address of principal executive offices)
|
(Zip Code)
|
Registrant’s telephone number, including area code: (314) 725-4477
Securities registered pursuant to Section 12(b) of the Act:
|
Common Stock, $0.001 Par Value
|
New York Stock Exchange
|
|
|
Title of Each Class
|
Name of Each Exchange on Which Registered
|
Securities registered pursuant to Section 12(g) of the Act:
None
(Title of Each Class)
Indicate by check mark if the registrant is a well-known seasoned issuer, as defined in Rule 405 of the Securities Act. Yes
T
No
£
Indicate by check mark if the registrant is not required to file reports pursuant to Section 13 or Section 15(d) of the Act. Yes
£
No
T
Indicate by check mark whether the registrant (1) has filed all reports required to be filed by Section 13 or 15(d) of the Securities Exchange Act of 1934 during the preceding 12 months (or for such shorter period that the registrant was required to file such reports), and (2) has been subject to such filing requirements for the past 90 days. Yes
T
No
£
Indicate by check mark whether the registrant has submitted electronically and posted on its corporate Web site, if any, every Interactive Data File required to be submitted and posted pursuant to Rule 405 of Regulation S-T during the preceding 12 months (or for such shorter period that the registrant was require to submit and post such files). Yes
T
No
£
Indicate by check mark if disclosure of delinquent filers pursuant to Item 405 of Regulation S-K is not contained herein, and will not be contained, to the best of registrant’s knowledge, in definitive proxy or information statements incorporated by reference in Part III of this Form 10-K or any amendment to this Form 10-K.
£
Indicate by check mark whether the registrant is a large accelerated filer, an accelerated filer, a non-accelerated filer, or a smaller reporting company. See the definitions of “large accelerated filer”, “accelerated filer” and “small reporting company” in Rule 12b-2 of the Exchange Act. Large accelerated filer
T
Accelerated filer
£
Non-accelerated filer
£
(do not check if a smaller reporting company) Smaller reporting company
£
Indicate by check mark whether the registrant is a shell company (as defined in Rule 12b-2 of the Act). Yes
£
No
T
The aggregate market value of the voting and non-voting common equity held by non-affiliates of the registrant, based upon the last reported sale price of the common stock on the New York Stock Exchange on June 30, 2010, was $1.0 billion.
As of February 4, 2011, the registrant had 52,197,869 shares of common stock outstanding.
DOCUMENTS INCORPORATED BY REFERENCE
Portions of the Proxy Statement for the registrant’s 2011 annual meeting of stockholders are incorporated by reference in Part III, Items 10, 11, 12, 13 and 14.
|
Part I
|
||||
|
Item 1.
|
|
|
2
|
|
|
Item 1A.
|
11
|
|||
|
Item 1B.
|
17
|
|||
|
Item 2.
|
|
|
17
|
|
|
Item 3.
|
|
|
17
|
|
|
Item 4.
|
17
|
|||
|
Part II
|
||||
|
Item 5.
|
|
|
17
|
|
|
Item 6.
|
|
|
19
|
|
|
Item 7.
|
|
|
20
|
|
|
Item 7A.
|
|
|
29
|
|
|
Item 8.
|
|
|
30
|
|
|
Item 9.
|
|
|
50
|
|
|
Item 9A.
|
|
|
50
|
|
|
Item 9B.
|
|
|
52
|
|
|
Part III
|
||||
|
Item 10.
|
|
|
52
|
|
|
Item 11.
|
|
|
52
|
|
|
Item 12.
|
|
|
52
|
|
|
Item 13
|
|
|
52
|
|
|
Item 14.
|
|
|
52
|
|
|
Part IV
|
||||
|
Item 15.
|
|
|
52
|
|
|
|
54
|
|||
CAUTIONARY STATEMENT ON FORWARD-LOOKING STATEMENTS
All statements, other than statements of current or historical fact, contained in this filing are forward-looking statements. We have attempted to identify these statements by terminology including “believe,” “anticipate,” “plan,” “expect,” “estimate,” “intend,” “seek,” “target,” “goal,” “may,” “will,” “should,” “can,” “continue” and other similar words or expressions in connection with, among other things, any discussion of future operating or financial performance. In particular, these statements include statements about our market opportunity, our growth strategy, competition, expected activities and future acquisitions, investments and the adequacy of our available cash resources. These statements may be found in the various sections of this filing, including those entitled “Management’s Discussion and Analysis of Financial Condition and Results of Operations,” Part I, Item 1A. “Risk Factors,” and Part I, Item 3 “Legal Proceedings.” Readers are cautioned that matters subject to forward-looking statements involve known and unknown risks and uncertainties, including economic, regulatory, competitive and other factors that may cause our or our industry’s actual results, levels of activity, performance or achievements to be materially different from any future results, levels of activity, performance or achievements expressed or implied by these forward-looking statements. These statements are not guarantees of future performance and are subject to risks, uncertainties and assumptions.
All forward-looking statements included in this filing are based on information available to us on the date of this filing. Actual results may differ from projections or estimates due to a variety of important factors, including:
|
·
|
our ability to accurately predict and effectively manage health benefits and other operating expenses;
|
|
·
|
competition;
|
|
·
|
changes in healthcare practices;
|
|
·
|
changes in federal or state laws or regulations;
|
|
·
|
inflation;
|
|
·
|
provider contract changes;
|
|
·
|
new technologies;
|
|
·
|
reduction in provider payments by governmental payors;
|
|
·
|
major epidemics;
|
|
·
|
disasters and numerous other factors affecting the delivery and cost of healthcare;
|
|
·
|
the expiration, cancellation or suspension of our Medicaid managed care contracts by state governments;
|
|
·
|
availability of debt and equity financing, on terms that are favorable to us; and
|
|
·
|
general economic and market conditions.
|
Item 1A “Risk Factors” of Part I of this filing contains a further discussion of these and other important factors that could cause actual results to differ from expectations. We disclaim any current intention or obligation to update or revise any forward-looking statements, whether as a result of new information, future events or otherwise. Due to these important factors and risks, we cannot give assurances with respect to our future premium levels or our ability to control our future medical costs.
OVERVIEW
We are a diversified, multi-line healthcare enterprise operating in two segments: Medicaid Managed Care and Specialty Services. Our Medicaid Managed Care segment provides Medicaid and Medicaid-related health plan coverage to individuals through government subsidized programs, including Medicaid, the State Children’s Health Insurance Program, or CHIP, Foster Care, Medicare Special Needs Plans and the Supplemental Security Income Program, also known as the Aged, Blind or Disabled Program, or collectively ABD. Our health plans in Florida, Georgia, Indiana, Mississippi, Ohio, South Carolina, Texas and Wisconsin are included in the Medicaid Managed Care segment. As of December 31, 2010, Medicaid accounted for 77% of our at-risk membership, while CHIP (also including Foster Care) and ABD (also including Medicare) accounted for 14% and 7%, respectively. Other state programs in Massachusetts represent the remaining 2% at-risk membership. Our Specialty Services segment offers products for behavioral health, heath insurance exchanges, individual health insurance, life and health management, long-term care programs, managed vision, telehealth services, and pharmacy benefits management to state programs, healthcare organizations, employer groups and other commercial organizations, as well as to our own subsidiaries. Our health plans in Arizona, operated by our long-term care company, and Massachusetts, operated by our individual health insurance provider, are included in the Specialty Services segment.
We completed the sale of certain assets of University Health Plans, Inc., or UHP, our New Jersey health plan, during the first quarter of 2010. Accordingly, the results of operations for UHP are classified as discontinued operations for all periods presented in our consolidated financial statements. The following discussion and analysis is presented primarily in the context of continuing operations unless otherwise identified.
Our at-risk managed care membership totaled approximately 1.5 million as of December 31, 2010. For the year ended December 31, 2010, our revenues and net earnings from continuing operations were $4.4 billion and $90.9 million, respectively, and our total cash flow from operations was $168.9 million.
We provide member-focused services through locally based staff by assisting in accessing care, coordinating referrals to related health and social services and addressing member concerns and questions. We also provide education and outreach programs to inform and assist members in accessing quality, appropriate healthcare services. We believe our local approach to managing our health plans, including provider and member services, enables us to provide accessible, quality, culturally-sensitive healthcare coverage to our communities. Our health management, educational and other initiatives are designed to help members best utilize the healthcare system to ensure they receive appropriate, medically necessary services and effective management of routine, severe and chronic health problems, resulting in better health outcomes. We combine our decentralized local approach for care with a centralized infrastructure of support functions such as finance, information systems and claims processing.
Our initial health plan commenced operations in Wisconsin in 1984. We were organized in Wisconsin in 1993 as a holding company for our initial health plan and reincorporated in Delaware in 2001. Our corporate office is located at 7700 Forsyth Boulevard, St. Louis, Missouri 63105, and our telephone number is (314) 725-4477. Our stock is publicly traded on the New York Stock Exchange under the ticker symbol “CNC.”
INDUSTRY
We provide our services to the uninsured primarily through Medicaid, CHIP, Foster Care, ABD, Medicare and other state programs for the uninsured. The federal Centers for Medicare and Medicaid Services, or CMS, estimated the total Medicaid and CHIP market was approximately $355 billion in 2008, and estimate the market will grow to $896 billion by 2019. According to the most recent information provided by the Kaiser Commission on Medicaid and the Uninsured, Medicaid spending increased by 8.8% in fiscal 2010 and states appropriated an increase of 7.4% for Medicaid in fiscal 2011 budgets.
Established in 1965, Medicaid is the largest publicly funded program in the United States, and provides health insurance to low-income families and individuals with disabilities. Authorized by Title XIX of the Social Security Act, Medicaid is an entitlement program funded jointly by the federal and state governments and administered by the states. The majority of funding is provided at the federal level. Each state establishes its own eligibility standards, benefit packages, payment rates and program administration within federal standards. As a result, there are 56 Medicaid programs— one for each U.S. state, each U.S. territory and the District of Columbia. Eligibility is based on a combination of household income and assets, often determined by an income level relative to the federal poverty level. Historically, children have represented the largest eligibility group. Many states have selected Medicaid managed care as a means of delivering quality healthcare and controlling costs, including states that automatically enroll Medicaid recipients who don’t select a health plan. We refer to these states as mandated managed care states.
Established in 1972, and authorized by Title XVI of the Social Security Act, ABD covers low-income persons with chronic physical disabilities or behavioral health impairments. ABD beneficiaries represent a growing portion of all Medicaid recipients. In addition, ABD recipients typically utilize more services because of their critical health issues.
The Balanced Budget Act of 1997 created CHIP to help states expand coverage primarily to children whose families earned too much to qualify for Medicaid, yet not enough to afford private health insurance. Some states include the parents of these children in their CHIP programs. CHIP is the single largest expansion of health insurance coverage for children since the enactment of Medicaid. Costs related to the largest eligibility group, children, are primarily composed of pediatrics and family care. These costs tend to be more predictable than other healthcare issues which predominantly affect the adult population.
A portion of Medicaid beneficiaries are dual eligibles, low-income seniors and people with disabilities who are enrolled in both Medicaid and Medicare. According to the Kaiser Commission on Medicaid and the Uninsured, there were approximately 9 million dual eligible enrollees in 2010. These dual eligibles may receive assistance from Medicaid for Medicaid benefits, such as nursing home care and/or assistance with Medicare premiums and cost sharing. Dual eligibles also use more services due to their tendency to have more chronic health issues. We serve dual eligibles through our ABD and long-term care programs, and beginning in 2008, through Special Needs Plans.
While Medicaid programs have directed funds to many individuals who cannot afford or otherwise maintain health insurance coverage, they did not initially address the inefficient and costly manner in which the Medicaid population tends to access healthcare. Medicaid recipients in non-managed care programs typically have not sought preventive care or routine treatment for chronic conditions, such as asthma and diabetes. Rather, they have sought healthcare in hospital emergency rooms, which tends to be more expensive. As a result, many states have found that the costs of providing Medicaid benefits have increased while the medical outcomes for the recipients remained unsatisfactory.
Since the early 1980s, increasing healthcare costs, combined with significant growth in the number of Medicaid recipients, have led many states to establish Medicaid managed care initiatives. Additionally, a number of states are designing programs to cover the rising number of uninsured Americans. The Kaiser Commission on Medicaid and the Uninsured estimated there were over 46 million Americans in 2008 that lacked health insurance. We expect that continued pressure on states’ Medicaid budgets will cause public policy to recognize the value of managed care as a means of delivering quality healthcare and effectively controlling costs. A growing number of states have mandated that their Medicaid recipients enroll in managed care plans. Other states are considering moving to a mandated managed care approach. As a result, a significant market opportunity exists for managed care organizations with operations and programs focused on the distinct socio-economic, cultural and healthcare needs of the uninsured population and the Medicaid, CHIP, Foster Care and ABD populations. We believe our approach and strategy enable us to be a growing participant in this market.
OUR COMPETITIVE STRENGTHS
Our multi-line managed care approach is based on the following key attributes:
|
·
|
Strong Historic Operating Performance.
We have increased revenues as we have grown in existing markets, expanded into new markets and broadened our product offerings. We entered the Wisconsin market in 1984, the Indiana market in 1995, the Texas market in 1999, the Arizona market in 2003, the Ohio market in 2004, the Georgia market in 2006, the South Carolina market in 2007, the Florida and Massachusetts markets in 2009 and the Mississippi market in 2011. We have increased our membership through participation in new programs in existing states. For example, in 2008, we began operations in the Texas Foster Care program and began serving Acute Care members in Yavapai county of Arizona. We have also increased membership by acquiring Medicaid businesses, contracts and other related assets from competitors in existing markets, most recently in Florida and South Carolina in 2010.
Our at-risk membership totaled approximately 1.5 million as of December 31, 2010. For the year ended December 31, 2010, we had revenues of $4.4 billion, representing a 25% Compound Annual Growth Rate, or CAGR, since the year ended December 31, 2005. We generated total cash flow from operations of $168.9 million and net earnings of $90.9 million for the year ended December 31, 2010.
|
|
·
|
Medicaid Expertise.
For more than 25 years, we have developed a specialized Medicaid expertise that has helped us establish and maintain relationships with members, providers and state governments. We have implemented programs developed to achieve savings for state governments and improve medical outcomes for members by reducing inappropriate emergency room use, inpatient days and high cost interventions, as well as by managing care of chronic illnesses. Our experience in working with state regulators helps us implement and deliver programs and services efficiently and affords us opportunities to provide input regarding Medicaid industry practices and policies in the states in which we operate. We work with state agencies on redefining benefits, eligibility requirements and provider fee schedules in order to maximize the number of uninsured individuals covered through Medicaid, CHIP, Foster Care and ABD and expand the types of benefits offered. Our approach is to accomplish this while maintaining adequate levels of provider compensation and protecting our profitability.
|
|
·
|
Diversified Business Lines.
We continue to broaden our service offerings to address areas that we believe have been traditionally underserved by Medicaid managed care organizations. In addition to our Medicaid and Medicaid-related managed care services, our service offerings include behavioral health, health insurance exchanges, individual health insurance, life and health management, long-term care programs, managed vision, telehealth services and pharmacy benefits management. Through the utilization of a multi-business line approach, we are able to improve quality of care, improve outcomes, and diversify our revenues and help control our medical costs.
|
|
·
|
Localized Approach with Centralized Support Infrastructure.
We take a localized approach to managing our subsidiaries, including provider and member services. This approach enables us to facilitate access by our members to high quality, culturally sensitive healthcare services. Our systems and procedures have been designed to address these community-specific challenges through outreach, education, transportation and other member support activities. For example, our community outreach programs work with our members and their communities to promote health and self-improvement through employment and education on how best to access care. We complement this localized approach with a centralized infrastructure of support functions such as finance, information systems and claims processing, which allows us to minimize general and administrative expenses and to integrate and realize synergies from acquisitions. We believe this combined approach allows us to efficiently integrate new business opportunities in both Medicaid and specialty services while maintaining our local accountability and improved access.
|
|
·
|
Specialized and Scalable Systems and Technology.
Through our specialized information systems, we work to strengthen relationships with providers and states which help us grow our membership base. We continue to develop our specialized information systems which allow us to support our core processing functions under a set of integrated databases, designed to be both replicable and scalable. Physicians can use claims, utilization and membership data to manage their practices more efficiently, and they also benefit from our timely payments. State agencies can use data from our information systems to demonstrate that their Medicaid populations receive quality healthcare in an efficient manner. These systems also help identify needs for new healthcare and specialty programs. We have the ability to leverage our platform for one state configuration into new states or for health plan acquisitions. Our utilization data is maintained on one common system for all health plans. Our ability to access data and translate it into meaningful information is essential to operating across a multi-state service area in a cost-effective manner.
|
OUR BUSINESS STRATEGY
Our objective is to become the leading multi-line healthcare enterprise focusing on the uninsured and under insured population and state funded healthcare initiatives. We intend to achieve this objective by implementing the following key components of our strategy:
|
·
|
Increase Penetration of Existing State Markets.
We seek to continue to increase our Medicaid membership in states in which we currently operate through alliances with key providers, outreach efforts, development and implementation of community-specific products and acquisitions. In Texas, we expanded our operations to the Corpus Christi market in 2006, began managing care for ABD recipients in February 2007 and began operations in the Foster Care program in April 2008. In Arizona, we began serving members of a long-term care plan in 2006 and within an acute care plan in 2008. In 2008, we began serving Medicare members within Special Needs Plans in Arizona, Ohio, Texas and Wisconsin. We may also increase membership by acquiring Medicaid businesses, contracts and other related assets from our competitors in our existing markets or by enlisting additional providers. For example, in 2010, we acquired certain Medicaid-related assets in Florida and South Carolina.
|
|
·
|
Diversify Business Lines.
We seek to broaden our business lines into areas that complement our existing business to enable us to grow and diversify our revenue. We are constantly evaluating new opportunities for expansion both domestically and abroad. For instance, in July 2008, we completed the acquisition of Celtic Insurance Company, a national individual health insurance provider. In October 2006, we commenced operations under our managed care program contracts to provide long-term care services in Arizona, and in January 2006, we completed the acquisition of US Script, a pharmacy benefits manager. We employ a disciplined acquisition strategy that is based on defined criteria including internal rate of return, accretion to earnings per share, market leadership and compatibility with our information systems. We engage our executives in the relevant operational units or functional areas to ensure consistency between the diligence and integration process.
|
|
·
|
Address Emerging State Needs.
We work to assist the states in which we operate in addressing the operating challenges they face. We seek to assist the states in balancing premium rates, benefit levels, member eligibility, policies and practices, and provider compensation. For example, in November 2010, we began operating under a new contract with the Texas Department of Insurance to provide affordable health plans for Texas small businesses under the new Healthy Texas initiative, in April 2010, we began offering an individual insurance product for residents of Massachusetts who do not qualify for other state funded insurance programs and in 2008, we began operating under a contract with the Texas Health and Human Services Commission for Comprehensive Health Care for Children in Foster Care, a new statewide program providing managed care services to participants in the Texas Foster Care program. By helping states structure an appropriate level and range of Medicaid, CHIP and specialty services, we seek to ensure that we are able to continue to provide those services on terms that achieve targeted gross margins, provide an acceptable return and grow our business.
|
|
·
|
Develop and Acquire Additional State Markets.
We continue to leverage our experience to identify and develop new markets by seeking both to acquire existing business and to build our own operations. We expect to focus expansion in states where Medicaid recipients are mandated to enroll in managed care organizations, because we believe member enrollment levels are more predictable in these states. In addition, we focus on states where managed care programs can help address states’ financial needs. In 2007, we entered the South Carolina market and we participated in the state’s conversion to at-risk managed care. In February 2009, we began managed care operations in Florida through conversion of members in certain counties from Access Health Solutions to at-risk managed care in Sunshine State Health Plan, through our state contract. In July 2009, we began operating under our contract in Massachusetts to manage healthcare services operating as CeltiCare Health Plan of Massachusetts. In 2011, we began managing care for ABD members in Mississippi. We expect to begin
providing managed care services to older adults and adults with disabilities in Illinois in the first half of 2011.
|
|
·
|
Leverage Established Infrastructure to Enhance Operating Efficiencies
. We intend to continue to invest in infrastructure to further drive efficiencies in operations and to add functionality to improve the service provided to members and other organizations at a low cost. Information technology, or IT, investments complement our overall efficiency goals by increasing the automated processing of transactions and growing the base of decision-making analytical tools. Our centralized functions and common systems enable us to add members and markets quickly and economically.
|
|
·
|
Maintain Operational Discipline.
We monitor our cost trends, operating performance, regulatory relationships and the Medicaid political environment in our existing markets. We seek to operate in markets that allow us to meet our internal metrics including membership growth, plan size, market leadership and operating efficiency. We may divest contracts or health plans in markets where the state’s Medicaid environment, over a long-term basis, does not allow us to meet our targeted performance levels. We use multiple techniques to monitor and reduce our medical costs, including on-site hospital review by staff nurses and involvement of medical management in significant cases. Our executive dashboard is utilized to quickly identify cost drivers and medical trends. Our management team regularly evaluates the financial impact of proposed changes in provider relationships,
contracts, changes in membership and mix of members, potential state rate changes and cost reduction initiatives.
|
We have regulated subsidiaries offering healthcare services in each state we serve. The table below provides summary data for the state markets we currently serve:
|
State
|
Local Health Plan Name
|
|
First Year of Operations Under the Company
|
|
Counties Served at December 31, 2010
|
|
Market Share
(1)
|
At-risk Managed Care Membership at
December 31, 2010
|
|
||
|
Arizona
|
Bridgeway Health Solutions
(2)
|
2008
|
5
|
1.5%
|
22,400
|
||||||
|
Florida
|
Sunshine State Health Plan
|
2009
|
26
|
17.3%
|
194,900
|
||||||
|
Georgia
|
Peach State Health Plan
|
2006
|
90
|
28.6%
|
305,800
|
||||||
|
Indiana
|
Managed Health Services
|
1995
|
92
|
31.8%
|
215,800
|
||||||
|
Massachusetts
|
CeltiCare Health Plan
|
2009
|
14
|
(3)
|
36,200
|
||||||
|
Ohio
|
Buckeye Community Health Plan
|
2004
|
43
|
9.9%
|
160,100
|
||||||
|
South Carolina
|
Absolute Total Care
|
2007
|
42
|
17.2%
|
90,300
|
||||||
|
Texas
|
Superior HealthPlan
|
1999
|
254
|
18.7%
|
433,100
|
||||||
|
Wisconsin
|
Managed Health Services
|
1984
|
38
|
10.5%
|
74,900
|
||||||
|
604
|
1,533,500
|
||||||||||
|
(1)
|
Represents Medicaid and CHIP membership as of December 31, 2010 as a percentage of total eligible Medicaid and CHIP managed care members in each state. ABD programs are excluded.
|
|
(2)
|
Represents the acute care and Medicare businesses under Bridgeway Health Solutions.
|
|
(3)
|
CeltiCare Health Plan manages members under the state Commonwealth Care Bridge program and Commonwealth Care program with market share of 100% and approximately 7.0%, respectively.
|
All of our revenue is derived from operations within the United States and its territories, and all of the Company’s long lived assets are based in the United States and its territories. We generally receive a fixed premium per member per month pursuant to our state contracts. Our medical costs have a seasonality component due to cyclical illness, for example cold and flu season, resulting in higher medical expenses beginning in the fourth quarter and continuing throughout the first quarter of the following year. Our managed care subsidiaries in Georgia, Ohio, and Texas had revenues from their respective state governments that each exceeded 10% of our consolidated total revenues in 2010. Other financial information about our segments is found in Note 20,
Segment Information
, of our Notes to Consolidated Financial Statements and “Management’s Discussion and Analysis of Financial Condition and Results of Operations” included elsewhere in this Annual Report on Form 10-K.
MEDICAID MANAGED CARE
Benefits to States
Our ability to establish and maintain a leadership position in the markets we serve results primarily from our demonstrated success in providing quality care while reducing and managing costs, and from our specialized programs in working with state governments. Among the benefits we are able to provide to the states with which we contract are:
|
·
|
Significant cost savings and budget predictability compared to state paid reimbursement for services.
We bring bottom-line management experience to our health plans. On the administrative and management side, we bring experience including quality of care improvement methods, utilization management procedures, an efficient claims payment system, and provider performance reporting, as well as managers and staff experienced in using these key elements to improve the quality of and access to care. We receive a contracted premium on a per member basis and are responsible for the medical costs and as a result, provide budget predictability.
|
|
·
|
Data-driven approaches to balance cost and verify eligibility.
Our Medicaid health plans have conducted enrollment processing and activities for state programs since 1984. We seek to ensure effective enrollment procedures that move members into the plan, then educate them and ensure they receive needed services as quickly as possible. Our IT department has created mapping/translation programs for loading membership and linking membership eligibility status to all of Centene’s subsystems.
|
|
·
|
Establishment of realistic and meaningful expectations for quality deliverables.
We have collaborated with state agencies in redefining benefits, eligibility requirements and provider fee schedules with the goal of maximizing the number of individuals covered through Medicaid, CHIP, Foster Care and ABD programs.
|
|
·
|
Managed care expertise in government subsidized programs.
Our expertise in Medicaid has helped us establish and maintain strong relationships with our constituent communities of members, providers and state governments. We provide access to services through local providers and staff that focus on the cultural norms of their individual communities. To that end, systems and procedures have been designed to address community-specific challenges through outreach, education, transportation and other member support activities.
|
|
·
|
Improved medical outcomes.
We have implemented programs developed to achieve savings for state governments and improve medical outcomes for members by reducing inappropriate emergency room use, inpatient days and high cost interventions, as well as by managing care of chronic illness.
|
|
·
|
Timely payment of provider claims.
We are committed to ensuring that our information systems and claims payment systems meet or exceed state requirements. We continuously endeavor to update our systems and processes to improve the timeliness of our provider payments.
|
|
·
|
Provider outreach and programs.
Our health plans have adopted a physician-driven approach where network providers are actively engaged in developing and implementing healthcare delivery policies and strategies. This approach is designed to eliminate unnecessary costs, improve services to members and simplify the administrative burdens placed on providers.
|
|
·
|
Responsible collection and dissemination of utilization data.
We gather utilization data from multiple sources, allowing for an integrated view of our members’ utilization of services. These sources include medical, vision and behavioral health claims and encounter data, pharmacy data, dental vendor claims and authorization data from the authorization and case management system utilized by us to coordinate care.
|
|
·
|
Timely and accurate reporting.
Our information systems have reporting capabilities which have been instrumental in identifying the need for new and/or improved healthcare and specialty programs. For state agencies, our reporting capability is important in demonstrating an auditable program.
|
|
·
|
Fraud and abuse prevention.
We have several systems in place to help identify, detect and investigate potential waste, abuse and fraud including pre and post payment software. We collaborate with state and federal agencies and assist with investigation requests. We use nationally recognized standards to benchmark our processes.
|
Member Programs and Services
We recognize the importance of member-focused delivery of quality managed care services. Our locally-based staff assists members in accessing care, coordinating referrals to related health and social services and addressing member concerns and questions. While covered healthcare benefits vary from state to state, our health plans generally provide the following services:
|
Ÿ
|
primary and specialty physician care
|
Ÿ
|
transportation assistance
|
|
|
Ÿ
|
inpatient and outpatient hospital care
|
Ÿ
|
vision care
|
|
|
Ÿ
|
emergency and urgent care
|
Ÿ
|
dental care
|
|
|
Ÿ
|
prenatal care
|
Ÿ
|
immunizations
|
|
|
Ÿ
|
laboratory and x-ray services
|
Ÿ
|
prescriptions and limited over-the-counter drugs
|
|
|
Ÿ
|
home health and durable medical equipment
|
Ÿ
|
therapies
|
|
|
Ÿ
|
behavioral health and substance abuse services
|
Ÿ
|
social work services
|
|
|
Ÿ
|
24-hour nurse advice line
|
Ÿ
|
We also provide the following education and outreach programs to inform and assist members in accessing quality, appropriate healthcare services in an efficient manner:
|
Ÿ
|
Start Smart For Your Baby
®
is a prenatal and infant health program designed to increase the percentage of pregnant women receiving early prenatal care, reduce the incidence of low birth weight babies, identify high risk pregnancies, increase participation in the federal Women, Infant and Children program, prevent hospital admissions in the first year of life and increase well-child visits. The program includes risk assessments, education through face-to-face meetings and materials, behavior modification plans, assistance in selecting a provider for the infant and scheduling newborn follow-up visits. These initiatives are supported by a statistically proven reduction in Neonatal Intensive Care Unit (NICU) days as well as increased gestational birth weights. The program includes a Notification of Pregnancy process to identify pregnant women more quickly and enables us to help them gain access to prenatal medical care, give them education on their healthcare needs, assist with social needs and concerns, and coordinate referrals to appropriate specialists and the obstetrics (OB) case management program as needed. The Notification of Pregnancy also identifies women eligible for our high risk OB management program, or 17P Program, which aims to reduce the rate of recurrent preterm delivery and neonatal intensive care admissions through the use of Progesterone. In addition, Start Smart has also co-written a book for the first year of life with the American Academy of Pediatrics. In 2010, Start Smart won the Platinum Award for Consumer Empowerment at the URAC Quality Summit. Start Smart also was awarded the 2010 URAC / GKEN International Health Promotion Award. The “Your Pregnancy Guide” developed by Start Smart was a 2010 Silver Medalist of the National Health Information Award.
|
|
Ÿ
|
Connections Plus
®
is a cell phone program developed for high-risk members who have limited or no access to a safe, reliable telephone. The program puts free, preprogrammed cell phones into the hands of eligible members. This program seeks to eliminate lack of safe, reliable access to a telephone as a barrier to coordinating care, thus reducing avoidable adverse events such as inappropriate emergency room utilization, hospital admissions and premature birth. Members are identified through case management activities or through a referral. Connections Plus is available to high-risk members in all Centene health plans. Originally designed for pregnant women and ABD populations, this program has now been expanded to service members with mental health issues, and specific diseases, including sickle cell. Connections Plus was recognized as a URAC Best Practice 2009 Silver Medalist and a 2008 NCQA Best Practice.
|
|
Ÿ
|
MemberConnections
®
is a community face-to-face outreach and education program designed to create a link between the member and the provider and help identify potential challenges or risk elements to a member’s health, such as nutritional challenges and health education shortcomings. MemberConnections representatives contact new members by phone or mail to discuss managed care, the Medicaid program and our services. Our MemberConnections representatives make home visits, conduct educational programs and represent our health plans at community events such as health fairs.
|
|
Ÿ
|
Thumbs Up Johnnie Health Initiatives for Children
is aimed at educating child members on a variety of health topics. Our health plans are reaching out directly to children with newsletters, contests and other innovative events, such as readings with the author of “The Adventures of Thumbs Up Johnnie” series of books. Thumbs Up Johnnie has developed two programs: preventive obesity and asthma. Obesity rates for children doubled in the past two decades and tripled for adolescents during the same period. Preventive obesity focuses on the childhood obesity epidemic with educational information encouraging proper eating and exercise habits. We have sponsored the creation of a book with author Michelle Bain titled "Thumbs Up Johnnie & the SUPER Centeam 5 - Adventures Through FITROPOLIS!" which is intended to educate children on the importance of living an active and healthy life as well as a kid’s cookbook entitled “SUPER Centeam 5 Cookbook”and a teen book entitled “Off the Chain”. Thumbs Up Johnnie’s focus on asthma has resulted in the creation of the book “Asthma: The Adventures from Puffletown” which educates children about how to manage their asthma. This book received the 2010 National Health Information Award Silver Medal.
|
|
Ÿ
|
Health Passport
is a leading-edge, patient-centric electronic community health record for foster care children in the state of Texas. Passport collects patient demographic data, clinician visit records, dispensed medications, vital sign history, lab results, allergy charts, and immunization data. Providers can directly input additional or updated patient data and documentation into the Passport. All information is accessible anywhere, anytime to all authorized users, including health plan staff, greatly facilitating coordinated care among providers. In 2010, we expanded the Health Passport to our behavioral health program in Arizona.
|
|
Ÿ
|
Fluvention
is an outreach program aimed at educating members on preventing the transmission of the influenza virus by encouraging members to get the seasonal influenza vaccines and take everyday precautions to prevent illness. We use an integrated communications approach including direct mail, phone calls, providing information via health plan websites and posting information in provider offices. The health plans also conduct general community awareness through public service announcements on television and radio. Beginning in 2009, we targeted education efforts related to health hygiene, preventative care and the benefits of obtaining appropriate care of their condition, for groups that are at higher-risk for contracting both the traditional and H1N1 influenza viruses, including pregnant women, children from six months old up to 24-year-old adults, as well as adults with chronic health conditions. Incentives in the form of gift cards were given to members who received both flu vaccines.
|
|
Ÿ
|
EPSDT Case Management
is a preventive care program designed to educate our members on the benefits of Early and Periodic Screening, Diagnosis and Treatment, or EPSDT, services. We have a systematic program of communicating, tracking, outreach, reporting and follow-through that promotes state EPSDT programs.
|
|
Ÿ
|
Life and Health Management Programs
are designed to help members understand their disease and treatment plan and improve their wellness in a cost effective manner. These programs address medical conditions that are common within the Medicaid population such as asthma, diabetes and pregnancy. Our Specialty Services segment manages many of our life and health management programs. Our ABD program uses a proprietary assessment tool that effectively identifies barriers to care, unmet functional needs, available social supports and the existence of behavioral health conditions that impede a member’s ability to maintain a proper health status. Care coordinators develop individual care plans with the member and healthcare providers ensuring the full integration of behavioral, social and acute care services. These care plans, while specific to an ABD member, incorporate “Condition Specific” practices in collaboration with physician partners and community resources.
|
Providers
For each of our service areas, we establish a provider network consisting of primary and specialty care physicians, hospitals and ancillary providers. As of December 31, 2010, the health plans we currently operate contracted with the following number of physicians and hospitals:
|
Primary Care
Physicians
|
Specialty Care
Physicians
|
Hospitals
|
||||||||||
|
Arizona
|
1,256 | 2,966 | 25 | |||||||||
|
Florida
|
1,785 | 4,290 | 78 | |||||||||
|
Georgia
|
3,056 | 9,831 | 122 | |||||||||
|
Indiana
|
1,036 | 5,443 | 97 | |||||||||
|
Massachusetts
|
1,937 | 6,676 | 35 | |||||||||
|
Ohio
|
2,000 | 8,537 | 122 | |||||||||
|
South Carolina
|
1,519 | 4,501 | 34 | |||||||||
|
Texas
|
8,885 | 21,671 | 400 | |||||||||
|
Wisconsin
|
2,451 | 6,655 | 76 | |||||||||
|
Total
|
23,925 | 70,570 | 989 | |||||||||
Our network of primary care physicians is a critical component in care delivery, management of costs and the attraction and retention of new members. Primary care physicians include family and general practitioners, pediatricians, internal medicine physicians and obstetricians and gynecologists. Specialty care physicians provide medical care to members generally upon referral by the primary care physicians. Specialty care physicians include, but are not limited to, orthopedic surgeons, cardiologists and otolaryngologists. We also provide education and outreach programs to inform and assist members in accessing quality, appropriate healthcare services.
Our health plans facilitate access to healthcare services for our members primarily through contracts with our providers. Our contracts with primary and specialty care physicians and hospitals usually are for one to two-year periods and renew automatically for successive one-year terms, but generally are subject to termination by either party upon 90 to 120 days prior written notice. In the absence of a contract, we typically pay providers at state Medicaid reimbursement levels. We pay hospitals under a variety of methods, including fee-for-services, per diems, diagnostic related groups and case rates. We pay physicians under a fee-for-service, capitation arrangement, or risk-sharing arrangement.
|
Ÿ
|
Under our fee-for-service contracts with physicians, particularly specialty care physicians, we pay a negotiated fee for covered services. This model is characterized as having no financial risk for the physician. In addition, this model requires management oversight because our total cost may increase as the units of services increase or as more expensive services replace less expensive services. We have prior authorization procedures in place that are intended to make sure that certain high cost diagnostic and other services are medically appropriate.
|
|
Ÿ
|
Under our capitated contracts, primary care physicians are paid a monthly fee for each of our members assigned to his or her practice for all ambulatory care. In return for this payment, these physicians provide all primary care and preventive services, including primary care office visits and EPSDT services, and are at risk for all costs associated with such services. If these physicians also provide non-capitated services to their assigned members, they may receive payment under fee-for-service arrangements at standard Medicaid rates.
|
|
Ÿ
|
Under risk-sharing arrangements, physicians are paid under a capitated or fee-for-service arrangement. The arrangement, however, contains provisions for additional bonus to the physicians or reimbursement from the physicians based upon cost and quality factors. We often refer to these arrangements as Model 1 contracts.
|
We work with physicians to help them operate efficiently by providing financial and utilization information, physician and patient educational programs and disease and medical management programs. Our programs are also designed to help the physicians coordinate care outside of their offices. In addition, we are governed by state prompt payment policies.
We believe our collaborative approach with physicians gives us a competitive advantage in entering new markets. Our physicians serve on local committees that assist us in implementing preventive care programs, managing costs and improving the overall quality of care delivered to our members, while also simplifying the administrative burdens on our providers. This approach has enabled us to strengthen our provider networks through improved physician recruitment and retention that, in turn, have helped to increase our membership base. The following are among the services we provide to support physicians:
|
Ÿ
|
Customized Utilization Reports
provide certain of our contracted physicians with information that enables them to run their practices more efficiently and focuses them on specific patient needs. For example, quarterly detail reports update physicians on their status within their risk pools. Equivalency reports provide physicians with financial comparisons of capitated versus fee-for-service arrangements.
|
|
Ÿ
|
Case Management Support
helps the physician coordinate specialty care and ancillary services for patients with complex conditions and direct members to appropriate community resources to address both their health and socio-economic needs.
|
|
Ÿ
|
Web-based Claims and Eligibility Resources
have been implemented to provide physicians with on-line access to perform claims and eligibility inquiries.
|
Our contracted physicians also benefit from several of the services offered to our members, including the MemberConnections, EPSDT case management and health management programs. For example, the MemberConnections staff facilitates doctor/patient relationships by connecting members with physicians, the EPSDT programs encourage routine checkups for children with their physicians and the health management programs assist physicians in managing their patients with chronic disease.
Where appropriate, our health plans contract with our specialty services organizations to provide services and programs such as behavioral health, life and health management, managed vision, telehealth services and pharmacy benefits management. When necessary, we also contract with third-party providers on a negotiated fee arrangement for physical therapy, home healthcare, diagnostic laboratory tests, x-ray examinations, ambulance services and durable medical equipment. Additionally, we contract with dental vendors in markets where routine dental care is a covered benefit.
Quality Management
Our medical management programs focus on improving quality of care in areas that have the greatest impact on our members. We employ strategies, including health management and complex case management, that are adjusted for implementation in our individual markets by a system of physician committees chaired by local physician leaders. This process promotes physician participation and support, both critical factors in the success of any clinical quality improvement program.
We have implemented specialized information systems to support our medical quality management activities. Information is drawn from our data warehouse, clinical databases and our membership and claims processing system to identify opportunities to improve care and to track the outcomes of the interventions implemented to achieve those improvements. Some examples of these intervention programs include:
|
Ÿ
|
appropriate leveling of care for neonatal intensive care unit hospital admissions, other inpatient hospital admissions, and observation admissions, in accordance with Interqual criteria;
|
|
Ÿ
|
tightening of our pre-authorization list and more stringent review of durable medical equipment and injectibles;
|
|
Ÿ
|
emergency department, or ED, program designed to collaboratively work with hospitals to steer non-emergency care away from the costly ED setting (through patient education, on-site alternative urgent care settings, etc.);
|
|
Ÿ
|
increase emphasis on case management and clinical rounding where case managers are nurses or social workers who are employed by the health plan to assist selected patients with the coordination of healthcare services in order to meet a patient's specific healthcare needs;
|
|
Ÿ
|
incorporation of disease management, which is a comprehensive, multidisciplinary, collaborative approach to chronic illnesses such as asthma and diabetes; and
|
|
Ÿ
|
Start Smart For Your Baby, a prenatal case management program aimed at helping women with high-risk pregnancies deliver full-term, healthy infants.
|
We provide reporting on a regular basis using our data warehouse. State and Health Employer Data and Information Set, or HEDIS, reporting constitutes the core of the information base that drives our clinical quality performance efforts. This reporting is monitored by Plan Quality Improvement Committees and our corporate medical management team.
In an effort to ensure the quality of our provider networks, we undertake to verify the credentials and background of our providers using standards that are supported by the National Committee for Quality Assurance.
Information Technology
The ability to access data and translate it into meaningful information is essential to operating across a multi-state service area in a cost-effective manner. Our centralized information systems, which are located in St. Louis, Missouri, support our core processing functions under a set of integrated databases and are designed to be both replicable and scalable to accommodate organic growth and growth from acquisitions. We continue to enhance our systems in order to leverage the platform we have developed for our existing states for configuration into new states or health plan acquisitions.
Our predictive modeling technology enables the medical management operations to proactively case and disease manage specific high risk members. It can recommend medical care opportunities using a mix of company defined algorithms and evidence based medical guidelines. Interventions are determined by the clinical indicators, the ability to improve health outcomes, and the risk profile of members.
Our integrated approach helps to assure that consistent sources of claim and member information are provided across all of our health plans. Our membership and claims processing system is capable of expanding to support additional members in an efficient manner. We have a disaster recovery and business resumption plan developed and implemented in conjunction with a third party. This plan allows us complete access to the business resumption centers and hot-site facilities provided under the business resumption plan.
SPECIALTY SERVICES
Our specialty services are a key component of our healthcare enterprise and complement our core Medicaid Managed Care business. Specialty services diversify our revenue stream, provide higher quality health outcomes to our membership and others, and assist in controlling costs. Our specialty services are provided primarily through the following businesses:
|
Ÿ
|
Behavioral Health.
Cenpatico Behavioral Health, or Cenpatico, manages behavioral healthcare for members via a contracted network of providers. Cenpatico works with providers to determine the best services to help people overcome mental illness and lead productive lives. Our networks feature a full range of services and levels of care to help people with mental illness reach their recovery and wellness goals. In addition, we operate school-based programs in Arizona that focus on students with special needs and also provide speech and other therapy services. We acquired Cenpatico in 2003.
|
|
Ÿ
|
Individual and State Sponsored Health Insurance Exchanges.
Celtic Insurance Company, or Celtic, is a national healthcare provider licensed in 49 states offering high-quality, affordable health insurance to individual customers and their families. Sold online and through independent insurance agents nationwide, Celtic’s portfolio of major medical plans is designed to meet the diverse needs of the uninsured at all budget and benefit levels. Celtic also offers a standalone guaranteed-issue medical conversion program to self-funded employer groups, stop-loss and fully-insured group carriers, managed care plans, and HMO reinsurers. We acquired Celtic in July 2008. In 2009, CeltiCare of Massachusetts was formed to provide state sponsored health insurance to the uninsured who do not qualify for Medicaid. In 2010, NovaSys Health LLC was acquired to add both TPA and PPO network capabilities.
|
|
Ÿ
|
Life and Health Management.
Nurtur Health, Inc. (Nurtur) specializes in implementing life and health management programs that encourage healthy behaviors, promote healthier workplaces, improve workforce and societal productivity and reduce healthcare costs. Health risk appraisals, biometric screenings, online and telephonic wellness programs, disease management and work-life/employee assistance services are areas of focus. Nurtur Health uses telephonic health and work/life balance coaching, in-home and online interaction and informatics processes to deliver effective clinical outcomes, enhanced patient-provider satisfaction and overall healthcare cost. Nurtur was formed in December 2007 through the combination of three
entities we acquired from July 2005 through November 2007.
|
|
Ÿ
|
Long-term Care and Acute Care.
Bridgeway Health Solutions, or Bridgeway, provides long-term care services to the elderly and people with disabilities that meet income and resources requirements who are at risk of being or are institutionalized. Bridgeway has long-term care members in the Maricopa, Yuma and La Paz counties of Arizona. Bridgeway participates with community groups to address situations that might be barriers to quality care and independent living. Bridgeway commenced long-term care operations in 2006. Bridgeway also provides acute care services to members in the Yavapai county of Arizona. These services include emergency and physician and hospitalization services, limited dental and rehabilitative services and other maternal and child health services. Bridgeway commenced acute care operations in October 2008.
|
|
Ÿ
|
Managed Vision.
OptiCare administers routine and medical surgical eye care benefits via its own contracted national network of eye care providers. OptiCare clients include Medicaid, Medicare, and commercial health plans, as well as employer groups. OptiCare has been providing vision network services for over 25 years and offers a variety of plan designs to meet the individual needs of its clients and members. We acquired the managed vision business of OptiCare Health Systems, Inc. in 2006.
|
|
Ÿ
|
Telehealth Services.
NurseWise and Nurse Response provide a toll-free nurse triage line 24 hours per day, 7 days per week, 52 weeks per year. Our members call one number and reach bilingual customer service representatives and nursing staff who provide health education, triage advice and offer continuous access to health plan functions. Additionally, our representatives verify eligibility, confirm primary care provider assignments and provide benefit and network referral coordination for members and providers after business hours. Our staff can arrange for urgent pharmacy refills, transportation and qualified behavioral health professionals for crisis stabilization assessments. Call volume is based on membership levels and seasonal variation. NurseWise commenced operations in 1998 and Nurse Response was acquired in 2006.
|
|
Ÿ
|
Pharmacy Benefits Management.
US Script offers progressive pharmacy benefits management services that are specifically designed to improve quality of care while containing costs. This is achieved through a lowest net cost strategy that helps optimize clients' pharmacy benefit. Services include claims processing, pharmacy network management, benefit design consultation, drug utilization review, formulary and rebate management, specialty and mail order pharmacy services, patient and physician intervention
.
We acquired US Script in 2006.
|
|
Ÿ
|
Care Management Software.
Casenet is a software provider of innovative care management solutions that automate the clinical, administrative and technical components of care management programs. We maintain an equity investment in Casenet and are currently implementing this new software platform which is available for sale to third parties. We acquired a controlling interest in Casenet in 2010 and present it as a consolidated subsidiary of the Company.
|
CORPORATE COMPLIANCE
Our Corporate Ethics and Compliance Program was established in 1998 and provides controls by which we further enhance operations, safeguard against fraud and abuse, improve access to quality care and help assure that our values are reflected in everything we do.
The two primary standards by which corporate compliance programs in the healthcare industry are measured are the Federal Organizational Sentencing Guidelines and the “Compliance Program Guidance” series issued by the Office of the Inspector General, or OIG, of the Department of Health and Human Services. Our program contains each of the seven elements suggested by the Sentencing Guidelines and the OIG guidance. These key components are:
|
Ÿ
|
written standards of conduct;
|
|
Ÿ
|
designation of a corporate compliance officer and compliance committee;
|
|
Ÿ
|
effective training and education;
|
|
Ÿ
|
effective lines for reporting and communication;
|
|
Ÿ
|
enforcement of standards through disciplinary guidelines and actions;
|
|
Ÿ
|
internal monitoring and auditing; and
|
|
Ÿ
|
prompt response to detected offenses and development of corrective action plans.
|
The goal of the program is to build a culture of ethics and compliance, which is assessed yearly using a diagnostic survey to measure the integrity of the organization. Our internal Corporate Compliance intranet site, accessible to all employees, contains our Business Ethics and Conduct Policy (Code of Conduct), Compliance Program description and various resources for employees to report concerns or ask questions. If needed, employees have access to the contact information for the members of the Audit Committee to report concerns. Our Ethics and Compliance Helpline is a toll-free number operated by a third party independent of the Company to allow employees or other persons to report suspected incidents of fraud, abuse or other compliance violations. The Board of Directors reviews an ethics compliance report on a quarterly basis.
COMPETITION
We continue to face varying and increasing levels of competition as we expand in our existing service areas or enter new markets, as federal regulations require at least two competitors in each service area. Healthcare reform may cause a number of commercial managed care organizations to decide to enter or exit the Medicaid market.
In our business, our principal competitors for state contracts, members and providers consist of the following types of organizations
:
|
Ÿ
|
Medicaid Managed Care Organizations
focus on providing healthcare services to Medicaid recipients. These organizations consist of national and regional organizations, as well as smaller organizations that operate in one city or state and are owned by providers, primarily hospitals.
|
|
Ÿ
|
National and Regional Commercial Managed Care Organizations
have Medicaid members in addition to members in private commercial plans. Some of these organizations offer a range of specialty services including pharmacy benefits management, behavioral health management, health management, and nurse triage call support centers.
|
|
Ÿ
|
Primary Care Case Management Programs
are programs established by the states through contracts with primary care providers. Under these programs, physicians provide primary care services to Medicaid recipients, as well as limited medical management oversight.
|
We compete with other managed care organizations and specialty companies for state contracts. In order to grant a contract, state governments consider many factors. These factors include quality of care, financial requirements, an ability to deliver services and establish provider networks and infrastructure. In addition, our specialty companies also compete with other providers, such as disease management companies, individual health insurance companies, and pharmacy benefits managers for non-governmental contracts.
We also compete to enroll new members and retain existing members. People who wish to enroll in a managed healthcare plan or to change healthcare plans typically choose a plan based on the quality of care and services offered, ease of access to services, a specific provider being part of the network and the availability of supplemental benefits.
We also compete with other managed care organizations to enter into contracts with physicians, physician groups and other providers. We believe the factors that providers consider in deciding whether to contract with us include existing and potential member volume, reimbursement rates, medical management programs, speed of reimbursement and administrative service capabilities. See “Risk Factors — Competition may limit our ability to increase penetration of the markets that we serve.”
REGULATION
Our Medicaid, Medicare and Specialty operations are regulated at both state and federal levels. Government regulation of the provision of healthcare products and services is a changing area of law that varies from jurisdiction to jurisdiction. Regulatory agencies generally have discretion to issue regulations and interpret and enforce laws and rules. Changes in applicable laws and rules also may occur periodically.
Our regulated subsidiaries are licensed to operate as health maintenance organizations and/or insurance companies in their respective states. In each of the jurisdictions in which we operate, we are regulated by the relevant health, insurance and/or human services departments that oversee the activities of managed care organizations providing or arranging to provide services to Medicaid enrollees.
The process for obtaining authorization to operate as a managed care organization is complex and requires us to demonstrate to the regulators the adequacy of the health plan’s organizational structure, financial resources, utilization review, quality assurance programs, complaint procedures, provider network and procedures for covering emergency medical conditions. Under both state managed care organization statutes and state insurance laws, our health plan subsidiaries, as well as our specialty companies, must comply with minimum statutory capital and other financial requirements, such as deposit and reserve requirements. Insurance regulations may also require prior state approval of acquisitions of other managed care organization businesses and the payment of dividends, as well as notice for loans or the transfer of funds. Our subsidiaries are also subject to periodic state and federal reporting requirements. In addition, each health plan and individual health insurance provider must meet criteria to secure the approval of state regulatory authorities before implementing operational changes, including the development of new product offerings and, in some states, the expansion of service areas.
States have adopted a number of regulations that may affect our business and results of operations. These regulations in certain states include:
|
Ÿ
|
premium taxes or similar assessments;
|
|
Ÿ
|
stringent prompt-pay laws;
|
|
Ÿ
|
disclosure requirements regarding provider fee schedules and coding procedures; and
|
|
Ÿ
|
programs to monitor and supervise the activities and financial solvency of provider groups.
|
We are regulated as an insurance holding company and are subject to the insurance holding company acts of the states in which our insurance company and HMO subsidiaries are domiciled. These acts contain certain reporting requirements as well as restrictions on transactions between an insurer or HMO and its affiliates. These holding company laws and regulations generally require insurance companies and HMOs within an insurance holding company system to register with the insurance department of each state where they are domiciled and to file with those states’ insurance departments certain reports describing capital structure, ownership, financial condition, certain intercompany transactions and general business operations. In addition, various notice and reporting requirements generally apply to transactions between insurance companies and HMOs and their affiliates within an insurance holding company system, depending on the size and nature of the transactions. Some insurance holding company laws and regulations require prior regulatory approval or, in certain circumstances, prior notice of certain material intercompany transfers of assets as well as certain transactions between insurance companies, HMOs, their parent holding companies and affiliates. Among other provisions, state insurance and HMO laws may restrict the ability of our regulated subsidiaries to pay dividends.
Additionally, the holding company acts of the states in which our subsidiaries are domiciled restrict the ability of any person to obtain control of an insurance company or HMO without prior regulatory approval. Under those statutes, without such approval (or an exemption), no person may acquire any voting security of an insurance holding company, which controls an insurance company or HMO, or merge with such a holding company, if as a result of such transaction such person would “control” the insurance holding company. “Control” is generally defined as the direct or indirect power to direct or cause the direction of the management and policies of a person and is presumed to exist if a person directly or indirectly owns or controls 10% or more of the voting securities of another person.
State Contracts
In addition to being a licensed health maintenance organization, in order to be a Medicaid Managed Care organization in each of the states in which we operate, we must operate under a contract with the state’s Medicaid agency. States generally use either a formal proposal process, reviewing a number of bidders, or award individual contracts to qualified applicants that apply for entry to the program. We receive monthly payments based on specified capitation rates determined on an actuarial basis. These rates differ by membership category and by state depending on the specific benefits and policies adopted by each state.
Our state contracts and the regulatory provisions applicable to us generally set forth the requirements for operating in the Medicaid sector, including provisions relating to:
|
Ÿ
|
eligibility, enrollment and disenrollment processes;
|
Ÿ
|
health education and wellness and prevention programs;
|
|
Ÿ
|
covered services;
|
Ÿ
|
timeliness of claims payment;
|
|
Ÿ
|
eligible providers;
|
Ÿ
|
financial standards;
|
|
Ÿ
|
subcontractors;
|
Ÿ
|
safeguarding of member information;
|
|
Ÿ
|
record-keeping and record retention;
|
Ÿ
|
fraud and abuse detection and reporting;
|
|
Ÿ
|
periodic financial and informational reporting;
|
Ÿ
|
grievance procedures; and
|
|
Ÿ
|
quality assurance;
|
Ÿ
|
organization and administrative systems.
|
|
Ÿ
|
accreditation;
|
A health plan or individual health insurance provider’s compliance with these requirements is subject to monitoring by state regulators and by CMS. A health plan is also subject to periodic comprehensive quality assurance evaluations by a third-party reviewing organization and generally by the insurance department of the jurisdiction that licenses the health plan. A health plan or individual health insurance provider must also submit reports to various regulatory agencies, including quarterly and annual statutory financial statements and utilization reports.
The table below sets forth the term of our state contracts and provides details regarding related renewal or extension and termination provisions as of December 31, 2010. The contracts are subject to termination by the state for cause, an event of default or lack of funding.
|
State Contract
|
|
Expiration Date
|
|
Renewal or Extension by the State
|
|
|
Arizona – Acute Care
|
September 30, 2011
|
May be extended for up to two additional one-year terms.
|
|||
|
Arizona – Behavioral Health
|
June 30, 2013
|
Renewable for two additional one-year terms.
|
|||
|
Arizona – Long-term Care
|
September 30, 2011
|
Renewable through the state’s reprocurement process.
|
|||
|
Arizona – Special Needs Plan (Medicare)
|
December 31, 2011
|
Renewable annually for successive 12-month periods.
|
|||
|
Florida – Medicaid & ABD
|
August 31, 2012
|
Renewable through the state’s recertification process.
|
|||
|
Florida – Long-term Care
|
August 31, 2011
|
Renewable through the state’s recertification process.
|
|||
|
Georgia – Medicaid & CHIP
|
June 30, 2011
|
Renewable for three additional one-year terms.
|
|||
|
Indiana – Medicaid & CHIP
|
December 31, 2014
|
Renewable for two additional one-year terms.
|
|||
|
Kansas – Behavioral Health
|
June 30, 2011
|
May be extended for up to one additional one-year term.
|
|||
|
Massachusetts – Commonwealth Care
|
June 30, 2011
|
Renewable through the state’s recertification process.
|
|||
|
Massachusetts – Commonwealth Care Bridge
|
June 30, 2011
|
May be extended for up to three additional one-year terms.
|
|||
|
Mississippi – ABD
|
December 31, 2013
|
Renewable through the state’s recertification process.
|
|||
|
Ohio – Medicaid, CHIP & ABD
|
June 30, 2011
|
Renewable annually for successive 12-month periods.
|
|||
|
Ohio – Special Needs Plan (Medicare)
|
December 31, 2011
|
Renewable annually for successive 12-month periods.
|
|||
|
South Carolina – Medicaid & ABD
|
March 31, 2012
|
May be extended for up to one additional year and subsequently renewable through the state’s recertification process.
|
|||
|
Texas – Medicaid, CHIP & ABD
|
August 31, 2013
|
Renewable through the state’s reprocurement process.
1
|
|||
|
Texas – CHIP Rural Service Area
|
August 31, 2013
|
May be extended for up to five additional years.
|
|||
|
Texas – Foster Care
|
August 31, 2012
|
May be extended for up to three and a half additional years.
|
|||
|
Texas – Special Needs Plan (Medicare)
|
December 31, 2011
|
Renewable annually for successive 12-month periods.
|
|||
|
Wisconsin – Medicaid, CHIP & ABD
|
December 31, 2011
|
Renewable through the state’s recertification process.
|
|||
|
Wisconsin – Network Health Plan Subcontract
|
December 31, 2011
|
Renews automatically for successive five-year terms.
|
|||
|
Wisconsin – Special Needs Plan (Medicare)
|
December 31, 2011
|
Renewable annually for successive 12-month periods.
|
1
The Texas Medicaid, CHIP and ABD contract is currently subject to renewal under the state’s reprocurement process effective March 1, 2012.
HIPAA and HITECH
In 1996, Congress enacted the Health Insurance Portability and Accountability Act, or HIPAA. The Act is designed to improve the portability and continuity of health insurance coverage, simplify the administration of health insurance transactions and ensure the privacy and security of individual’s information. Among the main requirements of HIPAA are the “Administrative Simplification” provisions which include: standards for processing health insurance claims and related transactions (Transactions Standards); requirements for protecting the privacy and security of medical records and other personal health information (Privacy Rule); and standards and specifications for safeguarding personal health information which is maintained, stored or transmitted in electronic format (Security Rule). The Health Information Technology for Economic and Clinical Health (HITECH) Act, which was enacted as part of the American Reinvestment and Recovery Act of 2009, amended certain provisions of HIPAA and introduced new data security obligations for covered entities and their business associates. HITECH also mandated individual notification in instances of data breach, provided enhanced penalties for HIPAA violations, and granted enforcement authority to states’ Attorneys General in addition to the HHS Office of Civil Rights.
The Privacy and Security Rules and HITECH enhancements establish requirements to protect the privacy of medical records and other personal health information maintained and used by healthcare providers, health plans, healthcare clearinghouses, and their business associates. Among numerous other requirements, the privacy regulations:
|
Ÿ
|
limit certain uses and disclosures of private health information, and require patient authorizations for such uses and disclosures of private health information;
|
|
Ÿ
|
guarantee patients the right to access their health information and to know who else has accessed it;
|
|
Ÿ
|
limit most disclosure of health information to the minimum needed for the intended purpose;
|
|
Ÿ
|
establish procedures to ensure the protection of private health information;
|
|
Ÿ
|
authorize access to records by researchers and others;
|
|
Ÿ
|
establish requirements for breach notification; and
|
|
Ÿ
|
impose criminal and civil sanctions for improper uses or disclosures of health information.
|
The Security Rule requires healthcare providers, health plans, healthcare clearinghouses, and their business associates to implement administrative, physical and technical safeguards to ensure the privacy and confidentiality of personal health information when it is electronically stored, maintained or transmitted. The HITECH Act established a federal requirement for notification when the security of personal health information is breached. In addition there is a patchwork of states laws that have been adopted to provide for, among other things, private rights of action for breaches of data security and mandatory notification to persons whose identifiable information is obtained without authorization.
The requirements of the Transactions Standards apply to certain healthcare related transactions conducted using “electronic media.” Since “electronic media” is defined broadly to include “transmissions that are physically moved from one location to another using magnetic tape, disk or compact disk media,” many communications are considered to be electronically transmitted. Under HIPAA, health plans are required to have the capacity to accept and send all covered transactions in a standardized electronic format. Penalties can be imposed for failure to comply with these requirements. The transaction standards are being modified to version 5010 to prepare for the implementation of the ICD10 coding system.
The preemption provisions of HIPAA provide that the federal standards will not preempt state laws that are more stringent than the related federal requirements. In addition, the Secretary of HHS may grant exceptions allowing state laws to prevail if one or more of a number of conditions are met, including but not limited to the following:
|
Ÿ
|
the state law is necessary to prevent fraud and abuse associated with the provision of and payment for healthcare;
|
|
Ÿ
|
the state law is necessary to ensure appropriate state regulation of insurance and health plans;
|
|
Ÿ
|
the state law is necessary for state reporting on healthcare delivery or costs; or
|
|
Ÿ
|
the state law addresses controlled substances.
|
We have implemented processes, policies and procedures to comply with both HIPAA and HITECH, including administrative, technical and physical safeguards to prevent against electronic data breach. We provide education and training for employees specifically designed to help prevent any unauthorized use or access to personal health information and enhance the reporting of suspected breaches. In addition, our corporate privacy officer and health plan privacy officials serve as resources to employees to address any questions or concerns they may have.
Other Fraud and Abuse Laws
Investigating and prosecuting healthcare fraud and abuse became a top priority for state and federal law enforcement entities in the last decade. The focus of these efforts has been directed at participants in public government healthcare programs such as Medicaid. The laws and regulations relating to Medicaid fraud and abuse and the contractual requirements applicable to health plans participating in these programs are complex and changing and may require substantial resources. We are constantly looking for ways to improve our waste, fraud and abuse detection methods. We have both prospective and retrospective processes to identify abusive patterns and fraudulent billing.
EMPLOYEES
As of December 31, 2010, we had approximately 4,200 employees. None of our employees are represented by a union. We believe our relationships with our employees are good.
EXECUTIVE OFFICERS OF THE REGISTRANT
The following table sets forth information regarding our executive officers, including their ages, at February 10, 2011:
|
Name
|
|
Age
|
|
Position
|
|
Michael F. Neidorff
|
|
68
|
|
Chairman and Chief Executive Officer
|
|
Karen A. Bedell
|
51
|
Senior Vice President, New Business Integration & Development
|
||
|
Mark W. Eggert
|
49
|
Executive Vice President, Health Plan Business Unit
|
||
|
Carol E. Goldman
|
|
53
|
|
Executive Vice President and Chief Administrative Officer
|
|
Jason M. Harrold
|
41
|
Senior Vice President, Specialty Business Unit
|
||
|
Jesse N. Hunter
|
35
|
Executive Vice President, Corporate Development
|
||
|
Donald G. Imholz
|
58
|
Executive Vice President and Chief Information Officer
|
||
|
Edmund E. Kroll
|
51
|
Senior Vice President, Finance and Investor Relations
|
||
|
Mary V. Mason
|
42
|
Senior Vice President and Chief Medical Officer
|
||
|
William N. Scheffel
|
|
57
|
|
Executive Vice President, Chief Financial Officer and Treasurer
|
|
Jeffrey A. Schwaneke
|
35
|
Vice President, Corporate Controller and Chief Accounting Officer
|
||
|
Keith H. Williamson
|
58
|
Senior Vice President, Secretary and General Counsel
|
Michael F. Neidorff.
Mr. Neidorff has served as our Chairman and Chief Executive Officer since May 2004. From May 1996 to May 2004, Mr. Neidorff served as President, Chief Executive Officer and as a member of our Board of Directors. From 1995 to 1996, Mr. Neidorff served as a Regional Vice President of Coventry Corporation, a publicly-traded managed care organization, and as the President and Chief Executive Officer of one of its subsidiaries, Group Health Plan, Inc. From 1985 to 1995, Mr. Neidorff served as the President and Chief Executive Officer of Physicians Health Plan of Greater St. Louis, a subsidiary of United Healthcare Corp., a publicly-traded managed care organization now known as UnitedHealth Group Incorporated. Mr. Neidorff also serves as a director of Brown Shoe Company, Inc., a publicly-traded footwear company with global operations.
Karen H. Bedell. Ms. Bedell has served as our Senior Vice President, New Business Integration & Development since May 2010. From 2007 to 2009, Ms. Bedell served as Vice President and General Manager for DRS Marlo Coil, a manufacturer of heat transfer systems. From 2003 to 2007, Ms. Bedell served as Senior Vice President, Marketing and Strategic Planning for Engineered Support Systems, Inc.
Mark W. Eggert
. Mr. Eggert has served as our Executive Vice President, Health Plan Business Unit since November 2007. From January 1999 to November 2007, Mr. Eggert served as the Associate Vice Chancellor and Deputy General Counsel at Washington University, where he oversaw the legal affairs of the School of Medicine.
Carol E. Goldman.
Ms. Goldman has served as Executive Vice President and Chief Administrative Officer since June 2007. From July 2002 to June 2007, she served as our Senior Vice President, Chief Administrative Officer. From September 2001 to July 2002, Ms. Goldman served as our Plan Director of Human Resources. From 1998 to August 2001, Ms. Goldman was Human Resources Manager at Mallinckrodt Inc., a medical device and pharmaceutical company.
Jason M. Harrold.
Mr. Harrold has served as our Senior Vice President, Specialty Business Unit since August 2009. He served as President of OptiCare from July 2000 to August 2009. From July 1996 to July 2000, Mr. Harrold held various positions of increasing responsibility at OptiCare including Vice President of Operations and Chief Operating Officer.
Jesse N. Hunter.
Mr. Hunter has served as our Executive Vice President, Corporate Development since April 2008. He served as our Senior Vice President, Corporate Development from April 2007 to April 2008. He served as our Vice President, Corporate Development from December 2006 to April 2007. From October 2004 to December 2006, he served as our Vice President, Mergers & Acquisitions. From July 2003 until October 2004, he served as the Director of Mergers & Acquisitions and from February 2002 until July 2003, he served as the Manager of Mergers & Acquisitions.
Donald G. Imholz.
Mr. Imholz has served as our Executive Vice President and Chief Information Officer since December 2009. Mr. Imholz served as our Senior Vice President and Chief Information Officer from September 2008 to December 2009. From January 2008 to September 2008, Mr. Imholz was an independent consultant working for clients across a variety of industries. From January 1975 to January 2008, Mr. Imholz was with The Boeing Company and served as Vice President of Information Technology from 2002 to January 2008. In that role, Mr. Imholz was responsible for all application development and support worldwide.
Edmund E. Kroll.
Mr. Kroll has served as our Senior Vice President, Finance and Investor Relations since May 2007. From June 1997 to November 2006, Mr. Kroll served as Managing Director at Cowen and Company LLC, where his research coverage focused on the managed care industry, including the Company.
Dr. Mary V. Mason.
Dr. Mason has served as our Senior Vice President and Chief Medical Officer since March 2007. From April 2006 to February 2007, she served as our Vice President, Medical Affairs – Health Plans. From January 2006 to April 2006 she served as our National Medical Director.
William N. Scheffel
. Mr. Scheffel has served as our Executive Vice President, Chief Financial Officer and Treasurer since May 2009. He served as our Executive Vice President, Specialty Business Unit from June 2007 to May 2009. From May 2005 to June 2007, he served as our Senior Vice President, Specialty Business Unit. From December 2003 until May 2005, he served as our Senior Vice President and Controller. From July 2002 to October 2003, Mr. Scheffel was a partner with Ernst & Young LLP. From 1975 to July 2002, Mr. Scheffel was with Arthur Andersen LLP.
Jeffrey A. Schwaneke.
Mr. Schwaneke has served as our Vice President, Corporate Controller since July 2008 and Chief Accounting Officer since September 2008. He previously served as Vice President, Controller and Chief Accounting Officer at Novelis Inc. from October 2007 to July 2008, and Assistant Corporate Controller from May 2006 to September 2007. Mr. Schwaneke served as Segment Controller for SPX Corporation from January 2005 to April 2006. Mr. Schwaneke served as Corporate Controller at Marley Cooling Technologies, a segment of SPX Corporation, from March 2004 to December 2004 and Director of Financial Reporting from November 2002 to February 2004.
Keith H. Williamson
. Mr. Williamson has served as our Senior Vice President, General Counsel since November 2006 and as our Secretary since February 2007. From 1988 until November 2006, he served at Pitney Bowes Inc. in various legal and executive roles, the last seven years as a Division President. Mr. Williamson also serves as a director of PPL Corporation, a publicly-traded energy and utility holding company.
Available Information
We are subject to the reporting and information requirements of the Securities Exchange Act of 1934, as amended (Exchange Act) and, as a result, we file periodic reports and other information with the Securities and Exchange Commission, or SEC. We make these filings available on our website free of charge, the URL of which is http://www.centene.com, as soon as reasonably practicable after we electronically file such material with, or furnish it to, the SEC. The SEC maintains a website (http://www.sec.gov) that contains our annual, quarterly and current reports and other information we file electronically with the SEC. You can read and copy any materials we file with the SEC at the SEC’s Public Reference Room at 100 F Street, N.E., Room 1850, Washington, D.C. 20549. You may obtain information on the operation of the Public Reference Room by calling the SEC at 1-800-SEC-0330. Information on our website does not constitute part of this Annual Report on Form 10-K.
FACTORS THAT MAY AFFECT FUTURE RESULTS AND THE
TRADING PRICE OF OUR COMMON STOCK
You should carefully consider the risks described below before making an investment decision. The trading price of our common stock could decline due to any of these risks, in which case you could lose all or part of your investment. You should also refer to the other information in this filing, including our consolidated financial statements and related notes. The risks and uncertainties described below are those that we currently believe may materially affect our Company. Additional risks and uncertainties that we are unaware of or that we currently deem immaterial also may become important factors that affect our Company.
Risks Related to Being a Regulated Entity
Reduction in Medicaid, CHIP and ABD funding could substantially reduce our profitability.
Most of our revenues come from Medicaid, CHIP and ABD premiums. The base premium rate paid by each state differs, depending on a combination of factors such as defined upper payment limits, a member’s health status, age, gender, county or region, benefit mix and member eligibility categories. Future levels of Medicaid, CHIP and ABD funding and premium rates may be affected by continuing government efforts to contain healthcare costs and may further be affected by state and federal budgetary constraints.
States periodically consider reducing or reallocating the amount of money they spend for Medicaid, CHIP, Foster Care and ABD. The current adverse economic conditions have, and are expected to continue to, put pressures on state budgets as tax and other state revenues decrease while the Medicaid eligible population increases, creating more need for funding. We anticipate this will require government agencies with whom we contract to find funding alternatives, which may result in reductions in funding for current programs and program expansions, contraction of covered benefits, limited or no premium rate increases or premium decreases. In recent years, the majority of states have implemented measures to restrict Medicaid, CHIP, Foster Care and ABD costs and eligibility. If any state in which we operate were to decrease premiums paid to us, or pay us less than the amount necessary to keep pace with our cost trends, it could have a material adverse effect on our revenues and operating results.
In March 2010, the Patient Protection and Affordable Care Act and the accompanying Health Care and Education Affordability Reconciliation Act were enacted. The Acts permit states to expand Medicaid to all individuals under age 65 with incomes up to 133% of the federal poverty level beginning April 1, 2010 and requires this expansion by January 1, 2014. Additional federal funds will be provided to states in 2014, but the amount of the federal support decreases each year. We cannot predict when the states will make these expansions. Further, because the states have to pay for a portion of the care, states may reduce our rates in order to afford the additional beneficiaries.
The American Reinvestment and Recovery Act of 2009, which was signed into law on February 17, 2009, provides $87 billion in additional federal Medicaid funding for states’ Medicaid expenditures between October 1, 2008 and December 31, 2010. States meeting certain eligibility requirements will temporarily receive additional money in the form of an increase in the federal medical assistance percentage (FMAP). Thus, for a limited period of time, the share of Medicaid costs that are paid for by the federal government will go up, and each state’s share will go down. On August 10, 2010, a six-month extension of the enhanced match funding law was signed, such that the enhanced match, at a reduced level, will continue until June 30, 2011. We cannot predict whether states are, or will remain, eligible to receive the additional federal Medicaid funding, or whether the states will have sufficient funds for their Medicaid programs.
Changes to Medicaid, CHIP, Foster Care and ABD programs could reduce the number of persons enrolled in or eligible for these programs, reduce the amount of reimbursement or payment levels, or increase our administrative or healthcare costs under these programs, all of which could have a negative impact on our business.
Recent legislation generally requires that eligibility levels be maintained, but this could cause states to reduce reimbursement or reduce benefits in order to afford to maintain eligibility levels.
We believe that reductions in Medicaid, CHIP, Foster Care and ABD payments could substantially reduce our profitability. Further, our contracts with the states are subject to cancellation by the state after a short notice period in the event of unavailability of state funds.
If we are unable to participate in CHIP programs, our growth rate may be limited.
CHIP is a federal initiative designed to provide coverage for low-income children not otherwise covered by Medicaid or other insurance programs. The programs vary significantly from state to state. Participation in CHIP programs is an important part of our growth strategy. If states do not allow us to participate or if we fail to win bids to participate, our growth strategy may be materially and adversely affected.
If CHIP is not reauthorized or states face shortfalls, our business could suffer.
Federal support for CHIP has been authorized through 2019,
with funding authorized through 2015
. We cannot be certain that funding for CHIP will be reauthorized when current funding expires in 2015. Thus, we cannot predict the impact that reauthorization will have on our business.
States receive matching funds from the federal government to pay for their CHIP programs which have a per state annual cap. Because of funding caps, there is a risk that states could experience shortfalls in future years, which could have an impact on our ability to receive amounts owed to us from states in which we have CHIP contracts.
If any of our state contracts are terminated or are not renewed, our business will suffer.
We provide managed care programs and selected services to individuals receiving benefits under federal assistance programs, including Medicaid, CHIP and ABD. We provide those healthcare services under contracts with regulatory entities in the areas in which we operate. Our contracts with various states are generally intended to run for one or two years and may be extended for one or two additional years if the state or its agent elects to do so. Our current contracts are set to expire or renew between June 30, 2011 and December 31, 2014. When our contracts expire, they may be opened for bidding by competing healthcare providers. There is no guarantee that our contracts will be renewed or extended. For example, on
April 12, 2010, the Wisconsin Department of Health Services notified us that our Wisconsin subsidiary was not awarded a Southeast Wisconsin BadgerCare Plus Managed Care contract. While we will continue to serve other regions of the state, we transitioned the affected members to other plans by November 1, 2010.
Further, our contracts with the states are subject to cancellation by the state after a short notice period in the event of unavailability of state funds. For example, the Indiana contract under which we operate can be terminated by the State without cause. Our contracts could also be terminated if we fail to perform in accordance with the standards set by state regulatory agencies. If any of our contracts are terminated, not renewed, renewed on less favorable terms, or not renewed on a timely basis, our business will suffer, and our financial position, results of operations or cash flows may be materially affected.
Changes in government regulations designed to protect the financial interests of providers and members rather than our investors could force us to change how we operate and could harm our business.
Our business is extensively regulated by the states in which we operate and by the federal government. The applicable laws and regulations are subject to frequent change and generally are intended to benefit and protect the financial interests of health plan providers and members rather than investors. The enactment of new laws and rules or changes to existing laws and rules or the interpretation of such laws and rules could, among other things:
• force us to restructure our relationships with providers within our network;
• require us to implement additional or different programs and systems;
• mandate minimum medical expense levels as a percentage of premium revenues;
• restrict revenue and enrollment growth;
• require us to develop plans to guard against the financial insolvency of our providers;
• increase our healthcare and administrative costs;
• impose additional capital and reserve requirements; and
• increase or change our liability to members in the event of malpractice by our providers.
Regulations may decrease the profitability of our health plans.
Certain states have enacted regulations which require us to maintain a minimum health benefits ratio, or establish limits on our profitability. Other states require us to meet certain performance and quality metrics in order to receive our full contractual revenue. In certain circumstances, our plans may be required to pay a rebate to the state in the event profits exceed established levels. These regulatory requirements, changes in these requirements or the adoption of similar requirements by other regulators may limit our ability to increase our overall profits as a percentage of revenues. Most states, including but not limited to Georgia, Indiana, Texas and Wisconsin have implemented prompt-payment laws and many states are enforcing penalty provisions for failure to pay claims in a timely manner. Failure to meet these requirements can result in financial fines and penalties. In addition, states may attempt to reduce their contract premium rates if regulators perceive our health benefits ratio as too low. Any of these regulatory actions could harm our financial position, results of operations or cash flows. Certain states also impose marketing restrictions on us which may constrain our membership growth and our ability to increase our revenues.
We face periodic reviews, audits and investigations under our contracts with state government agencies, and these audits could have adverse findings, which may negatively impact our business.
We contract with various state governmental agencies to provide managed healthcare services. Pursuant to these contracts, we are subject to various reviews, audits and investigations to verify our compliance with the contracts and applicable laws and regulations. Any adverse review, audit or investigation could result in:
• cancellation of our contracts;
• refunding of amounts we have been paid pursuant to our contracts;
• imposition of fines, penalties and other sanctions on us;
• loss of our right to participate in various markets;
• increased difficulty in selling our products and services; and
• loss of one or more of our licenses.
Failure to comply with government regulations could subject us to civil and criminal penalties.
Federal and state governments have enacted fraud and abuse laws and other laws to protect patients’ privacy and access to healthcare. In some states, we may be subject to regulation by more than one governmental authority, which may impose overlapping or inconsistent regulations. Violation of these and other laws or regulations governing our operations or the operations of our providers could result in the imposition of civil or criminal penalties, the cancellation of our contracts to provide services, the suspension or revocation of our licenses or our exclusion from participating in the Medicaid, CHIP, Foster Care and ABD programs. If we were to become subject to these penalties or exclusions as the result of our actions or omissions or our inability to monitor the compliance of our providers, it would negatively affect our ability to operate our business.
HIPAA broadened the scope of fraud and abuse laws applicable to healthcare companies. HIPAA created civil penalties for, among other things, billing for medically unnecessary goods or services. HIPAA established new enforcement mechanisms to combat fraud and abuse, including civil and, in some instances, criminal penalties for failure to comply with specific standards relating to the privacy, security and electronic transmission of most individually identifiable health information. The HITECH Act expanded the scope of these provisions by mandating individual notification in instances of data breach, providing enhanced penalties for HIPAA violations, and granting enforcement authority to states’ Attorneys General in addition to the HHS Office of Civil Rights. It is possible that Congress may enact additional legislation in the future to increase penalties and to create a private right of action under HIPAA, which could entitle patients to seek monetary damages for violations of the privacy rules.
We may incur significant costs as a result of compliance with government regulations, and our management will be required to devote time to compliance.
Many aspects of our business are affected by government laws and regulations. The issuance of new regulations, or judicial or regulatory guidance regarding existing regulations, could require changes to many of the procedures we currently use to conduct our business, which may lead to additional costs that we have not yet identified. We do not know whether, or the extent to which, we will be able to recover from the states our costs of complying with these new regulations. The costs of any such future compliance efforts could have a material adverse effect on our business. We have already expended significant time, effort and financial resources to comply with the privacy and security requirements of HIPAA and will have to expend additional time and financial resources to comply with the HIPAA provisions contained in
the American Recovery and Reinvestment Act of 2009
and the Patient Protection and Affordable Care Act and Health Care and Education Affordability Reconciliation Act
. We cann
ot predict whether states will enact stricter laws governing the privacy
and security of electronic health information. If any new requirements are enacted at the state or federal level, compliance would likely require additional expenditures and management time.
Changes in healthcare law and benefits may reduce our profitability.
Changes in applicable laws and regulations are continually being considered, and interpretations of existing laws and rules may also change from time to time. We are unable to predict what regulatory changes may occur or what effect any particular change may have on our business. For example, these changes could reduce the number of persons enrolled or eligible to enroll in Medicaid, reduce the reimbursement or payment levels for medical services or reduce benefits included in Medicaid coverage. For example, some states, including Indiana and Ohio have removed, and others could consider removing, pharmacy coverage from the services covered by managed care entities. We are also unable to predict whether new laws or proposals will favor or hinder the growth of managed healthcare in general.
The recently enacted health care reform law and the implementation of that law could have a material adverse effect on our business, financial condition, cash flows, or results of operations.
In March 2010, the Patient Protection and Affordable Care Act and the accompanying Health Care and Education Affordability Reconciliation Act were enacted. This legislation provides comprehensive changes to the U.S. health care system, which will be phased in at various stages over the next eight years. Among other things, by January 1, 2014, states will be required to expand their Medicaid programs to provide eligibility to nearly all people under age 65 with income below 133 percent of the federal poverty line. As a result, millions of low-income adults without children who currently cannot qualify for coverage, as well as many low-income parents and, in some instances, children now covered through CHIP, will be made eligible for Medicaid. States were permitted to begin such expansions on April 1, 2010.
The legislation also imposes an annual insurance industry assessment of $8 billion starting in 2014, with increasing annual amounts thereafter. Such assessment may not be deductible for income tax purposes. If this federal premium tax is imposed as enacted, and if the cost of the federal premium tax is not included in the calculation of our rates, or if we are unable to otherwise adjust our business model to address this new tax, our results of operations, financial position and liquidity may be materially adversely affected.
There are numerous outstanding steps required to implement the legislation, including the promulgation of a substantial number of new and potentially more onerous federal regulations. Further, various health insurance reform proposals are also emerging at the state level. Because of the unsettled nature of these reforms and numerous steps required to implement them, we cannot predict what additional health insurance requirements will be implemented at the federal or state level, or the effect that any future legislation or regulation will have on our business or our growth opportunities.
In addition, there have been a number of lawsuits filed that challenge all or part of the health care reform law. On January 31, 2011, a Florida District Court ruled that the entire health care reform law is unconstitutional. Other courts have ruled in favor of the law or have only struck down certain provisions of the law. These cases are under appeal and others are in process. We can not predict the ultimate outcome of any of the litigation. Further, various Congressional leaders have indicated a desire to revisit some or all of the health care reform law during 2011. While the U.S House of Representatives voted to repeal the whole health care reform law, the U.S. Senate voted against such a repeal, and there have separately been a number of bills introduced that would repeal or change certain provisions of the law. Because of these challenges, we cannot predict whether any or all of the legislation will be implemented as enacted, overturned, repealed or modified.
Although we believe the legislation may provide us with significant opportunities to grow our business, the enacted reforms, as well as future regulations and legislative changes, may in fact have a material adverse affect on our results of operations, financial position or liquidity. If we fail to effectively implement our operational and strategic initiatives with respect to the implementation of health care reform, or do not do so as effectively as our competitors, our business may be materially adversely affected.
If a state fails to renew a required federal waiver for mandated Medicaid enrollment into managed care or such application is denied, our membership in that state will likely decrease.
States may administer Medicaid managed care programs pursuant to demonstration programs or required waivers of federal Medicaid standards. Waivers and demonstration programs are generally approved for two year periods and can be renewed on an ongoing basis if the state applies. We have no control over this renewal process. If a state does not renew such a waiver or demonstration program or the Federal government denies a state’s application for renewal, membership in our health plan in the state could decrease and our business could suffer.
Changes in federal funding mechanisms may reduce our profitability.
Changes in funding for Medicaid may affect our business. For example, on May 29, 2007, CMS issued a final rule that would reduce states’ use of intergovernmental transfers for the states’ share of Medicaid program funding. By restricting the use of intergovernmental transfers, this rule may restrict some states’ funding for Medicaid, which could adversely affect our growth, operations and financial performance. On May 23, 2008, the United States District Court for the District of Columbia vacated the final rule as improperly promulgated.
On November 30, 2010, CMS issued final regulations that remove these provisions and restore the regulatory language that was in place before the 2007 regulations were issued. While this rule has been removed, we cannot predict whether another similar rule or any other rule that changes funding mechanisms will be promulgated, and if any are
, what impact
they
will have on our business.
Legislative changes in the Medicare program may also affect our business. For example, the Medicare Prescription Drug, Improvement and Modernization Act of 2003 revised cost-sharing requirements for some beneficiaries and requires states to reimburse the federal Medicare program for costs of prescription drug coverage provided to beneficiaries who are enrolled simultaneously in both the Medicaid and Medicare programs.
If state regulatory agencies require a statutory capital level higher than the state regulations, we may be required to make additional capital contributions.
Our operations are conducted through our wholly owned subsidiaries, which include health maintenance organizations, or HMOs, and managed care organizations, or MCOs. HMOs and MCOs are subject to state regulations that, among other things, require the maintenance of minimum levels of statutory capital, as defined by each state. Additionally, state regulatory agencies may require, at their discretion, individual HMOs to maintain statutory capital levels higher than the state regulations. If this were to occur to one of our subsidiaries, we may be required to make additional capital contributions to the affected subsidiary. Any additional capital contribution made to one of the affected subsidiaries could have a material adverse effect on our liquidity and our ability to grow.
If state regulators do not approve payments of dividends and distributions by our subsidiaries to us, we may not have sufficient funds to implement our business strategy.
We principally operate through our health plan subsidiaries. If funds normally available to us become limited in the future, we may need to rely on dividends and distributions from our subsidiaries to fund our operations. These subsidiaries are subject to regulations that limit the amount of dividends and distributions that can be paid to us without prior approval of, or notification to, state regulators. If these regulators were to deny our subsidiaries’ request to pay dividends to us, the funds available to us would be limited, which could harm our ability to implement our business strategy.
Risks Related to Our Business
Ineffectiveness of state-operated systems and subcontractors could adversely affect our business.
Our health plans rely on other state-operated systems or sub-contractors to qualify, solicit, educate and assign eligible members into the health plans. The effectiveness of these state operations and sub-contractors can have a material effect on a health plan’s enrollment in a particular month or over an extended period. When a state implements new programs to determine eligibility, new processes to assign or enroll eligible members into health plans, or chooses new contractors, there is an increased potential for an unanticipated impact on the overall number of members assigned into the health plans.
Failure to accurately predict our medical expenses could negatively affect our financial position, results of operations or cash flows.
Our medical expense includes claims reported but not yet paid, or inventory, estimates for claims incurred but not reported, or IBNR, and estimates for the costs necessary to process unpaid claims at the end of each period. Our development of the medical claims liability estimate is a continuous process which we monitor and refine on a monthly basis as claims receipts and payment information becomes available. As more complete information becomes available, we adjust the amount of the estimate, and include the changes in estimates in medical expense in the period in which the changes are identified.
We can not be sure that our medical claims liability estimates are adequate or that adjustments to those estimates will not unfavorably impact our results of operations. For example, in the three months ended June 30, 2006 we adjusted IBNR by $9.7 million for adverse medical costs development from the first quarter of 2006.
Additionally, when we commence operations in a new state or region, we have limited information with which to estimate our medical claims liability. For example, we commenced operations in South Carolina in December 2007, began our Foster Care program in Texas in April 2008, commenced operations in Florida in February 2009, in Massachusetts in July 2009, in Mississippi in January 2011, and expect to commence operations in Illinois in 2011. For a period of time after the inception of business in these states, we base our estimates on state-provided historical actuarial data and limited actual incurred and received claims.
The addition of new categories of individuals who are eligible for Medicaid under new legislation may pose the same difficulty in estimating our medical claims liability and utilization patterns.
From time to time in the past, our actual results have varied from our estimates, particularly in times of significant changes in the number of our members. The accuracy of our medical claims liability estimate may also affect our ability to take timely corrective actions, further harming our results.
Receipt of inadequate or significantly delayed premiums would negatively affect our revenues, profitability or cash flows.
Our premium revenues consist of fixed monthly payments per member and supplemental payments for other services such as maternity deliveries. These premiums are fixed by contract, and we are obligated during the contract periods to provide healthcare services as established by the state governments. We use a large portion of our revenues to pay the costs of healthcare services delivered to our members. If premiums do not increase when expenses related to medical services rise, our earnings will be affected negatively. In addition, our actual medical services costs may exceed our estimates, which would cause our health benefits ratio, or our expenses related to medical services as a percentage of premium revenue, to increase and our profits to decline. In addition, it is possible for a state to increase the rates payable to the hospitals without granting a corresponding increase in premiums to us. If this were to occur in one or more of the states in which we operate, our profitability would be harmed. In addition, if there is a significant delay in our receipt of premiums to offset previously incurred health benefits costs, our cash flows or earnings could be negatively impacted.
In some instances, our base premiums are subject to an adjustment, or risk score, based on the acuity of our membership. Generally, the risk score is determined by the State analyzing encounter submissions of processed claims data to determine the acuity of our membership relative to the entire state’s Medicaid membership. The risk score is dependent on several factors including our providers’ completeness and quality of claims submission, our processing of the claim, submission of the processed claims in the form of encounters to the states’ encounter systems and the states’ acceptance and analysis of the encounter data. If the risk scores assigned to our premiums that are risk adjusted are not adequate or do not appropriately reflect the acuity of our membership, our earnings will be affected negatively.
Failure to effectively manage our medical costs or related administrative costs or uncontrollable epidemic or pandemic costs would reduce our profitability.
Our profitability depends, to a significant degree, on our ability to predict and effectively manage expenses related to health benefits. We have less control over the costs related to medical services than we do over our general and administrative expenses. Because of the narrow margins of our health plan business, relatively small changes in our health benefits ratio can create significant changes in our financial results. Changes in healthcare regulations and practices, the level of use of healthcare services, hospital costs, pharmaceutical costs, major epidemics or pandemics, new medical technologies and other external factors, including general economic conditions such as inflation levels, are beyond our control and could reduce our ability to predict and effectively control the costs of providing health benefits. In 2009, the H1N1 influenza pandemic resulted in heightened costs due to increased physician visits and increased utilization of hospital emergency rooms and pharmaceutical costs. We cannot predict what impact the H1N1 influenza virus or any other epidemic or pandemic will have on our costs in the future. Additionally, we may not be able to manage costs effectively in the future. If our costs related to health benefits increase, our profits could be reduced or we may not remain profitable.
Our investment portfolio may suffer losses from changes in market interest rates and changes in market conditions which could materially and adversely affect our results of operations or liquidity.
As of December 31, 2010, we had $455.3 million in cash, cash equivalents and short-term investments and $618.6 million of long-term investments and restricted deposits.
We maintain an investment portfolio of cash equivalents and short-term and long-term investments in a variety of securities which may include asset backed securities, bank deposits, commercial paper, certificates of deposit, money market funds, municipal bonds, corporate bonds, instruments of the U.S. Treasury and other government corporations and agencies, insurance contracts and equity securities. These investments are subject to general credit, liquidity, market and interest rate risks. Substantially all of these securities are subject to interest rate and credit risk and will decline in value if interest rates increase or one of the issuers’ credit ratings is reduced. As a result, we may experience a reduction in value or loss of liquidity of our investments, which may have a negative adverse effect on our results of operations, liquidity and financial condition. For example, in the third quarter of 2008, we recorded a loss on investments of approximately $4.5 million due to a loss in a money market fund.
Our investments in state, municipal and corporate securities are not guaranteed by the United States government which could materially and adversely affect our results of operation, liquidity or financial condition.
As of December 31, 2010, we had $556.3 million of investments in state, municipal and corporate securities.
These securities are not guaranteed by the United States government. State and municipal securities are subject to additional credit risk based upon each local municipality’s tax revenues and financial stability. As a result, we may experience a reduction in value or loss of liquidity of our investments, which may have a negative adverse effect on our results of operations, liquidity and financial condition.
Difficulties in executing our acquisition strategy could adversely affect our business.
Historically, the acquisition of Medicaid and specialty services businesses, contract rights and related assets of other health plans both in our existing service areas and in new markets has accounted for a significant amount of our growth. Many of the other potential purchasers have greater financial resources than we have. In addition, many of the sellers are interested either in (a) selling, along with their Medicaid assets, other assets in which we do not have an interest or (b) selling their companies, including their liabilities, as opposed to the assets of their ongoing businesses.
We generally are required to obtain regulatory approval from one or more state agencies when making acquisitions. In the case of an acquisition of a business located in a state in which we do not currently operate, we would be required to obtain the necessary licenses to operate in that state. In addition, even if we already operate in a state in which we acquire a new business, we would be required to obtain additional regulatory approval if the acquisition would result in our operating in an area of the state in which we did not operate previously, and we could be required to renegotiate provider contracts of the acquired business. We cannot provide any assurance that we would be able to comply with these regulatory requirements for an acquisition in a timely manner, or at all. In deciding whether to approve a proposed acquisition, state regulators may consider a number of factors outside our control, including giving preference to competing offers made by locally owned entities or by not-for-profit entities.
We also may be unable to obtain sufficient additional capital resources for future acquisitions. If we are unable to effectively execute our acquisition strategy, our future growth will suffer and our results of operations could be harmed.
Execution of our growth strategy may increase costs or liabilities, or create disruptions in our business.
We pursue acquisitions of other companies or businesses from time to time. Although we review the records of companies or businesses we plan to acquire, even an in-depth review of records may not reveal existing or potential problems or permit us to become familiar enough with a business to assess fully its capabilities and deficiencies. As a result, we may assume unanticipated liabilities or adverse operating conditions, or an acquisition may not perform as well as expected. We face the risk that the returns on acquisitions will not support the expenditures or indebtedness incurred to acquire such businesses, or the capital expenditures needed to develop such businesses. We also face the risk that we will not be able to integrate acquisitions into our existing operations effectively without substantial expense, delay or other operational or financial problems. Integration may be hindered by, among other things, differing procedures, including internal controls, business practices and technology systems. We may need to divert more management resources to integration than we planned, which may adversely affect our ability to pursue other profitable activities.
In addition to the difficulties we may face in identifying and consummating acquisitions, we will also be required to integrate and consolidate any acquired business or assets with our existing operations. This may include the integration of:
• additional personnel who are not familiar with our operations and corporate culture;
• provider networks that may operate on different terms than our existing networks;
• existing members, who may decide to switch to another healthcare plan; and
• disparate administrative, accounting and finance, and information systems.
Additionally, our growth strategy includes start-up operations in new markets or new products in existing markets. We may incur significant expenses prior to commencement of operations and the receipt of revenue. As a result, these start-up operations may decrease our profitability. In the event we pursue any opportunity to diversify our business internationally, we would become subject to additional risks, including, but not limited to, political risk, an unfamiliar regulatory regime, currency exchange risk and exchange controls, cultural and language differences, foreign tax issues, and different labor laws and practices.
Accordingly, we may be unable to identify, consummate and integrate future acquisitions or start-up operations successfully or operate acquired or new businesses profitably.
Acquisitions of unfamiliar new businesses could negatively impact our business.
We are subject to the expenditures and risks associated with entering into any new line of business. Our failure to properly manage these expenditures and risks could have a negative impact on our overall business. For example, effective July 2008, we completed the previously announced acquisition of Celtic Group, Inc., the parent company of Celtic Insurance Company, or Celtic. Celtic is a national individual health insurance provider that provides health insurance to individual customers and their families. While we believed that the addition of Celtic would be complementary to our business, we had not previously operated in the individual health care industry.
If competing managed care programs are unwilling to purchase specialty services from us, we may not be able to successfully implement our strategy of diversifying our business lines.
We are seeking to diversify our business lines into areas that complement our Medicaid business in order to grow our revenue stream and balance our dependence on Medicaid risk reimbursement. In order to diversify our business, we must succeed in selling the services of our specialty subsidiaries not only to our managed care plans, but to programs operated by third-parties. Some of these third-party programs may compete with us in some markets, and they therefore may be unwilling to purchase specialty services from us. In any event, the offering of these services will require marketing activities that differ significantly from the manner in which we seek to increase revenues from our Medicaid programs. Our inability to market specialty services to other programs may impair our ability to execute our business strategy.
Failure to achieve timely profitability in any business would negatively affect our results of operations.
Business expansion costs associated with a new business can be substantial. For example, in order to obtain a certificate of authority in most jurisdictions, we must first establish a provider network, have systems in place and demonstrate our ability to obtain a state contract and process claims. If we were unsuccessful in obtaining the necessary license, winning the bid to provide service or attracting members in numbers sufficient to cover our costs, any new business of ours would fail. We also could be obligated by the state to continue to provide services for some period of time without sufficient revenue to cover our ongoing costs or recover business expansion costs. The expenses associated with starting up a new business could have a significant impact on our results of operations if we are unable to achieve profitable operations in a timely fashion.
Adverse credit market conditions may have a material adverse affect on our liquidity or our ability to obtain credit on acceptable terms.
The securities and credit markets have been experiencing extreme volatility and disruption over the past several years. The availability of credit, from virtually all types of lenders, has been restricted. Such conditions may persist during 2011 and beyond. In the event we need access to additional capital to pay our operating expenses, make payments on our indebtedness, pay capital expenditures, or fund acquisitions, our ability to obtain such capital may be limited and the cost of any such capital may be significant, particularly if we are unable to access our existing credit facility.
Our access to additional financing will depend on a variety of factors such as prevailing economic and credit market conditions, the general availability of credit, the overall availability of credit to our industry, our credit ratings and credit capacity, and perceptions of our financial prospects. Similarly, our access to funds may be impaired if regulatory authorities or rating agencies take negative actions against us. If a combination of these factors were to occur, our internal sources of liquidity may prove to be insufficient, and in such case, we may not be able to successfully obtain additional financing on favorable terms or at all. We believe that if credit could be obtained, the terms and costs of such credit could be significantly less favorable to us than what was obtained in our most recent financings.
We derive a majority of our premium revenues from operations in a small number of states, and our financial position, results of operations or cash flows would be materially affected by a decrease in premium revenues or profitability in any one of those states.
Operations in a few states have accounted for most of our premium revenues to date. If we were unable to continue to operate in any of our current states or if our current operations in any portion of one of those states were significantly curtailed, our revenues could decrease materially. Our Medicaid contract with Kansas, which terminated December 31, 2006, together with our Medicaid contract with Missouri, accounted for $317.0 million in revenue for the year ended December 31, 2006. Our reliance on operations in a limited number of states could cause our revenue and profitability to change suddenly and unexpectedly depending on legislative or other governmental or regulatory actions and decisions, economic conditions and similar factors in those states. For example, states we currently serve may bid out their Medicaid program through a Request for Proposal, or RFP, process. Our inability to continue to operate in any of the states in which we operate would harm our business.
Competition may limit our ability to increase penetration of the markets that we serve.
We compete for members principally on the basis of size and quality of provider network, benefits provided and quality of service. We compete with numerous types of competitors, including other health plans and traditional state Medicaid programs that reimburse providers as care is provided. In addition, the impact of health care reform and potential growth in our segment may attract new competitors. Subject to limited exceptions by federally approved state applications, the federal government requires that there be choices for Medicaid recipients among managed care programs. Voluntary programs, increases in the number of competitors and mandated competition may limit our ability to increase our market share.
Some of the health plans with which we compete have greater financial and other resources and offer a broader scope of products than we do. In addition, significant merger and acquisition activity has occurred in the managed care industry, as well as in industries that act as suppliers to us, such as the hospital, physician, pharmaceutical, medical device and health information systems businesses. To the extent that competition intensifies in any market that we serve, our ability to retain or increase members and providers, or maintain or increase our revenue growth, pricing flexibility and control over medical cost trends may be adversely affected.
In addition, in order to increase our membership in the markets we currently serve, we believe that we must continue to develop and implement community-specific products, alliances with key providers and localized outreach and educational programs. If we are unable to develop and implement these initiatives, or if our competitors are more successful than we are in doing so, we may not be able to further penetrate our existing markets.
If we are unable to maintain relationships with our provider networks, our profitability may be harmed.
Our profitability depends, in large part, upon our ability to contract favorably with hospitals, physicians and other healthcare providers. Our provider arrangements with our primary care physicians, specialists and hospitals generally may be cancelled by either party without cause upon 90 to 120 days prior written notice. We cannot provide any assurance that we will be able to continue to renew our existing contracts or enter into new contracts enabling us to service our members profitably.
From time to time providers assert or threaten to assert claims seeking to terminate non-cancelable agreements due to alleged actions or inactions by us. Even if these allegations represent attempts to avoid or renegotiate contractual terms that have become economically disadvantageous to the providers, it is possible that in the future a provider may pursue such a claim successfully. In addition, we are aware that other managed care organizations have been subject to class action suits by physicians with respect to claim payment procedures, and we may be subject to similar claims. Regardless of whether any claims brought against us are successful or have merit, they will still be time-consuming and costly and could distract our management’s attention. As a result, we may incur significant expenses and may be unable to operate our business effectively.
We will be required to establish acceptable provider networks prior to entering new markets. We may be unable to enter into agreements with providers in new markets on a timely basis or under favorable terms. If we are unable to retain our current provider contracts or enter into new provider contracts timely or on favorable terms, our profitability will be harmed.
We may be unable to attract and retain key personnel.
We are highly dependent on our ability to attract and retain qualified personnel to operate and expand our business. If we lose one or more members of our senior management team, including our chief executive officer, Michael F. Neidorff, who has been instrumental in developing our business strategy and forging our business relationships, our business and financial position, results of operations or cash flows could be harmed. Our ability to replace any departed members of our senior management or other key employees may be difficult and may take an extended period of time because of the limited number of individuals in the Medicaid managed care and specialty services industry with the breadth of skills and experience required to operate and successfully expand a business such as ours. Competition to hire from this limited pool is intense, and we may be unable to hire, train, retain or motivate these personnel.
Negative publicity regarding the managed care industry may harm our business and financial position, results of operations or cash flows.
The managed care industry has received negative publicity. This publicity has led to increased legislation, regulation, review of industry practices and private litigation in the commercial sector. These factors may adversely affect our ability to market our services, require us to change our services, and increase the regulatory burdens under which we operate. Any of these factors may increase the costs of doing business and adversely affect our financial position, results of operations or cash flows.
Claims relating to medical malpractice could cause us to incur significant expenses.
Our providers and employees involved in medical care decisions may be subject to medical malpractice claims. In addition, some states have adopted legislation that permits managed care organizations to be held liable for negligent treatment decisions or benefits coverage determinations. Claims of this nature, if successful, could result in substantial damage awards against us and our providers that could exceed the limits of any applicable insurance coverage. Therefore, successful malpractice or tort claims asserted against us, our providers or our employees could adversely affect our financial condition and profitability. Even if any claims brought against us are unsuccessful or without merit, they would still be time consuming and costly and could distract our management’s attention. As a result, we may incur significant expenses and may be unable to operate our business effectively.
Loss of providers due to increased insurance costs could adversely affect our business.
Our providers routinely purchase insurance to help protect themselves against medical malpractice claims. In recent years, the costs of maintaining commercially reasonable levels of such insurance have increased dramatically, and these costs are expected to increase to even greater levels in the future. As a result of the level of these costs, providers may decide to leave the practice of medicine or to limit their practice to certain areas, which may not address the needs of Medicaid participants. We rely on retaining a sufficient number of providers in order to maintain a certain level of service. If a significant number of our providers exit our provider networks or the practice of medicine generally, we may be unable to replace them in a timely manner, if at all, and our business could be adversely affected.
Growth in the number of Medicaid-eligible persons could cause our financial position, results of operations or cash flows to suffer if state and federal budgets decrease or do not increase.
Less favorable economic conditions may cause our membership to increase as more people become eligible to receive Medicaid benefits. During such economic downturns, however, state and federal budgets could decrease, causing states to attempt to cut healthcare programs, benefits and rates.
Additionally, the number of individuals eligible for Medicaid managed care will likely increase as a result of the recent health care reform legislation.
We cannot predict the impact of changes in the United States economic environment or other economic or political events, including acts of terrorism or related military action, on federal or state funding of healthcare programs or on the size of the population eligible for the programs we operate. If federal or state funding decreases or remains unchanged while our membership increases, our results of operations will suffer.
Growth in the number of Medicaid-eligible persons may be countercyclical, which could cause our financial position, results of operations or cash flows to suffer when general economic conditions are improving.
Historically, the number of persons eligible to receive Medicaid benefits has increased more rapidly during periods of rising unemployment, corresponding to less favorable general economic conditions. Conversely, this number may grow more slowly or even decline if economic conditions improve. Therefore, improvements in general economic conditions may cause our membership levels to decrease, thereby causing our financial position, results of operations or cash flows to suffer, which could lead to decreases in our stock price during periods in which stock prices in general are increasing.
If we are unable to integrate and manage our information systems effectively, our operations could be disrupted.
Our operations depend significantly on effective information systems. The information gathered and processed by our information systems assists us in, among other things, monitoring utilization and other cost factors, processing provider claims, and providing data to our regulators. Our providers also depend upon our information systems for membership verifications, claims status and other information.
Our information systems and applications require continual maintenance, upgrading and enhancement to meet our operational needs and regulatory requirements. Moreover, our acquisition activity requires frequent transitions to or from, and the integration of, various information systems. We regularly upgrade and expand our information systems’ capabilities. If we experience difficulties with the transition to or from information systems or are unable to properly maintain or expand our information systems, we could suffer, among other things, from operational disruptions, loss of existing members and difficulty in attracting new members, regulatory problems and increases in administrative expenses. In addition, our ability to integrate and manage our information systems may be impaired as the result of events outside our control, including acts of nature, such as earthquakes or fires, or acts of terrorists.
We rely on the accuracy of eligibility lists provided by state governments. Inaccuracies in those lists would negatively affect our results of operations.
Premium payments to us are based upon eligibility lists produced by state governments. From time to time, states require us to reimburse them for premiums paid to us based on an eligibility list that a state later discovers contains individuals who are not in fact eligible for a government sponsored program or are eligible for a different premium category or a different program. Alternatively, a state could fail to pay us for members for whom we are entitled to payment. Our results of operations would be adversely affected as a result of such reimbursement to the state if we had made related payments to providers and were unable to recoup such payments from the providers.
We may not be able to obtain or maintain adequate insurance.
We maintain liability insurance, subject to limits and deductibles, for claims that could result from providing or failing to provide managed care and related services. These claims could be substantial. We believe that our present insurance coverage and reserves are adequate to cover currently estimated exposures. We cannot provide any assurance that we will be able to obtain adequate insurance coverage in the future at acceptable costs or that we will not incur significant liabilities in excess of policy limits.
From time to time, we may become involved in costly and time-consuming litigation and other regulatory proceedings, which require significant attention from our management.
We are a defendant from time to time in lawsuits and regulatory actions relating to our business. Due to the inherent uncertainties of litigation and regulatory proceedings, we cannot accurately predict the ultimate outcome of any such proceedings. An unfavorable outcome could have a material adverse impact on our business and financial position, results of operations or cash flows. In addition, regardless of the outcome of any litigation or regulatory proceedings, such proceedings are costly and time consuming and require significant attention from our management. For example, we have in the past, or may be subject to in the future, securities class action lawsuits, IRS examinations or similar regulatory actions. Any such matters could harm our business and financial position, results of operations or cash flows.
An unauthorized disclosure of sensitive or confidential member information could have an adverse effect on our business.
As part of our normal operations, we collect, process and retain confidential member information. We are subject to various federal and state laws and rules regarding the use and disclosure of confidential member information, including HIPAA and the Gramm-Leach-Bliley Act. The American Recovery and Reinvestment Act of 2009 further expands the coverage of HIPAA by, among other things, extending the privacy and security provisions, requiring new disclosures if a data breach occurs, mandating new regulations around electronic medical records, expanding enforcement mechanisms, allowing the state Attorneys General to bring enforcement actions and increasing penalties for violations. Despite the security measures we have in place to ensure compliance with applicable laws and rules, our facilities and systems, and those of our third party service providers, may be vulnerable to security breaches, acts of vandalism, computer viruses, misplaced or lost data, programming and/or human errors or other similar events. Any security breach involving the misappropriation, loss or other unauthorized disclosure or use of confidential member information, whether by us or a third party, could have a material adverse effect on our business, financial condition, cash flows, or results of operations.
None.
We own both of our corporate office headquarters buildings located in St. Louis, Missouri. During 2008, 2009 and 2010, our capital expenditures included costs for the construction of a new real estate development on the property adjoining our corporate office, which we believe is necessary to accommodate our growing business.
We generally lease space in the states where our health plans, specialty companies and claims processing facilities operate. We are required by various insurance and regulatory authorities to have offices in the service areas where we provide benefits. We believe our current facilities are adequate to meet our operational needs for the foreseeable future.
In May 2008, the Internal Revenue Services began an audit of the Company’s 2006 and 2007 tax returns. In connection with the IRS examination, the field agent initially denied the $34.9 million tax benefit related to the abandonment of the FirstGuard stock in 2007 based on certain assumptions of fact by the IRS. The most significant change was to re-characterize the loss as a capital loss versus an ordinary loss.
In connection with an appeals conference in August 2010, the Company responded to the field agent's original write-up and provided additional documentation to the Appeals Officer to support the Company's view that sufficient technical tax authority existed at the time of the FirstGuard abandonment to support the Company's tax position. The Company is proceeding with the appeals process and believes that once the factual issues surrounding the abandonment are understood by the IRS, the position, more likely than not, will be upheld.
We routinely are subjected to legal proceedings in the normal course of business. While the ultimate resolution of such matters is uncertain, we do not expect the results of any of these matters individually, or in the aggregate, to have a material effect on our financial position or results of operations.
Market for Common Stock; Dividends
Our common stock has been traded and quoted on the New York Stock Exchange under the symbol “CNC” since October 16, 2003. The high and low prices, as reported by the NYSE, are set forth below for the periods indicated.
|
2010 Stock Price
|
2009 Stock Price
|
|||||||||||||||
|
High
|
Low
|
High
|
Low
|
|||||||||||||
|
First Quarter
|
$ | 25.03 | $ | 17.60 | $ | 22.50 | $ | 15.00 | ||||||||
|
Second Quarter
|
25.95 | 20.51 | 21.00 | 17.29 | ||||||||||||
|
Third Quarter
|
23.65 | 20.00 | 20.48 | 16.89 | ||||||||||||
|
Fourth Quarter
|
26.43 | 21.19 | 22.02 | 17.25 | ||||||||||||
As of February 4, 2011, there were 59 holders of record of our common stock.
We have never declared any cash dividends on our capital stock and currently anticipate that we will retain any future earnings for the development, operation and expansion of our business.
Issuer Purchases of Equity Securities
On October 26, 2009, the Company’s Board of Directors extended the Company’s stock repurchase program. The program authorizes the repurchase of up to 4,000,000 shares of the Company’s common stock from time to time on the open market or through privately negotiated transactions. No duration has been placed on the repurchase program, however, the terms of the Senior Notes require that all such redemptions are consummated on or before April 1, 2011. The Company reserves the right to discontinue the repurchase program at any time. During the year ended December 31, 2010, we did not repurchase any shares through this publicly announced program.
|
Issuer Purchases of Equity Securities
Fourth Quarter 2010
|
|||||||||||
|
Period
|
Total Number of
Shares
Purchased
|
Average Price
Per Share
|
Total Number
of Shares
Purchased as
Publicly
Announced
Plans
or Programs
|
Maximum
Number of Shares
that
May Yet Be
Purchased Under
the Plans or
Programs
|
|||||||
|
October 1 – October 31, 2010
|
949
|
$
|
23.19
|
—
|
1,667,724
|
||||||
|
November 1 – November 30, 2010
|
3,946
|
22.66
|
—
|
1,667,724
|
|||||||
|
December 1 – December 31, 2010
|
99,470
|
24.11
|
—
|
1,667,724
|
|||||||
|
TOTAL
|
|
104,365
|
1
|
$
|
24.04
|
|
—
|
1,667,724
|
|||
________________
1
Shares acquired represent shares relinquished to the Company by certain employees for payment of taxes upon vesting of restricted stock units.
Stock Performance Graphs
The graph below compares the cumulative total stockholder return on our common stock for the period from December 31, 2005 to December 31, 2010 with the cumulative total return of the New York Stock Exchange Composite Index and the Morgan Stanley Health Care Payor Index over the same period. The graph assumes an investment of $100 on December 31, 2005 in our common stock (at the last reported sale price on such day), the New York Stock Exchange Composite Index and the Morgan Stanley Health Care Payor Index and assumes the reinvestment of any dividends.
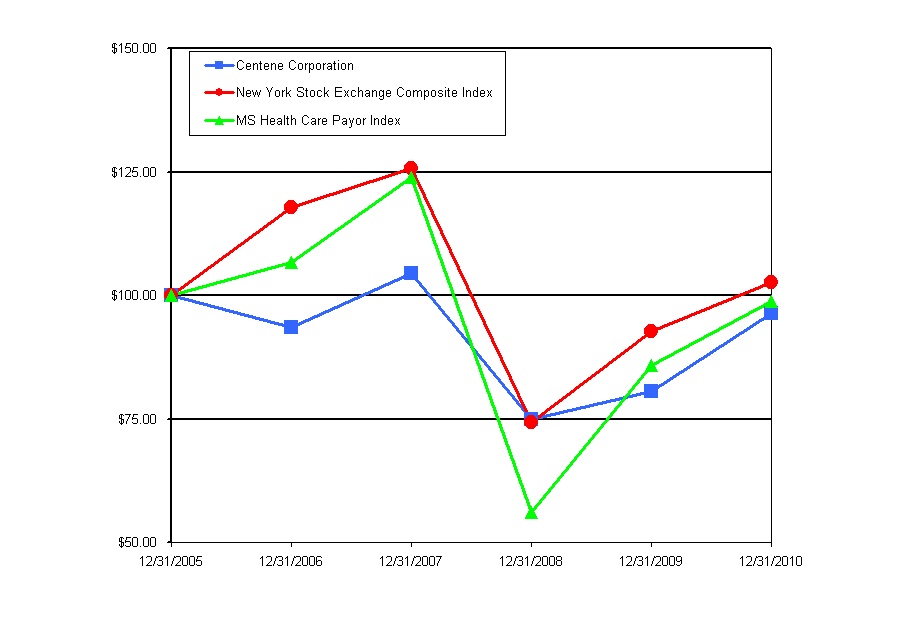
|
12/31/2005
|
12/31/2006
|
12/31/2007
|
12/31/2008
|
12/31/2009
|
12/31/2010
|
|||||||||||||||||||
|
Centene Corporation
|
$ | 100.00 | $ | 93.46 | $ | 104.37 | $ | 74.97 | $ | 80.52 | $ | 96.39 | ||||||||||||
|
New York Stock Exchange Composite Index
|
$ | 100.00 | $ | 117.86 | $ | 125.62 | $ | 74.25 | $ | 92.66 | $ | 102.71 | ||||||||||||
|
MS Health Care Payor Index
|
$ | 100.00 | $ | 106.65 | $ | 123.92 | $ | 56.00 | $ | 85.91 | $ | 98.96 | ||||||||||||
The following selected consolidated financial data should be read in conjunction with the consolidated financial statements and related notes and “Item 7. Management’s Discussion and Analysis of Financial Condition and Results of Operations” included in our Annual Report on Form 10-K. The assets, liabilities and results of operations of FirstGuard and University Health Plans have been classified as discontinued operations for all periods presented. The data for the years ended December 31, 2010, 2009 and 2008 and as of December 31, 2010 and 2009 are derived from consolidated financial statements included elsewhere in this filing. The data for the years ended December 31, 2007 and 2006 and as of December 31, 2008, 2007 and 2006 are derived from consolidated financial statements not included in this filing.
|
|
Year Ended December 31,
|
|||||||||||||||||||
|
|
2010
|
2009
|
2008
|
2007
|
2006
1
|
|||||||||||||||
|
(In thousands, except share data)
|
||||||||||||||||||||
|
|
||||||||||||||||||||
|
Revenues:
|
|
|||||||||||||||||||
|
Premium
|
|
$
|
4,192,172
|
$
|
3,786,525
|
$
|
3,199,360
|
$
|
2,611,953
|
$
|
1,707,439
|
|||||||||
|
Service
|
|
91,661
|
91,758
|
74,953
|
80,508
|
79,159
|
||||||||||||||
|
Premium and service revenues
|
4,283,833
|
3,878,283
|
3,274,313
|
2,692,461
|
1,786,598
|
|||||||||||||||
|
Premium tax
|
164,490
|
224,581
|
90,202
|
76,567
|
35,848
|
|||||||||||||||
|
Total revenues
|
|
4,448,323
|
4,102,864
|
3,364,515
|
2,769,028
|
1,822,446
|
||||||||||||||
|
Expenses:
|
|
|||||||||||||||||||
|
Medical costs
|
|
3,514,394
|
3,163,523
|
2,640,335
|
2,190,898
|
1,436,371
|
||||||||||||||
|
Cost of services
|
|
63,919
|
60,789
|
56,920
|
61,348
|
60,287
|
||||||||||||||
|
General and administrative expenses
|
|
547,823
|
514,529
|
444,733
|
384,970
|
267,712
|
||||||||||||||
|
Premium tax expense
|
165,118
|
225,888
|
90,966
|
76,567
|
35,848
|
|||||||||||||||
|
Total operating expenses
|
|
4,291,254
|
3,964,729
|
3,232,954
|
2,713,783
|
1,800,218
|
||||||||||||||
|
Earnings from operations
|
|
157,069
|
138,135
|
131,561
|
55,245
|
22,228
|
||||||||||||||
|
Other income (expense):
|
|
|||||||||||||||||||
|
Investment and other income
|
|
15,205
|
15,691
|
21,728
|
24,452
|
15,511
|
||||||||||||||
|
Interest expense
|
|
(17,992
|
)
|
(16,318
|
)
|
(16,673
|
)
|
(15,626
|
)
|
(10,574
|
)
|
|||||||||
|
Earnings from continuing operations, before income tax expense
|
|
154,282
|
137,508
|
136,616
|
64,071
|
27,165
|
||||||||||||||
|
Income tax expense
|
|
59,900
|
48,841
|
52,435
|
23,031
|
9,565
|
||||||||||||||
|
Earnings from continuing operations, net of income tax expense
|
94,382
|
88,667
|
84,181
|
41,040
|
17,600
|
|||||||||||||||
|
Discontinued operations, net of income tax expense (benefit) of $4,388, $(1,204), $(281), $(31,563), and $12,412, respectively
|
3,889
|
(2,422
|
)
|
(684
|
)
|
32,362
|
(61,229
|
)
|
||||||||||||
|
Net earnings (loss)
|
98,271
|
86,245
|
83,497
|
73,402
|
(43,629
|
)
|
||||||||||||||
|
Noncontrolling interest
|
3,435
|
2,574
|
—
|
—
|
—
|
|||||||||||||||
|
Net earnings (loss) attributable to Centene Corporation
|
|
$
|
94,836
|
$
|
83,671
|
$
|
83,497
|
$
|
73,402
|
$
|
(43,629
|
)
|
||||||||
|
Amounts attributable to Centene Corporation common shareholders:
|
||||||||||||||||||||
|
Earnings from continuing operations, net of income tax expense
|
$
|
90,947
|
$
|
86,093
|
$
|
84,181
|
$
|
41,040
|
$
|
17,600
|
||||||||||
|
Discontinued operations, net of income tax expense (benefit)
|
3,889
|
(2,422
|
)
|
(684
|
)
|
32,362
|
(61,229
|
)
|
||||||||||||
|
Net earnings (loss)
|
$
|
94,836
|
$
|
83,671
|
$
|
83,497
|
$
|
73,402
|
$
|
(43,629
|
)
|
|||||||||
|
Net earnings (loss) per common share attributable to Centene Corporation:
|
|
|||||||||||||||||||
|
Basic:
|
||||||||||||||||||||
|
Continuing operations
|
|
$
|
1.87
|
$
|
2.00
|
$
|
1.95
|
$
|
0.95
|
$
|
0.41
|
|||||||||
|
Discontinued operations
|
|
0.08
|
(0.06
|
)
|
(0.02
|
)
|
0.74
|
(1.42
|
)
|
|||||||||||
|
Basic earnings (loss) per common share
|
|
$
|
1.95
|
$
|
1.94
|
$
|
1.93
|
$
|
1.69
|
$
|
(1.01
|
)
|
||||||||
|
Diluted:
|
|
|||||||||||||||||||
|
Continuing operations
|
|
$
|
1.80
|
$
|
1.94
|
$
|
1.90
|
$
|
0.92
|
$
|
0.39
|
|||||||||
|
Discontinued operations
|
|
0.08
|
(0.05
|
)
|
(0.02
|
)
|
0.72
|
(1.37
|
)
|
|||||||||||
|
Diluted earnings (loss) per common share
|
|
$
|
1.88
|
$
|
1.89
|
$
|
1.88
|
$
|
1.64
|
$
|
(0.98
|
)
|
||||||||
|
Weighted average number of common shares outstanding:
|
|
|||||||||||||||||||
|
Basic
|
|
48,754,947
|
43,034,791
|
43,275,187
|
43,539,950
|
43,160,860
|
||||||||||||||
|
Diluted
|
|
50,447,888
|
44,316,467
|
44,398,955
|
44,823,082
|
44,613,622
|
||||||||||||||
___________________________________________
1
2006 results for discontinued operations include a goodwill impairment charge of $81,098 and other non-cash impairment charges of $7,170 for the FirstGuard reporting unit.
|
|
December 31,
|
|||||||||||||||||||
|
|
2010
|
2009
|
2008
|
2007
|
2006
|
|||||||||||||||
|
|
(In thousands)
|
|||||||||||||||||||
|
Consolidated Balance Sheet Data:
|
|
|||||||||||||||||||
|
Cash and cash equivalents
|
|
$
|
433,914
|
$
|
400,951
|
$
|
370,999
|
$
|
267,305
|
$
|
237,514
|
|||||||||
|
Investments and restricted deposits
|
639,983
|
585,183
|
451,058
|
369,545
|
174,431
|
|||||||||||||||
|
Total assets
|
|
1,943,882
|
1,702,364
|
1,451,152
|
1,121,824
|
894,980
|
||||||||||||||
|
Medical claims liability
|
456,765
|
470,932
|
384,360
|
323,741
|
241,073
|
|||||||||||||||
|
Long-term debt
|
|
327,824
|
307,085
|
264,637
|
206,406
|
174,646
|
||||||||||||||
|
Total stockholders’ equity
|
|
797,055
|
619,427
|
501,272
|
415,047
|
326,423
|
||||||||||||||
The following discussion of our financial condition and results of operations should be read in conjunction with our consolidated financial statements and the related notes included elsewhere in this filing. The discussion contains forward-looking statements that involve known and unknown risks and uncertainties, including those set forth under Part I, Item 1A.“Risk Factors” of this Form 10-K.
OVERVIEW
Our financial performance for 2010 is summarized as follows:
|
Ÿ
|
Year-end at-risk managed care membership of 1,533,500, an increase of 75,300 members, or 5.2% year over year.
|
|
Ÿ
|
Premium and service revenues from continuing operations of $4.3 billion, representing 10.5% growth year over year.
|
|
Ÿ
|
Health Benefits Ratio from continuing operations of 83.8%, compared to 83.5% in 2009.
|
|
Ÿ
|
General and Administrative expense ratio from continuing operations of 12.8%, compared to 13.3% in 2009.
|
|
Ÿ
|
Diluted net earnings per share from continuing operations of $1.80.
|
|
Ÿ
|
Total operating cash flows of $168.9 million, or 1.7 times net earnings.
|
We completed the sale of University Health Plans, Inc., or UHP, our New Jersey health plan, in the first quarter of 2010. Unless specifically noted, all discussions are in the context of continuing operations, and therefore, exclude UHP. The results of operations for UHP are classified as discontinued operations for all periods presented.
The following items contributed to our revenue and membership growth over the last two years:
|
Ÿ
|
Florida.
In February 2009, we began converting non-risk managed care membership from Access Health Solutions LLC, or Access, to our subsidiary, Sunshine State Health Plan on an at-risk basis. During 2010, we completed the conversion of approximately 26,000 members from Access. Additionally, in December 2010, we completed the acquisition of Citrus Health Care, Inc., a Medicaid and long-term care health plan.
|
|
Ÿ
|
South Carolina.
In March 2009, we completed the acquisition of Amerigroup Community Care of South Carolina, Inc. and in June 2010, we completed the acquisition of Carolina Crescent Health Plan. We served 90,300 at-risk members in South Carolina as of December 31, 2010.
|
|
Ÿ
|
Massachusetts.
In July 2009, we began managing healthcare services for members under the state’s Commonwealth Care program and in October 2009 under the Commonwealth Care Bridge program. In April 2010, we began offering an individual insurance product, under the names of Commonwealth Choice and CeltiCare Direct, for residents of the Boston area who do not qualify for other state funded insurance programs. At December 31, 2010, we served 36,200 members operating as CeltiCare Health Plan of Massachusetts.
|
|
Ÿ
|
Arizona.
In December 2010, we began operating under an expanded contract from the Arizona Department of Health Services to manage behavioral healthcare services for an additional four counties including Santa Cruz, Greenlee, Graham and Cochise.
|
|
Ÿ
|
Celtic Insurance Company, Inc.
In July 2010, we closed on the acquisition of certain assets and liabilities of NovaSys Health, LLC, a third party administrator in Arkansas that complements our existing Celtic business. In November 2010, we began operating under a new contract with the Texas Department of Insurance to provide affordable health insurance plans for Texas small businesses under the new Healthy Texas initiative.
|
We expect the following items to contribute to our future growth potential:
|
Ÿ
|
In September 2010, our new subsidiary, IlliniCare Health Plan, was selected as one of two vendors to provide managed care services to older adults and adults with disabilities under the Integrated Care Program in six counties of Illinois. We expect operations to commence in the first half of 2011.
|
|
Ÿ
|
In January 2011, we began operating under a new contract in Mississippi to provide managed care services to Medicaid recipients through the Mississippi Coordinated Access Network (MississippiCan) program.
|
|
Ÿ
|
In January 2011, we began operating under a new statewide managed care contract serving Healthy Indiana Plan members.
|
|
Ÿ
|
In February 2011, we began operating under an additional STAR+PLUS ABD contract in Texas in the Dallas service area.
|
As part of an RFP process, the state of Texas added a second vendor to the rural CHIP product in September 2010, which we previously managed under an exclusive contract. As a result, our December 31, 2010 membership in this product decreased by approximately 50,000 as compared to the prior year.
In April 2010, we were notified by the Wisconsin Department of Health Services that our Wisconsin subsidiary, Managed Health Services (MHS), was not awarded a Southeast Wisconsin BadgerCare Plus Managed Care contract. The change was effective November 1, 2010; after a two-month transition period (September through October), MHS no longer serves BadgerCare Plus Standard and Benchmark members in Milwaukee, Washington, Ozaukee, Waukesha and Kenosha counties. MHS continues to serve Wisconsin Core Plan and ABD members in this region as well as members in other regions of the state.
In 2010, we filed a legal challenge to the State of Wisconsin's decision on the southeast region reprocurement. The lawsuit is currently pending before the Wisconsin court of appeals. The timing and outcome of any decision from the appellate court is unknown at this time.
In March 2010, the Patient Protection and Affordable Care Act and the accompanying Health Care and Education Affordability Reconciliation Act, or the Acts, were enacted in the United States. The Acts contain provisions we expect will have a significant effect on our business in coming years including expanding Medicaid eligibility beginning in 2014 to recipients with incomes below 133% of the federal poverty level, retaining the CHIP program in its current form, and requiring state-based exchanges similar to our experience in Massachusetts in the future. The Acts allow states to receive the same level of rebates from pharmaceutical companies for their Medicaid programs, whether or not the states participate in managed care. The Acts also impose an excise tax on health insurers beginning in 2014 based upon relative market share. Effective in 2011, minimum health benefit cost ratios will be mandated for commercial, fully-insured major medical health plans in the individual market, like our Celtic subsidiary. The minimum health benefit cost ratio for these commercial plans will be set at 80% of premium revenue, adjusted for certain taxes, fees, assessments, risk premium and a credibility factor based upon both the number of covered life years and an average plan cost sharing adjustment calculated for each state. If the actual health benefit cost ratios do not meet the minimum calculated for any state, rebates will be paid to those policyholders. Due to its complexity and lack of comprehensive interpretive guidance and implementing regulations, the full impact of the Acts on Celtic is not yet fully known. The health benefit cost ratio minimum does not apply to other Centene subsidiaries.
MEMBERSHIP
From December 31, 2008 to December 31, 2010, we increased our at-risk managed care membership by 28.0%. The following table sets forth our membership by state for our managed care organizations:
|
December 31,
|
||||||||||||
|
2010
|
2009
|
2008
|
||||||||||
|
Arizona
|
22,400 | 20,700 | 17,000 | |||||||||
|
Florida
|
194,900 | 102,600 | — | |||||||||
|
Georgia
|
305,800 | 309,700 | 288,300 | |||||||||
|
Indiana
|
215,800 | 208,100 | 175,300 | |||||||||
|
Massachusetts
|
36,200 | 27,800 | — | |||||||||
|
Ohio
|
160,100 | 150,800 | 133,400 | |||||||||
|
South Carolina
|
90,300 | 48,600 | 31,300 | |||||||||
|
Texas
|
433,100 | 455,100 | 428,000 | |||||||||
|
Wisconsin
|
74,900 | 134,800 | 124,800 | |||||||||
|
Total at-risk membership
|
1,533,500 | 1,458,200 | 1,198,100 | |||||||||
|
Non-risk membership
|
4,200 | 63,700 | 3,700 | |||||||||
|
Total
|
1,537,700 | 1,521,900 | 1,201,800 | |||||||||
The following table sets forth our membership by line of business:
|
December 31,
|
||||||||||||
|
2010
|
2009
|
2008
|
||||||||||
|
Medicaid
|
1,177,100 | 1,081,400 | 877,400 | |||||||||
|
CHIP & Foster Care
|
210,500 | 263,600 | 257,300 | |||||||||
|
ABD & Medicare
|
104,600 | 82,800 | 61,300 | |||||||||
|
Hybrid Programs
|
36,200 | 27,800 | — | |||||||||
|
Long-term Care
|
5,100 | 2,600 | 2,100 | |||||||||
|
Total at-risk membership
|
1,533,500 | 1,458,200 | 1,198,100 | |||||||||
|
Non-risk membership
|
4,200 | 63,700 | 3,700 | |||||||||
|
Total
|
1,537,700 | 1,521,900 | 1,201,800 | |||||||||
The following table provides information for other membership categories:
|
December 31,
|
||||||||||||
|
2010
|
2009
|
2008
|
||||||||||
|
Cenpatico Behavioral Health:
|
||||||||||||
|
Kansas
|
39,200 | 41,400 | 41,100 | |||||||||
|
Arizona
|
174,600 | 120,100 | 105,000 | |||||||||
From December 31, 2009 to December 31, 2010 our membership changed as a result of:
|
Ÿ
|
acquisitions in Florida and South Carolina;
|
|
Ÿ
|
continued conversion of non-risk membership from Access to at-risk under Sunshine State Health Plan in Florida; and
|
|
Ÿ
|
decreased membership in Texas and Wisconsin as discussed above.
|
From December 31, 2008 to December 31, 2009 our membership increased in all of our states as a result of:
|
Ÿ
|
strong organic growth as a result of general economic conditions;
|
|
Ÿ
|
acquisitions in Florida and South Carolina;
|
|
Ÿ
|
the conversion of non-risk membership from Access to at-risk under Sunshine State Health Plan in Florida; and
|
|
Ÿ
|
expansion into Massachusetts under the state Commonwealth Care Bridge and Commonwealth Care programs.
|
RESULTS OF CONTINUING OPERATIONS
The following discussion and analysis is based on our consolidated statements of operations, which reflect our results of operations for the years ended December 31, 2010, 2009 and 2008, as prepared in accordance with generally accepted accounting principles in the United States.
Summarized comparative financial data for 2010, 2009 and 2008 are as follows ($ in millions):
|
2010
|
2009
|
2008
|
% Change 2009 - 2010
|
% Change 2008 - 2009
|
||||||||||||||||
|
Premium
|
$ | 4,192.2 | $ | 3,786.5 | $ | 3,199.3 | 10.7 | % | 18.4 | % | ||||||||||
|
Service
|
91.6 | 91.8 | 75.0 | (0.1 | ) % | 22.4 | % | |||||||||||||
|
Premium and service revenues
|
4,283.8 | 3,878.3 | 3,274.3 | 10.5 | % | 18.4 | % | |||||||||||||
|
Premium tax
|
164.5 | 224.6 | 90.2 | (26.8 | ) % | 149.0 | % | |||||||||||||
|
Total revenues
|
4,448.3 | 4,102.9 | 3,364.5 | 8.4 | % | 21.9 | % | |||||||||||||
|
Medical costs
|
3,514.4 | 3,163.5 | 2,640.3 | 11.1 | % | 19.8 | % | |||||||||||||
|
Cost of services
|
63.9 | 60.8 | 56.9 | 5.1 | % | 6.8 | % | |||||||||||||
|
General and administrative expenses
|
547.8 | 514.6 | 444.7 | 6.5 | % | 15.7 | % | |||||||||||||
|
Premium tax expense
|
165.1 | 225.9 | 91.0 | (26.9 | ) % | 148.3 | % | |||||||||||||
|
Earnings from operations
|
157.1 | 138.1 | 131.6 | 13.7 | % | 5.0 | % | |||||||||||||
|
Investment and other income, net
|
(2.8 | ) | (0.6 | ) | 5.0 | 344.5 | % | (112.4 | )% | |||||||||||
|
Earnings from continuing operations, before income tax expense
|
154.3 | 137.5 | 136.6 | 12.2 | % | 0.7 | % | |||||||||||||
|
Income tax expense
|
59.9 | 48.8 | 52.4 | 22.6 | % | (6.9 | )% | |||||||||||||
|
Earnings from continuing operations, net of income tax expense
|
94.4 | 88.7 | 84.2 | 6.4 | % | 5.3 | % | |||||||||||||
|
Discontinued operations, net of income tax expense (benefit) of $4.4, $(0.3) and $(31.6) respectively
|
3.9 | (2.4 | ) | (0.7 | ) | (260.6 | )% | 254.1 | % | |||||||||||
|
Net earnings
|
98.3 | 86.3 | 83.5 | 13.9 | % | 3.3 | % | |||||||||||||
|
Noncontrolling interest
|
3.5 | 2.6 | — | 33.4 | % | — | ||||||||||||||
|
Net earnings attributable to Centene Corporation
|
$ | 94.8 | $ | 83.7 | $ | 83.5 | 13.3 | % | 0.2 | % | ||||||||||
|
Amounts attributable to Centene Corporation common shareholders:
|
||||||||||||||||||||
|
Earnings from continuing operations, net of income tax expense
|
$ | 90.9 | $ | 86.1 | $ | 84.2 | 5.6 | % | 2.3 | % | ||||||||||
|
Discontinued operations, net of income tax expense (benefit)
|
3.9 | (2.4 | ) | (0.7 | ) | (260.6 | )% | 254.1 | % | |||||||||||
|
Net earnings
|
$ | 94.8 | $ | 83.7 | $ | 83.5 | 13.3 | % | 0.2 | % | ||||||||||
|
Diluted earnings (loss) per common share attributable to Centene Corporation:
|
||||||||||||||||||||
|
Continuing operations
|
$ | 1.80 | $ | 1.94 | $ | 1.90 | (7.2 | ) % | 2.1 | % | ||||||||||
|
Discontinued operations
|
0.08 | (0.05 | ) | (0.02 | ) | (260.0 | )% | (150.0 | )% | |||||||||||
|
Total diluted earnings per common share
|
$ | 1.88 | $ | 1.89 | $ | 1.88 | (0.5 | )% | 0.5 | % | ||||||||||
Overview
Revenues and Revenue Recognition
Our health plans generate revenues primarily from premiums we receive from the states in which we operate. We receive a fixed premium per member per month pursuant to our state contracts. We generally receive premium payments during the month we provide services and recognize premium revenue during the period in which we are obligated to provide services to our members. In some instances, our base premiums are subject to an adjustment, or risk score, based on the acuity of our membership. Generally, the risk score is determined by the state analyzing submissions of processed claims data to determine the acuity of our membership relative to the entire state’s membership. Some contracts allow for additional premium associated with certain supplemental services provided such as maternity deliveries. Revenues are recorded based on membership and eligibility data provided by the states, which may be adjusted by the states for updates to this data. These eligibility adjustments have been immaterial in relation to total revenue recorded and are reflected in the period known.
Our specialty services generate revenues under contracts with state programs, healthcare organizations, and other commercial organizations, as well as from our own subsidiaries. Revenues are recognized when the related services are provided or as ratably earned over the covered period of services.
Premium and service revenues collected in advance are recorded as unearned revenue. For performance-based contracts, we do not recognize revenue subject to refund until data is sufficient to measure performance. Premium and service revenues due to us are recorded as premium and related receivables and are recorded net of an allowance based on historical trends and our management’s judgment on the collectibility of these accounts. As we generally receive payments during the month in which services are provided, the allowance is typically not significant in comparison to total revenues and does not have a material impact on the presentation of our financial condition or results of operations.
Some states enact premium taxes, similar assessments and provider pass-through payments, collectively, premium taxes, and these taxes are recorded as a component of revenues as well as operating expenses. In 2009, one of the states in which we operate increased their premium which was required to be passed through to hospitals in the state. For the years ended December 31, 2010 and 2009, this pass-through totaled $84.2 million and $132.9 million. We exclude premium taxes from our key ratios as we believe the premium tax is a pass-through of costs and not indicative of our operating performance.
Operating Expenses
Medical Costs
Medical costs include payments to physicians, hospitals, and other providers for healthcare and specialty services claims. Medical costs also include estimates of medical expenses incurred but not yet reported, or IBNR, and estimates of the cost to process unpaid claims. We use our judgment to determine the assumptions to be used in the calculation of the required IBNR estimate. The assumptions we consider include, without limitation, claims receipt and payment experience (and variations in that experience), changes in membership, provider billing practices, healthcare service utilization trends, cost trends, product mix, seasonality, prior authorization of medical services, benefit changes, known outbreaks of disease or increased incidence of illness such as influenza, provider contract changes, changes to Medicaid fee schedules, and the incidence of high dollar or catastrophic claims.
Our development of the IBNR estimate is a continuous process which we monitor and refine on a monthly basis as claims receipts and payment information becomes available. As more complete information becomes available, we adjust the amount of the estimate, and include the changes in estimates in medical expense in the period in which the changes are identified.
Additionally, we contract with independent actuaries to review our estimates on a quarterly basis. The independent actuaries provide us with a review letter that includes the results of their analysis of our medical claims liability. We do not solely rely on their report to adjust our claims liability. We utilize their calculation of our claims liability only as additional information, together with management’s judgment to determine the assumptions to be used in the calculation of our liability for medical costs.
While we believe our IBNR estimate is appropriate, it is possible future events could require us to make significant adjustments for revisions to these estimates. Accordingly, we can not assure you that healthcare claim costs will not materially differ from our estimates.
Results of operations depend on our ability to manage expenses associated with health benefits and to accurately predict costs incurred. The health benefits ratio, or HBR, represents medical costs as a percentage of premium revenues (excluding premium taxes) and reflects the direct relationship between the premium received and the medical services provided.
Cost of Services
Cost of services expense includes the pharmaceutical costs associated with our pharmacy benefit manager’s external revenues and certain direct costs to support the functions responsible for generation of our services revenues. These expenses consist of the salaries and wages of the professionals who provide the services and associated expenses.
General and Administrative Expenses
General and administrative expenses, or G&A, primarily reflect wages and benefits, including stock compensation expense, and other administrative costs associated with our health plans, specialty companies and centralized functions that support all of our business units. Our major centralized functions are finance, information systems and claims processing. G&A expenses also include business expansion costs, such as wages and benefits for administrative personnel, contracting costs, and information technology buildouts, incurred prior to the commencement of a new contract or health plan.
The G&A expense ratio represents G&A expenses as a percentage of premium and service revenues, and reflects the relationship between revenues earned and the costs necessary to earn those revenues.
Other Income (Expense)
Other income (expense) consists principally of investment income from cash and investments, earnings in equity method investments, and interest expense on debt.
Discontinued Operations
In November 2008, we announced our intention to sell certain assets of UHP, our New Jersey health plan. Accordingly, the results of operations for UHP are reported as discontinued operations for all periods presented. We completed the sale in the first quarter of 2010.
Year Ended December 31, 2010 Compared to Year Ended December 31, 2009
Revenues
Premium and service revenues increased 10.5% in 2010 over 2009 as a result of membership growth discussed under the heading “Membership”, and net premium rate increases in 2010. The premium rates specified in our state contracts are generally updated on an annual basis through contract amendments. In 2010, we received premium rate adjustments in certain markets which yielded a net 2.3% composite increase across all of our markets. The increase in premium and service revenues was moderated by the removal of pharmacy services in two states in 2010. These pharmacy carve outs had the effect of reducing revenue by approximately $185.0 million during 2010.
Operating Expenses
Medical Costs
The table below depicts the HBR for our external membership by member category:
|
Year Ended December 31,
|
||||||||
|
2010
|
2009
|
|||||||
|
Medicaid and CHIP
|
83.6 | % | 84.6 | % | ||||
|
ABD and Medicare
|
85.0 | 81.1 | ||||||
|
Specialty Services
|
83.4 | 80.2 | ||||||
|
Total
|
83.8 | 83.5 | ||||||
The consolidated HBR of 83.8% for 2010 represented a 0.3% increase from the 2009 consolidated HBR of 83.5%. The increase is mainly due to our Florida and Texas health plans and is partially offset by improvements from our Georgia health plan. The impact from our Florida health plan is due to the higher HBR we have experienced in this market combined with the growth in membership and revenue from 2009 to 2010. The Texas health plan performance was impacted in 2010 as member mix shifted to less favorable HBR categories. The improvements from the Georgia health plan are due to provider network and utilization management initiatives.
General and Administrative Expenses
The consolidated G&A expense ratio for the years ended December 31, 2010 and 2009 was 12.8% and 13.3%, respectively. The decrease in the ratio in 2010 primarily reflects the leveraging of our expenses over higher revenues, partially offset by an increase in contributions to our charitable foundation as well as increased business expansion costs.
Investment and Other Income, Net
The following table summarizes the components of investment and other income, net ($ in millions):
|
Year Ended December 31,
|
||||||||
|
2010
|
2009
|
|||||||
|
Investment income
|
$ | 14.9 | $ | 15.6 | ||||
|
Net gain on sale of investments
|
2.5 | 0.1 | ||||||
|
Impairment of investment
|
(5.5 | ) | — | |||||
|
Gain on Reserve Primary Fund distributions
|
3.3 | — | ||||||
|
Interest expense
|
(18.0 | ) | (16.3 | ) | ||||
|
Investment and other income, net
|
$ | (2.8 | ) | $ | (0.6 | ) | ||
The decrease in investment income in 2010 reflects the decline in market interest rates.
In September 2010, we determined we had an other-than-temporary impairment of our investment in Casenet, LLC, a company that provides software to automate the clinical, administrative, and technical components of care management programs. As a result, the Company recorded an impairment charge of $5,531, including $3,531 of convertible promissory notes.
Additionally, we are a customer of Casenet, LLC and in December 2010, we purchased an additional investment interest in exchange for majority control of Casenet, LLC.
As a result of tightening our investment criteria for municipal securities, we sold municipal securities resulting in net gains of $2.5 million during 2010. Also in
2010, we received distributions from the Reserve Primary Fund of $5.7 million resulting in a gain of $3.3 recorded for the distributions received in excess of our adjusted basis.
Interest expense increased reflecting the borrowings on the loans associated with the construction of our corporate headquarters. The real estate development was placed in service in the third quarter 2010 and accordingly we ceased capitalizing interest on the project. The increase was partially offset by the reduction in debt outstanding under our revolving credit agreement as a result of the equity offering completed during the first quarter of 2010.
Income Tax Expense
Excluding the amounts attributable to noncontrolling interest, our effective tax rate in 2010 was 39.7% compared to 36.2% in 2009. The increase in 2010 was primarily driven by legislation enacted in May 2010 in the state of Georgia which replaced the state income tax with a premium tax for Medicaid managed care organizations effective July 1, 2010. Accordingly, a deferred tax asset of $1.7 million related to Georgia state net operating loss carry forwards was written off during the second quarter. Additionally, the increase in the effective tax rate in 2010 was also related to a decrease in tax exempt interest and an increase in state income taxes.
Discontinued Operations
Pre-tax earnings related to discontinued operations (consisting solely of the New Jersey health plan operations) were $8.3 million in 2010 compared to a pre-tax loss of $3.6 million in 2009. As a result of the sale of certain assets of the New Jersey operations in March 2010, we recognized a pre-tax gain of $8.2 million, which was $3.9 million after tax, or $0.08 per diluted share. Additionally, we recognized $1.2 million of restructuring costs associated with the exit primarily due to lease termination costs and employee retention programs. The total revenue associated with UHP included in results from discontinued operations was $21.8 million and $145.1 million for 2010 and 2009, respectively. UHP had remaining statutory capital of approximately $2.5 million at December 31, 2010, which will be transferred to unregulated cash as operations wind-down, subject to regulatory approval.
Segment Results
The following table summarizes our operating results by segment ($ in millions):
|
2010
|
2009
|
% Change
2009-2010
|
||||||||||
|
Premium and Service Revenues
|
||||||||||||
|
Medicaid Managed Care
|
$ | 3,740.5 | $ | 3,464.8 | 8.0 | % | ||||||
|
Specialty Services
|
1,112.1 | 1,049.5 | 6.0 | % | ||||||||
|
Eliminations
|
(568.8 | ) | (636.0 | ) | (10.6 | ) % | ||||||
|
Consolidated Total
|
$ | 4,283.8 | $ | 3,878.3 | 10.5 | % | ||||||
|
Earnings from Operations
|
||||||||||||
|
Medicaid Managed Care
|
$ | 117.1 | $ | 99.3 | 17.9 | % | ||||||
|
Specialty Services
|
40.0 | 38.8 | 2.9 | % | ||||||||
|
Consolidated Total
|
$ | 157.1 | $ | 138.1 | 13.7 | % | ||||||
Medicaid Managed Care
Premium and service revenues increased 8.0% in 2010 due to membership growth and net premium rate increases in 2010. Earnings from operations increased 17.9% in 2010 reflecting overall growth in our membership and leveraging of our general and administrative expenses.
Specialty Services
Premium and service revenues increased 6.0% in 2010 primarily due to growth of our operations in Massachusetts, as well as membership growth in our Medicaid segment and the associated specialty services provided to this increased membership. Earnings from operations increased 2.9% in 2010 reflecting the growth in service revenue for lower margin services, higher HBR in 2010, and the effect of pharmacy carve outs in two states.
Year Ended December 31, 2009 Compared to Year Ended December 31, 2008
Revenues
Premium and service revenues increased 18.4% in 2009 over 2008 as a result of membership growth in all our states discussed under the heading “Membership”, the effect of a full year of the Celtic acquisition in July 2008, and premium rate increases. The premium rates specified in our state contracts are generally updated on an annual basis through contract amendments. In 2009, we received premium rate increases in certain markets which yielded a 2.9% composite increase across all of our markets.
In November 2007, we received a contract amendment from the State of Georgia providing for an effective premium rate increase in Georgia effective July 1, 2007. The State of Georgia returned the fully executed contract in January 2008 and, accordingly, we recorded the additional revenue, retroactive to July 1, 2007, in the first quarter of 2008. The premium revenue, related to the period from July 1, 2007 to December 31, 2007, totals approximately $20.8 million.
Contract amendments related to rate increases for the Georgia health plan effective July 1, 2009 and July 1, 2010 were not fully executed until the respective fourth quarters and accordingly, the premium revenue from July 1 to September 30 was recorded in the fourth quarter in each respective year.
Operating Expenses
Medical Costs
The table below depicts the HBR for our external membership by member category:
|
Year Ended December 31,
|
||||||||
|
2009
|
2008
|
|||||||
|
Medicaid and CHIP
|
84.6 | % | 80.6 | % | ||||
|
ABD and Medicare
|
81.1 | 91.1 | ||||||
|
Specialty Services
|
80.2 | 83.8 | ||||||
|
Total
|
83.5 | 82.5 | ||||||
The consolidated HBR for the year ended December 31, 2009 was 83.5%, an increase of 1.0% over 2008. The increase in the total HBR in 2009 as compared to 2008 is due to the effect of the following items:
|
Ÿ
|
recording the Georgia premium rate increase for the period from July 1, 2007 to December 31, 2007 during the first quarter of 2008 had the effect of decreasing the HBR in 2008 by 0.6%;
|
|
Ÿ
|
a March 1, 2009 rate decrease for our CHIP/Perinate product in Texas which brought the HBR more in line with our normal range;
|
|
Ÿ
|
higher HBR in our Florida market; and
|
|
Ÿ
|
additional costs related to the flu.
|
These factors were partially offset by reductions in the HBR for our ABD product, particularly due to provider network improvements and exiting certain markets in Ohio, and growth in our South Carolina ABD membership which operates at a lower HBR than our normal range. The decrease in our ABD HBR lowered our total HBR by 1.7% for the year ended December 31, 2009.
General and Administrative Expenses
The consolidated G&A expense ratio for the years ended December 31, 2009 and 2008 was 13.3% and 13.6%, respectively. The decrease in the ratio in 2009 primarily reflects the leveraging of our expenses over higher revenues, partially offset by the effect of the acquisition of Celtic, our business expansion costs for Florida, Massachusetts and Mississippi and the consolidation of Access.
Investment and Other Income, Net
|
The following table summarizes the components of investment and other income, net ($ in millions):
|
|
Year Ended December 31,
|
||||||||
|
2009
|
2008
|
|||||||
|
Investment income
|
$ | 15.7 | $ | 19.8 | ||||
|
Earnings from equity method investee
|
— | 6.4 | ||||||
|
Loss on Reserve Primary Fund
|
— | (4.5 | ) | |||||
|
Interest expense
|
(16.3 | ) | (16.7 | ) | ||||
|
Investment and other income, net
|
$ | (0.6 | ) | $ | 5.0 | |||
Decreases in investment income in 2009 reflect the decline in market interest rates.
The 2008 results included a loss of $4.5 million related to our investment in the Reserve Primary money market fund whose Net Asset Value fell below $1.00 per share.
Earnings from equity method investee decreased due to the inclusion of investment in Access as a consolidated subsidiary beginning in 2009. Interest expense was relatively stable reflecting modest increases in debt balances offset by the decline in market interest rates associated with variable rate debt.
Income Tax Expense
Excluding the amounts attributable to noncontrolling interest, our effective tax rate in 2009 was 36.2% compared to 38.4% in 2008. The decrease in 2009 was primarily related to an increase in 2008 due to a change in the estimated benefit to be realized from New Jersey state net operating loss carryforwards.
Discontinued Operations
The pre-tax loss from discontinued operations was $3.6 million in 2009 and $1.0 million in 2008. Legal expenses of $1.8 million and employee retention expenses of $3.6 million related to the pending sale of UHP were included in the results from discontinued operations during 2009. The 2008 results include a one-time charge of $3.7 million primarily for asset impairments and employee severance related to the sale.
Segment Results
The following table summarizes our operating results by segment ($ in millions):
|
2009
|
2008
|
% Change
2008-2009
|
||||||||||
|
Premium and Service Revenues
|
||||||||||||
|
Medicaid Managed Care
|
$ | 3,464.8 | $ | 2,992.3 | 15.8 | % | ||||||
|
Specialty Services
|
1,049.5 | 816.5 | 28.5 | % | ||||||||
|
Eliminations
|
(636.0 | ) | (534.5 | ) | 19.0 | % | ||||||
|
Consolidated Total
|
$ | 3,878.3 | $ | 3,274.3 | 18.4 | % | ||||||
|
Earnings from Operations
|
||||||||||||
|
Medicaid Managed Care
|
$ | 99.3 | $ | 108.4 | (8.4 | ) % | ||||||
|
Specialty Services
|
38.8 | 23.2 | 67.4 | % | ||||||||
|
Consolidated Total
|
$ | 138.1 | $ | 131.6 | 5.0 | % | ||||||
Medicaid Managed Care
Premium and service revenues increased 15.8% in 2009 due to membership growth in our states, especially Florida, Indiana, South Carolina and Texas. Earnings from operations decreased in 2009 from 2008 levels due to the aforementioned effect of the Georgia rate increase. Excluding the effects of recording this rate increase in 2008, earnings from operations increased 13.4% in 2009 over 2008 levels reflecting the overall growth in our membership and revenue base and improvements in our ABD product, especially in Ohio and South Carolina. This increase was partially offset by a rate decrease in Texas, higher medical costs related to the flu, and a higher HBR in Florida.
Specialty Services
Premium and service revenues increased 28.5% in 2009 primarily due to a full year effect of the Celtic acquisition, the commencement of our new health plan in Massachusetts, and membership growth in our Medicaid segment and the associated specialty services provided to this increased membership. Earnings from operations increased 67.4% in 2009 from 2008 levels primarily due to the increase in revenue and leveraging of the segments infrastructure costs over this higher revenue base. Earnings from operations also increased due to a lower HBR.
LIQUIDITY AND CAPITAL RESOURCES
Shown below is a condensed schedule of cash flows for the years ended December 31, 2010, 2009 and 2008, that we use throughout our discussion of liquidity and capital resources ($ in millions).
|
Year Ended December 31,
|
||||||||||||
|
2010
|
2009
|
2008
|
||||||||||
|
Net cash provided by operating activities
|
$
|
168.9
|
$
|
248.2
|
$
|
222.0
|
||||||
|
Net cash used in investing activities
|
(210.6
|
)
|
(270.1
|
)
|
(153.9
|
)
|
||||||
|
Net cash provided by financing activities
|
72.1
|
46.6
|
42.4
|
|||||||||
|
Net increase in cash and cash equivalents
|
$
|
30.4
|
$
|
24.7
|
$
|
110.5
|
||||||
Normal operations are funded primarily through operating cash flows and borrowings under our revolving credit facility. Operating activities provided cash of $168.9 million in 2010, compared to $248.2 million in 2009 and $222.0 million in 2008. Cash flows from operations benefited in 2010 and 2009 as a result of prepayments from several of our states. We record prepayments from our states as unearned revenue. Cash flows from operations in 2010 also reflected an increase in premium and related receivables due to increased business in Florida, Massachusetts and South Carolina. As of December 31, 2010, we had unearned revenues and premium and related receivables of approximately $117.3 million and $136.2 million, respectively, representing advance payments and receivables from our state customers.
The table below details the impact to cash flows from operations from the timing of payments from our states ($ in millions).
|
Year Ended December 31,
|
||||||||||||
|
2010
|
2009
|
2008
|
||||||||||
|
Premium and related receivables
|
$
|
(23.4
|
)
|
$
|
2.4
|
$
|
(1.5)
|
|||||
|
Unearned revenue
|
25.7
|
78.3
|
(36.5)
|
|||||||||
|
Net increase (decrease) in operating cash flow
|
$
|
2.3
|
$
|
80.7
|
$
|
(38.0)
|
||||||
Cash flows from operations in 2009 also reflected an increase in medical claims liability primarily as a result of increased business in Florida, Massachusetts and South Carolina. Cash flows from operations in 2008 reflected an increase in our medical claims liability as a result of new business in Texas, South Carolina and Arizona.
Investing activities used cash of $210.6 million in 2010, $270.1 million in 2009 and $153.9 million in 2008. Cash flows from investing activities in 2010 and 2009 primarily consisted of additions to the investment portfolio of our regulated subsidiaries, including transfers from cash and cash equivalents to long-term investments, and capital expenditures. In 2009, cash flows from investing activities also include membership conversion fees in Florida and acquisitions in Florida and South Carolina. Cash flows from investing activities in 2008 included the acquisition of Celtic, which we acquired on July 1, 2008, capital expenditures and our investment in the Reserve Primary fund.
Our investment policies are designed to provide liquidity, preserve capital and maximize total return on invested assets within our guidelines. Net cash provided by and used in investing activities will fluctuate from year to year due to the timing of investment purchases, sales and maturities. As of December 31, 2010, our investment portfolio consisted primarily of fixed-income securities with an average duration of 2.2 years. These securities generally are actively traded in secondary markets and the reported fair market value is determined based on recent trading activity, recent trading activity in similar securities and other observable inputs. Our investment guidelines are compliant with the regulatory restrictions enacted in each state.
The following table summarizes our cash and investment balances as of December 31, ($ in millions):
|
2010
|
2009
|
|||||||
|
Cash, cash equivalents and short-term investments
|
$ | 455.2 | $ | 440.5 | ||||
|
Long-term investments
|
595.9 | 525.5 | ||||||
|
Restricted deposits
|
22.8 | 20.1 | ||||||
|
Total cash, investments and restricted deposits
|
$ | 1,073.9 | $ | 986.1 | ||||
|
Regulated cash, investments and restricted deposits
|
$ | 1,043.0 | $ | 949.9 | ||||
|
Unregulated cash and investments
|
30.9 | 36.2 | ||||||
|
Consolidated Total
|
$ | 1,073.9 | $ | 986.1 | ||||
|
Regulated cash and investments from discontinued operations
1
|
$ | 4.2 | $ | 24.9 | ||||
|
________________________
1
Upon payment of remaining UHP medical claims liabilities and other liabilities, substantially all of the remaining regulated cash of UHP will be transferred to our unregulated cash.
|
||||||||
We spent $31.7 million, $23.2 million and $44.1 million in 2010, 2009 and 2008, respectively, on capital expenditures for system enhancements and market expansions. We also spent $31.6 million, $0.5 million, and $21.1 million in 2010, 2009 and 2008, respectively, for costs associated with our headquarters development including land, tenant improvements and furniture. We anticipate spending approximately $55 million on capital expenditures in 2011 primarily associated with system enhancements and market expansions.
During the second quarter of 2009, we executed an agreement as a joint venture partner in an entity, Centene Center LLC, for the construction of a real estate development that includes the Company’s corporate headquarters. For the years ended December 31, 2010 and 2009, Centene Center LLC had capital expenditures of $55.3 million and $59.4 million, respectively, for costs associated with the real estate development. The development was placed into service in the third quarter of 2010. We anticipate spending approximately $10 million on capital expenditures in 2011 associated with the real estate development.
In June 2009, our real estate joint venture executed a $95 million construction loan associated with the development. In December 2010, we acquired the remaining ownership interest in the joint venture and refinanced the $95 million construction loan with an $80 million 10 year mortgage note payable. The mortgage note is non-recourse to the Company, bears a 5.14% interest rate and has a financial covenant requiring a minimum debt service coverage ratio.
Our financing activities provided cash of $72.1 million in 2010, $46.6 million in 2009 and $42.4 million in 2008. During 2010, our financing activities primarily related to proceeds from our stock offering and resulting payoff of our revolving credit facility discussed below, as well as borrowings for the construction of the real estate development discussed above. During 2009, our financing activities primarily related to proceeds from borrowings under our $300 million credit facility and construction financing of the real estate development discussed above. During 2008, our financing activities primarily related to borrowings under our $300 million revolver and stock repurchases.
During the first quarter of 2010, we completed the sale of 5.75 million shares of common stock for $19.25 per share. Net proceeds from the sale of the shares were approximately $104.5 million. A portion of the net proceeds was used to repay the outstanding indebtedness under our $300 million revolving credit loan facility ($84.0 million as of December 31, 2009). The remaining net proceeds have been used to fund our acquisition in South Carolina as well as capital expenditures.
At December 31, 2010, we had working capital, defined as current assets less current liabilities, of $(108.4) million, as compared to $(99.8) million at December 31, 2009. We manage our short-term and long-term investments with the goal of ensuring that a sufficient portion is held in investments that are highly liquid and can be sold to fund short-term requirements as needed. Our working capital was negative due to our efforts to increase investment returns through purchases of investments that have maturities of greater than one year and, therefore, are classified as long-term.
At December 31, 2010, our debt to capital ratio, defined as total debt divided by the sum of total debt and total equity, was 29.3%, compared to 33.2% at December 31, 2009. Excluding the $80.0 million non-recourse mortgage note, our debt to capital ratio is 23.9%. We utilize the debt to capital ratio as a measure, among others, of our leverage and financial flexibility.
We had a $300 million revolving credit agreement which bore interest based upon LIBOR rates, the Federal Funds Rate or the Prime Rate. As of December 31, 2010, we had $60.0 million in borrowings outstanding under the agreement and $41.6 million in letters of credit outstanding, leaving availability of $198.4 million. As of December 31, 2010, we were in compliance with all covenants.
In January 2011, we replaced the $300 million revolving credit agreement with a new $350 million revolving credit facility, or the revolver. The revolver is unsecured and has a five-year maturity with non-financial and financial covenants, including requirements of minimum fixed charge coverage ratios, maximum debt to EBITDA ratios and minimum net worth. Borrowings under the revolver will bear interest based upon LIBOR rates, the Federal funds rate, or the prime rate. There is a commitment fee on the unused portion of the agreement that ranges from 0.25% to 0.50% depending on the total debt to EBITDA ratio. As a result of the refinancing, the outstanding balance associated with the previous revolving credit agreement continues to be classified as long term as of December 31, 2010.
We have a stock repurchase program authorizing us to repurchase up to four million shares of common stock from time to time on the open market or through privately negotiated transactions. No duration has been placed on the repurchase program, however the terms of the Senior Notes require that all such redemptions are consummated on or before April 1, 2011. We reserve the right to discontinue the repurchase program at any time. We did not make any repurchases under this plan during 2010.
During the year ended December 31, 2010, we received dividends of $67.9 million from our regulated subsidiaries. During the year ended December 31, 2009, we received dividends of $19.1 million from our regulated subsidiaries. On July 1, 2008 we completed the acquisition of Celtic for a purchase price of approximately $82.0 million, net of unregulated cash acquired. During the year ended December 31, 2008, the Company received a dividend from Celtic of $31.4 million concurrent with the acquisition, and received an additional dividend of $17.0 million from a regulated subsidiary.
Based on our operating plan, we expect that our available cash, cash equivalents and investments, cash from our operations and cash available under our credit facility will be sufficient to finance our general operations and capital expenditures for at least 12 months from the date of this filing.
CONTRACTUAL OBLIGATIONS
The following table summarizes future contractual obligations. These obligations contain estimates and are subject to revision under a number of circumstances. Our debt consists of borrowings from our senior notes, credit facility, mortgages and capital leases. The purchase obligations consist primarily of software purchase and maintenance contracts. The contractual obligations and estimated period of payment over the next five years and beyond are as follows (in thousands):
|
Payments Due by Period
|
||||||||||||||||||||
|
Total
|
Less Than
1 Year
|
1-3
Years
|
3-5
Years
|
More Than
5 Years
|
||||||||||||||||
|
Medical claims liability
|
$ | 456,765 | $ | 456,765 | $ | — | $ | — | $ | — | ||||||||||
|
Debt
|
330,641 | 2,817 | 6,496 | 189,492 | 131,836 | |||||||||||||||
|
Operating lease obligations
|
67,797 | 18,444 | 25,119 | 14,370 | 9,864 | |||||||||||||||
|
Purchase obligations
|
42,887 | 21,066 | 16,440 | 4,981 | 400 | |||||||||||||||
|
Interest on long-term debt
1
|
44,406 | 12,688 | 25,375 | 6,343 | — | |||||||||||||||
|
Reserve for uncertain tax positions
|
1,668 | 515 | 1,153 | — | — | |||||||||||||||
|
Other long-term liabilities
2
|
52,055 | — | 18,084 | 7,288 | 26,683 | |||||||||||||||
|
Total
|
$ | 996,219 | $ | 513,295 | $ | 92,667 | $ | 222,474 | $ | 168,783 | ||||||||||
|
________________________________
1
Interest on $175,000 Senior Notes.
2
Includes $8,326 separate account liabilities from third party
reinsurance that will not be settled in cash.
|
||||||||||||||||||||
REGULATORY CAPITAL AND DIVIDEND RESTRICTIONS
Our operations are conducted through our subsidiaries. As managed care organizations, these subsidiaries are subject to state regulations that, among other things, require the maintenance of minimum levels of statutory capital, as defined by each state, and restrict the timing, payment and amount of dividends and other distributions that may be paid to us. Generally, the amount of dividend distributions that may be paid by a regulated subsidiary without prior approval by state regulatory authorities is limited based on the entity’s level of statutory net income and statutory capital and surplus.
Our subsidiaries are required to maintain minimum capital requirements prescribed by various regulatory authorities in each of the states in which we operate. As of December 31, 2010, our subsidiaries had aggregate statutory capital and surplus of $516.1 million, compared with the required minimum aggregate statutory capital and surplus requirements of $308.0 million and we estimate our Risk Based Capital, or RBC, percentage to be in excess of 350% of the Authorized Control Level.
The National Association of Insurance Commissioners has adopted rules which set minimum risk-based capital requirements for insurance companies, managed care organizations and other entities bearing risk for healthcare coverage. As of December 31, 2010, each of our health plans were in compliance with the risk-based capital requirements enacted in those states.
RECENT ACCOUNTING PRONOUNCEMENTS
For this information, refer to Note 2,
Summary of Significant Accounting Policies
, in the Notes to the Consolidated Financials Statements, included herein.
CRITICAL ACCOUNTING POLICIES AND ESTIMATES
Our discussion and analysis of our results of operations and liquidity and capital resources are based on our consolidated financial statements which have been prepared in accordance with GAAP. In connection with the preparation of our consolidated financial statements, we are required to make assumptions and estimates about future events, and apply judgments that affect the reported amounts of assets, liabilities, revenue, expenses, and the related disclosures. We base our assumptions, estimates and judgments on historical experience, current trends and other factors we believe to be relevant at the time we prepared our consolidated financial statements. On a regular basis, we review the accounting policies, assumptions, estimates and judgments to ensure that our consolidated financial statements are presented fairly and in accordance with GAAP. However, because future events and their effects cannot be determined with certainty, actual results could differ from our assumptions and estimates, and such differences could be material.
Our significant accounting policies are more fully described in Note 2,
Summary of Significant Accounting Policies,
to our consolidated financial statements included elsewhere herein. Our accounting policies regarding medical claims liability and intangible assets are particularly important to the portrayal of our financial position and results of operations and require the application of significant judgment by our management. As a result, they are subject to an inherent degree of uncertainty. We have reviewed these critical accounting policies and related disclosures with the Audit Committee of our Board of Directors.
Medical claims liability
Our medical claims liability includes claims reported but not yet paid, or inventory, estimates for claims incurred but not reported, or IBNR, and estimates for the costs necessary to process unpaid claims at the end of each period. We estimate our medical claims liability using actuarial methods that are commonly used by health insurance actuaries and meet Actuarial Standards of Practice. These actuarial methods consider factors such as historical data for payment patterns, cost trends, product mix, seasonality, utilization of healthcare services and other relevant factors.
Actuarial Standards of Practice generally require that the medical claims liability estimates be adequate to cover obligations under moderately adverse conditions. Moderately adverse conditions are situations in which the actual claims are expected to be higher than the otherwise estimated value of such claims at the time of estimate. In many situations, the claims amounts ultimately settled will be different than the estimate that satisfies the Actuarial Standards of Practice. We include in our IBNR an estimate for medical claims liability under moderately adverse conditions which represents the risk of adverse deviation of the estimates in our actuarial method of reserving.
We use our judgment to determine the assumptions to be used in the calculation of the required estimates. The assumptions we consider when estimating IBNR include, without limitation, claims receipt and payment experience (and variations in that experience), changes in membership, provider billing practices, healthcare service utilization trends, cost trends, product mix, seasonality, prior authorization of medical services, benefit changes, known outbreaks of disease or increased incidence of illness such as influenza, provider contract changes, changes to fee schedules, and the incidence of high dollar or catastrophic claims.
We apply various estimation methods depending on the claim type and the period for which claims are being estimated. For more recent periods, incurred non-inpatient claims are estimated based on historical per member per month claims experience adjusted for known factors. Incurred hospital inpatient claims are estimated based on known inpatient utilization data and prior claims experience adjusted for known factors. For older periods, we utilize an estimated completion factor based on our historical experience to develop IBNR estimates. The completion factor is an actuarial estimate of the percentage of claims incurred during a given period that have been received or adjudicated as of the reporting period to the estimate of the total ultimate incurred costs. When we commence operations in a new state or region, we have limited information with which to estimate our medical claims liability. See “Risk Factors – Failure to accurately predict our medical expenses could negatively affect our financial position, results of operations or cash flows.” These approaches are consistently applied to each period presented.
Additionally, we contract with independent actuaries to review our estimates on a quarterly basis. The independent actuaries provide us with a review letter that includes the results of their analysis of our medical claims liability. We do not solely rely on their report to adjust our claims liability. We utilize their calculation of our claims liability only as additional information, together with management’s judgment to determine the assumptions to be used in the calculation of our liability for claims.
Our development of the medical claims liability estimate is a continuous process which we monitor and refine on a monthly basis as additional claims receipts and payment information becomes available. As more complete claim information becomes available, we adjust the amount of the estimates, and include the changes in estimates in medical costs in the period in which the changes are identified. In every reporting period, our operating results include the effects of more completely developed medical claims liability estimates associated with previously reported periods. We consistently apply our reserving methodology from period to period. As additional information becomes known to us, we adjust our actuarial model accordingly to establish medical claims liability estimates.
The paid and received completion factors, claims per member per month and per diem cost trend factors are the most significant factors affecting the IBNR estimate. The following table illustrates the sensitivity of these factors and the estimated potential impact on our operating results caused by changes in these factors based on December 31, 2010 data:
|
Completion Factors (1):
|
|
Cost Trend Factors (2):
|
|||||||||
|
(Decrease)
Increase
in Factors
|
|
Increase
(Decrease) in
Medical Claims
Liabilities
|
(Decrease)
Increase
in Factors
|
|
Increase
(Decrease) in
Medical Claims
Liabilities
|
||||||
|
|
(in thousands)
|
|
(in thousands)
|
||||||||
|
(2.0
|
)%
|
$
|
63,000
|
(2.0
|
)%
|
$
|
(15,900
|
)
|
|||
|
(1.5
|
)
|
|
47,000
|
(1.5
|
)
|
(11,900
|
)
|
||||
|
(1.0
|
)
|
|
31,100
|
(1.0
|
)
|
(7,900
|
)
|
||||
|
(0.5
|
)
|
|
15,600
|
(0.5
|
)
|
(4,000
|
)
|
||||
|
0.5
|
|
(15,400
|
)
|
0.5
|
4,000
|
||||||
|
1.0
|
|
(30,500
|
)
|
1.0
|
8,100
|
||||||
|
1.5
|
|
(45,500
|
)
|
1.5
|
12,100
|
||||||
|
2.0
|
|
(60,500
|
)
|
2.0
|
16,200
|
||||||
|
(1)
|
Reflects estimated potential changes in medical claims liability caused by changes in completion factors.
|
|
(2)
|
Reflects estimated potential changes in medical claims liability caused by changes in cost trend factors for the most recent periods.
|
While we believe our estimates are appropriate, it is possible future events could require us to make significant adjustments for revisions to these estimates. For example, a 1% increase or decrease in our estimated medical claims liability would have affected net earnings by $2.8 million for the year ended December 31, 2010. The estimates are based on our historical experience, terms of existing contracts, our observance of trends in the industry, information provided by our providers and information available from other outside sources.
The change in medical claims liability is summarized as follows (in thousands):
|
|
Year Ended December 31,
|
|||||||||||
|
|
2010
|
2009
|
2008
|
|||||||||
|
Balance, January 1
|
|
$
|
470,932
|
$
|
384,360
|
$
|
323,741
|
|||||
|
Acquisitions
|
|
—
|
—
|
15,398
|
||||||||
|
Incurred related to:
|
|
|||||||||||
|
Current year
|
|
3,582,463
|
3,216,533
|
2,659,036
|
||||||||
|
Prior years
|
|
(68,069
|
)
|
(53,010
|
)
|
(18,701
|
)
|
|||||
|
Total incurred
|
|
3,514,394
|
3,163,523
|
2,640,335
|
||||||||
|
Paid related to:
|
|
|||||||||||
|
Current year
|
|
3,133,527
|
2,752,983
|
2,292,150
|
||||||||
|
Prior years
|
|
395,034
|
323,968
|
302,964
|
||||||||
|
Total paid
|
|
3,528,561
|
3,076,951
|
2,595,114
|
||||||||
|
Balance, December 31
|
|
$
|
456,765
|
$
|
470,932
|
$
|
384,360
|
|||||
|
|
||||||||||||
|
Claims inventory, December 31
|
|
434,900
|
423,400
|
269,300
|
||||||||
|
Days in claims payable
1
|
|
45.6
|
50.1
|
49.9
|
||||||||
|
________________________
1
Days in claims payable is a calculation of medical claims liability at the end of the period divided by average expense per calendar day for the fourth quarter of each year.
|
||||||||||||
The acquisition in 2008 includes reserves acquired in connection with our acquisition of Celtic.
Medical claims are usually paid within a few months of the member receiving service from the physician or other healthcare provider. As a result, the liability generally is described as having a “short-tail,” which causes less than 5% of our medical claims liability as of the end of any given year to be outstanding the following year. We believe that substantially all the development of the estimate of medical claims liability as of December 31, 2010 will be known by the end of 2011.
Changes in estimates of incurred claims for prior years are primarily attributable to reserving under moderately adverse conditions. In addition, claims processing initiatives yielded increased claim payment recoveries and coordination of benefits related to prior year dates of service. Changes in medical utilization and cost trends and the effect of medical management initiatives may also contribute to changes in medical claim liability estimates. While we have evidence that medical management initiatives are effective on a case by case basis, medical management initiatives primarily focus on events and behaviors prior to the incurrence of the medical event and generation of a claim. Accordingly, any change in behavior, leveling of care, or coordination of treatment occurs prior to claim generation and as a result, the costs prior to the medical management initiative are not known by us. Additionally, certain medical management initiatives are focused on member and provider education with the intent of influencing behavior to appropriately align the medical services provided with the member’s acuity. In these cases, determining whether the medical management initiative changed the behavior cannot be determined. Because of the complexity of our business, the number of states in which we operate, and the volume of claims that we process, we are unable to practically quantify the impact of these initiatives on our changes in estimates of IBNR.
The following medical management initiatives may have contributed to the favorable development through lower medical utilization and cost trends:
|
Ÿ
|
Appropriate leveling of care for neonatal intensive care unit hospital admissions, other inpatient hospital admissions, and observation admissions, in accordance with Interqual criteria.
|
|
Ÿ
|
Tightening of our pre-authorization list and more stringent review of durable medical equipment and injectibles.
|
|
Ÿ
|
Emergency department, or ED, program designed to collaboratively work with hospitals to steer non-emergency care away from the costly ED setting (through patient education, on-site alternative urgent care settings, etc.)
|
|
Ÿ
|
Increase emphasis on case management and clinical rounding where case managers are nurses or social workers who are employed by the health plan to assist selected patients with the coordination of healthcare services in order to meet a patient's specific healthcare needs.
|
|
Ÿ
|
Incorporation of disease management which is a comprehensive, multidisciplinary, collaborative approach to chronic illnesses such as asthma.
|
Goodwill and Intangible Assets
We have made several acquisitions that have resulted in our recording of intangible assets. These intangible assets primarily consist of customer relationships, purchased contract rights, provider contracts, trade names and goodwill. At December 31, 2010, we had $278.1 million of goodwill and $29.1 million of other intangible assets.
Intangible assets are amortized using the straight-line method over the following periods:
|
Intangible Asset
|
Amortization Period
|
|
|
Purchased contract rights
|
5 – 15 years
|
|
|
Provider contracts
|
5 – 10 years
|
|
|
Customer relationships
|
5 – 15 years
|
|
|
Trade names
|
7 – 20 years
|
Our management evaluates whether events or circumstances have occurred that may affect the estimated useful life or the recoverability of the remaining balance of goodwill and other identifiable intangible assets. If the events or circumstances indicate that the remaining balance of the intangible asset or goodwill may be impaired, the potential impairment will be measured based upon the difference between the carrying amount of the intangible asset or goodwill and the fair value of such asset. Our management must make assumptions and estimates, such as the discount factor, future utility and other internal and external factors, in determining the estimated fair values. While we believe these assumptions and estimates are appropriate, other assumptions and estimates could be applied and might produce significantly different results.
Goodwill is reviewed annually during the fourth quarter for impairment. In addition, an impairment analysis of intangible assets would be performed based on other factors. These factors include significant changes in membership, state funding, medical contracts and provider networks and contracts. The fair value of all reporting units with material amounts of goodwill was substantially in excess of the carrying value as of our annual impairment testing date.
INVESTMENTS
As of December 31, 2010, we had short-term investments of $21.3 million and long-term investments of $618.6 million, including restricted deposits of $22.8 million. The short-term investments generally consist of highly liquid securities with maturities between three and 12 months. The long-term investments consist of municipal, corporate and U.S. Agency bonds, life insurance contracts, U.S. Treasury investments, asset backed securities and equity securities and have maturities greater than one year. Restricted deposits consist of investments required by various state statutes to be deposited or pledged to state agencies. Due to the nature of the states’ requirements, these investments are classified as long-term regardless of the contractual maturity date. Our investments are subject to interest rate risk and will decrease in value if market rates increase. Assuming a hypothetical and immediate 1% increase in market interest rates at December 31, 2010, the fair value of our fixed income investments would decrease by approximately $11.2 million. Declines in interest rates over time will reduce our investment income. For a discussion of the interest rate risk that our investments are subject to, see "Risk Factors–Risks Related to Our Business–Our investment portfolio may suffer losses from reductions in market interest rates and changes in market conditions which could materially and adversely affect our results of operations or liquidity.”
INFLATION
While the inflation rate in 2010 for medical care costs was slightly less than that for all items, historically inflation for medical care costs has generally exceeded that for all items. We use various strategies to mitigate the negative effects of healthcare cost inflation. Specifically, our health plans try to control medical and hospital costs through our state savings initiatives and contracts with independent providers of healthcare services. Through these contracted care providers, our health plans emphasize preventive healthcare and appropriate use of specialty and hospital services. Additionally, our contracts with states require actuarially sound premiums that include health care cost trend.
While we currently believe our strategies to mitigate healthcare cost inflation will continue to be successful, competitive pressures, new healthcare and pharmaceutical product introductions, demands from healthcare providers and customers, applicable regulations or other factors may affect our ability to control the impact of healthcare cost increases.
Report of Independent Registered Public Accounting Firm
The Board of Directors and Stockholders
Centene Corporation:
We have audited the accompanying consolidated balance sheets of Centene Corporation and subsidiaries as of December 31, 2010 and 2009, and the related consolidated statements of operations, stockholders’ equity, and cash flows for each of the years in the three-year period ended December 31, 2010. These consolidated financial statements are the responsibility of the Company’s management. Our responsibility is to express an opinion on these consolidated financial statements based on our audits.
We conducted our audits in accordance with the standards of the Public Company Accounting Oversight Board (United States). Those standards require that we plan and perform the audit to obtain reasonable assurance about whether the financial statements are free of material misstatement. An audit includes examining, on a test basis, evidence supporting the amounts and disclosures in the financial statements. An audit also includes assessing the accounting principles used and significant estimates made by management, as well as evaluating the overall financial statement presentation. We believe that our audits provide a reasonable basis for our opinion.
In our opinion, the consolidated financial statements referred to above present fairly, in all material respects, the financial position of Centene Corporation and subsidiaries as of December 31, 2010 and 2009, and the results of their operations and their cash flows for each of the years in the three-year period ended December 31, 2010, in conformity with U.S. generally accepted accounting principles.
We also have audited, in accordance with the standards of the Public Company Accounting Oversight Board (United States), Centene Corporation’s internal control over financial reporting as of December 31, 2010, based on criteria established in
Internal Control - Integrated Framework
issued by the Committee of Sponsoring Organizations of the Treadway Commission (COSO), and our report dated February 21, 2011 expressed
an unqualified opinion on the effectiveness of the Company's internal control over financial reporting.
/s/ KPMG LLP
St. Louis, Missouri
February 21, 2011
CENTENE CORPORATION AND SUBSIDIARIES
(In thousands, except share data)
|
December 31,
2010
|
December 31,
2009
|
|||||||
|
ASSETS
|
||||||||
|
Current assets:
|
||||||||
|
Cash and cash equivalents of continuing operations
|
$ | 433,914 | $ | 400,951 | ||||
|
Cash and cash equivalents of discontinued operations
|
252 | 2,801 | ||||||
|
Total cash and cash equivalents
|
434,166 | 403,752 | ||||||
|
Premium and related receivables, net of allowance for uncollectible accounts of $17 and $1,338, respectively
|
136,243 | 103,456 | ||||||
|
Short-term investments, at fair value (amortized cost $21,141 and $39,230, respectively)
|
21,346 | 39,554 | ||||||
|
Other current assets
|
64,154 | 64,866 | ||||||
|
Current assets of discontinued operations other than cash
|
912 | 4,506 | ||||||
|
Total current assets
|
656,821 | 616,134 | ||||||
|
Long-term investments, at fair value (amortized cost $585,862 and $514,256, respectively)
|
595,879 | 525,497 | ||||||
|
Restricted deposits, at fair value (amortized cost $22,755 and $20,048, respectively)
|
22,758 | 20,132 | ||||||
|
Property, software and equipment, net of accumulated depreciation of $138,629 and $103,883, respectively
|
326,341 | 230,421 | ||||||
|
Goodwill
|
278,051 | 224,587 | ||||||
|
Intangible assets, net
|
29,109 | 22,479 | ||||||
|
Other long-term assets
|
30,057 | 36,829 | ||||||
|
Long-term assets of discontinued operations
|
4,866 | 26,285 | ||||||
|
Total assets
|
$ | 1,943,882 | $ | 1,702,364 | ||||
|
LIABILITIES AND STOCKHOLDERS’ EQUITY
|
||||||||
|
Current liabilities:
|
||||||||
|
Medical claims liability
|
$ | 456,765 | $ | 470,932 | ||||
|
Accounts payable and accrued expenses
|
185,218 | 132,001 | ||||||
|
Unearned revenue
|
117,344 | 91,644 | ||||||
|
Current portion of long-term debt
|
2,817 | 646 | ||||||
|
Current liabilities of discontinued operations
|
3,102 | 20,685 | ||||||
|
Total current liabilities
|
765,246 | 715,908 | ||||||
|
Long-term debt
|
327,824 | 307,085 | ||||||
|
Other long-term liabilities
|
53,378 | 59,561 | ||||||
|
Long-term liabilities of discontinued operations
|
379 | 383 | ||||||
|
Total liabilities
|
1,146,827 | 1,082,937 | ||||||
|
Commitments and contingencies
|
||||||||
|
Stockholders’ equity:
|
||||||||
|
Common stock, $.001 par value; authorized 100,000,000 shares; 52,172,037 issued and 49,616,824 outstanding at December 31, 2010, and 45,593,383 issued and 43,179,373 outstanding at December 31, 2009
|
52 | 46 | ||||||
|
Additional paid-in capital
|
384,206 | 281,806 | ||||||
|
Accumulated other comprehensive income:
|
||||||||
|
Unrealized gain on investments, net of tax
|
6,424 | 7,348 | ||||||
|
Retained earnings
|
453,743 | 358,907 | ||||||
|
Treasury stock, at cost (2,555,213 and 2,414,010 shares, respectively)
|
(50,486 | ) | (47,262 | ) | ||||
|
Total Centene stockholders’ equity
|
793,939 | 600,845 | ||||||
|
Noncontrolling interest
|
3,116 | 18,582 | ||||||
|
Total stockholders’ equity
|
797,055 | 619,427 | ||||||
|
Total liabilities and stockholders’ equity
|
$ | 1,943,882 | $ | 1,702,364 | ||||
The accompanying notes to the consolidated financial statements are an integral part of these statements.
CENTENE CORPORATION AND SUBSIDIARIES
(In thousands, except share data)
|
Year Ended December 31,
|
||||||||||||
|
|
2010
|
2009
|
2008
|
|||||||||
|
Revenues:
|
|
|||||||||||
|
Premium
|
|
$
|
4,192,172
|
$
|
3,786,525
|
$
|
3,199,360
|
|||||
|
Service
|
|
91,661
|
91,758
|
74,953
|
||||||||
|
Premium and service revenues
|
4,283,833
|
3,878,283
|
3,274,313
|
|||||||||
|
Premium tax
|
164,490
|
224,581
|
90,202
|
|||||||||
|
Total revenues
|
|
4,448,323
|
4,102,864
|
3,364,515
|
||||||||
|
Expenses:
|
|
|||||||||||
|
Medical costs
|
|
3,514,394
|
3,163,523
|
2,640,335
|
||||||||
|
Cost of services
|
|
63,919
|
60,789
|
56,920
|
||||||||
|
General and administrative expenses
|
|
547,823
|
514,529
|
444,733
|
||||||||
|
Premium tax expense
|
165,118
|
225,888
|
90,966
|
|||||||||
|
Total operating expenses
|
|
4,291,254
|
3,964,729
|
3,232,954
|
||||||||
|
Earnings from operations
|
|
157,069
|
138,135
|
131,561
|
||||||||
|
Other income (expense):
|
|
|||||||||||
|
Investment and other income
|
|
15,205
|
15,691
|
21,728
|
||||||||
|
Interest expense
|
|
(17,992
|
)
|
(16,318
|
)
|
(16,673
|
)
|
|||||
|
Earnings from continuing operations, before income tax expense
|
|
154,282
|
137,508
|
136,616
|
||||||||
|
Income tax expense
|
|
59,900
|
48,841
|
52,435
|
||||||||
|
Earnings from continuing operations, net of income tax expense
|
94,382
|
88,667
|
84,181
|
|||||||||
|
Discontinued operations, net of income tax expense (benefit) of $4,388, $(1,204) and $(281), respectively
|
3,889
|
(2,422
|
)
|
(684
|
)
|
|||||||
|
Net earnings
|
98,271
|
86,245
|
83,497
|
|||||||||
|
Noncontrolling interest
|
3,435
|
2,574
|
—
|
|||||||||
|
Net earnings attributable to Centene Corporation
|
|
$
|
94,836
|
$
|
83,671
|
$
|
83,497
|
|||||
|
Amounts attributable to Centene Corporation common shareholders:
|
||||||||||||
|
Earnings from continuing operations, net of income tax expense
|
$
|
90,947
|
$
|
86,093
|
$
|
84,181
|
||||||
|
Discontinued operations, net of income tax expense (benefit)
|
3,889
|
(2,422
|
)
|
(684
|
)
|
|||||||
|
Net earnings
|
$
|
94,836
|
$
|
83,671
|
$
|
83,497
|
||||||
|
Net earnings (loss) per common share attributable to Centene Corporation:
|
|
|||||||||||
|
Basic:
|
||||||||||||
|
Continuing operations
|
|
$
|
1.87
|
$
|
2.00
|
$
|
1.95
|
|||||
|
Discontinued operations
|
|
0.08
|
(0.06
|
)
|
(0.02
|
)
|
||||||
|
Basic earnings per common share
|
|
$
|
1.95
|
$
|
1.94
|
$
|
1.93
|
|||||
|
Diluted:
|
|
|||||||||||
|
Continuing operations
|
|
$
|
1.80
|
$
|
1.94
|
$
|
1.90
|
|||||
|
Discontinued operations
|
|
0.08
|
(0.05
|
)
|
(0.02
|
)
|
||||||
|
Diluted earnings per common share
|
|
$
|
1.88
|
$
|
1.89
|
$
|
1.88
|
|||||
|
Weighted average number of common shares outstanding:
|
|
|||||||||||
|
Basic
|
|
48,754,947
|
43,034,791
|
43,275,187
|
||||||||
|
Diluted
|
|
50,447,888
|
44,316,467
|
44,398,955
|
||||||||
The accompanying notes to the consolidated financial statements are an integral part of these statements
CENTENE CORPORATION AND SUBSIDIARIES
CONSOLIDATED STATEMENTS OF STOCKHOLDERS’ EQUITY
(In thousands, except share data)
|
Centene Stockholders’ Equity
|
||||||||||||||||||||||||||
|
Common Stock
|
Treasury Stock
|
|||||||||||||||||||||||||
|
$.001 Par
Value
Shares
|
Amt
|
Additional
Paid-in
Capital
|
Accumulated
Other
Comprehensive
Income
|
Retained
Earnings
|
$.001 Par
Value
Shares
|
Amt
|
Non
controlling
Interest
|
Total
|
||||||||||||||||||
|
Balance,
December 31, 2007
|
44,532,394
|
$
|
45
|
$
|
239,178
|
$
|
1,571
|
$
|
191,739
|
864,557
|
$
|
(17,486)
|
$
|
—
|
$
|
415,047
|
||||||||||
|
Comprehensive Earnings:
|
||||||||||||||||||||||||||
|
Net earnings
|
—
|
—
|
—
|
—
|
83,497
|
—
|
—
|
—
|
83,497
|
|||||||||||||||||
|
Change in unrealized investment gains, net of $882 tax
|
—
|
—
|
—
|
1,581
|
—
|
—
|
—
|
—
|
1,581
|
|||||||||||||||||
|
Total comprehensive earnings
|
—
|
—
|
—
|
—
|
—
|
—
|
—
|
—
|
85,078
|
|||||||||||||||||
|
Common stock issued for employee benefit plans
|
538,785
|
—
|
6,229
|
—
|
—
|
—
|
—
|
—
|
6,229
|
|||||||||||||||||
|
Common stock repurchases
|
—
|
—
|
—
|
—
|
—
|
1,218,858
|
(23,510)
|
—
|
(23,510
|
)
|
||||||||||||||||
|
Stock compensation expense
|
—
|
—
|
15,328
|
—
|
—
|
—
|
—
|
—
|
15,328
|
|||||||||||||||||
|
Excess tax benefits from stock compensation
|
3,100
|
3,100
|
||||||||||||||||||||||||
|
Balance,
December 31, 2008
|
45,071,179
|
$
|
45
|
$
|
263,835
|
$
|
3,152
|
$
|
275,236
|
2,083,415
|
$
|
(40,996)
|
$
|
—
|
$
|
501,272
|
||||||||||
|
Consolidation of Access Health Solutions LLC
|
—
|
—
|
—
|
—
|
—
|
—
|
—
|
29,144
|
29,144
|
|||||||||||||||||
|
Consolidation of Centene Center LLC
|
—
|
—
|
—
|
—
|
—
|
—
|
—
|
17,400
|
17,400
|
|||||||||||||||||
|
Comprehensive Earnings:
|
||||||||||||||||||||||||||
|
Net earnings
|
—
|
—
|
—
|
—
|
83,671
|
—
|
—
|
2,574
|
86,245
|
|||||||||||||||||
|
Change in unrealized investment gains, net of $2,663 tax
|
—
|
—
|
—
|
4,196
|
—
|
—
|
—
|
—
|
4,196
|
|||||||||||||||||
|
Total comprehensive earnings
|
90,441
|
|||||||||||||||||||||||||
|
Common stock issued for employee benefit plans
|
522,204
|
1
|
3,284
|
—
|
—
|
—
|
—
|
3,285
|
||||||||||||||||||
|
Common stock repurchases
|
—
|
—
|
—
|
—
|
—
|
332,595
|
(6,304)
|
—
|
(6,304
|
)
|
||||||||||||||||
|
Treasury stock issued for compensation
|
—
|
—
|
—
|
—
|
(2,000)
|
38
|
38
|
|||||||||||||||||||
|
Stock compensation expense
|
—
|
—
|
14,634
|
—
|
—
|
—
|
—
|
—
|
14,634
|
|||||||||||||||||
|
Excess tax benefits from stock compensation
|
—
|
—
|
53
|
—
|
—
|
—
|
—
|
—
|
53
|
|||||||||||||||||
|
Conversion fee
1
|
—
|
—
|
—
|
—
|
—
|
—
|
—
|
(27,366)
|
(27,366
|
)
|
||||||||||||||||
|
Distributions to noncontrolling interest
|
—
|
—
|
—
|
—
|
—
|
—
|
—
|
(3,170)
|
(3,170
|
)
|
||||||||||||||||
|
Balance,
December 31, 2009
|
45,593,383
|
$
|
46
|
$
|
281,806
|
$
|
7,348
|
$
|
358,907
|
2,414,010
|
$
|
(47,262)
|
$
|
18,582
|
$
|
619,427
|
||||||||||
|
Consolidation of noncontrolling interest
|
—
|
—
|
—
|
—
|
—
|
—
|
—
|
3,104
|
3,104
|
|||||||||||||||||
|
Comprehensive Earnings:
|
||||||||||||||||||||||||||
|
Net earnings
|
—
|
—
|
—
|
—
|
94,836
|
—
|
—
|
3,435
|
98,271
|
|||||||||||||||||
|
Change in unrealized investment gains, net of $(511) tax
|
—
|
—
|
—
|
(924
|
)
|
—
|
—
|
—
|
—
|
(924
|
)
|
|||||||||||||||
|
Total comprehensive earnings
|
97,347
|
|||||||||||||||||||||||||
|
Common stock issued for stock offering
|
5,750,000
|
6
|
104,528
|
—
|
—
|
—
|
—
|
—
|
104,534
|
|||||||||||||||||
|
Common stock issued for employee benefit plans
|
828,654
|
—
|
4,254
|
—
|
—
|
—
|
—
|
—
|
4,254
|
|||||||||||||||||
|
Issuance of stock warrants
|
—
|
—
|
296
|
—
|
—
|
—
|
—
|
—
|
296
|
|||||||||||||||||
|
Common stock repurchases
|
—
|
—
|
—
|
—
|
—
|
141,203
|
(3,224)
|
—
|
(3,224
|
)
|
||||||||||||||||
|
Stock compensation expense
|
—
|
—
|
13,874
|
—
|
—
|
—
|
—
|
—
|
13,874
|
|||||||||||||||||
|
Excess tax benefits from stock compensation
|
—
|
—
|
868
|
—
|
—
|
—
|
—
|
—
|
868
|
|||||||||||||||||
|
Redemption / purchase of noncontrolling interest
|
—
|
—
|
(21,420)
|
—
|
—
|
—
|
—
|
(14,056)
|
(35,476
|
)
|
||||||||||||||||
|
Distributions to noncontrolling interest
|
—
|
—
|
—
|
—
|
—
|
—
|
—
|
(7,949)
|
(7,949
|
)
|
||||||||||||||||
|
Balance,
December 31, 2010
|
52,172,037
|
$
|
52
|
$
|
384,206
|
$
|
6,424
|
$
|
453,743
|
2,555,213
|
$
|
(50,486)
|
$
|
3,116
|
$
|
797,055
|
||||||||||
|
1
|
Conversion fee represents additional purchase price to noncontrolling holders of Access Health Solutions LLC for the transfer of membership to the Company’s wholly-owned subsidiary, Sunshine State Health Plan, Inc.
|
The accompanying notes to the consolidated financial statements are an integral part of these statements.
CENTENE CORPORATION AND SUBSIDIARIES
(In thousands)
|
Year Ended December 31,
|
||||||||||||
|
2010
|
2009
|
2008
|
||||||||||
|
Cash flows from operating activities:
|
||||||||||||
|
Net earnings
|
$
|
98,271
|
$
|
86,245
|
$
|
83,497
|
||||||
|
Adjustments to reconcile net earnings to net cash provided by operating activities:
|
||||||||||||
|
Depreciation and amortization
|
52,000
|
44,004
|
35,414
|
|||||||||
|
Stock compensation expense
|
13,874
|
14,634
|
15,328
|
|||||||||
|
(Gain) loss on sale of investments, net
|
(6,337
|
)
|
(141
|
)
|
4,988
|
|||||||
|
(Gain) on sale of UHP
|
(8,201
|
)
|
—
|
—
|
||||||||
|
Impairment loss
|
5,531
|
—
|
2,546
|
|||||||||
|
Deferred income taxes
|
10,317
|
3,696
|
1,286
|
|||||||||
|
Changes in assets and liabilities:
|
||||||||||||
|
Premium and related receivables
|
(23,359
|
)
|
2,379
|
(1,548
|
)
|
|||||||
|
Other current assets
|
(3,240
|
)
|
(1,263
|
)
|
(4,244
|
)
|
||||||
|
Other assets
|
(2,028
|
)
|
9
|
(2,700
|
)
|
|||||||
|
Medical claims liability
|
(30,421
|
)
|
79,000
|
47,283
|
||||||||
|
Unearned revenue
|
25,700
|
78,345
|
(36,447
|
)
|
||||||||
|
Accounts payable and accrued expenses
|
37,398
|
(60,915
|
)
|
74,166
|
||||||||
|
Other operating activities
|
(573
|
)
|
2,202
|
2,409
|
||||||||
|
Net cash provided by operating activities
|
168,932
|
248,195
|
221,978
|
|||||||||
|
Cash flows from investing activities:
|
||||||||||||
|
Capital expenditures
|
(63,304
|
)
|
(23,721
|
)
|
(65,156
|
)
|
||||||
|
Capital expenditures of Centene Center LLC
|
(55,252
|
)
|
(59,392
|
)
|
—
|
|||||||
|
Purchase of investments
|
(615,506
|
)
|
(791,194
|
)
|
(549,652
|
)
|
||||||
|
Sales and maturities of investments
|
570,423
|
642,783
|
546,264
|
|||||||||
|
Proceeds from asset sales
|
13,420
|
—
|
—
|
|||||||||
|
Investments in acquisitions, net of cash acquired, and investment in equity method investee
|
(60,388
|
)
|
(38,563
|
)
|
(85,377
|
)
|
||||||
|
Net cash used in investing activities
|
(210,607
|
)
|
(270,087
|
)
|
(153,921
|
)
|
||||||
|
Cash flows from financing activities:
|
||||||||||||
|
Proceeds from exercise of stock options
|
3,419
|
2,365
|
5,354
|
|||||||||
|
Proceeds from borrowings
|
218,538
|
659,059
|
236,005
|
|||||||||
|
Proceeds from stock offering
|
104,534
|
—
|
—
|
|||||||||
|
Payment of long-term debt
|
(195,728
|
)
|
(616,219
|
)
|
(178,491
|
)
|
||||||
|
Purchase of noncontrolling interest
|
(48,257
|
)
|
—
|
—
|
||||||||
|
Distributions (to) from noncontrolling interest
|
(7,387
|
)
|
8,049
|
—
|
||||||||
|
Excess tax benefits from stock compensation
|
963
|
53
|
3,100
|
|||||||||
|
Common stock repurchases
|
(3,224
|
)
|
(6,304
|
)
|
(23,510
|
)
|
||||||
|
Debt issue costs
|
(769
|
)
|
(458
|
)
|
—
|
|||||||
|
Net cash provided by financing activities
|
72,089
|
46,545
|
42,458
|
|||||||||
|
Net increase in cash and cash equivalents
|
30,414
|
24,653
|
110,515
|
|||||||||
|
Cash and cash equivalents,
beginning of period
|
403,752
|
379,099
|
268,584
|
|||||||||
|
Cash and cash equivalents,
end of period
|
$
|
434,166
|
$
|
403,752
|
$
|
379,099
|
||||||
|
Supplemental disclosures of cash flow information:
|
||||||||||||
|
Interest paid
|
$
|
17,296
|
$
|
15,428
|
$
|
15,312
|
||||||
|
Income taxes paid
|
$
|
53,938
|
$
|
52,928
|
$
|
36,801
|
||||||
|
Supplemental disclosure of non-cash investing and financing activities:
|
||||||||||||
|
Contribution from noncontrolling interest
|
$
|
306
|
$
|
5,875
|
$
|
—
|
||||||
|
Capital expenditures
|
$
|
8,720
|
$
|
(1,476
|
)
|
$
|
4,175
|
|||||
The accompanying notes to the consolidated financial statements are an integral part of these statements.
CENTENE CORPORATION AND SUBSIDIARIES
NOTES TO CONSOLIDATED FINANCIAL STATEMENTS
(Dollars in thousands, except share data)
1. Organization and Operations
Centene Corporation, or the Company, is a diversified, multi-line healthcare enterprise operating in two segments: Medicaid Managed Care and Specialty Services. The Medicaid Managed Care segment provides Medicaid and Medicaid-related health plan coverage to individuals through government subsidized programs, including Medicaid, the State Children’s Health Insurance Program, or CHIP, Foster Care, Medicare Special Needs Plans and the Supplemental Security Income Program, also known as the Aged, Blind or Disabled Program, or collectively ABD. The health plans in Florida, Georgia, Indiana, Mississippi, Ohio, South Carolina, Texas and Wisconsin are included in the Medicaid Managed Care segment. The Specialty Services segment offers products for behavioral health, health insurance exchanges, individual health insurance, life and health management, long-term care programs, managed vision, telehealth services, and pharmacy benefits management to state programs, healthcare organizations, employer groups and other commercial organizations, as well as to our own subsidiaries. The health plans in Arizona, operated by our long-term care company, and Massachusetts, operated by our individual health insurance provider, are included in the Specialty Services segment.
2. Summary of Significant Accounting Policies
Principles of Consolidation
The accompanying consolidated financial statements include the accounts of Centene Corporation and all majority owned subsidiaries and subsidiaries over which the Company exercises the power and control to direct activities significantly impacting financial performance. All material intercompany balances and transactions have been eliminated. The assets, liabilities and results of operations of University Health Plans, Inc. are classified as discontinued operations for all periods presented.
The Company uses the cost and equity methods to account for its investment in entities that it does not control and for which it does not have the ability to exercise significant influence over operating and financial policies. These investments are recorded at the lower of their cost or fair value.
Use of Estimates
The preparation of financial statements in conformity with generally accepted accounting principles in the United States, or GAAP, requires management to make estimates and assumptions that affect the reported amounts of assets and liabilities and disclosure of contingent assets and liabilities at the date of the financial statements and the reported amounts of revenues and expenses during the reporting period. Future events and their effects cannot be predicted with certainty; accordingly, the accounting estimates require the exercise of judgment. The accounting estimates used in the preparation of the consolidated financial statements will change as new events occur, as more experience is acquired, as additional information is obtained and as the operating environment changes. The Company evaluates and updates its assumptions and estimates on an ongoing basis and may employ outside experts to assist in our evaluation, as considered necessary. Actual results could differ from those estimates.
Cash and Cash Equivalents
Investments with original maturities of three months or less are considered to be cash equivalents. Cash equivalents consist of commercial paper, money market funds, repurchase agreements and bank certificates of deposit and savings accounts.
The Company maintains amounts on deposit with various financial institutions, which may exceed federally insured limits. However, management periodically evaluates the credit-worthiness of those institutions, and the Company has not experienced any losses on such deposits.
Investments
Short-term investments include securities with maturities greater than three months to one year. Long-term investments include securities with maturities greater than one year.
Short-term and long-term investments are generally classified as available for sale and are carried at fair value. Certain equity investments are recorded using the cost or equity method. Unrealized gains and losses on investments available for sale are excluded from earnings and reported in accumulated other comprehensive income, a separate component of stockholders’ equity, net of income tax effects. Premiums and discounts are amortized or accreted over the life of the related security using the effective interest method. The Company monitors the difference between the cost and fair value of investments. Investments that experience a decline in value that is judged to be other than temporary are written down to fair value and a realized loss is recorded in investment and other income. To calculate realized gains and losses on the sale of investments, the Company uses the specific amortized cost of each investment sold. Realized gains and losses are recorded in investment and other income.
Restricted Deposits
Restricted deposits consist of investments required by various state statutes to be deposited or pledged to state agencies. These investments are classified as long-term, regardless of the contractual maturity date, due to the nature of the states’ requirements. The Company is required to annually adjust the amount of the deposit pledged to certain states.
Fair Value Measurements
In the normal course of business, the Company invests in various financial assets and incurs various financial liabilities. Fair values are disclosed for all financial instruments, whether or not such values are recognized in the Consolidated Balance Sheets. Management obtains quoted market prices and other observable inputs for these disclosures. The carrying amounts reported in the Consolidated Balance Sheets for cash and cash equivalents, premium and related receivables, unearned revenue, accounts payable and accrued expenses, and certain other current liabilities are carried at cost, which approximates fair value because of their short-term nature.
The following methods and assumptions were used to estimate the fair value of each financial instrument:
|
Ÿ
|
Available for sale investments and restricted deposits: The carrying amount is stated at fair value, based on quoted market prices, where available. For securities not actively traded, fair values were estimated using values obtained from independent pricing services or quoted market prices of comparable instruments.
|
|
Ÿ
|
Senior unsecured notes: Estimated based on third-party quoted market prices for the same or similar issues.
|
|
Ÿ
|
Variable rate debt: The carrying amount of our floating rate debt approximates fair value because the interest rates adjust based on market rate adjustments.
|
Property, Software and Equipment
Property, software and equipment are stated at cost less accumulated depreciation. Capitalized software includes certain costs incurred in the development of internal-use software, including external direct costs of materials and services and payroll costs of employees devoted to specific software development. Depreciation is calculated principally by the straight-line method over estimated useful lives. Leasehold improvements are depreciated using the straight-line method over the shorter of the expected useful life or the remaining term of the lease. Property, software and equipment are depreciated over the following periods:
|
Fixed Asset
|
Depreciation Period
|
|
|
Buildings
|
40 years
|
|
|
Computer hardware and software
|
3 – 7 years
|
|
|
Furniture and equipment
|
5 – 10 years
|
|
|
Leasehold improvements
|
1– 20 years
|
The carrying amounts of all long-lived assets are evaluated to determine if adjustment to the depreciation and amortization period or to the unamortized balance is warranted. Such evaluation is based principally on the expected utilization of the long-lived assets.
The Company retains fully depreciated assets in property and accumulated depreciation accounts until it removes them from service. In the case of sale, retirement, or disposal, the asset cost and related accumulated depreciation balance is removed from the respective account, and the resulting net amount, less any proceeds, is included as a component of earnings from operations in the consolidated statements of operations.
The Company tests for impairment of long-lived assets, including intangible assets, whenever events or changes in circumstances indicate that the carrying value of an asset or asset group (hereinafter referred to as “asset group”) may not be recoverable by comparing the sum of the estimated undiscounted future cash flows expected to result from use of the asset group and its eventual disposition to the carrying value. Such factors include, but are not limited to, significant changes in membership, state funding, state contracts and provider networks and contracts. If the sum of the estimated undiscounted future cash flows is less than the carrying value, an impairment determination is required. The amount of impairment is calculated by subtracting the fair value of the asset group from the carrying value of the asset group. An impairment charge, if any, is recognized within earnings from operations.
Goodwill and
Intangible Assets
Intangible assets represent assets acquired in purchase transactions and consist primarily of customer relationships, purchased contract rights, provider contracts, trade names and goodwill. Intangible assets are amortized using the straight-line method over the following periods:
|
Intangible Asset
|
Amortization Period
|
|
|
Purchased contract rights
|
5 – 15 years
|
|
|
Provider contracts
|
5 – 10 years
|
|
|
Customer relationships
|
5 – 15 years
|
|
|
Trade names
|
7 – 20 years
|
The Company tests goodwill for impairment using a fair value approach. The Company is required to test for impairment at least annually, absent some triggering event including a significant decline in operating performance that would require an impairment assessment. Absent any impairment indicators, the Company performs its goodwill impairment testing during the fourth quarter of each year.
The Company recognizes an impairment charge for any amount by which the carrying amount of goodwill exceeds its implied fair value.
The Company uses discounted cash flows to establish the fair value as of the testing date. The discounted cash flow approach includes many assumptions related to future growth rates, discount factors, future tax rates, etc. Changes in economic and operating conditions impacting these assumptions could result in goodwill impairment in future periods. When available and as appropriate, the Company uses comparative market multiples to corroborate discounted cash flow results.
Medical Claims Liability
Medical claims liability includes claims reported but not yet paid, or inventory, estimates for claims incurred but not reported, or IBNR, and estimates for the costs necessary to process unpaid claims at the end of each period. The Company estimates its medical claims liability using actuarial methods that are commonly used by health insurance actuaries and meet Actuarial Standards of Practice. These actuarial methods consider factors such as historical data for payment patterns, cost trends, product mix, seasonality, utilization of healthcare services and other relevant factors.
Actuarial Standards of Practice generally require that the medical claims liability estimates be adequate to cover obligations under moderately adverse conditions. Moderately adverse conditions are situations in which the actual claims are expected to be higher than the otherwise estimated value of such claims at the time of estimate. In many situations, the claims amounts ultimately settled will be different than the estimate that satisfies the Actuarial Standards of Practice. The Company includes in its IBNR an estimate for medical claims liability under moderately adverse conditions which represents the risk of adverse deviation of the estimates in its actuarial method of reserving.
The Company uses its judgment to determine the assumptions to be used in the calculation of the required estimates. The assumptions it considers when estimating IBNR include, without limitation, claims receipt and payment experience (and variations in that experience), changes in membership, provider billing practices, healthcare service utilization trends, cost trends, product mix, seasonality, prior authorization of medical services, benefit changes, known outbreaks of disease or increased incidence of illness such as influenza, provider contract changes, changes to fee schedules, and the incidence of high dollar or catastrophic claims.
The Company’s development of the medical claims liability estimate is a continuous process which it monitors and refines on a monthly basis as additional claims receipts and payment information becomes available. As more complete claim information becomes available, the Company adjusts the amount of the estimates, and includes the changes in estimates in medical costs in the period in which the changes are identified. In every reporting period, the operating results include the effects of more completely developed medical claims liability estimates associated with previously reported periods. The Company consistently applies its reserving methodology from period to period. As additional information becomes known, it adjusts the actuarial model accordingly to establish medical claims liability estimates.
The Company periodically reviews actual and anticipated experience compared to the assumptions used to establish medical costs. The Company establishes premium deficiency reserves if actual and anticipated experience indicates that existing policy liabilities together with the present value of future gross premiums will not be sufficient to cover the present value of future benefits, settlement and maintenance costs.
Revenue Recognition
The Company’s health plans generate revenues primarily from premiums received from the states in which it operates health plans. The Company receives a fixed premium per member per month pursuant to its state contracts. The Company generally receives premium payments during the month it provides services and recognizes premium revenue during the period in which it is obligated to provide services to its members. In some instances, the Company’s base premiums are subject to an adjustment, or risk score, based on the acuity of its membership. Generally, the risk score is determined by the State analyzing submissions of processed claims data to determine the acuity of the Company’s membership relative to the entire state’s Medicaid membership. Some states enact premium taxes, similar assessments and provider pass-through payments, collectively premium taxes, and these taxes are recorded as a separate component of both revenues and operating expenses. Some contracts allow for additional premium related to certain supplemental services provided such as maternity deliveries. Revenues are recorded based on membership and eligibility data provided by the states, which may be adjusted by the states for updates to this data. These eligibility adjustments have been immaterial in relation to total revenue recorded and are reflected in the period known.
The Company’s specialty companies generate revenues under contracts with state programs, individuals, healthcare organizations and other commercial organizations, as well as from the Company’s own subsidiaries. Revenues are recognized when the related services are provided or as ratably earned over the covered period of service.
Premium and service revenues collected in advance are recorded as unearned revenue. For performance-based contracts the Company does not recognize revenue subject to refund until data is sufficient to measure performance. Premiums and service revenues due to the Company are recorded as premium and related receivables and are recorded net of an allowance based on historical trends and management’s judgment on the collectibility of these accounts. As the Company generally receives payments during the month in which services are provided, the allowance is typically not significant in comparison to total revenues and does not have a material impact on the presentation of the financial condition or results of operations. Activity in the allowance for uncollectible accounts for the years ended December 31, is summarized below:
|
|
2010
|
2009
|
2008
|
|||||||||
|
Allowances, beginning of year
|
|
$
|
1,338
|
$
|
1,304
|
$
|
467
|
|||||
|
Amounts charged to expense
|
(48
|
)
|
285
|
1,142
|
||||||||
|
Write-offs of uncollectible receivables
|
|
(1,273
|
)
|
(251
|
)
|
(305
|
)
|
|||||
|
Allowances, end of year
|
|
$
|
17
|
$
|
1,338
|
$
|
1,304
|
|||||
Significant Customers
Centene receives the majority of its revenues under contracts or subcontracts with state Medicaid managed care programs. The current contracts expire on various dates between June 30, 2011 and December 31, 2014. States whose aggregate annual contract value exceeded 10% of annual revenues and the respective percentage of the Company’s total revenues for the years ended December 31, are as follows:
|
2010
|
2009
|
2008
|
||||||||||||
|
Georgia
|
17% |
Georgia
|
19% |
Georgia
|
23% | |||||||||
|
Ohio
|
13% |
Ohio
|
14% |
Ohio
|
16% | |||||||||
|
Texas
|
30% |
Texas
|
30% |
Texas
|
33% | |||||||||
Reinsurance
Centene's subsidiaries report reinsurance premiums as medical costs, while related reinsurance recoveries are reported as deductions from medical costs. The Company limits its risk of certain catastrophic losses by maintaining high deductible reinsurance coverage.
Other Income (Expense)
Other income (expense) consists principally of investment income, interest expense and equity method earnings from investments. Investment income is derived from the Company’s cash, cash equivalents, restricted deposits and investments. Interest expense relates to borrowings under the senior notes, credit facilities, interest on capital leases and credit facility fees.
Income Taxes
Deferred tax assets and liabilities are recorded for the future tax consequences attributable to differences between the financial statement carrying amounts of existing assets and liabilities and their respective tax bases. Deferred tax assets and liabilities are measured using enacted tax rates expected to apply to taxable income in the years in which those temporary differences are expected to be recovered or settled. The effect on deferred tax assets and liabilities of a change in tax law or tax rates is recognized in income in the period that includes the enactment date.
Valuation allowances are provided when it is considered more likely than not that deferred tax assets will not be realized. In determining if a deductible temporary difference or net operating loss can be realized, the Company considers future reversals of existing taxable temporary differences, future taxable income, taxable income in prior carryback periods and tax planning strategies.
Contingencies
The Company accrues for loss contingencies associated with outstanding litigation, claims and assessments for which it has determined it is probable that a loss contingency exists and the amount of loss can be reasonably estimated. The Company expenses professional fees associated with litigation claims and assessments as incurred.
Stock Based Compensation
The fair value of the Company’s employee share options and similar instruments are estimated using the Black-Scholes option-pricing model. That cost is recognized over the period during which an employee is required to provide service in exchange for the award. Excess tax benefits related to stock compensation are presented as a cash inflow from financing activities.
Recent Accounting Pronouncements
The Company has determined that all recently issued accounting guidance will not have a material impact on its consolidated financial position, results of operations and cash flows, or do not apply to its operations.
3. Discontinued Operations: University Health Plans, Inc.
In November 2008, the Company announced its intention to sell certain assets of its New Jersey health plan, University Health Plans, Inc., or UHP. Accordingly, the results of operations of UHP are presented as discontinued operations for all periods presented. The assets, liabilities and results of operations of UHP were classified as discontinued operations for all periods presented beginning in December 2008. UHP was previously reported in the Medicaid Managed Care segment.
In 2008, as a result of the plan to sell certain assets of UHP, the Company conducted an impairment analysis of the assets of UHP. The impairment analysis resulted in an impairment charge for fixed assets of $2,546. During the years ended December 31, 2010, 2009, and 2008 the Company incurred exit costs consisting primarily of lease termination fees and employee severance. The change in exit cost liability for UHP is summarized as follows:
|
Employee Benefits
|
Lease Termination
|
Total
|
||||||||||
|
Balance, December 31, 2008
|
$ | 444 | $ | 666 | $ | 1,110 | ||||||
|
Incurred
|
3,140 | — | 3,140 | |||||||||
|
Paid
|
(857 | ) | (400 | ) | (1,257 | ) | ||||||
|
Balance, December 31, 2009
|
2,727 | 266 | 2,993 | |||||||||
|
Incurred/(Adjustments)
|
(274 | ) | 1,010 | 736 | ||||||||
|
Paid
|
(2,186 | ) | (721 | ) | (2,907 | ) | ||||||
|
Balance, December 31, 2010
|
$ | 267 | $ | 555 | $ | 822 | ||||||
In March 2010, the Company ceased operations and completed the sale of certain assets of UHP and recorded a pre-tax gain of $8,201. Goodwill and intangible assets associated with the New Jersey operations disposed of as a part of the sale were $3,720. UHP had remaining statutory capital of approximately $2,500 at December 31, 2010, which will be transferred to unregulated cash as operations wind-down, subject to regulatory approval.
Operating results for the discontinued operations are as follows:
|
Year Ended December 31,
|
||||||||||||
|
|
2010
|
2009
|
2008
|
|||||||||
|
Revenues
|
|
$
|
21,757
|
$
|
145,097
|
$
|
150,638
|
|||||
|
Earnings (loss) before income taxes
|
|
$
|
8,276
|
|
$
|
(3,626
|
)
|
|
$
|
(965
|
)
|
|
|
Net earnings (loss)
|
|
$
|
3,889
|
|
$
|
(2,422
|
)
|
|
$
|
(684
|
)
|
|
Assets and liabilities of the discontinued operations are as follows:
|
December 31,
|
|||||||
|
2010
|
2009
|
||||||
|
Current assets
|
$ | 1,164 | $ | 7,307 | |||
|
Long term investments and restricted deposits
|
3,933 | 22,139 | |||||
|
Goodwill
|
— | 2,168 | |||||
|
Other intangible assets, net
|
— | 1,552 | |||||
|
Other assets
|
933 | 426 | |||||
|
Assets of discontinued operations
|
$ | 6,030 | $ | 33,592 | |||
|
December 31,
|
|||||||
|
2010
|
2009
|
||||||
|
Medical claims liability
|
$ | 1,464 | $ | 17,718 | |||
|
Accounts payable and accrued expenses
|
1,638 | 2,967 | |||||
|
Other liabilities
|
380 | 383 | |||||
|
Liabilities of discontinued operations
|
$ | 3,482 | $ | 21,068 | |||
4. Acquisitions
2010 Acquisitions
|
·
|
Carolina Crescent Health Plan.
In June 2010, the Company acquired certain assets of Carolina Crescent Health Plan, a South Carolina Medicaid managed care organization for $17,993 in total consideration. The Company recorded an initial allocation of fair value that resulted in goodwill of $14,394 and other identifiable intangible assets of $3,599. The Company allocated the total consideration to assets acquired and liabilities assumed based on its initial estimates of fair value using methodologies and assumptions that it believed were reasonable. During 2010, the Company finalized the allocation of the total consideration to identifiable assets and liabilities which increased goodwill to $16,543 and decreased other identifiable intangible assets to $1,450. The acquisition is recorded in the Medicaid Managed Care segment. All of the goodwill is deductible for income tax purposes.
|
|
·
|
NovaSys Health, LLC.
In July 2010, the Company acquired certain assets and liabilities of NovaSys Health, LLC, a third party administrator in Arkansas and paid $4,330 in cash. The Company’s allocation of fair value resulted in goodwill of $1,444 and other identifiable intangible assets of $3,050 that were recorded in the Specialty Services segment. All of the goodwill is deductible for income tax purposes.
|
|
·
|
Citrus Health Care, Inc.
In December 2010, the Company acquired certain assets in non reform counties of Citrus Health Care, Inc., a Florida Medicaid and long term care health plan for $28,689. The Company performed a preliminary allocation of fair value that resulted in goodwill of $22,951 and other identifiable intangible assets of $5,738 that were recorded in the Medicaid Managed Care segment. The fair value of the acquired intangible assets is preliminary pending the final valuation of those assets.
The Company allocated the total consideration to assets acquired and liabilities assumed based on its initial estimates of fair value using methodologies and assumptions that it believed were reasonable. All of the goodwill is deductible for income tax purposes.
|
|
·
|
Access Health Solutions, LLC.
In December 2010, the Company exercised its right to obtain the remaining assets and ownership interest in Access Health Solutions, LLC, or Access, for zero dollars. Prior to the acquisition of the remaining interest, the Company had reported its investment in Access as a consolidated variable interest entity (VIE) in which the Company was the primary beneficiary. Subsequent to the acquisition of the remaining interest, Access continues to be consolidated in the Company’s Medicaid Managed Care segment results as a wholly owned subsidiary of the Company.
|
|
·
|
Centene Center LLC.
In December 2010, the Company acquired the remaining ownership interest in Centene Center LLC for $48,250. The excess purchase price over the noncontrolling interest was recorded to additional paid in capital, net of the related deferred tax asset of $12,779. Centene Center LLC is a real estate development entity created for the construction of a real estate development that includes the Company’s corporate headquarters. The Company previously reported its investment in Centene Center as a consolidated VIE. Subsequent to the acquisition of the remaining interest, Centene Center LLC continues to be consolidated as a wholly owned subsidiary of the Company. The operating results of Centene Center LLC are included in general and administrative expense of the Company’s Medicaid Managed Care segment.
|
|
·
|
Casenet, LLC.
In December 2010, the Company acquired an additional ownership interest in Casenet, LLC for total consideration of $6,619, bringing its ownership interest to 68%. Casenet, LLC is a provider of care management solutions that automate the clinical, administrative, and technical components of care management programs. The Company performed an initial allocation of total consideration to assets acquired and liabilities assumed based on its initial estimates of fair value using methodologies and assumptions that it believed were reasonable. The initial allocation resulted in goodwill of $1,752 and other identifiable intangible assets of $4,500 that were recorded in the Specialty Services segment. The fair value of the acquired intangible assets is preliminary pending the final valuation of those assets.
The goodwill is not deductible for income tax purposes.
|
2009 Acquisitions
|
·
|
Access.
In July 2007, the Company acquired a 49% ownership interest in Access, a Medicaid managed care entity in Florida. The Company accounted for its investment in Access using the equity method of accounting through December 31, 2008. During the quarter ended March 31, 2009, the Company began presenting its investment in Access as a consolidated subsidiary in its financial statements. The consolidation of Access resulted in goodwill of approximately $43,400, and other identified intangible assets of approximately $5,400. In 2009, the Company paid an additional $33,927 conversion fee for the transfer of membership from Access to the Company’s wholly-owned subsidiary, Sunshine State Health Plan, Inc.
|
|
·
|
Additional 2009 Acquisitions
. The Company acquired assets of the following entities: Pediatric Associates LLC, effective February 2009, Amerigroup Community Care of South Carolina, Inc., effective March 2009 and InSpeech, Inc., effective July 2009. The Company paid a total of approximately $12,500 in cash for these acquisitions. Goodwill of approximately $9,500 and other identifiable intangible assets of approximately $1,500 were included in the Medicaid Managed Care segment and other identifiable intangible assets of $1,700 were included in the Specialty Services segment, all of which is deductible for income tax purposes.
|
2008 Acquisitions
|
·
|
Celtic Insurance Company.
On July 1, 2008, the Company acquired Celtic Insurance Company, or
Celtic, a health insurance carrier focused on the individual health insurance market. The Company paid approximately $82,100 in cash and related transaction costs, net of unregulated cash acquired. In conjunction with the closing of the acquisition, Celtic paid to the Company an extraordinary dividend of $31,411 in July 2008. The results of operations for Celtic are included in the Specialty Services segment of the consolidated financial statements since July 1, 2008.
|
The Company allocated total consideration paid to the assets acquired and liabilities assumed based on its estimates of fair value using methodologies and assumptions that it believed were reasonable. The purchase price allocation resulted in estimated identifiable intangible assets and goodwill of $8,600 and $24,300, respectively. The identifiable intangible assets have estimated useful lives ranging from seven to 15 years. The acquired goodwill is not deductible for income tax purposes.
Pro forma disclosures related to these acquisitions have been excluded as immaterial.
5. Syncare, LLC
During the first quarter of 2010, one of the Company’s employees became the owner of Syncare, LLC, or Syncare, a disease management company providing services to private and public insurers. Additionally, the Company is a guarantor on a $300 loan that was utilized to purchase the business and is a guarantor of Syncare’s $100 business loan. As a result, the Company determined that Syncare is a variable interest entity and the Company is the primary beneficiary. The Company has presented Syncare as a consolidated entity effective February 1, 2010. The Company’s non-controlling interest includes $119 associated with Syncare at December 31, 2010.
6. Short-term and Long-term Investments and Restricted Deposits
Short-term and long-term investments and restricted deposits by investment type consist of the following:
|
December 31, 2010
|
December 31, 2009
|
||||||||||||||||||||||
|
Amortized Cost
|
Gross Unrealized Gains
|
Gross Unrealized Losses
|
Fair Value
|
Amortized Cost
|
Gross Unrealized Gains
|
Gross Unrealized Losses
|
Fair Value
|
||||||||||||||||
|
U.S. Treasury securities and obligations of U.S. government corporations and agencies
|
$
|
28,665
|
|
$
|
510
|
|
$
|
(140
|
)
|
$
|
29,035
|
$
|
27,080
|
|
$
|
213
|
|
$
|
(5
|
)
|
$
|
27,288
|
|
|
Corporate securities
|
197,577
|
|
3,124
|
|
(586
|
)
|
200,115
|
153,478
|
|
581
|
|
(940
|
)
|
153,119
|
|||||||||
|
Restricted certificates of deposit
|
6,814
|
|
—
|
|
—
|
6,814
|
4,958
|
|
—
|
|
—
|
4,958
|
|||||||||||
|
Restricted cash equivalents
|
8,814
|
|
—
|
|
—
|
8,814
|
7,284
|
|
—
|
|
—
|
7,284
|
|||||||||||
|
Municipal securities:
|
|||||||||||||||||||||||
|
General obligation
|
109,866
|
|
3,601
|
|
(6
|
)
|
113,461
|
141,039
|
|
6,249
|
|
(3
|
)
|
147,285
|
|||||||||
|
Pre-refunded
|
32,442
|
|
756
|
|
—
|
33,198
|
39,928
|
|
950
|
|
(25
|
)
|
40,853
|
||||||||||
|
Revenue
|
100,198
|
|
2,781
|
|
(15
|
)
|
102,964
|
119,488
|
|
4,429
|
|
(3
|
)
|
123,914
|
|||||||||
|
Variable rate demand notes
|
106,540
|
|
—
|
|
—
|
106,540
|
33,500
|
|
—
|
|
—
|
33,500
|
|||||||||||
|
Asset backed securities
|
17,391
|
243
|
(43
|
)
|
17,591
|
19,934
|
61
|
—
|
19,995
|
||||||||||||||
|
Reserve Primary fund
|
—
|
|
—
|
|
—
|
—
|
2,444
|
—
|
|
—
|
2,444
|
||||||||||||
|
Cost method investments and equity method securities
|
7,060
|
—
|
|
—
|
7,060
|
9,751
|
312
|
|
(170
|
)
|
9,893
|
||||||||||||
|
Life insurance contracts
|
14,391
|
—
|
|
—
|
14,391
|
14,650
|
—
|
|
—
|
14,650
|
|||||||||||||
|
Total
|
$
|
629,758
|
|
$
|
11,015
|
|
$
|
(790
|
)
|
$
|
639,983
|
$
|
573,534
|
|
$
|
12,795
|
|
$
|
(1,146
|
)
|
$
|
585,183
|
|
The Company’s investments are classified as available-for-sale with the exception of life insurance contracts and certain cost method and equity method investments. The Company’s investment policies are designed to provide liquidity, preserve capital and maximize total return on invested assets with the focus on high credit quality securities. The Company limits the size of investment in any single issuer other than U.S. treasury securities and obligations of U.S. government coporations and agencies. As of December 31, 2010, the Company had no single issue with a par value greater than $5,000. As of December 31, 2010, 37% of the Company’s fair value investments in securities that carry a rating by Moody’s or S&P were rated AAA or higher, 76% were rated AA- or higher, and 99% were rated A- or higher. At December 31, 2010, the Company held certificates of deposit, life insurance contracts and cost and equity method invesments which did not carry a credit rating.
The fair value of available-for-sale investments with gross unrealized losses by investment type and length of time that individual securities have been in a continuous unrealized loss position were as follows:
|
December 31, 2010
|
December 31, 2009
|
||||||||||||||||||||||||||||||
|
Less Than 12 Months
|
12 Months or More
|
Less Than 12 Months
|
12 Months or More
|
||||||||||||||||||||||||||||
|
Unrealized Losses
|
Fair Value
|
Unrealized Losses
|
Fair Value
|
Unrealized Losses
|
Fair Value
|
Unrealized Losses
|
Fair Value
|
||||||||||||||||||||||||
|
U.S. Treasury securities and obligations of U.S. government corporations and agencies
|
$ | (140 | ) | $ | 9,246 | $ | — | $ | — | $ | (5 | ) | $ | 785 | $ | — | $ | — | |||||||||||||
|
Corporate securities
|
(586 | ) | 40,341 | — | — | (901 | ) | 99,418 | (39 | ) | 892 | ||||||||||||||||||||
|
Municipal securities:
|
|||||||||||||||||||||||||||||||
|
General obligation
|
(6 | ) | 1,131 | — | — | (3 | ) | 956 | — | — | |||||||||||||||||||||
|
Pre-refunded
|
— | — | — | — | (25 | ) | 7,811 | — | — | ||||||||||||||||||||||
|
Revenue
|
(15 | ) | 2,419 | — | — | (3 | ) | 916 | — | — | |||||||||||||||||||||
|
Equity securities
|
— | — | — | — | (84 | ) | 527 | (86 | ) | 629 | |||||||||||||||||||||
|
Asset backed securities
|
(43 | ) | 5,276 | — | — | — | — | — | — | ||||||||||||||||||||||
|
Total
|
$ | (790 | ) | $ | 58,413 | $ | — | $ | — | $ | (1,021 | ) | $ | 110,413 | $ | (125 | ) | $ | 1,521 | ||||||||||||
As of December 31, 2010, the gross unrealized losses were generated from 31 positions out of a total of 352 positions. The decline in fair value of fixed income securities is a result of movement in interest rates subsequent to the purchase of the security.
For each security in an unrealized loss position, the Company assesses whether it intends to sell the security or it is more likely than not the Company will be required to sell the security before recovery of the amortized cost basis for reasons such as liquidity, contractual or regulatory purposes. If the security meets this criterion, the decline in fair value is other-than-temporary and is recorded in earnings. The Company does not intend to sell these securities prior to maturity and it is not likely that the Company will be required to sell these securities prior to maturity; therefore, there is no indication of other than temporary impairment for these securities.
The contractual maturities of short-term and long-term investments and restricted deposits as of December 31, 2010, are as follows:
|
Investments
|
Restricted Deposits
|
|||||||||||||||
|
Amortized
Cost
|
Fair
Value
|
Amortized
Cost
|
Fair
Value
|
|||||||||||||
|
One year or less
|
$ | 21,141 | $ | 21,346 | $ | 17,387 | $ | 17,392 | ||||||||
|
One year through five years
|
464,270 | 474,255 | 5,368 | 5,366 | ||||||||||||
|
Five years through ten years
|
39,732 | 39,731 | — | — | ||||||||||||
|
Greater than ten years
|
81,860 | 81,893 | — | — | ||||||||||||
|
Total
|
$ | 607,003 | $ | 617,225 | $ | 22,755 | $ | 22,758 | ||||||||
The contractual maturities of short-term and long-term investments and restricted deposits as of December 31, 2009, are as follows:
|
Investments
|
Restricted Deposits
|
|||||||||||||||
|
Amortized
Cost
|
Fair
Value
|
Amortized
Cost
|
Fair
Value
|
|||||||||||||
|
One year or less
|
$ | 39,230 | $ | 39,554 | $ | 17,737 | $ | 17,758 | ||||||||
|
One year through five years
|
456,041 | 467,112 | 2,311 | 2,374 | ||||||||||||
|
Five years through ten years
|
28,597 | 28,780 | — | — | ||||||||||||
|
Greater than ten years
|
29,618 | 29,605 | — | — | ||||||||||||
|
Total
|
$ | 553,486 | $ | 565,051 | $ | 20,048 | $ | 20,132 | ||||||||
Actual maturities may differ from contractual maturities due to call or prepayment options. Asset backed securities are included in the one year through five years category, while equity securities and life insurance contracts are included in the five years through ten years category. The Company has an option to redeem at amortized cost substantially all of the securities included in the Greater than ten years category listed above.
Realized gains and losses are determined on the basis of specific identification or a first-in, first-out methodology, if specific identification is not practicable. The Company’s gross recorded realized gains and losses on investments for the years ended December 31, were as follows:
|
|
2010
|
2009 |
2008
|
|||||||
|
Gross realized gains
|
|
$
|
6,036
|
$ |
1,252
|
$
|
1,364
|
|||
|
Gross realized losses
|
|
(270
|
)
|
(1,111
|
)
|
(5,654
|
)
|
|||
|
Impairment of investment
|
(5,531
|
)
|
—
|
—
|
||||||
|
Net realized gains (losses)
|
|
$
|
235
|
$ |
141
|
$
|
(4,290
|
)
|
||
The Company continuously monitors investments for other-than-temporary impairment. Certain investments have experienced a decline in fair value due to changes in credit quality, market interest rates and/or general economic conditions. The Company recognizes an impairment loss for cost and equity method investments when evidence demonstrates that it is other-than-temporarily impaired. Evidence of a loss in value that is other than temporary may include the absence of an ability to recover the carrying amount of the investment or the inability of the investee to sustain a level of earnings that would justify the carrying amount of the investment. During 2010, the Company determined it had an other-than-temporary impairment of its investment in Casenet, LLC. As a result, the Company recorded an impairment charge of $5,531, including $3,531 of convertible promissory notes. The impairment charge is included in investment and other income.
Investment and other income included a net realized gain of $2,479 related to sales of fixed income investments and also included realized gains of $3,287 related to the Reserve Primary money market fund for distributions made during 2010. Investment amortization of $10,750, $7,209 and $3,388 was recorded in the years ended December 31, 2010, 2009 and 2008, respectively.
7. Fair Value Measurements
Assets and liabilities recorded at fair value in the consolidated balance sheets are categorized based upon the extent to which the fair value estimates are based upon observable or unobservable inputs. Level inputs are as follows:
|
Level Input:
|
|
Input Definition:
|
|
Level I
|
|
Inputs are unadjusted, quoted prices for identical assets or liabilities in active markets at the measurement date.
|
|
Level II
|
|
Inputs other than quoted prices included in Level I that are observable for the asset or liability through corroboration with market data at the measurement date.
|
|
Level III
|
|
Unobservable inputs that reflect management’s best estimate of what market participants would use in pricing the asset or liability at the measurement date.
|
The following table summarizes fair value measurements by level at December 31, 2010 for assets and liabilities measured at fair value on a recurring basis:
|
|
Level I
|
|
Level II
|
|
Level III
|
|
Total
|
|||||
|
Cash and cash equivalents
|
$
|
433,914
|
$
|
―
|
$
|
―
|
$
|
433,914
|
||||
|
Investments available for sale:
|
||||||||||||
|
U.S. Treasury securities and obligations of U.S. government corporations and agencies
|
|
$
|
14,809
|
|
$
|
7,096
|
|
$
|
―
|
|
$
|
21,905
|
|
Corporate securities
|
|
―
|
|
200,115
|
|
―
|
200,115
|
|||||
|
Municipal securities:
|
||||||||||||
|
General obligation
|
―
|
|
113,461
|
|
―
|
113,461
|
||||||
|
Pre-refunded
|
―
|
|
33,198
|
|
―
|
33,198
|
||||||
|
Revenue
|
―
|
|
102,964
|
|
―
|
102,964
|
||||||
|
Variable rate demand notes
|
|
―
|
|
106,540
|
|
―
|
106,540
|
|||||
|
Asset backed securities
|
―
|
17,591
|
―
|
17,591
|
||||||||
|
Total investments
|
$
|
14,809
|
|
$
|
580,965
|
|
$
|
―
|
$
|
595,774
|
||
|
Restricted deposits available for sale:
|
||||||||||||
|
Cash and cash equivalents
|
$
|
8,814
|
$
|
―
|
$
|
―
|
$
|
8,814
|
||||
|
Certificates of deposit
|
6,814
|
―
|
―
|
6,814
|
||||||||
|
U.S. Treasury securities and obligations of U.S. government corporations and agencies
|
7,130
|
―
|
―
|
7,130
|
||||||||
|
Total restricted deposits
|
$
|
22,758
|
$
|
―
|
$
|
―
|
$
|
22,758
|
||||
|
Total assets at fair value
|
$
|
471,481
|
$
|
580,965
|
$
|
―
|
$
|
1,052,446
|
||||
The following table summarizes fair value measurements by level at December 31, 2009, for assets and liabilities measured at fair value on a recurring basis:
|
Level I
|
Level II
|
Level III
|
Total
|
|||||||||
|
Cash and cash equivalents
|
$ | 400,951 | $ | ― | $ | ― | $ | 400,951 | ||||
|
Investments available for sale:
|
||||||||||||
|
U.S. Treasury securities and obligations of U.S. government corporations and agencies
|
$ | 16,635 | $ | 2,764 | $ | ― | $ | 19,399 | ||||
|
Corporate securities
|
― | 152,919 | ― | 152,919 | ||||||||
|
Municipal securities:
|
||||||||||||
|
General obligation
|
― | 147,285 | ― | 147,285 | ||||||||
|
Pre-refunded
|
― | 40,853 | ― | 40,853 | ||||||||
|
Revenue
|
― | 123,914 | ― | 123,914 | ||||||||
|
Variable rate demand notes
|
― | 33,500 | ― | 33,500 | ||||||||
|
Equity securities
|
3,585 | ― | ― | 3,585 | ||||||||
|
Asset backed securities
|
― | 19,995 | ― | 19,995 | ||||||||
|
Total investments
|
$ | 20,220 | $ | 521,230 | $ | ― | $ | 541,450 | ||||
|
Restricted deposits available for sale:
|
||||||||||||
|
Cash and cash equivalents
|
$ | 7,285 | $ | ― | $ | ― | $ | 7,285 | ||||
|
Certificates of deposit
|
4,958 | ― | ― | 4,958 | ||||||||
|
U.S. Treasury securities and obligations of U.S. government corporations and agencies
|
7,889 | ― | ― | 7,889 | ||||||||
|
Total restricted deposits
|
$ | 20,132 | $ | ― | $ | ― | $ | 20,132 | ||||
|
Total assets at fair value
|
$ | 441,303 | $ | 521,230 | $ | ― | $ | 962,533 | ||||
The Company periodically transfers U.S. Treasury securities and obligations of U.S. government corporations and agencies between Level I and Level II fair value measurements dependent upon the level of trading activity for the specific securities at the measurement date. The Company utilizes matrix pricing services to estimate fair value for securities which are not actively traded on the measurement date. The Company designates these securities as Level II fair value measurements. The aggregate carrying amount of the Company’s life insurance contracts and cost-method investments, which approximates fair value, was $21,451 and $23,601 as of December 31, 2010 and December 31, 2009, respectively.
8. Property, Software and Equipment
Property, software and equipment consist of the following as of December 31:
|
|
2010
|
2009
|
|||||
|
Computer software
|
|
$
|
141,918
|
$
|
113,416
|
||
|
Building
|
|
171,072
|
|
104,786
|
|||
|
Land
|
|
44,282
|
40,639
|
||||
|
Computer hardware
|
35,639
|
31,651
|
|||||
|
Furniture and office equipment
|
|
33,812
|
24,012
|
||||
|
Leasehold improvements
|
|
38,247
|
19,800
|
||||
|
|
464,970
|
334,304
|
|||||
|
Less accumulated depreciation
|
|
(138,629)
|
|
(103,883)
|
|||
|
Property, software and equipment, net
|
|
$
|
326,341
|
$
|
230,421
|
||
As of December 31, 2010 and 2009, the Company had assets acquired under capital leases of $6,339 and $6,411, net of accumulated amortization of $1,041 and $839, respectively. Amortization on assets under capital leases charged to expense is included in depreciation expense
.
Depreciation expense for the years ended December 31, 2010, 2009 and 2008 was $37,131, $33,103 and $28,453, respectively.
9. Goodwill and Intangible Assets
The following table summarizes the changes in goodwill by operating segment:
|
Medicaid Managed Care
|
Specialty
Services
|
Total
|
||||||||||
|
Balance as of December 31, 2008
|
$ | 51,548 | $ | 111,832 | $ | 163,380 | ||||||
|
Acquisitions
|
59,515 | 1,692 | 61,207 | |||||||||
|
Balance as of December 31, 2009
|
$ | 111,063 | $ | 113,524 | $ | 224,587 | ||||||
|
Acquisitions
|
45,385 | 8,079 | 53,464 | |||||||||
|
Balance as of December 31, 2010
|
$ | 156,448 | $ | 121,603 | $ | 278,051 | ||||||
Goodwill additions in 2010 and 2009 were related to the acquisitions discussed in Note 4,
Acquisitions
.
Intangible assets at December 31, consist of the following:
|
|
Weighted
Average Life
in Years
|
||||||||||
|
|
2010
|
2009
|
2010
|
2009
|
|||||||
|
Purchased contract rights
|
|
$
|
20,185
|
$
|
12,997
|
6.9
|
7.7
|
||||
|
Provider contracts
|
|
2,578
|
1,078
|
10.0
|
9.9
|
||||||
|
Customer relationships
|
16,056
|
15,845
|
7.7
|
7.3
|
|||||||
|
Trade names
|
|
5,595
|
5,545
|
18.9
|
19.0
|
||||||
|
Intangible assets
|
|
44,414
|
35,465
|
8.9
|
9.4
|
||||||
|
Less accumulated amortization:
|
|
||||||||||
|
Purchased contract rights
|
|
(7,053
|
)
|
(5,752
|
)
|
||||||
|
Provider contracts
|
|
(697
|
)
|
(515
|
)
|
||||||
|
Customer relationships
|
(6,278
|
)
|
(5,741
|
)
|
|||||||
|
Trade names
|
|
(1,277
|
)
|
(978
|
)
|
||||||
|
Total accumulated amortization
|
|
(15,305
|
)
|
(12,986
|
)
|
||||||
|
Intangible assets, net
|
|
$
|
29,109
|
$
|
22,479
|
||||||
Amortization expense was $4,119, $3,692 and $2,480 for the years ended December 31, 2010, 2009 and 2008, respectively.
Estimated total amortization expense related to intangible assets for each of the five succeeding fiscal years is as follows:
|
Year
|
Expense
|
|||
|
2011
|
$ | 5,200 | ||
|
2012
|
5,100 | |||
|
2013
|
4,600 | |||
|
2014
|
4,200 | |||
|
2015
|
3,400 | |||
10. Income Taxes
The consolidated income tax expense consists of the following for the years ended December 31:
|
|
2010
|
2009
|
2008
|
||||||
|
Current provision:
|
|
||||||||
|
Federal
|
|
$
|
46,259
|
$
|
41,310
|
$
|
53,543
|
||
|
State and local
|
|
6,868
|
5,578
|
6,726
|
|||||
|
Total current provision
|
|
53,127
|
46,888
|
60,269
|
|||||
|
Deferred provision
|
|
6,773
|
1,953
|
(7,834)
|
|||||
|
Total provision for income taxes
|
$
|
59,900
|
$
|
48,841
|
$
|
52,435
|
|||
The reconciliation of the tax provision at the U.S. Federal Statutory Rate to the provision for income taxes is as follows:
|
|
2010
|
2009
|
2008
|
||||||||
|
Earnings from continuing operations, before income tax expense
|
|
$
|
154,282
|
$
|
137,508
|
$
|
136,616
|
||||
|
Less noncontrolling interest
|
|
3,435
|
2,574
|
—
|
|||||||
|
Earnings from continuing operations, less noncontrolling interest, before income tax expense
|
150,847
|
134,934
|
136,616
|
||||||||
|
U.S. federal statutory rate
|
35.0%
|
35.0%
|
35.0%
|
||||||||
|
Tax provision at the U.S. federal statutory rate
|
52,797
|
47,227
|
47,816
|
||||||||
|
State income taxes, net of federal income tax benefit
|
|
6,231
|
2,419
|
4,938
|
|||||||
|
Other, net
|
872
|
(805
|
)
|
(319)
|
|||||||
|
Income tax expense
|
|
$
|
59,900
|
$
|
48,841
|
$
|
52,435
|
||||
|
Effective tax rate
|
39.7%
|
36.2%
|
38.4%
|
||||||||
The tax effects of temporary differences which give rise to deferred tax assets and liabilities are presented below for the years ended December 31:
|
2010
|
2009
|
|||||||
|
Deferred tax assets:
|
||||||||
|
Current:
|
||||||||
|
Medical claims liability and other accruals
|
$ | 25,418 | $ | 29,487 | ||||
|
Unearned premium and other deferred revenue
|
8,934 | 6,734 | ||||||
|
Other
|
1,999 | 2,633 | ||||||
|
Current deferred tax assets
|
36,351 | 38,854 | ||||||
|
Valuation allowance
|
(741 | ) | ― | |||||
|
Net current deferred tax assets
|
$ | 35,610 | $ | 38,854 | ||||
|
Non-current deferred tax assets:
|
||||||||
|
State net operating loss carry forward
|
$ | 4,841 | $ | 4,408 | ||||
|
Purchase of noncontrolling interest
|
13,223 | ― | ||||||
|
Investment in partnerships
|
― | 6,071 | ||||||
|
Stock compensation
|
13,676 | 13,915 | ||||||
|
Other
|
8,599 | 5,553 | ||||||
|
Non-current deferred tax assets
|
40,339 | 29,947 | ||||||
|
Valuation allowance
|
(4,400 | ) | (2,140 | ) | ||||
|
Net non-current deferred tax assets
|
$ | 35,939 | $ | 27,807 | ||||
|
Deferred tax liabilities:
|
||||||||
|
Current:
|
||||||||
|
Prepaid assets and other
|
$ | 4,350 | $ | 3,705 | ||||
|
Net current deferred tax liabilities
|
$ | 4,350 | $ | 3,705 | ||||
|
Non-current deferred tax liabilities:
|
||||||||
|
Intangible assets
|
$ | 11,519 | $ | 9,837 | ||||
|
Depreciation and amortization
|
34,743 | 38,302 | ||||||
|
Unrealized gain on investments
|
3,613 | 4,114 | ||||||
|
Other
|
2,777 | 85 | ||||||
|
Net non-current deferred tax liabilities
|
$ | 52,652 | $ | 52,338 | ||||
|
Net deferred tax assets
|
$ | 14,547 | $ | 10,618 | ||||
The Company's deferred tax assets include federal and state net operating losses, or NOLs, of which $1,136 were acquired in business combinations. Accordingly, the total and annual deduction for those NOLs is limited by tax law. The Company's federal NOLs expire between the years 2011 and 2023 and the state NOLs expire between the years 2011 and 2030. Valuation allowances are recorded for those NOLs the Company believes are more likely than not to expire unused. During 2010 and 2009, the Company recorded valuation allowance additions in the tax provision of $3,324 and $1,381, respectively. In 2010 and 2009, the Company recorded valuation allowance reductions of $323 and $80, respectively.
The Company maintains a reserve for uncertain tax positions that may be challenged by a tax authority. A roll-forward of the reserve is as follows:
|
Balance as of December 31, 2009
|
|
$
|
3,991
|
|
|
Increase based on tax positions during the current year
|
|
232
|
||
|
Decreases based on tax positions taken in a prior period
|
(2,556
|
)
|
||
|
Balance as of December 31, 2010
|
|
$
|
1,667
|
The December 31, 2010 reserve balance of $1,667 would decrease income tax expense, if recognized.
The Company recognizes interest accrued related to unrecognized tax benefits in the provision for income taxes. Interest accrued, net of federal benefit, was $707 and $1,072 as of December 31, 2010 and December 31, 2009, respectively. No penalties have been accrued.
The federal income tax returns for 2007 through 2010 are open tax years. In May 2008, the Internal Revenue Service, or IRS, began an audit of the Company's 2007 tax return. In connection with the IRS examination of the Company's 2007 tax return, the field agent initially denied the $34,856 tax benefit related to the abandonment of the FirstGuard stock in 2007 based on certain assumptions of fact by the IRS. The most significant change was to re-characterize the loss as a capital loss versus an ordinary loss.
In connection with an appeals conference in August 2010, the Company responded to the field agent's original write-up and provided additional documentation to the Appeals Officer to support the Company's view that sufficient technical tax authority existed at the time of the FirstGuard abandonment to support the Company's tax position. The Company is proceeding with the appeals process and believes that once the factual issues surrounding the abandonment are understood by the IRS, the position, more likely than not, will be upheld. Accordingly the Company has not made any adjustments to the reserve for this position.
The Company files in numerous state jurisdictions with varying statutes of limitation. The unrecognized state tax benefits are related to returns open from 2006 to 2010.
11. Medical Claims Liability
The change in medical claims liability is summarized as follows:
|
Year Ended December 31,
|
|||||||||
|
|
2010
|
2009
|
2008
|
||||||
|
Balance, January 1,
|
|
$
|
470,932
|
$
|
384,360
|
$
|
323,741
|
||
|
Acquisitions
|
|
—
|
—
|
15,398
|
|||||
|
Incurred related to:
|
|||||||||
|
Current year
|
|
3,582,463
|
3,216,533
|
2,659,036
|
|||||
|
Prior years
|
|
(68,069
|
)
|
(53,010
|
)
|
(18,701)
|
|||
|
Total incurred
|
|
3,514,394
|
3,163,523
|
2,640,335
|
|||||
|
Paid related to:
|
|||||||||
|
Current year
|
|
3,133,527
|
2,752,983
|
2,292,150
|
|||||
|
Prior years
|
|
395,034
|
323,968
|
302,964
|
|||||
|
Total paid
|
|
3,528,561
|
3,076,951
|
2,595,114
|
|||||
|
Balance, December 31,
|
|
$
|
456,765
|
$
|
470,932
|
$
|
384,360
|
||
Changes in estimates of incurred claims for prior years are primarily attributable to reserving under moderately adverse conditions. In addition, claims processing initiatives yielded increased claim payment recoveries and coordination of benefits related to prior year dates of service. Changes in medical utilization and cost trends and the effect of medical management initiatives may also contribute to changes in medical claim liability estimates. While the Company has evidence that medical management initiatives are effective on a case by case basis, medical management initiatives primarily focus on events and behaviors prior to the incurrence of the medical event and generation of a claim. Accordingly, any change in behavior, leveling of care, or coordination of treatment occurs prior to claim generation and as a result, the costs prior to the medical management initiative are not known by the Company. Additionally, certain medical management initiatives are focused on member and provider education with the intent of influencing behavior to appropriately align the medical services provided with the member’s acuity. In these cases, determining whether the medical management initiative changed the behavior cannot be determined. Because of the complexity of its business, the number of states in which it operates, and the volume of claims that it processes, the Company is unable to practically quantify the impact of these initiatives on its changes in estimates of IBNR.
The Company had reinsurance recoverables related to medical claims liability of $6,180 and $4,700 at December 31, 2010 and 2009, respectively, included in premium and related receivables.
Debt consists of the following at December 31:
|
2010
|
2009
|
|||||||
|
Senior notes
|
$ | 175,000 | $ | 175,000 | ||||
|
Revolving credit agreement
|
60,000 | 84,000 | ||||||
|
Mortgage notes payable
|
89,500 | 9,900 | ||||||
|
Capital leases
|
6,141 | 6,272 | ||||||
|
Joint venture construction loan
|
― | 32,559 | ||||||
|
Total debt
|
330,641 | 307,731 | ||||||
|
Less current portion
|
(2,817 | ) | (646 | ) | ||||
|
Long-term debt
|
$ | 327,824 | $ | 307,085 | ||||
Senior Notes
In March 2007, the Company issued $175,000 aggregate principal amount of 7 ¼% Senior Notes due April 1, 2014, or the Notes. The Notes have been registered under the Securities Act of 1933, as amended, pursuant to a registration rights agreement with the initial purchasers. The indenture governing the Notes contains non-financial and financial covenants, including requirements of a minimum fixed charge coverage ratio. Interest is paid semi-annually in April and October.
Revolving Credit Agreement
The Company had a $300,000 revolving credit agreement dated September 14, 2004 with various financial institutions, expiring in September 2011. The agreement contained various non-financial and financial covenants. As of December 31, 2010, the Company had $60,000 in borrowings outstanding under the agreement and $41,576 in letters of credit outstanding, leaving availability of $198,424. The outstanding borrowings at December 31, 2010 bore interest at the prime rate of 3.25%.
In January 2011, the Company replaced the $300,000 revolving credit agreement with a new $350,000 revolving credit facility, or the revolver. The revolver is unsecured and has a five-year maturity with non-financial and financial covenants, including requirements of minimum fixed charge coverage ratios, maximum debt to EBITDA ratios and minimum net worth. Borrowings under the revolver will bear interest based upon LIBOR rates the Federal funds rate, or the prime rate. There is a commitment fee on the unused portion of the agreement that ranges from 0.25% to 0.50% depending on the total debt to EBITDA ratio. As a result of the refinancing, the outstanding balance associated with the previous revolving credit agreement continues to be classified as long term as of December 31, 2010.
Mortgage Notes Payable
In June 2009, Centene Center LLC executed a $95,000 construction loan associated with the construction of a real estate development to include the Company’s corporate headquarters. Centene Center LLC capitalized $1,089 and $116 of interest in 2010 and 2009, respectively. In December 2010, the Company acquired the remaining ownership interest in the joint venture and refinanced the $95,000 construction loan with an $80,000 10 year mortgage note payable. The mortgage note is non-recourse to the Company, bears a 5.14% interest rate and has a financial covenant requiring a minimum debt service coverage ratio.
The Company also has a mortgage note of $9,500 collateralized by another building and parking garage. The collateralized properties had a net book value of $22,443 at December 31, 2010. The mortgage is due August 31, 2014 and bears interest at the LIBOR rate plus 3% or the bank’s certificate of deposit rate plus 2%. The mortgage includes a financial covenant requiring a minimum fixed charge coverage ratio. The weighted average interest rate of outstanding borrowings was 3.12% at December 31, 2010.
Aggregate maturities for the Company’s debt are as follows:
|
2011
|
$ | 2,817 | ||
|
2012
|
3,227 | |||
|
2013
|
3,269 | |||
|
2014
|
186,318 | |||
|
2015
|
3,174 | |||
|
Thereafter
|
131,836 | |||
|
Total
|
$ | 330,641 |
The fair value of outstanding debt was approximately $336,766 and $305,544 at December 31, 2010 and 2009, respectively.
13. Stockholders’ Equity
The Company has 10,000,000 authorized shares of preferred stock at $.001 par value. At December 31, 2010, there were no preferred shares outstanding.
On October 26, 2009, the Company’s Board of Directors extended the Company’s stock repurchase program. The program authorizes the repurchase of up to 4,000,000 shares of the Company’s common stock from time to time on the open market or through privately negotiated transactions. No duration has been placed on the repurchase program, however, the terms of the Senior Notes require that all such redemptions are consummated on or before April 1, 2011. The Company reserves the right to discontinue the repurchase program at any time. During the year ended December 31, 2010, the Company did not repurchase any shares through this publicly announced program.
As a component of the employee stock compensation plan, employees can use shares of stock which have vested to satisfy personal tax withholding obligations. During 2010, the Company repurchased 141,073 shares at an aggregate cost of $3,224. During 2009, the Company repurchased 332,595 shares at an aggregate cost of $6,304. These shares are included in the Company’s treasury stock.
14. Statutory Capital Requirements and Dividend Restrictions
Various state laws require Centene’s regulated subsidiaries to maintain minimum capital levels specified by each state and restrict the amount of dividends that may be paid without prior regulatory approval. At December 31, 2010 and 2009, Centene’s subsidiaries, including UHP, had aggregate statutory capital and surplus of $516,100 and $453,200, respectively, compared with the required minimum aggregate statutory capital and surplus of $308,000 and $286,500, respectively.
15. Stock Incentive Plans
The Company’s stock incentive plans allow for the granting of restricted stock or restricted stock unit awards and options to purchase common stock. Both incentive stock options and nonqualified stock options can be awarded under the plans. No option will be exercisable for longer than ten years after the date of grant. The plans have 2,082,929 shares available for future awards. Compensation expense for stock options and restricted stock unit awards is recognized on a straight-line basis over the vesting period, generally three to five years for stock options and one to ten years for restricted stock or restricted stock unit awards. Certain restricted stock unit awards contain performance-based as well as service-based provisions. Certain awards provide for accelerated vesting if there is a change in control as defined in the plans. The total compensation cost that has been charged against income for the stock incentive plans was $13,874, $14,634 and $15,328 for the years ended December 31, 2010, 2009 and 2008, respectively. The total income tax benefit recognized in the income statement for stock-based compensation arrangements was $4,713, $3,945 and $4,771 for the years ended December 31, 2010, 2009 and 2008, respectively.
Option activity for the year ended December 31, 2010 is summarized below:
|
Shares
|
Weighted
Average
Exercise
Price
|
Aggregate Intrinsic Value
|
Weighted
Average Remaining
Contractual
Term
|
||||||||
|
Outstanding as of December 31, 2009
|
3,460,755
|
$
|
20.31
|
||||||||
|
Granted
|
10,000
|
24.12
|
|||||||||
|
Exercised
|
(202,734)
|
12.99
|
|||||||||
|
Forfeited
|
(129,500)
|
22.38
|
|||||||||
|
Outstanding as of December 31, 2010
|
3,138,521
|
$
|
20.71
|
$
|
15,395
|
4.7
|
|||||
|
Exercisable as of December 31, 2010
|
2,743,754
|
$
|
20.55
|
$
|
13,987
|
4.3
|
|||||
The fair value of each option grant is estimated on the date of the grant using the Black-Scholes option-pricing model with the following weighted-average assumptions:
|
Year Ended December 31,
|
|||||||||
|
2010
|
2009
|
2008
|
|||||||
|
Expected life (in years)
|
5.8 | 5.8 | 5.8 | ||||||
|
Risk-free interest rate
|
2.7% | 2.2% | 3.0% | ||||||
|
Expected volatility
|
48.2% | 50.9% | 50.3% | ||||||
|
Expected dividend yield
|
0% | 0% | 0% | ||||||
For the years ended December 31, 2010, 2009 and 2008, the Company used a projected expected life for each award granted based on historical experience of employees’ exercise behavior. The expected volatility is primarily based on historical volatility levels along with the implied volatility of exchange traded options to purchase Centene common stock. The risk-free interest rates are based on the implied yield currently available on U.S. Treasury instruments with a remaining term equal to the expected life.
Other information pertaining to option activity during the years ended December 31, 2010, 2009 and 2008 is as follows:
|
Year Ended December 31,
|
||||||||||||
|
2010
|
2009
|
2008
|
||||||||||
|
Weighted-average fair value of options granted
|
$ | 11.60 | $ | 8.76 | $ | 9.27 | ||||||
|
Total intrinsic value of stock options exercised
|
$ | 1,999 | $ | 2,192 | $ | 3,529 | ||||||
A summary of the Company's non-vested restricted stock and restricted stock unit shares as of December 31, 2010, and changes during the year ended December 31, 2010, is presented below:
|
Shares
|
Weighted
Average
Grant Date
Fair Value
|
|||||||
|
Non-vested balance as of December 31, 2009
|
1,691,061
|
$
|
20.73
|
|||||
|
Granted
|
839,635
|
23.86
|
||||||
|
Vested
|
(644,261
|
)
|
20.48
|
|||||
|
Forfeited
|
(18,400
|
)
|
19.20
|
|||||
|
Non-vested balance as of December 31, 2010
|
1,868,035
|
$
|
22.62
|
|||||
The total fair value of restricted stock and restricted stock units vested during the years ended December 31, 2010, 2009 and 2008, was $13,012, $17,213 and $1,822, respectively.
As of December 31, 2010, there was $37,970 of total unrecognized compensation cost related to non-vested share-based compensation arrangements granted under the plans; that cost is expected to be recognized over a weighted-average period of 1.8 years. The actual tax benefit realized for the tax deductions from stock option exercises totaled $883, $395 and $1,127 for the years ended December 31, 2010, 2009 and 2008, respectively.
The Company maintains an employee stock purchase plan and has issued 37,048 shares, 34,306 shares, and 36,682 shares in 2010, 2009 and 2008, respectively.
16. Retirement Plan
Centene has a defined contribution plan which covers substantially all employees who are at least twenty-one years of age. Under the plan, eligible employees may contribute a percentage of their base salary, subject to certain limitations. Centene may elect to match a portion of the employee’s contribution. Company expense related to matching contributions to the plan was $4,044, $3,499 and $3,681 during the years ended December 31, 2010, 2009 and 2008, respectively.
17. Commitments
Centene and its subsidiaries lease office facilities and various equipment under non-cancelable operating leases which may contain escalation provisions. The rental expense related to these leases is recorded on a straight-line basis over the lease term, including rent holidays. Tenant improvement allowances are recorded as a liability and amortized against rent expense over the term of the lease. Rent expense was $21,393, $20,211 and $19,561 for the years ended December 31, 2010, 2009 and 2008, respectively. Annual non-cancelable minimum lease payments over the next five years and thereafter are as follows:
|
2011
|
$ | 18,444 | ||
|
2012
|
14,874 | |||
|
2013
|
10,245 | |||
|
2014
|
8,085 | |||
|
2015
|
6,285 | |||
|
Thereafter
|
9,864 | |||
| $ | 67,797 |
18. Contingencies
In May 2008, the Internal Revenue Services began an audit of the Company’s 2006 and 2007 tax returns. In connection with the IRS examination, the field agent initially denied the $34,856 tax benefit related to the abandonment of the FirstGuard stock in 2007 based on certain assumptions of fact by the IRS. The most significant change was to re-characterize the loss as a capital loss versus an ordinary loss.
In connection with an appeals conference in August 2010, the Company responded to the field agent's original write-up and provided additional documentation to the Appeals Officer to support the Company's view that sufficient technical tax authority existed at the time of the FirstGuard abandonment to support the Company's tax position. The Company is proceeding with the appeals process and believes that once the factual issues surrounding the abandonment are understood by the IRS, the position, more likely than not, will be upheld. Accordingly the Company has not made any adjustments to the reserve for this position.
The Company is routinely subjected to legal proceedings in the normal course of business. While the ultimate resolution of such matters is uncertain, the Company does not expect the results of any of these matters discussed above individually, or in the aggregate, to have a material effect on its financial position or results of operations.
19. Earnings Per Share
The following table sets forth the calculation of basic and diluted net earnings per share for the years ended December 31:
|
2010
|
2009
|
2008
|
||||||||||
|
Earnings (loss) attributable to Centene Corporation common shareholders:
|
||||||||||||
|
Earnings from continuing operations, net of tax
|
$ | 90,947 | $ | 86,093 | $ | 84,181 | ||||||
|
Discontinued operations, net of tax
|
3,889 | (2,422 | ) | (684 | ) | |||||||
|
Net earnings
|
$ | 94,836 | $ | 83,671 | $ | 83,497 | ||||||
|
Shares used in computing per share amounts:
|
||||||||||||
|
Weighted average number of common shares outstanding
|
48,754,947 | 43,034,791 | 43,275,187 | |||||||||
|
Common stock equivalents (as determined by applying the treasury stock method)
|
1,692,941 | 1,281,676 | 1,123,768 | |||||||||
|
Weighted average number of common shares and potential dilutive common shares outstanding
|
50,447,888 | 44,316,467 | 44,398,955 | |||||||||
|
Net earnings (loss) per share attributable to Centene Corporation:
|
||||||||||||
|
Basic:
|
||||||||||||
|
Continuing operations
|
$ | 1.87 | $ | 2.00 | $ | 1.95 | ||||||
|
Discontinued operations
|
0.08 | (0.06 | ) | (0.02 | ) | |||||||
|
Earnings per common share
|
$ | 1.95 | $ | 1.94 | $ | 1.93 | ||||||
|
Diluted:
|
||||||||||||
|
Continuing operations
|
$ | 1.80 | $ | 1.94 | $ | 1.90 | ||||||
|
Discontinued operations
|
0.08 | (0.05 | ) | (0.02 | ) | |||||||
|
Earnings per common share
|
$ | 1.88 | $ | 1.89 | $ | 1.88 | ||||||
The calculation of diluted earnings per common share for 2010, 2009 and 2008 excludes the impact of 2,010,183 shares, 2,351,679 shares and 2,004,778 shares, respectively, related to anti-dilutive stock options, restricted stock and restricted stock units.
20. Segment Information
Centene operates in two segments: Medicaid Managed Care and Specialty Services. The Medicaid Managed Care segment consists of Centene’s health plans including all of the functions needed to operate them. The Specialty Services segment consists of Centene’s specialty companies offering products for behavioral health, health insurance exchanges, individual health insurance, life and health management, long-term care programs, managed vision, telehealth services, and pharmacy benefits management. The health plans in Arizona, operated by our long-term care company, and Massachusetts, operated by our individual health insurance provider, are included in the Specialty Services segment.
Factors used in determining the reportable business segments include the nature of operating activities, existence of separate senior management teams, and the type of information presented to the Company’s chief operating decision maker to evaluate all results of operations.
Segment information as of and for the year ended December 31, 2010, follows:
|
Medicaid
Managed Care
|
Specialty
Services
|
Eliminations
|
Consolidated
Total
|
|||||||||||||
|
Premium and service revenues from external customers
|
$ | 3,679,807 | $ | 604,026 | $ | — | $ | 4,283,833 | ||||||||
|
Premium and service revenues from internal customers
|
60,676 | 508,157 | (568,833 | ) | — | |||||||||||
|
Total premium and service revenues
|
3,740,483 | 1,112,183 | (568,833 | ) | 4,283,833 | |||||||||||
|
Earnings from operations
|
117,106 | 39,963 | — | 157,069 | ||||||||||||
|
Total assets
|
1,552,886 | 390,996 | — | 1,943,882 | ||||||||||||
|
Stock compensation expense
|
12,716 | 1,158 | — | 13,874 | ||||||||||||
|
Depreciation expense
|
33,502 | 3,629 | — | 37,131 | ||||||||||||
|
Total capital expenditures
|
116,208 | 2,348 | — | 118,556 | ||||||||||||
Segment information as of and for the year ended December 31, 2009, follows:
|
Medicaid
Managed Care
|
Specialty
Services
|
Eliminations
|
Consolidated
Total
|
|||||||||||||
|
Premium and service revenues from external customers
|
$ | 3,398,009 | $ | 480,274 | $ | — | $ | 3,878,283 | ||||||||
|
Premium and service revenues from internal customers
|
66,763 | 569,191 | (635,954 | ) | — | |||||||||||
|
Total premium and service revenues
|
3,464,772 | 1,049,465 | (635,954 | ) | 3,878,283 | |||||||||||
|
Earnings from operations
|
99,307 | 38,828 | — | 138,135 | ||||||||||||
|
Total assets
|
1,330,987 | 371,377 | — | 1,702,364 | ||||||||||||
|
Stock compensation expense
|
13,285 | 1,349 | — | 14,634 | ||||||||||||
|
Depreciation expense
|
29,007 | 4,096 | — | 33,103 | ||||||||||||
|
Total capital expenditures
|
80,867 | 2,246 | — | 83,113 | ||||||||||||
Segment information as of and for the year ended December 31, 2008, follows:
|
Medicaid
Managed Care
|
Specialty
Services
|
Eliminations
|
Consolidated
Total
|
|||||||||||||
|
Premium and service revenues from external customers
|
$ | 2,931,894 | $ | 342,419 | $ | — | $ | 3,274,313 | ||||||||
|
Premium and service revenues from internal customers
|
60,451 | 474,061 | (534,512 | ) | — | |||||||||||
|
Total premium and service revenues
|
2,992,345 | 816,480 | (534,512 | ) | 3,274,313 | |||||||||||
|
Earnings from operations
|
108,363 | 23,198 | — | 131,561 | ||||||||||||
|
Total assets
|
1,105,610 | 345,542 | — | 1,451,152 | ||||||||||||
|
Stock compensation expense
|
13,840 | 1,346 | — | 15,186 | ||||||||||||
|
Depreciation expense
|
25,271 | 3,182 | — | 28,453 | ||||||||||||
|
Total capital expenditures
|
58,856 | 4,635 | — | 63,491 | ||||||||||||
21. Comprehensive Earnings
Differences between net earnings and total comprehensive earnings resulted from changes in unrealized gains on investments available for sale, as follows:
|
Year Ended December 31,
|
||||||||
|
2010
|
2009
|
2008
|
||||||
|
Net earnings
|
$
|
94,836
|
$
|
83,671
|
$
|
83,497
|
||
|
Reclassification adjustment, net of tax
|
(1,660)
|
252
|
252
|
|||||
|
Change in unrealized gains on investments available for sale, net of tax
|
736
|
3,944
|
1,329
|
|||||
|
Total change
|
(924)
|
4,196
|
1,581
|
|||||
|
Comprehensive earnings
|
93,912
|
87,867
|
85,078
|
|||||
|
Comprehensive earnings attributable to the noncontrolling interest
|
3,435
|
2,574
|
—
|
|||||
|
Comprehensive earnings attributable to Centene Corporation
|
$
|
90,477
|
$
|
85,293
|
$
|
85,078
|
||
22. Quarterly Selected Financial Information
(In thousands, except share data and membership data)
(Unaudited)
|
For the Quarter Ended
|
||||||||||||||||
|
March 31,
2010
|
June 30,
2010
|
September 30,
2010
|
December 31,
2010
|
|||||||||||||
|
Total revenues
|
$ | 1,068,721 | $ | 1,076,772 | $ | 1,121,861 | $ | 1,180,969 | ||||||||
|
Amounts attributable to Centene Corporation common shareholders:
|
||||||||||||||||
|
Earnings from continuing operations, net of income tax expense
|
20,082 | 22,999 | 22,402 | 25,464 | ||||||||||||
|
Discontinued operations, net of income tax expense (benefit)
|
3,920 | (226 | ) | 260 | (65 | ) | ||||||||||
|
Net earnings
|
$ | 24,002 | $ | 22,773 | $ | 22,662 | $ | 25,399 | ||||||||
|
Net earnings per share attributable to Centene Corporation:
|
||||||||||||||||
|
Basic:
|
||||||||||||||||
|
Continued operations
|
$ | 0.43 | $ | 0.46 | $ | 0.46 | $ | 0.52 | ||||||||
|
Discontinued operations
|
0.08 | — | — | — | ||||||||||||
|
Basic earnings per common share
|
$ | 0.51 | $ | 0.46 | $ | 0.46 | $ | 0.52 | ||||||||
|
Diluted:
|
||||||||||||||||
|
Continued operations
|
$ | 0.41 | $ | 0.45 | $ | 0.44 | $ | 0.50 | ||||||||
|
Discontinued operations
|
0.08 | — | — | — | ||||||||||||
|
Diluted earnings per common share
|
$ | 0.49 | $ | 0.45 | $ | 0.44 | $ | 0.50 | ||||||||
|
Period end at-risk membership
|
1,471,300 | 1,534,600 | 1,473,800 | 1,533,500 | ||||||||||||
|
For the Quarter Ended
|
||||||||||||||||
|
March 31,
2009
|
June 30,
2009
|
September 30,
2009
|
December 31,
2009
|
|||||||||||||
|
Total revenues
|
$ | 932,435 | $ | 1,039,469 | $ | 1,038,234 | $ | 1,092,726 | ||||||||
|
Amounts attributable to Centene Corporation common shareholders:
|
||||||||||||||||
|
Earnings from continuing operations, net of income tax expense
|
18,907 | 20,715 | 22,728 | 23,743 | ||||||||||||
|
Discontinued operations, net of income tax (benefit) expense
|
(449 | ) | (485 | ) | (1,460 | ) | (28 | ) | ||||||||
|
Net earnings
|
$ | 18,458 | $ | 20,230 | $ | 21,268 | $ | 23,715 | ||||||||
|
Net earnings (loss) per share attributable to Centene Corporation:
|
||||||||||||||||
|
Basic:
|
||||||||||||||||
|
Continued operations
|
$ | 0.44 | $ | 0.48 | $ | 0.53 | $ | 0.55 | ||||||||
|
Discontinued operations
|
(0.01 | ) | (0.01 | ) | (0.04 | ) | — | |||||||||
|
Basic earnings per common share
|
$ | 0.43 | $ | 0.47 | $ | 0.49 | $ | 0.55 | ||||||||
|
Diluted:
|
||||||||||||||||
|
Continued operations
|
$ | 0.43 | $ | 0.47 | $ | 0.51 | $ | 0.53 | ||||||||
|
Discontinued operations
|
(0.01 | ) | (0.01 | ) | (0.03 | ) | — | |||||||||
|
Diluted earnings per common share
|
$ | 0.42 | $ | 0.46 | $ | 0.48 | $ | 0.53 | ||||||||
|
Period end at-risk membership
|
1,249,600 | 1,291,400 | 1,388,900 | 1,458,200 | ||||||||||||
23. Condensed Financial Information of Registrant
Centene Corporation (Parent Company Only)
Condensed Balance Sheets
(In thousands, except share data)
|
December 31,
|
||||||||
|
2010
|
2009
|
|||||||
|
ASSETS
|
||||||||
|
Current assets:
|
||||||||
|
Cash and cash equivalents
|
$ | 9,380 | $ | 8,664 | ||||
|
Short-term investments, at fair value (amortized cost $560 and $1,305, respectively)
|
568 | 1,307 | ||||||
|
Other current assets
|
102,754 | 84,588 | ||||||
|
Total current assets
|
112,702 | 94,559 | ||||||
|
Long-term investments, at fair value (amortized cost $10,848 and 16,646, respectively)
|
11,109 | 17,160 | ||||||
|
Investment in subsidiaries
|
898,601 | 756,892 | ||||||
|
Other long-term assets
|
17,134 | 14,673 | ||||||
|
Total assets
|
$ | 1,039,546 | $ | 883,284 | ||||
|
LIABILITIES AND STOCKHOLDERS’ EQUITY
|
||||||||
|
Current liabilities
|
$ | 6,193 | $ | 3,785 | ||||
|
Long-term debt
|
235,000 | 259,000 | ||||||
|
Other long-term liabilities
|
1,298 | 1,072 | ||||||
|
Total liabilities
|
242,491 | 263,857 | ||||||
|
Stockholders’ equity:
|
||||||||
|
Common stock, $.001 par value; authorized 100,000,000 shares; 52,172,037 issued and 49,616,824 outstanding at December 31, 2010, and 45,593,383 issued and 43,179,373 outstanding at December 31, 2009
|
52 | 46 | ||||||
|
Additional paid-in capital
|
384,206 | 281,806 | ||||||
|
Accumulated other comprehensive income:
|
||||||||
|
Unrealized gain on investments, net of tax
|
6,424 | 7,348 | ||||||
|
Retained earnings
|
453,743 | 358,907 | ||||||
|
Treasury stock, at cost (2,555,213 and 2,414,010 shares, respectively)
|
(50,486 | ) | (47,262 | ) | ||||
|
Total Centene stockholders’ equity
|
793,939 | 600,845 | ||||||
|
Noncontrolling interest
|
3,116 | 18,582 | ||||||
|
Total stockholders’ equity
|
797,055 | 619,427 | ||||||
|
Total liabilities and stockholders’ equity
|
$ | 1,039,546 | $ | 883,284 | ||||
See notes to condensed financial information of registrant.
Centene Corporation (Parent Company Only)
Condensed Statements of Operations
(In thousands, except share data)
|
Year Ended December 31,
|
||||||||||||
|
2010
|
2009
|
2008
|
||||||||||
|
Expenses:
|
||||||||||||
|
General and administrative expenses
|
$
|
(3,502
|
)
|
$
|
(2,906
|
)
|
$
|
(6,153
|
)
|
|||
|
Other income (expense):
|
||||||||||||
|
Investment and other income
|
(4,700
|
)
|
6
|
(324
|
)
|
|||||||
|
Interest expense
|
(14,844
|
)
|
(15,692
|
)
|
(15,395
|
)
|
||||||
|
Loss before income taxes
|
(23,046
|
)
|
(18,592
|
)
|
(21,872
|
)
|
||||||
|
Income tax benefit
|
(8,576
|
)
|
(6,004
|
)
|
(7,988
|
)
|
||||||
|
Net earnings (loss) before equity in subsidiaries
|
(14,470
|
)
|
(12,588
|
)
|
(13,884
|
)
|
||||||
|
Equity in earnings from subsidiaries
|
109,306
|
96,259
|
97,381
|
|||||||||
|
Net earnings
|
$
|
94,836
|
$
|
83,671
|
$
|
83,497
|
||||||
|
Net earnings per share:
|
||||||||||||
|
Basic earnings per common share
|
$
|
1.95
|
$
|
1.94
|
$
|
1.93
|
||||||
|
Diluted earnings per common share
|
$
|
1.88
|
$
|
1.89
|
$
|
1.88
|
||||||
|
Weighted average number of shares outstanding:
|
||||||||||||
|
Basic
|
48,754,947
|
43,034,791
|
43,275,187
|
|||||||||
|
Diluted
|
50,447,888
|
44,316,467
|
44,398,955
|
|||||||||
See notes to condensed financial information of registrant.
Centene Corporation (Parent Company Only)
Condensed Statements of Cash Flows
(In thousands)
|
Year Ended December 31,
|
||||||||||||
|
2010
|
2009
|
2008
|
||||||||||
|
Cash flows from operating activities:
|
||||||||||||
|
Cash provided by operating activities
|
$
|
23,504
|
$
|
92,711
|
$
|
37,487
|
||||||
|
Cash flows from investing activities:
|
||||||||||||
|
Net dividends from and capital contributions to subsidiaries
|
(17,172
|
)
|
(67,328
|
)
|
10,146
|
|||||||
|
Purchase of investments
|
(86,549
|
)
|
(17,181
|
)
|
(39,261
|
)
|
||||||
|
Sales and maturities of investments
|
90,121
|
9,189
|
30,779
|
|||||||||
|
Acquisitions, net of cash acquired
|
(48,656
|
)
|
(38,563
|
)
|
(91,345
|
)
|
||||||
|
Proceeds from asset sales
|
13,420
|
—
|
—
|
|||||||||
|
Net cash used in investing activities
|
(48,836
|
)
|
(113,883
|
)
|
(89,681
|
)
|
||||||
|
Cash flows from financing activities:
|
||||||||||||
|
Proceeds from borrowings
|
91,000
|
616,500
|
224,000
|
|||||||||
|
Payment of long-term debt and notes payable
|
(115,000
|
)
|
(595,500
|
)
|
(166,000
|
)
|
||||||
|
Proceeds from exercise of stock options
|
3,419
|
2,365
|
5,354
|
|||||||||
|
Common stock offering
|
104,534
|
—
|
—
|
|||||||||
|
Common stock repurchases
|
(3,224
|
)
|
(6,304
|
)
|
(23,510
|
)
|
||||||
|
Debt issue costs
|
—
|
(368
|
)
|
—
|
||||||||
|
Distribution to noncontrolling interest
|
(8,158
|
)
|
(3,170
|
)
|
—
|
|||||||
|
Contributions from noncontrolling interest
|
771
|
11,219
|
—
|
|||||||||
|
Purchase of noncontrolling interest
|
(48,257
|
)
|
—
|
—
|
||||||||
|
Excess tax benefits from stock compensation
|
963
|
53
|
3,100
|
|||||||||
|
Net cash provided by financing activities
|
26,048
|
24,795
|
42,944
|
|||||||||
|
Net increase (decrease) in cash and cash equivalents
|
716
|
3,623
|
(9,250
|
)
|
||||||||
|
Cash and cash equivalents,
beginning of period
|
8,664
|
5,041
|
14,291
|
|||||||||
|
Cash and cash equivalents,
end of period
|
$
|
9,380
|
$
|
8,664
|
$
|
5,041
|
||||||
See notes to condensed financial information of registrant.
Notes to Condensed Financial Information of Registrant
Note A – Basis of Presentation and Significant Accounting Policies
In Centene Corporation’s parent company only financial statements, Centene Corporation’s investment in subsidiaries is stated at cost plus equity in undistributed earnings of the subsidiaries. Centene Corporation’s share of net income of its unconsolidated subsidiaries is included in income using the equity method of accounting.
Centene Corporation has unrestricted subsidiaries that receive monthly management fees from our restricted subsidiaries. The management and service fees received by our unrestricted subsidiaries are associated with all of the functions required to manage the restricted subsidiaries including but not limited to salaries and wages for all personnel, rent, utilities, medical management, provider contracting, compliance, member services, claims processing, information technology, cash management, finance and accounting, and other services. The management fees are based on a percentage of the restricted subsidiaries revenue.
Due to our centralized cash management function, all cash flows generated by our unrestricted subsidiaries, including management fees, are transferred to the parent company, primarily to repay borrowings on the parent company’s revolving credit facility. The parent company may also utilize the cash flow to make acquisitions, fund capital contributions to subsidiaries and fund its operations. During the years ended December 31, 2010, 2009, and 2008, cash flows received by the parent from unrestricted subsidiaries was $38.0 million, $102.2 million, and $49.4 million and was included in cash flows from operating activities.
Certain amounts presented in the parent company only financial statements are eliminated in the consolidated financial statements of Centene Corporation.
Centene Corporation’s parent company only financial statements should be read in conjunction with Centene Corporation’s audited consolidated financial statements and the notes to consolidated financial statements included in this Form 10-K.
Note B – Dividends
During 2010, 2009 and 2008, the Registrant received dividends from its subsidiaries totaling $67,891, $19,122 and $48,411, respectively.
None.
Evaluation of Disclosure Controls and Procedures -
Our management, with the participation of our Chief Executive Officer and Chief Financial Officer, evaluated the effectiveness of our disclosure controls and procedures as of December 31, 2010. The term “disclosure controls and procedures,” as defined in Rules 13a-15(e) and 15d-15(e) under the Exchange Act, means controls and other procedures of a company that are designed to ensure that information required to be disclosed by a company in the reports that it files or submits under the Exchange Act is recorded, processed, summarized and reported, within the time periods specified in the SEC's rules and forms. Disclosure controls and procedures include, without limitation, controls and procedures designed to ensure that information required to be disclosed by a company in the reports that it files or submits under the Exchange Act is accumulated and communicated to the company’s management, including its principal executive and principal financial officers, as appropriate to allow timely decisions regarding required disclosure. Management recognizes that any controls and procedures, no matter how well designed and operated, can provide only reasonable assurance of achieving their objectives and management necessarily applies its judgment in evaluating the cost-benefit relationship of possible controls and procedures. Based on the evaluation of our disclosure controls and procedures as of December 31, 2010, our Chief Executive Officer and Chief Financial Officer concluded that, as of such date, our disclosure controls and procedures were effective at the reasonable assurance level.
Management’s Report on Internal Control Over Financial Reporting
- Our management is responsible for establishing and maintaining adequate internal control over financial reporting, as such term is defined in Exchange Act Rules 13a-15(f) and 15d-15(f). Under the supervision and with the participation of our management, including our principal executive officer and principal financial officer, we conducted an evaluation of the effectiveness of our internal control over financial reporting based on the framework in
Internal
Control – Integrated Framework
issued by the Committee of Sponsoring Organizations of the Treadway Commission. Based on our evaluation under the framework in
Internal Control - Integrated Framework
, our management concluded that our internal control over financial reporting was effective at the reasonable assurance level as of December 31, 2010. Our management’s assessment of the effectiveness of our internal control over financial reporting as of December 31, 2010 has been audited by KPMG LLP, an independent registered public accounting firm, as stated in their report which is included herein.
Changes in Internal Control Over Financial Reporting
- No change in our internal control over financial reporting (as defined in Rules 13a-15(f) and 15d-15(f) under the Exchange Act) occurred during the quarter ended December 31, 2010 that has materially affected, or is reasonably likely to materially affect, our internal control over financial reporting.
Report of Independent Registered Public Accounting Firm
The Board of Directors and Stockholders
Centene Corporation:
We have audited Centene Corporation’s internal control over financial reporting as of December 31, 2010, based on criteria established in
Internal Control - Integrated Framework
issued by the Committee of Sponsoring Organizations of the Treadway Commission (COSO)
.
Centene Corporation’s management is responsible for maintaining effective internal control over financial reporting and for its assessment of the effectiveness of internal control over financial reporting, included in the accompanying Management’s Report on Internal Control Over Financial Reporting. Our responsibility is to express an opinion on the Company’s internal control over financial reporting based on our audit.
We conducted our audit in accordance with the standards of the Public Company Accounting Oversight Board (United States). Those standards require that we plan and perform the audit to obtain reasonable assurance about whether effective internal control over financial reporting was maintained in all material respects. Our audit included obtaining an understanding of internal control over financial reporting, assessing the risk that a material weakness exists, and testing and evaluating the design and operating effectiveness of internal control based on the assessed risk. Our audit also included performing such other procedures as we considered necessary in the circumstances. We believe that our audit provides a reasonable basis for our opinion.
A company's internal control over financial reporting is a process designed to provide reasonable assurance regarding the reliability of financial reporting and the preparation of financial statements for external purposes in accordance with generally accepted accounting principles. A company's internal control over financial reporting includes those policies and procedures that (1) pertain to the maintenance of records that, in reasonable detail, accurately and fairly reflect the transactions and dispositions of the assets of the company; (2) provide reasonable assurance that transactions are recorded as necessary to permit preparation of financial statements in accordance with generally accepted accounting principles, and that receipts and expenditures of the company are being made only in accordance with authorizations of management and directors of the company; and (3) provide reasonable assurance regarding prevention or timely detection of unauthorized acquisition, use, or disposition of the company’s assets that could have a material effect on the financial statements.
Because of its inherent limitations, internal control over financial reporting may not prevent or detect misstatements. Also, projections of any evaluation of effectiveness to future periods are subject to the risk that controls may become inadequate because of changes in conditions, or that the degree of compliance with the policies or procedures may deteriorate.
In our opinion, Centene Corporation maintained, in all material respects, effective internal control over financial reporting as of December 31, 2010, based on criteria established in
Internal Control - Integrated Framework
issued by the Committee of Sponsoring Organizations of the Treadway Commission
.
We also have audited, in accordance with the standards of the Public Company Accounting Oversight Board (United States), the consolidated balance sheets of Centene Corporation and subsidiaries as of December 31, 2010 and 2009, and the related consolidated statements of operations, stockholders’ equity, and cash flows for each of the years in the three-year period ended December 31, 2010, and our report dated February 21, 2011 expressed an unqualified opinion on those consolidated financial statements
.
/s/ KPMG LLP
St. Louis, Missouri
February 21, 2011
On February 17, 2011, the Company was informed that the Georgia Department of Community Health (DCH) is extending the term of the Georgia Families Program managed care contract between DCH and Peach State Health Plan, subject to the execution of a contract amendment. The contract amendment is expected to extend the contract to June 30, 2013 and includes a renewal option allowing it to extend to June 30, 2014. A copy of the notice of extension is filed as exhibit 10.1h to this document.
(a) Directors of the Registrant
Information concerning our directors will appear in our Proxy Statement for our 2011 annual meeting of stockholders under “Proposal One: Election of Directors” and “Information about Continuing Directors and Executive Officers.” These portions of the Proxy Statement is incorporated herein by reference.
(b) Executive Officers of the Registrant
Pursuant to General Instruction G(3) to Form 10-K and Instruction 3 to Item 401(b) of Regulation S-K, information regarding our executive officers is provided in Item 1 of Part I of this Annual Report on Form 10-K under the caption “Executive Officers of the Registrant.”
Information concerning our executive officers’ compliance with Section 16(a) of the Exchange Act will appear in our Proxy Statement for our 2011 annual meeting of stockholders under “Section 16(a) Beneficial Ownership Reporting Compliance.” These portions of our Proxy Statement are incorporated herein by reference. Information concerning our audit committee financial expert and identification of our audit committee will appear in our Proxy Statement for our 2011 annual meeting of stockholders under “Information about Corporate Governance.” Information concerning our code of ethics will appear in our Proxy Statement for our 2011 annual meeting of stockholders under “Code of Business Conduct and Ethics.”
(c) Corporate Governance
Information concerning certain corporate governance matters will appear in our Proxy Statement for our 2011 annual meeting of stockholders under “Information About Corporate Governance -- Director Candidates”, “Information About Corporate Governance --
Board and Committee Meetings” and “Information About Corporate Governance -- Audit Committee.” These portions of our Proxy Statement are incorporated herein by reference.
Information concerning executive compensation will appear in our Proxy Statement for our 2011 annual meeting of stockholders under “Information About Executive Compensation.” Information concerning Compensation Committee interlocks and insider participation will appear in the Proxy Statement for our 2011 Annual Meeting of Stockholders under “Compensation Committee Interlocks and Insider Participation.” These portions of the Proxy Statement is incorporated herein by reference. The sections entitled “Compensation Committee Report” in our 2011 Proxy Statement are not incorporated herein by reference.
Information concerning the security ownership of certain beneficial owners and management and our equity compensation plans will appear in our Proxy Statement for our 2011 annual meeting of stockholders under “Information About Stock Ownership” and “Equity Compensation Plan Information.” These portions of the Proxy Statement are incorporated herein by reference.
Information concerning director independence, certain relationships and related transactions will appear in our Proxy Statement for our 2011 annual meeting of stockholders under “Information about Corporate Governance – Board and Committee Meetings” and “Related Party Transactions.” These portions of our Proxy Statement is incorporated herein by reference.
Information concerning principal accountant fees and services will appear in our Proxy Statement for our 2011 annual meeting of stockholders under “Independent Auditor Fees.” This portion of our Proxy Statement is incorporated herein by reference.
|
(a)
|
Financial Statements and Schedules
|
The following documents are filed under Item 8 of this report:
1. Financial Statements:
|
Report of Independent Registered Public Accounting Firm
|
|
Consolidated Balance Sheets as of December 31, 2010 and 2009
|
|
Consolidated Statements of Operations for the Years Ended December 31, 2010, 2009 and 2008
|
|
Consolidated Statements of Stockholders’ Equity for the Years Ended December 31, 2010, 2009 and 2008
|
|
Consolidated Statements of Cash Flows for the Years Ended December 31, 2010, 2009 and 2008
|
|
Notes to Consolidated Financial Statements
|
2. Financial Statement Schedules:
None.
3. The exhibits listed in the accompanying Exhibit Index are filed or incorporated by reference as part of this filing.
EXHIBIT INDEX
|
|
INCORPORATED BY REFERENCE
1
|
|||||||||
|
EXHIBIT
NUMBER
|
|
DESCRIPTION
|
FILED WITH
THIS
FORM 10-K
|
FORM
|
FILING DATE
WITH SEC
|
EXHIBIT
NUMBER
|
||||
|
3.1
|
|
Certificate of Incorporation of Centene Corporation
|
S-1
|
October 9, 2001
|
3.2
|
|||||
|
3.1a
|
|
Certificate of Amendment to Certificate of Incorporation of Centene Corporation, dated November 8, 2001
|
S-1/A
|
November 13, 2001
|
3.2a
|
|||||
|
3.1b
|
|
Certificate of Amendment to Certificate of Incorporation of Centene Corporation as filed with the Secretary of State of the State of Delaware
|
10-Q
|
July 26, 2004
|
3.1b
|
|||||
|
3.2
|
|
By-laws of Centene Corporation
|
S-1
|
October 9, 2001
|
3.4
|
|||||
|
4.1
|
|
Rights Agreement between Centene Corporation and Mellon Investor Services LLC, as Rights Agent, dated August 30, 2002
|
8-K
|
August 30, 2002
|
4.1
|
|||||
|
4.1a
|
|
Amendment No. 1 to Rights Agreement by and between Centene Corporation and Mellon Investor Services LLC, as Rights Agent, dated April 23, 2007
|
8-K
|
April 26, 2007
|
4.1
|
|||||
|
4.2
|
|
Indenture for the 7 ¼% Senior Notes due 2014 dated March 22, 2007 among Centene Corporation and The Bank of New York Trust Company, N.A., as trustee
|
S-4
|
May 11, 2007
|
4.3
|
|||||
|
10.1
|
Contract Between the Georgia Department of Community Health and Peach State Contract for provision of Services to Georgia Healthy Families
|
8-K
|
July 22, 2005
|
10.1
|
||||||
|
10.1a
|
Amendment #1 to the Contract No. 0653 Between Georgia Department of Community Health and Peach State
|
10-Q
|
October 25, 2005
|
10.9
|
||||||
|
10.1b
|
Amendment #2 to the Contract No. 0653 Between Georgia Department of Community Health and Peach State
|
10-K
|
February 23, 2008
|
10.1b
|
||||||
|
10.1c
|
Amendment #3 to the Contract No. 0653 Between Georgia Department of Community Health and Peach State
|
10-K
|
February 23, 2009
|
10.1c
|
||||||
|
10.1d
|
Amendment #4 to the Contract No. 0653 Between Georgia Department of Community Health and Peach State
|
10-K
|
February 23, 2009
|
10.1d
|
||||||
|
10.1e
|
Amendment #6 to the Contract No. 0653 Between Georgia Department of Community Health and Peach State
|
10-K
|
February 22, 2010
|
10.1e
|
||||||
|
10.1f
|
|
Amendment #7 to the Contract No. 0653 Between Georgia Department of Community Health and Peach State
|
X
|
|||||||
|
10.1g
|
**
|
Amendment #8 to the Contract No. 0653 Between Georgia Department of Community Health and Peach State
|
X
|
|
||||||
|
10.1h
|
Notice of Extension of Contract No. 0653 between Peach State Health Plan, Inc. and Georgia Department of Community Health |
X
|
||||||||
|
10.2
|
Contract between the Texas Health and Human Services Commission and Superior HealthPlan, Inc.
|
10-K
|
February 24, 2006
|
10.5
|
||||||
|
10.2a
|
**
|
Amendment Q (Version 1.17) to Contract between the Texas Health and Human Services Commission and Superior HealthPlan, Inc.
|
X
|
|||||||
|
10.3
|
*
|
1996 Stock Plan of Centene Corporation, shares which are registered on Form S-8 – File Number 333-83190
|
S-1
|
October 9, 2001
|
10.9
|
|||||
|
10.4
|
*
|
1998 Stock Plan of Centene Corporation, shares which are registered on Form S-8 – File number 333-83190
|
S-1
|
October 9, 2001
|
10.10
|
|||||
|
10.5
|
*
|
1999 Stock Plan of Centene Corporation, shares which are registered on Form S-8 – File Number 333-83190
|
S-1
|
October 9, 2001
|
10.11
|
|||||
|
10.6
|
*
|
2000 Stock Plan of Centene Corporation, shares which are registered on Form S-8 – File Number 333-83190
|
S-1
|
October 9, 2001
|
10.12
|
|||||
|
10.7
|
*
|
2002 Employee Stock Purchase Plan of Centene Corporation, shares which are registered on Form S-8 – File Number 333-90976
|
10-Q
|
April 29, 2002
|
10.5
|
|||||
|
10.7a
|
*
|
First Amendment to the 2002 Employee Stock Purchase Plan
|
10-K
|
February 24, 2005
|
10.9a
|
|||||
|
10.7b
|
*
|
Second Amendment to the 2002 Employee Stock Purchase Plan
|
10-K
|
February 24, 2006
|
10.10b
|
|||||
|
10.8
|
*
|
Centene Corporation Amended and Restated 2003 Stock Incentive Plan, shares which are registered on Form S-8 – File Number 333-108467
|
8-K
|
April 30, 2010
|
10.1
|
|||||
|
10.9
|
*
|
Centene Corporation Non-Employee Directors Deferred Stock Compensation Plan
|
10-Q
|
October 25, 2004
|
10.1
|
|||||
|
10.9a
|
*
|
First Amendment to the Non-Employee Directors Deferred Stock Compensation Plan
|
10-K
|
February 24, 2006
|
10.12a
|
|||||
|
10.10
|
*
|
Centene Corporation Employee Deferred Compensation Plan
|
10-K
|
February 22, 1010
|
10.10
|
|||||
|
10.11
|
*
|
Centene Corporation 2007 Long-Term Incentive Plan
|
8-K
|
April 26, 2007
|
10.2
|
|||||
|
10.12
|
*
|
Centene Corporation Short-Term Executive Compensation Plan
|
X
|
|||||||
|
10.13
|
*
|
Executive Employment Agreement between Centene Corporation and Michael F. Neidorff, dated November 8, 2004
|
8-K
|
November 9, 2004
|
10.1
|
|||||
|
10.13a
|
*
|
Amendment No. 1 to Executive Employment Agreement between Centene Corporation and Michael F. Neidorff
|
10-Q
|
October 28, 2008
|
10.2
|
|||||
|
10.13b
|
*
|
Amendment No. 2 to Executive Employment Agreement between Centene Corporation and Michael F. Neidorff
|
10-Q
|
April 28, 2009
|
10.2
|
|||||
|
10.14
|
*
|
Form of Executive Severance and Change in Control Agreement
|
10-Q
|
October 28, 2008
|
10.3
|
|||||
|
10.15
|
*
|
Form of Restricted Stock Unit Agreement
|
10-Q
|
October 28, 2008
|
10.4
|
|||||
|
10.16
|
*
|
Form of Non-statutory Stock Option Agreement (Non-Employees)
|
8-K
|
July 28, 2005
|
10.3
|
|||||
|
10.17
|
*
|
Form of Non-statutory Stock Option Agreement (Employees)
|
10-Q
|
October 28, 2008
|
10.5
|
|||||
|
10.18
|
*
|
Form of Non-statutory Stock Option Agreement (Directors)
|
10-K
|
February 23, 2009
|
10.18
|
|||||
|
10.19
|
*
|
Form of Incentive Stock Option Agreement
|
10-Q
|
October 28, 2008
|
10.6
|
|||||
|
10.20
|
*
|
Form of Stock Appreciation Right Agreement
|
8-K
|
July 28, 2005
|
10.6
|
|||||
|
10.21
|
*
|
Form of Restricted Stock Agreement
|
10-Q
|
October 25, 2005
|
10.8
|
|||||
|
10.22
|
*
|
Form of Performance Based Restricted Stock Unit Agreement #1
|
10-Q
|
October 28, 2008
|
10.7
|
|||||
|
10.23
|
*
|
Form of Performance Based Restricted Stock Unit Agreement #2
|
10-K
|
February 23, 2009
|
10.23
|
|||||
|
10.24
|
*
|
Form of Long Term Incentive Plan Agreement
|
8-K
|
February 7, 2008
|
10.1
|
|||||
|
10.25
|
Credit Agreement dated as of September 14, 2004 among Centene Corporation, the various financial institutions party hereto and LaSalle Bank National Association
|
10-Q
|
October 25, 2004
|
10.2
|
||||||
|
10.25a
|
Amendment No. 2 to Credit Agreement dated as of September 14, 2004 among Centene Corporation, the various financial institutions party hereto and LaSalle Bank National Association
|
10-Q
|
October 25, 2005
|
10.11
|
||||||
|
10.25b
|
Amendment No. 3 to Credit Agreement dated as of September 14, 2004 among Centene Corporation, the various financial institutions party hereto and LaSalle Bank National Association
|
10-K
|
February 24, 2006
|
10.22b
|
||||||
|
10.25c
|
Amendment No. 4 to Credit Agreement dated as of September 14, 2004 among Centene Corporation, the various financial institutions party hereto and LaSalle Bank National Association
|
10-Q
|
July 25, 2006
|
10.2
|
||||||
|
10.25d
|
Amendment No. 5 to Credit Agreement dated as of September 14, 2004 among Centene Corporation, the various financial institutions party hereto and LaSalle Bank National Association
|
10-Q
|
October 24, 2006
|
10.1
|
||||||
|
10.25e
|
Amendment No. 6 to Credit Agreement dated as of September 14, 2004 among Centene Corporation, the various financial institutions party hereto and LaSalle Bank National Association
|
10-K
|
February 23, 2008
|
10.23e
|
||||||
|
10.25f
|
Amendment No. 7 to Credit Agreement dated as of September 14, 2004 among Centene Corporation, the various financial institutions party hereto and LaSalle Bank National Association
|
10-Q
|
July 28, 2009
|
10.1
|
||||||
|
10.26
|
**
|
Credit Agreement dated as of January 31, 2011 among Centene Corporation, the various financial institutions party hereto and Barclays Bank PLC
|
X
|
|||||||
|
12.1
|
Computation of ratio of earnings to fixed charges
|
X
|
||||||||
|
21
|
List of subsidiaries
|
X
|
||||||||
|
23
|
Consent of Independent Registered Public Accounting Firm incorporated by reference in each prospectus constituting part of the Registration Statements on Form S-3 (File Number 333-164390) and on Form S-8 (File Numbers 333-108467, 333-90976 and 333-83190)
|
X
|
||||||||
|
31.1
|
Certification Pursuant to Rule 13a-14(a) and 15d-14(a) of the Exchange Act, as Adopted Pursuant to Section 302 of the Sarbanes-Oxley Act of 2002 (Chief Executive Officer)
|
X
|
||||||||
|
31.2
|
Certification Pursuant to Rule 13a-14(a) and 15d-14(a) of the Exchange Act, as Adopted Pursuant to Section 302 of the Sarbanes-Oxley Act of 2002 (Chief Financial Officer)
|
X
|
||||||||
|
32.1
|
Certification Pursuant to 18 U.S.C. Section 1350 (Chief Executive Officer)
|
X
|
||||||||
|
32.2
|
Certification Pursuant to 18 U.S.C. Section 1350 (Chief Financial Officer)
|
X
|
||||||||
|
101.1
2
|
XBRL Taxonomy Instance Document.
|
X
|
||||||||
|
101.2
2
|
XBRL Taxonomy Extension Schema Document.
|
X
|
||||||||
|
101.3
2
|
XBRL Taxonomy Extension Calculation Linkbase Document.
|
X
|
||||||||
|
101.4
2
|
XBRL Taxonomy Extension Definition Linkbase Document.
|
X
|
||||||||
|
101.5
2
|
XBRL Taxonomy Extension Label Linkbase Document.
|
X
|
||||||||
|
101.6
2
|
XBRL Taxonomy Extension Presentation Linkbase Document.
|
X
|
||||||||
|
1
SEC File No. 001-31826 (for filings prior to October 14, 2003, the Registrant’s SEC File No. was 000-33395).
2
XBRL (Extensible Business Reporting Language) information is furnished and not filed or a part of a registration statement or prospectus for purposes of sections 11 or 12 of the Securities Act of 1933, is deemed not filed for purposes of section 18 of the Securities Exchange Act of 1934, and otherwise is not subject to liability under these sections.
*
Indicates a management contract or compensatory plan or arrangement.
**
The Company has requested confidential treatment of the redacted portions of this exhibit pursuant to Rule 24b-2 under the Securities Exchange Act of 1934, as amended, and has separately filed a complete copy of this exhibit with the Securities and Exchange Commission.
|
||||||||||
Pursuant to the requirements of Section 13 or 15(d) of the Securities Exchange Act of 1934, the registrant has duly caused this report to be signed on its behalf by the undersigned, thereunto duly authorized, as of February 22, 2011.
|
CENTENE CORPORATION
|
||
|
By:
|
/s/ M
ICHAEL
F. N
EIDORFF
|
|
|
Michael F. Neidorff
Chairman and Chief Executive Officer
|
||
Pursuant to the requirements of the Securities Exchange Act of 1934, this report has been signed below by the following persons on behalf of the registrant and in the capacities as indicated, as of February 22, 2011.
|
Signature
|
|
Title
|
|
/s/ M
ICHAEL
F. N
EIDORFF
Michael F. Neidorff
|
|
Chairman and Chief Executive Officer
(principal executive officer)
|
|
/s/ W
ILLIAM
N. S
CHEFFEL
William N. Scheffel
|
|
Executive Vice President and Chief Financial Officer (principal financial officer)
|
|
/s/ J
EFFREY
A. S
CHWANEKE
Jeffrey A. Schwaneke
|
Vice President, Corporate Controller and Chief Accounting Officer (principal accounting officer)
|
|
|
/s/ R
OBERT
K. D
ITMORE
Robert K. Ditmore
|
|
Director
|
|
/s/ F
RED
H. E
PPINGER
Fred H. Eppinger
|
|
Director
|
|
/s/ R
ICHARD
A. G
EPHARDT
Richard A. Gephardt
|
|
Director
|
|
/s/ P
AMELA
A. J
OSEPH
Pamela A. Joseph
|
|
Director
|
|
/s/ J
OHN
R. R
OBERTS
John R. Roberts
|
|
Director
|
|
/s/ D
AVID
L. S
TEWARD
David L. Steward
|
|
Director
|
|
/s/ T
OMMY
G. T
HOMPSON
Tommy G. Thompson
|
|
Director
|
54
TABLE OF CONTENTS
Part IItem 1. BusinessItem 1A. Risk FactorsItem 1B. Unresolved Staff CommentsItem 2. PropertiesItem 3. Legal ProceedingsItem 4. [removed and Reserved]Part IIItem 5. Market For Registrant S Common Equity, Related Stockholder Matters and Issuer Purchases Of Equity SecuritiesPart OfItem 6. Selected Financial DataItem 7. Management S Discussion and Analysis Of Financial Condition and Results Of OperationsItem 7A. Quantitative and Qualitative Disclosures About Market RiskItem 8. Financial Statements and Supplementary DataItem 9. Changes in and Disagreements with Accountants on Accounting and Financial DisclosureItem 9A. Controls and ProceduresItem 9B. Other InformationPart IIIItem 10. Directors, Executive Officers and Corporate GovernanceItem 11. Executive CompensationItem 12. Security Ownership Of Certain Beneficial Owners and Management and Related Stockholder MattersItem 13. Certain Relationships and Related Transactions , and Director IndependenceItem 14. Principal Accountant Fees and ServicesPart IVItem 15. Exhibits and Financial Statement Schedules