UNITED STATES
SECURITIES AND EXCHANGE COMMISSION
WASHINGTON, D.C. 20549
____________________________________
FORM
20-F
____________________________________
OR
For the fiscal year ended
December 31, 2019
OR
OR
Commission File Number
001-36085
____________________________________
(Exact name of registrant as specified in its charter)
____________________________________
The
Netherlands
(Jurisdiction of incorporation or organization)
(Address of principal executive offices)
Secretary
c/o CNH Industrial America LLC
FAX: +1
630-887-2344
Email:
michael.going@cnhind.com
(Name, Telephone, E-mail and/or Facsimile Number and Address of Company Contact Person)
Securities registered pursuant to Section 12(b) of the Act:
|
Title of Each Class
|
Trading Symbol (s)
|
Name of Each Exchange on which Registered
|
|
|
|
|
|
|
|
|
|
|
|
|
Securities registered pursuant to Section 12(g) of the Act: None
Securities for which there is a reporting obligation pursuant to Section 15(d) of the Act: None
_______________________________________
Indicate the number of outstanding shares of each of the issuer’s classes of capital or common stock as of the close of the period covered by the annual report:
1,350,132,117
common shares, par value €0.01 per share, and 387,951,116 loyalty program special voting shares, par value €0.01 per share.
Indicate by check mark if the registrant is a well-known seasoned issuer, as defined in Rule 405 of the Securities Act.
Yes
☑
No
☐
If this report is an annual or transition report, indicate by check mark if the registrant is not required to file reports pursuant to Section 13 or 15(d) of the Securities Act of 1934. Yes
☐
No
☑
Indicate by check mark whether the registrant: (1) has filed all reports required to be filed by Section 13 or 15(d) of the Securities Exchange Act of 1934 during the preceding 12 months (or for such shorter period that the registrant was required to file such reports), and (2) has been subject to such filing requirements for the past 90 days.
Yes
☑
No
☐
Indicate by check mark whether the registrant has submitted electronically every Interactive Data File required to be submitted pursuant to Rule 405 of Regulation S-T (§232.405 of this chapter) during the preceding 12 months (or for such shorter period that the registrant was required to submit such files).
Yes
☑
No
☐
|
|
☑
|
Accelerated filer
|
☐
|
Non-accelerated filer
|
☐
|
|
Emerging Growth Company
|
|
||||
If an emerging growth company that prepares its financial statements in accordance with U.S. GAAP, indicate by check mark if the registrant has elected not to use the extended transition period for complying with any new or revised financial accounting standards† provided pursuant to Section 13(a) of the Exchange Act.
☐
† The term “new or revised financial accounting standard” refers to any update issued by the Financial Accounting Standards Board to its Accounting Standards Codification after April 5, 2012.
Indicate by check mark which basis of accounting the registrant has used to prepare the financial statements included in this filing:
U.S. GAAP
☑
International Financial Reporting Standards as issued by the International Accounting Standards Board
☐
Other
☐
If “Other” has been checked in response to the previous question indicate by check mark which financial statement item the registrant has elected to follow: Item 17
☐
or Item 18
☐
.
If this is an annual report, indicate by check mark whether the registrant is a shell company (as defined in Rule 12b-2 of the Exchange Act). Yes
☐
No
☑
(APPLICABLE ONLY TO ISSUERS INVOLVED IN BANKRUPTCY PROCEEDINGS DURING THE PAST FIVE YEARS)
Indicate by check mark whether the registrant has filed all documents and reports required to be filed by Sections 12, 13 or 15(d) of the Securities Exchange Act of 1934 subsequent to the distribution of securities under a plan confirmed by a court. Yes
☐
No
☐
TABLE OF CONTENTS
|
Page
|
||||
|
Item 1.
|
||||
|
Item 2.
|
||||
|
Item 3.
|
||||
|
Item 4.
|
||||
|
Item 4A.
|
||||
|
Item 5.
|
||||
|
Item 6.
|
||||
|
Item 7.
|
||||
|
Item 8.
|
||||
|
Item 9.
|
||||
|
Item 10.
|
||||
|
Item 11.
|
||||
|
Item 12.
|
||||
|
Item 13.
|
||||
|
Item 14.
|
||||
|
Item 15.
|
||||
|
Item 16A.
|
||||
|
Item 16B.
|
||||
|
Item 16C.
|
||||
|
Item 16D.
|
||||
|
Item 16E.
|
||||
|
Item 16F.
|
||||
|
Item 16G.
|
||||
|
Item 16H.
|
||||
|
Item 17.
|
||||
|
Item 18.
|
||||
|
Item 19.
|
||||
Certain Defined Terms
CNH Industrial is incorporated in, and under the laws of, the Netherlands. CNH Industrial has its corporate seat in Amsterdam, the Netherlands, and its principal office in London, England. Unless otherwise indicated or the context otherwise requires, as used in this annual report, the terms “CNH Industrial”, “we”, “us”, “our” or “the Company” refer to CNH Industrial, together with its consolidated subsidiaries.
Presentation of Financial and Certain Other Information
We have prepared our annual consolidated financial statements presented in this Annual Report in accordance with accounting principles generally accepted in the United States of America (“U.S. GAAP”). Our consolidated financial statements are expressed in U.S. dollars and, unless otherwise indicated, all financial data set forth in this annual report are expressed in U.S. dollars.
2017 figures included in the following sections have been recast following the retrospective adoption, on January 1, 2018, of the updated accounting standard for revenue recognition (ASC 606), retirement benefit accounting (ASU 2017-07) and statement of cash flows - restricted cash (ASU 2016-18).
Certain financial information in this report has been presented by geographic area. Our geographic regions are: (1) North America; (2) Europe; (3) South America and (4) Rest of World. The geographic designations have the following meanings:
|
•
|
North America (formerly NAFTA)
: United States, Canada and Mexico;
|
|
•
|
Europe
: member countries of the European Union, European Free Trade Association, Ukraine and Balkans, formerly included in EMEA;
|
|
•
|
South America (formerly LATAM)
: Central and South America, and the Caribbean Islands; and
|
|
•
|
Rest of World
: Continental Asia (including Turkey and Russia), Oceania and member countries of the Commonwealth of Independent States (excluding Ukraine), formerly included in APAC, and African continent and Middle East, formerly included in EMEA.
|
Certain industry and market share information in this Annual Report has been presented on a worldwide basis which includes all countries. In this Annual Report, management estimates of market share information are generally based on retail unit sales data in North America, on registrations of equipment in most of Europe, Brazil, and various Rest of World markets, and on retail and shipment unit data collected by a central information bureau appointed by equipment manufacturers associations, including the Association of Equipment Manufacturers in North America, the Committee for European Construction Equipment in Europe, the Associação Nacional dos Fabricantes de Veículos Automotores (“ANFAVEA”) in Brazil, the Japan Construction Equipment Manufacturers Association, and the Korea Construction Equipment Manufacturers Association, as well as on other shipment data collected by independent service bureaus. Not all agricultural or construction equipment is registered, and registration data may thus underestimate, perhaps substantially, actual retail industry unit sales demand, particularly for local manufacturers in China, Southeast Asia, Eastern Europe, Russia, Turkey, Brazil, and any country where local shipments are not reported. For Commercial Vehicles, regions are defined as: Europe (the 27 countries where our Commercial Vehicles business competes, excluding United Kingdom and Ireland, for market share and total industry volume (“TIV”) reporting purposes), South America (Brazil, Argentina and Venezuela) and Rest of World (Russia, Turkey, South East Asia, Australia and New Zealand). In addition, there may be a period of time between the shipment, delivery, sale and/or registration of a unit, which must be estimated, in making any adjustments to the shipment, delivery, sale, or registration data to determine our estimates of retail unit data in any period.
1
|
Item 1.
|
Identity of Directors, Senior Management and Advisers
|
Not applicable.
|
Item 2.
|
Offer Statistics and Expected Timetable
|
Not applicable.
|
Item 3.
|
Key Information
|
A.
Selected Financial Data
The following selected consolidated financial data should be read in conjunction with our consolidated financial statements and the related notes included in “Item 18. Financial Statements” and the information contained in “Item 5. Operating and Financial Review and Prospects.”
The following table contains our selected historical financial data as of and for each of the five years ended
December 31, 2019
,
2018
,
2017
,
2016
and
2015
.
|
For the Years Ended December 31,
|
|||||||||||||||||||
|
2019
|
2018
|
2017
|
2016
|
2015
|
|||||||||||||||
|
(in millions, except per share data)
|
|||||||||||||||||||
|
Consolidated Statement of Operations Data:
|
|||||||||||||||||||
|
Revenues:
|
|||||||||||||||||||
|
Net sales
|
$
|
26,149
|
|
$
|
27,831
|
|
$
|
25,769
|
|
$
|
23,216
|
|
$
|
24,677
|
|
||||
|
Finance, interest and other income
|
1,930
|
|
1,875
|
|
1,932
|
|
1,879
|
|
1,235
|
|
|||||||||
|
Total Revenues
|
28,079
|
|
|
29,706
|
|
|
27,701
|
|
|
25,095
|
|
|
25,912
|
|
|||||
|
Net (loss) income
|
$
|
1,454
|
|
$
|
1,099
|
|
$
|
290
|
|
$
|
(261
|
)
|
$
|
248
|
|
||||
|
Net (loss) income attributable to CNH Industrial N.V.
|
$
|
1,422
|
|
$
|
1,068
|
|
$
|
272
|
|
$
|
(264
|
)
|
$
|
253
|
|
||||
|
Earnings per share attributable to CNH Industrial N.V.:
|
|||||||||||||||||||
|
Basic earnings per common share
|
$
|
1.05
|
|
$
|
0.79
|
|
$
|
0.20
|
|
$
|
(0.19
|
)
|
$
|
0.19
|
|
||||
|
Diluted earnings per common share
|
$
|
1.05
|
|
$
|
0.78
|
|
$
|
0.20
|
|
$
|
(0.19
|
)
|
$
|
0.19
|
|
||||
|
Cash dividends declared per common share
(1)
|
$
|
0.203
|
|
$
|
0.173
|
|
$
|
0.118
|
|
$
|
0.148
|
|
$
|
0.214
|
|
||||
|
As of December 31,
|
|||||||||||||||||||
|
2019
|
2018
|
2017
|
2016
|
2015
|
|||||||||||||||
|
(in millions)
|
|||||||||||||||||||
|
Consolidated Balance Sheet Data:
|
|||||||||||||||||||
|
Total Assets
|
$
|
47,352
|
|
$
|
46,100
|
|
$
|
48,298
|
|
$
|
45,555
|
|
$
|
46,677
|
|
||||
|
Share capital
|
$
|
25
|
|
$
|
25
|
|
$
|
25
|
|
$
|
25
|
|
$
|
25
|
|
||||
|
Common shares outstanding
(2)
|
1,350
|
|
1,354
|
|
1,364
|
|
1,362
|
|
1,362
|
|
|||||||||
|
Equity
|
$
|
6,121
|
|
$
|
5,068
|
|
$
|
4,232
|
|
$
|
4,320
|
|
$
|
4,843
|
|
||||
|
(1)
|
On March 3, 2020, the Board of Directors recommended to the Company’s shareholders a dividend of €
0.18
per common share, totaling approximately
€243 million
(equivalent to approximately $267 million, translated at the exchange rate reported by the European Central Bank on February 28, 2020). The recommended dividend is subject to the approval of the Company’s shareholders at the Annual General Meeting of shareholders to be held on April 16, 2020. For 2019, CNH Industrial declared and paid a dividend of €
0.18
per common share. For 2018, CNH Industrial declared and paid a dividend of €
0.14
per common share. For 2017, CNH Industrial declared and paid a dividend of €
0.11
per common share. For 2016, CNH Industrial declared and paid a dividend of
€0.13
per common share. For 2015, CNH Industrial declared and paid a dividend of €
0.20
. The cash dividends for 2019, 2018, 2017, 2016, and 2015 were paid on May 2, 2019, May 2, 2018, May 2, 2017, May 3, 2016, and April 29, 2015, respectively, and shareholders who held common shares on the record date traded on the NYSE received the dividend in U.S. dollars at the USD/EUR exchange rate reported by the European Central Bank on April 17, 2019 ($
0.2034
), April 19, 2018 ($
0.1722
) April 20, 2017 ($
0.1182
), April 21, 2016 ($
0.1476
), and April 16, 2015 ($
0.2142
), respectively.
|
|
(2)
|
Excludes loyalty program special voting shares at December 31, 2019, 2018, 2017, 2016, and 2015 of 388 million, 389 million, 389 million, 412 million and 413 million, respectively.
|
2
B.
Capitalization and Indebtedness
Not applicable.
C.
Reasons for the Offer and Use of Proceeds
Not applicable.
D.
Risk Factors
The following risks should be considered in conjunction with “Item 5. Operating and Financial Review and Prospects” beginning on page 30, the other risks described in the Safe Harbor Statement beginning on page 61 and notes to the consolidated financial statements beginning on page F-10. These risks may affect our operating results and, individually or in the aggregate, could cause our actual results to differ materially from past and projected future results. Some of these risks and uncertainties could affect particular lines of business, while others could affect all of our businesses. Although risks are discussed separately, many are interrelated. The following discussion of risks may contain forward-looking statements that are intended to be covered by the Safe Harbor Statement beginning on page 61. Except as may be required by law, we undertake no obligation to publicly update forward-looking statements, whether as a result of new information, future events, or otherwise. It is impossible to predict or identify all risk factors and, consequently, you should not consider the following factors to be a complete discussion of risks and uncertainties that may affect us. We invite you to consult any further related disclosures we make from time to time in materials filed with or furnished to the United States Securities and Exchange Commission (“SEC”).
Risks Related to Our Business, Strategy and Operations
Global economic conditions impact our businesses
.
Our results of operations and financial position are and will continue to be influenced by macroeconomic factors – including changes in gross domestic product, the level of consumer and business confidence, changes in interest rates, the availability of credit, inflation and deflation, energy prices, and the cost of commodities or other raw materials – which exist in the countries and regions in which we operate. Such macroeconomic factors vary from time to time and their effect on our results of operations and financial position cannot be specifically and singularly assessed and/or isolated.
Economic conditions vary across regions and countries, and demand for our products and services generally increases in those regions and countries experiencing economic growth and investment. Slower economic growth or a change in global mix of regions and countries experiencing economic growth and investment could have an adverse impact on our business, results of operations and financial condition. In a weaker economic environment, some dealers and customers may delay or cancel plans to purchase our products and services and may not be able to fulfill their obligations to us in a timely fashion. Our suppliers may also be impacted by economic pressures, which may adversely affect their ability to fulfill their obligations to us. These factors could result in product delays, increased accounts receivable, defaults and inventory challenges. In addition, demand for our products and services can be significantly impacted by concerns regarding the diverse economic and political circumstances in the European Union, the debt burden of several countries in the European Union, the risk that one or more European Union countries could come under increasing pressure to leave the European Union and the long-term stability of the euro as a single common currency. These concerns, along with the significant fiscal adjustments carried out in several countries, intended to manage actual or perceived sovereign credit risk, have led to further pressure on economic growth and may lead to new periods of economic volatility and recession in the European Union. Similarly, in Brazil and Argentina, macroeconomic conditions remain volatile. If there is significant deterioration in the global economy or the economies of key countries or regions, the demand for our products and services would likely decrease and our results of operations, financial position and cash flows could be materially and adversely affected.
We are exposed to political, economic, trade and other risks beyond our control as a result of operating a global business
.
We manufacture and sell products and offer services in several continents and numerous countries around the world
including those experiencing varying degrees of political and economic instability. Given the global nature of our activities, we are exposed to risks associated with international business activities that may increase our costs, impact our ability to manufacture and sell our products and require significant management attention. These risks include:
|
•
|
changes in laws, regulations and policies that affect, among other things:
|
|
–
|
import and export duties and quotas;
|
|
–
|
currency restrictions;
|
|
–
|
the design, manufacture and sale of our products, including, for example, engine emissions regulations;
|
|
–
|
interest rates and the availability of credit to our dealers and customers;
|
|
–
|
property, contract rights and intellectual property;
|
3
|
–
|
where, to whom, and what type of products may be sold, including new or additional trade or economic sanctions imposed by the U.S., EU or other governmental authorities and supranational organizations (e.g., the United Nations); and
|
|
–
|
taxes;
|
|
•
|
regulations from changing world organization initiatives and agreements;
|
|
•
|
changes in the dynamics of the industries and markets in which we operate;
|
|
•
|
labor disruptions;
|
|
•
|
disruption in the supply of raw materials and components (e.g. as a consequence of epidemics and pandemics), including rare materials (the latter might be more easily the target of sudden increases due to a variety of factors, including speculative measures or unforeseen political changes);
|
|
•
|
changes in governmental debt relief and subsidy program policies in certain significant markets such as Argentina and Brazil, including the Brazilian government discontinuing programs subsidizing interest rates on equipment loans;
|
|
•
|
withdrawal from or changes to trade agreements or trade terms, negotiation of new trade agreements and the imposition of new (and retaliatory) tariffs on certain countries or covering certain products or raw materials, including developments in U.S.-China trade relations; and
|
|
•
|
war, civil unrest and terrorism.
|
In recent years, terrorist attacks have occurred around the world, leading to personal safety anxieties and political instability in many countries and, ultimately, an impact on consumers’ confidence. More recently, growing populist political movements in several major developed countries, changes in or uncertainty surrounding global trade policies and other unanticipated changes to the previous geopolitical order may have negative effects on the global economy.
The recent outbreak of Coronavirus, a virus causing potentially deadly respiratory tract infections originating in China, may negatively affect economic conditions regionally as well as globally, disrupt supply chains and otherwise impact operations. Governments in affected countries are imposing travel bans, quarantines and other emergency public safety measures. Those measures, though temporary in nature, may continue and increase depending on developments in the virus’ outbreak. The ultimate severity of the Coronavirus outbreak is uncertain at this time and therefore we cannot predict the impact it may have on our end markets and our operations; however, the effect on our results may be material and adverse.
There can be no guarantee that we will be able to quickly and completely adapt our business model to changes that could result from the foregoing, and any such changes may have an adverse effect on our business, results of operations and financial condition.
Reduced demand for equipment would reduce our sales and profitability
.
The agricultural equipment market is influenced by factors such as:
|
•
|
the price of agricultural commodities and the ability to competitively export agricultural commodities;
|
|
•
|
the profitability of agricultural enterprises, farmers’ income and their capitalization;
|
|
•
|
the demand for food products; and
|
|
•
|
agricultural policies, including aid and subsidies to agricultural enterprises provided by governments and/or supranational organizations, policies impacting commodity prices or limiting the export or import of commodities, and alternative fuel mandates.
|
In addition, droughts and other unfavorable climatic conditions, especially during the spring, a particularly important period for generating sales orders, could have a negative impact on decisions to buy agricultural equipment and, consequently, on our revenues.
The construction equipment market is influenced by factors such as:
|
•
|
public infrastructure spending; and
|
|
•
|
new residential and non-residential construction; and
|
|
•
|
capital spending in oil and gas and, to a lesser extent, in mining.
|
The commercial vehicles market is influenced by factors such as:
|
•
|
changes in global market conditions, including interest rates;
|
|
•
|
changes in business investment, including timing of fleet renewals; and
|
|
•
|
public infrastructure spending.
|
The above factors can significantly influence the demand for agricultural and construction equipment, as well as for commercial vehicles, and consequently, our financial results. Additionally, if demand for our products is less than we expect, we may experience excess
4
inventories and be forced to incur additional charges and our profitability will suffer, including higher fixed costs associated with lower production levels at our plants. Our business may be negatively impacted if we experience excess inventories or we are unable to adjust our production schedules or our purchases from suppliers to reflect changes in customer demand and market fluctuations on a timely basis.
We depend on suppliers for raw materials, parts and components
.
We rely upon many suppliers for raw materials, parts and components that we require to manufacture our products. We cannot guarantee that we will be able to maintain access to raw materials, parts and components, and in some cases, this access may be affected by factors outside of our control and the control of our suppliers. Certain components and parts used in our products are available from a single supplier and cannot be quickly sourced from other suppliers. Increasing demand for certain products has resulted in challenges in obtaining parts and components due to supplier constraints. Supply chain disruptions, including those due to supplier financial distress, capacity constraints, labor shortages, business continuity, delivery or disruptions due to weather-related, natural disaster, pandemics or other unforeseen events, could negatively impact our business, results of operations and financial condition.
Supply chain disruptions, including those due to supplier financial distress, capacity constraints, labor shortages, business continuity, delivery or disruptions due to weather-related, natural disaster, epidemics and pandemics (like the recent Coronavirus outbreak) or other unforeseen events, could negatively impact our business, results of operations and financial condition
We use a variety of raw materials in our businesses, including steel, aluminum, lead, resin and copper, and precious metals such as platinum, palladium and rhodium. The availability and price of these raw materials fluctuate, particularly during times of economic volatility or regulatory instability or in response to changes in tariffs, and while we seek to manage this exposure, we may not be successful in mitigating these risks. Further, increases in the prices for raw materials can significantly increase our costs of production, which could have a material adverse effect on our business, results of operations and financial condition, particularly if we are unable to offset the increased costs through an increase in product pricing.
Competitive activity, or failure by us to respond to actions by our competitors, could adversely affect our results of operations
.
We operate in highly competitive global and regional markets. Depending on the particular country and product, we compete with other international, regional and local manufacturers and distributors of agricultural and construction equipment, commercial vehicles, and powertrains. Certain of our global competitors have substantial resources and may be able to provide products and services at little or no profit or even at a loss to compete with certain of our product offerings. We compete primarily on the basis of product performance, innovation, quality, distribution, customer service, and price. Aggressive pricing or other strategies pursued by competitors, unanticipated product or manufacturing delays, quality issues, or our failure to price our products competitively could adversely affect our business, results of operations and financial position. Additionally, there has been a trend toward consolidation in the truck and construction equipment industries that has resulted in larger and potentially stronger competitors in those industries. The markets in which we compete are highly competitive in terms of product quality, innovation, pricing, fuel economy, reliability, safety, customer service and financial services offered. Competition, particularly on pricing, has increased significantly in the markets in which we compete in recent years. Should we be unable to adapt effectively to market conditions, this could have an adverse effect on our business, results of operations and financial condition.
Costs of ongoing compliance with, or failure to comply with, increasingly stringent environmental, health and safety laws could have an adverse effect on our results of operations
.
We are subject to comprehensive and constantly evolving laws, regulations and policies in numerous jurisdictions around the world. We expect the extent of legal requirements affecting our businesses and our costs of compliance to continue to increase in the future. Such laws govern, among other things, products – with requirements on emissions of polluting gases and particulate matter, increased fuel efficiency and safety becoming increasingly strict – and industrial plants – with requirements for reduced air emissions, treatment of waste and water, and prohibitions on soil contamination also becoming increasingly strict. To comply with such laws, we make significant investments in research and development and capital expenditures and expect to continue to incur substantial costs in the future. Failure to comply with such laws could limit or prohibit our ability to sell our products in a particular jurisdiction, expose us to penalties or clean-up costs, civil or criminal liability and sanctions on certain of our activities, as well as damage to property or natural resources. Liabilities, sanctions, damages and remediation efforts related to any non-compliance with such laws, including those that may be adopted or imposed in the future, could negatively impact our ability to conduct our operations and our results of operations and financial condition. In addition, there can be no assurance that we will not be adversely affected by costs, liabilities or claims with respect to any subsequently acquired operations.
F
urther, environmental, health and safety regulations change from time to time, as may related interpretations and other guidance. For example, changes in environmental and climate change laws, including laws relating to engine and vehicle emissions, safety regulations, fuel requirements, restricted substances, or greenhouse gas emissions, could lead to new or additional investments in product designs and could increase environmental compliance expenditures. If these laws are either changed or adopted and impose significant operational restrictions and compliance requirements on our products or operations, they could result in higher capital expenditures and negatively impact our business, results of operations, financial position and competitive position. Finally, recent public opinion backlash against diesel engine emissions might trigger the adoption of policies severely restricting the use of diesel engines.
5
Changes in government monetary or fiscal policies may negatively impact our results
.
Most countries where our
products and services are sold have established central banks to regulate monetary systems and influence economic activities, generally by adjusting interest rates. Some governments may implement measures designed to slow economic growth in those countries (e.g. higher interest rates, reduced bank lending and other anti-inflation measures). Rising interest rates could have a dampening effect on the overall economic activity and/or the financial condition of our customers, either or both of which could negatively affect demand for our products and our customers’ ability to repay obligations to us. Central banks and other policy arms of many countries may take further actions to vary the amount of liquidity and credit available in an economy. The impact from a change in liquidity and credit policies could negatively affect the customers and markets we serve or our suppliers, which could adversely impact our business, results of operations and financial condition. Government initiatives that are intended to stimulate demand for products sold by us, such as changes in tax treatment or purchase incentives for new equipment, can significantly influence the timing and level of our revenues. The terms, size and duration of such government actions are unpredictable and outside of our control. Any adverse change in government policy relating to those initiatives could have a material adverse effect on our business, results of operations and financial condition.
Our future performance depends on our ability to innovate and on market acceptance of new or existing products
.
Our success depends on our ability to maintain or increase our market share in existing markets and to expand into new markets through the development of innovative, high-quality products that provide adequate profitability. In September 2019, we announced our five-year Strategic Business Plan. This Plan includes investments in innovation designed to further develop existing, and create new, product offerings responsive to customer needs, thereby producing sales growth in existing markets and expansion into new markets. Achievement of these objectives is dependent on a number of factors, including our ability to maintain key dealer relationships, our ability to produce products that meet the quality, performance and price expectations of our customers, and our ability to develop effective sales, dealer training and marketing programs. Failure to develop and offer innovative products that compare favorably to those of our principal competitors in terms of price, quality, functionality, features, mobility and connected services, vehicle electrification, fuel cell technology and autonomy, or delays in bringing strategic new products to market, or the inability to adequately protect our intellectual property rights or supply products that meet regulatory requirements, including engine emissions requirements, could result in reduced market share, which could have a material adverse effect on our business, results of operations and financial condition.
Our existing operations and expansion plans in emerging markets could entail significant risks
.
Our ability to grow our businesses depends to an increasing degree on our ability to increase market share and operate profitably worldwide, and in particular, in emerging market countries, such as Brazil, Russia, India, China, Argentina, Turkey, and South Africa. In addition, we could increase our use of suppliers located in such countries. Our implementation of these strategies will involve a significant investment of capital and other resources and exposes us to multiple and potentially conflicting cultural practices, business practices and legal requirements that are subject to change, including those related to tariffs, trade barriers, investments, property ownership rights, taxation and sanction and export control requirements. For example, we may encounter difficulties in obtaining necessary governmental approvals in a timely manner. In addition, we may experience delays and incur significant costs in constructing facilities, establishing supply channels, and commencing manufacturing operations. Further, customers in these markets may not readily accept our products as compared with products manufactured and commercialized by our competitors. The emerging market countries may also be subject to a greater degree of economic and political volatility that could adversely affect our financial position, results of operations and cash flows. Many emerging market economies have experienced slower growth, volatility, and other economic challenges in recent periods and may be subject to a further slowdown in gross domestic product expansion and/or be impacted by domestic political or currency volatility, potential hyperinflationary conditions and/or increase of public debt.
We may not realize all of the anticipated benefits from our business simplification initiatives, the spin-off of our On-Highway business and cost management initiatives
As part of our Strategic Business Plan, we are actively engaged in a number of initiatives to simplify our business and increase our productivity, efficiency and cash flow, which we expect to have a positive long-term effect on our business, results of operations and financial condition. These initiatives include the announced spin-off of our On-Highway business and the 80/20 simplification process related to our product portfolio. There can be no assurance that these initiatives or others will be beneficial to the extent anticipated, or that the estimated efficiency improvements or cash flow improvements will be realized as anticipated or at all. If these initiatives are not implemented successfully, they could have an adverse effect on our operations.
We also expect to take targeted restructuring actions as we continue to optimize our cost structure and improve the efficiency of our operations. In order to complete these actions, we will incur charges. Failure to realize anticipated savings or benefits from our cost reduction actions could have a material adverse effect on our business, prospects, financial condition, liquidity, results of operations and cash flows.
We are subject to extensive anti-corruption and antitrust laws and regulations
.
Due to the global scope of our operations, we are subject to many laws and regulations that apply to our operations around the world, including the U.S. Foreign Corrupt Practices Act, and the U.K. Bribery Act, as well as a range of national anti-corruption and antitrust or competition laws that apply to conduct in a particular jurisdiction. These anti-corruption laws prohibit improper payments in cash or anything of value to improperly influence third parties to obtain or retain business or gain a business advantage. These laws tend to apply regardless of whether those practices are legal or culturally acceptable in a particular jurisdiction. Over the past several years there has been an increase in the enforcement of anti-
6
corruption and antitrust or competition laws both globally and in particular jurisdictions and we have from time to time been subject to investigations and charges claiming violations of anti-corruption or antitrust or competition laws, including our settlement of the EU antitrust investigation announced on July 19, 2016. Following this settlement, the Company has been named as defendant in current private litigation commenced in various European jurisdictions and Israel that remains at an early stage. The Company expects to face further claims in various jurisdictions, the extent and outcome of which cannot be predicted at this time. We are committed to operating in compliance with all applicable laws, in particular, anti-corruption and antitrust or competition laws. We have implemented a program to promote compliance with these laws and to reduce the likelihood of potential violations. Our compliance program, however, may not in every instance protect us from acts committed by our employees, agents, contractors, or collaborators that may violate the applicable laws or regulations of the jurisdictions in which we operate. Such improper actions could subject us to civil or criminal investigations and monetary, injunctive and other penalties as well as damage claims. Investigations of alleged violations of these laws tend to be expensive and require significant management time and attention, and these investigations of purported violations, as well as any publicity regarding potential violations, could harm our reputation and have a material adverse effect on our business, results of operations and financial position. For further information
see "Note 14: Commitments and Contingencies” to the consolidated financial statements at
December 31, 2019
.
We may be adversely affected by the U.K. vote to leave the European Union (Brexit)
.
I
n a June 23, 2016 referendum, the United Kingdom (“U.K.”) voted to terminate the U.K.’s membership in the European Union (“Brexit”). The U.K. withdrew from the European Union on January 31, 2020. Following its departure, the U.K. entered a transition period until December 31, 2020. Negotiations during the transition period will determine the terms of the U.K.’s future relationship with the European Union and its member states, including the terms of trade. Any effect of Brexit is expected to depend on the agreements, if any, negotiated between the U.K. and the EU with respect to reciprocal market access and other matters, either during a transitional period or more permanently. The terms of the withdrawal, including terms of trade, are subject to ongoing negotiations that have created significant uncertainty about the future relationship between the U.K. and the EU. Brexit may also lead to legal uncertainty and potentially divergent national laws and regulations as the U.K. determines which EU laws to replace or replicate. Any of these effects of Brexit, among others, could adversely affect our business, results of operations and financial condition.
Brexit could adversely affect U.K., European or worldwide economic and market conditions more broadly and could contribute to instability in global financial markets. We have operations in the U.K., but do not believe that our global operations would be affected materially by Brexit. However, any adverse effect of Brexit on us or on global or regional economic or market conditions could adversely affect our business, results of operations, and financial condition as customers may reduce or delay spending decisions with respect to our products. Any uncertainty related to Brexit could also affect trading in our shares.
We are organized as a Dutch company, but we are considered resident in the U.K. for U.K. tax purposes. This determination is based on the U.K. as the location of management and control which has been confirmed through a mutual agreement procedure with the relevant tax authorities (as to which see “Other Risks - CNH Industrial operates and will continue to operate, as a company that is resident in the U.K. for tax purposes; other tax authorities may treat CNH Industrial as being tax resident elsewhere”). We do not expect the U.K.’s exit from the European Union to affect our tax residency in the U.K.; however, we are unable to predict with certainty whether any measures implemented in connection with the U.K.'s exit from the European Union or arrangements relating to the future relationship between the European Union and the U.K. will ultimately have any such impact.
Dealer equipment sourcing and inventory management decisions could adversely affect our sales
.
We sell our products primarily through independent dealers and are subject to risks relating to their inventory management decisions and operating and sourcing practices. Our dealers carry inventories of finished products and parts as part of ongoing operations and adjust those inventories based on their assessment of future sales opportunities and market conditions, including the level of used equipment inventory. If our dealers’ inventory levels are higher than they desire, they may postpone product purchases from us, which could cause our sales to be lower than the end-user demand for our products and negatively impact our results. Similarly, our sales could be negatively impacted through the loss of time-sensitive sales if our dealers do not maintain inventory sufficient to meet customer demand. Further, dealers who carry other products that compete with our products may focus their inventory purchases and sales efforts on goods provided by other suppliers due to industry demand or profitability. Such inventory adjustments and sourcing decisions can adversely impact our sales, results of operations and financial condition.
We may not be able to realize anticipated benefits from any acquisitions and, further, challenges associated with strategic alliances may have an adverse impact on our results of operations
.
We have engaged in the past, and may engage in the future, in mergers and acquisitions or enter into, expand or exit from strategic alliances and joint ventures that could involve risks that could prevent us from realizing the expected benefits of the transactions or the achievement of strategic objectives or could divert management’s time and attention. Such risks, many of which are outside our control, include:
|
•
|
technological and product synergies, economies of scale and cost reductions not occurring as expected;
|
|
•
|
unexpected liabilities;
|
7
|
•
|
incompatibility of operating, information or other systems;
|
|
•
|
unexpected changes in laws;
|
|
•
|
inability to retain key employees;
|
|
•
|
protecting intellectual property rights;
|
|
•
|
inability to source certain products or components (or the cost thereof);
|
|
•
|
significant costs associated with terminating or modifying alliances; and
|
|
•
|
problems in retaining customers and integrating operations, services, personnel, and customer bases.
|
If problems or issues were to arise among the parties to one or more strategic alliances for managerial, financial, or other reasons, or if such strategic alliances or other relationships were terminated, our product lines, businesses, results of operations and financial condition could be adversely affected.
Our results of operations may be adversely impacted by various types of claims, lawsuits, and other contingent obligations
.
In the ordinary course of business, we are involved in pending litigation and investigations on a wide range of topics, including dealer and supplier litigation, intellectual property rights disputes, product warranty and defective product claims, product performance, asbestos, personal injury, engine emissions and/or fuel economy regulatory and contract issues, and
environmental claims. The industries in which we operate are also periodically reviewed or investigated by regulators, which could lead to enforcement actions, fines and penalties or the assertion of private litigation claims. The ultimate outcome of these legal matters pending against us is uncertain, and although such legal matters are not expected individually to have a material adverse effect on our financial position or profitability, such legal matters could, in the aggregate, in the event of unfavorable resolutions thereof, have a material adverse effect on our results of operations and financial condition. Furthermore, we could in the future be subject to judgments or enter into settlements of lawsuits and claims that could have a material adverse effect on our results of operations in any particular period. In addition, while we maintain insurance coverage with respect to certain risks, we may not be able to obtain such insurance on acceptable terms in the future, if at all, and any such insurance may not provide adequate coverage against claims under such policies.
As required by U.S. GAAP, we
establish reserves based on our assessment of contingencies, including contingencies related to legal claims asserted against us. Subsequent developments in legal proceedings may affect our assessment and estimates of the loss contingency recorded as a reserve and require us to make payments that exceed our reserves, which could have a material adverse effect on our results of operations and/or financial position. For further information see
“Note 14: Commitments and Contingencies” to the consolidated financial statements for the year ended
December 31, 2019
for additional information.
A cybersecurity breach could interfere with our operations, compromise confidential information, negatively impact our corporate reputation and expose us to liability
.
We rely upon information technology systems and networks, some of which are managed by third parties, in connection with a variety of our business activities. These systems include supply chain, manufacturing, distribution, invoicing and collection of payments from dealers or other purchasers of our products and from customers of our financial services business, and connectivity services among vehicles. We use information technology systems to record, process and summarize financial information and results of operations for internal reporting purposes and to comply with regulatory financial reporting, legal and tax requirements. Additionally, we collect and store sensitive data, including intellectual property, proprietary business information and the proprietary information of our customers, suppliers and dealers, as well as personally identifiable information of our dealers, customers and employees, in data centers and on information technology networks. Operating these information technology systems and networks, and processing and maintaining this data, in a secure manner, are critical to our business operations and strategy. Increased information technology security threats and more sophisticated computer crime pose a risk to the security of our systems and networks and the confidentiality, availability and integrity of our data. Cybersecurity attacks could also include attacks targeting customer data or the security, integrity and/or reliability of the hardware and software installed in our products.
While we actively manage information technology security risks within our control through security measures, business continuity plans and employee training around phishing and other cyber risks, there can be no assurance that such actions will be sufficient to mitigate all potential risks to our systems, networks, data, and products. Furthermore, third parties on which we rely, including internet, mobile communications technology and cloud service providers, could be sources of information security risk to us.
A failure or breach in security, whether of our systems and networks or those of third parties on which we rely, could expose us and our customers, dealers and suppliers to risks of misuse of information or systems, the compromising of confidential information, loss of financial resources, manipulation and destruction of data, defective products, production downtimes and operations disruptions, which in turn could adversely affect our reputation, competitive position, businesses and results of operations. Security breaches could also result in litigation, regulatory action, unauthorized release of confidential or otherwise protected information and corruption of data, as well as remediation costs and higher operational and other costs of implementing further data protection measures. In addition, as security threats continue to evolve we may need to invest additional resources to protect the security of our systems and data. The amount or scope of insurance coverage we maintain may be inadequate to cover claims or liabilities relating to a cybersecurity attack.
8
Changes in privacy laws could disrupt our business
.
We are also subject to various laws regarding privacy and the protection of personal information. The regulatory framework for privacy and data security issues worldwide is rapidly evolving and is likely to remain uncertain for the foreseeable future. The European Union's General Data Protection Regulation (“GDPR”) imposes more stringent data protection requirements and provides for significant penalties for noncompliance. New privacy laws will continue to come into effect around the world, including the California Consumer Privacy Act and Brazil’s General Law of Personal Data Protection. We may be required to incur significant costs to comply with these and other privacy and data security laws, rules and regulations. Any inability to adequately address privacy and security concerns or comply with applicable privacy and data security laws, rules and regulations could have an adverse effect on our business prospects, results of operations and/or financial position.
We face risks associated with our employment relationships
.
In many countries where we operate, our employees are protected by laws and/or collective labor agreements that guarantee them, through local and national representatives, the right of consultation on specific matters, including repurposing, downsizing or closure of production facilities, activities and reductions in personnel. Laws and/or collective labor agreements applicable to us could impair our flexibility in reshaping and/or strategically repositioning our business activities. Therefore, our ability to reduce personnel or implement other permanent or temporary redundancy measures is subject to government approvals and/or the agreement of labor unions where such laws and agreements are applicable. Furthermore, we are at greater risk of work interruptions or stoppages than non-unionized companies and any work interruption or stoppage could significantly impact the volume of products we manufacture and sell, which could have a material adverse effect on our business, results of operations and financial condition.
Our ability to execute our strategy is dependent upon our ability to attract, motivate and retain qualified personnel
.
Our ability to compete successfully, to manage our business effectively, to expand our business and to execute our strategic direction, in particular the implementation of our Strategic Business Plan, depends, in part, on our ability to attract, motivate and retain qualified personnel in key functions. In particular, we are dependent on our ability to attract, motivate and retain qualified personnel with the requisite education, background, talents and industry experience. Failure to attract and retain qualified personnel, whether as a result of an insufficient number of qualified applicants, difficulty in recruiting new personnel, or the inability to integrate and retain qualified personnel, could impair our ability to execute our business strategy and could adversely affect our business.
Our business may be affected by unfavorable weather conditions, climate change or other calamities
.
Poor, severe or unusual weather conditions caused by climate change or other factors, particularly during the planting and early growing season, can significantly affect the purchasing decisions of our agricultural equipment customers. The timing and quantity of rainfall are two of the most important factors in agricultural production. Insufficient levels of rain prevent farmers from planting crops or may cause growing crops to die, resulting in lower yields. Excessive rain or flooding can also prevent planting or harvesting from occurring at optimal times and may cause crop loss through increased disease or mold growth. Temperature affects the rate of growth, crop maturity, crop quality and yield. Temperatures outside normal ranges can cause crop failure or decreased yields and may also affect disease incidence. Natural disasters such as floods, hurricanes, storms, droughts, diseases and pests can have a negative impact on agricultural production. The resulting negative impact on farm income can strongly affect demand for our agricultural equipment in any given period.
In addition, natural disasters, pandemic illness, terrorist attacks or violence, equipment failures, power outages, disruptions to our information technology systems and networks or other unexpected events could result in physical damage to and complete or partial closure of one or more of our manufacturing facilities or distribution centers, temporary or long-term disruption in the supply of parts or component products, disruption in the transport of our products to dealers and customers and delay in delivery of products to distribution centers. In the event such events occur, our financial results might be negatively impacted. Our existing insurance arrangements may not protect against all costs that may arise from such events.
Furthermore, the potential physical impacts of climate change on our facilities, suppliers and customers and therefore on our operations are highly uncertain and will be particular to the circumstances developing in various geographical regions. These may include long-term changes in temperature and water availability. These potential physical effects may adversely impact the demand for our products and the cost, production, sales and financial performance of our operations.
Changes in demand for food and alternate energy sources could impact our revenues
.
Changing worldwide demand for farm outputs to meet the world’s growing food and alternative energy demands, driven in part by government policies and a growing world population, are likely to result in fluctuating agricultural commodity prices, which affect sales of agricultural equipment. While higher commodity prices will benefit our crop producing agricultural equipment customers, higher commodity prices also result in greater feed costs for livestock and poultry producers, which in turn may result in lower levels of equipment purchased by these customers. Lower commodity prices directly affect farm income, which could negatively affect sales of agricultural equipment. Moreover, changing alternative energy demands may cause farmers to change the types or quantities of the crops they grow, with corresponding changes in equipment demands. Finally, changes in governmental policies regulating bio-fuel utilization could affect demand for our equipment and result in higher research and development costs related to equipment fuel standards.
9
International trade policies may impact demand for our products and our competitive position
.
Government policies on international trade and investment such as sanctions, import quotas, capital controls or tariffs, whether adopted by non-governmental bodies, individual governments or addressed by regional trade blocs, may affect the demand for our products, technology and services, impact the competitive position of our products or prevent us from being able to sell products to certain customers or in certain countries. The implementation of more protectionist trade policies, such as more detailed inspections, higher tariffs, or new barriers to entry, in countries where we sell products and provide services could negatively impact our business, results of operations and financial position. For example, a government’s adoption of trade sanctions or “buy national” policies or retaliation by another government against such policies could have a negative impact on our results of operations.
Financial Risks
Difficulty in obtaining financing or refinancing existing debt could impact our financial performance
.
Our performance will depend on, among other things, our ability to finance debt repayment obligations and planned investments from operating cash flow, available liquidity, the renewal or refinancing of existing bank loans and/or facilities and access to capital markets or other sources of financing. A decline in revenues could have a negative impact on the cash-generating capacity of our operations. Consequently, we could find ourselves in the position of having to seek additional financing and/or having to refinance existing debt, including in unfavorable market conditions with limited availability of funding and a general increase in funding costs. Instability in global capital markets, including market disruptions, limited liquidity and interest rate and exchange rate volatility, could reduce our access to capital markets or increase the cost of our short and long-term financing. Any difficulty in obtaining financing could have a material adverse effect on our business, results of operations and financial position.
Our ability to access the capital markets or other forms of financing and related costs are highly dependent on, among other things, the credit ratings of CNH Industrial N.V., its subsidiaries, asset-backed securities (“ABS”) and other debt instruments. Rating agencies may review and revise their ratings from time to time, and any downgrade or other negative action with respect to our credit ratings by one or more rating agencies may increase our cost of capital, potentially limit our access to sources of financing, and have a material adverse effect on our business, results of operations and financial condition.
We are subject to exchange rate fluctuations, interest rate changes and other market risks
.
We operate in numerous markets worldwide and are exposed to market risks stemming from fluctuations in currency and interest rates, including as a result of changes in monetary or fiscal policies of governmental authorities from time to time. We are subject to currency exchange risk to the extent that our costs are denominated in currencies other than those in which we earn revenues. In addition, the reporting currency for our consolidated financial statements is the U.S. dollar. Certain of our assets, liabilities, expenses and revenues are denominated in other currencies. Those assets, liabilities, expenses and revenues are translated into the U.S. dollar at the applicable exchange rates to prepare our consolidated financial statements. Therefore, increases or decreases in exchange rates between the U.S. dollar and those other currencies affect the value of those items reflected in our consolidated financial statements, even if their value remains unchanged in their original currency. Changes in currency exchange rates between the U.S. dollar and other currencies have had, and will continue to have, an impact on our results of operations and financial condition.
We use various forms of financing to cover the funding requirements of our Industrial Activities and for financing offered to customers and dealers. Financial Services normally implements a matching policy to offset the impact of differences in interest rates on the financed portfolio and related liabilities. Nevertheless, any future changes in interest rates can result in increases or decreases in revenues, finance costs and margins.
Although we seek to manage our currency risk and interest rate risk, including through hedging activities, there can be no assurance that we will be able to do so successfully, and our business, results of operations and financial position could be adversely affected. In addition, by utilizing these instruments, we potentially forego the benefits that may result from favorable fluctuations in currency exchange and interest rates. For additional information, see
“Item 11. Quantitative and Qualitative Disclosures About Market Risk.” to the consolidated financial statements at
December 31, 2019
.
We also face risks from currency devaluations. Currency devaluations result in a diminished value of funds denominated in the currency of the country instituting the devaluation.
Because Financial Services provides financing for a significant portion of our sales worldwide, our operations and financial results could be impacted materially should negative economic conditions affect the financial industry
.
Negative economic conditions can have an adverse effect on the financial industry in which Financial Services operates. Financial Services, through wholly-owned financial services companies and joint ventures, provides financing for a significant portion of our sales worldwide. Financial Services may experience credit losses that exceed its expectations and adversely affect its financial condition and results of operations. Financial Services’ inability to access funds at cost-effective rates to support its financing activities could have a material adverse effect on our business. Financial Services’ liquidity and ongoing profitability depend largely on timely access to capital in order to meet future cash flow requirements and to fund operations and costs associated with engaging in diversified funding activities. Additionally, negative
10
market conditions could reduce customer confidence levels, resulting in declines in credit applications and increases in delinquencies and default rates, which could materially impact Financial Services’ write-offs and provision for credit losses. Financial Services may also experience residual value losses that exceed its expectations caused by lower pricing for used equipment and higher than expected equipment returns at lease maturity.
An increase in delinquencies or repossessions could adversely affect the results of Financial Services
.
Fundamental in the operation of Financial Services is the credit risk associated with its customers/borrowers. The creditworthiness of each customer, rates of delinquency and default, repossessions and net losses on loans to customers are impacted by many factors, including: relevant industry and general economic conditions; the availability of capital; the terms and conditions applicable to extensions of credit; the experience and skills of the customer’s management team; commodity prices; political events; weather; and the value of the collateral securing the extension of credit. An increase in delinquencies or defaults, or a reduction in repossessions could have an adverse impact on the performance of Financial Services and our earnings and cash flows. In addition, although Financial Services evaluates and adjusts its allowance for credit losses related to past due or non-performing receivables on a regular basis, adverse economic conditions or other factors that might cause deterioration of the financial health of customers could change the timing and level of payments received and thus necessitate an increase in Financial Services’ estimated losses, which could have a material adverse effect on Financial Services’ and our results of operations and cash flows.
New regulations or changes in financial services regulations could adversely impact us
.
Financial Services’ operations are highly regulated by governmental authorities in the locations where it operates, which can impose significant additional costs and/or restrictions on its business. In the U.S., for example, the
requirements of the Dodd-Frank Wall Street Reform and Consumer Protection Act of 2010 (“Dodd-Frank Act”), including its implementing regulations, may substantially affect Financial Services’ origination, servicing, and securitization programs. The Dodd-Frank Act also strengthens the regulatory oversight of these securities and related capital market activities by the SEC and increases the regulation of the ABS markets through, among other things, a mandated risk retention requirement for securitizers and a direction to regulate credit rating agencies. Other future regulations may affect Financial Services' ability to engage in funding these capital market activities or increase the effective cost of such transactions, which could adversely affect our financial position, results of operations and cash flows.
We may be exposed to shortfalls in our pension plans
.
At
December 31, 2019
, the funded status for our defined benefit pension, healthcare and other postemployment benefit plans was a deficit of
$1,533 million
. This amount included obligations of
$715 million
for plans that we are currently not required to fund. The funded status is subject to many factors, as discussed in “Item 5. Operating and Financial Review and Prospects—A. Operating Results—Application of Critical Accounting Estimates—Pension and Other Postemployment Benefits,” as well as “Note 12: Employee Benefit Plans and Postretirement Benefits” to the consolidated financial statements for the year ended
December 31, 2019
.
To the extent that our obligations under a plan are unfunded or underfunded, we will have to use cash flows from operations and other sources to pay our obligations as they become due. In addition, since the assets that currently fund these obligations are primarily invested in debt instruments and equity securities, the value of these assets is subject to changes due to market fluctuations.
We have significant outstanding indebtedness, which may limit our ability to obtain additional funding and may limit our financial and operating flexibility
.
As of
December 31, 2019
, we had an aggregate of $
24,854
million (including $
20,748
million relating to Financial Services’ activities) of consolidated gross indebtedness, and our equity was $6,121 million, including noncontrolling interests. The extent of our indebtedness could have important consequences on our operations and financial results, including:
|
•
|
we may not be able to secure additional funds for working capital, capital expenditures, debt service requirements or general corporate purposes;
|
|
•
|
we may need to use a portion of our projected future cash flow from operations to pay principal and interest on our indebtedness, which may reduce the amount of funds available to us for other purposes;
|
|
•
|
we may be more financially leveraged than some of our competitors, which could put us at a competitive disadvantage;
|
|
•
|
we may not be able to invest in the development or introduction of new products or new business opportunities;
|
|
•
|
we may not be able to adjust rapidly to changing market conditions, which may make us more vulnerable to a downturn in general economic conditions; and
|
|
•
|
we may not be able to access the capital markets on favorable terms, which may adversely affect our ability to provide competitive retail and wholesale financing programs.
|
These risks are exacerbated by the ongoing volatility in the financial markets, in part resulting from perceived strains on the finances and creditworthiness of several governments and financial institutions, particularly in the European Union and Latin America, and from continued concerns about global economic growth, particularly in emerging markets.
11
Further, our indebtedness under some of our instruments including our revolving credit facilities and derivative transactions may bear interest at variable interest rates based on LIBOR. The LIBOR benchmark has been subject to national, international, and other regulatory guidance and proposals for reform. In July 2017, the U.K. Financial Conduct Authority announced that it intends to stop persuading or compelling banks to submit rates for calculation of LIBOR after 2021. These reforms may cause LIBOR to perform differently than in the past and LIBOR may ultimately cease to exist after 2021 or be unsuitable to use as a benchmark. The consequences of any potential cessation, modification or other reform of LIBOR cannot be predicted at this time. Any new benchmark rate will likely not replicate LIBOR exactly, which could impact new credit facilities and derivative transaction entered into after 2021. Any changes to benchmark rates could have an impact on our cost of funds and our access to the capital markets, which could impact our results of operations and cash flows. Uncertainty as to the nature of such potential changes may also adversely affect the trading market for our securities.
Restrictive covenants in our debt agreements could limit our financial and operating flexibility
.
The agreements governing our outstanding debt securities and other credit agreements to which we are a party from time to time contain, or may contain, covenants that restrict our ability to, among other things:
|
•
|
incur additional indebtedness by certain subsidiaries;
|
|
•
|
make certain investments;
|
|
•
|
enter into certain types of transactions with affiliates;
|
|
•
|
sell or acquire certain assets or merge with or into other companies; and/or
|
|
•
|
use assets as security in other transactions.
|
Although we do not believe any of these covenants materially restrict our operations currently, a breach of one or more of the covenants could result in adverse consequences that could negatively impact our businesses, results of operations, and financial position. These consequences may include the acceleration of amounts outstanding under certain of our credit facilities, triggering an obligation to redeem certain debt securities, termination of existing unused commitments by our lenders, refusal by our lenders to extend further credit under one or more of the facilities or to enter into new facilities or the lowering or modification of CNH Industrial’s credit ratings or those of one or more of its subsidiaries. For further information, see
“Note 10: Debt” to the consolidated financial statements for the year ended
December 31, 2019
for additional information.
Other Risks
CNH Industrial operates and will continue to operate, as a company that is resident in the U.K. for tax purposes; other tax authorities may treat CNH Industrial as being tax resident elsewhere
.
CNH Industrial is not incorporated in the U.K.; therefore, in order to be resident in the U.K. for tax purposes, CNH Industrial’s central management and control must be located (in whole or in part) in the U.K. The test of central management and control is largely a question of fact based on all the circumstances. The decisions of the U.K. courts and the published practice of Her Majesty’s Revenue & Customs, or HMRC, suggest that CNH Industrial should be regarded as being U.K.-resident on this basis. The competent authority ruling referred to below supports this analysis. Although CNH Industrial’s “central management and control” is in the U.K., it would not be treated as U.K.-resident if (a) CNH Industrial were concurrently resident in another jurisdiction (applying the tax residence rules of that jurisdiction) which has a double tax treaty with the U.K.; and (b) that tax treaty allocates exclusive residence to that other jurisdiction.
Although CNH Industrial’s central management and control is in the U.K., CNH Industrial is considered to be resident in the Netherlands for Dutch corporate income tax and Dutch dividend withholding tax purposes because CNH Industrial is incorporated in the Netherlands. The U.K. and Dutch competent authorities have agreed, following a mutual agreement procedure (as contemplated by the Netherlands-U.K. tax treaty), that CNH Industrial will be regarded as solely resident in the U.K. for purposes of the application of the Netherlands-U.K. tax treaty provided that CNH Industrial operates as planned and provides appropriate required evidence to the U.K. and Dutch competent tax authorities. If the facts upon which the competent authorities issued this ruling change over time, this ruling may be withdrawn or cease to apply and in that case the Netherlands may levy corporate income tax on CNH Industrial and impose withholding taxes on dividends distributed by CNH Industrial.
We do not expect Brexit to affect our tax residency in the U.K.; however, we are unable to predict with certainty whether the discussions to implement Brexit will ultimately have any impact on this matter.
CNH Industrial’s residence for Italian tax purposes is also largely a question of fact based on all the circumstances. For Italian tax purposes, a rebuttable presumption of CNH Industrial’s residence in Italy may apply under Italian legislation. However, CNH Industrial has a management and organizational structure such that CNH Industrial should be deemed resident in the U.K. from the date of its incorporation for purposes of the Italy-U.K. tax treaty. Because this analysis is highly factual and may depend on future changes in CNH Industrial’s management and organizational structure, there can be no assurance that CNH Industrial’s determination of its tax residence will be respected by all relevant tax authorities. Should CNH Industrial be treated as an Italian tax resident, CNH Industrial would be subject to
12
corporate income tax in Italy on its worldwide income and may be required to comply with withholding tax on dividends and other distributions and/or reporting obligations under Italian law, which could result in additional costs and expenses.
Tax may be required to be withheld from dividend payments
.
Although the U.K. and Dutch competent authorities have ruled that we should be treated as solely resident in the U.K. for the purposes of the Netherlands-U.K. double tax treaty, under Dutch domestic law dividend payments made by us to Dutch residents are still subject to Dutch dividend withholding tax and we would have no obligation to pay additional amounts in respect of such payments.
Should withholding taxes be imposed on future dividends or distributions with respect to our common shares, whether such withholding taxes are creditable against a tax liability to which a shareholder is otherwise subject depends on the laws of such shareholder’s jurisdiction and such shareholder’s particular circumstances. Shareholders are urged to consult their tax advisors in respect of the consequences of the potential imposition of withholding taxes.
We may incur additional tax expense or become subject to additional tax exposure
.
We are subject to income taxes in many jurisdictions around the world. Our tax liabilities are dependent upon the location of earnings among these different jurisdictions. Our future results of operations could be adversely affected by changes in the effective tax rate as a result of a change in the mix of earnings in countries with differing statutory tax rates, changes in our overall profitability, changes in tax legislation and rates, changes in generally accepted accounting principles and changes in the valuation of deferred tax assets and liabilities. If our effective tax rates were to increase, or if the ultimate determination of our taxes owed is for an amount in excess of amounts previously accrued or paid, our operating results, cash flows, and financial position could be adversely affected. For further information, see
“Item 10. Additional Information -E. Taxation.” to the consolidated financial statements for the year ended
December 31, 2019
.
We intend for the On-Highway separation to qualify as a tax-free allocation of shares to our shareholders in some jurisdictions, but no assurance can be given that the separation will receive such tax-free treatment in any specific jurisdiction
.
I
t is our intention to structure the spin-off of our "On-Highway" business (commercial vehicles and powertrain) in a tax efficient manner, taking appropriate account of the potential impact on shareholders, but no assurance can be given that the intended tax treatment will be achieved, or that shareholders, and/or persons that receive the allocation of On-Highway shares, will not incur tax liabilities in connection with the separation and allocation. In particular, the requirements for favorable tax treatment differ (and may conflict) from jurisdiction to jurisdiction and the relevant requirements are often complex. Accordingly, no assurance can be given that any ruling (or similar guidance) from any taxing authority would be sought or, if sought, granted.
Our maintenance of two exchange listings may adversely affect liquidity in the market for our common shares and could result in pricing differentials of our common shares between the two exchanges
.
The dual listing of our common shares on the NYSE and the MTA may split trading between the two markets and adversely affect the liquidity of the shares in one or both markets and the development of an active trading market for our common shares on the NYSE and may result in price differentials between the exchanges. Differences in the trading schedules, trading volume and investor bases, as well as volatility in the exchange rate between the two trading currencies, among other factors, may result in different trading prices for our common shares on the two exchanges or otherwise adversely affect liquidity and trading prices of our shares.
The loyalty voting program may affect the liquidity of our common shares and reduce our share price
.
CNH Industrial’s loyalty voting program is intended to reward shareholders for maintaining long-term share ownership by granting initial shareholders and persons holding shares continuously for at least three years at any time following the effectiveness of the merger, of Fiat Industrial S.p.A. and CNH Global N.V. with and into CNH Industrial (the “Merger”), the option to elect to participate in the loyalty voting program and have their common shares registered in the Company's Loyalty Register and receive special voting shares. Special voting shares cannot be traded and, immediately prior to the transfer of our common shares from the CNH Industrial Loyalty Register, any corresponding special voting shares shall be transferred to CNH Industrial for no consideration (
om niet
). This loyalty voting program is designed to encourage a stable shareholder base and, conversely, it may deter trading by those shareholders who are interested in gaining or retaining special voting shares. Therefore, the loyalty voting structure may reduce liquidity in our common shares and adversely affect their trading price.
The loyalty voting program may prevent or frustrate attempts by our shareholders to change our management and hinder efforts to acquire a controlling interest in us, and the market price of our common shares may be lower as a result
.
The provisions of our Articles of Association establishing the loyalty voting program may make it more difficult for a third party to acquire, or attempt to acquire, control of us, even if a change of control is considered favorably by shareholders holding a majority of our common shares. As a result of the loyalty voting program, a relatively large proportion of the voting power of our common shares could be concentrated in a relatively small number of shareholders who would have significant influence over us. As of
January 31, 2020
, EXOR N.V. had a voting interest in CNH Industrial of approximately
42.2%
.
For further information, see
“Item 7. Major Shareholders and Related Party Transactions”
13
to the consolidated financial statements at
December 31, 2019
.
Such shareholders participating in the loyalty voting program could effectively prevent change of control transactions that may otherwise benefit our shareholders.
The loyalty voting program may also prevent or discourage shareholders’ initiatives aimed at changes in our management.
A.
History and Development of the Company
CNH Industrial N.V. is the company formed by the business combination transaction, completed on September 29, 2013, between Fiat Industrial and its subsidiary CNH Global N.V.
CNH Industrial N.V. was incorporated on November 23, 2012, as a public limited liability company (
naamloze vennootschap
) under the laws of the Netherlands. The Company's principal office is located at 25 St. James’s Street, London, England, United Kingdom (telephone number: +44-207-7660-346). CNH Industrial’s agent for U.S. federal securities law purposes is Michael P. Going, c/o CNH Industrial America LLC, 6900 Veterans Boulevard, Burr Ridge, Illinois 60527 (telephone number +1-630-887-3766).
We make capital expenditures in the regions in which we operate principally related to initiatives to introduce new products, enhance manufacturing efficiency and increase capacity, and for maintenance and engineering. We continually analyze the allocation of our industrial resources, taking into account such things as relative currency values, existing and anticipated industry and product demand, the location of customers and suppliers, the cost of goods and labor, and plant utilization levels. See “Item 4. Information on the Company—D. Property, Plant and Equipment” for additional information.
The SEC maintains an Internet site at http://www.sec.gov that contains reports, proxy and information statements, and other information regarding issuers that file electronically with the SEC, from which the public may obtain any materials the company files with the SEC.
B.
Business Overview
General
We are a leading global capital goods company engaged in the design, production, marketing, sale and financing of agricultural and construction equipment, trucks, commercial vehicles, buses and specialty vehicles for firefighting, defense and other uses, as well as engines, transmissions and axles for those vehicles and engines for marine and power generation applications. We have industrial and financial services companies located in 44 countries and a commercial presence in approximately 180 countries.
Agriculture
designs, manufactures and distributes a full line of farm machinery and implements, including two-wheel and four-wheel drive tractors, crawler tractors (Quadtrac
®
), combines, cotton pickers, grape and sugar cane harvesters, hay and forage equipment, planting and seeding equipment, soil preparation and cultivation implements and material handling equipment. Agricultural equipment is sold under the New Holland Agriculture and Case IH brands, as well as the STEYR, Kongskilde and Överum brands in Europe and the Miller brand, primarily in North America and Australia.
Construction
designs, manufactures and distributes a full line of construction equipment including excavators, crawler dozers, graders, wheel loaders, backhoe loaders, skid steer loaders, and compact track loaders. Construction equipment is sold under the CASE Construction and New Holland Construction brands.
Commercial and Specialty Vehicles
designs, manufactures and distributes a full range of light, medium, and heavy vehicles for the transportation and distribution of goods under the IVECO brand, commuter buses and touring coaches under the IVECO BUS (previously Iveco Irisbus) and Heuliez Bus brands, quarry and mining equipment under the IVECO ASTRA brand, firefighting vehicles under the Magirus brand, and vehicles for civil defense and peace-keeping missions under the Iveco Defence Vehicles brand.
Powertrain
designs, manufactures and distributes, under the FPT Industrial Brand, a range of engines, transmission systems and axles for on- and off-road applications, as well as for marine and power generation.
Financial Services
offers a range of financial services to dealers and customers. Financial Services provides and administers retail financing to customers for the purchase or lease of new and used industrial equipment or vehicles and other equipment sold by CNH Industrial dealers. In addition, Financial Services provides wholesale financing to CNH Industrial dealers. Wholesale financing consists primarily of floor plan financing and allows the dealers to purchase and maintain a representative inventory of products. Financial Services also provides trade receivables factoring services to CNH Industrial companies.
14
Net revenues by segment in the years ended
December 31, 2019
,
2018
and
2017
were as follows:
|
2019
|
2018
|
2017
|
||||||||||
|
(in millions)
|
||||||||||||
|
Revenues:
|
||||||||||||
|
Agriculture
|
$
|
10,959
|
|
$
|
11,682
|
|
$
|
10,683
|
|
|||
|
Construction
|
2,768
|
|
3,021
|
|
2,530
|
|
||||||
|
Commercial and Specialty Vehicles
|
10,439
|
|
10,939
|
|
10,562
|
|
||||||
|
Powertrain
|
4,117
|
|
4,565
|
|
4,369
|
|
||||||
|
Eliminations and other
|
(2,134
|
)
|
(2,376
|
)
|
(2,375
|
)
|
||||||
|
Total Net sales of Industrial Activities
|
26,149
|
|
27,831
|
|
25,769
|
|
||||||
|
Financial Services
|
2,011
|
|
1,989
|
|
2,028
|
|
||||||
|
Eliminations and other
|
(81
|
)
|
(114
|
)
|
(96
|
)
|
||||||
|
Total Revenues
|
$
|
28,079
|
|
$
|
29,706
|
|
$
|
27,701
|
|
|||
Net revenues by region in the years ended
December 31, 2019
,
2018
and
2017
were as follows:
|
2019
|
2018
|
2017
|
|||||||||||||||||||
|
(in millions)
|
(%)
|
(in millions)
|
(%)
|
(in millions)
|
(%)
|
||||||||||||||||
|
Revenues:
|
|||||||||||||||||||||
|
Europe
|
$
|
14,203
|
|
50.6
|
%
|
$
|
14,921
|
|
50.2
|
%
|
$
|
13,429
|
|
48.5
|
%
|
||||||
|
North America
|
6,806
|
|
24.2
|
|
6,947
|
|
23.4
|
|
6,275
|
|
22.6
|
|
|||||||||
|
South America
|
2,893
|
|
10.3
|
|
3,004
|
|
10.1
|
|
3,132
|
|
11.3
|
|
|||||||||
|
Rest of World
|
4,177
|
|
14.9
|
|
4,834
|
|
16.3
|
|
4,865
|
|
17.6
|
|
|||||||||
|
Total Revenues
|
$
|
28,079
|
|
100.0
|
%
|
$
|
29,706
|
|
100.0
|
%
|
$
|
27,701
|
|
100.0
|
%
|
||||||
Industry Overview
Agriculture
The operators of dairy, livestock and row crop producing farms, as well as independent contractors that provide services to such farms, purchase most agricultural equipment. Row crop farmers typically purchase tractors at the mid-to-upper end of the horsepower ("hp") range, combines and harvesting equipment and crop production equipment. Dairy and livestock farmers typically utilize tractors in the mid-to-lower hp range and crop preparation and crop packaging implements. The key factors influencing sales of agricultural equipment are the level of net farm income and, to a lesser extent, general economic conditions, interest rates and the availability of financing and related subsidy programs, farm land prices and farm debt levels. Net farm income is primarily impacted by the volume of acreage planted, commodity and/or livestock prices and stock levels, the impacts of fuel ethanol demand, crop yields, farm operating expenses (including fuel and fertilizer costs), fluctuations in currency exchange rates, government subsidies, tax incentives and trade policies. Farmers tend to postpone the purchase of equipment when the farm economy is declining and to increase their purchases when economic conditions improve. The availability, quality, and cost of used equipment for sale also affect the level of new equipment sales. Weather conditions are a major determinant of crop yields and therefore affect equipment-buying decisions. In addition, geographical variations in weather from season to season may affect sales volumes differently in different markets. Government policies may affect the market for agricultural equipment by regulating the levels of acreage planted, with direct subsidies affecting specific commodity prices, or with other payments made directly to farmers. Global organization initiatives, such as those of the World Trade Organization, also can affect the market with demands for changes in governmental policies and practices regarding agricultural subsidies, tariffs and acceptance of genetically modified organisms such as seed, feed and animals.
Demand for agricultural equipment also varies seasonally by region and product, primarily due to differing climates and farming calendars. Peak retail demand for tractors and planting, seeding, and application equipment typically occurs in March through June in the Northern hemisphere and in September through December in the Southern hemisphere. Dealers order equipment year-round but harvesting equipment orders in the Northern hemisphere generally increase in the late fall and winter so that the dealers can receive inventory prior to the peak retail selling season, which generally extends from March through June. In the Southern hemisphere, dealers generally order between August and October so they can receive inventory prior to the peak retail-selling season, which extends from November through February. Agriculture's production levels are based upon estimated retail demand, which takes into account, among other things, the timing of dealer shipments (which occur in advance of retail demand), dealer and Company inventory levels, the need to retool manufacturing facilities to produce new or different models, and the efficient use of labor and facilities. Production levels are adjusted to reflect changes in estimated demand and dealer inventory levels. However, because production and wholesale shipments adjust
15
throughout the year to take into account the factors described above, wholesale sales of agricultural equipment products in any given period may not reflect the timing of dealer orders and retail demand for that period.
Customer preferences regarding farming practices, and thus product types and features, vary by region. In North America, Australia and other areas where soil conditions, climate, economic factors and population density allow for intensive mechanized agriculture, farmers demand high capacity, sophisticated machines equipped with the most advanced technology. In Europe, where farms are generally smaller in size than those in North America and Australia, there is greater demand for somewhat smaller, yet equally sophisticated, machines. In the developing regions of the world where labor is more abundant and infrastructure, soil conditions and/or climate are not conducive to intensive agriculture, customers generally prefer simple, robust and durable machines with relatively lower acquisition and operating costs. In many developing countries, tractors are the primary, if not the sole, type of agricultural equipment used, and much of the agricultural work in such countries that cannot be performed by tractors is carried out by hand. A growing number of part-time farmers, hobby farmers and customers engaged in landscaping, municipality and park maintenance, golf course and roadside mowing in Western Europe and North America prefer relatively simple, low-cost agricultural equipment. Our position as a geographically diversified manufacturer of agricultural equipment and our broad geographic network of dealers allows us to provide customers in each significant market with equipment that meets their specific requirements.
Major trends in the North American and Western European agricultural industries include a reduction in number but growth in size of farms, supporting increased demand for higher capacity agricultural equipment. In addition, we believe that the use of technology and other precision farming solutions (including the development of autonomously operated equipment) to enhance productivity and profitability are becoming more important in the buyers’ purchasing decision. Failure to design, develop and implement this technology may affect the prospects of our Company. In South America and in other emerging markets, the number of farms is growing, and mechanization is replacing manual labor. In Rest of World, long-term demographic trends, increasing urbanization, and low level of farm mechanization represent the key drivers of demand for agricultural equipment. Government farm programs, including the amount and timing of government payments, are a key income driver for farmers raising certain commodity crops in the United States (the "U.S.") and the European Union. The existence of a high level of subsidies in these markets for agricultural equipment reduces the effects of cyclicality in the agricultural equipment business. The effect of these subsidies on agricultural equipment demand depends largely on the U.S. Farm Bill and programs administered by the United States Department of Agriculture, the Common Agricultural Policy of the European Union and World Trade Organization negotiations. Additionally, the Brazilian government subsidizes the purchase of agricultural equipment through low-rate financing programs administered by the Banco Nacional de Desenvolvimento Economico e Social (“BNDES”). These programs have a significant influence on sales.
Agricultural equipment manufacturers are subject to, among other things, continuous changes in engine emission regulations and restrictions. These changes require frequent changes in engine technology, which can involve significant research and development investments. Manufacturers generally attempt to pass these incremental costs to their customers, but these price increases must be balanced with the affordability of the equipment. Each market may have its own unique regulations, which adds a level of complexity required to meet global product needs.
Global demand for renewable fuels increased considerably in recent years driven by consumer preference, government renewable fuel mandates, renewable fuel tax and production incentives. Biofuels, which include fuels such as ethanol and biodiesel, have become one of the most prevalent types of renewable fuels. The primary type of biofuel supported by government mandates and incentives varies by region. North America and Brazil are promoting ethanol first and then biodiesel, while Europe is primarily focused on biodiesel.
The demand for biofuels has created an associated demand for agriculturally based feedstocks, which are used to produce biofuels. Currently, most of the ethanol in the U.S. and Europe is extracted from corn, while in Brazil it is extracted from sugar cane. Biodiesel is typically extracted from soybeans and rapeseed oil in the U.S. and Brazil, and from rapeseed and other oil seeds as well as food waste by-products in Europe. The use of corn and soybeans for biofuel has been one of the main factors affecting the supply and demand relationships, as well as price for these crops. The economic feasibility of biofuels is significantly impacted by the price of oil. As the price of oil falls, biofuels become a less attractive alternative energy source. This relationship will, however, be impacted by government policy and mandates as governments around the world consider ways to combat global warming and avoid potential energy resource issues in the future.
The increase in crop production for biofuels has also driven changes in the type of crops grown and in crop rotations. The most significant change in U.S. crop production was the increase in acreage devoted to corn, typically using land previously planted with soybeans and cotton. In addition, a change in crop rotation resulted in more acres of corn being planted. As a result, agricultural producers are faced with new challenges for managing crop residues and are changing the type of equipment they use and how they use it.
Although the demand for new agricultural equipment tends to decrease during periods of economic stagnation or recession, the aftersales market is historically less volatile than the new equipment market and, therefore, helps limit the impact of declines in new equipment sales on the operating results of full-line manufacturers, such as Agriculture.
16
Construction
The construction equipment market consists of two principal segments: heavy construction equipment (excluding the mining and the specialized forestry equipment markets in which we do not participate), with equipment generally weighing more than 12 metric tons, and light construction equipment, with equipment generally weighing less than 12 metric tons.
In developed markets, customers tend to prefer more sophisticated machines equipped with the latest technology and features to improve operator productivity. In developing markets, customers tend to prefer equipment that is relatively less costly and has greater perceived durability. In North America and Europe, where the cost of machine operators is higher relative to fuel costs and machine depreciation, customers typically emphasize productivity, performance and reliability. In other markets, where the relative costs for machine operators is lower, customers often continue to use equipment after its performance and efficiency have begun to diminish.
Customer demand for power and operating capacity does not vary significantly from market to market. However, in many countries, restrictions on equipment weight or dimensions, as well as road regulations or job site constraints can limit demand for larger machines.
Although the demand for new construction equipment tends to decrease during periods of economic stagnation or recession, the aftersales market is historically less volatile than the new equipment market and, therefore, helps limit the impact of declines in new equipment sales on the operating results of full-line manufacturers, such as Construction.
Heavy Construction
Heavy construction equipment typically includes general construction equipment such as large wheel loaders and excavators, and road building and site preparation equipment such as graders, compactors and dozers. Purchasers of heavy construction equipment include construction companies, municipalities, local governments, rental fleet owners, quarrying and mining companies, waste management companies and forestry-related concerns.
Sales of heavy construction equipment depend on the expected volume of major infrastructure construction and repair projects such as highway, tunnel, dam and harbor projects, which depend on government spending and economic growth. Demand for aggregate mining and quarrying equipment is more closely linked to the general economy and commodity prices, while growing demand for environmental equipment is becoming less sensitive to the economic cycle. In North America, a portion of heavy equipment demand has historically been linked to the development of new housing subdivisions, where the entire infrastructure needs to be created, thus linking demand for both heavy and light construction equipment. The heavy equipment industry generally follows macroeconomic cyclicality, linked to growth in gross domestic product.
Light Construction
Light construction equipment is also known as compact and service equipment, and it includes skid-steer loaders, compact track loaders, tractor loaders, rough terrain forklifts, backhoe loaders, small wheel loaders and excavators. Purchasers of light construction equipment include contractors, residential builders, utilities, road construction companies, rental fleet owners, landscapers, logistics companies and farmers. The principal factor influencing sales of light construction equipment is the level of residential and commercial construction, remodeling and renovation, which is influenced by interest rates and the availability of financing. Other major factors include the construction of light infrastructure, such as utilities, cabling and piping and maintenance expenditures. The principal use of light construction equipment is to replace relatively high-cost, slower manual work. Product demand in the United States and Europe has generally tended to mirror housing starts, but with lags of six to twelve months. In areas where labor is abundant, and the cost of labor is inexpensive relative to other inputs, such as in India, Africa and South America, the light construction equipment market is generally smaller. These regions represent potential areas of growth for light construction equipment in the medium to long-term as labor costs rise relative to the cost of equipment.
Equipment rental is a significant element of the construction equipment market. Compared to the U.K. and Japan, where there is an established market for long-term equipment rentals as a result of favorable tax treatment, the rental market in North America and Western Europe (except for the U.K.) consists mainly of short-term rentals of light construction equipment to individuals or small contractors for which the purchase of equipment is not cost effective or that need specialized equipment for specific jobs. In North America, the main rental product has traditionally been the backhoe loader and, in Western Europe, it has been the mini-excavator. As the market has evolved, a greater variety of light and heavy equipment products have become available to rent. In addition, rental companies have allowed contractors to rent machines for longer periods instead of purchasing the equipment, enabling contractors to complete specific job requirements with greater flexibility and cost control. Large, national rental companies can significantly impact the construction equipment market, with purchase volumes being driven by their decisions to increase or decrease the sizes of their rental fleets based on rental utilization rates.
Seasonal demand for construction equipment fluctuates somewhat less than for agricultural equipment. Nevertheless, in North America and Western Europe, housing construction generally slows during the winter months. North American and European industry retail demand for construction equipment is generally strongest in the second and fourth quarters.
17
In markets outside of North America, Western Europe and Japan, equipment demand may also be partially satisfied by importing used equipment. Used heavy construction equipment from North America may fulfill demand in the Latin American market and equipment from Western Europe may be sold to Central and Eastern European, North African and Middle Eastern markets. Used heavy and light equipment from Japan is mostly sold to other Southeast Asian markets, while used excavators from Japan are sold to almost every other market in the world. This flow of used equipment is highly influenced by exchange rates, the weight and dimensions of the equipment and the different local regulations in terms of safety and/or engine emissions.
The construction equipment industry has seen an increase in the use of hydraulic excavators and wheel loaders in earth-moving and material handling applications. In addition, the light equipment sector has grown as more manual labor is being replaced on construction sites by machines with a variety of attachments for specialized applications, such as skid steer loaders, compact track loaders and mini-crawler excavators.
Commercial and Specialty Vehicles
Trucks and Commercial Vehicles
The world truck market is generally divided into two segments: Light Commercial Vehicles (“LCV”) market (gross vehicle weight (“GVW”) 3.5-7.49 metric tons), and Medium and Heavy (“M&H”) truck market (GVW above 7.5 metric tons). The M&H segment is characterized by a higher level of engineering specialization due to the technologies and production systems utilized, while the LCV segment has many engineering and design characteristics in common with the automobile industry. In addition, operators of M&H trucks often require vehicles with a higher degree of customization than the more standardized products that serve the LCV market. Customers generally purchase heavy trucks for one of three primary uses: long distance haulage, construction haulage, and/or distribution.
The regional variation in demand for commercial vehicles is influenced by differing economic conditions, levels of infrastructure development and geographic region, all of which lead to differing transport requirements.
M&H truck demand tends to be closely aligned with the general economic cycle and the capital investment cycle including the general level of interest rates and, in certain countries, governmental subsidy programs, particularly in more developed markets such as Europe, North America and Japan, as economic growth provides increased demand for haulage services and an incentive for transporters to invest in more efficient, higher capacity vehicles and renew vehicle fleets. The product life cycle for M&H trucks typically covers a seven to ten-year period.
Although economic cycles have a significant influence on demand for M&H trucks in emerging economies, the processes of industrialization and infrastructure development have generally driven long-term growth trends in these countries. As a country’s economy becomes more industrialized and its infrastructure develops, transport needs tend to grow in response to increases in production and consumption. Developing economies, however, tend to display volatility in short-term demand resulting from government intervention, changes in the availability of financial resources and protectionist trade policies. In developing markets, demand for M&H trucks increases when it becomes more cost-effective to transport heavier loads, especially as the infrastructure, primarily roads and bridges, becomes capable of supporting heavier trucks. At the same time, the need to transport goods tends to increase in these markets, resulting in increased demand for LCV.
Industry forecasts indicate that transportation of goods by road, currently the predominant mode of transport, will remain so for the foreseeable future. Demand for services and service-related products, including parts, is a function of the number of vehicles in use. Although demand for new commercial vehicles tends to decrease during periods of economic stagnation or recession, the aftersales market is historically less volatile than the new vehicle market and, therefore, helps limit the impact of declines in new vehicle sales on the operating results of full-line manufacturers, such as Commercial and Specialty Vehicles.
Commercial vehicles markets are subject to intense competition based on initial sales price, cost and performance of vehicles over their life cycle (i.e., purchase price, operating and maintenance costs and residual value of the vehicle at the end of its useful life), services and service-related products and the availability of financing options. High reliability and low variable costs contribute to customer profitability over the life of the vehicle and are usually important factors in an operator’s purchase decision. Additional competitive factors include the manufacturer’s ability to address customer transport requirements, driver safety, comfort, and brand loyalty through vehicle design.
Demand for trucks varies seasonally by region and by product class. In Europe, the peak retail demand occurs in the second and fourth quarters due to key fleet customer demands and customer budgetary cycles. In South America, demand is relatively stable throughout the year except for increased demand for heavy trucks in the first and fourth quarters from customers who transport foodstuffs. In Rest of World, sales tend to be higher in the second and fourth quarters due to local holiday periods.
Although we believe that diesel remains, for the foreseeable future, the primary fuel source for commercial vehicles and industrial equipment in general, the adoption of new engine technological solutions and growing public opinion in favor of more environmentally friendly solutions are pushing for increased penetration of both alternative and renewable fuels (such as compressed natural gas (“CNG”), liquefied natural gas (“LNG”), and methane) and full electric vehicles.
18
The car industry is leading autonomous vehicle development, but commercial vehicles are also making advances in platooning and autonomous technologies. We expect this development to intensify. We believe that the growing automation in transportation and infrastructure solutions through the use of self-driving vehicles will also allow the industry to provide greater safety, fuel savings, and transport efficiency.
Buses
The global bus business is organized by mission, from city and intercity transport to tourism purposes, with a capacity ranging from 7 to 150 seated/standing passengers. IVECO BUS (previously Iveco Irisbus) and Heuliez Bus target markets include urban, intercity buses and long-distance touring coaches. Operators in this industry include three types of manufacturers: those specialized in providing chassis to bodybuilders, those that build bodies on chassis produced by third parties, and those, like IVECO BUS, that produce the entire vehicle.
The principal customers of the bus segment are tour and intercity bus service operators, while the principal customers of the city bus segment are the transport authorities in urban areas.
Deregulation and privatization of transport services in many markets has favored concentration towards large private companies operating in one country, in more than one neighboring country, or at an international level. Demand has increased for highly standardized, high-use products for large fleets, with financing and maintenance agreements or kilometric pricing. Deregulation and privatization have also increased competition between large transport service companies, raising the level of vehicle use and increasing the choice of brands for operators in the market.
Sales for urban and intercity buses are generally higher in the second half of the year, due to public entities budgeting processes, tender rules and bus production lead-time.
Powertrain
The dynamics of the industrial powertrain business vary across the different market segments in which the various propulsion systems are used. For vehicle and equipment applications, product development is driven by regulatory requirements (i.e., legislation on emissions and, increasingly, CO
2
emissions), as well as the need to reduce total operating costs: customers are seeking more efficient propulsion systems that enable lower total cost of ownership and higher productivity.
For on-road applications in developed markets, where economy and infrastructure drive demand for local and haulage transportation, demand for engines is driven by general economic conditions, capital investment, industrialization and infrastructure developments.
In the bus market, engine demand is increasingly influenced by the environmental policies of governments and local authorities (i.e., requirements for natural gas, hybrid and electric solutions).
Demand for off-road applications in the agricultural industry is influenced by many factors, including the price of agricultural commodities and the relative level of new and used inventories, the profitability of agricultural enterprises, net farm income, the demand for food products, agricultural policies, as well as climatic conditions. At the same time, the heavy construction equipment business is driven by general economic factors and the level of public investment in infrastructure, which affects the need for replacement of old equipment and investment in more innovative solutions to boost productivity.
Increasingly stringent emission regulations in Europe, the U.S. and Asia represent an opportunity for Powertrain to gain a competitive advantage through technological solutions developed for engines and after-treatment systems (such as our High Efficiency SCR technology). Alternative fuel engines have become an attractive alternative solution to diesel for transport vehicles, as they are perceived as more environmentally friendly and offer better fuel economy than diesel while performing comparably to diesel engines (e.g. LNG for Buses and Commercial Vehicles). Increasing demand for alternative propulsion systems (such as electrified powertrain or fuel cell) is expected to continue, as related technologies are growing quickly and will offer business opportunities in the industrial sector. The increasing trend among mid-sized original equipment manufacturers ("OEMs") to outsource engine development, due to the significant research and development expenditures required to meet the new emission requirements, presents an opportunity for Powertrain to increase sales to third party customers.
The Company believes that FPT Industrial provides the Company, as a whole, with strategic independence in a key area where competition is particularly intense and further challenges, driven by increasingly stringent regulations, are expected.
Competition
The industries in which we operate are highly competitive. We believe that we have many competitive strengths that will enable us to improve our position in markets where we are already well established while we direct additional resources to markets and products with high growth potential.
We compete with: (i) large global full-line equipment manufacturers with a presence in every market and a broad range of products that cover most customer needs, (ii) manufacturers who are product specialists focused on particular industry segments on either a global or
19
regional basis, (iii) regional full-line manufacturers, some of which are expanding worldwide to build a global presence, and (iv) local, low-cost manufacturers in individual markets, particularly in emerging markets such as Eastern Europe, India and China.
Our competitive strengths include well-recognized brands, a full range of competitive products and features, and a strong global presence and distribution and customer service network. There are multiple factors that influence a buyer’s choice of industrial equipment. These factors include the strength and quality of the distribution network, brand loyalty, product features and performance, availability of a full product range, the quality and pricing of products, technological innovations, product availability, financing terms, parts and warranty programs, resale value and customer service and satisfaction. The ability to meet or exceed applicable engine emissions standards as they take effect is also a key competitive factor, particularly in those markets where such standards are the subject of frequent legislative or regulatory scrutiny and change, such as Europe and North America. We continually seek to improve in each of these areas but focus primarily on providing high-quality and high-value products and supporting those products through our dealer networks. Buyers tend to favor brands based on experience with the product and the dealer. Customers’ perceptions of product value in terms of productivity, reliability, resale value and dealer support are formed over many years.
The efficiency of our manufacturing, logistic and scheduling systems are dependent on forecasts of industry volumes and our anticipated share of industry sales, which is predicated on our ability to compete successfully with others in the marketplace. We compete based on product performance, customer service, quality, innovation and price. The environment remains competitive from a pricing standpoint, but actions taken to maintain our competitive position in the current challenging economic environment could result in lower than anticipated price realization.
Our main competitors in the agricultural equipment market are Deere, AGCO, Claas, the Argo Group, the Same Deutz Fahr Group and Kubota
.
Our principal competitors in the construction equipment market are Caterpillar, Komatsu, JCB, Hitachi, Volvo, Liebherr, Doosan, Kubota and Deere.
Our principal competitors in the commercial vehicles market are Daimler; the Traton (previously Volkswagen) Group; Paccar; the Volvo Group; Rosenbauer International AG; Rheinmetall; Oshkosh; Nexter; General Dynamics; BAE Systems; Caterpillar; and Navistar.
The principal competitors of Powertrain include Cummins, Daimler, Deutz, Perkins, Deere, Volvo, and Yanmar.
Products and Markets
Agriculture
Agriculture’s product lines are sold primarily under the Case IH and New Holland brands as well as the STEYR brand in Europe and the Miller brand, primarily in North America and Australia. Certain agricultural equipment products are also sold under the Kongskilde, Överum, and JF brands. To capitalize on customer loyalty to dealers and the segment’s brands, relative distribution strengths and historical brand identities, we sell our agricultural equipment products under the Case IH (and STEYR for tractors in Europe only) and New Holland brands. We believe that these brands enjoy high levels of brand identification and loyalty among both customers and dealers.
Although newer generation tractors have a high percentage of common mechanical components, each brand and product remains differentiated by features, color, interior and exterior styling, warranty terms, technology offering and model designation. Flagship products such as row crop tractors and large combine harvesters may have significantly greater differentiation.
Distinctive features that are specific to a particular brand such as the Supersteer
®
tractor axle or Twin Rotor combine threshing technology for New Holland, the Case IH tracked four-wheel drive tractor, Quadtrac
®
, and the front axle mounted hitch for STEYR remain an important part of each brand’s unique identity.
Agriculture’s product lines include tractors, combine harvesters, hay and forage equipment, seeding and planting equipment, and self-propelled sprayers. Agriculture also specializes in other key market segments like cotton picker packagers and sugar cane harvesters, where Case IH is a worldwide leader, and in self-propelled grape harvesters, where New Holland is a worldwide leader. These brands each offer parts and support services for all of their product lines. Our agricultural equipment is sold with a limited warranty that typically runs from one (1) to three (3) years.
Case IH and New Holland brands enable their customers to share in-depth real-time machine information with AgDNA, FieldView, and Farmers Edge digital management systems. In the fourth quarter of 2018, Agriculture launched AGXTEND
TM
brand, focused exclusively on aftermarket precision farming technology solutions. AGXTEND
TM
will provide our dealers and customers access to exclusive productivity enhancing precision farming technologies.
In 2019, the Company acquired AgDNA, which forms part of CNH Industrial’s long-term roadmap to enhance and extend its precision farming offering, in line with its commitment to delivering increasing digitalization and servitization in agriculture to add value for both customers and shareholders. AgDNA is an industry leading Farm Management Information System (FMIS) that automatically collects and analyzes data from CNH Industrial’s agricultural brands and other third-party agricultural equipment. The cloud-based platform analyzes equipment, agronomic and environmental data to deliver actionable insights directly to producer’s smartphones and tablets to help them maximize the agronomic performance of their CNH Industrial and other equipment and increase farm profitability.
20
Further, the Company's 2019 acquisition of agricultural implement manufacturer K-Line Ag adds key tillage and residue management equipment, which is critical to ensuring optimal seedbed preparation, fundamental to productive yields, and will further enhance the crop production portfolios of Case IH and New Holland Agriculture. K-Line became the number one tillage manufacturer in Australia by designing robust and reliable products for some of the world’s harshest soil conditions. The Speed-Tiller high-speed disk, being offered as a Case IH branded product in North America in 2020, is a dual-season tool that cuts, sizes and incorporates high levels of crop residue, improving soil quality and maximizing crop yields.
In 2019, the Company also acquired ATI, which manufactures track systems for combines and tractors. The combining of CNH Industrial and ATI’s track experience provides a pipeline of track options and designs to maximize power to the ground while maintaining flotation. Beginning in 2020, Case IH will offer the innovative PowerFlex
TM
track systems for both new combine orders and already owned combines to give flexibility to customers. PowerFlex has a fully suspended track system that improves flotation and ride while increasing speeds. ATI also manufactures track systems for the New Holland 4WD tractors.
Construction
Construction’s product lines are sold primarily under the CASE and New Holland Construction brands. CASE provides a wide range of products on a global scale, including crawler excavators that utilize technology from Sumitomo (S.H.I.) Construction Machinery Co. Ltd. and mini-excavators that use technology from Hyundai Construction Equipment, Inc. The New Holland Construction brand family also markets a full product line of construction equipment in Latin America and focusses on light equipment in the other regions.
Construction's products often share common components to achieve economies of scale in manufacturing, purchasing and development. Construction differentiates these products based on the relative product value and volume in areas such as technology, design concept, productivity, product serviceability, color and styling to preserve the unique identity of each brand.
Heavy construction equipment product lines include general construction equipment such as large excavators and wheel loaders, and road building and site preparation equipment such as compactors, graders and dozers. Light construction equipment is also known as compact and service equipment, and its product lines include backhoe loaders, skid steer and tracked loaders, mini- and midi- excavators and compact wheel loaders. The brands each offer parts and support services for all of their product lines. Our construction equipment is generally sold with a limited warranty that typically runs from one (1) to two (2) years.
We continue to evaluate our Construction business with a view toward increasing efficiencies and profitability as well as evaluating its strategic alliances to leverage its position in key markets.
Commercial and Specialty Vehicles
Trucks and Commercial Vehicles (IVECO AND IVECO ASTRA)
Under the IVECO brand, we produce a range of light, medium, and heavy trucks and commercial vehicles for both on-road and off-road use. Our key products include the Daily, a vehicle that covers the 3.5 – 7.2 ton vehicle weight range, the Eurocargo, a vehicle that covers the 6 – 16 tons range, the Trakker, a vehicle dedicated to off-road transport, and the Stralis,
dedicated to on road. In July 2019, Iveco started a process of complete renewal of the heavy product offering with the launch of the S-Way (the new range for long haulage and distribution) and X-Way (dedicated to construction logistics and municipalities); the new T-Way for off road is expected to be introduced in 2020
. The product offering is complemented by a series of aftersales and used vehicle assistance services.
Light vehicles include on-road vans and chassis cabs used for short and medium distance transportation and distribution of goods, and off-road trucks for use in quarries and other work sites. We also offer shuttle vehicles used by public transportation authorities, tourist operators, hotels and sports clubs and campers for holiday travel.
The M&H vehicles product lines include on-road chassis cabs designed for medium and long-distance hauling and distribution. Medium GVW off-road models are typically used for building roads, winter road maintenance, construction, transportation, maintenance of power lines and other installations in off-road areas, civil protection and roadside emergency service. Heavy GVW off-road models are designed to operate in virtually any climate and on any terrain and are typically used to transport construction plant materials, transport and mix concrete, maintain roads in winter and transport exceptionally heavy loads.
We offer ecological diesel and natural gas engines on our entire range of vehicles. We continue to develop engines with specific components and configurations optimized for use with CNG and LNG and we
have developed a comprehensive roadmap for the introduction in the market of a complete range of zero emission vehicles (from Light to Heavy)
.
Under the IVECO ASTRA brand, we build vehicles that can enter otherwise inaccessible quarries and mines and move large quantities of material, such as rock or mud, and perform heavy-duty tasks in extreme climatic conditions. Our product range for IVECO ASTRA includes mining and construction vehicles, rigid and articulated dump trucks and other special vehicles.
On September 3, 2019, CNH Industrial announced a strategic and exclusive Heavy-Duty Truck partnership with Nikola Corporation, a U.S. based leader in fuel cell truck technology. In this context, CNH Industrial made an initial subscription to Nikola's share capital
21
(approximately 2.5% shareholding) through a cash contribution of $50 million and an in-kind contribution of $50 million, granting Nikola access to certain Iveco technology.
Buses (IVECO BUS and Heuliez Bus)
Under the IVECO BUS and Heuliez Bus brands, we offer local and inter-city commuter buses, minibuses, school buses and tourism coaches. IVECO BUS is one of the major European manufacturers in the passenger transport sector and is expanding its activities globally. Heuliez Bus produces city buses for public transportation and is a leader in France for the urban bus market.
Specialty Vehicles (Magirus and Iveco Defence Vehicles)
Under the Magirus brand, we manufacture vehicles designed to respond to natural disasters and civil emergencies, such as fires, floods, earthquakes and explosions. Iveco Defence Vehicles develops and manufactures specialized vehicles for defense missions and civil protection.
Powertrain
Powertrain is dedicated to the design, development, manufacture and sale of engines, transmissions, and axles under the FPT Industrial brand.
Our product range features engines ranging from 2.2 to 20 liters with an output of 42 to 1,006 hp Our product portfolio includes engines for buses and for light, medium and heavy commercial vehicles, engines for industrial machinery including construction, agricultural and irrigation equipment, engines for special-purpose vehicles and engines for power generation units and marine applications.
FPT Industrial’s product line-up is completed by versions that use alternative fuels, including engines that run on natural gas and engines compatible with biodiesel and hydrotreated vegetable oil ("HVO"). With more than 20 years of experience in the research, development and production of natural gas engine technologies for industrial applications, FPT Industrial is an industry leader in this field.
During 2019, FPT Industrial presented different leading engines, such as the N67 Natural Gas specifically designed for off-road applications; the F28, an engine also for the off-road segment designed to be small, productive and environmentally-friendly, with Diesel and Natural Gas versions; and the C16 600 marine engine to support heavy commercial missions in the marine sector. FPT Industrial also presented Red Horizon, its premium integrated marine control system, and developed an innovative propulsion architecture for STEYR’s hybrid tractor concept, which further advanced the Brand’s efforts in E-Powertrain. This architecture consisted of a 4.5-liter engine for battery charging and, for traction, four independent electric motors installed in the wheel hubs.
While meeting the strict emission regulations for both on-road (Euro VI) and off-road vehicles (Stage V and Tier 4B), Powertrain’s technological solutions aim to provide enhanced results in terms of cost, packaging and fuel consumption for each segment of the market.
Additionally, FPT Industrial produces six speed manual transmissions for light commercial vehicles, with input torque up to 500 Nm and completes its product lineup with front and rear axles reaching 32 tons gross axle weight designated to cover Commercial and Specialty Vehicles’ demand, including specialty vehicles (military and fire-fighting).
In the fourth quarter of 2019, CNH Industrial announced its acquisition of Dolphin N2, a startup specializing in innovative combustion engine technology and its partnership with Microvast to develop and offer battery power systems.
Sales and Distribution
Agriculture and Construction
Agriculture sells and distributes products through approximately 2,300 full-line dealers and distributors with over 5,600 points of sale. Construction sells and distributes products through approximately 400 full-line dealers and distributors with over 1,200 points of sale. Agriculture’s and Construction’s dealers are almost all independently owned and operated. Some Agriculture dealers also sell construction equipment. In the United States, Canada, Mexico, most of Western Europe, Brazil, India, China, Russia and Australia, products are generally distributed directly through the independent dealer network. In the rest of the world, products are either sold to independent distributors who then resell to dealers, or to importers who have their own branches to sell product to retail customers. In both cases, the importers/distributors can take advantage of their size and knowledge of the market to minimize their marketing costs.
Consistent with our brand promotion program, we generally seek to have dealers sell a full range of our products. Typically, greater market penetration is achieved where each dealer sells the full line of products from only one of the brands. Although appointing dealers to sell more than one brand is not part of our business model, some joint dealers exist, either for historic reasons or in limited markets where it is not feasible to have a separate dealer for each brand. In some cases, dealerships are operated under common ownership but with separate points of sale for each brand. In each region, we seek to optimize our distribution strategy to reduce structural costs, while maximizing sales and customer satisfaction.
22
In North America and Australia, a trade-in of used equipment typically accompanies the sale of new equipment to end-users. We often provide marketing assistance to our dealers to support the sale of used, trade-in equipment through subsidized financing incentives, inventory carrying cost defrayment, or other methods.
Exclusive, dedicated dealers generally provide a higher level of market penetration. Some dealers may sell complementary products manufactured by other suppliers to complete their product offerings or to satisfy local demand for a particular specialty application or segment.
A strong dealer network with wide geographic coverage is a critical element in the success of Agriculture and Construction. We work to enhance our dealer network through the expansion of our product lines and customer services, including enhanced financial services offerings, and an increased focus on dealer support. To assist dealers in building rewarding relationships with their customers, focused customer satisfaction programs have been introduced and they are expected to incorporate customer input into the relevant product development and service delivery processes.
As the equipment rental business becomes a more significant factor in both the agricultural and construction equipment markets, Agriculture and Construction are continuing to support their dealer network by facilitating sales of equipment to the local, regional and national rental companies through their dealers as well as by encouraging dealers to develop their own rental activities. A strong dealer service network is required to maintain the rental equipment, and to help ensure that the equipment remains at peak performance levels both during its life as rental equipment and afterward when resold into the used equipment market. Agriculture and Construction have launched several programs to support their dealer service and rental operations, including training, improved dealer standards, financing, and advertising. As the rental market is a capital-intensive sector and sensitive to cyclical variations, we expand such activities gradually, with special attention to managing the resale of rental units into the used equipment market by our dealers, who can utilize this opportunity to improve their customer base and generate additional parts business.
We believe that it is generally more cost-effective to distribute our agricultural and construction equipment products through independent dealers, although Agriculture and Construction maintain a limited number of company-owned dealerships in some markets. As of
December 31, 2019
, we operated two and five company-owned Agriculture and Construction dealerships, respectively, primarily in North America and Europe. We also operate a selective dealer development program, in territories with growth potential but underdeveloped representation by our agricultural and construction equipment brands, that typically involves a transfer of ownership to a qualified operator through a buy-out or private investment after a few years.
Commercial and Specialty Vehicles
Commercial and Specialty Vehicles’ worldwide distribution strategy is based on a network of independent dealers, in addition to its own dealerships and branches. As of
December 31, 2019
, Commercial and Specialty Vehicles had approximately 700 dealers globally (of which 22 were directly owned by us and 15 were branches). All of these dealers sell spare parts for the relevant vehicles. Commercial and Specialty Vehicles bolsters its distribution strategy by offering incentives to its dealers based on target achievements for sales of new vehicles and parts and providing high quality aftersales services.
A key element of Commercial and Specialty Vehicles’ growth strategy is its distribution network. In Western Europe, Eastern Europe, Turkey, Russia, Australia and Latin America, continued consolidation of the distribution network is aimed at improving service to customers (such as the implementation of the Truck Stations network of specialized workshops), increasing profitability and reducing overall distribution costs. In Africa and the Middle East, the distribution network is being expanded to fully exploit growth in these markets.
In the U.K., Commercial and Specialty Vehicles is one of the few OEMs that sells trucks and other commercial vehicles to companies which offer commercial vehicle rental solutions, such as Ryder, Fraikin and Burntree, among others.
In accordance with European legislation, Commercial and Specialty Vehicles’ dealers have a specific sales territory. Additionally, European law allows our Commercial and Specialty Vehicles’ dealers to carry multiple brands.
Powertrain
Powertrain provides propulsion solution products for Agriculture, Construction, and Commercial and Specialty Vehicles. Additionally, Powertrain’s commercial strategy and business model are focused on the development of a portfolio of medium-to-large OEM customers. Powertrain has entered into long-term supply agreements with a growing number of third-party customers.
Powertrain has a network of approximately 73 dealers and 800 service points in 100 countries that cover its entire product range and related market sectors. Large OEMs use their own internal networks to obtain parts and services for purchased equipment, while small OEMs frequently rely on us for delivery of parts and services through Powertrain’s worldwide network.
Pricing and Promotion
The retail price of any particular piece of equipment or vehicle is determined by the individual dealer or distributor and generally depends on market conditions, features, options and, potentially, regulatory requirements. Retail sale prices may differ from the manufacturer-
23
suggested list prices. We sell equipment and vehicles to our dealers and distributors at wholesale prices that reflect a discount from the manufacturer-suggested list price. In the ordinary course of business, we engage in promotional campaigns that may include price incentives or preferential financing terms with respect to the purchase of certain products in certain areas.
We regularly advertise our products to the community of farmers, builders, transporters and agricultural and construction contractors, as well as to distributors and dealers in each of our major markets. To reach our target audience, we use a combination of general media, specialized design and trade magazines, the Internet and direct mail. We also regularly participate in major international and national trade shows and engage in co-operative advertising programs with distributors and dealers. The promotion strategy for each brand varies according to the target customers for that brand.
Parts and Services
The quality and timely availability of parts and services are important competitive factors for each of our businesses, as they are significant elements in overall dealer and customer satisfaction and important considerations in a customer’s original equipment purchase decision. We supply parts, many of which are proprietary, to support items in the current product line as well as for products we have sold in the past. In certain markets, we also offer personalized aftersales customer assistance programs that provide a wide range of modular and flexible maintenance and repair contracts, as well as warranty extension services, to meet a variety of customers’ needs and to support the vehicle’s value over time. Many of our products can have economically productive lives of up to 20 years when properly maintained, and each unit has the potential to produce a long-term parts and services revenue stream for us and our dealers.
As of
December 31, 2019
, we operated and administered 46 parts depots worldwide either directly, through a joint venture, or through arrangements with warehouse service providers. This network includes 10 parts depots in North America, 13 in Europe, 3 in South America, and 20 in Rest of World.
The network includes 33 parts depots that support Agriculture, 27 that support Construction, 19 that support Commercial and Specialty Vehicles and 5 that support Powertrain. These depots supply parts to dealers and distributors, which are responsible for sales to retail customers. Our parts depots and parts delivery systems provide customers with access to substantially all the parts required to support our products.
As of
December 31, 2019
, Commercial and Specialty Vehicles had approximately 5,000 Sales and/or Service Network points. In addition to Commercial and Specialty Vehicles' standard one-year full vehicle warranty and two-year powertrain warranty, Commercial and Specialty Vehicles offers personalized aftersales customer assistance programs.
Joint Ventures
As part of a strategy to enter and expand in new markets, we are also involved in several commercial and/or manufacturing joint ventures, including the following:
|
•
|
in Japan, we own 50.0% of New Holland HFT Japan Inc. (“HFT”), which distributes its products in Japan. HFT imports and sells the full range of New Holland agricultural equipment;
|
|
•
|
in Pakistan, we own 43.2% of Al Ghazi Tractors Ltd., which manufactures and distributes New Holland tractors;
|
|
•
|
in Turkey, we own 37.5% of Turk Traktor ve Ziraat Makineleri A.S., which manufactures and distributes various models of both New Holland and Case IH tractors;
|
|
•
|
in Mexico, we own 50.0% of CNH de Mexico S.A. de C.V., which manufactures New Holland agricultural equipment and distributes our agricultural equipment through one or more of its wholly-owned subsidiaries;
|
|
•
|
in China, we own 50.0% of Naveco (Nanjing Iveco Motor Co.) Ltd., a company that manufactures light and other commercial vehicles in China;
|
|
•
|
in China, we control 60.0% of SAIC Fiat Powertrain Hongyan Ltd (“SFH”), a manufacturing company located in Chongqing, which produces diesel engines under license from us to be sold in the Chinese market and to be exported to Europe, the U.S. and Latin America; and
|
|
•
|
in South Africa, we own 60.0% of Iveco South Africa Works (Pty) Ltd., which manufactures medium and heavy-duty commercial vehicles and buses.
|
Suppliers
We purchase materials, parts, and components from third party suppliers. We had approximately 4,175 global direct material suppliers for Industrial Activities at
December 31, 2019
. Our focus on quality improvement, cost reduction, product innovation and production flexibility requires us to rely upon suppliers with a focus on quality, reliability and the ability to provide cost reductions. We view our relationships with suppliers as critical to our operational effectiveness, and in recent years, we have established closer ties with a significantly reduced number of suppliers, selecting those that enjoy a leading position in the relevant markets.
24
Management believes that adequate supplies and alternate sources of our principal raw materials are available and does not believe that the prices of these raw materials are especially volatile at this time.
We rely on numerous suppliers. Certain components and parts used in our products are available from a single supplier and cannot be sourced quickly otherwise. The sudden or unexpected interruption in the availability of certain of our suppliers’ raw materials, parts and components could result in delays in, or increases in the costs of production.
Financial Services
Financial Services offers a range of financial products and services to dealers and customers in the various regions in which it operates. The principal products offered are retail loan and lease financing for the purchase or lease of new and used equipment and vehicles and wholesale financing to dealers and factoring of trade receivables from CNH Industrial companies. Wholesale financing consists primarily of dealer floor plan financing and gives the dealers the ability to maintain a representative inventory of new products. In addition, Financial Services provides financing to dealers for used equipment and vehicles taken in trade, equipment utilized in dealer-owned rental yards, parts inventory, working capital and other financing needs. As a captive finance business, Financial Services is reliant on the operations of Agriculture, Construction, Commercial and Specialty Vehicles and Powertrain, their dealers, and customers.
Financial Services supports the growth of Industrial Activities by developing and structuring financial products with the objective of increasing equipment and vehicle sales as well as profitability and customer loyalty. Financial Services’ strategy is to grow a core financing business to support the sale of our equipment and vehicles while at the same time maintaining its portfolio credit quality, service levels, operational effectiveness and customer satisfaction. Financial Services also offers products to finance third party equipment and vehicles sold through our dealer network or within our core businesses. Financed third party equipment and vehicles include used equipment and vehicles taken in trade on our products or equipment used in conjunction with or attached to our products.
In North America, customer and dealer financing activities, which support the sales of Agriculture and Construction, are managed through our wholly-owned financial services companies.
In Europe, there are two joint ventures that provide customer financing of Agriculture, Construction, and Commercial and Specialty Vehicles, depending on the country of origin. CNH Industrial Capital Europe S.a.S., a joint venture with BNP Paribas Group, is 49.9% owned by CNH Industrial N.V. and accounted for under the equity method. Transolver Finance Establecimiento Financiero de Credito S.A. (“Transolver Finance”), a joint venture with the Santander Group, is 49% owned by CNH Industrial N.V. and accounted for under the equity method. Transolver Finance also provides dealer financing. Additionally, there are vendor programs with banking partners that provide customer financing of Agriculture, Construction, and Commercial and Specialty Vehicles, depending on the country of origin. Customer and dealer financing activities not included in the joint ventures or vendor programs, such as factoring of trade receivables, are managed through our wholly-owned financial services companies.
For South America, customer and dealer financing activities in Brazil, which support the sales of Agriculture, Construction, and Commercial and Specialty Vehicles, are managed through our wholly-owned financial services company, Banco CNH Industrial Capital S.A. (“Banco CNH Industrial Capital”). For customer financing, Banco CNH Industrial Capital mainly serves as intermediary for funding provided by BNDES, a federally-owned financial institution linked to the Brazilian Ministry of Development, Industry and Foreign Trade. In Argentina, customer and dealer financing activities, which support the sales of Agriculture, Construction, and Commercial and Specialty Vehicles, are managed through a wholly-owned financial services company. Vendor programs with banking partners are also in place in Argentina.
For Rest of World, customer and dealer financing activities in Australia and India, which support the sales of Agriculture, Construction, and Commercial and Specialty Vehicles, are managed through wholly-owned financial services companies. In China and Russia, dealer financing activities are managed through wholly-owned financial services companies.
Customer Financing
Financial Services has certain retail underwriting and portfolio management policies and procedures that are specific to Agriculture, Construction, and Commercial and Specialty Vehicles. This distinction allows Financial Services to reduce risk by deploying industry-specific expertise in each of these businesses. We provide retail financial products primarily through our dealers, who are trained in the use of the various financial products. Dedicated credit analysis teams perform retail credit underwriting. The terms for financing equipment and vehicle retail sales typically provide for retention of a security interest in the equipment or vehicles financed.
Financial Services’ guidelines for minimum down payments for equipment and vehicles generally range from 5% to 30% of the actual sales price, depending on equipment types, repayment terms and customer credit quality. Finance charges are sometimes waived for specified periods or reduced on certain equipment sold or leased in advance of the season of use or in connection with other sales promotions. For periods during which finance charges are waived or reduced on the retail notes or leases, Financial Services generally receives compensation from the applicable Industrial Activities segment based on Financial Services’ estimated costs and a targeted return on equity. The cost is recognized as a reduction in net sales for the applicable Industrial Activities segment.
25
Dealer Financing
Financial Services provides wholesale floor plan financing for nearly all our dealers, which allows them to acquire and maintain a representative inventory of products. Financial Services also provides financing to dealers for used equipment taken in trade, equipment utilized in dealer-owned rental yards, parts inventory, working capital and other financing needs. For floor plan financing, Financial Services generally provides a fixed period of “interest free” financing to the dealers. This practice helps to level fluctuations in factory demand and provides a buffer from the impact of sales seasonality. During the “interest-free” period, the applicable Industrial Activities segment compensates Financial Services based on Financial Services’ estimated costs and a targeted return on equity.
After the expiration of any “interest-free” period, interest is charged to dealers on outstanding balances until Financial Services receives payment in full.
The cost is recognized as a reduction in net sales for the applicable Industrial Activities segment.
A wholesale underwriting group reviews dealer financial information and payment performance to establish credit lines for each dealer. In setting these credit lines, Financial Services seeks to meet the reasonable requirements of each dealer while managing its exposure to any one dealer. The credit lines are secured by the equipment or vehicles financed. Dealer credit agreements generally include a requirement to repay the particular financing at the time of the retail sale of the unit.
Financial Services leverages employees, third party contractors and new digital technologies like “geo-fencing” to conduct periodic stock audits at each dealership to confirm that the financed equipment or vehicle is maintained in inventory.
These audits are unannounced, and their frequency varies by dealer and depends on the dealer’s financial strength, payment history and prior performance.
Factoring
Financial Services also provides intragroup factoring of trade and other receivables. This activity involves the purchase (without recourse) of receivables of CNH Industrial companies, originating from the different Industrial Activities segments, and due from third or related parties.
Sources of Funding
The long-term profitability of Financial Services’ activities largely depends on the cyclical nature of the industries in which we operate, interest rate volatility and the ability to access funding on competitive terms. Financial Services funds its operations and lending activity through a combination of term receivable securitizations, committed secured and unsecured facilities, uncommitted lines of credit, unsecured bonds, unsecured commercial paper, affiliated financing and retained earnings. Financial Services’ current funding strategy is to maintain sufficient liquidity and flexible access to a wide variety of financial instruments and funding options.
Financial Services has periodically accessed the asset-backed securitization (“ABS”) markets in the United States, Canada, and Australia, as part of its retail and wholesale financing programs when those markets offer funding opportunities on competitive terms.
Financial Services has also accessed the unsecured bond market in the United States, Brazil and Australia and commercial paper market in the United States and France to add more diversity to its funding structure
.
Financial Services’ ability to access these markets will depend, in part, upon general economic conditions and Financial Services’ financial condition and portfolio performance. These factors can be negatively affected by cyclical swings in the industries in which we operate.
Competition
The financial services industry is highly competitive. Financial Services competes primarily with banks, equipment finance and leasing companies and other financial institutions. Typically, this competition is based upon the financial products and services offered, customer service, financial terms and interest rates charged. Financial Services’ ability to compete successfully depends upon, among other things, the availability and competitiveness of funding resources, the development of competitive financial products and services, and licensing or other governmental regulations.
Legal Proceedings
As a global company with a diverse business portfolio, we are exposed to numerous legal risks, including dealer and supplier litigation, intellectual property right disputes, product warranty and defective product claims, product performance, asbestos, personal injury, emissions and/or fuel economy regulatory and contractual issues and environmental claims that arise in the ordinary course of our business. The most significant of these matters are described in
“Note 14: Commitments and Contingencies” to our Consolidated Financial Statements for the year ended
December 31, 2019
.
The outcome of any current or future proceedings, claims or investigations cannot be predicted with certainty. Adverse decisions in one or more of these proceedings, claims or investigations could require CNH Industrial to pay substantial damages, or undertake service actions, recall campaigns or other costly actions. It is therefore possible that legal judgments could give rise to expenses that are not covered, or not fully covered, by insurers’ compensation payments and could affect our financial position and results of operations.
26
Although the ultimate outcome of legal matters pending against us and our subsidiaries cannot be predicted, management believes the reasonable possible range of losses for these unresolved legal actions in addition to the amounts accrued would not have a material effect on our Consolidated Financial Statements.
Follow-up on Damages Claims:
Iveco S.p.A., the Company’s wholly owned subsidiary, and its competitors were subject to an investigation by the European Commission (the “Commission”) into certain business practices in the European Union in relation to M&H trucks. On July 19, 2016, the Commission announced a settlement with Iveco. Following the settlement,
the Company
has been named as defendant in private litigation commenced in various European jurisdictions and Israel by customers and other third parties, either acting individually or as part of a wider group or class of claimants. These claims remain at an early stage. Further, on the basis of the letters issued by a significant number of customers indicating that they may commence proceedings in the future,
CNH Industrial
expects to face further claims based on the same legal grounds in the same and various other jurisdictions. The extent and outcome of these claims cannot be predicted at this time.
Insurance
We maintain insurance with third party insurers to cover various risks arising from our business activities including, but not limited to, risk of loss or damage to our assets or facilities, business interruption losses, general liability, automobile liability, product liability and directors' and officers' liability insurance. We believe that we maintain insurance coverage that is customary in our industry. We use a broker that is a subsidiary of Fiat Chrysler Automobiles N.V. to place a portion of our insurance coverage.
C.
Organizational Structure
As of
December 31, 2019
, CNH Industrial had 167 consolidated subsidiaries. A listing of our subsidiaries as of
December 31, 2019
, including the country of incorporation or residence, proportion of ownership interest and proportion of voting power held, is set forth in an Exhibit 8.1 to this annual report on Form 20-F.
The following table sets forth a list of the principal subsidiaries that are directly or indirectly controlled by CNH Industrial. For each principal subsidiary, the following information is provided: name, country of incorporation or residence, and the percentage interest held by CNH Industrial and its subsidiaries at
December 31, 2019
.
Principal Subsidiaries at
December 31, 2019
:
|
Name of Subsidiary
|
Country of Incorporation
|
Percentage Interest Held
|
|||
|
Banco CNH Industrial Capital S.A.
|
Brazil
|
100%
|
|||
|
Case Credit Holdings Limited
|
United States (Delaware)
|
100%
|
|||
|
Case New Holland Industrial Inc.
|
United States (Delaware)
|
100%
|
|||
|
CNH Industrial America LLC
|
United States (Delaware)
|
100%
|
|||
|
CNH Industrial U.S. Holdings Inc.
|
United States (Delaware)
|
100%
|
|||
|
CNH Industrial Brasil Ltda.
|
Brazil
|
100%
|
|||
|
CNH Industrial Capital Limited
|
United Kingdom
|
100%
|
|||
|
CNH Industrial Capital LLC
|
United States (Delaware)
|
100%
|
|||
|
CNH Industrial Capital America LLC
|
United States (Delaware)
|
100%
|
|||
|
CNH Capital Receivables LLC
|
United States (Delaware)
|
100%
|
|||
|
CNH Industrial Capital Canada Ltd.
|
Canada
|
100%
|
|||
|
CNH Industrial Capital Solutions S.p.A.
|
Italy
|
100%
|
|||
|
CNH Industrial Finance Europe S.A.
|
Luxembourg
|
100%
|
|||
|
CNH Industrial Finance S.p.A.
|
Italy
|
100%
|
|||
|
CNHI International S.A.
|
Switzerland
|
100%
|
|||
|
FPT Industrial S.p.A.
|
Italy
|
100%
|
|||
|
Iveco S.p.A.
|
Italy
|
100%
|
|||
|
Iveco Espana S.L.
|
Spain
|
100%
|
|||
|
Iveco France SAS
|
France
|
100%
|
|||
27
D.
Property, Plant and Equipment
As of
December 31, 2019
, we owned 67 manufacturing facilities. We also own other significant properties including spare parts depots, research laboratories, test tracks, warehouses and office buildings.
We make capital expenditures in the regions in which we operate principally related to initiatives to introduce new products, enhance manufacturing efficiency and improve capacity, and for maintenance and engineering. In
2019
, our total capital expenditures in long-lived assets, excluding assets sold with buy-back commitments and equipment on operating leases, were
$637 million
of which 15% was spent in North America, 7% in South America, 72% in Europe and 6% in Rest of World.
These capital expenditures were funded through a combination of cash generated from operating activities and borrowings under short-term facilities. In
2018
, our total capital expenditures were
$558 million
. The increased capital expenditures in
2019
from
2018
is related to our investment cycles, particularly for product enhancements, and primarily to our efforts on sustainability programs which include investments in digitalization, alternative propulsion, and automation.
The following table provides information about our manufacturing and engineering facilities as of
December 31, 2019
:
|
Location
|
Primary Functions
|
Approximate
Covered Area (Sqm/ 000) |
|||
|
Italy
|
|||||
|
Modena
|
Components (Agriculture and Construction)
|
102
|
|
||
|
S. Matteo
|
R&D center (Agriculture)
|
51
|
|
||
|
Jesi
|
Tractors
|
77
|
|
||
|
Lecce
|
Wheel loaders, compact track loaders, telehandlers; graders; R&D center
|
130
|
|
||
|
Piacenza
|
Quarry and construction vehicles; R&D center
|
64
|
|
||
|
Brescia
|
Medium vehicles, cabs, chassis; R&D center
|
276
|
|
||
|
Suzzara
|
Light vehicles; R&D center
|
170
|
|
||
|
Brescia
|
Firefighting vehicles; R&D center
|
28
|
|
||
|
Bolzano
|
Defense vehicles; R&D center
|
83
|
|
||
|
Torino
|
R&D center (Commercial and Specialty Vehicles)
|
41
|
|
||
|
Torino
|
R&D center (Powertrain)
|
28
|
|
||
|
Torino
|
Engines (marine & powertrain)
|
142
|
|
||
|
Torino
|
Transmissions and axles
|
239
|
|
||
|
Foggia
|
Engines; drive shafts; R&D center
|
151
|
|
||
|
Pregnana Milanese
|
Engines
|
31
|
|
||
|
S. Mauro
|
Excavators; R&D center
|
57
|
|
||
|
United States
|
|||||
|
New Holland
|
Hay & Forage; R&D center
|
104
|
|
||
|
Grand Island
|
Tractors and combines
|
128
|
|
||
|
Benson
|
Sprayers, cotton pickers; R&D center
|
41
|
|
||
|
Burlington
|
Backhoe loaders, forklift trucks; R&D center
|
91
|
|
||
|
Fargo
|
Tractors, wheeled loaders; R&D center
|
88
|
|
||
|
Goodfield
|
Soil management equipment; R&D center
|
39
|
|
||
|
Racine
|
Tractors, transmissions
|
105
|
|
||
|
Mt. Joy
|
R&D center (Agriculture)
|
11
|
|
||
|
Wichita
|
Skid steer loaders; R&D center
|
46
|
|
||
|
Burr Ridge (Hinsdale)
|
R&D center (Agriculture, Construction and Diesel engines)
|
44
|
|
||
|
St. Nazianz
|
Self-propelled sprayers
|
24
|
|
||
|
Mt. Vernon
|
Tracks
|
7
|
|
||
|
France
|
|||||
|
Coex
|
Grape Harvesters; R&D center
|
26
|
|
||
|
Croix
|
Cabins (Agriculture)
|
12
|
|
||
28
|
Tracy-Le-Mont
|
Hydraulic cylinders (Agriculture and Construction)
|
16
|
|
||
|
Annonay
|
Buses (Coaches & City); R&D center
|
114
|
|
||
|
Venissieux
|
R&D center (Commercial and Specialty Vehicles)
|
18
|
|
||
|
Rorthais
|
Buses (City); R&D center
|
29
|
|
||
|
Fourchambault
|
Engines (remanufacturing)
|
29
|
|
||
|
Bourbon Lancy
|
Engines; R&D center
|
107
|
|
||
|
Fecamp
|
Engines (power generation units)
|
16
|
|
||
|
Brazil
|
|||||
|
Belo Horizonte
|
Crawler excavators, crawler dozers, wheel loaders, graders, backhoe loaders; R&D center
|
70
|
|
||
|
Curitiba
|
Combines and tractors; R&D center
|
103
|
|
||
|
Piracicaba
|
Sugar cane harvesters, coffee harvesters, sprayers; R&D center
|
21
|
|
||
|
Sorocaba
|
Combines and other Agriculture; R&D center
|
160
|
|
||
|
Sete Lagoas
|
Heavy, medium and light vehicles; R&D center
|
100
|
|
||
|
Sete Lagoas
|
Defense vehicles
|
19
|
|
||
|
Sete Lagoas
|
Engines; R&D center
|
14
|
|
||
|
Germany
|
|||||
|
Ulm
|
Firefighting vehicles; R&D center
|
35
|
|
||
|
Ulm
|
R&D center (Commercial and Specialty Vehicles)
|
144
|
|
||
|
China
|
|||||
|
Harbin
|
Combines, tractors, balers; R&D center
|
121
|
|
||
|
Chongqing
|
Engine; R&D centers
|
76
|
|
||
|
Urumqi
|
Cotton pickers
|
10
|
|
||
|
Argentina
|
|||||
|
Cordoba
|
Engines
|
20
|
|
||
|
Cordoba
|
(Medium/Heavy) Trucks and buses; R&D center
|
94
|
|
||
|
Cordoba
|
Tractors and combines
|
30
|
|
||
|
Belgium
|
|||||
|
Antwerp
|
Components (Agriculture)
|
77
|
|
||
|
Zedelgem
|
Combines, forage harvesters and balers; R&D center
|
154
|
|
||
|
Spain
|
|||||
|
Madrid
|
Heavy vehicles; R&D center
|
134
|
|
||
|
Valladolid
|
Light vehicles, heavy cab components
|
81
|
|
||
|
India
|
|||||
|
Pithampur
|
Backhoe loaders, earth compactors; R&D center
|
29
|
|
||
|
Pune
|
Sugar cane harvesters and combines; R&D center
|
77
|
|
||
|
Noida
|
Tractors; R&D center
|
82
|
|
||
|
Poland
|
|||||
|
Plock
|
Combines, balers and headers; R&D center
|
129
|
|
||
|
Kutno
|
Row crop, cultivators, harvesters; R&D center
|
33
|
|
||
|
Australia
|
|||||
|
Dandenong
|
Trucks (heavy); R&D center
|
42
|
|
||
|
Cowra
|
Tillage; R&D center
|
5
|
|
||
|
Others
|
|||||
|
Basildon (U.K.)
|
Tractors; R&D center
|
129
|
|
||
|
Överum (Sweden)
|
Ploughs; R&D center
|
49
|
|
||
|
Saskatoon (Canada)
|
Sprayers, seeders; R&D center
|
61
|
|
||
|
St. Valentin (Austria)
|
Tractors; R&D center
|
53
|
|
||
29
|
Vysoke Myto (Czech Republic)
|
Buses (City & Intercity); R&D center
|
125
|
|
||
|
Queretaro (Mexico)
|
Components (Agriculture and Construction)
|
15
|
|
||
|
Naberezhnye Chelny (Russia)
|
Tractors and combines
|
50
|
|
||
|
Rosslyn (South Africa)
|
Trucks and buses (Intercity); R&D center
|
55
|
|
||
|
Arbon (Switzerland)
|
R&D center (Powertrain)
|
6
|
|
||
Environmental and Other Regulatory Matters
We engineer, manufacture and sell our products and offer our services around the world, subject to requirements applicable to our products that relate to vehicle emissions, product safety and fuel efficiency as well as those applicable to our manufacturing facilities that relate to stack emissions, treatment of waste, water and hazardous materials, prohibitions on soil contamination and worker health and safety. These extensive regional, national and local laws and regulations often impact the development of our products, including, but not limited to, required compliance with air emissions standards applicable to engines. We have made, and expect that we may make additional, significant capital and research and development expenditures to comply with these standards now and in the future.
We are conducting environmental investigatory or remedial activities at certain properties that are currently or were formerly, owned and/or operated by us, or which are being decommissioned. We believe that the outcome of these activities will not have a material adverse effect on our business, financial position or results of operations.
Our operations and the activities of our employees, contractors and agents around the world are also subject to the laws and regulations of numerous countries, including the United States. These laws and regulations include data privacy requirements, labor relations laws, tax laws, antitrust regulations, prohibitions on payments to governmental officials, federal and state environmental regulations, import and trade restrictions and export requirements. Any such violations could also result in prohibitions on our ability to offer our products and services in one or more countries and could have a material adverse effect on our business, results of operations and financial condition.
Our operations (particularly in those countries with developing economies) are also subject to risks of violations of laws prohibiting improper payments and bribery, including the U.S. Foreign Corrupt Practices Act and the U.K. Bribery Act as well as a range of national anti-corruption and antitrust or competition laws that apply to conduct in a particular jurisdiction. We have implemented a program to promote compliance with these laws and to reduce the likelihood of potential violations. Our compliance program, however, may not in every instance protect us from acts committed by our employees, agents, contractors, or collaborators that may violate the applicable laws or regulations of the jurisdictions in which we operate. Such improper actions could subject us to civil or criminal investigations and monetary, injunctive and other penalties as well as damage claims.
For further information, see “Note 14: Commitments and Contingencies” to our consolidated financial statements for the year ended
December 31, 2019
as well as “Item 3. Key Information—D. Risk Factors—Risks Related to Our Business, Strategy and Operations—Costs of ongoing compliance with, or failure to comply with, increasingly stringent environmental, health and safety laws could have an adverse effect on our results of operations”; “Item 3. Key Information—D. Risk Factors—Risks Related to Our Business, Strategy and Operations—We are subject to extensive anti-corruption and antitrust laws and regulations”; “Item 3. Key Information—D. Risk Factors—Risks Related to Our Business, Strategy and Operations—Changes in privacy laws could disrupt our business”; “Item 3. Key Information—D. Risk Factors—Risks Related to Our Business, Strategy and Operations—We face risk associated with employment relationships” and “Item 3. Key Information—D. Risk Factors—Risks Related to Our Business, Strategy and Operations—International trade policies may impact demand for our products and our competitive position”.
|
Item 4A.
|
Unresolved Staff Comments
|
None.
|
Item 5.
|
Operating and Financial Review and Prospects
|
The discussion in “Item 5. Operating and Financial Review and Prospects” should be read in conjunction with our consolidated financial statements for the years ended
December 31, 2019
,
2018
and
2017
.
The results presented in this annual report are prepared with the U.S. dollar as the reporting currency and in accordance with U.S. GAAP.
2017 figures included in the following section have been recast following the retrospective adoption, on January 1, 2018, of the updated accounting standard for revenue recognition (ASC 606), retirement benefit accounting (ASU 2017-07) and statement of cash flows - restricted cash (ASU 2016-18).
30
This discussion includes forward-looking statements, which, although based on assumptions that we consider reasonable, are subject to risks and uncertainties which could cause actual events or conditions to differ materially from those expressed or implied by the forward-looking statements. See “Item 5.G Safe Harbor Statement under the Private Securities Litigation Reform Act of 1995.” and “Item 3. Key Information—D. Risk Factors” for a discussion of risks and uncertainties facing us.
Overview
We are a leading global capital goods company engaged in the design, production, marketing, sale and financing of agricultural equipment, construction equipment, trucks, commercial vehicles, buses and specialty vehicles for firefighting, defense and civil protection, as well as engines, transmissions and axles for those equipment and vehicles and engines for marine and power generation applications.
The Company’s segments consist of: (i) Agriculture (ii) Construction, (iii) Commercial and Specialty Vehicles, (iv) Powertrain, and (v) Financial Services. Our Industrial Activities include Agriculture, Construction, Commercial and Specialty Vehicles, and Powertrain, as well as corporate functions.
We generate revenues and cash flows principally from the sale of equipment and vehicles to dealers and distributors. Financial Services provides a range of financial products focused on financing the sale and lease of equipment and vehicles by our dealers and their customers.
Revenues of Industrial Activities are presented net of discounts, allowances, settlement discounts and rebates, as well as costs for sales incentive programs, determined on the basis of historical costs, country by country, and charged against profit for the period in which the corresponding sales are recognized. Our sales incentive programs include the granting of retail financing at discounts to market interest rates. The corresponding cost to Industrial Activities is recognized at the time of the initial sale and the revenues of Financial Services are recognized on a pro rata basis in order to match the cost of funding.
Principal Factors Affecting Results
Our operating performance is highly correlated to sales volumes, which are influenced by several different factors that vary across our segments.
For Agriculture, the key factors influencing sales are the level of net farm income which is influenced by commodity prices, and, to a lesser extent, general economic conditions, interest rates and the availability of financing and related subsidy programs. Variations by region and product are also attributable to differences in typical climate and farming calendars, as well as extraordinary weather conditions. For additional discussion regarding the principal factors affecting results for Agriculture, see “Item 4. Information on the Company—B. Business Overview—Industry Overview—Agriculture.”
For Construction, segmentation varies by regional market: in developed markets, demand is oriented toward more sophisticated machines that increase operator productivity, while in developing markets, demand is oriented toward more utilitarian models with greater perceived durability. Sales levels for heavy construction equipment are particularly dependent on the expected level of major infrastructure construction and repair projects, which is a function of expected economic growth and government spending. For light construction equipment, the principal factor influencing demand is the level of residential and commercial construction, remodeling and renovation, which is influenced in turn by interest rates and availability of financing, as well as, in the residential sector, levels of disposable income and, in the commercial sector, the broader economic cycle. For additional discussion regarding the principal factors affecting results for Construction, see “Item 4. Information on the Company—B. Business Overview—Industry Overview—Construction.”
Regional variations in demand for Commercial and Specialty Vehicles are influenced by differences in economic conditions, levels of infrastructure development and physical geography, all of which lead to differing transport requirements. Demand for medium and heavy trucks tends to be closely aligned with the economic and capital investment cycle including the general level of interest rates and, in certain countries, governmental subsidy programs, particularly in more developed markets. In developing countries, the processes of industrialization and infrastructure development generally drive long-term growth trends. In the short term, however, demand for light vehicles is closely correlated to the level of economic activity which drives levels of vehicle utilization and, accordingly, the need for new vehicles. For additional discussion regarding the principal factors affecting results for Commercial and Specialty Vehicles, see “Item 4. Information on the Company—B. Business Overview—Industry Overview—Commercial and Specialty Vehicles.”
Powertrain is highly dependent on the market segments in which its propulsion systems are used, with developments in engine emissions regulations playing a significant role. For vehicle applications, product development is driven by regulatory considerations, as well as the need of customers to reduce operating costs. For additional discussion regarding the principal factors affecting results for Powertrain, see “Item 4. Information on the Company—B. Business Overview—Industry Overview—Powertrain.”
31
Demand for services and service-related products, including parts, is a function of the nature and extent of the use of the related agricultural and construction equipment or commercial and specialty vehicles. The after-sales market is historically less volatile than the new market and, therefore, helps reduce the impact on operating results of fluctuations in new sales.
Our segments (or our principal businesses) have a different geographic mix. As a result, the performance of Agriculture and Construction correlates more closely to the U.S. economic cycle, while the performance of Commercial and Specialty Vehicles is more directly tied to the European economic cycle.
Our cost base principally comprises the cost of raw materials and personnel costs.
Raw material costs are closely linked to commodities markets and largely outside of our control, although we are making a targeted effort to increase production efficiencies. Historically, we have been able to pass on to our customers most of the increase in the cost of raw materials through increases in product pricing. Nevertheless, even when we are able to do so, there is usually a time lag between an increase in materials cost and a realized increase in product prices and, accordingly, our results are typically adversely affected at least in the short term until price increases are accepted in the market.
Personnel costs change over time and are impacted by the terms of collective bargaining agreements, inflation and average number of employees. A significant proportion of our employees are based in countries where labor laws impose significant restrictions on employers’ rights and, accordingly, we have limited ability to downsize our personnel in response to a decrease in production during periods of market downturn.
Our results are also affected by changes in foreign exchange rates from period to period, mainly due to the difference in geographic distribution between our manufacturing activities and our commercial activities, resulting in cash flows from exports denominated in currencies that differ from those associated with production costs. In addition, our consolidated financial statements are expressed in U.S. dollars and are therefore subject to movements in exchange rates upon translation of the financial statements of subsidiaries whose functional currency is not the U.S. dollar. Generally, a strengthening of the euro against the U.S. dollar has a positive translation impact on the consolidated revenues of CNH Industrial because a significant portion arise from European operations, particularly the operations of Agriculture, Commercial and Specialty Vehicles and Powertrain. However, the positive translation impact on revenue is significantly offset by the negative exchange transaction impact on costs since purchases are predominantly denominated in euro for our worldwide operations. The reverse impact to revenues and cost occurs with a weakening of the euro against the U.S. dollar. For additional information regarding the effect on us of changes in interest rates and exchange rates, see “Item 3. Key Information—D. Risk Factors—Risks Related to Our Business, Strategy and Operations—We are subject to exchange rate fluctuations, interest rate changes and other market risks.”
Finally, our results may be materially affected, directly or indirectly, by governmental policies, including monetary and fiscal policies and policies on international trade and investment. For additional information regarding the effect on us of governmental policies, see “Item 3. Key Information-D. Risk Factors-Risks Related to Our Business, Strategy and Operations-Changes in government monetary or fiscal policies may negatively impact our results.” and “Item 3. Key Information-D. Risk Factors-Risks Related to Our Business, Strategy and Operations-International trade policies may impact demand for our products and our competitive position.”
Non-GAAP Financial Measures
We monitor our operations through the use of several non-GAAP financial measures. We believe that these non-GAAP financial measures provide useful and relevant information regarding our operating results and enhance the reader’s ability to assess our financial performance and financial position. These measures facilitate management’s ability to identify operational trends, as well as make decisions regarding future spending, resource allocations and other operational decisions as they provide additional transparency with respect to our core operations. These financial measures have no standardized meaning under U.S. GAAP and are unlikely to be comparable to other similarly titled measures used by other companies and are not intended to be substitutes for measures of financial performance and financial position as prepared in accordance with U.S. GAAP.
As of
December 31, 2019
, our primary non-GAAP financial measures are defined as follows:
Adjusted EBIT
Adjusted EBIT is defined as net income (loss) before income taxes, interest expenses of Industrial Activities, net, restructuring expenses, the finance and non-service component of pension and other post-employment costs, foreign exchange gains/(losses) and certain non-recurring items. In particular, non-recurring items are specifically disclosed items that management considers to be rare or discrete events that are infrequent in nature and not reflective of on-going operational activities. We provide a reconciliation of Net Income (Loss), the most directly comparable U.S. GAAP financial measure included in our consolidated statements of operations, to Adjusted EBIT.
32
Adjusted EBITDA
Adjusted EBITDA is defined as Adjusted EBIT plus depreciation and amortization including on assets sold under operating leases and assets sold under buy-back commitments. We provide a reconciliation of Net Income (Loss), the most directly comparable U.S. GAAP financial measure included in our consolidated statements of operations, to Adjusted EBITDA.
Net Debt and Net Debt of Industrial Activities (or Net Industrial Debt)
Net Debt is defined as total debt less intersegment notes receivable, cash and cash equivalents, restricted cash, other current financial assets, and derivative hedging debt. We provide a reconciliation of Net Debt to Total Debt, which is the most directly comparable measure included in our consolidated balance sheets. Due to different sources of cash flows used for the repayment of the debt between Industrial Activities and Financial Services (by cash from operations for Industrial Activities and by collection of financing receivables for Financial Services), management separately evaluates the cash flow performance of Industrial Activities using the Net Debt of Industrial Activities.
Revenues on a Constant Currency Basis
We discuss the fluctuations in revenues on a constant currency basis by applying the prior-year average exchange rates to current year’s revenue expressed in local currency in order to eliminate the impact of foreign exchange (“FX”) rate fluctuations.
Free Cash Flow of Industrial Activities
Free Cash Flow of Industrial Activities (or Industrial Free Cash Flow): refers to Industrial Activities, only, and is computed as consolidated cash flow from operating activities less: cash flow from operating activities of Financial Services; investments of Industrial Activities in assets sold under buy-back commitments, assets under operating leases, property, plant and equipment and intangible assets; change in derivatives hedging debt of Industrial Activities; as well as other changes and intersegment eliminations. We provide a reconciliation of Net cash provided by (used in) Operating Activities, the most directly comparable U.S. GAAP financial measure included in our consolidated statements of cash flows, to Free Cash Flow of Industrial Activities.
A
. Operating Results
The operations and key financial measures and financial analysis differ significantly for manufacturing and distribution businesses and financial services businesses; therefore, management believes that certain supplemental disclosures are important in understanding our consolidated operations and financial results. For further information, see “Note 22: Supplemental Information” to our consolidated financial statements for the year ended
December 31, 2019
, where we present supplemental consolidating data split by Industrial Activities and Financial Services. Industrial Activities include the Financial Services business on the equity basis of accounting. Transactions between Industrial Activities and Financial Services have been eliminated to arrive at the consolidated data.
Planned Spin-off of On-Highway Business
On September 3, 2019, the Company announced its intention to separate its "On-Highway" (commercial vehicles and powertrain) and "Off-Highway" (agriculture, construction and specialty vehicles) businesses. The separation is expected to be effected through the spin-off of CNH Industrial N.V.’s equity interest in the "On-Highway" business to CNH Industrial N.V. shareholders. The proposed spin-off is expected to be completed in early 2021, subject to approval at an Extraordinary General Meeting of shareholders. In order to preserve the operational effectiveness of the Off-Highway business, the Company intends to enter into a long-term supply agreement on Powertrain-related components. Additionally, the Company expects to guarantee continuous financial services support to both entities as a clear competitive advantage in tailoring the financial product offering to our customers needs.
33
2019
Compared to
2018
Consolidated Results of Operations
|
2019
|
2018
|
|||||||
|
(in millions)
|
||||||||
|
Revenues:
|
||||||||
|
Net sales
|
$
|
26,149
|
|
$
|
27,831
|
|
||
|
Finance, interest and other income
|
1,930
|
|
1,875
|
|
||||
|
Total Revenues
|
28,079
|
|
29,706
|
|
||||
|
Costs and Expenses:
|
||||||||
|
Cost of goods sold
|
21,832
|
|
22,958
|
|
||||
|
Selling, general and administrative expenses
|
2,216
|
|
2,351
|
|
||||
|
Research and development expenses
|
1,030
|
|
1,061
|
|
||||
|
Restructuring expenses
|
109
|
|
61
|
|
||||
|
Interest expense
|
798
|
|
812
|
|
||||
|
Other, net
|
924
|
|
997
|
|
||||
|
Total Costs and Expenses
|
26,909
|
|
28,240
|
|
||||
|
Income (loss) before income taxes and equity in income of
unconsolidated subsidiaries and affiliates
|
1,170
|
|
1,466
|
|
||||
|
Income taxes
|
271
|
|
(417
|
)
|
||||
|
Equity in income of unconsolidated subsidiaries and
affiliates
|
13
|
|
50
|
|
||||
|
Net income (loss)
|
1,454
|
|
1,099
|
|
||||
|
Net income attributable to noncontrolling interests
|
32
|
|
31
|
|
||||
|
Net income (loss) attributable to CNH Industrial N.V.
|
$
|
1,422
|
|
$
|
1,068
|
|
||
Revenues
We recorded revenues of
$28,079 million
in
2019
, a
decrease
of
5.5%
(
down
1.7%
on a constant currency basis) compared to
2018
. This decrease is primarily due to a decrease of 6.0% (a decrease of 2.1% on a constant currency basis) compared to the prior year in net sales of Industrial Activities.
Cost of Goods Sold
Cost of goods sold were
$21,832 million
in
2019
compared with
$22,958 million
in
2018
, a decrease of
4.9%
year over year due to the decrease in net sales, partially offset by higher product costs as a result of increased raw material costs and tariffs. In 2019, cost of goods sold also includes asset optimization charges of $165 million due to actions included in the “Transform2Win” strategy. As a percentage of net sales of Industrial Activities, cost of goods sold was
83.5%
in
2019
compared with
82.5%
in
2018
.
Selling, General and Administrative Expenses
SG&A expenses amounted to
$2,216 million
in
2019
(
7.9%
of revenues) compared to
$2,351 million
in
2018
(
7.9%
of revenues).
Research and Development Expenses
In
2019
, R&D expenses were
$1,030 million
compared to
$1,061 million
in
2018
. The expense in both years was primarily attributable to spending on engine development costs associated with emission requirements and continued investment in new products.
34
Restructuring Expenses
The Company incurred restructuring costs of
$109 million
and
$61 million
for the years ended
December 31, 2019
and
2018
, respectively. The current year expenses were primarily attributable to actions taken by CNH Industrial in the context of the "Transform2Win" strategy announced on September 3, 2019. Restructuring costs recognized in the period primarily relate to asset write-offs related to the closure of two plants and other activities related to the previously announced launch of a new organization structure focused on operating segments.
Interest Expense
Interest expense was
$798 million
in
2019
compared to
$812 million
in
2018
. The interest expense attributable to Industrial Activities, net of interest income and eliminations, was
$282 million
in
2019
compared to
$368 million
in
2018
, a decrease of
$86 million
over
2018
. The decrease was primarily attributable to the refinancing and early retirement of certain high-yield debt, as well as lower average indebtedness. In 2019, interest expense included a charge of $27 million related to the repurchase of of €380 million (equivalent to $420 million) in aggregate of certain outstanding CNH Industrial Finance Europe S.A. notes. In
2018
interest expense included a charge of
$22 million
related to the repurchase of a portion of the CNH Industrial Finance Europe S.A.
2.875%
Note.
Other, net
Other, net expenses were
$924 million
and included a pre-tax gain of
$119 million
($90 million net of tax impact) as a result of the Benefit Modification Amortization over approximately
4.5 years of
the
$527 million
positive impact from the 2018 U.S. healthcare plan modification, a $116 million pre-tax non-cash settlement charge ($88 million net of tax impact) resulting from the purchase of a group annuity contract to settle a portion of the outstanding U.S. pension obligations, and foreign exchange losses of
$56 million
. In
2018
, Other, net expenses were
$997 million
and included a pre-tax gain of
$80 million
due to the above-mentioned Benefit Modification Amortization and foreign exchange losses of
$171 million
.
Income Taxes
|
2019
|
2018
|
|||||||
|
(in millions, except percentages)
|
||||||||
|
Income before income taxes and equity in income of
unconsolidated subsidiaries and affiliates
|
$
|
1,170
|
|
$
|
1,466
|
|
||
|
Income taxes
|
$
|
(271
|
)
|
$
|
417
|
|
||
|
Effective tax rate
|
(23.2
|
)%
|
28.4
|
%
|
||||
In 2019, income taxes were a benefit of
$271 million
, compared to an expense of
$417 million
in
2018
. The effective tax rates for
2019
and
2018
were
(23.2)%
and
28.4%
, respectively. The negative 2019 effective tax rate was primarily caused by the $539 million non-cash tax benefit included in the Company’s results for the three and nine-month periods ending September 30, 2019, and associated with releasing valuation allowances on certain deferred tax assets. In addition, the Company’s 2019 tax rate was positively impacted by a favorable geographic mix of pre-tax earnings, increased tax credits and incentives in multiple jurisdictions and a reduced impact of tax contingencies associated with uncertain tax positions. Excluding the tax impacts related to restructuring, the Benefit Modification Amortization, the charge for the purchase of a group annuity contract, the asset optimization charges taken due to actions included in the "Transform2Win" strategy, the charges for the repurchase of notes, and the $539 million non-cash tax benefit, the effective tax rate for
2019
would have been
22%
.
In
2018
, income taxes totaled
$417 million
, including a tax benefit of
$8 million
due to the U.S. Tax Act, as well as the tax on restructuring costs of
$61 million
(
$52 million
after tax) and, charges for the repurchase and early redemption of notes of
$22 million
(
$22 million
after tax). Excluding the impact of these items and the $12 million impact of placing a valuation allowance against deferred tax assets in certain jurisdictions during the year, the effective tax rate would have been
27%
.
Equity in Income of Unconsolidated Subsidiaries and Affiliates
Equity in income of unconsolidated subsidiaries and affiliates was
$13 million
in
2019
, compared to
$50 million
in
2018
. The decrease in equity in income of unconsolidated subsidiaries and affiliates was mainly due to lower results of the joint ventures in Rest of World.
35
Industrial Activities and Business Segments
The following tables show revenues, Adjusted EBIT and Adjusted EBITDA by segment. We have also included a discussion of our results by Industrial Activities and each of our segments.
|
2019
|
2018
|
% Change
|
% Change excl. FX
|
|||||||||||
|
(in millions, except percentages)
|
||||||||||||||
|
Revenues:
|
||||||||||||||
|
Agriculture
|
$
|
10,959
|
|
$
|
11,682
|
|
(6.2
|
)%
|
(3.4
|
)%
|
||||
|
Construction
|
2,768
|
|
3,021
|
|
(8.4
|
)%
|
(6.4
|
)%
|
||||||
|
Commercial and Specialty Vehicles
|
10,439
|
|
10,939
|
|
(4.6
|
)%
|
0.9
|
%
|
||||||
|
Powertrain
|
4,117
|
|
4,565
|
|
(9.8
|
)%
|
(5.0
|
)%
|
||||||
|
Eliminations and other
|
(2,134
|
)
|
(2,376
|
)
|
||||||||||
|
Total Net sales of Industrial Activities
|
$
|
26,149
|
|
$
|
27,831
|
|
(6.0
|
)%
|
(2.1
|
)%
|
||||
|
Financial Services
|
2,011
|
|
1,989
|
|
1.1
|
%
|
3.4
|
%
|
||||||
|
Eliminations and other
|
(81
|
)
|
(114
|
)
|
||||||||||
|
Total Revenues
|
$
|
28,079
|
|
$
|
29,706
|
|
(5.5
|
)%
|
(1.7
|
)%
|
||||
|
2019
|
2018
|
$ Change
|
2019 Adj EBIT Margin
|
2018 Adj EBIT Margin
|
||||||||||||||
|
(in millions, except percentages)
|
||||||||||||||||||
|
Adjusted EBIT by segment:
|
||||||||||||||||||
|
Agriculture
|
$
|
897
|
|
$
|
1,036
|
|
$
|
(139
|
)
|
8.2
|
%
|
8.9
|
%
|
|||||
|
Construction
|
51
|
|
91
|
|
(40
|
)
|
1.8
|
%
|
3.0
|
%
|
||||||||
|
Commercial and Specialty Vehicles
|
224
|
|
299
|
|
(75
|
)
|
2.1
|
%
|
2.7
|
%
|
||||||||
|
Powertrain
|
363
|
|
406
|
|
(43
|
)
|
8.8
|
%
|
8.9
|
%
|
||||||||
|
Eliminations and other
|
(145
|
)
|
(247
|
)
|
102
|
|
||||||||||||
|
Total Industrial Activities
|
$
|
1,390
|
|
$
|
1,585
|
|
$
|
(195
|
)
|
5.3
|
%
|
5.7
|
%
|
|||||
|
Financial Services
|
490
|
|
516
|
|
(26
|
)
|
24.4
|
%
|
25.9
|
%
|
||||||||
|
Total Adjusted EBIT
|
$
|
1,880
|
|
$
|
2,101
|
|
$
|
(221
|
)
|
6.7
|
%
|
7.1
|
%
|
|||||
|
2019
|
2018
|
$ Change
|
2019 Adj EBITDA Margin
|
2018 Adj EBITDA Margin
|
||||||||||||||
|
(in millions, except percentages)
|
||||||||||||||||||
|
Adjusted EBITDA by segment:
|
||||||||||||||||||
|
Agriculture
|
$
|
1,178
|
|
$
|
1,339
|
|
$
|
(161
|
)
|
10.7
|
%
|
11.5
|
%
|
|||||
|
Construction
|
106
|
|
152
|
|
(46
|
)
|
3.8
|
%
|
5.0
|
%
|
||||||||
|
Commercial and Specialty Vehicles
|
729
|
|
890
|
|
(161
|
)
|
7.0
|
%
|
8.1
|
%
|
||||||||
|
Powertrain
|
487
|
|
536
|
|
(49
|
)
|
11.8
|
%
|
11.7
|
%
|
||||||||
|
Eliminations and other
|
(143
|
)
|
(246
|
)
|
103
|
|
||||||||||||
|
Total Industrial Activities
|
$
|
2,357
|
|
$
|
2,671
|
|
$
|
(314
|
)
|
9.0
|
%
|
9.6
|
%
|
|||||
|
Financial Services
|
738
|
|
767
|
|
(29
|
)
|
36.7
|
%
|
38.6
|
%
|
||||||||
|
Total Adjusted EBITDA
|
$
|
3,095
|
|
$
|
3,438
|
|
$
|
(343
|
)
|
11.0
|
%
|
11.6
|
%
|
|||||
Net sales of Industrial Activities were
$26,149 million
for the year, down 6% compared to the prior year (down
2.1%
on a constant currency basis) driven by decreased revenues in each Industrial Activities segment.
36
Adjusted EBIT of Industrial Activities was $1,390 million in the full year 2019 ($1,585 million in 2018), with an Adjusted EBIT margin of
5.3%
, down 40 basis points ("bps") compared to
2018
.
Adjusted EBITDA of Industrial Activities was
$2,357 million
for the full year
2019
, a decrease of
$314 million
compared to full year
2018
, with an Adjusted EBITDA margin of
9.0%
, down 60 bps compared to
2018
.
Business Segment Performance
Agriculture
Net Sales
The following table shows Agriculture net sales by geographic region in
2019
compared to
2018
:
Agriculture Sales – by geographic region:
|
($ million)
|
2019
|
2018
|
% Change
|
||||||||
|
North America
|
$
|
3,943
|
|
$
|
4,037
|
|
(2.3
|
)%
|
|||
|
Europe
|
3,876
|
|
4,059
|
|
(4.5
|
)%
|
|||||
|
South America
|
1,611
|
|
1,625
|
|
(0.9
|
)%
|
|||||
|
Rest of World
|
1,529
|
|
1,961
|
|
(22.0
|
)%
|
|||||
|
Total
|
$
|
10,959
|
|
$
|
11,682
|
|
(6.2
|
)%
|
|||
Net sales for Agriculture were
$10,959 million
in
2019
, a
6.2%
decrease
(down
3.4%
on a constant currency basis) compared to
2018
. The decrease was primarily driven by lower industry volumes in North America and Rest of World markets, coupled with actions to reduce dealer inventories in the second half of the year, partially offset by positive price realization performance across all geographies and sustained aftermarket activity.
For 2019, worldwide industry unit sales for tractors decreased 7% compared to 2018, while worldwide industry sales for combines were down 4% compared to 2018. In North America, industry volumes in the over 140 hp tractor market sector were down 3% and combines were down 7%. Industry volumes for under 140 hp tractors were up 2%. European markets were up 5% for tractors and down 16% for combines. In South America, tractor industry volumes decreased 13% and combine industry volumes decreased 5%. Rest of World markets decreased 10% for tractors and increased 2% for combines.
Adjusted EBIT
Adjusted EBIT was
$897 million
in
2019
, compared to
$1,036 million
in
2018
. Positive pricing, disciplined cost management, industrial efficiencies and a reduction in short-term incentive compensation expense were more than offset by lower wholesale volume and market and product mix, including negative industrial absorption primarily from the lower production levels (mainly in the second half of the year), as well as higher product costs as a result of increased raw material costs and tariffs. Adjusted EBIT margin decreased 70 bps to
8.2%
.
Construction
Net Sales
The following table shows Construction net sales by geographic region in
2019
compared to
2018
:
Construction Sales – by geographic region:
|
($ million)
|
2019
|
2018
|
% Change
|
||||||||
|
North America
|
$
|
1,397
|
|
$
|
1,525
|
|
(8.4
|
)%
|
|||
|
Europe
|
493
|
|
517
|
|
(4.6
|
)%
|
|||||
|
South America
|
344
|
|
345
|
|
(0.3
|
)%
|
|||||
|
Rest of World
|
534
|
|
634
|
|
(15.8
|
)%
|
|||||
|
Total
|
$
|
2,768
|
|
$
|
3,021
|
|
(8.4
|
)%
|
|||
37
Net sales for Construction were
$2,768 million
in
2019
, an
8.4%
decrease
(down
6.4%
on a constant currency basis) compared to
2018
, as result of lower net sales in North America and Rest of World markets due to weaker market conditions and actions to reduce dealer inventory levels in the second half of the year, partially offset by positive price realization.
In 2019, construction equipment’s worldwide compact equipment industry sales were up
4
% compared to 2018, while worldwide general equipment industry sales were down 1% compared to 2018 and worldwide road building and site equipment industry sales were down 9%.
Adjusted EBIT
Adjusted EBIT was
$51 million
in
2019
(down
$40 million
compared to
2018
). Adjusted EBIT margin decreased 120 bps to
1.8%
. Positive price realization was more than offset by unfavorable volume and mix in North America and Rest of World markets, including negative industrial absorption, and higher product costs primarily related to increased raw material costs and tariffs, and costs associated with our product quality excellence initiative.
Commercial and Specialty Vehicles
Net Sales
The following table shows Commercial and Specialty Vehicles net sales by geographic region in
2019
compared to
2018
:
Commercial and Specialty Vehicles Sales – by geographic region:
|
($ million)
|
2019
|
2018
|
% Change
|
||||||||
|
North America
|
$
|
67
|
|
$
|
25
|
|
n.m.
|
|
|||
|
Europe
|
8,473
|
|
8,862
|
|
(4.4
|
)%
|
|||||
|
South America
|
599
|
|
710
|
|
(15.6
|
)%
|
|||||
|
Rest of World
|
1,300
|
|
1,342
|
|
(3.1
|
)%
|
|||||
|
Total
|
$
|
10,439
|
|
$
|
10,939
|
|
(4.6
|
)%
|
|||
|
n.m. – not meaningful
|
|||||||||||
Commercial and Specialty Vehicles' net sales were
$10,439 million
in
2019
, a decrease of
4.6%
from
2018
(up
0.9%
on a constant currency basis), driven by increased deliveries in bus and specialty vehicles, sustained aftermarket activity and positive price realization, more than offset by reduced wholesale volumes in M&H trucks in both Europe, as we are transitioning to a new commercial policy and refreshed product offering, and South America, primarily due to low industry volume in Argentina.
In 2019, the European truck market (GVW ≥3.5 tons), excluding U.K. and Ireland, grew by 5% compared to 2018. The LCV market increased 9%, while the M&H truck market decreased by 1%. In South America, new truck registrations (GVW ≥3.5 tons) increased 17% compared to 2018, with an increase of 34% in Brazil, partially offset by a decrease of 41% in Argentina. In Rest of World, new truck registrations decreased 7% compared with 2018.
CNH Industrial’s estimated market share in the European truck market (GVW ≥3.5 tons), excluding U.K. and Ireland, was 10.9%, down 0.7 percentage points ("p.p.") compared with 2018. In South America, in 2019, CNH Industrial’s market share decreased 1.9 p.p. to 7.6%.
During 2019, Commercial and Specialty Vehicles delivered approximately 138,000 vehicles (including buses and specialty vehicles), representing a 5% decrease from 2018. Volumes were 3% lower in LCV and 10% lower in M&H truck segments. Commercial and Specialty Vehicles’ deliveries decreased 4% in Europe, 13% in South America and 7% in Rest of World.
In 2019, Commercial and Specialty Vehicles' ratio of truck orders received to units shipped and billed, or book-to-bill ratio, for the European truck market was 0.99, an increase of 1% compared to 2018. In 2019, truck order intake in Europe decreased 3% compared to previous year.
38
The following tables show our unit deliveries by geographic area and by product in
2019
compared to
2018
:
Commercial and Specialty Vehicles Deliveries – by geographic area:
|
(units in thousands)
|
2019
|
2018
|
% Change
|
||||||
|
France
|
24.3
|
|
24.9
|
|
(2.4
|
)%
|
|||
|
Germany & Switzerland
|
18.8
|
|
19.5
|
|
(3.6
|
)%
|
|||
|
U.K.
|
6.3
|
|
6.5
|
|
(3.1
|
)%
|
|||
|
Italy
|
23.1
|
|
24.0
|
|
(3.8
|
)%
|
|||
|
Iberia (Spain & Portugal)
|
10.8
|
|
11.4
|
|
(5.3
|
)%
|
|||
|
Rest of Europe
|
28.4
|
|
29.4
|
|
(3.4
|
)%
|
|||
|
Europe
|
111.7
|
|
115.7
|
|
(3.5
|
)%
|
|||
|
South America
|
11.2
|
|
12.9
|
|
(13.2
|
)%
|
|||
|
Rest of World
|
15.1
|
|
16.3
|
|
(7.4
|
)%
|
|||
|
Total Sales
|
138.0
|
|
144.9
|
|
(4.8
|
)%
|
|||
|
Naveco*
|
25.5
|
|
31.0
|
|
(17.7
|
)%
|
|||
|
Total
|
163.5
|
|
175.9
|
|
(7.0
|
)%
|
|||
(*) Joint venture accounted for under the equity method
Commercial and Specialty Vehicles Deliveries– by product:
|
(units in thousands)
|
2019
|
2018
|
% Change
|
|||||
|
Medium & Heavy
|
34.6
|
|
38.7
|
(10.6
|
)%
|
|||
|
Light
|
90.6
|
|
93.1
|
(2.7
|
)%
|
|||
|
Buses
|
9.7
|
|
10.3
|
(5.8
|
)%
|
|||
|
Specialty vehicles**
|
3.1
|
|
2.8
|
10.7
|
%
|
|||
|
Total
|
138.0
|
|
144.9
|
(4.8
|
)%
|
|||
(**) Defense and firefighting vehicles
Adjusted EBIT
Adjusted EBIT was
$224 million
in
2019
(
$299 million
in
2018
) and includes a $50 million gain realized in the third quarter from granting to Nikola Corporation access to certain Iveco technology as part of the $150 million in-kind contribution as consideration for our initial equity interest in Nikola. Adjusted EBIT was negatively impacted by higher product costs, foreign exchange transaction impacts, and the remeasurement of certain provisions completed in the fourth quarter, partially offset by favorable volume and mix, positive price realization and a reduction in short-term incentive compensation expense. Adjusted EBIT margin was
2.1%
(2.7% in the full year 2018).
Powertrain
Net Sales
Powertrain net sales were
$4,117 million
in
2019
, a
decrease
of
9.8%
(down
5.0%
on a constant currency basis) compared to
2018
, due to lower sales volume. Sales to external customers accounted for 51% of total net sales (50% in 2018).
During 2019, Powertrain sold approximately 596,400 engines, a decrease of 3% compared to 2018. By major customer, 24% of engines were supplied to Commercial and Specialty Vehicles, 17% to Agriculture, 4% to Construction and the remaining 55% to external customers (units sold to third parties were down 2% compared to 2018). Additionally, Powertrain delivered approximately 64,100 transmissions, a decrease of 11% compared to 2018, and 168,200 axles, a decrease of 4% over 2018.
39
Adjusted EBIT
Adjusted EBIT was
$363 million
in
2019
, a $43 million decrease compared to
$406 million
in
2018
due to unfavorable volume and mix and higher product development investment geared towards the “Transform2Win” strategy initiatives, partially offset by positive price realization and product cost efficiencies. Adjusted EBIT margin was
8.8%
(8.9% in the full year of 2018).
Financial Services Performance
Finance, Interest and Other Income
Financial Services reported revenues of
$2,011 million
in
2019
, an increase of
1.1%
compared to 2018 (up
3.4%
on a constant currency basis) primarily due to higher average portfolio.
Net Income
For the year ended
December 31, 2019
, net income was
$361 million
, a $24 million decrease compared to
2018
, primarily attributable to margin reductions in dealer financing activities and higher credit provisions compared to a very favorable 2018.
In 2019, retail loan originations (including unconsolidated joint ventures) were $9.7 billion, down $0.4 billion compared to 2018, flat on a constant currency basis. The managed portfolio (including unconsolidated joint ventures) was $26.6 billion as of December 31, 2019 (of which retail was 61% and wholesale 39%), up $0.3 billion compared to December 31, 2018. Excluding the impact of currency translation, the managed portfolio increased $0.5 billion compared to 2018.
Reconciliation of Net Income (Loss) to Adjusted EBIT and Adjusted EBITDA
The following table includes the reconciliation of Adjusted EBIT and Adjusted EBITDA, non-GAAP financial measures, to net income, the most comparable U.S. GAAP financial measure.
|
2019
|
2018
|
$ Change
|
||||||||||
|
(in millions)
|
||||||||||||
|
Net income
|
$
|
1,454
|
|
$
|
1,099
|
|
$
|
355
|
|
|||
|
Income tax expense
|
(271
|
)
|
417
|
|
(688
|
)
|
||||||
|
Interest expenses of Industrial Activities, net of
interest income and eliminations |
282
|
|
368
|
|
(86
|
)
|
||||||
|
Foreign exchange (gains) losses, net
|
56
|
|
171
|
|
(115
|
)
|
||||||
|
Finance and non-service component of Pension and other post-employment benefit costs
(1)
|
63
|
|
(15
|
)
|
78
|
|
||||||
|
Restructuring expenses
|
109
|
|
61
|
|
48
|
|
||||||
|
Other discrete items
(2)
|
187
|
|
—
|
|
187
|
|
||||||
|
Adjusted EBIT
|
$
|
1,880
|
|
$
|
2,101
|
|
$
|
(221
|
)
|
|||
|
Depreciation and Amortization
|
660
|
|
703
|
|
(43
|
)
|
||||||
|
Depreciation of assets under operating leases and assets sold with buy-back commitments
|
555
|
|
634
|
|
(79
|
)
|
||||||
|
Adjusted EBITDA
|
$
|
3,095
|
|
$
|
3,438
|
|
$
|
(343
|
)
|
|||
|
(1)
|
In the year ended December 31, 2019 and 2018, this item includes the pre-tax gain of $119 million and $80 million, respectively, as a result of the amortization over approximately 4.5 years of the $527 million passive income impact from the modification of a healthcare plan in the U.S. In the year ended December 31, 2019, this item also includes a $116 million pre-tax non-cash settlement charge resulting from the purchase of a group annuity contract to settle a portion of the outstanding U.S. pension obligations.
|
|
(2)
|
In the year ended December 31, 2019, this item mainly includes other asset optimization charges for $165 million due to actions included in the “Transform2Win” strategy.
|
40
2018
Compared to
2017
Consolidated Results of Operations
|
2018
|
2017
|
|||||||
|
(in millions)
|
||||||||
|
Revenues:
|
||||||||
|
Net sales
|
$
|
27,831
|
|
$
|
25,769
|
|
||
|
Finance, interest and other income
|
1,875
|
|
1,932
|
|
||||
|
Total Revenues
|
29,706
|
|
27,701
|
|
||||
|
Costs and Expenses:
|
||||||||
|
Cost of goods sold
|
22,958
|
|
21,572
|
|
||||
|
Selling, general and administrative expenses
|
2,351
|
|
2,315
|
|
||||
|
Research and development expenses
|
1,061
|
|
957
|
|
||||
|
Restructuring expenses
|
61
|
|
93
|
|
||||
|
Interest expense
|
812
|
|
940
|
|
||||
|
Other, net
|
997
|
|
1,165
|
|
||||
|
Total Costs and Expenses
|
28,240
|
|
27,042
|
|
||||
|
Income before income taxes and equity in income
of unconsolidated subsidiaries and affiliates
|
1,466
|
|
659
|
|
||||
|
Income taxes
|
(417
|
)
|
(457
|
)
|
||||
|
Equity in income of unconsolidated subsidiaries and
affiliates
|
50
|
|
88
|
|
||||
|
Net income
|
1,099
|
|
290
|
|
||||
|
Net income (loss) attributable to noncontrolling interests
|
31
|
|
18
|
|
||||
|
Net income attributable to CNH Industrial N.V.
|
$
|
1,068
|
|
$
|
272
|
|
||
Revenues
We recorded revenues of
$29,706 million
in
2018
, an
increase
of
7.2%
(up
6.7%
on a constant currency basis) compared to
2017
. The increase was primarily due to an increase of 8.0% (increase of 7.3% on a constant currency basis) compared to the prior year in net of Industrial Activities.
Cost of Goods Sold
Cost of goods sold were
$22,958 million
in
2018
compared with
$21,572 million
in
2017
, an increase year over year due to the increase in revenues. As a percentage of net sales of Industrial Activities, cost of goods sold was
82.5%
in 2018 compared with
83.7%
in
2017
.
Selling, General and Administrative Expenses
SG&A expenses amounted to
$2,351 million
in
2018
(
7.9%
of revenues), compared to
$2,315 million
in
2017
(
8.4%
of revenues).
Research and Development Expenses
In
2018
, R&D expenses were
$1,061 million
compared to
$957 million
in
2017
. The expense in both years was primarily attributable to spending on engine development costs associated with emission requirements and continued investment in new products.
Restructuring Expenses
The Company incurred restructuring costs of
$61 million
in
2018
and
$93 million
in for the years ended December 31, 2018 and
2017
, respectively. These costs were as follows:
41
• In 2018, Commercial and Specialty Vehicles and Agriculture recorded $30 million and $26 million respectively, which were primarily attributable to actions as part of the Company's Efficiency Program launched in 2014.
• In 2017, Commercial and Specialty Vehicles recorded $69 million mainly due to additional capacity realignment in the firefighting business and actions to reduce selling, general and administrative expenses as part of the Efficiency Program. Agriculture recorded $14 million, mainly as a result of footprint rationalization actions included in the Efficiency Program.
Interest Expense
Interest expense was
$812 million
in
2018
compared to
$940 million
in
2017
. The interest expense attributable to Industrial Activities, net of interest income and eliminations, was $368 million in
2018
compared to $482 million in
2017
, a decrease of $114 million over
2017
. In 2018, interest expense includes a charge of $22 million related to the repurchase of a portion of the CNH Industrial Finance Europe S.A. 2.875% Notes due 2021. In 2017, interest expense included a charge of $56 million related to the repurchase/early redemption of notes. Excluding these changes, the decrease in 2018 was primarily attributable to refinancing and early retirement of certain high yield debt as well as lower average indebtedness.
Other, net
Other, net expenses were
$997 million
and includes a pre-tax gain of $80 million as a result of the amortization over approximately 4.5 years of the $527 million positive impact from a healthcare plan modification following a judgement in favor of the Company issued by the United States Supreme Court in April 2018. In 2017, Other, net expenses were
$1,165 million
which included a non-cash pre- and after-tax charge of $92 million due to the deconsolidation of our Venezuelan operations. Excluding the impacts of these charges in both years, Other, net expenses were flat. For more information on the deconsolidation of our Venezuelan operations, see “Note 2: Summary of Significant Accounting Policies - Venezuela Currency Regulations, Re-measurement and Deconsolidation”.
Income Taxes
|
2018
|
2017
|
|||||||
|
(in millions, except percentages)
|
||||||||
|
Income before income taxes and equity in income of
unconsolidated subsidiaries and affiliates
|
$
|
1,466
|
|
$
|
659
|
|
||
|
Income taxes
|
$
|
417
|
|
$
|
457
|
|
||
|
Effective tax rate
|
28.4
|
%
|
69.3
|
%
|
||||
Income taxes totaled
$417 million
in
2018
, including a tax benefit of $8 million due to the U.S. Tax Act as well as the tax on restructuring costs of $61 million ($52 million after tax). The effective tax rate was also affected by charges for the repurchase and early redemption of notes of $22 million ($22 million after tax). Excluding the impact of these items and the $12 million impact of placing a valuation allowance against deferred tax assets in certain jurisdictions during the year, the effective tax rate for 2018 would have been 27%. The effective tax rate reduction in 2018 was primarily caused by the difference in tax accruals attributable to the U.S. Tax Act and other tax law changes, a reduced negative impact of recording valuation allowances against certain of our deferred tax assets, a more favorable geographic mix of pre-tax earnings, and a reduced U.S. tax rate pursuant to the U.S. Tax Act.
In
2017
, income taxes totaled
$457 million
, including a tax charge of $128 million due to the U.S. Tax Act and tax legislation changes in the U.K. and certain other countries enacted in the fourth quarter of 2017 as well as the tax on restructuring costs of $93 million ($86 million after tax), charges for the repurchase and early redemption of notes of $64 million ($55 million after tax). The effective tax rate was also affected by the deconsolidation of our Venezuelan operations of $92 million ($92 million after tax). Excluding the impact of these items, the effective tax rate for 2017 would have been 38%.
Equity in Income of Unconsolidated Subsidiaries and Affiliates
Equity in income of unconsolidated subsidiaries and affiliates was
$50 million
in
2018
, compared to $
88
million in
2017
. The decrease in equity in income of unconsolidated subsidiaries and affiliates was mainly due to lower results of the joint ventures in Rest of World.
42
Industrial Activities and Business Segments
The following tables show revenues and operating profit broken down by segment. We have also included a discussion of our results by Industrial Activities and each of our business segments.
|
2018
|
2017
|
% Change
|
% Change excl. FX
|
|||||||||||
|
(in millions, except percentages)
|
||||||||||||||
|
Revenues:
|
||||||||||||||
|
Agriculture
|
$
|
11,682
|
|
$
|
10,683
|
|
9.4
|
%
|
10.4
|
%
|
||||
|
Construction
|
3,021
|
|
2,530
|
|
19.4
|
%
|
20.2
|
%
|
||||||
|
Commercial and Specialty Vehicles
|
10,939
|
|
10,562
|
|
3.6
|
%
|
1.3
|
%
|
||||||
|
Powertrain
|
4,565
|
|
4,369
|
|
4.5
|
%
|
1.4
|
%
|
||||||
|
Eliminations and other
|
(2,376
|
)
|
(2,375
|
)
|
||||||||||
|
Total Net sales of Industrial Activities
|
27,831
|
|
25,769
|
|
8.0
|
%
|
7.3
|
%
|
||||||
|
Financial Services
|
1,989
|
|
2,028
|
|
(1.9
|
)%
|
(0.5
|
)%
|
||||||
|
Eliminations and other
|
(114
|
)
|
(96
|
)
|
||||||||||
|
Total Revenues
|
$
|
29,706
|
|
$
|
27,701
|
|
7.2
|
%
|
6.7
|
%
|
||||
|
2018
|
2017
|
$ Change
|
2018 Adj EBIT Margin
|
2017 Adj EBIT Margin
|
||||||||||||||
|
(in millions, except percentages)
|
||||||||||||||||||
|
Adjusted EBIT by segment:
|
||||||||||||||||||
|
Agriculture
|
$
|
1,036
|
|
$
|
791
|
|
$
|
245
|
|
8.9
|
%
|
7.4
|
%
|
|||||
|
Construction
|
91
|
|
(16
|
)
|
107
|
|
3.0
|
%
|
(0.6
|
)%
|
||||||||
|
Commercial and Specialty Vehicles
|
299
|
|
195
|
|
104
|
|
2.7
|
%
|
1.8
|
%
|
||||||||
|
Powertrain
|
406
|
|
360
|
|
46
|
|
8.9
|
%
|
8.2
|
%
|
||||||||
|
Eliminations and other
|
(247
|
)
|
(187
|
)
|
(60
|
)
|
||||||||||||
|
Total Industrial Activities
|
$
|
1,585
|
|
$
|
1,143
|
|
$
|
442
|
|
5.7
|
%
|
4.4
|
%
|
|||||
|
Financial Services
|
516
|
|
497
|
|
19
|
|
25.9
|
%
|
24.5
|
%
|
||||||||
|
Total Adjusted EBIT
|
$
|
2,101
|
|
$
|
1,640
|
|
$
|
461
|
|
7.1
|
%
|
5.9
|
%
|
|||||
|
2018
|
2017
|
$ Change
|
2018 Adj EBITDA Margin
|
2017 Adj EBITDA Margin
|
||||||||||||||
|
(in millions, except percentages)
|
||||||||||||||||||
|
Adjusted EBITDA by segment:
|
||||||||||||||||||
|
Agriculture
|
$
|
1,339
|
|
$
|
1,106
|
|
$
|
233
|
|
11.5
|
%
|
10.4
|
%
|
|||||
|
Construction
|
152
|
|
49
|
|
103
|
|
5.0
|
%
|
1.9
|
%
|
||||||||
|
Commercial and Specialty Vehicles
|
890
|
|
735
|
|
155
|
|
8.1
|
%
|
7.0
|
%
|
||||||||
|
Powertrain
|
536
|
|
488
|
|
48
|
|
11.7
|
%
|
11.2
|
%
|
||||||||
|
Eliminations and other
|
(246
|
)
|
(187
|
)
|
(59
|
)
|
||||||||||||
|
Total Industrial Activities
|
$
|
2,671
|
|
$
|
2,191
|
|
$
|
480
|
|
9.6
|
%
|
8.5
|
%
|
|||||
|
Financial Services
|
767
|
|
799
|
|
(32
|
)
|
38.6
|
%
|
39.4
|
%
|
||||||||
|
Total Adjusted EBITDA
|
$
|
3,438
|
|
$
|
2,990
|
|
$
|
448
|
|
11.6
|
%
|
10.8
|
%
|
|||||
Net sales of Industrial Activities were
$27,831
million in
2018
, an
8.0%
increase
(up
7.3%
on a constant currency basis) as compared to the prior year driven by increased revenues in each Industrial Activities segment.
Adjusted EBIT of Industrial Activities was up 39% to
$1,585
million in
2018
, compared to $1,143 million in 2017, with an Adjusted EBIT margin of
5.7%
, up
1.3
percentage points (“p.p.”) compared to
2017
.
43
Adjusted EBITDA of Industrial Activities was
$2,671
million in
2018
an increase of $480 million (or up 22%) compared to 2017, with an Adjusted EBITDA margin of 9.6%, up 1.1 p.p. compared to 2017.
Industrial Activities Performance by Business
Agriculture
Net Sales
The following table shows Agriculture net sales by geographic region in
2018
compared to
2017
:
Agriculture Sales – by geographic region:
|
($ million)
|
2018
|
2017
|
% Change
|
||||||||
|
North America
|
$
|
4,037
|
|
$
|
3,568
|
|
13.1
|
%
|
|||
|
Europe
|
4,059
|
|
3,595
|
|
12.9
|
%
|
|||||
|
South America
|
1,625
|
|
1,657
|
|
(1.9
|
)%
|
|||||
|
Rest of World
|
1,961
|
|
1,863
|
|
5.3
|
%
|
|||||
|
Total
|
$
|
11,682
|
|
$
|
10,683
|
|
9.4
|
%
|
|||
Net sales for Agriculture were
$11,682
million in
2018
, a
9.4%
increase
(up
10.4%
on a constant currency basis) compared to
2017
. The increase was driven by a sustained price realization performance, coupled with a stabilization of end-user demand in most of our markets, including emerging evidence of a replacement cycle in the row crop sector in North America.
For 2018, worldwide agricultural equipment's industry unit sales increased 3%. In North America, industry volumes in the over 140 hp tractor market sector were up 5% and combines were up 10%. Industry volumes for under 140 hp segment were up 6%. Europe markets were down 8% for tractors and up 4% for combines. South America tractor industry volumes decreased 1% and combine industry volumes increased 10%. Rest of World markets increased 3% for tractors and 2% for combines.
Adjusted EBIT
Adjusted EBIT was $
1,036
million in
2018
($
791
million in
2017
). The increase was mainly due to positive net price realization and favorable volume in most of our regions, partially offset by the sustained investment in product development, related primarily to precision farming and compliance with Stage V emission regulations. Adjusted EBIT margin increased
1.5
p.p. to
8.9%
.
Construction
Net Sales
The following table shows Construction net sales by geographic region in
2018
compared to
2017
:
Construction Sales – by geographic region:
|
($ million)
|
2018
|
2017
|
% Change
|
||||||||
|
North America
|
$
|
1,525
|
|
$
|
1,307
|
|
16.7
|
%
|
|||
|
Europe
|
517
|
|
434
|
|
19.1
|
%
|
|||||
|
South America
|
345
|
|
300
|
|
15.0
|
%
|
|||||
|
Rest of World
|
634
|
|
489
|
|
29.7
|
%
|
|||||
|
Total
|
$
|
3,021
|
|
$
|
2,530
|
|
19.4
|
%
|
|||
Net sales for Construction were
$3,021
million in
2018
, a
19.4%
increase
(up
20.2%
on a constant currency basis) compared to
2017
primarily due to increased end-user demand in all regions and favorable net price realization.
44
In 2018, construction equipment's worldwide heavy industry volumes were up 20% and light industry volumes were up 17% compared to 2017. Overall industry volumes increased in all regions.
Adjusted EBIT
Adjusted EBIT was $
91
million in
2018
(up $107 million compared to 2017). Adjusted EBIT margin increased
3.6
p.p. to
3.0%
. The increase was due to higher sales volume, favorable mix, and positive net price realization, more than offsetting raw material cost increases, mainly in North America
Commercial and Specialty Vehicles
Net Sales
The following table shows Commercial and Specialty Vehicles net sales by geographic region in
2018
compared to
2017
:
Commercial and Specialty Vehicles Sales – by geographic region:
|
($ million)
|
2018
|
2017
|
% Change
|
||||||||
|
North America
|
$
|
25
|
|
$
|
20
|
|
n.m.
|
|
|||
|
Europe
|
8,862
|
|
8,039
|
|
10.2
|
%
|
|||||
|
South America
|
710
|
|
837
|
|
(15.2
|
)%
|
|||||
|
Rest of World
|
1,342
|
|
1,666
|
|
(19.4
|
)%
|
|||||
|
Total
|
$
|
10,939
|
|
$
|
10,562
|
|
3.6
|
%
|
|||
Commercial and Specialty Vehicles net sales were
$10,939
million in
2018
, increased
3.6%
(up
1.3%
on a constant currency basis), as a result of positive pricing and a favorable product mix.
In 2018, the European truck market (GVW 3.5 tons), excluding U.K. and Ireland, grew by 8% compared to 2017. The light vehicles market (“LCV”) (GVW 3.5-7.49 tons) increased 11%, while the Medium and Heavy (“M&H”) Truck market (GVW 7.5 tons) increased 5%. In South America, new truck registrations (GVW 3.5 tons) increased 24% compared to 2017, with an increase of 46% in Brazil, partially offset by a decrease of 17% in Argentina. In Rest of World, new truck registrations slightly increased (up 1%) compared with 2017.
The Company’s estimated market share in the European truck market (GVW 3.5 tons), excluding U.K. and Ireland, was 11.6%, down 1.2 p.p. compared with 2017. In South America in 2018, the Company’s market share decreased 2.3 p.p. to 9.6%.
During 2018, Commercial and Specialty Vehicles delivered approximately 144,900 vehicles (including buses and specialty vehicles), representing a 5% decrease from 2017. Volumes increased 2% in LCV and decreased 20% in M&H truck segments. Commercial and Specialty Vehicles’ deliveries decreased 4% in Europe, 7% in South America and 17% in Rest of World.
In 2018, Commercial and Specialty Vehicles' ratio of orders received to units shipped and billed, or book-to-bill ratio, for the European truck market was 0.98, a decrease of 5% compared to 2017. In 2018, truck order intake in Europe decreased 7% compared to previous year.
45
The following tables show our unit deliveries by geographic area and by product in
2018
compared to
2017
:
Commercial and Specialty Vehicles Deliveries – by geographic area:
|
(units in thousands)
|
2018
|
2017
|
% Change
|
||||||
|
France
|
24.9
|
|
22.9
|
|
8.7
|
%
|
|||
|
Germany & Switzerland
|
19.5
|
|
20.7
|
|
(5.8
|
)%
|
|||
|
U.K.
|
6.5
|
|
7.2
|
|
(9.7
|
)%
|
|||
|
Italy
|
24.0
|
|
23.9
|
|
0.4
|
%
|
|||
|
Iberia (Spain & Portugal)
|
11.4
|
|
14.2
|
|
(19.7
|
)%
|
|||
|
Rest of Europe
|
29.4
|
|
38.2
|
|
(23.0
|
)%
|
|||
|
Europe
|
115.7
|
|
127.1
|
|
(9.0
|
)%
|
|||
|
South America
|
12.9
|
|
13.8
|
|
(6.5
|
)%
|
|||
|
Rest of World
|
16.3
|
|
11.5
|
|
41.7
|
%
|
|||
|
Total Sales
|
144.9
|
|
152.4
|
|
(4.9
|
)%
|
|||
|
Naveco*
|
31.0
|
|
31.3
|
|
(1.0
|
)%
|
|||
|
Total
|
175.9
|
|
183.7
|
|
(4.2
|
)%
|
|||
(*) Joint venture accounted for under the equity method
Commercial and Specialty Vehicles Deliveries – by product:
|
(units in thousands)
|
2018
|
2017
|
% Change
|
||||||
|
Medium & Heavy
|
38.7
|
|
48.4
|
|
(20.0
|
)%
|
|||
|
Light
|
93.1
|
|
91.0
|
|
2.3
|
%
|
|||
|
Buses
|
10.3
|
|
10.3
|
|
0.0
|
%
|
|||
|
Specialty vehicles**
|
2.8
|
|
2.7
|
|
3.7
|
%
|
|||
|
Total
|
144.9
|
|
152.4
|
|
(4.9
|
)%
|
|||
(**) Defense and firefighting vehicles
Adjusted EBIT
Adjusted EBIT was $
299
million in
2018
($
195
million in
2017
), mainly due to a favorable product mix in light duty trucks and buses, and to the focus on sales of alternative propulsion solutions in heavy duty trucks. Positive price realization in trucks and manufacturing efficiencies also contributed to the improved results. Adjusted EBIT margin
increased
0.9
p.p. to
2.7%
.
Powertrain
Net Sales
Powertrain net sales were
$4,565
million in
2018
, an
increase
of
4.5%
(up
1.4%
on a constant currency basis) compared to
2017
due to higher sales volumes in engine applications. Sales to external customers accounted for 50% of total net sales in
2018
, up from 48% in
2017
.
During 2018, Powertrain sold approximately 613,000 engines, an increase of 1% compared to 2017. By major customer, 25% of engines were supplied to Commercial and Specialty Vehicles, 16% to Agriculture, 4% to Construction and the remaining 55% to external customers (units sold to third parties were up 5% compared to 2017). Additionally, Powertrain delivered approximately 72,200 transmissions, an increase of 2% compared to 2017, and 175,700 axles, a decrease of 9% over 2017.
Adjusted EBIT
Adjusted EBIT was $
406
million in
2018
($
360
million in
2017
). The improvement was mainly due to a favorable product mix and manufacturing efficiencies, partially offset by higher product development spending. Adjusted EBIT margin increased to
8.9%
.
46
Financial Services
Finance, Interest and Other Income
Financial Services reported revenues of
$1,989
million in
2018
,
down
1.9%
(down
0.5%
on a constant currency basis) relative to
2017
, primarily due to a lower average portfolio balance in North America.
Net Income
For the year ended
December 31, 2018
net income was $
385
million, a $67 million decrease compared to
2017
, primarily attributable to the one-time tax benefit of $118 million recorded in 2017 as a result of the write-down of deferred tax liabilities in connection with the enactment of the U.S. Tax Act.
In 2018, retail loan originations (including unconsolidated joint ventures) were $10.0 billion, up $0.9 billion compared to 2017. The managed portfolio (including unconsolidated joint ventures) was $26.3 billion (of which retail was 62% and wholesale 38%), down $0.5 billion compared to December 31, 2017. Excluding the impact of currency translation, the managed portfolio increased $0.7 billion compared to 2017.
Reconciliation of Net Income (Loss) to Adjusted EBIT and Adjusted EBITDA
The following table includes the reconciliation of Adjusted EBIT and Adjusted EBITDA, non-GAAP financial measures, to net income, the most comparable U.S. GAAP financial measure.
|
2018
|
2017
|
$ Change
|
||||||||||
|
(in millions)
|
||||||||||||
|
Net income
|
$
|
1,099
|
|
$
|
290
|
|
$
|
809
|
|
|||
|
Income tax expense
|
417
|
|
457
|
|
(40
|
)
|
||||||
|
Interest expenses of Industrial Activities, net of
interest income and eliminations |
368
|
|
482
|
|
(114
|
)
|
||||||
|
Foreign exchange (gains) losses, net
|
171
|
|
124
|
|
47
|
|
||||||
|
Finance and non-service component of Pension and other post-employment benefit costs (1)
|
(15
|
)
|
102
|
|
(117
|
)
|
||||||
|
Restructuring expenses
|
61
|
|
93
|
|
(32
|
)
|
||||||
|
Venezuelan re-measurement and impairment of assets, and 2017 year-end deconsolidation of Venezuelan operations
|
—
|
|
92
|
|
(92
|
)
|
||||||
|
Adjusted EBIT
|
$
|
2,101
|
|
$
|
1,640
|
|
$
|
461
|
|
|||
|
Depreciation and Amortization
|
703
|
|
725
|
|
(22
|
)
|
||||||
|
Depreciation of assets under operating leases and assets sold with buy-back commitments
|
634
|
|
625
|
|
9
|
|
||||||
|
Adjusted EBITDA
|
$
|
3,438
|
|
$
|
2,990
|
|
$
|
448
|
|
|||
(1) This item contains a pre-tax gain of $80 million as a result of the amortization over approximately 4.5 years of the $527 million passive income impact from the modification of a healthcare plan in the U.S.
Application of Critical Accounting Estimates
The financial statements included in this annual report and related disclosures have been prepared in accordance with U.S. GAAP, which requires us to make judgments, estimates and assumptions that affect the reported amounts of assets and liabilities and the disclosure of contingent assets and liabilities at the date of the financial statements. The estimates and related assumptions are based on available information at the date of preparation of the financial statements, historical experience and other relevant factors. Actual results may differ from the estimates.
Particularly in light of the current economic uncertainty, developments may occur which may differ from our estimates and assumptions, and therefore might require significant adjustments to the carrying amounts of certain items, which as of the date of this annual report cannot be accurately estimated or predicted. The principal items affected by estimates are the allowances for doubtful accounts receivable and inventories, long-lived assets (tangible and intangible assets), the residual values of vehicles leased out under operating
47
lease arrangements or sold with buy-back commitments, sales allowances, product warranties, pension and other postemployment benefits, deferred tax assets and contingent liabilities.
Estimates and assumptions are reviewed periodically and the effects of any changes are recognized in the period in which the estimate is revised, if the revision affects only that period, or in the period of the revision and future periods if the revision affects both current and future periods.
The following are the critical judgments and the key assumptions concerning the future that we have made in the process of applying our accounting policies and that may have the most significant effect on the amounts recognized in our consolidated financial statements included in this annual report or that represent a significant risk of causing a material adjustment to the carrying amounts of assets and liabilities within the next financial year.
Allowance for Doubtful Accounts
The allowance for doubtful accounts reflects our estimate of losses inherent in the wholesale and retail credit portfolios. This allowance is based on our estimate of the losses to be incurred, which derives from past experience with similar receivables, current and historical past due amounts, dealer termination rates, write-offs and collections, the careful monitoring of portfolio credit quality and current and projected economic and market conditions. Should the present economic and financial situation persist or worsen, there could be a further deterioration in the financial situation of our debtors compared to that taken into consideration in calculating the allowances recognized in the financial statements.
Allowance for Obsolete and Slow-moving Inventory
The allowance for obsolete and slow-moving inventory reflects our estimate of the expected loss in value, and has been determined on the basis of past experience and historical and expected future trends in the used vehicle market. A worsening of the economic and financial situation could cause a further deterioration in conditions in the used vehicle market compared to that taken into consideration in calculating the allowances recognized in the financial statements.
Recoverability of Long-lived Assets (including Goodwill)
Long-lived assets include property, plant and equipment, goodwill and other intangible assets such as patents and trademarks. We evaluate the recoverability of property, plant and equipment and finite-lived other intangible assets whenever events or changes in circumstances indicate that the carrying amount of an asset may not be fully recoverable. We assess the recoverability of property, plant and equipment and finite-lived other intangible assets by comparing the carrying amount of the asset to future undiscounted net cash flows expected to be generated by the asset. If the carrying amount of the long-lived asset is not recoverable in full on an undiscounted cash flow basis, an impairment is recognized to the extent that the carrying amount exceeds its fair value.
We have identified five reporting units for the purpose of goodwill impairment testing: Agriculture, Construction, Commercial and Specialty Vehicles, Powertrain, and Financial Services. Impairment testing for goodwill is done at a reporting unit level. Under the goodwill impairment test, CNH Industrial’s estimate of the fair value of the reporting unit is compared with its carrying value. An impairment charge should be recognized for the amount by which the carrying amount exceeds the reporting unit’s fair value; however, the loss recognized should not exceed the total amount of goodwill allocated to that reporting unit. CNH Industrial has the option to perform the qualitative assessment for a reporting unit to determine if the quantitative impairment test is necessary.
The vast majority of goodwill, representing approximately
97%
of the total, as of
December 31, 2019
, related to Agriculture (
68%
), Construction (
23%
) and Financial Services (
6%
) and as such, the impairment testing of these reporting units is discussed in detail below.
The carrying values for each reporting unit include material allocations of our assets and liabilities and costs and expenses that are common to all of the reporting units. We believe that the basis for such allocations has been consistently applied and is reasonable.
We determine the fair value of our reporting units using multiple valuation methodologies, relying largely on an income approach but also incorporating value indicators from a market approach. Under the income approach, we calculate the fair value of a reporting unit based on the present value of estimated future cash flows. The income approach is dependent on several critical management assumptions, including estimates of future sales in the discrete future period and the weighted average cost of capital (discount rate), and also less significant assumptions such as gross margins, operating costs, income tax rates, terminal value growth rates, capital expenditures, and changes in working capital requirements. Discount rate assumptions include an assessment of the risk inherent in the future cash flows of the respective reporting units. Expected cash flows used under the income approach are developed in conjunction with our budgeting and forecasting process. Under the market approach, we estimate the fair value of the Agriculture and Construction reporting units using revenue and earnings before interest, tax, depreciation and amortization (“EBITDA”) multiples, and estimate the fair value of the Financial Services reporting unit using book value, tangible book value and interest margin multiples. The multiples are derived from comparable publicly-traded companies with similar operating and investment characteristics as the respective
48
reporting units. The guideline company method makes use of market price data of corporations whose stock is actively traded in a public, free and open market, either on an exchange or over-the counter basis. Although it is clear no two companies are entirely alike, the corporations selected as guideline companies must be engaged in the same, or a similar, line of business or be subject to similar financial and business risks, including the opportunity for growth.
Goodwill and indefinite-lived other intangible assets are tested for impairment at least annually. In 2019 and 2018, we performed our annual impairment review as of December 31 and concluded that there was no impairment in either year. We evaluate events and changes in circumstances to determine if additional testing may be required.
The estimated fair values of the Agriculture, Construction and Financial Services reporting units exceeded the carrying value by approximately
143%
,
28%
, and
43%
respectively. Thus, we did not recognize an impairment for the respective reporting units. While there is positive margin between the fair value and carrying value for the Construction reporting unit, the fair value can be significantly impacted by changes in assumptions used in the fair value valuation model including expected sales growth in the discrete future period, the weighted average cost of capital (discount rate), and also less significant assumptions such as expected improvements in margin, discount rates, long term growth rates along with other judgments. Based on our assessment of these circumstances, we have determined that the goodwill at the Construction reporting unit is at risk for impairment going forward should there be a deterioration of projected cash flows of the reporting unit as a result of the Company’s inability to successfully execute its plans to achieve further growth projections. Impairment assessments inherently involve management judgments regarding a number of assumptions such as those described above. Due to the many variables inherent in the estimation of a reporting unit’s fair value, differences in assumptions could have a material effect on the estimated fair value and could result in a goodwill impairment charge in a future period.
The sum of the fair values of our reporting units was in excess of our market capitalization at
December 31, 2019
. We believe that the difference between the fair value and market capitalization is reasonable (in the context of assessing whether any asset impairment exists) when market-based control premiums are taken into consideration.
Residual Values of Assets Leased Out Under Operating Lease Arrangements or Sold with a Buy-back Commitment
We record assets rented to customers or leased to them under operating leases as tangible assets. Furthermore, new vehicle sales with a buy-back commitment are not recognized as sales at the time of delivery but are accounted for as operating leases if it is probable that the vehicle will be repurchased by us. Income from such operating leases is recognized on a straight-line basis over the term of the lease. Depreciation expense for assets subject to operating leases is recognized on a straight-line basis over the lease term in amounts necessary to reduce the cost of an asset to its estimated residual value at the end of the lease term. The estimated residual value of leased assets is calculated at the lease commencement date on the basis of published industry information and historical experience.
Realization of the residual values is dependent on our future ability to market the assets under then-prevailing market conditions. We continually evaluate whether events and circumstances have occurred which impact the estimated residual values of the assets on operating leases. The used vehicle market was carefully monitored throughout
2019
to ensure that write-downs were properly determined; however, additional write-downs may be required if market conditions should deteriorate further.
Sales Allowances
At the later of the time of sale or the time an incentive is announced to dealers, we record the estimated impact of sales allowances in the form of dealer and customer incentives as a reduction of revenue. There may be numerous types of incentives available at any particular time. The determination of sales allowances requires us to make estimates based on various factors.
Product Warranties
We make provisions for estimated expenses related to product warranties at the time products are sold. We establish these estimates based on historical information on the nature, frequency and average cost of warranty claims. We seek to improve vehicle quality and minimize warranty expenses arising from claims. Warranty costs may differ from those estimated if actual claim rates are higher or lower than historical rates.
Pension and Other Postemployment Benefits
As more fully described in “Note 12: Employee Benefit Plans and Postretirement Benefits” to our consolidated financial statements for the year ended
December 31, 2019
, we sponsor pension, healthcare and other postemployment plans in various countries. We actuarially determine the costs and obligations relating to such plans using several statistical and judgmental factors. These assumptions include discount rates, rates for expected returns on plan assets, rates for compensation increases, mortality rates, retirement rates, and healthcare cost trend rates, as determined by us within certain guidelines. To the extent actual experiences differ from our assumptions or our assumptions change, we may experience gains and losses that we have not yet recognized in our consolidated
49
statements of operations but would be recognized in equity. For our pension and postemployment benefit plans, we recognize net gain or loss as a component of defined benefit plan cost for the year if, as of the beginning of the year, such unrecognized net gain or loss exceeds 10% of the greater of (1) the projected benefit obligation or (2) the fair or market value of the plan assets at year end. In such case, the amount of amortization we recognize is the resulting excess divided by the average remaining service period of active employees, and by the average life expectancy for inactive employees expected to receive benefits under the plan.
In October 2014, the Society of Actuaries (“SOA”) in the U.S. issued an updated mortality table (“RP-2014”) and mortality improvement scale (“MP-2014”). Accordingly, CNH Industrial reviewed the historical mortality experience and demographic characteristics of its U.S. pension plan participants and has decided to adopt the variants of blue-collar tables of RP-2014 (with MP-2014 removed) as the base mortality tables. This table with a newer version of the mortality improvement scale, MP-2017, was used at December 31, 2017.
Subsequent to the Benefits Modification to the US Healthcare plan on April 16, 2018, the Company decided to change the base mortality table for the US Healthcare plan from the variants of blue-collar tables of RPH-2014 (with MP-2014 removed) to a no-collar variant which led to an increase of $4.3 million to the Company's benefit obligations at December 31, 2018. In addition, in 2018, CNH Industrial adopted the MP-2018 mortality improvement scale, which better reflects the actual recent experience over the previous mortality improvement scales. The adoption of the new mortality assumptions resulted in a total decrease of
$3.6 million
to the Company’s benefit obligations at December 31, 2018, of which,
$3 million
and
$0.6 million
were related to pension plans and healthcare plans, respectively.
In October 2019, the SOA issued an updated mortality base table ("Pri-2012") as well as an updated mortality improvement scale (“MP-2019”). The Pri-2012 mortality base table reflects more recent mortality experience, uses a larger data set than the previous base table and includes separate mortality rates for survivors of deceased participants still benefiting under the plans. In 2019, the Company adopted the variant of blue-collar tables of the Pri-2012 for the US pension plans and the no collar variant of the PriH-2012 for the US OPEB plans, including the new survivor mortality as well as MP-2019 mortality improvement scale. Management believes the new mortality assumptions most appropriately represent its plans’ experience and characteristics. The adoption of the new mortality assumptions resulted in a total decrease of
$14 million
to the Company’s benefit obligations at December 31, 2019, of which,
$11 million
and
$3 million
were related to pension plans and healthcare plans, respectively.
The following table shows the effects of a one percentage-point change in our primary actuarial assumptions on pension, healthcare and other postemployment benefit obligations and expense:
|
2020 Benefit Cost
|
Year End Benefit Obligation
|
|||||||||||||||
|
One
Percentage-Point
Increase
|
One
Percentage-Point
Decrease
|
One
Percentage-Point
Increase
|
One
Percentage-Point
Decrease
|
|||||||||||||
|
(in millions)
|
||||||||||||||||
|
Pension benefits
|
||||||||||||||||
|
Assumed discount rate
|
$
|
(8
|
)
|
$
|
11
|
|
$
|
(360
|
)
|
$
|
453
|
|
||||
|
Expected long-term rate of return on plan assets
|
$
|
(21
|
)
|
$
|
21
|
|
$
|
—
|
|
$
|
—
|
|
||||
|
Healthcare benefits:
|
||||||||||||||||
|
Assumed discount rate
|
$
|
1
|
|
$
|
2
|
|
$
|
(32
|
)
|
$
|
37
|
|
||||
|
Assumed health care cost trend rate (initial and ultimate)
|
$
|
4
|
|
$
|
(2
|
)
|
$
|
22
|
|
$
|
(19
|
)
|
||||
|
Other benefits:
|
||||||||||||||||
|
Assumed discount rate
|
$
|
1
|
|
$
|
(1
|
)
|
$
|
(38
|
)
|
$
|
45
|
|
||||
Realization of Deferred Tax Assets
At
December 31, 2019
, we had net deferred tax assets on temporary differences and tax benefits arising from tax loss and credit carryforwards of $2.0 billion, of which $1.0 billion is not recognized in the financial statements. The corresponding totals at
December 31, 2018
were $2.1 billion and $1.6 billion, respectively.
We have recorded deferred tax assets that we believe are more likely than not to be recovered. The determination to record a valuation allowance requires significant judgement and is based on an assessment of positive and negative evidence, whereby objectively verifiable evidence takes precedence over other forms of evidence. We consider actual and forecasted results, the potential to carryback net operating losses and credits, the future reversal of certain taxable temporary differences, and planning strategies that are both prudent and feasible. We also consider risk factors, including, but not limited to, the economic conditions in the countries and, in some cases, regions in which we have significant operations as those conditions would generally impact our ability to generate taxable income in specific jurisdictions.
50
The above-mentioned $1.0 billion valuation allowance recorded in the consolidated financial statements at
December 31, 2019
includes a full valuation allowance with respect to the deferred tax assets of our Brazilian industrial operations. These assets, on a gross basis, netted to $245 million, $165 million of which related to tax losses carried forward. During 2019, for the first time in several years, these operations emerged from cumulative pre-tax losses in recent years. These operations do not yet have a history of sustained profitability, particularly in the low-end of business cycles. Further, Brazil tax law places significant restrictions, as compared to many other jurisdictions, on how much taxable income can be offset by prior year tax losses during any tax period. The Company concluded it was appropriate to maintain the full valuation allowance placed against these deferred tax assets at December 31,2019. It is, however, possible that the Company may be required to recognize a significant portion of these deferred tax assets during 2020.
Contingent Liabilities
We are the subject of legal proceedings and tax issues covering a range of matters, which are pending in various jurisdictions. Due to the uncertainty inherent in such matters, it is difficult to predict the final outcome of such matters. The cases and claims against us often raise difficult and complex factual and legal issues, which are subject to many uncertainties, including but not limited to the facts and circumstances of each particular case and claim, the jurisdiction and the differences in applicable law. In the normal course of business, we consult with legal counsel and certain other experts on matters related to litigation, taxes and other similar contingent liabilities. We accrue a liability when it is determined that an adverse outcome is probable and the amount of the loss can be reasonably estimated. In the event an adverse outcome is probable, but an estimate is not determinable or is possible, the matter is disclosed.
B.
Liquidity and Capital Resources
The following discussion of liquidity and capital resources principally focuses on our consolidated statements of cash flows and our consolidated balance sheets. Our operations are capital intensive and subject to seasonal variations in financing requirements for dealer receivables and dealer and company inventories. Whenever necessary, funds from operating activities are supplemented from external sources. We expect to have available to us cash reserves and cash generated from operations and from sources of debt and financing activities that are sufficient to fund our working capital requirements, capital expenditures and debt service at least through the end of 2020. See “Item 3. Key Information—D. Risk Factors” for additional information concerning risks related to our business, strategy and operations.
Cash Flow Analysis
At
December 31, 2019
, we had cash and cash equivalents of
$4,875
million, a decrease of
$156
million or
3.1%
from
$5,031
million at
December 31, 2018
. Cash and cash equivalents at
December 31, 2019
did not include restricted cash of
$898
million (
$772
million at
December 31, 2018
). The aggregate of cash and cash equivalents and restricted cash, which we consider to constitute our principal liquid assets (or “liquidity”), totaled
$5,773
million at
December 31, 2019
, a decrease of
$30
million, or
0.5%
, from the total at the end of
2018
of
$5,803
million.
Cash and cash equivalents are substantially flat compared to December 31, 2018 , and the $30 million decrease was mainly attributable to $496 million usage in working capital, the repurchase of notes, the distribution of annual dividend to CNH Industrial N.V.'s shareholders for $275 million and repurchase of common shares under the buy-back program for $57 million, partially offset by an increase in third party debt, mainly new issuances of bonds. At December 31, 2019, available liquidity was $11,247 million, inclusive of $5,474 million in undrawn committed facilities ($3,135 million at December 31, 2018), compared to $8,938 million at December 31, 2018.
The following table summarizes the changes to cash flows from operating, investing and financing activities for each of the years ended
December 31, 2019
,
2018
and
2017
.
|
2019
|
2018
|
2017
|
||||||||||
|
(in millions)
|
||||||||||||
|
Cash provided by (used in):
|
||||||||||||
|
Operating activities
|
$
|
1,826
|
|
$
|
2,554
|
|
$
|
2,865
|
|
|||
|
Investing activities
|
(1,987
|
)
|
(1,920
|
)
|
(1,869
|
)
|
||||||
|
Financing activities
|
206
|
|
(723
|
)
|
(1,045
|
)
|
||||||
|
Translation exchange differences
|
(75
|
)
|
(308
|
)
|
395
|
|
||||||
|
Net increase (decrease) in cash and cash equivalents
|
$
|
(30
|
)
|
$
|
(397
|
)
|
$
|
346
|
|
|||
51
Net Cash from Operating Activities
Cash provided by operating activities in
2019
totaled
$1,826
million and comprised the following elements:
|
•
|
$
1,454
million in net income;
|
|
•
|
plus
$1,215
million in non-cash charges for depreciation and amortization ($
660
million excluding assets sold with buy-back commitments and equipment on operating leases);
|
|
•
|
plus $
189
million in losses on the disposal of assets and other non-cash items;
|
|
•
|
plus $
27
million in cost of repurchase of notes;
|
|
•
|
less $
2
million of undistributed loss of unconsolidated subsidiaries (netted against dividends received from equity investees);
|
|
•
|
plus changes in deferred income taxes of $
(472)
million less change in provisions of $
93
million; and
|
|
•
|
plus $
(496)
million in change in working capital and other operating assets and liabilities.
|
In
2018
, cash generated by operating activities during the year was
$2,554
million as a result of cash generated from income-related inflows (calculated as net income plus amortization and depreciation, dividends, equity income, changes in other liabilities and deferred taxes, net of gains/losses on disposals and other non-cash items) for a total amount of
$2,615
million, and of a
$61
million decrease in cash resulting from an increase in working capital and other operating assets and liabilities.
In
2017
, $2,282 million of the
$2,865
million in cash generated by operating activities during the year was from income-related cash inflows (calculated as net income plus amortization and depreciation, dividends, equity income, changes in other liabilities and deferred taxes, net of gains/losses on disposals and other non-cash items), in addition to a
$583
million increase in cash resulting from a decrease in working capital and other operating assets and liabilities.
Net Cash from Investing Activities
In
2019
, cash used in investing activities was
$1,987
million. The negative flows were primarily generated by:
|
•
|
investments in tangible and intangible assets that used
$1,962
million in cash. Excluding investments for our long-term rental operations and relating to vehicles sold under buy-back commitments, investments amounted to $
637
million;
|
|
•
|
$
74
million employed in retail receivables, net of collections; and
|
|
•
|
less
$61
million of proceeds from the sale of assets
|
In
2018
, cash used in investing activities totaled
$1,920
million. Expenditures on tangible and intangible assets totaled
$1,902
million. Excluding investments for our long-term rental operations and relating to vehicles sold under buy-back commitments, investments amounted to $
558
million in
2018
. Net collections of receivables from retail financing activities amounted to $
253
million, and the proceeds from the sale of assets amounted to
$7
million.
In
2017
, cash used in investing activities totaled
$1,869
million. Expenditures on tangible and intangible assets totaled
$2,235
million. Excluding investments for our long-term rental operations and relating to vehicles sold under buy-back commitments, investments amounted to $
492
million in
2017
. Net collections of receivables from retail financing activities amounted to $
306
million, and the proceeds from the sale of assets amounted to $
17
million.
52
The following table summarizes our investments in tangible assets by segment and intangible assets for each of the years ended
December 31, 2019
,
2018
and
2017
:
|
2019
|
2018
|
2017
|
||||||||||
|
(in millions)
|
||||||||||||
|
Agriculture
|
$
|
164
|
|
$
|
148
|
|
$
|
156
|
|
|||
|
Construction
|
32
|
|
24
|
|
25
|
|
||||||
|
Commercial and Specialty Vehicles
|
226
|
|
170
|
|
132
|
|
||||||
|
Powertrain
|
90
|
|
85
|
|
86
|
|
||||||
|
Total Industrial Activities investments in tangible assets
|
512
|
|
427
|
|
399
|
|
||||||
|
Industrial Activities investments in intangible assets
|
121
|
|
123
|
|
89
|
|
||||||
|
Total Industrial Activities capital expenditures
|
633
|
|
550
|
|
488
|
|
||||||
|
Financial Services investments in tangible assets
|
—
|
|
—
|
|
1
|
|
||||||
|
Financial Services investments in intangible assets
|
4
|
|
8
|
|
3
|
|
||||||
|
Total Capital expenditures
|
$
|
637
|
|
$
|
558
|
|
$
|
492
|
|
|||
We incurred these capital expenditures in the regions in which we operate principally related to initiatives to introduce new products, enhance manufacturing efficiency and increase capacity, and for maintenance and engineering. The increase in capital expenditures in
2019
from
2018
is primarily related to our investment cycles, particularly for product enhancements, and primarily to our efforts on sustainability programs including investments in digitization, alternative propulsion, and automation.
Net Cash from Financing Activities
In
2019
, cash provided by financing activities totaled
$206
million,
mainly attributable to a net increase in third party debt (net of repurchase of notes), partially offset by dividend payments to shareholders and common shares repurchases.
In
2018
, cash used in financing activities totaled
$723
million, mainly attributable to a reduction in third party debt of Industrial Activities (including the repurchase of a portion of the CNH Industrial Finance Europe S.A. 2.875% notes due 2021 guaranteed by CNH Industrial N.V.), dividend payments to shareholders and common share repurchases, partially offset by an increase in third party debt of Financial Services.
In
2017
, cash used in financing activities totaled
$1,045
million, mainly attributable to lower bank debt of Industrial Activities, reduction of third-party debt due to the repurchase/early redemption of notes and dividend payments to shareholders, partially offset by new bond issuances.
Capital Resources
The cash flows, funding requirements and liquidity of CNH Industrial are managed on a standard and centralized basis. This centralized system is designed to optimize the efficiency and effectiveness of our management of capital resources.
Our subsidiaries participate in a company-wide cash management system, which we operate in a number of jurisdictions. Under this system, the cash balances of all our subsidiaries are aggregated at the end of each business day to central pooling accounts. The centralized treasury management offers financial and systems expertise in managing these accounts, as well as providing related services and consulting to our business segments.
Our policy is to keep a high degree of flexibility with our funding and investment options in order to maintain our desired level of liquidity to achieve our rating targets while improving the
Company’s
capital structure over time. In managing our liquidity requirements, we are pursuing a financing strategy that aims at extending over time our Industrial Activities debt profile by issuing long-term bonds and retiring short-term debt through opportunistic transactions, deleveraging our Industrial Activities balance sheet by reducing gross debt, and diversifying funding sources.
A summary of our strategy is set forth below:
|
•
|
To fund Industrial Activities’ short-term financing requirements and to ensure near-term liquidity, Industrial Activities will continue to sell certain of its receivables to Financial Services and rely on internal cash flows including managing working capital. We will also supplement our short-term financing by drawing on existing or new facilities with banks.
|
|
•
|
To the extent funding needs of Industrial Activities are determined to be of a longer-term nature, we will access public debt markets as well as private investors and banks, as appropriate, to refinance borrowings and replenish our liquidity.
|
53
|
•
|
Financial Services’ funding strategy is to maintain a sufficient level of liquidity and flexible access to a wide variety of financial instruments. While we expect securitizations and sale of receivables (factoring) to continue to represent a material portion of our capital structure and intersegment borrowings to remain a marginal source of funding, we will continue to diversify our funding sources and expand our investor base within Financial Services to support our investment grade credit ratings. These diversified funding sources include committed asset-backed facilities, unsecured notes, bank facilities and, in an effort to further diversify funding sources and reduce the average cost of funding, Financial Services has implemented commercial paper programs, both in the U.S. and Europe.
|
On a global level, we will continue to evaluate alternatives to ensure that Financial Services has access to capital on favorable terms to support its business, including agreements with global or regional partners, new funding arrangements or a combination of the foregoing. Our access to external sources of financing, as well as the cost of financing, is dependent on various factors, including our credit ratings.
In July 2019, Fitch Ratings (“Fitch”) improved the outlook of CNH Industrial N.V. to positive from stable. Fitch also affirmed CNH Industrial N.V.’s and CNH Industrial Capital LLC’s long-term issuer default rating at “BBB-”. Current ratings for the Company are as follows:
|
CNH Industrial N.V.
(1)
|
CNH Industrial Capital LLC
|
||||||
|
Long Term
|
Short Term
|
Outlook
|
Long Term
|
Short Term
|
Outlook
|
||
|
S&P
|
BBB
|
A-2
|
Stable
|
BBB
|
A-2
|
Stable
|
|
|
Fitch
|
BBB-
|
-
|
Positive
|
BBB-
|
F3
|
Positive
|
|
|
Moody’s
|
Baa3
|
-
|
Stable
|
Baa3
|
-
|
Stable
|
|
(1)
Includes treasury subsidiary, CNH Industrial Finance Europe S.A.
The Company’s debt is now fully investment grade, which the Company believes to permit access to funding at better rates.
A credit rating is not a recommendation to buy, sell or hold securities. Ratings may be subject to revision or withdrawal at any time by the assigning rating organization, and each rating should be evaluated independently of any other rating. A deterioration in our ratings could impair our ability to obtain debt financing and would increase the cost of such financing. Ratings are influenced by a number of factors, including, among others: financial leverage on an absolute basis or relative to peers, the composition of the balance sheet and/or capital structure, material changes in earnings trends and volatility, ability to dividend monies from subsidiaries and our competitive position. Material deterioration in any one, or a combination, of these factors could result in a downgrade of our ratings, thus increasing the cost, and limiting the availability, of financing.
Consolidated Debt
As of
December 31, 2019
, and
2018
, our consolidated Debt was as detailed in the table below:
|
Consolidated
|
Industrial Activities
|
Financial Services
|
||||||||||||||||||||||
|
2019
|
2018
|
2019
|
2018
|
2019
|
2018
|
|||||||||||||||||||
|
(in millions)
|
||||||||||||||||||||||||
|
Total Debt
|
$
|
24,854
|
|
$
|
24,445
|
|
$
|
6,558
|
|
$
|
6,347
|
|
$
|
20,748
|
|
$
|
20,436
|
|
||||||
We believe that Net Debt, defined as total debt less intersegment notes receivable, cash and cash equivalents, restricted cash, other current financial assets and derivatives hedging debt, is a useful analytical tool for measuring our effective borrowing requirements. This non-GAAP financial measure should neither be considered as a substitute for, nor superior to, measures of financial performance prepared in accordance with U.S. GAAP. In addition, this non-GAAP financial measure may not be computed in the same manner as similarly titled measures used by other companies.
We provide a separate analysis of Net Debt for Industrial Activities and Net Debt for Financial Services, to reflect the different cash flow management practices in the two activities. The separation between Industrial Activities and Financial Services represents a sub-consolidation based on the core business activities (industrial activities or financial services) of each CNH Industrial legal entity. The sub-consolidation for Industrial Activities also includes legal entities that perform centralized treasury activities, such as raising funding in the market and financing
CNH Industrial legal entities,
but do not, however, provide financing to third parties.
54
The calculation of Net Debt as of
December 31, 2019
and
2018
and the reconciliation of Net Debt to Total Debt, the U.S. GAAP financial measure that we believe to be most directly comparable, are shown below:
|
Consolidated
|
Industrial Activities
|
Financial Services
|
||||||||||||||||||||||
|
2019*
|
2018*
|
2019*
|
2018*
|
2019*
|
2018*
|
|||||||||||||||||||
|
(in millions)
|
||||||||||||||||||||||||
|
Third party debt
|
$
|
24,854
|
|
$
|
24,445
|
|
$
|
5,226
|
|
$
|
5,211
|
|
$
|
19,628
|
|
$
|
19,234
|
|
||||||
|
Intersegment notes payable **
|
—
|
|
—
|
|
1,332
|
|
1,136
|
|
1,120
|
|
1,202
|
|
||||||||||||
|
Total Debt ***
|
$
|
24,854
|
|
$
|
24,445
|
|
$
|
6,558
|
|
$
|
6,347
|
|
$
|
20,748
|
|
$
|
20,436
|
|
||||||
|
Less:
|
||||||||||||||||||||||||
|
Cash and cash equivalents
|
4,875
|
|
5,031
|
|
4,407
|
|
4,553
|
|
468
|
|
478
|
|
||||||||||||
|
Restricted cash
|
898
|
|
772
|
|
120
|
|
—
|
|
778
|
|
772
|
|
||||||||||||
|
Intersegment notes receivables **
|
—
|
|
—
|
|
1,120
|
|
1,202
|
|
1,332
|
|
1,136
|
|
||||||||||||
|
Other current financial assets
|
58
|
|
1
|
|
58
|
1
|
|
—
|
|
—
|
|
|||||||||||||
|
Derivatives hedging debt
|
(1
|
)
|
(8
|
)
|
(1
|
)
|
(8
|
)
|
—
|
|
—
|
|
||||||||||||
|
Net Debt (Cash)
|
$
|
19,024
|
|
$
|
18,649
|
|
$
|
854
|
|
$
|
599
|
|
$
|
18,170
|
|
$
|
18,050
|
|
||||||
(*) Starting from December 31, 2019, we modified the definition of Net Debt and Net Debt of Industrial Activities in
order to include Other current financial assets. As a consequence, prior periods amounts have been recast accordingly.
|
(**)
|
The net intersegment (receivable)/payable balance owed by Financial Services relating to Industrial Activities was $
(212)
million and $
66
million as of
December 31, 2019
and
2018
, respectively.
|
|
(***)
|
Total Debt of Industrial Activities includes Intersegment notes payable to Financial Services of
$1,332
million and $
1,136
million at
December 31, 2019
and
2018
, respectively. Total Debt of Financial Services includes Intersegment notes payable to Industrial Activities of
$1,120
million and
$1,202
million at
December 31, 2019
and
2018
, respectively.
|
The increase in the Net Debt position from
December 31, 2018
to
December 31, 2019
was primarily due to the increase
in the Net Debt of Industrial Activities, as a result of higher finished goods inventory due to the slowdown of industry demand in our Agriculture and Construction segments mainly in the second part of the year, a lower payables balance at the end of the year due to production cuts implemented to keep production in balance with retail performance and cash used to complete M&A transactions concluded during the course of the year.
55
The following table shows the change in Net Debt of Industrial Activities for
2019
and
2018
:
|
($ million)
|
2019
(*)
|
2018
(*)
|
||||||
|
Net Debt of Industrial Activities at beginning of year
|
$
|
(599
|
)
|
$
|
(903
|
)
|
||
|
Adjusted EBITDA of Industrial Activities
|
2,357
|
|
2,671
|
|
||||
|
Cash interest and taxes
|
(388
|
)
|
(613
|
)
|
||||
|
Changes in provisions and similar**
|
(436
|
)
|
(406
|
)
|
||||
|
Change in working capital
|
(753
|
)
|
(496
|
)
|
||||
|
Operating cash flow of Industrial Activities
|
780
|
|
1,156
|
|
||||
|
Investments in property, plant and equipment and intangible assets***
|
(633
|
)
|
(550
|
)
|
||||
|
Other changes
|
(126
|
)
|
(54
|
)
|
||||
|
Free Cash Flow of Industrial Activities
|
21
|
|
552
|
|
||||
|
Capital increases and dividends****
|
(340
|
)
|
(399
|
)
|
||||
|
Currency translation differences and other*****
|
64
|
|
151
|
|
||||
|
Change in Net Debt of Industrial Activities
|
(255
|
)
|
304
|
|
||||
|
Net Debt of Industrial Activities at end of year
|
(854
|
)
|
(599
|
)
|
||||
(*) Starting from December 31, 2019, we modified the definition of Net Debt and Net Debt of Industrial Activities in order to
include other current financial assets. As a consequence, prior periods amounts have been recast accordingly.
(**) Including other cash flow items related to operating lease and buy-back activities.
(***) Excluding assets sold under buy-back commitments and assets under operating leases.
(****) Including share buy-back transactions
(*****
) In the years ended December 31,
2019
and 2018, this item includes the charge of $27 million and $22 million, respectively,
related to the repurchase of notes.
The following table shows the change in Net cash provided by (used in) Operating Activities to Free Cash Flow of Industrial Activities for the year ended December 31, 2019 and 2018:
|
(in millions)
|
2019
(*)
|
2018
(*)
|
||||||
|
Net cash provided by (used in) Operating Activities
|
$
|
1,826
|
|
$
|
2,554
|
|
||
|
Net cash (provided by) used in Operating Activities of Financial Services
|
(869
|
)
|
(1,035
|
)
|
||||
|
Intersegment eliminations
|
384
|
|
264
|
|
||||
|
Net cash (provided by) used in Operating Activities of Industrial Activities
|
1,341
|
|
1,783
|
|
||||
|
Change in derivatives hedging debt of Industrial Activities
|
7
|
|
(2
|
)
|
||||
|
Investments in assets sold under buy-back commitments and operating lease assets of Industrial Activities
|
(568
|
)
|
(625
|
)
|
||||
|
Operating cash flow of Industrial Activities
|
780
|
|
1,156
|
|
||||
|
Investments in property plant and equipment, and intangible assets of Industrial Activities
|
(633
|
)
|
(550
|
)
|
||||
|
Other changes
(1)
|
(126
|
)
|
(54
|
)
|
||||
|
Free Cash Flow of Industrial Activities
|
$
|
21
|
|
$
|
552
|
|
||
(*) Starting from December 31, 2019, we modified the definition of Net Debt and Net Debt of Industrial Activities in order to
include other current financial assets. As a consequence, prior periods amounts have been recast accordingly.
(1) The item primarily includes change in intersegment financial recivables and capital increases in intersegment investments.
Industrial Activities
Capital Markets
At
December 31, 2019
,
we had an aggregate amount of
$
7.7
billion
in bonds outstanding, of which
$
5.1
billion
was issued by Industrial Activities.
The capital markets debt of Industrial Activities mainly related to notes issued under the Euro Medium Term Note Programme (and the notes issued under its predecessor, the Global Medium Term Notes Programme), and senior unsecured debt securities issued by CNH Industrial N.V. described below.
56
Euro Medium Term Note (EMTN) Programme
. We have a medium-term note programme allowing for the placement of debt securities that was established in February 2011 and has a total authorized amount of €10 billion ($11 billion).
At
December 31, 2019
,
€3,577
million (
$4,018
million)
was outstanding under the programme, all such debt having been issued by CNH Industrial Finance Europe S.A. and guaranteed by CNH Industrial N.V. The outstanding amount under the programme included the following notes issued in 2019: €600 million of notes, issued in March 2019, at an annual fixed rate of 1.75% due in March 2027 at an issue price of 98.597 percent of their principal amount; €500 million of notes, issued in July 2019, at an annual fixed rate of 1.625% due in July 2029 at an issue price of 98.926 percent of their principal amount; €50 million of 20-year notes, issued as a private placement in July 2019, at an annual fixed rate of 2.2% due in July 2039 at an issue price of 98.285 percent of their principal amount. In December 2019, in order to manage its liabilities, CNH Industrial Finance Europe S.A. repurchased, through a public tender, an aggregate nominal amount of €64,283,000 of the 2.875% Notes due September 27, 2021 issued under the EMTN, an aggregate nominal amount of €183,827,000 of the 1.375% Notes due May 23, 2022 issued under the EMTN and €131,452,000 of the 2.875% Notes due May 17, 2023 issued under the EMTN.
CNH Industrial N.V. Senior Notes. In the United States, CNH Industrial N.V has issued notes from time to time. In 2016, CNH Industrial N.V. issued $600 million of notes at an interest rate of 4.50% due August 2023 (the “2023 Notes”) at an issue price of 100 percent of their principal amount, and, in 2017, CNH Industrial N.V. issued $500 million of notes at an interest rate of 3.850% due November 2027 (the “2027 Notes”) at an issue price of 99.384% of their principal amount. The 2023 Notes and the 2027 Notes are collectively referred to as the “CNH Industrial N.V. Senior Notes”.
The notes issued under the EMTN (and its predecessor the Global Medium Term Notes Programme) as well as the CNH Industrial N.V. Senior Notes impose covenants and other obligations on CNH Industrial N.V. as issuer and, in certain cases, as guarantor and CNH Industrial Finance Europe S.A. as issuer, including: (i) a negative pledge provision which requires that, if any security interest over assets of the issuer or the guarantor is granted in connection with debt that is, or is capable of being, listed or any guarantee is granted in connection with such debt, such security or guarantee must be equally and ratably extended to the outstanding notes; (ii) a status (or
pari passu
) covenant, under which the notes rank and will rank
pari passu
with all other present and future outstanding unsubordinated and unsecured obligations of the issuer and/or the guarantor (subject to mandatorily preferred obligations under applicable laws); (iii) an events of default provision setting out certain customary events (such as cross defaults, insolvency related events, etc.) the occurrence of which entitles the holders of the outstanding notes to accelerate the repayment of the notes; (iv) change of control provisions which, when combined with a rating downgrade of CNH Industrial N.V., grant the note holders the right to require immediate repayment of the notes; and (v) other clauses that are generally applicable to securities of a similar type. A breach of these obligations may require the early repayment of the notes. At
December 31, 2019
, CNH Industrial was in compliance with the covenants of the notes issued under the EMTN (and its predecessor the Global Medium Term Notes Programme) and the CNH Industrial N.V. Senior Notes.
CNH Industrial intends to repay the issued bonds in cash at the due date by utilizing available liquid resources. In addition, CNH Industrial companies may from time to time buy-back their issued bonds. Such buy-backs, if made, depend upon market conditions, the financial situation of CNH Industrial and other factors which could affect such decisions.
Bank Debt
At December 31, 2019, Industrial Activities available committed unsecured facilities expiring after twelve months amounted to $5.1 billion ($2.6 billion at December 31, 2018).
Euro 4 billion Revolving Credit Facility.
In March 2019, CNH Industrial signed a five-year committed revolving credit facility for €4 billion ($4.5 billion at March 31, 2019 exchange rate) due to mature in 2024 with two extension options of 1-year each, exercisable on the first and second anniversary of the signing date.
The first 1-year option has been exercised and accepted by all lenders, the facility is now due to mature in March 2025
.
The credit facility replaces the existing five-year €1.75 billion credit facility due to mature in 2021 and includes:
|
•
|
customary covenants (including a negative pledge, a status (or
pari passu
) covenant and restrictions on the incurrence of indebtedness by certain subsidiaries);
|
|
•
|
customary events of default (some of which are subject to minimum thresholds and customary mitigants), including cross-default provisions, failure to pay amounts due or to comply with certain provisions under the loan agreement and the occurrence of certain bankruptcy-related events; and:
|
|
•
|
mandatory prepayment obligations upon a change in control of CNH Industrial or the borrower;
|
|
•
|
a financial covenant (Net debt/EBITDA ratio relating to Industrial Activities). Such covenant is not applicable with the current ratings levels.
|
CNH Industrial N.V. has guaranteed any borrowings under the revolving credit facility with cross-guarantees from each of the borrowers (
i.e.
, CNH Industrial Finance S.p.A., CNH Industrial Finance Europe S.A. and CNH Industrial Finance North America Inc.). At
December 31, 2019
, CNH Industrial was in compliance with the covenants of the Revolving Credit Facility.
57
Financial Services
Total Debt of Financial Services was
$20.7
billion at
December 31, 2019
, compared to
$20.4
billion at
December 31, 2018
.
Bank Debt
At December 31, 2019, Financial Services' available committed, unsecured facilities expiring after twelve months amounted to $0.4 billion ($0.5 billion at December 31, 2018).
Asset-Backed Financing
At December 31, 2019, Financial Services’ committed, asset-backed facilities expiring after twelve months amounted to $4.1 billion ($3.9 billion at December 31, 2018), of which $3.0 billion was utilized at December 31, 2019 ($3.0 billion at December 31, 2018).
We sell certain of our finance receivables to third parties in order to improve liquidity, to take advantage of market opportunities and, in certain circumstances, to reduce credit and concentration risk in accordance with our risk management objectives.
The sale of financial receivables is executed primarily through ABS transactions and involves mainly accounts receivable from final (retail) customers and from the network of dealers (wholesale) to our Financial Services subsidiaries.
At December 31, 2019, our receivables from financing activities included receivables sold and financed through both ABS and factoring transactions of $13.6 billion ($13.4 billion at December 31, 2018), which do not meet derecognition requirements and therefore must be recorded on our consolidated statement of financial position. These receivables are recognized as such in our financial statements even though they have been legally sold; a corresponding financial liability is recorded in the consolidated statement of financial position as debt
(see "Note 4: Receivables").
Capital Markets
In December 2019, CNH Industrial Capital Australia Pty. Limited issued AUD175 million of notes at an annual fixed rate of 2.1% due in 2022 at an issue price of 99.899 percent of their principal amount.
CNH Industrial Capital Australia Pty. Limited benefits from a support agreement issued by CNH Industrial N.V., the content of which is in line with the support agreement issued in the interest of CNH Industrial Capital LLC as described in paragraph “Support Agreement in the Interest of CNH Industrial Capital LLC” below.
Commercial Paper Programmes
With the purpose of further diversifying Financial Services’ funding structure, CNH Industrial Capital LLC has established a commercial paper program in the U.S. This program had an outstanding amount of $387
million at December 31, 2019. CNH Industrial Financial Services S.A. in Europe issues commercial paper under a program which had an outstanding amount of $105 million at December 31, 2019.
Support Agreement in the Interest of CNH Industrial Capital LLC
CNH Industrial Capital LLC benefits from a support agreement issued by CNH Industrial N.V., pursuant to which CNH Industrial N.V. agrees to, among other things, (a) make cash capital contributions to CNH Industrial Capital LLC, to the extent necessary to cause its ratio of net earnings available for fixed charges to fixed charges to be not less than 1.05:1.0 for each fiscal quarter (with such ratio determined, on a consolidated basis and in accordance with U.S. GAAP, for such fiscal quarter and the immediately preceding three fiscal quarters taken as a whole), (b) generally maintain an ownership of at least 51% of the voting equity interests in CNH Industrial Capital LLC and (c) cause CNH Industrial Capital LLC to have, as of the end of any fiscal quarter, a consolidated tangible net worth of at least $50 million. The support agreement is not intended to be, and is not, a guarantee by CNH Industrial N.V. of the indebtedness or other obligations of CNH Industrial Capital LLC. The obligations of CNH Industrial N.V. to CNH Industrial Capital LLC pursuant to this support agreement are to the company only and do not run to, and are not enforceable directly by, any creditor of CNH Industrial Capital LLC, including holders of the CNH Industrial Capital LLC’s notes or the trustee under the indenture governing the notes. The support agreement may be modified, amended or terminated, at CNH Industrial N.V.’s election, upon thirty days’ prior written notice to CNH Industrial Capital LLC and the rating agencies of CNH Industrial Capital LLC, if (a) the modification, amendment or termination would not result in a downgrade of CNH Industrial Capital LLC rated indebtedness; (b) the modification, amendment or notice of termination provides that the support agreement will continue in effect with respect to the company’s rated indebtedness then outstanding; or (c) CNH Industrial Capital LLC has no long-term rated indebtedness outstanding.
For more information on our outstanding indebtedness, see “Note 10: Debt” to our consolidated financial statements for the year ended
December 31, 2019
.
58
Future Liquidity
We have adopted formal policies and decision-making processes designed to optimize the allocation of funds, cash management processes and financial risk management. Our liquidity needs could increase in the event of an extended economic slowdown or recession that would reduce our cash flow from operations and impair the ability of our dealers and retail customers to meet their payment obligations. Any reduction of our credit ratings would increase our cost of funding and potentially limit our access to the capital markets and other sources of financing.
We believe that funds available under our current liquidity facilities, those realized under existing and planned asset-backed securitization programs and issuances of debt securities and those expected from ordinary course refinancing of existing credit facilities, together with cash provided by operating activities, will allow us to satisfy our debt service requirements for the coming year. At December 31, 2019,
we had
available committed, unsecured facilities expiring after twelve months of $5.5 billion ($3.1 billion at December 31, 2018).
Financial Services securitized debt is repaid with the cash generated by the underlying amortizing receivables. Accordingly, additional liquidity is not normally necessary for the repayment of such debt. Financial Services has traditionally relied upon the term ABS market and committed asset-backed facilities as a primary source of funding and liquidity. At December 31, 2019, Financial Services’ committed asset-backed facilities expiring after twelve months amounted to $4.1 billion ($3.9 billion at December 31, 2018), of which $3.0 billion at December 31, 2019 ($3.0 billion at December 31, 2018) were utilized.
If Financial Services were unable to obtain ABS funding at competitive rates, its ability to conduct its financial services activities would be limited.
Pension and Other Postemployment Benefits
Pension Plans
Pension plan obligations primarily comprise the obligations of our pension plans in the United States, the U.K. and Germany.
Under these plans, contributions are made to a separate fund (trust) which independently administers the plan assets. Our funding policy is to contribute amounts to the plan equal to the amounts required to satisfy the minimum funding requirements pursuant to the laws of the applicable jurisdictions. The significant pension plans that we are required to fund are in the United Sates and the U.K. In addition, we make discretionary contributions in addition to the funding requirements. To the extent that a fund is overfunded, we are not required to make further contributions to the plan in respect of minimum performance requirements so long as the fund is in surplus.
The investment strategy for the plan assets depends on the features of the plan and on the maturity of the obligations. Typically, less mature plan benefit obligations are funded by using more equity securities as they are expected to achieve long-term growth exceeding inflation. More mature plan benefit obligations are funded using more fixed income securities as they are expected to produce current income with limited volatility. Risk management practices include the use of multiple asset classes and investment managers within each asset class for diversification purposes. Specific guidelines for each asset class and investment manager are implemented and monitored.
At
December 31, 2019
and
2018
, the difference between the present value of the pension plan obligations and the fair value of the related plan assets was a
deficit
of $
842
million and $
748
million, respectively. In
2019
, we contributed $
53
million to the plan assets and made direct benefit payments of $26 million for our pension plans. Our expected total contribution to pension plan assets and direct benefit payments is estimated to be $65 million for 2020.
Healthcare Plans
Healthcare postretirement benefit plan obligations comprise obligations for healthcare and insurance plans granted to our employees working in the United States and Canada. These plans generally cover employees retiring on or after reaching the age of 55 who have completed at least 10 years of employment. United States salaried and non-represented hourly employees and Canadian employees hired after January 1, 2001 and January 1, 2002, respectively, are not eligible for postretirement healthcare and life insurance benefits under our plans. These plans are not required to be funded. Beginning in 2007, we made contributions on a voluntary basis to a separate and independently managed fund established to finance the North America healthcare plans.
At
December 31, 2019
and
2018
, the difference between the present value of the healthcare plan obligations and the fair value of the related plan assets was a deficit of $
260
million and $
293
million, respectively. In
2019
, we did not contribute to the plan assets and made direct benefit payments for healthcare plans of $15 million and we expect to make direct benefit payments of $21 million in 2020.
59
Other Postemployment Benefits
Other postemployment benefits consist of benefits for Italian Employee Leaving Entitlements up to December 31, 2006, loyalty bonus in Italy and various other similar plans in France, Germany and Belgium. Until December 31, 2006, Italian companies with more than 50 employees were required to accrue for benefits paid to employees upon them leaving the company. The scheme has since changed to a defined contribution plan. The obligation on our consolidated balance sheet represents the residual reserve for years until December 31, 2006. Loyalty bonuses are accrued for employees who have reached certain service seniority and are generally settled when employees leave the company. These plans are not required to be funded and, therefore, have no plan assets.
At
December 31, 2019
and
2018
, the present value of the obligation for other postemployment benefits amounted to $
431
million and $
422
million, respectively.
In
2019
, we made direct benefit payments of $37 million for other postemployment benefits and expect to make direct benefit payments of $31 million in 2020.
For further information on pension and other postemployment benefits, see “Note 12: Employee Benefit Plans and Postretirement Benefits” to our consolidated financial statements for the year ended
December 31, 2019
.
C.
Research and Development, Patents and Licenses, etc.
Our research, development and engineering personnel design, engineer, manufacture and test new products, components, and systems.
In a continuously and rapidly changing competitive environment, our research and development activities are a vital component in our strategic development. Our research and development activities are designed to accelerate time-to-market while taking advantage of specialization and experience in different markets.
R&D activities involved approximately 5,700 employees at 56 sites around the world during
2019
.
We own a significant number of patents, trade secrets, licenses and trademarks related to our products and services, and that number is expected to grow as our R&D activities continue. At
December 31, 2019
, we had 11,984 active granted patents, including 1,765 new patents registered during the year (in addition to 4,402 pending applications). We file patent applications in Europe, the U.S. and in other jurisdictions around the world to protect technology and improvements considered important to the business. Certain trademarks contribute to our identity and the recognition of our products and services and are an integral part of our business, and their loss could have a material adverse effect on us.
Agriculture
—We are marketing the New Holland, Case IH, STEYR and Miller brands and logos as the primary brand names for our agriculture products.
Construction
—For construction equipment under New Holland, we are marketing the New Holland Construction brand name and trademark. For construction equipment under CASE, we are promoting the CASE Construction brand name and trademark.
Commercial and Specialty Vehicles
—We are marketing a range of commercial vehicles under the IVECO brand, buses under the IVECO BUS and Heuliez Bus brands, and firefighting and special purpose vehicles under the Magirus, IVECO ASTRA and Iveco Defence Vehicles brands.
Powertrain
—We are marketing engines and transmissions for commercial and specialty vehicles, agriculture equipment, construction equipment, and for marine and other industrial applications under the FPT Industrial brand.
D.
Trend Information
See “Item 5. Operating and Financial Review and Prospects—A. Operating Results” and “Item 5. Operating and Financial Review and Prospects—B. Liquidity and Capital Resources.”
E.
Off-Balance Sheet Arrangements
We use certain off-balance sheet arrangements with unconsolidated third parties in the ordinary course of business, including financial guarantees. Our arrangements are described in more detail below.
For additional information, see “Note 14: Commitments and Contingencies” to our consolidated financial statements for the year ended
December 31, 2019
.
Financial Guarantees
Our financial guarantees require us to make contingent payments upon the occurrence of certain events or changes in an underlying instrument that is related to an asset, a liability or the equity of the guaranteed party. These guarantees include arrangements that are
60
direct obligations, giving the party receiving the guarantee a direct claim against us, as well as indirect obligations, under which we have agreed to provide the funds necessary for another party to satisfy an obligation.
CNH Industrial provided guarantees on the debt or commitments of third parties and performance guarantees in the interest of non-consolidated affiliates totaling
$453
million as of
December 31, 2019
.
F.
Tabular Disclosure of Contractual Obligations
The following table sets forth our contractual obligations and commercial commitments with definitive payment terms that will require significant cash outlays in the future, as of
December 31, 2019
:
|
Total
|
Less than
1 Year
|
1-3 Years
|
3-5 Years
|
After 5
Years
|
||||||||||||||||
|
(in millions)
|
||||||||||||||||||||
|
Contractual Obligations
|
||||||||||||||||||||
|
Debt obligations
(1)
|
||||||||||||||||||||
|
Bonds
|
$
|
7,710
|
|
$
|
571
|
|
$
|
2,375
|
|
$
|
1,512
|
|
$
|
3,252
|
|
|||||
|
Borrowings from banks
|
4,050
|
|
2,368
|
|
1,162
|
|
404
|
|
116
|
|
||||||||||
|
Asset-backed financing
|
11,757
|
|
6,572
|
|
4,227
|
|
893
|
|
65
|
|
||||||||||
|
Other debt
|
1,337
|
|
962
|
|
250
|
|
121
|
|
4
|
|
||||||||||
|
Operating lease obligations
|
508
|
|
126
|
|
166
|
|
91
|
|
125
|
|
||||||||||
|
Purchase obligations
|
1,590
|
|
747
|
|
653
|
|
181
|
|
9
|
|
||||||||||
|
Total
|
$
|
26,952
|
|
$
|
11,346
|
|
$
|
8,833
|
|
$
|
3,202
|
|
$
|
3,571
|
|
|||||
|
(1)
|
Amounts presented exclude the related interest expense that will be paid when due. The table above does not include obligations for pensions, post-retirement benefits and health care plans. Our best estimate of expected contributions including direct benefit payment to be made by us in 2020 to pension plans, healthcare plans and other postemployment plans is $65 million, $21 million and $31 million, respectively. Potential outflows in the years after 2020 are subject to a number of uncertainties, including future asset performance and changes in assumptions, and therefore we are unable to make sufficiently reliable estimates of future contributions beyond 2020.
|
Debt Obligations
For information on our debt obligations, see “Capital Resources” above and “Note 10: Debt” to our consolidated financial statements for the year ended
December 31, 2019
. The amount reported as debt obligations in the table above consists of our bonds, borrowings from banks, asset-backed financing and other debt which reconciles in total to the amount in the December 31, 2019 consolidated balance sheet.
Operating Lease Obligations
Our operating leases consist mainly of leases for commercial and industrial properties used in carrying out our businesses. The amounts reported above under “Operating Lease Obligations” include the minimal rental and payment commitments due under such leases.
Purchase Obligations
Our purchase obligations at
December 31, 2019
, included the following:
|
•
|
the repurchase price guaranteed to certain customers on sales with a buy-back commitment which is included in the line item “Other liabilities” in our consolidated balance sheets in an aggregate amount of
$1,472
million; and
|
|
•
|
commitments to purchase tangible fixed assets, largely in connection with planned capital expenditures, in an aggregate amount of approximately $118 million.
|
G.
Safe Harbor Statement under the Private Securities Litigation Reform Act of 1995
This Annual Report includes "forward-looking statements" within the meaning of the Private Securities Litigation Reform Act of 1995 and Section 21E of the Securities Exchange Act of 1934.
All statements other than statements of historical fact contained in this filing, including statements regarding our competitive strengths; business strategy; future financial position or operating results; budgets; projections with respect to revenue, income, earnings (or loss) per share, capital expenditures, dividends, capital structure
61
or other financial items; costs; and plans and objectives of management regarding operations and products, are forward-looking statements. These statements may include terminology such as “may”, “will”, “expect”, “could”, “should”, “intend”, “estimate”, “anticipate”, “believe”, “outlook”, “continue”, “remain”, “on track”, “design”, “target”, “objective”, “goal”, “forecast”, “projection”, “prospects”, “plan”, or similar terminology. Forward-looking statements are not guarantees of future performance. Rather, they are based on current views and assumptions and involve known and unknown risks, uncertainties and other factors, many of which are outside our control and are difficult to predict. If any of these risks and uncertainties materialize or other assumptions underlying any of the forward-looking statements prove to be incorrect, the actual results or developments may differ materially from any future results or developments expressed or implied by the forward-looking statements.
Factors, risks and uncertainties that could cause actual results to differ materially from those contemplated by the forward-looking statements include, among others: the many interrelated factors that affect consumer confidence and worldwide demand for capital goods and capital goods-related products; general economic conditions in each of our markets; changes in government policies regarding banking, monetary and fiscal policy; legislation, particularly relating to capital goods-related issues such as agriculture, the environment, debt relief and subsidy program policies, trade and commerce and infrastructure development; government policies on international trade and investment, including sanctions, import quotas, capital controls and tariffs; volatility in international trade caused by the imposition of tariffs, sanctions, trade wars; actions of competitors in the various industries in which we compete; development and use of new technologies and technological difficulties; the interpretation of, or adoption of new, compliance requirements with respect to engine emissions, safety or other aspects of our products; production difficulties, including capacity and supply constraints and excess inventory levels; labor relations; interest rates and currency exchange rates; inflation and deflation; energy prices; prices for agricultural commodities; housing starts and other construction activity; our ability to obtain financing or to refinance existing debt; a decline in the price of used vehicles; the resolution of pending litigation and investigations on a wide range of topics, including dealer and supplier litigation, follow-on private litigation in various jurisdictions after the settlement of the EU antitrust investigation announced on July 19, 2016, intellectual property rights disputes, product warranty and defective product claims, and emissions and/or fuel economy regulatory and contractual issues; the Company’s pension plans and other post-employment obligations; political and civil unrest; volatility and deterioration of capital and financial markets, including possible effects of “Brexit”, pandemics, terror attacks in Europe and elsewhere; our ability to achieve the targets set out in the Strategic Business Plan announced on September 3, 2019 at our Capital Markets Day event; our ability to successfully implement the planned spin-off of the Company's On-Highway business; and other similar risks and uncertainties and our success in managing the risks involved in the foregoing.
Forward-looking statements are based upon assumptions relating to the factors described in this filing, which are sometimes based upon estimates and data received from third parties. Such estimates and data are often revised. Our actual results could differ materially from those anticipated in such forward-looking statements. Forward-looking statements speak only as of the date on which such statements are made, and we undertake no obligation to update or revise publicly our forward-looking statements.
Additional factors which could cause actual results and developments to differ from those expressed or implied by the forward-looking statements are included in the section “Risk Factors” of this Annual Report.
62
A
.
Directors and Senior Management
The Board of Directors consists of nine directors. All directors were elected on April 12, 2019 at the Annual General Meeting of Shareholders (“AGM”). The term of office of the current Board of Directors expires on April 16, 2020 (the scheduled date of the next AGM) at which time our shareholders will elect a new Board of Directors for a term of approximately one year.
As of March 3, 2020, our directors and certain senior managers are as set forth below:
|
Name
|
Position with CNH Industrial
|
|
|
Jacqueline Tammenoms Bakker
|
Director, Member of the Governance and Sustainability Committee, Member of the
Compensation Committee |
|
|
Suzanne Heywood
|
Executive Director, Chairperson
|
|
|
Léo W. Houle
|
Senior Non-Executive Director, Chairperson of the Compensation Committee, Member of the Governance and Sustainability Committee
|
|
|
John Lanaway
|
Director, Member of the Audit Committee
|
|
|
Hubertus Mühlhäuser
|
Executive Director, Chief Executive Officer
|
|
|
Alessandro Nasi
|
Director, Chairperson of the Governance and Sustainability Committee, Member of the Compensation Committee
|
|
|
Silke Christina Scheiber
|
Director, Member of the Audit Committee
|
|
|
Lorenzo Simonelli
|
Director, Member of the Audit Committee
|
|
|
Jacques Theurillat
|
Director, Chairperson of the Audit Committee
|
|
|
Luc Billiet
|
General Manager, Aftermarket Solutions
|
|
|
Massimiliano Chiara
|
Chief Financial Officer and Chief Sustainability Officer
|
|
|
Vilmar Fistarol
|
General Manager, South America
|
|
|
Oddone Incisa
|
President, Financial Services
|
|
|
Jay Iyengar
|
Chief Technology Officer
|
|
|
Gerrit Marx
|
President, Commercial and Specialty Vehicles
|
|
|
Derek Neilson
|
President, Agriculture
|
|
|
Stefano Pampalone
|
President, Construction; General Manager, Asia, Middle East and Africa
|
|
|
Annalisa Stupenengo
|
President, Powertrain
|
|
|
Tom Verbaeten
|
Chief Supply Chain Officer
|
|
|
Andreas Weishaar
|
Chief Strategy, Talent, ICT and Digital Officer
|
|
|
•
|
Jacqueline A. Tammenoms Bakker,
Director (Non-Executive Director—independent), Member of the Governance and Sustainability Committee, Member of the Compensation Committee,
|
Jacqueline A. Tammenoms Bakker was a Director of Fiat Industrial S.p.A. from April 5, 2012 until the merger of the company into CNH Industrial. Jacqueline A. Tammenoms Bakker studied at Oxford University (BA) and the Johns Hopkins School for Advanced International Studies in Washington D.C. (MA). She joined Shell International in 1977 holding a number of positions in the Netherlands, the U.K. and Turkey. In 1989, she joined McKinsey where she worked as a consultant in the U.K. and the Netherlands until 1995 when she was appointed Vice-President Food Europe at Quest International (Unilever) in the Netherlands. In 1999, she moved to the public sector in the Netherlands, firstly as Director of GigaPort (a public-private initiative to roll out broadband networks), and then as Director-General of Freight Transport (2001-2004) and Director-General of Civil Aviation and Freight Transport (2004-2007) at the Dutch Ministry of Transport. In 2006, she was awarded the Légion d’Honneur for her contribution to cooperation between the Netherlands and France, and in 2006/2007 she chaired the High Level Group on the regulatory framework for civil aviation reporting to the EU Commissioner for Transport. Since 2008 Ms. Tammenoms Bakker has been an independent Board member; she is currently a Board member of TomTom (NL), Boskalis (NL), Unibail Rodamco (FR), Groupe Wendel (FR) and Chairman of the Van Leer Group Foundation (NL). Previously she was a Board member of Vivendi (FR) (2010-2014) and Tesco PLC (U.K.) (2009-2015). Born in 1953, Dutch citizenship. Date of first appointment: September 29, 2013.
63
|
•
|
Suzanne Heywood,
Chairperson
(Executive-Director)
|
Suzanne
Heywood was appointed Chair of CNH Industrial N.V., in July 2018. Lady Heywood became a Managing Director of EXOR in 2016. Prior to that she worked at McKinsey & Company which she joined as an associate in 1997 and left as a Senior Partner (Director) in 2016. Suzanne co-led McKinsey’s global service line on organization design for several years and also worked extensively on strategic issues with clients across different sectors. She has published a book, “Reorg,” and multiple articles on these topics and has also acted as a visiting lecturer at Tsinghua University in Beijing. Suzanne started her career in the U.K. Government as a Civil Servant in the U.K. Treasury. At the Treasury, she worked as Private Secretary to the Financial Secretary (who is responsible for all direct taxation issues) as well as leading thinking on the Government’s privatization policy and supporting the Chancellor in his negotiations at ECOFIN (the meeting of European Finance Ministers) in Brussels. Prior to that she studied science at Oxford University (BA) and then at Cambridge University (PhD). Lady Heywood is also a Board Member of The Economist (where she is an Audit Committee member), a non-executive director of Chanel, a director of the Royal Opera House (where she is the Acting Chair) and of the Royal Academy of Arts Trust. She grew up sailing around the world for ten years on a yacht with her family recreating Captain James Cook’s third voyage around the world. Born in 1969, British citizenship. Date of first appointment: April 15, 2016.
|
•
|
Léo W. Houle
, Director (Senior Non-Executive Director—independent), Chairperson of the Compensation Committee, Member of the Governance and Sustainability Committee
|
Mr. Houle was a Director of CNH Global N.V. from April 7, 2006 until the merger of the company into CNH Industrial. On September 6, 2011, Mr. Houle was appointed to the Board of Directors of Chrysler Group LLC now known as FCA US LLC until June 2016 when all public debt of the company was repaid and its public listing ceased. Mr. Houle was Chief Talent Officer of BCE Inc. and Bell Canada, Canada’s largest communications company, from June 2001 until his retirement in July 2008. Prior to joining BCE and Bell Canada, Mr. Houle was Senior Vice-President, Corporate Human Resources of Algroup Ltd., a Swiss-based diversified industrial company. From 1966 to 1987, Mr. Houle held various managerial positions with the Bank of Montreal, the last of which was Senior Manager, Human Resources, Administration Centers. In 1987, Mr. Houle joined the Lawson Mardon Group Limited and served as Group Vice-President, Human Resources until 1994 when Algroup Ltd. acquired Lawson Mardon Group at which time he was appointed Head of Human Resources for the packaging division of Algroup and in 1997 Head of Corporate Human Resources of Algroup, Ltd. Mr. Houle completed his studies at the College Saint Jean in Edmonton, attended the Executive Development Program in Human Resources at the University of Western Ontario in 1987 and holds the designation of Certified Human Resources Professional (CHRP) from the Province of Ontario. Born in 1947, Canadian citizenship. Date of first appointment: September 29, 2013.
|
•
|
John Lanaway
, Director (Non-Executive Director—independent), Member of the Audit Committee
|
Mr. Lanaway was elected a director of CNH Industrial N.V. in September 2013. Mr. Lanaway previously served as a director of CNH Global N.V. from 2006 to 2013. On September 6, 2011, Mr. Lanaway was appointed to the Board of Directors of Chrysler Group LLC now known as FCA US LLC until June 2016 when all public debt of the company was repaid and its public listing ceased. His work and academic background includes: 2011–Present, independent consultant; 2007-2011, Executive Vice President and Chief Financial Officer, North America at McCann Erickson; 2001-2007, various positions of increasing responsibility at Ogilvy North America, finally as Senior Vice President and Chief Financial Officer; 1999-2001, Chief Financial Officer and Senior Vice President at Geac Computer Corporation Limited; 1997-1999, Chief Financial Officer at Algorithmics Incorporated; 1995-1997, Senior Vice President and Chief Financial Officer at Spar Aerospace; 1993-1994, Sector Vice President, Labels North America at Lawson Mardon Group Limited; 1989-1993, Group Vice President and Chief Financial Officer at Lawson Mardon Group Limited; 1988-1989, General Manager at Lawson Mardon Graphics; 1985-1988, Vice President, Financial Reporting and Control at Lawson Mardon Group Limited; 1980-1985, Client Service Partner at Deloitte; and 1971-1980 Student-Staff Accountant-Supervisor-Manager at Deloitte. Mr. Lanaway graduated from the Institute of Chartered Accountants of Ontario, C.A. and has a Bachelor of Arts degree from the University of Toronto. Born in 1950, American, Canadian and British citizenship. Date of first appointment: September 29, 2013.
|
•
|
Alessandro Nasi,
Director (Non-Executive Director), Chairperson of the Governance and Sustainability Committee, Member of the Compensation Committee
|
Mr. Nasi was elected a Director of CNH Industrial N.V. in April 2019. Mr. Nasi started his career as a financial analyst in several banks, gaining experience at Europlus Asset Management, a division of Unicredit in Dublin, Ireland, PricewaterhouseCoopers in Turin, Italy, Merrill Lynch and JP Morgan in New York, U.S.A. He also worked as an Associate in the Private Equity Division of JP Morgan Partners in New York, USA. Mr. Nasi joined the Fiat Group in 2005 as manager of Corporate and Business Development, heading the APAC division and supporting Fiat Group sectors in Asia Pacific. In 2007, Mr. Nasi was appointed Vice President of Business Development and a member of the Steering Committee of Fiat Powertrain Technologies. In 2008, he joined CNH in the role of Senior Vice President of Business Development and from
64
2009 to 2011 he also served as Senior Vice President of Network Development. In January 2011, he was also appointed Secretary of the Industrial Executive Council of Fiat Industrial, continuing in the role of Executive Coordinator to the successor Group Executive Council of CNH Industrial until January 2019. In 2013 he was appointed President Specialty Vehicles, a role he held until January 2019. Mr. Nasi is a Director of Giovanni Agnelli B.V. and Vice Chairman of the
Board of Directors of EXOR N.V.
Since November 2019, he has been a member of the Advisory Board of the Lego Brand Group.
Mr. Nasi obtained a degree in Economics from the University of Turin. Born in 1974, Italian citizenship. Date of first appointment: April 12, 2019
.
|
•
|
Hubertus M. Mühlhäuser,
Chief Executive Officer (Executive-Director)
|
H
ubertus M. Mühlhäuser is the Chief Executive Officer of CNH Industrial N.V. since September 2018. Mr. Mühlhäuser brings extensive leadership experience at multinational industrial companies and a deep knowledge of the agricultural and construction sector, as well as strategic expertise. Prior to joining CNH Industrial, he was appointed President, CEO and Director of Welbilt Inc., a leading manufacturer of food service equipment, in 2015. Before joining Welbilt Inc., he dedicated two years to his family business, the tunneling specialist Mühlhäuser Holding Ltd., which he successfully restructured. From 2006 to 2013 he held positions of increasing importance at AGCO Corporation, a global agricultural equipment manufacturer. Initially Hubertus was the Senior Vice President of Strategy and Integration and was subsequently appointed Senior Vice President of AGCO’s global engine division. In 2009, he assumed the role of Senior Vice President Eastern Europe and Asia, and in 2012 became Head of Europe, Middle East and Africa, AGCO’s largest business region. Hubertus M. Mühlhäuser started his career at Arthur D. Little in Zurich, Switzerland in 1994, where he was appointed Global Head of the Strategy & Organization practice in 2000. He was also a member of the Global Executive Team. Mr. Mühlhäuser, who is fluent in four languages, holds an MBA from the European Business School of Wiesbaden and Oestrich-Winkel. He serves on the Board of Cormoran de Bilbao SL, of Bilbao, Spain and is also a Member of the Board of the National Association of Manufacturers (NAM), Washington D.C., U.S.A., a member of the Business Roundtable and serves on the Board of Trustees of the University of Tampa, Florida, U.S.A. Born in 1969, German and Swiss citizenship. Date of first appointment: November 29, 2018
.
|
•
|
Silke C. Scheiber
,
Director (Non-Executive Director—independent), Member of the Audit Committee
|
Silke C. Scheiber was at Kohlberg Kravis Roberts & Co. LLP, London, U.K. (“KKR”) from July 1999 to December 2015. She was a Member and Head of the European Industrials Group, responsible for identifying and executing a number of investment opportunities within the broader industrials space for KKR’s European private equity funds. From 1996 to 1999, Ms. Scheiber worked as a financial analyst at Goldman, Sachs & Company oHG, Frankfurt, Germany. Ms. Scheiber obtained her M.B.A. from the University of St. Gallen in St. Gallen, Switzerland, majoring in Finance and Accounting. Ms. Scheiber also attended the Ecole des Hautes Etudes Commerciales (HEC) in Paris, France where she majored in European Management and International Business Studies. Born in 1973, Austrian citizenship. Date of first appointment: April 15, 2016.
|
•
|
Lorenzo Simonelli
, Director (Non-Executive Director—independent), Member of the Audit Committee
|
Lorenzo Simonelli was appointed Director of CNH Industrial in April 2019. He is the Chairman, President and CEO of Baker Hughes, an energy technology company that combines innovation, expertise and scale to provide solutions for energy and industrial customers worldwide. In October 2017 he was named Chairman of the Board of Baker Hughes, and has been President and CEO since the Company’s creation in 2017, where he oversaw the successful merger of GE Oil & Gas with Baker Hughes Inc. In 2013 he was appointed President and CEO of GE Oil & Gas. Previously, Mr. Simonelli served as President and CEO of GE Transportation, a global transportation leader in the rail, mining, marine and energy storage industries. During the five year tenure, he expanded and diversified GE Transportation by focusing on advanced technology manufacturing, intelligent control systems and a diverse approach to new propulsion solutions. He served as Chief Financial Officer for the Americas for GE Consumer & Industrial, as well as General Manager, Product Management for GE Appliances, Lighting, Electrical Distribution and Motors. Lorenzo Simonelli joined GE’s Financial Management Program in 1994, where he worked on assignments in GE International, GE Shared Services, GE Oil & Gas and Consolidated Financial Insurance. Mr. Simonelli currently serves on the board of c3.ai. He graduated in Business & Economics from Cardiff University, Wales and received a master’s degree honoris causa in Chemical Sciences from the University of Florence, Italy. Born in 1973, Italian, Swiss and British citizenship. Date of first appointment: April 12, 2019
.
|
•
|
Jacques Theurillat,
Director (Non-Executive Director—independent), Chairperson of the Audit Committee
|
Jacques Theurillat is a member of the Boards of Vifor Pharma AG, Mundipharma Ltd., CNH Industrial N.V. and ADC Therapeutics S.A. He is a Partner at Sofinnova Crossover Fund, an investment fund focused on life sciences. From April 2008 to August 2015, Mr. Theurillat served as CEO of Ares Life Sciences AG, a privately- owned investment fund with the objective to build and manage a portfolio of companies in life sciences. From March 2007 to March 2008, he has served as CEO and Chairman of Albea Pharmaceuticals AG, a Swiss company involved in venture financing for life sciences companies. Mr.
65
Theurillat served as Serono’s SA Deputy CEO until December 2006. In addition to his role as Deputy CEO, he was appointed Senior Executive Vice President, Strategic Corporate Development in May 2006 and was responsible for developing Serono’s global strategy and pursuing its acquisition and in-licensing initiatives. From 2002 to 2006, Mr. Theurillat served as Serono’s President of European and International Sales & Marketing. In this position, he was responsible for Serono’s commercial operations in Europe, IBO, Asia-Pacific, Oceania/Japan, Latin America and Canada. He became a Board member in May 2000. From 1996 to 2002, Mr. Theurillat was Chief Financial Officer. He previously served as Managing Director of the Istituto Farmacologico Serono in Rome, where he started in 1994. In 1993, he was appointed Vice President Taxes and Financial Planning for Serono. In 1990-1993, Mr. Theurillat worked outside Serono, running his own law and tax firm. Before that, he was Serono’s Corporate Tax Director, a post to which he was appointed in 1988. He first joined Serono in 1987 as a Corporate Lawyer working on projects such as the company’s initial public offering. Mr. Theurillat is a Swiss barrister and holds Bachelor of Law degrees from both Madrid University and Geneva University. He also holds a Swiss Federal Diploma (Tax Expert) and has a Master’s degree in Finance. Born in 1959, Swiss citizenship. Date of first appointment: September 29, 2013.
|
•
|
Jay Iyengar, Chief Technology Officer
|
Jayanthi (Jay) Iyengar assumed the role of Chief Technology Officer in November 2019. She has over 30 years of international technology experience in the automotive, aerospace and advanced water technology fields, much of which she gained through roles of increasing importance with Fiat Chrysler Automobiles, Eaton Aerospace and Xylem Inc. After starting her career in product development for Delphi/General Motors in 1988, Ms. Iyengar joined Chrysler in 1997 as a Powertrain Systems Engineer. This was followed by a series of roles of increasing importance in its powertrain division, and in 2005 was named Senior Manager and Chief Engineer of Fiat Chrysler Automobiles' (FCA) Hybrid Development Center. From 2009-2012 Ms. Iyengar served as Global Director, Electrified Powertrains for FCA. In 2012 she joined Eaton Aerospace as Group Vice President Engineering and Technology, and from 2015-2019 she was the Senior Vice President, Chief Innovation and Technology Officer of Xylem Inc., a leading water technology company. Jay Iyengar holds a Bachelor's degree in Mechanical Engineering from Mysore University, Karnataka, India, a Master's degree MTech in Mechanical Engineering from the Indian Institute of Technology, Mumbai, India, as well as a Master of Science in Mechanical Engineering from Wayne State University, Michigan, USA. She has also served on the board of the Institute of Electrical & Electronics Engineers (IEEE) Vehicular Technology Society and is a current board member of Engineering Tomorrow, a non-profit focused on promoting STEM education for underprivileged minority high school students.
|
•
|
Luc Billiet, General Manager Aftermarket Solutions
|
Luc Billiet assumed the role of General Manager Aftermarket Solutions in January 2019. Mr. Billiet began his career with Volkswagen in Brussels, Belgium, where he spent 19 years in many positions related to Supply Chain. During this period, he had the opportunity to work for four years in Germany and for six years in Brazil. His last role in Brazil, before moving to Fiat in Italy, was as Managing Director Volkswagen Parts and Accessories South LATAM. In 2005, Mr. Billiet joined Fiat with responsibility for Logistics for the Car and Light Commercial and Specialty Vehicles sector. Three years later he joined CNH, where he served as Head of Supply Chain Management and after two years, Head of Precision Solutions & Telematics, Training Services and Network Development. He moved to FCA (Fiat Chrysler Automobiles) in 2013 as Head of Supply Chain for the EMEA region, a role he also held for the LATAM region from 2014. In February 2015, Mr. Billiet was appointed President of CNH Industrial’s Precision Solutions & Telematics organization, a position he held until July 2016, he also served as President, Parts and Service for CNH Industrial from 2015 - 2018. Luc Billiet was born in Belgium and holds a degree in Business Administration from the Catholic University of Leuven, Belgium.
|
•
|
Massimiliano (Max) Chiara, Chief Financial Officer and Chief Sustainability Officer
|
Massimiliano (Max) Chiara was appointed Chief Financial Officer of CNH Industrial N.V. in August 2013 and assumed the role of Chief Sustainability Officer in June 2016. In December 2017, the CFO role was expanded to include Business Development (now renamed M&A). He previously served as Chief Financial Officer and Head of Business Development for Fiat Chrysler in Latin America since January 2013. From 2011 to 2012 he served as Vice President Finance in the position of Head of Financial Planning and Analysis and Business Development Finance for Fiat Chrysler. Previously he held various positions with Chrysler Group LLC including Brands and Marketing Controller and Head of Financial Planning and Analysis, a position he held since he joined Chrysler Group LLC in 2009. Prior to this he was the Director of Business Development Finance for Fiat Powertrain S.p.A. Previously, and since 1993, Mr. Chiara held various managerial roles at Teksid Aluminum, PricewaterhouseCoopers, R. Bosch S.p.A., Wuerth Group and was a M&A financial analyst with Dresdner Kleinwort Benson. Max graduated Cum Laude from the Luigi Bocconi University in Milan (Italy), with a degree in Business Administration, and has a CEMS Master’s degree in International Management from the Bocconi University and the University of Cologne (Germany). Max held the position of Chairman of the Italian Association of Corporate Treasurers (AITI) for the years 2004-2007.
66
|
•
|
Vilmar Fistarol, General Manager South America
|
Vilmar Fistarol assumed the role of General Manager South America in January 2019. Mr. Fistarol started his career at the Metallurgical Division of Abramo Eberle (BR) casting in 1978, and subsequently undertook various roles for Agrale (BR) from 1981 to 1991. In 1991, he joined Fiat Group, and from 1991 - 2001, he served in roles of increasing importance within the Purchasing Division, including Director of Fiat Auto Argentina Purchasing, Purchasing Director of Fiat Auto Metallic Italy and Director of Purchasing for GM-Fiat Powertrain Europe. From 2001 to 2005, during the joint venture GM-Fiat Worldwide Purchasing, he was the Vice President for Purchasing Operations Fiat Latin America and Vice President of Powertrain and Metallic Purchasing for Latin America, Africa and Middle East. From 2005 to 2007, he was Vice President of Purchasing for Fiat in Latin America. Mr. Fistarol was appointed President and CEO of Teksid (Fiat Group Foundry NAFTA and Mercosul) in January 2008, and subsequently he served as Director of Human Resources for Fiat Group Automobiles Latin America from 2010 - 2011. Concurrently, he was appointed Executive Vice President of Fiat Group Automobiles Argentina. In 2011, he was appointed Head of Group Purchasing for Fiat Chrysler Global, a role he held until 2013, and was also named a member of the Fiat Chrysler Group Executive Council (GEC) on September 1, 2011. Vilmar Fistarol held the role of Chief Operating Officer for the LATAM region for CNH Industrial from 2013 - 2018. He trained in metallurgy at the Technical School Tupy- SC, and graduated in Business Administration at the University of Caxias do Sul, Brazil, in addition to obtaining an MBA from FDC/Kellogg School of Management in the U.S.A. and an MBA in FDC/INSEAD in France. Mr. Fistarol was President of Brazil SAE (Society of Automotive Engineers) in 2007-2008 and still serves as a member of the Advisory Board.
|
•
|
Oddone Incisa, President, Financial Services
|
Oddone Incisa della Rocchetta assumed the role of President Financial Services in January 2013. Mr. Incisa started his professional career with the Fiat Group in the finance team of Fiat Bank in Germany in 1997. He spent four years with this team and ultimately became Head of Control and Treasury. In 2001, he moved to Brazil and was the CFO of Banco Fiat for two years. Mr. Incisa then moved to Turin, Italy in 2003 as the Head of Financial Planning & Analysis for Fidis Retail and FGA Capital. In 2008, he moved to Racine, Wisconsin as the CFO for CNH Capital. From 2011 to 2013 Mr. Incisa was the CEO and General Manager of FGA Capital (now FCA Bank). He was born in Italy and holds degrees in Economics, cum laude, from the University of Turin and a Master’s degree in Management from ESCP-Europe (formerly, EAP) Paris, Oxford and Berlin.
|
•
|
Gerrit Marx, President Commercial and Specialty Vehicles
|
Gerrit Marx joined CNH Industrial and assumed the role of President Commercial and Specialty Vehicles in January 2019. Mr. Marx has some 20 years’ experience in roles of increasing importance in different geographies and in a variety of industrial segments, with specific, in-depth focus on automotive industries. He has held positions as a consultant, manager, and most recently was an Operating Partner at Bain Capital, a global private equity firm. From 1999 to 2007 he worked at McKinsey & Company, a global consulting firm, focusing on operational improvement programs in the automotive and aerospace industries in Europe, Brazil, and Japan. In 2007, Mr. Marx joined Daimler AG, heading the global controlling function for product (vehicles and powertrain components) and market-entry/merger and acquisition projects across three truck brands in North America, Europe and Asia. In 2009, he moved to China and became President and Chief Executive Officer of Daimler Trucks China, and subsequently was the President of Skoda China with Volkswagen AG, overseeing imports as well as joint venture business relationships in both roles. Mr. Marx joined the European leadership team of Bain Capital in 2012, as a member of their portfolio group driving and leading transformational change programs. This role also encompassed due diligence and merger and acquisition activities, with specific focus on automotive and industrial assets, and also included interim roles such as Chief Executive Officer of Wittur Group, a global Tier-1 supplier to the elevator industry. Mr. Marx holds a degree in Mechanical Engineering and an MBA (Diplom Kaufmann) from RWTH Aachen University, Germany and a Doctorate in Business Administration from Cologne University, Germany.
|
•
|
Derek Neilson, President, Agriculture
|
Derek Neilson assumed the role of President Agriculture in January 2019. Mr. Neilson has more than 20 years of experience in CNH Industrial and has been a member of the GEC (Global Executive Committee, formerly known as Group Executive Council) for some 10 years. He joined CNH in 1999 with responsibility for the UK Plant Engine and Tractor Manufacturing Business Units before being appointed Plant Manager of CNH’s Basildon (UK) tractor facility. In 2007, he became Vice President of Agricultural Manufacturing, Europe, a role he held until assuming global responsibilities for Agricultural Manufacturing in 2010. From 2012 to 2015, he served as Chief Manufacturing Officer for CNH Industrial. Mr. Neilson was appointed Chief Operating Officer EMEA in February 2015, alongside the position of President, Commercial Vehicles Products Segment, a role he held until December 2018. From April to September 2018, he was the Chief Executive Officer, Ad Interim, of CNH Industrial N.V. Mr. Neilson holds a BTEC Diploma in Mechanical and Production Engineering.
67
|
•
|
Stefano Pampalone, President, Construction; General Manager, Asia, Middle East and Africa
|
Stefano Pampalone assumed the role of President Construction in November 2019, this is in addition to that of General Manager Asia, Middle East and Africa, a position he has held since January 2019. Since joining CNH in 1998, Mr. Pampalone’s career has been focused on international assignments. In 2001, after gaining commercial experience in parts and whole goods in Poland, India, Africa and the Middle East, he was appointed Business Manager Southern Africa and Iran for all Fiat Group Agricultural Brands. In 2004, he became Marketing Director for Agriculture in Asia, Africa and the Middle East. From 2006 to 2007 he first served as Business Director for the CNH Agricultural Business in Africa and the Middle East. In 2009, he was appointed General Manager of the Agriculture and Construction Business in India and Pakistan. From February 2013, he held the role of General Manager for CNH in India, South East Asia and Japan, before being appointed Chief Operating Officer APAC (Asia and Pacific) region for CNH Industrial in September 2013, a role he held until 2018. Mr. Pampalone holds a degree in Engineering from the University of Trieste, Italy and an MBA from Profingest of Bologna, Italy.
|
•
|
Annalisa Stupenengo, President, Powertrain
|
Annalisa Stupenengo assumed the role of President Powertrain in January 2019. Ms. Stupenengo has extensive international experience and deep knowledge of the Powertrain business, gained through roles of increasing responsibility and complexity, within both CNH Industrial and FCA (Fiat Chrysler Automobiles). Ms. Stupenengo started her career in 1996 in the Sales & Marketing area of Fiat Group. In the early years of her professional career, she worked in Morocco, Sweden and Italy in management roles ranging from Sales, Project Management and Purchasing within Fiat and GM/Fiat joint ventures. In 2006, she contributed to establishing the Fiat Powertrain Sector Purchasing department, leading this organization until 2010 as its Purchasing Vice President. In 2008 Ms. Stupenengo was also appointed Vice President of the Electrical Commodity with global responsibility for Europe, USA, Brazil, China and India within Fiat Group Purchasing. In 2010, Annalisa Stupenengo joined CNH as Senior Vice President Purchasing. In January 2013, she became Head of Group Purchasing EMEA Region for Fiat Chrysler, then in September 2013 she rejoined CNH Industrial as Chief Purchasing Officer, and was a member of the CNH Industrial Group Executive Council (GEC). From 2015 - 2018 she held the posts of Brand President, FPT Industrial Brand and President, Powertrain Product Segment. In December 2015, she joined the Board of Directors at Welltec International ApS. Ms. Stupenengo holds a degree in Management Engineering from the Polytechnic University of Turin, Italy.
|
•
|
Tom Verbaeten, Supply Chain Officer
|
Tom Verbaeten assumed the role of Chief Supply Chain Officer in January 2019. Mr. Verbaeten joined CNH in 1994, performing various roles in the Antwerp Plant including Team Leader and Production Unit Manager for both Assembly and Machining areas. In 2006, he was appointed Plant Manager of Antwerp, and in 2009 he became Plant Manager for the harvesting plant in Zedelgem. In 2011, Mr. Verbaeten assumed responsibility for Manufacturing Operations of Agriculture in Europe. In addition to his role in Agriculture, Mr. Verbaeten took responsibility for all Construction Equipment plants in Europe from 2013 onwards. He has also managed the Global World Class Manufacturing activities from 2014 - 2015, in addition to his operational role. From 2015-2018, Mr. Verbaeten served as Chief Manufacturing Officer. Mr. Verbaeten holds an Engineering degree from the University of Leuven.
|
•
|
Andreas G. Weishaar, Chief Strategy, Talent, ICT and Digital Officer
|
Andreas G. Weishaar joined CNH Industrial and assumed the role of Chief Strategy, Talent, ICT and Digital Officer in January 2019. Mr. Weishaar has some 20 years’ experience in senior roles in international business, with deep knowledge of the agricultural sector, as well as strategic and industrial expertise. Mr. Weishaar started his career at Arthur D. Little, a global management consultancy, in Zurich, Switzerland in 1999. He was rapidly promoted and was appointed Senior Manager in the Strategy and Organization Practice in 2005. From 2005 to 2016 he held roles of increasing importance at AGCO Corporation, a global agriculture equipment manufacturer. Initially Andreas was Senior Manager for Strategy & Integration and was subsequently appointed Director and Vice President of the function in 2008 and 2009 respectively. In 2009 Mr. Weishaar assumed the role of Vice President Strategy & Integration and Operations for China, and in 2011 was promoted to the role of Vice President and Managing Director, China, responsible for the Company’s expansion in China, and their business in India and Pakistan. In 2014, he became Vice President and General Manager, Global Green Harvesting, overseeing the Company’s hay, forage and sugarcane businesses worldwide. Mr. Weishaar joined Welbilt Inc., a leading manufacturer of foodservice equipment, in 2016 as Senior Vice President Strategy, Marketing and Human Resources. He was appointed Senior Vice President Strategy, Marketing and Digital in 2018 and assumed the role of Executive Vice President, Chief Transformation and Digital Officer in August 2018. Mr. Weishaar holds an MBA (Diplom Kaufmann) from the European Business School of Oestrich-Winkel, Germany, having also studied at the École Supérieure de Commerce de Dijon, France and The American Graduate School of International Management, Thunderbird, Glendale, Arizona, U.S.A.
There is no family relationship among any of our Directors or senior managers set forth above.
68
B.
Compensation
Remuneration Report
Remuneration Policy Available on our Website
Our Remuneration Policy is designed to competitively reward the achievement of long-term performance goals, to help drive cultural transformation organization-wide, and to attract, motivate and retain highly qualified senior executives who are committed to performing their roles in the long-term interest of our shareholders and other stakeholders. Within the scope of the Remuneration Policy, the remuneration of the Executive Directors is determined by the Board of Non-Executive Directors (“Non-Executive Directors”), at the recommendation of the Compensation Committee. This annual Remuneration Report describes how the pay programs and practices of the Executive Directors were implemented in 2019, in accordance with the Remuneration Policy. A copy of the Remuneration Policy for reference is available on the Company’s website,
www.cnhindustrial.com.
The foundation of CNH Industrial’s Remuneration Policy is pay for performance. The key 2019 Company achievements, successes and developments were driven by organization-wide alignment of the shared Company strategy and values, with a pay philosophy that rewards the achievement of those goals.
Business context
The market environment in 2019 presented numerous challenges to our businesses, from trade disputes and tariffs to climate change, that led to volatile customer demand for our products and resulted in a weaker revenue performance than we had anticipated at the start of the year. Nonetheless, thanks to our strong operational discipline, we managed to meet our external commitments on profitability, while also maintaining our focus on our longer-term objectives.
The environmental sustainability of our business is a key priority for the Board of Directors (“Board”) and is considered an essential factor for the long-term success of CNH Industrial. In 2019, CNH Industrial was named Industry Leader in the Dow Jones Sustainability Indices for the 9
th
year in a row. This recognition demonstrates our Company’s continuous contribution, commitment and industry leadership towards a more sustainable environment and the future of our planet.
Highlights of our financial performance in 2019
|
▪
|
Net sales of Industrial Activities of $26.1 billion, a 2.1% decline at constant currency from 2018, amid lower market demand;
|
|
▪
|
Adjusted Net Income of $1.2 billion, up 5% compared to 2018;
|
|
▪
|
Adjusted diluted Earnings Per Share (“EPS”) up 5% year-over-year at $0.84 per share;
|
|
▪
|
Net debt of Industrial Activities at the end of 2019 at $0.9 billion, up by $255 million from end of 2018, due to higher working capital and cash investments related to the Merger & Acquisition activity performed during the year;
|
|
▪
|
Fitch Ratings improved the outlook of CNH Industrial N.V. to positive from stable and affirmed CNH Industrial N.V.’s and CNH Industrial Capital LLC’s long-term issuer default rating at “BBB- “;
|
|
▪
|
Total of $332 million returned to shareholders in 2019 through cash dividends and share buy-back.
|
Definitions of non-GAAP metrics referenced in the above list (derived from financial information prepared in accordance with U.S. GAAP):
Adjusted Net Income/(Loss)
: is defined as net income (loss), less restructuring charges and non-recurring items, after tax.
Adjusted diluted EPS
: is computed by dividing Adjusted Net Income (loss) attributable to CNH Industrial N.V. by a weighted-average number of common shares outstanding during the period that takes into consideration potential common shares outstanding deriving from the CNH Industrial share-based payment awards, when inclusion is not anti-dilutive. When we provide guidance for adjusted diluted EPS, we do not provide guidance on an earnings per share basis because the GAAP measure will include potentially significant items that have not yet occurred and are difficult to predict with reasonable certainty prior to year-end.
Net Debt and Net Debt of Industrial Activities
:
Net Debt is defined as total debt less intersegment notes receivable, cash and cash equivalents, restricted cash, other current financial assets and derivative hedging debt. CNH Industrial provides the reconciliation of Net Debt to Total Debt, which is the most directly comparable measure included in the consolidated balance sheets. Due to different sources of cash flows used for the repayment of the debt between Industrial Activities and Financial Services (by cash from operations for Industrial Activities and by collection of financing receivables for Financial Services), management separately evaluates the cash flow performance of Industrial Activities using Net Debt of Industrial Activities
.
69
Business Achievements
This resilient financial performance reflected the commitment of our businesses to meeting the needs of their customers with innovative and segment-leading products. These were reflected in a range of industry accolades as well as significant orders. Highlights of the year are set out in the table below:
|
Agriculture
|
Construction
|
|
|
▪
Case IH and New Holland Agriculture received a total of four ‘Machine of the Year’ titles at SIMA 2019 in Paris.
▪
New Holland Agriculture obtained the gold medal at the SITEVI Innovation Awards 2019 for its two, all-inclusive solutions, Plug-and-Play and Multipurpose-on-Demand.
▪
At Agritechnica in Hanover, New Holland was crowned with two coveted titles: ‘Tractor of the Year 2020’ in the Best of Specialized category for its Specialty Tractor T4 V/N/F models, and the new ‘Sustainable Tractor of the Year 2020’ award for the T6 Methane Power, the world’s first production methane tractor. Our aftermarket brand and start-up incubator AGXTEND was also awarded a silver medal for its ISOMAX concept. Additionally, Case IH, New Holland and STEYR earned ‘Machine of the Year 2020’ titles in different categories for their innovative machinery and technology.
|
▪
The CASE Compact Track Loader received the award for "Contractors" Top 50 New Products of 2019’ from Equipment Today and the ‘2019 Editor’s Choice Award’ from Green Industry Pros.
▪
CASE Construction also secured important orders, selling its first Stage V excavator in the Nordics and completing the sale of 12 excavators to Ruttle Plant Hire, a major U.S. supplier to the construction industry.
▪
Four of CASE's new products earned spots on ‘Construction Equipment’s 2019 Top 100 New Products’ list.
▪
The CASE 1110EX soil compactor won ‘Best design - Safety Award’ from the Equipment Times Yellow Dot Awards 2019
▪
In Italy, over 100 CASE Construction Equipment crawler excavators and wheel loaders were used to upgrade the runway at Milan Linate Airport.
|
|
|
Commercial and Specialty Vehicles
|
Powertrain
|
|
|
▪
IVECO bus won the ‘Sustainable Bus of the Year 2020’ award for its Crossway Natural Power bus.
▪
Significant product orders were secured, including that of IVECO Bus for 217 city and intercity Crossway buses in Norway, 200 Crossway and 50 Crealis Natural Power buses for the Abidjan Transport Company, and 409 Urbanway Natural Power buses for the Paris Transport Authority.
▪
Our Heuliez Bus brand leveraged its expertise in alternative propulsion to win an order for 49 electric city buses for a Dutch public transportation company and 50 fully electric buses in Paris.
▪
IVECO Defence Vehicles also signed a major contract to supply the Dutch Ministry of Defence with 1,275 medium multirole protected vehicles.
|
▪
FPT Industrial introduced several new engines during 2019, among them the N67 Natural Gas engine specifically developed for off-road applications.
▪
As part of its continuous approach to sustainability, our brand presented the Cursor 13 NG prototype, the most powerful 100% Natural Gas engine on the market for industrial vehicles.
▪
FPT also began its participation in VISION-xEV, a project funded by the European Commission as part of the European Green Vehicles Initiative, which contributes to the advancement of future electrified powertrain systems.
|
|
Strategic and Development Initiatives
A new wave of changes is upon us that is fueling major shifts in business, the economy and wider society. These changes, called
megatrends
, are enormous in their impact. Environmental sustainability, discussed above and in our Sustainability Report, is one of these. They also include, among others,
digitalization
,
autonomous
,
servitization
, and
alternative propulsion
.
To navigate and to thrive in the context of these megatrends, our Company has been working on key initiatives that involve internal projects, partnerships and acquisitions, new product launches and the presentation of innovative concepts.
Digitalization
is the new normal, and an enabler for innovative solutions such as precision farming, telematics and open connectivity. Our strategic acquisition
of AgDNA, a company with proven experience in Farm Management Information Systems, strengthened our capabilities in this area. In addition, Case IH, STEYR and New Holland Agriculture have come together for the award-winning DataConnect project, partnering with John Deere, CLAAS and 365FarmNet to develop precision farming solutions.
Concerning
automation
, our Company’s autonomous vehicle research and development program is pushing forward with the Autonomous Vehicle Concept (AVC).EP Although it is still a concept, some of its key technologies were rolled out this year on currently available Case IH and CASE Construction equipment. One example is the automation of all harvesting processes to simplify farmers’ tasks, resulting in productivity improvement, downtime reduction, better grain quality, development of tailored agronomic plans and prevention of driving
70
incidents. We also began introducing autonomous technology in our commercial vehicles to improve customer productivity, increase safety and operator efficiency, and reduce emissions.
Servitization
, the services around products, is increasing in importance and giving rise to new business models. Our Company is focusing heavily in this area, adding high-tech solutions to its most recently launched products. We see this in the new IVECO S-Way, a 100% connected, driver-centric long-haul truck that opens a new era in fleet management and on-board living. Also, IVECO launched the New Daily van in 2019, which embraces connectivity and unlocks a whole new world of highly personalized services tailored to meet customer requirements. We also advanced AGXTEND, our aftermarket brand focused exclusively on precision farming technology
solutions.
As far as
alternative propulsion
is concerned, several of our brands announced strategic partnerships, including IVECO and FPT, which are working with Nikola to accelerate the zero-emission future for heavy-duty trucks. FPT also signed a memorandum of understanding with Microvast to design and assemble high-voltage battery packs. In addition, we are part of the H2HAUL project for the development of fuel-cell electric heavy-duty trucks in Europe. On another front, we have developed numerous innovative concepts that were announced in 2019: CASE ProjectTETRA, the first methane-powered construction machine in the world, STEYR and FPT’s Konzept hybrid tractor loaded with future farming technology, and the zero-emission Nikola TRE heavy-duty truck, the first product stemming from the IVECO, FPT and Nikola
partnership
.
Successful initiatives like these reveal how our Company is adapting to the changing world. They support our responses to the specific megatrends and are integral to our new "
Transform2Win"
strategy which we launched at our Capital Markets Day in September 2019. This marks the beginning of a major transformation within the Company, which is structured around segment and function strategies backed by three clear and measurable corporate objectives:
grow sales, perform & simplify operations, optimize capital structure
. These objectives define our path to delivering superior stakeholder value, including excellent products and services for our customers.
We began on this pathway in 2019 and some highlights include the launch of our 80/20 Program to streamline our offering to focus on customer needs and the priorities of our businesses. Significant gains were also made in World Class Manufacturing: we now have 2 gold, 17 silver and 26 bronze level plants throughout the world. We continued delivering our customer-centric Horizon aftermarket solutions, prioritizing loyal customers and partnering with dealers. Of course, sustainability was and continues to be a major element of our strategy, with sustainable initiatives embedded in all areas of our business, from actively reducing CO
2
emissions to achieving our goal of decarbonization. Finally, we completed Phase 1 of our footprint rationalization program in our Construction and Powertrain operations.
In addition, we began preparations for the
separation of our ‘On-Highway’
(commercial vehicles and powertrain segments)
and our ‘Off-Highway’ businesses
(agriculture, construction and specialty segments), each supported by a dedicated financial services business. The separation, which is planned to occur early 2021, was communicated as part of our "Transform2Win" strategy recognizing that the ‘On-Highway’ and ‘Off-Highway’ businesses have diverging regulatory and customer requirements and are impacted differently by the accelerating industry megatrends. The separation will result in the creation of two listed entities, each a world leader in its business, and will maximize management focus and flexibility, align investment priorities and incentives, better meet respective business needs and optimize the cost and capital structure of each company to drive profitable growth.
Our strategy is framed on top by our purpose,
Powering Sustainable Transformation
, which is the reason why we exist and is intrinsically linked to our future business success. The base of our strategy is a solid foundation made up of our values:
entrepreneurship, passion, team spirit
and
excellence
. These four values
represent our identity, the way we work and what propels us forward.
Compensation Peer Group
The quality of our leaders and their commitment to the Company are fundamental to our success. Our compensation philosophy supports our business strategy and growth objectives in a diverse and evolving global market. A key principle of our compensation philosophy is to provide a competitive compensation structure that can attract, motivate and retain highly qualified senior executives.
The Company periodically benchmarks its executive compensation program and the compensation offered to executive directors against peer companies and monitors compensation levels and trends in the market. The Compensation Committee strives to develop a compensation peer group that best reflects all aspects of CNH Industrial N.V.’s business and considers public listing, industry practices, geographic reach and revenue proximity.
Our Company has few direct business competitors, which makes it difficult to create a representative compensation peer group based on industry, revenues or market capitalization alone. Additionally, notwithstanding CNH Industrial N.V. being a European headquartered company, evaluation against peer companies incorporated in only the European geographic region was believed to be inappropriate in light of being listed in both the New York and Milan stock exchanges and the strong commercial presence in the United States. Accordingly, the compensation peer group for the Chief Executive Officer (“CEO”) and the Chairperson includes a blend of U.S. S&P 500 industrial and non-U.S. global industrial companies, targeting an overall median revenue size comparable to CNH Industrial N.V. A blend of both U.S. and non-U.S. companies for the compensation peer group is deemed necessary for meaningful comparisons to the relevant talent market for our executives.
In 2019, additional European companies were added to the compensation peer group to reflect a more balanced approach between the primary geographic regions for CNH Industrial. The industrial companies of BAE Systems plc, Rolls-Royce Holdings plc, Traton SE
71
and Valeo SA have been added while Johnson Controls International plc and MAN SE were removed. Johnson Controls International plc has sold its Power Solutions business and is no longer comparable to CNH Industrial; while MAN SE is an entity of Traton SE which has been added and is a closer match in size and scope than MAN SE.
The compensation peer group, as shown in the table below, balances both U.S. and European peers to support our need to compete globally for top talent and leaders, given our extensive worldwide presence.
|
U.S. Companies
|
Non-U.S. Companies
|
|
|
AGCO Corporation
|
AB Volvo
|
|
|
Caterpillar Inc.
|
BAE Systems plc
|
|
|
Cummins Inc.
|
Continental AG
|
|
|
Deere & Company
|
Magna International Inc.
|
|
|
General Dynamics Inc.
|
Rolls-Royce Holdings plc
|
|
|
Honeywell International Inc.
|
Traton SE
|
|
|
Navistar International Corporation
|
Valeo SA
|
|
|
PACCAR Inc.
|
|
|
|
United Technologies Corporation
|
|
|
Our compensation peer group is utilized to benchmark targeted median pay levels and peer pay practices. The current market position for the CEO’s targeted pay is between 25th percentile and median of the above blended U.S. and European peer companies and is deemed competitive. The variable pay elements are designed to align actual pay levels with Company performance, following market practice threshold and overachievement variable pay structure.
72
Overview of Remuneration Elements
The Executive Director’s remuneration consists of the following primary elements:
|
Remuneration Element
|
Description
|
2019 Implementation
|
||
|
Base Salary
|
Fixed cash compensation set competitively to appropriate peer group
|
The Executive Directors’ base salary, set upon their respective appointments in 2018, remained competitive with no change in 2019
|
||
|
Short-Term Variable
|
Subject to the achievement of annually pre-established, challenging financial and other designated performance objectives
|
New metrics were selected to align with business priorities, establishing an over trigger achievement of at least 70% of Consolidated Adjusted EBIT Margin % target for any payout to add additional focus on profitability during a slowdown in key markets.
|
||
|
CEO:
|
||||
|
■ Target payout is 125% of the base salary and maximum payout is 200% target payout
|
Pay for performance alignment was reflected in the payout under the 2019 Company Bonus Plan, where challenging market and economic forces suppressed full goal attainment and the resulting overall payout was below target.
|
|||
|
■ No discretion applies
|
||||
|
Chairperson: Does not participate in the annual bonus program
|
||||
|
Long-Term Variable
|
To align Executive Directors to strategic goals and reward for sustained long-term growth
|
The 2017-2019 LTI performance cycle:
|
||
|
Two components:
■ 75% based on Company performance awards (Performance Shares Units or PSUs) ■ 25% retention based awards (Restricted Share Units or RSUs), subject to favorable individual performance and demonstration of Company values |
■ Company performance-based awards were tied to TSR performance relative to industry peers and maintaining investment grade credit rating. CNH Industrial’s relative TSR ranking did not meet the threshold for payout. No discretion was applied
|
|||
|
The Company performance component is subject to the achievement of predetermined challenging performance and market objectives, covering a 3-year performance period
|
■ Retention-based RSU awards under the first installment vested in 2019, The Compensation Committee determined an overall assessment of individual performance and leadership values met the vesting conditions.
|
|||
|
Holding period of five years from grant aligns with Dutch Corporate Governance Code ("DCGC")
|
In 2019, a portion of the RSUs connected to the next LTI performance cycle, 2020-2022, was granted with vesting in 2021 for continuity of an annual award opportunity while replenishing retention value for the Company.
|
|||
|
Post Employment Benefits
|
CEO:
■ Company sponsored retirement savings programs, available to all salaried employees ■ Severance protection of 12 months’ base salary, consistent with Dutch Corporate Governance Code best practice ■ Prorated equity award vesting in the event of death, disability or involuntary termination by the Company, not for cause. ■ Retiree healthcare benefits |
Current benefits in-line with the Remuneration Policy did not change in 2019
|
||
|
Chairperson:
■ Prorated equity award vesting in the event of death or disability. Board discretion in the event of end of mandate. ■ No other post mandate benefits provided |
||||
|
Other Benefits
|
CEO:
■ Typical benefits such as a company car, medical insurance, accident insurance, relocation and tax assistance ■ Tax equalization for any non U.S. sourced employment income |
Current benefits in-line with the Remuneration Policy did not change in 2019
|
||
|
Chairperson: No benefits provided
|
||||
73
Executive Directors’ 2019 Total Direct Compensation
The total annual compensation of the Executive Directors emphasizes pay for performance and long-term value creation, as evidenced by having significant pay at risk, contingent on performance and with a long-term horizon.
|
▪
|
Pay for Performance: through variable incentives, the Company aligns and rewards our executives on the achievement of the sustainable financial and operating goals as well as the leadership values that drive the attainment of those goals.
|
|
▪
|
Long-term value creation: further linkage supported by a requirement to hold equity awards for a minimum of five years from date of grant.
|
The narrative and charts below show the actual key components of compensation realized in 2019, base salary and short- and long-term incentives, and are intended to provide additional context for understanding the actual compensation received in 2019 as well provide a helpful comparison to the targeted and maximum pay mix.
CEO
The CEO’s 2019 realized compensation related to the 2019 performance year:
|
Base Salary
|
$1,100,000
(1)
|
|||
|
2019 STI:
|
$367,000
|
(33% of base salary, which is 27% of target achieved)
|
||
|
2019 LTI
(2)
|
$983,946
|
(97,300 share @ $10.1125/share (FMV at grant))
|
||
|
Total:
|
$2,450,946
|
|||
|
(1)
|
Base salary included in the Summary Remuneration table in a later section includes earnings from previously deferred salary. Current base salary is $1.1 million, unchanged in 2019.
|
|
(2)
|
The 2019 LTI value reflects retention-based Restricted Share Units (RSUs) when granted and Company performance-based Performance Share Units (PSUs) when vested, consistent with the realized equity award valuation used by corporate governance advisory firms. In 2019, an RSU award was granted (as indicated) and no PSUs vested. For the value of equity awards that vested during 2019, the CEO earned $4.5 million, including a “Make Whole” award (which was an agreed award upon hire to compensate for forfeited equity with prior employer) of $3.7 million. All the details at grant, vesting and outstanding of each award are reported in the share table in a later section.
|
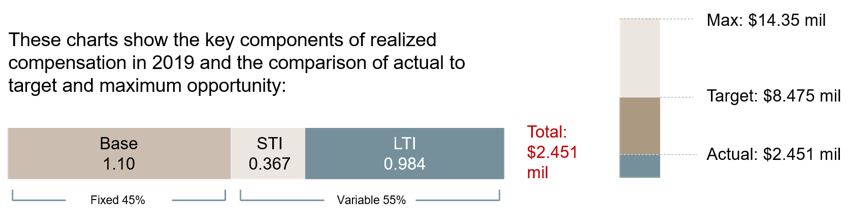
The CEO has discussed the Company’s pay philosophy, targeted pay structure and his 2019 actual compensation with the Board and fully accepts his compensation package as fitting to his role and to the 2019 performance. The CEO embraces the pay for performance compensation philosophy and is aligned with and favors the risks and rewards that come with that approach to compensation. Furthermore, the CEO recognizes that his leadership position demands setting the example and to advocate a shared, one-company mindset of performance and accountability to deliver on business objectives and values.
74
Chairperson
The realized 2019 compensation for the Chairperson:
|
Base Salary:
|
$250,000
(1)
|
|||
|
2019 STI:
|
NA
|
(no annual bonus eligibility)
|
||
|
2019 LTI
(2)
:
|
—
|
|||
|
Total:
|
250,000
|
|||
|
(1)
|
Base salary included in the Summary Remuneration table in a later section includes the prorated Chairperson fees from November 29, 2019 through December 31, 2019, paid in January 2020. Current annual salary is $250,000, unchanged in 2019.
|
|
(2)
|
The 2019 LTI value reflects retention-based Restricted Share Units (RSUs) when granted and Company performance-based Performance Share Units (PSUs) when vested, consistent with the realized equity award valuation used by corporate governance advisory firms. For the value of RSU equity awards that vested during 2019, the Chairperson earned $0.1 million, as reported in the share table in a later section.
|
In the Executive Chairperson role, the duties focus more on long-term value creation than on day to day management, and the variable incentives are aligned accordingly with no short-term incentive pay, but with long-term incentive reward opportunity. The Board discussed with the Chairperson her total compensation package, and the Chairperson is fully aligned with the compensation package and the long-term emphasis of her pay elements.
In accordance with DCGC, both Executive Directors’ equity awards are long-term investments in the Company and fully align with the shared interests of shareholders.
Internal Pay Ratios
When setting the Executive Directors’ compensation, the Compensation Committee considers both the appropriate external benchmark as well as the internal pay ratios within the Company. Although the primary consideration is market competitiveness to attract and retain highly qualified senior executives in a large global complex organization, a baseline internal comparison is set, and trends are tracked. The trend in executives’ compensation is closely and carefully evaluated in relation to the trend in employees’ compensation.
In line with the guidance under the DCGC, the CEO Pay ratio and trend is disclosed in the annual Remuneration Report. The basis of the pay ratio comparison uses the prevalent Dutch methodology of average employee compensation, including all labor costs. This is a change from the last year, the first year the pay ratio was reported by CNH Industrial, when a median compensated employee’s total direct compensation was used to compare to the CEO’s targeted total direct compensation. As a five-year trend of average employee compensation and CEO compensation is a new requirement effective for 2019, it is appropriate to use a consistent methodology for the CEO pay ratio. Consistent with prior years, CEO compensation and average employee compensation use the accounting value of equity. Under this methodology, the value of an equity award is spread between grant and vesting; the CEO value below includes expense related to performance awards that were ultimately forfeited.
The average employee compensation is the total personnel costs reported in the Annual Report less any Executive Director compensation divided by average year headcount reported in the Annual Report less the CEO who is included in the total average year headcount. Over the five-year period, the average employee compensation has been impacted, due to changing business conditions, by shifts in the labor market in the different geographies.
For the past five years, the trend of CEO pay versus average employee compensation is shown in the following table:
|
2019
(1)
|
2018
(2)
|
2017
(3)
|
2016
(4)
|
2015
(5)
|
5-year trend
|
||
|
CEO compensation ($000s)
|
6,632
|
8,738
|
7,066
|
3,943
|
2,759
|
140%
|
|
|
Average Employee compensation
(6)
($000s)
|
60.5
|
64.3
|
62.1
|
57.6
|
56.8
|
6.6%
|
|
|
CEO Pay Ratio
|
110
|
136
|
114
|
68
|
49
|
125%
|
|
|
(1)
|
For 2019, CEO compensation is per the Summary Remuneration table excluding the 2019 accounting value of the CEO’s one-time “Make Whole” award, granted upon hire in September 2018 and vested in September 2019. Including the 2019 Make Whole accounting value of $2.8 mil, the CEO pay ratio would be 156. The 2019 CEO Pay Ratio calculation includes $2.9 mil in accounting value related to the 2017-2019 PSUs that did not meet the threshold achievement for any payout and have been forfeited. The CEO Pay Ratio excluding the forfeited PSU award would be 62.
|
|
(2)
|
For 2018, given a partial year in the CEO role, a targeted full year compensation is shown for year-over-year comparison.
|
|
(3)
|
For 2017, CEO compensation included the accounting value of equity awards, $2.9 million, as reported in the Summary Remuneration table in the 2017 Remuneration Report. The amount represented the net impact of the cancellation of the prior
|
75
Company performance share awards covering the 2014-2018 performance period and the granting of a new award for the 2017-2019 performance period.
|
(4)
|
For 2016, CEO compensation did not include the accounting value of equity awards which was income of $3.0 million due to reversal of previously recognized expense linked to non-market conditions that the Company deemed not probable to achieve, as footnoted in the Summary Remuneration table in the 2016 Remuneration Report.
|
|
(5)
|
For 2015, CEO compensation did not include the accounting value of equity awards as the reporting convention in 2015 was value of awards at grant and no equity awards were granted in 2015. The comparable accounting value in 2015 was $8.0 million, which in part was reversed in 2016 for not achieving non-market conditions. In 2017, the related award for the market conditions was canceled for non-performance.
|
|
(6)
|
Average Employee compensation is derived from personnel costs reported under IFRS, which does not include personnel costs for the Executive Directors, divided by the average headcount.
|
For perspective, the key performance metrics for the same past five years are shown below:
|
Selected Performance Data
(1)
|
2019
|
2018
|
2017
(2)
|
2016
(2)
|
2015
(2)
|
5-year trend
|
|
|
Consolidated Adjusted EBIT Margin %
|
6.7%
|
7.1%
|
5.9%
|
5.8%
|
6.3%
(3)
|
6.3%
|
|
|
Adjusted Net Income ($ million)
|
1,178
|
1,117
|
651
|
471
|
474
(4)
|
148%
|
|
|
Adjusted Diluted Earnings/(Loss) per share ($)
|
0.84
|
0.80
|
0.46
|
0.34
|
0.35
(4)
|
140%
|
|
|
Absolute Total Shareholder Return - Indexed from 2014
(5)
|
159
|
141
|
169
|
116
|
90
|
59%
|
|
|
(1)
|
Includes non-GAAP metrics derived from financial information prepared in accordance with U.S. GAAP.
|
|
(2)
|
2017 and 2016 figures have been recast following the retrospective adoption, on January 1, 2018, of the updated standard for revenue recognition (ASC 606). 2015 figures have not been recast.
|
|
(3)
|
In 2015, Consolidated Adjusted EBIT Margin % was not reported; the figure represents the most comparable metric, Consolidated Operating Margin %.
|
|
(4)
|
In 2015, Net income and and Basic EPS before restructuring and other exceptional items were the comparable metrics reported.
|
|
(5)
|
Using 21-day average average at the beginning and ending of each year and indexing from a 2014 baseline (i.e., index at 100).
|
In conclusion, the 5-year performance trend of the Company has been positive, while comparison of the CEO pay trend is difficult to conclude given the accounting valuation of past equity awards, which does not reflect the pay earned.
Base Salary
The base salary for the new Executive Directors takes into consideration the executive’s skills, scope of job responsibilities, experience, and competitive market and compensation peer group pay comparisons as described above. The CEO’s annual base salary is $1,100,000 and the Chairperson’s base salary is $250,000, and their base salaries are in the competitive range for their respective roles.
Given the relatively recent benchmark of the salaries when hired or appointed to their respective roles in 2018, the Compensation Committee recommended no change in base salary in 2019.
Variable Components
Our Executive Directors are eligible to receive variable compensation contingent on the achievement of pre-established, challenging financial and other designated performance objectives that are approved by the Company’s Non-Executive Directors. The variable components of our Executive Directors’ remuneration, both the short- and the long-term incentives, where applicable, demonstrate our commitment to shareholders and long-term value creation by using metrics that align with our business strategy of delivering exceptional operating performance and shareholder returns. The Non-Executive Directors believe that placing significantly more weight on the long-term component is appropriate to align the Executive Directors efforts on the Company’s long-term success.
As specified by DCGC, scenario analyses are carried out annually to examine the relationship between the performance criteria chosen and the possible outcomes of variable remuneration of the Executive Directors. Such analysis was carried out for the 2019 financial year, and the Company found a strong link between remuneration and performance and concluded that the chosen performance criteria strongly supports the Company’s strategic objectives and are appropriate under both the short-term and long-term incentive components of total remuneration.
Short-Term Incentives
The primary objective of short-term variable incentives is to focus on the business priorities for the current year. As such, our CEO participates in the annual Company Bonus Plan (“CBP”), but our Chairperson does not as the focus of her role is long term. Our CEO’s short-term variable incentive compensation is based on achieving short-term (annual) financial and other designated goals proposed by the Compensation Committee and approved by the Chairperson and Non-Executive Directors each year.
76
In 2019, the Compensation Committee changed the CBP design to align more closely with the annual operational objectives. The new metrics and their corresponding weight for the determination of the CEO’s bonus is shown in the following table:
|
KPIs
|
|
Performance Level and Payout
|
Threshold
|
Target
|
Maximum
|
KPI Definition
|
|
Consolidated Revenue Growth @ Constant Currency (CC)
|
30%
|
performance level
|
2.0%
|
2.2%
|
2.9%
|
Current Year (CY) vs. Prior Year (PY) Consolidated Revenue @ Constant Currency (CC)
|
|
% of target pay-out
|
30%
|
100%
|
200%
|
|||
|
Consolidated Adjusted EBIT Margin %
|
50%
|
performance level
|
6.5%
|
7.2%
|
8.6%
|
Resulting ratio (in %) of Consolidated Adjusted EBIT (numerator) over Consolidated Net Revenue (denominator) for the full year
|
|
% of target pay-out
|
30%
|
100%
|
200%
|
|||
|
Cash Conversion Ratio %
|
20%
|
performance level
|
55.2%
|
61.3%
|
79.7%
|
Net Industrial Cash Flow / Adjusted Net Income
|
|
% of target pay-out
|
30%
|
100%
|
200%
|
|||
|
▪
|
The target incentive for the annual bonus program is 125% of base salary, linked to approved targets each year which are consistent with our public guidance to investors.
|
|
▪
|
To earn any incentive by metric, the threshold performance must be at least 90% of the specific target established, with an additional hurdle of achieving at least 70% of the Consolidated Adjusted EBIT Margin % for any payout. Achieving threshold performance earns 30% of target incentive.
|
|
▪
|
To earn the maximum payout of 200% of target incentive, actual results must be at least 120% of the target performance for Consolidated Adjusted EBIT Margin % and 130% for the other performance metrics.
|
|
▪
|
No individual performance adjustment factor applies to the CEO, in line with DCGC to have no discretion applicable to the bonus calculation.
|
Rationale for Change:
The key performance indicators selected for 2019 are similar in nature to those used previously to still emphasize growth, profitability and effective cash management.
|
▪
|
Consolidated revenue growth targets replaced consolidated revenue targets, to focus on year-over-year revenue gains without the adverse impact of currency fluctuations, allowing for enhanced line-of-sight.
|
|
▪
|
Adjusted EBIT Margin % of revenue replaced absolute Adjusted EBIT Margin to concentrate on structural profitability gains in a down market.
|
|
▪
|
Cash conversion ratio was introduced to emphasize the efficiency of converting profit into cash, an important capability for industrial companies.
|
With the change in targets to percentages and ratios from absolute targets, the performance ranges were also reviewed and revised to implement a competitive range appropriate for the type of each metric.
77
CEO Company Bonus Plan
The CBP award earned by the CEO for performance year 2019, payable in 2020, is $367,000, as determined by the achievement of pre-determined objectives and the corresponding overall company performance factor, illustrated in the table below:
|
Corporate Measures
|
|
Weight
|
Threshold
|
Target
|
Maximum
|
|
Achievement
|
Results vs. Targets
|
|
Performance Factor
|
Overall
|
|
Consolidated Revenue Growth (@CC)
|
a)
|
30%
|
2.0%
|
2.2%
|
2.9%
|
|
(1.7)%
|
(75.0)%
|
|
—%
|
—%
|
|
b)
|
|
$123,750
|
$412,500
|
$825,000
|
|
|
|
|
|
$—
|
|
|
Consolidated Adjusted EBIT Margin %
|
a)
|
50%
|
6.5%
|
7.2%
|
8.6%
|
|
6.7%
|
93.0%
|
|
53.3%
|
26.7%
|
|
b)
|
|
$206,250
|
$687,500
|
$1,375,000
|
|
|
|
|
|
$ 367,000
|
|
|
Cash Conversion Ratio %
|
a)
|
20%
|
55.2%
|
61.3%
|
79.7%
|
|
0.8%
|
1.0%
|
|
—%
|
—%
|
|
b)
|
|
$82,500
|
$275,000
|
$550,000
|
|
|
|
|
|
$—
|
|
|
Overall Award
|
a)
|
100%
|
|
|
|
|
|
|
|
|
26.7%
|
|
b)
|
|
$412,500
|
$1,375,000
|
$2,750,000
|
|
|
|
|
|
$ 367,000
|
|
|
(a)
|
Performance metrics, weighting, goals, achievement and performance payout factor.
|
|
(b)
|
CEO bonus amounts at threshold, target, outstanding performance and actual payout.
|
Discussion of 2019 Results
Amidst extremely challenging market conditions, the Company maintained profitable margins. The revenue growth and cash conversion ratio thresholds were not achieved, impacted by the adverse trade policies, slowdown in the economy and severe climate conditions at planting and throughout the growing season in many countries, including the largest markets in the U.S. and Europe.
The Compensation Committee established challenging goals for each metric. Even with the predicted downturn in industry volumes suppressing revenue growth year over year, targets for profitability and cash conversion were set higher than 2018 levels, illustrating the commitment of the Company and the Committee to rigorously review and consistently calibrate performance measures.
|
|
2017 Actual
|
2018 Actual
|
2019 Target
|
2019 Actual
|
|
Consolidated Revenue Growth @CC
|
8.1%
|
6.7%
|
2.2%
|
-1.7%
|
|
Consolidated Adjusted EBIT Margin %
|
5.9%
|
7.1%
|
7.2%
|
6.7%
|
|
Cash Conversion Ratio %
|
198.2%
|
49.8%
|
61.3%
|
0.8%
|
Long-Term Incentives
Long-term incentive compensation is a critical component of our Executive Directors’ compensation structure. This compensation component is designed to:
|
▪
|
Align the interests of our Executive Directors and other key contributors with the interests of our shareholders;
|
|
▪
|
Motivate the attainment of Company performance goals and reward sustained long-term value creation; and
|
|
▪
|
Serve as an important attraction and long-term retention tool that management and the Compensation Committee uses to strengthen loyalty to the Company.
|
Cyclical, Long-Term Nature of Our Business.
Market demand for agricultural equipment, as well as for construction equipment, trucks, commercial vehicles, buses and specialty vehicles, is cyclical, and product life cycles are long, and thus so is the nature of CNH Industrial’s business. As long-term incentive compensation is one of the key mechanisms to motivate and reward managers, the Company seeks for this component to consider the long term, cyclical nature of the business.
78
2017-2019 Long-Term Incentive Program
The 2017-2019 Long-Term Incentive Program consisted of two distinct but complementary components - one focused on the Company achieving certain performance goals, while the other retention-based award considers individual commitment and contribution.
For the performance-based grants (referred to as Performance Share Units or PSUs), the primary metric was Total Shareholder Return (“TSR”) relative to a group of peer companies and a secondary metric was to maintain investment grade credit rating. Results were measured at the end of the three-year performance period. Although the Company achieved an absolute TSR of 30% and further improved its investment grade credit rating during the 2017-2019 performance period, the TSR ranking versus specific industry peers did not meet the threshold ranking to earn a payout.
For the retention-based awards (referred to as Restricted Share Units or RSUs), the Compensation Committee utilizes this component to encourage share ownership and retention while aligning Executive Directors' interests with those of our shareholders over the longer term. Vesting is subject to continued employment with the Company and favorable individual performance. In June 2019, an installment of the 2017-2019 RSUs vested for both Executive Directors.
2019 Equity Awards
With the 2017-2019 LTI plan ending, the existing LTI plan design was reviewed in the context of the prevalent peer and market practice to provide an annual reward opportunity. A potential competitive gap existed as the next performance cycle awards, tied to a new strategic business plan, would only begin in 2020. After the 2017-2019 LTI plans would end, our CEO would not have held any unvested equity, which provides a powerful retention incentive. Addressing this annual award opportunity gap, the Compensation Committee and Non-Executive Directors approved a partial advance of the 2020-2022 LTI award for the CEO in February 2019, representing 15% of the CEO’s targeted annual LTI component of pay. The 2019 award consisted of 97,310 retention-based RSUs vesting in February 2021, subject to individual performance, as assessed by the Chairperson and Compensation Committee.
Pension and Retirement Savings
The CEO participates in the same Company sponsored retirement savings programs available to all salaried employees of CNH Industrial America LLC. The Chairperson does not participate in any Company sponsored retirement savings program, but CNH Industrial N.V. pays social contribution fees mandatorily due under U.K. law. No changes were made in 2019.
Other Benefits
We offer customary perquisites and fringe benefits to our CEO, such as a company car, medical insurance, accident insurance, tax preparation assistance, and relocation and retiree healthcare benefits. Furthermore, in the event of an involuntary termination of employment other than for cause, the CEO is entitled to twelve months’ base salary, while remaining subject to restrictive covenants, such as non-competition and non-solicitation for a period of two years. Additionally, for the CEO, outstanding equity awards are subject to prorated vesting in the event of death, disability or involuntary termination by the Company, unless for cause. For the Chairperson, no other benefits are applicable except in the event of death or disability, outstanding equity awards are subject to prorated vesting.
No changes were made in 2019.
Tax Equalization
The CEO, as a function of his global role in the Company, may be subject to tax on his employment income in multiple countries. As the CEO is subject to tax on his worldwide income in the United States, the Company will tax-equalize all employment earnings, including CNH Industrial equity award income, to his United States’ effective income tax and, if applicable, social contribution rates. The benefits are included in the Non-Monetary Compensation (Fringe Benefits) column in the remuneration table. As the same need is not foreseen for the Chairperson, there is currently no tax equalization provision in place for the Chairperson.
No changes were made in 2019.
Stock Ownership
Our Board recognizes the critical role that executive stock ownership has in aligning the interests of management with those of shareholders. With the change in Executive Director leadership in 2018, stock ownership requirements were put in place, in line with prevalent market practice. The Executive Directors are subject to share ownership guidelines which require owning shares with an aggregate value of not less than five (5) times base salary within five (5) years from the start of their respective assignments. The Compensation Committee assesses on an annual basis the Executive Directors’ progress toward meeting this objective. As of December 31, 2019, the CEO owned 233,213 shares and the Chairperson owned 114,824. With a share price of $11.00 on December 31, 2019, the FMV of current holdings at year-end 2019 was 2.3 times base salary for the CEO and 5.0 times for the Chairperson. The Compensation Committee has communicated to the Executive Directors that they are making satisfactory progress toward this shareholding objective.
79
Recoupment of Incentive Compensation (Claw back Policy)
The Board is dedicated to maintaining and enhancing a culture focused on integrity and accountability. The Recoupment Policy in the Company’s Equity Incentive Plan (the “EIP”), which defines the terms and conditions for any subsequent long-term incentive program, and the Company Bonus Plan (the “CBP”), which defines the short-term incentive program, as well as in any executive employment agreements, authorizes the Company to recover, or “claw back,” incentive compensation with the ability to retroactively make adjustments if any cash or equity incentive award is predicated upon achieving financial results and the financial results are subject to an accounting restatement.
No recoupment of incentive compensation was warranted under any incentive plan during 2019.
Remuneration for Non-Executive Directors
The remuneration of Non-Executive Directors is governed by the CNH Industrial N.V. Directors’ Compensation Plan, which was approved by the Company’s shareholders and is periodically reviewed by the Compensation Committee. The current remuneration for the Non-Executive Directors, which did not change from 2018, is shown in the table below.
|
Non-Executive Director Compensation
|
Total
|
|||
|
Annual Cash Retainer
|
$
|
125,000
|
|
|
|
Additional retainer for Audit Committee member
|
$
|
25,000
|
|
|
|
Additional retainer for Audit Committee Chairperson
|
$
|
35,000
|
|
|
|
Additional retainer for member of other Board committees
|
$
|
20,000
|
|
|
|
Additional retainer for Chairperson of other Board committees
|
$
|
25,000
|
|
|
Non-Executive Directors receive their annual retainer fee, committee membership, and committee chair fee payments (collectively, “Fees”) only cash. Remuneration of Non-Executive Directors is fixed and not dependent on the Company’s financial results. Non-Executive Directors are not eligible for variable compensation and do not participate in any Company incentive plans.
Directors eligible to receive compensation under the CNH Industrial Directors’ Compensation Plan do not receive benefits upon termination of their service as directors.
In 2019, upon the recommendation of the Compensation Committee, the Board resolved to implement share ownership guidelines for the Non-Executive Directors. Effective from their April 2019 appointment, Non-Executive Directors must own one times the annual retainer fee, that is $125,000 within 24 months to reach the guideline. The Non-Executive Directors are expected to hold shares as a long-term investment and as such are expected to hold shares while active on the Board and for an additional three months after their Board service terminates.
80
Implementation of Remuneration Policy in
2019
The following table summarizes remuneration paid or awarded (in USD $) to CNH Industrial N.V. Directors for the years ended December 31, 2019 and 2018 (the “Summary Remuneration table”):
|
Board of Directors
|
Position
|
Year
|
Fixed Remuneration
|
Variable Remuneration
|
Extra-ordinary Items
(4)
|
Pension & Similar Benefits
(5)
|
Total Remuneration
|
Proportion of fixed to variable remuneration
(6)
|
||
|
Base Salary or Fees
|
Fringe Benefits
(1)
|
One-year Variable
(2)
|
Multi-year Variable
(3)
|
|||||||
|
MÜHLHÄUSER Hubertus
|
CEO
|
2019
|
1,102,242
|
211,050
|
367,000
|
4,423,674
|
3,100,417
|
238,449
|
9,442,832
|
18%
|
|
2018
(7)
|
317,308
|
4,164
|
553,000
|
1,346,145
|
1,303,568
|
7,961
|
3,532,146
|
10%
|
||
|
HEYWOOD Suzanne
|
Chairperson
|
2019
|
272,917
(8)
|
—
|
—
|
436,892
|
—
|
47,365
|
757,174
|
68%
|
|
Director
|
2018
(9)
|
170,000
|
—
|
—
|
—
|
—
|
—
|
170,000
|
100%
|
|
|
GEROWIN Mina
|
Director
|
2019
|
72,500
|
—
|
—
|
—
|
—
|
8,424
|
80,924
|
100%
|
|
2018
|
145,000
|
—
|
—
|
—
|
—
|
17,242
|
162,242
|
100%
|
||
|
HOULE Léo W.
|
Senior Non-Executive Director
|
2019
|
171,750
|
—
|
—
|
—
|
—
|
—
|
171,750
|
100%
|
|
2018
|
170,000
|
—
|
—
|
—
|
—
|
—
|
170,000
|
100%
|
||
|
KALANTZIS Peter
|
Director
|
2019
|
85,000
|
—
|
—
|
—
|
—
|
—
|
85,000
|
100%
|
|
2018
|
170,000
|
—
|
—
|
—
|
—
|
—
|
170,000
|
100%
|
||
|
LANAWAY John
|
Director
|
2019
|
150,000
|
—
|
—
|
—
|
—
|
—
|
150,000
|
100%
|
|
2018
|
150,000
|
—
|
—
|
—
|
—
|
—
|
150,000
|
100%
|
||
|
NASI Alessandro
|
Director
|
2019
|
85,000
|
—
|
—
|
—
|
—
|
—
|
85,000
|
100%
|
|
SCHEIBER Silke
|
Director
|
2019
|
150,000
|
—
|
—
|
—
|
—
|
31,482
|
181,482
|
100%
|
|
2018
|
150,000
|
—
|
—
|
—
|
—
|
17,932
|
167,932
|
100%
|
||
|
SIMONELLI Lorenzo
|
Director
|
2019
|
75,000
|
—
|
—
|
—
|
—
|
—
|
75,000
|
100%
|
|
TABELLINI Guido
|
Director
|
2019
|
72,500
|
—
|
—
|
—
|
—
|
—
|
72,500
|
100%
|
|
2018
|
145,000
|
—
|
—
|
—
|
—
|
—
|
145,000
|
100%
|
||
|
TAMMENOMS BAKKER Jacqueline
|
Director
|
2019
|
155,000
|
—
|
—
|
—
|
—
|
32,345
|
187,345
|
100%
|
|
2018
|
145,000
|
—
|
—
|
—
|
—
|
17,242
|
162,242
|
100%
|
||
|
THEURILLAT Jacques
|
Director
|
2019
|
160,000
|
—
|
—
|
—
|
—
|
19,177
|
179,177
|
100%
|
|
2018
|
160,000
|
—
|
—
|
—
|
—
|
19,312
|
179,312
|
100%
|
||
Notes:
|
(1)
|
The stated amount includes the use of transportation, (company car and personal usage of aircraft), company cost of life and health insurance benefits, and tax preparation services.
|
|
(2)
|
The amounts represent the bonus earned for the performance year and paid in the following year, e.g. 2019 which will be paid in 2020.
|
|
(3)
|
The amounts represent the Company's share-based compensation (SBC) expense under applicable accounting standards relating to grants issued to the Executive Directors under LTI programs covered by the CNH Industrial N.V. Equity Incentive Plan (EIP). The amounts include SBC expense related to the 2017-2019 PSUs that did not meet the threshold achievement for any payout, $2.9 million and $0.3 million respectively for the CEO and Chairperson in 2019 and $0.8 million and $0.3 million respectively in 2018. Not included in this column is the SBC expense for the “Make Whole” equity award granted to the CEO as a condition of his accepting the CEO role with the Company in 2018. The “Make Whole” award vested over the first anniversary from the CEO’s hire date and the related 2019 and 2018 expenses were $2.8 million and $1.14 million respectively. The related SBC expense is reported under the Extraordinary Items column.
|
|
(4)
|
The stated amount includes relocation benefits and the SBC expense related to the CEO’s “Make Whole” award,
$2.8 million and $1.14 million 2019 and 2018 respectively.
|
|
(5)
|
For the CEO, the stated amount includes company contributions to U.S. Social Security and Medicare, the Company defined contribution plan and the service cost for future retiree healthcare benefits and for the other Directors, company contributions into the U.K. National Insurance.
|
81
|
(6)
|
The ratio of the percentage of fixed pay elements over the percentage of variable pay elements. Variable elements include variable Incentives, extraordinary items and the pension benefits derived from variable remuneration.
|
|
(7)
|
The compensation reflects a partial year as the CEO was hired on September 17, 2018.
|
|
(8)
|
The stated amount includes the prorated fees for the Chairperson role from November 29, 2018 through December 31, 2018 paid in January 2019. Full year fees are $250,000.
|
|
(9)
|
The stated amount covers the CNH Industrial N.V. Board of Director fees earned in 2018, but paid directly to EXOR N.V., as disclosed in the 2018 Remuneration Report.
|
The following table summarizes remuneration paid or awarded (in USD $) to Directors of CNH Industrial N.V. for roles held in subsidiaries of CNH Industrial N.V. for the year ended December 31, 2019:
|
Board of Directors
|
Position
|
Year
|
Fixed Remuneration
|
Variable Remuneration
|
Extra-ordinary Items
|
Pension & Similar Benefits
(3)
|
Total Remuneration
|
Proportion of fixed to variable remuneration
|
||
|
Fees
(1)
|
Fringe Benefits
|
One-year Variable
|
Multi-year Variable
(2)
|
|||||||
|
NASI Alessandro
|
Chairman IVECO Defence S.p.A
|
2019
|
126,383
|
—
|
—
|
564,359
|
—
|
26,407
|
717,149
|
27%
|
Notes:
|
(1)
|
The stated amount is the fees for the Chairman of IVECO Defence S.p.A role.
|
|
(2)
|
The stated amount is the share-based compensation for Mr. Nasi prorated from the date of his appointment to CNH Industrial N.V. Board of Director to the end of the year. The amount includes $374k in SBC expense related to the 2017-2019 PSUs that did not meet the threshold achievement for any payout.
|
|
(3)
|
The stated amount includes the company social contributions in Italy on employment income.
|
If, and to the extent, any changes are made to 2020 remuneration, such changes will be in line with the Remuneration Policy.
82
For year-over-year reference, per the new Dutch Civil Code requirements, the following table shows the compensation change each of the past five years (in US$ 000s):
|
Board of Directors
|
Position
|
2019 vs 2018
|
2018 vs 2017
|
2017 vs 2016
|
2016 vs 2015
|
||||
|
MÜHLHÄUSER, Hubertus
(1)
|
CEO
|
5,911
|
|
3,532
|
|
—
|
|
—
|
|
|
TOBIN Richard
(1)
|
CEO
|
(508
|
)
|
(6,558
|
)
|
3,123
|
|
1,184
|
|
|
HEYWOOD Suzanne
(1)
|
Chairperson
|
757
|
|
—
|
|
—
|
|
—
|
|
|
MARCHIONNE Sergio
(1)
|
Chairman
|
(2,840
|
)
|
(2,311
|
)
|
2,422
|
|
(166
|
)
|
|
ELKANN John
(2)
|
Senior Non-Executive Director
|
—
|
|
—
|
|
(44
|
)
|
(131
|
)
|
|
GEROWIN Mina
(3)
|
Director
|
(81
|
)
|
(1
|
)
|
(1
|
)
|
6
|
|
|
GRIECO Maria Patrizia
(2)
|
Director
|
—
|
|
—
|
|
(36
|
)
|
(109
|
)
|
|
HEYWOOD, Suzanne
(1)
|
Director
|
(170
|
)
|
—
|
|
43
|
|
128
|
|
|
HOULE Léo W.
|
Director
|
2
|
|
(2
|
)
|
8
|
|
19
|
|
|
KALANTZIS Peter
(3)
|
Director
|
(85
|
)
|
—
|
|
—
|
|
—
|
|
|
LANAWAY John
|
Director
|
—
|
|
—
|
|
—
|
|
—
|
|
|
NASI Alessandro
(4)
|
Director
|
85
|
|
—
|
|
—
|
|
—
|
|
|
SCHEIBER, Silke
(5)
|
Director
|
14
|
|
(1
|
)
|
42
|
|
128
|
|
|
SIMONELLI Lorenzo
(4)
|
Director
|
75
|
|
—
|
|
—
|
|
—
|
|
|
TABELLINI Guido
(3)
|
Director
|
(73
|
)
|
—
|
|
5
|
|
15
|
|
|
TAMMENOMS BAKKER Jacqueline
(6)
|
Director
|
25
|
|
(1
|
)
|
(1
|
)
|
(5
|
)
|
|
THEURILLAT Jacques
|
Director
|
—
|
|
(1
|
)
|
—
|
|
(2
|
)
|
Notes:
|
(1)
|
During 2018, the Company’s Executive Directors changed. At the end of April, the former CEO, Richard Tobin, left the Company voluntarily, and Derek Neilson, one of our senior managers, was appointed as Chief Executive Officer, Ad Interim. On September 17, 2018, Hubertus Mühlhäuser, recruited externally, assumed the position of CEO. On July 21, 2018, the Board of Directors, having been apprised of the deteriorating health situation of its Chairman Sergio Marchionne, appointed Lady Heywood as Chairperson with immediate effect. On July 25, 2018, Mr. Marchionne passed away. Shareholders appointed Lady Heywood and Mr. Mühlhäuser as Executive Directors at the November 29, 2018 Extraordinary General Meeting. Lady Heywood’s Chairperson fees prorated from November 29, 2018 through December 31, 2018 were paid in January 2019.
|
(2)
The following Directors stepped down from their Board of Directors roles in 2016: Mr. Elkann and Ms.Grieco.
(3)
The following Directors stepped down from their Board of Directors roles in 2019: Ms.Gerowin, Mr. Kalantzis, and Mr. Tabellini.
(4)
The following Directors were appointed their Board of Directors roles in 2019: Mr. Nasi and Mr. Simonelli.
(5)
Ms. Scheiber was appointed to the Board of Directors in 2016.
|
(6)
|
Ms. Jacqueline Tammenoms Bakker became a member of the Compensation Committee in 2019 in addition to the Governance and Sustainability Committee.
|
Executive Officers’ Compensation
The aggregate amount of compensation paid to or accrued for executive officers that held office during 2019 was approximately $23.4 million, including $2.3 million in pension and similar benefits paid or set aside by us. The aggregate amounts included those paid to or accrued for 11 executives at December 31, 2019.
83
Share Ownership
Collectively, our Directors and Executive Directors own less than one percent of our outstanding common shares. In 2019, the Company established share ownership requirements for both the Executive Directors and Non-Executive Directors. The following table summarizes the number of CNH Industrial common shares owned by our directors
and Global Executive Committee members
as of
February 28, 2020.
|
(number)
|
Common
Shares
(1)
|
||
|
CNH Industrial Directors owning CNH Industrial Common Shares at February 28, 2020
|
|||
|
Suzanne Heywood
|
114,824
|
|
|
|
Léo W. Houle
2
|
57,259
|
|
|
|
John Lanaway
|
37,286
|
|
|
|
Hubertus Mühlhäuser
|
233,213
|
|
|
|
Alessandro Nasi
|
333,286
|
|
|
|
Lorenzo Simonelli
|
14,327
|
|
|
|
Jacques Theurillat
|
18,422
|
|
|
|
CNH Industrial Global Executive Committee owning CNH Industrial Common Shares at February 28, 2020
|
|||
|
Luc Billiet
|
57,530
|
|
|
|
Massimiliano Chiara
|
129,626
|
|
|
|
Vilmar Fistarol
|
95,993
|
|
|
|
Oddone Incisa
|
41,257
|
|
|
|
Derek Neilson
|
245,257
|
|
|
|
Stefano Pampalone
|
45,016
|
|
|
|
Annalisa Stupenengo
|
50,540
|
|
|
|
Tom Verbaeten
|
61,649
|
|
|
|
Andreas Weishaar
|
55,313
|
|
|
(1)
No one member beneficially owns more than
1%
of our common shares
(2)
Mr. Houle also holds 57,259 special voting shares associated with his common shares.
84
Stock Options
As of December 31, 2019, no remaining stock options are held by CNH Industrial Directors under the CNH Industrial Directors’ Compensation Plan for Non-Executive Directors, the CNH Global Directors’ Compensation Plan (“CNH DCP”) for Non-Executive Directors and the CNH Global Equity Incentive Plan (“CNH EIP”) for Executive Directors. Ms. Mina Gerowin, a former Board of Director, exercised five of her seven stock option grants on September 4, 2019. The remaining two stock option grants were forfeited. The stock option activity in 2019 was as follows:
|
|
|
|
|
|
|
Information regarding the reported financial year
|
||||
|
The main conditions of share option plans
|
Opening Balance
|
During the year
|
Ending Balance
|
|||||||
|
Name of Director, position
|
Plan Name
|
Award Date
|
Vesting Date
|
Expiration Date
|
Strike price of the share
|
Share options awarded at the beginning of the period
|
Share options exercised
|
FMV at Exercise $/option
|
Share options forfeited
|
Share options outstanding at the end of the period
|
|
GEROWIN
Mina, former Director
|
Director SO
|
12/28/2013
|
12/28/2013
|
10/12/2019
|
11.33
|
6,402
|
—
|
—
|
6,402
|
—
|
|
Director SO
|
3/28/2014
|
3/28/2014
|
10/12/2019
|
11.26
|
6,442
|
—
|
—
|
6,442
|
—
|
|
|
Director SO
|
6/26/2014
|
6/26/2014
|
10/12/2019
|
10.25
|
7,073
|
7,073
|
10.305
|
—
|
—
|
|
|
Director SO
|
9/24/2014
|
9/24/2014
|
10/12/2019
|
7.82
|
9,271
|
9,271
|
10.305
|
—
|
—
|
|
|
Director SO
|
12/23/2014
|
12/23/2014
|
10/12/2019
|
8.26
|
8,777
|
8,777
|
10.305
|
—
|
—
|
|
|
Director SO
|
4/14/2015
|
4/14/2015
|
10/12/2019
|
8.25
|
4,394
|
4,394
|
10.305
|
—
|
—
|
|
|
Director SO
|
7/13/2015
|
7/13/2015
|
10/12/2019
|
9.52
|
3,808
|
3,808
|
10.305
|
—
|
—
|
|
|
|
|
|
|
|
Total:
|
46,167
|
33,323
|
|
12,844
|
—
|
Note: Total Fair Market Value (FMV) upon exercise of the stock options was $53,395.
Stock options for Non-Executive Directors expire upon the earlier of (i) ten years after the grant date, or (ii) six months after the date an individual ceases to be a director. The exercise date for Ms. Gerowin fell within the exercise period of the options which expired October 12, 2019. There were no performance conditions applicable as options were a choice for payment of Directors’ fees in lieu of cash payment. As such, there was no vesting or holding period applicable.
85
Share Awards
The following table summarizes unvested performance share units and restricted share units held by Executive Directors and Non-Executive Directors as of December 31, 2019:
|
Information regarding the reported financial year
|
||||||||||||||||||||||
|
The main conditions of share unit plans
|
Opening Balance
|
During the Year
|
Closing Balance
|
Accounting Expense
(6)
|
||||||||||||||||||
|
Name of Director, Position
|
Award Name
|
Performance Period
|
Award Date
|
Vesting Date
|
End of Holding Period
|
Shares Awarded at the Beginning of the Period
|
Shares Awarded
|
Shares Forfeited
|
Shares Vested
|
Share Subject to a Performance Condition
|
Shares Unvested
|
Shares Subject to a Holding Period
(5)
|
||||||||||
|
FMV at Grant (US$000s)
|
FMV at Vest (US$000s)
|
US$000s
|
||||||||||||||||||||
|
MÜHLHÄUSER Hubertus, CEO
|
2017-2019 PSU
(1)
|
01/01/17 – 12/31/19
|
9/17/18
|
2/28/20
|
9/17/23
|
492,700
|
|
—
|
|
492,700
|
|
—
|
|
—
|
|
—
|
|
—
|
|
|||
|
—
|
|
2,888
|
|
|||||||||||||||||||
|
2017-2019 RSU
(2)
|
09/17/18 – 06/30/20
|
9/17/18
|
6/30/20
|
9/17/23
|
164,300
|
|
—
|
|
—
|
|
82,150
|
|
—
|
|
82,150
|
|
82,150
|
|
||||
|
843
|
|
1,133
|
|
|||||||||||||||||||
|
2018 Make Whole RSU
(3)
|
09/17/18 – 09/17/19
|
9/17/18
|
9/17/19
|
9/17/23
|
339,100
|
|
—
|
|
—
|
|
339,100
|
|
—
|
|
—
|
|
339,100
|
|
||||
|
3,722
|
|
2,811
|
|
|||||||||||||||||||
|
2019 RSU
(4)
|
01/30/19 – 02/01/21
|
1/30/19
|
2/1/21
|
1/30/24
|
97,300
|
|
—
|
|
—
|
|
—
|
|
97,300
|
|
—
|
|
||||||
|
984
|
|
403
|
|
|||||||||||||||||||
|
HEYWOOD, Suzanne Chairperson
|
2017-2019 PSU
(1)(7)
|
01/01/17 – 12/31/19
|
11/29/18
|
2/28/20
|
11/29/23
|
61,000
|
|
—
|
|
61,000
|
|
—
|
|
—
|
|
—
|
|
—
|
|
|||
|
—
|
|
271
|
|
|||||||||||||||||||
|
2017-2019 RSU
(2)(7)
|
11/29/18 – 06/30/20
|
11/29/18
|
6/30/20
|
11/29/23
|
20,300
|
|
—
|
|
—
|
|
10,150
|
|
—
|
|
10,150
|
|
10,150
|
|
||||
|
104
|
|
166
|
|
|||||||||||||||||||
|
NASI, Alessandro, former CNHI Executive Officer
|
2017-2019 PSU
(4)
|
01/01/17 – 12/31/19
|
12/22/17
|
2/28/20
|
2/28/20
|
122,667
|
|
—
|
|
122,667
|
|
—
|
|
—
|
|
—
|
|
—
|
|
|||
|
—
|
|
374
|
|
|||||||||||||||||||
|
2017-2019 RSU
(4)
|
12/22/17 – 06/30/20
|
12/22/17
|
6/30/20
|
6/30/20
|
61,334
|
|
—
|
|
—
|
|
30,667
|
|
—
|
|
30,667
|
|
—
|
|
||||
|
294
|
|
187
|
|
|||||||||||||||||||
|
2016 RSU
(4)
|
06/09/2016 - 06/09/2019
|
6/9/16
|
6/9/20
|
6/9/20
|
6,267
|
|
—
|
|
—
|
|
6,267
|
|
—
|
|
—
|
|
—
|
|
||||
|
57
|
|
3
|
|
|||||||||||||||||||
|
Total Shares:
|
1,267,668
|
|
97,300
|
|
676,367
|
|
468,334
|
|
—
|
|
220,267
|
|
431,400
|
|
||||||||
|
Total FMV ($000s)
|
984
|
|
5,020
|
|
8,236
|
|
||||||||||||||||
|
(1)
|
This PSU award was the equity award for the 2017-2019 performance period, based on Company Performance: Relative TSR, weighted 100%, and maintaining investment credit rating. The threshold achievement was not met and all outstanding PSUs under this plan forfeited.
|
|
(2)
|
This RSU award is the retention-based equity award for the remainder of the three-year period, 2017-2019. Vesting is in two equal installments; the first installment vested on June 30, 2019 and second will vest on June 30, 2020.
|
|
(3)
|
As a condition of hiring, the CEO was granted a “Make Whole” RSU to compensate for forfeited equity awards from his prior employer. The “Make Whole” award vested over the first anniversary from the CEO’s hire date.
|
|
(4)
|
These awards were granted to Mr. Nasi when an employee of CNH Industrial, and per the Company’s agreement, the balances shown would continue to vest according to the terms and conditions of the awards. The 2017-2019 RSU awards at the beginning of the period have two installments; the first vested on 6/30/2019 and the second will vest on 6/30/2020. No holding period after vesting applies to any of Mr. Nasi's awards.
|
|
(5)
|
The gross shares of the awards that vested during 2019 are shown in the table, but only the related after-tax shares delivered are subject to the holding period. Shares were sold to cover withholdings.
|
|
(6)
|
The accounting valuation of share-based compensation expense (“SBC expense”) is the value reported for equity awards in the Summary Remuneration table. The SBC expense for the CEO’s “Make Whole” award is reported in the Extraordinary Items column.
|
|
(7)
|
On December 14, 2018, the Compensation Committee and the Non-Executive Directors approved the Chairperson’s compensation package, including a prorated award, under the 2017-2019 LTIP, for period remaining in the three-year program, split 75% for performance based awards (61,000 PSUs) and 25% for retention based awards (20,300 RSUs).
|
86
C.
Board Practices
CNH Industrial is a company, organized under the laws of the Netherlands, and results from a business combination of Fiat Industrial and CNH Global N.V. consummated on September 29, 2013. CNH Industrial qualifies as a foreign private issuer under the applicable rules of the SEC and its common shares are listed on the NYSE and on the MTA.
We are subject to, among other things, the laws of the Netherlands and the laws and regulations applicable to foreign private issuers in the U.S., the Dutch Corporate Governance Code (the “Dutch Code”), the Sarbanes Oxley Act of 2002, the Dodd-Frank Act and the NYSE listing standards, which are of particular significance to our corporate governance. In accordance with the NYSE Listed Company Manual, we are permitted to follow home country practice with regard to certain corporate governance standards. We describe the significant differences between our corporate governance practices and those required (i) under the Dutch Code and (ii) for domestic U.S. listed companies by the NYSE listing standards under “Item 16G. Corporate Governance”.
Board of Directors
We have a one-tier management structure (i.e. management board that may be comprised of both members having responsibility for our day-to-day operations, who are referred to as “executive directors”, and members not having such responsibility, who are referred to as “non-executive directors”). Pursuant to our Articles of Association, the Board of Directors may have three or more members. The Board of Directors currently has nine members. Our executive directors, Lady Heywood and Mr. Mühlhäuser, and our non-executive directors were elected at the last AGM on April 12, 2019. See “Item 6A. Directors, Senior Management and Employees” above. The term of office of the current Board of Directors will expire on April 16, 2020, the anticipated date of the Company’s next AGM at which shareholders will elect the Company’s directors for approximately a one-year term ending on the date of the AGM to be held in 2021. Each director may be re-elected at any subsequent general meeting of shareholders. None of our directors have service contracts with the Company (or any subsidiary) providing for benefits upon termination of employment as a director.
The Board as a whole is responsible for the strategy of the Company. The Board of Directors is currently composed of two executive directors (to whom the titles Chairperson and Chief Executive Officer have been granted) and seven non-executive directors. Under Article 16 of our Articles of Association, the general authority to represent CNH Industrial shall be vested in the Board of Directors, as well as in each of the executive directors to whom the title Chairperson or Chief Executive Officer has been granted.
Six directors (67%) qualify as independent for purposes of NYSE rules, Rule 10A-3 under the Securities Exchange Act of 1934, as amended (the “Exchange Act”) and the Dutch Code.
On September 9, 2013, the Board of Directors of the Company appointed-with effect as of the closing of the Merger - the following internal committees: (i) an Audit Committee, (ii) a Governance and Sustainability Committee, and (iii) a Compensation Committee. On April 12, 2019, the Board of Directors appointed Mr. Léo Houle Senior Non-Executive Director for purposes of best practice provision 5.1.3, and in compliance with best practice provision 2.1.9, of the Dutch Code. The Senior Non-Executive Director is responsible for the proper functioning of the Board of Directors and its Committees. On certain key operational matters, the Board of Directors is advised by the Company's Global Executive Committee (formally named the Group Executive Council, “GEC”). The GEC is an operational decision-making body that is responsible for reviewing the operating performance of the Company’s businesses and making decisions on certain operational matters.
The Board is responsible for creating a culture aimed at long-term value creation for CNH Industrial and all of its stakeholders. Operating in compliance with all applicable laws and consistent with the Company’s values and expectations is critical to creating such a culture. Accordingly, to clarify and make explicit the Company’s values and expectations, in 2014 the Board adopted the Company’s code of conduct (“Code of Conduct”) and the Company issued its Supplier Code of Conduct. In addition, the Company established a compliance and ethics program that is overseen by the Global Compliance and Ethics Committee (“GCEC”). The members of the GCEC include: the Chief Executive Officer, the Chief Financial Officer, the head of Internal Audit, the Corporate General Counsel, the Chief Compliance Officer (“CCO”), the Chief Information Officer, the President of the Financial Services segment, the head of the Human Resources function, and the Chief Strategy, Talent, ICT and Digital Officer. The GCEC meets at least quarterly to, among other things, review and discuss compliance and ethics trends and topics, review and discuss compliance risk assessments, discuss compliance-related training to be deployed, consider the need for new or modified compliance-related corporate policies, and review matters submitted to the Company’s Compliance Helpline (see Item 10(B) below) and related investigations. The extent to which each employee complies with and promotes such culture and values is assessed each year through the Company’s performance assessment process. Among other things, employees are evaluated on their ability to lead people, act with integrity and honesty, drive collaboration through respect and openness, and hold themselves and others accountable.
The non-executive directors believe that in consideration of the size of the Company, the complexity and specific characteristics of the segments in which it operates and the geographic distribution of its businesses, the Board of Directors should be composed of individuals with skills, experience and cultural background, both general and specific, acquired in an international environment and relevant to an understanding of the macro-economy and global markets, more generally, as well as the industrial and financial sectors, more specifically. An appropriate and diversified mix of skills, professional backgrounds and diversity factors (such as gender, race, ethnicity, and country of origin or nationality) are fundamental to the proper functioning of the Board as a collegial body. There should also be an appropriate balance between the number of executive directors and non-executive directors. Moreover, independent directors have an essential role
87
in protecting the interests of all stakeholders. Their contribution is also necessary for the proper composition and functioning of the Committees, whose advisory functions include preliminary examination and formulation of proposals relating to areas of potential risk, such as prevention of potential conflicts of interest. In addition, with regard to diversity, it is generally recognized that boards with adequate diversity are more effective in performing their monitoring and advisory activities, due to the variety of professional experience, perspectives, insights, skills and connections to the outside world that diversity can add.
88
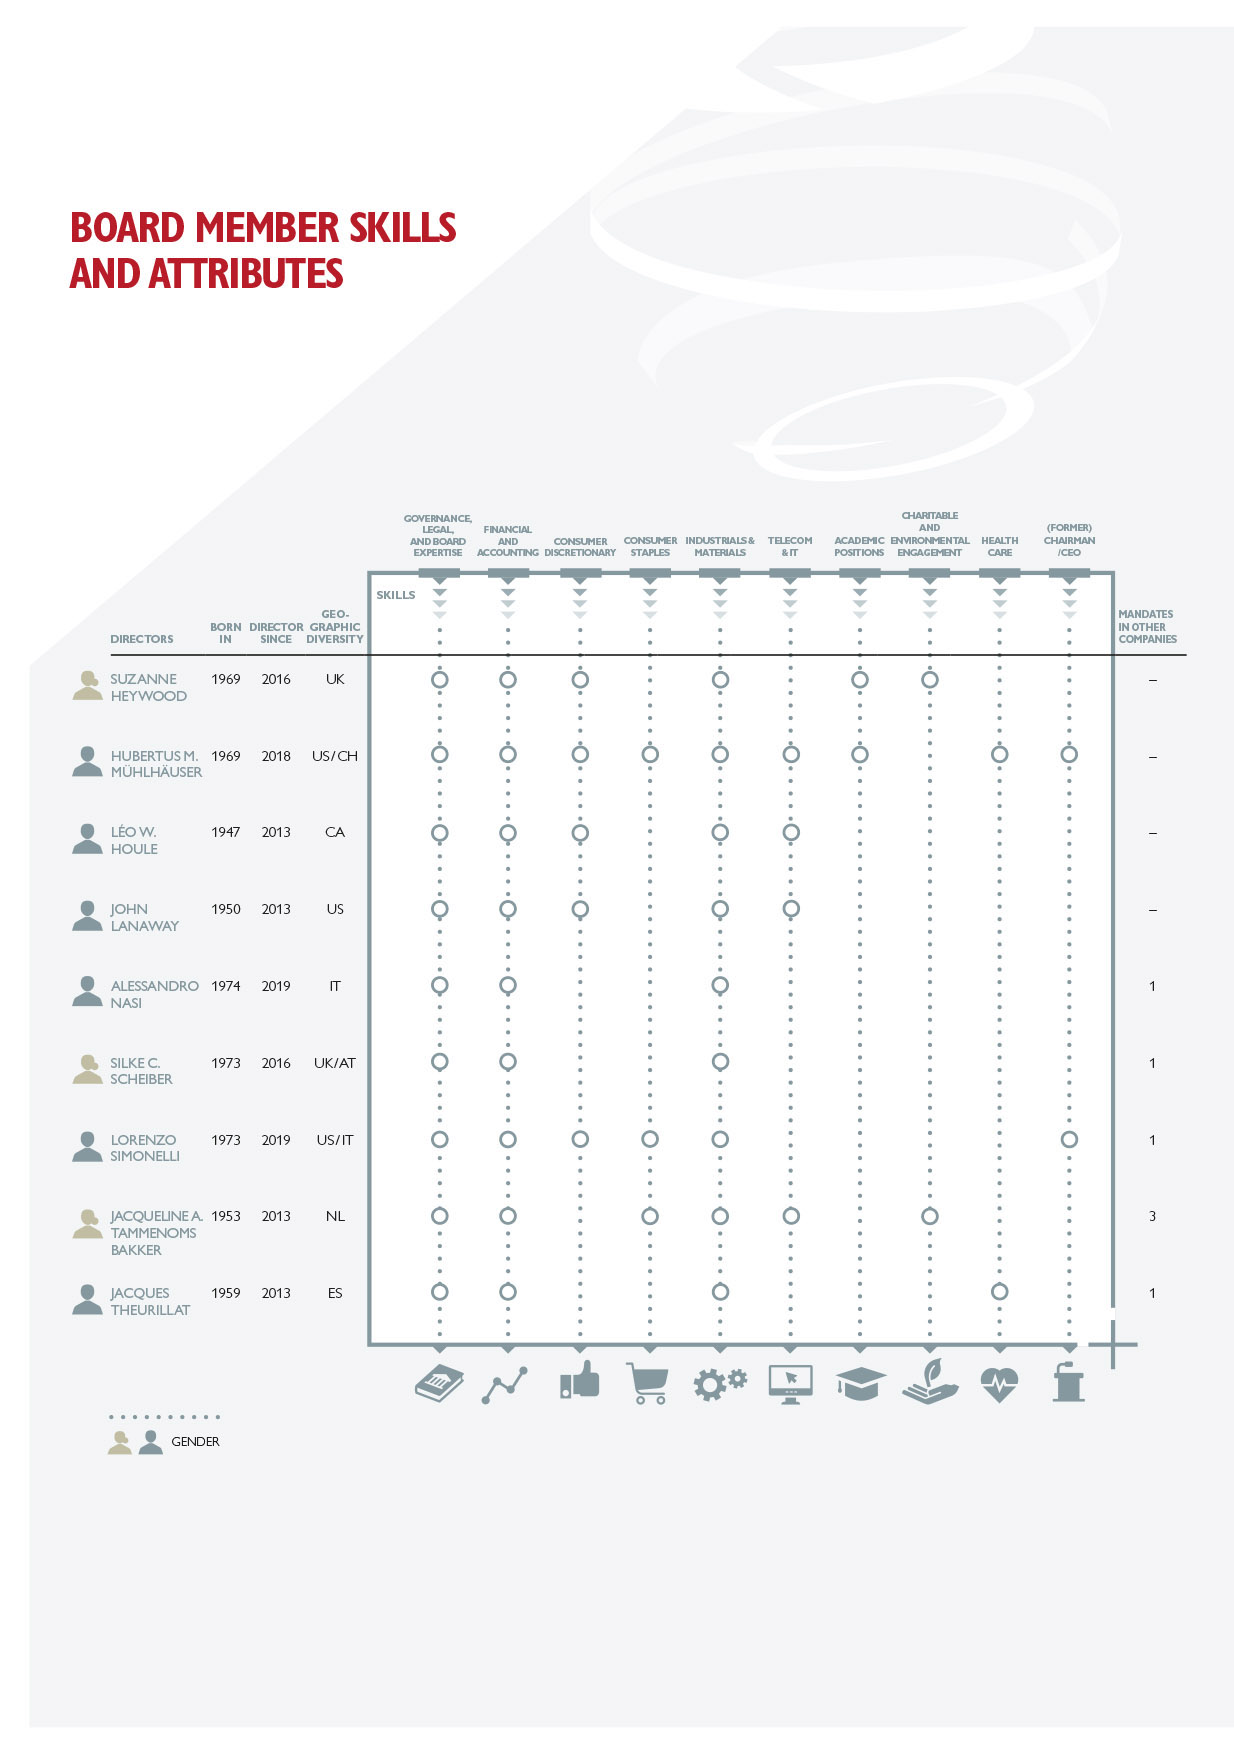
89
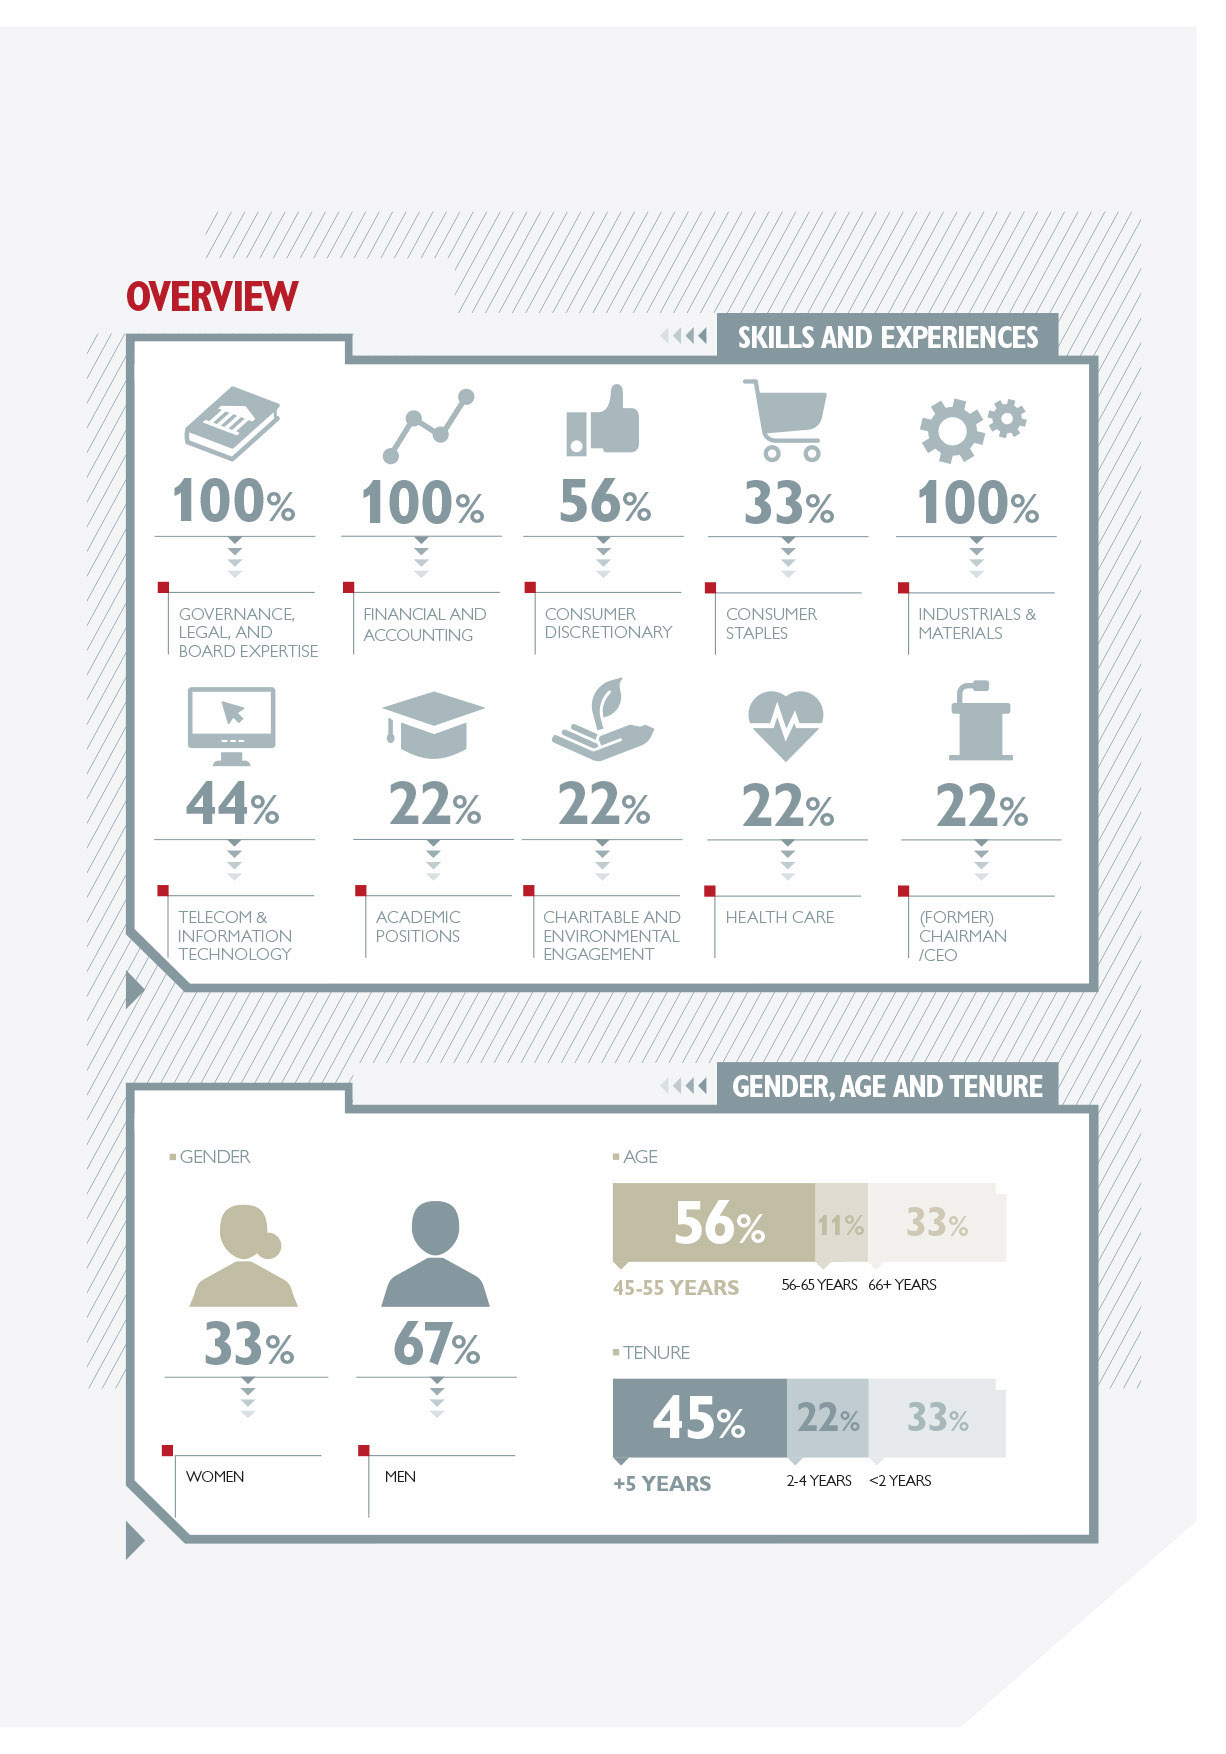
90
The following chart shows the 2019 Board members and their attendance at Board meetings.
|
Board Member
|
Heywood
|
Houle
|
Lanaway
|
Mühlhäuser
|
Nasi
|
Scheiber
|
Simonelli
|
Tammenoms Bakker
|
Theurillat
|
|
Attendance:
|
100%
|
100%
|
100%
|
100%
|
100%
|
80%
|
75%
|
90%
|
80%
|
The Audit Committee
The Company’s Audit Committee is responsible for assisting the Board of Directors’ oversight of: (i) the integrity of the Company’s financial statements, (ii) the Company’s policy on tax planning, (iii) the Company’s financing, (iv) the Company’s application of information and communication technology, (v) the systems of internal controls that management and the Board of Directors have established, (vi) the Company’s compliance with legal and regulatory requirements, (vii) the Company’s compliance with recommendations and observations of internal and external auditors, (viii) the Company’s policies and procedures for addressing certain actual or perceived conflicts of interest, (ix) the independent auditors’ qualifications, independence, remuneration and any non-audit services for the Company, (x) the performance of the Company’s internal audit function and of the independent auditors, (xi) risk management guidelines and policies, and (xii) the implementation and effectiveness of the Company’s ethics and compliance program.
The Audit Committee currently consists of Messrs. Theurillat (Chairperson), Lanaway, Simonelli, and Ms. Scheiber, all of whom are independent, non-executive directors. Under the Audit Committee Charter, the Audit Committee is elected by the Board of Directors, and is comprised of at least three members who may be appointed for terms of up to two years, each of whom must be a non-executive director. Members of the Audit Committee may be reappointed. Audit Committee members are also required (i) not to have any material relationship with the Company or to serve as auditors or accountants for the Company, (ii) to be “independent”, under the NYSE rules, Rule 10A-3 under the Exchange Act and the Dutch Code, and (iii) to be “financially literate” and have “accounting or selected financial management expertise” (as determined by the Board of Directors). At least one member of the Audit Committee shall be a “financial expert” as defined in the rules of the SEC and best practice provisions of the Dutch Code. No Audit Committee member may serve on more than four audit committees for other public companies, absent a waiver from the Board of Directors, which must be disclosed in the annual report on Form 20-F. Unless decided otherwise by the Audit Committee, the independent auditors of the Company, as well as the Chief Financial Officer of the Company, attend its meetings. See “Item 16A. Audit Committee Financial Expert” of this annual report on Form 20-F for additional information regarding Audit Committee financial expert.
The Charter for the Audit Committee is available on our web site (www.cnhindustrial.com). The information contained on our web site is not included in, or incorporated by reference into, this annual report on Form 20-F.
The following chart shows the 2019 Audit Committee members and their attendance at Committee meetings.
|
Audit Committee Member
|
Theurillat
|
Lanaway
|
Scheiber
|
Simonelli
|
|
|
Attendance:
|
100%
|
90%
|
70%
|
86%
|
|
The Compensation Committee
The Company’s Compensation Committee is responsible for, among other things, assisting the Board of Directors in: (i) determining executive compensation consistent with the Company’s remuneration policy, (ii) reviewing and recommending for approval the compensation of executive directors, (iii) administering equity incentive plans and deferred compensation benefit plans, and (iv) discussing with management the Company’s policies and practices related to compensation and issuing recommendations thereon.
The Compensation Committee currently consists of Mr. Houle (Chairperson), and Messrs, Nasi and Tammenoms Bakker, all of whom are independent, non-executive directors. The Compensation Committee is elected by the Board of Directors, and is comprised of at least three directors. No more than one member may be non-independent under the Dutch Code. The members of the Compensation Committee are appointed for terms of up to two years. Members of the Compensation Committee may be reappointed. Unless decided otherwise by the Compensation Committee, the Company’s Chief Human Resources Officer attends its meetings.
See “Item 16G. Corporate Governance” for additional information regarding how the composition of the Compensation Committee deviates from the rules of the NYSE.
The Charter for the Compensation Committee is available on our web site (www.cnhindustrial.com). The information contained on our web site is not included in, or incorporated by reference into, this annual report on Form 20-F.
The following chart shows the 2019 Compensation Committee members and their attendance at Committee meetings.
|
Compensation Committee Member
|
Houle
|
Nasi
|
Tammenoms Bakker
|
|
|
Attendance:
|
100%
|
100%
|
100%
|
|
91
The Governance and Sustainability Committee
The Governance and Sustainability Committee is responsible for, among other things, assisting the Board of Directors with: (i) the identification of the criteria, professional and personal qualifications for candidates to serve as directors of the Company, (ii) periodic assessment of the size and composition of the Board of Directors, (iii) periodic assessment of the functioning of individual Board members and reporting on this to the Board of Directors, (iv) proposals for appointment of executive and non-executive directors, (v) supervision of the selection criteria and appointment procedure for senior management, (vi) monitoring and evaluating reports on the Company’s sustainable development policies and practices, management standards, strategy, performance and governance globally, and (vii) reviewing, assessing and making recommendations as to strategic guidelines for sustainability-related issues, and reviewing the Company’s annual Sustainability Report.
The Governance and Sustainability Committee currently consists of Mr. Nasi (Chairperson), Mr. Houle, and Ms. Tammenoms Bakker, all of whom are independent, non-executive directors. The Governance and Sustainability Committee is elected by the Board of Directors, and is comprised of at least three Directors. No more than two members may be non-independent, and none of the members may be executive directors. The members of the Governance and Sustainability Committee are appointed for terms of up to two years. Members of the Governance and Sustainability Committee may be reappointed.
See “Item 16G. Corporate Governance” for additional information regarding how the composition of the Governance and Sustainability Committee deviates from the rules of the NYSE.
The Charter for the Governance and Sustainability Committee is available on our web site (www.cnhindustrial.com). The information contained on our web site is not included in, or incorporated by reference into, this annual report on Form 20-F.
The following chart shows the 2019 Governance and Sustainability Committee members and their attendance at Committee meetings.
|
Governance & Sustainability Committee Member
|
Nasi
|
Houle
|
Tammenoms Bakker
|
|
|
Attendance:
|
100%
|
100%
|
100%
|
|
Indemnification of Members of the Board of Directors
Pursuant to Article 17 of the Articles of Association, the Company has committed to indemnify any and all of its directors, officers, former directors, former officers and any person who may have served at its request as a director or officer of another company in which it owns shares or of which it is a creditor, against any and all expenses actually and necessarily incurred by any of them in connection with the defense of any action, suit or proceeding in which they, or any of them, are made parties, or a party, by reason of being or having been director or officer of the Company, or of such other company, except in relation to matters as to which any such person shall be adjudged in such action, suit or proceeding to be liable for negligence or misconduct in the performance of duty. Such indemnification shall not be deemed exclusive of any other rights to which those indemnified may be entitled otherwise.
D. Employees
The ability to attract, retain, and further develop qualified employees is crucial to the success of CNH Industrial’s businesses and its ability to create value over the long-term. CNH Industrial’s business is, by its nature, labor intensive and this is reflected in the high number of Group hourly employees.
92
The following tables show the breakdown of the number of employees by segment and by region at
December 31, 2019
,
2018
and
2017
:
|
(number)
|
2019
|
2018
|
2017
|
||||||
|
Agriculture
|
25,163
|
|
25,711
|
|
25,007
|
|
|||
|
Construction
|
5,318
|
|
5,424
|
|
5,240
|
|
|||
|
Commercial and Specialty Vehicles
|
23,692
|
|
23,933
|
|
23,843
|
|
|||
|
Powertrain
|
8,064
|
|
8,265
|
|
8,050
|
|
|||
|
Financial Services
|
1,128
|
|
1,149
|
|
1,071
|
|
|||
|
Other activities
|
134
|
|
143
|
|
145
|
|
|||
|
Total
|
63,499
|
|
64,625
|
|
63,356
|
|
|||
|
(number)
|
2019
|
2018
|
2017
|
||||||
|
Europe
|
41,499
|
|
41,982
|
|
40,979
|
|
|||
|
North America
|
8,447
|
|
8,856
|
|
8,691
|
|
|||
|
South America
|
7,997
|
|
8,001
|
|
8,150
|
|
|||
|
Rest of World
|
5,556
|
|
5,786
|
|
5,536
|
|
|||
|
Total
|
63,499
|
|
64,625
|
|
63,356
|
|
|||
As of December 31, 2019, CNH Industrial had
63,499
employees,
a decrease
of
1,126
from the
64,625
employees at year-end 2018. The change was mainly attributable to
the difference between new hires (approximately 5,200) and departures (approximately 6,300) during the year. A further decrease of approximately 40 employees was due to changes in the scope of the operations, mainly related to the sale of the Truckline parts business, retailer and distributor of aftermarket commercial vehicle parts and accessories in Australia, partially offset by the acquisition of the AgDNA, ATI Track Systems, K-Line AG companies in Australia and North America as CNHI Industrial commitment to growing its global agriculture business focused on placing technological advancements at the services of its brands’ global customer.
Excluding the scope of the operati
ons, the change compared to year-end 2018 is attributable to the decrease in permanent and fixed term workers for manufacturing activities, primarily for Agriculture in Europe and North America and for Powertrain in Europe, and to the reduction of salaried employees, due to optimizations linked to the business trend, for Agriculture mainly in North America and for Commercial and Specialty Vehicles and Construction mainly in Europe. The decrease has been partially offset by a moderate increase in the Research and Development personnel to strengthen the skills and competences needed for the transition driven by the technology megatrends like electrification and autonomous driving as well as alternative propulsions.
Collective Bargaining
In the United States, unions represent a small portion of our production and maintenance employees. The collective bargaining agreement with the United Automobile, Aerospace and Agricultural Implement Workers of America, which represents approximately 830 hourly production and maintenance employees in Burlington, Iowa and Racine, Wisconsin, continues through April 30, 2022. The collective bargaining agreement with the International Association of Machinists and Aerospace Workers, which represents approximately 430 of our employees in Fargo, North Dakota, continues through April 28, 2024.
In Europe, most employees are covered by collective labor agreements (“CLAs”) stipulated either by a CNH Industrial subsidiary or by the employer association for the specific industry to which the CNH Industrial subsidiary belongs.
In Italy, the approximately 16,850 CNH Industrial employees are covered by the CLA that was renewed on March 11, 2019 and expiring December 31, 2022. The approximately 430 CNH Industrial Managers are covered by the CLA renewed in 2016 and expired at the end of 2017, whose duration was tacitly extended.
Although we believe that our relations with employees and unions representing them are generally positive, current or future issues with labor unions might not be resolved favorably, and we may experience a work interruption or stoppage that could significantly impact the volume of products we manufacture and sell.
Please see “Item 3. Key Information—D. Risk Factors—Risks Related to Our Business, Strategy and Operations—We face risks associated with our relationships with our employees” for additional information.
93
|
Item 7.
|
Major Shareholders and Related Party Transactions
|
A.
Major Shareholders
The following table sets forth information with respect to ownership of our share capital in excess of 3% as of January 31, 2020 based on publicly available information.
|
Name of Beneficial Owner
|
Number of Common Shares Owned
|
Percent of Common Shares (c)
|
|||
|
EXOR N.V.
(a)
|
366,927,900
|
27.2
|
%
|
||
|
Harris Associates L.P.
(b)
|
185,027,203
|
13.7
|
%
|
||
|
a)
|
In addition, EXOR N.V. holds 366,927,900 special voting shares; EXOR N.V.'s beneficial ownership in CNH Industrial is 42.2%, calculated as the ratio of (i) the aggregate number of common and special voting shares owned by EXOR N.V. and (ii) the aggregate number of outstanding common shares and special voting shares of CNH Industrial. There were 1,738,119,416 outstanding common shares and special voting shares at January 31, 2020.
|
|
b)
|
Harris Associates L.P.'s beneficial ownership in CNH Industrial is 10.6% calculated as the ratio of (i) the number of common shares owned by Harris Associates L.P. and (ii) the aggregate number of outstanding common shares and special voting shares of CNH Industrial. There were 1,738,119,416 outstanding common shares and special voting shares at January 31, 2020.
|
|
c)
|
There were 1,350,168,250 common shares outstanding as of January 31, 2020. All these common shares have the same rights and entitlements. The “Percent of Common Shares” was calculated by using the publicly disclosed number of owned common shares as the numerator, respectively, and the number of the Company’s outstanding common shares as of January 31, 2020 as the denominator.
|
As of January 31, 2020, EXOR N.V.’s voting power in CNH Industrial as a result of the loyalty voting program was approximately
42.2%
. EXOR N.V., through its voting power, has the ability to significantly influence the decisions submitted to a vote of our shareholders, including approval of annual dividends, the election and removal of directors, mergers or other business combinations, the acquisition or disposition of assets and issuances of equity and the incurrence of indebtedness.
Our common shares are listed and can be traded on either the NYSE in U.S. dollars or the MTA in euro. The special voting shares are not listed on the NYSE or the MTA, not tradable and transferable only in very limited circumstances and only together with the common shares to which they are associated.
Our shares may be held in the following three ways:
|
•
|
If a shareholder holds common shares directly in his or her own name in the United States, such shares are held in registered form in an account at Computershare Trust Company, N.A., our transfer agent.
|
|
•
|
Interests in our common shares that are traded on the NYSE are held through the book-entry system provided by The Depository Trust Company (“DTC”) and are registered in the register of shareholders in the name of Cede & Co., as DTC’s nominee. Interests in the common shares traded on the MTA are held through Monte Titoli S.p.A., the Italian central clearing and settlement system, as a participant in DTC.
|
|
•
|
Special voting shares and the associated common shares are registered in the books and records of the Company’s transfer agents in the United States and Italy. As noted above, the special voting shares and associated common shares are not tradable. The associated common shares are only tradable after they are de-registered from the loyalty voting program at which time the associated special voting shares are surrendered to the Company. There is no possibility to hold a special voting share without holding an associated common share.
|
At January 31, 2020, there were 464 registered holders of our common stock in the U.S., including 142 shareholders that hold special voting shares associated with their common shares. As of January 31, 2020, based on the Company's share register and other sources available to us, approximately 109,000,000 common shares (3,875,575 of which had associated special voting shares) were held in the U.S.
B.
Related Party Transactions
Our related parties are primarily EXOR N.V. and the companies belonging to the EXOR Group, including Fiat Chrysler Automobiles N.V. and its subsidiaries and affiliates and Ferrari N.V. and its subsidiaries and affiliates. Members of CNH Industrial’s Board of Directors and executives with strategic responsibilities and their families are also considered related parties. As of January 31, 2020, EXOR N.V. holds approximately
42.2%
of our voting power and has the ability to significantly influence the decisions submitted to a vote of CNH Industrial’s shareholders. In addition, CNH Industrial engages in transactions, on commercial terms that are normal in the respective markets, with its unconsolidated subsidiaries and affiliates which CNH Industrial has a significant influence over or that CNH Industrial jointly controls. Transactions carried out by CNH Industrial, which have had an effect on revenues, finance, interest and other income,
94
cost of goods sold and trade receivables and payables, with unconsolidated subsidiaries, jointly-controlled entities, associates and other related parties, are primarily of a commercial nature. See “Note 21: Related Party Information” in the notes to our consolidated financial statements for the year ended
December 31, 2019
for further information.
|
Item 8.
|
Financial Information
|
A.
Consolidated Statements and Other Financial Information
See “Item 18. Financial Statements” for a list of the financial statements filed with this annual report.
B.
Significant Changes
The Board of Directors recommended and proposed to the shareholders the payment of a dividend of €
0.18
per common share, totaling approximately €
243 million
(equivalent to approximately $267 million, translated at the exchange rate reported by the European Central Bank on February 28, 2020). The proposal is subject to the approval of the Company’s shareholders at the Annual General Meeting scheduled to be held on April 16, 2020.
|
Item 9.
|
The Offer and Listing
|
A.
Offer and Listing Details
See "C. Markets" below.
B.
Plan of Distribution
Not applicable.
C.
Markets
Our outstanding common shares are listed on the NYSE under the symbol “CNHI” and the MTA under the symbol “CNHI.MI”.
D.
Selling Shareholders
Not applicable.
E.
Dilution
Not applicable.
F.
Expenses of the Issue
Not applicable.
95
|
Item 10.
|
Additional Information
|
A. Share Capital.
Not applicable.
B. Memorandum and Articles of Association.
Set forth below is a summary description of certain provisions of our Articles of Association, effective September 29, 2013 (the “Articles of Association”), and particular provisions of the laws of the Netherlands relevant to our statutory existence. This summary does not restate our Articles of Association or relevant laws of the Netherlands in their entirety.
Corporate Registration and Objectives
CNH Industrial N.V. (the “Company” or “CNH Industrial”) is incorporated under the laws of the Netherlands, and our principal office is located at 25 St. James’s Street, London SW1A 1HA, United Kingdom. We are registered at the U.K. Companies House under foreign company number FC031116 BR016181 and the Commercial Register kept at the Chamber of Commerce in Amsterdam, the Netherlands under file number 56532474.
As provided in Article 2 of our Articles of Association, our objectives are to carry on, either directly or through wholly or partially-owned companies and entities, activities relating to passenger and commercial vehicles, transport, mechanical engineering, agricultural and construction equipment, energy and propulsion, as well as any other manufacturing, commercial, financial, sales, distribution, engineering or service activity.
Within the scope and for the achievement of the above objectives, the Company may:
|
•
|
operate in, among other areas, the mechanical, electrical, electromechanical, thermo mechanical, electronic, nuclear, chemical, mining, steel and metallurgical industries, as well as in telecommunications, civil, industrial and agricultural engineering, publishing, information services, tourism and other service industries;
|
|
•
|
engage in, and/or participate in and operate, manage and control one or more companies engaged in the design, engineering, manufacture, marketing, sales, distribution, maintenance, repair, remanufacturing and/or resale of agricultural, construction, transport and similar equipment, tractors, commercial vehicles, buses, specialized vehicles for firefighting, defense and other uses, other capital goods, engines and transmissions for any of the foregoing equipment and/or vehicles and/or for marine and power generation applications, and/or replacement parts for any of the foregoing;
|
|
•
|
provide, and/or participate in and operate, manage and control one or more companies providing financing to dealers, end customers and others for the acquisition and/or lease of products and/or services described above, through the making of loans and leases and/or otherwise, and to borrow money for that purpose;
|
|
•
|
acquire shareholdings and interests, engage in or participate in companies and enterprises of any kind or form and purchase, sell or place shares and debentures;
|
|
•
|
provide financing to, and guarantee the obligations of, companies and entities it wholly or partially owns, and borrow money for that purpose, and carry on the technical, commercial, financial and administrative coordination of their activities;
|
|
•
|
purchase or otherwise acquire, on its own behalf or on behalf of companies and entities it wholly or partially owns, the ownership or right of use of intangible assets providing them for use by those companies and entities;
|
|
•
|
promote and ensure the performance of research and development activities, as well as the use and exploitation of the results thereof;
|
|
•
|
undertake, on its own behalf or on behalf of companies and entities it wholly or partially owns, any investment, real estate, financial, commercial, or partnership transaction whatsoever, including the assumption of loans and financing in general and the granting to third parties of endorsements, suretyships, warranting performance and other guarantees, including real security; and
|
|
•
|
render management and advisory services as well as anything which a company may lawfully do under the laws of the Netherlands which may be deemed conducive to the attainment of the objects set out in the above paragraphs.
|
Directors
We have included a summary description of the material provisions of our Articles of Association relating to our directors. The summary does not restate the Articles of Association in their entirety.
Our Articles of Association provide that the Company shall have a Board of Directors, consisting of three (3) or more members, comprising both members having responsibility for the day-to-day management of the Company (“executive directors”) and members not having
96
such day-to-day responsibility (“non-executive directors”). The Board of Directors as a whole will be responsible for the strategy of the Company. The majority of the members of the Board of Directors shall consist of non-executive directors. The Board of Directors shall determine the number of directors.
The general meeting of shareholders shall appoint the directors and directors are appointed by an absolute majority of votes validly cast at a general meeting. The general meeting of shareholders shall determine whether a director is an executive director or a non-executive director. The term of office of all directors will be for a period of approximately one (1) year after appointment, such period expiring on the day the AGM is held in the following calendar year. Each director may be reappointed at any subsequent general meeting of shareholders.
CNH Industrial has a Remuneration Policy in respect of the remuneration of the members of the Board of Directors. With due observation of the Company’s Remuneration Policy, the Board of Directors may determine the remuneration for the directors in respect of the performance of their duties.
Except as otherwise required by applicable law or the Articles of Association, the presence either in person or by proxy of a majority of the total number of directors then in office shall be required and constitute a quorum for the transaction of business, including the adoption of resolutions. If at any meeting of the Board of Directors a quorum is not present, a majority of the directors present may adjourn the meeting from time to time, without notice other than adjournment at the meeting, until a quorum shall be present. The vote of the majority of the directors present at any meeting at which a quorum is present shall be the act of the Board of Directors.
The Board of Directors shall submit to the general meeting of shareholders for its approval plans to award shares or the right to subscribe for shares.
The Company shall not grant its directors any personal loans, guarantees or the like unless in the normal course of business, with respect to executive directors on terms applicable to Company personnel as a whole, and after approval of the Board of Directors.
Members of the Board of Directors are not subject to an age limitation arising from the Articles of Association. In addition, there is no minimum or maximum number of shares to be owned in order to qualify as a director of the Company. However, the Company has adopted share ownership guidelines applicable to the directors.
Under the laws of the Netherlands, the Board of Directors must consider, in the performance of its duties, our interests, the interests of our shareholders and our employees, in all cases with reasonableness and fairness. A member of the Board of Directors shall not participate in discussions and decision making with respect to a matter in relation to which he or she has a direct or indirect personal interest which is in conflict with the interests of the Company and the business associated with the Company (“Conflict of Interest”). In addition, the Board of Directors as a whole may, on an ad hoc basis, resolve that there is such a strong appearance of a Conflict of Interest of an individual member of the Board of Directors in relation to a specific matter, that it is deemed in the best interest of a proper decision making process that such individual member of the Board of Directors be excused from participation in the decision making process with respect to such matter even though such member of the Board of Directors may not have an actual Conflict of Interest.
Our Board of Directors must approve CNH Industrial N.V.’s annual accounts and make them available to the shareholders for inspection at our offices within four months after the end of our fiscal year. During this period, including any extension, the Board of Directors must submit the annual accounts to the shareholders for adoption by the general meeting. When our shareholders adopt the annual accounts approved by the Board of Directors, they may discharge the members of the Board of Directors from potential liability with respect to the exercise of their duties during the fiscal year covered by the accounts. This discharge may be given subject to such reservations as the shareholders deem appropriate and is subject to a reservation of liability required under the laws of the Netherlands. Examples of reservations of liability required by the laws of the Netherlands include (1) liability of members of management boards and supervisory boards upon the bankruptcy of a company and (2) general principles of reasonableness and fairness. Under the laws of the Netherlands, a discharge of liability does not extend to matters not shown in the annual accounts or otherwise not properly disclosed to the shareholders. The annual accounts are made available through our website to our shareholders for review on the day that the notice convening the AGM is posted to our website.
The Board of Directors has established a procedure to ensure that the Company’s employees (and third parties) have the possibility to report alleged irregularities of a general, operational and financial nature with the Company. The Company’s Compliance Helpline is managed by an independent third party. Reports may be submitted through a dedicated web portal (
www.cnhindustrialcompliancehelpline.com
), by phone (to a call center managed by a third party), or to a Company representative. Where legally permissible, reports may be submitted on an anonymous basis. In addition, where legally required, the nature of the reports may be limited to certain subject matters. The Company investigates reports submitted and, in appropriate cases, implements corrective and/or disciplinary actions.
Our Shares and Shareholders
Our authorized share capital is
€40,000,000
consisting of two billion (
2,000,000,000
) common shares and two billion (
2,000,000,000
) special voting shares to be held with associated common shares, each having a par value of one euro cent (€
0.01
). Our common shares are registered shares represented by an entry in the share register of CNH Industrial. Beneficial interests in our common shares traded on the NYSE are held through the book-entry system provided by DTC and are registered in the register of shareholders
97
in the name of Cede & Co., as DTC’s nominee. Beneficial interests in the common shares traded on the MTA are held through Monte Titoli S.p.A., the Italian central clearing and settlement system, as a participant in DTC.
Loyalty Voting Program. In connection with the Merger, CNH Industrial implemented a loyalty voting program, pursuant to which the former shareholders of each of Fiat Industrial S.p.A. and CNH Global N.V. were able to elect to receive one CNH Industrial special voting share to be held only with each CNH Industrial common share they were entitled to receive in the Merger, provided that they fulfilled the requirements described in the terms and conditions of the loyalty voting program. The CNH Industrial common shares held by shareholders that elected to participate in the loyalty voting program had their common shares registered in the Company’s Loyalty Register. Following this registration, a corresponding number of special voting shares were allocated to such shareholders, and the additional voting rights could be exercised at the first CNH Industrial shareholders’ meeting that followed the registration. By signing an election form, whose execution was necessary to elect to participate in the loyalty voting program, shareholders also agreed to be bound by the terms and conditions thereof, including the transfer restrictions described below. The terms and conditions applicable to special voting shares are available on our web site (www.cnhindustrial.com).
Following the completion of the Merger, CNH Industrial shareholders may at any time elect to participate in the loyalty voting program by requesting that CNH Industrial register all or some of their CNH Industrial common shares in the Loyalty Register. If these CNH Industrial common shares have been registered in the Loyalty Register (and thus blocked from trading in the regular trading system) for an uninterrupted period of three years in the name of the same shareholder, such shares become eligible to receive special voting shares to be held with associated common shares (the “Qualifying Common Shares”) and the relevant shareholder will be entitled to hold one special voting share for each such Qualifying Common Share the shareholder continues to hold. If at any time such CNH Industrial common shares are de-registered from the Loyalty Register for whatever reason, the relevant shareholder shall lose his, her or its entitlement to hold a corresponding number of special voting shares.
A holder of Qualifying Common Shares may at any time request the de-registration of some or all such shares from the Loyalty Register, which will allow such shareholder to freely trade its CNH Industrial common shares. From the moment of such request, the holder of Qualifying Common Shares shall be considered to have waived his/her/its rights to cast any votes associated with the loyalty voting shares corresponding to its previously Qualifying Common Shares. Upon the de-registration from the Loyalty Register, the relevant common shares will therefore cease to be Qualifying Common Shares. Any de-registration request would automatically trigger a mandatory transfer requirement pursuant to which the special voting shares will be surrendered to CNH Industrial for no consideration.
CNH Industrial’s common shares are freely transferable. Special voting shares are not admitted to listing and are transferable only in very limited circumstances and only along with the common shares to which they are associated. Any transfer of common shares that are registered on the Loyalty Register will trigger the de-registration of such common shares from that register and any associated special voting shares will automatically be surrendered to CNH Industrial for no consideration.
The purpose of the loyalty voting program is to grant long-term CNH Industrial shareholders an extra voting right (as qualifying shareholders are entitled to exercise an additional vote through the common share and the associated special voting share held). However, under Dutch law, the special voting shares cannot be excluded from economic entitlements. As a result, in accordance with our Articles of Association, holders of special voting shares are entitled to a minimum dividend, which is allocated to a separate special dividend reserve (the “Special Dividend Reserve”). The distribution of dividends from the Special Dividend Reserve can only be approved by the general meeting of the holders of special voting shares upon proposal of the Board of Directors. The power to vote upon the distribution from the Special Dividend Reserve is the only power that is granted to that meeting, which can only be convened by the Board of Directors as it deems necessary. No distribution has been made from this reserve. The special voting shares do not have any other economic entitlement.
Section 10 of the special voting share terms and conditions includes liquidated damages provisions intended to discourage any attempt by participants in the loyalty voting program to violate the terms thereof. These liquidated damages provisions may be enforced by CNH Industrial by means of a legal action brought by the Company in the courts of the Netherlands. In particular, a violation of the provisions of the above-mentioned terms and conditions concerning the transfer of special voting shares may lead to the imposition of liquidated damages.
Pursuant to Section 12 of the special voting share terms and conditions, any amendment to the terms and conditions (other than merely technical, non-material amendments) may only be made with the approval of the general meeting of shareholders of CNH Industrial.
A shareholder must promptly notify CNH Industrial upon the occurrence of a change of control, which is defined in Article 4(1)(n) of the Articles of Association as including any direct or indirect transfer, carried out through one or a series of related transactions, by a CNH Industrial shareholder that is not an individual of (i) the ownership or control of 50% or more of the voting rights of such shareholder, (ii) the
de facto
ability to direct the casting of 50% or more of the votes which may be expressed at the general meetings of such shareholder, or (iii) the ability to appoint or remove half or more of the directors, executive directors or board members or executive officers of such shareholder or to direct the casting of 50% or more of the voting rights at meetings of the board, governing body or executive committee of such shareholder. In accordance with Article 4(1)(n) of the Articles of Association, no change of control shall be deemed to have occurred if (i) the transfer of ownership and/or control is the result of the succession or the liquidation of assets between spouses or the inheritance,
inter vivos
donation or other transfer to a spouse or a relative up to and including the fourth degree or (ii) the fair market value of the Qualifying Common Shares held by the relevant CNH Industrial shareholder represents less than 20% of the total assets of
98
the Transferred Group at the time of the transfer and the Qualifying Common Shares, in the sole judgment of CNH Industrial, are not otherwise material to the Transferred Group or the change of control transaction. Article 4(1)(n) of the Articles of Association defines “Transferred Group” as comprising the relevant shareholder together with its affiliates, if any, over which control was transferred as part of the same change of control transaction, as such term in defined in Article 4(1)(n) of the Articles of Association. A change of control will trigger the de-registration of the applicable Qualifying Common Shares from the Loyalty Register and the suspension of the special voting rights attached to such Qualifying Common Shares.
Issuance of Shares and Rights of Preference
Issuance of Shares
Our Board of Directors has the authority to issue common shares if, and to the extent that, a general meeting of shareholders has designated the Board of Directors to act as the authorized body for this purpose. A designation of authority to the Board of Directors to issue shares remains effective for the period specified by the general meeting and may be up to five years from the date of designation. A general meeting of shareholders may renew this designation for additional periods of up to five years. Without this designation, only the general meeting of shareholders has the power to authorize the issuance of shares.
For a period of five years from September 28, 2018, the Board of Directors has been irrevocably authorized by the shareholders to issue special voting shares up to the maximum aggregate amount of special voting shares as provided for in the Company’s authorized share capital as set forth in the Articles of Association. For a period of five years from April 13, 2018, the Board of Director has been irrevocably authorized by the shareholders to issue common shares of the Company, which authorization is limited to 15% of the total number of common shares as of April 14, 2018. In addition, and without application of the 15% limitation, the Board of Directors is authorized to issue common shares and grant rights to subscribe for common shares in the capital of the Company pursuant to equity incentive plans sponsored by the Company’s predecessors (Fiat Industrial S.p.A. and CNH Global N.V.) and new equity incentive or compensation plans.
Rights of Pre-emption
Under Dutch law and our Articles of Association, each shareholder has a right of pre-emption in proportion to the aggregate nominal value of its shareholding upon issuance of new Company common shares (or granting of rights to subscribe for shares) unless a general meeting of shareholders, or its designee, limits or eliminates this right. Our shareholders have no pre-emption right with respect to (i) shares issued for consideration other than cash, (ii) shares issued to our employees and (iii) to persons exercising a previously granted right to subscribe for Company common shares.
If a general meeting of shareholders delegates its authority to the Board of Directors for this purpose, then the Board of Directors will have the power to limit or exclude the pre-emption rights of shareholders. In the absence of this delegation, the general meeting of shareholders will have the power to limit or exclude these rights. Such a proposal requires the approval of at least two-thirds of the votes cast by shareholders at a general meeting if less than one-half of the issued share capital is represented at the meeting. Designations of authority to the Board of Directors may remain in effect for up to five years and may be renewed for additional periods of up to five years. For a period of five years from April 13, 2018, the Board of Directors has been designated by the shareholders as the authorized body to limit or exclude the rights of pre-emption of shareholders in connection with the authority of the Board of Directors to issue common shares and grant rights to subscribe for common shares. In the event of an issuance of special voting shares, shareholders shall not have any right of pre-emption.
Liability to Further Capital Calls
All of the outstanding Company common shares are fully paid and non-assessable.
Discriminating Provisions
There are no provisions in the Articles of Association that discriminate against a shareholder because of its ownership of a substantial number of shares.
Payment of Dividends
CNH Industrial may make distributions to the shareholders and other persons entitled to the distributable profits only to the extent that its shareholders’ equity exceeds the sum of the paid-up portion of the share capital and the reserves that must be maintained in accordance with Dutch law. No distribution of profits may be made to the Company itself for shares that the Company holds in its own share capital.
The Company may only make a distribution of dividends to the shareholders after the adoption of its statutory annual accounts demonstrating that such distribution is legally permitted. The Board of Directors may determine that dividends or interim dividends shall be paid, in whole or in part, from the Company’s share premium reserve or from any other reserve, provided that payments from reserves
99
may only be made to the shareholders that are entitled to the relevant reserve upon the dissolution of the Company and provided further that the policy of the Company on additions to reserves and dividends is duly observed.
The Company maintains a Special Dividend Reserve for the special voting shares for the purpose of the allocation of the mandatory minimal profits that accrue to the special voting shares. The special voting shares do not carry any entitlement to any other reserve. Any distribution out of the Special Dividend Reserve or the partial or full release of such reserve requires a prior proposal from the Board of Directors and a subsequent resolution of the general meeting of holders of special voting shares.
Insofar as the profits have not been distributed or allocated to the reserves, they may be subject to approval at the general meeting to be distributed as dividends on the Company common shares only. The general meeting of shareholders may resolve, on the proposal of the Board of Directors, to declare and distribute dividends in U.S. dollars. The Board of Directors may decide, subject to the approval of the general meeting of shareholders and the Board of Directors having been designated as the body competent to pass a resolution for the issuance of shares, that a distribution shall, wholly or partially, be made in the form of shares.
The right to dividends and distributions will lapse if the dividends or distributions are not claimed within five years following the day after the date on which they were first made available.
On March 3, 2020, the Board of Directors recommended and proposed to the Company’s shareholders that a dividend, in the amount of €
0.18
per share, be paid to the holders of our common shares.
Other than as described above, our Articles of Association do not include any redemption provisions or provide for any sinking or similar fund.
General Meetings of Shareholders and Voting Rights
Annual General Meeting of Shareholders ("AGM")
An AGM must be held within six months from the end of CNH Industrial’s preceding financial year. The purpose of the AGM is to discuss, among other things, the annual report, the adoption of the annual accounts, allocation of profits (including the proposal to distribute dividends), release of members of the Board of Directors from liability for their management and supervision, appointment of directors and other proposals brought up for discussion or vote by the Board of Directors.
General Meeting of Shareholders and Place of Meetings
Other general meetings will be held if requested by the Board of Directors, the chairperson or co-chairperson of the Board of Directors, the Senior Non-Executive Board Member or the Chief Executive Officer, or by the written request (stating the exact subjects to be discussed) of one or more shareholders representing in aggregate at least 10% of the issued share capital of the Company (taking into account the relevant provisions of Dutch law, and the Articles of Association and the applicable stock exchange regulations). General meetings will be held in Amsterdam or Haarlemmermeer (Schiphol Airport), the Netherlands.
Convocation Notice and Agenda
General meetings of shareholders can be convened by a notice, specifying the subjects to be discussed, the place and the time of the meeting and admission and participation procedure, issued at least 42 days before the meeting. All convocations, announcements, notifications and communications to shareholders must be made on the company’s corporate website in accordance with the relevant provisions of Dutch law. The agenda for a general meeting may contain the items requested by such number of shareholders who, by law, are entitled to make such proposals. Requests must be made in writing, including the reasons for adding the relevant item on the agenda, and received by the Board of Directors at least 60 days before the day of the meeting.
Admission and Registration
Each shareholder entitled to vote shall be authorized to attend the general meeting of shareholders, to address the general meeting and to exercise its voting rights. The Board of Directors shall set a record date, which shall be the 28th day prior to the date of the general meeting, so as to establish which shareholders are entitled to attend and vote at the general meeting. Only holders of shares at such record date are entitled to attend and vote at the general meeting. The convocation notice for the meeting shall state the record date and the manner in which the persons entitled to attend the general meeting may register and exercise their rights.
Those entitled to attend a general meeting may be represented at a general meeting by a proxy authorized in writing. The requirement that a proxy must be in written form is also fulfilled when it is recorded electronically.
Members of the Board of Directors have the right to attend a general meeting. In these general meetings, each member of the Board of Directors has an advisory role.
100
Voting Rights
Each common share and each associated special voting share of the Company confers the right on the holder to cast one vote at a general meeting. Resolutions are passed by a simple majority of the votes cast, unless Dutch law or the Articles of Association prescribes a larger majority. Under Dutch law and/or the Articles of Association, the following matters require at least two-thirds of the votes cast at a meeting if less than one-half of the issued share capital is present or represented:
|
•
|
a resolution to reduce the issued share capital;
|
|
•
|
a resolution to amend the Articles of Association;
|
|
•
|
a resolution to limit or exclude rights of pre-emption;
|
|
•
|
a resolution to authorize the Board of Directors to limit or exclude rights of pre-emption;
|
|
•
|
a resolution to enter into a legal merger or a legal demerger; or
|
|
•
|
a resolution to dissolve the Company.
|
Shareholders’ Votes on Certain Transactions
Any important change in the identity or character of the Company must be approved by shareholders, including (i) the transfer to a third party of the business of the Company or practically the entire business of the Company; (ii) the entry into or breaking off of any long-term cooperation of the Company or a subsidiary with another legal entity or company or as a fully liable partner of a general partnership or limited partnership, where such entry into or breaking off is of far-reaching importance to the Company; and (iii) the acquisition or disposal by the Company or a subsidiary of an interest in the capital of a company with a value of at least one-third of the Company’s assets according to the consolidated balance sheet with explanatory notes included in the last adopted annual accounts of the Company.
We are exempt from the proxy rules under the U.S. Securities Exchange Act of 1934, as amended.
Dissolution
If the Company were to be dissolved and liquidated, after all the debts of the Company have been paid, any remaining balances would be distributed in the following order of priority: (i) first, to satisfy the aggregate balance of share premium reserves and other reserves than the Special Dividend Reserve to the holders of CNH Industrial common shares in proportion to the number of common shares held by each of them; (ii) second, an amount equal to the aggregate amount of the nominal value of the CNH Industrial common shares to the holders thereof in proportion to the number of common shares held by each of them; (iii) third, an amount equal to the aggregate amount of the Special Dividend Reserve to the holders of special voting shares in proportion to the number of special voting shares held by each of them; and (iv) fourth, the aggregate amount of the nominal value of the special voting shares to the holders thereof in proportion to the number of special voting shares held by each of them. No liquidation payments will be made on shares that we hold in treasury.
Repurchase of Shares
We may acquire our shares, subject to applicable provisions of the laws of the Netherlands and of our Articles of Association, to the extent:
|
•
|
the general meeting of shareholders has authorized the Board of Directors to make such acquisition—which authorization shall be valid for a period of not more than eighteen months—and has specified the number of shares which may be acquired, the manner in which they may be acquired and the limits within which the price must be set;
|
|
•
|
our equity, less the amount to be paid for the shares to be acquired, exceeds the sum of (1) our share capital account, plus (2) any reserves required to be maintained by the laws of the Netherlands; and
|
|
•
|
after the acquisition of shares, we and our subsidiaries would not hold, or hold as pledges, shares having an aggregate par value that exceeds 50% of our issued share capital account, as these amounts would be calculated under generally accepted accounting principles in the Netherlands.
|
At the AGM held on April 14, 2017, shareholders granted the Board of Directors the authority to acquire common shares in its own capital through stock exchange trading or otherwise. The Board’s authority to acquire common shares is limited to a maximum of up to 10% of the issued common shares on April 14, 2017 and subject to a maximum price per common share equal to the average of the highest price on each of the five trading days prior to the date of acquisition, as shown in the Official Price List of the MTA and NYSE (as the case may be) plus 10% (maximum price) and to a minimum price per common share equal to the average of the lowest price on each of the five trading days prior to the date of acquisition, as shown in the Official Price List of the MTA or NYSE (as the case may be) minus 10% (minimum price).
101
On April 27, 2018, the Company announced its new buy-back program (the "$700 Million Program”) to repurchase up to
$700 million
in common shares, representing an increase of
$400 million
compared to the prior share buy-back program (the "$300 Million Program"). The $700 Million Program implements the resolution adopted by the Company’s shareholders at the AGM on April 13, 2018. The authorization granted was for a period of 18 months from the date of the AGM and, therefore, expired on October 12, 2019.
On May 24, 2019, the Company announced its intention to restart its buy-back program. The buy-back program involves repurchase of up to $700 million in common shares.
At the 2020 Annual General Meeting of Shareholders, the Board of Directors intends to recommend to the Company’s shareholders the renewal of the authorization to repurchase up to a maximum of 10% of the Company’s issued common shares.
The authorization is an instrument available to the Board of Directors but places no obligation on the Company to repurchase its own shares. Refer to “Item 16E: Purchase of Equity Securities by the Issuer and Affiliated Purchasers” for additional details of stock repurchases by the Company.
Up-to-date details of the transactions that occurred under the $300 Million Program and the $700 Million Program are available in the dedicated section on the corporate website (
www.cnhindustrial.com
).
Notification of Substantial Holdings
Dutch law requires that any person who, directly or indirectly, acquires or disposes of a capital interest and/or voting rights in CNH Industrial must immediately give written notice to the Netherlands Authority for the Financial Markets (Autoriteit Financiële Markten, the “AFM”) of such acquisition or disposal by means of a standard form if, as a result of such acquisition or disposal, the percentage of capital interest and/or voting rights held by such person reaches, exceeds or falls below the following thresholds: 3%, 5%, 10%, 15%, 20%, 25%, 30%, 40%, 50%, 60%, 75% and 95%. Notification by such person must be completed (1) without delay and ultimately two trading days after the acquisition or disposal in circumstances where a person has either acquired or disposed of shares thereby affecting its percentage of ownership and/or voting rights or (2) ultimately on the fourth trading day after the AFM has published the Company’s notification (as described below) of changes to its total share capital or voting rights in circumstances where the percentage reached, exceeded or fell below the threshold in a passive manner.
For the purpose of calculating the percentage of capital interest or voting rights, the following interests must be taken into account: (i) shares and/or voting rights directly held (or acquired or disposed of) by any person, (ii) shares and/or voting rights held (or acquired or disposed of) by such person’s controlled undertakings or by a third party for such person’s account, (iii) voting rights held (or acquired or disposed of) by a third party with whom such person has concluded an oral or written voting agreement, (iv) voting rights acquired pursuant to an agreement providing for a temporary transfer of voting rights in consideration for a payment, (v) shares which such person, or any controlled undertaking or third party referred to above, may acquire pursuant to any option or other right to acquire shares and (vi) the voting rights it may exercise as a usufructuary or pledge.
Special voting shares shall be added to the Company common shares for the purposes of the above thresholds.
Controlled undertakings (within the meaning of the Dutch Financial Supervision Act) do not themselves have notification obligations under the Dutch Financial Supervision Act as their direct and indirect interests are attributed to their (ultimate) parent. If a person who has a 3% or larger interest in the Company’s share capital or voting rights ceases to be a controlled undertaking it must immediately notify the AFM and all notification obligations under the Dutch Financial Supervision Act will become applicable to such former controlled undertaking.
Special rules apply to the attribution of shares and/or voting rights that are part of the property of a partnership or other form of joint ownership. A holder of a pledge or right of usufruct in respect of shares can also be subject to notification obligations, if such person has, or can acquire, the right to vote on the shares. The acquisition of (conditional) voting rights by a pledgee or beneficial owner may also trigger notification obligations as if the pledgee or beneficial owner were the legal holder of the shares and/or voting rights.
Furthermore, when calculating the percentage of capital interest, a person is also considered to be in possession of shares if (i) such person holds a financial instrument the value of which is (in part) determined by the value of the shares or any distributions associated therewith and which does not entitle such person to acquire any shares, (ii) such person may be obliged to purchase shares on the basis of an option, or (iii) such person has concluded another contract whereby such person acquires an economic interest comparable to that of holding a share.
The Company is required to notify the AFM promptly of any change of 1% or more in its issued and outstanding share capital or voting rights since a previous notification. Other changes in the Company’s issued and outstanding share capital or voting rights must be notified to the AFM within eight days after the end of the quarter in which the change occurred.
Each member of the Board of Directors must notify the AFM of each change in the number of shares he/she holds and of each change in the number of votes he/she is entitled to cast in respect of the Company’s issued and outstanding share capital, immediately after the relevant change.
The AFM keeps a public register of all notifications made pursuant to these disclosure obligations and publishes any notification received.
102
Non-compliance with these disclosure obligations is an economic offense and may lead to criminal prosecution. The AFM may impose administrative penalties for non-compliance, and the publication thereof. In addition, a civil court can impose measures against any person who fails to notify or incorrectly notifies the AFM of matters required to be notified. A claim requiring that such measures be imposed may be instituted by (i) the Company, (ii) one or more shareholders who alone or together with others represent at least 3% of the issued and outstanding share capital of the Company or are able to exercise at least 3% of the voting rights and (iii) holders of one or more shares with a special controlling right in the issuer under the Articles of Association. The measures that the civil court may impose include:
|
•
|
an order requiring appropriate disclosure;
|
|
•
|
suspension of the right to exercise the voting rights for a period of up to three years as determined by the court;
|
|
•
|
voiding a resolution adopted by the general meeting, if the court determines that the resolution would not have been adopted but for the exercise of the voting rights of the person with a duty to disclose, or suspension of a resolution adopted by the general meeting of shareholders until the court makes a decision about such voiding; and
|
|
•
|
an order to refrain, during a period of up to five years as determined by the court, from acquiring shares and/or voting rights in the Company.
|
Shareholders are advised to consult with their own legal advisers to determine whether the disclosure obligations apply to them.
Shareholder Disclosure and Reporting Obligations under U.S. Law
Holders of CNH Industrial shares are subject to certain U.S. reporting requirements under the Exchange Act, for shareholders owning more than 5 percent of any class of equity securities registered pursuant to Section 12 of the Exchange Act. Among the reporting requirements are disclosure obligations intended to keep investors aware of significant accumulations of shares that may lead to a change of control of an issuer.
If CNH Industrial were to fail to qualify as a foreign private issuer in the future, Section 16(a) of the Exchange Act would require CNH Industrial’s directors and executive officers, and persons who own more than ten percent of a registered class of CNH Industrial’s equity securities, to file reports of ownership of, and transactions in, CNH Industrial’s equity securities with the SEC. Such directors, executive officers and ten percent stockholders would also be required to furnish CNH Industrial with copies of all Section 16 reports they file.
Market Abuse Regulation (MAR)
On July 3, 2016, the Market Abuse Regulation (Regulation (EU) No. 596/2014, “MAR”) entered into force in the EU replacing the existing current rules in the different European countries originated by the implementation of an EU directive issued in 2003. The legal instrument chosen by the EU institutions to amend the current regime is a ‘regulation’, i.e. an instrument that, since the date of coming into effect, is immediately binding in all the EU States without necessity of further implementation.
The main aim of MAR is to expand and develop the existing EU legal framework regime of financial markets, ensuring a more uniform interpretation of the regime that, according to the Commission, should result in a reduction of compliance costs and greater legal certainty.
The focus of MAR is the prevention of any form of insider dealing (including attempted insider dealing and recommending or inducing another to engage in insider dealing), market manipulation (including attempted market manipulation), and unlawful disclosure of inside information (“Inside Information”).
In the field of prevention of insider dealing, MAR reiterates the notification regime in place for managers’ transactions involving issuer’s securities. Under MAR,
person discharging managerial responsibilities
(“PDMR”) and persons closely associated with them must notify the issuers and the national competent authority of every transaction conducted on their own account relating to the shares or debt instruments of that issuer, or to derivatives or other financial instruments linked to those shares or debt instruments.
Disclosure of Inside Information
Inside Information, as defined under MAR, is crucial for CNH Industrial since EU rules set forth a clear obligation upon the issuers to publicly disclose such Inside Information without delay. The above disclosure requirement shall be complied with through the publication of a press release in accordance with the modalities set forth under MAR disclosing to the public the relevant Inside Information. Delay in disclosure of Inside Information to the public is allowed on issuer’s own responsibility provided that all of the following conditions are met: (i) immediate disclosure is likely to prejudice the legitimate interests of the issuer or emission allowance market participant, (ii) delay of disclosure is not likely to mislead the public, and (iii) the issuer or emission allowance market participant is able to ensure the confidentiality of that information.
103
Insiders Lists
Pursuant to Article 18 of MAR, CNH Industrial as well as persons acting on its behalf or for its account, shall draw up in accordance with a precise electronic format and keep regularly updated, a list of persons who, in the exercise of their employment, profession or duties, have access to Inside Information. CNH Industrial shall transmit the Insider list to the relevant competent authority, upon its request.
Public Tender Offers
Any offer launched for CNH Industrial’s common shares (and /or for financial instruments linked to such common shares) with respect to both voluntary and mandatory public tender offers shall be managed in compliance with applicable laws and regulations, relevant provisions and with any requirement imposed by/or subject to national relevant authority’s supervision, in particular, among other things, the provisions concerning the tender offer price, the content of the offer document and the disclosure of the tender offer.
Reduction of Issued Share Capital
At a general meeting of shareholders, our shareholders may vote to reduce the issued share capital by canceling shares held by the Company or by reducing the nominal amount of our shares by means of an amendment to the Company’s Articles of Association. In either case, this reduction would be subject to applicable statutory provisions. A resolution to reduce the capital shall require a simple majority of the votes cast in a general meeting of shareholders for approval; provided, however, that such a resolution shall require a majority of at least two-thirds of the votes cast in a general meeting of shareholders if less than one half of the issued capital is represented at the meeting in person or by proxy.
At the AGM on April 15, 2016, shareholders authorized the Board to reduce the issued share capital of the Company, in accordance with article 8 of the Articles of Association and in compliance with applicable rules and regulations, by canceling up to 80 million special voting shares held by the Company in treasury. On September 15, 2017, the Company implemented the resolution adopted by the Company’s shareholders at the AGM held on April 15, 2016 and canceled 78,000,000 special voting shares held by the Company in treasury.
Amendments to the Company’s Articles of Association, including Variation of Rights
A majority of the votes cast by holders of our shares at a general meeting must approve any resolution proposed by our Board of Directors to amend the Articles of Association or to dissolve CNH Industrial. A majority of at least two-thirds of the votes cast shall be required if less than one-half of the issued capital is represented at the meeting. Any such resolution proposed by one or more shareholders must likewise be approved by a majority of the votes cast at a general meeting of shareholders.
The rights of shareholders may be changed only by amending the Articles of Association in compliance with Dutch law.
C.
Material Contracts
.
For a discussion of our related party transactions, please see “Item 7. Major Shareholders and Related Party Transactions—B. Related Party Transactions.”
For a discussion of the Company’s equity plans, please see “Note 17: Share-Based Compensation” to our consolidated financial statements for the year ended
December 31, 2019
.
D.
Exchange Controls.
There are no governmental laws, decrees, regulations or other legislation in the Netherlands that may affect the import or export of capital, including the availability of cash and cash equivalents for use by us, or that may affect the remittance of dividends, interest, or other payments by us to non-resident holders of our common shares. There are no special restrictions in our Articles of Association or Dutch law that limit the right of shareholders who are not citizens or residents of the Netherlands to hold or vote our common shares.
E.
Taxation.
Nothing within this section (Item 10.E.
Taxation
) of this document should be considered or relied upon as tax advice. Rather,
all prospective purchasers and holders of CNH Industrial stock, regardless of their country of residency, should consult their own tax advisors regarding the U.S. federal, state, local and foreign tax consequences of owning and disposing of CNH Industrial stock based upon their particular circumstances.
104
United States Federal Income Taxation
This section summarizes the material U.S. federal income tax consequences of the ownership and disposition of CNH Industrial stock by a U.S. Shareholder (as defined below). It applies solely to persons that hold shares as capital assets for U.S. federal income tax purposes. This section does not apply to members of a special class of holders subject to special rules, including:
|
•
|
a dealer in securities or foreign currencies;
|
|
•
|
regulated investment companies;
|
|
•
|
a trader in securities that elects to use a mark-to-market method of accounting for securities holdings;
|
|
•
|
a tax-exempt organization;
|
|
•
|
a bank, financial institution, or insurance company;
|
|
•
|
a person liable for alternative minimum tax;
|
|
•
|
a person that actually or constructively owns 10% or more, by vote or value, of CNH Industrial;
|
|
•
|
a person that holds shares as part of a straddle or a hedging, conversion, or other risk reduction transaction for U.S. federal income tax purposes;
|
|
•
|
a person that acquired shares pursuant to the exercise of employee stock options or otherwise as compensation; or
|
|
•
|
a person whose functional currency is not the U.S. dollar.
|
This section is based on the Internal Revenue Code of 1986, as amended (the “Code”), its legislative history, existing and proposed regulations, published rulings and court decisions, as well as on applicable tax treaties. These authorities are subject to change, possibly on a retroactive basis.
If a partnership holds shares, the U.S. federal income tax treatment of a partner will depend on the status of the partner and the tax treatment of the partnership.
For the purposes of this section, a “U.S. Shareholder” is a beneficial owner of shares that is:
|
•
|
an individual that is a citizen or resident of the U.S.;
|
|
•
|
a corporation, or other entity taxable as a corporation, created or organized under the laws of the U.S.;
|
|
•
|
an estate whose income is subject to U.S. federal income tax regardless of its source; or
|
|
•
|
a trust if a U.S. court can exercise primary supervision over the trust’s administration and one or more U.S. persons are authorized to control all substantial decisions of the trust.
|
CNH Industrial Common Stock
Taxation of Dividends
Under the U.S. federal income tax laws, subject to the discussion of “passive foreign investment company” (“PFIC”) taxation below, a U.S. Shareholder must include in its gross income the gross amount of any dividend paid by CNH Industrial out of its current or accumulated earnings and profits (as determined for U.S. federal income tax purposes). Dividends will be taxed as ordinary income to the extent that they are paid out of CNH Industrial’s current or accumulated earnings and profits. Dividends paid to a noncorporate U.S. Shareholder by certain “qualified foreign corporations” that constitute qualified dividend income will be taxable to the shareholder at the preferential rates applicable to long-term capital gains provided that the shareholder holds the shares for more than 60 days during the 121-day period beginning 60 days before the ex-dividend date and meets other holding period requirements. Subject to the discussion regarding PFIC taxation below, CNH Industrial believes that dividends CNH Industrial pays with respect to the shares will be qualified dividend income, assuming the holding period requirements are met.
A U.S. Shareholder must include any foreign tax withheld from the dividend payment in this gross amount even though the shareholder does not in fact receive it. The dividend is taxable to a U.S. Shareholder when the U.S. Shareholder receives the dividend, actually or constructively.
The dividend will not be eligible for the dividends-received deduction allowed to U.S. corporations in respect of dividends received from other U.S. corporations.
A distribution exceeding current and accumulated earnings and profits, as determined for U.S. federal income tax purposes, will be treated as a non-taxable return of capital to the extent of the U.S. Shareholder’s basis in the shares of CNH Industrial stock, causing a reduction in the U.S. Shareholder’s adjusted basis in CNH Industrial stock, and thereafter as capital gain.
105
Subject to certain limitations, any non-U.S. tax withheld and paid over to a non-U.S. taxing authority is eligible for credit against a U.S. Shareholder’s U.S. federal income tax liability except to the extent a refund of the tax withheld is available to the U.S. Shareholder under non-U.S. tax law or under an applicable tax treaty. The amount allowed to a U.S. Shareholder as a credit is limited to the amount of the U.S. Shareholder’s U.S. federal income tax liability that is attributable to income from sources outside the U.S. and is computed separately with respect to different types of income that the U.S. Shareholder receives from non-U.S. sources. Subject to the discussion below regarding Section 904(h) of the Code, dividends paid by CNH Industrial will be foreign source income and depending on the circumstances of the U.S. Shareholder, will be either “passive” or “general” income for purposes of computing the foreign tax credit allowable to a U.S. Shareholder.
Under Section 904(h) of the Code, dividends paid by a foreign corporation that is treated as 50% or more owned, by vote or value, by U.S. persons may be treated as U.S. source income (rather than foreign source income) for foreign tax credit purposes, to the extent the foreign corporation earns U.S. source income. In most circumstances, U.S. Shareholders would be able to choose the benefits of Section 904(h)(10) of the Code and elect to treat dividends that would otherwise be U.S. source dividends as foreign source dividends, but in such a case the foreign tax credit limitations would be separately determined with respect to such “resourced” income. In general, therefore, the application of Section 904(h) of the Code may adversely affect a U.S. Shareholder’s ability to use foreign tax credits. CNH Industrial does not believe that it is 50% or more owned by U.S. persons, but this conclusion is a factual determination and is subject to change; no assurance can therefore be given that CNH Industrial may not be treated as 50% or more owned by U.S. persons for purposes of Section 904(h) of the Code.
Taxation of Capital Gains
Subject to the discussion of PFIC taxation below, a U.S. Shareholder which sells or otherwise disposes of its CNH Industrial common shares will recognize capital gain or loss for U.S. federal income tax purposes equal to the difference between the amount that the U.S. Shareholder realizes and the U.S. Shareholder’s tax basis in those shares. Capital gain of a noncorporate U.S. Shareholder is taxed at preferential rates when the shareholder has a holding period greater than one year. The gain or loss will be U.S. source income or loss for foreign tax credit limitation purposes. The deduction of capital losses is subject to limitations.
Loyalty Voting Program
No statutory, judicial or administrative authority directly discusses how the receipt, ownership or disposition of special voting shares should be treated for U.S. federal income tax purposes and as a result, the U.S. federal income tax consequences are uncertain.
Receipt of Special Voting Shares
If a U.S. Shareholder receives special voting shares after requesting its shares be held on the Loyalty Register, the tax consequences of the receipt of special voting shares is unclear. While distributions of stock are tax-free in certain circumstances, it is possible that the distribution of special voting shares could be treated as a distribution subject to tax as described above in “—Taxation of Dividends” if such distribution were considered to result in a “disproportionate distribution.” If the distribution of special voting shares were so treated, the amount of the distribution should equal the fair market value of the special voting shares received. Because, among other things, the special voting shares are not transferable and a U.S. Shareholder will receive amounts in respect of the special voting shares only if CNH Industrial is liquidated, CNH Industrial believes and intends to take the position that the value of each special voting share is minimal. However, because the fair market value of the special voting shares is factual and not governed by any guidance that directly addresses such a situation, the IRS could assert that the value of the special voting shares (and thus the amount of the distribution) as determined by CNH Industrial is incorrect.
Ownership of Special Voting Shares
CNH Industrial believes that a U.S. Shareholder holding special voting shares associated with common shares should not have to recognize income in respect of amounts transferred to the special voting shares dividend reserve that are not paid out as dividends. Section 305 of the Code may, in certain circumstances, require a holder of preferred shares to recognize income, even if no dividends are actually received on such shares if the preferred shares are redeemable at a premium and the redemption premium results in a “constructive distribution.” Preferred shares for this purpose refer to shares that do not participate in corporate growth to any significant extent. CNH Industrial believes that Section 305 of the Code should not apply to any amounts transferred to the special voting shares dividend reserve that are not paid out as dividends so as to require current income inclusion by a U.S. Shareholder because, among other things, (i) the special voting shares are not redeemable on a specific date and a U.S. Shareholder is only entitled to receive amounts in respect of the special voting shares upon liquidation, (ii) Section 305 of the Code does not require the recognition of income in respect of a redemption premium if the redemption premium does not exceed a de minimis amount and, even if the amounts transferred to the special voting shares dividend reserve that are not paid out as dividends are considered redemption premium, the amount of the redemption premium is likely to be “de minimis” as such term is used in the applicable Treasury Regulations. CNH Industrial therefore intends to take the position that the
106
transfer of amounts to the special voting shares dividend reserve that are not paid out as dividends does not result in a “constructive distribution”, and this determination is binding on all U.S. Shareholders of special voting shares other than a U.S. Shareholder that explicitly discloses its contrary determination in the manner prescribed by the applicable Treasury Regulations. However, because the tax treatment of the loyalty voting structure is unclear and because CNH Industrial’s determination is not binding on the IRS, it is possible that the IRS could disagree with CNH Industrial’s determination and require current income inclusion in respect of such amounts transferred to the special voting shares dividend reserve that are not paid out as dividends.
Disposition of Special Voting Shares
The tax treatment of a U.S. Shareholder that has its special voting shares redeemed for zero consideration after removing its common shares from the Loyalty Register is unclear. It is possible that a U.S. Shareholder would recognize a loss to the extent of the U.S. Shareholder’s basis in its special voting shares, which should equal the amount that was included in income upon receipt. Such loss would be a capital loss and would be a long-term capital loss if a U.S. Shareholder has held its special voting shares for more than one year. It is also possible that a U.S. Shareholder would not be allowed to recognize a loss upon the redemption of its special voting shares and instead a U.S. Shareholder should increase the basis in its CNH Industrial common shares by an amount equal to the basis in its special voting shares. Such basis increase in a U.S. Shareholder’s CNH Industrial common shares would decrease the gain, or increase the loss, that a U.S. Shareholder would recognize upon the sale or other taxable disposition of its CNH Industrial common shares.
PFIC Considerations
CNH Industrial believes that shares of its stock are not stock of a PFIC for U.S. federal income tax purposes, but this conclusion is a factual determination made annually and thus may be subject to change. If CNH Industrial were to be treated as a PFIC, unless a U.S. Shareholder elects to be taxed annually on a mark-to-market basis with respect to its common shares (as discussed below), any gain realized on the sale or other disposition of CNH Industrial stock would in general not be treated as a capital gain. Instead, if you are a U.S. Shareholder, you would be treated as if you had realized such gain and certain “excess distributions” ratably over a U.S. Shareholder’s holding period for its CNH Industrial stock and would be taxed at the highest tax rate in effect for each such year to which the gain was allocated, together with an interest charge in respect of the tax attributable to CNH Industrial each such year. With certain exceptions, CNH Industrial stock will be treated as stock in a PFIC if CNH Industrial was a PFIC at any time during a U.S. Shareholder’s holding period of CNH Industrial stock. Dividends received from CNH Industrial will not be eligible for the special tax rates applicable to qualified dividend income if CNH Industrial is treated as a PFIC either in the taxable year of the distribution or the preceding taxable year, but instead will be taxable at rates applicable to ordinary income.
If CNH Industrial were to be treated as a PFIC for any taxable year and provided that CNH Industrial common shares were treated as “marketable stock” within the meaning of applicable Treasury Regulations, the latter of which CNH Industrial believes will be the case, a U.S. Shareholder may make a mark-to-market election with respect to such U.S. Shareholder’s common shares. Under a mark-to-market election, any excess of the fair market value of the CNH Industrial common shares at the close of any taxable year over the U.S. Shareholder’s adjusted tax basis in the CNH Industrial common shares is included in the U.S. Shareholder’s income as ordinary income. These amounts of ordinary income would not be eligible for the favorable tax rates applicable to qualified dividend income or long-term capital gains. In addition, the excess, if any, of such U.S. Shareholder’s adjusted tax basis at the close of any taxable year over the fair market value of the CNH Industrial common shares is deductible in an amount equal to the lesser of the amount of the excess or the amount of the net mark-to-market gains that such U.S. Shareholder included in income in prior years. A U.S. Shareholder’s tax basis in CNH Industrial common shares would be adjusted to reflect any such income or loss. Gain realized on the sale, exchange or other disposition of CNH Industrial common shares would be treated as ordinary income, and any loss realized on the sale, exchange or other disposition of CNH Industrial common shares would be treated as ordinary loss to the extent that such loss does not exceed the net mark-to-market gains previously included by such U.S. Shareholder.
Material U.K. Tax Consequences
This section summarizes the material U.K. tax consequences of the ownership of CNH Industrial common shares for U.S. Shareholders. It is intended only as a general guide and does not purport to be a complete analysis of all potential U.K. tax consequences of holding CNH Industrial common shares. This section is based on current U.K. tax law and what is understood to be the current practice of H.M. Revenue and Customs, as well as applicable tax treaties. This law and practice and these treaties are subject to change, possibly on a retroactive basis.
This section applies only to shareholders of CNH Industrial that are U.S. Shareholders, that are not resident or domiciled in the U.K., that are not individuals temporarily non-resident in the U.K. for a period of less than five complete tax years, that hold their shares as an investment, and that are the absolute beneficial owner of both the shares and any dividends paid on the shares. This section does not apply to members of any special class of shareholders subject to special rules, such as:
|
•
|
a pension fund;
|
107
|
•
|
a charity;
|
|
•
|
persons acquiring their shares in connection with an office or employment;
|
|
•
|
a dealer in securities;
|
|
•
|
an insurance company; or
|
|
•
|
a collective investment scheme.
|
In addition, this section may not apply to:
|
•
|
any shareholders that, either alone or together, with one or more associated persons, such as personal trusts and connected persons, control directly or indirectly at least 10% of the voting rights or of any class of share capital of CNH Industrial; or
|
|
•
|
any person holding shares as a borrower under a stock loan or an interim holder under a repo.
|
Taxation of Dividends
Withholding from dividend payments
Dividend payments may be made without withholding or deduction for or on account of U.K. income tax.
Non-U.K.-resident shareholders
A shareholder of CNH Industrial common shares that is not resident in the U.K. for U.K. tax purposes will not be liable to account for income or corporation tax in the U.K. on dividends paid on the shares unless the shareholder carries on a trade (or profession or vocation) in the U.K. and the dividends are either a receipt of that trade or, in the case of U.K. corporation tax, the shares are held by or for a U.K. permanent establishment through which the trade is carried on.
Some non-U.K.-resident individual shareholders of CNH Industrial common shares will be entitled to a non-repayable U.K. tax credit equal to one-ninth of the amount of the dividend received and brought into the charge to tax including any foreign tax withheld (or 10% of the aggregate of that dividend and tax credit). The U.K. government has issued a consultation draft legislation which would abolish the tax credit for dividends arising, or made, or treated as made, on or after April 6, 2016.
Non-U.K.-resident shareholders that are not otherwise liable to U.K. income or corporation tax on dividends will not generally be able to claim repayment of any significant part of the tax credit attaching to dividends from CNH Industrial as the U.K. will levy income tax at the source to offset the amount of the credit. A U.S. Shareholder will not ordinarily be entitled to any cash payment in respect of the tax credit.
Taxation of Capital Gains
Non-U.K.-resident shareholders
A disposal of CNH Industrial common shares by a shareholder that is not resident in the U.K. for tax purposes will not give rise to a chargeable gain or allowable loss unless that shareholder carries on a trade, profession or vocation in the U.K. through a branch, agency or permanent establishment and has used, held or acquired CNH Industrial common shares for the purposes of that trade, profession or vocation or that branch, agency or permanent establishment.
Stamp Duty and Stamp Duty Reserve Tax (“SDRT”)
CNH Industrial does not and will not maintain any share register in the U.K. and, accordingly, (i) U.K. stamp duty will not normally be payable in connection with a transfer of common shares, provided that the instrument of transfer is executed and retained outside the U.K. and no other action is taken in the U.K. by the transferor or transferee, and (ii) no U.K. SDRT will be payable in respect of any agreement to transfer CNH Industrial common shares.
Tax Consequences of Participating in the Loyalty Voting Program
A non-U.K.-resident shareholder that would not be subject to tax on dividends or capital gains in respect of CNH Industrial common shares will not be subject to U.K. tax in respect of the special voting shares.
CNH Industrial does not and will not maintain any share register in the U.K. and, accordingly, no liability to U.K. stamp duty or SDRT will arise to shareholders on the issue or repurchase of special voting shares.
108
Netherlands Taxation
This section summarizes solely the principal Dutch tax consequences of the acquisition, the ownership and the disposal of CNH Industrial common shares and / or special voting shares, by Non-resident holders of such shares (as defined below). It does not consider every aspect of Dutch taxation that may be relevant to a particular holder of shares in CNH Industrial in special circumstances or who is subject to special treatment under applicable law.
Where in this summary English terms and expressions are used to refer to Dutch concepts, the meaning to be attributed to such terms and expressions shall be the meaning to be attributed to the equivalent Dutch concepts under Dutch tax law. Where in this section the terms “the Netherlands” and “Dutch” are used, these refer solely to the European part of the Kingdom of the Netherlands.
This summary also assumes that the board shall control the conduct of the affairs of CNH Industrial and shall procure that CNH Industrial is organized in accordance with the facts, based upon which the competent authorities of the U.K. and the Netherlands have ruled that CNH Industrial should be treated as solely resident of the U.K. for the application of the tax treaty as concluded between the U.K. and the Netherlands. A change in facts and circumstances based upon which the ruling was issued may invalidate the contents of this section, which will not be updated to reflect any such change.
This summary is based on the tax law of the Netherlands (unpublished case law not included) as it stands at the date of this Form. The law upon which this summary is based is subject to change, perhaps with retroactive effect. Any such change may invalidate the contents of this summary, which will not be updated to reflect such change.
Scope of the Summary
The summary of Dutch taxes set out in this section “Material Dutch tax consequences” only applies to a holder of shares who is a Non-Resident holder of shares. For the purpose of this summary, a holder of shares is a Non-Resident holder of shares if such holder is neither a resident nor deemed to be resident in the Netherlands for purposes of Dutch income tax or corporation tax as the case may be. Where in this Dutch taxation discussion reference is made to “a holder of shares”, that concept includes, without limitation:
|
1.
|
an owner of one or more shares, who in addition to the title to such shares, has an economic interest in such shares;
|
|
2.
|
a person who, or an entity that holds the entire economic interest in one or more shares;
|
|
3.
|
a person who, or an entity that holds an interest in an entity, such as a partnership or a mutual fund, that is transparent for Dutch tax purposes, the assets of which comprise one or more shares, within the meaning of 1. or 2. above; or
|
|
4.
|
a person who is deemed to hold an interest in shares, as referred to under 1. to 3., pursuant to the attribution rules of article 2.14a, of the Dutch Income Tax Act 2001 (Wet inkomstenbelasting 2001), with respect to property that has been segregated, for instance, in a trust or a foundation.
|
Please note that this summary does not describe the tax considerations for holders of our shares who are individuals and derive benefits from our shares that are a remuneration or deemed to be a remuneration in connection with past, present or future employment performed in the Netherlands or management activities and functions or membership of a management board (bestuurder) or a supervisory board (commissaris) of a Netherlands resident entity by such holder or certain individuals related to such holder (as defined in The Dutch Income Tax Act 2001).
Dividend Withholding Tax
CNH Industrial is generally required to withhold Dutch dividend withholding tax at a rate of 15 percent from dividends distributed by it. The competent authorities of the U.K. and the Netherlands have ruled that CNH Industrial is resident of the U.K. for the application of the tax treaty as concluded between the Netherlands and the U.K. Consequently payments made by CNH Industrial on the common shares and / or the special voting shares to non-resident shareholders may be made free from Dutch dividend withholding tax.
Taxes on income and capital gains from the ownership and disposition of CNH Industrial common shares and / or special voting shares
A Non-resident holder (as defined above) of CNH Industrial common shares and / or special voting shares will not be subject to any Dutch taxes on income or capital gains in respect of any benefits derived or deemed to be derived by such holder from such holder’s CNH Industrial common shares and / or special voting shares, including any capital gain realized on the disposal thereof, unless:
|
1.
|
such holder derives profits from an enterprise, directly, or pursuant to a co-entitlement to the net value of such enterprise, or other than as a holder of securities which enterprise is either managed in the Netherlands or carried on, in whole or in part, through a permanent establishment or a permanent representative which is taxable in the Netherlands, and such holder’s CNH Industrial common shares and/or special voting shares are attributable to such enterprise; or
|
109
|
2.
|
such holder is an individual and such holder derives benefits from CNH Industrial common shares and / or special voting shares that are taxable as benefits from miscellaneous activities in the Netherlands. Benefits derived or deemed to be derived from certain miscellaneous activities by a child or a foster child who is under eighteen years of age are attributed to the parent who exercises, or the parents who exercise, authority over the child, irrespective of the country of residence of the child.
|
Gift and Inheritance Taxes
No Dutch gift or inheritance taxes will arise on the transfer of the shares by way of a gift by, or on the death of, a Non-Resident holder of CNH Industrial common shares, unless, in the case of a gift of the shares by an individual, such individual dies within 180 days after the date of the gift, while being resident or deemed to be resident in the Netherlands.
For purposes of Dutch gift and inheritance taxes, amongst others, an individual that holds the Dutch nationality will be deemed to be resident in the Netherlands if such individual has been resident in the Netherlands at any time during the ten years preceding the date of the gift or his/her death. Additionally, for purposes of Dutch gift tax, amongst others, an individual not holding the Dutch nationality will be deemed to be resident in the Netherlands if such individual has been resident in the Netherlands at any time during the twelve months preceding the date of the gift. Applicable tax treaties may override deemed residency.
Other Taxes and Duties
No Dutch registration tax, transfer tax, stamp duty or any other similar documentary tax or duty, other than court fees, is payable in the Netherlands by a holder in respect of or in connection with (i) the subscription, issue, placement or allotment of CNH Industrial common shares and / or special voting shares, (ii) the enforcement by way of legal proceedings (including the enforcement of any foreign judgment in the courts of the Netherlands) of the documents relating to the issue of CNH Industrial common shares and / or special voting shares or the performance by CNH Industrial of CNH Industrial’s obligations under such documents, or (iii) the transfer of CNH Industrial common shares and / or special voting shares.
F.
Dividends and Paying Agents.
Not applicable.
G.
Statement of Experts.
Not applicable.
H.
Documents on Display.
We file reports, including annual reports on Form 20-F, furnish periodic reports on Form 6-K and other information with the SEC pursuant to the rules and regulations of the SEC that apply to foreign private issuers. The SEC maintains an Internet site at http://www.sec.gov that contains reports, proxy and information statements, and other information regarding issuers that file electronically with the SEC, from which the public may obtain any materials the company files with the SEC.
I.
Subsidiary Information.
Not applicable.
|
Item 11.
|
Quantitative and Qualitative Disclosures about Market Risk
|
We are exposed to the following financial risks connected with our operations:
|
•
|
credit risk related to our financing activities;
|
|
•
|
market risk (primarily exchange rates and interest rates).
|
We attempt to actively manage these risks.
The quantitative data reported in the following sections does not have any predictive value. In particular, the sensitivity analysis on market risks does not reflect the complexity of the market or the reaction, which may result from any changes that are assumed to take place.
110
Credit Risk
Our credit concentration risk differs in relation to the activities carried out by the segments and sales markets in which we operate; in all cases, however, the risk is mitigated by the large number of counterparties and customers. Considered from a global point of view, however, there is a concentration of credit risk in trade receivables and receivables from financing activities, in particular dealer financing and finance leases in the European Union market and in North America, as well as in Latin America for Agriculture, Construction and Commercial and Specialty Vehicles.
Financial assets are recognized in the statement of financial position net of write-downs for the risk that counterparties may be unable to fulfill their contractual obligations, determined on the basis of the available information as to the creditworthiness of the customer and historical data.
The maximum credit risk to which we were theoretically exposed at
December 31, 2019
is represented by the carrying amounts stated for financial assets in the statement of financial position and the nominal value of the guarantees provided on debt or commitments of third parties.
Dealers and final customers are subject to specific assessments of their creditworthiness under a detailed scoring system. In addition to carrying out this evaluation process, we may also obtain financial and non-financial guarantees for risks arising from credit granted for the sale of commercial vehicles, agricultural equipment and construction equipment. These guarantees are further secured, where possible, by retention of title clauses or specific guarantees on financed vehicle sales to the distribution network and on vehicles under finance leasing agreements.
Balances which are objectively uncollectible either in part or for the whole amount are written down on a specific basis if they are individually significant. The amount of the write-down takes into account an estimate of the recoverable cash flows and the date of receipt, the costs of recovery, and the fair value of any guarantees received. Impairment losses are recognized for receivables that are not written down on a specific basis, but rather determined based on historical experience and statistical information.
Receivables for financing activities amounted to
$19,428 million
at
December 31, 2019
(
$19,167 million
at
December 31, 2018
) containing balances totaling
$458 million
(
$490 million
at
December 31, 2018
) that have been written down. In addition, balances totaling
$223 million
(
$259 million
at
December 31, 2018
) were either past due or in nonaccrual status. In the event of installment payments, even if only one installment is overdue, the whole amount of the receivable is classified as such.
Trade receivables totaling
$416 million
at
December 31, 2019
(
$399 million
at
December 31, 2018
) contain balances totaling
$60 million
(
$82 million
at
December 31, 2018
) that have been written down.
Currency Risk
We are exposed to risk resulting from changes in exchange rates, which can affect our earnings and equity.
Where one of our subsidiaries incurs costs in a currency different from that of its revenues, any change in exchange rates can affect the net income/(loss) of that company. In
2019
, the total net trade flows exposed to currency risk amounted to the equivalent of
15%
of our revenue (
16%
in
2018
). The principal exchange rates to which we are exposed are the following:
|
•
|
USD/EUR, in relation to the production/purchases of Agriculture and Construction in the euro area and to sales in dollars made by Commercial and Specialty Vehicles;
|
|
•
|
USD/BRL and EUR/BRL, in relation to production in Brazil and the respective import/export flows;
|
|
•
|
USD/AUD, mainly in relation to sales made by Agriculture and Construction in Australia;
|
|
•
|
EUR/GBP, predominately in relation to sales on the U.K. market.
|
Trade flows exposed to changes in these exchange rates in
2019
made up approximately
58%
of the exposure to currency risk from trade transactions.
It is our policy to use derivative financial instruments to hedge a certain percentage, on average between 55% and 85%, of the forecasted trading transaction exchange risk exposure for the coming 12 months with additional flexibility to reach 0% or 100% (including risk beyond that date where it is believed to be appropriate) and to hedge completely the exposure resulting from firm commitments.
Certain subsidiaries may hold trade receivables or payables denominated in a currency different from the subsidiary’s functional currency. In addition, in a limited number of cases, subsidiaries may obtain financing or use funds in a currency different from their functional currency. Changes in exchange rates may result in exchange gains or losses arising from these situations. It is our policy to hedge fully, whenever possible, the exposure resulting from receivables, payables, and securities denominated in foreign currencies different from the subsidiary’s functional currency.
Certain of our subsidiaries’ functional currency is different than the U.S. dollar, which is the Company’s reporting currency. The income statements of those subsidiaries are converted into U.S. dollars using the average exchange rate for the period, and while revenues and
111
margins are unchanged in local currency, changes in exchange rates may lead to effects on the converted balances of revenues, costs, and the results reported in U.S. dollars.
The assets and liabilities of consolidated companies whose functional currency is different from the U.S. dollar may acquire converted values in U.S. dollars which differ as a function of the fluctuation in exchange rates.
We monitor our principal exposure to conversion exchange risk, although there was no specific hedging in place at
December 31, 2019
. There were no substantial changes in
2019
in the nature or structure of exposure to currency risk or in our hedging policies.
Sensitivity Analysis
The potential loss in fair value of derivative financial instruments held for currency risk management (currency swaps/forwards, currency options, interest rate and currency swaps) at
December 31, 2019
resulting from a hypothetical change of
10%
in the exchange rates amounts to approximately
$392 million
(
$374 million
at
December 31, 2018
). The valuation model for currency options assumes that market volatility at year-end remains unchanged.
Receivables, payables, and future trade flows whose hedging transactions have been analyzed were not considered in this analysis. It is reasonable to assume that changes in exchange rates will produce the opposite effect, of an equal or greater amount, on the underlying transactions that have been hedged.
Interest Rate Risk
Our Industrial Activities make use of external funds obtained in the form of financing and invest in monetary and financial market instruments. In addition, we sell receivables. Changes in market interest rates can affect the cost of financing, including the sale of receivables, or the return on investments of funds, causing an impact on the level of net financial expenses incurred by us.
In addition, Financial Services provides loans (mainly to customers and dealers), financing themselves primarily using various forms of external borrowings or asset-backed financing (e.g., securitization of receivables). Where the characteristics of the variability of the interest rate applied to loans granted differ from those of the variability of the cost of the financing/funding obtained, changes in the current level of interest rates can affect our net income/(loss).
In order to mitigate these risks, we use interest rate derivative financial instruments, mainly interest rate swaps and forward rate agreements.
Sensitivity Analysis
In assessing the potential impact of changes in interest rates, we separate fixed rate financial instruments (for which the impact is assessed in terms of fair value) from floating rate financial instruments (for which the impact is assessed in terms of cash flows).
The fixed rate financial instruments used by us consist of retail receivables, debt, ABS securities, and other instruments.
The potential loss in fair value of fixed rate financial instruments (including the effect of interest rate derivative financial instruments) held at
December 31, 2019
, resulting from a hypothetical, unfavorable and instantaneous change of
10%
in market interest rates, would have been approximately
$21 million
(approximately
$32 million
at
December 31, 2018
).
Floating rate financial instruments consist principally of cash and cash equivalents, wholesale receivables, debt, and ABS securities. The effect of the sale of receivables is also considered in the sensitivity analysis as well as the effect of hedging derivative instruments.
A hypothetical change of
10%
in short-term interest rates at
December 31, 2019
, applied to floating rate financial assets and liabilities, operations for the sale of receivables and derivative financial instruments, would have caused increased net expenses before taxes, on an annual basis, of approximately
$4 million
(approximately
$2 million
at
December 31, 2018
).
This analysis is based on the assumption that there is a hypothetical change of 10% in interest rates across homogeneous categories. A homogeneous category is defined on the basis of the currency in which the financial assets and liabilities are denominated.
Other risks on derivative financial instruments
We have entered derivative contracts linked to commodity prices to hedge specific exposures on supply contracts.
Sensitivity Analysis
In the event of a hypothetical change of
10%
in the underlying raw materials prices, the potential loss in fair value of outstanding derivative financial instruments at
December 31, 2019
linked to commodity prices would not have been significant (not significant at
December 31, 2018
).
112
|
Item 12.
|
Description of Securities Other than Equity Securities
|
Not applicable.
113
|
Item 13.
|
Defaults, Dividend Arrearages and Delinquencies
|
None.
|
Item 14.
|
Material Modifications to the Rights of Security Holders and Use of Proceeds
|
None.
|
Item 15.
|
Controls and Procedures
|
(a) Disclosure Controls and Procedures
Under the supervision, and with the participation, of our management, including our Chief Executive Officer and Chief Financial Officer, we conducted an evaluation of the effectiveness of our disclosure controls and procedures as of
December 31, 2019
pursuant to Exchange Act Rule 13a-15(b). Based on that evaluation, our Chief Executive Officer and Chief Financial Officer concluded that our disclosure controls and procedures are effective to provide reasonable assurance that information required to be disclosed in our Exchange Act filings is recorded, processed, summarized and reported within the time periods specified in the SEC’s rules and forms and that such information is accumulated and communicated to our management, including our Chief Executive Officer and Chief Financial Officer, as appropriate, to allow timely decisions regarding required disclosure.
(b) Management’s Report on Internal Control over Financial Reporting
The Company’s management is responsible for establishing and maintaining adequate internal control over financial reporting. The Company’s internal control system was designed to provide reasonable assurance regarding the preparation and fair presentation of published financial statements in accordance with generally accepted accounting principles.
All internal control systems, no matter how well designed, have inherent limitations. Therefore, even those systems determined to be effective can provide only reasonable assurance with respect to financial statement preparation and presentation in accordance with generally accepted accounting principles.
Management assessed the effectiveness of the Company’s internal control over financial reporting as of
December 31, 2019
, using the criteria set forth in Internal Control - Integrated Framework (2013) issued by the Committee of Sponsoring Organizations of the Treadway Commission. Based on that assessment, management believes that, as of
December 31, 2019
, the Company’s internal control over financial reporting was effective.
The Company’s independent registered public accounting firm has issued an audit report on the effectiveness of the Company’s internal control over financial reporting. That report is included herein.
114
(c) Attestation Report of the Registered Public Accounting Firm
Report of Independent Registered Public Accounting Firm
To the Shareholders and the Board of Directors of CNH Industrial N.V.
Opinion on Internal Control Over Financial Reporting
We have audited CNH Industrial N.V.’s internal control over financial reporting as of
December 31, 2019
, based on criteria established in Internal Control—Integrated Framework issued by the Committee of Sponsoring Organizations of the Treadway Commission (2013 framework) (the COSO criteria). In our opinion, CNH Industrial N.V. (the Company) maintained, in all material respects, effective internal control over financial reporting as of
December 31, 2019
, based on the COSO criteria.
We also have audited, in accordance with the standards of the Public Company Accounting Oversight Board (United States) (PCAOB), the consolidated balance sheets of CNH Industrial N.V. as of
December 31, 2019
and
2018
, the related consolidated statements of operations, comprehensive income, cash flows and changes in equity for each of the three years in the period ended
December 31, 2019
, and the related notes and our report dated March 3, 2020 expressed an unqualified opinion thereon.
Basis for Opinion
The Company’s management is responsible for maintaining effective internal control over financial reporting and for its assessment of the effectiveness of internal control over financial reporting included in the accompanying Management’s Report on Internal Control over Financial Reporting. Our responsibility is to express an opinion on the Company’s internal control over financial reporting based on our audit. We are a public accounting firm registered with the PCAOB and are required to be independent with respect to the Company in accordance with the U.S. federal securities laws and the applicable rules and regulations of the Securities and Exchange Commission and the PCAOB.
We conducted our audit in accordance with the standards of the PCAOB. Those standards require that we plan and perform the audit to obtain reasonable assurance about whether effective internal control over financial reporting was maintained in all material respects.
Our audit included obtaining an understanding of internal control over financial reporting, assessing the risk that a material weakness exists, testing and evaluating the design and operating effectiveness of internal control based on the assessed risk, and performing such other procedures as we considered necessary in the circumstances. We believe that our audit provides a reasonable basis for our opinion.
Definition and Limitations of Internal Control Over Financial Reporting
A company’s internal control over financial reporting is a process designed to provide reasonable assurance regarding the reliability of financial reporting and the preparation of financial statements for external purposes in accordance with generally accepted accounting principles. A company’s internal control over financial reporting includes those policies and procedures that (1) pertain to the maintenance of records that, in reasonable detail, accurately and fairly reflect the transactions and dispositions of the assets of the company; (2) provide reasonable assurance that transactions are recorded as necessary to permit preparation of financial statements in accordance with generally accepted accounting principles, and that receipts and expenditures of the company are being made only in accordance with authorizations of management and directors of the company; and (3) provide reasonable assurance regarding prevention or timely detection of unauthorized acquisition, use, or disposition of the company’s assets that could have a material effect on the financial statements.
Because of its inherent limitations, internal control over financial reporting may not prevent or detect misstatements. Also, projections of any evaluation of effectiveness to future periods are subject to the risk that controls may become inadequate because of changes in conditions, or that the degree of compliance with the policies or procedures may deteriorate.
/s/ Ernst & Young LLP
Chicago, Illinois
March 3, 2020
115
(d) Changes in Internal Control
No change to our internal control over financial reporting occurred during the year ended December 31, 2019 that has materially affected, or is reasonably likely to materially affect, our internal control over financial reporting.
116
|
Item 16A.
|
Audit Committee Financial Expert
|
Our Board of Directors has determined that each member of the audit committee, namely, John Lanaway, Silke Christina Scheiber, Lorenzo Simonelli, and Jacques Theurillat, is an audit committee financial expert. All are independent directors under the NYSE standards.
|
Item 16B.
|
Code of Ethics
|
We have adopted a Code of Conduct which is applicable to all employees including our principal executive officer, principal financial officer and the principal accounting officer and controller. Our Code of Conduct is intended to meet the definition of “code of ethics” under Item 16B of Form 20-F under the Exchange Act. Our Code of Conduct is posted on our website, www.cnhindustrial.com, and may be found as follows: from our main page, first click on “Governance” and then on “Code of Conduct.”
|
Item 16C.
|
Principal Accountant Fees and Services
|
Ernst & Young LLP, the member firms of Ernst & Young and their respective affiliates (collectively, the “Ernst & Young Entities”) were appointed to serve as our independent registered public accounting firm for the years ended
December 31, 2019
and
2018
. We incurred the following fees from the Ernst & Young Entities for professional services for the years ended
December 31, 2019
and
2018
, respectively:
|
2019
|
2018
|
|||||||
|
Audit fees
|
$
|
12,295,000
|
|
$
|
12,375,000
|
|
||
|
Audit-related fees
|
1,009,000
|
|
1,754,000
|
|
||||
|
Other fees
|
34,000
|
|
30,000
|
|
||||
|
Total
|
$
|
13,338,000
|
|
$
|
14,159,000
|
|
||
“Audit Fees” are the aggregate fees billed by the Ernst & Young Entities for the audit of our consolidated annual financial statements, reviews of interim financial statements and attestation services that are provided in connection with statutory and regulatory filings or engagements. “Audit-Related Fees” are fees charged by the Ernst & Young Entities for assurance and related services that are reasonably related to the performance of the audit or review of our financial statements and are not reported under “Audit Fees.” This category comprises fees for the audit of employee benefit plans and pension plans, agreed-upon procedure engagements and other attestation services subject to regulatory requirements.
Audit Committee’s Pre-Approval Policies and Procedures
Our Audit Committee nominates and engages our independent registered public accounting firm to audit our consolidated financial statements. Our Audit Committee has a policy requiring management to obtain the Audit Committee’s approval before engaging our independent registered public accounting firm to provide any other audit or permitted non-audit services to us or our subsidiaries. Pursuant to this policy, which is designed to ensure that such engagements do not impair the independence of our independent registered public accounting firm, the Audit Committee reviews and pre-approves (if appropriate) specific audit and non-audit services in the categories Audit Services, Audit-Related Services, Tax Services, and any other services that may be performed by our independent registered public accounting firm. During the year ended
December 31, 2019
, all audit and non-audit services provided by our independent registered public accounting firm were pre-approved in accordance with such policies and procedures.
|
Item 16D.
|
Exemptions from the Listing Standards for Audit Committees
|
None.
117
|
Item 16E.
|
Purchase of Equity Securities by the Issuer and Affiliated Purchasers
|
The following table reports purchases of equity securities by the Company during the year ended
December 31, 2019
:
|
Period
|
Total Number of Shares Purchased
|
Average Price Paid per Share
(€)
|
Average Price Paid per Share
($)(3)
|
Total Number of Shares Purchased as Part of Publicly Announced Plans or Programs
|
Approximate Dollar Value of Shares that May Yet Be Purchased under the Plans or Programs
($)
|
|||||||||||||
|
Jan 1 to Jan 31, 2019
(1)
|
—
|
|
€
|
—
|
|
$
|
—
|
|
—
|
|
$
|
634,486,722
|
|
|||||
|
Feb 1 to Feb 28, 2019
|
—
|
|
€
|
—
|
|
$
|
—
|
|
—
|
|
$
|
634,486,722
|
|
|||||
|
March 1 to March 31, 2019
|
—
|
|
€
|
—
|
|
$
|
—
|
|
—
|
|
$
|
634,486,722
|
|
|||||
|
April 1 to April 30, 2019
|
—
|
|
€
|
—
|
|
$
|
—
|
|
—
|
|
$
|
634,486,722
|
|
|||||
|
May 1 to May 31, 2019
|
2,744,122
|
|
€
|
7.8090
|
|
$
|
8.7158
|
|
2,744,122
|
|
$
|
610,569,503
|
|
|||||
|
June 1 to June 30, 2019
|
2,306,140
|
|
€
|
8.2590
|
|
$
|
9.3092
|
|
2,306,140
|
|
$
|
589,101,185
|
|
|||||
|
July 1 to July 31, 2019
|
—
|
|
€
|
—
|
|
$
|
—
|
|
—
|
|
$
|
589,101,185
|
|
|||||
|
Aug 1 to Aug 31, 2019
|
—
|
|
€
|
—
|
|
$
|
—
|
|
—
|
|
$
|
589,101,185
|
|
|||||
|
Sep 1 to Sep 30, 2019
|
—
|
|
€
|
—
|
|
$
|
—
|
|
—
|
|
$
|
589,101,185
|
|
|||||
|
Oct 1 to Oct 31, 2019
|
1,218,330
|
|
€
|
8.9186
|
|
$
|
9.7661
|
|
1,218,330
|
|
$
|
577,202,852
|
|
|||||
|
Nov 1 to Nov 30, 2019
(2)
|
—
|
|
€
|
—
|
|
$
|
—
|
|
—
|
|
$
|
700,000,000
|
|
|||||
|
Dec 1 to Dec 31, 2019
|
—
|
|
€
|
—
|
|
$
|
—
|
|
—
|
|
$
|
700,000,000
|
|
|||||
|
Total
|
6,268,592
|
|
6,268,592
|
|
$
|
700,000,000
|
|
|||||||||||
|
(1)
|
On April 27, 2018, the Company announced a buy-back program to repurchase up to $700 million in the Company’s common shares. This buy-back program was approved by the Company’s shareholders at the AGM on April 13, 2018 and expired on October 12, 2019.
|
|
(2)
|
On November 7, 2019, the Company announced its new share buy-back program, which covers the repurchase up to $700 million in common shares. The buy-back program implements the resolution adopted by the Company's shareholders at the annual general meeting of shareholders (“AGM”) held on April 12, 2019. This program has a duration up to and including October 11, 2020.
|
|
(3)
|
Share repurchases are made on the Mercato Telematico Azionario (“MTA”) and have been translated from euros at the exchange rate reported by the European Central Bank on the respective transaction dates.
|
|
Item 16F.
|
Change in Registrant’s Certifying Accountant
|
Not applicable.
|
Item 16G.
|
Corporate Governance
|
CNH Industrial N.V. is a company organized under the laws of the Netherlands and qualifies as a foreign private issuer under the rules and regulations of the SEC and the listing standards of the NYSE. In accordance with the NYSE listing rules related to corporate governance, listed companies that are foreign private issuers are permitted to follow home-country practice in some circumstances in lieu of the provisions of the corporate governance rules contained in Section 303A of the NYSE Listed Company Manual that are otherwise applicable to listed companies. In addition, we must disclose any significant ways in which our corporate governance practices differ from those followed by domestic U.S. companies listed on the NYSE. In contrast to the NYSE rules applicable to domestic U.S. listed companies, the Dutch Code is based on a “comply or explain” principle, as a result of which deviation from the specific requirements of the Dutch Code is permissible as long as such deviation is identified and explained.
Both the Dutch and NYSE corporate governance regimes were adopted with the goal of restoring trust and confidence in the honesty, integrity and transparency of how business is conducted at and by public companies. Because these corporate governance regimes are based on the same principles, they are similar in many respects. However, certain differences exist between Dutch and NYSE corporate governance rules, as summarized below. We believe that our corporate governance practices and guidelines are consistent, in principle, with those required of U.S. companies listed on the NYSE.
The discussion below summarizes the significant differences between our corporate governance practices and the NYSE standards applicable to U.S. listed companies.
Dutch legal requirements concerning director independence differ in certain respects from the rules applicable to U.S. companies listed on the NYSE. While under most circumstances both regimes require that a majority of board members be “independent,” the definition of this term under Dutch law differs from the definition used under the NYSE corporate governance standards. In some cases, the Dutch requirements are more rigorous, such as by requiring a longer “look-back” period (five years) for former executive directors and employees and by considering a non-executive board member serving as director in the board of a shareholder holding ten percent or more of the
118
company's shares to be not independent, even if he or she is considered "independent" on the board of directors of the shareholder. Currently, a majority of our Board (six of the nine members) are “independent” under the NYSE definition and the Dutch Code. Under the Dutch Code, non-executive directors must not be a non-executive director of more than five other “large” Dutch companies (as defined in the Dutch Code). None of the members of our Board is a non-executive director of more than five other "large" Dutch companies.
The NYSE requires that, when an audit committee member of a U.S. domestic listed company serves on four or more audit committees of public companies, the listed company should disclose (either on its website or in its annual proxy statement or annual report on Form 10-K) that the board of directors has determined that this simultaneous service would not impair the director’s service to the listed company. Dutch law does not require the Company to make such a determination.
NYSE rules require a domestic U.S. listed company to have a compensation committee and a nominating/corporate governance committee composed entirely of independent directors. As a foreign private issuer, we do not have to comply with this requirement, although we do have a Compensation Committee and a Governance and Sustainability Committee. Our Compensation Committee Charter states that a maximum of one member of the Compensation Committee may not be independent. Two of the three members of the Compensation Committee are considered independent under the NYSE standards. Our Governance and Sustainability Committee Charter states that a maximum of two members of the Governance and Sustainability Committee may not be independent. Two of the three members of the Governance and Sustainability Committee are considered independent under the NYSE standards.
In contrast to NYSE rules applicable to U.S. companies, which require that external auditors be appointed by the Audit Committee, the general rule under Dutch law is that external auditors are appointed by the company’s general meeting of shareholders. In accordance with the requirements of Dutch law, the appointment and removal of our independent registered public accounting firm must be resolved upon by our general meeting of shareholders. We seek to follow best practices as contemplated by the NYSE standards by having our Audit Committee support and advise the Board with respect to the proposal to shareholders regarding the appointment and compensation of the Company's independent registered public accounting firm, which is appointed by our shareholders. Our Audit Committee also oversees and evaluates the work of our independent registered public accounting firm.
Under NYSE listing standards, shareholders of U.S. companies must be given the opportunity to vote on all equity compensation plans and to approve material revisions to those plans, with limited exceptions set forth in the NYSE rules. As a foreign private issuer, we are permitted to follow our home country laws regarding shareholder approval of compensation plans, and, under Dutch law and the Dutch Code, such approval from shareholders is not required for equity compensation plans for employees other than members of the Board, and to the extent the authority to grant equity rights has been delegated by the shareholders to the Board. For equity compensation plans for members of the Board and/or in the event that the authority to issue shares and/or rights to subscribe for shares has not been delegated to the Board, approval of the general meeting of shareholders is required.
While NYSE rules do not require listed companies to have shareholders approve or declare dividends, the Dutch Code requires that a dividend distribution be a separate agenda item at the general meeting of shareholders, in which the annual accounts are adopted. In our case, Articles 18 and 22 of our Articles of Association provide that annual dividends must be resolved upon by our general meeting of shareholders. For a discussion of our dividend policy, see “Item 10. Additional Information—B. Memorandum and Articles of Association—Payment of Dividends.”
In accordance with the corporate governance rules of the NYSE applicable to foreign private issuers, we also disclose these differences between our corporate governance practices and those required of domestic listed companies by the NYSE listing standards on our website at www.cnhindustrial.com.
|
Item 16H.
|
Mine Safety Disclosure
|
Not applicable.
119
|
Item 17.
|
Financial Statements
|
We have responded to Item 18 in lieu of responding to this item.
|
Item 18.
|
Financial Statements
|
INDEX TO CONSOLIDATED FINANCIAL STATEMENTS
CNH INDUSTRIAL N.V.
|
Item 19.
|
Exhibits
|
A list of exhibits included as part of this annual report on Form 20-F is set forth in the Index to Exhibits that immediately following the notes to the consolidated financial statements of this annual report on Form 20-F.
F-1
Report of Independent Registered Public Accounting Firm
To the Shareholders and the Board of Directors of CNH Industrial N.V.
Opinion on the Financial Statements
We have audited the accompanying consolidated balance sheets of CNH Industrial N.V. (the Company) as of December 31, 2019 and 2018, the related consolidated statements of operations, comprehensive income, cash flows and changes in equity for each of the three years in the period ended December 31, 2019, and the related notes (collectively referred to as the “consolidated financial statements”). In our opinion, the consolidated financial statements present fairly, in all material respects, the financial position of the Company at December 31, 2019 and 2018, and the results of its operations and its cash flows for each of the three years in the period ended December 31, 2019, in conformity with U.S. generally accepted accounting principles.
We also have audited, in accordance with the standards of the Public Company Accounting Oversight Board (United States) (PCAOB), the Company's internal control over financial reporting as of December 31, 2019, based on criteria established in Internal Control-Integrated Framework issued by the Committee of Sponsoring Organizations of the Treadway Commission (2013 framework) and our report dated March 3, 2020 expressed an unqualified opinion thereon.
Basis for Opinion
These financial statements are the responsibility of the Company's management. Our responsibility is to express an opinion on the Company’s financial statements based on our audits. We are a public accounting firm registered with the PCAOB and are required to be independent with respect to the Company in accordance with the U.S. federal securities laws and the applicable rules and regulations of the Securities and Exchange Commission and the PCAOB.
We conducted our audits in accordance with the standards of the PCAOB. Those standards require that we plan and perform the audit to obtain reasonable assurance about whether the financial statements are free of material misstatement, whether due to error or fraud. Our audits included performing procedures to assess the risks of material misstatement of the financial statements, whether due to error or fraud, and performing procedures that respond to those risks. Such procedures included examining, on a test basis, evidence regarding the amounts and disclosures in the financial statements. Our audits also included evaluating the accounting principles used and significant estimates made by management, as well as evaluating the overall presentation of the financial statements. We believe that our audits provide a reasonable basis for our opinion.
Critical Audit Matters
The critical audit matters communicated below are matters arising from the current period audit of the consolidated financial statements that were communicated or required to be communicated to the audit committee and that: (1) relate to accounts or disclosures that are material to the consolidated financial statements and (2) involved our especially challenging, subjective or complex judgments. The communication of critical audit matters does not alter in any way our opinion on the consolidated financial statements, taken as a whole, and we are not, by communicating the critical audit matters below, providing separate opinions on the critical audit matters or on the accounts or disclosures to which they relate.
|
Income Taxes - Valuation Allowances and Realizability of Deferred Tax Assets
|
||
|
Description of the Matter
|
As more fully described in Note 11, the Company had deferred tax assets of $1.65 billion (net of valuation allowances of $1.0 billion, primarily attributable to its operations in Brazil, Germany, and the U.K.) as of December 31, 2019. Additionally, during 2019, the Company assessed and weighed all positive and negative evidence and concluded it was more likely than not that a portion of the Company’s Italian deferred tax assets will be realized. Accordingly, the Company reduced its valuation allowance against its Italian deferred tax assets by approximately $539 million. Deferred tax assets are reduced by a valuation allowance if, based upon the weight of all available evidence, it is more likely than not that some portion, or all, of the deferred tax assets will not be realized.
Auditing management’s analysis of the realizability of its deferred tax assets and related valuation allowances was significant to our audit because the amounts are material to the financial statements and the assessment process by jurisdiction is complex. This assessment involves significant judgment, including the weighting of all available evidence, and includes assumptions that may be affected by future market or economic conditions in foreign jurisdictions that can include multiple entities from the Company’s various segments.
|
|
F-2
|
How We Addressed the Matter in Our Audit
|
We obtained an understanding, evaluated the design and tested the operating effectiveness of internal controls that address the risks of material misstatement relating to the realizability of deferred tax assets. This included controls over management’s projections of future taxable income, the future reversal of existing taxable temporary differences, and management’s identification and use of available tax planning strategies.
To test the realizability of the deferred tax assets and measurement of any valuation allowances, our audit procedures included, among others, evaluating the methodologies used, the significant assumptions discussed above, and the underlying data used by the Company in its analysis. For example, as part of our evaluation of management’s significant assumptions, we utilized our tax specialists and considered the relevant tax laws and regulations in the various jurisdictions, including considering whether the estimated future sources of taxable income were of the appropriate character to utilize the deferred tax assets in the relevant time period. We also evaluated cumulative income or loss positions in various jurisdictions and evaluated the Company’s projections of future taxable income, including comparing the forecasts to business plans to assess the reasonableness of those forecasts.
|
|
|
Valuation of Goodwill - Construction Reporting Unit
|
||
|
Description of the Matter
|
As more fully described in Note 9, the Company’s carrying value of goodwill associated with its Construction reporting unit was approximately $587 million at December 31, 2019. The Company performs its annual goodwill impairment testing as of December 31 each year or earlier if interim impairment indicators are present. Impairment testing for goodwill is performed at a reporting unit level and the Company’s estimate of the fair value of the reporting unit is compared with its carrying value. An impairment charge is recognized for the amount by which the carrying amount exceeds the reporting unit’s fair value. The Company determines the fair value of its Construction reporting unit using multiple valuation methodologies, relying largely on an income approach but also incorporating fair value estimates from a market approach.
Auditing management’s annual goodwill impairment test for the Construction reporting unit was complex and highly judgmental due to the significant estimation required to determine the fair value of the reporting unit. In particular, the fair value estimate was most sensitive to the significant assumptions of revenue growth in the discrete period and the weighted average cost of capital (discount rate) to be applied to the future cash flows, but also impacted by other less-significant assumptions such as gross margins, operating costs, income tax rates, terminal growth rates, capital expenditures and changes in working capital requirements.
|
|
|
How We Addressed the Matter in Our Audit
|
We obtained an understanding, evaluated the design and tested the operating effectiveness of internal controls that address the risk of material misstatement within the Company’s goodwill impairment testing of the Construction reporting unit. The testing included controls over management’s review of the significant assumptions described above and other relevant matters such as the determination of the carrying value of the reporting unit.
To test the estimated fair value of the Company’s Construction reporting unit, we performed audit procedures that included, among others, assessing the valuation methodologies and testing the significant assumptions discussed above as well as testing the underlying data used by the Company in its analysis. For example, we assessed the reasonableness of the significant assumptions in the Company’s forecasts and compared those assumptions to current industry and economic trends. We also assessed the historical accuracy of management’s estimates and performed sensitivity analyses on certain assumptions to evaluate the impact that any significant changes would have on the Company’s overall estimate of fair value of the Construction reporting unit. We used our internal valuation specialists to assist with the performance of these procedures.
|
|
/s/ Ernst & Young LLP
We have served as the Company’s auditor since 2014.
Chicago, IL
March 3, 2020
F-3
CNH INDUSTRIAL N.V.
For the Years Ended
December 31, 2019
,
2018
and
2017
|
2019
|
2018
|
2017
|
||||||||||
|
(in millions)
|
||||||||||||
|
Revenues
|
||||||||||||
|
Net sales
|
$
|
|
|
$
|
|
|
$
|
|
|
|||
|
Finance, interest and other income
|
|
|
|
|
|
|
||||||
|
Total Revenues
|
$
|
|
|
$
|
|
|
$
|
|
|
|||
|
Costs and Expenses
|
||||||||||||
|
Cost of goods sold
|
$
|
|
|
$
|
|
|
$
|
|
|
|||
|
Selling, general and administrative expenses
|
|
|
|
|
|
|
||||||
|
Research and development expenses
|
|
|
|
|
|
|
||||||
|
Restructuring expenses
|
|
|
|
|
|
|
||||||
|
Interest expense
|
|
|
|
|
|
|
||||||
|
Other, net
|
|
|
|
|
|
|
||||||
|
Total Costs and Expenses
|
$
|
|
|
$
|
|
|
$
|
|
|
|||
|
Income before income taxes and equity in income of unconsolidated subsidiaries and affiliates
|
|
|
|
|
|
|
||||||
|
Income tax (expense)
|
|
|
(
|
)
|
(
|
)
|
||||||
|
Equity in income of unconsolidated subsidiaries and affiliates
|
|
|
|
|
|
|
||||||
|
Net income
|
|
|
|
|
|
|
||||||
|
Net income attributable to noncontrolling interests
|
|
|
|
|
|
|
||||||
|
Net income attributable to CNH Industrial N.V.
|
$
|
|
|
$
|
|
|
$
|
|
|
|||
|
Earnings per share attributable to common shareholders
|
||||||||||||
|
Basic
|
$
|
|
|
$
|
|
|
$
|
|
|
|||
|
Diluted
|
$
|
|
|
$
|
|
|
$
|
|
|
|||
|
Cash dividends declared per common share
|
$
|
|
|
$
|
|
|
$
|
|
|
|||
The accompanying notes to consolidated financial statements are an integral part of these statements.
F-4
CNH INDUSTRIAL N.V.
CONSOLIDATED STATEMENTS OF COMPREHENSIVE INCOME
For the Years Ended
December 31, 2019
,
2018
and
2017
|
2019
|
2018
|
2017
|
||||||||||
|
(in millions)
|
||||||||||||
|
Net income
|
$
|
|
|
$
|
|
|
$
|
|
|
|||
|
Other comprehensive income (loss), net of tax
|
||||||||||||
|
Unrealized gain (loss) on cash flow hedges
|
(
|
)
|
(
|
)
|
|
|
||||||
|
Changes in retirement plans’ funded status
|
(
|
)
|
|
|
|
|
||||||
|
Foreign currency translation
|
|
(
|
)
|
(
|
)
|
|||||||
|
Share of other comprehensive income (loss) of entities using the equity method
|
(
|
)
|
(
|
)
|
|
|
||||||
|
Other comprehensive income (loss), net of tax
|
(
|
)
|
|
|
(
|
)
|
||||||
|
Comprehensive income
|
|
|
|
|
|
|
||||||
|
Less: Comprehensive income attributable to noncontrolling interests
|
|
|
|
|
|
|
||||||
|
Comprehensive income attributable to CNH Industrial N.V.
|
$
|
|
|
$
|
|
|
$
|
|
|
|||
The accompanying notes to consolidated financial statements are an integral part of these statements.
F-5
CNH INDUSTRIAL N.V.
As of
December 31, 2019
and
2018
|
December 31,
2019 |
December 31,
2018 |
|||||||
|
(in millions)
|
||||||||
|
ASSETS
|
||||||||
|
Cash and cash equivalents
|
$
|
|
|
$
|
|
|
||
|
Restricted cash
|
|
|
|
|
||||
|
Trade receivables, net
|
|
|
|
|
||||
|
Financing receivables, net
|
|
|
|
|
||||
|
Inventories, net
|
|
|
|
|
||||
|
Property, plant and equipment, net
|
|
|
|
|
||||
|
Investments in unconsolidated subsidiaries and affiliates
|
|
|
|
|
||||
|
Equipment under operating leases
|
|
|
|
|
||||
|
Goodwill
|
|
|
|
|
||||
|
Other intangible assets, net
|
|
|
|
|
||||
|
Deferred tax assets
|
|
|
|
|
||||
|
Derivative assets
|
|
|
|
|
||||
|
Other assets
|
|
|
|
|
||||
|
Total Assets
|
$
|
|
|
|
$
|
|
|
|
|
LIABILITIES AND EQUITY
|
||||||||
|
Debt
|
$
|
|
|
$
|
|
|
||
|
Trade payables
|
|
|
|
|
||||
|
Deferred tax liabilities
|
|
|
|
|
||||
|
Pension, postretirement and other postemployment benefits
|
|
|
|
|
||||
|
Derivative liabilities
|
|
|
|
|
||||
|
Other liabilities
|
|
|
|
|
||||
|
Total Liabilities
|
$
|
|
|
|
$
|
|
|
|
|
Redeemable noncontrolling interest
|
|
|
|
|
||||
|
Common shares, € 0.01, par value; outstanding 1,350,132,117 common shares and 387,951,166 loyalty program special voting shares in 2019; and outstanding 1,353,831,958 common shares and 388,725,624 loyalty program special voting shares in 2018
|
|
|
|
|
||||
|
Treasury stock, at cost - 14,268,079 shares in 2019 and 10,568,238 shares in 2018
|
(
|
)
|
(
|
)
|
||||
|
Additional paid in capital
|
|
|
|
|
||||
|
Retained earnings
|
|
|
|
|
||||
|
Accumulated other comprehensive loss
|
(
|
)
|
(
|
)
|
||||
|
Noncontrolling interests
|
|
|
|
|
||||
|
Total Equity
|
$
|
|
|
|
$
|
|
|
|
|
Total Liabilities and Equity
|
$
|
|
|
|
$
|
|
|
|
The accompanying notes to consolidated financial statements are an integral part of these statements.
F-6
CNH INDUSTRIAL N.V.
CONSOLIDATED BALANCE SHEETS — (Continued)
As of
December 31, 2019
and
2018
The following table presents certain assets and liabilities of consolidated variable interest entities (“VIEs”), which are included in the consolidated balance sheets above. The assets in the table include only those assets that can be used to settle obligations of consolidated VIEs. The liabilities in the table include third party liabilities of the consolidated VIEs, for which creditors do not have recourse to the general credit of CNH Industrial.
|
December 31,
2019 |
December 31,
2018 |
|||||||
|
(in millions)
|
||||||||
|
Restricted cash
|
$
|
|
|
$
|
|
|
||
|
Financing receivables
|
|
|
|
|
||||
|
Total Assets
|
$
|
|
|
|
$
|
|
|
|
|
Debt
|
$
|
|
|
$
|
|
|
||
|
Total Liabilities
|
$
|
|
|
|
$
|
|
|
|
The accompanying notes to consolidated financial statements are an integral part of these statements.
F-7
CNH INDUSTRIAL N.V.
For the Years Ended
December 31, 2019
,
2018
and
2017
|
2019
|
2018
|
2017
|
||||||||||
|
(in millions)
|
||||||||||||
|
Operating activities:
|
||||||||||||
|
Net income (loss)
|
$
|
|
|
$
|
|
|
$
|
|
|
|||
|
Adjustments to reconcile net income to net cash provided (used) by operating
activities:
|
||||||||||||
|
Depreciation and amortization expense, net of assets under operating lease and assets sold under buy-back commitments
|
|
|
|
|
|
|
||||||
|
Depreciation and amortization expense of assets under operating lease and assets sold under buy-back commitments
|
|
|
|
|
|
|
||||||
|
(Gain) loss from disposal of assets
|
(
|
)
|
|
|
|
|
||||||
|
Loss on repurchase of Notes
|
|
|
|
|
|
|
||||||
|
Undistributed income (loss) of unconsolidated subsidiaries
|
|
(
|
)
|
(
|
)
|
|||||||
|
Other non-cash items
|
|
|
|
|
|
|
||||||
|
Changes in operating assets and liabilities:
|
||||||||||||
|
Provisions
|
(
|
)
|
(
|
)
|
|
|
||||||
|
Deferred income taxes
|
(
|
)
|
|
|
|
|
||||||
|
Trade and financing receivables related to sales, net
|
(
|
)
|
(
|
)
|
(
|
)
|
||||||
|
Inventories, net
|
|
|
|
|
|
|
||||||
|
Trade payables
|
(
|
)
|
|
|
|
|
||||||
|
Other assets and liabilities
|
(
|
)
|
(
|
)
|
|
|
||||||
|
Net cash provided by operating activities
|
$
|
|
|
$
|
|
|
$
|
|
|
|||
|
Investing activities:
|
||||||||||||
|
Additions to retail receivables
|
(
|
)
|
(
|
)
|
(
|
)
|
||||||
|
Collections of retail receivables
|
|
|
|
|
|
|
||||||
|
Proceeds from the sale of assets, net of assets under operating leases and assets sold under buy-back commitments
|
|
|
|
|
|
|
||||||
|
Expenditures for property, plant and equipment and intangible assets, net of assets under operating lease and assets sold under buy-back commitments
|
(
|
)
|
(
|
)
|
(
|
)
|
||||||
|
Expenditures for assets under operating leases and assets sold under buy-back commitments
|
(
|
)
|
(
|
)
|
(
|
)
|
||||||
|
Other
|
(
|
)
|
|
|
|
|
||||||
|
Net cash used in investing activities
|
$
|
(
|
)
|
$
|
(
|
)
|
$
|
(
|
)
|
|||
|
Financing activities:
|
||||||||||||
|
Proceeds from long-term debt
|
|
|
|
|
|
|
||||||
|
Payments of long-term debt
|
(
|
)
|
(
|
)
|
(
|
)
|
||||||
|
Net increase (decrease) in other financial liabilities
|
|
|
|
|
|
|
||||||
|
Dividends paid
|
(
|
)
|
(
|
)
|
(
|
)
|
||||||
|
Other
|
(
|
)
|
(
|
)
|
(
|
)
|
||||||
|
Net cash provided by (used in) financing activities
|
$
|
|
|
$
|
(
|
)
|
$
|
(
|
)
|
|||
|
Effect of foreign exchange rate changes on cash and cash equivalents
|
(
|
)
|
(
|
)
|
|
|
||||||
|
Increase (decrease) in cash and cash equivalents
|
(
|
)
|
(
|
)
|
|
|
||||||
|
Cash and cash equivalents, beginning of year
|
|
|
|
|
|
|
||||||
|
Cash and cash equivalents, end of year
|
$
|
|
|
$
|
|
|
$
|
|
|
|||
The accompanying notes to consolidated financial statements are an integral part of these statements.
F-8
CNH INDUSTRIAL N.V.
CONSOLIDATED STATEMENTS OF CHANGES IN EQUITY
For the Years Ended
December 31, 2019
,
2018
and
2017
|
Common
Shares
|
Treasury
Stock
|
Additional
Paid-in
Capital
|
Retained
Earnings
|
Accumulated Other Comprehensive Income (Loss)
|
Noncontrolling
Interests
|
Total
|
Redeemable
Noncontrolling
Interest
|
|||||||||||||||||||||||||
|
(in millions)
|
||||||||||||||||||||||||||||||||
|
Balance, January 1, 2017
|
$
|
|
|
$
|
(
|
)
|
$
|
|
|
$
|
|
|
$
|
(
|
)
|
$
|
|
|
$
|
|
|
$
|
|
|
||||||||
|
Net income
|
—
|
|
—
|
|
—
|
|
|
|
—
|
|
|
|
|
|
|
|
||||||||||||||||
|
Other Comprehensive income (loss), net of tax
|
—
|
|
—
|
|
—
|
|
—
|
|
(
|
)
|
(
|
)
|
(
|
)
|
—
|
|
||||||||||||||||
|
Dividends paid
|
—
|
|
—
|
|
—
|
|
(
|
)
|
—
|
|
(
|
)
|
(
|
)
|
(
|
)
|
||||||||||||||||
|
Acquisition of treasury stock
|
—
|
|
(
|
)
|
—
|
|
—
|
|
—
|
|
—
|
|
(
|
)
|
—
|
|
||||||||||||||||
|
Common shares issued from treasury stock and capital increase for share-based compensation
|
—
|
|
|
|
(
|
)
|
—
|
|
—
|
|
—
|
|
|
|
—
|
|
||||||||||||||||
|
Share-based compensation expense
|
—
|
|
—
|
|
|
|
—
|
|
—
|
|
—
|
|
|
|
—
|
|
||||||||||||||||
|
Other changes
|
—
|
|
—
|
|
(
|
)
|
—
|
|
—
|
|
(
|
)
|
(
|
)
|
—
|
|
||||||||||||||||
|
Balance, December 31, 2017
|
$
|
|
|
$
|
(
|
)
|
$
|
|
|
$
|
|
|
$
|
(
|
)
|
$
|
|
|
$
|
|
|
$
|
|
|
||||||||
|
Net income
|
—
|
|
—
|
|
—
|
|
|
|
—
|
|
|
|
|
|
|
|
||||||||||||||||
|
Other Comprehensive income (loss), net of tax
|
—
|
|
—
|
|
—
|
|
—
|
|
|
|
(
|
)
|
|
|
—
|
|
||||||||||||||||
|
Dividends paid
|
—
|
|
—
|
|
—
|
|
(
|
)
|
—
|
|
(
|
)
|
(
|
)
|
(
|
)
|
||||||||||||||||
|
Acquisition of treasury stock
|
—
|
|
(
|
)
|
—
|
|
—
|
|
—
|
|
—
|
|
(
|
)
|
—
|
|
||||||||||||||||
|
Common shares issued from treasury stock and capital increase for share-based compensation
|
—
|
|
|
|
(
|
)
|
—
|
|
—
|
|
—
|
|
|
|
—
|
|
||||||||||||||||
|
Share-based compensation expense
|
—
|
|
—
|
|
|
|
—
|
|
—
|
|
—
|
|
|
|
—
|
|
||||||||||||||||
|
Other changes
|
—
|
|
—
|
|
(
|
)
|
—
|
|
—
|
|
|
|
|
|
—
|
|
||||||||||||||||
|
Balance, December 31, 2018
|
$
|
|
|
$
|
(
|
)
|
$
|
|
|
$
|
|
|
$
|
(
|
)
|
$
|
|
|
$
|
|
|
$
|
|
|
||||||||
|
Net income
|
—
|
|
—
|
|
—
|
|
|
|
—
|
|
|
|
|
|
|
|
||||||||||||||||
|
Other Comprehensive income (loss), net of tax
|
—
|
|
—
|
|
—
|
|
—
|
|
(
|
)
|
(
|
)
|
(
|
)
|
—
|
|
||||||||||||||||
|
Reclassification of certain tax effects
|
—
|
|
—
|
|
—
|
|
|
|
(
|
)
|
—
|
|
—
|
|
—
|
|
||||||||||||||||
|
Dividends paid
|
—
|
|
—
|
|
—
|
|
(
|
)
|
—
|
|
(
|
)
|
(
|
)
|
(
|
)
|
||||||||||||||||
|
Acquisition of treasury stock
|
—
|
|
(
|
)
|
—
|
|
—
|
|
—
|
|
—
|
|
(
|
)
|
—
|
|
||||||||||||||||
|
Common shares issued from treasury stock and capital increase for share-based compensation
|
—
|
|
|
|
(
|
)
|
—
|
|
—
|
|
—
|
|
(
|
)
|
—
|
|
||||||||||||||||
|
Share-based compensation expense
|
—
|
|
—
|
|
|
|
—
|
|
—
|
|
—
|
|
|
|
—
|
|
||||||||||||||||
|
Other changes
|
—
|
|
—
|
|
(
|
)
|
—
|
|
—
|
|
(
|
)
|
(
|
)
|
—
|
|
||||||||||||||||
|
Balance, December 31, 2019
|
$
|
|
|
$
|
(
|
)
|
$
|
|
|
$
|
|
|
$
|
(
|
)
|
$
|
|
|
$
|
|
|
$
|
|
|
||||||||
The accompanying notes to consolidated financial statements are an integral part of these statements.
F-9
CNH INDUSTRIAL N.V.
NOTES TO THE CONSOLIDATED FINANCIAL STATEMENTS
CNH Industrial N.V. (“CNH Industrial” or the “Company”) is incorporated in, and under the laws of, the Netherlands. CNH Industrial is a leading company in the capital goods sector that, through its various businesses, designs, produces and sells agricultural equipment and construction equipment, trucks, commercial vehicles, buses and specialty vehicles for firefighting, defense and other uses, as well as engines, transmissions and axles for those vehicles and engines for marine and power generation applications (see “Note 20: Segment Reporting”). In addition, CNH Industrial’s Financial Services segment offers an array of financial products and services, including retail financing for the purchase or lease of new and used CNH Industrial and other manufacturers’ products and other retail financing programs and wholesale financing to dealers.
The Company has
five
reportable segments consisting of: (i) Agriculture, which designs, produces and sells agricultural equipment (ii) Construction, which designs, produces and sells construction equipment (iii) Commercial and Specialty Vehicles, which designs, produces and sell trucks, commercial vehicles, buses, and specialty vehicles (iv) Powertrain, which produces and sells engines, transmissions and axles for those vehicles and engines for marine and power generation applications; and (v) Financial Services, which provides financial services to the customers of the Company’s products. The Company’s worldwide agricultural equipment, construction equipment, commercial vehicles, powertrain operations as well as corporate functions are collectively referred to as “Industrial Activities”.
The Company was formed as a result of the mergers of Fiat Industrial S.p.A. and its subsidiary CNH Global N.V. with and into CNH Industrial, effective September 29, 2013.
Planned Spin-off of On-Highway Business
On September 3, 2019, the Company announced its intention to separate its "On-Highway" (commercial vehicles and powertrain) and "Off-Highway" (agriculture, construction and specialty vehicles) businesses. The separation is expected to be effected through the spin-off of CNH Industrial N.V.’s equity interest in "On-Highway" to CNH Industrial N.V. shareholders. The proposed spin-off is expected to be completed in early 2021, subject to approval at an Extraordinary General Meeting of shareholders.
Principles of Consolidation and Basis of Presentation
CNH Industrial has prepared the accompanying consolidated financial statements in accordance with accounting principles generally accepted in the United States of America (“U.S. GAAP”). The consolidated financial statements include CNH Industrial N.V. and its consolidated subsidiaries. The consolidated financial statements are expressed in U.S. dollars and, unless otherwise indicated, all financial data set forth in these consolidated financial statements are expressed in U.S. dollars. The consolidated financial statements include the accounts of CNH Industrial’s subsidiaries in which CNH Industrial has a controlling financial interest, and reflect the noncontrolling interests of the minority owners of the subsidiaries that are not fully owned for the periods presented, as applicable. A controlling financial interest may exist based on ownership of a majority of the voting interest of an entity or based on CNH Industrial’s determination that it is the primary beneficiary of a variable interest entity (“VIE”). The primary beneficiary of a VIE is the party that has the power to direct the activities that most significantly impact the economic performance of the entity and the obligation to absorb losses or the right to receive benefits that could potentially be significant to the entity. The Company assesses whether it is the primary beneficiary on an ongoing basis, as prescribed by the accounting guidance on the consolidation of VIEs. The consolidated status of the VIEs with which the Company is involved may change as a result of such reassessments.
Business Combinations
Business combinations are accounted for by applying the acquisition method. Under this method, the consideration transferred in a business combination is measured at fair value, which is calculated as the sum of the acquisition-date fair values of the assets transferred and liabilities assumed by the Company and the equity interests issued in exchange for control of the acquiree. Acquisition-related costs are generally recognized in profit or loss as incurred.
F-10
Use of Estimates in the Preparation of Financial Statements
Revenue Recognition
Revenue is recognized when control of the vehicles, equipment, services or parts has been transferred and the Company’s performance obligations to the customers have been satisfied. Revenue is measured as the amount of consideration the Company expects to receive in exchange for transferring goods or providing services.
The timing of when the Company transfers the goods or services to the customer may differ from the timing of the customer’s payment.
Revenues are stated net of discounts, allowances, settlement discounts and rebates, as well as costs for sales incentive programs, which are determined on the basis of historical costs, country by country, and charged against profit for the period in which the corresponding sales are recognized.
The Company also enters into contracts with multiple performance obligations. For these contracts, the Company allocates revenue from the transaction price to the distinct goods and services in the contract on a relative standalone selling price basis. To the extent the Company sells the goods or services separately in the same market, the standalone selling price is the observable price at which the Company sells the goods or services separately. For all other goods or services, the Company estimates the standalone selling price considering all information reasonably available (including market conditions, entity-specific factors and information about the customer or class of customer).
Sales of goods
The Company has determined that the customers from the sale of vehicles, equipment and parts are generally dealers, distributors and retail customers.
Transfer of control, and thus related revenue recognition, generally corresponds to when the vehicles, equipment and parts are made available to the customer. Therefore, the Company recognizes revenue at a point in time when control is transferred to the customer at a sale price that the Company expects to receive.
For all sales, no significant uncertainty exists surrounding the purchaser’s obligation to pay for vehicles, equipment and parts. The Company records appropriate allowance for credit losses and anticipated returns as required. Fixed payment schedules exist for all sales, but payment terms vary by geographic market and product line.
The cost of incentives, if any, are estimated at the inception of a contract at the amount that is expected to be paid and is recognized as a reduction to revenue at the time of the sale. If a vehicle or equipment contract transaction has multiple performance obligations, the cost of incentives is allocated entirely to vehicle or equipment as the intent of the incentives is to encourage sales of vehicles or equipment. If the estimate of the incentive changes following the sale to the customer, the change in estimate is recognized as an adjustment to revenue in the period of the change. CNH Industrial grants certain sales incentives to support sales of its products to retail customers. At the later of the time of sale or the time an incentive is announced to dealers, CNH Industrial records the estimated impact of sales allowances in the form of dealer and customer incentives as a reduction of revenue. Subsequent adjustments to sales incentive programs related to products/vehicles previously sold are recognized as an adjustment to revenues in the period the adjustment is determinable. The determination of sales allowances requires management to make estimates based upon historical data, estimated future market demand for products, field inventory levels, announced incentive programs, competitive pricing and interest rates, among other things.
With reference to the sales to dealers accompanied by “floor plan” agreements under which the Company offers wholesale financing including “interest-free” financing for specified period of time (which also vary by geographic market and product line), two separate performance obligations exist. The first performance obligation consists of the sale of the equipment/vehicle from Industrial Activities to the dealer. Concurrent with the sale of the equipment/vehicle, Industrial Activities offers to the dealer wholesale financing through loans extended by Financial Services. Industrial Activities compensates Financial Services for the cost of the interest-free period. This cost has been determined to represent a cash sale incentive on the initial sale of the good, and therefore it should be recognized upfront as a reduction of net sales of Industrial Activities. The second performance obligation consists of a credit facility extended by Financial Services to the dealer. The remuneration for this performance obligation is represented by the compensation received from Industrial
F-11
Activities for the period of the interest-free financing and by the interest charged to dealer for the remaining period. This remuneration is recognized by Financial Services over the period of the outstanding exposure.
For parts sales, when the Company provides its customers with a right to return a transferred product, revenue and corresponding cost of sales are recognized for parts that are not expected to be returned. The expected returns are estimated based on an analysis of historical experience. The portion of revenue (and corresponding cost of sales) related to the parts that are expected to be returned is recognized at the end of the return period. The amount received or receivable that is expected to be returned is recognized as a refund liability, representing the obligation to return the customer’s consideration.
Furthermore, at the time of the initial sale, CNH Industrial recognizes a return asset for the right to recover the goods returned by the customer. This asset is initially measured at the former carrying amount of the inventory. At each reporting date, both the refund liability and the return asset are remeasured to record for any revisions to the expected level of returns, as well as any decreases in the value of the returned products.
Rendering of services
Revenues from services provided are primarily comprised of extended warranties and maintenance and repair services and are recognized over the contract period when the costs are incurred, that is when the claims are charged by the dealer. Amounts invoiced to customers for which CNH Industrial receives consideration before the performance is satisfied are recognized as contract liability. These services are either separately-priced or included in the selling price of the vehicle. In the second case, revenue for the services is allocated based on the estimated stand-alone selling price. In the event that the costs expected to be incurred to satisfy the remaining performance obligations exceed the transaction price, an estimated contract loss is recognized.
Shipping and other transportation activities performed as an agent are recognized on a net basis, which is netting the related freight cost against the freight revenue.
Rents and other income on assets sold with a buy-back commitment
Commercial and Specialty Vehicles enters into transactions for the sale of vehicles to some customers with an obligation to repurchase (“buy-back commitment”) the vehicles at the end of a period (“buy-back period”) at the customer’s request. For these types of arrangements, at inception, CNH Industrial assesses whether a significant economic incentive exists for the customer to exercise the option.
If CNH Industrial determines that a significant economic incentive exists for the customer to exercise the buy-back option, the transaction is accounted for as an operating lease. In such case, vehicles are accounted for as Property, plant and equipment because the agreements typically have a long-term buy-back period. The difference between the carrying value (corresponding to the manufacturing cost) and the estimated resale value (net of refurbishing costs) at the end of the buy-back period is depreciated on a straight-line basis over the same period. The initial sale price received is recognized in “Other liabilities” and is comprised of the repurchase value of the vehicle, and the rents to be recognized in the future recorded as contract liability. These rents are determined at the inception of the contract as the difference between the initial sale price and the repurchase price and are recognized as revenue on a straight-line basis over the term of the agreement. At the end of the agreement term, upon exercise of the option, the used vehicles are reclassified from Property, plant and equipment to Inventories. The proceeds from the sale of such vehicles are recognized as Revenues.
If CNH Industrial determines that a significant economic incentive does not exist for the customer to exercise the buy-back option, the transaction is treated as a sale with a variable consideration whose variable component is the buy-back provision accrual. The buy-back provision accrual is the difference between the repurchase price and the estimated market value of the used vehicle at the end of the buy-back period and is recorded only when the repurchase price is greater than the estimated market value of the used vehicle. The buy-back provision accrual is estimated and recognized as a reduction of revenues at the time of the sale. Any subsequent change following such periodic reassessment is recognized as a reduction of revenues at that time.
Finance and interest income
Finance and interest income on retail and other notes receivables and finance leases is recorded using the effective yield method. Deferred costs on the origination of financing receivables are recognized as a reduction in finance revenue over the expected lives of the receivables using the effective yield method. Recognition of income on loans is suspended when management determines that collection of future income is not probable or when an account becomes
120
days delinquent, whichever occurs earlier. Interest accrual is resumed when and if the receivable becomes contractually current and collection becomes probable. Previously suspended income is recognized at that time. The Company applies cash received on nonaccrual financing receivables to first reduce any unrecognized interest and then the recorded investment and any other fees. Receivables are considered past due if the required principal and interest payments have not been received as of the date such payments were due. Delinquency is reported on receivables greater than
30
days past due. Charge-offs of principal amounts of receivables outstanding are deducted from the allowance at the point when it is determined to be probable that all amounts due will not be collected.
Rents and other income on operating leases
Income from operating leases is recognized over the term of the lease on a straight-line basis.
F-12
Sales Allowances
CNH Industrial grants certain sales incentives to support sales of its products to retail customers. The expense for such incentive programs is recorded as a deduction in arriving at the net sales amount at the time of the sale of the product to the dealer. The expense for new programs is accrued at the inception of the program. The amounts of incentives to be paid are estimated based upon historical data, estimated future market demand for products, field inventory levels, announced incentive programs, competitive pricing and interest rates, among other things.
Warranty Costs
Advertising
Research and Development
Research and development costs are expensed as incurred.
Borrowing Costs
Borrowing costs that are directly attributable to the acquisition, construction or production of qualifying assets, which are assets that necessarily take a substantial period of time to get ready for their intended use or sale, are capitalized and amortized over the useful life of the class of assets to which they refer.
All other borrowing costs are expensed when incurred.
Government Grants
Government grants are recognized in the financial statements when there is reasonable assurance that the company concerned will comply with the conditions for receiving such grants and that the grants themselves will be received. Government grants are recognized as income over the periods necessary to match them with the related costs which they are intended to offset.
The benefit of a government loan at a below-market rate of interest is treated as a government grant. The benefit of the below-market rate of interest is measured as the difference between the initial carrying amount of the loan (fair value plus transaction costs) and the proceeds received, and is accounted for in accordance with the policies already used for the recognition of government grants.
Foreign Currency
Certain of CNH Industrial’s non-U.S. subsidiaries and affiliates maintain their books and accounting records using local currency as the functional currency. Assets and liabilities of these non-U.S. subsidiaries are translated into U.S. dollars at period-end exchange rates, and net exchange gains or losses resulting from such translation are included in “Accumulated other comprehensive income (loss)” in the accompanying consolidated balance sheets. Income and expense accounts of these non-U.S. subsidiaries are translated at the average exchange rates for the period. Gains and losses from foreign currency transactions are included in net income in the period during which they arise. Net foreign currency transaction gains and losses are reflected in “Other, net” in the accompanying consolidated statement of operations and also include the cost of hedging instruments. For the years ended
December 31, 2019
,
2018
and
2017
, the Company recorded net losses of
$
155
million
,
$
450
million
and
$
78
million
, respectively. Included in the net losses in
2019
,
2018
and
2017
were charges of
$
71
million
,
$
159
million
and
$
21
million
due to the devaluation of net monetary assets of Argentinian subsidiaries in
2019
,
2018
, and
2017
, as well as the re-measurement charges of
$
5
million
, and
$
27
million
, in
2018
and
2017
, on the Venezuelan bolivar fuerte (“Bs.F., or “bolivars”) rate described below. As described in Note 15: Financial Instruments, the Company uses hedging instruments to mitigate foreign currency risk. Net of gains realized on foreign currency hedging instruments, the Company recorded losses of
$
80
million
,
$
199
million
and
$
140
million
for the three years ended
December 31, 2019
,
2018
and
2017
, respectively.
Venezuela Currency Regulations, Re-measurement and Deconsolidation
In the fourth quarter of 2017, the deterioration of conditions in Venezuela and the persisting restrictive exchange control regulations, which prevent any payments out of the country, resulted in an other-than-temporary lack of exchangeability. Therefore, effective December 31, 2017, CNH Industrial determined that it no longer had the ability to control its Venezuelan operations. As a result, the Company recorded a non-cash pre- and after-tax charge of
$
92
million
to impair and deconsolidate its operations in Venezuela and began reporting
F-13
operating results under the cost method. The pre-tax charge included the write-off of the Company’s investment in Venezuela, including properties and all inter-company balances. The charge also included the reversal through income statement of foreign currency translation losses previously included in Accumulated other comprehensive income. CNH Industrial is no longer including the results of its Venezuelan operations in its Consolidated Financial Statements. If cash were to be received from the Venezuelan legal entities in future periods, income will be recognized. The Company expects the current economic conditions in Venezuela to continue and does not anticipate any payments to be made in the foreseeable future. CNH Industrial’s results of operations in Venezuela for the year ended
December 31, 2019
and
2018
were immaterial as a percentage of both CNH Industrial’s net revenues and operating profit.
Subsequent to the deconsolidation under the voting interest consolidation model, the Company determined that the Venezuelan subsidiaries are considered to be variable interest entities. As the Company does not have the power to direct the activities that most significantly affect the Venezuelan subsidiaries' economic performance, the Company is not the primary beneficiary of the variable interest entities and therefore would not consolidate the entities. Due to the lack of ability to settle U.S. dollar obligations, the Company does not intend to sell into, nor purchase inventory from, the Venezuela entities at this time. Additionally, the Company has no remaining financial commitments to the Venezuelan subsidiaries and therefore believes the exposure to future losses is not material.
Cash and Cash Equivalents
Cash equivalents are highly liquid investments with an original maturity of three months or less. The carrying value of cash equivalents approximates fair value because of the short maturity of these investments.
Restricted Cash
Restricted cash includes principal and interest payments from retail notes, wholesale receivables and commercial revolving accounts receivable owned by the consolidated VIEs that are payable to the VIEs’ investors, and cash pledged as a credit enhancement to the same investors. These amounts are held by depository banks in order to comply with contractual agreements.
Cash Flow Information
All cash flows from the changes in trade accounts and notes receivable are classified as operating activities in the consolidated statements of cash flows as these receivables arise from sales to CNH Industrial’s customers. Cash flows from financing receivables that are related to sales to CNH Industrial’s dealers are also included in operating activities. CNH Industrial’s financing of receivables related to equipment sold by dealers is included in investing activities.
CNH Industrial paid interest of
$
762
million
,
$
807
million
, and
$
896
million
for the years ended
December 31, 2019
,
2018
, and
2017
, respectively. For
2019
,
2018
, and
2017
, the amount includes a charge of
$
27
million
,
$
22
million
, and
$
64
million
, respectively, in connection with the Company’s accelerated debt redemption strategy.
CNH Industrial paid taxes of
$
208
million
,
$
355
million
, and
$
224
million
in
2019
,
2018
, and
2017
, respectively.
Receivables
Receivables are recorded at amortized cost, net of allowances for credit losses and deferred fees and costs.
Periodically, the Company sells or transfers retail notes, wholesale receivables and commercial revolving accounts receivable to funding facilities or in securitization transactions. In accordance with the accounting guidance regarding transfers of financial assets and the consolidation of VIEs, the retail notes, wholesale receivables and commercial revolving accounts receivable sold in securitizations do not qualify as sales and are recorded as secured borrowings with
no
gains or losses recognized at the time of securitization. Receivables associated with these securitization transactions and receivables that the Company has the ability and intent to hold for the foreseeable future are classified as held for investment. The substantial majority of the Company’s receivables, which include unrestricted receivables and restricted receivables for securitization investors, are classified as held for investment.
Allowance for Credit Losses
The allowance for credit losses is the Company’s estimate of probable losses on receivables owned by the Company and consists of two components, depending on whether the receivable has been individually identified as being impaired. The first component of the allowance for credit losses covers the receivables specifically reviewed by management for which the Company has determined it is probable that it will not collect all of the contractual principal and interest. Receivables are individually reviewed for impairment based on, among other items, amounts outstanding, days past due and prior collection history. These receivables are subject to impairment measurement at the loan level based either on the present value of expected future cash flows discounted at the receivables’ effective interest rate or the fair value of the collateral for collateral-dependent receivables.
The second component of the allowance for credit losses covers all receivables that have not been individually reviewed for impairment. The allowance for these receivables is based on aggregated portfolio evaluations, generally by financial product. The allowance for retail credit losses is based on loss forecast models that consider a variety of factors that include, but are not limited to, historical loss experience, collateral value, portfolio balance and delinquency. The allowance for wholesale credit losses is based on loss forecast models that consider
F-14
the same factors as the retail models plus dealer risk ratings. The loss forecast models are updated on a quarterly basis. In addition, qualitative factors that are not fully captured in the loss forecast models, including industry trends, and macroeconomic factors, are considered in the evaluation of the adequacy of the allowance for credit losses. These qualitative factors are subjective and require a degree of management judgment.
Inventories
Inventories are stated at the lower of cost or market. Cost is determined by the first-in, first-out method. The cost of finished goods and work-in-progress includes the cost of raw materials, other direct costs and production overheads.
Property, Plant and Equipment
Property, plant and equipment are stated at cost, less accumulated depreciation. Expenditures for maintenance and repairs are expensed as incurred.
Property, plant and equipment also include vehicles sold with a buy-back commitment, which are recognized under the method described in the paragraph
Revenue Recognition
.
Assets held under capital leases, which the Company assumes substantially all the risks and rewards of ownership, are recognized as assets of the Company at the lower of fair value or present value of the minimum lease payments. The corresponding liability to the lessor is included in the financial statements as debt.
Depreciation is recorded on a straight-line basis over the estimated useful lives of the respective assets as follows:
|
Category
|
Lives
|
|
|
Buildings and improvements
|
10 — 40 years
|
|
|
Plant, machinery and equipment
|
5 — 25 years
|
|
|
Other equipment
|
3 — 10 years
|
|
The following paragraph presents the Company’s policy for leases for which it is a lessee after the adoption of the new accounting standard ASU 2016-02 on January 1, 2019.
Lease policy
A lease is a contract that conveys the right to control the use of an identified asset (the leased asset) for a period of time in exchange for consideration. The lease term determined by the Company comprises the non-cancellable period of lease contract together with both periods covered by an option to extend the lease if the lessee is reasonably certain to exercise that option; and periods covered by an option to terminate the lease if the lessee is reasonably certain not to exercise that option.
For real estate leases, this assessment is based on an analysis by management of all relevant facts and circumstances including the leased asset’s purpose, the economic and practical potential for replacing and any plans that the Company has in place for the future use of the asset.
For lease agreements, we combine lease and non-lease components.
For leases with terms not exceeding twelve months (short-term leases), the Company recognizes the lease payments associated with those leases on a straight-line basis over the lease term as operating expense in the income statement.
For all other leases, the right-of-use asset includes the amount of lease liability recognized, initial direct costs incurred, and lease payments made at or before the commencement date less any lease incentives received. Correspondingly, the Company recognizes a lease liability, measured at the present value of lease payments to be made over the lease term,
discounted using the interest rate implicit in the lease or, if that rate cannot be readily determined, the Company's incremental borrowing rate. The incremental borrowing rate is determined considering macro-economic factors such as the specific interest rate curve based on the relevant currency and term, as well as specific factors contributing to CNH Industrial’s credit spread. The Company primarily uses the incremental borrowing rate as the discount rate for its lease liabilities.
For finance leases, the right-of-use asset is classified within Property, plant and equipment, net and the lease liability, within Debt. Assets held under finance leases, which the Company assumes substantially all the risks and rewards of ownership, are recognized as assets of the Company at the lower of fair value or present value of the minimum lease payments.
In case of operating leases, the right-of-use asset is classified within Other assets and the lease liability, within Other liabilities. After the commencement date, the Company recognizes in profit or loss a single lease cost, calculated so that the remaining cost of the lease is allocated over the remaining lease term on a straight-line basis. In particular, after lease commencement, the lease liability is measured at the present value of any remaining lease payments, discounted by using the rate determined at lease commencement, consistently with the model used to calculate the liability related to the finance lease. Correspondingly, the right-of-use asset is measured as the lease liability adjusted by accrued or prepaid rents (i.e., the aggregate difference between the cash payment and straight-line lease cost), remaining unamortized initial direct costs and lease incentives, and any impairments of the right-of-use asset.
F-15
Financial Services purchases leases and equipment from CNH Industrial dealers and other independent third parties that have leased equipment to retail customers under operating leases. For lease contracts where CNH Industrial acts as a lessor each of its leases is classified as either an operating lease or a finance lease. Leases where a significant portion of the risks and rewards are retained by the lessor are classified as operating leases. A lease is classified as a finance lease if it transfers substantially all the risks and rewards incidental to ownership of an underlying asset to the lessee.
Financial Services’ investment in operating leases is based on the purchase price paid for the equipment. Income from these operating leases is recognized over the term of the lease. The equipment is depreciated on a straight-line basis over the term of the lease to the estimated residual value at lease termination. Residual values are estimated at inception of the lease and are reviewed quarterly. Realization of the residual values is dependent on Financial Services’ future ability to re-market the equipment under then prevailing market conditions. Model changes and updates, as well as market strength and product acceptance, are monitored and adjustments are made to residual values in accordance with the significance of any such changes. Management believes that the estimated residual values are realizable. Expenditures for maintenance and repairs of the applicable equipment are the responsibility of the lessee.
Equipment returned to the Company upon termination of leases and held for subsequent sale or lease is recorded in inventory at the lower of net book value or estimated fair value of the equipment, less cost to sell, and is not depreciated.
Goodwill and Other Intangibles
Goodwill represents the excess of the aggregate purchase price over the fair value of the net assets acquired. Goodwill and indefinite-lived intangible assets are reviewed for impairment at least annually. During
2019
and
2018
, the Company performed its annual impairment review as of December 31 and concluded that there was
no
impairment in either year.
Other intangibles consist primarily of acquired dealer networks, trademarks, product drawings, patents, and software. Other intangibles with indefinite lives principally consist of acquired trademarks which have no legal, regulatory, contractual, competitive, economic, or other factor that limits their useful life. Intangible assets with an indefinite useful life are not amortized. Other intangible assets with definite lives are being amortized on a straight-line basis over
5
to
25
years.
Reference is made to “Note 9: Goodwill and Other Intangibles” for further information regarding goodwill and other intangible assets.
Impairment of Long-Lived Assets, Goodwill and Other Intangible Assets
CNH Industrial evaluates the recoverability of the carrying amount of long-lived assets whenever events or changes in circumstances indicate that the carrying amount of an asset may not be fully recoverable. If circumstances require a long-lived asset to be tested for possible impairment, CNH Industrial compares the carrying amount of an asset to future undiscounted net cash flows expected to be generated by the asset. If the carrying amount of the long-lived asset is not recoverable on an undiscounted cash flow basis, an impairment is recognized to the extent that the carrying amount exceeds its fair value.
Income Taxes
The provision for income taxes is determined using the asset and liability method. CNH Industrial recognizes a current tax liability or asset for the estimated taxes payable or refundable on tax returns for the current year and tax contingencies estimated to be settled with taxing authorities within one year. A deferred tax liability or asset is recognized for the estimated future tax effects attributable to temporary differences and tax attributes. The measurement of current and deferred tax liabilities and assets is based on provisions of enacted tax law. Valuation allowances are recorded to reduce deferred tax assets when it is more likely than not that a tax benefit will not be realized based on available evidence.
Retirement and Postemployment Benefits
Derivatives
CNH Industrial’s policy is to enter into derivative transactions to manage exposures that arise in the normal course of business and not for trading or speculative purposes. CNH Industrial records derivative financial instruments in the consolidated balance sheets as either an asset or a liability measured at fair value. The fair value of CNH Industrial’s foreign exchange derivatives is based on quoted market exchange rates, adjusted for the respective interest rate differentials (premiums or discounts). The fair value of CNH Industrial’s interest rate derivatives is based on discounting expected cash flows, using market interest rates, over the remaining term of the instrument. Changes in the fair value of derivative financial instruments are recognized in current income unless specific hedge accounting criteria
F-16
are met. For derivative financial instruments designated to hedge exposure to changes in the fair value of a recognized asset or liability, the gain or loss is recognized in income in the period of change together with the offsetting loss or gain on the related hedged item. For derivative financial instruments designated to hedge exposure to variable cash flows of a forecasted transaction, the derivative financial instrument’s gain or loss is initially reported in other comprehensive income (loss) and is subsequently reclassified into income when the forecasted transaction affects income. For derivative financial instruments that are not designated as hedges but held as economic hedges, the gain or loss is recognized immediately in income.
For derivative financial instruments designated as hedges, CNH Industrial formally documents the hedging relationship to the hedged item and its risk management strategy for all derivatives designated as hedges. This includes linking all derivatives that are designated as fair value hedges to specific assets and liabilities contained in the consolidated balance sheets and linking cash flow hedges to specific forecasted transactions or variability of cash flow. CNH Industrial assesses the effectiveness of its hedging instruments both at inception and on an ongoing basis. If a derivative is determined not to be highly effective as a hedge, or the underlying hedged transaction is no longer probable of occurring, or the derivative is terminated, the hedge accounting described above is discontinued and the derivative is marked to fair value and recorded in income through the remainder of its term.
Reference is made to “Note 15: Financial Instruments,” for further information regarding CNH Industrial’s use of derivative financial instruments.
Share-Based Compensation Plans
CNH Industrial recognizes all share-based compensation as an expense based on the fair value of each award on the grant date. CNH Industrial recognizes share-based compensation costs on a straight-line basis over the requisite service period for each separately vesting portion of an award.
Earnings per Share
Basic earnings per share is based on the weighted average number of shares outstanding during each period. Diluted earnings per share is based on the weighted average number of shares and dilutive share equivalents outstanding during each period. Unvested performance-based awards are considered outstanding and included in the computation of diluted earnings per share based on the number of shares that would vest if the end of the reporting period were the end of the contingency period.
New Accounting Pronouncements
Adopted
Derivatives and Hedging
In August 2017, the FASB issued ASU 2017-12,
Targeted Improvements to Accounting for Hedging Activities
(“ASU 2017-12”), which amends ASC 815, Derivatives and Hedging. The purpose of this ASU is to better align a company’s risk management activities and financial reporting for hedging relationships, simplify the hedge accounting requirements and improve the disclosures of hedging arrangements. Among other provisions, the new standard (1) requires an entity to present the earnings effect of the hedging instrument in the same income statement line item in which the earnings effect of the hedged item is reported, (2) eliminates the separate measurement and reporting of hedge ineffectiveness and (3) permits an entity to recognize in earnings the initial value of an excluded component under a systematic and rational method over the life of the derivative instrument. The Company adopted ASU 2017-12 on January 1, 2019. The adoption did not have a material impact on our results of operations, financial position and cash flows.
Leases
In February 2016, the FASB issued ASU 2016-02, Leases (Topic 842) (“ASU 2016-02”), which supersedes ASC 840, Leases. Subsequently, the FASB has issued additional ASUs which further clarify this guidance. The ASU's most prominent change is the requirement for lessees to recognize leased assets and liabilities classified as operating leases under the previous standard. The ASU does not significantly change the lessee’s recognition, measurement and presentation of expenses and cash flows from the previous accounting standard. Lessors’ accounting under the ASC is largely unchanged from the previous accounting standard. ASU 2016-02 also will require disclosures designed to give financial statement users information on the amount, timing, and uncertainty of cash flows arising from leases.
CNH Industrial has adopted the new standard effective January 1, 2019, using the modified retrospective approach, without recasting prior periods. CNH Industrial has applied certain practical expedients upon transition, including not to reassess under the new guidance its prior conclusions about lease identification, lease classification and initial direct costs; and, those provided for short-term leases. In such case, the lease payments associated with leases are recognized as expense in the income statement. In addition, the Company has elected not to separate lease and non-lease components.
At
January 1, 2019
, the Company recognized approximately
$
480
million
of right-of-use assets and lease liabilities without transition effect to equity.
F-17
Comprehensive Income
In February 2018, the FASB issued ASU No. 2018-02,
Reclassification of Certain Tax Effects from Accumulated Other Comprehensive Income
(“ASU 2018-02”), which amends ASC 220,
Income Statement - Reporting Comprehensive Income
. In December 2017, the U.S. government enacted the U.S. Tax Act. Included in the provisions of the U.S. Tax Act was a reduction of the corporate income tax rate from
35 percent
to
21 percent
. U.S. GAAP requires that the remeasurement of deferred taxes to the new corporate tax rate occur in the period in which the legislation is enacted with the deferred tax adjustment being recorded in the provision for income taxes, including items for which the tax effects were originally recorded in Other Comprehensive Income (“OCI”). This treatment results in the items in OCI reflecting a disproportionate tax rate, a result often referred to as stranded tax effects. This ASU allows a reclassification from accumulated OCI to retained earnings for stranded tax effects resulting from U.S. Tax Reform. ASU 2018-02 is effective for annual reporting periods beginning after December 15, 2018 including interim periods within those fiscal years. The Company adopted this standard on January 1, 2019, and reclassified
$
65
million
of tax effects from "Accumulated other comprehensive income (loss)" to "Retained earnings" within its Consolidated Balance Sheet.
Changes in Stockholders' Equity and Noncontrolling Interests
In August 2018, the SEC adopted a final rule that amends certain disclosure requirements that have become duplicative, overlapping, or outdated in light of other SEC disclosure requirements, U.S. GAAP, or changes in the information environment. However, the guidance also added requirements for registrants to include in their interim financial statements a reconciliation of changes in stockholders’ equity for each period for which an income statement is required (both year-to-date and quarterly periods). The Company first-time adopted the new interim disclosure requirement in its U.S. GAAP quarterly report for the three months ended March 31, 2019, which had no material impact to the Statement of Changes in Equity.
Not Yet Adopted
Financial Instruments
In June 2016, the FASB issued ASU 2016-13,
Measurement of Credit Losses on Financial Instruments
(“ASU 2016-13”), which establishes ASC 326,
Financial Instruments - Credit Losses
. In November 2018, the Financial Accounting Standards Board (“FASB”) issued ASU 2018-19,
Codification Improvements to Topic 326, Financial Instruments - Credit Losses
(“ASU 2018-19”), which supersedes existing
Measurement of Credit Losses on Financial Instruments
(“ASU 2016-13”). The ASU introduced a new model for recognizing credit losses on financial instruments based on an estimate of current expected credit losses. Additional disclosures about significant estimates and credit quality are also required. ASU 2018-19 is effective for annual periods beginning after December 15, 2019. CNH Industrial will adopt the new standard effective January 1, 2020, using the modified retrospective approach which requires the Company to recognize a cumulative-effect adjustment to the opening balance of retained earnings in the period of adoption, without recasting prior periods. The Company anticipates adoption of this standard will have an immaterial impact to equity at January 1, 2020.
Fair Value Measurement
In August 2018, the FASB issued ASU No. 2018-13,
Disclosure Framework - Changes to the Disclosure Requirements for Fair Value Measurement
, which amends ASC 820,
Fair Value Measurement
. This ASU modifies the disclosure requirements for fair value measurements by removing, modifying, or adding certain disclosures. The effective date is the first quarter of fiscal year 2020. The removed and modified disclosures will be adopted on a retrospective basis and the new disclosures will be adopted on a prospective basis. The Company is currently evaluating the impact the adoption of this standard will have on its consolidated financial statements.
Intangibles - Cloud Computing Arrangements
In August 2018, the FASB issued ASU No. 2018-15,
Customer's Accounting for Implementation Costs Incurred in a Cloud Computing Arrangement
("ASU 2018-15"), which expands upon the guidance set forth in ASU 2015-05,
Customer's Accounting for Fees Paid in a Cloud Computing Arrangement
. ASU 2018-15 aligns the requirements for capitalization of implementation costs in a cloud computing service contract with those requirements for capitalization of implementation costs incurred for an internal-use software license. ASU 2018-15 may be applied prospectively from the date the guidance is first applied or retrospectively.
ASU 2018-15 is effective for annual periods beginning after December 15, 2019, including interim periods within those fiscal years, and early adoption is permitted. The Company expects to adopt the ASU on a prospective basis, and, as such, this standard is not expected to have a material impact at adoption.
F-18
Related Party Guidance for Variable Interest Entities
In October 2018, the FASB issued ASU No. 2018-17,
Targeted Improvements to Related Party Guidance for Variable Interest Entities
("ASU 2018-17"), which expands the application of a specific private company alternative related to VIEs and changes the guidance for determining whether a decision-making fee is a variable interest. Under the new guidance, to determine whether decision-making fees represent a variable interest, an entity considers indirect interests held through related parties under common control on a proportionate basis, rather than in their entirety. ASU 2018-17 is effective for annual periods beginning after December 15, 2019, including interim periods within those fiscal years, and early adoption is permitted in any interim period. ASU 2018-17 is required to be applied retrospectively from the date the guidance is first applied. The Company does not expect the adoption of this standard to have a material impact on its consolidated financial statements.
Defined Benefit Plans Disclosure
In August 2018, the FASB issued ASU 2018-14,
Compensation - Retirement Benefits - Defined Benefit Plans - General: Changes to the Disclosure Requirements for Defined Benefit Plans
("ASU 2018-14"), which modifies the disclosure requirements for employers that sponsor defined benefit pension or other postretirement plans by removing and adding certain disclosures for these plans. ASU 2018-14 is effective for annual periods ending after December 15, 2020. Early adoption is permitted. The Company is currently evaluating the impact of adoption of this ASU on its related disclosures.
Simplifying the Accounting for Income Taxes
In December 2019, the FASB issued ASU 2019-12,
Simplifying the Accounting for Income Taxes
(“ASU 2019-12”). This ASU eliminates certain exceptions to the general principles in ASC 740,
Income Taxes
. Specifically, it eliminates the exception to (1) the incremental approach for intraperiod tax allocation when there is a loss from continuing operations, and income or a gain from other items; (2) the requirement to recognize a deferred tax liability for equity method investments when a foreign subsidiary becomes an equity method investment; (3) the ability not to recognize a deferred tax liability for a foreign subsidiary when a foreign equity method investment becomes a subsidiary; and (4) the general methodology for calculating income taxes in an interim period when a year-to-date loss exceeds the anticipated loss for the year. ASU 2019-12 will be effective for the annual periods beginning after December 15, 2020, including interim periods within those fiscal years. Early adoption is permitted. The Company is evaluating the impact of the adoption of this standard on its consolidated financial statements.
Codification Improvements to Topic 326, Financial Instruments – Credit Losses, Topic 815, Derivatives and Hedging, and Topic 825, Financial Instruments
In April 2019, the FASB issued ASU 2019-04, Codification Improvements to Topic 326, Financial Instruments - Credit Losses, Topic 815, Derivatives and Hedging, and Topic 825, Financial Instruments, which makes targeted changes to standards on credit losses, hedging, and recognizing and measuring financial instruments to clarify them and address implementation issues. The amendments clarify the scope of the credit losses standard and address issues related to accrued interest receivable balances, recoveries, variable interest rates and prepayments, among other things. On recognizing and measuring financial instruments, the amendments address the scope of the guidance, the requirement for remeasurement under ASC 820 when using the measurement alternative, certain disclosure requirements and which equity securities have to be remeasured at historical exchange rates. CNH Industrial will adopt the amendments related to ASU 2016-13, ASU 2017-12 and ASU 2016-01 at January 1, 2020. The Company does not expect the adoption of this standard to have a material impact on its consolidated financial statements.
F-19
The following tables summarize previously reported
revenues for the years ended
December 31, 2019
,
2018
and
2017
:
|
Year Ended December 31,
|
||||||||||||
|
2019
|
2018
|
2017
|
||||||||||
|
(in millions)
|
||||||||||||
|
Agriculture
|
$
|
|
|
$
|
|
|
$
|
|
|
|||
|
Construction
|
|
|
|
|
|
|
||||||
|
Commercial and Specialty Vehicles
|
|
|
|
|
|
|
||||||
|
Powertrain
|
|
|
|
|
|
|
||||||
|
Eliminations and Other
|
(
|
)
|
(
|
)
|
(
|
)
|
||||||
|
Total Industrial Activities
|
|
|
|
|
|
|
||||||
|
Financial Services
|
|
|
|
|
|
|
||||||
|
Eliminations and Other
|
(
|
)
|
(
|
)
|
(
|
)
|
||||||
|
Total Revenues
|
$
|
|
|
$
|
|
|
$
|
|
|
|||
|
Year Ended December 31,
|
|||||||||||||
|
2019
|
2018
|
2017
|
|||||||||||
|
(in millions)
|
|||||||||||||
|
Revenues from:
|
|||||||||||||
|
Sales of goods
|
$
|
|
|
$
|
|
|
$
|
|
|
||||
|
Rendering of services and other revenues
|
|
|
|
|
|
|
|||||||
|
Rents on assets sold with a buy-back commitment
|
|
|
|
|
|
|
|||||||
|
Revenues from sales of goods and services
|
$
|
|
|
$
|
|
|
$
|
|
|
||||
|
Finance and interest income
|
|
|
|
|
|
|
|||||||
|
Rents and other income on operating lease
|
|
|
|
|
|
|
|||||||
|
Finance, interest and other income
|
$
|
|
|
$
|
|
|
$
|
|
|
||||
|
Total Revenues
|
$
|
|
|
$
|
|
|
$
|
|
|
||||
Contract liabilities recorded in Other liabilities were
$
1,236
million,
$
1,368
million
and
$
1,498
million
at
December 31, 2019
,
2018
and
2017
, respectively. Contract liabilities primarily relate to extended warranties/maintenance and repair contracts, and transactions for the sale of vehicles with a buy-back commitment. During the year ended
December 31, 2019
,
2018
and
2017
, revenues included
$
508
million
,
$
544
million
and
$
496
million
, respectively, relating to contract liabilities outstanding at the beginning of each period.
As of
December 31, 2019
, the aggregate amount of the transaction price allocated to remaining performance obligations was approximately
$
2.0
billion (approximately
$
2.2
billion
at
December 31, 2018
). CNH Industrial expects to recognize revenue on approximately
39
%
and
84
%
of the remaining performance obligations over the next
12
and
36
months, respectively (approximately
40
%
and
84
%
as of
December 31, 2018
, respectively) with the remaining recognized thereafter.
Trade Receivables, net
As of
December 31, 2019
and
2018
, the Company had trade receivables of
$
416
million
and
$
399
million
, respectively. Trade receivables are shown net of allowances for doubtful accounts of
$
60
million
and
$
82
million
at
December 31, 2019
and
2018
respectively. Trade accounts have significant concentrations of credit risk in the Agriculture, Construction and Commercial and Specialty Vehicles segments. There is not a disproportionate concentration of credit risk in any geographic area.
The Industrial Activities businesses sell a significant portion of their trade receivables to Financial Services and provide compensation to Financial Services at approximate market interest rates.
F-20
Financing Receivables, net
A summary of financing receivables included in the consolidated balance sheets as of
December 31, 2019
and
2018
is as follows:
|
2019
|
2018
|
|||||||
|
(in millions)
|
||||||||
|
Retail
|
$
|
|
|
$
|
|
|
||
|
Wholesale
|
|
|
|
|
||||
|
Other
|
|
|
|
|
||||
|
Total
|
$
|
|
|
$
|
|
|
||
CNH Industrial provides and administers financing for retail purchases of new and used equipment sold through its dealer network. The terms of retail and other notes and finance leases generally range from
two
to
six years
, and interest rates on retail and other notes and finance leases vary depending on prevailing market interest rates and certain incentive programs offered by Industrial Activities.
Wholesale receivables arise primarily from the sale of goods to dealers and distributors and, to a lesser extent, the financing of dealer operations. Under the standard terms of the wholesale receivable agreements, these receivables typically have “interest-free” periods of up to
twelve months
and stated original maturities of up to
twenty-four
months, with repayment accelerated upon the sale of the underlying equipment by the dealer. During the “interest free” period, Financial Services is compensated by Industrial Activities for the difference between market interest rates and the amount paid by the dealer. After the expiration of any “interest-free” period, interest is charged to dealers on outstanding balances until CNH Industrial receives payment in full. The “interest-free” periods are determined based on the type of equipment sold and the time of year of the sale. Interest rates are set based on market factors and based on Euribor or the equivalent financial market rate (e.g. FHBR, Finance House Base Rate for UK). CNH Industrial evaluates and assesses dealers on an ongoing basis as to their credit worthiness. CNH Industrial may be obligated to repurchase the dealer’s equipment upon cancellation or termination of the dealer’s contract for such causes as change in ownership, closeout of the business, or default. There were
no
significant losses in
2019
,
2018
or
2017
relating to the termination of dealer contracts.
Financing receivables generally have significant concentrations of credit risk in the agriculture, construction and truck industries. On a geographic basis, there is not a disproportionate concentration of credit risk in any area. The Company typically retains as collateral a security interest in the equipment associated with retail notes, wholesale notes and finance leases.
As part of the Company’s overall funding strategy, the Company periodically transfers certain receivables into VIEs that are special purposes entities (“SPEs”) as part of its asset-back securitization program and are not available to the Company’s general creditors. Please see the securitization discussion at the end of this footnote.
Contractual maturities of financing receivables as of
December 31, 2019
are as follows:
|
Amount
|
||||
|
(in millions)
|
||||
|
2020
|
$
|
|
|
|
|
2021
|
|
|
||
|
2022
|
|
|
||
|
2023
|
|
|
||
|
2024
|
|
|
||
|
2025 and thereafter
|
|
|
||
|
Total
|
$
|
|
|
|
It has been the Company’s experience that substantial portions of retail receivables are repaid before their contractual maturity dates. As a result, the above table should not be regarded as a forecast of future cash collections.
Past due balances of financing receivables still accruing finance income represent the total balance held (principal plus accrued interest) with any payment amounts greater than
30
days or more past the contractual payment due date. Non-performing financing receivables represent loans for which the Company has ceased accruing finance income. These receivables are generally
120
days delinquent. Finance income for non-performing receivables is recognized on a cash basis. Accrual of finance income is resumed when the receivable becomes contractually current and collections are reasonably assured.
F-21
The aging of financing receivables as of
December 31, 2019
and
2018
is as follows (in millions):
|
2019
|
|||||||||||||||||||||||||||||||||
|
31-60 Days
Past Due
|
61-90 Days
Past Due
|
Greater Than
90 Days
|
Total Past
Due
|
Current
|
Total
Performing
|
Non
Performing
|
Total
|
||||||||||||||||||||||||||
|
Retail
|
|||||||||||||||||||||||||||||||||
|
North America
|
$
|
|
|
$
|
|
|
$
|
|
|
$
|
|
|
$
|
|
|
$
|
|
|
$
|
|
|
$
|
|
|
|||||||||
|
Europe
|
|
|
|
|
|
|
|
|
|
|
|
|
|
|
|
|
|||||||||||||||||
|
South America
|
|
|
|
|
|
|
|
|
|
|
|
|
|
|
|
|
|||||||||||||||||
|
Rest of World
|
|
|
|
|
|
|
|
|
|
|
|
|
|
|
|
|
|||||||||||||||||
|
Total Retail
|
$
|
|
|
$
|
|
|
$
|
|
|
$
|
|
|
$
|
|
|
$
|
|
|
$
|
|
|
$
|
|
|
|||||||||
|
Wholesale
|
|||||||||||||||||||||||||||||||||
|
North America
|
$
|
|
|
$
|
|
|
$
|
|
|
$
|
|
|
$
|
|
|
$
|
|
|
$
|
|
|
$
|
|
|
|||||||||
|
Europe
|
|
|
|
|
|
|
|
|
|
|
|
|
|
|
|
|
|||||||||||||||||
|
South America
|
|
|
|
|
|
|
|
|
|
|
|
|
|
|
|
|
|||||||||||||||||
|
Rest of World
|
|
|
|
|
$
|
|
|
|
|
|
|
|
|
|
|
|
|
||||||||||||||||
|
Total Wholesale
|
$
|
|
|
$
|
|
|
$
|
|
|
$
|
|
|
$
|
|
|
$
|
|
|
$
|
|
|
$
|
|
|
|||||||||
|
2018
|
|||||||||||||||||||||||||||||||||
|
31-60 Days
Past Due
|
61-90 Days
Past Due
|
Greater Than
90 Days
|
Total Past
Due
|
Current
|
Total
Performing
|
Non
Performing
|
Total
|
||||||||||||||||||||||||||
|
Retail
|
|||||||||||||||||||||||||||||||||
|
North America
|
$
|
|
|
$
|
|
|
$
|
|
|
$
|
|
|
$
|
|
|
$
|
|
|
$
|
|
|
$
|
|
|
|||||||||
|
Europe
|
|
|
|
|
|
|
|
|
|
|
|
|
|
|
|
|
|||||||||||||||||
|
South America
|
|
|
|
|
|
|
|
|
|
|
|
|
|
|
|
|
|||||||||||||||||
|
Rest of World
|
|
|
|
|
|
|
|
|
|
|
|
|
|
|
|
|
|||||||||||||||||
|
Total Retail
|
$
|
|
|
$
|
|
|
$
|
|
|
$
|
|
|
$
|
|
|
$
|
|
|
$
|
|
|
$
|
|
|
|||||||||
|
Wholesale
|
|||||||||||||||||||||||||||||||||
|
North America
|
$
|
|
|
$
|
|
|
$
|
|
|
$
|
|
|
$
|
|
|
$
|
|
|
$
|
|
|
$
|
|
|
|||||||||
|
Europe
|
|
|
|
|
|
|
|
|
|
|
|
|
|
|
|
|
|||||||||||||||||
|
South America
|
|
|
|
|
|
|
|
|
|
|
|
|
|
|
|
|
|||||||||||||||||
|
Rest of World
|
|
|
|
|
|
|
|
|
|
|
|
|
|
|
|
|
|||||||||||||||||
|
Total Wholesale
|
$
|
|
|
$
|
|
|
$
|
|
|
$
|
|
|
$
|
|
|
$
|
|
|
$
|
|
|
$
|
|
|
|||||||||
Allowance for credit losses activity for the three years ended
December 31, 2019
,
2018
and
2017
is as follows (in millions):
|
December 31, 2019
|
||||||||
|
Retail
|
Wholesale
|
|||||||
|
Opening balance
|
$
|
|
|
$
|
|
|
||
|
Provision
|
|
|
|
|
||||
|
Charge-offs, net of recoveries
|
(
|
)
|
(
|
)
|
||||
|
Foreign currency translation and other
|
(
|
)
|
|
|
||||
|
Ending balance
|
|
|
|
|
||||
|
Ending balance: Individually evaluated for impairment
|
|
|
|
|
||||
|
Ending balance: Collectively evaluated for impairment
|
|
|
|
|
||||
|
Receivables:
|
||||||||
|
Ending balance
|
|
|
|
|
||||
|
Ending balance: Individually evaluated for impairment
|
|
|
|
|
||||
|
Ending balance: Collectively evaluated for impairment
|
$
|
|
|
$
|
|
|
||
F-22
|
December 31, 2018
|
||||||||
|
Retail
|
Wholesale
|
|||||||
|
Opening balance
|
$
|
|
|
$
|
|
|
||
|
Provision
|
|
|
(
|
)
|
||||
|
Charge-offs, net of recoveries
|
(
|
)
|
(
|
)
|
||||
|
Foreign currency translation and other
|
(
|
)
|
(
|
)
|
||||
|
Ending balance
|
|
|
|
|
||||
|
Ending balance: Individually evaluated for impairment
|
|
|
|
|
||||
|
Ending balance: Collectively evaluated for impairment
|
|
|
|
|
||||
|
Receivables:
|
||||||||
|
Ending balance
|
|
|
|
|
||||
|
Ending balance: Individually evaluated for impairment
|
|
|
|
|
||||
|
Ending balance: Collectively evaluated for impairment
|
$
|
|
|
$
|
|
|
||
|
December 31, 2017
|
||||||||
|
Retail
|
Wholesale
|
|||||||
|
Opening balance
|
$
|
|
|
$
|
|
|
||
|
Provision
|
|
|
|
|
||||
|
Charge-offs, net of recoveries
|
(
|
)
|
(
|
)
|
||||
|
Foreign currency translation and other
|
|
|
|
|
||||
|
Ending balance
|
|
|
|
|
||||
|
Ending balance: Individually evaluated for impairment
|
|
|
|
|
||||
|
Ending balance: Collectively evaluated for impairment
|
|
|
|
|
||||
|
Receivables:
|
||||||||
|
Ending balance
|
|
|
|
|
||||
|
Ending balance: Individually evaluated for impairment
|
|
|
|
|
||||
|
Ending balance: Collectively evaluated for impairment
|
$
|
|
|
$
|
|
|
||
Financing receivables are considered impaired when it is probable the Company will be unable to collect all amounts due according to the contractual terms. Receivables reviewed for impairment generally include those that are either past due, have provided bankruptcy notification, or require significant collection efforts. Impaired receivables are generally classified as non-performing.
F-23
|
2019
|
2018
|
|||||||||||||||||||||||||||||||
|
Recorded
Investment
|
Unpaid
Principal
Balance
|
Related
Allowance
|
Average
Investment
|
Recorded
Investment
|
Unpaid
Principal
Balance
|
Related
Allowance
|
Average
Investment
|
|||||||||||||||||||||||||
|
(in millions)
|
||||||||||||||||||||||||||||||||
|
With an allowance recorded
|
||||||||||||||||||||||||||||||||
|
Retail
|
||||||||||||||||||||||||||||||||
|
North America
|
$
|
|
|
$
|
|
|
$
|
|
|
$
|
|
|
$
|
|
|
$
|
|
|
$
|
|
|
$
|
|
|
||||||||
|
Europe
|
$
|
|
|
$
|
|
|
$
|
|
|
$
|
|
|
$
|
|
|
$
|
|
|
$
|
|
|
$
|
|
|
||||||||
|
South America
|
$
|
|
|
$
|
|
|
$
|
|
|
$
|
|
|
$
|
|
|
$
|
|
|
$
|
|
|
$
|
|
|
||||||||
|
Rest of World
|
$
|
|
|
$
|
|
|
$
|
|
|
$
|
|
|
$
|
|
|
$
|
|
|
$
|
|
|
$
|
|
|
||||||||
|
Wholesale
|
||||||||||||||||||||||||||||||||
|
North America
|
$
|
|
|
$
|
|
|
$
|
|
|
$
|
|
|
$
|
|
|
$
|
|
|
$
|
|
|
$
|
|
|
||||||||
|
Europe
|
$
|
|
|
$
|
|
|
$
|
|
|
$
|
|
|
$
|
|
|
$
|
|
|
$
|
|
|
$
|
|
|
||||||||
|
South America
|
$
|
|
|
$
|
|
|
$
|
|
|
$
|
|
|
$
|
|
|
$
|
|
|
$
|
|
|
$
|
|
|
||||||||
|
Rest of World
|
$
|
|
|
$
|
|
|
$
|
|
|
$
|
|
|
$
|
|
|
$
|
|
|
$
|
|
|
$
|
|
|
||||||||
|
Total
|
||||||||||||||||||||||||||||||||
|
Retail
|
$
|
|
|
$
|
|
|
$
|
|
|
$
|
|
|
$
|
|
|
$
|
|
|
$
|
|
|
$
|
|
|
||||||||
|
Wholesale
|
$
|
|
|
$
|
|
|
$
|
|
|
$
|
|
|
$
|
|
|
$
|
|
|
$
|
|
|
$
|
|
|
||||||||
Troubled Debt Restructurings
A restructuring of a receivable constitutes a troubled debt restructuring (“TDR”) when the lender grants a concession it would not otherwise consider to a borrower that is experiencing financial difficulties. As a collateral based lender, CNH Industrial typically will repossess collateral in lieu of restructuring receivables. As such, for retail receivables, concessions are typically provided based on bankruptcy court proceedings. For wholesale receivables, concessions granted may include extended contract maturities, inclusion of interest-only periods, modification of a contractual interest rate to a below market interest rate and waiving of interest and principal.
TDRs are reviewed along with other receivables as part of management’s ongoing evaluation of the adequacy of the allowance for credit losses. The allowance for credit losses attributable to TDRs is based on the most probable source of repayment, which is normally the liquidation of the collateral. In determining collateral value, the Company estimates the current fair market value of the equipment collateral and considers credit enhancements such as additional collateral and third-party guarantees.
Before removing a receivable from TDR classification, a review of the borrower is conducted. If concerns exist about the future ability of the borrower to meet its obligations based on a credit review, the TDR classification is not removed from the receivable.
As of
December 31, 2019
, the Company had
279
retail and finance lease contracts classified as TDRs in North America where a court has determined the concession. The pre-modification value of these contracts was
$
10
million
and the post-modification value was
$
9
million
. Additionally, the Company had
323
accounts with a balance of
$
15
million
in North America undergoing bankruptcy proceedings where a concession has not yet been determined. As of
December 31, 2018
, the Company had
254
retail and finance lease contracts classified as TDRs in North America where a court has determined the concession. The pre-modification value of these contracts was
$
8
million
and the post-modification value was
$
7
million
. Additionally, the Company had
371
accounts with a balance of
$
17
million
in North America undergoing bankruptcy proceedings where a concession has not yet been determined. As the outcome of the bankruptcy cases is determined by the court based on available assets, subsequent re-defaults are unusual and were not material for retail and finance lease contracts that were modified in a TDR during the previous twelve months ended
December 31, 2019
and
2018
.
As of December 31, 2019, the Company had retail and finance lease receivable contracts classified as TDRs in Europe. The pre-modification value was
$
87
million
and the post-modification value was
$
80
million
. Subsequent re-defaults were not material for retail and finance lease receivable contracts that were modified in a TDR during the previous twelve months ended December 31, 2019.
As of
December 31, 2019
and
2018
, CNH Industrial's wholesale TDRs were immaterial.
Transfers of Financial Assets
The Company transfers a number of its financing receivables to securitization programs or factoring transactions.
A securitization transaction entails the sale of a portfolio of receivables to a securitization vehicle. This SPE finances the purchase of the receivables by issuing asset-backed securities (i.e. securities whose repayment and interest flow depend upon the cash flow generated by the portfolio). SPEs utilized in securitizations differ from other entities included in the Company’s consolidated financial statements
F-24
because the assets they hold are legally isolated. For bankruptcy analysis purposes, the Company has sold the receivables to the SPEs in a true sale and the SPEs are separate legal entities. Upon transfer of the receivables to the SPEs, the receivables and certain cash flows derived from them become restricted for use in meeting obligations to the SPEs creditors. The SPEs have ownership of cash balances that also have restrictions for the benefit of the SPEs’ investors. The Company’s interests in the SPEs’ receivables are subordinate to the interests of third-party investors. None of the receivables that are directly or indirectly sold or transferred in any of these transactions are available to pay the Company’s creditors until all obligations of the SPE have been fulfilled.
These trusts were determined to be VIEs and, consequently, the Company has consolidated these trusts. In its role as servicer, the Company has the power to direct the trusts’ activities. Through its retained interests, the Company has an obligation to absorb certain losses or the right to receive certain benefits that could potentially be significant to the trusts.
No recourse provisions exist that allow holders of the asset-backed securities issued by the trusts to return those securities to the Company, although the Company provides customary representations and warranties that could give rise to an obligation to repurchase from the trusts any receivables for which there is a breach of the representations and warranties. Moreover, the Company does not guarantee any securities issued by the trusts. The trusts have a limited life and generally terminate upon final distribution of amounts owed to investors or upon exercise of a cleanup-call option by the Company in its role as servicer.
Furthermore, factoring transactions may be either with recourse or without recourse; certain without recourse transfers include deferred payment clauses (for example, when the payment by the factor of a minor part of the purchase price is dependent on the total amount collected from the receivables), requiring first loss cover, meaning that the transferor takes priority participation in the losses, or require a significant exposure to the cash flows arising from the transferred receivables to be retained. These types of transactions do not qualify for the derecognition of the assets since the risks and rewards connected with collection are not substantially transferred, and accordingly the Company continues to recognize the receivables transferred by this means in its balance sheet and a financial liability of the same amount under asset-backed financing.
At
December 31, 2019
and
2018
, the carrying amount of such restricted receivables included in financing receivables above are the following (in millions):
|
2019
|
2018
|
|||||||
|
Retail note and finance lease receivables
|
$
|
|
|
$
|
|
|
||
|
Wholesale receivables
|
|
|
|
|
||||
|
Total
|
$
|
|
|
$
|
|
|
||
F-25
Inventories (stated at the lower of cost or market, cost being determined on a FIFO basis) as of
December 31, 2019
and
2018
consist of the following:
|
2019
|
2018
|
|||||||
|
(in millions)
|
||||||||
|
Raw materials
|
$
|
|
|
$
|
|
|
||
|
Work-in-process
|
|
|
|
|
||||
|
Finished goods
|
|
|
|
|
||||
|
Total Inventories
|
$
|
|
|
$
|
|
|
||
A summary of property, plant and equipment as of
December 31, 2019
and
2018
is as follows:
|
2019
|
2018
|
|||||||
|
(in millions)
|
||||||||
|
Land and industrial buildings
|
$
|
|
|
$
|
|
|
||
|
Plant, machinery and equipment
|
|
|
|
|
||||
|
Assets sold with buy-back commitment
|
|
|
|
|
||||
|
Construction in progress
|
|
|
|
|
||||
|
Other
|
|
|
|
|
||||
|
Gross property, plant and equipment
|
|
|
|
|
||||
|
Accumulated depreciation
|
(
|
)
|
(
|
)
|
||||
|
Net property, plant and equipment
|
$
|
|
|
$
|
|
|
||
Property, plant and equipment recorded under capital leases were immaterial as of
December 31, 2019
and
2018
.
Depreciation expense on the above property, plant and equipment totaled
$
853
million
,
$
965
million
, and
$
929
million
for the years ended
December 31, 2019
,
2018
, and
2017
, respectively. Excluding depreciation for assets sold with buy-back commitments, depreciation expenses totaled
$
548
million
,
$
587
million
, and
$
610
million
for the years ended
December 31, 2019
,
2018
, and
2017
, respectively.
Commercial and Specialty Vehicles recognized an impairment loss on new and used vehicles of
$
86
million
,
$
76
million
and
$
86
million
on assets sold with a buy-back commitment for the years ended
December 31, 2019
,
2018
, and
2017
, respectively. The losses are recognized in “Cost of goods sold.”
F-26
A summary of investments in unconsolidated subsidiaries and affiliates as of
December 31, 2019
and
2018
is as follows:
|
2019
|
2018
|
|||||||
|
(in millions)
|
||||||||
|
Equity method
|
$
|
|
|
$
|
|
|
||
|
Cost method
|
|
|
|
|
||||
|
Total
|
$
|
|
|
$
|
|
|
||
On September 3, 2019, CNH Industrial announced a strategic and exclusive Heavy-Duty Truck partnership with Nikola Corporation, a U.S. based leader in fuel cell truck technology. In this context, CNH Industrial made an initial subscription to Nikola's share capital (approximately
2.5
%
shareholding) through a cash contribution of
$
50
million
and an in-kind contribution of
$
50
million
, granting Nikola access to certain Iveco technology (reported as revenue). The investment in Nikola is accounted for using the cost method and is expected to grow to reflect an additional
$
150
million
of contributions (
$
50
million
of cash and
$
100
million
in services).
A summary of the combined results of operations and financial position as reported by the investees that CNH Industrial accounts for using the equity method is as follows:
|
For The Years Ended December 31,
|
||||||||||||
|
2019
|
2018
|
2017
|
||||||||||
|
(in millions)
|
||||||||||||
|
Net revenue
|
$
|
|
|
$
|
|
|
$
|
|
|
|||
|
Income before taxes
|
$
|
|
|
$
|
|
|
$
|
|
|
|||
|
Net income
|
$
|
|
|
$
|
|
|
$
|
|
|
|||
|
As of December 31,
|
||||||||
|
2019
|
2018
|
|||||||
|
(in millions)
|
||||||||
|
Total Assets
|
$
|
|
|
$
|
|
|
||
|
Total Liabilities
|
$
|
|
|
$
|
|
|
||
|
Total Equity
|
$
|
|
|
$
|
|
|
||
Lessee
The Company has mainly operating lease contracts for buildings, plant and machinery, vehicles, IT equipment and machinery.
Leases with a term of 12 months or less are not recorded in the balance sheet. The Company recognizes lease expense of
$
17
million
for the year ended
December 31, 2019
for these leases on a straight-line basis over the lease term.
For the year ended
December 31, 2019
, the Company incurred operating lease expenses of
$
162
million
.
At
December 31, 2019
, the Company has recorded approximately
$
450
million
of a right-of-use asset and
$
449
million
of lease liability included in Other Assets and Other Liabilities, respectively.
During the year ended
December 31, 2019
, leased assets obtained in exchange for operating lease obligations were
$
117
million
. The operating cash outflow for amounts included in the measurement of operating lease obligations was
$
162
million
.
At
December 31, 2019
, the weighted average remaining lease term (calculated on the basis of the remaining lease term and the lease liability balance for each lease) and the weighted average discount rate for operating leases were
6.9
years
and
3.4
%
, respectively.
F-27
Future minimum lease payments under non-cancellable leases as of December 31, 2019 were as follows:
|
Operating Leases
|
($ million)
|
|||
|
2020
|
$
|
|
|
|
|
2021
|
|
|
||
|
2022
|
|
|
||
|
2023
|
|
|
||
|
2024
|
|
|
||
|
2025 and thereafter
|
|
|
||
|
Total future minimum lease payments
|
$
|
|
|
|
|
Less: Interest
|
(
|
)
|
||
|
Total
|
$
|
|
|
|
Lessor
The Company, primarily through its Financial Services segment, leases equipment and vehicles to retail customers under operating leases. Our leases typically have terms of
3
to
5
years with options available for the lessee to purchase the equipment at the lease term date. Revenue for non-lease components are accounted for separately.
A summary of equipment on operating leases as of
December 31, 2019
, and
2018
is as follows:
|
2019
|
2018
|
|||||||
|
(in millions)
|
||||||||
|
Equipment on operating leases
|
$
|
|
|
$
|
|
|
||
|
Accumulated depreciation
|
(
|
)
|
(
|
)
|
||||
|
Net equipment on operating leases
|
$
|
|
|
$
|
|
|
||
Depreciation expense on equipment on operating leases is recorded in "Other, net" and amounted to
$
250
million
,
$
256
million
and
$
305
million
for the years ended
December 31, 2019
,
2018
and
2017
, respectively.
The following table sets out a maturity analysis of operating lease payments, showing the undiscounted lease payments to be received after the reporting date:
|
Amount
|
||||
|
(in millions)
|
||||
|
2020
|
$
|
|
|
|
|
2021
|
|
|
||
|
2022
|
|
|
||
|
2023
|
|
|
||
|
2024
|
|
|||
|
2025 and thereafter
|
|
|
||
|
Total undiscounted lease payments
|
$
|
|
|
|
F-28
The following table sets out a maturity analysis of finance lease payments, showing the undiscounted lease payments to be received after the reporting date:
|
Amount
|
||||
|
(in millions)
|
||||
|
2020
|
$
|
|
|
|
|
2021
|
|
|
||
|
2022
|
|
|
||
|
2023
|
|
|
||
|
2024
|
|
|||
|
2025 and thereafter
|
|
|
||
|
Total undiscounted lease payments
|
$
|
|
|
|
|
Unearned Finance Income
|
(
|
)
|
||
|
Present Value of Future minimum lease payments
|
$
|
|
|
|
Changes in the carrying amount of goodwill, for the years ended
December 31, 2019
and
2018
are as follows:
|
Agriculture
|
Construction
|
Commercial & Specialty Vehicles
|
Powertrain
|
Financial
Services
|
Total
|
|||||||||||||||||||
|
(in millions)
|
||||||||||||||||||||||||
|
Balance at January 1, 2018
|
$
|
|
|
$
|
|
|
$
|
|
|
$
|
|
|
$
|
|
|
$
|
|
|
||||||
|
Impact of foreign exchange and other
|
(
|
)
|
(
|
)
|
(
|
)
|
|
|
(
|
)
|
(
|
)
|
||||||||||||
|
Balance at December 31, 2018
|
$
|
|
|
|
$
|
|
|
|
$
|
|
|
|
$
|
|
|
|
$
|
|
|
|
$
|
|
|
|
|
Impact of foreign exchange and other
|
|
|
|
|
(
|
)
|
|
|
|
|
|
|
||||||||||||
|
Acquisitions
|
|
|
|
|
|
|
|
|
|
|
|
|
||||||||||||
|
Balance at December 31, 2019
|
$
|
|
|
|
$
|
|
|
|
$
|
|
|
|
$
|
|
|
|
$
|
|
|
|
$
|
|
|
|
Goodwill and other indefinite-lived intangible assets are tested for impairment annually or more frequently if a triggering event occurs. In
2019
and
2018
, CNH Industrial performed its annual impairment review as of December 31.
Impairment testing for goodwill is done at a reporting unit level. Under the goodwill impairment test, CNH Industrial’s estimate of the fair value of the reporting unit is compared with its carrying value. An impairment charge should be recognized for the amount by which the carrying amount exceeds the reporting unit’s fair value; however, the loss recognized should not exceed the total amount of goodwill allocated to that reporting unit. CNH Industrial has the option to perform the qualitative assessment for a reporting unit to determine if the quantitative impairment test is necessary.
The vast majority of goodwill, representing approximately
97
%
of the total, as of
December 31, 2019
, related to Agriculture (
68
%
), Construction (
23
%
) and Financial Services (
6
%
) and as such, the impairment testing of these reporting units is discussed in detail below.
The carrying values for each reporting unit include material allocations of the Company’s assets and liabilities and costs and expenses that are common to all of the reporting units. CNH Industrial believes that the basis for such allocations has been consistently applied and is reasonable.
CNH Industrial determines the fair value of its reporting units using multiple valuation methodologies, relying largely on an income approach but also incorporating value indicators from a market approach, with reference to the reporting units with the most significant allocated goodwill.
Under the income approach, CNH Industrial calculates the fair value of a reporting unit based on the present value of estimated future cash flows. The income approach is dependent on several critical management assumptions, including estimates of future sales in the discrete future period and the weighted average cost of capital (discount rate), and also less significant assumptions such as gross margins, operating costs, income tax rates, terminal value growth rates, capital expenditures, and changes in working capital requirements. Discount rate assumptions include an assessment of the risk inherent in the future cash flows of the respective reporting units. Expected cash flows used under the income approach are developed in conjunction with CNH Industrial budgeting and forecasting process.
F-29
Under the market approach, CNH Industrial estimates the fair value of the Agriculture and Construction reporting units using revenue and EBITDA multiples and estimates the fair value of the Financial Services reporting unit using book value, tangible book value and interest margin multiples. The multiples are derived from comparable publicly-traded companies with similar operating and investment characteristics as the respective reporting units. The guideline company method makes use of market price data of corporations whose stock is actively traded in a public, free and open market, either on an exchange or over-the counter basis. Although it is clear no two companies are entirely alike, the corporations selected as guideline companies must be engaged in the same, or a similar, line of business or be subject to similar financial and business risks, including the opportunity for growth.
As of
December 31, 2019
, the estimated fair values of the Agriculture, Construction and Financial Services reporting units exceeded the carrying value by approximately
143
%
,
28
%
, and
43
%
respectively. Thus, we did not recognize an impairment for the respective reporting units. While there is positive margin between the fair value and carrying value for the Construction reporting unit, the fair value can be significantly impacted by changes in assumptions used in the fair value valuation model including expected sales growth in the discrete future period, the weighted average cost of capital (discount rate), and also less significant assumptions such as expected improvements in margin, long term growth rates along with other judgments. Based on our assessment of these circumstances, CNH Industrial has determined that the goodwill at the Construction reporting unit is at risk for impairment going forward should there be a deterioration of projected cash flows of the reporting unit as a result of the Company’s inability to successfully execute its plans to achieve further growth projections.
The sum of the fair values of CNH Industrial’s reporting units was in excess of CNH Industrial’s market capitalization. CNH Industrial believes that the difference between the fair value and market capitalization is reasonable (in the context of assessing whether any asset impairment exists) when market-based control premiums are taken into consideration.
As of
December 31, 2019
, and
2018
, the Company’s other intangible assets and related accumulated amortization consisted of the following:
|
2019
|
2018
|
|||||||||||||||||||||||||
|
Weighted
Avg. Life
|
Gross
|
Accumulated
Amortization
|
Net
|
Gross
|
Accumulated
Amortization
|
Net
|
||||||||||||||||||||
|
(in millions)
|
||||||||||||||||||||||||||
|
Other intangible assets subject to amortization:
|
||||||||||||||||||||||||||
|
Dealer networks
|
|
$
|
|
|
$
|
|
|
$
|
|
|
$
|
|
|
$
|
|
|
$
|
|
|
|||||||
|
Patents, concessions and licenses and other
|
5-25
|
|
|
|
|
|
|
|
|
|
|
|
|
|||||||||||||
|
|
|
|
|
|
|
|
|
|
|
|
|
|
|
|
|
|
||||||||||
|
Other intangible assets not subject to amortization:
|
||||||||||||||||||||||||||
|
Trademarks
|
|
|
—
|
|
|
|
|
|
—
|
|
|
|
||||||||||||||
|
Total Other intangible assets
|
$
|
|
|
|
$
|
|
|
|
$
|
|
|
|
$
|
|
|
|
$
|
|
|
|
$
|
|
|
|||
CNH Industrial recorded amortization expense of
$
112
million
,
$
116
million
, and
$
115
million
during
2019
,
2018
, and
2017
, respectively.
Credit Facilities
Lenders of committed credit facilities have the obligation to make advances up to the facility amount. Lenders of uncommitted facilities have the right to terminate the agreement with prior notice to CNH Industrial. At
December 31, 2019
, CNH Industrial’s available committed unsecured facilities expiring after twelve months amounted to
$
5.5
billion
(
$
3.1
billion
at
December 31, 2018
).
In March 2019, CNH Industrial signed a five-year committed revolving credit facility for
€
4
billion
(
$
4.5
billion
at March 31, 2019 exchange rate) due to mature in 2024 with
two
extension options of
1
-year each, exercisable on the first and second anniversary of the signing date. The credit facility replaces the existing five-year
€
1.75
billion
credit facility due to mature in 2021. The first
1
-year option has been exercised and accepted by all lenders, the facility is now due to mature in March 2025. The
€
4
billion
facility is guaranteed by the parent company with cross-guarantees from each of the borrowers (i.e., CNH Industrial Finance S.p.A., CNH Industrial Finance Europe S.A. and CNH Industrial Finance North America Inc.), includes typical provisions for contracts of this type and size, such as: customary covenants mainly relating to Industrial Activities including negative pledge, a status (or pari passu) covenant, restrictions on
F-30
the incurrence of indebtedness by certain subsidiaries, customary events of default (some of which are subject to minimum thresholds and customary mitigants) including cross-default, failure to pay amounts due or to comply with certain provisions under the loan agreement, the occurrence of certain bankruptcy-related events and mandatory prepayment obligations upon a change in control of CNH Industrial or the borrower and a financial covenant (Net debt/EBITDA ratio relating to Industrial Activities) that is not applicable with the current ratings levels. The failure to comply with these provisions, in certain cases if not suitably remedied, can lead to the requirement to make early repayment of the outstanding advances. At
December 31, 2019
, the Company was in compliance with all covenants in the revolving credit facility.
At
December 31, 2019
, Financial Services’ committed asset-backed facilities expiring after twelve months amounted to
$
4.1
billion
(
$
3.9
billion
at
December 31, 2018
), of which
$
3.0
billion
at
December 31, 2019
(
$
3.0
billion
at
December 31, 2018
) were utilized.
Debt
A summary of issued bonds outstanding as of
December 31, 2019
, is as follows:
|
Currency
|
Face value of outstanding bonds (in millions)
|
Coupon
|
Maturity
|
Outstanding amount
($ millions)
|
||||||||||
|
Industrial Activities
|
||||||||||||||
|
Euro Medium Term Notes:
|
||||||||||||||
|
CNH Industrial Finance Europe S.A.
(1)
|
EUR
|
|
|
|
%
|
September 27, 2021
|
|
|
||||||
|
CNH Industrial Finance Europe S.A.
(1)
|
EUR
|
|
|
|
%
|
March 29, 2022
|
|
|
||||||
|
CNH Industrial Finance Europe S.A.
(1)
|
EUR
|
|
|
|
%
|
May 23, 2022
|
|
|
||||||
|
CNH Industrial Finance Europe S.A.
(1)
|
EUR
|
|
|
|
%
|
May 17, 2023
|
|
|
||||||
|
CNH Industrial Finance Europe S.A.
(1)
|
EUR
|
|
|
|
%
|
September 12, 2025
|
|
|
||||||
|
CNH Industrial Finance Europe S.A.
(1)
|
EUR
|
|
|
|
%
|
November 12, 2025
|
|
|
||||||
|
CNH Industrial Finance Europe S.A.
(1)
|
EUR
|
|
|
|
%
|
January 19, 2026
|
|
|
||||||
|
CNH Industrial Finance Europe S.A.
(1)
|
EUR
|
|
|
|
%
|
March 25, 2027
|
|
|
||||||
|
CNH Industrial Finance Europe S.A.
(1)
|
|
EUR
|
|
|
|
|
|
%
|
|
April 21, 2028
|
|
|
|
|
|
CNH Industrial Finance Europe S.A.
(1)
|
EUR
|
|
|
|
%
|
July 3, 2029
|
|
|
||||||
|
CNH Industrial Finance Europe S.A.
(1)
|
EUR
|
|
|
|
%
|
July 15, 2039
|
|
|
||||||
|
Other Bonds:
|
||||||||||||||
|
CNH Industrial N.V.
(2)
|
USD
|
|
|
|
%
|
August 15, 2023
|
|
|
||||||
|
CNH Industrial N.V.
(2)
|
USD
|
|
|
|
%
|
November 15, 2027
|
|
|
||||||
|
Hedging effects, bond premium/discount, and unamortized issuance costs
|
(
|
)
|
||||||||||||
|
Total Industrial Activities
|
$
|
|
|
|||||||||||
|
Financial Services
|
||||||||||||||
|
CNH Industrial Capital LLC
|
USD
|
|
|
|
%
|
November 6, 2020
|
|
|
||||||
|
CNH Industrial Capital LLC
|
USD
|
|
|
|
%
|
April 1, 2021
|
|
|
||||||
|
CNH Industrial Capital LLC
|
USD
|
|
|
|
%
|
October 15, 2021
|
|
|
||||||
|
CNH Industrial Capital LLC
|
USD
|
|
|
|
%
|
April 5, 2022
|
|
|
||||||
|
CNH Industrial Capital Australia Pty Ltd.
|
AUD
|
|
|
|
%
|
December 12, 2022
|
|
|
||||||
|
CNH Industrial Capital LLC
|
USD
|
|
|
|
%
|
January 15, 2024
|
|
|
||||||
|
Hedging effects, bond premium/discount, and unamortized issuance costs
|
|
|
||||||||||||
|
Total Financial Services
|
$
|
|
|
|||||||||||
(1) Bond listed on the Irish Stock Exchange
(2) Bond listed on the New York Stock Exchange
A summary of total debt as of
December 31, 2019
and
2018
, is as follows:
F-31
|
2019
|
2018
|
|||||||||||||||||||||||
|
Industrial Activities
|
Financial Services
|
Total
|
Industrial Activities
|
Financial Services
|
Total
|
|||||||||||||||||||
|
(in millions)
|
||||||||||||||||||||||||
|
Total Bonds
|
$
|
|
|
$
|
|
|
$
|
|
|
$
|
|
|
$
|
|
|
$
|
|
|
||||||
|
Asset-backed debt
|
|
|
|
|
|
|
|
|
|
|
|
|
||||||||||||
|
Other debt
|
|
|
|
|
|
|
|
|
|
|
|
|
||||||||||||
|
Intersegment debt
|
|
|
|
|
|
|
|
|
|
|
|
|
||||||||||||
|
Total Debt
|
$
|
|
|
|
$
|
|
|
|
$
|
|
|
|
$
|
|
|
|
$
|
|
|
|
$
|
|
|
|
The weighted-average interest rate on consolidated debt at
December 31, 2019
, and
2018
was
3.0
%
and
3.0
%
, respectively.
In March 2017, CNH Industrial Finance Europe S.A. issued as a private placement
€
75
million
of notes at an annual fixed rate of
1.625
%
due in
2022
(the “
1.625
%
CIFE Notes”) at an issue price of
99.407
percent
of their principal amount. The
1.625
%
CIFE Notes were issued under the
€
10
billion
Global Medium Term Note Programme (subsequently converted into the Euro Medium Term Note Programme) guaranteed by CNH Industrial N.V.
In April 2017, CNH Industrial Capital LLC issued at par
$
500
million
of notes at an annual fixed rate of
4.375
%
due in
2022
.
In May 2017, CNH Industrial Finance Europe S.A. issued
€
500
million
of notes at an annual fixed rate of
1.375
%
due in
2022
(the “
1.375
%
CIFE Notes”) at an issue price of
99.335
percent
of their principal amount. The
1.375
%
CIFE Notes were issued under the
€
10
billion
Euro Medium Term Note Programme guaranteed by CNH Industrial N.V.
In September 2017, CNH Industrial Finance Europe S.A. issued
€
650
million
of notes at an annual fixed rate of
1.750
%
due in
2025
(the “
1.750
%
CIFE Notes”) at an issue price of
99.248
percent
of their principal amount. The
1.750
%
CIFE Notes were issued under the
€
10
billion
Euro Medium Term Note Programme guaranteed by CNH Industrial N.V.
In September 2017, CNH Industrial Finance Europe S.A. repurchased a total of
€
800
million
in principal amount of its
6.250
%
Notes due 2018 and its
2.750
%
Notes due 2019.
On October 24, 2017, Fitch Ratings assigned to CNH Industrial N.V. and CNH Industrial Capital LLC new investment grade long-term issuer default ratings of “BBB-”. This rating action and the S&P upgrade on June 15, 2017 made CNH Industrial’s securities eligible for the main investment grade indices in the U.S. market, which CNH Industrial believes has improved its access to funding at better rates.
In November 2017, CNH Industrial N.V. issued
$
500
million
of notes at an annual fixed rate of
3.850
%
due
2027
with an issue price of
99.384
%
.
In August 2018, S&P Global Ratings raised its long-term issuer credit ratings on CNH Industrial N.V. and its subsidiary, CNH Industrial Capital LLC, to 'BBB' from 'BBB-'. The outlook is stable. Additionally, S&P Global Ratings raised the issue-level ratings on CNH Industrial N.V. and its industrial subsidiaries' debt, as well as the issue-level ratings on CNH Industrial Capital LLC's senior unsecured debt, to 'BBB' from 'BBB-'.
In August 2018, CNH Industrial Capital LLC refinanced an April 2018 maturity by issuing
$
500
million
of notes at an annual fixed rate of
4.200
%
due in January 2024 with an issue price of
99.701
percent of their principal.
In September 2018 CNH Industrial Finance Europe S.A. issued
€
500
million
of notes at an annual fixed rate of
1.875
%
due in 2026
(the “
1.875
%
CIFE Notes”) at an
issue price of
98.944
percent of their principal amount.
The
1.875
%
CIFE Notes were issued under the
€
10
billion
Euro Medium Term Note Programme guaranteed by CNH Industrial N.V
.
In December 2018, Moody's Investors Service ("Moody's") upgraded the senior unsecured ratings of CNH Industrial N.V. and its subsidiaries CNH Industrial Capital LLC and CNH Industrial Finance Europe S.A from Ba1 to Baa3. The outlook is stable.
In December 2018, in order to manage its liabilities, CNH Industrial Finance Europe S.A repurchased, through a public tender, an aggregate nominal amount of
€
268
million
of the outstanding
€
700
million
2.875
%
Notes due September 27, 2021 issued under the EMTN.
In March 2019, CNH Industrial Finance Europe S.A. issued
€
600
million
of notes at an annual fixed rate of
1.75
%
due in 2027, at an issue price of
98.597
percent
of their principal amount. The
1.75
%
CIFE Notes were issued under the
€
10
billion
Euro Medium Term Note Programme guaranteed by CNH Industrial N.V.
In July 2019, CNH Industrial Finance Europe S.A. issued
€
500
million
of notes at an annual fixed rate of
1.625
%
notes due in 2029 (the “
1.625
%
CIFE Notes”) at with an issue price of
98.926
percent
of their principal amount. The
1.625
%
CIFE Notes were issued under the
€
10
billion
Euro Medium Term Note Programme guaranteed by CNH Industrial N.V.
In July 2019, CNH Industrial Finance Europe S.A. issued as a private placement
€
50
million
of notes at an annual fixed rate of
2.200
%
due in 2039 (the “
2.200
%
CIFE Notes”) at an issue price of
98.285
percent
of their principal amount. The
2.200
%
CIFE Notes were issued under the
€
10
billion
Euro Medium Term Note Programme guaranteed by CNH Industrial N.V.
F-32
In December 2019, CNH Industrial Capital Australia Pty. Limited issued AUD
175
million
of notes at an annual fixed rate of
2.1
%
due in 2022 at an issue price of
99.899
percent
of their principal amount.
In December 2019, in order to manage its liabilities, CNH Industrial Finance Europe S.A. repurchased, through a public tender, an aggregate nominal amount of
€
64
million
of the
2.875
%
notes due September 27, 2021 issued under the EMTN; an aggregate nominal amount of
€
184
million
of the
1.375
%
notes due May 23, 2022 issued under the EMTN, and an aggregate nominal amount of
€
131
million
of the
2.875
%
notes due May 17, 2023 issued under the EMTN.
In July 2019, Fitch Ratings (“Fitch”) improved the outlook of CNH Industrial N.V. to positive from stable. Fitch also affirmed CNH Industrial N.V.’s and CNH Industrial Capital LLC’s long-term issuer default rating at “BBB-”.
With the purpose of further diversifying Financial Services’ funding structure, CNH Industrial Capital LLC has established a commercial paper program in the U.S. This program had an outstanding amount of
$
387
million
at December 31, 2019. CNH Industrial Financial Services S.A. in Europe issues commercial paper under a program which had an outstanding amount of
$
105
million
at December 31, 2019.
The bonds issued by the Group may contain commitments of the issuer, and in certain cases commitments of CNH Industrial N.V. in its capacity as guarantor, which are typical of international practice for bond issues of this type such as, in particular, negative pledge (in relation to quoted indebtedness), a status (or pari passu) covenant and cross default clauses. A breach of these commitments can lead to the early repayment of the applicable notes. The bonds guaranteed by CNH Industrial N.V. under the Euro Medium Term Note Programme (and its predecessor the Global Medium Term Note Programme), as well as the notes issued by CNH Industrial N.V., contain clauses which could lead to early repayment if there is a change of control of CNH Industrial N.V. leading to a rating downgrading of CNH Industrial N.V.
Other debt consists primarily of borrowings from banks which are at various terms and rates. Included in Other debt of Financial Services is approximately
$
1.5
billion
and
$
1.5
billion
at
December 31, 2019
and
2018
, respectively, of funding provided by the Brazilian development agency, Banco Nacional de Desenvolvimento Econômico e Social (BNDES). The program provides subsidized funding to financial institutions to be loaned to customers to support the purchase of agricultural or construction machinery or commercial vehicles in accordance with the program.
A summary of the minimum annual repayments of debt as of
December 31, 2019
, for
2020
and thereafter is as follows:
|
Industrial
Activities
|
Financial
Services
|
Consolidated
|
||||||||||
|
(in millions)
|
||||||||||||
|
2020
|
$
|
|
|
$
|
|
|
$
|
|
|
|||
|
2021
|
|
|
|
|
|
|
||||||
|
2022
|
|
|
|
|
|
|
||||||
|
2023
|
|
|
|
|
|
|
||||||
|
2024
|
|
|
|
|
|
|
||||||
|
2025 and thereafter
|
|
|
|
|
|
|
||||||
|
Intersegment
|
|
|
|
|
|
|
||||||
|
Total
|
$
|
|
|
|
$
|
|
|
|
$
|
|
|
|
F-33
CNH Industrial N.V. and its subsidiaries have substantial worldwide operations. CNH Industrial N.V.’s subsidiaries incur tax obligations in the jurisdictions in which they operate. The Company’s provision (benefit) for income taxes as reported in its consolidated statements of operations for the year ended
December 31, 2019
of
$(
271
) million
consists almost entirely of income taxes related to subsidiaries of CNH Industrial N.V.
The sources of income before taxes and equity in income of unconsolidated subsidiaries and affiliates for the years ended
December 31, 2019
,
2018
, and
2017
are as follows:
|
2019
|
2018
|
2017
|
||||||||||
|
(in millions)
|
||||||||||||
|
Parent country source
|
$
|
(
|
)
|
$
|
(
|
)
|
$
|
(
|
)
|
|||
|
Foreign sources
|
|
|
|
|
|
|
||||||
|
Income (loss) before taxes and equity in income of unconsolidated subsidiaries and affiliates
|
$
|
|
|
|
$
|
|
|
|
$
|
|
|
|
The provision for income taxes for the years ended
December 31, 2019
,
2018
and
2017
consisted of the following:
|
2019
|
2018
|
2017
|
||||||||||
|
(in millions)
|
||||||||||||
|
Current income taxes
|
$
|
|
|
$
|
|
|
$
|
|
|
|||
|
Deferred income taxes
|
(
|
)
|
|
|
|
|
||||||
|
Total income tax provision (benefit)
|
$
|
(
|
)
|
$
|
|
|
$
|
|
|
|||
CNH Industrial N.V. is incorporated in the Netherlands but is a tax resident of the United Kingdom ("U.K."). The reconciliation of the differences between the provision for income taxes and the statutory rate is presented on the basis of the weighted average of the U.K. statutory corporation tax rates in force over each of the Company’s calendar year reporting periods of
19.25
%
in
2017
,
19
%
in
2018
and
19
%
in
2019
.
A reconciliation of CNH Industrial’s income tax expense for the years ended
December 31, 2019
,
2018
and
2017
is as follows:
|
2019
|
2018
|
2017
|
||||||||||
|
(in millions)
|
||||||||||||
|
Tax provision at the parent statutory rate
|
$
|
|
|
$
|
|
|
$
|
|
|
|||
|
Foreign income taxed at different rates
|
|
|
|
|
|
|
||||||
|
Change in valuation allowance
|
(
|
)
|
|
|
|
|
||||||
|
Italian IRAP taxes
|
|
|
|
|
|
|
||||||
|
Tax contingencies
|
|
|
|
|
|
|
||||||
|
Tax credits and incentives
|
(
|
)
|
(
|
)
|
(
|
)
|
||||||
|
Venezuela remeasurement, and impairment and deconsolidation
charges
|
|
|
|
|
|
|
||||||
|
Change in tax rate or law
|
(
|
)
|
(
|
)
|
|
|
||||||
|
Withholding taxes
|
|
|
|
|
|
|
||||||
|
Other
|
|
|
|
|
|
|
||||||
|
Total income tax provision (benefit)
|
$
|
(
|
)
|
|
$
|
|
|
|
$
|
|
|
|
The effective tax rate reduction in 2019 was primarily caused by the Company reporting, during the three and nine month periods ending September 30, 2019, a
$
539
million
discrete tax benefit associated with recognizing a substantial portion the deferred tax assets associated with its Italian operations, increased tax credit and incentive benefits associated with multiple jurisdictions in which the Company operates and a reduced impact of tax contingencies, which was also associated with multiple tax jurisdictions.
The effective tax rate reduction in 2018 was primarily caused by the difference in tax accruals attributable to the U.S. Tax Act and other tax law changes, a reduced negative impact of recording valuation allowances against certain of our deferred tax assets, a more favorable geographic mix of pre-tax earnings, and a reduced U.S. tax rate pursuant to the U.S. Tax Act. As described further below, during 2017 the Company reported provisional tax impacts associated with the U.S. Tax Act, which was enacted in December 2017. In 2018 and in accordance with Staff Accounting Bulletin No. 118, the Company finalized its accounting for the impacts of the U.S. Tax Act, which
F-34
resulted in an
$
8
million
tax benefit being reported during 2018. In addition, amongst other items, the U.S. Tax Act enacted a tax upon global intangible low tax income, a so-called GILTI tax. The Company has made a policy election to account for the GILTI tax as a current period cost, rather than under the deferred tax method.
During the last quarter of 2017, new tax legislation was enacted in several jurisdictions, primarily including the U.S. and the U.K. In connection with these legislative changes, the Company reported a
$
46
million
tax expense related to the U.S. mandatory deemed repatriation tax and the write-down of deferred tax assets in the relevant jurisdictions. In addition, also in the last quarter of 2017, the Company established an
$
84
million
valuation allowance against deferred tax assets in its U.K. operations as a result of new tax legislation in the U.K.
At
December 31, 2019
, undistributed earnings in certain subsidiaries outside the U.K. totaled approximately
$
5
billion
for which
no
deferred tax liability has been recorded because the remittance of earnings from certain jurisdictions would incur no tax or such earnings are indefinitely reinvested. The Company has determined the amount of unrecognized deferred tax liability relating to the
$
5
billion
undistributed earnings was approximately
$
68
million
and attributable to foreign withholding taxes in certain jurisdictions. Further, the Company evaluated the undistributed earnings from its joint ventures in which it owned 50% or less and recorded
$
8
million
of deferred tax liabilities as of
December 31, 2019
. The repatriation of undistributed earnings to the U.K. is generally exempt from U.K. income taxes under a full participation exemption.
Deferred Income Tax Assets and Liabilities
The components of net deferred tax assets as of
December 31, 2019
and
2018
are as follows:
|
2019
|
2018
|
|||||||
|
(in millions)
|
||||||||
|
Deferred tax assets:
|
||||||||
|
Inventories
|
$
|
|
|
$
|
|
|
||
|
Warranty and campaigns
|
|
|
|
|
||||
|
Allowance for credit losses
|
|
|
|
|
||||
|
Marketing and sales incentive programs
|
|
|
|
|
||||
|
Other risk and future charges reserve
|
|
|
|
|
||||
|
Pension, postretirement and postemployment benefits
|
|
|
|
|
||||
|
Leasing liabilities
|
|
|
|
|
||||
|
Research and development costs
|
|
|
|
|
||||
|
Other reserves
|
|
|
|
|
||||
|
Tax credits and loss carry forwards
|
|
|
|
|
||||
|
Less: Valuation allowances
|
(
|
)
|
(
|
)
|
||||
|
Total deferred tax assets
|
$
|
|
|
|
$
|
|
|
|
|
Deferred tax liabilities:
|
||||||||
|
Property, plant and equipment
|
$
|
|
|
$
|
|
|
||
|
Other
|
|
|
|
|
||||
|
Total deferred tax liabilities
|
|
|
|
|
|
|||
|
Net deferred tax assets
|
$
|
|
|
|
$
|
|
|
|
Net deferred tax assets are reflected in the accompanying consolidated balance sheets as of
December 31, 2019
and
2018
as follows:
|
2019
|
2018
|
|||||||
|
(in millions)
|
||||||||
|
Deferred tax assets
|
$
|
|
|
$
|
|
|
||
|
Deferred tax liabilities
|
(
|
)
|
(
|
)
|
||||
|
Net deferred tax assets
|
$
|
|
|
|
$
|
|
|
|
F-35
Valuation Allowances
As of
December 31, 2019
, the Company has valuation allowances of
$
993
million
against certain deferred tax assets, including tax loss carry forwards, tax credits and other deferred tax assets. These valuation allowances are primarily attributable to operations in Brazil, Germany, Italy and the U.K.
CNH Industrial has gross tax loss carry forwards in several tax jurisdictions. These tax losses expire as follows:
$
68
million
in
2020
;
$
122
million
in
2021
;
$
86
million
in
2022
;
$
123
million
in
2023
;
$
418
million
in
2024
and beyond. CNH Industrial also has tax loss carry forwards of approximately
$
2
billion
with indefinite lives. CNH Industrial has tax credit carry forwards. The years in which these tax credits expire are as follows:
$
1
million
in
2023
; and
$
53
million
in
2024
and beyond.
Uncertain Tax Positions
The Company files income tax returns in multiple jurisdictions and is subject to examination by taxing authorities throughout the world. The Company has open tax years from
2009
to
2018
. Due to the global nature of the Company’s business, transfer pricing disputes may arise and the Company may seek correlative relief through competent authority processes.
A reconciliation of the gross amounts of tax contingencies at the beginning and end of the year is as follows:
|
2019
|
2018
|
|||||||
|
(in millions)
|
||||||||
|
Balance, beginning of year
|
$
|
|
|
$
|
|
|
||
|
Additions based on tax positions related to the current year
|
|
|
|
|
||||
|
Additions for tax positions of prior years
|
|
|
|
|
||||
|
Reductions for tax positions of prior years
|
(
|
)
|
(
|
)
|
||||
|
Reductions for tax positions as a result of lapse of statute
|
(
|
)
|
(
|
)
|
||||
|
Settlements
|
(
|
)
|
(
|
)
|
||||
|
Balance, end of year
|
$
|
|
|
|
$
|
|
|
|
As of
December 31, 2019
, there are
$
209
million
of unrecognized tax benefits that if recognized would affect the effective tax rate.
The Company recognizes interest and penalties accrued related to tax contingencies as part of the income tax provision. During the years ended
December 31, 2019
,
2018
and
2017
, the Company recognized expense of approximately
$
6
million
,
$
13
million
and
$(
1
) million
for income tax related interest and penalties, respectively. The Company had approximately
$
25
million
,
$
21
million
and
$
11
million
of income tax related interest and penalties accrued at
December 31, 2019
,
2018
and
2017
, respectively.
CNH Industrial provides pension, healthcare and insurance plans and other postemployment benefits to their employees and retirees under defined contribution and defined benefit plans.
In the case of defined contribution plans, CNH Industrial makes contributions to publicly or privately administered pension insurance plans on a mandatory, contractual or voluntary basis. Once the contributions have been made, the Company has no further payment obligations. CNH Industrial recognizes the contribution cost when the employees have rendered their service and includes this cost by function in cost of goods sold, SG&A expense, and R&D expense. During the years ended
December 31, 2019
,
2018
, and
2017
, CNH Industrial recorded expense of
$
188
million
,
$
198
million
, and
$
189
million
, respectively, for its defined contribution plans.
Defined benefit plans are classified by CNH Industrial on the basis of the type of benefit provided as follows: pension plans, healthcare plans, and other postemployment benefit plans.
Pension Plans
Pension obligations primarily comprise the obligations of the Company’s pension plans in the U.S., the U.K., and Germany.
Under these plans, contributions are made to a separate fund (trust) that independently administers the plan assets. The Company’s funding policy is to meet the minimum funding requirements pursuant to the laws of the applicable jurisdictions. The Company may also choose to make discretionary contributions.
In November 2019, CNH Industrial signed a group annuity contract to transfer the outstanding pension benefit obligations related to certain retirees and beneficiaries within the U.S. plans. In connection with this transaction,
$
431
million
of plan obligations were transferred along with
$
451
million
of plan assets. The Company also recognized a
$
116
million
pre-tax non-cash settlement charge, primarily related to the accelerated recognition of actuarial losses in those plans in the fourth quarter of 2019.
F-36
Healthcare Postretirement Benefit Plans
Healthcare postretirement benefit plan obligations comprise obligations for healthcare and insurance plans granted to employees working in the U.S. and Canada. These plans generally cover employees retiring on or after reaching the age of 55 who have completed at least 10 years of employment. CNH Industrial U.S. salaried and non-represented hourly employees and Canadian employees hired after January 1, 2001 and January 1, 2002, respectively, are not eligible for postretirement healthcare and life insurance benefits under the CNH Industrial plans.
These benefits may be subject to deductibles, co-payment provisions and other limitations, and CNH Industrial has reserved the right to change or terminate these benefits, subject to the provisions of any collective bargaining agreement. These plans are not required to be funded. However, beginning in 2007, the Company began making contributions on a voluntary basis to a separate and independently managed fund established to finance the North American healthcare plans.
On February 20, 2018, CNH Industrial announced that the United States Supreme Court ruled in its favor in Reese vs. CNH Industrial N.V. and CNH Industrial America LLC. The decision allowed CNH Industrial to terminate or modify various retiree healthcare benefits previously provided to certain UAW Union represented CNH Industrial retirees. On April 16, 2018, CNH Industrial announced its determination to modify the Benefits provided to the applicable retirees (“Benefits Modification”) to make them consistent with the Benefits provided to current eligible CNH Industrial retirees who had been represented by the UAW. The Benefits Modification resulted in a reduction of the plan liability by
$
527
million
. This amount will be amortized from OCI to the income statement over approximately
4.5
years, which represents the average service period to attain eligibility conditions for active participants. For the years ended
December 31, 2019
and
2018
,
$
119
million
and
$
80
million
of amortization was recorded as a pre-tax gain in Other, net, respectively.
Other Postemployment Benefits
Other postemployment benefits consist of obligations for Italian Employee Leaving Entitlements up to December 31, 2006, loyalty bonus in Italy and various other similar plans in France, Germany and Belgium. Until December 31, 2006, Italian companies with more than 50 employees were required to accrue for benefits paid to employees upon them leaving the Company. The scheme has since changed to a defined contribution plan. The obligation on the Company’s consolidated balance sheet represents the residual reserve for years until December 31, 2006. Loyalty bonus is accrued for employees who have reached certain service seniority and are generally settled when employees leave the Company. These plans are not required to be funded and, therefore, have no plan assets.
Obligations and Funded Status
The following summarizes data from CNH Industrial’s defined benefit pension, healthcare and other postemployment plans for the years ended
December 31, 2019
and
2018
:
|
Pension
|
Healthcare
(1)
|
Other
(1)
|
||||||||||||||||||||||
|
2019
|
2018
|
2019
|
2018
|
2019
|
2018
|
|||||||||||||||||||
|
(in millions)
|
||||||||||||||||||||||||
|
Change in benefit obligations:
|
||||||||||||||||||||||||
|
Beginning benefit obligation
|
$
|
|
|
$
|
|
|
$
|
|
|
$
|
|
|
$
|
|
|
$
|
|
|
||||||
|
Service cost
|
|
|
|
|
|
|
|
|
|
|
|
|
||||||||||||
|
Interest cost
|
|
|
|
|
|
|
|
|
|
|
|
|
||||||||||||
|
Plan participants’ contributions
|
|
|
|
|
|
|
|
|
|
|
|
|
||||||||||||
|
Actuarial loss (gain)
|
|
|
(
|
)
|
|
|
(
|
)
|
|
|
(
|
)
|
||||||||||||
|
Gross benefits paid
|
(
|
)
|
(
|
)
|
(
|
)
|
(
|
)
|
(
|
)
|
(
|
)
|
||||||||||||
|
Plan amendments
|
(
|
)
|
|
|
(
|
)
|
(
|
)
|
|
|
|
|
||||||||||||
|
Currency translation adjustments and other
(2)
|
(
|
)
|
(
|
)
|
(
|
)
|
(
|
)
|
(
|
)
|
(
|
)
|
||||||||||||
|
Ending benefit obligation
|
$
|
|
|
$
|
|
|
$
|
|
|
$
|
|
|
$
|
|
|
$
|
|
|
||||||
|
Change in the fair value of plan assets:
|
||||||||||||||||||||||||
|
Beginning plan assets
|
|
|
|
|
|
|
|
|
|
|
|
|
||||||||||||
|
Actual return on plan assets
|
|
|
(
|
)
|
|
|
(
|
)
|
|
|
|
|
||||||||||||
|
Employer contributions
|
|
|
|
|
|
|
|
|
|
|
|
|
||||||||||||
|
Plan participants’ contributions
|
|
|
|
|
|
|
|
|
|
|
|
|
||||||||||||
|
Gross benefits paid
|
(
|
)
|
(
|
)
|
(
|
)
|
(
|
)
|
|
|
|
|
||||||||||||
|
Currency translation adjustments and other
(2)
|
(
|
)
|
(
|
)
|
|
|
|
|
|
|
|
|
||||||||||||
|
Ending plan assets
|
|
|
|
|
|
|
|
|
|
|
|
|
||||||||||||
|
Funded status:
|
$
|
(
|
)
|
$
|
(
|
)
|
$
|
(
|
)
|
$
|
(
|
)
|
$
|
(
|
)
|
$
|
(
|
)
|
||||||
|
(1)
|
The healthcare and other postemployment plans are not required to be prefunded.
|
F-37
|
(2)
|
|
The following summarizes data from CNH Industrial’s defined benefit pension plans by significant geographical area for the years ended
December 31, 2019
and
2018
:
|
U.S.
|
U.K
|
Germany
(1)
|
Other Countries
(1)
|
|||||||||||||||||||||||||||||
|
2019
|
2018
|
2019
|
2018
|
2019
|
2018
|
2019
|
2018
|
|||||||||||||||||||||||||
|
(in millions)
|
||||||||||||||||||||||||||||||||
|
Change in benefit obligations:
|
||||||||||||||||||||||||||||||||
|
Beginning benefit obligation
|
$
|
|
|
$
|
|
|
$
|
|
|
$
|
|
|
$
|
|
|
$
|
|
|
$
|
|
|
$
|
|
|
||||||||
|
Service cost
|
|
|
|
|
|
|
|
|
|
|
|
|
|
|
|
|
||||||||||||||||
|
Interest cost
|
|
|
|
|
|
|
|
|
|
|
|
|
|
|
|
|
||||||||||||||||
|
Plan participants’ contributions
|
|
|
|
|
|
|
|
|
|
|
|
|
|
|
|
|
||||||||||||||||
|
Actuarial loss (gain)
|
|
|
(
|
)
|
|
|
(
|
)
|
|
|
(
|
)
|
|
|
(
|
)
|
||||||||||||||||
|
Gross benefits paid
|
(
|
)
|
(
|
)
|
(
|
)
|
(
|
)
|
(
|
)
|
(
|
)
|
(
|
)
|
(
|
)
|
||||||||||||||||
|
Plan amendments
|
|
|
|
|
|
|
|
|
|
|
|
|
(
|
)
|
|
|
||||||||||||||||
|
Currency translation adjustments and other
(2)
|
(
|
)
|
|
|
|
|
(
|
)
|
(
|
)
|
(
|
)
|
|
|
(
|
)
|
||||||||||||||||
|
Ending benefit obligation
|
$
|
|
|
$
|
|
|
$
|
|
|
$
|
|
|
$
|
|
|
$
|
|
|
$
|
|
|
$
|
|
|
||||||||
|
Change in the fair value of plan assets:
|
||||||||||||||||||||||||||||||||
|
Beginning plan assets
|
|
|
|
|
|
|
|
|
|
|
|
|
|
|
|
|
||||||||||||||||
|
Actual return on plan assets
|
|
|
(
|
)
|
|
|
|
|
|
|
|
|
|
|
|
|
||||||||||||||||
|
Employer contributions
|
|
|
|
|
|
|
|
|
|
|
|
|
|
|
|
|
||||||||||||||||
|
Plan participants’ contributions
|
|
|
|
|
|
|
|
|
|
|
|
|
|
|
|
|
||||||||||||||||
|
Gross benefits paid
|
(
|
)
|
(
|
)
|
(
|
)
|
(
|
)
|
|
|
|
|
(
|
)
|
(
|
)
|
||||||||||||||||
|
Currency translation adjustments and other
(2)
|
(
|
)
|
|
|
|
|
(
|
)
|
|
|
|
|
|
|
(
|
)
|
||||||||||||||||
|
Ending plan assets
|
$
|
|
|
$
|
|
|
$
|
|
|
$
|
|
|
$
|
|
|
$
|
|
|
$
|
|
|
$
|
|
|
||||||||
|
Funded status:
|
$
|
|
|
$
|
|
|
$
|
(
|
)
|
$
|
(
|
)
|
$
|
(
|
)
|
$
|
(
|
)
|
$
|
(
|
)
|
$
|
(
|
)
|
||||||||
|
(1)
|
Pension benefits in Germany and some other countries are not required to be prefunded.
|
|
(2)
|
Includes the impact of the transfer of the outstanding pension benefit obligations related to certain retirees and beneficiaries within the U.S. plans through a group annuity contract purchase in November 2019.
|
Net amounts recognized in the consolidated balance sheets as of
December 31, 2019
and
2018
consist of:
|
Pension
|
Healthcare
|
Other
|
||||||||||||||||||||||
|
2019
|
2018
|
2019
|
2018
|
2019
|
2018
|
|||||||||||||||||||
|
(in millions)
|
||||||||||||||||||||||||
|
Other assets
|
$
|
|
|
$
|
|
|
$
|
|
|
$
|
|
|
$
|
|
|
$
|
|
|
||||||
|
Pension, postretirement and other postemployment benefits
|
(
|
)
|
(
|
)
|
(
|
)
|
(
|
)
|
(
|
)
|
(
|
)
|
||||||||||||
|
Net liability recognized at end of year
|
$
|
(
|
)
|
$
|
(
|
)
|
$
|
(
|
)
|
$
|
(
|
)
|
$
|
(
|
)
|
$
|
(
|
)
|
||||||
Pre-tax amounts recognized in accumulated other comprehensive loss as of
December 31, 2019
consist of:
|
Pension
|
Healthcare
|
Other
|
||||||||||
|
(in millions)
|
||||||||||||
|
Unrecognized actuarial losses
|
$
|
|
|
$
|
|
|
$
|
|
|
|||
|
Unrecognized prior service credit
|
|
|
(
|
)
|
(
|
)
|
||||||
|
Accumulated other comprehensive loss
|
$
|
|
|
$
|
(
|
)
|
$
|
|
|
|||
F-38
The following table summarizes the aggregate pension accumulated benefit obligation and fair value of plan assets for pension plans with accumulated benefit obligations in excess of plan assets:
|
Pension
|
||||||||
|
2019
|
2018
|
|||||||
|
(in millions)
|
||||||||
|
Accumulated benefit obligation
|
$
|
|
|
$
|
|
|
||
|
Fair value of plan assets
|
$
|
|
|
$
|
|
|
||
The following table summarizes CNH Industrial’s pension and other postemployment plans with projected benefit obligations in excess of plan assets:
|
Pension
|
Healthcare
|
Other
|
||||||||||||||||||||||
|
2019
|
2018
|
2019
|
2018
|
2019
|
2018
|
|||||||||||||||||||
|
(in millions)
|
||||||||||||||||||||||||
|
Projected benefit obligation
|
$
|
|
|
$
|
|
|
$
|
|
|
$
|
|
|
$
|
|
|
$
|
|
|
||||||
|
Fair value of plan assets
|
$
|
|
|
$
|
|
|
$
|
|
|
$
|
|
|
$
|
|
|
$
|
|
|
||||||
The total accumulated benefit obligation for pension was
$
2,915
million
and
$
3,011
million
as of
December 31, 2019
and
2018
, respectively.
Net Periodic Benefit Cost
The following summarizes the components of net periodic benefit cost of CNH Industrial’s defined benefit for the years ended
December 31, 2019
,
2018
, and
2017
:
|
Pension
|
Healthcare
|
Other
|
||||||||||||||||||||||||||||||||||
|
2019
|
2018
|
2017
|
2019
|
2018
|
2017
|
2019
|
2018
|
2017
|
||||||||||||||||||||||||||||
|
(in millions)
|
||||||||||||||||||||||||||||||||||||
|
Service cost
|
$
|
|
|
$
|
|
|
$
|
|
|
$
|
|
|
$
|
|
|
$
|
|
|
$
|
|
|
$
|
|
|
$
|
|
|
|||||||||
|
Interest cost
|
|
|
|
|
|
|
|
|
|
|
|
|
|
|
|
|
|
|
||||||||||||||||||
|
Expected return on assets
|
(
|
)
|
(
|
)
|
(
|
)
|
(
|
)
|
(
|
)
|
(
|
)
|
|
|
|
|
|
|
||||||||||||||||||
|
Amortization of:
|
||||||||||||||||||||||||||||||||||||
|
Prior service cost (credit)
|
|
|
(
|
)
|
(
|
)
|
(
|
)
|
(
|
)
|
(
|
)
|
|
|
|
|
|
|
||||||||||||||||||
|
Actuarial loss (gain)
|
|
|
|
|
|
|
(
|
)
|
|
|
|
|
|
|
|
|
|
|
||||||||||||||||||
|
Settlement loss and other
|
|
|
|
|
|
|
|
|
|
|
|
|
|
|
|
|
|
|
||||||||||||||||||
|
Net periodic benefit cost
|
$
|
|
|
$
|
|
|
$
|
|
|
$
|
(
|
)
|
$
|
(
|
)
|
$
|
|
|
$
|
|
|
$
|
|
|
$
|
|
|
|||||||||
Net periodic benefit cost recognized in net income and other changes in plan assets and benefit obligations that are recognized in other comprehensive loss during
2019
consist of:
|
Pension
|
Healthcare
|
Other
|
||||||||||
|
(in millions)
|
||||||||||||
|
Net periodic benefit cost
|
$
|
|
|
$
|
(
|
)
|
$
|
|
|
|||
|
Benefit adjustments included in other comprehensive (income) loss:
|
||||||||||||
|
Net actuarial losses (gains)
|
|
|
|
|
|
|
||||||
|
Amortization of actuarial losses
|
(
|
)
|
|
|
(
|
)
|
||||||
|
Amortization of prior service (cost) credit
|
(
|
)
|
|
|
(
|
)
|
||||||
|
Currency translation adjustments and other
|
|
|
(
|
)
|
|
|
||||||
|
Total recognized in other comprehensive (income) loss
|
(
|
)
|
|
|
|
|
||||||
|
Total recognized in comprehensive loss
|
$
|
|
|
$
|
(
|
)
|
$
|
|
|
|||
F-39
Pre-tax amounts expected to be amortized in
2020
from accumulated other comprehensive loss consist of:
|
Pension
|
Healthcare
|
Other
|
||||||||||
|
(in millions)
|
||||||||||||
|
Actuarial losses
|
$
|
|
|
$
|
|
|
$
|
|
|
|||
|
Prior service cost (credit)
|
|
|
(
|
)
|
|
|
||||||
|
Total
|
$
|
|
|
$
|
(
|
)
|
$
|
|
|
|||
Actuarial gains and losses are recorded in accumulated other comprehensive income (loss). To the extent unamortized gains and losses exceed
10
%
of the higher of the market-related value of assets or the benefit obligation, the excess is amortized as a component of net periodic cost over the remaining service period of the active participants. For plans in which all or almost all of the plan's participants are inactive, the amortization period is the remaining life expectancy of the inactive participants.
Assumptions
The following assumptions were utilized in determining the funded status at
December 31, 2019
and
2018
, and the net periodic benefit cost of CNH Industrial’s defined benefit plans for the years ended
December 31, 2019
,
2018
, and
2017
:
|
Pension plans
|
Healthcare plans
|
Other
|
||||||||||||||||
|
(in %)
|
2019
|
2018
|
2017
|
2019
|
2018
|
2017
|
2019
|
2018
|
2017
|
|||||||||
|
Assumptions used to determine funded status at December 31
|
||||||||||||||||||
|
Weighted-average discount rate
|
|
|
|
|
|
|
|
|
|
|||||||||
|
Weighted-average rate of compensation increase
|
|
|
|
n/a
|
n/a
|
n/a
|
|
|
|
|||||||||
|
Weighted-average, initial healthcare cost trend rate
|
n/a
|
n/a
|
n/a
|
|
|
|
n/a
|
n/a
|
n/a
|
|||||||||
|
Weighted-average, ultimate healthcare cost trend rate(*)
|
n/a
|
n/a
|
n/a
|
|
|
|
n/a
|
n/a
|
n/a
|
|||||||||
|
Assumptions used to determine expense
|
||||||||||||||||||
|
Weighted-average discount rates - service cost
|
|
|
|
|
|
|
|
|
|
|||||||||
|
Weighted-average discount rates - interest cost
|
|
|
|
|
|
|
|
|
|
|||||||||
|
Weighted-average rate of compensation increase
|
|
|
|
n/a
|
n/a
|
n/a
|
|
|
|
|||||||||
|
Weighted-average long-term rates of return on plan assets
|
|
|
|
|
|
|
n/a
|
n/a
|
n/a
|
|||||||||
|
Weighted-average, initial healthcare cost trend rate
|
n/a
|
n/a
|
n/a
|
|
|
|
n/a
|
n/a
|
n/a
|
|||||||||
|
Weighted-average, ultimate healthcare cost trend rate(*)
|
n/a
|
n/a
|
n/a
|
|
|
|
n/a
|
n/a
|
n/a
|
|||||||||
|
(*)
|
CNH Industrial expects to achieve the ultimate healthcare cost trend rate in 2025 for U.S. plans. A flat trend rate assumption is utilized for the Canada plans.
|
Assumed discount rates are used in measurements of pension, healthcare and other postemployment benefit obligations and interest cost components of net periodic cost. CNH Industrial selects its assumed discount rates based on the consideration of equivalent yields on high-quality fixed income investments at the measurement date. The assumed discount rate is used to discount future benefit obligations back to today’s dollars. The discount rates for the U.S., European, U.K. and Canadian obligations are based on a benefit cash flow-matching approach and represent the rates at which the benefit obligations could effectively be settled as of the measurement date, December 31. The benefit cash flow-matching approach involves analyzing CNH Industrial’s projected cash flows against a high quality bond yield curve, mainly calculated using a wide population of AA-grade corporate bonds subject to minimum amounts outstanding and meeting other defined selection criteria. The discount rates for the Company’s remaining obligations are based on benchmark yield data of high-quality fixed income investments for which the timing and amounts of payments approximate the timing and amounts of projected benefit payments.
The expected long-term rate of return on plan assets reflects management’s expectations on long-term average rates of return on funds invested to provide for benefits included in the projected benefit obligations. The expected return is based on the outlook for inflation,
F-40
fixed income returns and equity returns while also considering asset allocation and investment strategy, premiums for active management to the extent asset classes are actively managed, and plan expenses. Return patterns and correlations, consensus return forecasts, and other relevant financial factors are analyzed to check for reasonability and appropriateness.
The assumed healthcare trend rate represents the rate at which healthcare costs are assumed to increase. Rates are determined based on company-specific experience, consultation with actuaries and outside consultants, and various trend factors including general and healthcare sector-specific inflation projections from the United States Department of Health and Human Services Healthcare Financing Administration. The initial trend is a short-term assumption based on recent experience and prevailing market conditions. The ultimate trend is a long-term assumption of healthcare cost inflation based on general inflation, incremental medical inflation, technology, new medicine, government cost-shifting, utilization changes, an aging population, and a changing mix of medical services.
In October 2014, the Society of Actuaries (“SOA”) in the U.S. issued an updated mortality table (“RP-2014”) and mortality improvement scale (“MP-2014”). Accordingly, CNH Industrial reviewed the historical mortality experience and demographic characteristics of its U.S. pension plan participants and has decided to adopt the variants of blue-collar tables of RP-2014 (with MP-2014 removed) as the base mortality tables. This table with a newer version of the mortality improvement scale, MP-2017, was used at December 31, 2017.
Subsequent to the Benefits Modification to the US Healthcare plan on April 16, 2018, the Company decided to change the base mortality table for the US Healthcare plan from the variants of blue-collar tables of RPH-2014 (with MP-2014 removed) to a no-collar variant which led to an increase of
$
4.3
million
to the Company's benefit obligations at December 31, 2018. In addition, in 2018, CNH Industrial adopted the MP-2018 mortality improvement scale, which better reflects the actual recent experience over the previous mortality improvement scales. The adoption of the new mortality assumptions resulted in a total decrease of
$
3.6
million
to the Company’s benefit obligations at December 31, 2018, of which,
$
3
million
and
$
0.6
million
were related to pension plans and healthcare plans, respectively.
In October 2019, the SOA issued an updated mortality base table ("Pri-2012") as well as an updated mortality improvement scale (“MP-2019”). The Pri-2012 mortality base table reflects more recent mortality experience, uses a larger data set than the previous base table and includes separate mortality rates for survivors of deceased participants still benefiting under the plans. In 2019, the Company adopted the variant of blue-collar tables of the Pri-2012 for the US pension plans and the no collar variant of the PriH-2012 for the US Healthcare plans, including the new survivor mortality as well as MP-2019 mortality improvement scale. Management believes the new mortality assumptions most appropriately represent its plans’ experience and characteristics. The adoption of the new mortality assumptions resulted in a total decrease of
$
14
million
to the Company’s benefit obligations at December 31, 2019, of which,
$
11
million
and
$
3
million
were related to pension plans and healthcare plans, respectively.
The Company uses the spot yield curve approach to estimate the service and interest cost components of the net periodic pension and other postretirement benefit costs by applying the specific spot rates along the yield curve used to determine the benefit obligations to relevant projected cash outflows.
A one percentage point change in the assumed healthcare cost trend rates would have the following effect:
|
One Percentage-
Point Increase
|
One Percentage-
Point Decrease
|
|||||||
|
(in millions)
|
||||||||
|
Total increase/(decrease) in service cost and interest cost components of 2019 Healthcare Plan benefit expense
|
$
|
|
|
$
|
(
|
)
|
||
|
Total increase/(decrease) in accumulated Healthcare benefit obligations as of December 31, 2019
|
$
|
|
|
$
|
(
|
)
|
||
Plan Assets
The investment strategy for the plan assets depends on the features of the plan and on the maturity of the obligations. Typically, less mature plan benefit obligations are funded by using more equity securities as they are expected to achieve long-term growth exceeding the rate of inflation. More mature plan benefit obligations are funded using more fixed income securities as they are expected to produce current income with limited volatility. Risk management practices include the use of multiple asset classes and investment managers within each asset class for diversification purposes. Specific guidelines for each asset class and investment manager are implemented and monitored.
F-41
Weighted average target asset allocation for all plans for
2019
are as follows:
|
All
Plans
|
|||
|
Asset category:
|
|||
|
Equity securities
|
|
%
|
|
|
Debt securities
|
|
%
|
|
|
Cash/Other
|
|
%
|
|
CNH Industrial determines the fair value of plan assets using observable market data obtained from independent sources when available. CNH Industrial classifies its plan assets according to the fair value hierarchy:
Level 1—Quoted prices for
identical
instruments in active markets.
Level 2—Quoted prices for
similar
instruments in active markets; quoted prices for identical or similar instruments in markets that are not active; and model-derived valuations in which all significant inputs and significant value drivers are observable in active markets.
Level 3—Valuations derived from valuation techniques in which one or more significant inputs or significant value drivers are
unobservable.
The following summarizes the fair value of plan assets by asset category and level within the fair value hierarchy as of
December 31, 2019
:
|
Total
|
Level 1
|
Level 2
|
Level 3
|
|||||||||||||
|
(in millions)
|
||||||||||||||||
|
Equity securities:
|
||||||||||||||||
|
U.S. equities
|
$
|
|
|
$
|
|
|
$
|
|
|
$
|
|
|
||||
|
Non-U.S. equities
|
|
|
|
|
|
|
|
|
||||||||
|
Total Equity securities
|
|
|
|
|
|
|
|
|
||||||||
|
Fixed income securities:
|
||||||||||||||||
|
U.S. government bonds
|
|
|
|
|
|
|
|
|
||||||||
|
U.S. corporate bonds
|
|
|
|
|
|
|
|
|
||||||||
|
Non-U.S. government bonds
|
|
|
|
|
|
|
|
|
||||||||
|
Non-U.S. corporate bonds
|
|
|
|
|
|
|
|
|
||||||||
|
Mortgage backed securities
|
|
|
|
|
|
|
|
|
||||||||
|
Other fixed income
|
|
|
|
|
|
|
|
|
||||||||
|
Total Fixed income securities
|
|
|
|
|
|
|
|
|
||||||||
|
Other types of investments:
|
||||||||||||||||
|
Mutual funds
(A)
|
|
|
|
|
|
|
|
|
||||||||
|
Insurance contracts
|
|
|
|
|
|
|
|
|
||||||||
|
Derivatives—credit contracts
|
|
|
|
|
|
|
|
|
||||||||
|
Real estate
|
|
|
|
|
|
|
|
|
||||||||
|
Total Other types of investments
|
|
|
|
|
|
|
|
|
||||||||
|
Cash:
|
|
|
|
|
|
|
|
|
||||||||
|
Total
|
$
|
|
|
$
|
|
|
$
|
|
|
$
|
|
|
||||
(A) This category includes mutual funds, which primarily invest in non-U.S. equities and non-U.S. corporate bonds.
F-42
The following table presents the changes in the Level 3 plan assets for the year ended
December 31, 2019
:
|
Insurance
Contracts (in millions)
|
||||
|
Balance at December 31, 2018
|
$
|
|
|
|
|
Actual return on plan assets relating to assets still held at
reporting date
|
|
|
||
|
Purchases
|
|
|
||
|
Settlements
|
(
|
)
|
||
|
Transfers in and/or out of level 3
|
|
|
||
|
Currency impact
|
|
|
||
|
Balance at December 31, 2019
|
$
|
|
|
|
The following summarizes the fair value of plan assets by asset category and level within the fair value hierarchy as of
December 31, 2018
:
|
Total
|
Level 1
|
Level 2
|
Level 3
|
|||||||||||||
|
(in millions)
|
||||||||||||||||
|
Equity securities:
|
||||||||||||||||
|
U.S. equities
|
$
|
|
|
$
|
|
|
$
|
|
|
$
|
|
|
||||
|
Non-U.S. equities
|
|
|
|
|
|
|
|
|
||||||||
|
Total Equity securities
|
|
|
|
|
|
|
|
|
||||||||
|
Fixed income securities:
|
||||||||||||||||
|
U.S. government bonds
|
|
|
|
|
|
|
|
|
||||||||
|
U.S. corporate bonds
|
|
|
|
|
|
|
|
|
||||||||
|
Non-U.S. government bonds
|
|
|
|
|
|
|
|
|
||||||||
|
Non-U.S. corporate bonds
|
|
|
|
|
|
|
|
|
||||||||
|
Mortgage backed securities
|
|
|
|
|
|
|
|
|
||||||||
|
Other fixed income
|
|
|
|
|
|
|
|
|
||||||||
|
Total Fixed income securities
|
|
|
|
|
|
|
|
|
||||||||
|
Other types of investments:
|
||||||||||||||||
|
Mutual funds
(A)
|
|
|
|
|
|
|
|
|
||||||||
|
Insurance contracts
|
|
|
|
|
|
|
|
|
||||||||
|
Derivatives—credit contracts
|
|
|
|
|
|
|
|
|
||||||||
|
Real estate
|
|
|
|
|
|
|
|
|
||||||||
|
Total Other types of investments
|
|
|
|
|
|
|
|
|
||||||||
|
Cash:
|
|
|
|
|
|
|
|
|
||||||||
|
Total
|
$
|
|
|
$
|
|
|
$
|
|
|
$
|
|
|
||||
(A) This category includes mutual funds, which primarily invest in non-U.S. equities and non-U.S. corporate bonds.
F-43
The following table presents the changes in the Level 3 plan assets for the year ended
December 31, 2018
:
|
Insurance
Contracts (in millions)
|
||||
|
Balance at December 31, 2017
|
$
|
|
|
|
|
Actual return on plan assets relating to assets still held at
reporting date
|
|
|
||
|
Purchases
|
|
|
||
|
Settlements
|
(
|
)
|
||
|
Transfers in and/or out of Level 3
|
|
|
||
|
Currency impact
|
(
|
)
|
||
|
Balance at December 31, 2018
|
$
|
|
|
|
Contributions
CNH Industrial expects to contribute (including through direct benefit payments) approximately
$
65
million
to its pension plans,
$
21
million
to its healthcare plans and
$
31
million
to its other postemployment plans in
2020
.
The benefit expected to be paid from the benefit plans which reflect expected future years of service, and the Medicare subsidy expected to be received are as follows:
|
Pension Plans
|
Healthcare
|
Medicare
Reimbursement
|
Other
|
|||||||||||||
|
(in millions)
|
||||||||||||||||
|
2020
|
$
|
|
|
$
|
|
|
$
|
|
|
$
|
|
|
||||
|
2021
|
|
|
|
|
|
|
|
|
||||||||
|
2022
|
|
|
|
|
|
|
|
|
||||||||
|
2023
|
|
|
|
|
|
|
|
|
||||||||
|
2024
|
|
|
|
|
|
|
|
|
||||||||
|
2025 - 2029
|
|
|
|
|
(
|
)
|
|
|
||||||||
|
Total
|
$
|
|
|
$
|
|
|
$
|
(
|
)
|
$
|
|
|
||||
A summary of “Other liabilities” as of
December 31, 2019
and
2018
is as follows:
|
2019
|
2018
|
|||||||
|
(in millions)
|
||||||||
|
Advances on buy-back agreements
|
$
|
|
|
$
|
|
|
||
|
Warranty and campaign programs
|
|
|
|
|
||||
|
Marketing and sales incentive programs
|
|
|
|
|
||||
|
Tax payables
|
|
|
|
|
||||
|
Accrued expenses and deferred income
|
|
|
|
|
||||
|
Accrued employee benefits
|
|
|
|
|
||||
|
Lease liabilities
|
|
|
—
|
|
||||
|
Legal reserves and other provisions
|
|
|
|
|
||||
|
Contract reserve
|
|
|
|
|
||||
|
Contract liabilities
|
|
|
|
|
||||
|
Restructuring reserve
|
|
|
|
|
||||
|
Other
|
|
|
|
|
||||
|
Total
|
$
|
|
|
|
$
|
|
|
|
F-44
Warranty and Campaign Program
As described in “Note 2: Summary of Significant Accounting Policies,” CNH Industrial pays for basic warranty and other service action costs.
A summary of recorded activity for the basic warranty and campaign program accrual for the years ended
December 31, 2019
and
2018
are as follows:
|
2019
|
2018
|
|||||||
|
(in millions)
|
||||||||
|
Balance, beginning of year
|
$
|
|
|
$
|
|
|
||
|
Current year additions
|
|
|
|
|
||||
|
Claims paid
|
(
|
)
|
(
|
)
|
||||
|
Currency translation adjustment and other
|
(
|
)
|
(
|
)
|
||||
|
Balance, end of year
|
$
|
|
|
|
$
|
|
|
|
Advance on Buy-back Agreements
As described in “Note 2: Summary of Significant Accounting Policies,” the repurchase value of the asset relating to new vehicle sales with a buy-back commitment by Commercial and Specialty Vehicles is recognized as advances on buy-back agreements.
Restructuring Provision
The Company incurred restructuring costs of
$
109
million
,
$
61
million
and
$
93
million
for the years ended
December 31, 2019
,
2018
, and
2017
, respectively. These costs were as follows:
|
•
|
In
2019
, Commercial and Specialty Vehicles, Agriculture, Construction and Powertrain recorded
$
|
|
•
|
In
2018
, Commercial and Specialty Vehicles and Agriculture recorded
$
|
|
•
|
In
2017
, Commercial and Specialty Vehicles recorded
$
|
The following table sets forth restructuring activity for the years ended
December 31, 2019
,
2018
and
2017
:
F-45
|
Severance
and
Other
Employee
Costs
|
Facility
Related
Costs
|
Other
Restructuring
|
Total
|
|||||||||||||
|
(in millions)
|
||||||||||||||||
|
Balance at January 1, 2017
|
$
|
|
|
$
|
|
|
$
|
|
|
$
|
|
|
||||
|
Restructuring charges
|
|
|
|
|
|
|
|
|
||||||||
|
Reserves utilized: cash
|
(
|
)
|
(
|
)
|
|
|
(
|
)
|
||||||||
|
Reserves utilized: non-cash
|
(
|
)
|
(
|
)
|
|
|
(
|
)
|
||||||||
|
Currency translation adjustments
|
|
|
|
|
|
|
|
|
||||||||
|
Balance at December 31, 2017
|
$
|
|
|
|
$
|
|
|
|
$
|
|
|
|
$
|
|
|
|
|
Restructuring charges
|
|
|
|
|
|
|
|
|
||||||||
|
Reserves utilized: cash
|
(
|
)
|
|
|
(
|
)
|
(
|
)
|
||||||||
|
Reserves utilized: non-cash
|
(
|
)
|
|
|
|
|
(
|
)
|
||||||||
|
Currency translation adjustments
|
(
|
)
|
|
|
(
|
)
|
(
|
)
|
||||||||
|
Balance at December 31, 2018
|
$
|
|
|
|
$
|
|
|
|
$
|
|
|
|
$
|
|
|
|
|
Restructuring charges
|
|
|
(
|
)
|
|
|
|
|
||||||||
|
Reserves utilized: cash
|
(
|
)
|
|
|
(
|
)
|
(
|
)
|
||||||||
|
Reserves utilized: non-cash
|
|
|
(
|
)
|
(
|
)
|
(
|
)
|
||||||||
|
Currency translation adjustments
|
(
|
)
|
|
|
|
|
(
|
)
|
||||||||
|
Balance at December 31, 2019
|
$
|
|
|
|
$
|
|
|
|
$
|
|
|
|
$
|
|
|
|
As a global company with a diverse business portfolio, CNH Industrial is exposed to numerous legal risks, including dealer and supplier litigation, intellectual property right disputes, product warranty and defective product claims, product performance, asbestos, personal injury, emissions and/or fuel economy regulatory and contractual issues, and environmental claims that arise in the ordinary course of business. The most significant of these matters are described below.
The outcome of any current or future proceedings, claims or investigations cannot be predicted with certainty. Adverse decisions in one or more of these proceedings, claims or investigations could require the Company to pay substantial damages or undertake service actions, recall campaigns or other costly actions. It is therefore possible that legal judgments could give rise to expenses that are not covered, or not fully covered, by insurers’ compensation payments and could affect CNH Industrial’s financial position and results. When it is probable that such a loss has been incurred and the amount can be reasonably estimated, an accrual has been made against the Company’s earnings and included in “Other liabilities” on the consolidated balance sheets.
Although the ultimate outcome of legal matters pending against CNH Industrial and its subsidiaries cannot be predicted, the Company believes the reasonable possible range of losses for these unresolved legal matters in addition to the amounts accrued would not have a material effect on its consolidated financial statements.
Environmental
Pursuant to the U.S. Comprehensive Environmental Response, Compensation and Liability Act of 1980 (“CERCLA”), which imposes strict and, under certain circumstances, joint and several liability for remediation and liability for natural resource damages, and other federal and state laws that impose similar liabilities, CNH Industrial has received inquiries for information or notices of its potential liability regarding
66
non-owned U.S. sites at which regulated materials allegedly generated by CNH Industrial were released or disposed (“Waste Sites”). Of the Waste Sites,
16
are on the National Priority List (“NPL”) promulgated pursuant to CERCLA. For
60
of the Waste Sites, the monetary amount or extent of the Company’s liability has either been resolved; it has not been named as a potentially responsible party (“PRP”), or its liability is likely
de minimis
.
Because estimates of remediation costs are subject to revision as more information becomes available about the extent and cost of remediation and because settlement agreements can be reopened under certain circumstances, the Company’s potential liability for remediation costs associated with the
66
Waste Sites could change. Moreover, because liability under CERCLA and similar laws can be joint and several, CNH Industrial could be required to pay amounts in excess of its pro rata share of remediation costs. However, when appropriate, the financial strength of other PRPs has been considered in the determination of the Company’s potential liability. CNH
F-46
Industrial believes that the costs associated with the Waste Sites will not have a material effect on the Company’s business, financial position or results of operations.
The Company is conducting environmental investigatory or remedial activities at certain properties that are currently or were formerly owned and/or operated or that are being decommissioned. The Company believes that the outcome of these activities will not have a material adverse effect on its business, financial position, or results of operations.
The actual costs for environmental matters could differ materially from those costs currently anticipated due to the nature of historical handling and disposal of hazardous substances typical of manufacturing and related operations, the discovery of currently unknown conditions, and as a result of more aggressive enforcement by regulatory authorities and changes in existing laws and regulations. As in the past, CNH Industrial plans to continue funding its costs of environmental compliance from operating cash flows.
Investigation, analysis and remediation of environmental sites is a time consuming activity. The Company expects such costs to be incurred and claims to be resolved over an extended period of time that could exceed
30
years
for some sites. As of
December 31, 2019
and
2018
, environmental reserves of approximately
$
32
million
and
$
38
million
, respectively, were established to address these specific estimated potential liabilities. Such reserves are undiscounted and do not include anticipated recoveries, if any, from insurance companies. After considering these reserves, management is of the opinion that the outcome of these matters will not have a material adverse effect on the Company’s financial position or results of operations.
Other Litigation and Investigation
Follow-up on Damages Claims: Iveco S.p.A., the Company’s wholly owned subsidiary, and its competitors were subject to an investigation by the European Commission (the “Commission”) into certain business practices in the European Union in relation to M&H trucks. On July 19, 2016, the Commission announced a settlement with Iveco. Following the settlement, CNH Industrial has been named as defendant in private litigation commenced in various European jurisdictions and Israel by customers and other third parties, either acting individually or as part of a wider group or class of claimants. These claims remain at an early stage. Further, on the basis of the letters issued by a significant number of customers indicating that they may commence proceedings in the future, CNH Industrial expects to face further claims based on the same legal grounds in the same and various other jurisdictions. The extent and outcome of these claims cannot be predicted at this time.
Commitments
CNH Industrial has entered operating lease contracts for the right to use industrial buildings and equipment and other assets.
Refer to Note 8 for
future minimum lease payments under non-cancellable lease contracts
.
At
December 31, 2019
, Financial Services has various agreements to extend credit for the following financing arrangements:
|
Facility
|
Total
Credit
Limit
|
Utilized
|
Not
Utilized
|
|||||||||
|
(in millions)
|
||||||||||||
|
Wholesale and dealer financing
|
$
|
|
|
$
|
|
|
$
|
|
|
|||
Guarantees
The Company may elect to measure financial instruments and certain other items at fair value. This fair value option would be applied on an instrument-by-instrument basis with changes in fair value reported in earnings. The election can be made at the acquisition of an eligible financial asset, financial liability, or firm commitment, or when certain specified reconsideration events occur. The fair value election may not be revoked once made. The Company did not elect the fair value measurement option for eligible items.
Fair-Value Hierarchy
The hierarchy of valuation techniques for financial instruments is based on whether the inputs to those valuation techniques are observable or unobservable. Observable inputs reflect market data obtained from independent sources, while unobservable inputs reflect the Company’s market assumptions. These two types of inputs have created the following fair-value hierarchy:
Level 1—Quoted prices for
identical
instruments in active markets.
F-47
Level 2—Quoted prices for
similar
instruments in active markets; quoted prices for identical or similar instruments in markets that are not active; and model-derived valuations in which all significant inputs and significant value drivers are observable in active markets.
Level 3—Valuations derived from valuation techniques in which one or more significant inputs or significant value drivers are
unobservable.
This hierarchy requires the use of observable market data when available.
Determination of Fair Value
When available, the Company uses quoted market prices to determine fair value and classifies such items as Level 1. In some cases where a market price is not available, the Company will make use of observable market-based inputs to calculate fair value, in which case the items are classified as Level 2.
If quoted or observable market prices are not available, fair value is based upon internally developed valuation techniques that use, where possible, current market-based or independently sourced market parameters such as interest rates, currency rates, or yield curves. Items valued using such internally generated valuation techniques are classified according to the lowest level input or value driver that is significant to the valuation. Thus, an item may be classified as Level 3 even though there may be some significant inputs that are readily observable.
The following section describes the valuation methodologies used by the Company to measure various financial instruments at fair value, including an indication of the level in the fair value hierarchy in which each instrument is generally classified. Where appropriate, the description includes details of the valuation models and the key inputs to those models as well as any significant assumptions.
Derivatives
CNH Industrial utilizes derivative instruments to mitigate its exposure to interest rate and foreign currency exposures. Derivatives used as hedges are effective at reducing the risk associated with the exposure being hedged and are designated as a hedge at the inception of the derivative contract. CNH Industrial does not hold or enter into derivatives or other financial instruments for speculative purposes. The credit and market risk related to derivatives is reduced through diversification among various counterparties, utilizing mandatory termination clauses and/or collateral support agreements. Derivative instruments are generally classified as Level 2 in the fair value hierarchy. The cash flows underlying all derivative contracts were recorded in operating activities in the consolidated statements of cash flows.
Foreign Exchange Derivatives
CNH Industrial has entered into foreign exchange forward contracts and swaps in order to manage and preserve the economic value of cash flows in a currency different from the functional currency of the relevant legal entity. CNH Industrial conducts its business on a global basis in a wide variety of foreign currencies and hedges foreign currency exposures arising from various receivables, liabilities and expected inventory purchases and sales. Derivative instruments utilized to hedge the foreign currency risk associated with anticipated inventory purchases and sales in foreign currencies are designated as cash flow hedges. Gains and losses on these instruments are deferred in accumulated other comprehensive income (loss) and recognized in earnings when the related transaction occurs. The maturity of these instruments does not exceed
24
months
and the after-tax gains (losses) deferred in accumulated other comprehensive income (loss) that will be recognized in net sales and cost of goods sold over the next twelve months assuming foreign exchange rates remain unchanged is approximately
$(
73
) million
. If a derivative instrument is terminated because the hedge relationship is no longer effective or because the hedged item is a forecasted transaction that is no longer determined to be probable, the cumulative amount recorded in accumulated other comprehensive income (loss) is recognized immediately in earnings. Such amounts were insignificant in all periods presented.
CNH Industrial also uses forwards and swaps to hedge certain assets and liabilities denominated in foreign currencies. Such derivatives are considered economic hedges and not designated as hedging instruments. The changes in the fair values of these instruments are recognized directly in income in “Other, net” and are expected to offset the foreign exchange gains or losses on the exposures being managed.
All of CNH Industrial’s foreign exchange derivatives are considered Level 2 as the fair value is calculated using market data input and can be compared to actively traded derivatives. The total notional amount of CNH Industrial’s foreign exchange derivatives was
$
6.9
billion
and
$
7.2
billion
at
December 31, 2019
and
2018
, respectively.
Interest Rate Derivatives
CNH Industrial has entered into interest rate derivatives (swaps and caps) in order to manage interest rate exposures arising in the normal course of business. Interest rate derivatives that have been designated as cash flow hedges are being used by the Company to mitigate the risk of rising interest rates related to existing debt and anticipated issuance of fixed-rate debt in future periods. Gains and losses on these instruments, are deferred in accumulated other comprehensive income (loss) and recognized in interest expense over the period in
F-48
which CNH Industrial recognizes interest expense on the related debt. The after-tax gains (losses) deferred in accumulated other comprehensive income (loss) that will be recognized in interest expense over the next twelve months is insignificant.
Interest rate derivatives that have been designated as fair value hedge relationships have been used by CNH Industrial to mitigate the volatility in the fair value of existing fixed rate bonds and medium-term notes due to changes in floating interest rate benchmarks. Gains and losses on these instruments are recorded in “Interest expense” in the period in which they occur and an offsetting gain or loss is also reflected in “Interest expense” based on changes in the fair value of the debt instrument being hedged due to changes in floating interest rate benchmarks.
CNH Industrial also enters into offsetting interest rate derivatives with substantially similar terms that are not designated as hedging instruments to mitigate interest rate risk related to CNH Industrial’s committed asset-backed facilities. Unrealized and realized gains and losses resulting from fair value changes in these instruments are recognized directly in income. These facilities require CNH Industrial to enter into interest rate derivatives. To ensure that these transactions do not result in the Company being exposed to this risk, CNH Industrial enters into a compensating position. Net gains and losses on these instruments were insignificant for the years ending
December 31, 2019
,
2018
, and
2017
.
All of CNH Industrial’s interest rate derivatives outstanding as of
December 31, 2019
and
2018
are considered Level 2. The fair market value of these derivatives is calculated using market data input and can be compared to actively traded derivatives. The total notional amount of CNH Industrial’s interest rate derivatives was approximately
$
5.4
billion
and
$
5.4
billion
at
December 31, 2019
and
2018
, respectively.
Financial Statement Impact of CNH Industrial Derivatives
The following table summarizes the gross impact of changes in the fair value of derivatives designated as cash flow hedges on accumulated other comprehensive income (loss) and net income during the year ended
December 31, 2019
,
December 31, 2018
and
December 31, 2017
(in millions):
|
Recognized in Net Income
|
||||||||||
|
For the Year Ended December 31,
|
Gain (Loss) Recognized in Accumulated Other Comprehensive Income
|
Classification of Gain (Loss)
|
Gain (Loss) Reclassified from Accumulated Other Comprehensive Income into Income
|
|||||||
|
2019
|
||||||||||
|
Foreign exchange contracts
|
$
|
(
|
)
|
Net sales
|
$
|
|
|
|||
|
Cost of goods sold
|
(
|
)
|
||||||||
|
Other, net
|
(
|
)
|
||||||||
|
Interest expense, net
|
(
|
)
|
||||||||
|
Interest rate contracts
|
(
|
)
|
||||||||
|
Total
|
$
|
(
|
)
|
$
|
(
|
)
|
||||
|
2018
|
||||||||||
|
Foreign currency contracts
|
$
|
|
|
Net sales
|
$
|
(
|
)
|
|||
|
Cost of goods sold
|
|
|
||||||||
|
Other, net
|
|
|
||||||||
|
Interest expense, net
|
(
|
)
|
||||||||
|
Interest rate contracts
|
|
|
||||||||
|
Total
|
$
|
|
|
$
|
|
|
||||
|
2017
|
||||||||||
|
Foreign currency contracts
|
$
|
|
|
Net sales
|
$
|
|
|
|||
|
Cost of goods sold
|
(
|
)
|
||||||||
|
Other, net
|
|
|
||||||||
|
Interest expense, net
|
|
|
||||||||
|
Interest rate contracts
|
|
|
||||||||
|
Total
|
$
|
|
|
$
|
(
|
)
|
||||
F-49
The following table summarizes the activity in accumulated other comprehensive income related to the derivatives held by the Company during the years ended
December 31, 2019
and
2018
:
|
(in millions)
|
Before-Tax Amount
|
Income Tax
|
After-Tax Amount
|
|||||||||
|
Accumulated derivative net losses as of December 31, 2018
|
$
|
(
|
)
|
$
|
(
|
)
|
$
|
(
|
)
|
|||
|
Net changes in fair value of derivatives
|
(
|
)
|
|
|
(
|
)
|
||||||
|
Net losses reclassified from accumulated other comprehensive income into income
|
|
|
(
|
)
|
|
|
||||||
|
Accumulated derivative net losses as of December 31, 2019
|
$
|
(
|
)
|
$
|
|
|
$
|
(
|
)
|
|||
|
(in millions)
|
Before-Tax Amount
|
Income Tax
|
After-Tax Amount
|
|||||||||
|
Accumulated derivative net losses as of December 31, 2017
|
$
|
|
|
$
|
|
|
$
|
|
|
|||
|
Net changes in fair value of derivatives
|
|
|
(
|
)
|
(
|
)
|
||||||
|
Net losses reclassified from accumulated other comprehensive income into income
|
(
|
)
|
|
|
(
|
)
|
||||||
|
Accumulated derivative net losses as of December 31, 2018
|
$
|
(
|
)
|
$
|
(
|
)
|
$
|
(
|
)
|
|||
|
(in millions)
|
Before-Tax Amount
|
Income Tax
|
After-Tax Amount
|
|||||||||
|
Accumulated derivative net losses as of December 31, 2016
|
$
|
(
|
)
|
$
|
(
|
)
|
$
|
(
|
)
|
|||
|
Net changes in fair value of derivatives
|
|
|
|
|
|
|
||||||
|
Net losses reclassified from accumulated other comprehensive income into income
|
|
|
|
|
|
|
||||||
|
Accumulated derivative net losses as of December 31, 2017
|
$
|
|
|
$
|
|
|
$
|
|
|
|||
The following tables summarize the impact that changes in the fair value of fair value hedges and derivatives not designated as hedging instruments had on earnings for the year ended
December 31, 2019
and
2018
:
|
For the Year Ended December 31,
|
|||||||||||||
|
(in millions)
|
Classification of Gain
|
2019
|
2018
|
2017
|
|||||||||
|
Fair Value Hedges
|
|||||||||||||
|
Interest rate derivatives
|
Interest expense
|
$
|
|
|
$
|
|
|
$
|
(
|
)
|
|||
|
Not Designated as Hedges
|
|||||||||||||
|
Foreign exchange contracts
|
Other, Net
|
$
|
(
|
)
|
$
|
|
|
$
|
(
|
)
|
|||
The fair values of CNH Industrial’s derivatives as of
December 31, 2019
and
December 31, 2018
in the condensed consolidated balance sheets are recorded as follows:
F-50
|
December 31, 2019
|
December 31, 2018
|
|||||||||
|
(in millions)
|
Balance Sheet Location
|
Fair Value
|
Balance Sheet Location
|
Fair Value
|
||||||
|
Derivatives designated as hedging instruments under Subtopic 815-20
|
||||||||||
|
Interest rate contracts
|
Derivative assets
|
|
|
Derivative assets
|
|
|
||||
|
Foreign currency contracts
|
Derivative assets
|
|
|
Derivative assets
|
|
|
||||
|
Total derivative assets designated as hedging instruments
|
|
|
|
|
||||||
|
Interest rate contracts
|
Derivative liabilities
|
|
|
Derivative liabilities
|
|
|
||||
|
Foreign currency contracts
|
Derivative liabilities
|
|
|
Derivative liabilities
|
|
|
||||
|
Total derivative liabilities designated as hedging instruments
|
|
|
|
|
||||||
|
Derivatives not designated as hedging instruments under Subtopic 815-20
|
||||||||||
|
Interest rate contracts
|
Derivative assets
|
|
|
Derivative assets
|
|
|
||||
|
Foreign currency contracts
|
Derivative assets
|
|
|
Derivative assets
|
|
|
||||
|
Total derivative assets not designated as hedging instruments
|
|
|
|
|
||||||
|
Interest rate contracts
|
Derivative liabilities
|
|
|
Derivative liabilities
|
|
|
||||
|
Foreign currency contracts
|
Derivative liabilities
|
|
|
Derivative liabilities
|
|
|
||||
|
Total derivative liabilities not designated as hedging instruments
|
|
|
|
|
||||||
Items Measured at Fair Value on a Recurring Basis
The following tables present for each of the fair-value hierarchy levels the Company’s assets and liabilities that are measured at fair value on a recurring basis at
December 31, 2019
and
December 31, 2018
:
|
Level 1
|
Level 2
|
Total
|
|||||||||||||||||||||
|
December 31, 2019
|
December 31, 2018
|
December 31, 2019
|
December 31, 2018
|
December 31, 2019
|
December 31, 2018
|
||||||||||||||||||
|
(in millions)
|
|||||||||||||||||||||||
|
Assets
|
|||||||||||||||||||||||
|
Foreign exchange derivatives
|
$
|
|
|
$
|
|
|
$
|
|
|
$
|
|
|
$
|
|
|
$
|
|
|
|||||
|
Interest rate derivatives
|
|
|
|
|
|
|
|
|
|
|
|
|
|||||||||||
|
Investments
|
|
|
|
|
|
|
|
|
|
|
|
|
|||||||||||
|
Total Assets
|
$
|
|
|
$
|
|
|
$
|
|
|
$
|
|
|
$
|
|
|
$
|
|
|
|||||
|
Liabilities
|
|||||||||||||||||||||||
|
Foreign exchange derivatives
|
$
|
|
|
$
|
|
|
$
|
(
|
)
|
$
|
(
|
)
|
$
|
(
|
)
|
$
|
(
|
)
|
|||||
|
Interest rate derivatives
|
|
|
|
|
(
|
)
|
(
|
)
|
(
|
)
|
(
|
)
|
|||||||||||
|
Total Liabilities
|
$
|
|
|
$
|
|
|
$
|
(
|
)
|
$
|
(
|
)
|
$
|
(
|
)
|
$
|
(
|
)
|
|||||
Fair Value of Other Financial Instruments
The carrying value of cash and cash equivalents, restricted cash, trade accounts receivable and accounts payable included in the condensed consolidated balance sheets approximates its fair value.
F-51
Financial Instruments Not Carried at Fair Value
The estimated fair market values of financial instruments not carried at fair value in the condensed consolidated balance sheets as of
December 31, 2019
and 2018 are as follows:
|
December 31, 2019
|
December 31, 2018
|
||||||
|
Carrying
Amount |
Fair
Value |
Carrying
Amount |
Fair
Value |
||||
|
(in millions)
|
|||||||
|
Financing receivables
|
$
|
$
|
$
|
$
|
|||
|
Debt
|
$
|
$
|
$
|
$
|
|||
Financing Receivables
The fair value of financing receivables is based on the discounted values of their related cash flows at current market interest rates and they are classified as a Level 3 fair value measurement.
Debt
All debt is classified as a Level 2 fair value measurement with the exception of bonds issued by CNH Industrial Finance Europe S.A. and bonds issued by CNH Industrial N.V. that are classified as a Level 1 fair value measurement.
The Articles of Association of CNH Industrial N.V. provide for authorized share capital of
€
40
million
, divided into
2
billion
common shares and
2
billion
special voting shares to be held with associated common shares, each with a per share par value of
€
0.01
. As of
December 31, 2019
, the Company’s share capital was
€
18
million
(equivalent to
$
25
million
), fully paid-in, and consisted of
1,364,400,196
common shares (
1,350,132,117
common shares outstanding, net of
14,268,079
common shares held in treasury by the Company as described in the following section) and
396,474,276
special voting shares (
387,951,166
special voting shares outstanding, net of
8,523,110
special voting shares held in treasury by the Company as described in the section below).
Changes in the composition of the share capital of CNH Industrial during
2019
,
2018
, and
2017
are as follows:
|
(number of shares)
|
CNH Industrial
N.V. Common
Shares
|
CNH Industrial
N.V. Loyalty Program Special
Voting Shares
|
Total CNH
Industrial N.V.
Shares
|
||||||
|
Total CNH Industrial N.V. shares at December 31, 2016
|
|
|
|
|
|
|
|||
|
Capital increase
|
|
|
—
|
|
|
|
|||
|
Common Stock Repurchase
|
(
|
)
|
|
|
(
|
)
|
|||
|
Retirement of special voting shares
|
—
|
|
(
|
)
|
(
|
)
|
|||
|
Total CNH Industrial N.V. shares at December 31, 2017
|
|
|
|
|
|
|
|
|
|
|
Capital increase
|
|
|
—
|
|
|
|
|||
|
Common stock repurchases
|
(
|
)
|
—
|
|
(
|
)
|
|||
|
Retirement of special voting shares
|
—
|
|
(
|
)
|
(
|
)
|
|||
|
Total CNH Industrial N.V. shares at December 31, 2018
|
|
|
|
|
|
|
|
|
|
|
Capital increase
|
|
|
—
|
|
|
|
|||
|
Common stock repurchases
|
(
|
)
|
—
|
|
(
|
)
|
|||
|
Retirement of special voting shares
|
—
|
|
(
|
)
|
(
|
)
|
|||
|
Total CNH Industrial N.V. shares at December 31, 2019
|
|
|
|
|
|
|
|
|
|
During the year ended
December 31, 2019
and
2018
,
0.8
million
and
0.2
million
special voting shares, respectively, were acquired by the Company following the de-registration of the corresponding number of qualifying common shares from the Loyalty Register, net of transfer and allocation of special voting shares in accordance with the Special Voting Shares – Terms and Conditions. On September 15, 2017, the Company canceled
78,000,000
special voting shares held in treasury, consequently, the total amount of issued special voting shares was reduced from
474,474,276
to
396,474,276
.
F-52
Furthermore, during the years ended
December 31, 2019
and
2018
, the Company delivered
2.6
million
and
2.7
million
common shares, respectively, under the Company’s stock compensation plan, primarily due to the vesting or exercise of share-based awards. See “Note 17: Share Based Compensation” for further discussion.
Loyalty Voting Program
In order to reward long-term ownership of the Company’s common shares and promote stability of its shareholder base, the Articles of Association of CNH Industrial N.V. provide for a loyalty voting program that grants eligible long-term shareholders the equivalent of
two
votes for each CNH Industrial N.V. common share that they hold. This has been accomplished through the issuance of special voting shares.
A shareholder may at any time elect to participate in the loyalty voting program by requesting the registration of all or some of the common shares held by such shareholder in a separate register (the “Loyalty Register”) of the Company. If such common shares have been registered in the Loyalty Register for an uninterrupted period of
three years
in the name of the same shareholder, such
shares will become “Qualifying Common Shares” and the relevant shareholder will be entitled to receive one special voting share for each such Qualifying Common Share
which can be retained only for so long as the shareholder retains the associated common share and registers it in the Loyalty Register.
Shareholders are not required to pay any amount to the Company in connection with the allocation of the special voting shares.
The common shares are freely transferable, while, special voting shares are transferable exclusively in limited circumstances and they are not listed on the NYSE or the MTA. In particular, at any time, a holder of common shares that are Qualifying Common Shares who wants to transfer such common shares other than in limited specified circumstances (e.g., transfers to affiliates or relatives through succession, donation or other transfers) must request a de-registration of such Qualifying Common Shares from the Loyalty Register. After de-registration from the Loyalty Register, such common shares no longer qualify as Qualifying Common Shares and, as a result, the holder of such common shares is required to transfer the special voting shares associated with the transferred common shares to the Company for no consideration.
The special voting shares have minimal economic entitlements as the purpose of the special voting shares is to grant long-term shareholders with an extra voting right by means of granting an additional special voting share, without granting such shareholders with any additional economic rights. However, as a matter of Dutch law, such special voting shares cannot be fully excluded from economic entitlements. Therefore, the Articles of Association provide that only a minimal dividend accrues to the special voting shares, which is not distributed, but allocated to a separate special dividend reserve. The impact of this special voting dividend reserve on the earnings per share of the common shares is not material.
Treasury
Shares
In order to maintain the necessary operating flexibility over an adequate time period, including the implementation of the program in place, on April 12, 2019 the Annual General Meeting ("AGM") granted to the Board of Directors the authority to acquire common shares in the capital of the Company through stock exchange trading on the MTA and the NYSE or otherwise for a period of
18
months
(i.e., up to and including October 11, 2020). Under such authorization the Board's authority is limited to a maximum of up to
10
%
of the issued common shares as of
the date of the AGM and, in compliance with applicable rules and regulations, subject to a maximum price per common share equal to the average of the highest price on each of the five trading days prior to the date of acquisition, as shown in the Official Price List of the MTA or NYSE (as the case may be) plus
10
%
(maximum price) and to a minimum price per common share equal to the average of the lowest price on each of the five trading days prior to the date of acquisition, as shown in the Official Price List of the MTA or NYSE (as the case may be) minus
10
%
(minimum price). In the framework of the buy-back authorization granted by the AGM held on April 12, 2019 and following the expiration of the buy-back program previously in place, in November 2019 the Company launched its new share buy-back program (the "Program"). The Program involves the repurchase from time to time of up to
$
700
million
in the Company’s common shares and is intended to optimize the capital structure of the Company and to meet the obligations arising from the Company’s equity incentive plans. The Program has a duration up to and including October 11, 2020 and will be funded by the Company’s liquidity.
Neither the renewal of the authorization
nor the launch of any program obliges the Company to buy-back any common shares. In any event, such program may be suspended, discontinued or modified at any time for any reason and without previous notice, in accordance with applicable laws and regulations.
During the year ended
December 31, 2019
, the Company repurchased
6.3
million
shares of its common stock on the MTA and on multilateral trading facilities ("MTFs") under the buy-back program at an aggregate cost of
$
57
million
. As of
December 31, 2019
, the Company held
14.3
million
common shares in treasury, net of transfers of common shares to fulfill its obligations under its stock compensation plans, at an aggregate cost of
$
153
million
. Depending on market and business conditions and other factors, the Company may continue or suspend purchasing its common stock at any time without notice.
F-53
At the 2020 Annual General Meeting of Shareholders, the Board of Directors intends to recommend to the Company’s shareholders the renewal of the authorization to repurchase up to a maximum of
10
%
of the Company’s issued common shares.
During the year ended
December 31, 2019
, the Company acquired approximately
0.8
million
special voting shares following the de-registration of qualifying common shares from the Loyalty Register, net of the transfer and allocation of special voting shares to those shareholders whose qualifying common shares became eligible to receive special voting shares after the uninterrupted three-year registration period in the Loyalty Register. As of
December 31, 2019
, the Company held
8.5
million
special voting shares in treasury.
Dividend
On March 3, 2020 the Board of Directors of CNH Industrial N.V. recommended and proposed to the Company’s shareholders that the Company declare a dividend of
€
0.18
per common share, totaling approximately
€
243
million
(equivalent to approximately
$
267
million
, translated at the exchange rate reported by the European Central Bank on February 28, 2020). The proposal is subject to the approval of the Company’s shareholders at the AGM to be held on April 16, 2020.
At the AGM held by CNH Industrial on April 12, 2019, shareholders approved the payment of a dividend of
€
0.18
per common share. The dividend was paid in May 2018 for a total amount of
€
244
million
(
$
275
million
). The Company shall only have power to make distributions to shareholders and other persons entitled to distributable profits to the extent the Company’s equity exceeds the sum of the paid-up portion of the share capital and the reserves that must be maintained in accordance with provision of law. No distribution of profits may be made to the Company itself for shares that the Company holds in its own share capital.
For the years ended
December 31, 2019
,
2018
, and
2017
CNH Industrial recognized total share-based compensation expense of
$
33
million
,
$
35
million
, and
$
19
million
respectively. For the years ended
December 31, 2019
,
2018
and
2017
, CNH Industrial recognized a total tax benefit relating to share-based compensation expense of
$
3
million
,
$
3
million
and
$
1
million
, respectively. As of
December 31, 2019
, CNH Industrial had unrecognized share-based compensation expense related to nonvested awards of approximately
$
10
million
based on current assumptions related to achievement of specified performance objectives, when applicable. Unrecognized share-based compensation costs will be recognized over a weighted-average period of
0.6
years
.
CNH Industrial’s equity awards are governed by several plans: i) CNH Industrial N.V. Equity Incentive Plan (“CNH Industrial EIP”); ii) CNH Industrial N.V. Directors’ Compensation Plan (“CNH Industrial DCP”); iii) CNH Global N.V. Directors’ Compensation Plan (“CNH DCP”); and, iv) CNH Global N.V. Equity Incentive Plan (“CNH EIP”).
CNH Industrial N.V. Equity Incentive Plan (“CNH Industrial EIP”)
At the AGM held on April 16, 2014, the Company’s shareholders approved the adoption of the CNH Industrial EIP, an umbrella program defining the terms and conditions for any subsequent long-term incentive program, whose main features are as follows:
|
•
|
The EIP allows grants of the following specific types of equity awards to any current or prospective executive director, officer or employee of, or service provider to, CNH Industrial: stock options, stock appreciation rights, restricted share units, restricted stock, performance shares or performance share units and other stock-based awards that are payable in cash, common shares or any combination thereof subject to the terms and conditions established by the Compensation Committee.
|
|
•
|
The EIP authorized
|
|
•
|
The EIP will terminate at, and no more awards will be permitted to be granted thereunder
|
Performance Share Units
In 2014, CNH Industrial issued a one-time grant of Performance Share Units ("PSU’s") to its then Chief Executive Officer and selected key employees, with financial performance goals covering the
five
-year period from January 1, 2014 to December 31, 2018. This PSU grant totaled approximately
12
million
units. Prorated share amounts covering performance through this same period were issued to new employees entering the plan. One third of the total grant was expected to vest in February 2017, but such grants did not vest as both the performance and market conditions for the performance period 2014 through 2016 were not met.
In December 2017, CNH Industrial canceled all PSU’s issued in 2014, 2015 and 2016 and issued a grant of PSU's to its then Chief Executive Officer and selected key employees, with financial performance goals covering the
three
-year period from January 1, 2017 to December 31, 2019. This PSU grant totaled approximately
7
million
units. In
2018
and 2019, prorated share amounts covering performance through this same period were issued to new employees entering the plan.
0.6
million additional PSU's were granted in
2018
. Furthermore,
F-54
in
2019
,
0.4
million additional PSU's were granted. The performance goal is a market condition with a payout schedule ranging from
0
%
to
130
%
. In addition, there is a performance condition that if not met, reduces the payout by
30
%
. Accordingly, the total number of shares that will eventually be granted may vary from the original estimate of
7
million
shares. The awards cliff vest on
February 28, 2020
to the extent that the market condition is met upon completion of the performance period on
December 31, 2019
.
The fair values of the awards are calculated using the Monte Carlo Simulation model. The weighted average fair value of the awards that were issued in
2019
and
2018
is
$
5.19
and
$
8.69
per share, respectively.
As a significant majority of the awards (approximately
79
%
of total awards as of
December 31, 2019
) were issued on December 22, 2017, the key assumptions utilized to calculate the grant-date fair values for awards issued on this grant date are listed below:
|
Key Assumptions for awards issued on
|
||
|
December 22, 2017
|
||
|
Expected Volatility
|
|
|
|
Dividend yield
|
|
|
|
Risk-free rate
|
|
|
The expected volatility is based on the daily stock price movements experienced by the common shares of CNH Industrial over a
three years
period ending on the grant date. The expected dividend yield was based on CNH Industrial’s historical dividend payout as management expected the dividend payout for future years to be consistent. The risk-free interest rate was based on the yields of three-year U.S. Treasury bonds.
The following table reflects the activity of performance-based share units under CNH Industrial EIP for the year ended
December 31, 2019
:
|
2019
|
|||||||
|
Performance
Shares
|
Weighted
Average
Grant-Date
Fair Value
|
||||||
|
Nonvested at beginning of year
|
|
|
$
|
|
|
||
|
Granted
|
|
|
$
|
|
|
||
|
Forfeited/Cancelled
|
(
|
)
|
$
|
|
|
||
|
Vested
|
|
|
$
|
|
|
||
|
Nonvested at end of year
|
|
|
$
|
|
|
||
Restricted Share Units
In
2017
,
2018
, and
2019
, CNH Industrial issued approximately
4
million
,
1
million
, and
0.8
million
Restricted Share Units (“RSUs”) to the Chairperson, CEO and selected employees with a weighted average fair value of
$
13.23
,
$
11.63
, and
$
9.95
per share, respectively. These shares are primarily set to vest in three equal tranches over a
three years
period. The fair value of the award is measured using the stock price on the grant date adjusted for the present value of future dividends that employees will not receive during the vesting period.
CNH Industrial issued
500
thousand
restricted share units to the CEO of CNH Industrial on September 17, 2018. The weighted average fair value of these shares was
$
11.63
per share, measured using the stock price on the grant date adjusted for the present value of future dividends that the CEO would not receive during the vesting period. These shares are service based and vest in 3 tranches. The first and second tranches of
82
thousand
and
339
thousand
shares vested on June 30, 2019 and September 17, 2019, respectively. The third tranche of
82
thousand
is due to vest on June 30, 2020. On April 3, 2019 CNH Industrial issued an additional
97
thousand
restricted share units to the CEO of CNH Industrial. The weighted average fair value of these shares was
$
10.18
per share. These shares are scheduled to vest on February 1, 2021.
CNH Industrial issued
20
thousand
restricted share units to the Chairperson of CNH Industrial on January 15, 2019. The weighted average fair value of these shares was
$
9.69
per share measured using the stock price on the grant date adjusted for the present value of future dividends that the Chairperson would not receive during the vesting period. These shares are service based and vested in 2 tranches. The first tranche of
10
thousand
shares vested on June 30, 2019. The second tranche of
10
thousand
shares is due to vest on June 30, 2020.
F-55
The following table reflects the activity of restricted share units under CNH Industrial EIP for the year ended
December 31, 2019
:
|
2019
|
|||||||
|
Restricted
Shares
|
Weighted
Average
Grant-Date
Fair Value
|
||||||
|
Nonvested at beginning of year
|
|
|
$
|
|
|
||
|
Granted
|
|
|
$
|
|
|
||
|
Forfeited
|
(
|
)
|
$
|
|
|
||
|
Vested
|
(
|
)
|
$
|
|
|
||
|
Nonvested at end of year
|
|
|
$
|
|
|
||
CNH Industrial N.V. Directors’ Compensation Plan (“CNH Industrial DCP”)
On September 9, 2013, the CNH Industrial DCP was approved by the shareholders and adopted by the Board of Directors of CNH Industrial. On April 14, 2017, shareholders approved a proposed amendment to the CNH Industrial DCP pursuant to which non-executive directors would only be paid cash compensation for their service as a director. The CNH Industrial DCP provides for the payment of the following to eligible members of the CNH Industrial Board in the form of cash, provided that such members do not receive salary or other employment compensation from CNH Industrial or FCA, and their subsidiaries and affiliates:
|
•
|
$
|
|
•
|
An additional
$
|
|
•
|
An additional
$
|
Prior to the amendment of the CNH Industrial DCP, each quarter of the CNH Industrial DCP year, the eligible directors elected the form of payment of their fees. If the elected form was common shares, the eligible director would receive as many common shares as equal to the amount of fees the director elected to be paid in common shares, divided by the fair market value of a CNH Industrial common share on the date that the quarterly payment was made. Common shares issued to the eligible director vested immediately upon grant. If an eligible director elected to receive all or a portion of fees in the form of a stock option, the number of common shares underlying the stock option was determined by dividing (i) by (ii) where (i) equals the dollar amount of the quarterly payment that the eligible director elected to receive in the form of stock options multiplied by four and (ii) the fair market value of the common shares on the date that the quarterly payment was made. The CNH Industrial DCP defined fair market value, as applied to each ordinary share, to be equal to the average of the highest and lowest sale price of a CNH Industrial common share during normal trading hours on the last trading day of each plan quarter in which sales of common shares on the New York Stock Exchange are recorded. Stock options granted as a result of such an election vested immediately, but shares purchased under options cannot be sold for
six months
following the date of exercise. Stock options terminate upon the earlier of: (1)
ten years
after the grant date; or (2)
six months
after the date an individual ceases to be a director.
There were
0.2
million
common shares authorized for issuance under the CNH Industrial DCP. The weighted average fair value for the stock options that were issued in
2015
was
$
1.65
.
No
stock options were issued under this plan in
2019
or
2018
and as of
December 31, 2019
,
no
stock options were outstanding under the CNH Industrial DCP.
CNH Global Directors’ Compensation Plan (“CNH DCP”)
CNH Global Directors’ Compensation Plan stipulated the right for directors of former CNH Global to be compensated in the form of cash, and/or common shares of CNH Global N.V., and/or options to purchase common shares of CNH Global. On September 29, 2013, CNH Industrial assumed the sponsorship of the CNH DCP in connection with the Merger. Stock options issued under the CNH DCP were converted using the CNH Global exchange ratio of
3.828
CNH Industrial shares for each CNH Global common share and exercisable for common shares of CNH Industrial N.V. upon September 29, 2013. All of the outstanding stock options from the CNH DCP were exercised or forfeited during 2018. The CNH DCP was terminated effective as of the Merger and no new equity awards will be issued under the CNH DCP.
CNH Global Equity Incentive Plan (the “CNH EIP”)
The CNH Global Equity Incentive Plan provides for grants of stock options, restricted share units and performance share units to former officers and employees of CNH Global. On September 29, 2013, CNH Industrial assumed the sponsorship of the CNH EIP in connection
F-56
with the Merger. CNH Industrial can not issue any new equity awards under the CNH EIP; however, CNH Industrial is required to issue shares under the CNH EIP to settle the exercise or vesting of the existing equity awards.
On September 29, 2013, outstanding stock options, unvested restricted share units and performance share units under the CNH EIP became exercisable or convertible for common shares of CNH Industrial N.V. The number of shares of outstanding equity awards was increased and exercise price of stock options reduced to take into account the CNH Global exchange ratio of
3.828
CNH Industrial shares for each CNH Global common share. The conversion did not change the aggregate fair value of the outstanding equity awards and, therefore, resulted in no additional share-based compensation expense in 2013.
Stock Option Plan
In September 2012, approximately
2.7
million
performance-based stock options (at target award levels) were issued under the CNH EIP (the “2012 Grant”). Upon the achievement of CNH Global’s 2012 target performance objective, approximately
4
million
of options were granted. These options vested in three equal tranches in February 2012, 2013 and 2014. Options granted under the CNH EIP have a contractual life of
five years
from the initial vesting date.
Additional Share-Based Compensation Information
The table below provides additional share-based compensation information for the years ended
December 31, 2019
,
2018
, and
2017
:
|
2019
|
2018
|
2017
|
||||||||||
|
(in millions)
|
||||||||||||
|
Total intrinsic value of options exercised and shares vested
|
$
|
|
|
$
|
|
|
$
|
|
|
|||
|
Fair value of shares vested
|
$
|
|
|
$
|
|
|
$
|
|
|
|||
|
Cash received from share award exercises
|
$
|
|
|
$
|
|
|
$
|
|
|
|||
|
Tax benefit of options exercised and shares vested
|
$
|
|
|
$
|
|
|
$
|
|
|
|||
The Company’s basic earnings per share (“EPS”) is computed by dividing net income available to common shareholders by the weighted-average number of common shares outstanding during the period.
Diluted EPS reflects the potential dilution that could occur if dilutive securities were exercised into common stock. The effect of dilutive securities is calculated using the treasury stock method.
The following table sets forth the computation of basic EPS and diluted EPS for the years ended
December 31, 2019
,
2018
and
2017
.
|
2019
|
2018
|
2017
|
||||||||||
|
(in millions, except per share data)
|
||||||||||||
|
Basic:
|
||||||||||||
|
Net income (loss) attributable to CNH Industrial
|
$
|
|
|
$
|
|
|
$
|
|
|
|||
|
Weighted average common shares outstanding—basic
|
|
|
|
|
|
|
||||||
|
Basic earnings per share
|
$
|
|
|
$
|
|
|
$
|
|
|
|||
|
Diluted:
|
||||||||||||
|
Net income (loss) attributable to CNH Industrial
|
$
|
|
|
$
|
|
|
$
|
|
|
|||
|
Weighted average common shares outstanding—basic
|
|
|
|
|
|
|
||||||
|
Effect of dilutive securities (when dilutive):
|
||||||||||||
|
Stock compensation plans
|
|
|
|
|
|
|
||||||
|
Weighted average common shares outstanding—diluted (A)
|
|
|
|
|
|
|
||||||
|
Diluted earnings per share
|
$
|
|
|
$
|
|
|
$
|
|
|
|||
|
(A)
|
For the twelve months ended
December 31, 2019
,
2018
and 2017,
|
F-57
The Company’s share of comprehensive income (loss) includes net income plus other comprehensive income, which includes changes in fair value of certain derivatives designated as cash flow hedges, certain changes in pension and other retirement benefit plans, foreign currency translation gains and losses, changes in the fair value of available-for-sale securities, the Company’s share of other comprehensive income of entities accounted for using the equity method, and reclassifications for amounts included in net income less net income and other comprehensive income attributable to the noncontrolling interest. For more information on the Company’s derivative instruments, see “Note 15: Financial Instruments”. For more information on the Company’s pensions and retirement benefit obligations, see “Note 12: Employee Benefit Plans and Postretirement Benefits”. The Company’s other comprehensive income (loss) amounts are aggregated within accumulated other comprehensive income (loss).
The tax effect for each component of other comprehensive income (loss) consisted of the following:
|
Year Ended December 31, 2019
|
||||||||||||
|
(in millions)
|
Gross
Amount
|
Income
Taxes
|
Net
Amount
|
|||||||||
|
Unrealized gain (loss) on cash flow hedges
|
$
|
(
|
)
|
$
|
|
|
$
|
(
|
)
|
|||
|
Changes in retirement plans’ funded status
|
(
|
)
|
|
|
(
|
)
|
||||||
|
Foreign currency translation
|
|
|
|
|
|
|
||||||
|
Share of other comprehensive loss of entities using the equity method
|
(
|
)
|
|
|
(
|
)
|
||||||
|
Other comprehensive loss
|
$
|
(
|
)
|
|
$
|
|
|
|
$
|
(
|
)
|
|
|
Year Ended December 31, 2018
|
||||||||||||
|
(in millions)
|
Gross
Amount
|
Income
Taxes
|
Net
Amount
|
|||||||||
|
Unrealized gain (loss) on cash flow hedges
|
$
|
(
|
)
|
$
|
(
|
)
|
$
|
(
|
)
|
|||
|
Changes in retirement plans’ funded status
|
|
|
(
|
)
|
|
|
||||||
|
Foreign currency translation
|
(
|
)
|
|
|
(
|
)
|
||||||
|
Share of other comprehensive loss of entities using the equity method
|
(
|
)
|
|
|
(
|
)
|
||||||
|
Other comprehensive income
|
$
|
|
|
|
$
|
(
|
)
|
|
$
|
|
|
|
|
Year Ended December 31, 2017
|
||||||||||||
|
(in millions)
|
Gross
Amount
|
Income
Taxes
|
Net
Amount
|
|||||||||
|
Unrealized gain (loss) on cash flow hedges
|
$
|
|
|
$
|
|
|
$
|
|
|
|||
|
Changes in retirement plans’ funded status
|
|
|
(
|
)
|
|
|
||||||
|
Foreign currency translation
|
(
|
)
|
|
|
(
|
)
|
||||||
|
Share of other comprehensive loss of entities using the equity method
|
|
|
|
|
|
|
||||||
|
Other comprehensive loss
|
$
|
(
|
)
|
|
$
|
(
|
)
|
|
$
|
(
|
)
|
|
F-58
The changes, net of tax, in each component of accumulated other comprehensive income (loss) consisted of the following:
|
(in millions)
|
Unrealized
Gain (Loss) on
Cash Flow
Hedges
|
Change in
Retirement Plans’
Funded
Status
|
Foreign
Currency
Translation
|
Share of Other
Comprehensive
Income of
Entities Using
the Equity
Method
|
Total
|
|||||||||||||||
|
Balance, December 31, 2016
|
$
|
(
|
)
|
$
|
(
|
)
|
$
|
(
|
)
|
$
|
(
|
)
|
$
|
(
|
)
|
|||||
|
Other comprehensive income (loss), before reclassifications
|
|
|
|
|
(
|
)
|
|
|
(
|
)
|
||||||||||
|
Amounts reclassified from other comprehensive income
|
|
|
|
|
|
|
|
|
|
|
||||||||||
|
Other comprehensive income (loss)
1
|
|
|
|
|
|
|
(
|
)
|
|
|
|
|
(
|
)
|
||||||
|
Balance, December 31, 2017
|
|
|
|
(
|
)
|
|
(
|
)
|
|
$
|
(
|
)
|
|
$
|
(
|
)
|
||||
|
Other comprehensive income (loss), before reclassifications
|
(
|
)
|
|
|
(
|
)
|
(
|
)
|
|
|
||||||||||
|
Amounts reclassified from other comprehensive income (loss)
|
(
|
)
|
|
|
|
|
|
|
(
|
)
|
||||||||||
|
Other comprehensive income (loss)
1
|
(
|
)
|
|
|
|
|
(
|
)
|
|
(
|
)
|
|
|
|
||||||
|
Balance, December 31, 2018
|
$
|
(
|
)
|
|
$
|
(
|
)
|
|
$
|
(
|
)
|
|
$
|
(
|
)
|
|
$
|
(
|
)
|
|
|
Other comprehensive income (loss), before reclassifications
|
(
|
)
|
(
|
)
|
|
|
(
|
)
|
(
|
)
|
||||||||||
|
Amounts reclassified from other comprehensive income
|
|
|
(
|
)
|
|
|
|
|
|
|
||||||||||
|
Other comprehensive income (loss)
1
|
(
|
)
|
|
(
|
)
|
|
|
|
|
(
|
)
|
|
(
|
)
|
||||||
|
Reclassification of certain tax effects
|
|
|
(
|
)
|
|
|
|
|
(
|
)
|
||||||||||
|
Balance, December 31, 2019
|
$
|
(
|
)
|
|
(
|
)
|
|
$
|
(
|
)
|
|
$
|
(
|
)
|
|
$
|
(
|
)
|
||
|
(1)
|
Excluded from the table above is other comprehensive (income) loss allocated to noncontrolling interests of
$(
|
Significant amounts reclassified out of each component of accumulated other comprehensive income (loss) in
December 31, 2019
and
2018
consisted of the following:
|
Amount Reclassified from Other
Comprehensive Income (Loss)
|
Consolidated Statement
of Operations line
|
|||||||||
|
2019
|
2018
|
|||||||||
|
(in millions)
|
||||||||||
|
Cash flow hedges
|
$
|
|
|
$
|
|
|
Net sales
|
|||
|
|
|
(
|
)
|
Cost of goods sold
|
||||||
|
|
|
(
|
)
|
Other, net
|
||||||
|
|
|
|
|
Interest expense
|
||||||
|
(
|
)
|
|
|
Income taxes
|
||||||
|
$
|
|
|
|
$
|
(
|
)
|
||||
|
Change in retirement plans’ funded status:
|
||||||||||
|
Amortization of actuarial losses
|
$
|
|
|
$
|
|
|
*
|
|||
|
Amortization of prior service cost
|
(
|
)
|
(
|
)
|
*
|
|||||
|
|
|
|
|
Income taxes
|
||||||
|
$
|
(
|
)
|
|
$
|
|
|
||||
|
Total reclassifications, net of tax
|
$
|
|
|
|
$
|
(
|
)
|
|||
|
(*)
|
|
F-59
The operating segments through which the Company manages its operations are based on the internal reporting used by the Company’s Chief Operating Decision Maker (“CODM”) to assess performance and make decisions about resource allocation. The segments are organized based on products and services provided by the Company.
CNH Industrial has
five
operating segments:
Agriculture
designs, manufactures and distributes a full line of farm machinery and implements, including two-wheel and four-wheel drive tractors, crawler tractors (Quadtrac
®
), combines, cotton pickers, grape and sugar cane harvesters, hay and forage equipment, planting and seeding equipment, soil preparation and cultivation implements and material handling equipment. Agricultural equipment is sold under the New Holland Agriculture and Case IH brands, as well as the STEYR, Kongskilde and Överum brands in Europe and the Miller brand, primarily in North America and Australia.
Construction
designs, manufactures and distributes a full line of construction equipment including excavators, crawler dozers, graders, wheel loaders, backhoe loaders, skid steer loaders, and compact track loaders. Construction equipment is sold under the CASE Construction and New Holland Construction brands.
Commercial and Specialty Vehicles
designs, manufactures and distributes a full range of light, medium, and heavy vehicles for the transportation and distribution of goods under the IVECO brand, commuter buses and touring coaches under the IVECO BUS (previously Iveco Irisbus) and Heuliez Bus brands, quarry and mining equipment under the IVECO ASTRA brand, firefighting vehicles under the Magirus brand, and vehicles for civil defense and peace-keeping missions under the Iveco Defence Vehicles brand.
Powertrain
designs, manufactures and distributes, under the FPT Industrial Brand, a range of engines, transmission systems and axles for on- and off-road applications, as well as for marine and power generation.
Financial Services
offers a range of financial services to dealers and customers. Financial Services provides and administers retail financing to customers for the purchase or lease of new and used industrial equipment or vehicles and other equipment sold by CNH Industrial dealers. In addition, Financial Services provides wholesale financing to CNH Industrial dealers. Wholesale financing consists primarily of floor plan financing and allows the dealers to purchase and maintain a representative inventory of products. Financial Services also provides trade receivables factoring services to CNH Industrial companies.
Revenues for each reported segment are those directly generated by or attributable to the segment as a result of its usual business activities and include revenues from transactions with third parties as well as those deriving from transactions with other segments, recognized at normal market prices. Segment expenses represent expenses deriving from each segment’s business activities both with third parties and other operating segments or which may otherwise be directly attributable to it. Expenses deriving from business activities with other segments are recognized at normal market prices.
The CODM assesses segment performance and makes decisions about resource allocation based upon Adjusted EBIT and Adjusted EBITDA. The Company believes Adjusted EBIT and Adjusted EBITDA more fully reflect segment and consolidated profitability. Adjusted EBIT is defined as net income/(loss) before income taxes, interest expenses of Industrial Activities, net, restructuring expenses, the finance and non-service component of pension and other post-employment benefits costs, foreign exchange gains/(losses) and certain non-recurring items. In particular, non-recurring items are specifically disclosed items that management considers to be rare or discrete events that are infrequent in nature and not reflective of on-going operational activities.
Adjusted EBITDA is defined as Adjusted EBIT plus depreciation and amortization (including on assets under operating leases and assets sold under buy-back commitments). With reference to Financial Services, the CODM assesses the performance of the segment on the basis of net income prepared in accordance with U.S. GAAP.
The following table includes the reconciliation of Adjusted EBIT and Adjusted EBITDA, non-GAAP financial measures, to net income, the most comparable U.S. GAAP financial measure, for the years ended
December 31, 2019
,
2018
, and
2017
.
F-60
|
Years Ended December 31,
|
||||||||||||
|
2019
|
2018
|
2017
|
||||||||||
|
(in millions)
|
||||||||||||
|
Net income
|
$
|
|
|
$
|
|
|
$
|
|
|
|||
|
Income tax (expense)
|
(
|
)
|
|
|
|
|
||||||
|
Interest expenses of Industrial Activities, net of interest income and eliminations
|
|
|
|
|
|
|
||||||
|
Foreign exchange (gains) losses, net
|
|
|
|
|
|
|
||||||
|
Finance and non-service component of Pension and other post-employment benefit costs
|
|
|
(
|
)
|
|
|
||||||
|
Restructuring expenses
|
|
|
|
|
|
|
||||||
|
Other discrete items
|
|
|
|
|
|
|
||||||
|
Venezuelan re-measurement and impairment of assets, and 2017 year-end deconsolidation of Venezuelan operations
|
|
|
|
|
|
|
||||||
|
Adjusted EBIT
|
$
|
|
|
$
|
|
|
$
|
|
|
|||
|
Depreciation and Amortization
|
|
|
|
|
|
|
||||||
|
Depreciation of assets under operating leases and assets sold with buy-back commitments
|
|
|
|
|
|
|
||||||
|
Adjusted EBITDA
|
$
|
|
|
$
|
|
|
$
|
|
|
|||
Segment Information
The following summarizes Adjusted EBIT by reportable segment:
|
Years Ended December 31,
|
||||||||||||
|
2019
|
2018
|
2017
|
||||||||||
|
(in millions)
|
||||||||||||
|
Agriculture
|
$
|
|
|
$
|
|
|
$
|
|
|
|||
|
Construction
|
|
|
|
|
(
|
)
|
||||||
|
Commercial and Specialty Vehicles
|
|
|
|
|
|
|
||||||
|
Powertrain
|
|
|
|
|
|
|
||||||
|
Unallocated items, eliminations and other
|
(
|
)
|
(
|
)
|
(
|
)
|
||||||
|
Total Industrial Activities
|
$
|
|
|
|
$
|
|
|
|
$
|
|
|
|
|
Financial Services
|
|
|
|
|
|
|
||||||
|
Adjusted EBIT
|
$
|
|
|
|
$
|
|
|
|
$
|
|
|
|
The following summarizes Adjusted EBITDA by reportable segment:
|
Years Ended December 31,
|
||||||||||||
|
2019
|
2018
|
2017
|
||||||||||
|
(in millions)
|
||||||||||||
|
Agriculture
|
$
|
|
|
$
|
|
|
$
|
|
|
|||
|
Construction
|
|
|
|
|
|
|
||||||
|
Commercial and Specialty Vehicles
|
|
|
|
|
|
|
||||||
|
Powertrain
|
|
|
|
|
|
|
||||||
|
Unallocated items, eliminations and other
|
(
|
)
|
(
|
)
|
(
|
)
|
||||||
|
Total Industrial Activities
|
$
|
|
|
$
|
|
|
$
|
|
|
|||
|
Financial Services
|
|
|
|
|
|
|
||||||
|
Adjusted EBITDA
|
$
|
|
|
$
|
|
|
$
|
|
|
|||
F-61
A summary of additional operating segment information as of and for the years ended
December 31, 2019
,
2018
, and
2017
is as follows:
|
Years Ended December 31,
|
||||||||||||
|
2019
|
2018
|
2017
|
||||||||||
|
(in millions)
|
||||||||||||
|
Revenues:
|
||||||||||||
|
Agriculture
|
$
|
|
|
$
|
|
|
$
|
|
|
|||
|
Construction
|
|
|
|
|
|
|
||||||
|
Commercial and Specialty Vehicles
|
|
|
|
|
|
|
||||||
|
Powertrain
|
|
|
|
|
|
|
||||||
|
Eliminations and other
|
(
|
)
|
(
|
)
|
(
|
)
|
||||||
|
Net sales of Industrial Activities
|
|
|
|
|
|
|
|
|
||||
|
Financial Services
|
|
|
|
|
|
|
||||||
|
Eliminations and other
|
(
|
)
|
(
|
)
|
(
|
)
|
||||||
|
Total Revenues
|
$
|
|
|
|
$
|
|
|
|
$
|
|
|
|
|
Depreciation and Amortization (*):
|
||||||||||||
|
Agriculture
|
|
|
|
|
|
|
||||||
|
Construction
|
|
|
|
|
|
|
||||||
|
Commercial and Specialty Vehicles
|
|
|
|
|
|
|
||||||
|
Powertrain
|
|
|
|
|
|
|
||||||
|
Other activities and adjustments
|
|
|
|
|
|
|
||||||
|
Depreciation and amortization of Industrial Activities
|
|
|
|
|
|
|
|
|
||||
|
Financial Services
|
|
|
|
|
|
|
||||||
|
Depreciation and amortization
|
$
|
|
|
|
$
|
|
|
|
$
|
|
|
|
|
Expenditures for long-lived assets (**):
|
||||||||||||
|
Agriculture
|
$
|
|
|
$
|
|
|
$
|
|
|
|||
|
Construction
|
|
|
|
|
|
|
||||||
|
Commercial and Specialty Vehicles
|
|
|
|
|
|
|
||||||
|
Powertrain
|
|
|
|
|
|
|
||||||
|
Other activities
|
|
|
|
|
|
|
||||||
|
Expenditures for long-lived assets of Industrial Activities
|
|
|
|
|
|
|
|
|
||||
|
Financial Services
|
|
|
|
|
|
|
||||||
|
Expenditures for long-lived assets
|
$
|
|
|
|
$
|
|
|
|
$
|
|
|
|
|
(*)
|
Excluding assets sold with buy-back commitments and equipment on operating leases
|
|
(**)
|
Excluding assets sold with buy-back commitments, equipment on operating leases and right of use assets
|
F-62
Geographic Information
CNH Industrial has its principal office in London, England, U.K. Revenues earned in the U.K. from external customers were
$
888
million
,
$
1,006
million
, and
$
864
million
for the years ended
December 31, 2019
,
2018
, and
2017
, respectively. Revenues earned in the rest of the world from external customers were
$
27,191
million
,
$
28,700
million
, and
$
26,837
million
for the years ended
December 31, 2019
,
2018
, and
2017
, respectively.
The following highlights revenues earned from external customers in the rest of the world by destination:
|
2019
|
2018
|
2017
|
||||||||||
|
(in millions)
|
||||||||||||
|
United States
|
$
|
|
|
$
|
|
|
$
|
|
|
|||
|
Italy
|
|
|
|
|
|
|
||||||
|
France
|
|
|
|
|
|
|
||||||
|
Brazil
|
|
|
|
|
|
|
||||||
|
Germany
|
|
|
|
|
|
|
||||||
|
Canada
|
|
|
|
|
|
|
||||||
|
Australia
|
|
|
|
|
|
|
||||||
|
Spain
|
|
|
|
|
|
|
||||||
|
Argentina
|
|
|
|
|
|
|
||||||
|
Poland
|
|
|
|
|
|
|
||||||
|
Other
|
|
|
|
|
|
|
||||||
|
Total Revenues from external customers in the rest of world
|
$
|
|
|
|
$
|
|
|
|
$
|
|
|
|
Total long-lived tangible and intangible assets located in the U.K. were
$
178
million
and
$
218
million
at
December 31, 2019
and
2018
, respectively, and the total of such assets located in the rest of the world totaled
$
10,292
million
and
$
10,699
million
at
December 31, 2019
and
2018
, respectively.
The following highlights long-lived tangible and intangible assets by geographic in the rest of the world:
|
At December 31,
|
||||||||
|
2019
|
2018
|
|||||||
|
(in millions)
|
||||||||
|
United States
|
$
|
|
|
$
|
|
|
||
|
Italy
|
|
|
|
|
||||
|
France
|
|
|
|
|
||||
|
Germany
|
|
|
|
|
||||
|
Spain
|
|
|
|
|
||||
|
Canada
|
|
|
|
|
||||
|
Brazil
|
|
|
|
|
||||
|
China
|
|
|
|
|
||||
|
Other
|
|
|
|
|
||||
|
Total Long-lived assets in the rest of the world
|
$
|
|
|
|
$
|
|
|
|
CNH Industrial’s related parties are primarily EXOR N.V. and the companies that EXOR N.V. controls or has significant influence over, including Fiat Chrysler Automobiles N.V. and its subsidiaries and affiliates (“FCA”) and Ferrari N.V. and its subsidiaries and affiliates (“Ferrari”). As of January 31, 2020, EXOR N.V. held
42.2
%
of CNH Industrial’s voting power and had the ability to significantly influence the decisions submitted to a vote of CNH Industrial’s shareholders, including approval of annual dividends, the election and removal of directors, mergers or other business combinations, the acquisition or disposition of assets, and issuances of equity and the incurrence of indebtedness. The percentage above has been calculated as the ratio of (i) the aggregate number of common shares and special voting shares beneficially owned by EXOR N.V. to (ii) the aggregate number of outstanding common shares and special voting shares of CNH Industrial as of January 31, 2020. In addition, CNH Industrial engages in transactions with its unconsolidated subsidiaries and affiliates over which CNH Industrial has a significant influence or jointly controls.
The Company’s Audit Committee reviews and evaluates all significant related party transactions.
F-63
Transactions with EXOR N.V. and its Subsidiaries and Affiliates
EXOR N.V. is an investment holding company in Europe. Among other things, EXOR N.V. manages a portfolio that includes investments in FCA and Ferrari. CNH Industrial did not enter into any significant transactions with EXOR N.V. during the years ended
December 31, 2019
and
2018
.
In connection with the establishment of Fiat Industrial (now CNH Industrial) through the demerger from Fiat (now FCA), the two companies entered into a Master Services Agreement (“MSA”) which sets forth the primary terms and conditions pursuant to which the service provider subsidiaries of CNH Industrial and FCA provide services to the service receiving subsidiaries. As structured, the applicable service provider and service receiver subsidiaries become parties to the MSA through the execution of an Opt-in letter that may contain additional terms and conditions. Pursuant to the MSA, service receivers are required to pay to service providers the actual cost of the services plus a negotiated margin. FCA subsidiaries provide CNH Industrial with administrative services such as accounting, cash management, maintenance of plant and equipment, security, information systems and training under the terms and conditions of the MSA and the applicable Opt-in letters.
Additionally, CNH Industrial sells engines and light commercial vehicles to and purchases engine blocks and other components from FCA subsidiaries. Furthermore, CNH Industrial and FCA may engage in other minor transactions in the ordinary course of business.
These transactions with FCA are reflected in the Company’s consolidated financial statements as follows:
|
2019
|
2018
|
2017
|
||||||||||
|
(in millions)
|
||||||||||||
|
Net sales
|
$
|
|
|
$
|
|
|
$
|
|
|
|||
|
Cost of goods sold
|
$
|
|
|
$
|
|
|
$
|
|
|
|||
|
Selling, general and administrative expenses
|
$
|
|
|
$
|
|
|
$
|
|
|
|||
|
December 31, 2019
|
December 31, 2018
|
|||||||
|
(in millions)
|
||||||||
|
Trade receivables
|
$
|
|
|
$
|
|
|
||
|
Trade payables
|
$
|
|
|
$
|
|
|
||
Transactions with Unconsolidated Subsidiaries and Affiliates
CNH Industrial sells commercial vehicles, agricultural and construction equipment and provides technical services to unconsolidated subsidiaries and affiliates such as IVECO—OTO MELARA Società Consortile a responsabilità limitata, CNH de Mexico SA de CV, Turk Traktor ve Ziraat Makineleri A.S. and New Holland HFT Japan Inc. CNH Industrial also purchases equipment from unconsolidated subsidiaries and affiliates, such as Turk Traktor ve Ziraat Makineleri A.S.
These transactions primarily affected revenues, finance, interest and other income, cost of goods sold, trade receivables and payables and are presented as follows:
|
2019
|
2018
|
2017
|
||||||||||
|
(in millions)
|
||||||||||||
|
Net sales
|
$
|
|
|
$
|
|
|
$
|
|
|
|||
|
Cost of goods sold
|
$
|
|
|
$
|
|
|
$
|
|
|
|||
|
December 31, 2019
|
December 31, 2018
|
|||||||
|
(in millions)
|
||||||||
|
Trade receivables
|
$
|
|
|
$
|
|
|
||
|
Trade payables
|
$
|
|
|
$
|
|
|
||
F-64
The operations, key financial measures, and financial analysis differ significantly for manufacturing and distribution businesses and financial services businesses; therefore, management believes that certain supplemental disclosures are important in understanding the consolidated operations and financial results of CNH Industrial. This supplemental information does not purport to represent the operations of each group as if each group were to operate on a standalone basis. For example, Industrial Activities presents the cost of “interest free” periods for wholesale receivables as Interest Compensation to Financial Services and not as a reduction of sales in their Statements of Operations. This supplemental data is as follows:
Industrial Activities
—The financial information captioned “Industrial Activities” reflects the consolidation of all majority-owned subsidiaries except for Financial Services business. Financial Services business has been included using the equity method of accounting whereby the net income and net assets of Financial Services business are reflected, respectively, in “Equity in income of unconsolidated subsidiaries and affiliates” in the accompanying statement of operations, and in “Investments in unconsolidated subsidiaries and affiliates” in the accompanying balance sheets.
Financial Services
—The financial information captioned “Financial Services” reflects the consolidation or combination of Financial Services business.
Transactions between the “Industrial Activities” and “Financial Services” have been eliminated to arrive at the consolidated financial statements.
Certain prior period balances have been reclassified to conform to the current period presentation resulting from the adoption of new accounting pronouncements.
|
Statement of Operations
|
||||||||||||||||||||||||
|
Industrial Activities
|
Financial Services
|
|||||||||||||||||||||||
|
2019
|
2018
|
2017
|
2019
|
2018
|
2017
|
|||||||||||||||||||
|
(in millions)
|
||||||||||||||||||||||||
|
Revenues
|
||||||||||||||||||||||||
|
Net sales
|
$
|
|
|
$
|
|
|
$
|
|
|
$
|
|
|
$
|
|
|
$
|
|
|
||||||
|
Finance, interest and other income
|
|
|
|
|
|
|
|
|
|
|
|
|
||||||||||||
|
Total Revenues
|
$
|
|
|
$
|
|
|
$
|
|
|
$
|
|
|
$
|
|
|
$
|
|
|
||||||
|
Costs and Expenses
|
||||||||||||||||||||||||
|
Cost of goods sold
|
$
|
|
|
$
|
|
|
$
|
|
|
$
|
|
|
$
|
|
|
$
|
|
|
||||||
|
Selling, general & administrative expenses
|
|
|
|
|
|
|
|
|
|
|
|
|
||||||||||||
|
Research and development expenses
|
|
|
|
|
|
|
|
|
|
|
|
|
||||||||||||
|
Restructuring expenses
|
|
|
|
|
|
|
|
|
|
|
|
|
||||||||||||
|
Interest expense
|
|
|
|
|
|
|
|
|
|
|
|
|
||||||||||||
|
Other, net
|
|
|
|
|
|
|
|
|
|
|
|
|
||||||||||||
|
Total Costs and Expenses
|
$
|
|
|
$
|
|
|
$
|
|
|
$
|
|
|
$
|
|
|
$
|
|
|
||||||
|
Income (loss) before income taxes and equity in income of unconsolidated subsidiaries and affiliates
|
|
|
|
|
|
|
|
|
|
|
|
|
||||||||||||
|
Income tax (expense)
|
|
(
|
)
|
(
|
)
|
(
|
)
|
(
|
)
|
(
|
)
|
|||||||||||||
|
Equity income of unconsolidated subsidiaries and affiliates
|
(
|
)
|
|
|
|
|
|
|
|
|
|
|
||||||||||||
|
Results from intersegment investments
|
|
|
|
|
|
|
|
|
|
|
|
|
||||||||||||
|
Net income (loss)
|
$
|
|
|
$
|
|
|
$
|
|
|
$
|
|
|
$
|
|
|
$
|
|
|
||||||
F-65
|
Balance Sheets
|
||||||||||||||||
|
Industrial Activities
|
Financial Services
|
|||||||||||||||
|
2019
|
2018
|
2019
|
2018
|
|||||||||||||
|
(in millions)
|
||||||||||||||||
|
ASSETS
|
||||||||||||||||
|
Cash and cash equivalents
|
$
|
|
|
$
|
|
|
$
|
|
|
$
|
|
|
||||
|
Restricted cash
|
|
|
|
|
|
|
|
|
||||||||
|
Trade receivables, net
|
|
|
|
|
|
|
|
|
||||||||
|
Financing receivables, net
|
|
|
|
|
|
|
|
|
||||||||
|
Inventories, net
|
|
|
|
|
|
|
|
|
||||||||
|
Property, plant and equipment, net
|
|
|
|
|
|
|
|
|
||||||||
|
Investments in unconsolidated subsidiaries and affiliates
|
|
|
|
|
|
|
|
|
||||||||
|
Equipment under operating leases
|
|
|
|
|
|
|
|
|
||||||||
|
Goodwill
|
|
|
|
|
|
|
|
|
||||||||
|
Other intangible assets, net
|
|
|
|
|
|
|
|
|
||||||||
|
Deferred tax assets
|
|
|
|
|
|
|
|
|
||||||||
|
Derivative assets
|
|
|
|
|
|
|
|
|
||||||||
|
Other assets
|
|
|
|
|
|
|
|
|
||||||||
|
TOTAL ASSETS
|
$
|
|
|
$
|
|
|
$
|
|
|
$
|
|
|
||||
|
LIABILITIES AND EQUITY
|
||||||||||||||||
|
Debt
|
|
|
|
|
|
|
|
|
||||||||
|
Trade payables
|
|
|
|
|
|
|
|
|
||||||||
|
Deferred tax liabilities
|
|
|
|
|
|
|
|
|
||||||||
|
Pension, postretirement and other postemployment benefits
|
|
|
|
|
|
|
|
|
||||||||
|
Derivative liability
|
|
|
|
|
|
|
|
|
||||||||
|
Other liabilities
|
|
|
|
|
|
|
|
|
||||||||
|
TOTAL LIABILITIES
|
$
|
|
|
$
|
|
|
$
|
|
|
$
|
|
|
||||
|
Equity
|
|
|
|
|
|
|
|
|
||||||||
|
Redeemable noncontrolling interest
|
|
|
|
|
|
|
|
|
||||||||
|
TOTAL LIABILITIES AND EQUITY
|
$
|
|
|
$
|
|
|
$
|
|
|
$
|
|
|
||||
F-66
|
Cash Flow Statements
|
||||||||||||||||||||||||
|
Industrial Activities
|
Financial Services
|
|||||||||||||||||||||||
|
2019
|
2018
|
2017
|
2019
|
2018
|
2017
|
|||||||||||||||||||
|
(in millions)
|
||||||||||||||||||||||||
|
Operating activities:
|
||||||||||||||||||||||||
|
Net income (loss)
|
$
|
|
|
$
|
|
|
$
|
|
|
$
|
|
|
$
|
|
|
$
|
|
|
||||||
|
Adjustments to reconcile net income to net cash provided (used) by operating activities:
|
||||||||||||||||||||||||
|
Depreciation and amortization expense, net of assets under operating lease and assets sold under buy-back commitments
|
|
|
|
|
|
|
|
|
|
|
|
|
||||||||||||
|
Depreciation and amortization expense of assets under operating lease and assets sold under buy-back commitments
|
|
|
|
|
|
|
|
|
|
|
|
|
||||||||||||
|
(Gain) loss from disposal of assets
|
(
|
)
|
|
|
|
|
|
|
|
|
|
|
||||||||||||
|
Loss on repurchase of Notes
|
|
|
|
|
|
|
|
|
|
|
|
|
||||||||||||
|
Undistributed income (loss) of unconsolidated subsidiaries
|
|
|
(
|
)
|
(
|
)
|
(
|
)
|
(
|
)
|
(
|
)
|
||||||||||||
|
Other non-cash items
|
|
|
|
|
|
|
|
|
|
|
|
|
||||||||||||
|
Changes in operating assets and liabilities:
|
||||||||||||||||||||||||
|
Provisions
|
(
|
)
|
(
|
)
|
|
|
(
|
)
|
|
|
(
|
)
|
||||||||||||
|
Deferred income taxes
|
(
|
)
|
|
|
|
|
|
|
|
|
(
|
)
|
||||||||||||
|
Trade and financing receivables related to
sales, net
|
(
|
)
|
|
|
|
|
(
|
)
|
(
|
)
|
(
|
)
|
||||||||||||
|
Inventories, net
|
(
|
)
|
(
|
)
|
|
|
|
|
|
|
|
|
||||||||||||
|
Trade payables
|
(
|
)
|
|
|
|
|
|
|
(
|
)
|
|
|
||||||||||||
|
Other assets and liabilities
|
(
|
)
|
(
|
)
|
|
|
|
|
|
|
|
|
||||||||||||
|
Net cash provided by operating activities
|
$
|
|
|
$
|
|
|
$
|
|
|
$
|
|
|
$
|
|
|
$
|
|
|
||||||
|
Investing activities:
|
||||||||||||||||||||||||
|
Additions to retail receivables
|
|
|
|
|
|
|
(
|
)
|
(
|
)
|
(
|
)
|
||||||||||||
|
Collections of retail receivables
|
|
|
|
|
|
|
|
|
|
|
|
|
||||||||||||
|
Proceeds from sale of assets, net of assets sold under operating leases and assets sold under buy-back commitments
|
|
|
|
|
|
|
|
|
|
|
|
|
||||||||||||
|
Expenditures for property, plant and equipment and intangible assets, net of assets under operating lease and sold under buy-back commitments
|
(
|
)
|
(
|
)
|
(
|
)
|
(
|
)
|
(
|
)
|
(
|
)
|
||||||||||||
|
Expenditures for assets under operating lease and assets sold under buy-back commitments
|
(
|
)
|
(
|
)
|
(
|
)
|
(
|
)
|
(
|
)
|
(
|
)
|
||||||||||||
|
Other
|
|
|
|
|
(
|
)
|
(
|
)
|
(
|
)
|
|
|
||||||||||||
|
Net cash used in investing activities
|
$
|
(
|
)
|
$
|
(
|
)
|
$
|
(
|
)
|
$
|
(
|
)
|
$
|
(
|
)
|
$
|
(
|
)
|
||||||
|
Financing activities:
|
||||||||||||||||||||||||
|
Proceeds from long-term debt
|
|
|
|
|
|
|
|
|
|
|
|
|
||||||||||||
|
Payments of long-term debt
|
(
|
)
|
(
|
)
|
(
|
)
|
(
|
)
|
(
|
)
|
(
|
)
|
||||||||||||
|
Net increase (decrease) in other financial liabilities
|
(
|
)
|
|
|
(
|
)
|
|
|
|
|
|
|
||||||||||||
|
Dividends paid
|
(
|
)
|
(
|
)
|
(
|
)
|
(
|
)
|
(
|
)
|
(
|
)
|
||||||||||||
|
Other
|
(
|
)
|
(
|
)
|
(
|
)
|
|
|
|
|
|
|
||||||||||||
|
Net cash provided by (used in) financing activities
|
(
|
)
|
(
|
)
|
(
|
)
|
|
|
|
|
(
|
)
|
||||||||||||
|
Effect of foreign exchange rate changes on cash and
cash equivalents
|
(
|
)
|
(
|
)
|
|
|
|
|
(
|
)
|
|
|
||||||||||||
|
Increase (decrease) in cash and cash equivalents
|
(
|
)
|
(
|
)
|
|
|
(
|
)
|
(
|
)
|
|
|
||||||||||||
|
Cash and cash equivalents, beginning of year
|
|
|
|
|
|
|
|
|
|
|
|
|
||||||||||||
|
Cash and cash equivalents, end of year
|
$
|
|
|
$
|
|
|
$
|
|
|
$
|
|
|
$
|
|
|
$
|
|
|
||||||
F-67
On February 25, 2020, IVECO BUS, a brand of CNH Industrial N.V., signed an agreement with Otokar Otomotiv ve Savunma Sanayi A., a bus manufacturer in Turkey, to locally manufacture products under the IVECO BUS brand at its facilities in Sakarya, Turkey. This contractual partnership covers existing models in the IVECO BUS portfolio for international distribution, as well as the production of a model specifically catered to the Eastern Europe, Africa, Middle East and Asia markets. The models will be powered by engines from FPT Industrial, the first of which are expected to be produced within 2021.
On February 28, 2020, CNH Industrial extended its
€
4
billion
committed revolving credit facility for one additional year with all lenders, by exercising the first one-year extension option. The facility is therefore due to mature in March 2025.
The recent outbreak of Coronavirus, a virus causing potentially deadly respiratory tract infections originating in China and spreading in various jurisdictions, may negatively affect economic conditions regionally as well as globally, disrupt operations situated in countries particularly exposed to the contagion, affect supply chains or otherwise impact our businesses. Governments in affected countries are imposing travel bans, quarantines and other emergency public safety measures. Those measures, though temporary in nature, may continue and increase depending on developments in the virus’ outbreak. The ultimate severity of the Coronavirus outbreak is uncertain at this time and therefore the Company cannot reasonably estimate the impact it may have on our end markets and our operations.
F-68
INDEX TO EXHIBITS
|
Exhibit
|
Description
|
|
|
1.1
|
||
|
1.2
|
||
|
2.1
|
||
|
2.2
|
||
|
2.3
|
||
|
There have not been filed as exhibits to this Form 20-F certain long-term debt instruments, none of which relates to indebtedness that exceeds 10% of the consolidated assets of CNH Industrial N.V. CNH Industrial N.V. agrees to furnish the Securities and Exchange Commission, upon its request, a copy of any instrument defining the rights of holders of long-term debt of CNH Industrial N.V. and its consolidated subsidiaries.
|
||
|
4.1
|
||
|
4.2
|
||
|
4.3
|
||
|
4.4
|
||
|
4.5
|
||
|
4.6
|
||
|
7.1
|
||
|
8.1
|
||
|
12.1
|
||
|
12.2
|
||
|
13.0
|
||
|
15.0
|
||
|
101.SCH
|
Inline XBRL Taxonomy Extension Schema Document
|
|
|
101.CLA
|
Inline XBRL Taxonomy Extension Calculation Linkbase Document
|
|
|
101DEF
|
Inline XBRL Taxonomy Extension Definition Linkbase Document
|
|
|
101.LAB
|
Inline XBRL Taxonomy Extension Label Linkbase Document
|
|
|
101.PRE
|
Inline XBRL Taxonomy Extension Presentation Linkbase Document
|
|
F-69
SIGNATURES
The registrant hereby certifies that it meets all of the requirements for filing on Form 20-F and has duly caused and authorized the undersigned to sign this annual report on its behalf.
|
CNH INDUSTRIAL N.V.
(Registrant)
|
|
|
/s/
M
ASSIMILIANO
C
HIARA
|
|
|
Massimiliano Chiara
|
|
|
Chief Financial Officer
|
|
|
Dated: March 3, 2020
|
|
F-70
TABLE OF CONTENTS
Part IItem 1. Identity Of Directors, Senior Management and AdvisersItem 2. Offer Statistics and Expected TimetableItem 3. Key InformationItem 4. Information on The CompanyItem 4A. Unresolved Staff CommentsItem 5. Operating and Financial Review and ProspectsItem 6. Directors, Senior Management and EmployeesItem 7. Major Shareholders and Related Party TransactionsItem 8. Financial InformationItem 9. The Offer and ListingItem 10. Additional InformationItem 11. Quantitative and Qualitative Disclosures About Market RiskItem 12. Description Of Securities Other Than Equity SecuritiesPart IIItem 13. Defaults, Dividend Arrearages and DelinquenciesItem 14. Material Modifications To The Rights Of Security Holders and Use Of ProceedsItem 15. Controls and ProceduresItem 16A. Audit Committee Financial ExpertItem 16B. Code Of EthicsItem 16C. Principal Accountant Fees and ServicesItem 16D. Exemptions From The Listing Standards For Audit CommitteesItem 16E. Purchase Of Equity Securities By The Issuer and Affiliated PurchasersItem 16F. Change in Registrant S Certifying AccountantItem 16G. Corporate GovernanceItem 16H. Mine Safety DisclosurePart IIIItem 17. Financial StatementsItem 18. Financial StatementsItem 19. ExhibitsNote 1: Nature Of OperationsNote 2: Summary Of Significant Accounting PoliciesNote 3: RevenueNote 4: ReceivablesNote 5: InventoriesNote 6: Property, Plant and EquipmentNote 7: Investments in Unconsolidated Subsidiaries and AffiliatesNote 8: LeasesNote 9: Goodwill and Other IntangiblesNote 10: DebtNote 11: Income TaxesNote 12: Employee Benefit Plans and Postretirement BenefitsPart DNote 13: Other LiabilitiesNote 14: Commitments and ContingenciesNote 15: Financial InstrumentsNote 16: Shareholders EquityNote 17: Share-based CompensationNote 18: Earnings Per ShareNote 19: Accumulated Other Comprehensive Income (loss)Note 20: Segment ReportingNote 21: Related Party InformationNote 22: Supplemental InformationNote 23: Subsequent Event