CONMED CORP
10-Ks and 10-Qs
|
|
|
|
|
|
|
|
|
|
|
|
|
|
|
|
|
|
|
|
|
|
|
|
|
|
|
|
|
|
|
|
|
|
|
|
|
|
|
|
|
|
|
|
|
|
|
|
|
|
|
|
|
|
|
|
United States
Securities and Exchange Commission
Washington, D.C. 20549
Form 10-K
Annual Report Pursuant to Section 13 or 15(d) of
the Securities Exchange Act of 1934
|
For the fiscal year ended December 31, 2018
|
Commission file number 0-16093
|
CONMED CORPORATION
(Exact name of registrant as specified in its charter)
|
New York
|
16-0977505
|
|
(State or other jurisdiction of incorporation or organization)
|
(I.R.S. Employer Identification No.)
|
|
525 French Road, Utica, New York
|
13502
|
|
(Address of principal executive offices)
|
(Zip Code)
|
(315) 797-8375
(Registrant's telephone number, including area code)
Securities registered pursuant to Section 12(g) of the Act:
Common Stock, $.01 par value per share
(Title of class)
Indicate by check mark if the registrant is a well-known seasoned issuer (as defined in Rule 405 of the Securities Act).
Yes
ý
No
¨
Indicate by check mark if the registrant is not required to file reports pursuant to Section 13 or Section 15(d) of the Act.
Yes
o
No
x
Indicate by check mark whether the registrant (1) has filed all reports required to be filed by Section 13 or 15(d) of the Securities Exchange Act of 1934 during the preceding 12 months (or for such shorter period that the registrant was required to file such reports), and (2) has been subject to such filing requirements for the past 90 days.
Yes
x
No
o
Indicate by check mark whether the registrant has submitted electronically every Interactive Data File required to be submitted pursuant to Rule 405 of Regulation S-T (§232.405 of this chapter) during the preceding 12 months (or for such shorter period that the registrant was required to submit such files). Yes
x
No
o
Indicate by check mark if disclosure of delinquent filers pursuant to Item 405 of Regulation S-K (§229.405 of this chapter) is not contained herein, and will not be contained, to the best of registrant's knowledge, in definitive proxy or information statements incorporated by reference in Part III of this Form 10-K or any amendment to this Form 10-K.
o
Indicate by check mark whether the registrant is a large accelerated filer, an accelerated filer, a non-accelerated filer, a smaller reporting company, or an emerging growth company. See the definitions of “large accelerated filer", "accelerated filer", "smaller reporting company", and "emerging growth company" in Rule 12b-2 of the Exchange Act.
Large accelerated filer
ý
Accelerated filer
o
Non-accelerated filer
o
Smaller reporting company
o
Emerging growth company
o
If an emerging growth company, indicate by check mark if the registrant has elected not to use the extended transition period for complying with any new or revised financial accounting standards provided pursuant to Section 13(a) of the Exchange Act.
o
Indicate by check mark whether the registrant is a shell company (as defined in Rule 12b-2 of the Act).
Yes
o
No
x
As of
June 29, 2018
, the last business day of the registrant’s most recently completed second fiscal quarter, the aggregate market value of the shares of voting common stock held by non-affiliates of the registrant was approximately
$2,057,379,476
based upon the closing price of the Company’s common stock on the NASDAQ Stock Market.
The number of shares of the registrant's $0.01 par value common stock outstanding as of
February 20, 2019
was
28,150,428.
DOCUMENTS INCORPORATED BY REFERENCE:
Portions of the Definitive Proxy Statement and any other informational filings for the
2019
Annual Meeting of Shareholders are incorporated by reference into Part III of this report.
CONMED CORPORATION
ANNUAL REPORT ON FORM 10-K
FOR YEAR ENDED DECEMBER 31,
2018
TABLE OF CONTENTS
|
Part I
|
||
|
|
|
Page
|
|
|
|
|
|
Item 1.
|
||
|
Item 1A.
|
||
|
Item 1B.
|
||
|
Item 2.
|
||
|
Item 3.
|
||
|
Item 4.
|
||
|
|
Part II
|
|
|
|
|
|
|
Item 5.
|
||
|
Item 6.
|
||
|
Item 7.
|
||
|
Item 7A.
|
||
|
Item 8.
|
||
|
Item 9.
|
||
|
Item 9A.
|
||
|
Item 9B.
|
||
|
|
|
|
|
|
Part III
|
|
|
|
|
|
|
Item 10.
|
||
|
Item 11.
|
||
|
Item 12.
|
||
|
Item 13.
|
||
|
Item 14.
|
||
|
|
|
|
|
|
Part IV
|
|
|
|
|
|
|
Item 15.
|
||
|
|
|
|
|
|
||
|
Item 16.
|
||
1
CONMED CORPORATION
Item 1. Business
Forward Looking Statements
This Annual Report on Form 10-K for the Fiscal Year Ended
December 31, 2018
(“Form 10-K”) contains certain forward-looking statements (as such term is defined in the Private Securities Litigation Reform Act of 1995) and information relating to CONMED Corporation (“CONMED”, the “Company”, “we” or “us” — references to “CONMED”, the “Company”, “we” or “us” shall be deemed to include our direct and indirect subsidiaries unless the context otherwise requires) which are based on the beliefs of our management, as well as assumptions made by and information currently available to our management.
When used in this Form 10-K, the words “estimate”, “project”, “believe”, “anticipate”, “intend”, “expect” and similar expressions are intended to identify forward-looking statements. These statements involve known and unknown risks, uncertainties and other factors, including those identified under the caption “Item 1A-Risk Factors” and elsewhere in this Form 10-K which may cause our actual results, performance or achievements, or industry results, to be materially different from any future results, performance or achievements expressed or implied by such forward-looking statements. Such factors include, among others, the following:
|
•
|
general economic and business conditions;
|
|
•
|
compliance with and changes in regulatory requirements;
|
|
•
|
the possibility that United States or foreign regulatory and/or administrative agencies may initiate enforcement actions against us or our distributors;
|
|
•
|
competition;
|
|
•
|
changes in customer preferences;
|
|
•
|
changes in technology;
|
|
•
|
the introduction and acceptance of new products;
|
|
•
|
the availability and cost of materials;
|
|
•
|
cyclical customer purchasing patterns due to budgetary and other constraints;
|
|
•
|
quality of our management and business abilities and the judgment of our personnel;
|
|
•
|
the availability, terms and deployment of capital;
|
|
•
|
future levels of indebtedness and capital spending;
|
|
•
|
changes in foreign exchange and interest rates;
|
|
•
|
the ability to evaluate, finance and integrate acquired businesses, products and companies;
|
|
•
|
changes in business strategy;
|
|
•
|
the risk of an information security breach, including a cybersecurity breach;
|
|
•
|
the risk of a lack of allograft tissues due to reduced donations of such tissues or due to tissues not meeting the appropriate high standards for screening and/or processing of such tissues;
|
|
•
|
the ability to defend and enforce intellectual property;
|
|
•
|
the risk of litigation, especially patent litigation as well as the cost associated with patent and other litigation;
|
|
•
|
trade protection measures, tariffs and other border taxes, and import or export licensing requirements; and
|
|
•
|
various other factors referenced in this Form 10-K.
|
See “Item 7-Management’s Discussion and Analysis of Financial Condition and Results of Operations”, “Item 1-Business” and “Item 1A-Risk Factors” for a further discussion of these factors. You are cautioned not to place undue reliance on these forward-looking statements, which speak only as of the date hereof. We do not undertake any obligation to publicly release any revisions to these forward-looking statements to reflect events or circumstances after the date of this Form 10-K or to reflect the occurrence of unanticipated events.
General
CONMED Corporation was incorporated under the laws of the State of New York in 1970. CONMED is a medical technology company that provides surgical devices and equipment for minimally invasive procedures. The Company’s products are used by surgeons and physicians in a variety of specialties including orthopedics, general surgery, gynecology, neurosurgery, thoracic surgery and gastroenterology. Headquartered in Utica, New York, the Company’s
3,100
employees distribute its products worldwide from three primary manufacturing locations.
We have historically used strategic business acquisitions, internal product development activities and exclusive distribution relationships to diversify our product offerings, increase our market share in certain product lines, realize economies
2
of scale and take advantage of growth opportunities in the healthcare field. We consider the
February 11, 2019
acquisition of Buffalo Filter, LLC, as described below under “Buffalo Filter Acquisition,” to be an example of the type of strategic business acquisition that allows us to diversify our product offerings, realize economies of scale and take advantage of growth opportunities in the healthcare field.
We are committed to offering products with the highest standards of quality, technological excellence and customer service. Substantially all of our facilities have attained certification under the ISO international quality standards and other domestic and international quality accreditations.
Our annual report on Form 10-K, quarterly reports on Form 10-Q, current reports on Form 8-K and amendments to those reports are accessible free of charge through the Investor Relations section of our website (
http://www.conmed.com
) as soon as practicable after such materials have been electronically filed with, or furnished to, the United States Securities and Exchange Commission (the "SEC"). In addition, the SEC maintains an Internet site (http:/www.sec.gov) containing reports, proxy and information statements and other information regarding issuers that file with the SEC.
Business Strategy
Our principal objectives are to improve the quality of surgical outcomes and patient care through the development of innovative medical devices, the refinement of existing products and the development of new technologies which reduce risk, trauma, cost and procedure time. We believe that by meeting these objectives we will enhance our ability to anticipate and adapt to customer needs and market opportunities and provide shareholders with favorable investment returns. We intend to achieve future growth in revenues and earnings through the following initiatives:
|
•
|
Introduction of New Products and Product Enhancements.
We continually pursue organic growth through the development of new products and enhancements to existing products. We seek to develop new technologies which improve the durability, performance and usability of existing products. In addition to our internal research and development efforts, we receive new ideas for products and technologies, particularly in procedure-specific areas, from surgeons, inventors and other healthcare professionals.
|
|
•
|
Pursue Strategic Acquisitions.
We pursue strategic acquisitions, distribution and similar arrangements in existing and new growth markets to achieve increased operating efficiencies, geographic diversification and market penetration. Targeted companies have historically included those with proven technologies and established brand names which provide potential sales, marketing and manufacturing synergies. This includes the January 4, 2016 acquisition of SurgiQuest, Inc. ("SurgiQuest") and
February 11, 2019
acquisition of Buffalo Filter, LLC ("Buffalo Filter") as further described in Item 7 - Management's Discussion and Analysis of Financial Condition and Results of Operations and Note 2 to the consolidated financial statements.
|
|
•
|
Realize Manufacturing and Operating Efficiencies.
We continually review our production systems for opportunities to reduce operating costs, consolidate product lines or process flows, reduce inventory requirements and optimize existing processes. Our vertically integrated manufacturing facilities allow for further opportunities to reduce overhead and increase operating efficiencies and capacity utilization.
|
|
•
|
Geographic Diversification.
We believe that significant growth opportunities exist for our surgical products outside the United States. Principal international markets for our products include Europe, Latin America, Canada and Asia/Pacific Rim. Critical elements of our future sales growth in these markets include leveraging our existing relationships with international surgeons, hospitals, third-party payers and foreign distributors (including sub-distributors and sales agents), maintaining an appropriate presence in emerging market countries and continually evaluating our routes-to-market.
|
|
•
|
Active Participation in the Medical Community.
We believe that excellent working relationships with physicians and others in the medical industry enable us to gain an understanding of new therapeutic and diagnostic alternatives, trends and emerging opportunities. Active participation allows us to quickly respond to the changing needs of physicians and patients. In addition, we are an active sponsor of medical education both in the United States and internationally, offering training on new and innovative surgical techniques as well as other medical education materials for use with our products.
|
3
Products
The following table sets forth the percentage of net sales for each of our product lines during each of the three years ended December 31:
|
|
Year Ended December 31,
|
||||||||||
|
|
2018
|
2017
|
2016
|
||||||||
|
Orthopedic surgery
|
52
|
%
|
54
|
%
|
55
|
%
|
|||||
|
General surgery
|
48
|
|
46
|
|
45
|
|
|||||
|
Consolidated net sales
|
100
|
%
|
100
|
%
|
100
|
%
|
|||||
|
Net sales (in thousands)
|
$
|
859,634
|
|
$
|
796,392
|
|
$
|
763,520
|
|
||
Orthopedic Surgery
Our orthopedic surgery product offering includes sports medicine, powered surgical instruments, and sports biologics and tissue. These products are marketed under a number of brands, including Hall
®
, CONMED Linvatec
®
, Concept
®
and Shutt
®
.
In
2018
, approximately
72%
of orthopedic surgery revenue came from single-use products that are expected to be recurring.
We offer a comprehensive range of devices and products to repair injuries in the articulating joint areas of the body. Many of these injuries are the result of sports related events or similar traumas. Our sports medicine products include powered resection instruments, arthroscopes, reconstructive systems, tissue repair sets, metal and bioabsorbable implants as well as related disposable products and fluid management systems. It is our standard practice to place some of these products, such as shaver consoles and fluid pumps, with certain customers at no charge in exchange for commitments to purchase disposable products over certain time periods. We loan this capital equipment, and it is subject to return if the customer does not meet certain minimum single-use purchases. Single-use products include products such as shaver blades, burs and pump tubing. In sports medicine, we compete with Smith & Nephew, plc; Arthrex, Inc.; Stryker Corporation; Johnson & Johnson: DePuy Mitek, Inc. and Zimmer Biomet, Inc.
Our powered instruments offering is sold principally under the Hall
®
Surgical brand name, for use in large and small bone orthopedic, arthroscopic, oral/maxillofacial, podiatric, plastic, ENT, neurological, spinal and cardiothoracic surgeries. Our newest product is the Hall 50™ Powered Instrument System, specifically designed to meet the requirements of most orthopedic applications. The modularity and versatility of the Hall 50™ Powered Instrument System allows a facility to purchase a single power system to perform total joint arthroplasty, trauma, arthroscopy and some small bone procedures. In powered instruments, our competition includes Stryker Corporation; Medtronic plc; Johnson & Johnson: DePuy Synthes, Inc.; MicroAire Surgical Instruments, LLC and Zimmer Biomet, Inc.
Our surgical visualization products offer imaging systems for use in minimally invasive orthopedic and general surgery procedures including 2DHD and 3DHD vision technologies. In surgical visualization, our competition includes Smith & Nephew, plc; Arthrex, Inc.; Stryker Corporation; Olympus, Inc.; Richard Wolf and Karl Storz GmbH.
The Company is party to an agreement with Musculoskeletal Transplant Foundation (“MTF”) for the exclusive worldwide sales representation, marketing and promotion of MTF's allograft tissues in the field of sports medicine and related areas to customers through our sales force and marketing. The allograft tissues supplied by MTF under this agreement are used in the reconstruction and/or replacement of tendon, ligament, cartilage or menisci, along with the correction of deformities within the extremities.
General Surgery
Our general surgery product line offers a large range of products in the areas of advanced surgical, endoscopic technologies and critical care.
In
2018
, approximately
87%
of general surgery revenue came from single-use products that are expected to be recurring.
Our advanced surgical product offering includes the leading clinical insufflation system (AirSeal
®
), an extensive energy line and a broad offering of endomechanical products. AirSeal
®
includes proprietary valveless access ports to deliver significant benefits to traditional minimally invasive surgery and robotic surgery. The electrosurgical offering consists of monopolar and bipolar generators, Argon beam coagulation generators, handpieces, smoke management systems and other accessories. Our endomechanical products offer a full line of instruments, including tissue retrieval bags, trocars, suction irrigation devices, graspers, scissors and dissectors, used in minimally invasive surgery. We offer a unique and premium uterine manipulator called VCARE
®
4
for use in increasing the efficiency of laparoscopic hysterectomies and other gynecologic laparoscopic procedures. Our competition includes Medtronic plc; Johnson & Johnson: Ethicon Endo-Surgery, Inc.; Stryker Endoscopy, Olympus, ERBE Elektromedizin GmbH; and Applied Medical Resources Corporation.
Our endoscopic technologies offering includes a comprehensive line of diagnostic and therapeutic products used in gastroenterology procedures which utilize flexible endoscopes. This offering includes forceps, snares, infection prevention accessories, and devices for dilatation, stricture management, hemostasis and for the treatment of diseases of the biliary structures. Our competition includes Boston Scientific Corporation - Endoscopy; Cook Medical, Inc.; Merit Medical Endotek; Olympus, Inc.; STERIS Corporation - U.S. Endoscopy and Cantel Medical- Medivators, Inc.
Our cardiology and critical care offering includes a line of vital signs, cardiac monitoring and patient care products including ECG electrodes & accessories, cardiac defibrillation & pacing pads and a complete line of suction instruments and tubing. Finally, we offer a physician's office electrosurgical product mainly used by dermatologists. Cardiology and critical care's main competition includes Cardinal (formerly Medtronic plc) and 3M Company.
Buffalo Filter Acquisition
On
February 11, 2019
, we acquired Buffalo Filter and all of the issued and outstanding common stock of Palmerton Holdings, Inc. from Filtration Group FGC LLC (the “Buffalo Filter Acquisition”) for approximately
$365 million
, in cash, subject to customary adjustments for working capital, cash held by Buffalo Filter at closing, indebtedness of Buffalo Filter, expenses related to the transaction and other related fees and expenses. Buffalo Filter develops, manufactures and markets smoke evacuation technologies that are complementary to our Advanced Surgical portfolio.
We financed the purchase price for the Buffalo Filter Acquisition using a combination of the issuance of $345 million of 2.625% convertible notes due 2024 issued on January 29, 2019 (the Convertible Notes”) and the incurrence of indebtedness under our sixth amended and restated senior secured credit agreement, which closed on
February 7, 2019
.
International
Expanding our international presence is an important component of our long-term growth plan. Our products are sold in over 100 foreign countries. International sales efforts are coordinated through local country dealers (including sub-distributors or sales agents) or through direct in-country sales. We distribute our products through sales subsidiaries and branches with offices located in Australia, Austria, Belgium, Canada, China, Denmark, Finland, France, Germany, Italy, Japan, Korea, the Netherlands, Poland, Spain, Sweden and the United Kingdom. In these countries, our sales are denominated in the local currency and amounted to approximately
34%
of our total net sales in
2018
. In the remaining countries where our products are sold through independent distributors, sales are denominated in United States dollars.
Competition
We compete in orthopedic and general surgery medical device markets across the world. Our competitors range from large manufacturers with multiple business units to smaller manufacturers with limited product offerings. We believe we have appropriate product offerings and adequate market share to compete effectively in these markets. The global markets are constantly changing due to technological advances. We seek to closely align our research and development with our key business objectives, namely developing and improving products and processes, applying innovative technology to the manufacture of products for new global markets and reducing the cost of producing core products.
The breadth of our product lines in our key product areas enables us to meet a wide range of customer requirements and preferences. This has enhanced our ability to market our products to surgeons, hospitals, surgery centers, group purchasing organizations ("GPOs"), integrated delivery networks ("IDNs") and other customers, particularly as institutions seek to reduce costs and minimize the number of suppliers.
Marketing
A significant portion of our products are distributed domestically directly to more than 6,000 hospitals, surgery centers and other healthcare institutions as well as through medical specialty distributors. We are not dependent on any single customer and no single customer accounted for more than 10% of our net sales in
2018, 2017 and 2016
.
A significant portion of our U.S. sales are to customers affiliated with GPOs, IDNs and other large national or regional accounts, as well as to the Veterans Administration and other hospitals operated by the Federal government. For hospital inventory
5
management purposes, some of our customers prefer to purchase our products through independent third-party medical product distributors.
Our employee sales representatives are extensively trained in our various product offerings. Each employee sales representative is assigned a defined geographic area and compensated on a commission basis or through a combination of salary and commission. The sales force is supervised and supported by either area directors or district managers. In certain geographies, sales agent groups are used in the United States to sell our orthopedic products. These sales agent groups are paid a commission for sales made to customers while home office sales and marketing management provide the overall direction and training for marketing and positioning of our products. Our sales professionals provide surgeons and medical personnel with information relating to the technical features and benefits of our products.
Our health systems organization is responsible for interacting with large regional and national accounts (e.g. GPOs, IDNs, etc.). We have contracts with many such organizations and believe that the loss of any individual group purchasing contract will not materially impact our business. In addition, all of our sales professionals are required to work closely with distributors where applicable and maintain close relationships with end-users.
We sell to a diversified base of customers around the world and, therefore, believe there is no material concentration of credit risk.
Manufacturing
Raw material costs constitute a substantial portion of our cost of production. Substantially all of our raw materials and select components used in the manufacturing process are procured from external suppliers. We work closely with multiple suppliers to ensure continuity of supply while maintaining high quality and reliability. As a consequence of supply chain best practices, new product development and acquisitions, we often form strategic partnerships with key suppliers. As a consequence of these supplier partnerships, components and raw materials may be sole sourced. Due to the strength of these suppliers and the variety of products we provide, we do not believe the risk of supplier interruption poses an overall material adverse effect on our financial and operational performance. We schedule production and maintain adequate levels of safety stock based on a number of factors, including experience, knowledge of customer ordering patterns, demand, manufacturing lead times and optimal quantities required to maintain the highest possible service levels. Customer orders are generally processed for immediate shipment and backlog of firm orders is therefore not considered material to an understanding of our business.
Research and Development
New and improved products play a critical role in our continued sales growth. Internal research and development efforts focus on the development of new products and product technological and design improvements aimed at complementing and expanding existing product lines. We continually seek to leverage new technologies which improve the durability, performance and usability of existing products. In addition, we maintain close working relationships with surgeons, inventors and operating room personnel who often make new product and technology disclosures, principally in procedure-specific areas. In certain cases, we seek to obtain rights to these ideas through negotiated agreements. Such agreements typically compensate the originator through payments based upon a percentage of licensed product net sales. Annual royalty expense approximated
$1.5 million
,
$1.8 million
and
$2.3 million
in
2018, 2017 and 2016
, respectively.
Amounts expended for Company research and development were approximately
$42.2 million
,
$32.3 million
and
$32.3 million
during
2018, 2017 and 2016
, respectively.
Intellectual Property
Patents and other proprietary rights, in general, are important to our business. We have rights to intellectual property, including United States patents and foreign equivalent patents which cover a wide range of our products. We own a majority of these patents and have exclusive and non-exclusive licensing rights to the remainder. In addition, certain of these patents have currently been licensed to third parties on a non-exclusive basis. We believe that the development of new products and technological and design improvements to existing products will continue to be of primary importance in maintaining our competitive position.
6
Government Regulation and Quality Systems
The development, manufacture, sale and distribution of our products are subject to regulation by numerous agencies and legislative bodies, including the U.S. Food and Drug Administration ("FDA") and comparable foreign counterparts. In the United States, these regulations were enacted under the Medical Device Amendments of 1976 to the Federal Food, Drug and Cosmetic Act and its subsequent amendments, and the regulations issued or proposed thereunder.
The FDA’s Quality System Regulations set forth requirements for our product design and manufacturing processes, require the maintenance of certain records, provide for on-site inspection of our facilities and continuing review by the FDA. Many of our products are also subject to industry-defined standards. Authorization to commercially market our products in the U.S. is granted by the FDA under a procedure referred to as a 510(k) pre-market notification. This process requires us to notify the FDA of the new product and obtain FDA clearance before marketing the device. We believe that our products and processes presently meet applicable standards in all material respects.
Medical device regulations continue to evolve world-wide. Products marketed in the European Union and other countries require preparation of technical files and design dossiers which demonstrate compliance with applicable international regulations. As government regulations continue to change, there is a risk that the distribution of some of our products may be interrupted or discontinued if they do not meet the country specific requirements.
We market our products in numerous foreign countries and therefore are subject to regulations affecting, among other things, product standards, sterilization, packaging requirements, labeling requirements, import laws and onsite inspection by independent bodies with the authority to issue or not issue certifications we may require to be able to sell products in certain countries. Many of the regulations applicable to our devices and products in these countries are similar to those of the FDA. The member countries of the European Union have adopted the European Medical Device Directives, which create a single set of medical device regulations for all member countries. These regulations require companies that wish to manufacture and distribute medical devices in the European Union to maintain quality system certifications through European Union recognized Notified Bodies. These Notified Bodies authorize the use of the CE Mark allowing free movement of our products throughout the member countries. Requirements pertaining to our products vary widely from country to country, ranging from simple product registrations to detailed submissions such as those required by the FDA. We believe that our products and quality procedures currently meet applicable standards for the countries in which they are marketed.
As noted above, our facilities are subject to periodic inspection by the United States Food and Drug Administration (“FDA”) and foreign regulatory agencies or notified bodies for, among other things, conformance to Quality System Regulation and Current Good Manufacturing Practice (“CGMP”) requirements and foreign or international standards. Refer to Note 12 to the consolidated financial statements for further discussion.
We are also subject to various environmental health and safety laws and regulations both in the United States and internationally. Our operations involve the use of substances regulated under environmental laws, primarily in manufacturing and sterilization processes. We believe our policies, practices and procedures are properly designed to comply, in all material respects, with applicable environmental laws and regulations. We do not expect compliance with these requirements to have a material effect on purchases of property, plant and equipment, cash flows, net income or our competitive position.
Employees
As of
December 31, 2018
, we had approximately
3,100
full-time employees, including approximately
1,890
in operations,
150
in research and development and the remaining in sales, marketing and related administrative support. We believe that we have good relations with our employees and have never experienced a strike or similar work stoppage. None of our domestic employees are represented by a labor union.
Item 1A. Risk Factors
An investment in our securities, including our common stock, involves a high degree of risk. Investors should carefully consider the specific factors set forth below as well as the other information included or incorporated by reference in this Form 10-K. See “Forward Looking Statements”.
7
(i) Risks Related to Our Business and the Medical Device Industry
Our financial performance is dependent on conditions in the healthcare industry and the broader economy.
The results of our business are directly tied to the economic conditions in the healthcare industry and the broader economy as a whole. We will continue to monitor and manage the impact of the overall economic environment on the Company.
In addition, approximately
21%
of our revenues are derived from the sale of capital products. The sales of such products may be negatively impacted if hospitals and other healthcare providers are unable to secure the financing necessary to purchase these products or otherwise defer purchases.
Our financial performance may be adversely impacted by healthcare reform legislation.
Provisions of healthcare legislation, including provisions of the Patient Protection and Affordable Care Act ("ACA"), could meaningfully change the way health care is developed and delivered and may adversely affect our business and results of operations. For example, the ACA includes provisions aimed at improving quality and decreasing costs of Medicare, governing comparative effectiveness research, and implementing an independent payment advisory board and pilot programs to evaluate alternative payment methodologies. That legislation also included a 2.3% excise tax imposed upon sales within the U.S. of certain medical device products, which has been delayed until 2020. We also face uncertainties that might result in the modification or repeal of any provisions of the ACA, including as a result of current and future executive orders and legislative actions. The uncertainty associated with modifications or a repeal could generally cause healthcare markets to be unstable and we could be subject to some interruptions, the magnitude of which are impossible to determine, as healthcare providers, both facilities and medical professionals, who have benefited from the ACA determine the paths forward.
As a manufacturer of medical devices that interacts with physicians and health care providers domestically and internationally, we face risks under domestic and foreign regulations, including the Foreign Corrupt Practices Act.
Manufacturers of medical devices have been the subject of various investigations or enforcement actions relating to interactions with health care providers domestically or internationally. The interactions with domestic health care providers are subject to regulations, known as the Anti-Kickback Statute, the Stark Act and the False Claims Act, that generally govern incentives for health care providers, or methods of reimbursement funded in whole or in part by the government. Similarly, the Foreign Corrupt Practices Act (“FCPA”) prohibits certain conduct by manufacturers, generally described as bribery, with respect to interactions, either directly through foreign subsidiaries or indirectly through distributors, with health care providers who may be considered government officials because they are affiliated with public hospitals. The FCPA also imposes obligations on manufacturers listed on U.S. stock exchanges to maintain accurate books and records, and maintain internal accounting controls sufficient to provide assurance that transactions are accurately recorded, lawful and in accordance with management’s authorization. The FCPA can pose unique challenges for manufacturers who operate in foreign cultures where conduct prohibited by the FCPA may not be viewed as illegal in local jurisdictions, and because, in some cases, a United States manufacturer may face risks under the FCPA based on the conduct of third parties over whom the manufacturer may not have complete control.
In this regard, from time to time, the Company may receive an information request or subpoena from a government agency, such as the Securities and Exchange Commission, Department of Justice, Equal Employment Opportunity Commission, the Occupational Safety and Health Administration, the Department of Labor, the Treasury Department or other federal and state agencies or foreign governments or government agencies. Alternatively, employees or private parties may provide us with reports of alleged misconduct. These information requests or subpoenas may or may not be routine inquiries, or may begin as informal or routine inquiries and over time develop into investigations or enforcement actions of various types under the FCPA or otherwise. Similarly, the employee and third party reports may prompt us to conduct internal investigations into the alleged misconduct. As a medical device company, CONMED’s operations and interactions with government hospitals, healthcare professionals and purchasers may be subject to various federal and state regulations, including the federal False Claims Act, which provides, in part, that the federal government may bring a lawsuit against any person or entity that it believes has knowingly presented, or caused to be presented, a false or fraudulent request for payment to the government, or has made or used, or caused to be made or used, a false statement or false record material to a false claim. In addition, in certain circumstances, private parties may bring so-called
Qui Tam
claims as plaintiffs purportedly on behalf of the government asserting claims arising under the False Claims Act. A violation of the False Claims Act may result in fines up to $11,000 for each false claim, plus up to three times the amount of damages sustained by the government, and may also provide the basis for the imposition of administrative penalties and exclusion from participation in federal healthcare programs. Many states have enacted false claims acts that are similar to the federal False Claims Act. No inquiry or claim that the Company currently faces or has faced to date, and no report of misconduct that the Company has received to date, has had a material adverse effect on our financial condition, results of operations or cash flows. There can be no assurance, however, that any pending inquiries will not become investigations or enforcement actions, or the costs
8
associated with responding to such inquiries, investigations, enforcement actions or investigations relating to reports of misconduct will not have a material adverse effect on our financial condition, results of operations or cash flows.
Failure to comply with regulatory requirements may result in recalls, fines or materially adverse implications
.
Substantially all of our products are classified as class II medical devices subject to regulation by numerous agencies and legislative bodies, including the FDA and comparable international counterparts. As a manufacturer of medical devices, our manufacturing processes and facilities are subject to on-site inspection and continuing review by the FDA for compliance with the Quality System Regulations. We may have future inspections at our sites and there can be no assurance that the costs of responding to such inspections will not be material.
Manufacturing and sales of our products outside the United States are also subject to international regulatory requirements which vary from country to country. Moreover, we are generally required to obtain regulatory clearance or approval prior to marketing a new product. The time required to obtain approvals from foreign countries may be longer or shorter than that required for FDA clearance, and requirements for such approvals may differ from FDA requirements. Failure to comply with applicable domestic and/or foreign regulatory requirements may result in:
|
•
|
fines or other enforcement actions;
|
|
•
|
recall or seizure of products;
|
|
•
|
total or partial suspension of production;
|
|
•
|
loss of certification;
|
|
•
|
withdrawal of existing product approvals or clearances;
|
|
•
|
refusal to approve or clear new applications or notices;
|
|
•
|
increased quality control costs; or
|
|
•
|
criminal prosecution.
|
Failure to comply with Quality System Regulations and applicable international regulations could result in a material adverse effect on our business, financial condition or results of operations.
If we are not able to manufacture products in compliance with regulatory standards, we may decide to cease manufacturing of those products and may be subject to product recall.
In addition to the Quality System Regulations, many of our products are also subject to industry-defined standards. We may not be able to comply with these regulations and standards due to deficiencies in component parts or our manufacturing processes. If we are not able to comply with the Quality System Regulations or industry-defined standards, we may not be able to fill customer orders and we may decide to cease production of non-compliant products. Failure to produce products could affect our profit margins and could lead to loss of customers.
Our products are subject to product recall and we have conducted product recalls in the past. Although no recall has had a material adverse effect on our business or financial condition, we cannot assure you that regulatory issues will not have a material adverse effect on our business, financial condition or results of operations in the future or that product recalls will not harm our reputation and our customer relationships.
The highly competitive market for our products may create adverse pricing pressures.
The market for our products is highly competitive and our customers have numerous alternatives of supply. Many of our competitors offer a range of products in areas other than those in which we compete, which may make such competitors more attractive to surgeons, hospitals, group purchasing organizations and others. In addition, many of our competitors are large, technically competent firms with substantial assets. Competitive pricing pressures or the introduction of new products by our competitors could have an adverse effect on our revenues. See “Products” in Item 1 - Business for a further discussion of these competitive forces.
Factors which may influence our customers’ choice of competitor products include:
•
changes in surgeon preferences;
•
increases or decreases in healthcare spending related to medical devices;
•
our inability to supply products to them as a result of product recall, market withdrawal or back-order;
•
the introduction by competitors of new products or new features to existing products;
•
the introduction by competitors of alternative surgical technology; and
9
•
advances in surgical procedures, discoveries or developments in the healthcare industry.
Cost reduction efforts in the healthcare industry could put pressures on our prices and margins.
In recent years, the healthcare industry has undergone significant change driven by various efforts to reduce costs. Such efforts include national healthcare reform, trends towards managed care, cuts in Medicare reimbursement for procedures, consolidation of healthcare distribution companies and collective purchasing arrangements by GPOs and IDNs. Demand and prices for our products may be adversely affected by such trends.
We use a variety of raw materials in our businesses, and significant shortages or price increases could increase our operating costs and adversely impact the competitive positions of our products.
Our reliance on certain suppliers and commodity markets to secure raw materials used in our products exposes us to volatility in the prices and availability of raw materials. In some instances, we participate in commodity markets that may be subject to allocations by suppliers. A disruption in deliveries from our suppliers, price increases or decreased availability of raw materials or commodities could have an adverse effect on our ability to meet our commitments to customers or increase our operating costs. We believe that our supply management practices are based on an appropriate balancing of the foreseeable risks and the costs of alternative practices. Nonetheless, price increases or the unavailability of some raw materials may have an adverse effect on our results of operations or financial condition.
We may not be able to keep pace with technological change or to successfully develop new products with wide market acceptance, which could cause us to lose business to competitors.
The market for our products is characterized by rapidly changing technology. Our future financial performance will depend in part on our ability to develop and manufacture new products on a cost-effective basis, to introduce them to the market on a timely basis and to have them accepted by surgeons.
We may not be able to keep pace with technology or to develop viable new products. In addition, many of our competitors are substantially larger with greater financial resources which may allow them to more rapidly develop new products. Factors which may result in delays of new product introductions or cancellation of our plans to manufacture and market new products include:
|
•
|
capital constraints;
|
|
•
|
research and development delays;
|
|
•
|
delays in securing regulatory approvals; and
|
|
•
|
changes in the competitive landscape, including the emergence of alternative products or solutions which reduce or eliminate the markets for pending products.
|
Ordering patterns of our customers may change resulting in reductions in sales
.
Our hospital and surgery center customers purchase our products in quantities sufficient to meet their anticipated demand. Likewise, our healthcare distributor customers purchase our products for ultimate resale to healthcare providers in quantities sufficient to meet the anticipated requirements of the distributors’ customers. Should inventories of our products owned by our hospital, surgery center and distributor customers grow to levels higher than their requirements, our customers may reduce the ordering of products from us. This could result in reduced sales during a financial accounting period.
(ii) Risks Related to Our Indebtedness
The terms of our indebtedness outstanding from time to time, including our senior credit agreement, may restrict our current and future operations, particularly our ability to respond to changes or to take certain actions.
The senior credit agreement contains, and future credit facilities are expected to contain, a number of restrictive covenants that impose significant operating and financial restrictions on us and may limit our ability to respond to changes in our business or competitive activities, or to otherwise engage in acts that may be in our long-term best interest, including restrictions on our ability to:
•
incur indebtedness;
•
allow for liens to be placed on our assets;
•
make investments;
•
engage in transactions with affiliates;
10
•
make certain restricted payments;
•
enter into certain restrictive agreements;
•
enter into certain swap agreements;
•
change our line of business;
•
pay dividends or make other distributions on, or redeem or repurchase, capital stock;
•
consolidate, merge or sell all or substantially all of our assets;
•
prepay and/or modify the terms of certain indebtedness; and
•
pursue acquisitions.
These covenants, unless waived, may prevent us from pursuing acquisitions, significantly limit our operating and financial flexibility and limit our ability to respond to changes in our business or competitive activities. Our ability to comply with such provisions may be affected by events beyond our control. In the event of any default under our credit agreement, the credit agreement lenders may elect to declare all amounts borrowed under our credit agreement, together with accrued interest, to be due and payable. If we were unable to repay such borrowings, the credit agreement lenders could proceed against collateral securing the credit agreement which consists of substantially all of our property and assets. Our credit agreement also contains a material adverse effect clause which may limit our ability to access additional funding under our credit agreement should a material adverse change in our business occur.
We may not be able to generate sufficient cash to service our indebtedness, and, our leverage and debt service requirements may require us to adopt alternative business strategies
.
As of
December 31, 2018
, we had
$457.2 million
of debt outstanding, representing
40%
of total capitalization. We may not have sufficient cash flow available to enable us to meet our obligations. If we are unable to service our indebtedness, we will be forced to adopt an alternative strategy that may include actions such as foregoing acquisitions, reducing or delaying capital expenditures, selling assets, restructuring or refinancing our indebtedness or seeking additional equity capital. We cannot assure you that any of these strategies could be implemented on terms acceptable to us, if at all. See “Management’s Discussion and Analysis of Financial Condition and Results of Operations—Liquidity and Capital Resources” and Note 6 to our consolidated financial statements.
The degree to which we are leveraged could have important consequences to investors, including but not limited to the following:
|
•
|
a portion of our cash flow from operations must be dedicated to debt service and will not be available for operations, capital expenditures, acquisitions, dividends and other purposes;
|
|
•
|
our ability to obtain additional financing in the future for working capital, capital expenditures, acquisitions or general corporate purposes may be limited or impaired or may be at higher interest rates;
|
|
•
|
we may be at a competitive disadvantage when compared to competitors that are less leveraged;
|
|
•
|
we may be hindered in our ability to adjust rapidly to market conditions;
|
|
•
|
our degree of leverage could make us more vulnerable in the event of a downturn in general economic conditions or other adverse circumstances applicable to us; and
|
|
•
|
our interest expense could increase if interest rates in general increase because a portion of our borrowings, including our borrowings under our credit agreement, are and will continue to be at variable rates of interest.
|
Our variable rate indebtedness subjects us to interest rate risk, which could cause our debt service obligations to increase significantly.
Borrowings under our senior credit agreement are at variable rates of interest and expose us to interest rate risk. If interest rates were to increase, our debt service obligations on the variable rate indebtedness would increase even though the amount borrowed remained the same, and our net income and cash flows, including cash available for servicing our indebtedness, will correspondingly decrease. In the future, we may enter into interest rate swaps that involve the exchange of floating for fixed rate interest payments in order to reduce interest rate volatility. However, we may not maintain interest rate swaps with respect to all of our variable rate indebtedness, and any swaps we enter into may not fully mitigate our interest rate risk.
Despite our current level of indebtedness, we and our subsidiaries may still be able to incur substantially more debt. This could further exacerbate the risks to our financial condition described above.
We may incur substantial additional indebtedness, including secured indebtedness. As of December 31, 2018 and after giving effect to the Buffalo Filter acquisition on a
pro forma
basis, the borrowing under our sixth senior credit agreement, and the issuance of the notes and the use of proceeds therefrom, we would have had $324.0 million of availability under the senior credit agreement. If we incur secured indebtedness and such secured indebtedness is either accelerated or becomes subject to a
11
bankruptcy, liquidation or reorganization, our assets would be used to satisfy obligations with respect to the indebtedness secured thereby before any payment could be made on the debt that is not similarly secured. If new debt or other liabilities are added to our current debt levels, the related risks that we now face could intensify. Our senior credit agreement restricts our ability to incur additional indebtedness, including secured indebtedness, but if the facilities mature or are repaid, we may not be subject to such restrictions under the terms of any subsequent indebtedness.
The conditional conversion features of our 2.625% Convertible Notes due 2024 (the “Convertible Notes”), if triggered, may adversely affect our financial condition.
In the event the conditional conversion features of the Convertible Notes issued on January 29, 2019 are triggered, holders of the Convertible Notes will be entitled to convert the Convertible Notes at any time during specified periods at their option. If one or more holders elect to convert their Convertible Notes, unless we elect to satisfy our conversion obligation by delivering solely shares of our common stock, we would be required to make cash payments to satisfy all or a portion of our conversion obligation based on the conversion rate, which could adversely affect our liquidity. In addition, even if holders do not elect to convert their Convertible Notes, we could be required under applicable accounting rules to reclassify all or a portion of the outstanding principal of the Convertible Notes as a current rather than long-term liability, which could result in a material reduction of our net working capital. Refer to Item 7. Management and Discussion and Analysis - Financing Cash Flows and Note 17 for further details on the Convertible Notes.
The convertible note hedge and warrant transactions that we entered into in connection with the offering of the Convertible Notes may affect the value of the Convertible Notes and our common stock.
In connection with the offering of the Convertible Notes, we entered into convertible note hedge transactions with certain option counterparties (each an “option counterparty”). The convertible note hedge transactions are expected generally to reduce the potential dilution upon conversion of the Convertible Notes and/or offset any cash payments we are required to make in excess of the principal amount of converted Convertible Notes, as the case may be. We also entered into warrant transactions with each option counterparty. The warrant transactions could separately have a dilutive effect on our common stock to the extent that the market price per share of our common stock exceeds the strike price of the warrants, unless we elect to settle the warrants in cash. In connection with establishing its initial hedge of the convertible note hedge and warrant transactions, each option counterparty or an affiliate thereof may have entered into various derivative transactions with respect to our common stock concurrently with or shortly after the pricing of the Convertible Notes. This activity could increase (or reduce the size of any decrease in) the market price of our common stock or the Convertible Notes at that time. In addition, each option counterparty or an affiliate thereof may modify its hedge position by entering into or unwinding various derivatives with respect to our common stock and/or purchasing or selling our common stock or other securities of ours in secondary market transactions prior to the maturity of the Convertible Notes (and is likely to do so during any observation period related to a conversion of the Convertible Notes). This activity could also cause or avoid an increase or a decrease in the market price of our common stock or the Convertible Notes. In addition, if any such convertible note hedge and warrant transactions fail to become effective, each option counterparty may unwind its hedge position with respect to our common stock, which could adversely affect the value of our common stock and the value of the Convertible Notes.
We are subject to counterparty risk with respect to the convertible note hedge transactions.
Each option counterparty to the convertible note hedge transactions is a financial institution whose obligation to perform under the convertible note hedge transaction will not be secured by any collateral. If an option counterparty becomes subject to insolvency proceedings, we will become an unsecured creditor in those proceedings with a claim equal to our exposure at that time under our transactions with the option counterparty. Our exposure will generally correlate to the increase in the market price and in the volatility of our common stock. In addition, upon a default by an option counterparty, we may suffer adverse tax consequences and more dilution than we currently anticipate with respect to our common stock. Although these counterparties are large, reputable U.S. financial institutions, we can provide no assurances as to the financial stability or viability of any option counterparty.
(iii) Risks Related to Our Acquisition Strategy
Our financial performance is subject to the risks inherent in our acquisition strategy, including the effects of increased borrowing and integration of newly acquired businesses or product lines
.
A key element of our business strategy has been to expand through acquisitions and we may seek to pursue additional acquisitions in the future, including the acquisition of Buffalo Filter. Our success in pursuing this strategy depends on our ability to identify target companies or product lines that are available for sale, and, negotiating successful terms with the sellers, as the sellers may also be negotiating with other bidders with greater financial resources than we have. Even when we win a bid, our success is also
12
dependent in part upon our ability to integrate acquired companies or product lines into our existing operations. We may not have sufficient management and other resources to accomplish the integration of our past and future acquisitions and implementing our acquisition strategy may strain our relationship with customers, suppliers, distributors, personnel or others. There can be no assurance that we will be able to identify and make acquisitions on acceptable terms or that we will be able to obtain financing for such acquisitions on acceptable terms. In addition, while we are generally entitled to customary indemnification from sellers of businesses or coverage from representation and warranty insurance for any difficulties that may have arisen prior to our acquisition of each business, acquisitions may involve exposure to unknown liabilities and the amount and time for claiming under these indemnification provisions is often limited. As a result, our financial performance is now, and will continue to be, subject to various risks associated with the acquisition of businesses, including the financial effects associated with any increased borrowing required to fund such acquisitions or with the integration of such businesses.
The terms of any future preferred equity or debt financing may give holders of any preferred securities or debt securities rights that are senior to rights of our common shareholders or impose more stringent operating restrictions on our company.
Debt or equity financing may not be available to us on acceptable terms. If we incur additional debt or raise equity through the issuance of preferred stock or convertible securities, the terms of the debt or the preferred stock issued may give the holders rights, preferences and privileges senior to those of holders of our common stock, particularly in the event of liquidation. The terms of the debt may also impose additional and more stringent restrictions on our operations. If we raise funds through the issuance of additional equity, the ownership percentage of our existing shareholders would be diluted.
(iv) Other Risks Related to Our Business
We could experience a failure of a key information technology system, process or site or a breach of information security, including a cybersecurity breach or failure of one or more key information technology systems, networks, processes, associated sites or service providers.
We rely extensively on information technology (“IT”) systems for the storage, processing, and transmission of our electronic, business-related, information assets used in or necessary to conduct business. We leverage our internal IT infrastructures, and those of our business partners, to enable, sustain, and support our global business activities. In addition, we rely on networks and services, including internet sites, data hosting and processing facilities and tools and other hardware, software and technical applications and platforms, some of which are managed, hosted, provided and/or used by third-parties or their vendors, to assist in conducting our business. The data we store and process may include customer payment information, personal information concerning our employees, confidential financial information, and other types of sensitive business-related information. In limited instances, we may also come into possession of information related to patients of our physician customers. Numerous and evolving cybersecurity threats pose potential risks to the security of our IT systems, networks and services, as well as the confidentiality, availability and integrity of our data. In addition, the laws and regulations governing security of data on IT systems and otherwise collected, processed, stored, transmitted, disclosed and disposed of by companies are evolving, adding another layer of complexity in the form of new requirements. We have made, and continue to make investments, seeking to address these threats, including monitoring of networks and systems, hiring of experts, employee training and security policies for employees and third-party providers. The techniques used in these attacks change frequently and may be difficult to detect for periods of time and we may face difficulties in anticipating and implementing adequate preventative measures. While the breaches of our IT systems to date have not been material to our business or results of operations, the costs of attempting to protect IT systems and data may increase, and there can be no assurance that these added security efforts will prevent all breaches of our IT systems or thefts of our data. If our IT systems are damaged or cease to function properly, the networks or service providers we rely upon fail to function properly, we fail to comply with an applicable law or regulation, such as the General Data Protection Regulation ("GDPR"), or we or one of our third-party providers suffer a loss or disclosure of our business or stakeholder information due to any number of causes ranging from catastrophic events or power outages to improper data handling or security breaches and our business continuity plans do not effectively address these failures on a timely basis, we may be exposed to potential disruption in operations, loss of customers, reputational, competitive and business harm as well as significant costs from remediation, litigation and regulatory actions.
We rely on a third party to obtain, process and distribute sports medicine allograft tissue. If such tissue cannot be obtained, is not accepted by the market or is not accepted under numerous government regulations, our results of operations could be negatively impacted.
A portion of our orthopedic revenues relate to our share of the service fees from the MTF allograft tissues for which we have exclusive worldwide sales representation, marketing and promotion rights, as further described in our revenue recognition policy in Note 1 to the consolidated financial statements. Our primary costs related to these revenues come from our commission expense and certain marketing costs. Our ability to increase the service fees may be constrained by certain factors which are outside of
13
our control, such as the limited supply of donors and donated tissue that meets the quality standards of MTF. Similarly, under the terms of the agreement, MTF remains responsible for tissue procurement and processing, shipment of tissues and invoicing of service fees to customers. To the extent MTF’s performance does not meet customer expectations or otherwise fails, CONMED may be unable to increase the allograft service fees or to find a suitable replacement for MTF on terms that are acceptable.
The FDA and several states have statutory authority to regulate allograft processing and allograft-based materials. The FDA could identify deficiencies in future inspections of MTF or MTF's suppliers or promulgate future regulatory rulings that could disrupt our business, reducing profitability.
We distribute some products for third-party companies, and cannot ensure that our rights to distribute such third-party products will continue indefinitely.
While we generally own the products' designs and rights to the products we sell, in some cases we distribute products for third-parties. While these third-parties may have business reasons for contracting with us to distribute their products, we may face the risk that the third-parties may seek alternate distribution partners when their distribution contracts with us expire or are scheduled for renewal. If we lose the distribution rights to such products, we may not be able to find replacement products that are acceptable to our customers, or to us.
If we lose our patents or they are held to be invalid, or if our products or services infringe on third party patents, we could become subject to liability and our competitive position could be harmed.
Much of the technology used in the markets in which we compete is covered by patents. We have numerous U.S. patents and corresponding international patents on products expiring at various dates from
2019
through
2040
and have additional patent applications pending. See Item 1 Business “Research and Development” and “Intellectual Property” for a further description of our patents. The loss of our patents could reduce the value of the related products and any related competitive advantage. Competitors may also be able to design around our patents and to compete effectively with our products. In addition, the cost of enforcing our patents against third parties and defending our products against patent infringement actions by others could be substantial, and we may not prevail.
While we seek to take reasonable steps to avoid infringing on patents we do not own or license, we cannot be sure that our services and products do not infringe on the intellectual property rights of third parties, and we may have infringement claims asserted against us. These claims could cost us money, prevent us from offering some services or products, or damage our reputation.
We cannot assure you that:
|
•
|
pending patent applications will result in issued patents;
|
|
•
|
patents issued to or licensed by us will not be challenged by competitors;
|
|
•
|
our patents will be found to be valid or sufficiently broad to protect our technology or provide us with a competitive advantage; or
|
|
•
|
we will be successful in defending against pending or future patent infringement claims asserted against our products.
|
We can be sued for product liability claims and our insurance coverage may be insufficient to cover the nature and amount of any product liability claims
.
Even if our products are properly designed and perform as intended, we may be sued because the nature of our products as medical devices and today’s litigious environment should be regarded as potential risks which could significantly and adversely affect our financial condition and results of operations. The insurance we maintain to protect against claims associated with the use of our products has deductibles and may not adequately cover the amount or nature of any claim asserted against us. We are also exposed to the risk that our insurers may become insolvent or that premiums may increase substantially. See “Item 3 - Legal Proceedings” for a further discussion of the risk of product liability actions and our insurance coverage.
Damage to our physical properties as a result of windstorm, earthquake, fire or other natural or man-made disaster may cause a financial loss and a loss of customers.
Although we maintain insurance coverage for physical damage to our property and the resultant losses that could occur during a business interruption, we are required to pay deductibles and our insurance coverage is limited to certain caps. For example, our deductible for windstorm damage to our Florida property amounts to 2% of any loss.
14
Further, while insurance reimburses us for our lost gross earnings during a business interruption, if we are unable to supply our customers with our products for an extended period of time, there can be no assurance that we will regain the customers’ business once the product supply is returned to normal.
Our significant international operations subject us to foreign currency fluctuations and other risks associated with operating in countries outside the United States
.
A significant portion of our revenues, approximately
48%
of
2018
consolidated net sales, were to customers outside the United States. We have sales subsidiaries in a significant number of countries in Europe as well as Australia, Canada, China, Japan and Korea. In those countries in which we have a direct presence, our sales are denominated in the local currency and those sales denominated in local currency amounted to approximately
34%
of our total net sales in
2018
. The remaining
14%
of sales to customers outside the United States was on an export basis and transacted in United States dollars.
Because a significant portion of our operations consist of sales activities in jurisdictions outside the United States, our financial results may be affected by factors such as changes in foreign currency exchange rates or weak economic conditions in the markets in which we distribute products. While we have implemented a hedging strategy involving foreign currency forward contracts for
2018
, our revenues and earnings are only partially protected from foreign currency translation if the United States dollar strengthens as compared with currencies such as the Euro. Further, as of the date of this Form 10-K, we have not entered into any foreign currency forward contracts beyond
2020
. Our international presence exposes us to certain other inherent risks, including:
|
•
|
imposition of limitations on conversions of foreign currencies into dollars or remittance of dividends and other payments by international subsidiaries;
|
|
•
|
imposition or increase of withholding and other taxes on remittances and other payments by international subsidiaries;
|
|
•
|
trade barriers and tariffs;
|
|
•
|
compliance with economic sanctions, trade embargoes, export controls, and the customs laws and regulations of the many countries in which we operate;
|
|
•
|
political risks, including political instability;
|
|
•
|
reliance on third parties to distribute our products;
|
|
•
|
hyperinflation in certain countries outside the United States; and
|
|
•
|
imposition or increase of investment and other restrictions by foreign governments.
|
We cannot assure you that such risks will not have a material adverse effect on our business and results of operations.
Our new products may fail to achieve expected levels of market acceptance.
New product introductions may fail to achieve market acceptance. The degree of market acceptance for any of our products will depend upon a number of factors, including:
|
•
|
our ability to develop and introduce new products and product enhancements in the time frames we currently estimate;
|
|
•
|
our ability to successfully implement new technologies;
|
|
•
|
the market’s readiness to accept new products;
|
|
•
|
having adequate financial and technological resources for future product development and promotion;
|
|
•
|
the efficacy of our products; and
|
|
•
|
the prices of our products compared to the prices of our competitors’ products.
|
If our new products do not achieve market acceptance, we may be unable to recover our investments and may lose business to competitors.
In addition, some of the companies with which we now compete, or may compete in the future, have or may have more extensive research, marketing and manufacturing capabilities and significantly greater technical and personnel resources than we do, and may be better positioned to continue to improve their technology in order to compete in an evolving industry. See “Products” in Item 1 - Business for a further discussion of these competitive forces.
Our Board of Directors may, in the future, limit or discontinue payment of a dividend on common stock.
We have paid a regular quarterly dividend to our shareholders since 2012. However, we may not declare or pay such dividends in the future at the prior rate, or at all. All decisions regarding our payment of dividends will be made by our Board of Directors from time to time and will be subject to an evaluation of our financial condition, results of operations and capital requirements, as well as applicable law, regulatory constraints, industry practice, contractual restraints and other business considerations that
15
our Board of Directors considers relevant. In addition, our senior credit agreement contains restrictions on our ability to pay dividends, and the terms of agreements governing debt that we may incur in the future may also limit or prohibit dividend payments. We may not have sufficient surplus or net profits under New York law to be able to pay any dividends, which may result from extraordinary cash expenses, actual expenses exceeding contemplated costs, funding of capital expenditures or increases in reserves.
Anti-takeover provisions in our organizational documents and New York law could delay or prevent a change in control.
Provisions of our certificate of incorporation and bylaws may delay or prevent a merger or acquisition that a shareholder may consider favorable. These provisions include:
|
•
|
the ability of our board of directors to determine to issue shares of preferred stock and to determine the price and other terms of those shares, including preferences and voting rights, without shareholder approval, which could be used to significantly dilute the ownership of a hostile acquirer;
|
|
•
|
the requirement that a special meeting of shareholders may be called only by the board of directors, the chairman of the board of directors or the president, which may delay the ability of our shareholders to force consideration of a proposal or to take action;
|
|
•
|
providing indemnification to our directors and officers;
|
|
•
|
providing that directors may be removed prior to the expiration of their terms by shareholders only for cause; and
|
|
•
|
advance notice procedures that shareholders must comply with in order to nominate candidates to our board of directors or to propose matters to be acted upon at a shareholders’ meeting, which may discourage or deter a potential acquiror from conducting a solicitation of proxies to elect the acquiror’s own slate of directors or otherwise attempting to obtain control of us.
|
As a New York corporation, we are also subject to provisions of New York law, including Section 912 of the New York Business Corporation Law, which prevents some shareholders holding more than 20% of our outstanding common stock from engaging in certain business combinations without approval of the board of directors or the holders of substantially all of our outstanding common stock. Any provision of our certificate of incorporation and bylaws or New York law that has the effect of delaying or deterring a change in control could limit the opportunity for our shareholders to receive a premium for their shares of our common stock, and could also affect the price that some investors are willing to pay for our common stock.
Item 1B. Unresolved Staff Comments
None.
16
Item 2. Properties
Facilities
The following table sets forth certain information with respect to our principal operating facilities. We believe that our facilities are generally well maintained, are suitable to support our business and adequate for present and anticipated needs.
|
Location
|
Square Feet
|
Own or Lease
|
Lease Expiration
|
||||
|
Utica, NY
|
500,000
|
|
Own
|
—
|
|||
|
Largo, FL
|
278,000
|
|
Own
|
—
|
|||
|
Chihuahua, Mexico
|
207,720
|
|
Lease
|
October 2019
|
|||
|
Chihuahua, Mexico
|
40,626
|
|
Lease
|
March 2028
|
|||
|
Lithia Springs, GA
|
188,400
|
|
Lease
|
December 2019
|
|||
|
Brussels, Belgium
|
58,276
|
|
Lease
|
June 2024
|
|||
|
Mississauga, Canada
|
22,421
|
|
Lease
|
December 2023
|
|||
|
Greenwood Village, CO
|
22,162
|
|
Lease
|
July 2024
|
|||
|
Westborough, MA
|
19,515
|
|
Lease
|
June 2020
|
|||
|
Frenchs Forest, Australia
|
16,912
|
|
Lease
|
July 2020
|
|||
|
Seoul, Korea
|
15,586
|
|
Lease
|
January 2020
|
|||
|
Anaheim, CA
|
14,037
|
|
Lease
|
August 2021
|
|||
|
Frankfurt, Germany
|
13,532
|
|
Lease
|
March 2023
|
|||
|
Milan, Italy
|
13,024
|
|
Lease
|
March 2023
|
|||
|
Barcelona, Spain
|
12,820
|
|
Lease
|
December 2023
|
|||
|
Swindon, Wiltshire, UK
|
8,562
|
|
Lease
|
December 2020
|
|||
|
Askim, Sweden
|
8,353
|
|
Lease
|
May 2019
|
|||
|
Lyon, France
|
7,492
|
|
Lease
|
December 2022
|
|||
|
Beijing, China
|
6,799
|
|
Lease
|
June 2019
|
|||
|
Beijing, China
|
3,456
|
|
Lease
|
September 2022
|
|||
|
Shanghai, China
|
4,308
|
|
Lease
|
August 2021
|
|||
|
New York, NY
|
3,473
|
|
Lease
|
September 2022
|
|||
|
Warsaw, Poland
|
3,222
|
|
Lease
|
March 2023
|
|||
|
Espoo, Finland
|
3,078
|
|
Lease
|
January 2020
|
|||
|
Copenhagen, Denmark
|
2,852
|
|
Lease
|
March 2022
|
|||
|
Innsbruck, Austria
|
1,820
|
|
Lease
|
June 2020
|
|||
|
Tokyo, Japan
|
1,753
|
|
Lease
|
December 2020
|
|||
Our principal manufacturing facilities are located in Utica, NY, Largo, FL and Chihuahua, Mexico. Lithia Springs, GA and Brussels, Belgium are our principal distribution centers. The remaining facilities are generally sales and administrative offices with certain offices also including smaller distribution centers.
Item 3. Legal Proceedings
We are involved in various proceedings, legal actions and claims arising in the normal course of business, including proceedings related to product, labor and intellectual property and other matters that are more fully described in Note 12 to the consolidated financial statements. We are not a party to any pending legal proceedings other than ordinary routine litigation incidental to our business.
Item 4. Mine Safety Disclosures
Not applicable.
17
PART II
Item 5. Market for the Registrant’s Common Equity, Related Stockholder Matters and Issuer Purchases of Equity Securities
Our common stock, par value $.01 per share, is traded on the NASDAQ Stock Market under the symbol “CNMD”. At January 31,
2019
, there were approximately 550 registered holders of our common stock and approximately 9,900 accounts held in “street name”.
Our Board of Directors has authorized a share repurchase program; see Note 8 to the consolidated financial statements.
The Board of Directors declared a quarterly cash dividend of $0.20 per share in
2017
and
2018
. The fourth quarter dividend for
2018
was paid on
January 7, 2019
to shareholders of record as of
December 14, 2018
. The total dividend payable at
December 31, 2018
was
$5.6 million
and is included in other current liabilities in the consolidated balance sheet. Future decisions as to the payment of dividends will be at the discretion of the Board of Directors, subject to conditions then existing, including our financial requirements and condition and the limitation and payment of cash dividends contained in debt agreements.
Refer to Item 12 for information relating to compensation plans under which equity securities of CONMED Corporation are authorized for issuance.
18
Performance Graph
The performance graph below compares the yearly percentage change in the Company’s Common Stock with the cumulative total return of the NASDAQ Composite Index and the cumulative total return of the Standard & Poor’s Health Care Equipment Index. In each case, the cumulative total return assumes reinvestment of dividends into the same class of equity securities at the frequency with which dividends are paid on such securities during the applicable fiscal year.
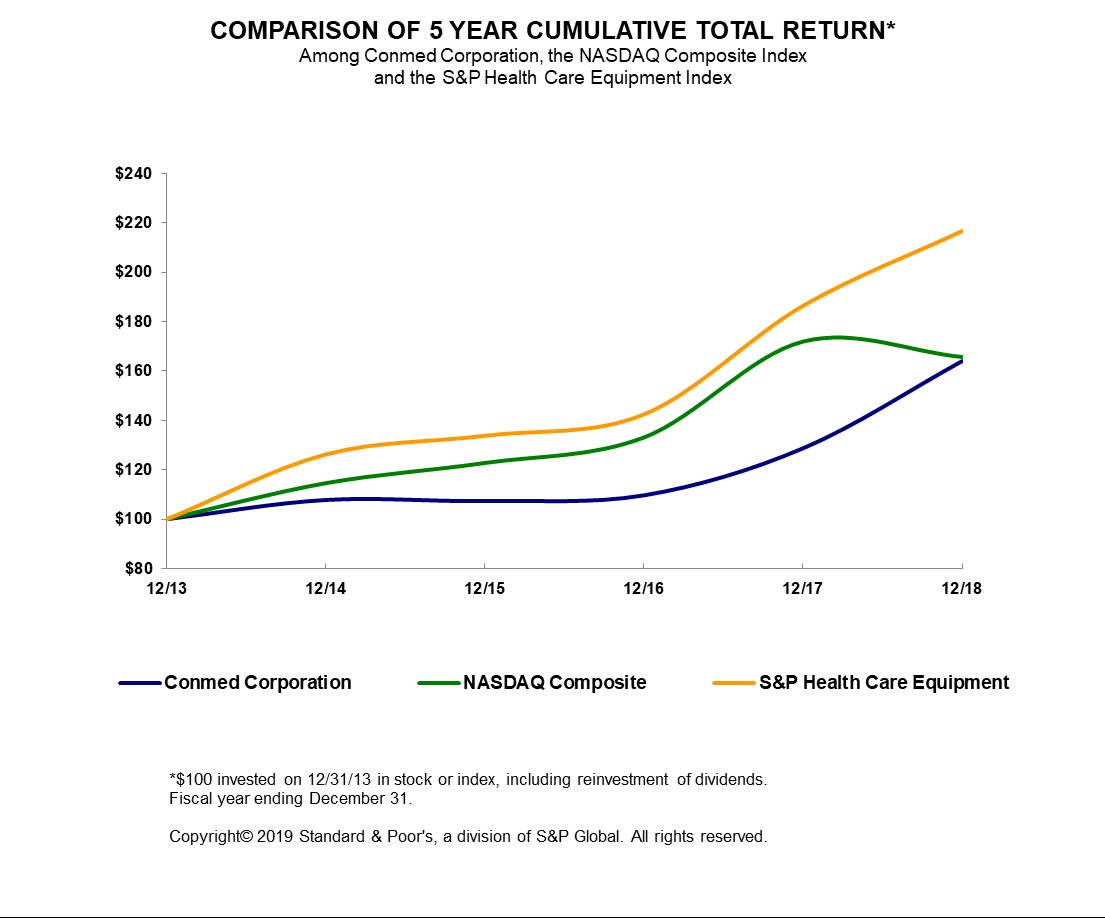
19
Item 6. Selected Financial Data
The following table sets forth selected historical financial data for the years ended
December 31, 2018
,
2017
,
2016
,
2015
and
2014
. The financial data set forth below should be read in conjunction with the information under “Management’s Discussion and Analysis of Financial Condition and Results of Operations” included in Item 7 of this Form 10-K and the Consolidated Financial Statements of the Company and the notes thereto.
FIVE YEAR SUMMARY OF SELECTED FINANCIAL DATA
|
Years Ended December 31,
|
|||||||||||||||||||
|
2018
|
2017
|
2016
|
2015
|
2014
|
|||||||||||||||
|
|
(In thousands, except per share data)
|
||||||||||||||||||
|
Statements of Operations Data
(1)
:
|
|
||||||||||||||||||
|
Net sales
(2)
|
$
|
859,634
|
|
$
|
796,392
|
|
$
|
763,520
|
|
$
|
719,168
|
|
$
|
740,055
|
|
||||
|
Cost of sales
(3)
|
390,524
|
|
365,351
|
|
355,190
|
|
337,466
|
|
335,998
|
|
|||||||||
|
Gross profit
|
469,110
|
|
431,041
|
|
408,330
|
|
381,702
|
|
404,057
|
|
|||||||||
|
Selling and administrative expense
(4)
|
355,617
|
|
351,799
|
|
338,400
|
|
303,091
|
|
323,492
|
|
|||||||||
|
Research and development expense
(5)
|
42,188
|
|
32,307
|
|
32,254
|
|
27,436
|
|
27,779
|
|
|||||||||
|
Income from operations
|
71,305
|
|
46,935
|
|
37,676
|
|
51,175
|
|
52,786
|
|
|||||||||
|
Other expense
(6)
|
—
|
|
—
|
|
2,942
|
|
—
|
|
—
|
|
|||||||||
|
Interest expense
|
20,652
|
|
18,203
|
|
15,359
|
|
6,031
|
|
6,111
|
|
|||||||||
|
Income before income taxes
|
50,653
|
|
28,732
|
|
19,375
|
|
45,144
|
|
46,675
|
|
|||||||||
|
Provision (benefit) for income taxes
(7)
|
9,799
|
|
(26,755
|
)
|
4,711
|
|
14,646
|
|
14,483
|
|
|||||||||
|
Net income
|
$
|
40,854
|
|
$
|
55,487
|
|
$
|
14,664
|
|
$
|
30,498
|
|
$
|
32,192
|
|
||||
|
Per Share Data:
|
|
|
|||||||||||||||||
|
Basic earnings per share
|
$
|
1.45
|
|
$
|
1.99
|
|
$
|
0.53
|
|
$
|
1.10
|
|
$
|
1.17
|
|
||||
|
Diluted earnings per share
|
$
|
1.41
|
|
$
|
1.97
|
|
$
|
0.52
|
|
$
|
1.09
|
|
$
|
1.16
|
|
||||
|
Dividends per share of common stock
|
$
|
0.80
|
|
$
|
0.80
|
|
$
|
0.80
|
|
$
|
0.80
|
|
$
|
0.80
|
|
||||
|
Weighted Average Number of Common Shares In Calculating:
|
|
|
|||||||||||||||||
|
Basic earnings per share
|
28,118
|
|
27,939
|
|
27,804
|
|
27,653
|
|
27,401
|
|
|||||||||
|
Diluted earnings per share
|
28,890
|
|
28,171
|
|
27,964
|
|
27,858
|
|
27,769
|
|
|||||||||
|
Other Financial Data:
|
|
|
|||||||||||||||||
|
Depreciation and amortization
|
$
|
61,803
|
|
$
|
58,548
|
|
$
|
55,309
|
|
$
|
43,879
|
|
$
|
45,734
|
|
||||
|
Capital expenditures
|
16,507
|
|
12,842
|
|
14,753
|
|
15,009
|
|
15,411
|
|
|||||||||
|
Balance Sheet Data (at period end):
|
|
|
|||||||||||||||||
|
Cash and cash equivalents
|
$
|
17,511
|
|
$
|
32,622
|
|
$
|
27,428
|
|
$
|
72,504
|
|
$
|
66,332
|
|
||||
|
Total assets
(8)
|
1,369,138
|
|
1,357,961
|
|
1,328,983
|
|
1,101,700
|
|
1,086,703
|
|
|||||||||
|
Long-term obligations
(8)
|
545,924
|
|
576,526
|
|
634,455
|
|
396,909
|
|
389,449
|
|
|||||||||
|
Total shareholders’ equity
|
662,270
|
|
631,432
|
|
580,576
|
|
585,073
|
|
581,298
|
|
|||||||||
|
(1)
|
Results of operations of acquired businesses have been recorded in the financial statements since the date of acquisition. Refer to Note 2 to the consolidated financial statements.
|
|
(2)
|
On January 1, 2018, we adopted ASC 606, Revenue from Contracts with Customers, using the modified retrospective transition approach and began recording certain costs, previously recorded in selling and administrative expense and principally related to administrative fees paid to group purchasing organizations, as a reduction of revenue. These costs
|
20
are presented in selling and administrative expense for all preceding years. During 2018, we recorded
$8.3 million
of these costs as a reduction of revenue.
|
(3)
|
In
2017
,
2016
,
2015
and
2014
, we incurred charges related to the restructuring of certain of our manufacturing operations of
$2.9 million
,
$3.1 million
,
$8.0 million
and
$5.6 million
, respectively; in 2016 we incurred charges of
$4.5 million
related to the termination of a product offering. See additional discussion in Note 13 to the consolidated financial statements.
|
|
(4)
|
Acquisition, restructuring and other expense included in selling and administrative costs are the following:
|
|
|
2018
|
2017
|
2016
|
2015
|
2014
|
||||||||||||||
|
Business acquisition costs
|
$
|
2,372
|
|
$
|
2,336
|
|
$
|
17,029
|
|
$
|
2,543
|
|
$
|
722
|
|
||||
|
Restructuring costs
|
—
|
|
1,347
|
|
6,670
|
|
13,655
|
|
3,354
|
|
|||||||||
|
Legal matters
|
—
|
|
17,480
|
|
3,773
|
|
—
|
|
—
|
|
|||||||||
|
Gain on sale of facility
|
—
|
|
—
|
|
(1,890
|
)
|
—
|
|
—
|
|
|||||||||
|
Management restructuring costs
|
—
|
|
—
|
|
—
|
|
—
|
|
12,546
|
|
|||||||||
|
Shareholder activism costs
|
—
|
|
—
|
|
—
|
|
—
|
|
3,966
|
|
|||||||||
|
Patent dispute and other matters
|
—
|
|
—
|
|
—
|
|
—
|
|
3,374
|
|
|||||||||
|
Acquisition, restructuring and other expense included in selling and administrative expense
|
$
|
2,372
|
|
$
|
21,163
|
|
$
|
25,582
|
|
$
|
16,198
|
|
$
|
23,962
|
|
||||
See additional discussion in Notes 2, 12 and 13 to the consolidated financial statements.
|
(5)
|
During 2018, we recorded a net charge of
$4.2 million
to research and development expense mainly associated with the impairment of an in-process research and development asset, net of the release of previously accrued contingent consideration in other current and long-term liabilities, as further described in Notes 12 and 13.
|
|
(6)
|
During 2016, we incurred a
$2.7 million
charge related to commitment fees paid to certain of our lenders, which provided a financing commitment for the SurgiQuest acquisition and recorded a loss on the early extinguishment of debt of
$0.3 million
in conjunction with the fifth amended and restated senior credit agreement as further described in Note 6 to the consolidated financial statements.
|
|
(7)
|
During 2017, we recorded a deferred tax benefit of
$31.9 million
as a result of the 2017 Tax Cuts and Jobs Act ("Tax Reform"). During 2018, we recorded Tax Reform measurement period adjustments of
$0.9 million
to the December 2017 deferred tax balances, resulting in additional income tax expense. Refer to Note 7 to the consolidated financial statements for further details.
|
|
(8)
|
In November 2015, the FASB issued ASU No. 2015-17 "Income Taxes (ASC 740): Balance Sheet Classification of Deferred Taxes". This ASU requires all deferred income tax assets and liabilities be presented as non-current in classified balance sheets. We adopted this guidance as of January 1, 2016 and applied retrospectively.
|
21
Item 7. Management’s Discussion and Analysis of Financial Condition and Results of Operations
The following discussion should be read in conjunction with Selected Financial Data (Item 6), and our Consolidated Financial Statements and related notes contained elsewhere in this report.
Overview of CONMED Corporation
CONMED Corporation (“CONMED”, the “Company”, “we” or “us”) is a medical technology company that provides surgical devices and equipment for minimally invasive procedures. The Company’s products are used by surgeons and physicians in a variety of specialties including orthopedics, general surgery, gynecology, neurosurgery, thoracic surgery and gastroenterology.
Our product lines consist of orthopedic surgery and general surgery. Orthopedic surgery consists of sports medicine instrumentation and small bone, large bone and specialty powered surgical instruments as well as, imaging systems for use in minimally invasive surgery procedures including 2DHD and 3DHD vision technologies and service fees related to the promotion and marketing of sports medicine allograft tissue. General surgery consists of a complete line of endo-mechanical instrumentation for minimally invasive laparoscopic and gastrointestinal procedures, a line of cardiac monitoring products as well as electrosurgical generators and related instruments. These product lines as a percentage of consolidated net sales are as follows:
|
|
2018
|
2017
|
2016
|
|||||
|
Orthopedic surgery
|
52
|
%
|
54
|
%
|
55
|
%
|
||
|
General surgery
|
48
|
|
46
|
|
45
|
|
||
|
Consolidated net sales
|
100
|
%
|
100
|
%
|
100
|
%
|
||
A significant amount of our products are used in surgical procedures with approximately
79%
of our revenues derived from the sale of single-use products. Our capital equipment offerings also facilitate the ongoing sale of related single-use products and accessories, thus providing us with a recurring revenue stream. We manufacture substantially all of our products in facilities located in the United States and Mexico. We market our products both domestically and internationally directly to customers and through distributors. International sales approximated
48%
in
2018
,
2017
and
2016
.
Business Environment
On
February 11, 2019
, we acquired Buffalo Filter and all of the issued and outstanding common stock of Palmerton Holdings, Inc. from Filtration Group FGC LLC (the “Buffalo Filter Acquisition”) for approximately
$365 million
, in cash, subject to customary adjustments for working capital, cash held by Buffalo Filter at closing, indebtedness of Buffalo Filter, expenses related to the transaction and other related fees and expenses. Buffalo Filter develops, manufactures and markets smoke evacuation technologies that are complementary to our Advanced Surgical portfolio.
We financed the purchase price for the Buffalo Filter Acquisition using a combination of the issuance of
$345.0 million
of
2.625%
convertible notes due 2024 issued on January 29, 2019 (the Convertible Notes”) and the incurrence of indebtedness under our sixth amended and restated senior secured credit agreement, which closed on
February 7, 2019
. Refer to Financing Cash Flows and Note 17 to the consolidated financial statements for further details.
Critical Accounting Policies
Preparation of our financial statements requires us to make estimates and assumptions which affect the reported amounts of assets, liabilities, revenues and expenses. Note 1 to the consolidated financial statements describes the significant accounting policies used in preparation of the consolidated financial statements. The most significant areas involving management judgments and estimates are described below and are considered by management to be critical to understanding the financial condition and results of operations of CONMED Corporation. Actual results may or may not differ from these estimates.
Inventory Valuation
We value inventory at the lower of cost and net realizable value based on historical experience and life of inventory. We write-off excess and obsolete inventory resulting from the inability to sell our products at prices in excess of current carrying costs. We make estimates regarding the future recoverability of the costs of our products and record a provision for excess and obsolete
22
inventories based on historical experience and expected future trends. Market changes or new product introductions could impact demand for our products and require inventory write-downs.
Goodwill and Intangible Assets
We have a history of growth through acquisitions. Assets and liabilities of acquired businesses are recorded at their estimated fair values as of the date of acquisition. Goodwill represents costs in excess of fair values assigned to the underlying net assets of acquired businesses. Factors that contribute to the recognition of goodwill include synergies that are specific to our business and are expected to increase net sales and profits; acquisition of a talented workforce; cost savings opportunities; the strategic benefit of expanding our presence in core and adjacent markets; and diversifying our product portfolio.
Customer and distributor relationships, trademarks, tradenames, developed technology, patents and other intangible assets primarily represent allocations of purchase price to identifiable intangible assets of acquired businesses. Sales representation, marketing and promotional rights represent intangible assets created under our agreement with Musculoskeletal Transplant Foundation (“MTF”). Determining the fair value of intangible assets acquired as part of a business combination requires us to make significant estimates. These estimates include the amount and timing of projected future cash flows of each project or technology, the discount rate used to discount those cash flows to present value, the assessment of the asset’s useful life, and the consideration of legal, technical, regulatory, economic, and competitive risks.
Goodwill and intangible assets deemed to have indefinite lives are not amortized, but are subject to at least annual impairment testing. It is our policy to perform our annual impairment testing in the fourth quarter. The identification and measurement of goodwill impairment involves the estimation of the fair value of our business. Estimates of fair value are based on the best information available as of the date of the assessment. We completed our goodwill impairment testing during the fourth quarter of
2018
. We performed our impairment test utilizing the market capitalization approach to determine whether the fair value of a reporting unit is less than its carrying amount. Based upon our assessment, the fair value continues to exceed carrying value.
Intangible assets with a finite life are amortized over the estimated useful life of the asset and are evaluated each reporting period to determine whether events and circumstances warrant a revision to the remaining period of amortization. Intangible assets subject to amortization are reviewed for impairment whenever events or changes in circumstances indicate that its carrying amount may not be recoverable. The carrying amount of an intangible asset subject to amortization is not recoverable if it exceeds the sum of the undiscounted cash flows expected to result from the use of the asset. An impairment loss is recognized by reducing the carrying amount of the intangible asset to its current fair value.
For all other indefinite-lived intangible assets, we perform a qualitative impairment test. Based upon this assessment, we have determined that our indefinite-lived intangible assets are not impaired.
See Note 5 to the consolidated financial statements for further discussion of goodwill and other intangible assets.
23
Consolidated Results of Operations
The following table presents, as a percentage of net sales, certain categories included in our consolidated statements of comprehensive income for the periods indicated:
|
|
Years Ended December 31,
|
|||||||
|
|
2018
|
2017
|
2016
|
|||||
|
Net sales
|
100.0
|
%
|
100.0
|
%
|
100.0
|
%
|
||
|
Cost of sales
|
45.4
|
|
45.9
|
|
46.5
|
|
||
|
Gross profit
|
54.6
|
|
54.1
|
|
53.5
|
|
||
|
Selling and administrative expense
|
41.4
|
|
44.2
|
|
44.3
|
|
||
|
Research and development expense
|
4.9
|
|
4.1
|
|
4.2
|
|
||
|
Income from operations
|
8.3
|
|
5.9
|
|
4.9
|
|
||
|
Other expense
|
—
|
|
—
|
|
0.4
|
|
||
|
Interest expense
|
2.4
|
|
2.3
|
|
2.0
|
|
||
|
Income before income taxes
|
5.9
|
|
3.6
|
|
2.5
|
|
||
|
Provision (benefit) for income taxes
|
1.1
|
|
(3.4
|
)
|
0.6
|
|
||
|
Net income
|
4.8
|
%
|
7.0
|
%
|
1.9
|
%
|
||
24
Net Sales
The following table presents net sales by product line for the years ended
December 31, 2018
,
2017
and
2016
:
|
% Change from
2017 to 2018 |
|||||||||||||||||||
|
2018
|
2017
|
As Reported
|
ASC 606 Impact
|
Impact of Foreign Currency
|
Adjusted
a
|
||||||||||||||
|
Orthopedic surgery
|
$
|
446.7
|
|
$
|
428.9
|
|
4.1
|
%
|
0.7
|
%
|
-0.9
|
%
|
3.9
|
%
|
|||||
|
General surgery
|
412.9
|
|
367.5
|
|
12.4
|
%
|
1.7
|
%
|
-0.3
|
%
|
13.8
|
%
|
|||||||
|
Net sales
|
$
|
859.6
|
|
$
|
796.4
|
|
7.9
|
%
|
1.2
|
%
|
-0.7
|
%
|
8.4
|
%
|
|||||
|
Single-use products
|
$
|
681.1
|
|
$
|
637.0
|
|
6.9
|
%
|
1.4
|
%
|
-0.7
|
%
|
7.6
|
%
|
|||||
|
Capital products
|
178.5
|
|
159.4
|
|
12.0
|
%
|
—
|
%
|
-0.5
|
%
|
11.5
|
%
|
|||||||
|
Net sales
|
$
|
859.6
|
|
$
|
796.4
|
|
7.9
|
%
|
1.2
|
%
|
-0.7
|
%
|
8.4
|
%
|
|||||
|
% Change from
2016 to 2017 |
|||||||||||||||||
|
2017
|
2016
|
As Reported
|
Impact of Foreign Currency
|
Adjusted
a
|
|||||||||||||
|
Orthopedic surgery
|
$
|
428.9
|
|
$
|
422.1
|
|
1.6
|
%
|
-0.1
|
%
|
1.5
|
%
|
|||||
|
General surgery
|
367.5
|
|
341.4
|
|
7.6
|
%
|
0.2
|
%
|
7.8
|
%
|
|||||||
|
Net sales
|
$
|
796.4
|
|
$
|
763.5
|
|
4.3
|
%
|
—
|
%
|
4.3
|
%
|
|||||
|
Single-use products
|
$
|
637.0
|
|
$
|
605.8
|
|
5.2
|
%
|
—
|
%
|
5.2
|
%
|
|||||
|
Capital products
|
159.4
|
|
157.7
|
|
1.1
|
%
|
-0.1
|
%
|
1.0
|
%
|
|||||||
|
Net sales
|
$
|
796.4
|
|
$
|
763.5
|
|
4.3
|
%
|
—
|
%
|
4.3
|
%
|
|||||
(a) Adjusted net sales growth is measured in constant currency and is adjusted for administrative fees that we began recording as a reduction of revenue under Accounting Standards Codification 606, Revenue from Contracts with Customers ("ASC 606") on January 1, 2018. Refer to Note 16 to the consolidated financial statements and Non-GAAP Financial Measures below for further details.
Net sales increased
7.9%
to
$859.6 million
in
2018
and
4.3%
in
2017
to
$796.4 million
from
$763.5 million
in
2016
. The increase in
2018
was due to growth in both the orthopedic and general surgery product lines, as described below. The adoption of ASC 606 reduced sales by
$8.3 million
in 2018, as we are required to report certain costs previously recorded in selling and administrative expense and principally related to administration fees paid to group purchasing organizations, as a reduction of revenue beginning in 2018. The increase in
2017
was due to the continued growth in general surgery and the return to growth in orthopedic surgery, as described below.
|
•
|
Orthopedic surgery sales increased
4.1%
in
2018
to
$446.7 million
and
1.6%
in
2017
to
$428.9 million
from
$422.1 million
in
2016
. In
2018
, the increase was primarily due to continued growth in our sports medicine and powered instrument offerings driven by the introduction of new products. In
2017
, the increase was mainly driven by our sports medicine offerings, including new product introductions, partially offset by lower capital sales.
|
|
•
|
General surgery sales increased
12.4%
in
2018
to
$412.9 million
and
7.6%
in
2017
to
$367.5 million
from
$341.4 million
in
2016
. The increase in
2018
was driven by continued sales growth from all product offerings. New product introductions and continued strong AirSeal® sales contributed to this growth. The increase in
2017
was driven primarily by sales growth of our advanced surgical product offering, particularly in AirSeal
®
and new product introductions, and endoscopic technologies products, particularly in new product introductions.
|
25
Cost of Sales
Cost of sales was
$390.5 million
in
2018
,
$365.4 million
in
2017
and
$355.2 million
in
2016
. Gross profit margins were
54.6%
in
2018
,
54.1%
in
2017
and
53.5%
in
2016
. The increase in gross profit margin of
0.5
percentage points in
2018
was mainly the result of a decrease in restructuring costs, product mix and favorable foreign exchange rates on sales offset by the impact of the adoption of ASC 606. The increase of
0.6
percentage points in
2017
was mainly the result of reduced restructuring costs.
Selling and Administrative Expense
Selling and administrative expense was
$355.6 million
in
2018
,
$351.8 million
in
2017
and
$338.4 million
in
2016
. Selling and administrative expense as a percentage of net sales was
41.4%
in
2018
,
44.2%
in
2017
and
44.3%
in
2016
.
The factors affecting the
2.8
percentage point decrease in selling and administrative expense as a percentage of net sales in
2018
as compared to the same period a year ago included (1) a
$17.5 million
(
2.2
percentage point) decrease primarily associated with the
$12.2 million
SurgiQuest, Inc. vs. Lexion Medical litigation verdict as further described in Notes 12 and 13 and legal fees associated with this and other legal matters during 2017, (2) an
$8.3 million
(
1.0
percentage point) reduction in selling and administrative expense due to the adoption of ASC 606 as we are required to report certain costs previously recorded in selling and administrative expense and (3) a
$1.3 million
(
0.2
percentage point) decrease in selling and administrative restructuring charges. These decreases were partially offset by incremental compensation costs and investments in our infrastructure.
The factors affecting the
0.1
percentage point decrease in selling and administrative expense as percentage of net sales in
2017
as compared to
2016
included (1) a
$14.7 million
decrease in costs associated with the SurgiQuest acquisition as further described in Notes 2 and 12 and (2) a
$5.3 million
decrease in severance and other related costs from the restructuring of certain sales, marketing and administrative functions as further described in Note 13. These decreases were offset by (1)
$12.2 million
in costs associated with the SurgiQuest, Inc. vs. Lexion Medical litigation verdict as further described in Notes 12 and 13, (2) the
$1.5 million
increase in legal fees associated with this litigation as well as other legal matters as further described in Note 13, (3) the
$1.9 million
gain on the sale of our Centennial, CO facility in 2016 as further described in Note 13 and (4) higher selling and administrative expense to support the growth of the Company.
Research and Development Expense
Research and development expense was
$42.2 million
,
$32.3 million
and
$32.3 million
in
2018, 2017 and 2016
, respectively. As a percentage of net sales, research and development expense was
4.9%
in
2018
,
4.1%
in
2017
and
4.2%
in
2016
.
The increase in expense during
2018
is due to our continued efforts to increase new product development as well as a net charge of
$4.2 million
mainly associated with the impairment of an in-process research and development asset, net of the release of previously accrued contingent consideration in other current and long-term liabilities, as further described in Note 12. Research and development expense remained flat in
2017
as compared to
2016
due to the timing of projects
Other Expense
Other expense in 2016 related to costs associated with our fifth amended and restated senior credit agreement entered into on January 4, 2016 as further described in Note 6 to the consolidated financial statements. These costs include a
$2.7 million
charge related to commitment fees paid to certain of our lenders, which provided a financing commitment for the SurgiQuest acquisition and a loss on the early extinguishment of debt of
$0.3 million
.
Interest Expense
Interest expense was
$20.7 million
in
2018
compared to
$18.2 million
in
2017
and
$15.4 million
in
2016
. Interest expense increased in
2018
as compared to
2017
and
2017
as compared to
2016
due to higher interest rates under the fifth amended and restated senior credit agreement as further described in Note 6 to the consolidated financial statements. The weighted average interest rates on our borrowings were
4.35%
in
2018
increasing from
3.52%
in
2017
and
2.93%
in
2016
.
26
Provision (Benefit) for Income Taxes
A provision (benefit) for income taxes was recorded at an effective rate of
19.3%
,
(93.1)%
and
24.3%
in
2018
,
2017
and
2016
, respectively, as compared to the federal statutory rate of 21.0% in
2018
and 35.0% in
2017
and
2016
. The effective tax rate in
2018
is higher than that recorded in
2017
due primarily to the one-time benefit taken related to the Tax Cuts and Jobs Act in 2017 ("Tax Reform"). The effective tax rate in
2017
is lower than that recorded in
2016
due to Tax Reform and consolidated group restructuring. A reconciliation of the United States statutory income tax rate to our effective tax rate is included in Note 7 to the consolidated financial statements.
Non-GAAP Financial Measures
Net sales on an "adjusted" basis is a non-GAAP measure that presents net sales in "constant currency" and adjusts for the adoption impact of ASC 606. The Company analyzes net sales on a constant currency basis to better measure the comparability of results between periods. To measure percentage sales growth in constant currency, the Company removes the impact of changes in foreign currency exchange rates that affect the comparability and trend of net sales. In addition, the Company adjusts for the adoption impact of ASC 606. For GAAP purposes, we applied the modified retrospective transition approach which requires certain costs previously included in selling and administrative expense and principally related to administrative fees paid to group purchasing organizations, to be recorded as a reduction of revenue for periods subsequent to January 1, 2018. Amounts reported in prior years remain unchanged with these administrative fees included in selling and administrative expense. To improve comparability between reporting periods, we assumed ASC 606 had been applied as of January 1, 2017 thereby reducing net sales by the administrative fees for both periods when calculating adjusted sales growth.
Because non-GAAP financial measures are not standardized, it may not be possible to compare this financial measure with other companies' non-GAAP financial measures having the same or similar names. This adjusted financial measure should not be considered in isolation or as a substitute for reported net sales growth, the most directly comparable GAAP financial measure. This non-GAAP financial measure is an additional way of viewing net sales that, when viewed with our GAAP results, provides a more complete understanding of our business. The Company strongly encourages investors and shareholders to review our financial statements and publicly-filed reports in their entirety and not to rely on any single financial measure.
Liquidity and Capital Resources
Our liquidity needs arise primarily from capital investments, working capital requirements and payments on indebtedness under the amended and restated senior credit agreement, described below. We have historically met these liquidity requirements with funds generated from operations and borrowings under our revolving credit facility. In addition, we have historically used term borrowings, including borrowings under the fifth amended and restated senior credit agreement and borrowings under separate loan facilities, in the case of real property purchases, to finance our acquisitions. We also have the ability to raise funds through the sale of stock or we may issue debt through a private placement or public offering. Management believes that cash flow from operations, including cash and cash equivalents on hand and available borrowing capacity under our amended and restated senior credit agreement, will be adequate to meet our anticipated operating working capital requirements, debt service, funding of capital expenditures and common stock repurchases in the foreseeable future.
We had total cash on hand at
December 31, 2018
of
$17.5 million
, of which approximately
$16.1
million was held by our foreign subsidiaries outside the United States with unremitted earnings. During 2018, we redeployed
$25.4 million
of cash from certain non-U.S. subsidiaries primarily for U.S. debt reduction. This cash consisted of earnings that were taxed in 2017 as part of the deemed repatriation toll charge implemented by Tax Reform. If we were to repatriate the remaining unremitted earnings that have been taxed as part of the deemed repatriation toll charge, we would be required to accrue and pay withholding taxes in certain foreign jurisdictions. We have accrued a deferred tax liability for foreign withholding taxes related to the amount of the remaining cumulative unremitted earnings as of December 31, 2017 as these are not considered permanently reinvested.
It is our intention to permanently reinvest all future foreign earnings for periods occurring after December 31, 2017. The amount of such untaxed foreign earnings for the periods occurring after December 2017 totaled
$18.4 million
. If we were to repatriate these funds, we would be required to accrue and pay taxes on such amounts. The Company has estimated foreign withholding taxes of
$0.6 million
would be due if these earnings were repatriated.
Operating Cash Flows
27
Our net working capital position was
$213.4 million
at
December 31, 2018
. Net cash provided by operating activities was
$74.7 million
in
2018
,
$65.6 million
in
2017
and
$39.9 million
in
2016
generated on net income of
$40.9 million
in
2018
,
$55.5 million
in
2017
and
$14.7 million
in
2016
.
The increase in cash flows from operating activities in
2018
compared to
2017
is primarily due to the increase in net income (excluding the non-cash impact of Tax Reform) as 2017 included costs associated with restructuring and legal matters as further described in Note 13 to the consolidated financial statements, including a
$12.2 million
accrual related to the Lexion trial verdict. This accrual was subsequently paid during 2018, thereby partially offsetting the increase in operating cash flows in 2018. In addition, other significant changes in assets and liabilities affecting cash flows include the following:
|
•
|
A decrease in cash flows from inventory is caused primarily by an increase in production to support new product introductions and sales growth;
|
|
•
|
An increase in cash flows from accounts payable is due to timing of payments and increased raw material purchases;
|
|
•
|
An increase in cash flows from accrued compensation and benefits is caused by higher commission and incentive compensation accruals associated with increased sales; and
|
|
•
|
A decrease in cash flows from other liabilities is caused primarily by the aforementioned Lexion trial verdict payment during 2018.
|
The increase in cash provided by operating activities from
2017
to
2016
is mainly related to the prior year having significant cash outflows resulting from the SurgiQuest, Inc. acquisition whereby 2017 had a
$12.2 million
accrual related to the Lexion trial verdict, as further described in Notes 12 and 13 to the consolidated financial statements.
Investing Cash Flows
Net cash used in investing activities decreased to
$16.5 million
in
2018
compared to
$29.1 million
in
2017
primarily due to there being no payments related to business and asset acquisitions during
2018
as compared to the
$16.2 million
in
2017
.
Net cash used in investing activities decreased to
$29.1 million
in
2017
compared to
$266.0 million
in
2016
primarily due to the
$16.2 million
in payments related to acquiring businesses, assets and a distributor in
2017
as compared to the payment for the SurgiQuest acquisition in
2016
of
$256.5 million
. This decrease was also offset by
$5.2 million
in proceeds from the sale of our Centennial, Colorado facility during 2016.
Capital expenditures were
$16.5 million
,
$12.8 million
and
$14.8 million
in
2018
,
2017
and
2016
, respectively. Capital expenditures are expected to be in the $15.0 million to $20.0 million range for
2019
.
Financing Cash Flows
Financing activities in
2018
used cash of
$72.3 million
compared to using cash of
$34.9 million
in
2017
and providing cash of
$182.5 million
in
2016
. Below is a summary of the significant financing activities:
|
•
|
During 2016, we had borrowings of
$175.0 million
on our term loan. We repaid
$13.1 million
in
2018
and
$8.8 million
in each of
2017
and
2016
in accordance with the agreement, as further described below. During
2018
and
2017
, we had net repayments on our revolving line of credit of
$15.0 million
and
$2.0 million
, respectively, as compared to net borrowings of
$62.7 million
in
2016
.
|
|
•
|
Dividend payments remained consistent at
$22.4 million
,
$22.3 million
and
$22.2 million
in
2018, 2017 and 2016
, respectively.
|
|
•
|
In 2018, we paid
$21.3 million
in contingent consideration related to a prior asset acquisition.
|
|
•
|
In
2016
, we made the final payment of
$16.7 million
associated with the distribution and development agreement with Musculoskeletal Transplant Foundation.
|
|
•
|
In
2018
, debt issuance costs of
$0.9 million
were related to the sixth amended and restated senior credit agreement completed in 2019 and
$5.6 million
in
2016
were paid in conjunction with our fifth and fourth amended and restated senior credit agreements, respectively.
|
28
On January 4, 2016, we entered into a fifth amended and restated senior credit agreement consisting of: (a) a
$175.0 million
term loan facility and (b) a
$525.0 million
revolving credit facility both expiring on January 4, 2021. The term loan is payable in quarterly installments increasing over the term of the facility. Proceeds from the term loan facility and borrowings under the revolving credit facility were used to repay the then existing senior credit agreement and to finance the acquisition of SurgiQuest. Interest rates are at LIBOR plus an interest rate margin (the total of which is equal to
4.405%
at
December 31, 2018
). For those borrowings where we elect to use the alternate base rate, the base rate is the greatest of (i) the Prime Rate, (ii) the Federal Funds Rate plus
0.50%
or (iii) the one-month Eurocurrency Rate plus
1.00%
, plus, in each case, an interest rate margin.
There were
$144.4 million
in borrowings outstanding on the term loan and
$312.0 million
in borrowings outstanding under the revolving credit facility as of
December 31, 2018
. Our available borrowings on the revolving credit facility at
December 31, 2018
were
$210.0 million
with approximately
$3.0 million
of the facility set aside for outstanding letters of credit.
The fifth amended and restated senior credit agreement is collateralized by substantially all of our personal property and assets. The fifth amended and restated senior credit agreement contains covenants and restrictions which, among other things, require the maintenance of certain financial ratios and restrict dividend payments and the incurrence of certain indebtedness and other activities, including acquisitions and dispositions. We were in full compliance with these covenants and restrictions as of
December 31, 2018
. We are also required, under certain circumstances, to make mandatory prepayments from net cash proceeds from any issuance of equity and asset sales.
As described in Note 17 to the consolidated financial statements, on
February 7, 2019
we entered into a sixth amended and restated senior credit agreement consisting of: (a) a
$265.0 million
term loan facility and (b) a
$585.0 million
revolving credit facility. The revolving credit facility will terminate and the loans outstanding under the term loan facility will expire on the earlier of (i) February 7, 2024 or (ii) 91 days prior to the earliest scheduled maturity date of the
$345.0 million
in
2.625%
convertible notes due in 2024 described below, (if, as of such date, more than
$150.0 million
in aggregate principal amount of such convertible notes (or any refinancing thereof) remains outstanding). The term loan is payable in quarterly installments increasing over the term of the facility. Proceeds from the term loan facility and borrowings under the revolving credit facility were used to repay the then existing senior credit agreement and in part to finance the acquisition of Buffalo Filter. Initial interest rates are at LIBOR plus an interest rate margin of
1.875%
. For those borrowings where we elect to use the alternate base rate, the initial base rate will be the greatest of (i) the Prime Rate, (ii) the Federal Funds Rate plus
0.50%
or (iii) the one-month Eurocurrency Rate plus
1.00%
, plus, in each case, an interest rate margin.
As described in Note 17 to the consolidated financial statements, on January 29, 2019, we issued
$345.0 million
in
2.625%
convertible notes due in 2024 (the "Notes"). Interest is payable semi-annually in arrears on February 1 and August 1 of each year, commencing August 1, 2019. The Notes will mature on February 1, 2024, unless earlier repurchased or converted. The Notes represent subordinated unsecured obligations and are convertible under certain circumstances, as defined in the indenture, into a combination of cash and CONMED common stock. The Notes may be converted at an initial conversion rate of
11.2608
shares of our common stock per
$1,000
principal amount of Notes (equivalent to an initial conversion price of approximately
$88.80
per share of common stock). Holders of their Notes may convert their Notes at their option at any time on or after November 1, 2023 through the second scheduled trading day preceding the maturity date. Holders of the Notes will also have the right to convert the Notes prior to November 1, 2023, but only upon the occurrence of specified events. The conversion rate is subject to anti-dilution adjustments if certain events occur.
A portion of the net proceeds from the offering of the notes were used as part of the financing for the Buffalo Filter acquisition,
$21.0 million
was used to pay the cost of certain convertible notes hedge transactions as further described below and we intend to use the remaining proceeds of the Notes for general corporate purposes.
In accordance with ASC 470-20, because the Notes may be wholly or partially settled in cash, we are required to separate the Notes into a liability and an equity component, such that interest expense reflects the non-convertible debt interest rate. A debt discount is recognized at issuance as a decrease to the Notes and an increase to equity. This debt discount will be amortized to interest expense over the expected term of the Notes, thereby accreting the Notes value to the principal amount.
In connection with the offering of the Notes, we entered into convertible note hedge transactions with a number of financial institutions (each, an “option counterparty”). The convertible note hedge transactions cover, subject to anti-dilution adjustments substantially similar to those applicable to the Notes, the number of shares of our common stock underlying the Notes. Concurrently with entering into the convertible note hedge transactions, we also entered into separate warrant transactions with each option counterparty whereby we sold to such option counterparty warrants to purchase, subject to customary anti-dilution adjustments, the same number of shares of our common stock.
The convertible note hedge transactions are expected generally to reduce the potential dilution upon conversion of the Notes and/or offset any cash payments we are required to make in excess of the principal amount of converted Notes, as the case
29
may be, in the event that the market price per share of our common stock, as measured under the terms of the convertible note hedge transactions, is greater than the strike price (
$114.92
) of the convertible note hedge transactions, which initially corresponds to the conversion price of the Notes and is subject to anti-dilution adjustments substantially similar to those applicable to the conversion rate of the Notes. If, however, the market price per share of our common stock, as measured under the terms of the warrant transactions, exceeds the strike price of the warrants, there would nevertheless be dilution to the extent that such market price exceeds the strike price of the warrants, unless we elect to settle the warrants in cash.
We have a mortgage note outstanding in connection with the Largo, Florida property and facilities bearing interest at 8.25% per annum with semiannual payments of principal and interest through June 2019. The principal balance outstanding on the mortgage note aggregated $
0.8 million
at
December 31, 2018
. The mortgage note is collateralized by the Largo, Florida property and facilities.
Our Board of Directors has authorized a
$200.0 million
share repurchase program. Through
December 31, 2018
, we have repurchased a total of
6.1 million
shares of common stock aggregating
$162.6 million
under this authorization and have
$37.4 million
remaining available for share repurchases. The repurchase program calls for shares to be purchased in the open market or in private transactions from time to time. We may suspend or discontinue the share repurchase program at any time. We did not purchase any shares of common stock under the share repurchase program during
2018
. We have financed the repurchases and may finance additional repurchases through operating cash flow and from available borrowings under our revolving credit facility.
Management believes that cash flow from operations, including cash and cash equivalents on hand and available borrowing capacity under our amended and restated senior credit agreement, will be adequate to meet our anticipated operating working capital requirements, debt service, funding of capital expenditures and common stock repurchases in the foreseeable future. See “Item 1A. Risk Factors - Risks Related to Our Indebtedness."
Restructuring
For the years ending
December 31, 2017
and
2016
, we incurred
$2.9 million
and
$3.1 million
, respectively, in costs associated with operational restructuring. These costs were charged to cost of sales and include severance, inventory and other charges. As part of this plan, we engaged a consulting firm to assist us in streamlining our product offering and improving our operational efficiency. As a result, we identified certain catalog numbers to be discontinued and consolidated into existing product offerings and recorded a
$1.3 million
charge in the
year ended
December 31, 2017
to write-off inventory which will no longer be offered for sale. This amount is included in the above total for 2017.
During 2016, the Company discontinued our Altrus product offering as part of our ongoing restructuring and incurred
$4.5 million
in non-cash charges primarily related to inventory and fixed assets which were included in cost of sales.
During
2017
and
2016
, we restructured certain sales, marketing and administrative functions and incurred severance and other related costs in the amount of
$1.3 million
and
$6.7 million
. These costs were charged to selling and administrative expense.
During 2016, we sold our Centennial, Colorado facility. We received net cash proceeds of
$5.2 million
and recorded a gain of
$1.9 million
in selling and administrative expense.
During recent years we had a number of initiatives to consolidate manufacturing facilities and restructure our sales and administrative functions. Although much of this is complete, we will continue to review our operations and sales and administrative functions to reduce costs and headcount, as necessary. Such cost reductions will result in additional charges, including employee termination costs and other exit costs that will be charged to cost of sales and selling and administrative expense, as applicable.
Refer to Note 13 to the consolidated financial statements for further discussions regarding restructuring.
30
Contractual Obligations
The following table summarizes our contractual obligations for the next five years and thereafter (amounts in thousands) as of
December 31, 2018
. Purchase obligations represent purchase orders for goods and services placed in the ordinary course of business.
|
|
Payments Due by Period
|
||||||||||||||||||
|
Total
|
Less than
1 Year
|
1-3
Years
|
3-5
Years
|
More than
5 Years
|
|||||||||||||||
|
Long-term debt
|
$
|
457,211
|
|
$
|
18,336
|
|
$
|
438,875
|
|
$
|
—
|
|
$
|
—
|
|
||||
|
Purchase obligations
|
62,928
|
|
60,517
|
|
1,468
|
|
943
|
|
—
|
|
|||||||||
|
Lease obligations
|
23,334
|
|
9,106
|
|
8,687
|
|
4,044
|
|
1,497
|
|
|||||||||
|
Total contractual obligations
|
$
|
543,473
|
|
$
|
87,959
|
|
$
|
449,030
|
|
$
|
4,987
|
|
$
|
1,497
|
|
||||
In addition to the above contractual obligations, we are required to make periodic interest payments on our long-term debt obligations (see additional discussion under Item 7A. “Quantitative and Qualitative Disclosures About Market Risk—Interest Rate Risk” and Note 6 to the consolidated financial statements). The above table also does not include unrecognized tax benefits of approximately
$3.1 million
, the timing and certainty of recognition for which is not known (See Note 7 to the consolidated financial statements).
Stock-based Compensation
We have reserved shares of common stock for issuance to employees and directors under
two
shareholder-approved share-based compensation plans (the "Plans"). The Plans provide for grants of stock options, stock appreciation rights (“SARs”), dividend equivalent rights, restricted stock, restricted stock units (“RSUs”), performance share units (“PSUs”) and other equity-based and equity-related awards. The exercise price on all outstanding stock options and SARs is equal to the quoted fair market value of the stock at the date of grant. RSUs and PSUs are valued at the market value of the underlying stock on the date of grant. Stock options, SARs, RSUs and PSUs are non-transferable other than on death and generally become exercisable over a four to five year period from date of grant. Stock options and SARs expire ten years from date of grant. SARs are only settled in shares of the Company’s stock (See Note 8 to the consolidated financial statements). Total pre-tax stock-based compensation expense recognized in the consolidated statements of comprehensive income was
$10.0 million
,
$8.5 million
and
$8.4 million
for the years ended
December 31, 2018
,
2017
and
2016
, respectively.
Other Matters
Our credit facility allows us to seek to sell products to certain customers in Iran in compliance with applicable laws and regulations and subject to certain terms and conditions, including pre-approval by us and our lenders of the identity of any distributor and prior review of each of the end-customers. We had sales to a third-party distributor in Iran during 2018 and expect there may be sales prospectively. We intend to limit sales into Iran to products that qualify as “medical supplies” within the meaning of the general license, or covered by specific licenses, provided by the Iranian Transactions and Sanctions Regulations set forth in the regulations promulgated by the Office of Foreign Assets Control (“OFAC”) of the United States Department of the Treasury set forth at 31 C.F.R. § 560.530. We have implemented certain controls and processes designed to ensure that the ultimate end-users for the products are those permitted under the OFAC general license, and that the sales and transactions with the Iranian distributor otherwise comply with the requirements of the OFAC regulations. The expected revenues and net profits associated with sales to the Iranian distributor are not expected to be material to our results of operations.
We do not believe that our activities to date, and do not expect that our activities in the future, will be subject to required disclosure under Section 13(r) of the Securities Exchange Act of 1934 (the “Exchange Act”), which, among other things, requires disclosure of transactions and activities knowingly entered into with the Government of Iran that do not benefit from an OFAC license and with certain designated parties. If, however, any activities in future periods are within the scope of the transactions and activities captured by Section 13(r) of the Exchange Act, we will make the required disclosures and notices.
New Accounting Pronouncements
See Note 16 to the consolidated financial statements for a discussion of new accounting pronouncements.
31
Item 7A. Quantitative and Qualitative Disclosures About Market Risk
Market risk is the potential loss arising from adverse changes in market rates and prices such as commodity prices, foreign currency exchange rates and interest rates. In the normal course of business, we are exposed to various market risks, including changes in foreign currency exchange rates and interest rates. We manage our exposure to these and other market risks through regular operating and financing activities and as necessary through the use of derivative financial instruments.
Foreign currency risk
Approximately
48%
of our total
2018
consolidated net sales were to customers outside the United States. We have sales subsidiaries in a significant number of countries in Europe as well as Australia, Canada, China, Japan and Korea. In those countries in which we have a direct presence, our sales are denominated in the local currency amounting to approximately
34%
of our total net sales in
2018
. The remaining
14%
of sales to customers outside the United States was on an export basis and transacted in United States dollars.
Because a significant portion of our operations consist of sales activities in foreign jurisdictions, our financial results may be affected by factors such as changes in foreign currency exchange rates or weak economic conditions in the markets in which we distribute products. During
2018
, foreign currency exchange rates, including the effects of the hedging program, caused sales to increase by approximately $5.1 million and income before income taxes to increase by approximately
$3.2
million, compared to sales and income before income taxes in
2017
.
We hedge forecasted intercompany sales denominated in foreign currencies through the use of forward contracts. We account for these forward contracts as cash flow hedges. To the extent these forward contracts meet hedge accounting criteria, changes in their fair value are not included in current earnings but are included in accumulated other comprehensive loss. These changes in fair value will be recognized into earnings as a component of sales or cost of sales when the forecasted transaction occurs. The notional contract amounts for forward contracts outstanding at
December 31, 2018
which have been accounted for as cash flow hedges totaled
$155.3 million
. Net realized gains (losses) recognized for forward contracts accounted for as cash flow hedges approximated
$(0.9) million
,
$(0.7) million
and
$1.2 million
for the years ended
December 31, 2018
,
2017
and
2016
, respectively. At
December 31, 2018
,
$4.1 million
of net unrealized gains on forward contracts accounted for as cash flow hedges, and included in accumulated other comprehensive loss, are expected to be recognized in earnings in the next twelve months.
We also enter into forward contracts to exchange foreign currencies for United States dollars in order to hedge our currency transaction exposures on intercompany receivables denominated in foreign currencies. These forward contracts settle each month at month-end, at which time we enter into new forward contracts. We have not designated these forward contracts as hedges and have not applied hedge accounting to them. The notional contract amounts for forward contracts outstanding at
December 31, 2018
which have not been designated as hedges totaled
$39.6 million
. Net realized gains (losses) recognized in connection with those forward contracts not accounted for as hedges approximated
$0.1 million
,
$(1.6) million
and
$0.0 million
for the years ended
December 31, 2018, 2017 and 2016
, respectively, offsetting gains (losses) on our intercompany receivables of
$(0.8) million
,
$1.1 million
and
$(0.1) million
for the years ended
December 31, 2018, 2017 and 2016
, respectively. These gains and losses have been recorded in selling and administrative expense in the consolidated statements of comprehensive income.
We record these forward foreign exchange contracts at fair value; the net fair value for forward foreign exchange contracts outstanding at
December 31, 2018
was
$5.2 million
and is included in prepaids and other current assets in the consolidated balance sheet.
Refer to Note 15 in the consolidated financial statements for further discussion.
Interest rate risk
At
December 31, 2018
, we had approximately
$456.4 million
of variable rate long-term debt outstanding under our senior credit agreement. Assuming no repayments, if market interest rates for similar borrowings averaged 1.0% more in
2019
than they did in
2018
, interest expense would increase, and income before income taxes would decrease by $4.6 million. Comparatively, if market interest rates for similar borrowings average 1.0% less in
2019
than they did in
2018
, our interest expense would decrease, and income before income taxes would increase by
$4.6 million
.
Item 8.
Financial Statements and Supplementary Data
Our
2018
Financial Statements are included in this Form 10-K beginning on page 43 and incorporated by reference herein.
32
Item 9.
Changes In and Disagreements with Accountants on Accounting and Financial Disclosures
There were no changes in or disagreement with accountants on accounting and financial disclosure.
Item 9A.
Controls and Procedures
As of the end of the period covered by this report, an evaluation was carried out by CONMED Corporation’s management, with the participation of our Chief Executive Officer and Chief Financial Officer, of the effectiveness of our disclosure controls and procedures (as defined in Rule 13a-15(e) under the Securities Exchange Act of 1934). Based upon that evaluation, our Chief Executive Officer and Chief Financial Officer concluded that these disclosure controls and procedures were effective as of the end of the period covered by this report. In addition, no change in our internal control over financial reporting (as defined in Rule 13a-15 under the Securities Exchange Act of 1934) occurred during the fourth quarter of the year ended
December 31, 2018
that has materially affected, or is reasonably likely to materially affect, our internal control over financial reporting.
Management’s Report on Internal Control over Financial Reporting and the Report of Independent Registered Public Accounting Firm thereon are set forth in Part IV, Item 15 of the Annual Report on Form 10-K.
Item 9B.
Other Information
Not applicable.
33
PART III
Item 10.
Directors, Executive Officers and Corporate Governance
The information required by this item is incorporated herein by reference to the sections captioned “Proposal One: Election of Directors”, “Directors, Executive Officers, Other Company Officers and Nominees for the Board of Directors”, “Section 16(a) Beneficial Ownership Reporting Compliance”, “Ethics Disclosure” and "Meetings of Board of Directors and Committees, Leadership Structure and Risk Oversight” in CONMED Corporation’s definitive Proxy Statement or other informational filing to be filed with the Securities and Exchange Commission on or about
April 12, 2019
.
Item 11.
Executive Compensation
The information required by this item is incorporated herein by reference to the sections captioned “Compensation Discussion and Analysis”, “Compensation Committee Report on Executive Compensation”, “Summary Compensation Table”, “Grants of Plan-Based Awards”, “Outstanding Equity Awards at Fiscal Year-End”, “Option Exercises and Stock Vested”, “Non-Qualified Deferred Compensation”, “Potential Payments on Termination or Change-in-Control”, “Director Compensation,” “Pay Ratio Disclosure” and “Board of Directors Interlocks and Insider Participation; Certain Relationships and Related Transactions” in CONMED Corporation’s definitive Proxy Statement or other informational filing to be filed with the Securities and Exchange Commission on or about
April 12, 2019
.
Item 12.
Security Ownership of Certain Beneficial Owners and Management and Related Stockholder Matters
The information required by this item is incorporated herein by reference to the section captioned “Security Ownership of Certain Beneficial Owners and Management” in CONMED Corporation’s definitive Proxy Statement or other informational filing to be filed with the Securities and Exchange Commission on or about
April 12, 2019
.
Information relating to shareholder approved compensation plans under which equity securities of CONMED Corporation are authorized for issuance is set forth below:
|
Equity Compensation Plan Information
|
||||||||||
|
Plan category
|
Number of securities to be issued upon exercise of outstanding options, warrants and rights
(a)
|
Weighted-average exercise price of outstanding options, warrants and rights
(b)
|
Number of securities remaining available for future issuance under equity compensation plans (excluding securities reflected in column (a))
(c)
|
|||||||
|
Equity compensation plans approved by security holders
|
2,113,537
|
|
$
|
47.67
|
|
4,716,862
|
|
|||
|
Equity compensation plans not approved by security holders
|
—
|
|
—
|
|
—
|
|
||||
|
Total
|
2,113,537
|
|
$
|
47.67
|
|
4,716,862
|
|
|||
The number of securities included in column (a) above consists of outstanding stock options, share appreciation rights (“SARs”) and performance share units, however the weighted-average exercise price in column (b) is for stock options and SARs only.
During
2018
, the Company granted employment inducement awards in conjunction with the hiring of the Executive Vice President & Chief Financial Officer. This included
48,000
stock options at an exercise price of
$50.56
per share. These shares are not part of a shareholder approved plan and no shares remain available for future issuance.
34
Item 13.
Certain Relationships and Related Transactions, and Director Independence
The information required by this item is incorporated
herein by reference to the section captioned “Directors, Executive Officers and Nominees for the Board of Directors” and “Board of Directors Interlocks and Insider Participation; Certain Relationships and Related Transactions” in CONMED Corporation’s definitive Proxy Statement or other informational filing to be filed with the Securities and Exchange Commission on or about
April 12, 2019
.
Item 14.
Principal Accounting Fees and Services
The information required by this item is incorporated
herein by reference to the section captioned “Principal Accounting Fees and Services” in CONMED Corporation’s definitive Proxy Statement or other informational filing to be filed with the Securities and Exchange Commission on or about
April 12, 2019
.
35
PART IV
Item 15. Exhibits, Financial Statement Schedules
|
Index to Financial Statements
|
||
|
|
|
|
|
(a)(1)
|
List of Financial Statements
|
Page in Form 10-K
|
|
|
|
|
|
|
Management’s Report on Internal Control Over Financial Reporting
|
|
|
|
|
|
|
|
Report of Independent Registered Public Accounting Firm
|
|
|
|
|
|
|
|
Consolidated Balance Sheets at December 31, 2018 and 2017
|
|
|
|
|
|
|
|
Consolidated Statements of Comprehensive Income for the Years Ended December 31, 2018, 2017 and 2016
|
|
|
|
|
|
|
|
Consolidated Statements of Shareholders’ Equity for the Years Ended December 31, 2018, 2017 and 2016
|
|
|
|
|
|
|
|
Consolidated Statements of Cash Flows for the Years Ended December 31, 2018, 2017 and 2016
|
|
|
|
|
|
|
|
Notes to Consolidated Financial Statements
|
|
|
|
|
|
|
(2)
|
List of Financial Statement Schedules
|
|
|
|
|
|
|
|
Valuation and Qualifying Accounts (Schedule II)
|
|
|
|
|
|
|
|
All other schedules have been omitted because they are not applicable, or the required information is shown in the financial statements or notes thereto.
|
|
|
|
|
|
|
(3)
|
List of Exhibits
|
|
|
|
|
|
|
|
The exhibits listed on the accompanying Exhibit Index on page
39
below are filed as part of this Form 10-K.
|
|
|
|
|
|
|
|
|
|
36
SIGNATURES
Pursuant to the requirements of Section 13 or 15(d) of the Securities Exchange Act of 1934, the registrant has duly caused this report to be signed on its behalf by the undersigned, thereunto duly authorized on the date indicated below.
|
CONMED CORPORATION
|
|
|
|
By: /s/ Curt R. Hartman
|
|
Curt R. Hartman
|
|
(President and Chief
|
|
Executive Officer)
|
|
|
|
Date:
|
|
February 25, 2019
|
37
Pursuant to the requirements of the Securities Exchange Act of 1934, this report has been signed below by the following persons on behalf of the registrant and in the capacities and on the dates indicated.
|
Signature
|
Title
|
Date
|
||
|
|
|
|
||
|
/s/ MARK E. TRYNISKI
|
Chairman of the Board
|
|
||
|
Mark E. Tryniski
|
of Directors
|
February 25, 2019
|
||
|
|
|
|
||
|
/s/ CURT R. HARTMAN
|
President, Chief Executive
|
|
||
|
Curt R. Hartman
|
Officer and Director
|
February 25, 2019
|
||
|
|
|
|
||
|
/s/ TODD W. GARNER
|
Executive Vice President
|
|
||
|
Todd W. Garner
|
and Chief Financial Officer
|
February 25, 2019
|
||
|
|
|
|
||
|
/s/ TERENCE M. BERGE
|
Vice President-
|
|
||
|
Terence M. Berge
|
Corporate Controller
|
February 25, 2019
|
||
|
|
|
|
||
|
/s/ DAVID BRONSON
|
|
|
||
|
David Bronson
|
Director
|
February 25, 2019
|
||
|
/s/ BRIAN P. CONCANNON
|
||||
|
Brian P. Concannon
|
Director
|
February 25, 2019
|
||
|
/s/ CHARLES M. FARKAS
|
|
|
||
|
Charles M. Farkas
|
Director
|
February 25, 2019
|
||
|
/s/ MARTHA GOLDBERG ARONSON
|
|
|
||
|
Martha Goldberg Aronson
|
Director
|
February 25, 2019
|
||
|
/s/ DIRK M. KUYPER
|
|
|
||
|
Dirk M. Kuyper
|
Director
|
February 25, 2019
|
||
|
|
|
|
||
|
/s/ JEROME J. LANDE
|
|
|
||
|
Jerome J. Lande
|
Director
|
February 25, 2019
|
||
|
|
|
|
||
|
/s/ JOHN L. WORKMAN
|
|
|
||
|
John L. Workman
|
Director
|
February 25, 2019
|
||
38
Exhibit Index
|
Exhibit No.
|
|
Description
|
|
|
|
|
|
-
|
||
|
|
|
|
|
-
|
||
|
|
|
|
|
-
|
||
|
|
|
|
|
-
|
||
|
-
|
||
|
|
|
|
|
-
|
||
|
|
|
|
|
-
|
||
|
-
|
||
|
-
|
||
|
|
|
|
|
-
|
||
|
-
|
||
|
-
|
||
|
-
|
||
|
|
|
|
39
|
-
|
||
|
|
||
|
-
|
||
|
|
|
|
|
-
|
||
|
|
||
|
-
|
||
|
-
|
||
|
-
|
||
|
-
|
||
|
-
|
||
|
-
|
||
|
-
|
||
|
-
|
||
|
-
|
||
|
-
|
||
|
-
|
||
|
-
|
||
40
|
-
|
||
|
-
|
||
|
-
|
||
|
-
|
||
|
-
|
||
|
-
|
||
|
-
|
||
|
-
|
||
|
-
|
||
|
-
|
||
|
-
|
||
|
-
|
||
|
-
|
||
|
-
|
||
|
-
|
||
41
|
-
|
||
|
-
|
||
|
-
|
||
|
-
|
||
|
14
|
-
|
Code of Ethics. The CONMED code of ethics may be accessed via the Company’s website at http://www.conmed.com/en/about-us/investors/investor-relations
|
|
-
|
||
|
|
|
|
|
-
|
||
|
|
|
|
|
-
|
||
|
|
|
|
|
-
|
||
|
|
|
|
|
-
|
||
|
101*
|
-
|
The following materials from CONMED Corporation's Annual Report on Form 10-K for the year ended December 31, 2018 formatted in XBRL (Extensible Business Reporting Language): (i) Consolidated Statements of Comprehensive Income for the three years ended December 31, 2018, (ii) Consolidated Balance Sheets at December 31, 2018 and 2017, (iii) Consolidated Statements of Shareholders' Equity for the three years ended December 31, 2018 (iv) Consolidated Statements of Cash Flows for the three years ended December 31, 2018, (v) Notes to the Consolidated Financial Statements for the year ended December 31, 2018 and (vi) Schedule II - Valuation and Qualifying Accounts. In accordance with Rule 406T of Regulation S-T, the XBRL related information in Exhibit 101 to this Annual Report on Form 10-K shall not be deemed to be “filed” for purposes of Section 18 of the Exchange Act, or otherwise subject to the liability of that section, and shall not be part of any registration statement or other document filed under the Securities Act or the Exchange Act, except as shall be expressly set forth by specific reference in such filing.
|
|
|
|
|
|
|
*
|
Filed herewith
|
|
+
|
Management contract or compensatory plan or arrangement
|
|
42
MANAGEMENT’S REPORT ON INTERNAL CONTROL
OVER FINANCIAL REPORTING
The management of CONMED Corporation is responsible for establishing and maintaining adequate internal control over financial reporting. Internal control over financial reporting is a process designed to provide reasonable assurance regarding the reliability of financial reporting and the preparation of financial statements for external reporting purposes in accordance with generally accepted accounting principles. Our internal control over financial reporting includes policies and procedures that pertain to the maintenance of records that, in reasonable detail, accurately and fairly reflect transactions and dispositions of assets; provide reasonable assurances that transactions are recorded as necessary to permit preparation of financial statements in accordance with accounting principles generally accepted in the United States of America, and that receipts and expenditures are being made only in accordance with authorizations of management and the directors of the Company; and provide reasonable assurance regarding prevention or timely detection of unauthorized acquisition, use or disposition of our assets that could have a material effect on our financial statements. Because of its inherent limitations, internal control over financial reporting may not prevent or detect misstatements. Management assessed the effectiveness of CONMED’s internal control over financial reporting as of
December 31, 2018
. In making its assessment, management utilized the criteria set forth by the Committee of Sponsoring Organizations of the Treadway Commission (“COSO”) in “Internal Control-Integrated Framework”, released in 2013. Management has concluded that based on its assessment, CONMED’s internal control over financial reporting was effective as of
December 31, 2018
. The effectiveness of the Company’s internal control over financial reporting as of
December 31, 2018
has been audited by PricewaterhouseCoopers LLP, an independent registered public accounting firm, as stated in their report which appears herein.
/s/ Curt R. Hartman
Curt R. Hartman
President and
Chief Executive Officer
/s/ Todd W. Garner
Todd W. Garner
Executive Vice President and
Chief Financial Officer
43
REPORT OF INDEPENDENT REGISTERED PUBLIC ACCOUNTING FIRM
To the Board of Directors and Shareholders of CONMED Corporation
Opinions on the Financial Statements and Internal Control over Financial Reporting
We have audited the accompanying consolidated balance sheets of CONMED Corporation and its subsidiaries
(the "Company")
as of
December 31, 2018 and 2017
,
and the related consolidated statements of comprehensive income, shareholders’ equity and cash flows for each of the three years in the period ended
December 31, 2018
, including the related notes and financial statement schedule listed in the index appearing under Item 15(a)(2)
(collectively referred to as the “consolidated financial statements”).
We also have audited the Company's internal control over financial reporting as of
December 31, 2018
, based on criteria established in
Internal Control - Integrated Framework
(2013)
issued by the Committee of Sponsoring Organizations of the Treadway Commission (COSO).
In our opinion, the consolidated
financial statements referred to above present fairly, in all material respects, the financial position of the Company as of
December 31, 2018 and 2017
, and the results of their
operations and their
cash flows for each of the three years in the period ended
December 31, 2018
in conformity with accounting principles generally accepted in the United States of America. Also in our opinion, the Company maintained, in all material respects, effective internal control over financial reporting as of December 31, 2018 based on criteria established in
Internal Control - Integrated Framework
(2013)
issued by the COSO.
Basis for Opinions
The Company's management is responsible for these consolidated financial statements, for maintaining effective internal control over financial reporting, and for its assessment of the effectiveness of internal control over financial reporting, included in the accompanying Management’s Report on Internal Control over Financial Reporting. Our responsibility is to express opinions on the Company’s consolidated
financial statements and on the Company's internal control over financial reporting based on our audits. We are a public accounting firm registered with the Public Company Accounting Oversight Board (United States) ("PCAOB") and are required to be independent with respect to the Company in accordance with the U.S. federal securities laws and the applicable rules and regulations of the Securities and Exchange Commission and the PCAOB.
We conducted our audits in accordance with the standards of the PCAOB. Those standards require that we plan and perform the audits to obtain reasonable assurance about whether the consolidated
financial statements are free of material misstatement, whether due to error or fraud, and whether effective internal control over financial reporting was maintained in all material respects.
Our audits of the consolidated
financial statements included performing procedures to assess the risks of material misstatement of the consolidated
financial statements, whether due to error or fraud, and performing procedures that respond to those risks. Such procedures included examining, on a test basis, evidence regarding the amounts and disclosures in the consolidated
financial statements. Our audits also included evaluating the accounting principles used and significant estimates made by management, as well as evaluating the overall presentation of the consolidated
financial statements. Our audit of internal control over financial reporting included obtaining an understanding of internal control over financial reporting, assessing the risk that a material weakness exists, and testing and evaluating the design and operating effectiveness of internal control based on the assessed risk. Our audits also included performing such other procedures as we considered necessary in the circumstances. We believe that our audits provide a reasonable basis for our opinions.
Definition and Limitations of Internal Control over Financial Reporting
A company’s internal control over financial reporting is a process designed to provide reasonable assurance regarding the reliability of financial reporting and the preparation of financial statements for external purposes in accordance with generally accepted accounting principles. A company’s internal control over financial reporting includes those policies and procedures that (i) pertain to the maintenance of records that, in reasonable detail, accurately and fairly reflect the transactions and dispositions of the assets of the company; (ii) provide reasonable assurance that transactions are recorded as necessary to permit preparation of financial statements in accordance with generally accepted accounting principles, and that receipts and expenditures of the company are being made only in accordance with authorizations of management and directors of the company; and (iii) provide reasonable assurance regarding prevention or timely detection of unauthorized acquisition, use, or disposition of the company’s assets that could have a material effect on the financial statements.
44
Because of its inherent limitations, internal control over financial reporting may not prevent or detect misstatements. Also, projections of any evaluation of effectiveness to future periods are subject to the risk that controls may become inadequate because of changes in conditions, or that the degree of compliance with the policies or procedures may deteriorate.
/s/ PricewaterhouseCoopers LLP
Rochester, New York
February 25, 2019
We have served as the Company’s auditor since 1982.
45
CONMED CORPORATION
CONSOLIDATED BALANCE SHEETS
December 31, 2018
and
2017
(In thousands except share and per share amounts)
|
|
2018
|
2017
|
|||||
|
ASSETS
|
|
|
|||||
|
Current assets:
|
|
|
|||||
|
Cash and cash equivalents
|
$
|
17,511
|
|
$
|
32,622
|
|
|
|
Accounts receivable, less allowance for doubtful
|
|
|
|
|
|||
|
accounts of $2,660 in 2018 and $2,137 in 2017
|
181,550
|
|
167,037
|
|
|||
|
Inventories
|
154,599
|
|
141,436
|
|
|||
|
Prepaid expenses and other current assets
|
20,691
|
|
15,688
|
|
|||
|
Total current assets
|
374,351
|
|
356,783
|
|
|||
|
Property, plant and equipment, net
|
113,245
|
|
116,229
|
|
|||
|
Deferred income taxes
|
5,162
|
|
4,721
|
|
|||
|
Goodwill
|
400,440
|
|
401,954
|
|
|||
|
Other intangible assets, net
|
413,193
|
|
414,940
|
|
|||
|
Other assets
|
62,747
|
|
63,334
|
|
|||
|
Total assets
|
$
|
1,369,138
|
|
$
|
1,357,961
|
|
|
|
LIABILITIES AND SHAREHOLDERS' EQUITY
|
|
|
|
|
|||
|
Current liabilities:
|
|
|
|
|
|||
|
Current portion of long-term debt
|
$
|
18,336
|
|
$
|
14,699
|
|
|
|
Accounts payable
|
53,498
|
|
42,044
|
|
|||
|
Accrued compensation and benefits
|
42,924
|
|
34,258
|
|
|||
|
Other current liabilities
|
46,186
|
|
59,002
|
|
|||
|
Total current liabilities
|
160,944
|
|
150,003
|
|
|||
|
Long-term debt
|
438,564
|
|
471,744
|
|
|||
|
Deferred income taxes
|
81,061
|
|
77,668
|
|
|||
|
Other long-term liabilities
|
26,299
|
|
27,114
|
|
|||
|
Total liabilities
|
706,868
|
|
726,529
|
|
|||
|
Commitments and contingencies (Note 12)
|
|
|
|
|
|||
|
Shareholders' equity:
|
|
|
|
|
|||
|
Preferred stock, par value $.01 per share; authorized
|
|
|
|
|
|||
|
500,000 shares, none issued or outstanding
|
—
|
|
—
|
|
|||
|
Common stock, par value $.01 per share; 100,000,000
|
|
|
|
|
|||
|
authorized; 31,299,194 issued in 2018 and 2017, respectively
|
313
|
|
313
|
|
|||
|
Paid-in capital
|
341,738
|
|
333,795
|
|
|||
|
Retained earnings
|
464,851
|
|
440,085
|
|
|||
|
Accumulated other comprehensive loss
|
(55,737
|
)
|
(49,078
|
)
|
|||
|
Less: Treasury stock, at cost;
|
|
|
|
|
|||
|
3,167,422 and 3,338,015 shares in
|
|
|
|
|
|||
|
2018 and 2017, respectively
|
(88,895
|
)
|
(93,683
|
)
|
|||
|
Total shareholders' equity
|
662,270
|
|
631,432
|
|
|||
|
Total liabilities and shareholders' equity
|
$
|
1,369,138
|
|
$
|
1,357,961
|
|
|
The accompanying notes are an integral part of the consolidated financial statements.
46
CONMED CORPORATION
CONSOLIDATED STATEMENTS OF COMPREHENSIVE INCOME
Years Ended
December 31, 2018
,
2017
and
2016
(In thousands except per share amounts)
|
2018
|
2017
|
2016
|
|||||||||
|
Net sales
|
$
|
859,634
|
|
$
|
796,392
|
|
$
|
763,520
|
|
||
|
Cost of sales
|
390,524
|
|
365,351
|
|
355,190
|
|
|||||
|
Gross profit
|
469,110
|
|
431,041
|
|
408,330
|
|
|||||
|
Selling and administrative expense
|
355,617
|
|
351,799
|
|
338,400
|
|
|||||
|
Research and development expense
|
42,188
|
|
32,307
|
|
32,254
|
|
|||||
|
Operating expenses
|
397,805
|
|
384,106
|
|
370,654
|
|
|||||
|
Income from operations
|
71,305
|
|
46,935
|
|
37,676
|
|
|||||
|
Other expense
|
—
|
|
—
|
|
2,942
|
|
|||||
|
Interest expense
|
20,652
|
|
18,203
|
|
15,359
|
|
|||||
|
Income before income taxes
|
50,653
|
|
28,732
|
|
19,375
|
|
|||||
|
Provision (benefit) for income taxes
|
9,799
|
|
(26,755
|
)
|
4,711
|
|
|||||
|
Net income
|
$
|
40,854
|
|
$
|
55,487
|
|
$
|
14,664
|
|
||
|
Per share data:
|
|
|
|||||||||
|
Basic
|
$
|
1.45
|
|
$
|
1.99
|
|
$
|
0.53
|
|
||
|
Diluted
|
$
|
1.41
|
|
$
|
1.97
|
|
$
|
0.52
|
|
||
|
Other comprehensive income (loss), before tax:
|
|||||||||||
|
Foreign currency translation adjustments
|
$
|
(8,369
|
)
|
$
|
13,879
|
|
$
|
(4,501
|
)
|
||
|
Pension liability
|
(885
|
)
|
1,023
|
|
(755
|
)
|
|||||
|
Cash flow hedging gain (loss)
|
10,985
|
|
(8,051
|
)
|
547
|
|
|||||
|
Other comprehensive income, before tax
|
42,585
|
|
62,338
|
|
9,955
|
|
|||||
|
Provision (benefit) for income taxes related to items of other comprehensive income
|
2,441
|
|
(2,597
|
)
|
(77
|
)
|
|||||
|
Comprehensive income
|
$
|
40,144
|
|
$
|
64,935
|
|
$
|
10,032
|
|
||
The accompanying notes are an integral part of the consolidated financial statements.
47
CONMED CORPORATION
CONSOLIDATED STATEMENTS OF SHAREHOLDERS' EQUITY
Years Ended
December 31, 2018
,
2017
and
2016
(In thousands)
|
|
Common Stock
|
Paid-in
Capital
|
Retained
Earnings
|
Accumulated
Other
Comprehensive
Loss
|
Treasury
Stock
|
Shareholders’
Equity
|
||||||||||||||||||||
|
|
Shares
|
Amount
|
||||||||||||||||||||||||
|
Balance at December 31, 2015
|
31,299
|
|
$
|
313
|
|
$
|
324,915
|
|
$
|
414,506
|
|
$
|
(53,894
|
)
|
$
|
(100,767
|
)
|
$
|
585,073
|
|
||||||
|
Common stock issued
|
|
|
|
|
|
|
|
|
|
|
|
|
|
|
||||||||||||
|
under employee plans
|
|
|
|
|
(4,217
|
)
|
|
|
|
|
3,348
|
|
(869
|
)
|
||||||||||||
|
Tax benefit arising from
|
|
|
|
|
|
|
|
|
|
|
|
|
|
|
||||||||||||
|
common stock issued under
|
|
|
|
|
|
|
|
|
|
|
|
|
|
|
||||||||||||
|
employee plans
|
|
|
|
|
203
|
|
|
|
|
|
|
|
203
|
|
||||||||||||
|
Stock-based compensation
|
|
|
|
|
8,375
|
|
|
|
|
|
|
|
8,375
|
|
||||||||||||
|
Dividends on common stock
|
(22,238
|
)
|
(22,238
|
)
|
||||||||||||||||||||||
|
Comprehensive income (loss):
|
||||||||||||||||||||||||||
|
Foreign currency translation adjustments
|
(4,501
|
)
|
||||||||||||||||||||||||
|
Pension liability (net of income tax benefit of $279)
|
(476
|
)
|
||||||||||||||||||||||||
|
Cash flow hedging gain (net of income tax expense of $202)
|
345
|
|
||||||||||||||||||||||||
|
Net income
|
14,664
|
|
||||||||||||||||||||||||
|
Total comprehensive income
|
|
|
|
|
|
|
10,032
|
|
||||||||||||||||||
|
Balance at December 31, 2016
|
31,299
|
|
$
|
313
|
|
$
|
329,276
|
|
$
|
406,932
|
|
$
|
(58,526
|
)
|
$
|
(97,419
|
)
|
$
|
580,576
|
|
||||||
|
Common stock issued
|
|
|
|
|
|
|
|
|
|
|
|
|
|
|
||||||||||||
|
under employee plans
|
|
|
|
|
(3,953
|
)
|
|
|
|
|
3,736
|
|
(217
|
)
|
||||||||||||
|
Stock-based compensation
|
|
|
|
|
8,472
|
|
|
|
|
|
|
|
8,472
|
|
||||||||||||
|
Dividends on common stock
|
(22,334
|
)
|
(22,334
|
)
|
||||||||||||||||||||||
|
Comprehensive income (loss):
|
||||||||||||||||||||||||||
|
Foreign currency translation adjustments
|
13,879
|
|
||||||||||||||||||||||||
|
Pension liability (net of income tax expense of $378)
|
645
|
|
||||||||||||||||||||||||
|
Cash flow hedging loss (net of income tax benefit of $2,975)
|
(5,076
|
)
|
||||||||||||||||||||||||
|
Net income
|
55,487
|
|
||||||||||||||||||||||||
|
Total comprehensive income
|
|
|
|
|
|
|
|
|
64,935
|
|
||||||||||||||||
|
Balance at December 31, 2017
|
31,299
|
|
$
|
313
|
|
$
|
333,795
|
|
$
|
440,085
|
|
$
|
(49,078
|
)
|
$
|
(93,683
|
)
|
$
|
631,432
|
|
||||||
48
|
|
Common Stock
|
Paid-in
Capital
|
Retained
Earnings
|
Accumulated
Other
Comprehensive
Loss
|
Treasury
Stock
|
Shareholders’
Equity
|
||||||||||||||||||||
|
|
Shares
|
Amount
|
||||||||||||||||||||||||
|
Common stock issued
|
|
|
|
|
|
|
|
|
|
|
|
|
||||||||||||||
|
under employee plans
|
|
|
|
|
(2,094
|
)
|
|
|
|
|
4,788
|
|
2,694
|
|
||||||||||||
|
Stock-based compensation
|
|
|
|
|
10,037
|
|
|
|
|
|
|
|
10,037
|
|
||||||||||||
|
Dividends on common stock
|
(22,477
|
)
|
(22,477
|
)
|
||||||||||||||||||||||
|
Comprehensive income (loss):
|
|
|
||||||||||||||||||||||||
|
Foreign currency
translation adjustments
|
(8,369
|
)
|
||||||||||||||||||||||||
|
Pension liability (net of income tax benefit of $213)
|
(672
|
)
|
||||||||||||||||||||||||
|
Cash flow hedging gain (net of income tax expense of $2,654)
|
8,331
|
|
||||||||||||||||||||||||
|
Net income
|
40,854
|
|
||||||||||||||||||||||||
|
Total comprehensive income
|
40,144
|
|
||||||||||||||||||||||||
|
Cumulative effect of change in accounting principle
(1)
|
6,389
|
|
(5,949
|
)
|
440
|
|
||||||||||||||||||||
|
Balance at December 31, 2018
|
31,299
|
|
$
|
313
|
|
$
|
341,738
|
|
$
|
464,851
|
|
$
|
(55,737
|
)
|
$
|
(88,895
|
)
|
$
|
662,270
|
|
||||||
|
(1)
We recorded the cumulative impact of adopting ASU 2014-09, Revenue from Contracts with Customers, (and its amendments) and ASU 2018-02, Income Statement - Reporting Comprehensive Income (Topic 220) in 2018. See Note 16 to the consolidated financial statements for further discussion regarding the adoption of accounting standards during 2018.
|
||||||||||||||||||||||||||
The accompanying notes are an integral part of the consolidated financial statements.
49
CONMED CORPORATION
CONSOLIDATED STATEMENTS OF CASH FLOWS
Years Ended
December 31, 2018
,
2017
and
2016
(In thousands)
|
2018
|
2017
|
2016
|
|||||||||
|
Cash flows from operating activities:
|
|
||||||||||
|
Net income
|
$
|
40,854
|
|
$
|
55,487
|
|
$
|
14,664
|
|
||
|
Adjustments to reconcile net income to net cash provided by operating activities:
|
|
|
|||||||||
|
Depreciation
|
18,530
|
|
20,079
|
|
20,479
|
|
|||||
|
Amortization
|
43,273
|
|
38,469
|
|
34,830
|
|
|||||
|
Stock-based compensation
|
10,037
|
|
8,472
|
|
8,375
|
|
|||||
|
Impairment charges
|
4,212
|
|
—
|
|
—
|
|
|||||
|
Deferred income taxes
|
2,063
|
|
(40,021
|
)
|
(2,871
|
)
|
|||||
|
Gain on sale of facility
|
—
|
|
—
|
|
(1,890
|
)
|
|||||
|
Increase (decrease) in cash flows from changes in assets and
|
|
|
|||||||||
|
liabilities, net of acquired assets:
|
|
|
|||||||||
|
Accounts receivable
|
(17,460
|
)
|
(13,631
|
)
|
(6,380
|
)
|
|||||
|
Inventories
|
(15,037
|
)
|
(3,926
|
)
|
3,103
|
|
|||||
|
Accounts payable
|
12,109
|
|
(286
|
)
|
2,094
|
|
|||||
|
Income taxes
|
(2,193
|
)
|
4,288
|
|
(200
|
)
|
|||||
|
Accrued compensation and benefits
|
9,044
|
|
336
|
|
(2,598
|
)
|
|||||
|
Other assets
|
(24,216
|
)
|
(22,401
|
)
|
(23,234
|
)
|
|||||
|
Other liabilities
|
(6,515
|
)
|
18,700
|
|
(6,491
|
)
|
|||||
|
|
33,847
|
|
10,079
|
|
25,217
|
|
|||||
|
Net cash provided by operating activities
|
74,701
|
|
65,566
|
|
39,881
|
|
|||||
|
Cash flows from investing activities:
|
|
|
|||||||||
|
Payments related to business and asset acquisitions, net of cash acquired
|
—
|
|
(16,212
|
)
|
(256,450
|
)
|
|||||
|
Proceeds from sale of a facility
|
—
|
|
—
|
|
5,178
|
|
|||||
|
Purchases of property, plant and equipment
|
(16,507
|
)
|
(12,842
|
)
|
(14,753
|
)
|
|||||
|
Net cash used in investing activities
|
(16,507
|
)
|
(29,054
|
)
|
(266,025
|
)
|
|||||
|
Cash flows from financing activities:
|
|
|
|||||||||
|
Payments on term loan
|
(13,125
|
)
|
(8,750
|
)
|
(8,750
|
)
|
|||||
|
Proceeds from term loan
|
—
|
|
—
|
|
175,000
|
|
|||||
|
Payments on revolving line of credit
|
(168,000
|
)
|
(157,000
|
)
|
(162,347
|
)
|
|||||
|
Proceeds from revolving line of credit
|
153,000
|
|
155,000
|
|
225,000
|
|
|||||
|
Payments related to distribution agreement
|
—
|
|
—
|
|
(16,667
|
)
|
|||||
|
Payments on mortgage notes
|
(1,574
|
)
|
(1,452
|
)
|
(1,339
|
)
|
|||||
|
Payments related to contingent consideration
|
(21,323
|
)
|
—
|
|
—
|
|
|||||
|
Payments related to debt issuance costs
|
(913
|
)
|
—
|
|
(5,556
|
)
|
|||||
|
Dividends paid on common stock
|
(22,443
|
)
|
(22,307
|
)
|
(22,213
|
)
|
|||||
|
Other, net
|
2,113
|
|
(372
|
)
|
(585
|
)
|
|||||
|
Net cash provided by (used in) financing activities
|
(72,265
|
)
|
(34,881
|
)
|
182,543
|
|
|||||
|
Effect of exchange rate changes on cash and cash equivalents
|
(1,040
|
)
|
3,563
|
|
(1,475
|
)
|
|||||
|
Net increase (decrease) in cash and cash equivalents
|
(15,111
|
)
|
5,194
|
|
(45,076
|
)
|
|||||
|
Cash and cash equivalents at beginning of year
|
32,622
|
|
27,428
|
|
72,504
|
|
|||||
|
Cash and cash equivalents at end of year
|
$
|
17,511
|
|
$
|
32,622
|
|
$
|
27,428
|
|
||
|
Non-cash investing and financing activities:
|
|||||||||||
|
Contractual obligations from asset acquisition
|
$
|
8,360
|
|
$
|
—
|
|
$
|
—
|
|
||
|
Dividends payable
|
5,626
|
|
5,592
|
|
5,566
|
|
|||||
50
|
2018
|
2017
|
2016
|
|||||||||
|
Supplemental disclosures of cash flow information:
|
|
|
|||||||||
|
Cash paid during the year for:
|
|
|
|||||||||
|
Interest
|
$
|
19,660
|
|
$
|
16,157
|
|
$
|
13,758
|
|
||
|
Income taxes
|
11,048
|
|
8,869
|
|
9,588
|
|
|||||
The accompanying notes are an integral part of the consolidated financial statements.
51
CONMED CORPORATION
NOTES TO CONSOLIDATED FINANCIAL STATEMENTS
(In thousands except per share amounts)
Note 1 — Operations and Significant Accounting Policies
Organization and operations
CONMED Corporation (“CONMED”, the “Company”, “we” or “us”) is a medical technology company that provides surgical devices and equipment for minimally invasive procedures. The Company’s products are used by surgeons and physicians in a variety of specialties including orthopedics, general surgery, gynecology, neurosurgery, thoracic surgery and gastroenterology.
Principles of consolidation
The consolidated financial statements include the accounts of CONMED Corporation and its controlled subsidiaries. All significant intercompany accounts and transactions have been eliminated.
Use of estimates
The preparation of financial statements in conformity with accounting principles generally accepted in the United States of America requires management to make estimates and judgments which affect the reported amounts of assets, liabilities, related disclosure of contingent assets and liabilities at the date of the financial statements and the reported amount of revenues and expenses during the reporting period. Due to the inherent uncertainty involved in making estimates, actual results reported in future periods may differ from those estimates.
Cash and cash equivalents
We consider all highly liquid investments with an original maturity of three months or less to be cash equivalents.
Inventories
Inventories are valued at the lower of cost and net realizable value determined on the FIFO (first-in, first-out) cost method.
We write-off excess and obsolete inventory resulting from the inability to sell our products at prices in excess of current carrying costs. We make estimates regarding the future recoverability of the costs of our products and record a provision for excess and obsolete inventories based on historical experience and expected future trends.
Property, plant and equipment
Property, plant and equipment are stated at cost and depreciated using the straight-line method over the following estimated useful lives:
|
|
Building and improvements
|
12 to 40 years
|
|
|
Leasehold improvements
|
Shorter of life of asset or life of lease
|
|
|
Machinery and equipment
|
2 to 15 years
|
Goodwill and other intangible assets
We have a history of growth through acquisitions. Assets and liabilities of acquired businesses are recorded at their estimated fair values as of the date of acquisition. Goodwill represents costs in excess of fair values assigned to the underlying net assets of acquired businesses. Factors that contribute to the recognition of goodwill include synergies that are specific to our business and are expected to increase net sales and profits; acquisition of a talented workforce; cost savings opportunities; the strategic benefit of expanding our presence in core and adjacent markets; and diversifying our product portfolio.
Customer and distributor relationships, trademarks, tradenames, developed technology, patents and other intangible assets primarily represent allocations of purchase price to identifiable intangible assets of acquired businesses. Sales representation, marketing and promotional rights represent intangible assets created under our agreement with Musculoskeletal Transplant Foundation (“MTF”).
52
Goodwill and intangible assets deemed to have indefinite lives are not amortized, but are subject to at least annual impairment testing. It is our policy to perform our annual impairment testing in the fourth quarter. The identification and measurement of goodwill impairment involves the estimation of the fair value of our business. Estimates of fair value are based on the best information available as of the date of the assessment. We completed our goodwill impairment testing during the fourth quarter of
2018
. We performed our impairment test utilizing the market capitalization approach to determine whether the fair value of a reporting unit is less than its carrying amount. Based upon our assessment, the fair value continues to exceed carrying value.
Intangible assets with a finite life are amortized over the estimated useful life of the asset and are evaluated each reporting period to determine whether events and circumstances warrant a revision to the remaining period of amortization. Intangible assets subject to amortization are reviewed for impairment whenever events or changes in circumstances indicate that its carrying amount may not be recoverable. The carrying amount of an intangible asset subject to amortization is not recoverable if it exceeds the sum of the undiscounted cash flows expected to result from the use of the asset. An impairment loss is recognized by reducing the carrying amount of the intangible asset to its current fair value.
For all other indefinite-lived intangible assets, we perform a qualitative impairment test. Based upon this assessment, we have determined that our indefinite-lived intangible assets are not impaired.
Other long-lived assets
We review other long-lived assets consisting of property, plant and equipment and field inventory for impairment whenever events or circumstances indicate that such carrying amounts may not be recoverable. If the sum of the expected future undiscounted cash flows is less than the carrying amount of the asset, an impairment loss is recognized by reducing the recorded value to its current fair value.
The Company maintains field inventory consisting of capital equipment for customer demonstration and evaluation purposes. Field inventory is generally not sold to customers but rather continues to be used over its useful life for demonstration, evaluation and loaner purposes. An annual wear and tear provision has been recorded on field inventory. The net book value of such equipment at
December 31, 2018
and
2017
is
$50.4 million
and
$52.4 million
, respectively.
Translation of foreign currency financial statements
Assets and liabilities of foreign subsidiaries have been translated into United States dollars at the applicable rates of exchange in effect at the end of the period reported. Revenues and expenses have been translated at the applicable weighted average rates of exchange in effect during the period reported. Translation adjustments are reflected in accumulated other comprehensive loss. Transaction gains and losses are included in net income.
Foreign exchange and hedging activity
We manage our foreign currency transaction risks through the use of forward contracts to hedge forecasted cash flows associated with foreign currency transaction exposures. We account for these forward contracts as cash flow hedges. To the extent these forward contracts meet hedge accounting criteria, changes in their fair value are not included in current earnings but are included in accumulated other comprehensive loss. These changes in fair value will be reclassified into earnings as a component of sales or cost of sales when the forecasted transaction occurs.
We also enter into forward contracts to exchange foreign currencies for United States dollars in order to hedge our currency transaction exposures on intercompany receivables denominated in foreign currencies. These forward contracts settle each month at month-end, at which time we enter into new forward contracts. We have not designated these forward contracts as hedges and have not applied hedge accounting to them. We record these forward contracts at fair value with resulting gains and losses included in selling and administrative expense in the consolidated statements of comprehensive income.
Income taxes
Deferred income tax assets and liabilities are based on the difference between the financial statement and tax basis of assets and liabilities and operating loss and tax credit carryforwards as measured by the enacted tax rates that are anticipated to be in effect in the respective jurisdictions when these differences reverse. The deferred income tax provision generally represents the net change in the assets and liabilities for deferred income taxes. A valuation allowance is established when it is necessary to reduce deferred income tax assets to amounts for which realization is likely. In assessing the need for a valuation allowance, we estimate future taxable income, considering the feasibility of ongoing tax planning strategies and the realizability of tax loss
53
carryforwards following tax law ordering rules. Valuation allowances related to deferred tax assets may be impacted by changes to tax laws, changes to statutory tax rates, reversal of temporary differences and ongoing and future taxable income levels.
Deferred income taxes are not provided on the unremitted earnings of subsidiaries outside of the United States earned after December 31, 2017 as it is expected that these earnings are permanently reinvested. Such earnings may become taxable upon a repatriation of assets from a subsidiary or the sale or liquidation of a subsidiary. Deferred income taxes are provided when the Company no longer considers subsidiary earnings to be permanently invested, such as in situations where the Company’s subsidiaries plan to make future dividend distributions.
Revenue recognition
The Company recognizes revenue when we have satisfied a performance obligation by transferring a promised good or service (that is an asset) to a customer. An asset is transferred when the customer obtains control of that asset. The following policies apply to our major categories of revenue transactions:
|
•
|
Revenue is recognized when product is shipped at which point the performance obligation is satisfied and the customer obtains control of the product.
|
|
•
|
We place certain of our capital equipment with customers on a loaned basis and at no charge in exchange for commitments to purchase related single-use products over time periods generally ranging from one to three years. In these circumstances, no revenue is recognized upon capital equipment shipment as the equipment is loaned and subject to return if certain minimum single-use purchases are not met. Revenue is recognized upon the sale and shipment of the related single-use products. The cost of the equipment is amortized over its estimated useful life which is generally five years.
|
|
•
|
We recognize revenues in accordance with the terms of our agreement with MTF on a net basis as our role is that of an agent earning a commission or fee. MTF is responsible for the sourcing, processing and distribution of allograft tissue for sports medicine procedures while the Company represents, markets and promotes MTF’s sports medicine allograft tissues to customers. The Company is paid a Fee by MTF which is calculated as a percentage of the net amounts invoiced by MTF to customers for sports medicine allograft tissues. The Company accounts for the services provided to MTF as a series of distinct performance obligations and each service is recognized over time as MTF simultaneously receives and consumes the benefit.
|
|
•
|
Product returns are only accepted at the discretion of the Company and in accordance with our “Returned Goods Policy”. Historically, the level of product returns has not been significant. We accrue for sales returns, rebates and allowances based upon an analysis of historical customer returns and credits, rebates, discounts and current market conditions.
|
|
•
|
Our terms of sale to customers generally do not include any obligations to perform future services. Limited warranties are provided for capital equipment sales and provisions for warranty are provided at the time of product sale based upon an analysis of historical data.
|
|
•
|
Amounts billed to customers related to shipping and handling have been included in net sales. Shipping and handling costs included in selling and administrative expense were
$14.0 million
,
$13.1 million
and
$13.4 million
for
2018
,
2017
and
2016
, respectively.
|
|
•
|
We sell to a diversified base of customers around the world and, therefore, believe there is no material concentration of credit risk.
|
|
•
|
We assess the risk of loss on accounts receivable and adjust the allowance for doubtful accounts based on this risk assessment. Historically, losses on accounts receivable have not been material. Management believes that the allowance for doubtful accounts is adequate to provide for probable losses resulting from accounts receivable.
|
|
•
|
We sell extended warranties to customers that are typically for a period of one to three years. The related revenue is recorded as a contract liability and recognized over the life of the contract on a straight-line basis, which is reflective of our obligation to stand ready to provide repair services.
|
54
Please refer to Note 9 and Note 16 for further detail on revenue and the impact of adopting Accounting Standards Update ("ASU") No. 2014-09, Revenue from Contracts with Customers, during
2018
.
Earnings per share
Basic earnings per share (“basic EPS”) is computed by dividing net income by the weighted average number of common shares outstanding for the reporting period. Diluted earnings per share (“diluted EPS”) gives effect to all dilutive potential shares outstanding resulting from employee stock options, restricted stock units, performance share units and stock appreciation rights during the period. The following table sets forth the computation of basic and diluted earnings per share at
December 31, 2018
,
2017
and
2016
, respectively:
|
|
2018
|
2017
|
2016
|
||||||||
|
Net income
|
$
|
40,854
|
|
$
|
55,487
|
|
$
|
14,664
|
|
||
|
Basic-weighted average shares outstanding
|
28,118
|
|
27,939
|
|
27,804
|
|
|||||
|
Effect of dilutive potential securities
|
772
|
|
232
|
|
160
|
|
|||||
|
Diluted-weighted average shares outstanding
|
28,890
|
|
28,171
|
|
27,964
|
|
|||||
|
Net income (per share)
|
|||||||||||
|
Basic
|
$
|
1.45
|
|
$
|
1.99
|
|
$
|
0.53
|
|
||
|
Diluted
|
1.41
|
|
1.97
|
|
0.52
|
|
|||||
The shares used in the calculation of diluted EPS exclude options and stock appreciation rights ("SARs") to purchase shares where the exercise price was greater than the average market price of common shares for the year and the effect of the inclusion would be anti-dilutive. Such shares aggregated approximately
0.7 million
,
1.2 million
and
1.4 million
at
December 31, 2018
,
2017
and
2016
, respectively.
Stock-based compensation
All share-based payments to employees, including grants of employee stock options, restricted stock units, performance share units and stock appreciation rights are recognized in the financial statements based at their fair values. Compensation expense is generally recognized using a straight-line method over the vesting period. Compensation expense for performance share units is recognized using the graded vesting method.
We issue shares under our stock based compensation plans out of treasury stock whereby treasury stock is reduced by the weighted average cost of such treasury stock. To the extent there is a difference between the cost of the treasury stock and the exercise price of shares issued under stock based compensation plans, we record gains to paid in capital; losses are recorded to paid in capital to the extent any gain was previously recorded, otherwise the loss is recorded to retained earnings.
55
Accumulated other comprehensive loss
Accumulated other comprehensive loss consists of the following:
|
Cash Flow
Hedging
Gain (Loss)
|
Pension
Liability
|
Foreign Currency Translation
Adjustments
|
Accumulated
Other
Comprehensive Loss
|
||||||||||||
|
Balance, December 31, 2015
|
$
|
1,201
|
|
$
|
(25,982
|
)
|
$
|
(29,113
|
)
|
$
|
(53,894
|
)
|
|||
|
Other comprehensive income (loss)
before reclassifications, net of tax
|
1,088
|
|
(2,229
|
)
|
(4,501
|
)
|
(5,642
|
)
|
|||||||
|
Amounts reclassified from accumulated other comprehensive income (loss) before tax
(a)
|
(1,179
|
)
|
2,780
|
|
—
|
|
1,601
|
|
|||||||
|
Income tax
|
436
|
|
(1,027
|
)
|
—
|
|
(591
|
)
|
|||||||
|
Net current-period other comprehensive income (loss)
|
345
|
|
(476
|
)
|
(4,501
|
)
|
(4,632
|
)
|
|||||||
|
Balance, December 31, 2016
|
$
|
1,546
|
|
$
|
(26,458
|
)
|
$
|
(33,614
|
)
|
$
|
(58,526
|
)
|
|||
|
Other comprehensive income (loss)
before reclassifications, net of tax
|
(5,529
|
)
|
(1,142
|
)
|
13,879
|
|
7,208
|
|
|||||||
|
Amounts reclassified from accumulated other comprehensive income (loss) before tax
(a)
|
718
|
|
2,835
|
|
—
|
|
3,553
|
|
|||||||
|
Income tax
|
(265
|
)
|
(1,048
|
)
|
—
|
|
(1,313
|
)
|
|||||||
|
Net current-period other comprehensive income (loss)
|
(5,076
|
)
|
645
|
|
13,879
|
|
9,448
|
|
|||||||
|
Balance, December 31, 2017
|
$
|
(3,530
|
)
|
$
|
(25,813
|
)
|
$
|
(19,735
|
)
|
$
|
(49,078
|
)
|
|||
|
Other comprehensive income (loss)
before reclassifications, net of tax
|
7,197
|
|
(2,711
|
)
|
(8,369
|
)
|
(3,883
|
)
|
|||||||
|
Amounts reclassified from accumulated other comprehensive income (loss) before tax
(a)
|
913
|
|
2,689
|
|
—
|
|
3,602
|
|
|||||||
|
Income tax
|
221
|
|
(650
|
)
|
—
|
|
(429
|
)
|
|||||||
|
Net current-period other comprehensive income (loss)
|
8,331
|
|
(672
|
)
|
(8,369
|
)
|
(710
|
)
|
|||||||
|
Cumulative effect of change in accounting principle
(b)
|
(716
|
)
|
(5,233
|
)
|
—
|
|
(5,949
|
)
|
|||||||
|
Balance, December 31, 2018
|
$
|
4,085
|
|
$
|
(31,718
|
)
|
$
|
(28,104
|
)
|
$
|
(55,737
|
)
|
|||
(a) The cash flow hedging gain (loss) and pension liability accumulated other comprehensive income components are included in sales or cost of sales and as a component of net periodic pension cost, respectively. Refer to Note 15 and Note 11, respectively, for further details.
(b) We recorded the cumulative impact of adopting ASU 2018-02 in 2018, which allows for the elimination of the stranded tax effects of Tax Reform through a reclassification between accumulated other comprehensive income (loss) and retained earnings. See Note 16 to the consolidated financial statements for further discussion regarding the adoption of this accounting standard.
Note 2 – Business Acquisition
On January 4, 2016, we acquired all of the stock of SurgiQuest, Inc. ("SurgiQuest") for
$257.7 million
in cash (based on an aggregate purchase price of
$265 million
as adjusted pursuant to the merger agreement governing the acquisition). SurgiQuest developed, manufactured and marketed the AirSeal
®
System, the first integrated access management technology for use in laparoscopic and robotic procedures. This proprietary and differentiated access system is complementary to our current general surgery offering. The acquisition was funded through a combination of cash on hand and long-term borrowings.
56
The unaudited pro forma information for the year ended December 31, 2016, assuming SurgiQuest occurred as of January 1, 2015 are presented below. This information has been prepared for comparative purposes only and does not purport to be indicative of the results of operations which actually would have resulted had the SurgiQuest acquisition occurred on the dates indicated, or which may result in the future.
|
December 31, 2016
|
|||
|
Net sales
|
$
|
763,520
|
|
|
Net income
|
29,153
|
|
|
These pro forma results include certain adjustments, primarily due to increases in amortization expense due to fair value adjustments of intangible assets, increases in interest expense due to additional borrowings incurred to finance the acquisition, and acquisition related costs including transaction costs such as legal, accounting, valuation and other professional services as well as integration costs such as severance and retention.
Net sales associated with SurgiQuest of
$68.4 million
have been recorded in the consolidated statement of comprehensive income for the year ended December 31, 2016. It is impracticable to determine the earnings recorded in the consolidated statement of comprehensive income associated with the SurgiQuest acquisition for the year ended December 31, 2016 as these amounts are not separately measured.
On
February 11, 2019
, we acquired Buffalo Filter and all of the issued and outstanding common stock of Palmerton Holdings, Inc. from Filtration Group FGC LLC (the “Buffalo Filter Acquisition”) for approximately
$365 million
, in cash, subject to customary adjustments for working capital, cash held by Buffalo Filter at closing, indebtedness of Buffalo Filter, expenses related to the transaction and other related fees and expenses. Refer to Note 17 for further details.
Note 3 — Inventories
Inventories consist of the following at December 31:
|
|
2018
|
2017
|
|||||
|
Raw materials
|
$
|
45,898
|
|
$
|
41,844
|
|
|
|
Work in process
|
15,000
|
|
14,666
|
|
|||
|
Finished goods
|
93,701
|
|
84,926
|
|
|||
|
|
$
|
154,599
|
|
$
|
141,436
|
|
|
Note 4 — Property, Plant and Equipment
Property, plant and equipment consist of the following at December 31:
|
|
2018
|
2017
|
|||||
|
Land
|
$
|
4,027
|
|
$
|
4,027
|
|
|
|
Building and improvements
|
92,470
|
|
91,766
|
|
|||
|
Machinery and equipment
|
227,795
|
|
219,675
|
|
|||
|
Construction in progress
|
8,043
|
|
7,837
|
|
|||
|
|
332,335
|
|
323,305
|
|
|||
|
Less: Accumulated depreciation
|
(219,090
|
)
|
(207,076
|
)
|
|||
|
|
$
|
113,245
|
|
$
|
116,229
|
|
|
Internal-use software, included in gross machinery and equipment at
December 31, 2018
and
2017
was
$47.8 million
and
$45.3 million
, respectively, with related accumulated depreciation of
$34.5 million
and
$30.4 million
, respectively. Internal use software depreciation expense was
$4.7 million
,
$4.5 million
and
$4.0 million
for the years ended
December 31, 2018
,
2017
and
2016
, respectively.
57
We lease various manufacturing facilities, office facilities and equipment under operating and capital leases. Leasehold improvements related to these facilities are included in building and improvements above. Rental expense on operating leases was approximately
$8.7 million
,
$6.5 million
and
$6.0 million
for the years ended
December 31, 2018
,
2017
and
2016
, respectively. During
2018
and
2017
, we entered into capital lease obligations of
$0.2 million
and
$0.8 million
in connection with the purchase of equipment.
The aggregate future minimum lease commitments for leases at
December 31, 2018
are as follows:
|
Operating
Leases
|
Capital
Leases
|
|||||
|
2019
|
$
|
8,759
|
|
$
|
347
|
|
|
2020
|
5,520
|
|
217
|
|
||
|
2021
|
2,929
|
|
21
|
|
||
|
2022
|
2,406
|
|
75
|
|
||
|
2023
|
1,563
|
|
—
|
|
||
|
Thereafter
|
1,497
|
|
—
|
|
||
Note 5 – Goodwill and Other Intangible Assets
The changes in the net carrying amount of goodwill for the years ended December 31, are as follows:
|
|
2018
|
2017
|
|||||
|
Balance as of January 1,
|
$
|
401,954
|
|
$
|
397,664
|
|
|
|
Goodwill resulting from business combinations
|
—
|
|
2,209
|
|
|||
|
Foreign currency translation
|
(1,514
|
)
|
2,081
|
|
|||
|
Balance as of December 31,
|
$
|
400,440
|
|
$
|
401,954
|
|
|
During 2017, we entered into a business combination for which we recorded
$2.2 million
to goodwill. Total accumulated goodwill impairment losses aggregated
$107.0 million
at
December 31, 2018 and 2017, respectively
.
58
Other intangible assets consist of the following:
|
|
December 31, 2018
|
December 31, 2017
|
||||||||||||||
|
Weighted Average Amortization Period (Years)
|
Gross
Carrying
Amount
|
Accumulated
Amortization
|
Gross
Carrying
Amount
|
Accumulated
Amortization
|
||||||||||||
|
Intangible assets with definite lives:
|
|
|
||||||||||||||
|
Customer and distributor relationships
|
29
|
$
|
214,577
|
|
$
|
(97,131
|
)
|
$
|
214,685
|
|
$
|
(86,137
|
)
|
|||
|
|
|
|
|
|||||||||||||
|
Sales representation, marketing and promotional rights
|
25
|
149,376
|
|
(42,000
|
)
|
149,376
|
|
(36,000
|
)
|
|||||||
|
Patents and other intangible assets
|
14
|
61,473
|
|
(44,242
|
)
|
69,668
|
|
(42,127
|
)
|
|||||||
|
|
|
|
|
|||||||||||||
|
Developed technology
|
16
|
91,965
|
|
(7,369
|
)
|
62,283
|
|
(3,352
|
)
|
|||||||
|
Intangible assets with indefinite lives
:
|
|
|
|
|
|
|
|
|
||||||||
|
|
|
|
|
|||||||||||||
|
Trademarks and tradenames
|
86,544
|
|
—
|
|
86,544
|
|
—
|
|
||||||||
|
|
24
|
$
|
603,935
|
|
$
|
(190,742
|
)
|
$
|
582,556
|
|
$
|
(167,616
|
)
|
|||
On January 3, 2012, the Company entered into an agreement with MTF to obtain the right to represent, market, and promote MTF's allograft tissues within the field of sports medicine. The initial consideration from the Company included a
$63.0 million
up-front payment for the rights and certain assets, with an additional
$84.0 million
contingently payable over a
four
year period depending on MTF meeting supply targets for tissue. On January 6, 2016, we paid the final
$16.7 million
additional consideration installment.
Amortization expense related to intangible assets which are subject to amortization totaled
$23.2 million
,
$21.3 million
and
$20.0 million
for the years ending
December 31, 2018, 2017 and 2016
, respectively, and is included as a reduction of revenue (for amortization related to our sales representation, marketing and promotional rights) and in selling and administrative expense (for all other intangible assets) in the consolidated statements of comprehensive income. Included in developed technology is
$21.3 million
of earn-out consideration that was paid during 2018 and an additional accrual of
$8.4 million
that is considered probable as of
December 31, 2018
associated with a prior asset acquisition. The accrual is recorded in other current liabilities at
December 31, 2018
. This developed technology has a weighted average useful life of
15
years.
During the year ended
December 31, 2018
, the Company wrote off
$9.5 million
related to an in-process research and development asset and recorded the net charge to research and development expense. Refer to Notes 12 and 13 for further details.
The estimated amortization expense related to intangible assets at
December 31, 2018
and for each of the five succeeding years is as follows:
|
Amortization included in expense
|
Amortization recorded as a reduction of revenue
|
Total
|
|||||||
|
2019
|
17,978
|
|
6,000
|
|
$
|
23,978
|
|
||
|
2020
|
17,995
|
|
6,000
|
|
$
|
23,995
|
|
||
|
2021
|
17,042
|
|
6,000
|
|
$
|
23,042
|
|
||
|
2022
|
15,583
|
|
6,000
|
|
$
|
21,583
|
|
||
|
2023
|
14,879
|
|
6,000
|
|
$
|
20,879
|
|
||
59
Note 6 — Long Term Debt
Long-term debt consists of the following at December 31:
|
|
2018
|
2017
|
|||||
|
Revolving line of credit
|
$
|
312,000
|
|
$
|
327,000
|
|
|
|
Term loan, net of deferred debt issuance costs of $311 and $467 in 2018 and 2017, respectively
|
144,064
|
|
157,033
|
|
|||
|
Mortgage notes
|
836
|
|
2,410
|
|
|||
|
Total debt
|
456,900
|
|
486,443
|
|
|||
|
Less: Current portion
|
18,336
|
|
14,699
|
|
|||
|
Total long-term debt
|
$
|
438,564
|
|
$
|
471,744
|
|
|
On January 4, 2016, we entered into a fifth amended and restated senior credit agreement consisting of: (a) a
$175.0 million
term loan facility and (b) a
$525.0 million
revolving credit facility both expiring on January 4, 2021. The term loan is payable in quarterly installments increasing over the term of the facility. Proceeds from the term loan facility and borrowings under the revolving credit facility were used to repay the then existing senior credit agreement and to finance the acquisition of SurgiQuest. Interest rates are at LIBOR plus an interest rate margin (the total of which is equal to
4.405%
at
December 31, 2018
). For those borrowings where we elect to use the alternate base rate, the base rate is the greatest of (i) the Prime Rate, (ii) the Federal Funds Rate plus
0.50%
or (iii) the one-month Eurocurrency Rate plus
1.00%
, plus, in each case, an interest rate margin.
In conjunction with this agreement, we incurred charges included in other expense in the 2016 statement of comprehensive income related to commitment fees paid to certain of our lenders, which provided a financing commitment for the SurgiQuest acquisition totaling
$2.7 million
and recorded a loss on the early extinguishment of debt of
$0.3 million
.
There were
$144.4 million
in borrowings outstanding on the term loan as of
December 31, 2018
. There were
$312.0 million
in borrowings outstanding under the revolving credit facility as of
December 31, 2018
. Our available borrowings on the revolving credit facility at
December 31, 2018
were
$210.0 million
with approximately
$3.0 million
of the facility set aside for outstanding letters of credit.
The fifth amended and restated senior credit agreement is collateralized by substantially all of our personal property and assets. The fifth amended and restated senior credit agreement contains covenants and restrictions which, among other things, require the maintenance of certain financial ratios and restrict dividend payments and the incurrence of certain indebtedness and other activities, including acquisitions and dispositions. We were in full compliance with these covenants and restrictions as of
December 31, 2018
. We are also required, under certain circumstances, to make mandatory prepayments from net cash proceeds from any issuance of equity and asset sales.
As described in Note 17, on
February 7, 2019
we entered into a sixth amended and restated senior credit agreement consisting of: (a) a
$265.0 million
term loan facility and (b) a
$585.0 million
revolving credit facility. The revolving credit facility will terminate and the loans outstanding under the term loan facility will expire on the earlier of (i) February 7, 2024 or (ii) 91 days prior to the earliest scheduled maturity date of the
$345.0 million
in
2.625%
convertible notes due in 2024 described below, (if, as of such date, more than
$150.0 million
in aggregate principal amount of such convertible notes (or any refinancing thereof) remains outstanding). The term loan is payable in quarterly installments increasing over the term of the facility and borrowing
.
As further described in Note 17, on January 29, 2019, we issued
$345.0 million
in
2.625%
convertible notes due in 2024.
We have a mortgage note outstanding in connection with the Largo, Florida property and facilities bearing interest at
8.25%
per annum with semiannual payments of principal and interest through June 2019. The principal balance outstanding on the mortgage note aggregated
$0.8 million
at
December 31, 2018
. The mortgage note is collateralized by the Largo, Florida property and facilities.
60
The scheduled maturities of long-term debt outstanding at
December 31, 2018
are as follows:
|
2019
|
$
|
18,336
|
|
|
2020
|
17,500
|
|
|
|
2021
|
421,375
|
|
|
|
2022
|
—
|
|
|
|
2023
|
—
|
|
|
|
Thereafter
|
—
|
|
|
Note 7 — Income Taxes
The provision (benefit) for income taxes for the years ended
December 31, 2018
,
2017
and
2016
consists of the following:
|
|
2018
|
2017
|
2016
|
||||||||
|
Current tax expense:
|
|
||||||||||
|
Federal
|
$
|
(1,077
|
)
|
$
|
1,744
|
|
$
|
312
|
|
||
|
State
|
777
|
|
2,101
|
|
159
|
|
|||||
|
Foreign
|
8,036
|
|
9,421
|
|
7,111
|
|
|||||
|
|
7,736
|
|
13,266
|
|
7,582
|
|
|||||
|
Deferred income tax expense (benefit)
|
2,063
|
|
(40,021
|
)
|
(2,871
|
)
|
|||||
|
Provision (benefit) for income taxes
|
$
|
9,799
|
|
$
|
(26,755
|
)
|
$
|
4,711
|
|
||
61
A reconciliation between income taxes computed at the statutory federal rate and the provision (benefit) for income taxes for the years ended
December 31, 2018
,
2017
and
2016
follows:
|
|
2018
|
2017
|
2016
|
|||||
|
Tax provision at statutory rate based on income before income taxes
|
21.0
|
%
|
35.0
|
%
|
35.0
|
%
|
||
|
US tax reform
|
1.8
|
|
(111.0
|
)
|
—
|
|
||
|
International tax reform
|
(3.6
|
)
|
—
|
|
—
|
|
||
|
Consolidated group restructuring
|
—
|
|
(7.4
|
)
|
—
|
|
||
|
Foreign income taxes
|
3.6
|
|
(5.3
|
)
|
(6.8
|
)
|
||
|
Federal research credit
|
(2.8
|
)
|
(2.8
|
)
|
(5.6
|
)
|
||
|
Settlement of taxing authority examinations
|
(0.7
|
)
|
(2.1
|
)
|
(3.5
|
)
|
||
|
Stock-based compensation
|
(1.6
|
)
|
(2.1
|
)
|
—
|
|
||
|
European permanent deduction
|
(0.2
|
)
|
(0.5
|
)
|
(3.4
|
)
|
||
|
Non deductible/non-taxable items
|
(1.2
|
)
|
(0.5
|
)
|
7.2
|
|
||
|
State income taxes, net of federal tax benefit
|
1.6
|
|
2.8
|
|
1.7
|
|
||
|
US tax on worldwide earnings at different rates
|
2.9
|
|
—
|
|
—
|
|
||
|
Other, net
|
(1.5
|
)
|
0.8
|
|
(0.3
|
)
|
||
|
|
19.3
|
%
|
(93.1
|
)%
|
24.3
|
%
|
||
The 2017 Tax Cuts and Jobs Act ("Tax Reform") was enacted on December 22, 2017. The Tax Reform included a number of changes in existing tax law impacting businesses, including a one-time deemed repatriation of cumulative undistributed foreign earnings and a permanent reduction in the U.S. federal statutory rate from
35%
to
21%
, effective on January 1, 2018. Under U.S. GAAP, changes in tax rates and tax law were accounted for in 2017, the period of enactment, and deferred tax assets and liabilities were measured at the enacted tax rate. The 2017 rate reconciliation included the Company’s assessment of the accounting under the Tax Reform which was preliminary based on information that was available to management at the time the consolidated financial statements were prepared. Estimated provisional amounts were recorded for the deemed repatriation toll charge implemented by the Tax Reform, related foreign tax credits, deferred tax revaluation amounts and deferred tax liabilities on unremitted earnings. Accordingly, the Company had determined a preliminary
$31.9 million
of tax benefit related to Tax Reform.
Staff Accounting Bulletin No. 118 provided for a one-year measurement period to finalize these estimated provisional amounts. During 2018, the Company finalized its accounting and recorded
$1.3 million
of tax expense related to the revaluation of certain deferred tax items. This expense was offset in part by
$0.4 million
of tax benefit primarily resulting from finalization of the deemed repatriation toll charge, related foreign tax credits and adjustments to foreign withholding amounts. The final tax benefit related to Tax Reform was
$31.0 million
.
FASB Staff Q&A, Topic 740, No. 5, Accounting for Global Intangible Low-Taxed Income, ("GILTI") allows for an election to account for GILTI under the deferred method, which requires recognizing deferred taxes for basis differences which will impact the GILTI inclusion upon reversal, or as a period cost. The Company has completed its evaluation of this election to account for GILTI and has adopted the period cost method. The net impact of GILTI including the allowable GILTI deduction
62
is presented in the rate reconciliation as a component of “US tax on worldwide earnings at different rates” and is offset in part by the Foreign Derived Intangible Income deduction (“FDII”).
The tax effects of the significant temporary differences which comprise the deferred income tax assets and liabilities at
December 31, 2018
and
2017
are as follows:
|
|
2018
|
2017
|
|||||
|
Assets:
|
|
||||||
|
Inventory
|
$
|
4,096
|
|
$
|
2,420
|
|
|
|
Net operating losses
|
7,358
|
|
11,091
|
|
|||
|
Capitalized research and development
|
7,214
|
|
8,557
|
|
|||
|
Deferred compensation
|
2,085
|
|
1,749
|
|
|||
|
Accounts receivable
|
2,296
|
|
1,855
|
|
|||
|
Compensation and benefits
|
5,434
|
|
4,138
|
|
|||
|
Accrued pension
|
3,205
|
|
2,695
|
|
|||
|
Research and development credit
|
8,585
|
|
8,957
|
|
|||
|
Other
|
2,235
|
|
9,342
|
|
|||
|
Less: valuation allowances
|
(1,159
|
)
|
(570
|
)
|
|||
|
41,349
|
|
50,234
|
|
||||
|
Liabilities:
|
|
|
|||||
|
Goodwill and intangible assets
|
100,108
|
|
102,099
|
|
|||
|
Depreciation
|
1,345
|
|
3,333
|
|
|||
|
State taxes
|
12,212
|
|
11,709
|
|
|||
|
Unremitted foreign earnings
|
3,583
|
|
6,000
|
|
|||
|
Contingent interest
|
—
|
|
40
|
|
|||
|
|
117,248
|
|
123,181
|
|
|||
|
Net liability
|
$
|
(75,899
|
)
|
$
|
(72,947
|
)
|
|
Income before income taxes consists of the following U.S. and foreign income:
|
|
2018
|
2017
|
2016
|
||||||||
|
U.S. income (loss)
|
$
|
24,320
|
|
$
|
1,492
|
|
$
|
(6,128
|
)
|
||
|
Foreign income
|
26,333
|
|
27,240
|
|
25,503
|
|
|||||
|
Total income
|
$
|
50,653
|
|
$
|
28,732
|
|
$
|
19,375
|
|
||
As of
December 31, 2018
, the amount of federal net operating loss carryforward was
$29.5 million
and begins to expire in 2026. As of
December 31, 2018
, the amount of federal research credit carryforward available was
$8.6 million
. These credits begin to expire in 2027.
In accordance with Tax Reform and SAB 118 measurement period adjustments, the Company has finalized the federal and state tax liabilities accrued on cumulative foreign subsidiary earnings at December 31, 2017. In addition, we have accrued a liability for foreign withholding taxes related to the amount of unremitted earnings at December 31, 2017 as they are not considered permanently reinvested. However, it is our intention to indefinitely reinvest all future foreign earnings for all periods occurring after December 31, 2017. The amount of such untaxed foreign earnings for the periods occurring after December 2017 totaled
$18.4 million
. If we were to repatriate these funds, we would be required to accrue and pay taxes on such amounts. The Company has estimated foreign withholding taxes of
$0.6 million
would be due if these earnings were repatriated.
The Company is subject to taxation in the United States and various states and foreign jurisdictions. Taxing authority examinations can involve complex issues and may require an extended period of time to resolve. Our federal income tax returns have been examined by the Internal Revenue Service (“IRS”) for calendar years ending through 2016.
63
We recognize tax liabilities in accordance with the provisions for accounting for uncertainty in income taxes. Such guidance prescribes a recognition threshold and measurement attribute for the financial statement recognition and measurement of a tax position taken or expected to be taken in a tax return.
The following table summarizes the activity related to our unrecognized tax benefits for the years ending December 31,:
|
|
2018
|
2017
|
2016
|
||||||||
|
Balance as of January 1,
|
$
|
2,943
|
|
$
|
1,839
|
|
$
|
616
|
|
||
|
Increases (decreases) for positions taken in prior periods
|
(250
|
)
|
(246
|
)
|
—
|
|
|||||
|
Increases for positions taken in current periods
|
1,017
|
|
1,957
|
|
1,584
|
|
|||||
|
Decreases in unrecorded tax positions related to settlement with the taxing authorities
|
(370
|
)
|
(607
|
)
|
(361
|
)
|
|||||
|
Decreases in unrecorded tax positions related to lapse of statute of limitations
|
(267
|
)
|
—
|
|
—
|
|
|||||
|
Balance as of December 31,
|
$
|
3,073
|
|
$
|
2,943
|
|
$
|
1,839
|
|
||
If the total unrecognized tax benefits of
$3.1 million
at
December 31, 2018
were recognized, it would reduce our annual effective tax rate. The amount of interest accrued in
2016
,
2017
and
2018
related to these unrecognized tax benefits was not material and is included in the provision (benefit) for income taxes in the consolidated statements of comprehensive income.
Note 8 – Shareholders’ Equity
On February 29, 2012, the Board of Directors adopted a cash dividend policy and declared an initial quarterly dividend of
$0.15
per share. On October 28, 2013, the Board of Directors increased the quarterly dividend to
$0.20
per share. The total dividend per share was
$0.80
for each of 2018, 2017 and 2016. The fourth quarter dividend for
2018
was paid on
January 7, 2019
to shareholders of record as of
December 14, 2018
. The total dividend payable was
$5.6 million
at both
December 31, 2018 and 2017
, and is included in other current liabilities in the consolidated balance sheet.
Our shareholders have authorized
500,000
shares of preferred stock, par value
$.01
per share, which may be issued in one or more series by the Board of Directors without further action by the shareholders. As of
December 31, 2018
and
2017
, no preferred stock had been issued.
Our Board of Directors has authorized a
$200.0 million
share repurchase program. Through
December 31, 2018
, we have repurchased a total of
6.1 million
shares of common stock aggregating
$162.6 million
under this authorization and have
$37.4 million
remaining available for share repurchases. The repurchase program calls for shares to be purchased in the open market or in private transactions from time to time. We may suspend or discontinue the share repurchase program at any time. During
2018
,
2017
, and
2016
we did not repurchase any shares.
We have reserved
13.3 million
shares of common stock for issuance to employees and directors under
two
shareholder approved share-based compensation plans (the "Plans") of which approximately
4.7 million
shares remain available for grant at
December 31, 2018
. The exercise price on all outstanding stock options and stock appreciation rights (“SARs”) is equal to the quoted fair market value of the stock at the date of grant. Restricted stock units (“RSUs”) and performance stock units (“PSUs”) are valued at the market value of the underlying stock on the date of grant. Stock options, SARs, RSUs and PSUs are non-transferable other than on death and generally become exercisable over a
four
to
five
year period from date of grant. Stock options and SARs expire
ten
years from date of grant. SARs are only settled in shares of the Company’s stock. The issuance of shares pursuant to the exercise of stock options and SARs and vesting of RSUs and PSUs are from the Company’s treasury stock.
Total pre-tax stock-based compensation expense recognized in the consolidated statements of comprehensive income was
$10.0 million
,
$8.5 million
and
$8.4 million
for the years ended
December 31, 2018
,
2017
and
2016
, respectively. These amounts are included in selling and administrative expenses, and in 2016
$0.7 million
of the total relates to acceleration of awards associated with the Company's restructuring as further described in Note 13. Tax related benefits of
$2.3 million
,
$2.0 million
64
and
$3.1 million
were also recognized for the years ended
December 31, 2018
,
2017
and
2016
, respectively. Cash received from the exercise of stock options was
$3.5 million
,
$1.0 million
and
$0.0 million
for the years ended
December 31, 2018
,
2017
and
2016
, respectively, and is reflected in cash flows from financing activities in the consolidated statements of cash flows.
The Company uses the Black-Scholes option pricing model to estimate the fair value of stock options and SARs at the date of grant. Use of a valuation model requires management to make certain assumptions with respect to select model inputs. Expected volatilities are based upon historical volatility of the Company’s stock over a period equal to the expected life of each stock option and SAR grant. The risk free interest rate is based on the stock option and SAR grant date for a traded U.S. Treasury bond with a maturity date closest to the expected life. The expected annual dividend yield is based on the Company's anticipated cash dividend payouts. The expected life represents the period of time that the stock options and SARs are expected to be outstanding based on a study of historical data of option holder exercise and termination behavior. Forfeitures are recognized as incurred.
The following table illustrates the assumptions used in estimating fair value in the years ended
December 31, 2018
,
2017
and
2016
:
|
2018
|
2017
|
2016
|
|||||||||
|
Grant date fair value of stock options and SARs
|
$
|
14.78
|
|
$
|
10.07
|
|
$
|
8.61
|
|
||
|
Expected stock price volatility
|
25.69
|
%
|
27.63
|
%
|
26.88
|
%
|
|||||
|
Risk-free interest rate
|
2.62
|
%
|
2.11
|
%
|
1.45
|
%
|
|||||
|
Expected annual dividend yield
|
1.34
|
%
|
1.87
|
%
|
2.10
|
%
|
|||||
|
Expected life of options & SARs (years)
|
5.7
|
|
5.8
|
|
6.0
|
|
|||||
The following table illustrates the stock option and SAR activity for the year ended
December 31, 2018
:
|
Number
of
Shares
(in 000’s)
|
Weighted-
Average
Exercise
Price
|
|||||
|
Outstanding at December 31, 2017
|
2,308
|
|
$
|
42.75
|
|
|
|
Granted
|
839
|
|
$
|
59.64
|
|
|
|
Forfeited
|
(123
|
)
|
$
|
44.59
|
|
|
|
Exercised
|
(173
|
)
|
$
|
42.20
|
|
|
|
Outstanding at December 31, 2018
|
2,851
|
|
$
|
47.67
|
|
|
|
Exercisable at December 31, 2018
|
797
|
|
$
|
43.23
|
|
|
|
Stock options & SARs expected to vest
|
2,053
|
|
$
|
49.40
|
|
|
The weighted average remaining contractual term for SARs and stock options outstanding and exercisable at
December 31, 2018
was
7.8
years and
6.7
years, respectively. The aggregate intrinsic value of SARs and stock options outstanding and exercisable at
December 31, 2018
was
$47.2 million
and
$16.7 million
, respectively. The aggregate intrinsic value of stock options and SARs exercised during the years ended
December 31, 2018
,
2017
and
2016
was
$4.2 million
,
$2.7 million
and
$1.4 million
, respectively.
The following table illustrates the RSU and PSU activity for the year ended
December 31, 2018
:
|
Number
of
Shares
(in 000’s)
|
Weighted-
Average
Grant-Date
Fair Value
|
|||||
|
Outstanding at December 31, 2017
|
228
|
|
$
|
41.66
|
|
|
|
Granted
|
31
|
|
$
|
61.76
|
|
|
|
Vested
|
(66
|
)
|
$
|
45.81
|
|
|
|
Forfeited
|
(6
|
)
|
$
|
45.03
|
|
|
|
Outstanding at December 31, 2018
|
187
|
|
$
|
43.46
|
|
|
65
The weighted average fair value of awards of RSUs granted in the years ended
December 31, 2018
,
2017
and
2016
was
$61.76
,
$48.32
and
$40.27
, respectively.
The total fair value of RSUs and PSUs vested was
$3.0 million
,
$3.4 million
and
$4.7 million
for the years ended
December 31, 2018
,
2017
and
2016
, respectively.
As of
December 31, 2018
, there was
$21.3 million
of total unrecognized compensation cost related to nonvested stock options, SARs, RSUs and PSUs granted under the Plans which is expected to be recognized over a weighted average period of
3.3
years.
We offer to our employees a shareholder-approved Employee Stock Purchase Plan (the “Employee Plan”), under which we have reserved
1.0 million
shares of common stock for issuance to our employees. The Employee Plan provides employees with the opportunity to invest from
1%
to
10%
of their annual salary to purchase shares of CONMED common stock at a purchase price equal to
95%
of the fair market value of the common stock on the exercise date. During
2018
, we issued approximately
16,800
shares of common stock under the Employee Plan. No stock-based compensation expense has been recognized in the accompanying consolidated financial statements as a result of common stock issuances under the Employee Plan.
Note 9 — Revenues
The following tables present revenue disaggregated by product line and timing of revenue recognition for the years ended
December 31, 2018, 2017 and 2016
:
|
2018
|
|||||||||||
|
|
Orthopedic Surgery
|
General Surgery
|
Total
|
||||||||
|
Timing of Revenue Recognition
|
|||||||||||
|
Goods transferred at a point in time
|
$
|
413,630
|
|
$
|
411,391
|
|
$
|
825,021
|
|
||
|
Services transferred over time
|
33,098
|
|
1,515
|
|
34,613
|
|
|||||
|
Total sales from contracts with customers
|
$
|
446,728
|
|
$
|
412,906
|
|
$
|
859,634
|
|
||
|
2017
|
|||||||||||
|
|
Orthopedic Surgery
|
General Surgery
|
Total
|
||||||||
|
Timing of Revenue Recognition
|
|||||||||||
|
Goods transferred at a point in time
|
$
|
396,147
|
|
$
|
366,672
|
|
$
|
762,819
|
|
||
|
Services transferred over time
|
32,797
|
|
776
|
|
33,573
|
|
|||||
|
Total sales from contracts with customers
|
$
|
428,944
|
|
$
|
367,448
|
|
$
|
796,392
|
|
||
|
2016
|
|||||||||||
|
|
Orthopedic Surgery
|
General Surgery
|
Total
|
||||||||
|
Timing of Revenue Recognition
|
|||||||||||
|
Goods transferred at a point in time
|
$
|
391,114
|
|
$
|
341,276
|
|
$
|
732,390
|
|
||
|
Services transferred over time
|
30,989
|
|
141
|
|
31,130
|
|
|||||
|
Total sales from contracts with customers
|
$
|
422,103
|
|
$
|
341,417
|
|
$
|
763,520
|
|
||
Revenue disaggregated by primary geographic market where the products are sold is included in Note 10.
Contract liability balances related to the sale of extended warranties to customers are as follows:
|
December 31, 2018
|
December 31, 2017
|
||||||
|
Contract Liability
|
$
|
11,043
|
|
$
|
7,786
|
|
|
66
Revenue recognized during years ended
December 31, 2018
,
2017
and
2016
from amounts included in contract liabilities at the beginning of the period were
$5.0 million
,
$3.9 million
and
$3.5 million
, respectively. There were no material contract assets as of
December 31, 2018
and
December 31, 2017
.
Note 10 — Business Segments and Geographic Areas
We are accounting and reporting for our business as a single operating segment entity engaged in the development, manufacturing and sale on a global basis of surgical devices and related equipment. Our chief operating decision maker (the CEO) evaluates the various global product portfolios on a net sales basis and evaluates profitability, investment, cash flow metrics and allocates resources on a consolidated worldwide basis due to shared infrastructure and resources. Our product lines consist of orthopedic surgery and general surgery. Orthopedic surgery consists of sports medicine instrumentation and small bone, large bone and specialty powered surgical instruments as well as imaging systems for use in minimally invasive surgery procedures including 2DHD and 3DHD vision technologies and fees related to sales representation, promotion and marketing of sports medicine allograft tissue. General surgery consists of a complete line of endo-mechanical instrumentation for minimally invasive laparoscopic and gastrointestinal procedures, a line of cardiac monitoring products as well as electrosurgical generators and related instruments. These product lines' net sales and primary geographic market where the products are sold, are as follows for the years ended
December 31, 2018, 2017 and 2016
:
|
2018
|
|||||||||||
|
|
Orthopedic Surgery
|
General Surgery
|
Total
|
||||||||
|
Primary Geographic Markets
|
|||||||||||
|
United States
|
$
|
172,462
|
|
$
|
276,186
|
|
$
|
448,648
|
|
||
|
Americas (excluding the United States)
|
66,519
|
|
31,009
|
|
97,528
|
|
|||||
|
Europe, Middle East & Africa
|
112,998
|
|
53,565
|
|
166,563
|
|
|||||
|
Asia Pacific
|
94,749
|
|
52,146
|
|
146,895
|
|
|||||
|
Total sales from contracts with customers
|
$
|
446,728
|
|
$
|
412,906
|
|
$
|
859,634
|
|
||
|
2017
|
|||||||||||
|
|
Orthopedic Surgery
|
General Surgery
|
Total
|
||||||||
|
Primary Geographic Markets
|
|||||||||||
|
United States
|
$
|
167,602
|
|
$
|
243,439
|
|
$
|
411,041
|
|
||
|
Americas (excluding the United States)
|
60,439
|
|
30,730
|
|
91,169
|
|
|||||
|
Europe, Middle East & Africa
|
106,921
|
|
48,928
|
|
155,849
|
|
|||||
|
Asia Pacific
|
93,982
|
|
44,351
|
|
138,333
|
|
|||||
|
Total sales from contracts with customers
|
$
|
428,944
|
|
$
|
367,448
|
|
$
|
796,392
|
|
||
|
2016
|
|||||||||||
|
|
Orthopedic Surgery
|
General Surgery
|
Total
|
||||||||
|
Primary Geographic Markets
|
|||||||||||
|
United States
|
$
|
171,158
|
|
$
|
227,949
|
|
$
|
399,107
|
|
||
|
Americas (excluding the United States)
|
56,773
|
|
30,759
|
|
87,532
|
|
|||||
|
Europe, Middle East & Africa
|
103,709
|
|
44,276
|
|
147,985
|
|
|||||
|
Asia Pacific
|
90,463
|
|
38,433
|
|
128,896
|
|
|||||
|
Total sales from contracts with customers
|
$
|
422,103
|
|
$
|
341,417
|
|
$
|
763,520
|
|
||
Sales are attributed to countries based on the location of the customer. There were no significant investments in long-lived assets located outside the United States at
December 31, 2018
and
2017
.
No
single customer represented over
10%
of our consolidated net sales for the years ended
December 31, 2018
,
2017
and
2016
.
67
Note 11 — Employee Benefit Plans
We sponsor an employee savings plan (“401(k) plan”) covering substantially all of our United States based employees. We also sponsor a defined benefit pension plan (the “pension plan”) that was frozen in 2009. It covered substantially all our United States based employees at the time it was frozen.
Total employer contributions to the 401(k) plan were
$8.3 million
,
$7.5 million
and
$7.1 million
during the years ended
December 31, 2018
,
2017
and
2016
, respectively.
We use a December 31, measurement date for our pension plan.
Cumulative gains and losses in excess of 10% of the greater of the benefit obligation or the market-related value of assets are amortized on a straight-line basis over the lesser of the expected average remaining life expectancy of the plan's participants or
12
years. The limit of
12
years is adjusted to reflect the percentage change in the average remaining service period for the plan's active membership.
The following table provides a reconciliation of the projected benefit obligation, plan assets and funded status of the pension plan at December 31:
|
|
2018
|
2017
|
|||||
|
Accumulated benefit obligation
|
$
|
80,776
|
|
$
|
87,765
|
|
|
|
Change in benefit obligation
|
|
|
|
|
|||
|
Projected benefit obligation at beginning of year
|
$
|
87,765
|
|
$
|
82,005
|
|
|
|
Service cost
|
675
|
|
603
|
|
|||
|
Interest cost
|
2,806
|
|
2,773
|
|
|||
|
Actuarial gain (loss)
|
(7,430
|
)
|
6,556
|
|
|||
|
Benefits paid
|
(2,104
|
)
|
(1,976
|
)
|
|||
|
Settlements
|
(936
|
)
|
(2,196
|
)
|
|||
|
Projected benefit obligation at end of year
|
$
|
80,776
|
|
$
|
87,765
|
|
|
|
Change in plan assets
|
|
|
|
|
|||
|
Fair value of plan assets at beginning of year
|
$
|
74,932
|
|
$
|
69,061
|
|
|
|
Actual gain (loss) on plan assets
|
(5,585
|
)
|
10,043
|
|
|||
|
Benefits paid
|
(2,104
|
)
|
(1,976
|
)
|
|||
|
Settlements
|
(936
|
)
|
(2,196
|
)
|
|||
|
Fair value of plan assets at end of year
|
$
|
66,307
|
|
$
|
74,932
|
|
|
|
Funded status
|
$
|
(14,469
|
)
|
$
|
(12,833
|
)
|
|
Amounts recognized in the consolidated balance sheets consist of the following at December 31,:
|
|
2018
|
2017
|
|||||
|
Other long-term liabilities
|
$
|
(14,469
|
)
|
$
|
(12,833
|
)
|
|
|
Accumulated other comprehensive loss
|
(41,822
|
)
|
(40,937
|
)
|
|||
Accumulated other comprehensive loss for the years ended
December 31, 2018
and
2017
consists of net actuarial losses not yet recognized in net periodic pension cost (before income taxes).
The following actuarial assumptions were used to determine our accumulated and projected benefit obligations as of December 31,:
|
|
2018
|
2017
|
|||
|
Discount rate
|
4.37
|
%
|
3.69
|
%
|
|
68
Other changes in plan assets and benefit obligations recognized in other comprehensive income in
2018
and
2017
are as follows:
|
2018
|
2017
|
||||||
|
Current year actuarial loss
|
$
|
(3,574
|
)
|
$
|
(1,812
|
)
|
|
|
Amortization of actuarial loss
|
2,689
|
|
2,835
|
|
|||
|
Total recognized in other comprehensive loss
|
$
|
(885
|
)
|
$
|
1,023
|
|
|
The estimated portion of net actuarial loss in accumulated other comprehensive loss that is expected to be recognized as a component of net periodic pension cost in
2019
is
$2.9 million
.
Net periodic pension cost for the years ended December 31, consists of the following:
|
|
2018
|
2017
|
2016
|
||||||||
|
Service cost
|
$
|
675
|
|
$
|
603
|
|
$
|
452
|
|
||
|
Interest cost on projected benefit obligation
|
2,806
|
|
2,773
|
|
2,878
|
|
|||||
|
Expected return on plan assets
|
(5,418
|
)
|
(5,300
|
)
|
(5,189
|
)
|
|||||
|
Amortization of loss
|
2,689
|
|
2,835
|
|
2,780
|
|
|||||
|
Net periodic pension cost
|
$
|
752
|
|
$
|
911
|
|
$
|
921
|
|
||
The following actuarial assumptions were used to determine our net periodic pension benefit cost for the years ended December 31,:
|
|
2018
|
2017
|
2016
|
|||||
|
Discount rate on benefit obligation
|
3.69
|
%
|
4.28
|
%
|
4.54
|
%
|
||
|
Effective rate for interest on benefit obligation
|
3.28
|
%
|
3.49
|
%
|
3.77
|
%
|
||
|
Expected return on plan assets
|
7.50
|
%
|
8.00
|
%
|
8.00
|
%
|
||
We use a full yield curve approach in the estimation of the interest cost component of net periodic pension cost by applying the specific spot rates along the yield curve used in the determination of the benefit obligation that correlates to the relevant projected cash flows ("spot rate approach").
In determining the expected return on pension plan assets, we consider the relative weighting of plan assets, the historical performance of total plan assets and individual asset classes and economic and other indicators of future performance. In addition, we consult with financial and investment management professionals in developing appropriate targeted rates of return.
Asset management objectives include maintaining an adequate level of diversification to reduce interest rate and market risk and providing adequate liquidity to meet immediate and future benefit payment requirements.
The allocation of pension plan assets by category is as follows at December 31,:
|
Percentage of Pension
Plan Assets
|
Target
Allocation
|
|||||||
|
|
2018
|
2017
|
2019
|
|||||
|
Equity securities
|
71
|
%
|
87
|
%
|
70
|
%
|
||
|
Debt securities
|
29
|
|
13
|
|
30
|
|
||
|
Total
|
100
|
%
|
100
|
%
|
100
|
%
|
||
As of
December 31, 2018
, the pension plan held
27,562
shares of our common stock, which had a fair value of
$1.8 million
. We believe that our long-term asset allocation on average will approximate the targeted allocation. We regularly review
69
our actual asset allocation and periodically rebalance the pension plan’s investments to our targeted allocation when deemed appropriate.
FASB guidance defines fair value and establishes a framework for measuring fair value and related disclosure requirements as described in Note 15. Following is a description of the valuation methodologies used for our pension assets. There have been no changes in the methodologies used at
December 31, 2018
and
2017
:
|
Common Stock:
|
Common stock is valued at the closing price reported on the common stock’s respective stock exchange and is classified within level 1 of the valuation hierarchy.
|
|
|
|
|
Fixed Income Securities:
|
Valued at the closing price reported on the active market on which the individual securities are traded and are classified within level 1 of the valuation hierarchy.
|
|
Money Market Fund:
|
These investments are public investment vehicles valued using the Net Asset Value (NAV).
|
|
Mutual Funds:
|
These investments are public investment vehicles valued using the Net Asset Value (NAV) provided by the administrator of the fund. The NAV is based on the value of the underlying assets owned by the fund, minus its liabilities, and then divided by the number of shares outstanding.
|
The methods described above may produce a fair value calculation that may not be indicative of net realizable value or reflective of future fair values. Furthermore, while the pension plan believes its valuation methods are appropriate and consistent with other market participants, the use of different methodologies or assumptions to determine the fair value of certain financial instruments could result in a different fair value measurement at the reporting date.
The following table sets forth the value of the pension plan's assets as of
December 31, 2018
and
December 31, 2017
:
|
2018
|
2017
|
||||||
|
Investments measured at fair value:
|
|||||||
|
Level 1
|
|||||||
|
Common Stock
|
$
|
6,362
|
|
$
|
36,643
|
|
|
|
Fixed Income Securities
|
17,640
|
|
7,974
|
|
|||
|
Total Investments measured at fair value
|
24,002
|
|
44,617
|
|
|||
|
Investments measured at NAV:
|
|||||||
|
Money Market Fund
|
1,385
|
|
1,517
|
|
|||
|
Mutual Funds
|
40,920
|
|
28,798
|
|
|||
|
Total Investments measured at NAV
|
42,305
|
|
30,315
|
|
|||
|
Total Investments
|
$
|
66,307
|
|
$
|
74,932
|
|
|
We do not expect to make any contributions to our pension plan for
2019
.
The following table summarizes the benefits and settlements expected to be paid by our pension plan in each of the next five years and in aggregate for the following five years. The expected payments are estimated based on the same assumptions used to measure the Company’s projected benefit obligation at
December 31, 2018
and reflect the impact of expected future employee service.
|
2019
|
|
$5,602
|
|
|
2020
|
5,651
|
|
|
|
2021
|
4,901
|
|
|
|
2022
|
5,249
|
|
|
|
2023
|
5,294
|
|
|
|
2024-2028
|
25,688
|
|
|
70
Note 12 — Legal Matters and Contingencies
From time to time, we are subject to claims alleging product liability, patent infringement or other claims incurred in the ordinary course of business. These may involve our United States or foreign operations, or sales by foreign distributors. Likewise, from time to time, the Company may receive an information request or subpoena from a government agency such as the Securities and Exchange Commission, Department of Justice, Equal Employment Opportunity Commission, the Occupational Safety and Health Administration, the Department of Labor, the Treasury Department or other federal and state agencies or foreign governments or government agencies. These information requests or subpoenas may or may not be routine inquiries, or may begin as routine inquiries and over time develop into enforcement actions of various types. Likewise, we receive reports of alleged misconduct from employees and third parties, which we investigate as appropriate.
Manufacturers of medical devices have been the subject of various enforcement actions relating to interactions with health care providers domestically or internationally whereby companies are claimed to have provided health care providers with inappropriate incentives to purchase their products. Similarly, the Foreign Corrupt Practices Act ("FCPA") imposes obligations on manufacturers with respect to interactions with health care providers who may be considered government officials based on their affiliation with public hospitals. The FCPA also requires publicly listed manufacturers to maintain accurate books and records, and maintain internal accounting controls sufficient to provide assurance that transactions are accurately recorded, lawful and in accordance with management's authorization. The FCPA poses unique challenges both because manufacturers operate in foreign cultures in which conduct illegal under the FCPA may not be illegal in local jurisdictions, and because, in some cases, a United States manufacturer may face risks under the FCPA based on the conduct of third parties over whom the manufacturer may not have complete control. While CONMED has not experienced any material enforcement action to date, there can be no assurance that the Company will not be subject to a material enforcement action in the future, or that the Company will not incur costs including, in the form of fees for lawyers and other consultants, that are material to the Company’s results of operations in the course of responding to a future inquiry or investigation.
Manufacturers of medical products may face exposure to significant product liability claims. To date, we have not experienced any product liability claims that have been material to our financial statements or financial condition, but any such claims arising in the future could have a material adverse effect on our business, results of operations or cash flows. We currently maintain commercial product liability insurance of
$30 million
per incident and
$30 million
in the aggregate annually, which we believe is adequate. This coverage is on a claims-made basis. There can be no assurance that claims will not exceed insurance coverage, that the carriers will be solvent or that such insurance will be available to us in the future at a reasonable cost.
We record reserves sufficient to cover probable and estimable losses associated with any such pending claims. We do not expect that the resolution of any pending claims, investigations or reports of alleged misconduct will have a material adverse effect on our financial condition, results of operations or cash flows. There can be no assurance, however, that future claims or investigations, or the costs associated with responding to such claims, investigations or reports of misconduct, especially claims and investigations not covered by insurance, will not have a material adverse effect on our financial condition, results of operations or cash flows.
Our operations are subject, and in the past have been subject, to a number of environmental laws and regulations governing, among other things, air emissions; wastewater discharges; the use, handling and disposal of hazardous substances and wastes; soil and groundwater remediation and employee health and safety. In some jurisdictions, environmental requirements may be expected to become more stringent in the future. In the United States, certain environmental laws can impose liability for the entire cost of site restoration upon each of the parties that may have contributed to conditions at the site regardless of fault or the lawfulness of the party’s activities. While we do not believe that the present costs of environmental compliance and remediation are material, there can be no assurance that future compliance or remedial obligations would not have a material adverse effect on our financial condition, results of operations or cash flows.
In April 2017, the previously disclosed lawsuit involving a false advertising claim by Lexion Medical ("Lexion") against SurgiQuest arising prior to the acquisition of SurgiQuest by CONMED went to trial in federal court in the District of Delaware. The claims arose under the Lanham Act, as well as Delaware state laws. Lexion sought damages of
$22.0 million
for alleged lost profits and
$18.7 million
for costs related to alleged “corrective advertising,” as well as damages claimed for disgorgement of SurgiQuest’s alleged profits and attorneys' fees. On January 4, 2016, SurgiQuest became a subsidiary of CONMED, and we assumed the costs and liabilities related to the Lexion lawsuit subject to the terms of the merger agreement. On April 11, 2017, a jury returned a verdict finding SurgiQuest liable for
$2.2 million
in compensatory damages with an additional
$10.0 million
in punitive damages. These costs were recorded in selling and administrative expense during 2017. The District Court entered judgment on April 13, 2017. SurgiQuest and Lexion each filed post-verdict motions. Lexion sought an equitable award for disgorgement of SurgiQuest’s alleged profits, for so-called corrective advertising and for attorney’s fees. CONMED sought to
71
vacate the award of punitive damages. By memorandum decision dated
May 16, 2018
, the District Court denied both Lexion's and SurgiQuest's post-verdict motions. The period within which either Lexion or SurgiQuest was able to pursue an appeal expired in June without either party seeking to appeal the judgment. CONMED paid the judgment, together with post-judgment interest, in a total amount of
$12.3 million
on
July 10, 2018
.
In 2014, the Company acquired EndoDynamix, Inc. The agreement governing the terms of the acquisition provides that, if various conditions are met, certain contingent payments relating to the first commercial sale of the products (the milestone payment), as well as royalties based on sales (the revenue based payments), are due to the seller. In 2016, we notified the seller that there was a need to redesign the product, and that, as a consequence, the first commercial sale had been delayed. Consequently, the payment of contingent milestone and revenue-based payments were delayed. On January 18, 2017, the seller provided notice ("the Notice") seeking
$12.7 million
, which essentially represents the seller’s view as to the sum of the projected contingent milestone and revenue-based payments on an accelerated basis. CONMED responded to the Notice denying that there was any basis for acceleration of the payments due under the acquisition agreement. On February 22, 2017, the representative of the former shareholders of EndoDynamix filed a complaint in Delaware Chancery Court claiming breach of contract with respect to the duty to commercialize the product and seeking the contingent payments on an accelerated basis. We believe that there was a substantive contractual basis to support the Company’s decision to redesign the product, such that there was no legitimate basis for seeking the acceleration of the contingent payments at that time. The Company recently decided to halt the development of the EndoDynamix clip applier. While we recorded a charge to write off assets and released previously accrued contingent consideration as described in Note 13, we expect to defend the claims asserted by the sellers of EndoDynamix in the Delaware Court, although there can be no assurance that we will prevail in the litigation.
Note 13 — Acquisition, Restructuring and Other Expense
Acquisition, restructuring and other expense for the year ended December 31, consists of the following:
|
|
2018
|
2017
|
2016
|
||||||||
|
Consolidation costs
|
$
|
—
|
|
$
|
2,903
|
|
$
|
3,066
|
|
||
|
Termination of a product offering
|
—
|
|
—
|
|
4,546
|
|
|||||
|
Restructuring costs included in cost of sales
|
$
|
—
|
|
$
|
2,903
|
|
$
|
7,612
|
|
||
|
Business acquisition costs
|
$
|
2,372
|
|
$
|
2,336
|
|
$
|
17,029
|
|
||
|
Restructuring costs
|
—
|
|
1,347
|
|
6,670
|
|
|||||
|
Legal matters
|
—
|
|
17,480
|
|
3,773
|
|
|||||
|
Gain on sale of facility
|
—
|
|
—
|
|
(1,890
|
)
|
|||||
|
Acquisition, restructuring and other expense included in selling and administrative expense
|
$
|
2,372
|
|
$
|
21,163
|
|
$
|
25,582
|
|
||
|
Impairment charges included in research and development expense
|
$
|
4,212
|
|
$
|
—
|
|
$
|
—
|
|
||
|
Debt refinancing costs included in other expense
|
$
|
—
|
|
$
|
—
|
|
$
|
2,942
|
|
||
During
2018
,
2017
and
2016
we incurred
$1.1 million
,
$2.3 million
and
$17.0 million
respectively, in costs associated with the January 4, 2016 acquisition of SurgiQuest, Inc. as further described in Note 2. The costs incurred in 2018 consist of a charge to selling and administrative expense associated with a vacant lease related to the acquisition. The costs incurred in 2017 consist of costs associated with expensing of unvested options acquired and integration related costs. The costs incurred in 2016 consist of investment banking fees, consulting fees, legal fees associated with the acquisition, costs associated with expensing of unvested options acquired and integration related costs.
During
2018
, we incurred
$1.3 million
in consulting, legal and other costs associated with the
February 11, 2019
acquisition of Buffalo Filter as further described in Note 17.
During
2018
, we recorded a net charge of
$4.2 million
to research and development expense mainly associated with the impairment of an in-process research and development asset, net of the release of previously accrued contingent consideration in other current and long-term liabilities, as further described in Note 12.
During 2017, we incurred
$12.2 million
in costs associated with the SurgiQuest, Inc. vs. Lexion Medical litigation verdict
72
whereby SurgiQuest was found liable for
$2.2 million
in compensatory damages with an additional
$10.0 million
in punitive damages as further described in Note 12. These costs were paid on July 10, 2018. In addition, during the years ended December 31, 2017 and 2016, we incurred
$5.3 million
and
$3.8 million
, respectively, in costs associated with this litigation and other legal matters.
During 2016, we incurred a
$2.7 million
charge related to commitment fees paid to certain of our lenders, which provided a financing commitment for the SurgiQuest acquisition and recorded a loss on the early extinguishment of debt of
$0.3 million
in conjunction with the fifth amended and restated senior credit agreement as further described in Note 6.
For the years ending December 31,
2017
and
2016
, we incurred
$2.9 million
and
$3.1 million
, respectively, in costs associated with operational restructuring. These costs were charged to cost of sales and included severance, inventory and other charges. As part of this plan, we engaged a consulting firm to assist us in streamlining our product offering and improving our operational efficiency. As a result, we identified certain catalog numbers to be discontinued and consolidated into existing product offerings and recorded a
$1.3 million
charge in the
year ended
December 31, 2017 to write-off inventory which will no longer be offered for sale. This amount is included in the above total for 2017.
During 2016, we discontinued our Altrus product offering as part of our ongoing restructuring and incurred
$4.5 million
in non-cash charges primarily related to inventory and fixed assets which were included in cost of sales during 2016.
During 2016, we sold our Centennial, Colorado facility. We received net cash proceeds of
$5.2 million
and recorded a gain of
$1.9 million
on the sale.
During
2017
and
2016
, we restructured certain selling and administrative functions and incurred
$1.3 million
and
$6.7 million
, respectively, in related costs consisting principally of severance charges.
Note 14 — Guarantees
We provide warranties on certain of our products at the time of sale and sell extended warranties. The standard warranty period for our capital equipment is generally
one
year and our extended warranties typically vary from one to three years. Liability under service and warranty policies is based upon a review of historical warranty and service claim experience. Adjustments are made to accruals as claim data and historical experience warrant.
Changes in the carrying amount of service and product standard warranties for the year ended December 31, are as follows:
|
|
2018
|
2017
|
2016
|
||||||||
|
Balance as of January 1,
|
$
|
1,750
|
|
$
|
1,954
|
|
$
|
2,509
|
|
||
|
Provision for warranties
|
1,099
|
|
1,034
|
|
610
|
|
|||||
|
Claims made
|
(1,264
|
)
|
(1,238
|
)
|
(1,165
|
)
|
|||||
|
Balance as of December 31,
|
$
|
1,585
|
|
$
|
1,750
|
|
$
|
1,954
|
|
||
Costs associated with extended warranty repairs are recorded as incurred and amounted to
$4.9 million
,
$4.6 million
and
$4.1 million
for the
years ended
December 31, 2018
,
2017
and
2016
respectively.
Note 15 – Fair Value Measurement
We enter into derivative instruments for risk management purposes only. We operate internationally and, in the normal course of business, are exposed to fluctuations in interest rates, foreign exchange rates and commodity prices. These fluctuations can increase the costs of financing, investing and operating the business. We use forward contracts, a type of derivative instrument, to manage certain foreign currency exposures.
By nature, all financial instruments involve market and credit risks. We enter into forward contracts with major investment grade financial institutions and have policies to monitor the credit risk of those counterparties. While there can be no assurance, we do not anticipate any material non-performance by any of these counterparties.
73
Foreign Currency Forward Contracts.
We hedge forecasted intercompany sales denominated in foreign currencies through the use of forward contracts. The notional contract amounts for forward contracts outstanding at
December 31, 2018
which have been accounted for as cash flow hedges totaled
$155.3 million
. Net realized gains (losses) recognized for forward contracts accounted for as cash flow hedges approximated
$(0.9) million
,
$(0.7) million
and
$1.2 million
for the years ended
December 31, 2018, 2017 and 2016
, respectively. At
December 31, 2018
,
$4.1 million
of net unrealized gains on forward contracts accounted for as cash flow hedges, and included in accumulated other comprehensive loss, are expected to be recognized in earnings in the next twelve months.
We also enter into forward contracts to exchange foreign currencies for United States dollars in order to hedge our currency transaction exposures on intercompany receivables denominated in foreign currencies. The notional contract amounts for forward contracts outstanding at
December 31, 2018
which have not been designated as hedges totaled
$39.6 million
. Net realized gains (losses) recognized in connection with those forward contracts not accounted for as hedges approximated
$0.1 million
,
$(1.6) million
and
$0.0 million
for the years ended
December 31, 2018, 2017 and 2016
, respectively, offsetting gains (losses) on our intercompany receivables of
$(0.8) million
,
$1.1 million
and
$(0.1) million
for the years ended
December 31, 2018, 2017 and 2016
, respectively. These gains and losses have been recorded in selling and administrative expense in the consolidated statements of comprehensive income.
We record these forward foreign exchange contracts at fair value; the following tables summarize the fair value for forward foreign exchange contracts outstanding at
December 31, 2018
and
2017
:
|
December 31, 2018
|
Asset Fair
Value |
Liabilities Fair
Value |
Net
Fair Value |
||||||||
|
Derivatives designated as hedging instruments:
|
|
|
|
||||||||
|
Foreign exchange contracts
|
$
|
5,817
|
|
$
|
(431
|
)
|
$
|
5,386
|
|
||
|
Derivatives not designated as hedging instruments:
|
|
|
|
|
|
|
|||||
|
Foreign exchange contracts
|
19
|
|
(217
|
)
|
(198
|
)
|
|||||
|
Total derivatives
|
$
|
5,836
|
|
$
|
(648
|
)
|
$
|
5,188
|
|
||
|
December 31, 2017
|
Asset Fair
Value
|
Liabilities Fair
Value
|
Net
Fair
Value
|
||||||||
|
Derivatives designated as hedging instruments:
|
|
|
|||||||||
|
Foreign exchange contracts
|
$
|
346
|
|
$
|
(5,945
|
)
|
$
|
(5,599
|
)
|
||
|
Derivatives not designated as hedging instruments:
|
|
|
|||||||||
|
Foreign exchange contracts
|
4
|
|
(78
|
)
|
(74
|
)
|
|||||
|
Total derivatives
|
$
|
350
|
|
$
|
(6,023
|
)
|
$
|
(5,673
|
)
|
||
Our forward foreign exchange contracts are subject to a master netting agreement and qualify for netting in the consolidated balance sheets. Accordingly, at
December 31, 2018
and
December 31, 2017
we have recorded the net fair value of
$5.2 million
in prepaid expenses and other current assets and
$5.7 million
in other current liabilities, respectively.
Fair Value Disclosure.
FASB guidance defines fair value and establishes a framework for measuring fair value and related disclosure requirements. This guidance applies when fair value measurements are required or permitted. The guidance indicates, among other things, that a fair value measurement assumes that the transaction to sell an asset or transfer a liability occurs in the principal market for the asset or liability or, in the absence of a principal market, the most advantageous market for the asset or liability. Fair value is defined based upon an exit price model.
Valuation Hierarchy.
A valuation hierarchy was established for disclosure of the inputs to the valuations used to measure fair value. This hierarchy prioritizes the inputs into three broad levels as follows. Level 1 inputs are quoted prices (unadjusted) in active markets for identical assets or liabilities. Level 2 inputs are quoted prices for similar assets and liabilities in active
74
markets, quoted prices for identical or similar assets in markets that are not active, inputs other than quoted prices that are observable for the asset or liability, including interest rates, yield curves and credit risks, or inputs that are derived principally from or corroborated by observable market data through correlation. Level 3 inputs are unobservable inputs based on our own assumptions used to measure assets and liabilities at fair value. A financial asset or liability’s classification within the hierarchy is determined based on the lowest level input that is significant to the fair value measurement. There have been no significant changes in the assumptions.
Valuation Techniques.
Assets and liabilities carried at fair value and measured on a recurring basis as of
December 31, 2018
consist of forward foreign exchange contracts. The Company values its forward foreign exchange contracts using quoted prices for similar assets. The most significant assumption is quoted currency rates. The value of the forward foreign exchange contract assets and liabilities were valued using Level 2 inputs and are listed in the table above.
The carrying amounts reported in our balance sheets for cash and cash equivalents, accounts receivable, accounts payable and long-term debt approximate fair value.
Note 16 - New Accounting Pronouncements
Recently Adopted Accounting Standards
In May 2014, the FASB issued ASU No. 2014-09, Revenue from Contracts with Customers, along with amendments issued in 2015 and 2016, which is codified in Accounting Standards Codification ("ASC") 606. The Company adopted ASC 606 effective January 1, 2018. ASC 606 is a comprehensive new revenue recognition model that requires a company to recognize revenue when it transfers promised goods or services to customers in an amount that reflects the consideration the company expects to receive in exchange for those goods or services. The Company has applied the modified retrospective approach to adoption whereby the standard is applied only to the current period.
Adoption of ASC 606 did not have a material impact on our consolidated financial statements. Certain costs previously included in selling and administrative expense and principally related to administrative fees paid to group purchasing organizations are required to be recorded as a reduction of revenue under the new standard. These costs amounted to
$8.3 million
,
$8.2 million
and
$7.9 million
for 2018, 2017 and 2016, respectively. These costs are included as a reduction in net sales during 2018 and as selling and administrative expense during 2017 and 2016. There is no impact on net income or earnings per share as a result of this change.
The Company previously expensed as incurred commissions paid for the sale of extended warranty contracts to customers. Under the new guidance, the Company capitalizes these contract acquisition costs and realizes the expense in line with the related extended warranty contract revenue recognition. Upon adoption of the new standard, we recorded a cumulative adjustment of
$0.4 million
net of income taxes to beginning shareholders’ equity in order to capitalize costs incurred to obtain contracts with customers.
In November 2016, the FASB issued ASU No. 2016-18, Statement of Cash Flows (Topic 230): Restricted Cash. The amendments in this ASU require that a statement of cash flows explain the change during the period in total cash, cash equivalents and amounts generally described as restricted cash or restricted cash equivalents. The ASU is effective for periods beginning after December 15, 2017, however early adoption is permitted. The Company adopted
this new guidance effective January 1, 2018 and it did not have a material impact on the consolidated financial statements.
In January 2017, the FASB issued ASU No. 2017-04, Intangibles - Goodwill and Other (Topic 350): Simplifying the Accounting for Goodwill Impairment. This ASU removes Step 2 of the goodwill impairment test, which requires hypothetical purchase price allocation. A goodwill impairment will now be the amount by which the reporting unit's carrying value exceeds its fair value, not to exceed the carrying amount of goodwill. This new guidance is effective for periods beginning after December 15, 2019, however early adoption is permitted. The Company adopted this guidance in conjunction with our annual impairment testing during the fourth quarter of 2018.
In March 2017, the FASB issued ASU No. 2017-07 Compensation Retirement Benefits (ASC 715) - Improving the Presentation of Net Periodic Pension Cost and Net Periodic Postretirement Benefit Cost. This ASU requires companies to record the service component of net periodic pension cost in the same income statement line as other compensation costs arising from services rendered by the pertinent employees during the period. The other components of net periodic pension cost would be presented in the income statement separately from the service cost component and outside the subtotal of income from operations, if one is presented. The Company adopted this new guidance effective January 1, 2018 and it did not have a material impact on the consolidated financial statements.
75
In May 2017, the FASB issued ASU No. 2017-09, Compensation - Stock Based Compensation (ASC 718) - Scope of Modification Accounting. This ASU does not change the accounting for modifications but clarifies that modification accounting guidance should be applied if there is a change to the value, vesting conditions, or award classification and would not be required if the changes are considered non-substantive. The Company adopted this new guidance effective January 1, 2018 and it did not have a material impact on the consolidated financial statements.
In February 2018, the FASB issued ASU 2018-02, Income Statement - Reporting Comprehensive Income (Topic 220). This ASU provides entities with the option to eliminate the stranded tax effects associated with the change in tax rates under Tax Reform through a reclassification of the stranded tax effects from accumulated other comprehensive income to retained earnings. The Company adopted this guidance during the fourth quarter of 2018 and reclassified
$5.9 million
from accumulated other comprehensive loss to retained earnings. The reclassification was primarily comprised of amounts relating to our pension plan and unrealized hedging gains and losses. The Company generally releases income tax effects from accumulated other comprehensive loss once the reason for the tax effects ceases to exist.
In June 2018, the FASB issued ASU 2018-07 Compensation - Stock Compensation (Topic 718), Improvements to Nonemployee Share-Based Payment Accounting. This ASU is intended to simplify aspects of share-based compensation issued to non-employees by making the guidance consistent with accounting for employee share-based compensation. This guidance is effective for fiscal years beginning after December 15, 2018, including interim periods within that fiscal year. Early adoption is permitted. We early adopted this update on October 1, 2018 and it did not have a material impact on our consolidated financial statements.
In August 2018, the FASB issued ASU 2018-15, Intangibles-Goodwill and Other-Internal-Use Software (Subtopic 350-40): Customer's Accounting for Implementation Costs Incurred in a Cloud Computing Arrangement That Is a Service Contract. This guidance requires companies to determine if costs associated with hosted cloud computing services are capitalized or expensed depending on the nature of the cost and the project stage during which they are incurred. Generally, companies will only capitalize costs related to the development and implementation of the cloud computing arrangement. This guidance is effective for fiscal years beginning after December 15, 2019 and early adoption is permitted in any interim period. We early adopted this new guidance, on a prospective basis, effective July 1, 2018 and it did not have a material impact on the consolidated financial statements.
Recently Issued Accounting Standards, Not Yet Adopted
In February 2016, the FASB issued ASU No. 2016-02, Leases (Topic 842) (“ASU 2016-02”), along with amendments issued in 2017 and 2018. This ASU requires lessees to record leases on their balance sheets but recognize the expenses on their income statements in a manner similar to current practice. ASU 2016-02 states that a lessee would recognize a lease liability for the obligation to make lease payments and a right-of-use asset for the right to use the underlying asset for the lease term.
The new standard is effective for interim and annual periods beginning after December 15, 2018 and early adoption is permitted. The Company adopted the new standard on January 1, 2019, and is applying the modified retrospective approach along with the package of transition practical expedients. The Company has lease agreements with lease and non-lease components, which we plan to account for separately. For certain equipment leases, we expect to apply a portfolio approach to efficiently account for the operating lease ROU assets and lease liabilities. We also plan to elect the short-term lease exemption and not recognize leases with terms less than one year on the balance sheet.
We have assessed the impact of adopting this ASU and performed a detailed review of our lease portfolio. As a result of the assessment, we expect to record right-of-use assets and lease liabilities, that were previously unrecorded under prior GAAP, in the range of
$17 million
to
$19 million
. We do not expect this update to have a material impact on our net income, earnings per share or cash flows.
In June 2016, the FASB issued ASU No. 2016-13 Financial Instruments-Credit Losses (Topic 326): Measurement of Credit Losses on Financial Instruments which requires instruments measured at amortized cost, including accounts receivable, to be presented at the net amount expected to be collected. The new model requires an entity to estimate credit losses based on historical information, current information, and reasonable and supportable forecasts, including estimates of prepayments. The update is effective for fiscal years beginning after December 31, 2019 and early adoption is permissible during any interim period after December 31, 2018. The Company is currently assessing the impact of this guidance on our consolidated financial statements.
In August 2017, the FASB issued ASU No. 2017-12 Derivatives and Hedging (Topic 815): Targeted Improvements to Accounting for Hedging Activities. This ASU makes more financial and non-financial hedging strategies eligible for hedge accounting. It also amends the presentation and disclosure requirements and changes how companies assess effectiveness. It is
76
intended to more closely align hedge accounting with companies’ risk management strategies, simplify the application of hedge accounting, and increase transparency as to the scope and results of hedging programs. This guidance is effective for fiscal years beginning after December 15, 2018, including interim periods within that reporting period. Early adoption is permitted. We adopted this update on January 1, 2019 and we do not expect this guidance to have a material impact on our consolidated financial statements.
In August 2018, the FASB issued ASU 2018-13, Fair Value Measurement (Topic 820): Disclosure Framework-Changes to the Disclosure Requirements for Fair Value Measurement, which modifies the disclosure requirements on fair value measurements. This update is effective for fiscal years beginning after December 15, 2019 and early adoption is permitted. The Company is currently assessing the impact of this guidance on our consolidated financial statements.
In August 2018, the FASB issued ASU 2018-14, Compensation-Retirement Benefits-Defined Benefit Plans-General (Topic 715-20): Disclosure Framework-Changes to the Disclosure Requirements for Defined Benefit Plans, which modifies the disclosure requirements for defined benefit pension plans and other postretirement plans. This ASU is effective for fiscal years beginning after December 15, 2020 and early adoption is permitted. The Company is currently assessing the impact of this guidance on our consolidated financial statements.
Note 17 - Subsequent Events
On
February 11, 2019
, we acquired Buffalo Filter and all of the issued and outstanding common stock of Palmerton Holdings, Inc. from Filtration Group FGC LLC (the “Buffalo Filter Acquisition”) for approximately
$365 million
in cash, subject to customary adjustments for working capital, cash held by Buffalo Filter at closing, indebtedness of Buffalo Filter, expenses related to the transaction and other related fees and expenses. Buffalo Filter develops, manufactures and markets smoke evacuation technologies that are complementary to our Advanced Surgical portfolio. The acquisition was funded through a combination of cash on hand and long-term borrowings as further described below.
In
2018
, we incurred pre-tax transaction costs of
$1.3 million
associated with the Buffalo Filter acquisition which are recorded in selling and administrative expense. We are in the process of completing our accounting and valuation of this acquisition and accordingly, more detailed disclosures will be provided in future filings. Supplemental pro forma information has not been provided as we deem it impracticable given the timing of the closing of the transaction and availability of Buffalo Filter financial information.
On
February 7, 2019
, we entered into a sixth amended and restated senior credit agreement consisting of: (a) a
$265.0 million
term loan facility and (b) a
$585.0 million
revolving credit facility. The revolving credit facility will terminate and the loans outstanding under the term loan facility will expire on the earlier of (i) February 7, 2024 or (ii) the date that is 91 days prior to the earliest scheduled maturity date of the
$345.0 million
in
2.625%
convertible notes due in 2024 described below, (if, as of such date, more than
$150.0 million
in aggregate principal amount of such convertible notes (or any refinancing thereof) remains outstanding). The term loan is payable in quarterly installments increasing over the term of the facility. Proceeds from the term loan facility and borrowings under the revolving credit facility were used to repay the then existing senior credit agreement and in part to finance the acquisition of Buffalo Filter. Initial interest rates are at LIBOR plus an interest rate margin of
1.875%
. For those borrowings where we elect to use the alternate base rate, the initial base rate will be the greatest of (i) the Prime Rate, (ii) the Federal Funds Rate plus
0.50%
or (iii) the one-month Eurocurrency Rate plus
1.00%
, plus, in each case, an interest rate margin.
On January 29, 2019, we issued
$345.0 million
in
2.625%
convertible notes due in 2024 (the "Notes"). Interest is payable semi-annually in arrears on February 1 and August 1 of each year, commencing August 1, 2019. The Notes will mature on February 1, 2024, unless earlier repurchased or converted. The Notes represent subordinated unsecured obligations and are convertible under certain circumstances, as defined in the indenture, into a combination of cash and CONMED common stock. The Notes may be converted at an initial conversion rate of
11.2608
shares of our common stock per
$1,000
principal amount of Notes (equivalent to an initial conversion price of approximately
$88.80
per share of common stock). Holders of the Notes may convert their Notes at their option at any time on or after November 1, 2023 through the second scheduled trading day preceding the maturity date. Holders of their Notes will also have the right to convert the Notes prior to November 1, 2023, but only upon the occurrence of specified events. The conversion rate is subject to anti-dilution adjustments if certain events occur.
A portion of the net proceeds from the offering of the notes were used as part of the financing for the Buffalo Filter acquisition,
$21.0 million
were used to pay the cost of certain convertible notes hedge transactions as further described below and we intend to use the remaining proceeds of the Notes for general corporate purposes.
In connection with the offering of the Notes, we entered into convertible note hedge transactions with a number of financial institutions (each, an “option counterparty”). The convertible note hedge transactions cover, subject to anti-dilution adjustments substantially similar to those applicable to the Notes, the number of shares of our common stock underlying the Notes. Concurrently with entering into the convertible note hedge transactions, we also entered into separate warrant transactions with each option
77
counterparty whereby we sold to such option counterparty warrants to purchase, subject to customary anti-dilution adjustments, the same number of shares of our common stock.
The convertible note hedge transactions are expected generally to reduce the potential dilution upon conversion of the Notes and/or offset any cash payments we are required to make in excess of the principal amount of converted Notes, as the case may be, in the event that the market price per share of our common stock, as measured under the terms of the convertible note hedge transactions, is greater than the strike price (
$114.92
) of the convertible note hedge transactions, which initially corresponds to the conversion price of the Notes and is subject to anti-dilution adjustments substantially similar to those applicable to the conversion rate of the Notes. If, however, the market price per share of our common stock, as measured under the terms of the warrant transactions, exceeds the strike price of the warrants, there would nevertheless be dilution to the extent that such market price exceeds the strike price of the warrants, unless we elect to settle the warrants in cash.
Note 18 — Selected Quarterly Financial Data (Unaudited)
Selected quarterly financial data for
2018
and
2017
are as follows:
|
|
Three Months Ended
|
||||||||||||||
|
|
March
|
June
|
September
(1)
|
December
(2)
|
|||||||||||
|
2018
|
|
|
|
|
|||||||||||
|
Net sales
|
$
|
202,064
|
|
$
|
212,820
|
|
$
|
202,307
|
|
$
|
242,444
|
|
|||
|
Gross profit
|
109,557
|
|
116,271
|
|
110,627
|
|
132,655
|
|
|||||||
|
Net income
|
10,657
|
|
8,719
|
|
5,825
|
|
15,653
|
|
|||||||
|
EPS:
|
|
|
|
|
|
|
|
|
|||||||
|
Basic
|
$
|
.38
|
|
$
|
.31
|
|
$
|
.21
|
|
$
|
.56
|
|
|||
|
Diluted
|
.37
|
|
.30
|
|
.20
|
|
.54
|
|
|||||||
|
|
Three Months Ended
|
||||||||||||||
|
|
March
(3)
|
June
(4)
|
September
(5)
|
December
(6)
|
|||||||||||
|
2017
|
|
|
|
|
|||||||||||
|
Net sales
|
$
|
186,567
|
|
$
|
197,154
|
|
$
|
190,117
|
|
$
|
222,555
|
|
|||
|
Gross profit
|
99,885
|
|
104,652
|
|
102,547
|
|
123,958
|
|
|||||||
|
Net income (loss)
|
(4,545
|
)
|
6,139
|
|
7,197
|
|
46,696
|
|
|||||||
|
EPS:
|
|
|
|
|
|
|
|
|
|||||||
|
Basic
|
$
|
(.16
|
)
|
$
|
.22
|
|
$
|
.26
|
|
$
|
1.67
|
|
|||
|
Diluted
|
(.16
|
)
|
.22
|
|
.26
|
|
1.65
|
|
|||||||
Items Included In Selected Quarterly Financial Data:
|
(1)
|
The third quarter of 2018 includes pre-tax business acquisition costs of
$1.1 million
and in-process research and development impairment charges of
$4.2 million
.
|
|
(2)
|
The fourth quarter of 2018 includes pre-tax business acquisition costs of
$1.3 million
.
|
|
(3)
|
The first quarter of 2017 includes pre-tax business acquisition costs of
$0.5 million
, restructuring costs of
$2.5 million
and charges related to legal matters of
$14.2 million
.
|
|
(4)
|
The second quarter of 2017 includes pre-tax business acquisition costs of
$0.4 million
, restructuring costs of
$0.3 million
and charges related to legal matters of
$2.5 million
.
|
|
(5)
|
The third quarter of 2017 includes pre-tax business acquisition costs of
$0.1 million
, restructuring costs of
$1.3 million
and charges related to legal matters of
$0.3 million
.
|
|
(6)
|
The fourth quarter of 2017 includes pre-tax business acquisition costs of
$1.3 million
, restructuring costs of
$0.1 million
and charges related to legal matters of
$0.4 million
as well as an income tax benefit of
$31.9 million
resulting from the 2017 Tax Cuts and Jobs Act.
|
78
SCHEDULE II—Valuation and Qualifying Accounts
(In thousands)
|
|
|
|
|
|||||||||||||
|
|
|
|
|
|||||||||||||
|
|
Additions
|
|
|
|||||||||||||
|
|
Balance at
Beginning of
Period
|
Charged to
Costs and
Expenses
|
|
|||||||||||||
|
Balance at End
of Period
|
||||||||||||||||
|
Description
|
Deductions
|
|||||||||||||||
|
2018
|
|
|
|
|
||||||||||||
|
Allowance for bad debts
|
$
|
2,137
|
|
$
|
1,485
|
|
$
|
(962
|
)
|
$
|
2,660
|
|
||||
|
Sales returns and
|
|
|
|
|
|
|
|
|
||||||||
|
allowance
|
2,219
|
|
1,050
|
|
(23
|
)
|
3,246
|
|
||||||||
|
Deferred tax asset
|
|
|
|
|
|
|
|
|
||||||||
|
valuation allowance
|
570
|
|
589
|
|
—
|
|
1,159
|
|
||||||||
|
2017
|
|
|
|
|
|
|
|
|
||||||||
|
Allowance for bad debts
|
$
|
2,031
|
|
$
|
1,031
|
|
$
|
(925
|
)
|
$
|
2,137
|
|
||||
|
Sales returns and
|
|
|
|
|
|
|
|
|
||||||||
|
allowance
|
1,817
|
|
424
|
|
(22
|
)
|
2,219
|
|
||||||||
|
Deferred tax asset
|
|
|
|
|
|
|
|
|
||||||||
|
valuation allowance
|
441
|
|
129
|
|
—
|
|
570
|
|
||||||||
|
2016
|
|
|
|
|
|
|
|
|
||||||||
|
Allowance for bad debts
|
$
|
1,336
|
|
$
|
983
|
|
$
|
(288
|
)
|
$
|
2,031
|
|
||||
|
Sales returns and
|
|
|
|
|
|
|
|
|
||||||||
|
allowance
|
1,814
|
|
268
|
|
(265
|
)
|
1,817
|
|
||||||||
|
Deferred tax asset
|
|
|
|
|
|
|
|
|
||||||||
|
valuation allowance
|
124
|
|
317
|
|
—
|
|
441
|
|
||||||||
Item 16. Form 10-K Summary
Registrants may voluntarily provide a summary of information required by Form 10-K under this Item 16. The Company has elected not to include such summary information.
79
TABLE OF CONTENTS
Item 1. BusinessItem 1A. Risk FactorsItem 1B. Unresolved Staff CommentsItem 2. PropertiesItem 3. Legal ProceedingsItem 4. Mine Safety DisclosuresPart IIItem 5. Market For The Registrant S Common Equity, Related Stockholder Matters and Issuer Purchases Of Equity SecuritiesItem 6. Selected Financial DataItem 7. Management S Discussion and Analysis Of Financial Condition and Results Of OperationsItem 7A. Quantitative and Qualitative Disclosures About Market RiskItem 8. Financial Statements and Supplementary DataItem 9. Changes in and Disagreements with Accountants on Accounting and Financial DisclosuresItem 9A. Controls and ProceduresItem 9B. Other InformationPart IIIItem 10. Directors, Executive Officers and Corporate GovernanceItem 11. Executive CompensationItem 12. Security Ownership Of Certain Beneficial Owners and Management and Related Stockholder MattersItem 13. Certain Relationships and Related Transactions, and Director IndependenceItem 14. Principal Accounting Fees and ServicesPart IVItem 15. Exhibits, Financial Statement SchedulesNote 1 Operations and Significant Accounting PoliciesNote 2 Business AcquisitionNote 3 InventoriesNote 4 Property, Plant and EquipmentNote 5 Goodwill and Other Intangible AssetsNote 6 Long Term DebtNote 7 Income TaxesNote 8 Shareholders EquityNote 9 RevenuesNote 10 Business Segments and Geographic AreasNote 11 Employee Benefit PlansNote 12 Legal Matters and ContingenciesNote 13 Acquisition, Restructuring and Other ExpenseNote 14 GuaranteesNote 15 Fair Value MeasurementNote 16 - New Accounting PronouncementsNote 17 - Subsequent EventsNote 18 Selected Quarterly Financial Data (unaudited)Item 16. Form 10-k Summary