Washington, D.C. 20549
Form 10-K
|
(Mark One)
|
|
|
þ
|
ANNUAL REPORT PURSUANT TO SECTION 13 OR 15(d) OF THE SECURITIES EXCHANGE ACT OF 1934
|
|
For the Fiscal Year Ended December 31, 2017
|
|
or
|
o
|
TRANSITION REPORT PURSUANT TO SECTION 13 OR 15(d) OF THE SECURITIES EXCHANGE ACT OF 1934
|
Commission File No. 1-38300
_________________________________
CANNAE HOLDINGS
, INC.
(Exact name of registrant as specified in its charter)
|
Delaware
|
|
82-1273460
|
|
(State or other jurisdiction of incorporation or organization)
|
|
(I.R.S. Employer Identification No.)
|
|
|
|
|
|
1701 Village Center Circle
Las Vegas, Nevada 89134
(Address of principal executive offices, including zip code)
|
|
(702) 323-7330
(Registrant’s telephone number,
including area code)
|
Securities registered pursuant to Section 12(b) of the Act:
|
Title of Each Class
|
|
Name of Each Exchange on Which Registered
|
|
Cannae Common Stock, $0.0001 par value
|
|
New York Stock Exchange
|
Securities registered pursuant to Section 12(g) of the Act: None
Indicate by check mark if the registrant is a well-known seasoned issuer, as defined in Rule 405 of the Securities Act. Yes
o
No
þ
Indicate by check mark if the registrant is not required to file reports pursuant to Section 13 or Section 15(d) of the Act. Yes
o
No
þ
Indicate by check mark whether the registrant (1) has filed all reports required to be filed by Section 13 or 15(d) of the Securities Exchange Act of 1934 during the preceding 12 months (or for such shorter period that the registrant was required to file such reports), and (2) has been subject to such filing requirements for the past 90 days. Yes
þ
No
o
Indicate by check mark whether the registrant has submitted electronically and posted on its corporate Web site, if any, every Interactive Data File required to be submitted and posted pursuant to Rule 405 of Regulation S-T (§ 232.405 of this chapter) during the preceding 12 months (or for such shorter period that the registrant was required to submit and post such files). Yes
þ
No
o
Indicate by check mark if disclosure of delinquent filers pursuant to Item 405 of Regulation S-K (§ 229.405) is not contained herein, and will not be contained, to the best of registrant’s knowledge, in definitive proxy or information statements incorporated by reference in Part III of this Form 10-K, or any amendment to this Form 10-K.
o
Indicate by check mark whether the registrant is a large accelerated filer, an accelerated filer, a non-accelerated filer, or a smaller reporting company. See the definitions of “large accelerated filer,” “accelerated filer” and “smaller reporting company” in Rule 12b-2 of the Exchange Act. (Check one):
|
Large accelerated filer
o
|
|
Accelerated filer
o
|
|
|
|
Non-accelerated filer
þ
(Do not check if a smaller reporting company)
|
|
Smaller reporting company
o
|
Emerging growth company
o
|
|
If an emerging growth company, indicate by check mark if the registrant has elected not to use the extended transition period for complying with any new or revised financial accounting standards provided pursuant to Section 13(a) of the Exchange Act.
o
Indicate by check mark whether the registrant is a shell company (as defined in Rule 12b-2 of the Exchange Act). Yes
o
No
þ
As of June 30, 2017, the registrant's common stock was not publicly traded.
As of
February 28, 2018
there were 70,858,143 shares of Cannae common stock outstanding.
The information in Part III hereof for the fiscal year ended
December 31, 2017
, will be filed within 120 days after the close of the fiscal year that is the subject of this Report.
CANNAE HOLDINGS, INC.
FORM 10-K
TABLE OF CONTENTS
|
|
|
Page
Number
|
|
|
||
|
|
||
|
|
||
i
|
Item 1.
|
Business
|
Introductory Note
The following describes the business of Cannae Holdings, Inc. and its subsidiaries. Except where otherwise noted, all references to “we,” “us,” “our,” "Cannae", "Cannae Holdings", "the Company," or “CNNE” are to Cannae Holdings, Inc. and its subsidiaries, taken together.
Separation from Fidelity National Financial
On November 17, 2017, Fidelity National Financial, Inc. (“FNF”) redeemed each outstanding share of its FNFV Group common stock, par value
$0.0001
, for
one
share of common stock, par value
$0.0001
, of a newly formed entity, Cannae Holdings, Inc., with cash in lieu of fractional shares (the "Split-Off"). In conjunction with the Split-Off, FNF contributed to us its majority and minority equity investment stakes in a number of entities, including American Blue Ribbon Holdings, LLC ("ABRH"), Ceridian Holding, LLC ("Ceridian"), T-System Holdings, LLC ("T-System"), and various other controlled portfolio companies and other minority equity investments. We filed our registration statement on Form S-4 describing the Split-Off with the U.S. Securities and Exchange Commission (the “SEC”), which was declared effective by the SEC on October 19, 2017 (the “Registration Statement”). On November 20, 2017, Cannae common stock began “regular-way” trading on The New York Stock Exchange under the “CNNE” stock symbol.
Description of Business
We are a holding company engaged in actively managing and operating a group of companies and investments with a net asset value of approximately
$1.2 billion
as of
December 31, 2017
. Our business consists of managing and operating certain majority-owned subsidiaries, as well as making additional majority and minority equity portfolio investments in businesses, in order to achieve superior financial performance and maximize the value of these assets.
As of
December 31, 2017
, we had the following reportable segments:
Restaurant Group.
This segment consists of the operations of ABRH, in which we have a
55%
ownership interest. ABRH was established in Denver, Colorado in 2009 and is now headquartered in Nashville, Tennessee. ABRH operates more than 550 company and franchise family and casual dining restaurants in 40 states and Guam under the O'Charley's, Ninety Nine Restaurants & Pub, Village Inn, and Bakers Square restaurant and food service concepts, and the Legendary Baking bakery operation.
Ceridian.
This segment consists of our
33%
ownership interest in Ceridian. Ceridian, through its operating subsidiary Ceridian HCM, Inc. ("Ceridian HCM"), is a global human capital management ("HCM") company that offers a broad range of services and software designed to help employers more effectively manage employment processes, such as payroll, payroll related tax filing, human resource information systems, employee self-service, time and labor management, employee assistance and work-life programs, and recruitment and applicant screening. Ceridian HCM's cloud offering, Dayforce, is our flagship cloud HCM platform that meets HCM needs with one employee record and one user experience throughout the application. Dayforce enables organizations to process payroll, maintain human resources records, manage benefits enrollment, schedule staff, and find and hire personnel, while monitoring compliance throughout the employee life cycle. Ceridian is a founder-led organization, and the culture combines the agility and innovation of a start-up with a history of deep domain and operational expertise. We account for our investment in Ceridian under the equity method of accounting and therefore its results of operations do not consolidate into ours.
T-System.
This segment consists of the operations of our wholly-owned subsidiary, T-System. T-System is a provider of clinical documentation and coding solutions to hospital-based and free-standing emergency departments and urgent care facilities. T-System organizes itself into
two
businesses. The Clinical Documentation business offers software solutions providing clinical staff with full workflow operations that drive documentation completeness and revenue optimization to more than
435
customers. Additionally, the patented T-Sheet is the industry standard for emergency department documentation, with more than
800
customers. The Coding Software & Outsourced Solutions business provides a full-service outsourced coding solution as well as a cloud-based software-as-a-service solution for self-service coding. These offerings help more than
75
customers at over
300
sites optimize their revenue cycle workflow and customer revenue reimbursement through improved coding accuracy and compliance and coder productivity compared to in-house coding.
Corporate and Other.
This segment consists of our share in the operations of controlled and uncontrolled portfolio companies including our 24.8% equity interest in Triple Tree Holdings, LLC ("Triple Tree"), our wholly-owned subsidiary Fidelity National Timber Resources, Inc ("FNTR"), our interest in the debt of Colt Holding LLC ("Colt Defense"), and other various majority and minority equity investments. Triple Tree is an independent, research-driven investment banking firm focused on mergers and acquisitions, financial restructuring, and principal investing services for innovative, high-growth businesses in the healthcare industry. FNTR and its subsidiaries currently operate and invest in golf and real estate properties and develops, manages and operates residential and recreational properties, including a 1,800-acre ranch-style luxury resort and residential community in
1
Oregon and an 18-hole championship golf facility in Idaho. Colt Defense researches, develops, manufactures and sells firearms for military and personal defense and recreational purposes in the U.S. and internationally. As of
December 31, 2017
, we own debt of Colt Defense with a market value of
$14.8 million
.
Financial Information of Segments
Refer to
Management's Discussion and Analysis of
Financial Condition and Results of Operations
included in Item 7 of Part II of this Annual Report and Note Q.
Segment Information
to our Consolidated and Combined Financial Statements included in Item 8 of Part II of this Annual Report for financial information of each of our reporting segments.
Strategy
We actively manage a group of companies and investments with a net asset value of approximately
$1.2 billion
as of
December 31, 2017
. The businesses within our portfolio primarily consist of our majority ownership positions in ABRH and T-System and our 33% minority investment in Ceridian. Our strategy for the Company is to continue our activities with respect to such business investments to achieve superior financial performance, maximize and ultimately monetize the value of those assets and to continue to pursue similar investments in businesses and to grow and achieve superior financial performance with respect to such newly acquired businesses.
Restaurant Group.
Our restaurant operations are focused in the family dining and casual dining segments. The Restaurant Group's strategy is to achieve long-term profit growth and drive increases in same store sales and guest counts. We have a highly experienced management team that is focused on enhancing the guest experience at our restaurants and building team member engagement. We also utilize a shared service platform that takes advantage of the combined back-office synergies of our operating companies. We expect to continue to maintain a strong balance sheet for our Restaurant Group to provide stability in all operating environments.
Ceridian.
Ceridian HCM's business has transformed from a legacy service-bureau model into a cloud-based provider model, and in the second half of 2016, Cloud revenue surpassed Bureau revenue for the first time. Ceridian HCM's flagship cloud offering, Dayforce, is a cloud solution that meets HCM needs with one employee record and one user experience throughout the application. As evidenced by its more than 60% compound annual growth rate since 2012, we believe that the Dayforce cloud offering, built on a single database, enjoys a competitive advantage in the marketplace. We believe Ceridian's Dayforce offering is a market leader as shown by both extensive recognition and industry awards. Nucleus Research named Dayforce as the leader in both HCM technology and Workforce Management, based on functionality and usability. In addition, Gartner Peer Insights placed Ceridian's Dayforce offering in the leader quadrant in global payroll services, and Ventana Research found Dayforce as the leader in both usability and capability in its Value Index. During 2016, Ceridian won several awards for Dayforce, including a TekTonic Award from HRO Today Magazine, a Gold American Business Award for best new product, and a Ventana Research Technology Innovation Award, among others.
T-System.
T-System is engaged in providing clinical, financial, operational, and regulatory solutions for hospital emergency room ("ER") departments, free-standing emergency departments ("ED"), and urgent care and family practice healthcare facilities. T-System offers documentation solutions, including EV, an emergency department information system; EV for physicians, a solution with ER-specific clinical content and workflow for emergency physicians; T Sheets Digital, a documentation solution for urgent care; and T Sheets, which provides patient care through medical records/documentation and optimized reimbursement. We also provide charge capture and coding solutions that combine intelligent coding technology with services to improve quality and compliance, and result in accurate coding and financial outcomes for various types of facilities ranging from critical access hospitals to children's hospitals; and Advanced Coding System, which facilitates accurate coding for simple encounters and multiple patient complaints, and ensures optimal reimbursement for care provided.
In the past several years, there has been an increased push for interoperability across systems to address the fact that patient records will contain information from more than one health care IT system. We believe that we are positioned to take the steps to create interoperability between T-System solutions and other large IT systems
.
Acquisitions, Dispositions, Minority Owned Operating Affiliates and Financings.
Acquisitions have been an important part of our growth strategy. Dispositions have been an important aspect of our strategy of returning value to shareholders. On an ongoing basis, with assistance from our advisors, we actively evaluate possible transactions, such as acquisitions and dispositions of business units and operating assets and business combination transactions.
In the future, we may seek to sell certain investments or other assets to increase our liquidity. Further, our management has stated that we may make acquisitions in lines of business that are not directly tied to, or synergistic with, our current operating segments.
In the past we have obtained majority and minority investments in entities and securities where we see the potential to achieve above market returns. Fundamentally our goal is to acquire quality companies that are well-positioned in their respective industries, run by best-in-class management teams in industries that have attractive organic and acquired growth opportunities. We leverage our operational expertise and track record of growing industry leading companies and our active interaction with management of acquired companies, directly or through our board of directors, to ultimately provide value for our shareholders.
2
There can be no assurance that any suitable opportunities will arise or that any particular transaction will be completed.
We have made a number of acquisitions and dispositions over the past several years to strengthen and expand our service offerings and customer base in our various businesses, to expand into other businesses or where we otherwise saw value, and to monetize investments in assets and businesses.
Intellectual Property
Restaurant Group
. We regard our service marks, including "O'Charley's", "Ninety Nine", "Village Inn", "Legendary Baking", and "Bakers Square", and other service marks and trademarks as having significant value and as being important factors in the marketing of our restaurants. We have also obtained trademarks for several of our menu items and for various advertising slogans. We are aware of names and marks similar to our service marks and trademarks used by other persons in certain geographic areas where we have restaurants. However, we believe such uses will not adversely affect us. Our policy is to pursue registration of our marks whenever possible and to oppose vigorously any infringement of our marks.
We license the use of our registered trademarks and service marks to franchisees and third parties through franchise arrangements and licenses. The franchise and license arrangements restrict franchisees' and licensees' activities with respect to the use of our trademarks and service marks, and impose quality control standards in connection with goods and services offered in connection with the trademarks and service marks.
Ceridian
. Ceridian HCM and its subsidiaries own or have the rights to various trademarks, trade names and service marks, including the following: Ceridian®, Dayforce® and various logos used in association with these terms.
T-System
.T-System's intellectual property includes the following: T Sheets
TM
, T-System EV
TM
, and T-System EV4P
TM
. T Sheets is one of the most widely used and accepted documentation systems in emergency medicine. T Sheets is built with the most comprehensive and up-to-date clinical content and serves as the clinical documentation backbone of T-System’s industry leading software solutions. T-System EV
TM
and EV4P
TM
are category-leading best-of-breed software solutions used by the episodic care market.
Refer to
Note A.
Business and Summary of Significant Accounting Policies
to our Consolidated and Combined Financial Statements included in Item 8 of Part II of this Annual Report for further information on the accounting for our Other intangible assets, including intellectual property.
Seasonality
Restaurant Group
. Average weekly sales per restaurant are typically higher in the first and fourth quarters than in other quarters, and the Restaurant Group typically generates a disproportionate share of its earnings from operations in the first and fourth quarters. Holidays, severe weather and other disruptive conditions may impact sales volumes seasonally in some operating regions. Our revenues in future periods will continue to be subject to these and other factors that are beyond our control and, as a result, are likely to fluctuate.
Ceridian.
Because the volume of payroll items processed increases in the fourth quarter of each year in connection with employers' year-end reporting requirements, Ceridian HCM's revenue and profitability tends to be greater in that quarter.
T-System.
The Clinical Documentation segment of T-System's business is impacted by seasonal volume increases in the first and fourth quarters compared to other quarters. The increase in charts coded is generated by seasonal flu volumes that impact the visits to health care facilities.
Inventory
Restaurant Group.
In the restaurant group's Legendary Baking business, sales of baked goods are greatest during the holiday season in the fourth quarter. As a result of inventory requirements to meet this demand, inventory is built up over the course of the first nine months of the year.
Competition
Restaurant Group.
The restaurant industry is highly competitive and is often affected by changes in consumer tastes and discretionary spending patterns; changes in general economic conditions; public safety conditions or concerns; demographic trends; weather conditions; the cost of food products, labor, energy and other operating costs; and governmental regulations. The restaurant industry is also characterized by high capital investments for new restaurants and relatively high fixed or semi-variable restaurant operating expenses. Because of the high fixed and semi-variable expenses, changes in sales in existing restaurants are generally expected to significantly affect restaurant profitability because many restaurant costs and expenses are not expected to change at the same rate as sales. Restaurant profitability can also be negatively affected by inflationary and regulatory increases in operating costs and other factors. The most significant commodities that may affect our cost of food and beverage are beef, seafood, poultry, and dairy, which accounted for approximately half of our overall cost of food and beverage in the past. Generally, temporary increases in these costs are not passed on to guests; however, in the past, we have adjusted menu prices to compensate for increased
3
costs of a more permanent nature. Our revenues in future periods will continue to be subject to these and other factors that are beyond our control and, as a result, are likely to fluctuate.
Ceridian.
The market for HCM products is highly competitive. Ceridian HCM's products compete primarily on the basis of technology, delivered functionality and performance, price, and service. Its competitors include (i) large service bureaus, primarily Automatic Data Processing Inc.; (ii) companies, such as Oracle, Kronos, Lawson, Ultimate Software and Workday that offer human resource management and payroll software products for use on mainframes, client/server environments and/or Web servers; and (iii) smaller service providers, such as Paychex.
T-System
. The market for healthcare solutions is subject to intense competition and subject to rapid technological change. T-System offers solutions and services to support the clinical, financial, and operational needs for hospital ER departments, free-standing EDs, and urgent care and family practice healthcare facilities. Our competitors include companies such as Allscripts Healthcare Solutions, Cerner Corporation, Medhost, and Epic Systems.
Due to the pace of change within the market, we expect that major software information system companies, start-up companies, and other companies would produce new software solutions or services that would compete with evolving industry standards and requirements.
C
ompetitive Strengths
Proven management team.
Our executive management team has a proven track record of investment identification and management. Our executive management's breadth of knowledge of capital markets allows us to identify companies and strategic assets with attractive value propositions, to structure investments to maximize their value, and to return the value created to shareholders.
Employees
As of March 2, 2018, Cannae and our consolidated subsidiaries had 27,385 full-time equivalent employees, which includes 26,870 in our Restaurant Group, 329 at T-System and 186 in the various businesses comprising our Corporate and other segment.
We monitor our staffing levels based on current economic activity.
None of our employees are unionized or represented by any collective agency.
We believe that our relations with employees are generally good.
Geographic Operations
For each of the last three fiscal years, substantially all of our revenues were earned in the United States and substantially all of our consolidated long-lived assets were located in the United States.
Statement Regarding Forward-Looking Information
The statements contained in this Form 10-K or in our other documents or in oral presentations or other statements made by our management that are not purely historical are forward-looking statements within the meaning of Section 27A of the Securities Act of 1933 and Section 21E of the Securities Exchange Act of 1934, including statements regarding our expectations, hopes, intentions, or strategies regarding the future. These statements relate to, among other things, future financial and operating results of the Company. In many cases, you can identify forward-looking statements by terminology such as “may,” “will,” “should,” “expect,” “plan,” “anticipate,” “believe,” “estimate,” “predict,” “potential,” or “continue,” or the negative of these terms and other comparable terminology. Actual results could differ materially from those anticipated in these statements as a result of a number of factors, including, but not limited to the following:
|
•
|
changes in general economic, business, and political conditions, including changes in the financial markets;
|
|
•
|
compliance with extensive government regulation of our operating subsidiaries and adverse changes in applicable laws or regulations or in their application by regulators;
|
|
•
|
loss of key personnel that could negatively affect our financial results and impair our operating abilities;
|
|
•
|
our potential inability to find suitable acquisition candidates, as well as the risks associated with acquisitions in lines of business that will not necessarily be limited to our traditional areas of focus, or difficulties integrating acquisitions;
|
|
•
|
other risks detailed in "Risk Factors" below and elsewhere in this document and in our other filings with the SEC.
|
We are not under any obligation (and expressly disclaim any such obligation) to update or alter our forward-looking statements, whether as a result of new information, future events or otherwise. You should carefully consider the possibility that actual results may differ materially from our forward-looking statements.
Additional Information
Our website address is
www.cannaeholdings.com
. We make available free of charge on or through our website our Annual Report on Form 10-K, Quarterly Reports on Form 10-Q, Current Reports on Form 8-K and all amendments to those reports filed
4
or furnished pursuant to Section 13(a) or 15(d) of the Securities Exchange Act of 1934, as amended, as soon as reasonably practicable after such material is electronically filed with or furnished to the SEC. However, the information found on our website is not part of this or any other report.
Item 1A.
Risk Factors
Factors Relating to the Company's Corporate History and Structure
We are a holding company and will depend on distributions from our subsidiaries for cash.
We are a holding company whose primary assets are the securities of our portfolio companies. Our ability to pay interest on our outstanding debt, if any, and our other obligations and to pay dividends, if any, is dependent on the ability of our subsidiaries to pay dividends or make other distributions or payments to us (such ability of our subsidiaries also being subject to certain restrictions under their respective credit agreements and other debt instruments, as applicable). If our portfolio companies are not able to pay dividends to us, we may not be able to meet our obligations or pay dividends on our common stock. The ability of the Cannae Holdings portfolio companies to pay dividends or to make other payments or advances to us depends on their individual operating results and any statutory, regulatory or contractual restrictions to which they may be or may become subject.
We have no operating history as a separate company upon which you can evaluate our performance.
We do not have an operating history as a public company. Accordingly, there can be no assurance that our business will be successful on a long-term basis. We may not be able to grow our businesses as planned and may not be profitable.
We may become subject to the Investment Company Act of 1940.
We do not believe that we are subject to regulation under the Investment Company Act of 1940, as amended (the "40 Act"). We were formed for the purpose of effecting the Split-Off and for controlling, operating or holding, as applicable, the FNFV Group's business and investments, including the portfolio companies. We engage primarily in the business of managing and operating our controlled subsidiaries. Our officers and any employees who provide services to us pursuant to the terms of our corporate services agreement with FNF devote their activities to the businesses of these portfolio companies. Our interest in the portfolio companies comprises substantially all of our assets and substantially all of our income, if any, is derived from restaurant revenue from ABRH, the revenue of T-System, and dividends and other distributions made on our interests in portfolio companies. Based on these factors, we believe that we are not an investment company under the 40 Act, including under Section 3(b)(1) of the 40 Act. If, at any time, we become primarily engaged in the business of investing, reinvesting or trading in securities, we could become subject to regulation under the 40 Act. Following any such change in our business and after giving effect to any applicable grace periods, we may be required to register as an investment company, which could result in significant registration and compliance costs, could require changes to our corporate governance structure and financial reporting, and could restrict our activities going forward. In addition, if we were to become inadvertently subject to the 40 Act, any violation of the 40 Act could subject us to material adverse consequences, including potentially significant regulatory penalties and the possibility that certain of our contracts would be deemed unenforceable.
Factors Relating to the Restaurant Businesses
General macroeconomic factors, including unemployment, energy prices and interest rates, and certain economic and business factors specific to the restaurant and bakery industries that are largely out of our restaurant businesses' control may materially and adversely affect consumer behavior and have a material adverse effect on our business, financial condition and results of operations.
General economic conditions may materially and adversely affect the financial condition and results of operations of our restaurant businesses, which we also refer to as our Restaurant Group companies. Recessionary economic cycles, a protracted economic slowdown, a worsening economy, increased unemployment, increased energy prices, rising interest rates, a downgrade of the United States ("U.S.") government's long-term credit rating, financial market volatility and unpredictability or other national, regional and local regulatory and economic conditions or other industry-wide cost pressures could affect consumer behavior and spending for restaurant dining occasions and result in increased pressure with respect to our Restaurant Group companies' pricing, guest count levels and commodity costs, which could lead to a decline in our Restaurant Group companies' sales and earnings. Job losses, foreclosures, bankruptcies and falling home prices could cause customers to make fewer discretionary purchases, and any significant decrease in our Restaurant Group companies' guest counts or profit will negatively impact their financial performance. In addition, if gasoline, natural gas, electricity and other energy costs increase, or credit card, home mortgage and other borrowing costs increase with rising interest rates, our Restaurant Group companies' customers may have lower disposable income and reduce the frequency with which they dine at restaurants, may spend less during each visit at our Restaurant Group companies' restaurants or may choose more inexpensive restaurants. These factors could also cause the Restaurant Group companies to, among other things, reduce the number and frequency of new restaurant openings, close restaurants or delay the reimaging of the Restaurant Group companies' existing restaurant locations.
5
Furthermore, we cannot predict the effects that actual or threatened armed conflicts, terrorist attacks, efforts to combat terrorism, including military action against any foreign state or local group located in a foreign state, heightened security requirements on local, regional, national or international economies or a failure to protect information systems for critical infrastructure, such as the electrical grid and telecommunications systems, could have on the Restaurant Group companies' operations, the economy or consumer confidence generally. Any of these events could affect consumer spending patterns or result in increased costs for the Restaurant Group companies due to security measures.
The business results of our Restaurant Group companies depend on a number of industry-specific factors as well, many of which are beyond the Restaurant Group companies' control. The full service dining sector of the restaurant industry is affected by seasonal fluctuation of sales volumes, consumer confidence, consumer spending patterns and consumer preferences, including changes in consumer tastes and dietary habits, and the level of consumer acceptance of our restaurant brands. The performance of individual restaurants may also be materially and adversely affected by factors applicable to those restaurants, such as demographic trends, severe weather, traffic patterns and the type, number and location of competing restaurants.
Unfavorable changes in the above factors or in other business and economic conditions affecting our Restaurant Group companies' customers or industry could increase costs, reduce guest counts in some or all restaurants or impose practical limits on pricing, any of which could lower profit margins and have a material adverse effect on our business, financial condition and results of operations.
The Restaurant Group companies could face significant competition for customers, real estate and employees and competitive pressure to adapt to changes in conditions driving customer demand. The Restaurant Group companies' inability to compete effectively may affect guest counts, sales and profit margins, which could have a material adverse effect on our business, financial condition and results of operations.
The restaurant industry is intensely competitive with a substantial number of restaurant operators that compete directly and indirectly with the Restaurant Group companies with respect to price, service, ambiance, brand, customer service, dining experience, location, food quality and variety and value perception of menu items and there are other well established competitors with substantially greater financial and other resources than the Restaurant Group companies. Some of our Restaurant Group companies' competitors advertise on national television, which may provide customers with greater awareness and name recognition than our Restaurant Group companies can achieve through their advertising efforts. There is also active competition for management personnel and attractive suitable real estate sites. Consumer tastes and perceptions, nutritional and dietary trends, guest count patterns and the type, number and location of competing restaurants often affect the restaurant business, and our Restaurant Group companies' competitors may react more efficiently and effectively to those conditions. For instance, prevailing health or dietary preferences or perceptions of our Restaurant Group companies' products may cause consumers to avoid certain menu items or products our Restaurant Group companies offer in favor of foods that are perceived as more healthy, and such choices by consumers could have a material adverse effect on our business, financial condition and results of operations. Further, our Restaurant Group companies face growing competition from the supermarket industry, with the improvement of their "convenient meals" in the deli and prepared food sections, from quick service and fast casual restaurants and online food delivery services as a result of food and beverage offerings by those food providers. As our Restaurant Group companies' competitors expand operations in markets where our restaurant businesses operate or expect to operate, we expect competition to intensify. If our Restaurant Group companies are unable to continue to compete effectively, their guest counts, sales and profit margins could decline, which could have a material adverse effect on our business, financial condition and results of operations.
Historically, customer spending patterns for the Restaurant Group companies' restaurants are generally highest in the fourth quarter of the year and lowest in the third quarter of the year. Sales activity during the holidays may affect seasonal sales volumes in some of the markets in which our restaurant businesses operate. The quarterly results of our Restaurant Group companies have been and will continue to be affected by the timing of new restaurant openings and their associated costs (which are often materially greater during the first several months of operation than thereafter), restaurant closures and exit-related costs, labor availability and costs for hourly and management personnel, profitability of restaurants, especially in new markets, trends in comparable restaurant sales, changes in borrowings and interest rates, changes in consumer preferences and competitive conditions, fluctuations in food and commodity prices, fluctuations in costs attributable to public company compliance and impairments of goodwill, intangible assets and property, fixtures and equipment. As a result of these and other factors, the Restaurant Group companies' financial results for any quarter may not be indicative of the results that may be achieved for a full fiscal year.
If our restaurant businesses are unable to effectively grow revenue and profitability at certain of their locations, our Restaurant Group companies may be required to record impairment charges to their restaurant assets, the carrying value of their goodwill or other intangible assets, which could have a material adverse effect on our financial condition and results of operations.
Our Restaurant Group companies assess the potential impairment of their long-lived assets whenever events or changes in circumstances indicate that the carrying value of the assets or asset group may not be recoverable. Factors considered include, but are not limited to, significant underperformance relative to historical or projected future operating results, significant changes in the manner in which an asset is being used, an expectation that an asset will be disposed of significantly before the end of its
6
previously estimated useful life and significant negative industry or economic trends. Our Restaurant Group companies annually review and compare the carrying value of intangible assets, including goodwill, to the fair value. We cannot accurately predict the amount and timing of any recorded impairment to our Restaurant Group companies' assets. Should the value of goodwill or other intangible or long-lived assets become impaired, there could be a material adverse effect on our financial condition and results of operations.
Increased commodity, energy and other costs could decrease our Restaurant Group companies' profit margins or cause the Restaurant Group companies to limit or otherwise modify their menus, which could have a material adverse effect on our business, financial condition and results of operations.
The cost, availability and quality of ingredients restaurant operations use to prepare their food is subject to a range of factors, many of which are beyond their control. A significant component of our restaurant businesses' costs will be related to food commodities, including beef, pork, chicken, seafood, poultry, dairy products, oils, produce, fruit, flour and other related costs such as energy and transportation over which we may have little control, which can be subject to significant price fluctuations due to seasonal shifts, climate conditions, industry demand, changes in international commodity markets and other factors. If there is a substantial increase in prices for these commodities, our Restaurant Group companies' results of operations may be negatively affected. In addition, the Restaurant Group companies' restaurants are dependent upon frequent deliveries of perishable food products that meet certain specifications. Shortages or interruptions in the supply of perishable food products caused by unanticipated demand, problems in production or distribution, disease or food-borne illnesses, inclement weather or other conditions could adversely affect the availability, quality, and cost of ingredients, which would likely lower revenues, damage the Restaurant Group companies' reputation or otherwise harm our business.
The Restaurant Group companies are also subject to the general risks of inflation. The performance of our Restaurant Group companies' business is also adversely affected by increases in the price of utilities, such as natural gas, whether as a result of inflation, shortages or interruptions in supply, or otherwise. The Restaurant Group companies' business will also incur significant costs for insurance, labor, marketing, taxes, real estate, borrowing and litigation, all of which could increase due to inflation, changes in laws and regulations, competition or other events beyond the Restaurant Group companies' control.
Negative customer experiences or negative publicity surrounding our Restaurant Group companies' restaurants or other restaurants could adversely affect sales in one or more of our Restaurant Group companies' restaurants and make our concepts less valuable, which could have a material adverse effect on our business, financial condition and results of operations.
Because we believe our Restaurant Group companies' success depends significantly on their ability to provide exceptional food quality, outstanding service and an excellent overall dining experience, adverse publicity, whether or not accurate, relating to food quality, public health concerns, illness, safety, injury or government or industry findings concerning our Restaurant Group companies' restaurants, restaurants operated by other food service providers or others across the food industry supply chain could affect our Restaurant Group companies more than it would other restaurants that compete primarily on price or other factors. If customers perceive or experience a reduction in the food quality, service or ambiance at our Restaurant Group companies' restaurants or in any way believe our Restaurant Group companies' restaurants have failed to deliver a consistently positive experience, the value and popularity of one or more of our Restaurant Group companies' concepts could suffer. Further, because our restaurant businesses rely heavily on "word-of-mouth," as opposed to more conventional mediums of advertisement, to establish concept recognition, our restaurant businesses may be more adversely affected by negative customer experiences than other dining establishments, including those of our restaurant businesses' competitors.
Our restaurant businesses could suffer due to reduced demand for our restaurant businesses' brands or specific menu offerings if our restaurant businesses are the subject of negative publicity or litigation regarding allegations of food-related contaminations or illnesses, which could have a material adverse effect on our business, financial condition and results of operations.
Food safety is a top priority, and our Restaurant Group companies dedicate substantial resources to ensuring that their customers enjoy safe, quality food products. Food-related contaminations and illnesses may be caused by a variety of food-borne pathogens, such as e-coli or salmonella, which are frequently carried on unwashed fruits and vegetables, from a variety of illnesses transmitted by restaurant workers, such as hepatitis A, which may not be diagnosed prior to being infectious, and from contamination of food by foreign substances. Contamination and food borne illness incidents could also be caused at the point of source or by food suppliers and distributors. As a result, we cannot control all of the potential sources of contamination or illness that can be contained in or transmitted from our Restaurant Group companies' food. Regardless of the source or cause, any report of food-borne illnesses or other food safety issues including food tampering or contamination, at one of our Restaurant Group companies' restaurants could adversely affect the reputation of our Restaurant Group companies' brands and have a negative impact on their sales. Even instances of food-borne illness, food tampering or food contamination occurring solely at restaurants of our Restaurant Group companies' competitors or at one of our Restaurant Group companies' suppliers could result in negative publicity about the food service industry generally and adversely impact our Restaurant Group companies' sales.
7
If any person becomes injured or ill, or alleges becoming injured or ill, as a result of eating our Restaurant Group companies' food, our Restaurant Group companies may temporarily close some restaurants or their bakery facilities, which would decrease their revenues, and our restaurant businesses may be liable for damages or be subject to governmental regulatory action, either of which could have long-lasting, negative effects on our restaurant businesses' reputation, financial condition and results of operations, regardless of whether the allegations are valid or whether our restaurant businesses are found liable. The occurrence of food-borne illnesses or food safety issues could also adversely affect the price and availability of affected ingredients, resulting in higher costs and lower margins.
Our Restaurant Group companies' failure to comply with government regulation, and the costs of compliance or non-compliance, could have a material adverse effect on our business, financial condition and results of operations.
The Restaurant Group companies are subject to various federal, state and local laws and regulations affecting their business. Each of their restaurants and their bakery division are subject to licensing and regulation by a number of federal, state and local governmental authorities, which may include, among others, alcoholic beverage control, health and safety, nutritional menu labeling, health care, environmental and fire agencies. Difficulty in obtaining or failure to obtain the required licenses, including liquor or other licenses, permits or approval could delay or prevent the development of a new restaurant in a particular area. Additionally, difficulties or inabilities to retain or renew licenses, or increased compliance costs due to changed regulations, could adversely affect operations at existing restaurants.
While only approximately 9% of the Restaurant Group companies' consolidated restaurant sales in 2017 were attributable to the sale of alcoholic beverages, approximately 19% of the restaurant sales at Ninety Nine were attributable to the sale of alcoholic beverages in 2017. Alcoholic beverage control regulations require each restaurant to apply to a state authority and, in certain locations, county or municipal authorities for a license or permit to sell alcoholic beverages on the premises and to provide service for extended hours and on Sundays. Typically, licenses must be renewed annually and may be revoked or suspended for cause at any time. Alcoholic beverage control regulations relate to numerous aspects of daily operations of the Restaurant Group companies' restaurants, including minimum ages of patrons and employees, hours of operation, advertising, training, wholesale purchasing, inventory control and the handling, storage and dispensation of alcoholic beverages. The failure of a restaurant to obtain or retain liquor or food service licenses would adversely affect the restaurant's operations.
Our restaurant businesses' operations are also subject to federal and state labor laws, including the Fair Labor Standards Act of 1938, as amended, governing such matters as minimum wages, overtime, tip credits and worker conditions. The Restaurant Group companies' employees who receive tips as part of their compensation, such as servers, are generally paid at a minimum wage rate, after giving effect to applicable tip credits. The Restaurant Group companies rely on their employees to accurately disclose the full amount of their tip income, and they base their Federal Insurance Contributions Act tax reporting on the disclosures provided to them by such tipped employees. Significant numbers of these personnel are paid at rates related to the applicable minimum wage and thus, further increases in the federal or state minimum wage or other changes in these laws could increase our Restaurant Group companies' labor costs. Their ability to respond to minimum wage increases by increasing menu prices will depend on the responses of their competitors and customers.
In 2010, the Patient Protection and Affordable Care Act of 2010 (the "PPACA
"
) was signed into law in the U.S. to require healthcare coverage for many uninsured individuals and expand coverage to those already insured. Starting in 2015, the PPACA required the Restaurant Group companies to offer healthcare benefits to all full-time employees (including full-time hourly employees) that meet certain minimum requirements of coverage and affordability, or face penalties. Continued compliance with the requirements of the PPACA and rising costs of healthcare may impose additional administrative costs. The costs and other effects of these healthcare requirements are not anticipated to have a significant effect on our business, financial condition or results of operations in fiscal year 2018 but they may significantly increase our Restaurant Group companies' healthcare coverage costs in future periods and could have a material adverse effect on our business, financial condition and results of operations.
Additionally, the PPACA, in part, amended the federal Food, Drug and Cosmetic Act, to require chain restaurants with 20 or more locations in the U.S. to comply with federal nutritional disclosure requirements. Although the Food and Drug Administration ("FDA
"
) has published final regulations to implement the nutritional menu labeling provisions, it has extended the compliance date until May 7, 2018, for those covered by the rule. We do not expect our restaurant businesses to incur any material costs from compliance with this provision, but cannot anticipate any changes in customer behavior resulting from the implementation of this portion of the law, which could have an adverse effect on our Restaurant Group companies' sales and results of operations. A number of states, counties and cities have also enacted menu labeling laws requiring multi-unit restaurant operators to disclose certain nutritional information to customers, or have enacted legislation restricting the use of certain types of ingredients in restaurants. Many of these requirements are inconsistent or are interpreted differently from one jurisdiction to another.
There is also a potential for increased regulation of certain food establishments in the U.S., where compliance with Hazard Analysis & Critical Control Points ("HACCP") management systems may now be required. HACCP refers to a management system in which food safety is addressed through the analysis and control of potential hazards from raw material production, procurement and handling, to manufacturing, distribution and consumption of the finished product. Many states have required
8
restaurants to develop and implement HACCP programs and the U.S. government continues to expand the sectors of the food industry that must adopt and implement HACCP programs. For example, the Food Safety Modernization Act, signed into law in January 2011, granted the FDA new authority regarding the safety of the entire food system, including through increased inspections and mandatory food recalls. We anticipate that the new requirements may impact the restaurant industry. Additionally, our Restaurant Group companies' suppliers may initiate or otherwise be subject to food recalls that may impact the availability of certain products, result in adverse publicity or require the Restaurant Group companies' to take actions that could be costly for them or otherwise harm their business.
In addition, in order to develop and construct restaurants, the Restaurant Group companies must comply with applicable zoning, land use and environmental regulations. Such regulations have not had a material effect on its operations to date, but more stringent and varied requirements of local governmental bodies could delay or prevent construction and increase development costs for new restaurants. The Restaurant Group companies are also subject to federal and state laws which prohibit discrimination and other accessibility standards as mandated by the Americans with Disabilities Act (the "ADA"), which generally, among other things, prohibits discrimination in accommodation or employment based on disability. The ADA became effective as to public accommodations and employment in 1992. Pursuant to the ADA, our restaurant businesses may in the future have to modify restaurants, by adding access ramps or redesigning certain architectural fixtures for example, to provide service to or make reasonable accommodations for disabled persons. While these expenses could be material, the Restaurant Group companies' current expectation is that any such actions will not require substantial capital expenditures.
The Restaurant Group companies are subject to a variety of federal, state and local laws and regulations relating to the use, storage, discharge, emission and disposal of hazardous materials. There also has been increasing focus by the U.S. on other environmental matters, such as climate change, the reduction of greenhouse gases and water consumption. This increased focus may lead to new initiatives directed at regulating an as yet unspecified array of environmental matters, such as the emission of greenhouse gases, and "cap and trade" initiatives could effectively impose a tax on carbon emissions. Legislative, regulatory or other efforts to combat climate change or other environmental concerns could result in future increases in the cost of raw materials, commodities, taxes, transportation and utilities, which could decrease our Restaurant Group companies' operating profits and necessitate future investments in facilities and equipment.
The Restaurant Group companies are subject to laws and regulations relating to information security, privacy, cashless payments, gift cards and consumer credit, protection and fraud, and any failure or perceived or alleged failure to comply with these laws and regulations could harm their reputation or lead to litigation, which could have a material adverse effect on our financial condition and results of operations.
The impact of current laws and regulations, the effect of future changes in laws or regulations that impose additional requirements and the consequences of litigation relating to current or future laws and regulations, or an insufficient or ineffective response to significant regulatory or public policy issues, could increase our Restaurant Group companies' cost structure or lessen their operational efficiencies and talent availability, and therefore have a material adverse effect on our financial condition and results of operations. Failure to comply with the laws and regulatory requirements of federal, state and local authorities could result in, among other things, revocation of required licenses, administrative enforcement actions, fines and civil and criminal liability. Compliance with these laws and regulations can be costly and can increase the Restaurant Group companies' exposure to litigation or governmental investigations or proceedings.
Restaurant companies, including our restaurant companies, are the target of claims and lawsuits from time to time in the ordinary course of business. Proceedings of this nature, if successful, could result in our payment of substantial costs and damages, which could have a material adverse effect on our business, financial condition and results of operations.
Our Restaurant Group companies and other restaurant companies have been subject to claims and lawsuits alleging various matters from time to time in the ordinary course of business, including those that follow. Claims and lawsuits may include class action lawsuits, alleging violations of federal and state laws regarding workplace and employment matters, discrimination and similar matters. A number of these lawsuits have resulted in the payment of substantial damages by the defendants. Similar lawsuits have been instituted from time to time alleging violations of various federal and state wage and hour laws regarding, among other things, employee meal deductions, the sharing of tips amongst certain employees, overtime eligibility of assistant managers and failure to pay for all hours worked. Although our restaurant businesses will maintain what we believe to be adequate levels of insurance, insurance may not be available at all or in sufficient amounts to cover any liabilities with respect to these matters. Accordingly, if our restaurant businesses are required to pay substantial damages and expenses as a result of these types or other lawsuits, such payments or expenses could have a material adverse effect on our business and results of operations.
Occasionally, our Restaurant Group companies' customers may file complaints or lawsuits against the Restaurant Group companies alleging that they are responsible for some illness or injury the customers suffered at or after a visit to one of the Restaurant Group companies' restaurants, including actions seeking damages resulting from food-borne illness and relating to notices with respect to chemicals contained in food products required under state law. Our Restaurant Group companies may also be subject to a variety of other claims from third parties arising in the ordinary course of their business, including personal injury
9
claims, contract claims and claims alleging violations of federal and state laws. In addition, most of our Restaurant Group companies' restaurants are subject to state "dram shop" or similar laws which generally allow a person to sue our restaurant businesses if that person was injured by a legally intoxicated person who was wrongfully served alcoholic beverages at one of our Restaurant Group companies' restaurants. The restaurant industry has also been subject to a growing number of claims that the menus and actions of restaurant chains have led to the obesity of certain of their customers. In addition, the Restaurant Group companies may also be subject to lawsuits from their employees or others alleging violations of federal and state laws regarding workplace and employment matters, discrimination and similar matters. A number of these lawsuits in the restaurant industry have resulted in the payment of substantial damages by the defendants.
Additionally, certain of the Restaurant Group companies' tax returns and employment practices are subject to audits by the IRS and various state tax authorities. Such audits could result in disputes regarding tax matters that could lead to litigation that would be costly to defend or could result in the payment of additional taxes, which could have a material adverse effect on our business, results of operations and financial condition.
Regardless of whether any claims against the Restaurant Group companies are valid or whether they are liable, claims may be expensive to defend and may divert resources away from their operations. In addition, such claims may generate negative publicity, which could reduce customer traffic and sales. Although our restaurant businesses will maintain what they believe to be adequate levels of insurance, insurance may not be available at all or in sufficient amounts to cover any liabilities with respect to these or other matters. Defense costs, even for unfounded claims, or a judgment or other liability in excess of our restaurant businesses' insurance coverage for any claims or any adverse publicity resulting from claims could have a material adverse effect on our business, results of operations and financial condition.
The Restaurant Group companies rely heavily on information technology and any material failure, interruption, or security breach in their systems could have a material adverse effect on our business, financial condition and results of operations.
The Restaurant Group companies rely heavily on information technology systems across their operations and corporate functions, including for order and delivery from suppliers and distributors, point-of-sale processing in their restaurants, management of their supply chains, payment of obligations, collection of cash, bakery production, data warehousing to support analytics, finance or accounting systems, labor optimization tools, gift cards, online business and various other processes and transactions, including the storage of employee and customer information. The Restaurant Group companies' ability to effectively manage their business and coordinate the production, distribution and sale of their products will depend significantly on the reliability and capacity of these systems. In August 2015, the Restaurant Group companies upgraded their information systems using a third-party provider. However, the failure of these systems to operate effectively, maintenance problems or problems with transitioning to upgraded or replacement systems could cause delays in product sales and reduced efficiency of our restaurant businesses' operations, and significant capital investments could be required to remediate the problem.
The regulatory environment surrounding information security and privacy is increasingly demanding, with the frequent imposition of new and constantly changing requirements. Compliance with these requirements may result in cost increases due to necessary systems changes and the development of new administrative processes. In addition, customers and employees have a high expectation that our restaurant businesses will adequately protect their personal information. The majority of our restaurant businesses' restaurant sales are by credit or debit cards. We and other restaurants and retailers have experienced security breaches in which credit and debit card information of their customers has been stolen. For example, a cyber-security investigation at O'Charley's identified signs of unauthorized access to the payment card network of O'Charley's restaurants from March 18, 2016 to April 8, 2016, during which period credit cards used at all O'Charley's restaurants (other than three franchised locations) may have been affected. In connection with this matter, ABRH has reimbursed Fifth Third Bank for fines arising under the MasterCard Security Rules and Procedures (Merchant Edition) in the amount of
$0.6 million
. ABRH has also reimbursed Fifth Third Bank for an assessment under the VISA Global Compromised Account Recovery (GCAR) rules and PCI penalty in the amount of
$1.8 million
. ABRH has received insurance reimbursements equal to
$2.0 million
relating to the MasterCard and VISA assessments. Any additional amounts imposed by other card issuers will depend on a variety of factors, including the specific facts and circumstances of the incident (e.g., how many cards were used to make unauthorized purchases) and the exercise of discretion by each card network. O’Charley’s could also face lawsuits by individual cardholders for unauthorized charges if the individuals are not fully compensated by the card brands. However, individual cardholders generally have no liability for unauthorized charges under the card brand rules, and O’Charley’s has received no notice of any such lawsuits to date.
In addition, any breach in customer payment information could result in investigations by the U.S. Secret Service Electronic Crimes Task Force ("ECTF") and increased cost in our restaurant businesses' efforts to cooperate with the ECTF.
The Restaurant Group companies also maintain certain personal information regarding their employees. In addition to government investigations, the Restaurant Group companies may in the future become subject to lawsuits or other proceedings for purportedly fraudulent transactions arising out of the actual or alleged theft of their customers' credit or debit card information or if customer or employee information is obtained by unauthorized persons or used inappropriately. If the Restaurant Group companies fail to comply with these laws and regulations or experience a significant breach of customer, employee or company
10
data, their reputation could be damaged and they could experience lost sales, fines or lawsuits. Additionally, if a person is able to circumvent the security measures intended to protect our Restaurant Group companies' employee or customer private data, he or she could destroy or steal valuable information and disrupt our restaurant businesses' operations. The Restaurant Group companies may also be required to incur additional costs to modify or enhance their systems in order to prevent or remediate any such attacks.
The success of the Restaurant Group depends, in part, on its intellectual property, which we may be unable to protect.
We regard our service marks, including "O'Charley's", "Ninety Nine", "Village Inn", "Legendary Baking", and "Bakers Square", and other service marks and trademarks as having significant value and as being important factors in the marketing of our restaurants. We have also obtained trademarks for several of our menu items and for various advertising slogans. We are aware of names and marks similar to our service marks and trademarks used by other persons in certain geographic areas where we have restaurants. We believe such uses will not adversely affect us and our policy is to pursue registration of our marks whenever possible and to oppose vigorously any infringement of our marks.
We license the use of our registered trademarks and service marks to franchisees and third parties through franchise arrangements and licenses. The franchise and license arrangements restrict franchisees' and licensees' activities with respect to the use of our trademarks and service marks, and impose quality control standards in connection with goods and services offered in connection with the trademarks and service marks.
Occasionally, third parties may assert that we are, or may be, infringing on or misappropriating their intellectual property rights. In these cases, we intend to defend against claims or negotiate licenses when we consider these actions appropriate. Intellectual property cases are uncertain and involve complex legal and factual questions. If we become involved in this type of litigation, it could consume significant resources and divert our attention from business operations.
If we are found to infringe on the intellectual property rights of others, we could incur significant damages, be enjoined from continuing to use certain marks, or be required to obtain a license to continue using the affected marketing and promotional materials. A license could be very expensive to obtain or may not be available at all. Similarly, changing our marketing plan to avoid infringing the rights of others may be costly or impracticable.
Factors Relating to Ceridian
General economic factors could have a material adverse effect on Ceridian's financial performance and on our business, financial condition and results of operations.
General economic conditions and trade, monetary and fiscal policies impact Ceridian's business and the industries it serves. The Ceridian business has been negatively affected in the past by weak global and U.S. and Canadian economic environments which have included high unemployment rates, low interest rates and soft retail sales. Although elements of the challenging economic environment have become more favorable or stabilized in at least the U.S. and Canada, a prolonged slowdown in the economy or other economic conditions affecting overall unemployment levels, business and consumer spending and retail strength may adversely affect Ceridian's operating results by, among other things, decreasing its revenue through low customer employee counts or amounts of employee wage and bonus payments, diminished or slowing customer orders and timing of product installations and reduced spending on outsourcing or pressure to renegotiate existing contacts. Additionally, lower interest rates and risk associated with certain investment options have caused a decrease in Ceridian's revenue from interest in customer funds held in trust. Should global economic conditions deteriorate, the related impact on available credit may also adversely affect Ceridian or its business partners and customers by reducing access to capital or credit, increasing cost of debt and limiting ability to manage interest rate risk, and increasing the risk of bankruptcy of parties with which Ceridian does business, including credit or debt related counterparties. Such economic conditions and uncertainties may also adversely affect Ceridian and its business partners and customers through increased investment related risks by decreasing liquidity and/or increasing investment losses. In addition, Ceridian is dependent upon various large banks to execute payment transactions as part of its client payroll and tax services.
Failure to comply with anti-corruption laws and regulations, anti-money laundering laws and regulations, economic and trade sanctions and similar laws could have a material adverse effect on Ceridian's reputation, and on our business, financial condition and results of operations.
Regulators worldwide are exercising heightened scrutiny with respect to anti-corruption, anti-money laundering laws and regulations and economic and trade sanctions. Such heightened scrutiny has resulted in more aggressive enforcement of such laws and more burdensome regulations, which could adversely impact Ceridian's business. We will operate Ceridian around the world, including in some economies where companies and government officials may be more likely to engage in business practices that are prohibited by domestic and foreign laws and regulations, including the U.S. Foreign Corrupt Practices Act ("FCPA") and the U.K. Bribery Act. Such laws generally prohibit improper payments or offers of payments to foreign government officials and leaders of political parties, and in some cases, to other persons, for the purpose of obtaining or retaining business. Ceridian will also be subject to economic and trade sanctions programs, including those administered by the U.S. Treasury Department's Office of Foreign Assets Control, which prohibit or restrict transactions or dealings with specified countries, their governments, and in
11
certain circumstances, their nationals, and with individuals and entities that are specially designated, including narcotics traffickers and terrorists or terrorist organizations, among others.
Ceridian has implemented policies and procedures to monitor and address compliance with applicable anti-corruption laws and regulations and economic and trade sanctions, and annually reviews and evaluates the suitability of its policies; however, there can be no assurance that none of Ceridian's employees, consultants or agents will take actions in violation of these policies, for which Ceridian may be ultimately responsible, or that Ceridian's policies and procedures will be adequate or will be determined to be adequate by regulators. Any violations of applicable anti-corruption laws and regulations or economic and trade sanctions could limit certain of Ceridian's business activities until they are satisfactorily remediated and could result in civil and criminal penalties, including fines that could damage its reputation and have a material adverse effect on our business, financial condition and results of operations. Further, bank regulators are imposing additional and stricter requirements on banks to ensure they are meeting their obligations under The Bank Secrecy Act of 1970, as amended by the USA PATRIOT Act of 2001, and banks are, therefore, placing increased scrutiny on vendors and partners. As a result, Ceridian's banking partners may limit the scope of services they provide to Ceridian or may impose additional requirements on Ceridian. These regulatory restrictions on banks and changes to banks' internal risk-based policies and procedures may place an additional burden on Ceridian operations, or may require Ceridian to change the manner in which it conducts some aspects of its business, which may decrease its revenues and earnings and could have a material adverse effect on our business, financial condition and results of operations.
Ceridian's indebtedness could have a material adverse effect on our business, financial condition and results of operations.
In November 2014, Ceridian HCM Holding Inc. entered in a senior secured credit facility (the "Ceridian Credit Facility") with Deutsche Bank AG New York Branch, as administrative agent and collateral agent and Deutsche Bank AG Canada Branch, as Canadian sub-agent, and the lenders from time to time party thereto. The Ceridian Credit Facility provides for (i) a revolving credit facility with aggregate commitments in the amount of $130.0 million (the "Ceridian Revolver") consisting of an $88.4 million sub-facility for U.S. Dollar revolving loans and a $41.6 million sub-facility for multicurrency revolving loans and (ii) a term loan in the initial principal amount of $702.0 million (the "Ceridian Term Loan"), plus an accordion feature granting Ceridian the ability to increase the size of the facilities on the terms specified in the Ceridian Credit Facility. In October 2013, Ceridian issued senior unsecured notes due 2021 (the "Ceridian Notes", and together with the Ceridian Credit Facility, the "Ceridian Debt Facilities") pursuant to that certain Indenture with Wells Fargo Bank National Association in an original principal amount of $475.0 million. As of
December 31, 2017
, the Ceridian Revolver had no outstanding principal amount, the Ceridian Term Loan had an aggregate outstanding principal amount of $657.3 million and the Ceridian Notes had an aggregate outstanding principal amount of $475.0 million.
The Ceridian Debt Facilities contain, among other things, restrictive covenants that limit Ceridian and its subsidiaries' ability to finance future operations or capital needs or to engage in other business activities. The Ceridian Debt Facilities restrict, among other things, Ceridian's ability and the ability of its subsidiaries to incur additional indebtedness or issue guarantees, create liens on their respective assets, make distributions on or redeem equity interests, make investments, transfer or sell properties or other assets, and engage in mergers, consolidations or other fundamental change transactions, engage in transactions with affiliates and/or enter into burdensome agreements, in each case, subject to certain customary exceptions. In addition, if the usage of the Ceridian Revolver exceeds a specified threshold, the Ceridian Credit Facility will require Ceridian to meet a specified financial ratio.
The Ceridian indebtedness, including the related restrictive covenants that impose operating and financial restrictions on Ceridian, and its other financial obligations could have important consequences to us, such as:
|
•
|
increasing Ceridian's vulnerability to general adverse economic and industry conditions, which could place it at a competitive disadvantage compared to its competitors that have relatively less indebtedness;
|
|
•
|
requiring Ceridian to dedicate a substantial portion of its cash flow from operations to payments on Ceridian's indebtedness, thereby reducing funds available for working capital, capital expenditures, acquisitions, selling and marketing efforts, service and product development and other purposes;
|
|
•
|
exposing Ceridian to the risk of increased interest rates as certain of its borrowings, including borrowings under the Ceridian Credit Facility, are at variable rates of interest;
|
|
•
|
restricting Ceridian from making strategic acquisitions, causing it to make non-strategic divestitures, or limiting its ability to engage in acts that may be in its long-term best interests (including merging or consolidating with another person, selling or otherwise disposing of all or substantially all of Ceridian's assets, redeeming, repurchasing or retiring its capital stock, subordinated debt or certain other debt or incurring or guaranteeing additional debt);
|
|
•
|
limiting Ceridian's planning flexibility for, or ability to react to, changes in its business and the industries in which it operates; and
|
|
•
|
limiting Ceridian's ability to adjust to changing market conditions.
|
12
If Ceridian fails to make any required payment under its indebtedness or to comply with any of the financial and operating covenants related thereto, it will be in default. Ceridian's lenders could then vote to accelerate the maturity of the indebtedness and, in the case of the Ceridian Credit Facility, foreclose upon Ceridian and its subsidiaries' assets securing such indebtedness. Other creditors might then accelerate other indebtedness. If any of Ceridian's creditors accelerate the maturity of their indebtedness, Ceridian may not have sufficient assets to satisfy its obligations under its indebtedness.
A breach of Ceridian's security, loss of customer data or system disruption could have a material adverse effect on our business, financial condition and results of operations.
Ceridian is dependent on its respective payroll, transaction, financial, accounting and other data processing systems. Ceridian relies on these systems to process, on a daily basis, a large number of complicated transactions. Any security breach in these business processes and/or systems has the potential to impact Ceridian's customer information and its financial reporting capabilities which could result in the potential loss of business and its ability to accurately report financial results. If any of these systems fails to operate properly or becomes disabled even for a brief period of time, Ceridian could potentially lose control of customer data and Ceridian could suffer financial loss, a disruption of its businesses, liability to clients, regulatory intervention or damage to its reputation.
In addition, any issue of data privacy as it relates to unauthorized access to or loss of customer and/or employee information could result in the potential loss of business, damage to Ceridian's market reputation, litigation and regulatory investigation and penalties. Ceridian's continued investment in the security of its IT systems, continued efforts to improve the controls within its IT systems, business processes improvements, and the enhancements to its culture of information security may not successfully prevent attempts to breach its security or unauthorized access to confidential, sensitive or proprietary information.
In addition, in the event of a catastrophic occurrence, either natural or man-made, Ceridian's ability to protect its infrastructure, including client data, and maintain ongoing operations could be significantly impaired. Ceridian's business continuity and disaster recovery plans and strategies may not be successful in mitigating the effects of a catastrophic occurrence. If Ceridian's security is breached, confidential information is accessed or it experiences a catastrophic occurrence, such an occurrence could have a material adverse effect on our business and operating results.
Litigation and governmental inquiries, investigations and proceedings related to Ceridian could have a material adverse effect on our business, financial condition and results of operations.
Ceridian may be adversely affected by judgments, settlements, unanticipated costs or other effects of legal and administrative proceedings now pending or that may be instituted in the future, or from investigations by regulatory bodies or administrative agencies. From time to time in the ordinary course of business, Ceridian has had inquiries from regulatory bodies and administrative agencies relating to the operation of its business. It is Ceridian's practice to cooperate with such inquiries. Such inquiries may result in various audits, reviews and investigations. An adverse outcome of any investigation by, or other inquiries from, such bodies or agencies could have a material adverse effect on our business, financial condition and results of operations and result in the institution of administrative or civil proceedings, sanctions and the payment of fines and penalties, changes in personnel, and increased review and scrutiny of Ceridian by its customers, regulatory authorities, the media and others. Ceridian is also subject to claims and a number of judicial and administrative proceedings considered normal in the course of its current and past operations, including employment-related disputes, contract disputes, intellectual property disputes, government audits and proceedings, customer disputes and tort claims. Responding to such claims may be difficult and expensive, and Ceridian may not prevail. In some proceedings, the claimant seeks damages as well as other relief, which, if granted, would require expenditures on Ceridian's part. There can be no certainty that Ceridian may not ultimately incur charges in excess of presently or established future financial accruals or insurance coverage, or that Ceridian would prevail. Whether or not Ceridian prevails, such litigation may have a material adverse effect on our business, financial condition and results of operations.
The failure of Ceridian's business to comply with applicable laws could result in substantial taxes, penalties and liabilities that could have a material adverse effect on our business, financial condition and results of operations.
Ceridian is subject to various laws and regulations, and its failure to comply with such laws and regulations could adversely affect our business. For example, Ceridian's customers remit employer and employee tax funds to its businesses. Ceridian processes the data received from its customers and remits the funds along with a tax return to the appropriate taxing authorities when due. Under various service agreements with its customers, Ceridian assumes financial responsibility for the payment of the taxes, penalties and liabilities assessed against its customers arising out of its failure to fulfill its obligations under its agreements with these customers, unless these taxes, penalties or liabilities are attributable to the customer's failure to comply with the terms of the agreement the customer has with Ceridian. These taxes, penalties and liabilities could, in some cases, be substantial and could adversely affect Ceridian's business and operating results. Additionally, Ceridian's failure to fulfill its obligations under its customer agreements could adversely affect Ceridian's reputation, its relationship with its customers and its ability to gain new customers. In addition, mistakes may occur in connection with this service. Ceridian and its customers may be subject to penalties imposed by tax authorities for late filings or underpayment of taxes.
13
Ceridian is subject to risks related to its international operations, which could have a material adverse effect on our business, financial condition and results of operations.
Approximately 31% of Ceridian's revenue for the year ended December 31, 2017 was obtained from its international operations. Ceridian's Canada operations provide certain human capital management ("HCM
"
) services for Ceridian's Canadian customers. Ceridian is continuing to expand its international HCM business into other countries by (i) engaging a partner within a country to provide it with managed payroll administration and processing services for that country and (ii) expanding the features and functionality of its Dayforce product for use in such other countries. As such, Ceridian's international operations are subject to risks that could adversely affect those operations or its business as a whole, including costs of localizing products and services for foreign customers; difficulties in managing and staffing international operations; difficulties and increased expenses introducing corporate policies and controls in its international operations; difficulties with or inability to engage global partners; reduced or varied protection of intellectual property and other legal rights in some countries; longer sales and payment cycles; the burdens of complying with a wide variety of foreign laws; compliance with applicable anti-bribery laws, including the FCPA; exposure to legal jurisdictions that may not recognize or interpret customer contracts appropriately; potentially adverse tax consequences, including the complexities of foreign value added tax systems, restrictions on the repatriation of earnings and changes in tax rates; exposure to local economic and political conditions; and changes in currency exchange rates.
In addition, we anticipate that Ceridian's customers and potential customers may increasingly require and demand that a single vendor provide HCM solutions and services for their employees in a number of countries. If Ceridian is unable to provide the required services on a multinational basis, there may be a negative impact on its new orders and customer retention, which would negatively impact revenue and earnings. Although Ceridian has a multinational strategy, additional investment and efforts may be necessary to implement such strategy.
Factors Relating to T-System
The healthcare industry is heavily regulated at the local, state and federal levels. T-System's failure to comply with regulatory requirements could create liability for us, result in adverse publicity and negatively affect T-System's business.
The healthcare industry is heavily regulated and is constantly evolving due to the changing political, legislative and regulatory landscapes. In some instances, to the extent that they are subject to these laws and regulations, these regulations directly impact T-System's business. However, these regulations also impact T-System's business indirectly as, in a number of circumstances, T-System's solutions and services must be capable of being used by its customers in a way that complies with those laws and regulations, even though T-System's may not be directly regulated by the specific healthcare laws and regulations. There is a significant number of wide-ranging regulations, including regulations in the areas of healthcare fraud, e-prescribing, claims processing and transmission, medical devices, the security and privacy of patient data, the American Reinvestment and Recovery Act ("ARRA") meaningful use program, and interoperability standards, that may be directly or indirectly applicable to T-System's operations and relationships or the business practices of its customers.
Economic, market and other factors may cause a decline in spending for information technology and services by T-System's current and prospective customers which may result in less demand for its products, lower prices and, consequently, lower revenues and a lower revenue growth rate.
The purchase of T-System's information system involves a significant financial commitment by its customers. At the same time, the healthcare industry faces significant financial pressures that could adversely affect overall spending on healthcare information technology and services. For example, the recent actual and potential reductions in federal and state funding for Medicare and Medicaid has caused hospitals to reduce, eliminate or postpone information technology related and other spending. To the extent spending for healthcare information technology and services declines or increases slower than T-System's anticipates, demand for its products and services, as well as the prices it charges, could be adversely affected. Accordingly, we cannot assure you that T-System will be able to increase or maintain its revenues or its revenue growth rate.
If T-System's security is breached, it could be subject to liability, and clients could be deterred from using its products and services.
T-System's business relies on the secure electronic transmission, storage and hosting of sensitive information, including Protected Health Information ("PHI"), financial information and other sensitive information relating to its clients, company and workforce. As a result, T-System faces risk of a deliberate or unintentional incident involving unauthorized access to its computer systems or data that could result in the misappropriation or loss of assets or the disclosure of sensitive information, the corruption of data, or other disruption of its business operations. Similarly, denial-of-service, ransomware or other Internet-based attacks may range from mere vandalism of T-System's electronic systems to systematic theft of sensitive information and intellectual property. We believe that, in recent years, companies in T-System's industry have been targeted by such events with increasing frequency, primarily due to the increasing value of healthcare-related data.
14
Various risks could affect T-System's worldwide operations, exposing it to significant costs.
T-System conducts operations in the United States, India, and the Philippines, either directly or through its service providers. Such worldwide operations expose T-System to potential operational disruptions and costs as a result of a wide variety of events, including local inflation or economic downturn, currency exchange fluctuations, political turmoil, terrorism, labor issues, natural disasters, unfavorable intellectual property protection, and pandemics. Any such disruptions or costs could have a negative effect on T-System's ability to provide its services or meet its contractual obligations, the cost of its services, client and user satisfaction, its ability to attract or maintain clients and users, and, ultimately, its profits.
Factors Relating to the Company's Corporate and Other Businesses
Competition and technology may erode the Corporate and Other business franchises and result in lower earnings, which could have a material adverse effect on our business, financial condition and results of operations.
Each of the Corporate and Other businesses face intense competitive pressures within markets in which they operate. While we will manage our businesses with the objective of achieving long-term sustainable growth by developing and strengthening competitive advantages, many factors, including market and technology changes, may erode or prevent the strengthening of competitive advantages. Accordingly, future operating results will depend to some degree on whether our Corporate and Other businesses are successful in protecting or enhancing their competitive advantages. If our Corporate and Other businesses are unsuccessful in these efforts, our periodic operating results in the future may decline from current levels.
The Corporate and Other businesses, from time to time in the ordinary course of business, are involved in legal proceedings and may experience unfavorable outcomes, which could have a material adverse effect on our business, financial condition and results of operations.
The Corporate and Other businesses, from time to time in the ordinary course of business, are involved in pending and threatened litigation matters, some of which include claims for punitive or exemplary damages. These companies are also subject to compliance with extensive government laws and regulations related to employment practices and policies. The Corporate and Other businesses may not be able to successfully resolve these types of conflicts to their satisfaction, and these matters may involve claims for substantial amounts of money or for other relief that might necessitate changes to their business or operations. The defense of these actions may be both time consuming and expensive and their outcomes cannot be predicted with certainty. Determining reserves for pending litigation is a complex, fact-intensive process that requires significant legal judgment. It is possible that unfavorable outcomes in one or more such proceedings could result in substantial payments that could have a material adverse effect on the Corporate and Other businesses' cash flows in a particular period or on our business, financial condition and results of operations.
Failure to comply with, or changes in, laws or regulations applicable to the Corporate and Other businesses could have a material adverse effect on our business, financial condition and results of operations.
The Corporate and Other businesses will be subject to certain laws, such as certain environmental laws, takeover laws, anti-bribery and anti-corruption laws, escheat or abandoned property laws, and antitrust laws, that may impose requirements on us and them as an affiliated group. As a result, we could become jointly and severally liable for all or part of fines imposed on our Corporate and Other businesses or be fined directly for violations committed by these businesses, and such fines imposed directly on us could be greater than those imposed on such businesses. Compliance with these laws or contracts could also require us to commit significant resources and capital towards information gathering and monitoring thereby increasing our operating costs.
Similarly, the Corporate and Other businesses may be subject to contractual obligations which may impose obligations or restrictions on their affiliates. The interpretation of such contractual provisions will depend on local laws. Given that we do not control all of the Corporate and Other businesses and that they generally operate independently of each other, there is a risk that we could contravene one or more of such laws, regulations and contractual arrangements due to limited access and opportunities to monitor compliance. In addition, compliance with these laws or contracts could require us to commit significant resources and capital towards information gathering and monitoring thereby increasing our operating costs.
We need qualified personnel to manage and operate our Corporate and Other businesses, which could have a material adverse effect on our business, financial condition and results of operations.
In our decentralized business model, we need qualified and competent management to direct day-to-day business activities of our Corporate and Other businesses. Our Corporate and Other businesses also need qualified and competent personnel in executing their business plans and serving their customers, suppliers and other stakeholders. Changes in demographics, training requirements and the unavailability of qualified personnel could negatively impact our Corporate and Other businesses' ability to meet demands of customers to supply goods and services. Recruiting and retaining qualified personnel is important to all of our Corporate and Other businesses' operations. Although our Corporate and Other businesses have adequate personnel for the current business environment, unpredictable increases in demand for goods and services may exacerbate the risk of not having sufficient numbers of trained personnel, which could have a negative impact on our operating results, financial condition and liquidity.
15
Factors Relating to the Company's Investments
Our management may seek growth through acquisitions in lines of business that will not necessarily be limited to our current areas of focus or geographic areas. This expansion of our business subjects us to associated risks, such as the diversion of management's attention and lack of experience in operating such businesses, which could have a material adverse effect on our business, financial condition and results of operations.
We may make acquisitions in lines of business that are not directly tied to or synergistic with our current portfolio companies. Accordingly, we may in the future acquire businesses in industries or geographic areas with which management is less familiar than we are with our current businesses.
The acquisition and integration of any business we may acquire involves a number of risks and may result in unforeseen operating difficulties and expenditures in assimilating or integrating the businesses, technologies, products, personnel or operations of the acquired business. Furthermore, acquisitions may:
|
•
|
involve our entry into geographic or business markets in which we have little or no prior experience;
|
|
•
|
involve difficulties in retaining the customers of the acquired business;
|
|
•
|
involve difficulties and expense associated with regulatory requirements, competition controls or investigations;
|
|
•
|
result in a delay or reduction of sales for both us and the business we acquire; and
|
|
•
|
disrupt our ongoing business, divert our resources and require significant management attention that would otherwise be available for ongoing development of our current business.
|
To complete future acquisitions, we may determine that it is necessary to use a substantial amount of our cash or engage in equity or debt financing. If we raise additional funds through further issuances of equity or convertible debt securities, our existing stockholders could suffer significant dilution, and any new equity securities we issue could have rights, preferences and privileges senior to those of holders of our common stock. Any debt financing obtained by us in the future could involve restrictive covenants relating to our capital-raising activities and other financial and operational matters that make it more difficult for us to obtain additional capital in the future and to pursue other business opportunities, including potential acquisitions. In addition, we may not be able to obtain additional financing on terms favorable to us, if at all, which could limit our ability to engage in acquisitions. Moreover, we can make no assurances that the anticipated benefits of any acquisition, such as operating improvements or anticipated cost savings, would be realized or that we would not be exposed to unexpected liabilities in connection with any acquisition.
Further, an acquisition may negatively affect our operating results because it may require us to incur charges and substantial debt or other liabilities, may cause adverse tax consequences, substantial depreciation and amortization of deferred compensation charges, may require the amortization, write-down or impairment of amounts related to deferred compensation, goodwill and other intangible assets, may include substantial contingent consideration payments or other compensation that reduce our earnings during the quarter in which incurred, or may not generate sufficient financial return to offset acquisition costs.
We may often pursue investment opportunities that involve business, regulatory, legal or other complexities, which could have a material adverse effect on our business, financial condition and results of operations.
As an element of our investment style, we may pursue unusually complex investment opportunities. This could often take the form of substantial business, regulatory or legal complexity. Our tolerance for complexity may present risks, as such transactions can be more difficult, expensive and time-consuming to finance and execute; it may be more difficult to manage or realize value from the assets acquired in such transactions; and such transactions may sometimes entail a higher level of regulatory scrutiny or a greater risk of contingent liabilities. Any of these risks could harm our performance.
The loss of key personnel could impair our operating abilities and could have a material adverse effect on our business, financial condition and results of operations.
Our success will substantially depend on our ability to attract and retain key members of our senior management team and officers. If we lose one or more of these key employees, our operating results and in turn the value of our common stock could be materially adversely affected. Although we will have employment agreements with many of our officers, there can be no assurance that the entire term of the employment agreement will be served or that the employment agreement will be renewed upon expiration.
The due diligence process that we undertake in connection with new acquisitions may not reveal all facts that may be relevant in connection with an investment.
Before making acquisitions, we will conduct due diligence that we deem reasonable and appropriate based on the facts and circumstances applicable to each investment. When conducting due diligence, we may be required to evaluate important and complex business, financial, tax, accounting, environmental and legal issues. Outside consultants, legal advisers, accountants and investment banks may be involved in the due diligence process in varying degrees depending on the type of investment. Nevertheless, when conducting due diligence and making an assessment regarding an acquisition, we will rely on the resources
16
available to us, including information provided by the target of the investment and, in some circumstances, third party investigations. The due diligence investigation that we will carry out with respect to any opportunity may not reveal or highlight all relevant facts (including fraud) that may be necessary or helpful in evaluating such opportunity. Moreover, such an investigation will not necessarily result in the investment being successful.
Factors Relating to the Split-Off
We may incur material costs as a result of our separation from FNF, which could have a material adverse effect on our business, financial condition and results of operations.
We will incur costs and expenses not previously incurred as a result of our separation from FNF. These increased costs and expenses may arise from various factors, including financial reporting, costs associated with complying with the federal securities laws (including compliance with the Sarbanes-Oxley Act of 2002, tax administration and human resources related functions.) Although FNF will continue to provide many of these services for us at no-cost (other than reimbursement of FNF's out-of-pocket costs and expenses) under the corporate services agreement for up to three years following the Split-Off. If the corporate services agreement is not mutually terminated by Cannae Holdings and FNF prior to the expiration of the initial three-year term, the corporate services agreement will automatically renew for successive one-year terms on mutually agreeable arm's length terms unless FNF and Cannae Holdings mutually agree to terminate the agreement. We cannot assure you that we will not incur third-party vendor costs or out-of-pocket expenses under the corporate services agreement that are material to our business. Moreover, we will have to develop internal departments/functions to perform the services at the end of the term of the corporate services agreement.
Our company has an overlapping director and overlapping officers with FNF, which may lead to conflicting interests.
Four of our executive officers, Brent B. Bickett, Richard L. Cox, Michael L. Gravelle and David Ducommun, are also employed by FNF or FNF's subsidiaries and one of our directors, William P. Foley, II, also serves on the boards of directors of FNF or its subsidiaries. Our executive officers and members of our board of directors have fiduciary duties to our stockholders. Likewise, any such persons who serve in similar capacities at FNF or any other public company have fiduciary duties to that company's stockholders. We also are party to a variety of related party agreements and relationships with FNF and certain of FNF's subsidiaries and FNF and subsidiaries of FNF have an ownership interest in Cannae Holdings. From time to time, we may enter into transactions with FNF and/or its respective subsidiaries or other affiliates. There can be no assurance that the terms of any such transactions will be as favorable to our company, FNF or any of our or its respective subsidiaries or affiliates as would be the case where there is no overlapping officer or director.
Our inter-company agreements were negotiated while we were a subsidiary of FNF.
We have a number of inter-company agreements covering matters such as tax sharing and our responsibility for certain liabilities previously undertaken by FNF for certain of our businesses. In addition, we have entered into (i) a corporate services agreement with FNF, pursuant to which FNF provides to us certain "back office" services at no-cost (other than reimbursement of FNF's out-of-pocket costs and expenses), (ii) a voting agreement with FNF, pursuant to which FNF agrees to appear or cause all shares of Cannae Holdings common stock that FNF or its subsidiaries, as applicable, own after the Split-Off to be counted as present at any meeting of the stockholders of Cannae Holdings, for the purpose of establishing a quorum, and agrees to vote all of such Cannae Holdings shares (or cause them to be voted) in the same manner as, and in the same proportion to, all shares voted by holders of Cannae Holdings common stock (other than FNF and its subsidiaries), (iii) a registration rights agreement, pursuant to which FNF or its subsidiaries, as applicable, received registration rights with respect to the shares in Cannae held by FNF and (iv) a revolver note with FNF, pursuant to which Cannae Holdings may borrow revolving loans, the proceeds of which may be used for investment purposes and working capital needs, from FNF from time to time in an aggregate amount not to exceed $100.0 million. The terms of all of these agreements were established while we were a wholly-owned subsidiary of FNF, and hence may not be the result of arm's length negotiations. We believe that the terms of these inter-company agreements are commercially reasonable and fair to all parties under the circumstances; however, conflicts could arise in the interpretation or any extension or renegotiation of the foregoing agreements after the Split-Off.
Factors Relating to the Company's Common Stock and the Securities Market
If we are unable to satisfy the requirements of Section 404 of Sarbanes-Oxley, or our internal control over financial reporting is not effective, the reliability of our financial statements may be questioned and our stock price may suffer, which could have a material adverse effect on our business, financial condition and results of operations.
Section 404 of Sarbanes-Oxley requires any company subject to the reporting requirements of the U.S. securities laws to do a comprehensive evaluation of its and its consolidated subsidiaries' internal control over financial reporting. To comply with this statute, we will be required to document and test our internal control procedures, our management will be required to assess and issue a report concerning our internal control over financial reporting, and our independent auditors will be required to issue an opinion on management's assessment of those matters. Our compliance with Section 404 of Sarbanes-Oxley will first be tested in connection with the filing of our Annual Report on Form 10-K for the fiscal year ending December 31, 2018. The rules governing
17
the standards that must be met for management to assess our internal control over financial reporting are complex and require significant documentation, testing and possible remediation to meet the detailed standards under the rules.
During the course of its testing, our management may identify material weaknesses or significant deficiencies which may not be remedied in time to meet the deadline imposed by Sarbanes-Oxley. If our management cannot favorably assess the effectiveness of our internal control over financial reporting or our auditors identify material weaknesses in our internal controls, investor confidence in our financial results may weaken, and our stock price may suffer.
Our charter, bylaws and provisions of Delaware law may discourage or prevent strategic transactions, including a takeover of our company, even if such a transaction would be beneficial to our stockholders.
Provisions contained in our charter and bylaws and provisions of the Delaware General Corporate Law ("DGCL"), could delay or prevent a third party from entering into a strategic transaction with us, as applicable, even if such a transaction would benefit our stockholders. For example, our charter and bylaws:
|
•
|
authorize the issuance of "blank check" preferred stock that could be issued by us upon approval of our board of directors to increase the number of outstanding shares of capital stock, making a takeover more difficult and expensive;
|
|
•
|
provide that directors may be removed from office only for cause and that any vacancy on our board of directors may only be filled by a majority of our directors then in office, which may make it difficult for other stockholders to reconstitute our board of directors;
|
|
•
|
provide that special meetings of the stockholders may be called only upon the request of a majority of our board of directors or by our executive chairman, chief executive officer or president, as applicable;
|
|
•
|
require advance notice to be given by stockholders for any stockholder proposals or director nominees;
|
|
•
|
provide that directors are elected by a plurality of the votes cast by stockholders, which results in each director nominee elected by a plurality winning his or her seat upon receiving one "for" vote; and
|
|
•
|
provide that the board of directors is divided into three classes, as nearly equal in number as possible, with one class being elected at each annual meeting of stockholders, which could make it more difficult for a third party to acquire, or discourage a third party from seeking to acquire, control of Cannae.
|
These restrictions and provisions could keep us from pursuing relationships with strategic partners and from raising additional capital, which could impede our ability to expand our business and strengthen our competitive position. These restrictions could also limit stockholder value by impeding a sale of our company.
|
Item 1B.
|
Unresolved Staff Comments
|
None.
|
Item 2.
|
Properties
|
Our corporate headquarters are located in Las Vegas, Nevada in leased facilities.
Restaurant Group
. The Restaurant Group's headquarters are located in Nashville, Tennessee with other office locations in Woburn, Massachusetts and Denver, Colorado. The majority of the restaurants are leased from third parties, and are located in 40 states throughout the United States and Guam. Substantially all of our Restaurant Group's revenues are generated in those states.
Ceridian.
The principal executive offices of Ceridian HCM are located in Minneapolis, Minnesota and Toronto, Ontario. As of
December 31, 2017
, Ceridian's principal computer and office facilities are located in the metropolitan areas of Minneapolis, Minnesota; Atlanta, Georgia; Los Angeles, California; Chicago, Illinois; St. Petersburg, Florida; St. Louis, Missouri; Honolulu, Hawaii; Louisville, Kentucky; in Winnipeg, Manitoba, Montreal, Quebec, Ottawa, Ontario, Calgary, Alberta, Halifax, Nova Scotia, Charlottetown, Prince Edward Island, Canada; and in Ebene, Mauritius.
T-System
. T-System's headquarters are located in Dallas, Texas with other leased offices located in Kansas City, Kansas.
Corporate and Other.
The Golf & Real Estate segment of FNTR owns a 1,800 acre ranch-style luxury resort and residential community in Bend/Powell Butte, Oregon and an 18-hole championship golf facility located in Rock Creek, Idaho.
|
Item 3.
|
Legal Proceedings
|
For a description of our legal proceedings see discussion under
Legal and Regulatory Contingencies
in Note M.
Commitments and Contingencies
to our Consolidated and Combined Financial Statements included in Item 8 of Part II of this Annual Report, which is incorporated by reference into this Part I, Item 3.
18
|
Item 5.
|
Market for Registrant's Common Equity, Related Stockholder Matters and Issuer Purchases of Equity Securities
|
The Company's common stock trades on The New York Stock Exchange under the trading symbol "CNNE". The following table provides the high and low closing sales prices of our common stock and cash dividends declared per share of common stock during the fourth quarter of 2017. Our stock began trading on November 20, 2017.
|
Cannae Holdings, Inc.
|
Stock Price High
|
|
Stock Price Low
|
|
Cash Dividends
Declared
|
|||||
|
Year ended December 31, 2017
|
|
|
|
|
|
|
|
|
||
|
Fourth quarter
|
$
|
18.45
|
|
$
|
16.43
|
|
|
—
|
|
|
Information concerning securities authorized for issuance under our equity compensation plans will be included in Item 12 of Part III of this Annual Report.
19
PERFORMANCE GRAPH
Set forth below is a graph comparing cumulative total shareholder return on our Cannae Holdings ("CNNE") common stock against the cumulative total return on the S&P 500 Index and against the cumulative total return of a peer group index consisting of certain companies against which we compete for the period ending
December 31, 2017
. The peer group comparison has been weighted based on their stock market capitalization. The graph assumes an initial investment of $100.00 on November 20, 2017, the date which CNNE began trading.
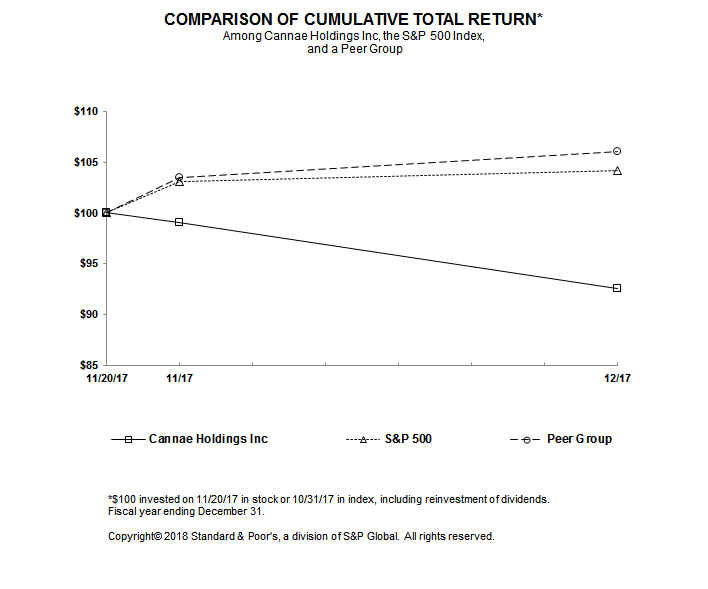
|
|
|
11/20/2017
|
11/30/2017
|
12/31/2017
|
|||
|
Cannae Holdings, Inc.
|
100.00
|
|
99.02
|
|
92.60
|
|
|
|
S&P 500
|
100.00
|
|
103.07
|
|
104.21
|
|
|
|
Peer Group (1)
|
100.00
|
|
103.49
|
|
106.02
|
|
|
(1) This peer group consists of the following companies: Apollo Global Management, LLC, Ares Capital Corporation, BlackRock, Inc., The Blackstone Group L.P., The Carlyle Group, Compass Diversified Holdings, KKR & Co. L.P., Leucadia National Corporation, Liberty Interactive Corporation, and Liberty Media Corporation.
On February 28, 2018, the last reported sale price of Cannae Holdings common stock on The New York Stock Exchange was $18.38 per share. We had approximately 5,215 shareholders of record of Cannae Holdings common stock.
We have not paid any dividends on our Cannae Holdings common stock, and our current Cannae Holdings dividend policy does not presently anticipate the payment of dividends.
Payment of dividends, if any, in the future will be determined by our Board of Directors in light of our earnings, financial condition and other relevant considerations.
20
On November 16, 2017, certain subsidiaries of FNF contributed an aggregate of $100.0 million to us in exchange for 5,706,134 shares of Cannae common stock.
|
Item 6.
|
Selected Financial Data
|
The information set forth below should be read in conjunction with the Consolidated and Combined Financial Statements and related notes and “Management’s Discussion and Analysis of Financial Condition and Results of Operations” included elsewhere in this Form 10-K. Certain reclassifications have been made to the prior year amounts to conform with the
2017
presentation.
See Note A
Business and Summary of Significant Accounting Policies
to our Consolidated and Combined Financial Statements for discussion of immaterial corrections of errors affecting the years ended December 31, 2016, 2015 and 2014.
On June 6, 2017, we closed on the sale of OneDigital for
$560.0 million
in an all-cash transaction.
The operations of One Digital are included in discontinued operations for the years ended December 31, 2017, 2016, and 2015.
We recognized a pre-tax gain of
$276.0 million
on the sale and
$126.3 million
in income tax expense, which are included in Net earnings from discontinued operations on the Consolidated and Combined Statement of Operations for the quarter ended June 30, 2017.
On
September 28, 2015
, we completed the distribution of J. Alexander's to FNFV shareholders. The results of J. Alexander's operations are included through the distribution date.
On December 31, 2014, we completed the distribution of Remy International, Inc. to FNFV shareholders. The operations of Remy are included in discontinued operations for the years ended December 31, 2014 and 2013.
|
|
As of December 31,
|
|||||||||||||||||
|
|
2017
|
2016
|
2015
|
2014
|
2013
|
|||||||||||||
|
|
||||||||||||||||||
|
Balance Sheet Data:
|
|
|
|
|
|
|
|
|
|
|
||||||||
|
Cash and cash equivalents
|
$
|
245.6
|
|
$
|
141.7
|
|
$
|
273.8
|
|
$
|
203.0
|
|
150.5
|
|
||||
|
Total assets
|
1,487.2
|
|
1,473.3
|
|
1,469.5
|
|
1,918.1
|
|
2,685.6
|
|
||||||||
|
Notes payable, long term
|
12.7
|
|
93.3
|
|
92.8
|
|
113.0
|
|
363.1
|
|
||||||||
|
Equity
|
1,153.1
|
|
1,009.8
|
|
1,056.5
|
|
1,483.6
|
|
1,700.6
|
|
||||||||
21
|
|
Year Ended December 31,
|
||||||||||||||||||
|
2017
|
2016
|
2015
|
2014
|
2013
|
|||||||||||||||
|
|
|||||||||||||||||||
|
Operating Data:
|
|
|
|
|
|
|
|
|
|
|
|||||||||
|
Operating revenue
|
$
|
1,169.5
|
|
$
|
1,178.4
|
|
$
|
1,414.7
|
|
$
|
1,453.8
|
|
$
|
1,426.1
|
|
||||
|
Expenses:
|
|
|
|
|
|
|
|
|
|
|
|||||||||
|
Operating Expenses:
|
|||||||||||||||||||
|
Cost of restaurant revenues
|
991.0
|
|
984.1
|
|
1,195.2
|
|
1,219.6
|
|
1,203.6
|
|
|||||||||
|
Personnel costs
|
103.2
|
|
68.3
|
|
85.4
|
|
110.7
|
|
135.7
|
|
|||||||||
|
Depreciation and amortization
|
49.3
|
|
44.7
|
|
49.8
|
|
53.2
|
|
55.1
|
|
|||||||||
|
Other operating expenses
|
104.4
|
|
83.5
|
|
96.4
|
|
90.6
|
|
71.5
|
|
|||||||||
|
Total operating expenses
|
1,247.9
|
|
1,180.6
|
|
1,426.8
|
|
1,474.1
|
|
1,465.9
|
|
|||||||||
|
Operating loss
|
(78.4
|
)
|
(2.2
|
)
|
(12.1
|
)
|
(20.3
|
)
|
(39.8
|
)
|
|||||||||
|
Total other income (expense), net
|
3.2
|
|
7.4
|
|
8.3
|
|
(1.4
|
)
|
(6.4
|
)
|
|||||||||
|
(Loss) earnings before income taxes, equity in earnings (loss) of unconsolidated affiliates, and noncontrolling interest
|
(75.2
|
)
|
5.2
|
|
(3.8
|
)
|
(21.7
|
)
|
(46.2
|
)
|
|||||||||
|
Income tax (benefit) expense
|
(16.6
|
)
|
(10.4
|
)
|
(19.7
|
)
|
160.3
|
|
(40.1
|
)
|
|||||||||
|
(Loss) earnings before equity in earnings (loss) of unconsolidated affiliates
|
(58.6
|
)
|
15.6
|
|
15.9
|
|
(182.0
|
)
|
(6.1
|
)
|
|||||||||
|
Equity in earnings (loss) of unconsolidated affiliates
|
3.4
|
|
(29.5
|
)
|
(26.0
|
)
|
431.9
|
|
(30.1
|
)
|
|||||||||
|
(Loss) earnings from continuing operations, net of tax
|
(55.2
|
)
|
(13.9
|
)
|
(10.1
|
)
|
249.9
|
|
(36.2
|
)
|
|||||||||
|
Earnings from discontinued operations, net of tax
|
147.7
|
|
2.0
|
|
2.8
|
|
10.1
|
|
14.4
|
|
|||||||||
|
Net earnings (loss)
|
92.5
|
|
(11.9
|
)
|
(7.3
|
)
|
260.0
|
|
(21.8
|
)
|
|||||||||
|
Less: Net (loss) earnings attributable to noncontrolling interests
|
(16.3
|
)
|
0.5
|
|
15.6
|
|
3.8
|
|
13.4
|
|
|||||||||
|
Net earnings (loss) attributable to Cannae Holdings
|
$
|
108.8
|
|
$
|
(12.4
|
)
|
$
|
(22.9
|
)
|
$
|
256.2
|
|
$
|
(35.2
|
)
|
||||
|
Per Share Data:
|
|
|
|
|
|
|
|
|
|
|
|||||||||
|
Basic
|
|
|
|||||||||||||||||
|
Net (loss) earnings from continuing operations attributable to Cannae Holdings common shareholders (1)
|
$
|
(0.55
|
)
|
$
|
(0.21
|
)
|
$
|
(0.36
|
)
|
$
|
3.49
|
|
$
|
(0.70
|
)
|
||||
|
Net earnings from discontinued operations attributable to Cannae Holdings common shareholders (1)
|
2.09
|
|
0.03
|
|
0.04
|
|
0.14
|
|
0.20
|
|
|||||||||
|
Net earnings (loss) per share attributable to Cannae Holdings common shareholders (1)
|
$
|
1.54
|
|
$
|
(0.18
|
)
|
$
|
(0.32
|
)
|
$
|
3.63
|
|
$
|
(0.50
|
)
|
||||
|
Weighted average shares outstanding Cannae Holdings, basic basis (1)
|
70.6
|
|
70.6
|
|
70.6
|
|
70.6
|
|
70.6
|
|
|||||||||
|
Diluted
|
|||||||||||||||||||
|
Net (loss) earnings from continuing operations attributable to Cannae Holdings common shareholders (1)
|
$
|
(0.55
|
)
|
$
|
(0.21
|
)
|
$
|
(0.36
|
)
|
$
|
3.49
|
|
$
|
(0.70
|
)
|
||||
|
Net earnings from discontinued operations attributable to Cannae Holdings common shareholders (1)
|
2.09
|
|
0.03
|
|
0.04
|
|
0.14
|
|
0.20
|
|
|||||||||
|
Net earnings (loss) per share attributable to Cannae Holdings common shareholders (1)
|
$
|
1.54
|
|
$
|
(0.18
|
)
|
$
|
(0.32
|
)
|
$
|
3.63
|
|
$
|
(0.50
|
)
|
||||
|
Weighted average shares outstanding Cannae Holdings, diluted basis (1)
|
70.6
|
|
70.6
|
|
70.6
|
|
70.6
|
|
70.6
|
|
|||||||||
|
Cash dividends paid per share Cannae Holdings common stock
|
$
|
—
|
|
$
|
—
|
|
$
|
—
|
|
$
|
—
|
|
$
|
—
|
|
||||
|
Book value per share Cannae Holdings (1)
|
$
|
16.33
|
|
$
|
14.30
|
|
$
|
14.96
|
|
$
|
21.01
|
|
$
|
24.09
|
|
||||
______________________________________
|
(1)
|
On November 17, 2017, the date of the consummation of the Split-Off, 70.6 million common shares of CNNE were distributed to FNFV Group shareholders. For comparative purposes, the weighted average number of common shares outstanding and basic and diluted earnings per share for the years ended December 31, 2016, 2015, 2014 and 2013 were calculated using the number of shares distributed as if those shares were issued and outstanding beginning January 1, 2013.
|
22
Summary Quarterly Financial Data (Unaudited)
Selected quarterly financial data is as follows:
|
|
Quarter Ended
|
||||||||||||||
|
March 31,
|
June 30,
|
September 30,
|
December 31,
|
||||||||||||
|
2017:
|
|
|
|
|
|
|
|
|
|||||||
|
Operating revenue
|
$
|
275.3
|
|
$
|
295.5
|
|
$
|
281.3
|
|
$
|
317.4
|
|
|||
|
Loss before income taxes, equity in losses of unconsolidated affiliates, and noncontrolling interest
|
(2.2
|
)
|
(35.4
|
)
|
(21.2
|
)
|
(16.4
|
)
|
|||||||
|
Net earnings (loss) attributable to Cannae Holdings (1)
|
$
|
0.5
|
|
$
|
126.4
|
|
$
|
(16.6
|
)
|
$
|
(1.5
|
)
|
|||
|
Basic earnings (loss) per share attributable to Cannae Holdings common shareholders
|
$
|
—
|
|
$
|
1.79
|
|
$
|
(0.24
|
)
|
$
|
(0.02
|
)
|
|||
|
Diluted earnings (loss) per share attributable to Cannae Holdings common shareholders
|
$
|
—
|
|
$
|
1.79
|
|
$
|
(0.24
|
)
|
$
|
(0.02
|
)
|
|||
|
Cash dividends paid per share Cannae Holdings common stock
|
$
|
—
|
|
$
|
—
|
|
$
|
—
|
|
$
|
—
|
|
|||
|
2016:
|
|||||||||||||||
|
Operating revenue
|
$
|
295.4
|
|
$
|
298.1
|
|
$
|
281.9
|
|
$
|
303.0
|
|
|||
|
(Loss) earnings before income taxes, equity in losses of unconsolidated affiliates, and noncontrolling interest
|
(2.0
|
)
|
18.4
|
|
(4.3
|
)
|
(6.9
|
)
|
|||||||
|
Net earnings (loss) attributable to Cannae Holdings (1)
|
$
|
(0.4
|
)
|
$
|
16.4
|
|
$
|
(27.7
|
)
|
$
|
(0.7
|
)
|
|||
|
Basic earnings (loss) per share attributable to Cannae Holdings common shareholders
|
$
|
(0.01
|
)
|
$
|
0.23
|
|
$
|
(0.39
|
)
|
$
|
(0.01
|
)
|
|||
|
Diluted earnings (loss) per share attributable to Cannae Holdings common shareholders
|
$
|
(0.01
|
)
|
$
|
0.23
|
|
$
|
(0.39
|
)
|
$
|
(0.01
|
)
|
|||
|
Cash dividends paid per share Cannae Holdings common stock
|
$
|
—
|
|
$
|
—
|
|
$
|
—
|
|
$
|
—
|
|
|||
______________________________________
|
(1)
|
Net earnings (loss) attributable to Cannae Holdings ("Net Earnings") for previously reported quarterly information is different from the previously reported amounts in our Registration Statement and Form 10-Q due to immaterial corrections made during the fourth quarter of 2017. Net earnings for the quarters ended March 31, June 30, and September 30, 2017 increased (decreased) by $(0.2) million, $(1.5) million, and $(1.5) million, respectively from the previously reported amounts. Net Earnings for the quarters ended March 31, June 30, September 30, and December 31, 2016 decreased by $1.3 million, $1.3 million, $1.3 million and $2.6 million, respectively. See Note A
Business and Summary of Significant Accounting Policies
to our Consolidated and Combined Financial Statements for further discussion of immaterial corrections of errors.
|
23
|
Item 7.
|
Management's Discussion and Analysis of Financial Condition and Results of Operations
|
The following discussion should be read in conjunction with the Consolidated and Combined Financial Statements and the Notes thereto and Selected Financial Data included elsewhere in this Form 10-K.
Overview
For a description of our business, including descriptions of segments, see the discussion under Business in Item 1 of Part I of this Annual Report, which is incorporated by reference into this Part II, Item 7 of this Annual Report.
Recent Developments
On March 26, 2018, Ceridian HCM announced that it has filed a draft registration statement on Form S-1 with the SEC, which has not yet become effective, relating to the proposed initial public offering of its common stock. The number of shares of common stock to be sold and the price range for the proposed offering have not yet been determined. The initial public offering is expected to commence after the SEC completes its review process, subject to market and other conditions. Ceridian will apply to list its common stock on the New York Stock Exchange and on the Toronto Stock Exchange. Securities in Ceridian may not be sold nor may offers to buy be accepted prior to the time the registration statement becomes effective.
On March 13, 2018, Cannae entered into an Assignment and Assumption Agreement with ABRH's lenders to purchase all of the outstanding loans and lending commitments under the ABRH Credit Facility, as defined in Note K.
Notes Payable
to our Consolidated and Combined Financial Statements included in Item 8 of Part II of this Annual Report, which resulted in Cannae becoming ABRH's sole lender. Subsequent to the assignment, Cannae and ABRH entered into a Second Amendment to the Credit Agreement, as defined in Note K.
Notes Payable
to our Consolidated and Combined Financial Statements included in Item 8 of Part II of this Annual Report, to increase the interest rate to
10%
, suspend the financial covenants until March 31, 2019 and require ABRH to pay to Cannae an amendment fee equal to
2%
of the outstanding loan balance.
On March 12, 2018, Cannae Holdings and Newport Global Opportunities Fund I-AAIV ("Newport Global") signed a non-binding letter of intent pursuant to which American Blue Ribbon Holdings intends to distribute
95%
of its family dining group and Legendary Baking to Newport Global in
100%
redemption of Newport Global’s interest in American Blue Ribbon Holdings. This proposed transaction would leave Cannae with approximately
94%
of the interest in O’Charley’s and 99 Restaurants, LLC, a wholly-owned subsidiary of FNH ("99 Restaurants"), along with an approximately
5%
interest in the family dining group and Legendary Baking.
On February 1, 2018, Cannae Holdings, LLC (“Cannae LLC”), a Delaware limited liability company and a subsidiary of the Company, Fidelity Newport Holdings, LLC, a Delaware limited liability company and a majority-owned subsidiary of Cannae LLC (“FNH” and, together with Cannae LLC, the “Sellers”), 99 Restaurants, J. Alexander’s Holdings, Inc., a Tennessee corporation (“JAX”), J. Alexander’s Holdings, LLC, a Delaware limited liability company and direct, majority-owned subsidiary of JAX (“JAX OP”) and Nitro Merger Sub, Inc., a Tennessee corporation and wholly-owned subsidiary of JAX OP (“Merger Sub”) entered into a letter agreement to terminate their previously reported Agreement and Plan of Merger, dated as of August 3, 2017, by and among the Sellers, 99 Restaurants, JAX, JAX OP and Merger Sub (as amended on January 30, 2018, the “Merger Agreement”), pursuant to Section 9.1(b)(iii) thereof. The parties reached this decision following the conclusion of a special meeting of the shareholders of JAX held on February 1, 2018.
On January 29, 2018, the Board of Directors of the Company adopted a resolution increasing the size of the Company’s Board of Directors to
six
, and elected James B. Stallings, Jr. to serve on our Board of Directors. Mr. Stallings was appointed to serve as Chairman of the Audit Committee of the Company.
On November 17, 2017, Mr. Frank P. Willey was appointed to the Company’s Board of Directors.
On November 17, 2017, a special meeting of the FNFV Group stockholders was held to approve the Split-Off. The Split-Off was approved by a majority of the stockholders and was completed on November 17, 2017. As a result, Cannae is now a separate public company listed under the ticker symbol CNNE on The New York Stock Exchange.
On November 16, 2017, certain subsidiaries of FNF contributed an aggregate of
$100.0 million
to us (the "FNF Investment") in exchange for
5,706,134
shares of Cannae common stock. In addition, on November 17, 2017, FNF issued to Cannae a revolver note in aggregate principal amount of up to
$100.0 million
(the "FNF Revolver"), which accrues interest at LIBOR plus
450
basis points and matures on the
five
-year anniversary of the date of the revolver note. The maturity date is automatically extended for additional
five
-year terms unless notice of non-renewal is otherwise provided by either FNF or Cannae, in their sole discretion. The FNF Revolver replaces the Revolver Note discussed in Note K
Notes Payable
to our Consolidated and Combined Financial Statements included in Item 8 of Part II of this Annual Report.
On October 16, 2017, Fidelity National Financial Ventures LLC ("FNFV LLC"), a wholly-owned subsidiary of the Company, completed a merger pursuant to an Agreement and Plan of Merger (the ‘‘T-System Merger Agreement’’) with Project F Merger Sub LLC, a Delaware limited liability company and a wholly-owned subsidiary of FNFV LLC (‘‘T-System Merger Sub’’), T-
24
System Holding LLC, a Delaware limited liability company (‘‘T-System’’), and Francisco Partners II, L.P., a Delaware limited partnership, providing for the acquisition of T-System by FNFV LLC pursuant to the proposed merger (the ‘‘T-System Merger’’) of T-System with and into T- System Merger Sub, which resulted in T-System continuing as the surviving entity and wholly-owned subsidiary of FNFV LLC.
As a result of the T-System Merger, all of the outstanding securities of T-System were canceled, extinguished and converted into the right to receive a portion of the aggregate merger consideration in accordance with the terms of the T-System Merger Agreement. The aggregate merger consideration was equal to
$202.9 million
, in cash.
On June 6, 2017, we closed on the sale of Digital Insurance, Inc. ("OneDigital") for
$560.0 million
in an all-cash transaction. After repayment of debt, payout to option holders and a minority equity investor and other transaction related payments, the Company received
$331.4 million
from the sale, which includes
$326.0 million
in cash and
$5.4 million
in purchase price holdback receivable. We recognized a pre-tax gain of
$276.0 million
on the sale and
$126.3 million
in income tax expense which are included in Net earnings from discontinued operations on the Consolidated and Combined Statement of Operations for the year ended December 31, 2017. Income tax expense resulting from the gain was recorded as a discrete tax expense for the three months ended June 30, 2017 and included a permanent tax adjustment for nondeductible goodwill. We retained no ownership in OneDigital and have
no
continuing involvement with OneDigital as of the date of the sale.
As a result of the sale of OneDigital we have reclassified the assets and liabilities divested as assets and liabilities of discontinued operations in our Consolidated and Combined Balance Sheet as of December 31, 2016. Further, the financial results of OneDigital have been reclassified to discontinued operations for all periods presented in our Consolidated and Combined Statements of Operations. See Note N
Discontinued Operations
to our Consolidated and Combined Financial Statements included in Item 8 of Part II of this Annual Report for further details of the results of OneDigital.
Acquisitions and Dispositions
The results of operations and financial position of the entities acquired during any year are included in the Consolidated and Combined Financial Statements from and after the date of acquisition. In the years ended December 31, 2017, 2016 and 2015, we have made several acquisitions and dispositions of businesses. See Note B
Acquisitions and Dispositions
of our Consolidated and Combined Financial Statements included in Item 8 of Part II of this Annual Report for further discussion.
Related Party Transactions
Our financial statements for all years presented reflect transactions with FNF. See Note R
Related Party Transactions
of our Consolidated and Combined Financial Statements included in Item 8 of Part II of this Annual Report for further discussion.
Business Trends and Conditions
Restaurant Group
The restaurant industry is highly competitive and is often affected by changes in consumer tastes and discretionary spending patterns; changes in general economic conditions; public safety conditions or concerns; demographic trends; weather conditions; the cost of food products, labor, energy and other operating costs; and governmental regulations. Higher labor costs due to state and local minimum wage increases and shopping pattern shifts to e-commerce and “ready to eat” grocery and convenience stores have had a negative impact on restaurant performance, particularly in the casual and family dining restaurants in which the company operates.
The restaurant industry is also characterized by high capital investments for new restaurants and relatively high fixed or semi-variable restaurant operating expenses. Because of the high fixed and semi-variable expenses, changes in sales in existing restaurants are generally expected to significantly affect restaurant profitability because many restaurant costs and expenses are not expected to change at the same rate as sales. Restaurant profitability can also be negatively affected by inflationary and regulatory increases in operating costs and other factors. The most significant commodities that may affect our cost of food and beverage are beef, seafood, poultry, and dairy, which accounted for approximately half of our overall cost of food and beverage in the past. Generally, temporary increases in these costs are not passed on to guests; however, in the past, we have adjusted menu prices to compensate for increased costs of a more permanent nature.
Average weekly sales per restaurant are typically higher in the first and fourth quarters than in other quarters, and we typically generate a disproportionate share of our earnings from operations in the first and fourth quarters. Holidays, severe weather and other disruptive conditions may impact sales volumes seasonally in some operating regions.
Our revenues in future periods will continue to be subject to these and other factors that are beyond our control and, as a result, are likely to fluctuate.
Ceridian
25
Over the last several years, a number of factors have significantly affected Ceridian’s results of operations, including its capital restructuring resulting from the initial acquisition by Thomas H. Lee Partners, L.P., a Delaware limited partnership ("THL") and FNFV LLC of all of the outstanding equity of the Ceridian entities that was completed on November 9, 2007 (such acquisition, the "2007 Merger"), and related interest expense, accounting and purchase price allocations from the 2007 Merger, acquisition in 2012 of the Dayforce legal entities, and Ceridian’s corporate restructuring following the 2013 separation of Ceridian HCM and Comdata. Other factors that have affected Ceridian’s results of operations over the last several years include the levels of customer trust funds held, transaction volumes, price increases, foreign currency exchange rates, interest rates (including interest earned on customer trust funds and interest expense on debt), customer employment levels, and Ceridian's cost savings initiatives. Ceridian is subject to the risks arising from adverse changes in domestic and global economic conditions. Historically low interest rates continue to adversely affect Ceridian's business, having a negative impact on the interest income generated from funds held in trust for customers. Ceridian believes all of such factors may continue to significantly affect its results of operations.
T-System
The healthcare industry is impacted by several factors that can impact the business landscape in which T-System operates. In the past several years health care providers have shown a preference for single IT platforms across all venues. During this same time, there has been a push for interoperability across different healthcare IT systems due to the likelihood that a single patient will have medical information from multiple health care facilities or providers. Healthcare IT systems continue to face rising costs from factors such as legislative and regulatory reform, complex reimbursement models, and difficulties in electronic data exchange. These factors may continue to impact the results of T-System’s operations.
Critical Accounting Estimates
The accounting estimates described below are those we consider critical in preparing our Consolidated and Combined Financial Statements. Management is required to make estimates and assumptions that can affect the reported amounts of assets and liabilities and disclosures with respect to contingent assets and liabilities at the date of the Consolidated and Combined Financial Statements and the reported amounts of revenues and expenses during the reporting period. Actual amounts could differ from those estimates. See Note A of the Notes to Consolidated and Combined Financial Statements for additional description of the significant accounting policies that have been followed in preparing our Consolidated and Combined Financial Statements.
Valuation of Goodwill.
Goodwill represents the excess of cost over fair value of identifiable net assets acquired and assumed in a business combination. Goodwill and other intangible assets with indefinite useful lives are reviewed for impairment annually or more frequently if circumstances indicate potential impairment, through a comparison of fair value to the carrying amount. In evaluating the recoverability of goodwill, we perform an annual goodwill impairment analysis. We have the option to first assess goodwill for impairment based on a review of qualitative factors to determine if events and circumstances exist which will lead to a determination that the fair value of a reporting unit is greater than its carrying amount, prior to performing a full fair-value assessment. If, after assessing the totality of events or circumstances, the Company determines it is not more likely than not that the fair value of a reporting unit is less than its carrying amount, then performing the two-step impairment test is unnecessary. However, if the Company concludes otherwise, then it is required to perform the first step of the two-step impairment test by calculating the fair value of the reporting unit and comparing the fair value with the carrying amount of the reporting unit. If the carrying amount of a reporting unit exceeds its fair value, then the Company is required to perform the second step of the goodwill impairment test to measure the amount of the impairment loss, if any.
We completed annual goodwill impairment analyses in the fourth quarter of each respective year using a September 30 measurement date and as a result
no
goodwill impairments have been recorded. For the years ended December 31, 2017, 2016, and 2015, we determined that there were no events or circumstances which indicated that the carrying value exceeded the fair value.
Valuation of Other Intangible Assets.
We have other intangible assets, not including goodwill, which consist primarily of customer relationships and contracts, trademarks and tradenames which are generally recorded in connection with acquisitions at their fair value, franchise rights, the fair value of purchased software and capitalized software development costs. Intangible assets with estimable lives are amortized over their respective estimated useful lives to their estimated residual values and reviewed for impairment whenever events or changes in circumstances indicate that the carrying amount may not be recoverable. In general, customer relationships are amortized over their estimated useful lives using an accelerated method which takes into consideration expected customer attrition rates. Contractual relationships are generally amortized over their respective contractual lives. Trademarks are generally considered intangible assets with indefinite lives and are reviewed for impairment at least annually. Capitalized software development costs and purchased software are recorded at cost and amortized using the straight-line method over their estimated useful life. Useful lives of computer software range from
3
to
10
years. We also assess the recorded value of computer software for impairment on a regular basis by comparing the carrying value to the estimated future cash flows to be generated by the underlying software asset. There is an inherent uncertainty in determining the expected useful life of or cash flows to be generated from computer software.
26
We recorded
$2.9 million
of impairment expense related to a tradename in our Restaurant Group in the year ended December 31, 2017. We recorded
$1.1 million
in impairment expense to an abandoned software project in our Restaurant Group segment during the year ended December 31, 2015. We recorded
no
impairment expense related to other intangible assets in the year ended December 31, 2016.
Investment in Ceridian.
Our investment in Ceridian is accounted for using the equity method of accounting as we have the ability to exercise significant influence, but not control, over Ceridian. The carrying amount of a company accounted for using the equity method is adjusted quarterly by any change in its equity, including its historical earnings and losses, corresponding to our percentage interest in the company. We evaluate Ceridian quarterly for impairment to determine if circumstances indicate that we may not be able to recover the carrying value. We review recent revenue and earnings trends, and cash flows and discuss relevant impairment risk factors with Ceridian Management. For the years ended December 31, 2017, 2016 and 2015, we determined that there were no events or circumstances which indicated that the carrying value exceeded the fair value.
Accounting for Income Taxes.
We recognize deferred tax assets and liabilities for temporary differences between the financial reporting basis and the tax basis of our assets and liabilities and expected benefits of utilizing net operating loss and credit carryforwards. Deferred tax assets and liabilities are measured using enacted tax rates expected to apply to taxable income in the years in which those temporary differences are expected to be recovered or settled. The impact of changes in tax rates and laws on deferred taxes, if any, is applied to the years during which temporary differences are expected to be settled and reflected in the financial statements in the period enacted.
Refer to Note L
Income Taxes
of
our Consolidated and Combined Financial Statements included in Item 8 of Part II of this Annual Report for further discussion of the enactment of the Tax Cuts and Jobs Act ("Tax Reform") in December 2017 and the related impact on our accounting for income taxes.
Revenue Recognition.
Restaurant Group.
Restaurant revenue on the Consolidated and Combined Statements of Operations consists of restaurant sales, bakery operations, and to a lesser extent, franchise revenue and other revenue. Restaurant sales include food and beverage sales and are net of applicable state and local sales taxes and discounts. Revenue from bakery operations is recognized in the period during which the products are shipped to the customer. Franchise revenue and other revenue consist of development fees and royalties on sales by franchised units. Initial franchise fees are recognized as income upon commencement of the franchise operation and completion of all material services and conditions by the Company. Royalties are calculated as a percentage of the franchisee sales and recognized in the period in which the sales are generated. Revenue resulting from the sale of gift cards is recognized in the period in which the gift card is redeemed and is recorded as deferred revenue until recognized.
Cost of restaurant revenue on the Consolidated and Combined Statements of Operations consists of direct costs associated with restaurant revenue. We receive vendor rebates from various nonalcoholic beverage suppliers, and to a lesser extent, suppliers of food products and supplies. Rebates are recognized as reductions to cost of food and beverage in the period in which they are earned.
T-System.
T-System recognizes revenue when delivery has occurred, persuasive evidence of an arrangement exists, fees are fixed or determinable and collection is deemed probable. With respect to long-term licensing agreements, T-System recognizes only the portion of revenue that is earned during the current year with the remainder of the fee deferred to subsequent years. Revenues are recorded net of any sales taxes charged to customers.
T-System sells paper medical documentation templates to emergency care providers to be used for documentation of patient care on a fixed fee determined by a pricing sheet based on annual billable patient visits. Licenses are sold through one-time perpetual license fee arrangements and recurring fixed-term or subscription fee arrangements. Delivery is determined at the time the templates are provided to the customer and the customer's personnel has been trained. The license fee is billed and recognized upfront for onetime perpetual licenses and monthly for recurring fixed-term or subscription licenses after delivery has occurred. For customers that pay the license fee in advance for the full term of the contract, revenue is recognized ratably over the term of such contract.
T-System also sells an electronic version of the medical documentation system, provided in the form of a non-exclusive license to use the software at the sites under the agreement. The Company sells software licenses through one-time perpetual license fee arrangements and recurring fixed-term or subscription fee arrangements. For software licensing arrangements including multiple elements, each element of the arrangement is separately identified and accounted for based on vendor specific objective evidence ("VSOE") of stand-alone value of such element. Revenue is not recognized on any element in a software arrangement if the undelivered elements lack VSOE of stand-alone value. When the only undelivered element is post-contract support ("PCS") and PCS has VSOE, revenue is recognized ratably over the PCS term.
Corporate and Other.
Other operating revenue on the Consolidated and Combined Statements of Operations also consists of income generated by our resort operations which includes sales of real estate, lodging rentals, food and beverage sales, and other income from various resort services offered.
27
Certain Factors Affecting Comparability
Year ended December 31, 2017.
On October 16, 2017, we completed the T-System Merger. The results of operation of T-System subsequent to the T-System Merger are included in the T-System segment.
On June 6, 2017, we closed on the sale of OneDigital for
$560.0 million
in an all-cash transaction. As a result of the sale of OneDigital, we have reclassified the financial results of OneDigital to discontinued operations for all periods presented in our Consolidated and Combined Statements of Operations.
See Note A
Business and Summary of Significant Accounting Policies
to our Consolidated and Combined Financial Statements for discussion of immaterial corrections of errors affecting the years ended December 31, 2016 and 2015.
Year ended December 31, 2015.
On September 28, 2015 FNF distributed all of its shares of J. Alexander's to the holders of FNFV common stock. As a result of this distribution, the results of operations for the year-ended December 31, 2015 include the results from J. Alexander's through the date of the distribution.
Results of Operations
Consolidated Results of Operations
Net earnings.
The following table presents certain financial data for the years indicated:
|
Year ended December 31,
|
|||||||||||
|
|
2017
|
2016
|
2015
|
||||||||
|
(In millions)
|
|||||||||||
|
Revenues:
|
|||||||||||
|
Restaurant revenue
|
$
|
1,129.0
|
|
$
|
1,157.6
|
|
$
|
1,412.3
|
|
||
|
Other operating revenue
|
40.5
|
|
20.8
|
|
2.4
|
|
|||||
|
Total operating revenues
|
1,169.5
|
|
1,178.4
|
|
1,414.7
|
|
|||||
|
Operating expenses:
|
|||||||||||
|
Cost of restaurant revenue
|
991.0
|
|
984.1
|
|
1,195.2
|
|
|||||
|
Personnel costs
|
103.2
|
|
68.3
|
|
85.4
|
|
|||||
|
Depreciation and amortization
|
49.3
|
|
44.7
|
|
49.8
|
|
|||||
|
Other operating expenses
|
104.4
|
|
83.5
|
|
96.4
|
|
|||||
|
Total operating expenses
|
1,247.9
|
|
1,180.6
|
|
1,426.8
|
|
|||||
|
Operating loss
|
(78.4
|
)
|
(2.2
|
)
|
(12.1
|
)
|
|||||
|
Other income (expense):
|
|||||||||||
|
Interest and investment income
|
5.3
|
|
3.3
|
|
2.0
|
|
|||||
|
Interest expense
|
(7.0
|
)
|
(5.2
|
)
|
(5.5
|
)
|
|||||
|
Realized gains, net
|
4.9
|
|
9.3
|
|
11.8
|
|
|||||
|
Total other income
|
3.2
|
|
7.4
|
|
8.3
|
|
|||||
|
(Loss) earnings from continuing operations before income taxes and equity in earnings (losses) of unconsolidated affiliates
|
(75.2
|
)
|
5.2
|
|
(3.8
|
)
|
|||||
|
Income tax benefit
|
(16.6
|
)
|
(10.4
|
)
|
(19.7
|
)
|
|||||
|
(Loss) earnings from continuing operations before equity in earnings (losses) of unconsolidated affiliates
|
(58.6
|
)
|
15.6
|
|
15.9
|
|
|||||
|
Equity in earnings (losses) of unconsolidated affiliates
|
3.4
|
|
(29.5
|
)
|
(26.0
|
)
|
|||||
|
Loss from continuing operations
|
(55.2
|
)
|
(13.9
|
)
|
(10.1
|
)
|
|||||
|
Net earnings from discontinued operations, net of tax
|
147.7
|
|
2.0
|
|
2.8
|
|
|||||
|
Net earnings (loss)
|
92.5
|
|
(11.9
|
)
|
(7.3
|
)
|
|||||
|
Less: Net (loss) earnings attributable to non-controlling interests
|
(16.3
|
)
|
0.5
|
|
15.6
|
|
|||||
|
Net earnings (loss) attributable to Cannae Holdings, Inc. common shareholders
|
$
|
108.8
|
|
$
|
(12.4
|
)
|
$
|
(22.9
|
)
|
||
Revenues
Total revenue in
2017
decreased
$8.9 million
compared to
2016
, primarily due to a decrease in revenue in our Restaurant Group segment, partially offset by an increase in revenue in our Corporate and Other segment. Total revenue in
2016
decreased
$236.3 million
compared to
2015
, primarily due to a decrease in revenue in our Restaurant Group segment and our Corporate and Other segment.
28
Expenses
Our operating expenses consist primarily of personnel costs, cost of restaurant revenue, other operating expenses, and depreciation and amortization.
Personnel costs include base salaries, commissions, benefits, stock-based compensation and bonuses paid to employees, and are one of our most significant operating expenses. Personnel costs that are directly attributable to the operations of the Restaurant Group are included in Cost of restaurant revenue.
Cost of restaurant revenue includes cost of food and beverage, primarily the costs of beef, groceries, produce, seafood, poultry and alcoholic and non-alcoholic beverages, net of vendor discounts and rebates, payroll and related costs and expenses directly relating to restaurant level activities, and restaurant operating costs including occupancy and other operating expenses at the restaurant level.
Other operating expenses include professional fees, advertising costs and travel expenses.
Depreciation and amortization expense consists of our depreciation related to investments in property and equipment as well as amortization of intangible assets.
The change in expenses from our segments is discussed in further detail at the segment level below.
Income tax benefit on continuing operations was
$16.6 million
,
$10.4 million
, and
$19.7 million
for the years ended
December 31, 2017
,
2016
, and
2015
, respectively. The effective tax rate for the years ended
December 31, 2017
,
2016
, and
2015
was
22.0%
,
(204.3)%
, and
512.5%
, respectively. The
increase
in the effective tax rate in
2017
from
2016
is primarily attributable to
increased net earnings and decreased losses from unconsolidated affiliates in
2017
from
2016
. The decrease in the effective tax rate in
2016
from
2015
is primarily attributable to the effect of equity investment losses and lower pretax income in 2015. The fluctuation in income tax benefit as a percentage of earnings from continuing operations before income taxes is attributable to our estimate of ultimate income tax liability and changes in the characteristics of net earnings year to year, such as the weighting of operating income versus investment income.
For a detailed breakout of our effective tax rate, see Note L.
Income Taxes
to our Consolidated and Combined Financial Statements included in Item 8 of Part II of this Annual Report.
Other
Net realized gains totaled
$4.9 million
,
$9.3 million
, and
$11.8 million
for the years ended
December 31, 2017
,
2016
, and
2015
, respectively. The net realized gain for the year ended December 31, 2017 is primarily attributable to the sale of equity securities available for sale. The net realized gain for the year ended December 31, 2016 primarily includes a net realized gain of $15.0 million on the sale of our 15% ownership interest in Stillwater Insurance ("Stillwater"), a property and casualty insurance company sold during the second quarter of 2016 for proceeds of $36 million. The gain was offset by net realized losses of $2.5 million on the sale of the Max & Erma's restaurant concept by our Restaurant Group, and net realized losses of $3.0 million on impairment of a cost method investment in our Corporate and Other segment. The net realized gain for the year ended December 31, 2015 is primarily related to the $12.2 million gain on sale of Cascades Timberlands, offset by miscellaneous losses.
Equity in earnings (losses) of unconsolidated affiliates was
$3.4 million
,
$(29.5) million
, and
$(26.0) million
for the years ended
December 31, 2017
,
2016
, and
2015
, respectively, and consisted of our equity in the net loss of Ceridian and other investments in unconsolidated affiliates. The decrease in equity in loss of unconsolidated affiliates is primarily attributable to decreased losses at Ceridian.
Net Earnings
Net earnings attributable to Cannae
increased
$121.2 million
in the year ended
December 31, 2017
, compared to the
2016
period. The increase consisted of a
$140.1 million
increase in earnings in our Corporate and Other segment and
$1.5 million
in net earnings from T-System, acquired in the fourth quarter of 2017, partially offset by a
$20.4 million
increased loss at our Restaurant Group. Total net loss attributable to Cannae decreased
$10.5 million
in the year ended
December 31, 2016
, compared to the
2015
period. The decrease consisted of a
$6.0 million
decreased earnings at Restaurant Group offset by
$16.5 million
decreased loss at Corporate and Other.
The change in revenue and net earnings from the segments is discussed in further detail at the segment level below.
29
Segment Results of Operations
Restaurant Group
The results of operations for the Restaurant Group for the year ended December 31, 2015 include the results of J. Alexander's through September 28, 2015, the date it was distributed to common shareholders of FNFV.
The following table presents the results from operations of our Restaurant Group segment:
|
Year ended December 31,
|
|||||||||||
|
|
2017
|
2016
|
2015
|
||||||||
|
|
(In millions)
|
||||||||||
|
Revenues:
|
|
|
|||||||||
|
Restaurant revenue
|
$
|
1,129.0
|
|
$
|
1,157.6
|
|
$
|
1,412.3
|
|
||
|
Operating expenses:
|
|||||||||||
|
Cost of restaurant revenue
|
991.0
|
|
984.1
|
|
1,195.2
|
|
|||||
|
Personnel costs
|
52.8
|
|
52.9
|
|
65.1
|
|
|||||
|
Depreciation and amortization
|
43.6
|
|
42.4
|
|
48.9
|
|
|||||
|
Other operating expenses
|
71.1
|
|
70.2
|
|
89.1
|
|
|||||
|
Total operating expenses
|
1,158.5
|
|
1,149.6
|
|
1,398.3
|
|
|||||
|
Operating (loss) income
|
(29.5
|
)
|
8.0
|
|
14.0
|
|
|||||
|
Other expense:
|
|||||||||||
|
Interest expense
|
(6.6
|
)
|
(4.7
|
)
|
(5.9
|
)
|
|||||
|
Realized losses, net
|
—
|
|
(2.5
|
)
|
(0.5
|
)
|
|||||
|
Total other expense
|
(6.6
|
)
|
(7.2
|
)
|
(6.4
|
)
|
|||||
|
(Loss) earnings from continuing operations before income taxes and equity in losses of unconsolidated affiliates
|
(36.1
|
)
|
0.8
|
|
7.6
|
|
|||||
Total revenues for the Restaurant Group segment
decreased
$28.6 million
, or
2.5%
in the year ended
December 31, 2017
from the
2016
period. The decrease is primarily attributable to a $17.3 million, or 1.6%, decrease in consolidated comparable store sales, a decrease of $8.4 million related to the inclusion of revenue from the Max & Erma's restaurant concept in the 2016 period, a $5.2 million decrease from the net effect of new and closed restaurants, and a $4.5 million decrease related to timing of store days, partially offset by a $7.1 million increase in third-party bakery operation sales. Total revenues for the Restaurant Group segment
decreased
$254.7 million
, or
18.0%
in the year ended
December 31, 2016
from the
2015
period primarily due to the distribution of J. Alexander's on September 28, 2015 which resulted in a $158.5 million decrease, decreased comparable store sales primarily at O'Charley's which resulted in a decrease of $25.2 million, and the sale of the Max & Erma's restaurant concept on January 25, 2016 which resulted in a decrease of $70.9 million.
Personnel costs
decreased
by
$0.1 million
or
0.2%
in the year ended
December 31, 2017
from the
2016
period. Personnel costs
decreased
by
$12.2 million
or
18.7%
in the year ended
December 31, 2016
from the
2015
period primarily due to the distribution of J. Alexander's.
Other operating expenses
increased
by
$0.9 million
or
1.3%
in the year ended
December 31, 2017
from the
2016
period. Other operating expenses
decreased
by
$18.9 million
or
21.2%
in the year ended
December 31, 2016
from the
2015
period. The decrease was primarily attributable to the distribution of J. Alexander's which resulted in a decrease of $10.1 million and reduced operating expense at ABRH corporate of $2.1 million.
Cost of restaurant revenue
increased
$6.9 million
or
0.7%
in the year ended
December 31, 2017
from the
2016
period. Cost of restaurant revenue
decreased
$211.1 million
or
17.7%
in the year ended
December 31, 2016
from the
2015
period. Cost of restaurant revenue as a percentage of restaurant revenue were approximately
87.8%
,
85.0%
, and
84.6%
in the years ended
December 31, 2017
,
2016
and
2015
, respectively. The increase in cost of restaurant revenue as a percentage of restaurant revenue in the 2017 period from the comparable 2016 period was primarily driven by reduced operating leverage associated with lower same store sales, increased hourly labor costs, and an increase in value promotions offered in the 2017 periods.
(Loss) earnings from continuing operations before income taxes
decreased
$36.9 million
in the year ended
December 31, 2017
from the
2016
period. Earnings from continuing operations before income taxes
decreased
$6.8 million
in the year ended
December 31, 2016
from the
2015
period.
Comparable Store Sales.
One method we use in evaluating the performance of our restaurants is to compare sales results for restaurants period over period. We include a restaurant in our comparable store sales figures starting in the first period following
30
a new restaurant's first seventy-eight weeks of operations. Changes in comparable store sales reflect changes in sales for the comparable store group of restaurants over a specified period of time. This measure highlights the performance of existing restaurants, as the impact of new restaurant openings is excluded. Comparable store sales for our Restaurant Group decreased 1.6% and 2.6 % in the years ended December 31, 2017 and 2016, respectively, from the prior fiscal years. The decreases were primarily attributable to decreased comparable store sales at ABRH's O'Charley's, Village Inn, and Baker's Square brands, partially offset by an increase in comparable store sales at 99 Restaurants.
Ceridian
We own a 33% economic interest in Ceridian, which operates through its subsidiary Ceridian HCM. Ceridian HCM is a global company that offers a broad range of services and software designed to help employers more effectively manage employment processes, such as payroll, payroll related tax filing, human resource information systems, employee self-service, time and labor management, employee assistance and work-life programs, and recruitment and applicant screening. Its technology-based services are typically provided through long-term customer relationships that result in a high level of recurring revenue. Its operations are primarily located in the U.S. and Canada. Ceridian HCM's business has transformed from a legacy service-bureau model into a cloud-based provider model, and in the second half of 2016, Cloud revenue surpassed bureau revenue for the first time. Ceridian HCM's flagship cloud platform, Dayforce, is a cloud solution that meets HCM needs with one employee record and one user experience throughout the application. Built on a single database, Dayforce enables organizations to process payroll, maintain human resources records, manage benefits enrollment, schedule staff, and find and hire the right people, while monitoring compliance throughout the employee life cycle. Ceridian is a founder-led organization, and the culture combines the agility and innovation of a start-up with a history of deep domain and operational expertise. We account for our investment in Ceridian under the equity method of accounting and therefore its results of operations do not consolidate into ours.
See the audited financial statements of Ceridian Holding, LLC, the ultimate parent of Ceridian HCM, at Exhibit 99.1 to this Annual Report.
T-System
We acquired T-System on October 16, 2017. The following table presents the results from operations of our T-System segment since it was acquired:
|
Year ended December 31,
|
|||
|
|
2017
|
||
|
|
(In millions)
|
||
|
Revenues:
|
|
|
|
|
Other operating revenue
|
$
|
12.9
|
|
|
Total operating revenues
|
12.9
|
|
|
|
Operating expenses:
|
|||
|
Personnel costs
|
7.6
|
|
|
|
Depreciation and amortization
|
3.1
|
|
|
|
Other operating expenses
|
3.1
|
|
|
|
Total operating expenses
|
13.8
|
|
|
|
Operating loss
|
(0.9
|
)
|
|
|
Loss from continuing operations before income taxes and equity in losses of unconsolidated affiliates
|
$
|
(0.9
|
)
|
Corporate and Other
The Corporate and Other segment consists of certain other unallocated corporate overhead expenses, and other smaller investments.
The Corporate and Other segment generated revenues of
$27.6 million
,
$20.8 million
, and
$2.3 million
for the years ended
December 31, 2017
,
2016
, and
2015
, respectively. Revenues
increased
$6.8 million
in
2017
compared to
2016
primarily due to growth in sales of real estate at FNTR. Revenues
increased
$18.5 million
in
2016
compared to
2015
primarily due to the acquisition of Brasada Club, LLC ("Brasada").
Personnel costs were
$42.8 million
,
$15.4 million
, and
$20.3 million
in the years ended
December 31, 2017
,
2016
, and
2015
, respectively. The increase in 2017 from 2016 is primarily attributable to Investment Success Incentive Program bonuses associated with the sale of OneDigital.
Other operating expenses for the Corporate and Other segment were
$30.2 million
,
$13.3 million
, and
$7.2 million
in the years ended
December 31, 2017
,
2016
and
2015
, respectively. The increase in the
2017
period from the
2016
period is primarily
31
attributable to increased cost at our real estate subsidiaries and costs associated with our separation from FNF. The increase in the
2016
period from the
2015
period is primarily attributable to acquisition costs and operating costs at Brasada.
This segment generated (losses) earnings from continuing operations before income taxes of
$(38.2) million
,
$4.4 million
, and
$(11.4) million
for the years ended
December 31, 2017
,
2016
, and
2015
, respectively. The change in earnings is attributable to the aforementioned changes in revenues and expenses.
Discontinued Operations
As a result of the sale of OneDigital, the financial results of OneDigital have been reclassified to discontinued operations for the twelve months ended
December 31, 2017
,
2016
, and
2015
. Earnings from discontinued operations were
$147.7 million
,
$2.0 million
, and
$2.8 million
for the years ended
December 31, 2017
,
2016
and
2015
respectively. The increase in
2017
compared to
2016
and
2015
was primarily attributable to the after-tax gain of $149.7 million on the sale of OneDigital.
Liquidity and Capital Resources
Cash Requirements.
Our current cash requirements include personnel costs, operating expenses, taxes, payments of interest and principal on our debt, capital expenditures, business acquisitions, and stock repurchases. There are no restrictions on our retained earnings regarding our ability to pay dividends to stockholders, although there are limits on the ability of certain subsidiaries to pay dividends to us, as a result of provisions in certain debt agreements. The declaration of any future dividends is at the discretion of our Board of Directors. Additional uses of cash flow are expected to include stock repurchases, acquisitions, and debt repayments.
We continually assess our capital allocation strategy, including decisions relating to reducing debt, repurchasing our stock, and/or conserving cash. We believe that all anticipated cash requirements for current operations will be met from internally generated funds, cash dividends from subsidiaries, cash generated by investment securities, potential sales of non-strategic assets, and borrowings on existing credit facilities. Our short-term and long-term liquidity requirements are monitored regularly to ensure that we can meet our cash requirements. We forecast the needs of all of our subsidiaries and periodically review their short-term and long-term projected sources and uses of funds, as well as the asset, liability, investment and cash flow assumptions underlying such forecasts.
We are focused on evaluating our assets and investments as potential vehicles for creating liquidity. Our intent is to use that liquidity for general corporate purposes, including, potentially reducing debt, repurchasing shares of our stock, other strategic initiatives and/or conserving cash.
Operating Cash Flows
. Our cash flows (used in) provided by operations for the years ended
December 31, 2017
,
2016
, and
2015
were
$(90.7) million
,
$60.3 million
and
$11.1 million
, respectively. The
decrease
in cash provided by operations of
$151.0 million
from
2017
to
2016
is primarily attributable to increased payments for income taxes in the current year which primarily related to the sale of OneDigital. The proceeds from the sale of OneDigital were recorded as an investing cash flow. The
increase
in cash provided by operations of
$49.2 million
from
2016
to
2015
is primarily attributable to lower income taxes payments.
Investing Cash Flows.
Our cash flows provided by (used in) investing activities for the years ended
December 31, 2017
,
2016
, and
2015
were
$91.7 million
,
$(168.2) million
and
$273.1 million
, respectively. The
increase
in cash provided by (decrease in cash used in) investing activities of
$259.9 million
from
2017
to
2016
is primarily attributable to proceeds of $326.0 million from the sale of OneDigital, decreased investments in unconsolidated affiliates of $67.2 million, and lower spending on other investments in the 2017 period, offset by increased cash used for acquisitions of businesses, primarily T-System, in the 2017 period. The
decrease
in cash provided by (increase in cash used in) investing activities of
$441.3 million
from
2016
to
2015
is primarily attributable to increased cash paid for acquisitions of $51.1 million, decreased distributions from unconsolidated affiliates, primarily Ceridian, of $273.3 million, decreased proceeds from sales of investments of $46.2 million, and increased cash invested in unconsolidated affiliates of $64.1 million.
Capital Expenditures.
Total capital expenditures for property and equipment and other intangible assets were
$40.1 million
,
$55.2 million
and
$60.5 million
for the years ended
December 31, 2017
,
2016
, and
2015
, respectively. Capital expenditures in the
2017
period primarily consist of purchases of property, equipment and software in our Restaurant Group segment. The decrease in expenditures in the
2017
period from the
2016
period is primarily attributable to the sale of OneDigital. The decrease in the
2016
period from the
2015
period is reflective of an increase at our former OneDigital segment and Corporate and Other segment, offset by a decrease at our Restaurant Group segment driven by the spin-off of J. Alexander's in 2015.
Financing Cash Flows.
Our cash flows provided by (used in) financing activities for the years ended
December 31, 2017
,
2016
, and
2015
were
$98.2 million
,
$(20.8) million
and
$(212.5) million
, respectively. The
increase
in cash provided by (decrease in cash used in) financing activities of
$119.0 million
from
2017
to
2016
is primarily attributable to the $100 million FNF Investment and an increase in net borrowings (net of debt service payments). The
increase
in cash provided by (decrease in cash used in) financing activities of
$191.7 million
from
2016
to
2015
is primarily attributable to a decrease in borrowings of $55.3 million, an increase in debt principal payments of $13.5 million, payments of $24.5 million to minority investors in the 2015 period, and
32
decreased cash outflow of $233.7 million related to equity transactions with FNF which is primarily attributable to repurchases of FNFV Group common stock by FNF.
Financing Arrangements.
In our Restaurant Group, financing arrangements are used both as part of our overall capitalization structure as well as to fund purchases of seasonal inventory in advance of sales. For a description of our historical financing arrangements see Note K
Notes Payable
to our Consolidated and Combined Financial Statements included in Item 8 of Part II of this Annual Report.
On November 17, 2017, FNF issued to Cannae a revolver note in aggregate principal amount of up to
$100.0 million
(the "FNF Revolver"), which accrues interest at LIBOR plus
450
basis points and matures on the
five
-year anniversary of the date of the revolver note. The maturity date is automatically extended for additional
five
-year terms unless notice of non-renewal is otherwise provided by either FNF or Cannae, in their sole discretion.
ABRH was not in compliance with certain financial covenants of the ABRH Credit Facility as of December 31, 2017 and, accordingly, all outstanding borrowings under such facility were classified as current on our Consolidated and Combined Balance Sheets. On March 13, 2018, Cannae entered into an Assignment and Assumption Agreement with certain of ABRH's lenders to purchase all of the outstanding loans and lending commitments under the ABRH Credit Facility, which resulted in Cannae becoming ABRH's sole lender. Subsequent to the assignment, Cannae and ABRH entered into a Second Amendment to the Credit Agreement to increase the interest rate to 10%, suspend the financial covenants until March 31, 2019 and require ABRH to pay to Cannae an amendment fee equal to 2% of the outstanding loan balance.
Contractual Obligations.
Unconditional purchase obligations include agreements to purchase goods or services that are enforceable, are legally binding and specify all significant terms, including fixed or minimum quantities to be purchased, fixed, minimum or variable price provisions, and the approximate timing of the transaction. The Restaurant Group has unconditional purchase obligations with various vendors, primarily related to food and beverage obligations with fixed commitments in regards to the time period of the contract and the quantities purchased with annual price adjustments that can fluctuate. Future purchase obligations are estimated by assuming historical purchase activity over the remaining, non-cancellable terms of the various agreements. For agreements with minimum purchase obligations, at least the minimum amounts we are legally required to purchase are included. These agreements do not include fixed delivery terms. We used both historical and projected volume and pricing as of December 31, 2017 to determine the amount of the obligations.
As of
December 31, 2017
, our required annual payments relating to these contractual obligations were as follows:
|
|
2018
|
2019
|
2020
|
2021
|
2022
|
Thereafter
|
Total
|
||||||||||||||||||||
|
|
|||||||||||||||||||||||||||
|
Notes payable
|
$
|
124.3
|
|
$
|
—
|
|
$
|
—
|
|
$
|
—
|
|
$
|
—
|
|
$
|
11.5
|
|
$
|
135.8
|
|
||||||
|
Operating lease payments
|
61.7
|
|
57.0
|
|
50.6
|
|
43.5
|
|
32.5
|
|
131.5
|
|
376.8
|
|
|||||||||||||
|
Unconditional purchase obligations
|
220.3
|
|
26.2
|
|
17.0
|
|
4.4
|
|
3.3
|
|
—
|
|
271.2
|
|
|||||||||||||
|
Total
|
$
|
406.3
|
|
$
|
83.2
|
|
$
|
67.6
|
|
$
|
47.9
|
|
$
|
35.8
|
|
|
$
|
143.0
|
|
$
|
783.8
|
|
|||||
Capital Stock Transactions.
On November 17, 2017, FNF completed the previously announced Split-Off of its FNFV Group and redeemed each outstanding share of its FNFV Group common stock, par value $0.0001, for one share of common stock, par value $0.0001, of Cannae (NYSE: CNNE), with cash in lieu of fractional shares. As of November 17, 2017, FNF and Cannae are separate publicly traded companies.
On November 16, 2017, certain subsidiaries of FNF contributed an aggregate of $100.0 million to us in exchange for 5,706,134 shares of Cannae common stock.
Equity Security Investments.
Subsequent to December 31, 2017, we sold the remainder of our equity securities holdings for gross proceeds of
$17.7 million
resulting in net realized gains of
$0.1 million
.
Off-Balance Sheet Arrangements.
We do not engage in off-balance sheet activities other than facility and equipment operating leasing arrangements.
Recent Accounting Pronouncements
For a description of recent accounting pronouncements, see Note S.
Recent Accounting Pronouncements
to our Consolidated and Combined Financial Statements included in Item 8 of Part II of this Annual Report.
33
|
Item 7A.
|
Quantitative and Qualitative Disclosure about Market Risk
|
Commodity Price Risk
We are exposed to market price fluctuations in beef, seafood, produce and other food product prices. Given the historical volatility of beef, seafood, produce and other food product prices, these fluctuations can materially impact the food and beverage costs incurred in our Restaurant Group segment. While ABRH has taken steps to qualify multiple suppliers who meet our standards as suppliers for our restaurants and have entered into agreements with suppliers for some of the commodities used in our restaurant operations, there can be no assurance that future supplies and costs for such commodities will not fluctuate due to weather and other market conditions outside of our control. Consequently, such commodities can be subject to unforeseen supply and cost fluctuations. Dairy costs can also fluctuate due to government regulation. Because we typically set our menu prices in advance of our food product prices, our menu prices cannot immediately take into account changing costs of food items. To the extent that we are unable to pass the increased costs on to our guests through price increases, our results of operations would be adversely affected. We do not use financial instruments to hedge our risk to market price fluctuations in beef, seafood, produce and other food product prices at this time.
34
Item 8.
Financial Statements and Supplementary Data
CANNAE HOLDINGS, INC.
INDEX TO FINANCIAL INFORMATION
|
|
Page
Number
|
35
REPORT OF INDEPENDENT REGISTERED PUBLIC ACCOUNTING FIRM
To the stockholders and the Board of Directors
Cannae Holdings, Inc.
Las Vegas, Nevada
Opinion on the Financial Statements
We have audited the accompanying consolidated and combined balance sheets of Cannae Holdings, Inc. and subsidiaries (the "Company") as of December 31, 2017 and 2016, the related consolidated and combined statements of operations, comprehensive earnings (loss), equity, and cash flows for each of the two years in the period ended December 31, 2017, and the related notes (collectively referred to as the “financial statements”). In our opinion, the financial statements present fairly, in all material respects, the financial position of the Company as of December 31, 2017 and 2016, and the results of its operations and its cash flows for each of the two years in the period ended December 31, 2017, in conformity with accounting principles generally accepted in the United States of America.
We did not audit the consolidated financial statements of Ceridian Holding LLC, the Company's investment in which is accounted for by use of the equity method. The accompanying financial statements of the Company include its equity investment in Ceridian Holding LLC of $324.9 million and $316.9 million as of December 31, 2017 and 2016, respectively, and its equity in earnings (losses) in Ceridian Holding LLC of $1.9 million and ($29.1) million for the years ended December 31, 2017 and 2016, respectively. Those statements were audited by other auditors whose report has been furnished to us, and our opinion, insofar as it relates to the amounts included for Ceridian Holding LLC, is based solely on the report of the other auditors.
Basis for Opinion
These financial statements are the responsibility of the Company's management. Our responsibility is to express an opinion on the Company’s financial statements based on our audits. We are a public accounting firm registered with the Public Company Accounting Oversight Board (United States) (PCAOB) and are required to be independent with respect to the Company in accordance with the U.S. federal securities laws and the applicable rules and regulations of the Securities and Exchange Commission and the PCAOB.
We conducted our audits in accordance with the standards of the PCAOB. Those standards require that we plan and perform the audit to obtain reasonable assurance about whether the financial statements are free of material misstatement, whether due to error or fraud. The Company is not required to have, nor were we engaged to perform, an audit of its internal control over financial reporting. As part of our audits, we are required to obtain an understanding of internal control over financial reporting but not for the purpose of expressing an opinion on the effectiveness of the Company’s internal control over financial reporting. Accordingly, we express no such opinion.
Our audits included performing procedures to assess the risks of material misstatement of the financial statements, whether due to error or fraud, and performing procedures that respond to those risks. Such procedures included examining, on a test basis, evidence regarding the amounts and disclosures in the financial statements. Our audits also included evaluating the accounting principles used and significant estimates made by management, as well as evaluating the overall presentation of the financial statements. We believe our audits provide a reasonable basis for our opinion.
/s/ Deloitte & Touche LLP
Las Vegas, Nevada
March 26, 2018
We have served as the Company’s auditor since 2017.
36
REPORT OF INDEPENDENT REGISTERED PUBLIC ACCOUNTING FIRM
The Board of Directors and Stockholders
Fidelity National Financial, Inc.:
We have audited the accompanying combined statement of operations, comprehensive loss, equity, and cash flows of Fidelity National Financial Ventures Operations for the year ended December 31, 2015. These combined financial statements are the responsibility of the Company’s management. Our responsibility is to express an opinion on these combined financial statements based on our audits.
We conducted our audits in accordance with the standards of the Public Company Accounting Oversight Board (United States) and in accordance with auditing standards generally accepted in the United States of America. Those standards require that we plan and perform the audit to obtain reasonable assurance about whether the financial statements are free of material misstatement. An audit also includes examining, on a test basis, evidence supporting the amounts and disclosures in the financial statements. An audit also includes assessing the accounting principles used and significant estimates made by management, as well as evaluating the overall financial statement presentation. We believe that our audits provide a reasonable basis for our opinion.
In our opinion, the combined financial statements referred to above present fairly, in all material respects, the results of operations and cash flows of Fidelity National Financial Ventures Operations for the year ended December 31, 2015, in conformity with U.S. generally accepted accounting principles.
///
/s/ KPMG, LLP
Jacksonville, Florida
May 11, 2017, except for Notes A and N,
as to which the date is August 21, 2017
Certified Public Accountants
37
CANNAE HOLDINGS, INC.
CONSOLIDATED AND COMBINED BALANCE SHEETS
|
|
December 31,
2017 |
December 31,
2016 |
|||||
|
|
(in millions)
|
||||||
|
ASSETS
|
|||||||
|
Current assets:
|
|
|
|
|
|||
|
Cash and cash equivalents
|
$
|
245.6
|
|
$
|
141.7
|
|
|
|
Trade receivables
|
35.8
|
|
24.7
|
|
|||
|
Inventory
|
29.7
|
|
23.9
|
|
|||
|
Equity securities available for sale, at fair value
|
17.7
|
|
51.8
|
|
|||
|
Prepaid expenses and other current assets
|
21.4
|
|
8.7
|
|
|||
|
Current assets of discontinued operations
|
—
|
|
21.8
|
|
|||
|
Total current assets
|
350.2
|
|
272.6
|
|
|||
|
Investments in unconsolidated affiliates
|
424.9
|
|
401.0
|
|
|||
|
Property and equipment, net
|
218.8
|
|
235.0
|
|
|||
|
Other intangible assets, net
|
214.5
|
|
111.8
|
|
|||
|
Goodwill
|
202.7
|
|
103.1
|
|
|||
|
Fixed maturity securities available for sale, at fair value
|
14.8
|
|
25.0
|
|
|||
|
Deferred tax asset
|
10.6
|
|
33.1
|
|
|||
|
Other long term investments and noncurrent assets
|
50.7
|
|
49.8
|
|
|||
|
Noncurrent assets of discontinued operations
|
—
|
|
241.9
|
|
|||
|
Total assets
|
$
|
1,487.2
|
|
$
|
1,473.3
|
|
|
|
LIABILITIES AND EQUITY
|
|||||||
|
Current liabilities:
|
|
|
|
|
|||
|
Accounts payable and other accrued liabilities, current
|
$
|
100.7
|
|
$
|
91.5
|
|
|
|
Income taxes payable
|
0.8
|
|
—
|
|
|||
|
Deferred revenue, current
|
26.1
|
|
24.7
|
|
|||
|
Notes payable, current
|
122.2
|
|
11.4
|
|
|||
|
Current liabilities of discontinued operations
|
—
|
|
31.9
|
|
|||
|
Total current liabilities
|
249.8
|
|
159.5
|
|
|||
|
Deferred revenue, long-term
|
9.1
|
|
—
|
|
|||
|
Notes payable, long-term
|
12.7
|
|
93.3
|
|
|||
|
Accounts payable and other accrued liabilities, long-term
|
62.5
|
|
60.6
|
|
|||
|
Noncurrent liabilities of discontinued operations
|
—
|
|
150.1
|
|
|||
|
Total liabilities
|
334.1
|
|
463.5
|
|
|||
|
Commitments and contingencies - see Note M
|
|
|
|
|
|||
|
Equity:
|
|
|
|||||
|
Retained earnings
|
0.2
|
|
—
|
|
|||
|
Additional paid-in capital
|
1,130.2
|
|
—
|
|
|||
|
Parent investment in FNFV
|
—
|
|
961.6
|
|
|||
|
Accumulated other comprehensive loss
|
(71.0
|
)
|
(68.1
|
)
|
|||
|
Total Cannae shareholders' equity
|
1,059.4
|
|
893.5
|
|
|||
|
Noncontrolling interests
|
93.7
|
|
116.3
|
|
|||
|
Total equity
|
1,153.1
|
|
1,009.8
|
|
|||
|
Total liabilities and equity
|
$
|
1,487.2
|
|
$
|
1,473.3
|
|
|
See Notes to Consolidated and Combined Financial Statements
38
CANNAE HOLDINGS, INC.
CONSOLIDATED AND COMBINED STATEMENTS OF OPERATIONS
|
Year ended December 31,
|
|||||||||||
|
|
2017
|
2016
|
2015
|
||||||||
|
(in millions)
|
|||||||||||
|
Revenues:
|
|||||||||||
|
Restaurant revenue
|
$
|
1,129.0
|
|
$
|
1,157.6
|
|
$
|
1,412.3
|
|
||
|
Other operating revenue
|
40.5
|
|
20.8
|
|
2.4
|
|
|||||
|
Total operating revenues
|
1,169.5
|
|
1,178.4
|
|
1,414.7
|
|
|||||
|
Operating expenses:
|
|||||||||||
|
Cost of restaurant revenue
|
991.0
|
|
984.1
|
|
1,195.2
|
|
|||||
|
Personnel costs
|
103.2
|
|
68.3
|
|
85.4
|
|
|||||
|
Depreciation and amortization
|
49.3
|
|
44.7
|
|
49.8
|
|
|||||
|
Other operating expenses
|
104.4
|
|
83.5
|
|
96.4
|
|
|||||
|
Total operating expenses
|
1,247.9
|
|
1,180.6
|
|
1,426.8
|
|
|||||
|
Operating loss
|
(78.4
|
)
|
(2.2
|
)
|
(12.1
|
)
|
|||||
|
Other income (expense):
|
|||||||||||
|
Interest and investment income
|
5.3
|
|
3.3
|
|
2.0
|
|
|||||
|
Interest expense
|
(7.0
|
)
|
(5.2
|
)
|
(5.5
|
)
|
|||||
|
Realized gains, net
|
4.9
|
|
9.3
|
|
11.8
|
|
|||||
|
Total other income
|
3.2
|
|
7.4
|
|
8.3
|
|
|||||
|
(Loss) earnings from continuing operations before income taxes and equity in earnings (losses) of unconsolidated affiliates
|
(75.2
|
)
|
5.2
|
|
(3.8
|
)
|
|||||
|
Income tax benefit
|
(16.6
|
)
|
(10.4
|
)
|
(19.7
|
)
|
|||||
|
(Loss) earnings from continuing operations before equity in earnings (losses) of unconsolidated affiliates
|
(58.6
|
)
|
15.6
|
|
15.9
|
|
|||||
|
Equity in earnings (losses) of unconsolidated affiliates
|
3.4
|
|
(29.5
|
)
|
(26.0
|
)
|
|||||
|
Loss from continuing operations
|
(55.2
|
)
|
(13.9
|
)
|
(10.1
|
)
|
|||||
|
Net earnings from discontinued operations, net of tax - see Note N
|
147.7
|
|
2.0
|
|
2.8
|
|
|||||
|
Net earnings (loss)
|
92.5
|
|
(11.9
|
)
|
(7.3
|
)
|
|||||
|
Less: Net (loss) earnings attributable to non-controlling interests
|
(16.3
|
)
|
0.5
|
|
15.6
|
|
|||||
|
Net earnings (loss) attributable to Cannae Holdings, Inc. common shareholders
|
$
|
108.8
|
|
$
|
(12.4
|
)
|
$
|
(22.9
|
)
|
||
|
Amounts attributable to Cannae Holdings, Inc. common shareholders
|
|||||||||||
|
Net loss from continuing operations attributable to Cannae Holdings, Inc. common shareholders
|
$
|
(38.7
|
)
|
$
|
(14.3
|
)
|
$
|
(25.7
|
)
|
||
|
Net earnings from discontinued operations attributable to Cannae Holdings, Inc. common shareholders
|
147.5
|
|
1.9
|
|
2.8
|
|
|||||
|
Net earnings (loss) attributable to Cannae Holdings, Inc. common shareholders
|
$
|
108.8
|
|
$
|
(12.4
|
)
|
$
|
(22.9
|
)
|
||
|
Earnings per share
|
|||||||||||
|
Basic
|
|||||||||||
|
Net loss per share from continuing operations
|
$
|
(0.55
|
)
|
$
|
(0.21
|
)
|
$
|
(0.36
|
)
|
||
|
Net earnings per share from discontinued operations
|
2.09
|
|
0.03
|
|
0.04
|
|
|||||
|
Net earnings (loss) per share
|
$
|
1.54
|
|
$
|
(0.18
|
)
|
$
|
(0.32
|
)
|
||
|
Diluted
|
|||||||||||
|
Net loss per share from continuing operations
|
$
|
(0.55
|
)
|
$
|
(0.21
|
)
|
$
|
(0.36
|
)
|
||
|
Net earnings per share from discontinued operations
|
2.09
|
|
0.03
|
|
0.04
|
|
|||||
|
Net earnings (loss) per share
|
$
|
1.54
|
|
$
|
(0.18
|
)
|
$
|
(0.32
|
)
|
||
|
Weighted average shares outstanding Cannae Holdings common stock, basic basis
|
70.6
|
|
70.6
|
|
70.6
|
|
|||||
|
Weighted average shares outstanding Cannae Holdings common stock, diluted basis
|
70.6
|
|
70.6
|
|
70.6
|
|
|||||
See Notes to Consolidated and Combined Financial Statements
39
CANNAE HOLDINGS, INC.
CONSOLIDATED AND COMBINED STATEMENTS OF COMPREHENSIVE EARNINGS (LOSS)
|
|
Year Ended December 31,
|
||||||||||
|
|
2017
|
2016
|
2015
|
||||||||
|
|
(in millions)
|
||||||||||
|
Net earnings (loss)
|
$
|
92.5
|
|
$
|
(11.9
|
)
|
$
|
(7.3
|
)
|
||
|
Other comprehensive earnings (loss), net of tax:
|
|
|
|
|
|||||||
|
Unrealized (loss) gain on investments and other financial instruments, net (excluding investments in unconsolidated affiliates) (1)
|
(8.7
|
)
|
2.6
|
|
2.3
|
|
|||||
|
Unrealized gain (loss) relating to investments in unconsolidated affiliates (2)
|
8.9
|
|
4.8
|
|
(26.7
|
)
|
|||||
|
Reclassification adjustments for change in unrealized gains and losses included in net earnings (3)
|
(3.1
|
)
|
—
|
|
—
|
|
|||||
|
Other comprehensive (loss) earnings
|
(2.9
|
)
|
7.4
|
|
(24.4
|
)
|
|||||
|
Comprehensive earnings (loss)
|
89.6
|
|
(4.5
|
)
|
(31.7
|
)
|
|||||
|
Less: Comprehensive (loss) earnings attributable to noncontrolling interests
|
(16.3
|
)
|
0.5
|
|
15.6
|
|
|||||
|
Comprehensive earnings (loss) attributable to Parent
|
$
|
105.9
|
|
$
|
(5.0
|
)
|
$
|
(47.3
|
)
|
||
|
(1)
|
Net of income tax (benefit) expense of
$(3.1) million
,
$1.6 million
and
$1.4 million
for the years ended December 31, 2017, 2016 and 2015, respectively.
|
|
(2)
|
Net of income tax expense (benefit) of
$2.4 million
,
$2.9 million
and
$(16.3) million
for the years ended December 31, 2017, 2016 and 2015, respectively.
|
|
(3)
|
Net of income tax expense of
$1.9 million
for the year ended December 31, 2017.
|
See Notes to Consolidated and Combined Financial Statements
40
CANNAE HOLDINGS, INC.
CONSOLIDATED AND COMBINED STATEMENTS OF EQUITY
|
|
Common Stock
|
Parent Investment in FNFV
|
Additional Paid-in Capital
|
Retained Earnings
|
Accumulated Other Comp (Loss) Earnings
|
Non-controlling
Interests
|
Total
Equity
|
|||||||||||||||||||||||
|
|
Shares
|
$
|
||||||||||||||||||||||||||||
|
|
(in millions)
|
|||||||||||||||||||||||||||||
|
Balance, December 31, 2014
|
—
|
|
$
|
—
|
|
$
|
1,397.6
|
|
$
|
—
|
|
$
|
—
|
|
$
|
(51.1
|
)
|
$
|
137.1
|
|
$
|
1,483.6
|
|
|||||||
|
Other comprehensive earnings — unrealized gain on investments and other financial instruments, net of tax
|
—
|
|
—
|
|
—
|
|
—
|
|
—
|
|
2.3
|
|
—
|
|
2.3
|
|
||||||||||||||
|
Other comprehensive earnings — unrealized loss on investments in unconsolidated affiliates, net of tax
|
—
|
|
—
|
|
—
|
|
—
|
|
—
|
|
(26.7
|
)
|
—
|
|
(26.7
|
)
|
||||||||||||||
|
Subsidiary stock-based compensation
|
—
|
|
—
|
|
—
|
|
—
|
|
—
|
|
—
|
|
1.4
|
|
1.4
|
|
||||||||||||||
|
Ceridian stock-based compensation
|
—
|
|
—
|
|
3.4
|
|
—
|
|
—
|
|
—
|
|
—
|
|
3.4
|
|
||||||||||||||
|
Distribution of J. Alexander's to FNFV Shareholders
|
—
|
|
—
|
|
—
|
|
—
|
|
—
|
|
—
|
|
(13.0
|
)
|
(13.0
|
)
|
||||||||||||||
|
Sale of Cascade Timberlands
|
—
|
|
—
|
|
—
|
|
—
|
|
—
|
|
—
|
|
(24.5
|
)
|
(24.5
|
)
|
||||||||||||||
|
Net change in Parent investment in FNFV
|
—
|
|
—
|
|
(359.7
|
)
|
—
|
|
—
|
|
—
|
|
—
|
|
(359.7
|
)
|
||||||||||||||
|
Subsidiary dividends paid to noncontrolling interests
|
—
|
|
—
|
|
—
|
|
—
|
|
—
|
|
—
|
|
(3.0
|
)
|
(3.0
|
)
|
||||||||||||||
|
Net (loss) earnings
|
—
|
|
—
|
|
(22.9
|
)
|
—
|
|
—
|
|
—
|
|
15.6
|
|
(7.3
|
)
|
||||||||||||||
|
Balance, December 31, 2015
|
—
|
|
$
|
—
|
|
$
|
1,018.4
|
|
$
|
—
|
|
$
|
—
|
|
$
|
(75.5
|
)
|
$
|
113.6
|
|
$
|
1,056.5
|
|
|||||||
|
Other comprehensive earnings — unrealized gain on investments and other financial instruments, net of tax
|
—
|
|
—
|
|
—
|
|
—
|
|
—
|
|
2.6
|
|
—
|
|
2.6
|
|
||||||||||||||
|
Other comprehensive earnings — unrealized gain on investments in unconsolidated affiliates, net of tax
|
—
|
|
—
|
|
—
|
|
—
|
|
—
|
|
4.8
|
|
—
|
|
4.8
|
|
||||||||||||||
|
Subsidiary stock-based compensation
|
—
|
|
—
|
|
—
|
|
—
|
|
—
|
|
—
|
|
1.2
|
|
1.2
|
|
||||||||||||||
|
Ceridian stock-based compensation
|
—
|
|
—
|
|
5.1
|
|
—
|
|
—
|
|
—
|
|
—
|
|
5.1
|
|
||||||||||||||
|
Acquisition of Brasada
|
—
|
|
—
|
|
—
|
|
—
|
|
—
|
|
—
|
|
2.0
|
|
2.0
|
|
||||||||||||||
|
Dissolution of consolidated subsidiary
|
—
|
|
—
|
|
—
|
|
—
|
|
—
|
|
—
|
|
(0.3
|
)
|
(0.3
|
)
|
||||||||||||||
|
Net change in Parent investment in FNFV
|
—
|
|
—
|
|
(49.5
|
)
|
—
|
|
—
|
|
—
|
|
—
|
|
(49.5
|
)
|
||||||||||||||
|
Subsidiary dividends paid to noncontrolling interests
|
—
|
|
—
|
|
—
|
|
—
|
|
—
|
|
—
|
|
(0.7
|
)
|
(0.7
|
)
|
||||||||||||||
|
Net (loss) earnings
|
—
|
|
—
|
|
(12.4
|
)
|
—
|
|
—
|
|
—
|
|
0.5
|
|
(11.9
|
)
|
||||||||||||||
|
Balance, December 31, 2016
|
—
|
|
$
|
—
|
|
$
|
961.6
|
|
$
|
—
|
|
$
|
—
|
|
$
|
(68.1
|
)
|
$
|
116.3
|
|
$
|
1,009.8
|
|
|||||||
|
Other comprehensive earnings — unrealized loss on investments and other financial instruments, net of tax
|
—
|
|
—
|
|
—
|
|
—
|
|
—
|
|
(8.7
|
)
|
—
|
|
(8.7
|
)
|
||||||||||||||
|
Other comprehensive earnings — unrealized gain on investments in unconsolidated affiliates, net of tax
|
—
|
|
—
|
|
—
|
|
—
|
|
—
|
|
8.9
|
|
—
|
|
8.9
|
|
||||||||||||||
|
Reclassification adjustments for unrealized gains and losses included in net earnings
|
—
|
|
—
|
|
—
|
|
—
|
|
—
|
|
(3.1
|
)
|
—
|
|
(3.1
|
)
|
||||||||||||||
|
Stock-based compensation
|
—
|
|
—
|
|
—
|
|
0.2
|
|
—
|
|
—
|
|
0.3
|
|
0.5
|
|
||||||||||||||
|
Issuance of restricted stock
|
0.3
|
|
—
|
|
—
|
|
—
|
|
—
|
|
—
|
|
—
|
|
—
|
|
||||||||||||||
|
Sale of OneDigital
|
—
|
|
—
|
|
—
|
|
—
|
|
—
|
|
—
|
|
(6.2
|
)
|
(6.2
|
)
|
||||||||||||||
|
Contribution of back office services from FNF
|
—
|
|
—
|
|
—
|
|
0.1
|
|
—
|
|
—
|
|
—
|
|
0.1
|
|
||||||||||||||
|
Ceridian stock-based compensation
|
—
|
|
—
|
|
—
|
|
5.7
|
|
—
|
|
—
|
|
—
|
|
5.7
|
|
||||||||||||||
|
Net change in Parent investment in FNFV
|
—
|
|
—
|
|
(46.0
|
)
|
—
|
|
—
|
|
—
|
|
—
|
|
(46.0
|
)
|
||||||||||||||
|
Subsidiary dividends paid to noncontrolling interests
|
—
|
|
—
|
|
—
|
|
—
|
|
—
|
|
—
|
|
(0.4
|
)
|
(0.4
|
)
|
||||||||||||||
|
FNF investment
|
5.7
|
|
—
|
|
—
|
|
100.0
|
|
—
|
|
—
|
|
—
|
|
100.0
|
|
||||||||||||||
|
FNF contribution of FNFV
|
64.9
|
|
—
|
|
(1,024.2
|
)
|
1,024.2
|
|
—
|
|
—
|
|
—
|
|
—
|
|
||||||||||||||
|
Net earnings (loss)
|
—
|
|
—
|
|
108.6
|
|
—
|
|
0.2
|
|
—
|
|
(16.3
|
)
|
92.5
|
|
||||||||||||||
|
Balance, December 31, 2017
|
70.9
|
|
$
|
—
|
|
$
|
—
|
|
$
|
1,130.2
|
|
$
|
0.2
|
|
$
|
(71.0
|
)
|
$
|
93.7
|
|
$
|
1,153.1
|
|
|||||||
|
See Notes to Consolidated and Combined Financial Statements.
|
||||||||||||||||||||||||||||||
41
CANNAE HOLDINGS, INC.
|
|
Year ended December 31,
|
||||||||||
|
|
|||||||||||
|
|
2017
|
2016
|
2015
|
||||||||
|
|
(in millions)
|
||||||||||
|
Cash flows from operating activities:
|
|||||||||||
|
Net earnings (loss)
|
$
|
92.5
|
|
$
|
(11.9
|
)
|
$
|
(7.3
|
)
|
||
|
Adjustments to reconcile net earnings (loss) to net cash (used in) provided by operating activities:
|
|||||||||||
|
Depreciation and amortization
|
58.1
|
|
62.9
|
|
65.5
|
|
|||||
|
Equity in (earnings) losses of unconsolidated affiliates
|
(3.4
|
)
|
29.5
|
|
26.0
|
|
|||||
|
Realized gains, net
|
(4.9
|
)
|
(9.3
|
)
|
(11.8
|
)
|
|||||
|
Gain on sale of OneDigital
|
(276.0
|
)
|
—
|
|
—
|
|
|||||
|
Impairment of assets
|
9.9
|
|
3.3
|
|
18.5
|
|
|||||
|
Subsidiary stock-based compensation cost
|
0.5
|
|
1.2
|
|
1.4
|
|
|||||
|
Changes in assets and liabilities, net of effects from acquisitions:
|
|||||||||||
|
Net increase in trade receivables
|
(1.2
|
)
|
(4.2
|
)
|
(1.6
|
)
|
|||||
|
Net (increase) decrease in inventory, prepaid expenses and other assets
|
(12.2
|
)
|
11.8
|
|
11.2
|
|
|||||
|
Net increase (decrease) in accounts payable, accrued liabilities, deferred revenue and other
|
15.0
|
|
(7.6
|
)
|
(23.5
|
)
|
|||||
|
Net change in income taxes
|
31.0
|
|
(15.4
|
)
|
(67.3
|
)
|
|||||
|
Net cash (used in) provided by operating activities
|
(90.7
|
)
|
60.3
|
|
|
11.1
|
|
||||
|
Cash flows from investing activities:
|
|
|
|||||||||
|
Proceeds from sale of investment securities available for sale
|
31.6
|
|
—
|
|
—
|
|
|||||
|
Additions to property and equipment
|
(39.0
|
)
|
(49.6
|
)
|
(55.4
|
)
|
|||||
|
Additions to other intangible assets
|
(1.1
|
)
|
(5.6
|
)
|
(5.1
|
)
|
|||||
|
Purchases of investment securities available for sale
|
(1.3
|
)
|
(39.9
|
)
|
(28.8
|
)
|
|||||
|
Contributions to investments in unconsolidated affiliates
|
(1.4
|
)
|
(68.6
|
)
|
(4.5
|
)
|
|||||
|
Proceeds from the sale of cost method and other investments
|
1.3
|
|
36.0
|
|
—
|
|
|||||
|
Purchases of other long-term investments
|
(4.3
|
)
|
(6.3
|
)
|
(5.6
|
)
|
|||||
|
Distributions from investments in unconsolidated affiliates
|
1.1
|
|
42.4
|
|
315.7
|
|
|||||
|
Net other investing activities
|
1.4
|
|
(0.7
|
)
|
(0.6
|
)
|
|||||
|
Acquisition of T-System, net of cash acquired
|
(201.6
|
)
|
—
|
|
—
|
|
|||||
|
Acquisition of Brasada, net of cash acquired
|
—
|
|
(27.5
|
)
|
—
|
|
|||||
|
Proceeds from sale of OneDigital
|
326.0
|
|
—
|
|
—
|
|
|||||
|
Proceeds from sale of Cascade Timberlands, LLC
|
—
|
|
—
|
|
82.2
|
|
|||||
|
Other acquisitions/disposals of businesses, net of cash acquired
|
(21.0
|
)
|
(48.4
|
)
|
(24.8
|
)
|
|||||
|
Net cash provided by (used in) investing activities
|
91.7
|
|
(168.2
|
)
|
|
273.1
|
|
||||
|
Cash flows from financing activities:
|
|
|
|||||||||
|
Borrowings
|
84.4
|
|
76.7
|
|
132.0
|
|
|||||
|
Debt service payments
|
(35.8
|
)
|
(44.7
|
)
|
(31.2
|
)
|
|||||
|
Proceeds from sale of Cascades paid to noncontrolling interest shareholders
|
—
|
|
—
|
|
(24.5
|
)
|
|||||
|
Proceeds from FNF Investment
|
100.0
|
|
—
|
|
—
|
|
|||||
|
Subsidiary distributions paid to noncontrolling interest shareholders
|
(0.4
|
)
|
(0.7
|
)
|
(3.0
|
)
|
|||||
|
Payment of contingent consideration for prior period acquisitions
|
(4.0
|
)
|
—
|
|
—
|
|
|||||
|
Equity transactions with Parent, net
|
(46.0
|
)
|
(52.1
|
)
|
(285.8
|
)
|
|||||
|
Net cash provided by (used in) financing activities
|
98.2
|
|
(20.8
|
)
|
|
(212.5
|
)
|
||||
|
Net increase (decrease) in cash and cash equivalents
|
99.2
|
|
(128.7
|
)
|
|
71.7
|
|
||||
|
Cash and cash equivalents at beginning of period, including cash of discontinued operations
|
146.4
|
|
275.1
|
|
203.4
|
|
|||||
|
Cash and cash equivalents at end of period
|
$
|
245.6
|
|
$
|
146.4
|
|
|
$
|
275.1
|
|
|
See Notes to Consolidated and Combined Financial Statements
42
CANNAE HOLDINGS, INC.
NOTES TO CONSOLIDATED AND COMBINED FINANCIAL STATEMENTS
|
Note A.
|
Business and Summary of Significant Accounting Policies
|
The following describes the significant accounting policies of Cannae Holdings, Inc. and its subsidiaries (collectively, “we,” “us,” “our,” "Cannae," or the "Company”) which have been followed in preparing the accompanying Consolidated and Combined Financial Statements.
Description of Business
We are a holding company engaged in actively managing and operating a group of companies and investments with a net asset value of approximately
$1.2 billion
as of
December 31, 2017
. Our business consists of managing and operating certain majority-owned subsidiaries, as well as making additional majority and minority equity portfolio investments in businesses, in order to achieve superior financial performance and maximize the value of these assets. As of
December 31, 2017
, our primary majority and minority-owned subsidiaries include American Blue Ribbon Holdings, LLC ("ABRH"), T-System Holdings, LLC ("T-System"), Ceridian Holding, LLC ("Ceridian"), and various other controlled portfolio companies and minority equity investments.
See Note Q
Segment Information
for further discussion of the businesses comprising our reportable segments.
Split-off of Cannae from FNF
During December 2016, the board of directors of Fidelity National Financial, Inc. (“FNF” or “Parent”) authorized its management to pursue a plan to redeem each outstanding share of its Fidelity National Financial Ventures Group ("FNFV Group") common stock, par value
$0.0001
, for
one
share of common stock, par value
$0.0001
, of a newly formed entity, Cannae Holdings, Inc. (“Cannae”), with cash in lieu of fractional shares (the "Split-Off"). On November 17, 2017, FNF contributed to Cannae its majority and minority equity investment stakes in a number of entities, including ABRH, T-System, Ceridian, and various other controlled portfolio companies and minority equity investments. The Split-Off is intended to be tax-free to stockholders of FNFV Group common stock.
Following the Split-Off, FNF and Cannae operate as separate, publicly traded companies. In connection with the Split-Off, FNF and Cannae entered into certain agreements in order to govern certain of the ongoing relationships between the two companies after the Split-Off and to provide for an orderly transition. These agreements include a reorganization agreement, a corporate services agreement, a registration rights agreement, a voting agreement and a tax matters agreement.
The reorganization agreement provides for, among other things, the principal corporate transactions (including the internal restructuring) required to effect the Split-Off, certain conditions to the Split-Off and provisions governing the relationship between Cannae and FNF with respect to and resulting from the Split-Off. The tax matters agreement provides for the allocation and indemnification of tax liabilities and benefits between FNF and Cannae and other agreements related to tax matters. The voting and registration rights agreements provides for certain appearance and voting restrictions and registration rights on shares of Cannae owned by FNF after consummation of the Split-Off. Pursuant to the corporate services agreement (the "CSA"), FNF will provide Cannae with certain "back office" services including legal, tax, accounting, treasury and investor relations support. FNF will generally provide these services at no-cost for up to
three years
. Cannae will reimburse FNF for direct, out-of-pocket expenses incurred by FNF in providing these services.
The Split-Off was accounted for at historical cost due to the pro rata nature of the distribution to holders of FNFV Group common stock.
Principles of Consolidation and Combination and Basis of Presentation
The accompanying Consolidated and Combined Financial Statements are prepared in accordance with generally accepted accounting principles in the United States ("GAAP") and include the historical accounts as well as wholly-owned and majority-owned subsidiaries of the Company. Prior to the Split-Off, these financial statements represent a combination of the historical financial information of the operations attributed to FNFV, of which Cannae is comprised. The Company is allocated certain corporate overhead and management services expenses from FNF based on the terms of the CSA and our proportionate share of the expense determined on actual usage and our best estimate of management's allocation of time. Both FNF and Cannae believe such allocations are reasonable; however, they may not be indicative of the actual results of operations or cash flows of the Company had the Company been operating as an independent, publicly traded company for the periods presented or the amounts that will be incurred by the Company in the future.
All intercompany profits, transactions and balances have been eliminated. Our investments in non-majority-owned partnerships and affiliates are accounted for using the equity method until such time that they may become wholly or majority-owned. Earnings attributable to noncontrolling interests are recorded on the Consolidated and Combined Statements of Operations relating to
43
CANNAE HOLDINGS, INC.
NOTES TO CONSOLIDATED AND COMBINED FINANCIAL STATEMENTS — (continued)
majority-owned subsidiaries with the appropriate noncontrolling interest that represents the portion of equity not related to our ownership interest recorded on the Consolidated and Combined Balance Sheets in each period.
Management Estimates
The preparation of these Consolidated and Combined Financial Statements in conformity with GAAP requires management to make estimates and assumptions that affect the reported amounts of assets and liabilities and disclosure of contingent assets and liabilities at the date of the Consolidated and Combined Financial Statements and the reported amounts of revenues and expenses during the reporting period. Significant estimates made by management include the carrying amount and depreciation of property and equipment (Note E), the valuation of acquired intangible assets (Note B and Note H), fair value measurements (Note C), and accounting for income taxes (Note L). Actual results could differ from estimates.
Recent Developments
On March 26, 2018, Ceridian HCM announced that it has filed a draft registration statement on Form S-1 with the SEC, which has not yet become effective, relating to the proposed initial public offering of its common stock. The number of shares of common stock to be sold and the price range for the proposed offering have not yet been determined. The initial public offering is expected to commence after the SEC completes its review process, subject to market and other conditions. Ceridian will apply to list its common stock on the New York Stock Exchange and on the Toronto Stock Exchange. Securities in Ceridian may not be sold nor may offers to buy be accepted prior to the time the registration statement becomes effective.
On March 13, 2018, Cannae entered into an Assignment and Assumption Agreement with certain of ABRH's lenders to purchase all of the outstanding loans and lending commitments under the ABRH Credit Facility, which resulted in Cannae becoming ABRH's sole lender. Subsequent to the assignment, Cannae and ABRH entered into a Second Amendment to the Credit Agreement to increase the interest rate to
10%
, suspend the financial covenants until March 31, 2019 and require ABRH to pay to Cannae an amendment fee equal to
2%
of the outstanding loan balance.
On March 12, 2018, Cannae Holdings and Newport Global Opportunities Fund I-AAIV ("Newport Global") signed a non-binding letter of intent pursuant to which American Blue Ribbon Holdings intends to distribute
95%
of its family dining group and Legendary Baking to Newport Global in
100%
redemption of Newport Global’s interest in American Blue Ribbon Holdings. This proposed transaction would leave Cannae with approximately
94%
of the interest in O’Charley’s and 99 Restaurants, LLC, a wholly-owned subsidiary of FNH ("99 Restaurants"), along with an approximately
5%
interest in the family dining group and Legendary Baking.
On February 1, 2018, Cannae Holdings, LLC (“Cannae LLC”), a Delaware limited liability company and a subsidiary of the Company, Fidelity Newport Holdings, LLC, a Delaware limited liability company and a majority-owned subsidiary of Cannae LLC (“FNH” and, together with Cannae LLC, the “Sellers”), 99 Restaurants, J. Alexander’s Holdings, Inc., a Tennessee corporation (“JAX”), J. Alexander’s Holdings, LLC, a Delaware limited liability company and direct, majority-owned subsidiary of JAX (“JAX OP”) and Nitro Merger Sub, Inc., a Tennessee corporation and wholly-owned subsidiary of JAX OP (“Merger Sub”) entered into a letter agreement to terminate their previously reported Agreement and Plan of Merger, dated as of August 3, 2017, by and among the Sellers, 99 Restaurants, JAX, JAX OP and Merger Sub (as amended on January 30, 2018, the “Merger Agreement”), pursuant to Section 9.1(b)(iii) thereof. The parties reached this decision following the conclusion of a special meeting of the shareholders of JAX held on February 1, 2018.
On January 29, 2018, the Board of Directors of the Company adopted a resolution increasing the size of the Company’s Board of Directors to
six
, and elected James B. Stallings, Jr. to serve on our Board of Directors. Mr. Stallings was appointed to serve as Chairman of the Audit Committee of the Company.
On November 17, 2017, Mr. Frank P. Willey was appointed to the Company’s Board of Directors.
On November 17, 2017, a special meeting of the FNFV Group stockholders was held to approve the Split-Off. The Split-Off was approved by a majority of the stockholders and was completed on November 17, 2017. As a result, Cannae is now a separate public company listed under the ticker symbol CNNE on The New York Stock Exchange.
On November 16, 2017, certain subsidiaries of FNF contributed an aggregate of
$100.0 million
to us (the "FNF Investment") in exchange for
5,706,134
shares of Cannae common stock. In addition, on November 17, 2017, FNF issued to Cannae a revolver note in aggregate principal amount of up to
$100.0 million
(the "FNF Revolver"), which accrues interest at LIBOR plus
450
basis points and matures on the
five
-year anniversary of the date of the revolver note. The maturity date is automatically extended for additional
five
-year terms unless notice of non-renewal is otherwise provided by either FNF or Cannae, in their sole discretion. The FNF Revolver replaces the Revolver Note discussed in Note K
Notes Payable
.
On October 16, 2017, Fidelity National Financial Ventures LLC ("FNFV LLC"), a wholly-owned subsidiary of the Company, completed a merger pursuant to an Agreement and Plan of Merger (the ‘‘T-System Merger Agreement’’) with Project F Merger
44
CANNAE HOLDINGS, INC.
NOTES TO CONSOLIDATED AND COMBINED FINANCIAL STATEMENTS — (continued)
Sub LLC, a Delaware limited liability company and a wholly-owned subsidiary of FNFV LLC (‘‘T-System Merger Sub’’), T-System Holding LLC, a Delaware limited liability company (‘‘T-System’’), and Francisco Partners II, L.P., a Delaware limited partnership, providing for the acquisition of T-System by FNFV LLC pursuant to the proposed merger (the ‘‘T-System Merger’’) of T-System with and into T- System Merger Sub, which resulted in T-System continuing as the surviving entity and wholly-owned subsidiary of FNFV LLC.
As a result of the T-System Merger, all of the outstanding securities of T-System were canceled, extinguished and converted into the right to receive a portion of the aggregate merger consideration in accordance with the terms of the T-System Merger Agreement. The aggregate merger consideration was equal to
$202.9 million
, in cash.
On June 6, 2017, we closed on the sale of Digital Insurance, Inc. ("OneDigital") for
$560.0 million
in an all-cash transaction. After repayment of debt, payout to option holders and a minority equity investor and other transaction-related payments, the Company received
$331.4 million
from the sale, which includes
$326.0 million
in cash and
$5.4 million
in purchase price holdback receivable. We recognized a pre-tax gain of
$276.0 million
on the sale and
$126.3 million
in income tax expense which are included in Net earnings from discontinued operations on the Consolidated and Combined Statement of Operations for the year ended December 31, 2017. Income tax expense resulting from the gain was recorded as a discrete tax expense for the three months ended June 30, 2017 and included a permanent tax adjustment for nondeductible goodwill. We retained no ownership in OneDigital and have
no
continuing involvement with OneDigital as of the date of the sale.
As a result of the sale of OneDigital we have reclassified the assets and liabilities divested as assets and liabilities of discontinued operations in our Consolidated and Combined Balance Sheet as of December 31, 2016. Further, the financial results of OneDigital have been reclassified to discontinued operations for all periods presented in our Consolidated and Combined Statements of Operations. See Note N
Discontinued Operations
for further details of the results of OneDigital.
Cash and Cash Equivalents
Highly liquid instruments, including money market instruments, purchased as part of cash management with original maturities of three months or less, and certain amounts in transit from credit and debit card processors, are considered cash equivalents. The carrying amounts reported in the Consolidated and Combined Balance Sheets for these instruments approximate their fair value.
Investments
Fixed maturity securities are purchased to support our investment strategies, which are developed based on factors including rate of return, maturity, credit risk, duration, tax considerations and regulatory requirements. Fixed maturity securities which may be sold prior to maturity to support our investment strategies are carried at fair value and are classified as available for sale as of the balance sheet dates. Fair values for fixed maturity securities are principally a function of current market conditions and are valued based on quoted prices in markets that are not active or model inputs that are observable either directly or indirectly. Discount or premium is recorded for the difference between the purchase price and the principal amount. The discount or premium is amortized or accrued using the interest method and is recorded as an adjustment to interest and investment income. The interest method results in the recognition of a constant rate of return on the investment equal to the prevailing rate at the time of purchase or at the time of subsequent adjustments of book value.
Equity securities held are considered to be available for sale and carried at fair value as of the balance sheet dates. Our equity securities are Level 1 financial assets and fair values are based on quoted prices in active markets.
Investments in unconsolidated affiliates are recorded using the equity method of accounting.
Realized gains and losses on the sale of investments are determined on the basis of the cost of the specific investments sold and are credited or charged to income on a trade date basis. Unrealized gains or losses on securities which are classified as available for sale, net of applicable deferred income tax expenses (benefits), are excluded from earnings and credited or charged directly to a separate component of equity. If any unrealized losses on available for sale securities are determined to be other-than-temporary, such unrealized losses are recognized as realized losses. Unrealized losses are considered other-than-temporary if factors exist that cause us to believe that the value will not increase to a level sufficient to recover our cost basis. Some factors considered in evaluating whether or not a decline in fair value is other-than-temporary include: (i) our need and intent to sell the investment prior to a period of time sufficient to allow for a recovery in value; (ii) the duration and extent to which the fair value has been less than cost; and (iii) the financial condition and prospects of the issuer. Such reviews are inherently uncertain and the value of the investment may not fully recover or may decline in future periods resulting in a realized loss.
Fair Value of Financial Instruments
The fair values of financial instruments presented in the Consolidated and Combined Financial Statements are estimates of the fair values at a specific point in time using available market information and appropriate valuation methodologies. These estimates are subjective in nature and involve uncertainties and significant judgment in the interpretation of current market data.
45
CANNAE HOLDINGS, INC.
NOTES TO CONSOLIDATED AND COMBINED FINANCIAL STATEMENTS — (continued)
We do not necessarily intend to dispose of or liquidate such instruments prior to maturity. See Note C
Fair Value Measurements
for further details.
Trade Receivables
Restaurant Group.
Trade receivables on the Consolidated and Combined Balance Sheets for the Restaurant Group consists primarily of billings to third-party customers of ABRH's bakery business, business to business gift card sales, insurance-related reimbursement, rebates, tenant improvement allowances, and billings to franchisees for royalties, initial and renewal fees, equipment sales and rent. Trade receivables are recorded net of an allowance for doubtful accounts which is our best estimate of the amount of probable credit losses related to existing receivables.
T-System.
Trade receivables on the Consolidated and Combined Balance Sheets for T-System consists primarily of billings to third-party customers and are carried at the invoiced amount less an estimate for doubtful accounts.
The carrying values reported in the Consolidated and Combined Balance Sheets for trade receivables approximate their fair value.
Inventory
Inventory primarily consists of restaurant food products and supplies and is stated at the lower of cost or net realizable value. Cost is determined using the first in, first out method for restaurant inventory and standard cost that approximates actual cost on a first in, first out basis for the bakery operations. Inventory primarily consists of food, beverages, paper products and supplies.
Other long term investments and non-current assets
Other long-term investments consist of various cost-method investments and land held for investment purposes, which are carried at historical cost.
Other non-current assets include notes receivable from third-parties and other miscellaneous non-current assets.
Goodwill
Goodwill represents the excess of cost over fair value of identifiable net assets acquired and assumed in a business combination. Goodwill and other intangible assets with indefinite useful lives are reviewed for impairment annually or more frequently if circumstances indicate potential impairment, through a comparison of fair value to the carrying amount. In evaluating the recoverability of goodwill, we perform an annual goodwill impairment analysis. We have the option to first assess goodwill for impairment based on a review of qualitative factors to determine if events and circumstances exist which will lead to a determination that the fair value of a reporting unit is greater than its carrying amount, prior to performing a full fair-value assessment. If, after assessing the totality of events or circumstances, the Company determines it is not more likely than not that the fair value of a reporting unit is less than its carrying amount, then performing the two-step impairment test is unnecessary. However, if the Company concludes otherwise, then it is required to perform the first step of the two-step impairment test by calculating the fair value of the reporting unit and comparing the fair value with the carrying amount of the reporting unit. If the carrying amount of a reporting unit exceeds its fair value, then the Company is required to perform the second step of the goodwill impairment test to measure the amount of the impairment loss, if any.
We completed annual goodwill impairment analyses in the fourth quarter of each respective year using a September 30 measurement date and as a result
no
goodwill impairments have been recorded. For the years ended December 31, 2017, 2016, and 2015, we determined that there were no events or circumstances which indicated that the carrying value exceeded the fair value.
Other Intangible Assets
We have other intangible assets, not including goodwill, which consist primarily of customer relationships and contracts, trademarks and tradenames which are generally recorded in connection with acquisitions at their fair value, franchise rights, the fair value of purchased software and capitalized software development costs. Intangible assets with estimable lives are amortized over their respective estimated useful lives to their estimated residual values and reviewed for impairment whenever events or changes in circumstances indicate that the carrying amount may not be recoverable. In general, customer relationships are amortized over their estimated useful lives using an accelerated method which takes into consideration expected customer attrition rates. Contractual relationships are generally amortized over their respective contractual lives. Trademarks are generally considered intangible assets with indefinite lives and are reviewed for impairment at least annually. Capitalized software development costs and purchased software are recorded at cost and amortized using the straight-line method over their estimated useful life. Useful lives of computer software range from
3
to
10
years. We also assess the recorded value of computer software for impairment on a regular basis by comparing the carrying value to the estimated future cash flows to be generated by the underlying software
46
CANNAE HOLDINGS, INC.
NOTES TO CONSOLIDATED AND COMBINED FINANCIAL STATEMENTS — (continued)
asset. There is an inherent uncertainty in determining the expected useful life of or cash flows to be generated from computer software.
We recorded
$2.9 million
of impairment expense related to a tradename in our Restaurant Group segment in the year ended December 31, 2017. We recorded
$1.1 million
in impairment expense to an abandoned software project in our Restaurant Group segment during the year ended December 31, 2015. We recorded
no
impairment expense related to other intangible assets in the year ended December 31, 2016.
Property and Equipment, net
Property and equipment, net are recorded at cost, less accumulated depreciation. Depreciation is computed primarily using the straight-line method based on the estimated useful lives of the related assets:
thirty
to
forty
years for buildings and
three
to
twenty-five
years for furniture, fixtures and equipment. Leasehold improvements are amortized on a straight-line basis over the lesser of the term of the applicable lease or the estimated useful lives of such assets. Property and equipment are reviewed for impairment whenever events or circumstances indicate that the carrying amounts may not be recoverable.
In our Restaurant Group, all direct external costs associated with obtaining the land, building and equipment for each new restaurant, as well as construction period interest are capitalized. Direct external costs associated with obtaining the dining room and kitchen equipment, signage and other assets and equipment are also capitalized. In addition, for each new restaurant and re-branded restaurant, a portion of the internal direct costs of its real estate and construction department are also capitalized.
We recorded
$6.9 million
,
$2.8 million
, and
$1.6 million
of impairment expense related to Property and equipment in our Restaurant Group segment in the years ended December 31, 2017, 2016 and 2015, respectively, which is recorded within Other operating expenses on our Consolidated and Combined Statement of Operations for the year then ended.
Insurance Reserves
ABRH is currently self-insured for a portion of its workers' compensation, general liability, and liquor liability losses (collectively, casualty losses) as well as certain other insurable risks. To mitigate the cost of its exposures for certain property and casualty losses, ABRH makes annual decisions to either retain the risks of loss up to a certain maximum per occurrence, aggregate loss limits negotiated with its insurance carriers, or fully insure those risks. ABRH is also self-insured for healthcare claims for eligible participating employees subject to certain deductibles and limitations. We have accounted for ABRH's retained liabilities for casualty losses and healthcare claims, including reported and incurred but not reported claims, based on information provided by third-party actuaries. As of December 31, 2017, ABRH was committed under letters of credit totaling
$11.0 million
issued primarily in connection with ABRH's casualty insurance programs.
Income Taxes
We recognize deferred tax assets and liabilities for temporary differences between the financial reporting basis and the tax basis of our assets and liabilities and expected benefits of utilizing net operating loss and credit carryforwards. Deferred tax assets and liabilities are measured using enacted tax rates expected to apply to taxable income in the years in which those temporary differences are expected to be recovered or settled. The impact of changes in tax rates and laws on deferred taxes, if any, is applied to the years during which temporary differences are expected to be settled and reflected in the financial statements in the period enacted.
We recognize the benefits of uncertain tax positions in the financial statements only after determining a more likely than not probability that the uncertain tax positions will withstand challenge, if any, from taxing authorities. When facts and circumstances change, we reassess these probabilities and record any changes in the financial statements as appropriate. Uncertain tax positions are accounted for by determining the minimum recognition threshold that a tax position is required to meet before being recognized in the financial statements. This determination requires the use of judgment in assessing the timing and amounts of deductible and taxable items. Tax positions that meet the more likely than not recognition threshold are recognized and measured as the largest amount of tax benefit that is more than 50% likely to be realized upon settlement with a taxing authority that has full knowledge of all relevant information. The Company recognizes interest and penalties accrued related to unrecognized tax benefits as components of income tax expense.
Parent Investment in FNFV
Parent investment in FNFV on the Consolidated and Combined Balance Sheet as of December 31, 2016 represents FNF's historical investment in the Company, the Company's accumulated net earnings after taxes prior to the Split-Off, and the net effect of transactions with and allocations from FNF prior to the Split-Off. In conjunction with the Split-Off, Parent investment in FNFV was reclassified to Additional paid-in capital.
47
CANNAE HOLDINGS, INC.
NOTES TO CONSOLIDATED AND COMBINED FINANCIAL STATEMENTS — (continued)
Revenue Recognition
Restaurant Group.
Restaurant revenue on the Consolidated and Combined Statements of Operations consists of restaurant sales, bakery operations, and to a lesser extent, franchise revenue and other revenue. Restaurant sales include food and beverage sales and are net of applicable state and local sales taxes and discounts and are recognized as services are performed and goods are provided. Revenue from bakery operations is recognized in the period during which the products are shipped to the customer. Franchise revenue and other revenue consist of development fees and royalties on sales by franchised units. Initial franchise fees are recognized as income upon commencement of the franchise operation and completion of all material services and conditions by the Company. Royalties are calculated as a percentage of the franchisee sales and recognized in the period in which the sales are generated. Revenue resulting from the sale of gift cards is recognized in the period in which the gift card is redeemed and is recorded as deferred revenue until recognized.
Cost of restaurant revenue on the Consolidated and Combined Statements of Operations consists of direct costs associated with restaurant revenue. We receive vendor rebates from various nonalcoholic beverage suppliers, and to a lesser extent, suppliers of food products and supplies. Rebates are recognized as reductions to cost of food and beverage in the period in which they are earned.
T-System.
T-System recognizes revenue when delivery has occurred, persuasive evidence of an arrangement exists, fees are fixed or determinable and collection is deemed probable. With respect to long-term licensing agreements, T-System recognizes only the portion of revenue that is earned during the current year with the remainder of the fee deferred to subsequent years. Revenues are recorded net of any sales taxes charged to customers.
T-System sells paper medical documentation templates to emergency care providers to be used for documentation of patient care on a fixed fee determined by a pricing sheet based on annual billable patient visits. Licenses are sold through one-time perpetual license fee arrangements and recurring fixed-term or subscription fee arrangements. Delivery is determined at the time the templates are provided to the customer and the customer's personnel has been trained. The license fee is billed and recognized upfront for onetime perpetual licenses and monthly for recurring fixed-term or subscription licenses after delivery has occurred. For customers that pay the license fee in advance for the full term of the contract, revenue is recognized ratably over the term of such contract.
T-System also sells an electronic version of the medical documentation system, provided in the form of a non-exclusive license to use the software at the sites under the agreement. The Company sells software licenses through one-time perpetual license fee arrangements and recurring fixed-term or subscription fee arrangements. For software licensing arrangements including multiple elements, each element of the arrangement is separately identified and accounted for based on vendor specific objective evidence ("VSOE") of stand-alone value of such element. Revenue is not recognized on any element in a software arrangement if the undelivered elements lack VSOE of stand-alone value. When the only undelivered element is post-contract support ("PCS") and PCS has VSOE, revenue is recognized ratably over the PCS term.
Corporate and Other.
Other operating revenue on the Consolidated and Combined Statements of Operations also consists of income generated by our resort operations which includes sales of real estate, lodging rentals, food and beverage sales, and other income from various resort services offered.
Advertising Costs
The Company expenses advertising and marketing costs as incurred, except for certain advertising production costs that are initially capitalized and subsequently expensed the first time the advertising takes place. During 2017, 2016, and 2015, the Company incurred
$35.6 million
,
$36.1 million
, and
$35.6 million
of advertising and marketing costs, respectively, related to advertising at ABRH, T-System and in our real estate operations. These costs are included in Other operating expenses on the Consolidated and Combined Statements of Operations.
Comprehensive Earnings (Loss)
We report comprehensive earnings (loss) in accordance with GAAP on the Consolidated and Combined Statements of Comprehensive Earnings (Loss). Total comprehensive earnings (loss) are defined as all changes in shareholders' equity during a period, other than those resulting from investments by and distributions to shareholders. While total comprehensive earnings (loss) is the activity in a period and is largely driven by net earnings in that period, accumulated other comprehensive earnings or loss represents the cumulative balance of other comprehensive earnings, net of tax, as of the balance sheet date. Amounts reclassified to net earnings relate to the realized gains (losses) on our investments and other financial instruments, excluding investments in unconsolidated affiliates, and are included in Realized gains and losses, net on the Consolidated and Combined Statements of Operations.
48
CANNAE HOLDINGS, INC.
NOTES TO CONSOLIDATED AND COMBINED FINANCIAL STATEMENTS — (continued)
Changes in the balance of other comprehensive earnings (loss) by component are as follows:
|
|
Unrealized gain (loss) on investments and other financial instruments, net (excluding investments in unconsolidated affiliates)
|
Unrealized (loss) gain relating to investments in unconsolidated affiliates
|
Total Accumulated Other Comprehensive (Loss) Earnings
|
||||||||
|
|
(In millions)
|
||||||||||
|
Balance December 31, 2015
|
$
|
2.3
|
|
$
|
(77.8
|
)
|
$
|
(75.5
|
)
|
||
|
Other comprehensive earnings
|
2.6
|
|
4.8
|
|
7.4
|
|
|||||
|
Balance December 31, 2016
|
4.9
|
|
(73.0
|
)
|
(68.1
|
)
|
|||||
|
Other comprehensive (losses) earnings
|
(8.7
|
)
|
8.9
|
|
0.2
|
|
|||||
|
Reclassification adjustments
|
(3.1
|
)
|
$
|
—
|
|
(3.1
|
)
|
||||
|
Balance December 31, 2017
|
$
|
(6.9
|
)
|
$
|
(64.1
|
)
|
$
|
(71.0
|
)
|
||
Stock-Based Compensation Plans
Stock-based compensation includes restricted stock awards granted to certain members of management in Cannae common stock, as well as in historical FNFV Group tracking stock. We account for stock-based compensation plans using the fair value method. Under the fair value method of accounting, compensation cost is measured based on the fair value of the award at the grant date, using quoted market prices of the underlying stock, and recognized over the service period.
Earnings Per Share
Basic earnings per share, as presented on the Consolidated and Combined Statement of Operations, is computed by dividing net earnings available to common shareholders by the weighted average number of common shares outstanding during the period.
On November 17, 2017, the date of the consummation of the Split-Off,
70.6 million
common shares of CNNE were distributed to FNFV Group shareholders. For comparative purposes, the weighted average number of common shares outstanding and basic and diluted earnings per share for the years ended December 31, 2016 and 2015 were calculated using the number of shares distributed as if those shares were issued and outstanding beginning January 1, 2015.
In periods when earnings are positive, diluted earnings per share is calculated by dividing net earnings available to common shareholders by the weighted average number of common shares outstanding plus the impact of assumed conversions of potentially dilutive securities. For periods when we recognize a net loss, diluted earnings per share is equal to basic earnings per share as the impact of assumed conversions of potentially dilutive securities is considered to be antidilutive. We have granted certain shares of restricted stock which have been treated as common share equivalents for purposes of calculating diluted earnings per share for periods in which positive earnings have been reported.
Instruments which provide the ability to purchase shares of our common stock that are antidilutive are excluded from the computation of diluted earnings per share. For the year ended
December 31, 2017
,
0.1 million
shares of restricted stock were excluded from the calculation of diluted earnings per share as they were antidilutive.
Revision of Prior Period Financial Statements
In connection with the preparation of our Consolidated and Combined Financial Statements for the year ended December 31, 2017, we identified and corrected prior period errors pertaining to the accounting for our investment in Ceridian and our accounting for leases associated with the acquisition of O'Charley's and ABRH in 2012. Specifically the adjustments related to: (1) a misclassification by Ceridian of a deferred tax liability attributable to previously amortized tax basis goodwill as a deferred tax liability eligible to offset deferred tax assets when determining the requirement for a valuation allowance, (2) our accounting for the equity pick-up related to stock-based compensation at Ceridian, (3) the timing of accounting adjustments made by Ceridian and by us and (4) the correction of the assumptions used in the valuation of certain favorable and unfavorable lease assets and liabilities acquired with O'Charley's and ABRH in 2012. Adjustments in (2) above related to our accounting for the equity pick-up related to stock-based compensation at Ceridian had no impact to equity due to offsetting adjustments to Parent investment in FNFV.
These corrections resulted in:
i.
an increase in Equity in losses of unconsolidated affiliates of
$7.2 million
and
$3.4 million
for the years ended December 31, 2016 and 2015, respectively;
ii.
an increase in Income tax benefit of
$0.8 million
for the year ended December 31, 2016;
49
CANNAE HOLDINGS, INC.
NOTES TO CONSOLIDATED AND COMBINED FINANCIAL STATEMENTS — (continued)
iii.
an increase in Other intangible assets, Goodwill, Deferred tax asset, and Accounts payable and other accrued liabilities, long term of
$12.4 million
,
$1.7 million
,
$2.2 million
and
$12.5 million
, respectively, as of December 31, 2016;
iv.
a decrease in Investments in unconsolidated affiliates, Property and equipment and Prepaid expenses and other current assets of
$6.3 million
,
$1.1 million
, and
$0.5 million
, respectively, as of December 31, 2016; and
v.
a decrease in Parent investment in FNFV of
$3.9 million
,
$2.6 million
, and
$2.6 million
as of December 31, 2016, 2015 and 2014, respectively.
No earnings per share data was affected as our shares began trading on November 20, 2017 and therefore was not previously presented.
In accordance with accounting guidance found in Accounting Standards Codification ("ASC") Topic 250-10 (SEC Staff Accounting Bulletin No. 99, Materiality), we assessed the materiality of the errors from quantitative and qualitative perspectives and concluded that the errors were not material, individually or in the aggregate, to any of our previously issued financial statements. Since the revision was not material to any prior period, no amendments to previously issued financial statements are required. Consequently, we have adjusted for these errors by revising the financial statement line items discussed above, including the related impacts to the statements of comprehensive earnings (loss), equity and cash flows and disclosures in our historical financial statements presented herein.
Note B. Acquisitions and Dispositions
The results of operations and financial position of the entities acquired during any period are included in the Consolidated and Combined Financial Statements from and after the date of acquisition.
T-System
On October 16, 2017, we completed the T-System Merger for aggregate merger consideration of
$202.9 million
. T-System is a provider of clinical documentation and coding solutions to hospital-based and free-standing emergency departments and urgent care facilities.
The Company paid total consideration, net of cash received, of
$201.6 million
in exchange for
100%
of the equity ownership of T-System. The total consideration paid was as follows (in millions):
|
Cash paid
|
$
|
202.9
|
|
|
Less: Cash acquired
|
1.3
|
|
|
|
Total cash consideration paid
|
$
|
201.6
|
|
The purchase price has been allocated to T-System's assets acquired and liabilities assumed based on our best estimates of their fair values as of the acquisition date. Goodwill has been recorded based on the amount that the purchase price exceeds the fair value of the net assets acquired.
$32.8 million
of the goodwill recorded is expected to be deductible for tax purposes. These estimates are preliminary and subject to adjustments as we complete our valuation process with respect to Goodwill, Other intangible assets, and Deferred tax liabilities.
The following table summarizes the total purchase price consideration and the preliminary fair value amounts recognized for the assets acquired, excluding cash received, and liabilities assumed as of the acquisition date (in millions):
50
CANNAE HOLDINGS, INC.
NOTES TO CONSOLIDATED AND COMBINED FINANCIAL STATEMENTS — (continued)
|
|
Fair Value
|
||
|
Trade receivables
|
$
|
11.3
|
|
|
Prepaid and other current assets
|
2.0
|
|
|
|
Property and equipment
|
1.2
|
|
|
|
Goodwill
|
99.6
|
|
|
|
Other intangible assets
|
112.4
|
|
|
|
Total assets acquired
|
226.5
|
|
|
|
|
|||
|
Accounts payable and accrued liabilities
|
6.6
|
|
|
|
Deferred revenue
|
11.0
|
|
|
|
Deferred tax liabilities
|
7.3
|
|
|
|
Total liabilities assumed
|
24.9
|
|
|
|
Net assets acquired
|
$
|
201.6
|
|
51
CANNAE HOLDINGS, INC.
NOTES TO CONSOLIDATED AND COMBINED FINANCIAL STATEMENTS — (continued)
For comparative purposes, selected unaudited pro-forma combined results of operations of Cannae for the years ended December 31, 2017, 2016 and 2015 are presented below (in millions). Pro-forma results presented assume the consolidation of T-System occurred as of the beginning of the 2015 period. Amounts are adjusted to exclude costs directly attributable to the acquisition of T-System, including transaction costs and amortization of acquired intangible assets.
|
Year ended December 31,
|
|||||||||||
|
2017
|
2016
|
2015
|
|||||||||
|
(Unaudited)
|
|||||||||||
|
Total revenues
|
$
|
1,214.8
|
|
$
|
1,242.5
|
|
$
|
1,478.4
|
|
||
|
Net earnings (loss) attributable to Cannae Holdings
|
109.8
|
|
(5.4
|
)
|
(18.9
|
)
|
|||||
The gross carrying values and weighted average estimated useful lives of property and equipment and other intangible assets acquired in the T-System acquisition consists of the following (dollars in millions):
|
Gross Carrying Value
|
Weighted Average
Estimated Useful Life
(in years)
|
|||||
|
Property and equipment
|
$
|
1.2
|
|
3 - 5
|
||
|
Other intangible assets:
|
||||||
|
Customer relationships
|
55.2
|
|
10
|
|||
|
Computer software
|
45.1
|
|
9
|
|||
|
Tradename
|
10.6
|
|
10
|
|||
|
Noncompete agreement
|
1.5
|
|
5
|
|||
|
Total other intangible assets
|
112.4
|
|
||||
|
Total
|
$
|
113.6
|
|
|||
Corporate and other
Brasada
On January 18, 2016, we completed our purchase of certain assets of Brasada Ranch Development, LLC, Brasada Ranch Hospitality, LLC, Brasada Ranch Utilities, LLC, Brasada Rental Management, LLC, and Oregon Resorts, LLC (collectively, "Brasada") through our
87%
owned subsidiary FNF NV Brasada, LLC. Brasada is a ranch-style resort in Bend/Powell Butte, Oregon which offers luxury accommodations, championship golf, world-class dining and amenities, and vast recreational activities. The acquisition was made to supplement our resort, land and real estate holdings.
The Company paid total consideration, net of cash received, of
$27.5 million
in exchange for the assets of Brasada. The total consideration paid was as follows (in millions):
|
Cash paid
|
$
|
12.0
|
|
|
Cash consideration financed through a mortgage loan
|
15.5
|
|
|
|
Total cash consideration paid
|
$
|
27.5
|
|
The purchase price has been allocated to Brasada's assets acquired and liabilities assumed based on our best estimates of their fair values as of the acquisition date.
52
CANNAE HOLDINGS, INC.
NOTES TO CONSOLIDATED AND COMBINED FINANCIAL STATEMENTS — (continued)
The following table summarizes the total purchase price consideration and the fair value amounts recognized for the assets acquired, excluding cash received, and liabilities assumed as of the acquisition date (in millions):
|
|
Fair Value
|
||
|
Trade receivables
|
$
|
0.4
|
|
|
Prepaid and other current assets
|
1.2
|
|
|
|
Other long-term investments
|
8.7
|
|
|
|
Property and equipment
|
14.4
|
|
|
|
Other intangible assets
|
7.0
|
|
|
|
Total assets acquired
|
31.7
|
|
|
|
|
|||
|
Accounts payable and accrued liabilities
|
1.1
|
|
|
|
Deferred revenue
|
1.1
|
|
|
|
Notes payable
|
0.2
|
|
|
|
Total liabilities assumed
|
2.4
|
|
|
|
Total noncontrolling assumed
|
1.8
|
|
|
|
Net assets acquired
|
$
|
27.5
|
|
For comparative purposes, selected unaudited pro-forma combined results of operations of Cannae Holdings for the years ended December 31, 2016 and 2015 are presented below (in millions). Pro-forma results presented assume the consolidation of Brasada occurred as of the beginning of the 2015 period. Amounts are adjusted to exclude costs directly attributable to the acquisition of Brasada, including transaction costs.
|
Year ended December 31,
|
|||||||
|
2016
|
2015
|
||||||
|
(Unaudited)
|
|||||||
|
Total revenues
|
$
|
1,179.4
|
|
$
|
1,434.0
|
|
|
|
Net loss attributable to Cannae Holdings
|
(11.7
|
)
|
(20.3
|
)
|
|||
The gross carrying values and weighted average estimated useful lives of property and equipment and other intangible assets acquired in the Brasada acquisition consists of the following (dollars in millions):
|
Gross Carrying Value
|
Weighted Average
Estimated Useful Life
(in years)
|
|||||
|
Property and equipment
|
$
|
14.4
|
|
3 - 40
|
||
|
Other intangible assets:
|
||||||
|
Management services contract
|
5.2
|
|
12
|
|||
|
Tradename
|
1.8
|
|
15
|
|||
|
Total other intangible assets
|
7.0
|
|
||||
|
Total
|
$
|
21.4
|
|
|||
Dispositions
On June 6, 2017, we closed on the sale of Digital Insurance, Inc. ("OneDigital") for
$560.0 million
in an all-cash transaction. After repayment of debt, payout to option holders and a minority equity investor and other transaction-related payments, the Company received
$331.4 million
from the sale, which includes
$326.0 million
in cash and
$5.4 million
in purchase price holdback receivable. We recognized a pre-tax gain of
$276.0 million
on the sale and
$126.3 million
in income tax expense which are included in Net earnings from discontinued operations on the Consolidated and Combined Statement of Operations for the year ended December 31, 2017.
On January 25, 2016, we completed the sale of our Max & Erma's restaurant concept for
$6.5 million
pursuant to an Asset Purchase Agreement ("APA"). In the years ended December 31, 2016 and 2015 we recorded
$3.0 million
in total expense, inclusive of a
$2.5 million
loss on the sale and
$0.5 million
in impairment charges, and
$17.3 million
in expense related to impairment
53
CANNAE HOLDINGS, INC.
NOTES TO CONSOLIDATED AND COMBINED FINANCIAL STATEMENTS — (continued)
charges related to the sale, respectively, which are included in realized gains and (losses), net and other operating expense, respectively, on the Consolidated and Combined Statements of Operations for the years then ended.
On September 16, 2015, J. Alexander's, Inc. ("J. Alexander's") and FNF entered into a Separation and Distribution Agreement, pursuant to which FNF agreed to distribute one hundred percent (100%) of its shares of J. Alexander's common stock, on a pro rata basis, to the holders of FNFV Group tracking stock. Holders of FNFV Group tracking stock received approximately
0.17272
shares of J. Alexander's common stock for every one share of FNFV Group tracking stock held at the close of business on September 22, 2015, the record date for the distribution (the "Distribution"). The Distribution was made on September 28, 2015. The results of operations of J. Alexander's are included in the Consolidated and Combined Statements of Operations through the date which it was distributed to holders of FNFV Group tracking stock.
On February 18, 2015, we closed the sale of substantially all of the assets of Cascade Timberlands, LLC ("Cascade") which grows and sells timber and in which we owned a
70.2%
interest, for
$85.5 million
less a replanting allowance of
$0.7 million
and an indemnity holdback of
$1.0 million
. The gain on the sale of
$12.2 million
was recorded in realized gains and (losses), net in the Consolidated and Combined Statement of Operations in the year ended December 31, 2015. There was no effect on net earnings attributable to Cannae due to offsetting amounts attributable to noncontrolling interests.
|
Note C.
|
Fair Value Measurements
|
The fair value hierarchy established by the accounting standards on fair value measurements includes three levels which are based on the priority of the inputs to the valuation technique. The fair value hierarchy gives the highest priority to quoted prices in active markets for identical assets or liabilities (Level 1) and the lowest priority to unobservable inputs (Level 3). If the inputs used to measure the financial instruments fall within different levels of the hierarchy, the categorization is based on the lowest level input that is significant to the fair value measurement of the instrument. Financial assets and liabilities that are recorded in the Consolidated and Combined Balance Sheets are categorized based on the inputs to the valuation techniques as follows:
Level 1.
Financial assets and liabilities whose values are based on unadjusted quoted prices for identical assets or liabilities in an active market that we have the ability to access.
Level 2.
Financial assets and liabilities whose values are based on quoted prices in markets that are not active or model inputs that are observable either directly or indirectly for substantially the full term of the asset or liability.
Level 3.
Financial assets and liabilities whose values are based on model inputs that are unobservable.
Recurring Fair Value Measurements
The following table presents our fair value hierarchy for those assets and liabilities measured at fair value on a recurring basis as of December 31, 2017 and 2016, respectively:
|
|
December 31, 2017
|
||||||||||||||
|
|
Level 1
|
Level 2
|
Level 3
|
Total
|
|||||||||||
|
|
(In millions)
|
||||||||||||||
|
Assets:
|
|||||||||||||||
|
Fixed-maturity securities available for sale:
|
|
|
|
|
|
|
|
|
|||||||
|
Corporate debt securities
|
$
|
—
|
|
$
|
14.8
|
|
$
|
—
|
|
$
|
14.8
|
|
|||
|
Equity securities available for sale
|
17.7
|
|
—
|
|
—
|
|
17.7
|
|
|||||||
|
Deferred compensation
|
4.4
|
|
—
|
|
—
|
|
4.4
|
|
|||||||
|
Total assets
|
$
|
22.1
|
|
$
|
14.8
|
|
$
|
—
|
|
$
|
36.9
|
|
|||
|
Liabilities:
|
|||||||||||||||
|
Deferred compensation
|
4.4
|
|
—
|
|
—
|
|
4.4
|
|
|||||||
|
Total liabilities
|
$
|
4.4
|
|
$
|
—
|
|
$
|
—
|
|
$
|
4.4
|
|
|||
|
|
December 31, 2016
|
||||||||||||||
|
|
Level 1
|
Level 2
|
Level 3
|
Total
|
|||||||||||
|
|
(In millions)
|
||||||||||||||
|
Assets:
|
|||||||||||||||
|
Fixed-maturity securities available for sale:
|
|
|
|
|
|
|
|
|
|||||||
|
Corporate debt securities
|
$
|
—
|
|
$
|
25.0
|
|
$
|
—
|
|
$
|
25.0
|
|
|||
|
Equity securities available for sale
|
51.8
|
|
—
|
|
—
|
|
51.8
|
|
|||||||
|
Deferred compensation
|
3.5
|
|
—
|
|
—
|
|
3.5
|
|
|||||||
|
Total assets
|
$
|
55.3
|
|
$
|
25.0
|
|
$
|
—
|
|
$
|
80.3
|
|
|||
|
Liabilities:
|
|||||||||||||||
|
Deferred compensation
|
3.5
|
|
—
|
|
—
|
|
3.5
|
|
|||||||
|
Total liabilities
|
$
|
3.5
|
|
$
|
—
|
|
$
|
—
|
|
$
|
3.5
|
|
|||
Our recurring Level 2 fair value measure for our fixed-maturity securities available for sale are provided by a third-party provider. We rely on one price for the instruments to determine the carrying amount of the assets on our balance sheet. Quarterly, a comparable public company is utilized to determine the fair value. The inputs utilized in the analysis include observable measures such as reference data including public company operating results and share prices and market research publications. Other factors considered include the bond's yield, its terms and conditions, and any other feature which may influence its risk and thus marketability, as well as relative credit information and relevant sector news. We review the pricing methodologies for our Level 2 securities by obtaining an understanding of the valuation models and assumptions used by the third-party as well as independently comparing the resulting prices to other publicly available measures of fair value.
Additional information regarding the fair value of our investment portfolio is included in Note D
Investments
.
Deferred compensation plan assets are comprised of various investment funds which are valued based upon their quoted market prices.
As of December 31, 2017 and 2016, we held
no
material assets or liabilities of continuing operations measured at fair value using Level 3 inputs.
The carrying amounts of trade receivables and notes receivable approximate fair value due to their short-term nature. The fair value of our notes payable is included in Note K
Notes Payable
.
Note D. Investments
Available for Sale Securities
The carrying amounts and fair values of our available for sale securities at December 31, 2017 and 2016 are as follows:
|
|
December 31, 2017
|
||||||||||||||||||
|
|
Carrying
Value
|
Cost Basis
|
Unrealized
Gains
|
Unrealized
Losses
|
Fair
Value
|
||||||||||||||
|
|
(In millions)
|
||||||||||||||||||
|
Fixed maturity securities available for sale:
|
|
|
|
|
|
|
|
|
|
|
|||||||||
|
Corporate debt securities
|
14.8
|
|
26.3
|
|
0.3
|
|
(11.8
|
)
|
14.8
|
|
|||||||||
|
Equity securities available for sale
|
17.7
|
|
17.7
|
|
0.3
|
|
(0.3
|
)
|
17.7
|
|
|||||||||
|
Total
|
$
|
32.5
|
|
$
|
44.0
|
|
$
|
0.6
|
|
$
|
(12.1
|
)
|
$
|
32.5
|
|
||||
54
CANNAE HOLDINGS, INC.
NOTES TO CONSOLIDATED AND COMBINED FINANCIAL STATEMENTS — (continued)
|
|
December 31, 2016
|
||||||||||||||||||
|
|
Carrying
Value
|
Cost Basis
|
Unrealized
Gains
|
Unrealized
Losses
|
Fair
Value
|
||||||||||||||
|
|
(In millions)
|
||||||||||||||||||
|
Fixed maturity securities available for sale:
|
|
|
|
|
|
|
|
|
|
|
|||||||||
|
Corporate debt securities
|
25.0
|
|
24.7
|
|
0.3
|
|
—
|
|
25.0
|
|
|||||||||
|
Equity securities available for sale
|
51.8
|
|
44.2
|
|
7.6
|
|
—
|
|
51.8
|
|
|||||||||
|
Total
|
$
|
76.8
|
|
$
|
68.9
|
|
$
|
7.9
|
|
$
|
—
|
|
$
|
76.8
|
|
||||
The cost basis of fixed maturity securities available for sale includes an adjustment for amortized premium or discount since the date of purchase.
As of December 31, 2017, the fixed maturity securities in our investment portfolio were corporate debt securities with a maturity of greater than
one
year but less than
five
years. Expected maturities may differ from contractual maturities because certain borrowers have the right to call or prepay obligations with or without call or prepayment penalties.
Net unrealized losses on investment securities and the fair value of the related securities, aggregated by investment category and length of time that individual securities have been in a continuous unrealized loss position at December 31, 2017 were as follows (in millions):
|
|
Less than 12 Months
|
||||||
|
|
Fair
|
Unrealized
|
|||||
|
|
Value
|
Losses
|
|||||
|
Corporate debt securities
|
$
|
14.3
|
|
$
|
(11.8
|
)
|
|
|
Equity securities available for sale
|
6.8
|
|
(0.3
|
)
|
|||
|
Total temporarily impaired securities
|
$
|
21.1
|
|
$
|
(12.1
|
)
|
|
The unrealized losses for the corporate debt securities were primarily caused by industry volatility and declines in values of comparable public companies. We consider the unrealized losses related to these securities to be temporary rather than permanent changes in credit quality. We expect to recover the entire amortized cost basis of our temporarily impaired fixed maturity securities as we do not intend to sell these securities and we do not believe that we will be required to sell the fixed maturity securities before recovery of the cost basis. For these reasons, we do not consider these securities other-than-temporarily impaired at
December 31, 2017
. It is reasonably possible that declines in fair value below cost not considered other-than-temporary in the current period could be considered to be other-than-temporary in a future period and earnings would be reduced to the extent of the impairment.
Equity securities are carried at fair value. The change in unrealized gains on equity securities for the years ended December 31, 2017 and 2016 was a net (decrease) increase of
$(7.6) million
and
$4.0 million
, respectively.
During the year ended December 31, 2017, we sold equity securities for gross proceeds of
$31.6 million
resulting in net realized gains of
$5.1 million
. We sold
no
securities in the years ended December 31, 2016 and 2015, respectively. Subsequent to December 31, 2017, we sold the remainder of our equity holdings for gross proceeds of
$17.7 million
resulting in net realized gains of
$0.1 million
.
During the years ended December 31, 2017, 2016 and 2015 we incurred
no
other-than-temporary impairment charges relating to available for sale investments. We recorded realized gains of
$5.1 million
in the year ended December 31, 2017 related to the sales of equity securities available for sale. We recorded
no
realized gains or losses on available for sale securities in the years ended December 31, 2016 and 2015.
As of December 31, 2017, we held no investments for which an other-than-temporary impairment had been previously recognized. It is possible that future events may lead us to recognize potential future impairment losses related to our investment portfolio and that unanticipated future events may lead us to dispose of certain investment holdings and recognize the effects of any market movements in our Consolidated and Combined Financial Statements.
55
CANNAE HOLDINGS, INC.
NOTES TO CONSOLIDATED AND COMBINED FINANCIAL STATEMENTS — (continued)
Interest and investment income consists of the following:
|
|
Year Ended December 31,
|
||||||||||
|
|
2017
|
2016
|
2015
|
||||||||
|
|
(In millions)
|
||||||||||
|
Cash and short term investments
|
$
|
2.0
|
|
$
|
0.5
|
|
$
|
0.2
|
|
||
|
Fixed maturity securities available for sale
|
2.5
|
|
2.1
|
|
—
|
|
|||||
|
Notes receivable
|
0.6
|
|
0.6
|
|
0.6
|
|
|||||
|
Other
|
0.2
|
|
0.1
|
|
1.2
|
|
|||||
|
Total
|
$
|
5.3
|
|
$
|
3.3
|
|
$
|
2.0
|
|
||
Investments in Unconsolidated Affiliates
Investments in unconsolidated affiliates recorded using the equity method of accounting as of December 31, 2017 and 2016 consisted of the following (in millions):
|
|
Ownership at December 31, 2017
|
2017
|
2016
|
|||||||
|
Ceridian
|
33
|
%
|
$
|
324.9
|
|
$
|
316.9
|
|
||
|
Ceridian II
|
32
|
%
|
58.4
|
|
47.4
|
|
||||
|
Total investment in Ceridian
|
|
|
383.3
|
|
364.3
|
|
||||
|
Other
|
various
|
|
41.6
|
|
36.7
|
|
||||
|
Total
|
|
|
$
|
424.9
|
|
$
|
401.0
|
|
||
On March 30, 2016, Ceridian Holding II LLC ("Ceridian II"), an affiliate of Ceridian, completed an offering of common stock (the “Offering”) for aggregate proceeds of
$150.2 million
. The proceeds of the Offering were used by Ceridian II to purchase shares of senior convertible preferred stock of Ceridian HCM, a wholly-owned subsidiary of Ceridian. As part of the Offering, FNF purchased a number of shares of common stock of Ceridian II equal to its pro-rata ownership in Ceridian.
During the year ended December 31, 2016 we received distributions from Ceridian of
$36.7 million
.
Other Long-term Investments
Other long-term investments consist of various cost-method investments and land held for investment purposes. In the year ended December 31, 2016 we recorded
$3.0 million
in impairment charges related to a cost-method investment in which we determined recoverability of our investment was unlikely. The impairment is included in realized gains and (losses), net on the Consolidated and Combined Statement of Operations.
|
Note E.
|
Property and Equipment
|
|
Property and equipment consists of the following:
|
|||||||
|
|
Year Ended December 31,
|
||||||
|
|
2017
|
2016
|
|||||
|
|
(In millions)
|
||||||
|
Furniture, fixtures and equipment
|
$
|
192.8
|
|
$
|
185.1
|
|
|
|
Leasehold improvements
|
146.3
|
|
146.1
|
|
|||
|
Land
|
38.7
|
|
23.1
|
|
|||
|
Buildings
|
33.5
|
|
53.7
|
|
|||
|
Other
|
—
|
|
—
|
|
|||
|
|
411.3
|
|
408.0
|
|
|||
|
Accumulated depreciation and amortization
|
(192.5
|
)
|
(173.0
|
)
|
|||
|
|
$
|
218.8
|
|
$
|
235.0
|
|
|
56
CANNAE HOLDINGS, INC.
NOTES TO CONSOLIDATED AND COMBINED FINANCIAL STATEMENTS — (continued)
Depreciation expense on property and equipment was $
41.9
million, $
41.4
million, and $
47.7
million for the years ended
December 31, 2017
,
2016
, and
2015
, respectively.
|
Note F.
|
Goodwill
|
Goo
dwill consists of the following:
|
|
Restaurant Group
|
T-System
|
FNFV Corporate
and Other |
Total
|
||||||||||||
|
|
(in millions)
|
|||||||||||||||
|
Balance, December 31, 2015
|
$
|
102.7
|
|
$
|
—
|
|
$
|
—
|
|
$
|
102.7
|
|
||||
|
Immaterial prior period correction, see Note A
|
1.7
|
|
—
|
|
—
|
|
1.7
|
|
||||||||
|
Sale of Max & Erma's
|
(1.3
|
)
|
—
|
|
—
|
|
(1.3
|
)
|
||||||||
|
Balance, December 31, 2016
|
$
|
103.1
|
|
$
|
—
|
|
$
|
—
|
|
$
|
103.1
|
|
||||
|
Goodwill acquired during the year
|
—
|
|
99.6
|
|
—
|
|
99.6
|
|
||||||||
|
Balance, December 31, 2017
|
$
|
103.1
|
|
$
|
99.6
|
|
$
|
—
|
|
$
|
202.7
|
|
||||
See Note B.
Acquisition and Dispositions
for further information on Goodwill acquired in conjunction with business combinations.
|
Note G.
|
Variable Interest Entities
|
The Company, in the normal course of business, engages in certain activities that involve variable interest entities ("VIEs"), which are legal entities in which the equity investors as a group lack any of the characteristics of a controlling interest. The primary beneficiary of a VIE is generally the enterprise that has both the power to direct the activities most significant to the economic performance of the VIE and the obligation to absorb losses or receive benefits that could potentially be significant to the VIE. The Company evaluates its interest in certain entities to determine if these entities meet the definition of a VIE and whether the Company is the primary beneficiary and should consolidate the entity based on the variable interests it held both at inception and when there is a change in circumstances that requires a reconsideration. If the Company is determined to be the primary beneficiary of a VIE, it must account for the VIE as a consolidated subsidiary. If the Company is determined not to be the primary beneficiary of a VIE but holds a variable interest in the entity, such variable interests are accounted for under accounting standards as deemed appropriate. As of and for the years ended December 31, 2017, 2016 and 2015, we are not the primary beneficiary of any VIEs.
Unconsolidated VIEs
The table below summarizes select information related to variable interests held by the Company as of December 31, 2017 and 2016, of which we are not the primary beneficiary:
|
2017
|
2016
|
|||||||||||
|
|
Total Assets
|
Maximum Exposure
|
Total Assets
|
Maximum Exposure
|
||||||||
|
|
(in millions)
|
|||||||||||
|
Investments in unconsolidated affiliates
|
13.0
|
|
14.7
|
|
9.8
|
|
11.9
|
|
||||
Investments in Unconsolidated Affiliates
The Company holds variable interests in certain unconsolidated affiliates, outlined in the table above, which are primarily comprised of funds that hold minority ownership investments primarily in healthcare-related entities. The principal risk to which these funds are exposed is credit risk related to the underlying investees. In addition to the book value of our investments in unconsolidated affiliates, the maximum exposure to loss also includes
$1.7 million
and
$2.1 million
as of December 31, 2017 and 2016, respectively, for notes receivable from an investee. We do not provide any implicit or explicit liquidity guarantees or principal value guarantees to these VIEs. The assets are included in investments in unconsolidated affiliates on the Consolidated and Combined Balance Sheets and accounted for under the equity method of accounting.
57
CANNAE HOLDINGS, INC.
NOTES TO CONSOLIDATED AND COMBINED FINANCIAL STATEMENTS — (continued)
|
Note H.
|
Other Intangible Assets
|
Other intangible assets consist of the following:
|
|
December 31,
|
||||||
|
|
2017
|
2016
|
|||||
|
|
(In millions)
|
||||||
|
Trademarks and tradenames
|
$
|
84.0
|
|
$
|
76.6
|
|
|
|
Software
|
67.4
|
|
19.6
|
|
|||
|
Customer relationships and contracts
|
61.8
|
|
5.3
|
|
|||
|
Other
|
17.4
|
|
19.5
|
|
|||
|
|
230.6
|
|
121.0
|
|
|||
|
Accumulated amortization
|
(16.1
|
)
|
(9.2
|
)
|
|||
|
|
$
|
214.5
|
|
$
|
111.8
|
|
|
Amortization expense for amortizable intangible assets, which consist primarily of
customer relationships and software,
was
$7.4 million
,
$3.4 million
, and
$2.1 million
for the years ended December 31, 2017, 2016 and 2015, respectively.
Other intangible assets primarily represent non-amortizable intangible assets such as licenses. Estimated amortization expense for the next five years for assets owned at December 31, 2017, is
$24.4 million
in 2018,
$23.0 million
in 2019,
$21.0 million
in 2020,
$19.1 million
in 2021 and
$12.8 million
in 2022. See Note B.
Acquisition and Dispositions
for further information on Other intangible assets acquired in conjunction with business combinations.
|
Note I.
|
Inventory
|
Inventory consists of the following:
|
|
December 31,
|
||||||
|
|
2017
|
2016
|
|||||
|
|
(In millions)
|
||||||
|
Bakery inventory:
|
|||||||
|
Raw materials
|
$
|
9.1
|
|
$
|
5.1
|
|
|
|
Semi-finished and finished goods
|
7.5
|
|
5.9
|
|
|||
|
Packaging
|
2.8
|
|
2.2
|
|
|||
|
Obsolescence reserve
|
(0.6
|
)
|
(0.3
|
)
|
|||
|
Total bakery inventory
|
18.8
|
|
12.9
|
|
|||
|
Restaurant and other inventory
|
10.9
|
|
11.0
|
|
|||
|
Total inventory
|
$
|
29.7
|
|
$
|
23.9
|
|
|
58
CANNAE HOLDINGS, INC.
NOTES TO CONSOLIDATED AND COMBINED FINANCIAL STATEMENTS — (continued)
|
Note J.
|
Accounts Payable and Other Accrued Liabilities
|
Accounts payable and other accrued liabilities, current consist of the following:
|
|
December 31,
|
||||||
|
|
2017
|
2016
|
|||||
|
|
(In millions)
|
||||||
|
Accrued payroll and employee benefits
|
$
|
23.7
|
|
$
|
20.4
|
|
|
|
Trade accounts payable
|
20.3
|
|
24.7
|
|
|||
|
Accrued casualty insurance expenses
|
16.5
|
|
16.7
|
|
|||
|
Other accrued liabilities
|
40.2
|
|
|
29.7
|
|
||
|
|
$
|
100.7
|
|
$
|
91.5
|
|
|
Accounts payable and other accrued liabilities, long term consist of the following:
|
|
December 31,
|
||||||
|
|
2017
|
2016
|
|||||
|
|
(In millions)
|
||||||
|
Unfavorable lease liability
|
$
|
25.6
|
|
$
|
30.0
|
|
|
|
Other accrued liabilities
|
36.9
|
|
30.6
|
|
|||
|
|
$
|
62.5
|
|
$
|
60.6
|
|
|
|
Note K.
|
Notes Payable
|
Notes payable consists of the following:
|
December 31,
|
||||||||
|
|
2017
|
2016
|
||||||
|
|
(In millions)
|
|||||||
|
ABRH Term Loan, interest payable monthly at LIBOR + 3.0% (4.57% at December 31, 2017), due August 2019
|
$
|
84.2
|
|
$
|
91.6
|
|
||
|
ABRH Revolving Credit Facility, due August 2019 with interest payable monthly or quarterly at various rates
|
38.0
|
|
—
|
|
||||
|
Brasada Cascades Credit Agreement, due January 2026 with interest payable monthly at varying rates
|
12.1
|
|
12.9
|
|
||||
|
Revolver Note with FNF, Inc., unused portion of $100.0 million at December 31, 2017
|
—
|
|
—
|
|
||||
|
Other
|
0.6
|
|
0.2
|
|
||||
|
Notes payable, total
|
$
|
134.9
|
|
$
|
104.7
|
|
||
|
Less: Notes payable, current
|
122.2
|
|
11.4
|
|
||||
|
Notes payable, long term
|
$
|
12.7
|
|
$
|
93.3
|
|
||
At December 31, 2017, the carrying value of our outstanding notes payable approximated fair value. The respective carrying values of the ABRH Term Loan and the B Note, Development Loan and Line of Credit Loan pursuant to the Cascades Credit Agreement, each as defined below, approximate fair value as they are variable rate instruments with monthly reset periods which reflect current market rates. The revolving credit facilities are considered Level 2 financial liabilities. The fixed-rate A Note, as defined below, pursuant to the Cascades Credit Agreement approximates fair value as of December 31, 2017.
On January 29, 2016, FNF NV Brasada, LLC, an Oregon limited liability company and majority-owned subsidiary of Cannae ("NV Brasada"), entered into a credit agreement with an aggregate borrowing capacity of
$17.0 million
(the "Cascades Credit Agreement") with Bank of the Cascades, an Oregon state-chartered commercial bank ("Bank of the Cascades"), as lender. The Cascades Credit Agreement provides for (i) a
$12.5 million
acquisition loan (the "Acquisition Loan"), (ii) a
$3.0 million
development loan (the "Development Loan"), and (iii) a
$1.5 million
line of credit loan (the "Line of Credit Loan", and collectively with the Acquisition Loan and the Development Loan, the "Cascades Loans"). Pursuant to the Acquisition Loan, NV Brasada executed a
$6.25 million
"A Note", which accrues interest at a rate of
4.51%
per annum and matures on the tenth anniversary of the issuance thereof, and a
$6.25 million
"B Note", which accrues interest at the rate of LIBOR plus
225
basis points, adjusted
59
CANNAE HOLDINGS, INC.
NOTES TO CONSOLIDATED AND COMBINED FINANCIAL STATEMENTS — (continued)
monthly, and matures on the tenth anniversary of the issuance thereof. NV Brasada makes equal monthly payments of principal and interest to Bank of the Cascades under the Acquisition Loan. Each of the Development Loan and the Line of Credit Loan accrue interest at the rate of LIBOR plus
225
basis points, adjusted monthly, and mature on the second anniversary of the respective issuances thereof. NV Brasada makes equal monthly payments of interest to Bank of the Cascades under the Development Loan and the Line of Credit Loan. The Cascades Loans are secured by certain single-family residential lots that can be sold for construction, owned by NV Brasada, and certain other operating assets owned by NV Brasada. The Company does not provide any guaranty or stock pledge under the Cascades Credit Agreement. As of December 31, 2017, there was
$12.1 million
, net of debt issuance costs, outstanding under the Cascades Credit Agreement; the Acquisition Loan and Line of Credit Loan incurred interest at
3.63%
and
3.75%
, respectively; and there was
$0.8 million
available to be drawn on the Line of Credit Loan.
On August 19, 2014, ABRH entered into a credit agreement (the "ABRH Credit Facility") with Wells Fargo Bank, National Association as Administrative Agent, Swingline Lender and Issuing Lender (the "ABRH Administrative Agent"), Bank of America, N.A. as Syndication Agent and the other financial institutions party thereto. On February 24, 2017, the ABRH Credit Facility was amended. The ABRH Credit Facility provides for a maximum revolving loan of
$60.0 million
(the "ABRH Revolver") with a maturity date of August 19, 2019. Additionally, the ABRH Credit Facility provides for a maximum term loan (the "ABRH Term Loan") of
$110.0 million
with quarterly installment repayments through June 30, 2019 and a maturity date of August 19, 2019 for the outstanding unpaid principal balance and all accrued and unpaid interest. ABRH borrowed the entire
$110.0 million
under the ABRH Term Loan in August 2014. Pricing for the ABRH Credit Facility is based on an applicable margin between
225
basis points to
300
basis points over LIBOR and between
125
basis points and
200
basis points over the Base Rate (which is the highest of (a)
50
basis points in excess of the federal funds rate, (b) the ABRH Administrative Agent "prime rate," or (c) the sum of
100
basis points plus one-month LIBOR). A commitment fee amount is also due at a rate per annum equal to between
32.5
and
40
basis points on the average daily unused portion of the commitments under the ABRH Revolver. The ABRH Credit Facility also allows for ABRH to request up to
$20.0 million
of letters of credit commitments and
$20 million
in swingline debt from the ABRH Administrative Agent. The ABRH Credit Facility is subject to affirmative, negative and financial covenants customary for financings of this type, including, among other things, limits on ABRH's creation of liens, sales of assets, incurrence of indebtedness, restricted payments and transactions with affiliates. The covenants addressing restricted payments include certain limitations on the declaration or payment of dividends by ABRH to its parent, Fidelity Newport Holdings, LLC ("FNH"), and by FNH to its members. The ABRH Credit Facility includes customary events of default for facilities of this type (with customary grace periods, as applicable), which include a cross-default provision whereby an event of default will be deemed to have occurred if ABRH or any of its guarantors, which consists of FNH and certain of its subsidiaries (together, the "Loan Parties") or any of their subsidiaries default on any agreement with a third party of
$10.0 million
or more related to their indebtedness and such default results in a right by such third party to accelerate such Loan Party's or its subsidiary's obligations. The ABRH Credit Facility provides that, upon the occurrence of an event of default, the ABRH Administrative Lender may (i) declare the principal of, and any and all accrued and unpaid interest and all other amounts owed in respect of, the loans immediately due and payable, (ii) terminate loan commitments and (iii) exercise all other rights and remedies available to the ABRH Administrative Lender or the lenders under the loan documents. As of December 31, 2017,
$34.7 million
of borrowings under the ABRH Credit Facility incurred interest monthly at
4.49%
and
$3.3 million
of borrowings incurred interest quarterly at
6.50%
,
$11.0 million
of letters of credit were outstanding and there was
$11.0 million
of remaining borrowing capacity under its revolving credit facility. ABRH was not in compliance with certain covenants of the ABRH Credit Facility as of December 31, 2017 and, accordingly, all outstanding borrowings under such facility were classified as current on our Consolidated and Combined Balance Sheets. On March 13, 2018 Cannae entered into an Assignment and Assumption Agreement with certain of ABRH's lenders to purchase all of the outstanding loans and lending commitments under the ABRH Credit Facility, which resulted in Cannae becoming ABRH's sole lender. Subsequent to the assignment, Cannae and ABRH entered into a Second Amendment to the Credit Agreement to increase the interest rate to
10%
suspend the financial covenants until March 31, 2019 and require ABRH to pay to Cannae an amendment fee equal to
2%
of the outstanding loan balance.
On June 30, 2014, FNF issued to FNFV, LLC a revolver note in an aggregate principal amount of up to
$100 million
(the "Revolver Note"), pursuant to FNF's revolving credit facility. Pursuant to the Revolver Note, FNF may make one or more loans to FNFV, LLC, in increments of
$1.0 million
, with up to
$100.0 million
outstanding at any time. Outstanding amounts under the Revolver Note accrue interest at the rate set forth under FNF's revolving credit facility, plus
100
basis points. Revolving loans under FNF's revolving credit facility generally bear interest at a variable rate based on either (i) the base rate (which is the highest of (a)
0.5%
in excess of the federal funds rate, (b) the Administrative Agent's "prime rate", or (c) the sum of
1%
plus one-month LIBOR) plus a margin of between
32.5
and
60
basis points depending on the senior unsecured long-term debt ratings of FNF, or (ii) LIBOR plus a margin of between
132.5
and
160
basis points depending on the senior unsecured long-term debt ratings of FNF. The Revolver Note matured on June 30, 2015, which maturity date automatically continued to be extended for additional
one
-year terms. On November 17, 2017, FNF issued to Cannae a revolver note in aggregate principal amount of up to
$100.0 million
(the "FNF Revolver") which replaced the Revolver Note. The FNF Revolver accrues interest at LIBOR plus
450
basis points and matures on the
five
-year anniversary of the date of the FNF Revolver. The maturity date is automatically extended for
60
CANNAE HOLDINGS, INC.
NOTES TO CONSOLIDATED AND COMBINED FINANCIAL STATEMENTS — (continued)
additional
five
-year terms unless notice of non-renewal is otherwise provided by either FNF or Cannae, in their sole discretion. As of December 31, 2017, we have not made any borrowings under the FNF Revolver.
|
Gross principal maturities of notes payable at December 31, 2017 are as follows (in millions):
|
|||
|
2018
|
$
|
124.3
|
|
|
2019
|
—
|
|
|
|
2020
|
—
|
|
|
|
2021
|
—
|
|
|
|
2022
|
—
|
|
|
|
Thereafter
|
11.5
|
|
|
|
|
$
|
135.8
|
|
|
Note L.
|
Income Taxes
|
On November 17, 2017, FNF distributed all of common stock of Cannae to the shareholders of FNFV Group in a transaction that qualified as a tax-free split-off under section 355 of the Internal Revenue Code of 1986. As a result of the Split-Off, Cannae is now a separate publicly traded company. All activity through the date of the Split-Off will be included in FNF’s consolidated tax return and Cannae will file an initial federal consolidated tax return, as well as various state tax returns, that will include Cannae’s activity subsequent to the Split-Off.
Income tax (benefit) expense on continuing operations consists of the following:
|
|
Year Ended December 31,
|
||||||||||
|
|
2017
|
2016
|
2015
|
||||||||
|
|
(In millions)
|
||||||||||
|
Current
|
$
|
(28.2
|
)
|
$
|
6.2
|
|
$
|
46.5
|
|
||
|
Deferred
|
11.6
|
|
(16.6
|
)
|
(66.2
|
)
|
|||||
|
|
$
|
(16.6
|
)
|
$
|
(10.4
|
)
|
$
|
(19.7
|
)
|
||
A reconciliation of the federal statutory rate to our effective tax rate is as follows:
|
|
Year Ended December 31,
|
|||||||
|
|
2017
|
2016
|
2015
|
|||||
|
Federal statutory rate
|
35.0
|
%
|
35.0
|
%
|
35.0
|
%
|
||
|
State income taxes, net of federal benefit
|
3.1
|
|
4.4
|
|
17.1
|
|
||
|
Tax credits
|
8.6
|
|
(66.1
|
)
|
84.8
|
|
||
|
Valuation allowance
|
5.9
|
|
—
|
|
(2.0
|
)
|
||
|
Non-deductible expenses and other, net
|
(5.0
|
)
|
9.1
|
|
7.6
|
|
||
|
Noncontrolling interests
|
(7.6
|
)
|
(2.3
|
)
|
140.8
|
|
||
|
Tax Reform
|
(9.9
|
)
|
—
|
|
—
|
|
||
|
Other
|
(3.7
|
)
|
—
|
|
—
|
|
||
|
Effective tax rate excluding equity investments
|
26.4
|
%
|
(19.9
|
)%
|
283.3
|
%
|
||
|
Equity investments
|
(4.4
|
)
|
(184.4
|
)
|
229.2
|
|
||
|
Effective tax rate
|
22.0
|
%
|
(204.3
|
)%
|
512.5
|
%
|
||
61
CANNAE HOLDINGS, INC.
NOTES TO CONSOLIDATED AND COMBINED FINANCIAL STATEMENTS — (continued)
The significant components of deferred tax assets and liabilities at December 31, 2017 and 2016 consist of the following:
|
|
December 31,
|
||||||
|
|
2017
|
2016
|
|||||
|
|
(In millions)
|
||||||
|
Deferred tax assets:
|
|
|
|
|
|||
|
Employee benefit accruals
|
$
|
0.2
|
|
$
|
1.6
|
|
|
|
Net operating loss carryforwards
|
10.9
|
|
—
|
|
|||
|
Equity investments
|
14.6
|
|
35.0
|
|
|||
|
Investment securities
|
3.0
|
|
—
|
|
|||
|
Partnerships
|
—
|
|
4.9
|
|
|||
|
Accrued liabilities
|
3.3
|
|
—
|
|
|||
|
State income taxes
|
—
|
|
0.7
|
|
|||
|
Tax credit carryforwards
|
1.1
|
|
—
|
|
|||
|
Total gross deferred tax asset
|
33.1
|
|
42.2
|
|
|||
|
Less: valuation allowance
|
0.7
|
|
5.8
|
|
|||
|
Total deferred tax asset
|
$
|
32.4
|
|
$
|
36.4
|
|
|
|
Deferred tax liabilities:
|
|
|
|
|
|||
|
Investment securities
|
$
|
—
|
|
$
|
(3.0
|
)
|
|
|
Amortization of goodwill and intangible assets
|
(16.8
|
)
|
—
|
|
|||
|
Partnerships
|
(4.4
|
)
|
—
|
|
|||
|
Depreciation
|
(0.6
|
)
|
(0.3
|
)
|
|||
|
Total deferred tax liability
|
$
|
(21.8
|
)
|
$
|
(3.3
|
)
|
|
|
Net deferred tax asset
|
$
|
10.6
|
|
$
|
33.1
|
|
|
The Company's net deferred tax asset was
$10.6 million
and
$33.1 million
at December 31, 2017, and 2016, respectively. The primary changes to the deferred taxes relate to acquired intangibles and net operating loss ("NOL") carryforwards; as well as changes in valuation allowance, equity investments, and partnership interests.
The decrease of
$20.4 million
in our deferred tax asset for equity investments as of December 31, 2017 from 2016 was the result of the current year pick up of equity in earnings of unconsolidated affiliates and the enactment of the Tax Reform Act, as defined below. The change in our deferred taxes for investment securities from a deferred tax liability of
$3.0 million
to a deferred tax asset of
$3.0 million
as of December 31, 2016 and December 31, 2017, respectively, was primarily related to valuation adjustments for unrealized losses on corporate debt securities. See Note D.
Investments
for further discussion on temporary impairment of corporate debt securities. The change in our deferred taxes for partnerships from a deferred tax asset of
$4.9 million
as of December, 31, 2016 to a deferred tax liability of
$4.4 million
as of December 31, 2017 was primarily related to the transfer of tax attributes to FNF as a result of the Split-Off.
As a result of the T-System Merger in the fourth quarter of 2017, the Company recorded a deferred tax liability of approximately
$16.6 million
related to intangibles and an
$8.6 million
deferred tax asset related to federal and state NOL carryforwards. The NOLs acquired in the T-System Merger are subject to a Section 382 limitation; however based on the section 382 limitation amount all of the NOL carryovers can be fully utilized before they expire.
The Company’s NOL and tax credit carryovers expire in various tax years through 2038.
ASC 740 requires that companies assess whether a valuation allowance should be established against their deferred tax assets based on the consideration of all of the available evidence using a “more likely than not” standard. A valuation allowance is established for deferred tax assets if, based on the weight of available evidence, it is more likely than not that some portion or all of the deferred tax assets may not be realized. Management evaluated the Company’s deferred tax assets for recoverability using a consistent approach which considers the relative impact of negative and positive evidence, in particular, the Company’s historical profitability and any projections of future taxable income or potential future tax planning strategies.
As of December 31, 2017 and 2016, we had a valuation allowance of
$0.7 million
and
$5.8 million
, respectively. The valuation allowance recorded as of December 31, 2016 related to tax basis of an investment which would generate capital losses when sold or written off. In the fourth quarter of 2017, management determined that it was more likely than not that the Company would
62
CANNAE HOLDINGS, INC.
NOTES TO CONSOLIDATED AND COMBINED FINANCIAL STATEMENTS — (continued)
be able to realize such capital losses in the future. As a result, the valuation allowance was released. As of December 31, 2017, a small valuation allowance was recorded against certain state NOLs reflected in the Restaurant Group segment that were not more likely than not to be realized.
The Company did not have any unrecognized tax benefits as of December 31, 2017, 2016 or 2015.
Tax Reform
On December 22, 2017, the U.S. government enacted comprehensive tax legislation commonly referred to as the Tax Cuts and Jobs Act (the “Tax Reform Act”). Among other provisions, the Tax Reform Act reduced the Federal statutory corporate income tax rate from 35% to 21% and limited or eliminated certain deductions. During the fourth quarter of 2017, we recorded a one-time non-cash net tax expense of
$7.5 million
related to the revaluation of our deferred income tax assets and liabilities as a result of the Tax Reform Act. The reduction in tax rate reduced the Company’s 2017 effective tax rate by
9.9%
.
The Tax Reform Act significantly changes how the United States taxes corporations. The Company has analyzed and interpreted the current and future impacts of the Tax Reform Act and recorded the provisional effects in its financial statements as of December 31, 2017. However, the legislation remains subject to potential amendments, technical corrections and further guidance. Further, in connection with the filing of its tax return, the Company has the ability to change certain elections it has applied to the calculation of the year-end deferred tax assets and liabilities or amounts related to investments in subsidiaries. When the impact of the Tax Reform Act is finalized, the Company will record any necessary adjustments in the period in which the change occurs.
|
Note M.
|
Commitments and Contingencies
|
Legal Contingencies
In the ordinary course of business, we are involved in various pending and threatened litigation and regulatory matters related to our operations, some of which include claims for punitive or exemplary damages. Our ordinary course litigation includes purported class action lawsuits, which make allegations related to various aspects of our business. From time to time, we also receive requests for information from various state and federal regulatory authorities, some of which take the form of civil investigative demands or subpoenas. Some of these regulatory inquiries may result in the assessment of fines for violations of regulations or settlements with such authorities requiring a variety of remedies. We believe that no actions, other than those discussed below, depart from customary litigation or regulatory inquiries incidental to our business.
Our Restaurant Group companies are a defendant from time to time in various legal proceedings arising in the ordinary course of business, including claims relating to injury or wrongful death under “dram shop” laws that allow a person to sue us based on any injury caused by an intoxicated person who was wrongfully served alcoholic beverages at one of the restaurants; individual and purported class or collective action claims alleging violation of federal and state employment, franchise and other laws; and claims from guests or employees alleging illness, injury or other food quality, health or operational concerns. Our Restaurant Group companies are also subject to compliance with extensive government laws and regulations related to employment practices and policies and the manufacture, preparation, and sale of food and alcohol. We may also become subject to lawsuits and other proceedings, as well as card network fines and penalties, arising out of the actual or alleged theft of our customers' credit or debit card information.
We review lawsuits and other legal and regulatory matters (collectively “legal proceedings”) on an ongoing basis when making accrual and disclosure decisions. When assessing reasonably possible and probable outcomes, management bases its decision on its assessment of the ultimate outcome assuming all appeals have been exhausted. For legal proceedings in which it has been determined that a loss is both probable and reasonably estimable, a liability based on known facts and which represents our best estimate is recorded. As of December 31, 2017, we had
$0.2 million
accrued for legal proceedings. As of December 31, 2016, we had
no
accrual for legal proceedings as none of our ongoing matters were both probable and reasonably estimable. Actual losses may materially differ from the amounts recorded and the ultimate outcome of our pending legal proceedings is generally not yet determinable. While some of these matters could be material to our operating results or cash flows for any particular period in the event of an unfavorable outcome, at present, we do not believe that the ultimate resolution of currently pending legal proceedings, either individually or in the aggregate, will have a material adverse effect on our financial condition, results of operations or cash flows.
On April 8, 2016, a cyber-security investigation at O’Charley’s identified signs of unauthorized access to the payment card network of O’Charley’s restaurants. The Company retained a cyber security firm to prepare a report (a “Payment Card Industry Forensic Investigator report” or “PFI report”) describing the incident. The PFI report was submitted to the card networks on June 10, 2016. Based on PFI report, credit cards used at all O’Charley’s restaurants (other than
three
franchised locations) from March 18, 2016, to April 8, 2016 may have been affected.
63
CANNAE HOLDINGS, INC.
NOTES TO CONSOLIDATED AND COMBINED FINANCIAL STATEMENTS — (continued)
To date, the Company has reimbursed Fifth Third Bank for fines arising under the MasterCard Security Rules and Procedures (Merchant Edition) in the amount of
$0.6 million
. The Company has also reimbursed Fifth Third Bank for an assessment under the VISA Global Compromised Account Recovery (GCAR) rules and PCI penalty in the amount of
$1.8 million
. The Company has received insurance reimbursements equal to
$2.0 million
relating to the MasterCard and VISA assessments. Any additional amounts imposed by other card issuers will depend on a variety of factors, including the specific facts and circumstances of the incident, including the number of cards used to make unauthorized purchases, and the exercise of discretion by each card network. O’Charley’s could also face lawsuits by individual cardholders for unauthorized charges if the individuals are not fully compensated by the card brands. However, individual cardholders generally have no liability for unauthorized charges under the card brand rules, and O’Charley’s has received no notice of any such lawsuits to date.
O’Charley’s is the defendant in a lawsuit, Otis v. O’Charley’s, LLC, filed on July 13, 2016, in U.S. District Court, Central District of Illinois. The lawsuit purports to bring a national class action on behalf of all O’Charley’s servers and bartenders under the Fair Labor Standards Act and similar state laws. The complaint alleges that O'Charley's failed to pay plaintiffs the applicable minimum wage and overtime by requiring tipped employees to: (a) spend more than
twenty percent
of their time performing non-tipped duties, including dishwashing, food preparation, cleaning, maintenance, and other "back of the house" duties; and (b) perform “off the clock” work. Plaintiffs seek damages and declaratory relief. The named plaintiffs and members of the putative class are parties to employment agreements with O’Charley’s that provide, inter alia, for individual arbitration of potential claims and disputes. On October 25, 2016, the District Court entered an Order staying all proceedings in the Otis case pending the United States Supreme Court’s resolution of certain petitions for certiorari filed in several Circuit Courts of Appeals cases that address the issue of whether agreements between employers and employees to arbitrate disputes on an individual basis are enforceable under the Federal Arbitration Act. The Order provides that, if certiorari is granted in any of the Circuit Courts of Appeals cases, the stay of the Otis case will continue until the Supreme Court reaches a final decision on the merits in the cases. On January 13, 2017, the Supreme Court granted certiorari in three of the Circuit Courts of Appeals cases that address the enforceability of arbitration agreements. Accordingly, the proceedings in the Otis case are stayed until the Supreme Court reaches a final decision on the merits in the
three
cases.
Operating Leases
|
Future minimum operating lease payments are as follows (in millions):
|
|||
|
2018
|
$
|
61.7
|
|
|
2019
|
57.0
|
|
|
|
2020
|
50.6
|
|
|
|
2021
|
43.5
|
|
|
|
2022
|
32.5
|
|
|
|
Thereafter
|
131.5
|
|
|
|
Total future minimum operating lease payments
|
$
|
376.8
|
|
Rent expense incurred under operating leases during the years ended December 31, 2017, 2016 and 2015 was
$61.9 million
,
$64.5 million
, and
$74.8 million
, respectively. Rent expense in the year ended December 31, 2016 also included abandoned lease charges related to office closures of
$6.9 million
related to the termination of leases associated with the sale of the Max and Erma's restaurant concept.
No
abandoned lease charges were recorded in the years ended December 31, 2017 and 2015.
Unconditional Purchase Obligations
The Restaurant Group has unconditional purchase obligations with various vendors. These purchase obligations are primarily food and beverage obligations with fixed commitments in regards to the time period of the contract and the quantities purchased with annual price adjustments that can fluctuate. We used both historical and projected volume and pricing as of December 31, 2017 to determine the amount of the obligations.
64
CANNAE HOLDINGS, INC.
NOTES TO CONSOLIDATED AND COMBINED FINANCIAL STATEMENTS — (continued)
Purchase obligations as of December 31, 2017 are as follows (in millions):
|
2018
|
$
|
220.3
|
|
|
2019
|
26.2
|
|
|
|
2020
|
17.0
|
|
|
|
2021
|
4.4
|
|
|
|
2022
|
3.3
|
|
|
|
Thereafter
|
—
|
|
|
|
Total purchase commitments
|
$
|
271.2
|
|
Note N. Discontinued Operations
OneDigital
On June 6, 2017, we completed the sale of OneDigital. As a result of the sale of OneDigital we have reclassified the assets and liabilities divested as held for sale as of December 31, 2016. Further, the financial results of the businesses sold have been reclassified to discontinued operations for all periods presented in our Consolidated and Combined Statements of Operations. We retained
no
ownership in OneDigital and have no continuing involvement with OneDigital as of the date of the sale.
A reconciliation of the operations of OneDigital to the Consolidated and Combined Statement of Operations is shown below:
|
Year Ended December 31,
|
|||||||||||
|
2017
|
2016
|
2015
|
|||||||||
|
(in millions)
|
|||||||||||
|
Revenues:
|
|||||||||||
|
Other operating revenue
|
$
|
80.9
|
|
$
|
148.3
|
|
$
|
116.4
|
|
||
|
Total operating revenues
|
80.9
|
|
148.3
|
|
116.4
|
|
|||||
|
Operating expenses:
|
|||||||||||
|
Personnel costs
|
56.9
|
|
94.8
|
|
75.7
|
|
|||||
|
Depreciation and amortization
|
8.8
|
|
18.1
|
|
15.7
|
|
|||||
|
Other operating expenses
|
11.3
|
|
27.1
|
|
17.0
|
|
|||||
|
Total operating expenses
|
77.0
|
|
140.0
|
|
108.4
|
|
|||||
|
Operating income
|
3.9
|
|
8.3
|
|
8.0
|
|
|||||
|
Other income (expense):
|
|||||||||||
|
Interest expense
|
(2.9
|
)
|
(4.8
|
)
|
(3.0
|
)
|
|||||
|
Realized gain
|
276.0
|
|
—
|
|
—
|
|
|||||
|
Total other income (expense)
|
273.1
|
|
|
(4.8
|
)
|
|
(3.0
|
)
|
|||
|
Earnings from continuing operations before income taxes
|
277.0
|
|
3.5
|
|
5.0
|
|
|||||
|
Income tax expense
|
129.3
|
|
1.5
|
|
2.2
|
|
|||||
|
Net earnings from discontinued operations
|
147.7
|
|
2.0
|
|
2.8
|
|
|||||
|
Cash flow from discontinued operations data:
|
|||||||||||
|
Net cash provided by operations
|
$
|
17.3
|
|
$
|
27.6
|
|
$
|
17.9
|
|
||
|
Net cash used in investing activities
|
(27.3
|
)
|
(51.9
|
)
|
(30.0
|
)
|
|||||
Other acquisitions/disposals of businesses, net of cash acquired, on the Consolidated and Combined Statements of Cash Flows for the years ended December 31, 2017, 2016, and 2015 includes
$25.9 million
,
$48.3 million
, and
$26.1 million
, respectively, related to acquisitions made by OneDigital. Borrowings on the Consolidated and Combined Statements of Cash Flows for the years ended December 31, 2017 and 2016 includes
$23.0 million
and
$38.0 million
, respectively, related to borrowings made by OneDigital. Debt service payments on the Consolidated and Combined Statements of Cash Flows for the years ended December 31, 2017 and 2016 includes
$3.0 million
and
$7.5 million
, respectively, related to debt principal payments made by OneDigital.
65
CANNAE HOLDINGS, INC.
NOTES TO CONSOLIDATED AND COMBINED FINANCIAL STATEMENTS — (continued)
A reconciliation of the financial position of OneDigital to the Consolidated and Combined Balance Sheet is shown below:
|
|
December 31,
|
||
|
2016
|
|||
|
|
|||
|
Cash and cash equivalents
|
$
|
4.7
|
|
|
Trade receivables
|
13.6
|
|
|
|
Prepaid expenses and other current assets
|
3.5
|
|
|
|
Total current assets of discontinued operations
|
21.8
|
|
|
|
Property and equipment, net
|
3.0
|
|
|
|
Deferred tax assets
|
17.0
|
|
|
|
Other intangible assets, net
|
115.6
|
|
|
|
Goodwill
|
104.7
|
|
|
|
Other long term investments and noncurrent assets
|
1.6
|
|
|
|
Total noncurrent assets of discontinued operations
|
241.9
|
|
|
|
Total assets of discontinued operations
|
$
|
263.7
|
|
|
Accounts payable and other accrued liabilities, current
|
$
|
28.5
|
|
|
Income taxes payable
|
3.4
|
|
|
|
Total current liabilities of discontinued operations
|
31.9
|
|
|
|
Long term notes payable
|
128.7
|
|
|
|
Accounts payable and other accrued liabilities, long term
|
21.4
|
|
|
|
Total noncurrent liabilities of discontinued operations
|
150.1
|
|
|
|
Total liabilities of discontinued operations
|
$
|
182.0
|
|
|
Note O.
|
Employee Benefit Plans
|
Omnibus Plan
In 2017, we established the 2017 Omnibus Incentive Plan (the “Omnibus Plan”) authorizing the issuance of up
to
3.9 million
shares of common stock, subject to the terms of the Omnibus Plan. The 2017 Omnibus Plan provides for the grant of stock options, stock appreciation rights, restricted stock, restricted stock units and performance shares, performance units, other cash and stock-based awards and dividend equivalents.
As of December 31, 2017, there were
287,059
shares of CNNE restricted stock outstanding (the "CNNE Awards") under the Omnibus Plan. Awards granted are approved by the Compensation Committee of the Board of Directors of the Company.
Restricted stock transactions under the Omnibus Plan in
2017
are as follows:
|
|
|
|||||
|
|
Shares
|
Weighted Average Grant Date Fair Value
|
||||
|
Balance, December 31, 2016
|
—
|
|
$
|
—
|
|
|
|
Granted
|
287,059
|
|
18.45
|
|
||
|
Balance, December 31, 2017
|
287,059
|
|
$
|
18.45
|
|
|
Compensation cost relating to share-based payments is recognized in the Consolidated and Combined Statements of Earnings based on the grant-date fair value of each award. Using the fair value method of accounting, compensation cost is measured based on the fair value of the award at the grant date and recognized over the service period of
3
years. Fair value of restricted stock awards and units is based on the grant date value of the underlying stock derived from quoted market prices. Net earnings attributable to Cannae reflects stock-based compensation expense for the CNNE Awards of
$0.2 million
for the year ended December 31, 2017, which are included in personnel costs on the Consolidated and Combined Statements of Operations. There was
no
expense related to CNNE Awards in 2016 or 2015.
The total fair value of restricted stock awards granted in the year ended
December 31, 2017 was
$5.3 million
.
66
CANNAE HOLDINGS, INC.
NOTES TO CONSOLIDATED AND COMBINED FINANCIAL STATEMENTS — (continued)
As of December 31, 2017, the unrecognized compensation cost related to the CNNE Awards is
$5.1 million
and is expected to be recognized over a period of
three
years.
FNFV Restricted Stock Awards
Prior to the Split-Off, we historically participated in FNF's Omnibus Incentive Plan (the “ FNF Omnibus Plan”) which provided for the grant of stock options, stock appreciation rights, restricted stock, restricted stock units and performance shares, performance units, other cash and stock-based awards and dividend equivalents in either of FNF's two former classes of common stock, FNF Group and FNFV Group. As of December 31, 2017 there
were no shares of FNFV Group restricted stock outstanding
(the "FNFV Awards") under the FNF Omnibus Plan.
Prior to the Split-Off, stock-based compensation related to FNFV Awards was allocated to us by FNF. Compensation cost relating to share-based payments is recognized in the Consolidated and Combined Financial Statements based on the fair value of each award. Using the fair value method of accounting, compensation cost is measured based on the fair value of the award at the grant date and recognized over the service period of 3 years. Fair value of restricted stock awards and units is based on the grant date value of the underlying stock derived from quoted market prices. Net earnings attributable to FNFV reflects the allocation of stock-based compensation expense for the FNFV Awards of
$4.2 million
,
$4.7 million
, and
$9.9 million
for the years ended December 31, 2017, 2016 and 2015, respectively which are included in personnel costs on the Consolidated and Combined Statements of Operation.
As of December 31, 2017, there was
no
remaining unrecognized compensation cost related to the FNFV Awards.
|
Note P.
|
Concentration of Risk
|
Financial instruments that potentially subject us to concentrations of credit risk consist primarily of cash equivalents and trade receivables.
We place cash equivalents with high credit quality financial institutions and, by policy, limit the amount of credit exposure with any one financial institution.
Concentrations of credit risk with respect to trade receivables are limited because a large number of geographically diverse customers make up our customer base, thus spreading the trade receivables credit risk. We control credit risk through monitoring procedures.
ABRH obtains a majority of its restaurant food products and supplies from
four
distributors. Although we believe alternative vendors could be found in a timely manner, any disruption of these services could potentially have an adverse impact on ABRH's operating results.
67
CANNAE HOLDINGS, INC.
NOTES TO CONSOLIDATED AND COMBINED FINANCIAL STATEMENTS — (continued)
Note Q. Segment Information
Summarized financial information concerning our reportable segments is shown in the following tables. There are several intercompany corporate related arrangements between our various businesses. The effects of these arrangements including intercompany notes and related interest and any other non-operational intercompany revenues and expenses have been eliminated in the segment presentations below.
As of and for the year ended December 31, 2017:
|
|
Restaurant Group
|
T-System
|
Ceridian
|
Corporate
and Other |
Ceridian Elimination
|
Total
|
|||||||||||||||||
|
|
(in millions)
|
||||||||||||||||||||||
|
Restaurant revenues
|
$
|
1,129.0
|
|
$
|
—
|
|
$
|
—
|
|
$
|
—
|
|
$
|
—
|
|
$
|
1,129.0
|
|
|||||
|
Other revenues
|
—
|
|
12.9
|
|
751.7
|
|
27.6
|
|
(751.7
|
)
|
40.5
|
|
|||||||||||
|
Revenues from external customers
|
1,129.0
|
|
12.9
|
|
751.7
|
|
27.6
|
|
(751.7
|
)
|
1,169.5
|
|
|||||||||||
|
Interest and investment income, including realized gains and losses
|
—
|
|
—
|
|
—
|
|
10.2
|
|
—
|
|
10.2
|
|
|||||||||||
|
Total revenues
|
1,129.0
|
|
12.9
|
|
751.7
|
|
37.8
|
|
(751.7
|
)
|
1,179.7
|
|
|||||||||||
|
Depreciation and amortization
|
43.6
|
|
3.1
|
|
57.9
|
|
2.6
|
|
(57.9
|
)
|
49.3
|
|
|||||||||||
|
Interest expense
|
(6.6
|
)
|
—
|
|
(86.6
|
)
|
(0.4
|
)
|
86.6
|
|
(7.0
|
)
|
|||||||||||
|
(Loss) earnings from continuing operations, before income taxes and equity in earnings (loss) of unconsolidated affiliates
|
(36.1
|
)
|
(0.9
|
)
|
(51.8
|
)
|
(38.2
|
)
|
51.8
|
|
(75.2
|
)
|
|||||||||||
|
Income tax expense (benefit)
|
0.7
|
|
(2.4
|
)
|
(43.9
|
)
|
(14.9
|
)
|
43.9
|
|
(16.6
|
)
|
|||||||||||
|
(Loss) earnings from continuing operations, before equity in earnings (loss) of unconsolidated affiliates
|
(36.8
|
)
|
1.5
|
|
(7.9
|
)
|
(23.3
|
)
|
7.9
|
|
(58.6
|
)
|
|||||||||||
|
Equity in earnings of unconsolidated affiliates
|
0.1
|
|
—
|
|
—
|
|
1.4
|
|
1.9
|
|
3.4
|
|
|||||||||||
|
(Loss) earnings from continuing operations
|
$
|
(36.7
|
)
|
$
|
1.5
|
|
$
|
(7.9
|
)
|
$
|
(21.9
|
)
|
$
|
9.8
|
|
$
|
(55.2
|
)
|
|||||
|
Assets
|
$
|
501.0
|
|
$
|
221.2
|
|
$
|
6,832.9
|
|
$
|
765.0
|
|
$
|
(6,832.9
|
)
|
$
|
1,487.2
|
|
|||||
|
Goodwill
|
103.1
|
|
99.6
|
|
2,087.3
|
|
—
|
|
(2,087.3
|
)
|
202.7
|
|
|||||||||||
68
CANNAE HOLDINGS, INC.
NOTES TO CONSOLIDATED AND COMBINED FINANCIAL STATEMENTS — (continued)
As of and for the year ended December 31, 2016:
|
|
Restaurant Group
|
Ceridian
|
Corporate
and Other |
Ceridian Elimination
|
Total
|
||||||||||||||
|
|
(in millions)
|
||||||||||||||||||
|
Restaurant revenues
|
$
|
1,157.6
|
|
$
|
—
|
|
$
|
—
|
|
$
|
—
|
|
$
|
1,157.6
|
|
||||
|
Other revenues
|
—
|
|
704.2
|
|
20.8
|
|
(704.2
|
)
|
20.8
|
|
|||||||||
|
Revenues from external customers
|
1,157.6
|
|
704.2
|
|
20.8
|
|
(704.2
|
)
|
1,178.4
|
|
|||||||||
|
Interest and investment (loss) income, including realized gains and losses
|
(2.5
|
)
|
—
|
|
15.1
|
|
—
|
|
12.6
|
|
|||||||||
|
Total revenues
|
1,155.1
|
|
704.2
|
|
35.9
|
|
(704.2
|
)
|
1,191.0
|
|
|||||||||
|
Depreciation and amortization
|
42.4
|
|
57.3
|
|
2.3
|
|
(57.3
|
)
|
44.7
|
|
|||||||||
|
Interest expense
|
(4.7
|
)
|
(87.4
|
)
|
(0.5
|
)
|
87.4
|
|
(5.2
|
)
|
|||||||||
|
Earnings (loss) from continuing operations, before income taxes and equity in losses of unconsolidated affiliates
|
0.8
|
|
(87.6
|
)
|
4.4
|
|
87.6
|
|
5.2
|
|
|||||||||
|
Income tax expense (benefit)
|
0.4
|
|
17.8
|
|
(10.8
|
)
|
(17.8
|
)
|
(10.4
|
)
|
|||||||||
|
Earnings (loss) from continuing operations, before equity in losses of unconsolidated affiliates
|
0.4
|
|
(105.4
|
)
|
15.2
|
|
105.4
|
|
15.6
|
|
|||||||||
|
Equity in losses of unconsolidated affiliates
|
—
|
|
—
|
|
(0.4
|
)
|
(29.1
|
)
|
(29.5
|
)
|
|||||||||
|
Earnings (loss) from continuing operations
|
$
|
0.4
|
|
$
|
(105.4
|
)
|
$
|
14.8
|
|
$
|
76.3
|
|
$
|
(13.9
|
)
|
||||
|
Assets
|
$
|
497.2
|
|
$
|
6,426.5
|
|
$
|
976.1
|
|
$
|
(6,426.5
|
)
|
$
|
1,473.3
|
|
||||
|
Goodwill
|
103.1
|
|
2,058.0
|
|
—
|
|
(2,058.0
|
)
|
103.1
|
|
|||||||||
As of and for the year ended December 31, 2015:
|
|
Restaurant Group
|
Ceridian
|
Corporate
and Other |
Ceridian Elimination
|
Total FNFV
|
||||||||||||||
|
|
(in millions)
|
||||||||||||||||||
|
Restaurant revenues
|
$
|
1,412.3
|
|
$
|
—
|
|
$
|
—
|
|
$
|
—
|
|
$
|
1,412.3
|
|
||||
|
Other revenues
|
—
|
|
693.9
|
|
2.4
|
|
(693.9
|
)
|
2.4
|
|
|||||||||
|
Revenues from external customers
|
1,412.3
|
|
693.9
|
|
2.4
|
|
(693.9
|
)
|
1,414.7
|
|
|||||||||
|
Interest and investment (loss) income, including realized gains and losses
|
(0.5
|
)
|
—
|
|
14.3
|
|
—
|
|
13.8
|
|
|||||||||
|
Total revenues
|
1,411.8
|
|
693.9
|
|
16.7
|
|
(693.9
|
)
|
1,428.5
|
|
|||||||||
|
Depreciation and amortization
|
48.9
|
|
56.0
|
|
0.9
|
|
(56.0
|
)
|
49.8
|
|
|||||||||
|
Interest expense
|
(5.9
|
)
|
(87.8
|
)
|
0.4
|
|
87.8
|
|
(5.5
|
)
|
|||||||||
|
Earnings (loss) from continuing operations, before income taxes and equity in earnings (loss) of unconsolidated affiliates
|
7.6
|
|
(55.7
|
)
|
(11.4
|
)
|
55.7
|
|
(3.8
|
)
|
|||||||||
|
Income tax (benefit) expense
|
(1.8
|
)
|
8.6
|
|
(17.9
|
)
|
(8.6
|
)
|
(19.7
|
)
|
|||||||||
|
Earnings (loss) from continuing operations, before equity in earnings (loss) of unconsolidated affiliates
|
9.4
|
|
(64.3
|
)
|
6.5
|
|
64.3
|
|
15.9
|
|
|||||||||
|
Equity in (losses) earnings of unconsolidated affiliates
|
—
|
|
—
|
|
1.2
|
|
(27.2
|
)
|
(26.0
|
)
|
|||||||||
|
Earnings (loss) from continuing operations
|
$
|
9.4
|
|
$
|
(64.3
|
)
|
$
|
7.7
|
|
$
|
37.1
|
|
$
|
(10.1
|
)
|
||||
|
Assets
|
$
|
507.6
|
|
$
|
7,186.4
|
|
$
|
961.9
|
|
$
|
(7,186.4
|
)
|
$
|
1,469.5
|
|
||||
|
Goodwill
|
102.7
|
|
2,008.5
|
|
—
|
|
(2,008.5
|
)
|
102.7
|
|
|||||||||
The activities in our segments include the following:
|
•
|
Restaurant Group.
This segment consists of the operations of ABRH, in which we have a
55%
ownership interest. ABRH and its affiliates are the owners and operators of the O'Charley's, Ninety Nine Restaurants, Village Inn and Bakers Square food service and restaurant concepts, as well as the Legendary Baking bakery operation. This segment also included the results of operations of J. Alexander's through the date which it was distributed to holders of FNFV Group tracking stock, September 28, 2015, and the Max & Erma's restaurant concept, which was sold pursuant to an APA on January 25, 2016.
|
|
•
|
Ceridian.
This segment consists of our
33%
ownership interest in Ceridian. Ceridian, through its operating subsidiary Ceridian HCM, is a global company that offers a broad range of services and software designed to help employers more effectively manage employment processes, such as payroll, payroll related tax filing, human resource information systems, employee self-service, time and labor management, employee assistance and work-life programs, and recruitment and applicant screening. Ceridian HCM's cloud offering, Dayforce, is a cloud solution that meets HCM needs with one
|
69
CANNAE HOLDINGS, INC.
NOTES TO CONSOLIDATED AND COMBINED FINANCIAL STATEMENTS — (continued)
employee record and one user experience throughout the application. Dayforce enables organizations to process payroll, maintain human resources records, manage benefits enrollment, schedule staff, and find and hire personnel, while monitoring compliance throughout the employee life cycle. Our chief operating decision maker reviews the full financial results of Ceridian for purposes of assessing performance and allocating resources. Thus, we have included the full financial results of Ceridian in the table above. We account for our investment in Ceridian under the equity method of accounting and therefore its results of operations do not consolidate into ours. Accordingly, we have presented the elimination of Ceridian's results in the
Ceridian Elimination
section of the segment presentation above.
|
•
|
T-System.
This segment consists of the operations of our wholly-owned subsidiary, T-System, acquired on October 16, 2017. T-System is a provider of clinical documentation and coding solutions to hospital-based and free-standing emergency departments and urgent care facilities. T-System organizes itself into
two
businesses. The Clinical Documentation business offers software solutions providing clinical staff with full workflow operations that drive documentation completeness and revenue optimization to more than
435
customers. Additionally, the patented T-Sheet is the industry standard for emergency department documentation, with more than
800
customers. The Coding Software & Outsourced Solutions business provides a full-service outsourced coding solution as well as a cloud-based software-as-a-service solution for self-service coding. These offerings help more than
75
customers at over
300
sites optimize their revenue cycle workflow and customer revenue reimbursement through improved coding accuracy and compliance and coder productivity compared to in-house coding
|
|
•
|
Corporate and Other.
This segment consists of our share in the operations of certain controlled portfolio companies and other equity investments as well as certain intercompany eliminations and taxes. Total assets for this segment as of December 31, 2016 and 2015 also include the assets of One Digital. See Note N
Discontinued Operations
for further details.
|
Note R. Related Party Transactions
FNF
As a former wholly-owned subsidiary of FNF, we have incurred payables related to historical intercompany transactions, taxes and cost allocations between us and FNF. FNF forgave these historical intercompany receivables due from us which amounted to
$4.5 million
,
$9.5 million
, and
$2.2 million
in the years ended December 31, 2017, 2016, and 2015, respectively.
The Company is allocated certain corporate overhead and management services expenses from FNF based on the terms of the CSA and our proportionate share of the expense determined on actual usage and our best estimate of management's allocation of time. Total operating expenses allocated from FNF to us was
$9.5 million
,
$9.3 million
and
$16.9 million
in the years ended December 31, 2017, 2016 and 2015, respectively, which includes
$0.1 million
related to activity allocated to us after consummation of the Split-Off.
On November 16, 2017, certain subsidiaries of FNF contributed an aggregate of
$100.0 million
to us (the "FNF Investment") in exchange for
5,706,134
shares of Cannae common stock.
We have a
$100.0 million
Revolver Note with FNF. As of December 31, 2017 and 2016, there is
no
outstanding balance under the FNF Revolver or Revolver Note. Refer to Note K
Notes Payable
for further discussion.
Sale of Max & Erma's
On January 25, 2016, ABRH completed the sale of its Max & Erma's restaurant concept for
$6.5 million
pursuant to an APA. The buyer was a joint venture formed by Newport Global Opportunities Fund 1-A AIV LP and Glacier Restaurant Group ("GRG"), a restaurant owner and operator majority-owned by William P. Foley II, the Chairman of FNF's Boards of Directors. The transaction included the sale of
26
restaurants to GRG along with all Max & Erma's tradenames/trademarks and franchise operations, and other assets and liabilities. While the real estate leases for the
25
leased restaurants were assigned to the buyer, ABRH was not released from liability under the leases and remains liable in the event the buyer fails to pay amounts due thereunder. As of December 31, 2017, the maximum amount of this guarantee is
$23.1 million
.
|
Note S.
|
Recent Accounting Pronouncements
|
In May 2014, the Financial Accounting Standards Board ("FASB") issued Accounting Standards Update ("ASU") No. 2014-09,
Revenue from Contracts with Customers (Topic 606)
. This ASU provides a new comprehensive revenue recognition model that requires companies to recognize revenue to depict the transfer of goods or services to a customer at an amount that reflects the consideration it expects to receive in exchange for those goods or services. This update also requires additional disclosure about the nature, amount, timing and uncertainty of revenue and cash flows arising from customer contracts. This update permits the use of either the retrospective or cumulative effect transition method. ASU No. 2016-08,
Revenue from Contracts with
70
CANNAE HOLDINGS, INC.
NOTES TO CONSOLIDATED AND COMBINED FINANCIAL STATEMENTS — (continued)
Customers (Topic 606): Principal versus Agent Considerations
was issued by FASB in March 2016 to clarify the principal versus agent considerations within ASU 2014-09. ASU 2016-10
Revenue from Contracts with Customers (Topic 606): Identifying Performance Obligations and Licensing
was issued by the FASB in April 2016 to clarify how to determine whether goods and services are separately identifiable and thus accounted for as separate performance obligations. ASU 2016-12
Revenue from Contracts with Customers (Topic 606): Narrow-Scope Improvements and Practical Expedients
was issued by the FASB in May 2016 to clarify certain terms from the aforementioned updates and to add practical expedients for contracts at various stages of completion. ASU 2016-20,
Technical Corrections and Improvements to Topic 606, Revenue from Contracts with Customers
, was issued by the FASB in December 2016 which includes thirteen technical corrections and improvements affecting narrow aspects of the guidance issued in ASU 2014-09. Upon issuance of ASU 2015-14, the effective date of ASU 2014-09 was deferred to annual and interim periods beginning on or after December 15, 2017. We will adopt the guidance on January 1, 2018. Either of the following transition methods is permitted: (i) a full retrospective approach reflecting the application of the new standard in each prior reporting period, or (ii) a modified retrospective approach with a cumulative-effect adjustment to the opening balance of retained earnings in the year the new standard is first applied. We expect to adopt the new guidance under the modified retrospective approach and, while we expect to record a cumulative-effect adjustment, we do not expect the new guidance to have a material impact on our Consolidated and Combined Financial Statements.
In February 2016, the FASB issued ASU No. 2016-02
Leases (Topic 842)
. The amendments in this ASU introduce broad changes to the accounting and reporting for leases by lessees. The main provisions of the new standard include: clarifications to the definitions of a lease, components of leases, and criteria for determining lease classification; requiring virtually all leased assets, including operating leases and related liabilities, to be reflected on the lessee's balance sheet; and expanding and adding to the required disclosures for lessees. This update is effective for annual and interim periods beginning after December 15, 2018, including interim periods within those fiscal years. Early application of the standard is permitted. The ASU requires a modified retrospective approach to transitioning which allows for the use of practical expedients to effectively account for leases commenced prior to the effective date in accordance with previous GAAP, except that lessees are required to recognize a right-of-use asset and a lease liability for all operating leases at each reporting date based on the present value of the remaining minimum rental payments that were tracked and disclosed under previous GAAP. We are still evaluating the totality of the effects this new guidance will have on our business process and systems, Consolidated and Combined Financial Statements and related disclosures. We have identified a vendor with software suited to track and account for leases under the new standard. We plan to adopt this standard on January 1, 2019.
In June 2016, the FASB issued ASU No. 2016-13
Financial Instruments—Credit Losses: Measurement of Credit Losses on Financial Instruments
. The amendments in this ASU introduce broad changes to accounting for credit impairment of financial instruments. The primary updates include the introduction of a new current expected credit loss ("CECL") model that is based on expected rather than incurred losses and amendments to the accounting for impairment of debt securities available for sale. This update is effective for annual periods beginning after December 15, 2019, including interim periods within those fiscal years. Early adoption is permitted for annual periods beginning after December 15, 2018, including interim periods within those fiscal years. We are currently evaluating the effect this new guidance will have on our Consolidated and Combined Financial Statements and related disclosures and have not yet concluded on its effects. We do not plan to early adopt the standard.
In August 2016, the FASB issued ASU No. 2016-15
Statement of Cash Flows (Topic 230): Classification of Certain Cash Receipts and Cash Payments
. The amendments in this ASU introduce clarifications to the presentation of certain cash receipts and cash payments in the statement of cash flows. The primary updates include additions and clarifications of the classification of cash flows related to certain debt repayment activities, contingent consideration payments related to business combinations, proceeds from insurance policies, distributions from equity method investees, and cash flows related to securitized receivables. This update is effective for annual periods beginning after December 15, 2017, including interim periods within those fiscal years. Early adoption of this ASU is permitted, including in interim periods. The ASU requires retrospective application to all prior periods presented upon adoption. We adopted this ASU on January 1, 2018 and based on our preliminary analysis, we do not expect the adoption of this ASU to have a material impact on our resulting operating, investing, or financing cash flows.
In January 2017, the FASB issued ASU 2017-01,
Business Combinations (Topic 805): Clarifying the Definition of a Business
to assist companies with evaluating whether transactions should be accounted for as acquisitions of assets or businesses. The new guidance requires a company to evaluate if substantially all of the fair value of the gross assets acquired (or disposed of) is concentrated in a single identifiable asset or a group of similar identifiable assets; if so, the set of assets and activities is not a business. The guidance also requires a business to include at least one substantive process and narrows the definition of outputs by more closely aligning it with how outputs are described in the guidance for revenue from contracts with customers. The new standard is effective for fiscal years, and interim periods within those fiscal years, beginning after December 15, 2017, with early adoption permitted. The guidance should be applied prospectively to any transactions occurring within the period of adoption. We adopted this ASU on January 1, 2018. Based on our historical acquisition activity, we do not expect this to have a material impact on our ongoing accounting or financial reporting.
71
CANNAE HOLDINGS, INC.
NOTES TO CONSOLIDATED AND COMBINED FINANCIAL STATEMENTS — (continued)
In January 2017, the FASB issued ASU 2017-04,
Intangibles—Goodwill and Other (Topic 350): Simplifying the Test for Goodwill Impairment.
The guidance simplifies the measurement of goodwill impairment by removing step 2 of the goodwill impairment test, which requires the determination of the fair value of individual assets and liabilities of a reporting unit. The new guidance requires goodwill impairment to be measured as the amount by which a reporting unit's carrying value exceeds its fair value; however, the loss recognized should not exceed the total amount of goodwill allocated to that reporting unit. The amendments should be applied on a prospective basis. The new standard is effective for fiscal years beginning after December 15, 2019 with early adoption permitted for interim or annual goodwill impairment tests performed after January 1, 2017. We have completed our evaluation of the effect this new guidance will have on our Consolidated and Combined Financial Statements and related disclosures and have concluded that the effect will not be material. We do not expect to early adopt this standard.
|
Note T.
|
Supplementary Cash Flow Information
|
The following supplemental cash flow information is provided with respect to interest and tax payments, as well as certain non-cash investing and financing activities.
|
|
Year Ended December 31,
|
|||||||||||
|
|
2017
|
2016
|
2015
|
|||||||||
|
|
(In millions)
|
|||||||||||
|
Cash paid during the year:
|
|
|
|
|
|
|
||||||
|
Interest
|
$
|
8.7
|
|
$
|
8.7
|
|
$
|
7.4
|
|
|||
|
Income taxes
|
117.7
|
|
4.0
|
|
53.6
|
|
||||||
|
Non-cash financing activities:
|
|
|
|
|
||||||||
|
Liabilities and noncontrolling interests assumed in connection with acquisitions (1):
|
|
|
|
|
||||||||
|
Fair value of net assets acquired
|
$
|
252.5
|
|
$
|
92.0
|
|
$
|
31.5
|
|
|||
|
Less: Total cash purchase price
|
222.7
|
|
75.8
|
|
24.7
|
|
||||||
|
Liabilities and noncontrolling interests assumed
|
$
|
29.8
|
|
$
|
16.2
|
|
$
|
6.8
|
|
|||
|
Debt extinguished through the sale of OneDigital
|
$
|
151.1
|
|
$
|
—
|
|
$
|
—
|
|
|||
_____________________________________
(1) See Note B for further discussion of assets and liabilities acquired in business combinations in the years ended December 31, 2017 and 2016.
|
Item 9.
|
Changes in and Disagreements with Accountants on Accounting and Financial Disclosure
|
None.
|
Item 9A.
|
Controls and Procedures
|
As of the end of the year covered by this report, we carried out an evaluation, under the supervision and with the participation of our principal executive officer and principal financial officer, of the effectiveness of the design and operation of our disclosure controls and procedures as such term is defined in Rule 13a-15(e) or 15d-15(e) under the Exchange Act. Based on this evaluation, our principal executive officer and principal financial officer concluded that our disclosure controls and procedures are effective to ensure that information required to be disclosed by the Company in the reports that we file or submit under the Act is: (a) recorded, processed, summarized and reported, within the time periods specified in the Commission’s rules and forms; and (b) accumulated and communicated to management, including our principal executive and principal financial officers, as appropriate to allow timely decisions regarding required disclosure.
There were no changes in our internal control over financial reporting that occurred during the quarter ended
December 31, 2017
that have materially affected, or are reasonably likely to materially affect, our internal control over financial reporting.
Exemption from Management’s Report on Internal Control Over Financial Reporting for 2017
This Annual Report on Form 10-K does not include a report of management's assessment regarding internal control over financial reporting or an attestation report of the Company's independent registered public accounting firm due to a transition period established by rules of the Securities and Exchange Commission for newly public companies.
72
|
Item 9B.
|
Other Information
|
None.
Items 10-14.
Within 120 days after the close of our fiscal year, we intend to file with the Securities and Exchange Commission the matters required by these items.
73
|
Item 15.
|
Exhibits, Financial Statement Schedules and Reports on Form 8-K
|
(a) (1)
Financial Statements.
The following is a list of the Consolidated and Combined Financial Statements of Cannae Holdings, Inc. and its subsidiaries included in Item 8 of Part II:
All other schedules are omitted because they are not applicable or not required, or because the required information is included in the Consolidated and Combined Financial Statements or notes thereto.
74
(a) (2) The following exhibits are incorporated by reference or are set forth on pages to this Form 10-K:
|
Exhibit
Number
|
Description
|
|
2.1
|
|
|
3.1
|
|
|
3.2
|
|
|
10.1
|
|
|
10.2
|
|
|
10.3
|
|
|
10.4
|
|
|
10.5
|
|
|
10.6
|
|
|
10.7
|
|
|
10.8
|
|
|
10.9
|
|
|
10.10
|
|
|
10.11
|
|
|
10.12
|
|
|
21.1
|
|
|
23.1
|
|
|
23.2
|
|
|
23.3
|
|
|
31.1
|
|
|
31.2
|
|
|
32.1
|
|
|
32.2
|
|
|
99.1
|
|
|
101
|
The following materials from Cannae Holdings, Inc.'s Annual Report on Form 10-K for the year ended December 31, 2017, formatted in Extensible Business Reporting Language (XBRL): (i) the Consolidated and Combined Balance Sheets, (ii) the Consolidated and Combined Statements of Operations, (iii) the Consolidated and Combined Statements of Comprehensive Earnings (Loss), (iv) the Consolidated and Combined Statements of Stockholders' Equity, (v) the Consolidated and Combined Statements of Cash Flows, and (vi) the Notes to Consolidated and Combined Financial Statements.
|
75
(1) A management or compensatory plan or arrangement required to be filed as an exhibit to this report pursuant to Item 15(c) of Form 10-K
76
SIGNATURES
Pursuant to the requirements of Section 13 or 15(d) of the Securities Exchange Act of 1934, the Registrant has duly caused this report to be signed on its behalf by the undersigned, thereunto duly authorized.
|
Cannae Holdings, Inc.
|
|||
|
|
By:
|
/s/ Brent B. Bickett
|
|
|
Brent B. Bickett
|
|||
|
President (Principal Executive Officer)
|
|||
Date:
March 26, 2018
|
Pursuant to the requirements of the Securities Exchange Act of 1934, this report has been signed below by the following persons on behalf of the Registrant and in the capacities and on the dates indicated.
|
||||
|
Signature
|
|
Title
|
|
Date
|
|
/s/
Brent B. Bickett
|
|
President
|
|
March 26, 2018
|
|
Brent B. Bickett
|
(Principal Executive Officer)
|
|||
|
|
|
|
|
|
|
/s/
Richard L. Cox
|
|
Executive Vice President and Chief Financial Officer
|
|
March 26, 2018
|
|
Richard L. Cox
|
(Principal Financial and Accounting Officer)
|
|||
|
|
|
|
|
|
|
/s/
William P. Foley, II
|
|
Director
|
|
March 26, 2018
|
|
William P. Foley, II
|
||||
|
|
|
|
|
|
|
/s/
Hugh R. Harris
|
|
Director
|
|
March 26, 2018
|
|
Hugh R. Harris
|
||||
|
|
|
|
|
|
|
/s/ C. Malcolm Holland
|
|
Director
|
|
March 26, 2018
|
|
C. Malcolm Holland
|
||||
|
|
|
|
|
|
|
/s/ Frank R. Martire
|
|
Director
|
|
March 26, 2018
|
|
Frank R. Martire
|
||||
|
|
|
|
|
|
|
/s/ James B. Stallings, Jr.
|
|
Director
|
|
March 26, 2018
|
|
James B. Stallings, Jr.
|
||||
|
|
|
|
|
|
|
/s/ Frank P. Willey
|
|
Director
|
|
March 26, 2018
|
|
Frank P. Willey
|
||||
77
TABLE OF CONTENTS
Part IItem 1. BusinessItem 1A. Risk FactorsItem 1B. Unresolved Staff CommentsItem 2. PropertiesItem 3. Legal ProceedingsPart IIItem 5. Market For Registrant's Common Equity, Related Stockholder Matters and Issuer Purchases Of Equity SecuritiesItem 6. Selected Financial DataItem 7. Management's Discussion and Analysis Of Financial Condition and Results Of OperationsItem 7A. Quantitative and Qualitative Disclosure About Market RiskItem 8. Financial Statements and Supplementary DataItem 9. Changes in and Disagreements with Accountants on Accounting and Financial DisclosureItem 9A. Controls and ProceduresItem 9B. Other InformationPart IIIPart IVItem 15. Exhibits, Financial Statement Schedules and Reports on Form 8-k