CAPITAL ONE FINANCIAL CORP
10-Ks and 10-Qs
|
|
|
|
|
|
|
|
|
|
|
|
|
|
|
|
|
|
|
|
|
|
|
|
|
|
|
|
|
|
|
|
|
|
|
|
|
|
|
|
|
|
|
|
|
|
|
|
|
|
|
|
|
|
|
|
______________________________________________________________________________________________________________________________________________________________________________________________________________________________________________________________________________________________________________________________________________________________________________________________________________________________________________________________________________________________________________________________________________________________________________
UNITED STATES
SECURITIES AND EXCHANGE COMMISSION
Washington, D.C. 20549
____________________________________
FORM 10-K
____________________________________
|
ý
ANNUAL REPORT PURSUANT TO SECTION 13 OR 15(d) OF THE SECURITIES EXCHANGE ACT OF 1934
|
|
For the fiscal year ended December 31, 2017
|
|
OR
|
|
¨
TRANSITION REPORT PURSUANT TO SECTION 13 OR 15(d) OF THE SECURITIES EXCHANGE ACT OF 1934
|
|
For the transition period from
to
Commission File No. 1-13300
|
____________________________________
CAPITAL ONE FINANCIAL CORPORATION
(Exact name of registrant as specified in its charter)
____________________________________
|
Delaware
|
|
54-1719854
|
|
(State or Other Jurisdiction of Incorporation or Organization)
|
|
(I.R.S. Employer Identification No.)
|
|
1680 Capital One Drive,
McLean, Virginia
|
|
22102
|
|
(Address of Principal Executive Offices)
|
|
(Zip Code)
|
Registrant’s telephone number, including area code: (703) 720-1000
____________________________________
Securities registered pursuant to section 12(b) of the act:
|
Title of Each Class
|
Name of Each Exchange on Which Registered
|
|
Common Stock (par value $.01 per share)
|
New York Stock Exchange
|
|
Warrants (expiring November 14, 2018)
|
New York Stock Exchange
|
|
Depositary Shares, Each Representing a 1/40th Interest in a Share of Fixed Rate Non-Cumulative Perpetual Preferred Stock, Series B
|
New York Stock Exchange
|
|
Depositary Shares, Each Representing a 1/40th Interest in a Share of Fixed Rate Non-Cumulative Perpetual Preferred Stock, Series C
|
New York Stock Exchange
|
|
Depositary Shares, Each Representing a 1/40th Interest in a Share of Fixed Rate Non-Cumulative Perpetual Preferred Stock, Series D
|
New York Stock Exchange
|
|
Depositary Shares, Each Representing a 1/40th Interest in a Share of Fixed Rate Non-Cumulative Perpetual Preferred Stock, Series F
|
New York Stock Exchange
|
|
Depositary Shares, Each Representing a 1/40th Interest in a Share of Fixed Rate Non-Cumulative Perpetual Preferred Stock, Series G
|
New York Stock Exchange
|
|
Depositary Shares, Each Representing a 1/40th Interest in a Share of Fixed Rate Non-Cumulative Perpetual Preferred Stock, Series H
|
New York Stock Exchange
|
Securities registered pursuant to section 12(g) of the act: None
____________________________________
Indicate by check mark if the registrant is a well-known seasoned issuer, as defined in Rule 405 of the Securities Act. Yes
ý
No
¨
Indicate by check mark if the registrant is not required to file reports pursuant to Section 13 or Section 15(d) of the Act. Yes
¨
No
ý
Indicate by check mark whether the registrant (1) has filed all reports required to be filed by Section 13 or 15(d) of the Securities Exchange Act of 1934 during the preceding 12 months (or for such shorter period that the registrant was required to file such reports), and (2) has been subject to such filing requirements for the past 90 days.
Yes
ý
No
¨
Indicate by check mark whether the registrant has submitted electronically and posted on its corporate website, if any, every Interactive Data File required to be submitted and posted pursuant to Rule 405 of Regulation S-T (§232.405 of this chapter) during the preceding 12 months (or for such shorter period that the registrant was required to submit and post such files). Yes
ý
No
¨
Indicate by check mark if disclosure of delinquent filers pursuant to Item 405 of Regulation S-K is not contained herein, and will not be contained, to the best of the registrant’s knowledge, in definitive proxy or information statements incorporated by reference in Part III of this Form 10-K or any amendment to this Form 10-K.
¨
Indicate by check mark whether the registrant is a large accelerated filer, an accelerated filer, a non-accelerated filer, a smaller reporting company. or an emerging growth company. See the definitions of “large accelerated filer,” “accelerated filer,” “smaller reporting company,” and “emerging growth company” in Rule 12b-2 of the Exchange Act.
|
Large accelerated filer
|
|
ý
|
|
Accelerated filer
|
|
¨
|
|
Non-accelerated filer
|
|
¨
(Do not check if a smaller reporting company)
|
|
Smaller reporting company
|
¨
|
|
|
Emerging growth company
|
¨
|
|||||
If an emerging growth company, indicate by check mark if the registrant has elected not to use the extended transition period for complying with any new or revised financial accounting standards provided pursuant to Section 13(a) of the Exchange Act.
¨
Indicate by check mark whether the registrant is a Shell Company (as defined in Rule 12b-2 of the Exchange Act) Yes
¨
No
ý
The aggregate market value of the voting stock held by non-affiliates of the registrant as of the close of business on June 30, 2017 was approximately
$39.2 billion
. As of January 31, 2018, there were
486,287,085
shares of the registrant’s Common Stock outstanding.
DOCUMENTS INCORPORATED BY REFERENCE
|
1.
|
Portions of the Proxy Statement for the annual meeting of stockholders to be held on May 3, 2018, are incorporated by reference into Part III.
|
______________________________________________________________________________________________________________________________________________________________________________________________________________________________________________________________________________________________________________________________________________________________________________________________________________________________________________________________________________________________________________________________________________________________________________
TABLE OF CONTENTS
|
Page
|
||
|
PART I
|
||
|
Item 1.
|
Business
|
|
|
Supervision and Regulation
|
||
|
Item 1A.
|
Risk Factors
|
|
|
Item 1B.
|
Unresolved Staff Comments
|
|
|
Item 2.
|
Properties
|
|
|
Item 3.
|
Legal Proceedings
|
|
|
Item 4.
|
Mine Safety Disclosures
|
|
|
PART II
|
||
|
Item 5.
|
Market for Registrant’s Common Equity, Related Stockholder Matters and Issuer Purchases of Equity Securities
|
|
|
Item 6.
|
Summary of Selected Financial Data
|
|
|
Item 7.
|
Management’s Discussion and Analysis of Financial Condition and Results of Operations (“MD&A”)
|
|
|
Executive Summary and Business Outlook
|
||
|
Business Segment Financial Performance
|
||
|
Accounting Changes and Developments
|
||
|
Capital Management
|
||
|
Risk Management
|
||
|
Credit Risk Profile
|
||
|
Liquidity Risk Profile
|
||
|
Market Risk Profile
|
||
|
Glossary and Acronyms
|
||
|
Item 7A.
|
Quantitative and Qualitative Disclosures about Market Risk
|
|
|
Item 8.
|
||
|
1
|
Capital One Financial Corporation (COF)
|
|
|
Note 1—Summary of Significant Accounting Policies
|
||
|
Note 2—
Business Developments and Discontinued Operations
|
||
|
Note 3—Investment Securities
|
||
|
Note 4—Loans
|
||
|
Note 5—Allowance for Loan and Lease Losses and Reserve for Unfunded Lending Commitments
|
||
|
Note 6—Variable Interest Entities and Securitizations
|
||
|
Note 7—Goodwill and Intangible Assets
|
||
|
Note 8—Premises, Equipment and Lease Commitments
|
||
|
Note 9—Deposits and Borrowings
|
||
|
Note 10—Derivative Instruments and Hedging Activities
|
||
|
Note 11—Stockholders’ Equity
|
||
|
Note 12—Regulatory and Capital Adequacy
|
||
|
Note 13—Earnings Per Common Share
|
||
|
Note 14—Stock-Based Compensation Plans
|
||
|
Note 15—Employee Benefit Plans
|
||
|
Note 16—Income Taxes
|
||
|
Note 17—Fair Value Measurement
|
||
|
Note 18—Business Segments
|
||
|
Note 19—Commitments, Contingencies, Guarantees and Others
|
||
|
Note 20—Capital One Financial Corporation (Parent Company Only)
|
||
|
Note 21—Related Party Transactions
|
||
|
Item 9.
|
Changes in and Disagreements with Accountants on Accounting and Financial Disclosure
|
|
|
Item 9A.
|
Controls and Procedures
|
|
|
Item 9B.
|
Other Information
|
|
|
PART III
|
||
|
Item 10.
|
Directors, Executive Officers and Corporate Governance
|
|
|
Item 11.
|
Executive Compensation
|
|
|
Item 12.
|
Security Ownership of Certain Beneficial Owners and Management and Related Stockholder Matters
|
|
|
Item 13.
|
Certain Relationships and Related Transactions and Director Independence
|
|
|
Item 14.
|
Principal Accountant Fees and Services
|
|
|
PART IV
|
||
|
Item 15.
|
Exhibits, Financial Statements Schedules
|
|
|
Item 16.
|
Form 10-K Summary
|
|
|
SIGNATURES
|
||
|
2
|
Capital One Financial Corporation (COF)
|
|
INDEX OF MD&A AND SUPPLEMENTAL TABLES
|
MD&A Tables:
|
Page
|
|
|
1
|
Average Balances, Net Interest Income and Net Interest Margin
|
|
|
2
|
Rate/Volume Analysis of Net Interest Income
|
|
|
3
|
Non-Interest Income
|
|
|
4
|
Non-Interest Expense
|
|
|
5
|
Investment Securities
|
|
|
6
|
Non-Agency Investment Securities Credit Ratings
|
|
|
7
|
Loans Held for Investment
|
|
|
8
|
Business Segment Results
|
|
|
9
|
Credit Card Business Results
|
|
|
9.1
|
Domestic Card Business Results
|
|
|
10
|
Consumer Banking Business Results
|
|
|
11
|
Commercial Banking Business Results
|
|
|
12
|
Other Category Results
|
|
|
13
|
Capital Ratios under Basel III
|
|
|
14
|
Regulatory Capital Reconciliations between Basel III Transition to Fully Phased-in
|
|
|
15
|
Preferred Stock Dividends Paid Per Share
|
|
|
16
|
Loans Held for Investment Portfolio Composition
|
|
|
17
|
Commercial Loans by Industry
|
|
|
18
|
Home Loans—Risk Profile by Lien Priority
|
|
|
19
|
||
|
20
|
Credit Score Distribution
|
|
|
21
|
30+ Day Delinquencies
|
|
|
22
|
Aging and Geography of 30+ Day Delinquent Loans
|
|
|
23
|
90+ Day Delinquent Loans Accruing Interest
|
|
|
24
|
Nonperforming Loans and Other Nonperforming Assets
|
|
|
25
|
Net Charge-Offs (Recoveries)
|
|
|
26
|
Troubled Debt Restructurings
|
|
|
27
|
Allowance for Loan and Lease Losses and Reserve for Unfunded Lending Commitments Activity
|
|
|
28
|
Allowance Coverage Ratios
|
|
|
29
|
Liquidity Reserves
|
|
|
30
|
Deposits Composition and Average Deposits Interest Rates
|
|
|
31
|
Maturities of Large-Denomination Domestic Time Deposits—$100,000 or More
|
|
|
32
|
Long-Term Funding
|
|
|
33
|
Senior Unsecured Long-Term Debt Credit Ratings
|
|
|
34
|
||
|
35
|
Interest Rate Sensitivity Analysis
|
|
|
A
|
Loans Held for Investment Portfolio Composition
|
|
|
B
|
||
|
C
|
||
|
D
|
||
|
E
|
||
|
F
|
Reconciliation of Non-GAAP Measures and Calculation of Regulatory Capital Measures
|
|
|
G
|
Selected Quarterly Financial Information
|
|
|
3
|
Capital One Financial Corporation (COF)
|
|
Item 1.
Business
|
OVERVIEW
|
General
Capital One Financial Corporation, a Delaware corporation established in 1994 and headquartered in McLean, Virginia, is a diversified financial services holding company with banking and non-banking subsidiaries. Capital One Financial Corporation and its subsidiaries (the “Company” or “Capital One”) offer a broad array of financial products and services to consumers, small businesses and commercial clients through branches, the internet and other distribution channels.
As of
December 31, 2017
, our principal subsidiaries included:
|
•
|
Capital One Bank (USA), National Association (“COBNA”), which offers credit and debit card products, other lending products and deposit products; and
|
|
•
|
Capital One, National Association (“CONA”), which offers a broad spectrum of banking products and financial services to consumers, small businesses and commercial clients.
|
The Company is hereafter collectively referred to as “we,” “us” or “our.” COBNA and CONA are collectively referred to as the “Banks.” References to “this Report” or our “
2017
Form 10-K” or “
2017
Annual Report” are to our Annual Report on Form 10-K for the fiscal year ended
December 31, 2017
. All references to
2017
,
2016
,
2015
,
2014
and
2013
, refer to our fiscal years ended, or the dates, as the context requires,
December 31, 2017
,
December 31, 2016
,
December 31, 2015
,
December 31, 2014
and
December 31, 2013
, respectively. Certain business terms used in this document are defined in the “MD&A—Glossary and Acronyms” and should be read in conjunction with the Consolidated Financial Statements included in this Report.
As one of the nation’s ten largest banks based on deposits as of
December 31, 2017
, we service banking customer accounts through the internet and mobile banking, as well as through Cafés, ATMs and branch locations
primarily across New York, Louisiana, Texas, Maryland, Virginia, New Jersey and the District of Columbia.
We also operate the largest online direct bank in the United States (“U.S.”) by deposits. In addition to bank lending, treasury management and depository services, we offer credit and debit card products, auto loans and other consumer lending products in markets across the United States. We were the third largest issuer of Visa
®
(“Visa”) and MasterCard
®
(“MasterCard”) credit cards in the U.S. based on the outstanding balance of credit card loans as of
December 31, 2017
.
We also offer products outside of the U.S. principally through Capital One (Europe) plc (“COEP”), an indirect subsidiary of COBNA organized and located in the United Kingdom (“U.K.”), and through a branch of COBNA in Canada. Both COEP and our branch of COBNA in Canada have the authority to provide credit card loans.
Business Developments
We regularly explore and evaluate opportunities to acquire financial services and financial assets, including credit card and other loan portfolios, and enter into strategic partnerships as part of our growth strategy. We also explore opportunities to acquire digital companies and related assets to improve our information technology infrastructure and to deliver on our digital strategy. In addition, we regularly consider the potential disposition of certain of our assets, branches, partnership agreements or lines of business. We may issue equity or debt, including public offerings, to fund our acquisitions.
On November 7, 2017, we announced our decision to cease new originations of residential mortgage and home equity loan products within our Consumer Banking business. We continue to service our existing home loan portfolio.
On September 25, 2017, we completed the acquisition from Synovus Bank of credit card assets and related liabilities of World’s Foremost Bank, a wholly-owned subsidiary of Cabela’s Incorporated (“Cabela’s acquisition”). The Cabela’s acquisition added approximately $5.7 billion to our domestic credit card loans held for investment portfolio as of the acquisition date. See “
Note 2—
Business Developments and Discontinued Operations
” for additional details.
|
4
|
Capital One Financial Corporation (COF)
|
|
On December 1, 2015, we completed the acquisition of the Healthcare Financial Services business of General Electric Capital Corporation (“HFS acquisition”). Including post-closing purchase price adjustments, we recorded approximately
$9.2 billion
in assets, including
$8.2 billion
of loans.
Additional Information
Our common stock trades on the New York Stock Exchange (“NYSE”) under the symbol “COF” and is included in the Standard & Poor’s (“S&P”) 100 Index. We maintain a website at www.capitalone.com. Documents available under Corporate Governance in the Investor Relations section of our website include:
|
•
|
our Code of Business Conduct and Ethics for the Corporation;
|
|
•
|
our Corporate Governance Guidelines; and
|
|
•
|
charters for the Audit, Compensation, Governance and Nominating, and Risk Committees of the Board of Directors.
|
These documents also are available in print to any stockholder who requests a copy. We intend to disclose future amendments to certain provisions of our Code of Business Conduct and Ethics, and waivers of our Code of Business Conduct and Ethics granted to executive officers and directors, on the website within four business days following the date of the amendment or waiver.
In addition, we make available free of charge through our website our Annual Reports on Form 10-K, Quarterly Reports on Form 10-Q, Current Reports on Form 8-K and amendments to those reports as soon as reasonably practicable after electronically filing or furnishing such material to the U.S. Securities and Exchange Commission (“SEC”).
|
OPERATIONS AND BUSINESS SEGMENTS
|
Our consolidated total net revenues are derived primarily from lending to consumer and commercial customers net of funding costs associated with deposits, short-term borrowings and long-term debt. We also earn non-interest income which primarily consists of interchange income net of reward expenses, and service charges and other customer-related fees. Our expenses primarily consist of the provision for credit losses, operating expenses, marketing expenses and income taxes.
Our principal operations are organized for management reporting purposes into three primary business segments, which are defined primarily based on the products and services provided or the type of customer served: Credit Card, Consumer Banking and Commercial Banking. The operations of acquired businesses have been integrated into our existing business segments. Certain activities that are not part of a segment, such as management of our corporate investment portfolio, asset/liability management by our centralized Corporate Treasury group and
residual tax expense or benefit to arrive at the consolidated effective tax rate that is not assessed to our primary business segments
, are included in the Other category.
|
•
|
Credit Card:
Consists of our domestic consumer and small business card lending, and international card businesses in Canada and the United Kingdom.
|
|
•
|
Consumer Banking:
Consists of our branch-based lending and deposit gathering activities for consumers and small businesses, national deposit gathering, national auto lending and our consumer home loan portfolio and associated servicing activities.
|
|
•
|
Commercial Banking:
Consists of our lending, deposit gathering, capital markets and treasury management services to commercial real estate and commercial and industrial customers. Our commercial and industrial customers typically include companies with annual revenues between $20 million and $2 billion.
|
Customer usage and payment patterns, credit quality, levels of marketing expense and operating efficiency all affect our profitability. In our Credit Card business, we experience fluctuations in purchase volume and the level of outstanding loan receivables due to seasonal variances in consumer spending and payment patterns which, for example, are highest around the winter holiday season. No individual quarter in 2017, 2016 or 2015 accounted for more than 30% of our total revenues in any of these fiscal years. Net charge-off rates in our Credit Card and Consumer Banking businesses also have historically exhibited seasonal patterns and generally tend to be the highest in the first and fourth quarters of the year.
|
5
|
Capital One Financial Corporation (COF)
|
|
For additional information on our business segments, including the financial performance of each business, see “Part II—Item 7. Management’s Discussion and Analysis of Financial Condition and Results of Operations (“MD&A”)—
Executive Summary and Business Outlook
,” “MD&A—
Business Segment Financial Performance
” and “
Note 18—Business Segments
” of this Report.
|
COMPETITION
|
Each of our business segments operates in a highly competitive environment, and we face competition in all aspects of our business from numerous bank and non-bank providers of financial services.
Our Credit Card business competes with international, national, regional and local issuers of Visa and MasterCard credit cards, as well as with American Express
®
, Discover Card
®
, private-label card brands, and, to a certain extent, issuers of debit cards. In general, customers are attracted to credit card issuers largely on the basis of price, credit limit, reward programs and other product features.
Our Consumer Banking and Commercial Banking businesses compete with national, state and direct banks for deposits, commercial and auto loans, as well as with savings and loan associations and credit unions for loans and deposits. Our competitors also include automotive finance companies, commercial mortgage banking companies and other financial services providers that provide loans, deposits, and other similar services and products. In addition, we compete against non-depository institutions that are able to offer these products and services. Securities firms and insurance companies that elect to become financial holding companies may acquire banks and other financial institutions. Combinations of this type could significantly change the competitive environment in which we conduct business. The financial services industry is also likely to become more competitive as further technological advances enable more companies to provide financial services. These technological advances may diminish the importance of depository institutions and other financial intermediaries in the transfer of funds between parties. In addition, competition among direct banks is intense because online banking provides customers the ability to rapidly deposit and withdraw funds and open and close accounts in favor of products and services offered by competitors.
Our businesses generally compete on the basis of the quality and range of their products and services, transaction execution, innovation and price. Competition varies based on the types of clients, customers, industries and geographies served. Our ability to compete depends, in part, on our ability to attract and retain our associates and on our reputation. Our decision to cease new originations of residential mortgage and home equity loan products within our Consumer Banking business was informed, in part, by the competitive landscape for those products. That decision notwithstanding, we believe that we are able to compete effectively in our current markets. There can be no assurance, however, that our ability to market products and services successfully or to obtain adequate returns on our products and services will not be impacted by the nature of the competition that now exists or may later develop, or by the broader economic environment. For a discussion of the risks related to our competitive environment, please refer to “Part I—Item 1A.
Risk Factors
.”
|
SUPERVISION AND REGULATION
|
General
Capital One Financial Corporation is a bank holding company (“BHC”) and a financial holding company (“FHC”) under the Bank Holding Company Act of 1956, as amended (“BHC Act”), and is subject to the requirements of the BHC Act, including approval requirements for investments in or acquisitions of banking organizations, capital adequacy standards and limitations on nonbanking activities. As a BHC and FHC, we are subject to supervision, examination and regulation by the Board of Governors of the Federal Reserve System (“Federal Reserve”). Permissible activities for a BHC include those activities that are so closely related to banking as to be a proper incident thereto. In addition, an FHC is permitted to engage in activities considered to be financial in nature (including, for example, securities underwriting and dealing and merchant banking activities), incidental to financial activities or, if the Federal Reserve determines that they pose no risk to the safety or soundness of depository institutions or the financial system in general, activities complementary to financial activities.
To become and remain eligible for financial holding company status, a BHC and its subsidiary depository institutions must meet certain criteria, including capital, management and Community Reinvestment Act (“CRA”) requirements. Failure to meet such criteria could result, depending on which requirements were not met, in the Company facing restrictions on new financial activities or acquisitions or being required to discontinue existing activities that are not generally permissible for BHCs.
|
6
|
Capital One Financial Corporation (COF)
|
|
The Banks are national associations chartered under the laws of the United States, the deposits of which are insured by the Deposit Insurance Fund (“DIF”) of the Federal Deposit Insurance Corporation (“FDIC”) up to applicable limits. The Banks are subject to comprehensive regulation and periodic examination by the Office of the Comptroller of the Currency (“OCC”), the FDIC and the Consumer Financial Protection Bureau (“CFPB”).
We are also registered as a financial institution holding company under the law of the Commonwealth of Virginia and, as such, we are subject to periodic examination by the Virginia Bureau of Financial Institutions. We also face regulation in the international jurisdictions in which we conduct business (see below under “Regulation of Businesses by Authorities Outside the United States”).
Regulation of Business Activities
The business activities of the Company and Banks are also subject to regulation and supervision under various laws and regulations.
Regulations of Consumer Lending Activities
The activities of the Banks as consumer lenders are subject to regulation under various federal laws, including, for example, the Truth in Lending Act (“TILA”), the Equal Credit Opportunity Act, the Fair Credit Reporting Act, the CRA, the Servicemembers Civil Relief Act and the Military Lending Act, as well as under various state laws. We are also subject to the Credit Card Accountability Responsibility and Disclosure Act, which amended the TILA, and which imposes a number of restrictions on credit card practices impacting rates and fees, requires that a consumer’s ability to pay be taken into account before issuing credit or increasing credit limits, and imposes revised disclosures required for open-end credit.
Depending on the underlying issue and applicable law, regulators may be authorized to impose penalties for violations of these statutes and, in certain cases, to order banks to compensate customers. Borrowers may also have a private right of action for certain violations. Federal bankruptcy and state debtor relief and collection laws may also affect the ability of a bank, including the Banks, to collect outstanding balances owed by borrowers.
Mortgage Lending
The CFPB has issued several rules pursuant to the Dodd-Frank Wall Street Reform and Consumer Protection Act (“Dodd-Frank Act”) that provide additional disclosure requirements and substantive limitations on our mortgage lending activities. Although we announced our decision to cease new originations of residential mortgage and home equity loan products within our Consumer Banking business, these rules could still impact pending mortgage loan applications and our servicing activities.
Debit Interchange Fees
The Dodd-Frank Act requires that the amount of any interchange fee received by a debit card issuer with respect to debit card transactions be reasonable and proportional to the cost incurred by the issuer with respect to the transaction. Final rules adopted by the Federal Reserve to implement these requirements limit interchange fees per debit card transaction to $0.21 plus five basis points of the transaction amount and provide for an additional $0.01 fraud prevention adjustment to the interchange fee for issuers that meet certain fraud prevention requirements.
Bank Secrecy Act and USA PATRIOT Act of 2001
The Bank Secrecy Act and the USA PATRIOT Act of 2001 (“Patriot Act”) require financial institutions, among other things, to implement a risk-based program reasonably designed to prevent money laundering and to combat the financing of terrorism, including through suspicious activity and currency transaction reporting, compliance, record-keeping and customer due diligence.
In May 2016, the United States Department of the Treasury’s Financial Crimes Enforcement Network issued a final rule making customer due diligence a required, stand-alone part of the anti-money laundering programs financial institutions must maintain under the Bank Secrecy Act. For these purposes, the term “customer due diligence” refers to customer identification and verification, beneficial ownership identification and verification, understanding the nature and purpose of customer relationships to develop a customer risk profile, ongoing monitoring for reporting suspicious transactions and, on a risk-adjusted basis, maintaining and updating customer information. The rule became effective on July 11, 2016 and requires full compliance by May 11, 2018 for Capital One and all other covered financial institutions.
The Patriot Act also contains financial transparency laws and provides enhanced information collection tools and enforcement mechanisms to the United States government, including due diligence and record-keeping requirements for private banking and correspondent accounts; standards for verifying customer identification at account opening; rules to produce certain records upon
|
7
|
Capital One Financial Corporation (COF)
|
|
request of a regulator or law enforcement agency; and rules to promote cooperation among financial institutions, regulators and law enforcement agencies in identifying parties that may be involved in terrorism, money laundering and other crimes.
Funding
Under the Federal Deposit Insurance Corporation Improvement Act of 1991 (“FDICIA”), as discussed in “MD&A—Liquidity Risk Profile,” only well-capitalized and adequately capitalized institutions may accept brokered deposits. Adequately capitalized institutions, however, must obtain a waiver from the FDIC before accepting brokered deposits, and such institutions may not pay rates that significantly exceed the rates paid on deposits of similar maturity obtained from the institution’s normal market area or, for deposits obtained from outside the institution’s normal market area, the national rate on deposits of comparable maturity. The FDIC is authorized to terminate a bank’s deposit insurance upon a finding by the FDIC that the bank’s financial condition is unsafe or unsound or that the institution has engaged in unsafe or unsound practices or has violated any applicable rule, regulation, order or condition enacted or imposed by the bank’s regulatory agency. The termination of deposit insurance would likely have a material adverse effect on a bank’s liquidity and earnings.
Nonbank Activities
Certain of our nonbank subsidiaries are subject to supervision and regulation by various other federal and state authorities. Capital One Securities, Inc. and Capital One Investing, LLC are registered broker-dealers regulated by the SEC and the Financial Industry Regulatory Authority. Our broker-dealer subsidiaries are subject, among other things, to net capital rules designed to measure the general financial condition and liquidity of a broker-dealer. Under these rules, broker-dealers are required to maintain the minimum net capital deemed necessary to meet their continuing commitments to customers and others, and to keep a substantial portion of their assets in relatively liquid form. These rules also limit the ability of a broker-dealer to transfer capital to its parent companies and other affiliates. Broker-dealers are also subject to regulations covering their business operations, including sales and trading practices, public offerings, publication of research reports, use and safekeeping of client funds and securities, capital structure, record-keeping and the conduct of directors, officers and employees.
Capital One Asset Management, LLC and Capital One Advisors, LLC are SEC-registered investment advisers regulated under the Investment Advisers Act of 1940. Capital One Asset Management, LLC, whose sole client is CONA, provides investment advice to CONA’s private banking customers, including trusts, high net worth individuals, institutions, foundations, endowments and other organizations.
Capital One Agency LLC is a licensed insurance agency that provides both personal and business insurance services to retail and commercial clients. It is regulated by state insurance regulatory agencies in the states in which it operates.
Derivatives Activities
The Commodity Futures Trading Commission (“CFTC”) and the SEC have jointly issued final rules further defining the Dodd-Frank Act’s “swap dealer” definitions. Based on these rules, no Capital One entity is currently required to register with the CFTC or SEC as a swap dealer. The Dodd-Frank Act also requires all swap market participants to keep certain swap transaction records and report pertinent information to swap data repositories on a real-time and on-going basis. Further, each swap, group, category, type or class of swap that the CFTC or SEC determines must be cleared through a derivatives clearinghouse (unless the swap is eligible for a clearing exemption) must also be executed on a designated contract market (“DCM”), exchange or swap execution facility (“SEF”), unless no DCM, exchange or SEF has made the swap available for trading.
Volcker Rule
We and each of our subsidiaries, including the Banks, are subject to the “Volcker Rule,” a provision of the Dodd-Frank Act that contains prohibitions on proprietary trading and certain investments in, and relationships with, covered funds (hedge funds, private equity funds and similar funds), subject to certain exemptions, in each case as the applicable terms are defined in the Volcker Rule and the implementing regulations. The implementing regulations also require that we, as a banking entity with $50 billion or more in total assets, establish and maintain an enhanced compliance program designed to ensure that we comply with the requirements of the regulations.
|
8
|
Capital One Financial Corporation (COF)
|
|
Capital and Liquidity Regulation
The Company and the Banks are subject to capital adequacy guidelines adopted by the Federal Reserve and OCC. For a further discussion of the capital adequacy guidelines, see “MD&A—Capital Management,” “MD&A—Liquidity Risk Profile” and “
Note 12—Regulatory and Capital Adequacy
.”
Basel III and United States Capital Rules
In December 2010, the Basel Committee on Banking Supervision (“Basel Committee”) published a framework for additional capital and liquidity requirements (“Basel III”), which included detailed capital ratios and buffers, subject to transition periods. The Federal Reserve, OCC and FDIC (collectively, the “Federal Banking Agencies”) issued a final rule that implemented Basel III and certain Dodd-Frank Act and other capital provisions and updated the prompt corrective action (“PCA”) framework to reflect the new regulatory capital minimums (“Basel III Capital Rule”). The Basel III Capital Rule increased the minimum capital that we and other institutions are required to hold. The Basel III Capital Rule includes the “Basel III Standardized Approach” and the “Basel III Advanced Approaches.”
The Basel III Advanced Approaches are mandatory for institutions with total consolidated assets of $250 billion or more or total consolidated on-balance-sheet foreign exposure of $10 billion or more. We became subject to the predecessor of these rules at the end of 2012. Prior to full implementation of the Basel III Advanced Approaches, however, a covered organization must complete a qualification period, known as the parallel run, during which it must demonstrate that it meets the requirements of the rule to the satisfaction of its primary United States banking regulator. We entered parallel run on January 1, 2015. A parallel run must last at least four quarters, but in practice United States banks have taken considerably longer to complete parallel runs.
Notwithstanding the Basel III Advanced Approaches, the Basel III Capital Rule also established a capital floor so that organizations subject to the Basel III Advanced Approaches may not hold less capital than would be required using the Basel III Standardized Approach capital calculations.
The Basel III Capital Rule revised the definition of regulatory capital, established a new common equity Tier 1 capital requirement, set higher minimum capital ratio requirements, introduced a new capital conservation buffer of 2.5%, introduced a new countercyclical capital buffer (currently set at 0.0%) and updated the PCA framework. Compliance with certain aspects of the Basel III Capital Rule went into effect for Capital One as of January 1, 2014, and other provisions have gone or will go into effect according to various start dates and phase-in periods. As of January 1, 2014, the minimum risk-based and leverage capital requirements for Advanced Approaches banking organizations included a common equity Tier 1 capital ratio of at least 4.0%, a Tier 1 risk-based capital ratio of at least 5.5%, a total risk-based capital ratio of at least 8.0% and a Tier 1 leverage capital ratio of at least 4.0%. On January 1, 2015, the minimum risk-based capital ratio requirements increased to 4.5% for the common equity Tier 1 capital ratio and to 6.0% for the Tier 1 risk-based capital ratio, and the minimum requirements for the total risk-based capital ratio and Tier 1 leverage capital ratio remained the same. Both the capital conservation buffer and the countercyclical capital buffer are being phased-in over a transition period of four years that commenced on January 1, 2016. On January 1, 2014, we began to use the Basel III Capital Rule, with transition provisions, to calculate our regulatory capital, including for purposes of calculating our regulatory capital ratios. On January 1, 2015, we began to use the Basel III Standardized Approach for calculating our risk-weighted assets in our regulatory capital ratios.
The Basel III Capital Rule also introduced a new supplementary leverage ratio for all Advanced Approaches banking organizations with a minimum requirement of 3.0%. The supplementary leverage ratio compares Tier 1 capital to total leverage exposure, which includes all on-balance sheet assets and certain off-balance sheet exposures, including derivatives and unused commitments. Given that we are in our Basel III Advanced Approaches parallel run, we calculate the ratio based on Tier 1 capital under the Standardized Approach. The minimum requirement for the supplementary leverage ratio became effective on January 1, 2018. As an Advanced Approaches banking organization, however, we were required to calculate and publicly disclose our supplementary leverage ratio beginning in the first quarter of 2015. For further information, see “MD&A—Capital Management.”
Global systemically important banks (“G-SIBs”) that are based in the United States are subject to an additional common equity Tier 1 capital requirement (“G-SIB Surcharge”). United States BHCs with total consolidated assets of $250 billion or more or total consolidated on-balance-sheet foreign exposure of $10 billion or more are required to determine annually whether they are considered to be a G-SIB for purposes of the G-SIB Surcharge. We are not a G-SIB based on the most recent available data and thus we are not subject to a G-SIB Surcharge.
In October 2017, the Federal Banking Agencies proposed certain limited changes to the Basel III Capital Rule. There is uncertainty regarding how any of the proposed changes may impact the Basel III Standardized Approach and the Basel III Advanced Approaches.
|
9
|
Capital One Financial Corporation (COF)
|
|
Additionally, in December 2017, the Basel Committee finalized certain modifications to the international Basel III capital standards, which would require rulemaking in the United States prior to becoming effective for United States banking organizations. There is uncertainty around which of those changes may be adopted in the United States and how those changes may impact the U.S. capital framework.
Market Risk Rule
The “Market Risk Rule” supplements both the Basel III Standardized Approach and the Basel III Advanced Approaches by requiring institutions subject to the Market Risk Rule to adjust their risk-based capital ratios to reflect the market risk in their trading portfolios. The Market Risk Rule generally applies to institutions with aggregate trading assets and liabilities equal to the lesser of:
|
•
|
10% or more of total assets; or
|
|
•
|
$1 billion or more.
|
As of December 31, 2017, the Company and CONA are subject to the Market Risk Rule. See “MD&A—Market Risk Profile” below for additional information.
Basel III and United States Liquidity Rules
The Basel Committee has published a liquidity framework, which includes two standards for liquidity risk supervision, each subject to observation periods and transitional arrangements. One standard, the liquidity coverage ratio (“LCR”), seeks to promote short-term resilience by requiring organizations to hold sufficient high-quality liquid assets to survive a stress scenario lasting for 30 days. The other standard, the net stable funding ratio (“NSFR”), seeks to promote longer-term resilience by requiring sufficient stable funding over a one-year period based on the liquidity characteristics of its assets and activities.
As implemented in the United States, the LCR Rule applies to institutions with total consolidated assets of $250 billion or more or total consolidated on-balance sheet foreign exposure of $10 billion or more, and their respective consolidated subsidiary depository institutions with $10 billion or more in total consolidated assets. As a result, the Company and the Banks are subject to the LCR Rule. The rule requires the Company and each of the Banks to hold an amount of eligible high-quality, liquid assets that equals or exceeds 100% of their respective projected net cash outflows over a 30-day period, each as calculated in accordance with the LCR Rule. The LCR Rule requires us to calculate the LCR daily as of July 1, 2016. Each company subject to the LCR Rule is required to make quarterly public disclosures of its LCR and certain related quantitative liquidity metrics, along with a qualitative discussion of its LCR. The Company is required to comply with these disclosure requirements beginning April 1, 2018.
In April 2016, the Federal Banking Agencies issued an interagency notice of proposed rulemaking regarding the U.S. implementation of the Basel III NSFR (the “Proposed NSFR”), which would apply to the same institutions subject to the LCR Rule. The Proposed NSFR would require us to maintain a sufficient amount of stable funding in relation to our assets, derivatives exposures and commitments over a one-year horizon period. While the Proposed NSFR is generally consistent with the Basel NSFR standard, it is more stringent in certain areas. The financial and operational impact on us of a final NSFR rule remains uncertain until a final rule is published. There is uncertainty regarding the timing and form of any final rule implementing the NSFR in the United States.
In general, U.S. implementation of the above capital and liquidity rules has increased capital and liquidity requirements for us. We will continue to monitor regulators’ implementation of the new capital and liquidity rules and assess the potential impact to us.
FDICIA and Prompt Corrective Action
The FDICIA requires Federal Banking Agencies to take “prompt corrective action” for banks that do not meet minimum capital requirements. The FDICIA establishes five capital ratio levels: well capitalized; adequately capitalized; undercapitalized; significantly undercapitalized; and critically undercapitalized. The three undercapitalized categories are based upon the amount by which a bank falls below the ratios applicable to an adequately capitalized institution. The capital categories are determined solely for purposes of applying the FDICIA’s PCA provisions, and such capital categories may not constitute an accurate representation of the Banks’ overall financial condition or prospects.
|
10
|
Capital One Financial Corporation (COF)
|
|
As noted above, the Basel III Capital Rule updated the PCA framework to reflect new, higher regulatory capital minimums. For an insured depository institution to be well capitalized, it must maintain a total risk-based capital ratio of 10% or more; a Tier 1 capital ratio of 8% or more; a common equity Tier 1 capital ratio of 6.5% or more; and a leverage ratio of 5% or more. An adequately capitalized depository institution must maintain a total risk-based capital ratio of 8% or more; a Tier 1 capital ratio of 6% or more; a common equity Tier 1 capital ratio of 4.5% or more; a leverage ratio of 4% or more; and, for Basel III Advanced Approaches institutions, a supplementary leverage ratio, which incorporates a broader set of exposures as noted above, of 3% or more. The revised PCA requirements became effective on January 1, 2015, other than the supplementary leverage ratio, which became effective on January 1, 2018.
Under applicable regulations for 2014, before the PCA requirements became effective, an insured depository institution was considered to be well capitalized if it maintained a total risk-based capital ratio of at least 10%, a Tier 1 risk-based capital ratio of at least 6%, a Tier 1 leverage capital ratio of at least 5% and was not subject to any supervisory agreement, order or directive to meet and maintain a specific capital level for any capital measure. The PCA provisions also authorize the Federal Banking Agencies to reclassify a bank’s capital category or take other action against banks that are determined to be in an unsafe or unsound condition or to have engaged in unsafe or unsound banking practices.
As an additional means to identify problems in the financial management of depository institutions, the FDICIA required the Federal Banking Agencies to establish certain non-capital safety and soundness standards. The standards relate generally to operations and management, asset quality, interest rate exposure and executive compensation. The Federal Banking Agencies are authorized to take action against institutions that fail to meet such standards.
Enhanced Prudential Standards and Other Requirements Under the Dodd-Frank Act
As a BHC with total consolidated assets of $50 billion or more (a “covered company”), we are subject under the Dodd-Frank Act to certain enhanced prudential standards, including requirements that may be recommended by the Financial Stability Oversight Council (“FSOC”) and implemented by the Federal Reserve and other regulators. As a result, we are subject to more stringent standards and requirements than those applicable to smaller institutions. The FSOC may also issue recommendations to the Federal Reserve or other primary financial regulatory agencies to apply new or enhanced standards to certain financial activities or practices.
The Federal Reserve and FDIC have issued rules requiring covered companies to implement resolution planning for orderly resolution in the event the Company faces material financial distress or failure. The FDIC issued similar rules regarding resolution planning applicable to the Banks. In addition, the OCC issued final guidelines in September 2016 that require the Banks to develop recovery plans detailing the actions they would take to remain a going concern when they experience considerable financial or operational stress, but have not deteriorated to the point that resolution is imminent.
The Federal Reserve established a rule that implements the requirement in the Dodd-Frank Act that the Federal Reserve conduct annual stress tests on the capacity of our capital to absorb losses as a result of adverse economic conditions. The stress test rule also implements the requirement that we conduct our own semiannual stress tests and requires us to publish the results of the stress tests on our website or other public forum. The OCC adopted a similar stress test rule to implement the requirement that each of the Banks conduct annual stress tests.
The Federal Reserve has finalized other rules implementing certain other aspects of the enhanced prudential standards under the Dodd-Frank Act, which were applicable to us beginning on January 1, 2015 (“Enhanced Standards Rule”). Under the Enhanced Standards Rule, we must meet liquidity risk management standards, conduct internal liquidity stress tests, and maintain a 30-day buffer of highly liquid assets, in each case, consistent with the requirements of the rule. These requirements are in addition to the LCR, discussed above in “Basel III and United States Liquidity Rules.” The Enhanced Standards Rule also requires that we comply with, and hold capital commensurate with, the requirements of, any regulations adopted by the Federal Reserve relating to capital planning and stress tests. Stress testing and capital planning regulations are discussed further below under “Dividends, Stock Repurchases and Transfers of Funds.” The Enhanced Standards Rule also requires that we establish and maintain an enterprise-wide risk management framework that includes a risk committee and a chief risk officer.
Although not a requirement of the Dodd-Frank Act, the OCC established regulatory guidelines (“Heightened Standards Guidelines”) that apply heightened standards for risk management to large institutions subject to its supervision, including the Banks. The Heightened Standards Guidelines establish standards for the development and implementation by the Banks of a risk governance framework.
|
11
|
Capital One Financial Corporation (COF)
|
|
Investment in the Company and the Banks
Certain acquisitions of our capital stock may be subject to regulatory approval or notice under federal or state law. Investors are responsible for ensuring that they do not, directly or indirectly, acquire shares of our capital stock in excess of the amount that can be acquired without regulatory approval, including under the BHC Act and the Change in Bank Control Act (“CIBC Act”).
Federal law and regulations prohibit any person or company from acquiring control of the Company or the Banks without, in most cases, prior written approval of the Federal Reserve or the OCC, as applicable. Control exists if, among other things, a person or company acquires more than 25% of any class of our voting stock or otherwise has a controlling influence over us. For a publicly traded BHC like us, a rebuttable presumption of control arises under the CIBC Act if a person or company acquires more than 10% of any class of our voting stock.
Additionally, COBNA and CONA are “banks” within the meaning of Chapter 13 of Title 6.1 of the Code of Virginia governing the acquisition of interests in Virginia financial institutions (“Financial Institution Holding Company Act”). The Financial Institution Holding Company Act prohibits any person or entity from acquiring, or making any public offer to acquire, control of a Virginia financial institution or its holding company without making application to, and receiving prior approval from, the Virginia Bureau of Financial Institutions.
Dividends, Stock Repurchases and Transfers of Funds
Under the Federal Reserve’s capital planning rules applicable to large BHCs including us (commonly referred to as Comprehensive Capital Analysis and Review or “CCAR”), a BHC with total consolidated assets of $50 billion or more must submit a capital plan to the Federal Reserve on an annual basis that contains a description of all planned capital actions, including dividends or stock repurchases, over a nine-quarter planning horizon beginning with the fourth quarter of the calendar year prior to the submission of the capital plan (“CCAR cycle”). A covered BHC may take the proposed capital actions if the Federal Reserve does not object to the plan.
Dodd-Frank Act stress testing, described above in “Enhanced Prudential Standards and Other Requirements under the Dodd-Frank Act,” is a complementary exercise to CCAR. It is a forward-looking exercise conducted by the Federal Reserve and covered financial companies to help assess whether a company has sufficient capital to absorb losses and support operations during adverse economic conditions. The supervisory stress test, after incorporating a firm’s planned capital actions, is used for quantitative assessment in CCAR.
As part of its evaluation of a large BHC’s capital plan, the Federal Reserve will consider how comprehensive the plan is, the reasonableness of the assumptions, analysis and methodologies used therein to assess capital adequacy and the ability of the BHC to maintain capital above each minimum regulatory capital ratio on a pro forma basis under expected and stressful conditions throughout a planning horizon of at least nine quarters. The annual CCAR cycle measures our capital levels under the Basel III Standardized Approach, with appropriate phase-in provisions applicable to Capital One. The Federal Reserve has indefinitely delayed incorporation of the Basel III Advanced Approaches into the capital planning and stress testing process. The Company must file its capital plan and stress testing results with the Federal Reserve by April 5, 2018, using data as of the end of the prior calendar year. The Federal Reserve is expected to provide its objection or non-objection to that capital plan the following June. The Federal Reserve’s objection or non-objection applies to planned capital actions from the third quarter of the year the capital plan is submitted through the end of the second quarter of the following year. The Company, along with other BHCs subject to the supplementary leverage ratio, must incorporate an estimate of its supplementary leverage ratio into its capital plan and stress tests.
For annual company-run stress tests, a covered BHC is required to disclose the results within 15 calendar days after the Federal Reserve discloses the results of the BHC’s supervisory stress test, unless that time period is extended by the Federal Reserve. For the mid-cycle company-run stress test, a BHC must disclose the results within 30 calendar days after the BHC submits the results of the test to the Federal Reserve, unless that time period is extended by the Federal Reserve.
The current capital planning and stress testing rules place supervisory focus on quarterly capital issuances and distributions by establishing a cumulative net distribution requirement. With certain limited exceptions, to the extent a BHC does not issue the amount of a given class of regulatory capital instrument that it projected in its capital plan, as measured on an aggregate basis beginning in the third quarter of the planning horizon, the BHC must reduce its capital distributions.
|
12
|
Capital One Financial Corporation (COF)
|
|
In January 2017, the Federal Reserve issued revisions to its capital planning and stress testing rules for the 2017 cycle. Among the provisions applicable to the Company, the revisions decrease the amount of capital a company subject to the quantitative requirements of CCAR can distribute to shareholders outside of an approved capital plan without seeking prior approval from the Federal Reserve (known as the “de minimis exception”). Beginning April 1, 2017, if a company does not receive an objection to its capital plan, it may distribute up to 0.25% of its Tier 1 capital above the distributions in its capital plan, a reduction from the 1% of Tier 1 capital permitted previously. The revisions also impose a “blackout period,” starting with the 2017 CCAR exercise, during the second calendar quarter on the ability of a firm subject to CCAR to submit prior notice of its intention to rely on the aforementioned de minimis exception or to submit a request for prior approval for a capital distribution that is not reflected in the firm’s capital plan for which it has received a non-objection from the Federal Reserve.
Historically, dividends from the Company’s direct and indirect subsidiaries have represented a major source of the funds we have used to pay dividends on our stock, make payments on corporate debt securities and meet our other obligations. There are various federal law limitations on the extent to which the Banks can finance or otherwise supply funds to us through dividends and loans. These limitations include minimum regulatory capital requirements, federal banking law requirements concerning the payment of dividends out of net profits or surplus, provisions of Sections 23A and 23B of the Federal Reserve Act and Regulation W governing transactions between an insured depository institution and its affiliates, as well as general federal regulatory oversight to prevent unsafe or unsound practices. In general, federal and applicable state banking laws prohibit insured depository institutions, such as the Banks, from making dividend distributions without first obtaining regulatory approval if such distributions are not paid out of available earnings or would cause the institution to fail to meet applicable capital adequacy standards.
Deposit Insurance Assessments
Each of CONA and COBNA, as an insured depository institution, is a member of the DIF maintained by the FDIC. Through the DIF, the FDIC insures the deposits of insured depository institutions up to prescribed limits for each depositor. The FDIC sets a Designated Reserve Ratio (“DRR”) for the DIF. To maintain the DIF, member institutions may be assessed an insurance premium, and the FDIC may take action to increase insurance premiums if the DRR falls below its required level.
The Dodd-Frank Act reformed the management of the DIF in several ways. It raised the minimum DRR to 1.35% (from the former minimum of 1.15%); removed the upper limit on the DRR; required that the reserve ratio reach 1.35% by September 30, 2020; required the FDIC, when setting deposit insurance assessments, to offset the effect on small insured depository institutions of meeting the increased reserve ratio; and eliminated the requirement that the FDIC pay dividends from the DIF when the reserve ratio reached certain levels. The FDIC has set the DRR at 2% and, in lieu of dividends, has established progressively lower assessment rate schedules as the reserve ratio meets certain trigger levels. The Dodd-Frank Act also required the FDIC to change the deposit insurance assessment base from deposits to average total consolidated assets minus average tangible equity.
On March 15, 2016, the FDIC issued a final rule implementing Section 334(e) of the Dodd-Frank Act, which requires the FDIC to offset the effect on community banks of increasing the DIF reserve ratio from 1.15% to 1.35%. The rule imposes a new quarterly deposit insurance surcharge assessment, with an annual rate of 4.5 basis points, on insured depository institutions with assets of $10 billion or more, including the Banks. On August 30, 2016, the FDIC provided notice that the DIF Reserve Ratio exceeded the 1.15% threshold level, which triggered two changes in the deposit insurance assessments of the Banks. First, the initial assessment rates for all insured depository institutions, including the Banks, declined. Second, the surcharge assessment was applied. The FDIC has estimated that the reserve ratio will reach 1.35% in 2018; however, under the final rule, if the reserve ratio does not reach 1.35% by December 31, 2018, the FDIC will impose a one-time shortfall assessment on March 31, 2019 on depository institutions subject to the surcharge, including the Banks.
Source of Strength and Liability for Commonly Controlled Institutions
Under regulations issued by the Federal Reserve, a BHC must serve as a source of financial and managerial strength to its subsidiary banks (the so-called “source of strength doctrine”). The Dodd-Frank Act codified this doctrine.
Under the “cross-guarantee” provision of the Financial Institutions Reform, Recovery and Enforcement Act of 1989 (“FIRREA”), insured depository institutions such as the Banks may be liable to the FDIC with respect to any loss incurred, or reasonably anticipated to be incurred, by the FDIC in connection with the default of, or FDIC assistance to, any commonly controlled insured depository institution. The Banks are commonly controlled within the meaning of the FIRREA cross-guarantee provision.
|
13
|
Capital One Financial Corporation (COF)
|
|
FDIC Orderly Liquidation Authority
The Dodd-Frank Act provides the FDIC with liquidation authority that may be used to liquidate nonbank financial companies and BHCs if the Treasury Secretary, in consultation with the President and based on the recommendation of the Federal Reserve and another federal agency, determines that doing so is necessary, among other criteria, to mitigate serious adverse effects on United States financial stability. Upon such a determination, the FDIC would be appointed receiver and must liquidate the company in a way that mitigates significant risks to financial stability and minimizes moral hazard. The costs of a liquidation of a financial company would be borne by shareholders and unsecured creditors and then, if necessary, by risk-based assessments on large financial companies. The FDIC has issued rules implementing certain provisions of its liquidation authority and may issue additional rules in the future.
Regulation of Businesses by Authorities Outside the United States
COBNA is subject to regulation in foreign jurisdictions where it operates, currently in the United Kingdom and Canada.
United Kingdom
In the United Kingdom, COBNA operates through COEP, which was established in 2000 and is an authorized payment institution regulated by the Financial Conduct Authority (“FCA”) under the Payment Services Regulations 2009 and the Financial Services and Markets Act 2000. COEP’s indirect parent, Capital One Global Corporation, is wholly-owned by COBNA and is subject to regulation by the Federal Reserve as an “agreement corporation” under the Federal Reserve’s Regulation K.
Regulatory focus on Payment Protection Insurance (“PPI”) complaint handling has continued and PPI continues to be a key driver of consumer complaints to the Financial Ombudsman Service (“FOS”). In March 2017, following a period of extensive consultation, FCA announced that new rules in relation to PPI complaint handling would come into force on August 29, 2017. The new rules introduced: a 2-year deadline for PPI complaints to be brought against firms under the FCA complaint handling rules; rules setting out how firms should handle unfair relationship complaints about the non-disclosure of commission on the sale of PPI (following the court decision in
Plevin v
.
Paragon Personal Finance
(“Plevin Complaints”)); a requirement that by November 29, 2017 firms write to previously rejected PPI complainants that fall within the unfair relationship timelines to tell them of their right to raise a Plevin Complaint; and an FCA led, multi-channel communications campaign to raise customer awareness of the deadline and new complaint handling rules. The new rules are now in force and COEP is handling complaints under the new rules. A number of claims management firms and law firms are threatening to pursue Plevin Complaints via the courts, rather than as complaints, to try and secure a higher level of redress.
The FCA’s Credit Card Market Study continued throughout 2017 and will run into early 2018 before the FCA publishes final remedies and rules, with implementation expected to begin by the end of the second quarter of 2018 and through the course of the year.
On January 13, 2018, the new Payment Services Regulations 2017 (so called “PSD2” or “PSRs”) came into force following a 2-year implementation period after PSD2 became law in the European Union (“EU”) in January 2016. The new legislation replaces the previous Payment Services Regulations in its entirety; however, the principal effect of PSD2 is to improve consumer protection against fraud, possible abuses and payment incidents through enhanced security requirements through new Regulated Technical Standards on secure authentication, promote competition/innovation through new players and the development of innovative mobile and internet payments in Europe, and require COEP to adopt specific procedures for responding to Payments Services complaints. In particular, PSD2 requires banks and financial service providers to open up their systems to Payment Initiation Services (“PISPs”) (software bridges between a merchant website and online banking platform or payer’s bank) and Account Information Services (“AISPs”) (online services to provide consolidated information on one or more payment account, or account aggregation services).
The new data protection Regulation (so called “General Data Protection Regulation” or “GDPR”) on the protection of individuals’ personal data will come into force on May 25, 2018. GDPR brings heightened scrutiny of data processing activities and higher fines and sanctions for non-compliance with data protection legislation. In addition, the GDPR widens the territorial scope of EU privacy rules to organizations located outside the EU if they offer goods or services to or monitor EU citizen behaviors and introduces new compliance obligations, including financial penalties for noncompliance. The U.K. and the organizations in the U.K. are working to implement GDPR’s requirements with a view for the country to obtain “Adequacy” status from the EU, reflecting a view that the U.K. protects personal data at a substantially equivalent level to the EU. Adequacy status would allow the free movement of data between the European Economic Area and the U.K. after Brexit, as defined below.
|
14
|
Capital One Financial Corporation (COF)
|
|
Following a public referendum in mid-2016, the U.K. will leave the EU (“Brexit”). The U.K.’s negotiation with the EU on the terms of its departure and the U.K.’s subsequent relationship with the EU will continue throughout 2018 with no final decisions being made on any terms of the negotiation until all elements of it have been concluded. It is widely expected that the U.K. will enter into a transitional relationship with the EU after leaving the EU (scheduled currently for March 2019) during which time all current regulations and laws would remain applicable.
Canada
In Canada, COBNA operates as an authorized foreign bank pursuant to the Bank Act (Canada) (“Bank Act”) and is permitted to conduct its credit card business in Canada through its Canadian branch, Capital One Bank (Canada Branch) (“Capital One Canada”). The primary regulator of Capital One Canada is the Office of the Superintendent of Financial Institutions Canada. Other regulators include the Financial Consumer Agency of Canada, the Office of the Privacy Commissioner of Canada, and the Financial Transactions and Reports Analysis Centre of Canada. Capital One Canada is subject to regulation under various Canadian federal laws, including the Bank Act and its regulations, the Proceeds of Crime (Money Laundering) and Terrorist Financing Act and the Personal Information Protection and Electronic Documents Act.
In April 2015, a voluntary agreement to reduce interchange fees among the Canadian federal government, MasterCard Canada and Visa Canada came into effect. The agreement contains a commitment to reduce interchange fees for consumer credit cards to an average of 1.5% and will remain in effect for 5 years. Although the Canadian federal government acknowledges independent audit findings that Visa and MasterCard have met their commitments to reduce interchange fees pursuant to the 5-year agreement terminating in 2020, the government is currently conducting a further assessment of interchange fees.
|
EMPLOYEES
|
A central part of our philosophy is to attract and retain highly capable staff. We had approximately
49,300
employees, whom we refer to as “associates,” as of
December 31, 2017
. None of our associates are covered under a collective bargaining agreement, and management considers our associate relations to be satisfactory.
|
ADDITIONAL INFORMATION
|
Technology/Systems
We leverage information and technology to achieve our business objectives and to develop and deliver products and services that satisfy our customers’ needs. A key part of our strategic focus is the development and use of efficient, flexible computer and operational systems, such as cloud technology, to support complex marketing and account management strategies, the servicing of our customers, and the development of new and diversified products. We believe that the continued development and integration of these systems is an important part of our efforts to reduce costs, improve quality and provide faster, more flexible technology services. Consequently, we continuously review capabilities and develop or acquire systems, processes and competencies to meet our unique business requirements.
As part of our continuous efforts to review and improve our technologies, we may either develop such capabilities internally or rely on third-party outsourcers who have the ability to deliver technology that is of higher quality, lower cost, or both. We continue to rely on third-party outsourcers to help us deliver systems and operational infrastructure. These relationships include (but are not limited to): Amazon Web Services, Inc. (“AWS”) for our cloud infrastructure, Total System Services, Inc. (“TSYS”) for processing services for our North American and U.K. portfolios of consumer, commercial and small business credit card accounts, Fidelity Information Services (“FIS”) for certain of our banking systems and International Business Machines Corporation (“IBM”) for mainframe managed services.
We safeguard our information and technology to reduce risk, implement backup and recovery systems, and generally require the same of our third-party service providers. We take measures that mitigate against known attacks and use internal and external resources to scan for vulnerabilities in platforms, systems, and applications necessary for delivering Capital One products and services.
Intellectual Property
As part of our overall and ongoing strategy to protect and enhance our intellectual property, we rely on a variety of protections, including copyrights, trademarks, trade secrets, patents and certain restrictions on disclosure, solicitation and competition. We also undertake other measures to control access to, or distribution of, our other proprietary information. Despite these precautions, it may be possible for a third party to copy or otherwise obtain and use certain intellectual property or proprietary information without authorization. Our precautions may not prevent misappropriation or infringement of our intellectual property or proprietary information. In addition, our competitors and other third parties also file patent applications for innovations that are used in our industry. The ability of our competitors and other third parties to obtain such patents may adversely affect our ability to compete. Conversely, our ability to obtain such patents may increase our competitive advantage and/or preserve our freedom to operate certain technologies via cross-licenses or other arrangements with third parties. There can be no assurance that we will be successful in such efforts, or that the ability of our competitors to obtain such patents may not adversely impact our financial results.
|
15
|
Capital One Financial Corporation (COF)
|
|
|
FORWARD-LOOKING STATEMENTS
|
From time to time, we have made and will make forward-looking statements, including those that discuss, among other things, strategies, goals, outlook or other non-historical matters; projections, revenues, income, returns, expenses, capital measures, accruals for claims in litigation and for other claims against us; earnings per share or other financial measures for us; future financial and operating results; our plans, objectives, expectations and intentions; and the assumptions that underlie these matters.
To the extent that any such information is forward-looking, it is intended to fit within the safe harbor for forward-looking information provided by the Private Securities Litigation Reform Act of 1995.
Numerous factors could cause our actual results to differ materially from those described in such forward-looking statements, including, among other things:
|
•
|
general economic and business conditions in the U.S., the U.K., Canada or our local markets, including conditions affecting employment levels, interest rates, collateral values, consumer income, credit worthiness and confidence, spending and savings that may affect consumer bankruptcies, defaults, charge-offs and deposit activity;
|
|
•
|
an increase or decrease in credit losses, including increases due to a worsening of general economic conditions in the credit environment, and the impact of inaccurate estimates or inadequate reserves;
|
|
•
|
compliance with financial, legal, regulatory, tax or accounting changes or actions, including the impacts of the Tax Act, the Dodd-Frank Act, and other regulations governing bank capital and liquidity standards;
|
|
•
|
developments, changes or actions relating to any litigation, governmental investigation or regulatory enforcement action or matter involving us;
|
|
•
|
the inability to sustain revenue and earnings growth;
|
|
•
|
increases or decreases in interest rates;
|
|
•
|
our ability to access the capital markets at attractive rates and terms to capitalize and fund our operations and future growth;
|
|
•
|
increases or decreases in our aggregate loan balances or the number of customers and the growth rate and composition thereof, including increases or decreases resulting from factors such as shifting product mix, amount of actual marketing expenses we incur and attrition of loan balances;
|
|
•
|
the amount and rate of deposit growth;
|
|
•
|
our ability to execute on our strategic and operational plans;
|
|
•
|
our response to competitive pressures;
|
|
•
|
changes in retail distribution strategies and channels, including the emergence of new technologies and product delivery systems;
|
|
•
|
the success of our marketing efforts in attracting and retaining customers;
|
|
•
|
changes in the reputation of, or expectations regarding, the financial services industry or us with respect to practices, products or financial condition;
|
|
•
|
any significant disruption in our operations or in the technology platforms on which we rely, including cybersecurity, business continuity and related operational risks, as well as other security failures or breaches of our systems or those of our customers, partners, service providers or other third parties;
|
|
•
|
our ability to maintain a compliance and technology infrastructure suitable for the nature of our business;
|
|
•
|
our ability to develop and adapt to rapid changes in digital technology to address the needs of our customers and comply with applicable regulatory standards, including our increasing reliance on third party infrastructure and compliance with data protection and privacy standards;
|
|
16
|
Capital One Financial Corporation (COF)
|
|
|
•
|
the effectiveness of our risk management strategies;
|
|
•
|
our ability to control costs, including the amount of, and rate of growth in, our expenses as our business develops or changes or as it expands into new market areas;
|
|
•
|
the extensive use, reliability and accuracy of the models and data we rely on in our business;
|
|
•
|
our ability to recruit and retain talented and experienced personnel;
|
|
•
|
the impact from, and our ability to respond to, natural disasters and other catastrophic events, including hurricanes Harvey and Irma;
|
|
•
|
changes in the labor and employment markets;
|
|
•
|
fraud or misconduct by our customers, employees, business partners or third parties;
|
|
•
|
merchants’ increasing focus on the fees charged by credit card networks; and
|
|
•
|
other risk factors identified from time to time in our public disclosures, including in the reports that we file with the SEC.
|
Forward-looking statements often use words such as “will,” “anticipate,” “target,” “expect,” “estimate,” “intend,” “plan,” “goal,” “believe” or other words of similar meaning. Any forward-looking statements made by us or on our behalf speak only as of the date they are made or as of the date indicated, and we do not undertake any obligation to update forward-looking statements as a result of new information, future events or otherwise. For additional information on factors that could materially influence forward-looking statements included in this Report, see the risk factors set forth under “Part I—Item 1A.
Risk Factors
” in this report. You should carefully consider the factors discussed above, and in our Risk Factors or other disclosure, in evaluating these forward-looking statements.
|
17
|
Capital One Financial Corporation (COF)
|
|
Item 1A.
Risk Factors
This section highlights specific risks that could affect our business. Although we have tried to discuss all material risks of which we are aware at the time this Report has been filed, other risks may prove to be important in the future, including those that are not currently ascertainable. In addition to the factors discussed elsewhere in this Report, other factors that could cause actual results to differ materially from our forward-looking statements include:
General Economic and Market Risks
Changes And Instability In The Macroeconomic Environment May Adversely Affect Our Industry, Business, Results Of Operations And Financial Condition.
We offer a broad array of financial products and services to consumers, small businesses and commercial clients. We market our credit card products on a national basis throughout the United States, Canada and the United Kingdom and offer banking and other services in many regions within the United States. A prolonged period of economic volatility, slow growth, or a significant deterioration in economic conditions, in the United States or one of these countries could have a material adverse effect on our financial condition and results of operations as customers default on their loans or maintain lower deposit levels or, in the case of credit card accounts, carry lower balances and reduce credit card purchase activity.
Some of the risks we may face in connection with adverse changes and instability in macroeconomic environment include the following:
|
•
|
Payment patterns may change, causing increases in delinquencies and default rates, which could have a negative impact on our results of operations. In addition, changes in consumer confidence levels and behavior, including decreased consumer spending, lower demand for credit and a shift in consumer payment behavior towards avoiding late fees, finance charges and other fees, could have a negative impact on our results of operations.
|
|
•
|
Increases in bankruptcies could cause increases in our charge-off rates, which could have a negative impact on our results of operations.
|
|
•
|
Our ability to recover debt that we have previously charged-off may be limited, which could have a negative impact on our results of operations.
|
|
•
|
The process and models we use to estimate our allowance for loan and lease losses may become less reliable if volatile economic conditions, changes in the competitive environment, significant changes in customer behavior or other unexpected variations in key inputs and assumptions cause actual losses to diverge from the projections of our models. As a result, our estimates for credit losses may become increasingly subject to management’s judgment and high levels of volatility over short periods of time, which could negatively impact our results of operations. See “
There Are Risks Resulting From The Extensive Use Of Models and Data In Our Business.
”
|
|
•
|
Risks associated with financial market instability and volatility could cause a material adverse effect on our liquidity and our funding costs. For example, increases in interest rates and our credit spreads could negatively impact our results of operations.
|
|
•
|
Our ability to borrow from other financial institutions or to engage in funding transactions on favorable terms or at all could be adversely affected by disruptions in the capital markets or other events, including actions by rating agencies and deteriorating investor expectations, which could limit our access to funding.
|
|
•
|
While interest rates have risen from historic lows set in 2016, both shorter-term and longer-term interest rates remain below long-term historical averages and the yield curve has been relatively flat compared to past periods. A flat yield curve combined with low interest rates generally leads to lower revenue and reduced margins because it tends to limit our ability to increase the spread between asset yields and funding costs. Sustained periods of time with a flat yield curve coupled with low interest rates could have a material adverse effect on our earnings and our net interest margin.
|
|
18
|
Capital One Financial Corporation (COF)
|
|
Regulatory Risk
Compliance With New And Existing Laws, Regulations And Regulatory Expectations May Increase Our Costs, Reduce Our Revenue, Limit Our Ability To Pursue Business Opportunities And Increase Compliance Challenges.
Legislation and regulation with respect to the financial services industry has increased in recent years, and we expect that oversight of our business may continue to expand in scope and complexity. A wide array of banking and consumer lending laws apply to almost every aspect of our business. Failure to comply with these laws and regulations could result in financial, structural and operational penalties, including significant fines and criminal sanctions, and could result in negative publicity or damage to our reputation with regulators or the public. In addition, establishing systems and processes to achieve compliance with these laws and regulations may increase our costs and limit our ability to pursue certain business opportunities.
We are subject to heightened regulatory oversight by the federal banking regulators to ensure that we build systems and processes that are commensurate with the nature of our business and that meet the heightened risk management and enhanced prudential standards issued by our regulators. For example, over the last several years, state and federal regulators have focused on compliance with the Bank Secrecy Act and anti-money laundering laws, data integrity and security, use of service providers, fair lending and other consumer protection issues. In July 2015, Capital One entered into a consent order with the OCC to address concerns about our anti-money laundering (“AML”) program (“AML Program”). Although we are making substantial progress in taking the steps and making the improvements required by the OCC consent order, we expect heightened oversight of our AML Program will continue for the foreseeable future.
The Dodd-Frank Act, other regulatory reforms and implementing regulations have increased our need to develop, monitor and maintain compliance processes and infrastructure and to otherwise enhance our risk management throughout all aspects of our business. The cumulative impact of these changes also includes higher expectations for the amount of capital and liquidity we must maintain, as discussed in more detail below under the heading “
We May Not Be Able To Maintain Adequate Capital Or Liquidity Levels, Which Could Have A Negative Impact On Our Financial Results And Our Ability To Return Capital To Our Shareholders
,” and higher operational costs, which may further increase as regulators continue to implement such reforms. United States government agencies charged with adopting and interpreting laws, rules and regulations, including under the Dodd-Frank Act, may do so in an unforeseen manner, including in ways that potentially expand the impact of such laws, rules or regulations on us more than initially contemplated or currently anticipated. Both Congress and the regulators continue to review the laws and regulations that could have impacts beyond those initially contemplated or currently anticipated.
We have a large number of customer accounts in our credit card and auto lending businesses and we have made the strategic choice to originate and service subprime credit cards and auto loans which typically have higher delinquencies and charge-offs than prime customers. Accordingly, we have significant involvement with credit bureau reporting and the collection and recovery of delinquent and charged-off debt, primarily through customer communications, the filing of litigation against customers in default, the periodic sale of charged-off debt and vehicle repossession. The banking industry is subject to enhanced legal and regulatory scrutiny regarding credit bureau reporting and debt collection practices from regulators, courts and legislators. Any future changes to our business practices in these areas, including our debt collection practices, whether mandated by regulators, courts, legislators or otherwise, or any legal liabilities resulting from our business practices, including our debt collection practices, could have a material adverse impact on our financial condition.
The legislative and regulatory environment is beyond our control, may change rapidly and unpredictably and may negatively influence our revenue, costs, earnings, growth, liquidity and capital levels. In addition, some rules and regulations may be subject to litigation or other challenges that delay or modify their implementation and impact on us. For example, the Tax Act has resulted in material impacts to our results of operations due to changes to the valuation of our deferred tax assets, the valuation of other tax assets, and tax expense, and may affect customer behavior and our ability to forecast our effective tax rate. Many aspects of the Tax Act are unclear and may not be clarified for some time. As a result, we have not yet been able to determine the full impact of the new laws on our business, operating results and financial condition. For example, in the United Kingdom and Europe, continued regulatory uncertainty or changes arising from Brexit negotiations could adversely affect our U.K. operations.
Certain laws and regulations, and any interpretations and applications with respect thereto, may benefit consumers, borrowers and depositors, but not shareholders. Our success depends on our ability to maintain compliance with both existing and new laws and regulations. For a description of the material laws and regulations to which we are subject, please refer to “Part I—Item 1. Business—Supervision and Regulation.”
|
19
|
Capital One Financial Corporation (COF)
|
|
Credit Risk
We May Experience Increased Delinquencies, Credit Losses, Inaccurate Estimates And Inadequate Reserves.
Like other lenders, we face the risk that our customers will not repay their loans. A customer’s ability and willingness to repay us can be negatively impacted by increases in their payment obligations to other lenders, whether as a result of higher debt levels or rising interest rates, or by restricted availability of credit generally. We may fail to quickly identify customers that are likely to default on their payment obligations and reduce our exposure by closing credit lines and restricting authorizations, which could adversely impact our financial condition and results of operations. Our ability to manage credit risk also may be adversely affected by legal or regulatory changes (such as restrictions on collections, bankruptcy laws, minimum payment regulations and re-age guidance), competitors' actions and consumer behavior, as well as inadequate collections staffing, techniques and models.
Rising losses or leading indicators of rising losses (such as higher delinquencies, higher rates of non-performing loans, higher bankruptcy rates, lower collateral values or elevated unemployment rates) may require us to increase our allowance for loan and lease losses, which may degrade our profitability if we are unable to raise revenue or reduce costs to compensate for higher losses. In particular, we face the following risks in this area:
|
•
|
Missed Payments:
Our customers may miss payments. Loan charge-offs (including from bankruptcies) are generally preceded by missed payments or other indications of worsening financial condition for our customers. Customers are more likely to miss payments during an economic downturn or prolonged periods of slow economic growth. In addition, we face the risk that consumer and commercial customer behavior may change (for example, an increase in the unwillingness or inability of customers to repay debt, which may be heightened by increasing interest rates or levels of consumer debt generally), causing a long-term rise in delinquencies and charge-offs.
|
|
•
|
Estimates of Inherent Losses:
The credit quality of our portfolio can have a significant impact on our earnings. We allow for and reserve against credit risks based on our assessment of credit losses inherent in our loan portfolios. This process, which is critical to our financial results and condition, requires complex judgments, including forecasts of economic conditions. We may underestimate our inherent losses and fail to hold an allowance for loan and lease losses sufficient to account for these losses. Incorrect assumptions could lead to material underestimations of inherent losses and inadequate allowance for loan and lease losses. In cases where we modify a loan, if the modifications do not perform as anticipated we may be required to build additional allowance on these loans. The build or release of allowances impacts our current financial results.
|
|
•
|
Underwriting:
Our ability to accurately assess the creditworthiness of our customers may diminish, which could result in an increase in our credit losses and a deterioration of our returns. See “
Our Risk Management Strategies May Not Be Fully Effective In Mitigating Our Risk Exposures In All Market Environments Or Against All Types Of Risk
.”
|
|
•
|
Business Mix:
We engage in a diverse mix of businesses with a broad range of potential credit exposure. Our business mix could change in ways that could adversely affect the credit quality of our portfolio. Because we originate a relatively greater proportion of consumer loans in our loan portfolio compared to other large bank peers and originate both prime and subprime credit card accounts and auto loans, we may experience higher delinquencies and a greater number of accounts charging off compared to other large bank peers, which could result in increased credit losses, operating costs and regulatory scrutiny.
|
|
•
|
Charge-off Recognition / Allowance for Loan and Lease Losses:
We account for the allowance for loan and lease losses according to accounting and regulatory guidelines and rules, including Financial Accounting Standards Board (“FASB”) standards and the Federal Financial Institutions Examination Council (“FFIEC”) Account Management Guidance. In June 2016, the FASB issued revised guidance for impairments on financial instruments. The guidance, which becomes effective on January 1, 2020, with early adoption permitted no earlier than January 1, 2019, requires use of a current expected credit loss (“CECL”) model that is based on expected rather than incurred losses. Adoption of the CECL model could require changes in our account management or allowance for loan and lease losses practices, and may cause our allowance for loan and lease losses and credit losses to change materially.
|
|
•
|
Industry Developments:
Our charge-off and delinquency rates may be negatively impacted by industry developments, including new regulations applicable to our industry.
|
|
20
|
Capital One Financial Corporation (COF)
|
|
|
•
|
Collateral:
The collateral we have on secured loans could be insufficient to compensate us for loan losses. When customers default on their secured loans, we attempt to recover collateral where permissible and appropriate. However, the value of the collateral may not be sufficient to compensate us for the amount of the unpaid loan, and we may be unsuccessful in recovering the remaining balance from our customers. Decreases in real estate values adversely affect the collateral value for our commercial lending activities, while the auto business is similarly exposed to collateral risks arising from the auction markets that determine used car prices. Therefore, the recovery of such property could be insufficient to compensate us for the value of these loans. Borrowers may be less likely to continue making payments on loans if the value of the property used as collateral for the loan is less than what the borrower owes, even if the borrower is still financially able to make the payments. Trends in home prices are a driver of credit costs in our home loan business as they impact both the probability of default and the loss severity of defaults. Additionally, the potential volatility in the number of defaulted and modified loans from changes in home prices can create material impacts on the servicing costs of the business, fluctuations in credit marks and profitability in acquired portfolios and volatility in mortgage servicing rights valuations. Although home prices have generally appreciated recently, the slow economic recovery, shifts in monetary policy and potentially diminishing demands from investors could threaten or limit the recovery. In our auto business, if vehicle prices experience declines, we could be adversely affected. For example, business and economic conditions that negatively affect household incomes, housing prices, and consumer behavior related to our businesses could decrease (i) the demand for new and used vehicles and (ii) the value of the collateral underlying our portfolio of auto loans, which could cause the number of consumers who become delinquent or default on their loans to increase.
|
|
•
|
Geographic and Industry Concentration:
Although our consumer lending is geographically diversified, approximately 30% of our commercial loan portfolio is concentrated in the tri-state area of New York, New Jersey and Connecticut. The regional economic conditions in the tri-state area affect the demand for our commercial products and services as well as the ability of our customers to repay their commercial loans and the value of the collateral securing these loans. An economic downturn or prolonged period of slow economic growth in, or a catastrophic event that disproportionately affects, the tri-state area could have a material adverse effect on the performance of our commercial loan portfolio and our results of operations. In addition, our Commercial Banking strategy includes an industry-specific focus. If any of the industries that we focus on experience changes, we may experience increased credit losses and our results of operations could be adversely impacted. For example, as of
December 31, 2017
, energy-related loan balances represented approximately
4%
of our total commercial loan portfolio. This amount is comprised of loans to commercial entities in the energy industry, such as exploration and production, oil field services, and pipeline transportation of gas and crude oil, as well as loans to entities in industries that are indirectly impacted by energy prices, such as petroleum wholesalers, oil and gas equipment manufacturing, air transportation, and petroleum bulk stations and terminals. In recent years, oil prices have fluctuated significantly, which has impacted many of the borrowers in this portfolio and the value of the collateral securing our loans to these borrowers. A prolonged period of declining oil prices could impair their ability to service loans outstanding to them and/or reduce demand for loans. If energy-related industries or any of the other industries that we focus on experience adverse changes, we may experience increased credit losses and our results of operations could be adversely impacted.
|
Capital and Liquidity Risk
We May Not Be Able To Maintain Adequate Capital Or Liquidity Levels, Which Could Have A Negative Impact On Our Financial Results And Our Ability To Return Capital To Our Shareholders.
As a result of the Dodd-Frank Act and the United States implementation of international accords, financial institutions are subject to new and increased capital and liquidity requirements, and we expect further changes to these regulations. Although United States regulators have finalized regulations for many of these requirements, continued uncertainty remains as to the form additional new requirements will take or how and when they will apply to us. As a result, it is possible that we could be required to increase our capital and/or liquidity levels above the levels assumed in our current financial plans. These new requirements could have a negative impact on our ability to lend, grow deposit balances or make acquisitions and limit our ability to make most capital distributions. Higher capital levels also lower our return on equity.
In addition, as described further above in “Part I—Item 1. Business—Supervision and Regulation,” for regulatory capital purposes we entered parallel run on January 1, 2015. We will become subject to the Basel III Advanced Approaches framework for purposes of determining our regulatory capital requirements once we receive regulatory approval to do so, although the exact timing of when such approval may be granted is uncertain. Although we have current estimates of risk-weighted asset calculations under that framework, there remains uncertainty around future regulatory interpretations of certain aspects of those calculations. Moreover, the so-called Collins Amendment to the Dodd-Frank Act, as implemented in the Basel III Capital Rule, establishes a capital floor so that organizations subject to the Basel III Advanced Approaches may not hold less capital than would be required using the
|
21
|
Capital One Financial Corporation (COF)
|
|
Basel III Standardized Approach capital calculations. Additionally, in December 2017 the Basel Committee on Banking Supervision finalized certain modifications to the international Basel III capital standards which, if implemented by the United States federal banking agencies, could alter regulatory capital requirements. Therefore, we cannot assure you that our current estimates will be correct, and we may need to hold significantly more regulatory capital in the future than we currently estimate to maintain a given capital ratio.
In April 2016, the United States federal banking agencies proposed a rule regarding the United States implementation of the net stable funding ratio (“Proposed NSFR”). See “Part I—Item 1. Business—Supervision and Regulation” for further details regarding the Proposed NSFR. The financial and operational impact on us of a final NSFR rule remains uncertain until a final rule is published, and there is uncertainty as to the combined impact of the existing Liquidity Coverage Ratio and any final NSFR on how we manage our business. See “
Note 12—Regulatory and Capital Adequacy
” and “Part I—Item 1. Business—Supervision and Regulation—Dividends, Stock Repurchases and Transfers of Funds” for additional information regarding recent developments in capital and liquidity requirements.
We consider various factors in the management of capital, including the impact of stress on our capital levels, as determined by both our internal modeling and the Federal Reserve’s modeling of our capital position in supervisory stress tests and CCAR. There can be significant differences between our modeling and the Federal Reserve’s estimates for a given scenario and between the capital needs suggested by our internal bank holding company scenarios relative to the supervisory scenarios. Therefore, although our estimated capital levels under stress disclosed as part of the CCAR or DFAST processes may suggest that we have substantial capacity to return capital to shareholders and remain well capitalized under stress, the Federal Reserve’s modeling, our own modeling of another scenario or other factors related to our capital management process may result in a materially lower capacity to return capital to shareholders than that indicated by the projections released in the CCAR or DFAST processes. This in turn could lead to restrictions on our ability to pay dividends and engage in share repurchase transactions. See “Part I—Item 1. Business—Supervision and Regulation” for additional information.
Operational Risk
We Face Risks Related To Our Operational, Technological And Organizational Infrastructure.
Our ability to retain and attract new customers depends on our ability to build or acquire necessary operational, technological and organizational infrastructure or adapt to technological advances involving such infrastructure, which can be a challenge due to the fast pace of digital transformation and advances. We are embedding technology, data and software development deeply into our business model and how we work.
Similar to other large corporations, we are exposed to operational risk that can manifest itself in many ways, such as errors related to failed or inadequate processes, inaccurate models, faulty or disabled computer systems, fraud by employees or persons outside of our company and exposure to external events. In addition, we are heavily dependent on the security, capability and continuous availability of the technology systems that we use to manage our internal financial and other systems, interface with our customers and develop and implement effective marketing campaigns.
In addition, our businesses are dependent on our ability to process, record and monitor a large number of complex transactions. If any of our financial, accounting or other data processing systems fail or have other significant shortcomings, our business and reputation could be materially adversely affected. We may also be subject to disruptions of our operating systems arising from events that are wholly or partially beyond our control, which may include, for example, computer viruses or electrical or telecommunications outages, design flaws in foundational components or platforms, availability and quality of vulnerability patches from key vendors, cyber-attacks, including Distributed Denial of Service (“DDOS”) attacks discussed below, natural disasters, other damage to property or physical assets or events arising from local or larger scale politics, including terrorist acts. Any of these occurrences could diminish our ability to operate our businesses, service customer accounts and protect customers’ information, or result in potential liability to customers, reputational damage, regulatory intervention and customers’ loss of confidence in our businesses, any of which could result in a material adverse effect.
We also rely on the business infrastructure and systems of third parties with which we do business and to whom we outsource the maintenance and development of operational and technological functionality. For example, we have migrated a number of, and intend to migrate substantially all, of our core systems and customer-facing applications to third-party cloud infrastructure platforms such as Amazon Web Services, Inc. If we do not execute the transition or administer these new environments in a well-managed, secure and effective manner, we may experience unplanned service disruption or unforeseen costs which may harm our business and operating results. We must successfully develop and maintain information, financial reporting, data-protection and other
|
22
|
Capital One Financial Corporation (COF)
|
|
controls adapted to our reliance on new platforms and providers. In addition, our cloud infrastructure providers, or other service providers, could experience system breakdowns or failures, outages, downtime, cyber-attacks, adverse changes to financial condition, bankruptcy or other adverse conditions, which could have a material adverse effect on our business and reputation. Thus, the substantial amount of our infrastructure that we outsource to “the cloud” or to other third parties may increase our risk exposure.
Our ability to develop and deliver new products that meet the needs of our existing customers and attract new ones and to run our business in compliance with applicable laws and regulations depends on the functionality and reliability of our operational and technology systems. Any disruptions, failures or inaccuracies of our operational and technology systems and models, including those associated with improvements or modifications to such systems and models, could cause us to be unable to market and manage our products and services, manage our risk, meet our regulatory obligations or report our financial results in a timely and accurate manner, all of which could have a negative impact on our results of operations. In addition, our ongoing investments in infrastructure, which are necessary to maintain a competitive business, integrate acquisitions and establish scalable operations, may increase our expenses. As our business develops, changes or expands, additional expenses can arise as a result of a reevaluation of business strategies, management of outsourced services, asset purchases or other acquisitions, structural reorganization, compliance with new laws or regulations or the integration of newly acquired businesses. If we are unable to successfully manage our expenses, our financial results will be negatively affected.
We Could Incur Increased Costs, Reductions In Revenue And Suffer Reputational Damage And Business Disruptions In The Event Of The Theft, Loss Or Misuse Of Information, Including As A Result Of A Cyber-Attack.
Our products and services involve the gathering, management, processing, storage and transmission of sensitive and confidential information regarding our customers and their accounts, our employees and other third parties with which we do business. Our ability to provide such products and services, many of which are web-based, depends upon the management and safeguarding of information, software, methodologies and business secrets. To provide these products and services to, as well as communicate with, our customers, we rely on information systems and infrastructure, including digital technologies, computer and email systems, software, networks and other web-based technologies, that we and third-party service providers operate. We also have arrangements in place with third parties through which we share and receive information about their customers who are or may become our customers.
Like other financial services firms, technologies, systems, networks and devices of Capital One or our customers, employees, service providers or other third parties with whom we interact continue to be the subject of attempted unauthorized access, mishandling or misuse of information, denial-of-service attacks, computer viruses, website defacement, hacking, malware, ransomware, phishing or other forms of social engineering, and other forms of cyber-attacks designed to obtain confidential information, destroy data, disrupt or degrade service, sabotage systems or cause other damage, and other events. These threats may derive from human error, fraud or malice on the part of our employees, insiders or third parties or may result from accidental technological failure. Any of these parties may also attempt to fraudulently induce employees, customers or other third-party users of our systems to disclose sensitive information in order to gain access to our data or that of our customers or third parties with whom we interact. Further, cyber and information security risks for large financial institutions like us have generally increased in recent years in part because of the proliferation of new technologies, the use of the Internet and telecommunications technologies to conduct financial transactions and the increased sophistication and activities of organized crime, perpetrators of fraud, hackers, terrorists, activists, formal and informal instrumentalities of foreign governments and other external parties. In addition, to access our products and services, our customers may use computers, smartphones, tablet PCs and other mobile devices that are beyond our security control systems.
As a financial institution, we are subject to and examined for compliance with an array of data protection laws, regulations and guidance, as well as to our own internal privacy and information security policies and programs. However, because the methods and techniques employed by perpetrators of fraud and others to attack, disable, degrade or sabotage platforms, systems and applications change frequently, are increasingly sophisticated and often are not fully recognized or understood until after they have occurred, and some techniques could occur and persist for an extended period of time before being detected, we and our third-party service providers and partners may be unable to anticipate or identify certain attack methods in order to implement effective preventative measures or mitigate or remediate the damages caused in a timely manner. We may also be unable to hire and develop talent capable of detecting, mitigating or remediating these risks. Although we believe we have a robust suite of authentication and layered information security controls, including our cyber threat analytics, data encryption and tokenization technologies, anti-malware defenses and vulnerability management program, any one or combination of these controls could fail to detect, mitigate or remediate these risks in a timely manner. We may face an increasing number of attempted cyber-attacks as we expand our
|
23
|
Capital One Financial Corporation (COF)
|
|
mobile- and other internet-based products and services, as well as our usage of mobile and cloud technologies and as we provide more of these services to a greater number of retail clients.
A disruption or breach, including as a result of a cyber-attack, or media reports of perceived security vulnerabilities at Capital One or at third-party service providers, could result in significant legal and financial exposure, regulatory intervention, remediation costs, card reissuance, supervisory liability, damage to our reputation or loss of confidence in the security of our systems, products and services that could adversely affect our business. We and other U.S. financial services providers continue to be targeted with evolving and adaptive cybersecurity threats from sophisticated third parties. Although we have not experienced any material losses relating to cyber incidents, there can be no assurance that unauthorized access or cyber incidents will not occur or that we will not suffer such losses in the future. Unauthorized access or cyber incidents could occur more frequently and on a more significant scale. If future attacks like these are successful or if customers are unable to access their accounts online for other reasons, it could adversely impact our ability to service customer accounts or loans, complete financial transactions for our customers or otherwise operate any of our businesses or services. In addition, a breach or attack affecting one of our third-party service providers or partners could harm our business even if we do not control the service that is attacked.
In addition, the increasing prevalence and the evolution of cyber-attacks and other efforts to breach or disrupt our systems or those of our partners, retailers or other market participants has led, and will likely continue to lead, to increased costs to us with respect to preventing, mitigating and remediating these risks, as well as any related attempted fraud. We may be required to expend significant additional resources to continue to modify or strengthen our protective security measures, investigate and remediate any vulnerabilities of our information systems and infrastructure or invest in new technology designed to mitigate security risks. For example, various retailers have continued to be victims of cyber-attacks in which customer data, including debit and credit card information, was obtained. In these situations, we incur a variety of costs, including those associated with replacing the compromised cards and remediating fraudulent transaction activity. Further, successful cyber-attacks at other large financial institutions or other market participants, whether or not we are impacted, could lead to a general loss of customer confidence in financial institutions that could negatively affect us, including harming the market perception of the effectiveness of our security measures or the financial system in general which could result in reduced use of our financial products. Though we have insurance against some cyber-risks and attacks, it may not be sufficient to offset the impact of a material loss event.
Our Exposure To Potential Data Protection and Privacy Incidents, And Our Required Compliance With Regulations Related To These Areas, May Increase Our Costs, Reduce Our Revenue And Limit Our Ability To Pursue Business Opportunities.
If our information systems or infrastructure or those of our customers, partners, service providers or other market participants experience a significant disruption or breach, it could lead, depending on the nature of the disruption or breach, to the unauthorized access to and release, gathering, monitoring, misuse, loss or destruction of personal or confidential data about our customers, employees or other third parties in our possession. Any party that obtains this personal or confidential data through a breach or disruption may use this information for ransom, to be paid by us or a third-party, as part of a fraudulent activity that is part of a broader criminal activity, or for other illicit purposes. Further, such disruption or breach could also result in unauthorized access to our proprietary information, intellectual property, software, methodologies and business secrets and in unauthorized transactions in Capital One accounts or unauthorized access to personal or confidential information maintained by those entities. For example, there has been a significant proliferation of consumer information available on the Internet resulting from breaches of third-party entities, including personal information, log-in credentials and authentication data. While Capital One was not directly involved in these third-party breach events, the stolen information can create a vulnerability for our customers if their Capital One log-in credentials are the same as or similar to the credentials that have been compromised on other sites. This vulnerability could include the risk of unauthorized account access, data loss and fraud. The use of automation software, or “bots,” can increase the velocity and efficacy of these types of attacks. A data protection incident, or media reports of perceived security vulnerabilities at Capital One or at third-party service providers, could result in significant legal and financial exposure, regulatory intervention, remediation costs, card reissuance, supervisory liability, damage to our reputation or loss of confidence in the security of our systems, products and services that could adversely affect our business.
We regularly move data across national borders to conduct our operations, and consequently are subject to a variety of continuously evolving and developing laws and regulations in the United States and abroad regarding privacy, data protection, and data security, including those related to the collection, storage, handling, use, disclosure, transfer, and security of personal data. Significant uncertainty exists as privacy and data protection laws may be interpreted and applied differently from country to country and may create inconsistent or conflicting requirements. For example, the GDPR, which becomes effective in May 2018, extends the scope of the EU data protection law to all companies processing data of EU residents, regardless of the company’s location. The law requires companies to meet new requirements regarding the handling of personal data, including new rights such as the “portability” of personal data. Our efforts to comply with GDPR and other privacy and data protection laws may entail substantial expenses,
|
24
|
Capital One Financial Corporation (COF)
|
|
may divert resources from other initiatives and projects, and could limit the services we are able to offer. Furthermore, enforcement actions and investigations by regulatory authorities related to data security incidents and privacy violations continue to increase. The enactment of more restrictive laws, rules, regulations, or future enforcement actions or investigations could impact us through increased costs or restrictions on our business, and noncompliance could result in regulatory penalties and significant legal liability.
Legal Risk
Our Businesses Are Subject To The Risk Of Increased Litigation, Government Investigations And Regulatory Enforcement.
Our businesses are subject to increased litigation, government investigations and other regulatory enforcement risks as a result of a number of factors and from various sources, including the highly regulated nature of the financial services industry, the focus of state and federal prosecutors on banks and the financial services industry, the structure of the credit card industry and business practices in the mortgage business. Given the inherent uncertainties involved in litigation, government investigations and regulatory enforcement decisions, and the very large or indeterminate damages sought in some matters asserted against us, there can be significant uncertainty as to the ultimate liability we may incur from these kinds of matters. The finding, or even the assertion, of substantial legal liability against us could have a material adverse effect on our business and financial condition and could cause significant reputational harm to us, which could seriously harm our business.
In addition, financial institutions, including us, have faced significant regulatory scrutiny over the past several years, which has increasingly led to public enforcement actions. We and our subsidiaries are subject to comprehensive regulation and periodic examination by the Federal Reserve, the SEC, OCC, FDIC and CFPB. We have been subject to enforcement actions by many of these and other regulators and may continue to be involved in such actions, including governmental inquiries, investigations and enforcement proceedings, including by the Department of Justice and state Attorneys General. We expect that regulators and governmental enforcement bodies will continue taking formal enforcement actions against financial institutions in addition to addressing supervisory concerns through non-public supervisory actions or findings, which could involve restrictions on our activities, among other limitations that could adversely affect our business. In addition, a violation of law or regulation by another financial institution is likely to give rise to an investigation by regulators and other governmental agencies of the same or similar practices by us. For example, various regulatory and governmental agencies initiated an industry-wide supervisory initiative regarding sales practices and sales incentive compensation structures following a public enforcement action at another financial institution. In addition, a single event may give rise to numerous and overlapping investigations and proceedings. These and other initiatives from governmental authorities and officials may subject us to further judgments, settlements, fines or penalties, or cause us to restructure our operations and activities or to cease offering certain products or services, all of which could harm our reputation or lead to higher operational costs. Litigation, government investigations and other regulatory actions could involve restrictions on our activities, generally subject us to significant fines, increased expenses, restrictions on our activities and damage to our reputation and our brand, and could adversely affect our business, financial condition and results of operations.
Other Business Risks
We Face Intense Competition In All Of Our Markets.
We operate in a highly competitive environment, whether in making loans, attracting deposits or in the global payments industry, and we expect competitive conditions to continue to intensify with respect to most of our products. We compete on the basis of the rates we pay on deposits and the rates and other terms we charge on the loans we originate or purchase, as well as the quality and range of our customer service, products, innovation and experience. This increasingly competitive environment is primarily a result of changes in technology, product delivery systems and regulation, as well as the emergence of new or significantly larger financial service providers, all of which may affect our customers’ expectations and demands.
Some of our competitors, including new and emerging competitors in the digital and mobile payments space and other financial technology providers, are not subject to the same regulatory requirements or legislative scrutiny to which we are subject, which also could place us at a competitive disadvantage, in particular in the development of new technology platforms or the ability to rapidly innovate. We compete with many forms of payments offered by both bank and non-bank providers, including a variety of new and evolving alternative payment mechanisms, systems and products, such as aggregators and web-based and wireless payment platforms or technologies, digital currencies, prepaid systems and payment services targeting users of social networks and online gaming (including, for example, those offering payment through mobile phone accounts). If we are unable to continue to keep pace with innovation, our business and results of operations could be adversely affected.
Some of our competitors are substantially larger than we are, which may give those competitors advantages, including a more diversified product and customer base, the ability to reach out to more customers and potential customers, operational efficiencies,
|
25
|
Capital One Financial Corporation (COF)
|
|
broad-based local distribution capabilities, lower-cost funding and larger existing branch networks. Many of our competitors are also focusing on cross-selling their products and developing new products or technologies, which could affect our ability to maintain or grow existing customer relationships or require us to offer lower interest rates or fees on our lending products or higher interest rates on deposits. Price competition for loans might result in origination of fewer loans or earning less on our loans.
As of
December 31, 2017
, we operate the largest online direct bank in the U.S. by deposits. While direct banking represents a significant opportunity to attract new customers that value greater and more flexible access to banking services at reduced costs, we face strong competition in the direct banking market. Aggressive pricing throughout the industry may adversely affect the retention of existing balances and the cost-efficient acquisition of new deposit funds and may affect our growth and profitability. In addition, the effects of a competitive environment may be exacerbated by the flexibility of direct banking and the increasing financial and technological sophistication of our customer base. Customers could also close their online accounts or reduce balances or deposits in favor of products and services offered by competitors for other reasons. These shifts, which could be rapid, could result from general dissatisfaction with our products or services, including concerns over pricing, online security or our reputation.
In our credit card business, competition for rewards customers may result in higher rewards expenses, or we may fail to attract new customers or retain existing rewards customers due to increasing competition for these consumers. We have expanded our credit card partnership business over the past several years with the additions of a number of credit card partnerships. The market for key business partners, especially in the credit card business, is very competitive, and we may not be able to grow or maintain these partner relationships. We face the risk that we could lose partner relationships, even after we have invested significant resources, time and expense into acquiring and developing the relationships. The loss of any of our key business partners could have a negative impact on our results of operations, including lower returns, excess operating expense and excess funding capacity.
Some of our competitors have developed, or may develop, substantially greater financial and other resources than we have, may offer richer value propositions or a wider range of programs and services than we offer or may use more effective advertising, marketing or cross-selling strategies to acquire and retain more customers, capture a greater share of spending and borrowings, attain and develop more attractive cobrand card programs and maintain greater merchant acceptance than we have. We may not be able to compete effectively against these threats or respond or adapt to changes in consumer spending habits as effectively as our competitors.
In such a competitive environment, we may lose entire accounts or may lose account balances to competing firms, or we may find it more costly to maintain our existing customer base. Customer attrition from any or all of our lending products, together with any lowering of interest rates or fees that we might implement to retain customers, could reduce our revenues and therefore our earnings. Similarly, unexpected customer attrition from our deposit products, in addition to an increase in rates or services that we may offer to retain deposits, may increase our expenses and therefore reduce our earnings.
Our Business, Financial Condition And Results Of Operations May Be Adversely Affected By Merchants’ Increasing Focus On The Fees Charged By Credit Card Networks And By Regulation And Legislation Impacting Such Fees.
Credit card interchange fees are generally one of the largest components of the costs that merchants pay in connection with the acceptance of credit cards and are a meaningful source of revenue for our credit card businesses. Interchange fees are the subject of significant and intense global legal, regulatory and legislative focus, and the resulting decisions, regulations and legislation may have a material adverse impact on our overall business, financial condition and results of operations.
Regulators and legislative bodies in a number of countries are seeking to reduce credit card interchange fees through legislation, competition-related regulatory proceedings, central bank regulation and or litigation. Interchange reimbursement rates in the United States are set by credit card networks such as MasterCard and Visa. In some jurisdictions, such as Canada and certain countries in the European Union, interchange fees and related practices are subject to regulatory activity that have limited the ability of certain networks to establish default rates, including in some cases imposing caps on permissible interchange fees. We have already experienced these impacts in our international credit card portfolio. Legislators and regulators around the world are aware of each other’s approaches to the regulation of the payments industry. Consequently, a development in one country, state or region may influence regulatory approaches in another, such as our primary market, the United States.
In addition to this regulatory activity, merchants are also seeking avenues to reduce interchange fees. During the past few years, merchants and their trade groups have filed numerous lawsuits against Visa, MasterCard, American Express and their card-issuing banks, claiming that their practices toward merchants, including interchange and similar fees, violate federal antitrust laws. In 2005, a number of entities filed antitrust lawsuits against MasterCard and Visa and several member banks, including our subsidiaries and us, alleging among other things, that the defendants conspired to fix the level of interchange fees. In December 2013, the U.S.
|
26
|
Capital One Financial Corporation (COF)
|
|
District Court for the Eastern District of New York granted final approval of the proposed class settlement. The settlement provided, among other things, that merchants would be entitled to join together to negotiate lower interchange fees. The settlement was appealed to the Second Circuit Court of Appeals, which rejected the settlement in June 2016; this litigation remains ongoing. See “
Note 19—Commitments, Contingencies, Guarantees and Others
” for further details.
Some major retailers may have sufficient bargaining power to independently negotiate lower interchange fees with MasterCard and Visa, which could, in turn, result in lower interchange fees for us when our cardholders undertake purchase transactions with these retailers. In 2016, some of the largest merchants individually negotiated lower interchange rates with MasterCard and/or Visa. These and other merchants also continue to lobby aggressively for caps and restrictions on interchange fees and there can be no assurance that their efforts will not be successful or that they will not in the future bring legal proceedings against us or other credit card and debit card issuers and networks.
Beyond pursuing litigation, legislation and regulation, merchants may also promote forms of payment with lower fees, such as ACH-based payments, or seek to impose surcharges at the point of sale for use of credit or debit cards. New payment systems, particularly mobile-based payment technologies, could also gain widespread adoption and lead to issuer transaction fees or the displacement of credit card accounts as a payment method.
The heightened focus by merchants and regulatory and legislative bodies on the fees charged by credit and debit card networks, and the ability of certain merchants to successfully negotiate discounts to interchange fees with MasterCard and Visa or develop alternative payment systems could result in a reduction of interchange fees. Any resulting loss in income to us could have a material adverse effect on our business, financial condition and results of operations.
If We Are Not Able To Invest Successfully In And Introduce Digital And Other Technological Developments Across All Our Businesses, Our Financial Performance May Suffer.
Our industry is subject to rapid and significant technological changes and our ability to meet our customers’ needs and expectations is key to our ability to grow revenue and earnings. We expect digital technologies to have a significant impact on banking over time. Consumers increasingly expect robust digital experiences from their financial services providers. The ability for customers to access their accounts and conduct financial transactions using digital technology, including mobile applications, is an increasingly important aspect of the financial services industry and it impacts our ability to deliver products and services to our customers. To that end, financial institutions are rapidly introducing new digital and other technology-driven products and services, which aim to offer a better customer experience and to reduce costs. We continue to invest in digital technology designed to attract new customers, facilitate the ability of existing customers to conduct financial transactions and enhance the customer experience related to our products and services.
Our continued success depends, in part, upon our ability to address the needs of our customers by using digital technology to provide products and services that efficiently meet their expectations in a cost-effective manner. The development and launch of new digital products and services depends in large part on our capacity to invest in and build the technology platforms that can enable them. We continue to actively invest in such technology platforms, however, we may fail to implement the correct technology, or may fail to do so in a timely manner as discussed in more detail above under the headings “
We Face Intense Competition In All Of Our Markets
”
and “
We Face Risks Related To Our Operational, Technological And Organizational Infrastructure.
”
Some of our competitors are substantially larger than we are, which may allow those competitors to invest more money into their technology infrastructure and digital innovation than we do. In addition, we face intense competition from smaller companies which experience lower cost structures and different regulatory requirements and scrutiny than we do, and which may allow them to innovate more rapidly than we can. See “
We Face Intense Competition In All Of Our Markets.
” Further, our success depends on our ability to attract and retain strong digital and technology leaders, engineers and other talent, and competition for such talent is intense. If we are unable to attract and retain digital and technology talent, our ability to offer digital products and services and build the necessary technology infrastructure could be negatively affected, which could negatively impact our business and financial results. A failure to maintain or enhance our competitive position with respect to digital products and services, whether because we fail to anticipate customer expectations or because our technological developments fail to perform as desired or are not implemented in a timely or successful manner, could negatively impact our business and financial results.
We May Fail To Realize All Of The Anticipated Benefits Of Our Mergers, Acquisitions And Strategic Partnerships.
We have engaged in merger and acquisition activity and entered into strategic partnerships over the past several years and may continue to engage in such activity in the future. We continue to evaluate and anticipate engaging in, among other merger and acquisition activity, additional strategic partnerships and selected acquisitions of financial institutions and other financial assets,
|
27
|
Capital One Financial Corporation (COF)
|
|
including credit card and other loan portfolios. There can be no assurance that we will be able to identify and secure future acquisition targets on terms and conditions that are acceptable to us, or successfully complete proposed mergers, acquisitions and strategic partnerships, which could impair our growth.
Any merger, acquisition or strategic partnership we undertake entails certain risks, which may materially and adversely affect our results of operations. If we experience greater than anticipated costs to integrate acquired businesses into our existing operations, or are not able to achieve the anticipated benefits of any merger, acquisition or strategic partnership, including cost savings and other synergies, our business could be negatively affected. In addition, it is possible that the ongoing integration processes could result in the loss of key employees, errors or delays in systems implementation, the disruption of our ongoing businesses or inconsistencies in standards, controls, procedures and policies that adversely affect our ability to maintain relationships with partners, clients, customers, depositors and employees or to achieve the anticipated benefits of any merger, acquisition or strategic partnership. Integration efforts also may divert management attention and resources. These integration matters may have an adverse effect on us during any transition period.
In addition, we may face the following risks in connection with any merger, acquisition or strategic partnership:
|
•
|
New Businesses and Geographic or Other Markets:
Our merger, acquisition or strategic partnership activity may involve our entry into new businesses and new geographic areas or other markets which present risks resulting from our relative inexperience in these new businesses or markets. These new businesses or markets may change the overall character of our consolidated portfolio of businesses and could react differently to economic and other external factors. We face the risk that we will not be successful in these new businesses or in these new markets.
|
|
•
|
Identification and Assessment of Merger and Acquisition Targets and Deployment of Acquired Assets:
We cannot assure you that we will identify or acquire suitable financial assets or institutions to supplement our organic growth through acquisitions or strategic partnerships. In addition, we may incorrectly assess the asset quality and value of the particular assets or institutions we acquire. Further, our ability to achieve the anticipated benefits of any merger, acquisition or strategic partnership will depend on our ability to assess the asset quality and value of the particular assets or institutions we partner with, merge with or acquire. We may be unable to profitably deploy any assets we acquire.
|
|
•
|
Accuracy of Assumptions:
In connection with any merger, acquisition or strategic partnership, we may make certain assumptions relating to the proposed merger, acquisition or strategic partnership that may be, or may prove to be, inaccurate, including as a result of the failure to realize the expected benefits of any merger, acquisition or strategic partnership. The inaccuracy of any assumptions we may make could result in unanticipated consequences that could have a material adverse effect on our results of operations or financial condition.
|
|
•
|
Target-specific Risk:
Assets and companies that we acquire, or companies that we enter into strategic partnerships with, will have their own risks that are specific to a particular asset or company. These risks include, but are not limited to, particular or specific regulatory, accounting, operational, reputational and industry risks, any of which could have a material adverse effect on our results of operations or financial condition. Indemnification rights, if any, may be insufficient to compensate us for any losses or damages resulting from such risks. In addition to regulatory approvals discussed above, certain of our merger, acquisition or partnership activity may require third-party consents in order for us to fully realize the anticipated benefits of any such transaction.
|
|
•
|
Conditions to Regulatory Approval
: Certain acquisitions may not be consummated without obtaining approvals from one or more of our regulators. We cannot be certain when or if, or on what terms and conditions, any required regulatory approvals will be granted. Consequently, we might be required to sell portions of acquired assets as a condition to receiving regulatory approval or we may not obtain regulatory approval for a proposed acquisition on acceptable terms or at all, in which case we would not be able to complete the acquisition despite the time and expenses invested in pursuing it.
|
Reputational Risk And Social Factors May Impact Our Results And Damage Our Brand.
Our ability to originate and maintain accounts is highly dependent upon the perceptions of consumer and commercial borrowers and deposit holders and other external perceptions of our business and compliance practices or our financial health. In addition, our brand has historically been, and we expect it to continue to be, very important to us. Maintaining and enhancing our brand will depend largely on our ability to continue to provide high-quality products and services. Adverse perceptions regarding our reputation in the consumer, commercial and funding markets could lead to difficulties in generating and maintaining accounts as well as in financing them. In particular, negative public perceptions regarding our reputation could lead to decreases in the levels of deposits that consumer and commercial customers and potential customers choose to maintain with us or significantly increase
|
28
|
Capital One Financial Corporation (COF)
|
|
the costs of attracting and retaining customers. In addition, negative perceptions regarding certain industries or clients could also prompt us to cease business activities associated with those industries or clients.
Negative public opinion or damage to our brand could also result from actual or alleged conduct in any number of activities or circumstances, including lending practices, regulatory compliance, security breaches (including the use and protection of customer information), corporate governance, and sales and marketing, and from actions taken by regulators or other persons in response to such conduct. Such conduct could fall short of our customers’ and the public’s heightened expectations of companies of our size with rigorous data, privacy and compliance practices, and could further harm our reputation. In addition, third parties with whom we have important relationships may take actions over which we have limited control that could negatively impact perceptions about us or the financial services industry. The proliferation of social media may increase the likelihood that negative public opinion from any of the events discussed above will impact our reputation and business.
In addition, a variety of social factors may cause changes in borrowing activity, including credit card use, payment patterns and the rate of defaults by accountholders and borrowers domestically and internationally. These social factors include changes in consumer confidence levels, the public’s perception regarding the banking industry and consumer debt, including credit card use, and changing attitudes about the stigma of bankruptcy. If consumers develop or maintain negative attitudes about incurring debt, or if consumption trends decline or if we fail to maintain and enhance our brand, or we incur significant expenses in this effort, our business and financial results could be materially and negatively affected.
If We Are Not Able To Protect Our Intellectual Property, Our Revenue And Profitability Could Be Negatively Affected.
We rely on a variety of measures to protect and enhance our intellectual property, including copyrights, trademarks, trade secrets, patents and certain restrictions on disclosure, solicitation and competition. We also undertake other measures to control access to and distribution of our other proprietary information. These measures may not prevent misappropriation of our proprietary information or infringement of our intellectual property rights and a resulting loss of competitive advantage. In addition, our competitors or other third parties may file patent applications for innovations that are used in our industry or allege that our systems, processes or technologies infringe on their intellectual property rights. If our competitors or other third parties are successful in obtaining such patents or prevail in intellectual property-related litigation against us, we could lose significant revenues, incur significant license, royalty or technology development expenses, or pay significant damages.
There Are Risks Resulting From The Extensive Use Of Models and Data In Our Business.
We rely on quantitative models, and our ability to manage data and our ability to aggregate data in an accurate and timely manner, to assess and manage our various risk exposures and to estimate certain financial values. Models may be used in such processes as determining the pricing of various products, grading loans and extending credit, measuring interest rate and other market risks, predicting losses, assessing capital adequacy and calculating economic and regulatory capital levels, as well as to estimate the value of financial instruments and balance sheet items. Our risk reporting and management, including business decisions based on information incorporating models, depend on the effectiveness of our models and our policies, programs, processes and practices governing how data is acquired, validated, stored, protected, processed and analyzed. Any issues with the quality or effectiveness of our data aggregation and validation procedures, as well as the quality and integrity of data inputs, could result in ineffective risk management practices or inaccurate risk reporting. For example, models based on historical data sets might not be accurate predictors of future outcomes and their ability to appropriately predict future outcomes may degrade over time. While we continuously update our policies, programs, processes and practices, many of our data management and aggregation processes are manual and subject to human error or system failure. Failure to manage data effectively and to aggregate data in an accurate and timely manner may limit our ability to manage current and emerging risk, to produce accurate financial, regulatory and operational reporting as well as to manage changing business needs. If our risk management framework proves ineffective, we could suffer unexpected losses which could materially adversely affect our results of operation or financial condition. Also, information we provide to the public or to our regulators based on poorly designed or implemented models could be inaccurate or misleading. Some of the decisions that our regulators make, including those related to capital distribution to our shareholders, could be affected adversely due to the perception that the quality of the models used to generate the relevant information is insufficient.
Our Risk Management Strategies May Not Be Fully Effective In Mitigating Our Risk Exposures In All Market Environments Or Against All Types Of Risk.
Management of risk, including market, credit, liquidity, compliance and strategic risks, requires, among other things, policies and procedures to properly record and verify a large number of transactions and events. See “MD&A—Risk Management” for further details. We have devoted significant resources to developing our risk management policies and procedures and expect to continue
|
29
|
Capital One Financial Corporation (COF)
|
|
to do so in the future. Nonetheless, our risk management strategies may not be fully effective in identifying and mitigating our risk exposure in all market environments or against all types of risk, including risks that are unidentified or unanticipated, even if our models for assessing risk are properly designed and implemented.
Some of our methods of managing risk are based upon our use of observed historical market behavior and management’s judgment. These methods may not accurately predict future exposures, which could be significantly greater than the historical measures indicate. For example, market conditions during the financial crisis involved unprecedented dislocations and highlight the limitations inherent in using historical information to manage risk. In addition, credit risk is inherent in the financial services business and results from, among other things, extending credit to customers. Our ability to assess the creditworthiness of our customers may be impaired if the models and approaches we use to select, manage and underwrite our consumer and commercial customers become less predictive of future charge-offs (due, for example, to rapid changes in the economy, including the unemployment rate).
While we employ a broad and diversified set of risk monitoring and risk mitigation techniques, those techniques and the judgments that accompany their application cannot anticipate every economic and financial outcome or the timing of such outcomes. For example, our ability to implement our risk management strategies may be hindered by adverse changes in the volatility or liquidity conditions in certain markets and as a result, may limit our ability to distribute such risks (for instance, when we seek to syndicate exposure in bridge financing transactions we have underwritten). We may, therefore, incur losses in the course of our risk management or investing activities.
Changes In Consumer Behavior And Their Adoption of Digital Technology May Change Retail Distribution Strategies And May Adversely Impact Our Investments In Our Bank Premises And Equipment And Other Retail Distribution Assets, Lead To Increased Expenditures And Expose Us To Additional Risk.
We have significant investments in bank premises and equipment for our branch network and other branch banking assets including our banking centers, parcels of land held for the development of future banking centers and our retail work force. Advances in technology such as digital and mobile banking, in-branch self-service technologies, proximity or remote payment technologies, as well as progressively changing customer preferences for these other methods of banking, could decrease the value of our branch network or other retail distribution assets. As a result, we may need to further change our retail distribution strategy and close, sell and/or renovate additional branches or parcels of land held for development and restructure or reduce our remaining branches and work force. These actions could lead to losses on these assets or could adversely impact the carrying value of other long-lived assets, reduce our revenues, increase our expenditures, dilute our brand and/or reduce customer demand for our products and services.
Further, to the extent that we change our retail distribution strategy and as a result expand into new business areas, we may face more competitors with more experience in the new business areas and more established relationships with relevant customers, regulators and industry participants, which could adversely affect our ability to compete. Our competitors may also be subject to less burdensome regulations. See
“We Face Intense Competition In All Our Markets.”
Fluctuations In Market Interest Rates Or Volatility In The Capital Markets Could Adversely Affect Our Income And Expense, The Value Of Assets And Obligations, Our Regulatory Capital, Cost Of Capital Or Our Liquidity.
Like other financial institutions, our business may be sensitive to market interest rate movement and the performance of the capital markets. Disruptions, uncertainty or volatility across the capital markets could negatively impact market liquidity and limit our access to funding required to operate and grow our business. In addition, changes in interest rates or in valuations in the debt or equity markets could directly impact us. For example, we borrow money from other institutions and depositors, which we use to make loans to customers and invest in debt securities and other earning assets. We earn interest on these loans and assets and pay interest on the money we borrow from institutions and depositors. The interest rates that we pay on the securities we have issued are also influenced by, among other things, applicable credit ratings from recognized rating agencies. A downgrade to any of these credit ratings could affect our ability to access the capital markets, increase our borrowing costs and have a negative impact on our results of operations. Increased charge-offs, rising London Interbank Offering Rate (“LIBOR”) and other events may cause our securitization transactions to amortize earlier than scheduled, which could accelerate our need for additional funding from other sources. Fluctuations in interest rates, including changes in the relationship between short-term rates and long-term rates and in the relationship between our funding basis rate and our lending basis rate, may have negative impacts on our net interest income and therefore our earnings.
|
30
|
Capital One Financial Corporation (COF)
|
|
In addition, interest rate fluctuations and competitor responses to those changes may affect the rate of customer prepayments for mortgage, auto and other term loans and may affect the balances customers carry on their credit cards. Although recent increases in interest rates may reduce prepayment risk, debt service requirements for some of our borrowers will increase, which may adversely affect those borrowers’ ability to pay as contractually obligated. This could result in additional delinquencies or charge-offs and negatively impact our results of operations. These changes can reduce the overall yield on our earning asset portfolio. Changes in interest rates and competitor responses to these changes may also impact customer decisions to maintain balances in the deposit accounts they have with us. An inability to attract or maintain deposits could materially affect our ability to fund our business and our liquidity position. Many other financial institutions have increased their reliance on deposit funding and, as such, we expect continued competition in the deposit markets. We cannot predict how this competition will affect our costs. If we are required to offer higher interest rates to attract or maintain deposits, our funding costs will be adversely impacted. Changes in valuations in the debt and equity markets could have a negative impact on the assets we hold in our investment portfolio. Such market changes could also have a negative impact on the valuation of assets for which we provide servicing. Finally, the Basel III Capital Rule requires that most amounts reported in Accumulated Other Comprehensive Income (“AOCI”), including
unrealized gains and losses on securities designated as available for sale
,
be included in our regulatory capital calculations. Changes in interest rates or market valuations that result in unrealized losses on components of AOCI could therefore impact our regulatory capital ratios negatively.
As a result of recent regulatory and other legal proceedings, actions by regulators or law enforcement agencies may result in changes to the manner in which LIBOR is determined or the establishment of alternative reference rates for floating rate debt. Uncertainty as to the nature of potential changes, alternative reference rates or other reforms may adversely affect the trading market for LIBOR-based securities. In addition, any changes in the method pursuant to which LIBOR is determined may result in a sudden or prolonged increase or decrease in LIBOR. If that were to occur, the level of interest payments and the value of LIBOR-indexed debt may be affected. Uncertainty as to the extent and manner of future changes may adversely affect the current trading market for LIBOR based securities.
We assess our interest rate risk by estimating the effect on our earnings under various scenarios that differ based on assumptions about the direction and the magnitude of interest rate changes. We take risk mitigation actions based on those assessments. We face the risk that changes in interest rates could materially reduce our net interest income and our earnings, especially if actual conditions turn out to be materially different than those we assumed. See “MD&A—Market Risk Profile” for additional information.
Our Business Could Be Negatively Affected If We Are Unable To Attract, Retain And Motivate Skilled Senior Leaders.
Our success depends, in large part, on our ability to retain key senior leaders, and competition for such senior leaders is intense. The executive compensation provisions of the Dodd-Frank Act and the regulations issued thereunder, and any further legislation, regulation or regulatory guidance restricting executive compensation, may limit the types of compensation arrangements that we may enter into with our most senior leaders and could have a negative impact on our ability to attract, retain and motivate such leaders in support of our long-term strategy. These laws and regulations may not apply in the same manner to all financial institutions, and we therefore may face more restrictions than other institutions and companies with which we compete for talent. These laws and regulations may also hinder our ability to compete for talent with other industries. If we are unable to retain talented senior leadership, our business could be negatively affected.
We Face Risks From Unpredictable Catastrophic Events.
Despite the business contingency plans we have in place, there can be no assurance that such plans will fully mitigate all potential business continuity risks to us. The impact from natural disasters and other catastrophic events may have a negative effect on our business and infrastructure, including our information technology systems and those of third-parties that we rely on. Our ability to conduct business may be adversely affected by a disruption in the infrastructure that supports our business and the communities where we are located, which are concentrated in the Northern Virginia and New York metropolitan areas, as well as Richmond, Virginia and Plano, Texas. This may include a disruption involving physical site access, cyber incidents, terrorist activities, disease pandemics, catastrophic events, natural disasters, extreme weather events, electrical outage, environmental hazard, computer servers, communications or other services we use, our employees or third parties with whom we conduct business. In addition, if a natural disaster or other catastrophic event occurs in certain regions where our business and customers are concentrated, such as the mid-Atlantic, New York or Texas metropolitan areas, we could be disproportionately impacted as compared to our competitors. The impact of such events and other catastrophes on the overall economy may also adversely affect our financial condition and results of operations.
|
31
|
Capital One Financial Corporation (COF)
|
|
We Face Risks From The Use Of Or Changes To Assumptions Or Estimates In Our Financial Statements.
Pursuant to generally accepted accounting principles in the U.S. (“U.S. GAAP”), we are required to use certain assumptions and estimates in preparing our financial statements, including determining our allowance for loan and lease losses, the fair value of certain assets and liabilities, and asset impairment, among other items. In December 2017, Congress passed and the President signed into law the Tax Act, that made significant changes to the U.S. federal tax laws. Many aspects of the new legislation are unclear and may not be clarified for some time. As a result, we have relied on reasonable estimates and provisional accounting entries in our accounting for income taxes. The ultimate impact of the Tax Act may differ from our estimates due to changes in the interpretations and assumptions, as well as additional regulatory guidance that may be issued. In addition, the FASB, the SEC and other regulatory bodies may change the financial accounting and reporting standards, including those related to assumptions and estimates we use to prepare our financial statements, in ways that we cannot predict and that could impact our financial statements. For example, in June 2016, the FASB issued revised guidance for impairments on financial instruments. The guidance, which becomes effective on January 1, 2020 with early adoption permitted no earlier than January 1, 2019, requires use of a CECL model that is based on expected rather than incurred losses. We are currently assessing the potential impact of this guidance, which may be material to our accounting for credit losses on financial instruments. If actual results differ from the assumptions or estimates underlying our financial statements or if financial accounting and reporting standards are changed, we may experience unexpected material losses. For a discussion of our use of estimates in the preparation of our consolidated financial statements, see “MD&A—Critical Accounting Policies and Estimates” and “
Note 1—Summary of Significant Accounting Policies
.”
Limitations On Our Ability To Receive Dividends From Our Subsidiaries Could Affect Our Liquidity And Ability To Pay Dividends And Repurchase Common Stock.
We are a separate and distinct legal entity from our subsidiaries, including the Banks. Dividends to us from our direct and indirect subsidiaries, including the Banks, have represented a major source of funds for us to pay dividends on our common and preferred stock, repurchase common stock, make payments on corporate debt securities and meet other obligations. There are various federal law limitations on the extent to which the Banks can finance or otherwise supply funds to us through dividends and loans. These limitations include minimum regulatory capital requirements, federal banking law requirements concerning the payment of dividends out of net profits or surplus, Sections 23A and 23B of the Federal Reserve Act and Regulation W governing transactions between an insured depository institution and its affiliates, as well as general federal regulatory oversight to prevent unsafe or unsound practices. If our subsidiaries’ earnings are not sufficient to make dividend payments to us while maintaining adequate capital levels, our liquidity may be affected and we may not be able to make dividend payments to our common or preferred stockholders, repurchase our common stock, make payments on outstanding corporate debt securities or meet other obligations, each and any of which could have a material adverse impact on our results of operations, financial position or perception of financial health.
The Soundness Of Other Financial Institutions And Other Third Parties Could Adversely Affect Us.
Our ability to engage in routine funding and other transactions could be adversely affected by the stability and actions of other financial services institutions. Financial services institutions are interrelated as a result of trading, clearing, servicing, counterparty and other relationships. We have exposure to an increasing number of financial institutions and counterparties. These counterparties include institutions that may be exposed to various risks over which we have little or no control, including European or U.S. sovereign debt that is currently or may become in the future subject to significant price pressure, rating agency downgrade or default risk.
In addition, we routinely execute transactions with counterparties in the financial services industry, including brokers and dealers, commercial banks, investment banks, mutual and hedge funds and other institutional clients, resulting in a significant credit concentration with respect to the financial services industry overall. As a result, defaults by, or even rumors or questions about, one or more financial services institutions, or the financial services industry generally, have led to market-wide liquidity problems and could lead to losses or defaults by us or by other institutions.
Likewise, adverse developments affecting the overall strength and soundness of our competitors, the financial services industry as a whole and the general economic climate or sovereign debt could have a negative impact on perceptions about the strength and soundness of our business even if we are not subject to the same adverse developments. In addition, adverse developments with respect to third parties with whom we have important relationships also could negatively impact perceptions about us. These perceptions about us could cause our business to be negatively affected and exacerbate the other risks that we face.
|
32
|
Capital One Financial Corporation (COF)
|
|
Item 1B.
Unresolved Staff Comments
None.
|
33
|
Capital One Financial Corporation (COF)
|
|
Item 2.
Properties
Our corporate and banking real estate portfolio consists of approximately 14.7 million square feet of owned or leased office and retail space, used to support our business. Of this overall portfolio, approximately 11.2 million square feet of space is dedicated for various corporate office uses and approximately 3.5 million square feet of space is for bank branches and related offices.
Our 11.2 million square feet of corporate office space consists of approximately 6.4 million square feet of leased space and 4.8 million square feet of owned space. Our headquarters is located in McLean, Virginia, and is included in our corporate office space. We maintain corporate office space primarily in Virginia, Illinois, Texas, New York, Delaware, Louisiana and Maryland.
Our 3.5 million square feet of bank branch, Café and office space consists of approximately 1.9 million square feet of leased space and 1.6 million square feet of owned space, including branch locations
primarily across New York, Louisiana, Texas, Maryland, Virginia, New Jersey and the District of Columbia.
See “
Note 8—Premises, Equipment and Lease Commitments
” for information about our premises.
Item 3.
Legal Proceedings
The information required by Item 103 of Regulation S-K is included in “
Note 19—Commitments, Contingencies, Guarantees and Others
.”
Item 4.
Mine Safety Disclosures
Not applicable.
|
34
|
Capital One Financial Corporation (COF)
|
|
Item 5.
Market for Registrant’s Common Equity, Related Stockholder Matters and Issuer Purchases of Equity Securities
Market Information
Our common stock is listed on the NYSE and is traded under the symbol “COF.” As of January 31, 2018, there were
10,982
holders of record of our common stock. The table below presents the high and low closing trade prices of our common stock as reported by the NYSE and cash dividends per common share declared by us during each quarter indicated.
|
|
Trade Price
|
Cash
Dividends
|
||||||||||
|
For the Quarter Ended
|
High
|
Low
|
||||||||||
|
December 31, 2017
|
$
|
100.50
|
|
$
|
84.59
|
|
$
|
0.40
|
|
|||
|
September 30, 2017
|
87.94
|
|
78.21
|
|
0.40
|
|
||||||
|
June 30, 2017
|
85.80
|
|
76.92
|
|
0.40
|
|
||||||
|
March 31, 2017
|
96.12
|
|
82.13
|
|
0.40
|
|
||||||
|
December 31, 2016
|
90.62
|
|
71.07
|
|
0.40
|
|
||||||
|
September 30, 2016
|
72.50
|
|
60.86
|
|
0.40
|
|
||||||
|
June 30, 2016
|
75.96
|
|
58.15
|
|
0.40
|
|
||||||
|
March 31, 2016
|
71.03
|
|
58.66
|
|
0.40
|
|
||||||
Dividend Restrictions
For information regarding our ability to pay dividends, see the discussion under “Part I—Item 1. Business—Supervision and Regulation—Dividends, Stock Repurchases and Transfers of Funds,” “MD&A—Capital Management—Dividend Policy and Stock Purchases” and “
Note 12—Regulatory and Capital Adequacy
.”
Securities Authorized for Issuance Under Equity Compensation Plans
Information relating to compensation plans under which our equity securities are authorized for issuance is presented in this Report under “Part III—Item 12.
Security Ownership of Certain Beneficial Owners and Management and Related Stockholder Matters
.”
|
35
|
Capital One Financial Corporation (COF)
|
|
Common Stock Performance Graph
The following graph shows the cumulative total stockholder return on our common stock compared to an overall stock market index, the S&P Composite 500 Stock Index (“S&P 500 Index”), and a published industry index, the S&P Financial Composite Index (“S&P Financial Index”), over the five-year period commencing December 31, 2012 and ending December 31, 2017. The stock performance graph assumes that $100 was invested in our common stock and each index and that all dividends were reinvested. The stock price performance on the graph below is not necessarily indicative of future performance.
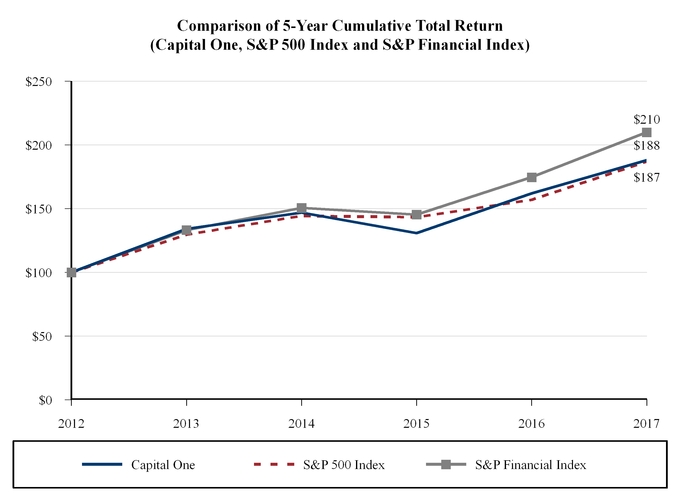
|
December 31,
|
||||||||||||||||||||||||
|
2012
|
2013
|
2014
|
2015
|
2016
|
2017
|
|||||||||||||||||||
|
Capital One
|
$
|
100.00
|
|
$
|
134.18
|
|
$
|
146.88
|
|
$
|
130.86
|
|
$
|
161.94
|
|
$
|
188.35
|
|
||||||
|
S&P 500 Index
|
100.00
|
|
129.60
|
|
144.36
|
|
143.31
|
|
156.98
|
|
187.47
|
|
||||||||||||
|
S&P Financial Index
|
100.00
|
|
133.21
|
|
150.66
|
|
145.42
|
|
174.71
|
|
209.70
|
|
||||||||||||
|
36
|
Capital One Financial Corporation (COF)
|
|
Recent Sales of Unregistered Securities
We did not have any sales of unregistered equity securities in
2017
.
Issuer Purchases of Equity Securities
The following table presents information related to repurchases of shares of our common stock for each calendar month in the fourth quarter of
2017
. During this period, there were no repurchases of common stock under the 2017 Stock Repurchase Program. Commission costs are excluded from the amounts presented below.
|
Number
of Shares
Purchased
(1)
|
Average
Price Paid
per Share
|
Number of
Shares Purchased as
Part of Publicly
Announced Plans
|
Maximum
Amount That May
Yet be Purchased
Under the Plan
or Program
(in millions)
|
|||||||||||
|
October
|
—
|
|
—
|
|
—
|
|
$
|
1,834
|
|
|||||
|
November
|
35,254
|
|
$
|
92.10
|
|
—
|
|
1,834
|
|
|||||
|
December
(2)
|
—
|
|
—
|
|
—
|
|
1,000
|
|
||||||
|
Total
|
35,254
|
|
$
|
92.10
|
|
—
|
|
|||||||
__________
|
(1)
|
Shares withheld in November 2017 were to cover taxes on restricted stock awards whose restrictions have lapsed.
|
|
(2)
|
In December 2017,
the Board of Directors reduced the authorized repurchases of our common stock to up to $1.0 billion for the remaining 2017 CCAR period, which ends June 30, 2018
.
|
|
37
|
Capital One Financial Corporation (COF)
|
|
The following table presents selected consolidated financial data and performance metrics for the five-year period ended
December 31, 2017
. Certain prior period amounts have been recast to conform to the current period presentation. We prepare our consolidated financial statements based on U.S. GAAP. This data should be reviewed in conjunction with our audited consolidated financial statements and related notes and with the MD&A included in this Report. The historical financial information presented may not be indicative of our future performance.
Five-Year Summary of Selected Financial Data
|
Year Ended December 31,
|
Change
|
|||||||||||||||||||||||||
|
(Dollars in millions, except per share data and as noted)
|
2017
|
2016
|
2015
|
2014
|
2013
|
2017 vs. 2016
|
2016 vs. 2015
|
|||||||||||||||||||
|
Income statement
|
||||||||||||||||||||||||||
|
Interest income
|
$
|
25,222
|
|
$
|
22,891
|
|
$
|
20,459
|
|
$
|
19,397
|
|
$
|
19,898
|
|
10
|
%
|
12
|
%
|
|||||||
|
Interest expense
|
2,762
|
|
2,018
|
|
1,625
|
|
1,579
|
|
1,792
|
|
37
|
|
24
|
|
||||||||||||
|
Net interest income
|
22,460
|
|
20,873
|
|
18,834
|
|
17,818
|
|
18,106
|
|
8
|
|
11
|
|
||||||||||||
|
Non-interest income
|
4,777
|
|
4,628
|
|
4,579
|
|
4,472
|
|
4,278
|
|
3
|
|
1
|
|
||||||||||||
|
Total net revenue
|
27,237
|
|
25,501
|
|
23,413
|
|
22,290
|
|
22,384
|
|
7
|
|
9
|
|
||||||||||||
|
Provision for credit losses
|
7,551
|
|
6,459
|
|
4,536
|
|
3,541
|
|
3,453
|
|
17
|
|
42
|
|
||||||||||||
|
Non-interest expense:
|
||||||||||||||||||||||||||
|
Marketing
|
1,670
|
|
1,811
|
|
1,744
|
|
1,561
|
|
1,373
|
|
(8
|
)
|
4
|
|
||||||||||||
|
Operating expenses
|
12,524
|
|
11,747
|
|
11,252
|
|
10,619
|
|
10,980
|
|
7
|
|
4
|
|
||||||||||||
|
Total non-interest expense
|
14,194
|
|
13,558
|
|
12,996
|
|
12,180
|
|
12,353
|
|
5
|
|
4
|
|
||||||||||||
|
Income from continuing operations before income taxes
|
5,492
|
|
5,484
|
|
5,881
|
|
6,569
|
|
6,578
|
|
—
|
|
(7
|
)
|
||||||||||||
|
Income tax provision
|
3,375
|
|
1,714
|
|
1,869
|
|
2,146
|
|
2,224
|
|
97
|
|
(8
|
)
|
||||||||||||
|
Income from continuing operations, net of tax
|
2,117
|
|
3,770
|
|
4,012
|
|
4,423
|
|
4,354
|
|
(44
|
)
|
(6
|
)
|
||||||||||||
|
Income (loss) from discontinued operations, net of tax
|
(135
|
)
|
(19
|
)
|
38
|
|
5
|
|
(233
|
)
|
**
|
|
**
|
|
||||||||||||
|
Net income
|
1,982
|
|
3,751
|
|
4,050
|
|
4,428
|
|
4,121
|
|
(47
|
)
|
(7
|
)
|
||||||||||||
|
Dividends and undistributed earnings allocated to participating securities
|
(13
|
)
|
(24
|
)
|
(20
|
)
|
(18
|
)
|
(17
|
)
|
(46
|
)
|
20
|
|
||||||||||||
|
Preferred stock dividends
|
(265
|
)
|
(214
|
)
|
(158
|
)
|
(67
|
)
|
(53
|
)
|
24
|
|
35
|
|
||||||||||||
|
Net income available to common stockholders
|
$
|
1,704
|
|
$
|
3,513
|
|
$
|
3,872
|
|
$
|
4,343
|
|
$
|
4,051
|
|
(51
|
)
|
(9
|
)
|
|||||||
|
Common share statistics
|
|
|
|
|
||||||||||||||||||||||
|
Basic earnings per common share:
|
||||||||||||||||||||||||||
|
Net income from continuing operations
|
$
|
3.80
|
|
$
|
7.00
|
|
$
|
7.08
|
|
$
|
7.70
|
|
$
|
7.39
|
|
(46
|
)%
|
(1
|
)%
|
|||||||
|
Income (loss) from discontinued operations
|
(0.28
|
)
|
(0.04
|
)
|
0.07
|
|
0.01
|
|
(0.40
|
)
|
**
|
|
**
|
|
||||||||||||
|
Net income per basic common share
|
$
|
3.52
|
|
$
|
6.96
|
|
$
|
7.15
|
|
$
|
7.71
|
|
$
|
6.99
|
|
(49
|
)
|
(3
|
)
|
|||||||
|
Diluted earnings per common share:
|
|
|
||||||||||||||||||||||||
|
Net income from continuing operations
|
$
|
3.76
|
|
$
|
6.93
|
|
$
|
7.00
|
|
$
|
7.58
|
|
$
|
7.28
|
|
(46
|
)
|
(1
|
)
|
|||||||
|
Income (loss) from discontinued operations
|
(0.27
|
)
|
(0.04
|
)
|
0.07
|
|
0.01
|
|
(0.39
|
)
|
**
|
|
**
|
|
||||||||||||
|
Net income per diluted common share
|
$
|
3.49
|
|
$
|
6.89
|
|
$
|
7.07
|
|
$
|
7.59
|
|
$
|
6.89
|
|
(49
|
)
|
(3
|
)
|
|||||||
|
Common shares outstanding (period-end, in millions)
|
485.5
|
|
480.2
|
|
527.3
|
|
553.4
|
|
572.7
|
|
1
|
|
(9
|
)
|
||||||||||||
|
Dividends declared per common share
|
$
|
1.60
|
|
$
|
1.60
|
|
$
|
1.50
|
|
$
|
1.20
|
|
$
|
0.95
|
|
—
|
|
7
|
|
|||||||
|
Tangible book value per common share (period-end)
(1)
|
60.28
|
|
57.76
|
|
53.65
|
|
50.32
|
|
43.64
|
|
4
|
|
8
|
|
||||||||||||
|
Common dividend payout ratio
(2)
|
45.45
|
%
|
22.99
|
%
|
20.98
|
%
|
15.56
|
%
|
13.59
|
%
|
22
|
|
2
|
|
||||||||||||
|
Stock price per common share at period end
|
$
|
99.58
|
|
$
|
87.24
|
|
$
|
72.18
|
|
$
|
82.55
|
|
$
|
76.61
|
|
14
|
|
21
|
|
|||||||
|
Book value per common share at period end
|
100.37
|
|
98.95
|
|
89.67
|
|
81.41
|
|
72.69
|
|
1
|
|
10
|
|
||||||||||||
|
Total market capitalization at period end
|
48,346
|
|
41,893
|
|
38,061
|
|
45,683
|
|
43,875
|
|
15
|
|
10
|
|
||||||||||||
|
Balance sheet (average balances)
|
||||||||||||||||||||||||||
|
Loans held for investment
|
$
|
245,565
|
|
$
|
233,272
|
|
$
|
210,745
|
|
$
|
197,925
|
|
$
|
192,614
|
|
5
|
%
|
11
|
%
|
|||||||
|
Interest-earning assets
|
322,330
|
|
307,796
|
|
282,581
|
|
267,174
|
|
266,423
|
|
5
|
|
9
|
|
||||||||||||
|
Total assets
|
354,924
|
|
339,974
|
|
313,474
|
|
297,659
|
|
296,200
|
|
4
|
|
8
|
|
||||||||||||
|
Interest-bearing deposits
|
213,949
|
|
198,304
|
|
185,677
|
|
181,036
|
|
187,700
|
|
8
|
|
7
|
|
||||||||||||
|
Total deposits
|
239,882
|
|
223,714
|
|
210,989
|
|
205,675
|
|
209,045
|
|
7
|
|
6
|
|
||||||||||||
|
Borrowings
|
53,659
|
|
56,878
|
|
45,420
|
|
38,882
|
|
37,807
|
|
(6
|
)
|
25
|
|
||||||||||||
|
Common equity
|
45,170
|
|
45,162
|
|
45,072
|
|
43,055
|
|
40,629
|
|
—
|
|
—
|
|
||||||||||||
|
Total stockholders’ equity
|
49,530
|
|
48,753
|
|
47,713
|
|
44,268
|
|
41,482
|
|
2
|
|
2
|
|
||||||||||||
|
38
|
Capital One Financial Corporation (COF)
|
|
|
Year Ended December 31,
|
Change
|
|||||||||||||||||||||||||
|
(Dollars in millions, except per share data and as noted)
|
2017
|
2016
|
2015
|
2014
|
2013
|
2017 vs. 2016
|
2016 vs. 2015
|
|||||||||||||||||||
|
Selected performance metrics
|
|
|
|
|||||||||||||||||||||||
|
Purchase volume
(3)
|
$
|
336,440
|
|
$
|
307,138
|
|
$
|
271,167
|
|
$
|
224,750
|
|
$
|
201,074
|
|
10
|
%
|
13
|
%
|
|||||||
|
Total net revenue margin
(4)
|
8.45
|
%
|
8.29
|
%
|
8.29
|
%
|
8.34
|
%
|
8.40
|
%
|
16
|
bps
|
—
|
|
||||||||||||
|
Net interest margin
(5)
|
6.97
|
|
6.78
|
|
6.66
|
|
6.67
|
|
6.80
|
|
19
|
|
12
|
bps
|
||||||||||||
|
Return on average assets
|
0.60
|
|
1.11
|
|
1.28
|
|
1.49
|
|
1.47
|
|
(51
|
)
|
(17
|
)
|
||||||||||||
|
Return on average tangible assets
(6)
|
0.62
|
|
1.16
|
|
1.35
|
|
1.57
|
|
1.55
|
|
(54
|
)
|
(19
|
)
|
||||||||||||
|
Return on average common equity
(7)
|
4.07
|
|
7.82
|
|
8.51
|
|
10.08
|
|
10.54
|
|
(4
|
)%
|
(1
|
)%
|
||||||||||||
|
Return on average tangible common equity (“TCE”)
(8)
|
6.16
|
|
11.93
|
|
12.87
|
|
15.79
|
|
17.35
|
|
(6
|
)
|
(1
|
)
|
||||||||||||
|
Equity-to-assets ratio
(9)
|
13.96
|
|
14.34
|
|
15.22
|
|
14.87
|
|
14.00
|
|
(38
|
)bps
|
(88
|
)bps
|
||||||||||||
|
Non-interest expense as a percentage of average loans held for investment
|
5.78
|
|
5.81
|
|
6.17
|
|
6.15
|
|
6.41
|
|
(3
|
)
|
(36
|
)
|
||||||||||||
|
Efficiency ratio
(10)
|
52.11
|
|
53.17
|
|
55.51
|
|
54.64
|
|
55.19
|
|
(106
|
)
|
(234
|
)
|
||||||||||||
|
Effective income tax rate from continuing operations
|
61.5
|
|
31.3
|
|
31.8
|
|
32.7
|
|
33.8
|
|
30
|
%
|
(1
|
)%
|
||||||||||||
|
Net charge-offs
|
$
|
6,562
|
|
$
|
5,062
|
|
$
|
3,695
|
|
$
|
3,414
|
|
$
|
3,934
|
|
30
|
|
37
|
|
|||||||
|
Net charge-off rate
(11)
|
2.67
|
%
|
2.17
|
%
|
1.75
|
%
|
1.72
|
%
|
2.04
|
%
|
50
|
bps
|
42
|
bps
|
||||||||||||
|
December 31,
|
Change
|
|||||||||||||||||||||||||
|
(Dollars in millions, except as noted)
|
|
2017
|
2016
|
2015
|
2014
|
2013
|
2017 vs. 2016
|
2016 vs. 2015
|
||||||||||||||||||
|
|
|
|
|
|
||||||||||||||||||||||
|
Loans held for investment
|
$
|
254,473
|
|
$
|
245,586
|
|
$
|
229,851
|
|
$
|
208,316
|
|
$
|
197,199
|
|
4
|
%
|
7
|
%
|
|||||||
|
Interest-earning assets
|
334,124
|
|
321,807
|
|
302,007
|
|
277,849
|
|
265,170
|
|
4
|
|
7
|
|
||||||||||||
|
Total assets
|
365,693
|
|
357,033
|
|
334,048
|
|
308,167
|
|
296,064
|
|
2
|
|
7
|
|
||||||||||||
|
Interest-bearing deposits
|
217,298
|
|
211,266
|
|
191,874
|
|
180,467
|
|
181,880
|
|
3
|
|
10
|
|
||||||||||||
|
Total deposits
|
243,702
|
|
236,768
|
|
217,721
|
|
205,548
|
|
204,523
|
|
3
|
|
9
|
|
||||||||||||
|
Borrowings
|
60,281
|
|
60,460
|
|
59,115
|
|
48,457
|
|
40,654
|
|
—
|
|
2
|
|
||||||||||||
|
Common equity
|
44,370
|
|
43,154
|
|
43,990
|
|
43,231
|
|
40,779
|
|
3
|
|
(2
|
)
|
||||||||||||
|
Total stockholders’ equity
|
48,730
|
|
47,514
|
|
47,284
|
|
45,053
|
|
41,632
|
|
3
|
|
—
|
|
||||||||||||
|
Credit quality metrics
|
|
|
|
|
||||||||||||||||||||||
|
Allowance for loan and lease losses
|
$
|
7,502
|
|
$
|
6,503
|
|
$
|
5,130
|
|
$
|
4,383
|
|
$
|
4,315
|
|
15
|
%
|
27
|
%
|
|||||||
|
Allowance as a percentage of loans held for investment (“allowance coverage ratio”)
|
2.95
|
%
|
2.65
|
%
|
2.23
|
%
|
2.10
|
%
|
2.19
|
%
|
30
|
bps
|
42
|
bps
|
||||||||||||
|
30+ day performing delinquency rate
|
3.23
|
|
2.93
|
|
2.69
|
|
2.62
|
|
2.63
|
|
30
|
|
24
|
|
||||||||||||
|
30+ day delinquency rate
|
3.48
|
|
3.27
|
|
3.00
|
|
2.91
|
|
2.96
|
|
21
|
|
27
|
|
||||||||||||
|
Capital ratios
|
|
|
|
|
|
|
|
|
||||||||||||||||||
|
Common equity Tier 1 capital
(12)
|
10.3
|
%
|
10.1
|
%
|
11.1
|
%
|
12.5
|
%
|
N/A
|
|
20
|
bps
|
(100
|
)bps
|
||||||||||||
|
Tier 1 common ratio
|
N/A
|
|
N/A
|
|
N/A
|
|
N/A
|
|
12.2
|
%
|
**
|
|
**
|
|
||||||||||||
|
Tier 1 capital
(12)
|
11.8
|
|
11.6
|
|
12.4
|
|
13.2
|
|
12.6
|
|
20
|
|
(80
|
)
|
||||||||||||
|
Total capital
(12)
|
14.4
|
|
14.3
|
|
14.6
|
|
15.1
|
|
14.7
|
|
10
|
|
(30
|
)
|
||||||||||||
|
Tier 1 leverage
(12)
|
9.9
|
|
9.9
|
|
10.6
|
|
10.8
|
|
10.1
|
|
—
|
|
(70
|
)
|
||||||||||||
|
Tangible common equity
(13)
|
8.3
|
|
8.1
|
|
8.9
|
|
9.5
|
|
8.9
|
|
20
|
|
(80
|
)
|
||||||||||||
|
Supplementary leverage
(12)
|
8.4
|
|
8.6
|
|
9.2
|
|
N/A
|
|
N/A
|
|
(20
|
)
|
(60
|
)
|
||||||||||||
|
Other
|
|
|
|
|||||||||||||||||||||||
|
Employees (period end, in thousands)
|
49.3
|
|
47.3
|
|
45.4
|
|
46.0
|
|
45.4
|
|
4
|
%
|
4
|
%
|
||||||||||||
|
(1)
|
Tangible book value per common share is a non-GAAP measure calculated based on tangible common equity divided by common shares outstanding. See “MD&A—Table
F
—Reconciliation of Non-GAAP Measures and Calculation of Regulatory Capital Measures” for additional information on non-GAAP measures.
|
|
(2)
|
Common dividend payout ratio is calculated based on dividends per common share for the period divided by basic earnings per common share for the period.
|
|
(3)
|
Purchase volume consists of purchase transactions, net of returns, for the period for loans both classified as held for investment and held for sale in our Credit Card business, and excludes cash advance and balance transfer transactions.
|
|
(4)
|
Total net revenue margin is calculated based on
total net revenue
for the period divided by average interest-earning assets for the period.
|
|
(5)
|
Net interest margin is calculated based on
net interest income
for the period divided by average interest-earning assets for the period.
|
|
39
|
Capital One Financial Corporation (COF)
|
|
|
(6)
|
Return on average tangible assets is a non-GAAP measure
calculated based on
income from continuing operations, net of tax, for the period divided by average tangible assets for the period. See “MD&A—Table
F
—Reconciliation of Non-GAAP Measures and Calculation of Regulatory Capital Measures” for additional information on non-GAAP measures.
|
|
(7)
|
Return on average common equity is
calculated based on
(i) income from continuing operations, net of tax; (ii) less dividends and undistributed earnings allocated to participating securities; (iii) less preferred stock dividends, for the period, divided by average common equity. Our calculation of return on average common equity may not be comparable to similarly-titled measures reported by other companies.
|
|
(8)
|
Return on average tangible common equity is a non-GAAP measure
calculated based on
(i) income from continuing operations, net of tax; (ii) less dividends and undistributed earnings allocated to participating securities; (iii) less preferred stock dividends, for the period, divided by average TCE. Our calculation of return on average TCE may not be comparable to similarly-titled measures reported by other companies. See “MD&A—Table
F
—Reconciliation of Non-GAAP Measures and Calculation of Regulatory Capital Measures” for additional information on non-GAAP measures.
|
|
(9)
|
Equity-to-assets ratio is calculated based on average stockholders’ equity for the period divided by average total assets for the period.
|
|
(10)
|
Efficiency ratio is calculated based on non-interest expense for the period divided by total net revenue for the period.
|
|
(11)
|
Net charge-off
rate is calculated by dividing net charge-offs by average loans held for investment for the period for each loan category
.
|
|
(12)
|
Beginning on January 1, 2014, we calculate our regulatory capital under Basel III Standardized Approach subject to transition provisions. Prior to January 1, 2014, we calculated regulatory capital measures under Basel I. See “MD&A—Capital Management” and “MD&A—Table
F
—Reconciliation of Non-GAAP Measures and Calculation of Regulatory Capital Measures” for additional information, including the calculation of each of these ratios.
|
|
(13)
|
Tangible common equity ratio is a non-GAAP measure calculated based on TCE divided by tangible assets. See “MD&A—Table
F
—Reconciliation of Non-GAAP Measures and Calculation of Regulatory Capital Measures” for the calculation of this measure and reconciliation to the comparative U.S. GAAP measure.
|
|
**
|
Change is not meaningful.
|
|
40
|
Capital One Financial Corporation (COF)
|
|
Item 7.
Management’s Discussion and Analysis of Financial Condition and Results of Operations (“MD&A”)
|
|
||||
This discussion contains forward-looking statements that are based upon management’s current expectations and are subject to significant uncertainties and changes in circumstances. Please review “Part I—Item 1. Business
—
Forward-Looking Statements” for more information on the forward-looking statements in this 2017 Annual Report on Form 10-K (“this Report”). Our actual results may differ materially from those included in these forward-looking statements due to a variety of factors including, but not limited to, those described in “Part I—Item 1A. Risk Factors” in this Report. Unless otherwise specified, references to notes to our consolidated financial statements refer to the notes to our consolidated financial statements as of
December 31, 2017
included in this Report.
Management monitors a variety of key indicators to evaluate our business results and financial condition. The following MD&A is intended to provide the reader with an understanding of our results of operations, financial condition and liquidity by focusing on changes from year to year in certain key measures used by management to evaluate performance, such as profitability, growth and credit quality metrics. MD&A is provided as a supplement to, and should be read in conjunction with, our audited consolidated financial statements as of and for the year ended
December 31, 2017
and accompanying notes. MD&A is organized in the following sections:
|
• Executive Summary and Business Outlook
|
|
• Capital Management
|
|
• Consolidated Results of Operations
|
|
• Risk Management
|
|
• Consolidated Balance Sheets Analysis
|
|
• Credit Risk Profile
|
|
• Off-Balance Sheet Arrangements
|
|
• Liquidity Risk Profile
|
|
• Business Segment Financial Performance
|
|
• Market Risk Profile
|
|
• Critical Accounting Policies and Estimates
|
|
• Supplemental Tables
|
|
• Accounting Changes and Developments
|
|
• Glossary and Acronyms
|
|
EXECUTIVE SUMMARY AND BUSINESS OUTLOOK
|
Financial Highlights
We reported net income of
$2.0 billion
(
$3.49
per diluted common share) on total net revenue of
$27.2 billion
for
2017
. In comparison, we reported net income of
$3.8 billion
(
$6.89
per diluted common share) on total net revenue of
$25.5 billion
for
2016
, and
$4.1 billion
(
$7.07
per diluted common share) on total net revenue of
$23.4
billion for 2015.
Our net income of
$2.0 billion
for
2017
includes charges totaling
$1.8 billion
related to the enactment of the Tax Act in the fourth quarter of 2017. See “MD&A—Income Taxes” below for additional information.
Our common equity Tier 1 capital ratio as calculated under the Basel III Standardized Approach, including transition provisions, was
10.3%
and 10.1% as of
December 31, 2017
and
2016
, respectively. See “MD&A—
Capital Management
” below for additional information.
On June 28, 2017, we announced that our Board of Directors authorized the repurchase of up to $1.85 billion of shares of our common stock from the third quarter of 2017 through the end of the second quarter of 2018. In December 2017,
the Board of Directors reduced the authorized repurchases of our common stock to up to $1.0 billion for the remaining 2017 CCAR period, which ends June 30, 2018
(“2017 Stock Repurchase Program”). See “MD&A—
Capital Management
—Dividend Policy and Stock Purchases” for additional information.
Below are additional highlights of our performance in
2017
. These highlights are generally based on a comparison between the results of
2017
and
2016
, except as otherwise noted. The changes in our financial condition and credit performance are generally based on our financial condition and credit performance as of
December 31, 2017
compared to our financial condition and credit performance as of
December 31, 2016
. We provide a more detailed discussion of our financial performance in the sections following this “
Executive Summary and Business Outlook
.”
|
41
|
Capital One Financial Corporation (COF)
|
|
Total Company Performance
|
•
|
Earnings:
Our net income decreased by
$1.8 billion
to
$2.0 billion
in
2017
compared to 2016. The decrease was primarily driven by:
|
|
◦
|
higher income tax provision due to
charges associated with the estimated impacts of the Tax Act
;
|
|
◦
|
higher provision for credit losses primarily driven by higher charge-offs in our domestic credit card loan portfolio;
|
|
◦
|
higher operating expenses as a result of (i) loan growth; (ii) continued investments in technology and infrastructure; and (iii)
restructuring activities, which primarily consisted of severance and related benefits pursuant to our ongoing benefit programs, that are the result of exiting certain business activities and locations
; and
|
|
◦
|
higher interest expense due to the net effect of higher interest rates, as well as growth and mix changes in our interest-bearing liabilities
.
|
These drivers were partially offset by higher interest income due to growth in our domestic credit card and auto loan portfolios, as well as higher yields as a result of higher interest rates.
|
•
|
Loans Held for Investment
:
|
|
◦
|
Period-end loans held for investment
increased
by
$8.9 billion
to
$254.5 billion
as of
December 31, 2017
from
December 31, 2016
primarily due to growth in our domestic credit card loan portfolio, largely driven by loans obtained in the Cabela’s acquisition, as well as growth in our auto loan portfolio, partially offset by run-off of our acquired home loan portfolio
.
|
|
◦
|
Average loans held for investment
increased
by
$12.3 billion
to
$245.6 billion
in
2017
compared to
2016
primarily driven by growth in our auto, domestic credit card and commercial loan portfolios, partially offset by run-off of our acquired home loan portfolio.
|
|
•
|
Net Charge-Off and Delinquency Metrics:
Our net charge-off rate
increased
by
50
basis points to
2.67%
in
2017
compared to
2016
primarily due to
growth and seasoning of recent domestic credit card loan originations
.
|
Our 30+ day delinquency rate
increased
by
21
basis points to
3.48%
as of
December 31, 2017
from
December 31, 2016
primarily due to:
|
◦
|
higher auto delinquency inventories
; and
|
|
◦
|
growth and seasoning of recent domestic credit card loan originations
.
|
We provide additional information on our credit quality metrics below under “MD&A—
Business Segment Financial Performance
” and “MD&A —
Credit Risk Profile
.”
|
•
|
Allowance for Loan and Lease Losses:
Our allowance for loan and lease losses
increased
by
$999 million
to
$7.5 billion
as of
December 31, 2017
from
December 31, 2016
, and the allowance coverage ratio
increased
by
30
basis points to
2.95%
as of
December 31, 2017
from
December 31, 2016
. The increases were primarily driven by:
|
|
◦
|
an allowance build in our domestic credit card loan portfolio primarily due to increasing losses from recent vintages and portfolio seasoning
; and
|
|
◦
|
an allowance build in our auto loan portfolio due to higher losses associated with growth
.
|
These drivers were partially offset by
an allowance decrease in our commercial loan portfolio primarily driven by charge-offs in our taxi medallion lending portfolio, as well as reduced exposure and improved credit risk ratings in our oil and gas portfolio
.
|
42
|
Capital One Financial Corporation (COF)
|
|
Business Outlook
We discuss below our current expectations regarding our total company performance and the performance of each of our business segments over the near-term based on market conditions, the regulatory environment and our business strategies as of the time we filed this Report. The statements contained in this section are based on our current expectations regarding our outlook for our financial results and business strategies. Our expectations take into account, and should be read in conjunction with, our expectations regarding economic trends and analysis of our business as discussed in “Part I—Item 1. Business” and “Part II—Item 7. MD&A” of this Report. Certain statements are forward-looking statements within the meaning of the Private Securities Litigation Reform Act of 1995. Actual results could differ materially from those in our forward-looking statements. Except as otherwise disclosed, forward-looking statements do not reflect:
|
•
|
any change in current dividend or repurchase strategies;
|
|
•
|
the effect of any acquisitions, divestitures or similar transactions that have not been previously disclosed; or
|
|
•
|
any changes in laws, regulations or regulatory interpretations, in each case after the date as of which such statements are made.
|
See “Part I—Item 1. Business—Forward-Looking Statements” in this Report for more information on the forward-looking statements included in this Report and “Part I—Item 1A. Risk Factors” in this Report for factors that could materially influence our results.
Total Company Expectations
We expect that our current trajectory, coupled with the Tax Act, will enable us to accelerate 2018 earnings per share growth, excluding adjusting items and assuming no substantial change in the broader economic or credit cycles.
We expect that a majority of the benefit from the Tax Act will be reflected in our earnings in the near term. Over time, we expect that marketplace dynamics will consume a portion of the benefit through increasing competition, including higher levels of marketing, lower prices and higher wages, and we expect that these market effects will increase over time.
We expect our annual effective income tax rate to be around 19% in 2018, plus or minus a reasonable margin of volatility.
We expect that marketing expense in 2018 will be higher than 2017.
While our efficiency ratio may vary in any given year, over the long term, we believe that we will be able to achieve gradual improvement in our efficiency ratio driven by growth and digital productivity gains.
We believe that our common equity Tier 1 capital ratio on a fully phased-in basis will trend toward the mid-10% range by the end of 2018.
On June 28, 2017, we announced that our Board of Directors authorized the repurchase of up to $1.85 billion of shares of our common stock from the third quarter of 2017 through the end of the second quarter of 2018 as part of the 2017 Stock Repurchase Program. In December 2017,
the Board of Directors reduced the authorized repurchases of our common stock to up to $1.0 billion for the remaining 2017 CCAR period, which ends June 30, 2018
. The timing and exact amount of any common stock repurchases will depend on various factors, including regulatory approval, market conditions, opportunities for growth, our capital position, the amount of retained earnings and utilizing Rule 10b5-1 programs, and may be suspended at any time. See “MD&A—Capital Management—Dividend Policy and Stock Purchases” for more information.
We continue to be in a strong position to deliver attractive growth and returns, as well as significant capital distribution, subject to regulatory approval and market conditions.
Business Segment Expectations
Credit Card
: In our Domestic Card business, we expect that the upward pressure on charge-offs as new loans season and become a larger portion of our overall portfolio will continue to moderate, with a small impact in 2018. As the impact of new loan seasoning moderates, we expect that our delinquency and charge-off rate trends will be driven more by broader industry factors.
Consumer Banking
: In our Consumer Banking business, we expect that the charge-off rate in our auto finance business will increase gradually and the growth we have experienced in that business will moderate.
|
43
|
Capital One Financial Corporation (COF)
|
|
|
CONSOLIDATED RESULTS OF OPERATIONS
|
The section below provides a comparative discussion of our consolidated financial performance for
2017
and
2016
. We provide a discussion of our business segment results in the following section, “MD&A—Business Segment Financial Performance.” You should read this section together with our “MD&A—
Executive Summary and Business Outlook
,” where we discuss trends and other factors that we expect will affect our future results of operations.
Net Interest Income
Net interest income represents the difference between the interest income, including certain fees, earned on our interest-earning assets and the interest expense on our interest-bearing liabilities. Interest-earning assets include loans, investment securities and other interest-earning assets, while our interest-bearing liabilities include interest-bearing deposits, securitized debt obligations, senior and subordinated notes, and other borrowings. Generally, we include in interest income any past due fees on loans that we deem collectible. Our net interest margin, based on our consolidated results, represents the difference between the yield on our interest-earning assets and the cost of our interest-bearing liabilities, including the notional impact of non-interest-bearing funding. We expect net interest income and our net interest margin to fluctuate based on changes in interest rates and changes in the amount and composition of our interest-earning assets and interest-bearing liabilities.
|
44
|
Capital One Financial Corporation (COF)
|
|
Table
1
below presents, for each major category of our interest-earning assets and interest-bearing liabilities, the average outstanding balance, interest income earned or interest expense incurred, and average yield for
2017
,
2016
and
2015
.
Table
1
:
Average Balances, Net Interest Income and Net Interest Margin
__________
|
|
Year Ended December 31,
|
||||||||||||||||||||||||||||||||
|
|
2017
|
2016
|
2015
|
||||||||||||||||||||||||||||||
|
(Dollars in millions)
|
Average
Balance
|
Interest
Income/
Expense
|
Average Yield/
Rate |
Average
Balance
|
Interest
Income/
Expense
|
Average Yield/
Rate |
Average
Balance |
Interest
Income/ Expense (2)(3) |
Average Yield/
Rate |
||||||||||||||||||||||||
|
Assets:
|
|||||||||||||||||||||||||||||||||
|
Interest-earning assets:
|
|||||||||||||||||||||||||||||||||
|
Loans:
(1)
|
|||||||||||||||||||||||||||||||||
|
Credit card
|
$
|
103,468
|
|
$
|
15,735
|
|
15.21
|
%
|
$
|
96,596
|
|
$
|
14,173
|
|
14.67
|
%
|
$
|
86,923
|
|
$
|
12,387
|
|
14.25
|
%
|
|||||||||
|
Consumer banking
|
74,865
|
|
4,984
|
|
6.66
|
|
71,631
|
|
4,537
|
|
6.33
|
|
71,365
|
|
4,460
|
|
6.25
|
|
|||||||||||||||
|
Commercial banking
(2)
|
68,150
|
|
2,630
|
|
3.86
|
|
66,033
|
|
2,290
|
|
3.47
|
|
53,161
|
|
1,710
|
|
3.22
|
|
|||||||||||||||
|
Other
(2)(3)
|
130
|
|
39
|
|
30.00
|
|
78
|
|
203
|
|
260.26
|
|
100
|
|
228
|
|
228.00
|
|
|||||||||||||||
|
Total loans, including loans held for sale
|
246,613
|
|
23,388
|
|
9.48
|
|
234,338
|
|
21,203
|
|
9.05
|
|
211,549
|
|
18,785
|
|
8.88
|
|
|||||||||||||||
|
Investment securities
|
68,896
|
|
1,711
|
|
2.48
|
|
66,260
|
|
1,599
|
|
2.41
|
|
63,738
|
|
1,575
|
|
2.47
|
|
|||||||||||||||
|
Cash equivalents and other interest-earning assets
|
6,821
|
|
123
|
|
1.80
|
|
7,198
|
|
89
|
|
1.24
|
|
7,294
|
|
99
|
|
1.36
|
|
|||||||||||||||
|
Total interest-earning assets
|
322,330
|
|
25,222
|
|
7.82
|
|
307,796
|
|
22,891
|
|
7.44
|
|
282,581
|
|
20,459
|
|
7.24
|
|
|||||||||||||||
|
Cash and due from banks
|
3,457
|
|
3,235
|
|
2,970
|
|
|||||||||||||||||||||||||||
|
Allowance for loan and lease losses
|
(7,025
|
)
|
(5,675
|
)
|
(4,582
|
)
|
|||||||||||||||||||||||||||
|
Premises and equipment, net
|
3,931
|
|
3,671
|
|
3,701
|
|
|||||||||||||||||||||||||||
|
Other assets
|
32,231
|
|
30,947
|
|
28,804
|
|
|||||||||||||||||||||||||||
|
Total assets
|
$
|
354,924
|
|
$
|
339,974
|
|
$
|
313,474
|
|
||||||||||||||||||||||||
|
Liabilities and stockholders’ equity:
|
|||||||||||||||||||||||||||||||||
|
Interest-bearing liabilities:
(3)
|
|||||||||||||||||||||||||||||||||
|
Deposits
|
$
|
213,949
|
|
$
|
1,602
|
|
0.75
|
%
|
$
|
198,304
|
|
$
|
1,213
|
|
0.61
|
%
|
$
|
185,677
|
|
$
|
1,091
|
|
0.59
|
%
|
|||||||||
|
Securitized debt obligations
|
18,237
|
|
327
|
|
1.79
|
|
16,576
|
|
216
|
|
1.30
|
|
13,929
|
|
151
|
|
1.08
|
|
|||||||||||||||
|
Senior and subordinated notes
|
27,866
|
|
731
|
|
2.62
|
|
22,417
|
|
476
|
|
2.12
|
|
20,935
|
|
330
|
|
1.58
|
|
|||||||||||||||
|
Other borrowings and liabilities
|
8,917
|
|
102
|
|
1.14
|
|
18,736
|
|
113
|
|
0.60
|
|
11,297
|
|
53
|
|
0.47
|
|
|||||||||||||||
|
Total interest-bearing liabilities
|
268,969
|
|
2,762
|
|
1.03
|
|
$
|
256,033
|
|
2,018
|
|
0.79
|
|
$
|
231,838
|
|
1,625
|
|
0.70
|
|
|||||||||||||
|
Non-interest-bearing deposits
|
25,933
|
|
25,410
|
|
25,312
|
|
|||||||||||||||||||||||||||
|
Other liabilities
|
10,492
|
|
9,778
|
|
8,611
|
|
|||||||||||||||||||||||||||
|
Total liabilities
|
305,394
|
|
291,221
|
|
265,761
|
|
|||||||||||||||||||||||||||
|
Stockholders’ equity
|
49,530
|
|
48,753
|
|
47,713
|
|
|||||||||||||||||||||||||||
|
Total liabilities and stockholders’ equity
|
$
|
354,924
|
|
$
|
339,974
|
|
$
|
313,474
|
|
||||||||||||||||||||||||
|
Net interest income/spread
|
$
|
22,460
|
|
6.79
|
|
$
|
20,873
|
|
6.65
|
|
$
|
18,834
|
|
6.54
|
|
||||||||||||||||||
|
Impact of non-interest-bearing funding
|
0.18
|
|
0.13
|
|
0.12
|
|
|||||||||||||||||||||||||||
|
Net interest margin
|
6.97
|
%
|
6.78
|
%
|
6.66
|
%
|
|||||||||||||||||||||||||||
|
(1)
|
Past due fees included in interest income totaled approximately $1.6 billion, $1.5 billion and $1.4 billion in
2017
,
2016
and
2015
, respectively.
|
|
(2)
|
Some of our commercial loans generate tax-exempt income. Accordingly, we make certain reclassifications to present interest income and yields from our Commercial Banking business on a taxable-equivalent basis, calculated assuming an effective tax rate approximately equal to our federal statutory rate (35% for all periods presented), with offsetting reductions to the Other category.
Taxable-equivalent adjustments included in the interest income and yield computations for our Commercial banking loans totaled approximately $129 million, $126 million and $102 million in 2017, 2016 and 2015, respectively, with corresponding reductions to Other.
|
|
(3)
|
Interest income and interest expense and the calculation of average yields on interest-earning assets and average rates on interest-bearing liabilities include the impact of hedge accounting.
|
|
45
|
Capital One Financial Corporation (COF)
|
|
Net interest income
increased
by
$1.6 billion
to
$22.5 billion
in
2017
compared to
2016
. Net interest margin
increased
by
19
basis points to
6.97%
in
2017
compared to
2016
. These increases were primarily driven by:
|
•
|
growth in our domestic credit card and auto loan portfolios; and
|
|
•
|
higher yields as a result of higher interest rates.
|
These drivers were partially offset by
higher interest expense due to the net effect of higher interest rates, as well as growth and mix changes in our interest-bearing liabilities
.
Net interest income increased by $2.0 billion to $20.9 billion in 2016 compared to 2015 primarily driven by:
|
•
|
growth in our credit card and commercial loan portfolios, including loans acquired from the HFS acquisition; and
|
|
•
|
higher yields as a result of higher interest rates.
|
Net interest margin increased by 12 basis points to 6.78% in 2016 compared to 2015 primarily driven by:
|
•
|
continued growth in our credit card loan portfolio; and
|
|
•
|
continued run-off of our acquired home loan portfolio.
|
This increase was partially offset by:
|
•
|
the impact of loans acquired from the HFS acquisition, which generally have lower net interest margins compared to our total company portfolio; and
|
|
•
|
margin compression in our auto loan portfolio.
|
|
46
|
Capital One Financial Corporation (COF)
|
|
Table
2
displays the change in our net interest income between periods and the extent to which the variance is attributable to:
|
•
|
changes in the volume of our interest-earning assets and interest-bearing liabilities; or
|
|
•
|
changes in the interest rates related to these assets and liabilities.
|
Table
2
:
Rate/Volume Analysis of Net Interest Income
(1)
__________
|
|
2017 vs. 2016
|
2016 vs. 2015
|
||||||||||||||||||||||
|
(Dollars in millions)
|
Total Variance
|
Volume
|
Rate
|
Total Variance
|
Volume
|
Rate
|
||||||||||||||||||
|
Interest income:
|
||||||||||||||||||||||||
|
Loans:
|
||||||||||||||||||||||||
|
Credit card
|
$
|
1,562
|
|
$
|
1,031
|
|
$
|
531
|
|
$
|
1,786
|
|
$
|
1,410
|
|
$
|
376
|
|
||||||
|
Consumer banking
|
447
|
|
210
|
|
237
|
|
77
|
|
17
|
|
60
|
|
||||||||||||
|
Commercial banking
(2)
|
340
|
|
75
|
|
265
|
|
580
|
|
437
|
|
143
|
|
||||||||||||
|
Other
(2)
|
(164
|
)
|
16
|
|
(180
|
)
|
(25
|
)
|
(50
|
)
|
25
|
|
||||||||||||
|
Total loans, including loans held for sale
|
2,185
|
|
1,332
|
|
853
|
|
2,418
|
|
1,814
|
|
604
|
|
||||||||||||
|
Investment securities
|
112
|
|
65
|
|
47
|
|
24
|
|
61
|
|
(37
|
)
|
||||||||||||
|
Cash equivalents and other interest-earning assets
|
34
|
|
(5
|
)
|
39
|
|
(10
|
)
|
(1
|
)
|
(9
|
)
|
||||||||||||
|
Total interest income
|
2,331
|
|
1,392
|
|
939
|
|
2,432
|
|
1,874
|
|
558
|
|
||||||||||||
|
Interest expense:
|
||||||||||||||||||||||||
|
Deposits
|
389
|
|
101
|
|
288
|
|
122
|
|
76
|
|
46
|
|
||||||||||||
|
Securitized debt obligations
|
111
|
|
23
|
|
88
|
|
65
|
|
31
|
|
34
|
|
||||||||||||
|
Senior and subordinated notes
|
255
|
|
128
|
|
127
|
|
146
|
|
25
|
|
121
|
|
||||||||||||
|
Other borrowings and liabilities
|
(11
|
)
|
(59
|
)
|
48
|
|
60
|
|
41
|
|
19
|
|
||||||||||||
|
Total interest expense
|
744
|
|
193
|
|
551
|
|
393
|
|
173
|
|
220
|
|
||||||||||||
|
Net interest income
|
$
|
1,587
|
|
$
|
1,199
|
|
$
|
388
|
|
$
|
2,039
|
|
$
|
1,701
|
|
$
|
338
|
|
||||||
|
(1)
|
We calculate the change in interest income and interest expense separately for each item. The portion of interest income or interest expense attributable to both volume and rate is allocated proportionately when the calculation results in a positive value. When the portion of interest income or interest expense attributable to both volume and rate results in a negative value, the total amount is allocated to volume or rate, depending on which amount is positive.
|
|
(2)
|
Some of our commercial loans generate tax-exempt income. Accordingly, we make certain reclassifications to present interest income and yields from our Commercial Banking business on a taxable-equivalent basis, calculated assuming an effective tax rate approximately equal to our federal statutory rate (35% for all periods presented), with offsetting reductions to the Other category.
|
|
47
|
Capital One Financial Corporation (COF)
|
|
Non-Interest Income
Table
3
displays the components of non-interest income for
2017
,
2016
and
2015
. Certain prior period amounts have been recast to conform to the current period presentation.
Table
3
:
Non-Interest Income
|
|
Year Ended December 31,
|
|||||||||||
|
(Dollars in millions)
|
2017
|
2016
|
2015
|
|||||||||
|
Interchange fees, net
|
$
|
2,573
|
|
$
|
2,452
|
|
$
|
2,264
|
|
|||
|
Service charges and other customer-related fees
|
1,597
|
|
1,646
|
|
1,856
|
|
||||||
|
Net securities gains (losses)
|
65
|
|
(11
|
)
|
(32
|
)
|
||||||
|
Other non-interest income:
|
||||||||||||
|
Mortgage banking revenue
|
201
|
|
166
|
|
147
|
|
||||||
|
Treasury and other investment income
|
126
|
|
83
|
|
107
|
|
||||||
|
Other
|
215
|
|
292
|
|
237
|
|
||||||
|
Total other non-interest income
|
542
|
|
541
|
|
491
|
|
||||||
|
Total non-interest income
|
$
|
4,777
|
|
$
|
4,628
|
|
$
|
4,579
|
|
|||
Non-interest income
increased
by
$149 million
to
$4.8 billion
in
2017
compared to
2016
primarily due to:
|
•
|
an increase in net interchange fees primarily due to higher purchase volume; and
|
|
•
|
gains from
the sale of investment securities as a result of portfolio repositioning
.
|
Non-interest income increased by
$49 million
to
$4.6 billion
in
2016
compared to
2015
primarily driven by:
|
•
|
an increase in interchange fees driven by higher purchase volume in our Credit Card business, net of rewards expense from the continued expansion of our rewards franchise; and
|
|
•
|
higher revenue attributable to our multifamily business in our Commercial Banking business.
|
These increases were partially offset by:
|
•
|
lower service charges and other customer-related fees primarily due to the
exit of our legacy payment protection products in our Domestic Card business during the first quarter of 2016
.
|
Provision for Credit Losses
Our provision for credit losses in each period is driven by net charge-offs, changes to the allowance for loan and lease losses and changes to the reserve for unfunded lending commitments. We recorded a provision for credit losses of
$7.6 billion
,
$6.5 billion
and
$4.5 billion
in
2017
,
2016
and
2015
, respectively. The provision for credit losses as a percentage of net interest income was
33.6%
,
30.9%
and
24.1%
in
2017
,
2016
and
2015
, respectively.
Our provision for credit losses
increased
by
$1.1 billion
in
2017
compared to
2016
primarily driven by:
|
•
|
higher charge-offs in our domestic credit card loan portfolio due to growth and portfolio seasoning; and
|
|
•
|
higher charge-offs in our auto loan portfolio due to growth.
|
These drivers were partially offset by lower provision in our commercial banking loan portfolio primarily driven by
stabilizing industry conditions impacting our oil and gas lending portfolio compared to adverse industry conditions in the prior year
.
Our provision for credit losses increased by
$1.9 billion
in
2016
compared to
2015
primarily driven by:
|
•
|
higher charge-offs and a larger allowance build in our credit card loan portfolio due to growth and portfolio seasoning;
|
|
•
|
higher charge-offs in our commercial loan portfolio as a result of continued adverse industry conditions impacting our taxi medallion and oil and gas lending portfolios; and
|
|
•
|
higher allowance in our auto loan portfolio due to continued loan growth, increasing loss expectations on recent originations and a build reflecting a change in accounting estimate of the timing of charge-offs of bankrupt accounts.
|
We provide additional information on the provision for credit losses and changes in the allowance for loan and lease losses within “MD&A—Credit Risk Profile,” “
Note 4—Loans
” and “
Note 5—Allowance for Loan and Lease Losses and Reserve for Unfunded Lending Commitments
.” For information on the allowance methodology for each of our loan categories, see “
Note 1—Summary of Significant Accounting Policies
.”
Non-Interest Expense
Table
4
displays the components of non-interest expense for
2017
,
2016
and
2015
. Certain prior period amounts have been recast to conform to the current period presentation.
Table
4
:
Non-Interest Expense
|
Year Ended December 31,
|
||||||||||||
|
(Dollars in millions)
|
2017
|
2016
|
2015
|
|||||||||
|
Salaries and associate benefits
|
$
|
5,899
|
|
$
|
5,202
|
|
$
|
4,975
|
|
|||
|
Occupancy and equipment
|
1,939
|
|
1,944
|
|
1,829
|
|
||||||
|
Marketing
|
1,670
|
|
1,811
|
|
1,744
|
|
||||||
|
Professional services
|
1,097
|
|
1,075
|
|
1,120
|
|
||||||
|
Communications and data processing
|
1,177
|
|
1,169
|
|
1,055
|
|
||||||
|
Amortization of intangibles
|
245
|
|
386
|
|
430
|
|
||||||
|
Other non-interest expense:
|
||||||||||||
|
Bankcard, regulatory and other fee assessments
|
626
|
|
540
|
|
444
|
|
||||||
|
Collections
|
364
|
|
313
|
|
322
|
|
||||||
|
Fraud losses
|
334
|
|
331
|
|
316
|
|
||||||
|
Other
|
843
|
|
787
|
|
761
|
|
||||||
|
Total other non-interest expense
|
2,167
|
|
1,971
|
|
1,843
|
|
||||||
|
Total non-interest expense
|
$
|
14,194
|
|
$
|
13,558
|
|
$
|
12,996
|
|
|||
Non-interest expense
increased
by
$636 million
to
$14.2 billion
in
2017
compared to
2016
primarily due to:
|
•
|
higher operating expenses associated with loan growth, as well as continued investments in technology and infrastructure; and
|
|
•
|
restructuring activities, which primarily consisted of severance and related benefits pursuant to our ongoing benefit programs, that are the result of exiting certain business activities and locations
.
|
These increases were partially offset by:
|
•
|
lower marketing expenses; and
|
|
•
|
lower amortization of intangibles.
|
Non-interest expense increased by
$562 million
to
$13.6 billion
in
2016
compared to
2015
, primarily due to:
|
•
|
higher operating and marketing expenses associated with loan growth, as well as continued investments in technology and infrastructure;
|
|
48
|
Capital One Financial Corporation (COF)
|
|
|
•
|
higher bank optimization charges; and
|
|
•
|
higher FDIC surcharges and premiums.
|
Income (Loss) from Discontinued Operations, Net of Tax
Income (loss) from discontinued operations consists of results from the discontinued mortgage origination operations of our wholesale mortgage banking unit, GreenPoint Mortgage Funding, Inc. (“GreenPoint”) and the discontinued manufactured housing operations of GreenPoint Credit, LLC, a subsidiary of GreenPoint, both of which were acquired as part of the North Fork Bancorporation, Inc. (“North Fork”) acquisition in December 2006. Loss from discontinued operations, net of tax, was
$135 million
in
2017
,
primarily driven by a mortgage representation and warranty settlement in the fourth quarter of 2017
, compared to loss of
$19 million
in
2016
and income of
$38 million
in
2015
.
We provide additional information on discontinued operations in “
Note 2—
Business Developments and Discontinued Operations
” and on the net benefit (provision) for mortgage representation and warranty losses and the related reserve for representation and warranty claims in “MD&A—
Consolidated Balance Sheets Analysis
—Mortgage Representation and Warranty Reserve” and “
Note 19—Commitments, Contingencies, Guarantees and Others
.”
Income Taxes
We recorded income tax provision of
$3.4 billion
(
61.5%
effective income tax rate) in 2017, which includes charges of
$1.8 billion
associated with the estimated impacts of the Tax Act. The estimated impacts of the Tax Act consist of:
|
•
|
$1.6 billion due to the revaluation of our net deferred tax assets reflecting the reduction in the U.S. corporate tax rate from 35% to 21%
;
|
|
•
|
$125 million related to the deemed repatriation of our undistributed foreign earnings
; and
|
|
•
|
$76 million associated with the revaluation of our investments in affordable housing projects
.
|
The impacts of the Tax Act are considered to be reasonable estimates that are provisional in nature and are subject to potential adjustment during the measurement period ending no later than December 2018. See “MD&A—
Accounting Changes and Developments
” for more information on the accounting for the impacts of the Tax Act.
We recorded income tax provisions of $1.7 billion (31.3% effective income tax rate) and $1.9 billion (31.8% effective income tax rate) in
2016
and
2015
, respectively. Our effective tax rate on income from continuing operations varies between periods due, in part, to fluctuations in our pre-tax earnings, which affects the relative tax benefit of tax-exempt income, tax credits and other permanent tax items.
The increase in our effective income tax rate in
2017
compared to
2016
was primarily due to charges of
$1.8 billion
associated with the impacts of the Tax Act, partially offset by a relative increase in the amount of tax credits and tax-exempt income.
The decrease in our effective income tax rate in 2016 compared to 2015 was primarily due to lower income before taxes and increased tax credits. This decrease was partially offset by reduced discrete tax benefits and a reduced benefit of lower taxed foreign earnings.
We recorded total discrete tax expense of
$1.7 billion
in 2017, primarily consisting of the charges of
$1.8 billion
for the estimated impacts of the Tax Act, and discrete tax benefits of
$2 million
and
$15 million
in
2016
and
2015
, respectively. Our effective income tax rate, excluding the impact of discrete tax items, was
29.9%
,
31.3%
and
32.0%
in
2017
,
2016
and
2015
, respectively.
We provide additional information on items affecting our income taxes and effective tax rate in “
Note 16—Income Taxes
.”
|
CONSOLIDATED BALANCE SHEETS ANALYSIS
|
Total assets
increased
by
$8.7 billion
to
$365.7 billion
as of
December 31, 2017
from
December 31, 2016
primarily driven by an increase in loans held for investment
primarily due to growth in our domestic credit card loan portfolio, largely driven by loans obtained in the Cabela’s acquisition, as well as growth in our auto loan portfolio, partially offset by run-off of our acquired home loan portfolio
.
Total liabilities
increased
by
$7.4 billion
to
$317.0 billion
as of
December 31, 2017
from
December 31, 2016
primarily driven by:
|
•
|
an increase in our senior and subordinated notes; and
|
|
•
|
an increase in our deposits.
|
These drivers were partially offset by a decrease in our Federal Home Loan Banks (“FHLB”) advances outstanding, which is included in other debt.
|
49
|
Capital One Financial Corporation (COF)
|
|
Stockholders’ equity
increased
by
$1.2 billion
to
$48.7 billion
as of
December 31, 2017
from
December 31, 2016
primarily due to our net income of
$2.0 billion
in
2017
, partially offset by
$1.0 billion
of dividend payments to our common and preferred stockholders.
The following is a discussion of material changes in the major components of our assets and liabilities during
2017
. Period-end balance sheet amounts may vary from average balance sheet amounts due to liquidity and balance sheet management activities that are intended to ensure the adequacy of capital while managing the liquidity requirements of the Company, our customers and our market risk exposure in accordance with our risk appetite.
Investment Securities
Our investment portfolio consists primarily of the following: U.S. Treasury securities; U.S. government-sponsored enterprise or agency (“Agency”) and non-agency residential mortgage-backed securities (“RMBS”); Agency commercial mortgage-backed securities (“CMBS”); other asset-backed securities (“ABS”); and other securities.
Agency securities include Government National Mortgage Association (“Ginnie Mae”) guaranteed securities, Federal National Mortgage Association (“Fannie Mae”) and Federal Home Loan Mortgage Corporation (“Freddie Mac”) issued securities. The carrying value of our investments in U.S. Treasury and Agency securities represented
95%
and
91%
of our total investment securities as of
December 31, 2017
and
2016
, respectively.
The fair value of our available for sale securities portfolio was
$37.7 billion
as of
December 31, 2017
, a
decrease
of
$3.1 billion
from
December 31, 2016
. The
decrease
in fair value was primarily due to
the sale of investment securities as a result of portfolio repositioning
. The fair value of our held to maturity securities portfolio was
$29.4 billion
as of
December 31, 2017
, an
increase
of
$3.2 billion
from
December 31, 2016
. The
increase
in fair value was primarily driven by
purchases outpacing paydowns
.
Table
5
presents the amortized cost, carrying value and fair value for the major categories of our investment securities portfolio as of
December 31, 2017
,
2016
and
2015
.
Table
5
:
Investment Securities
__________
|
December 31,
|
||||||||||||||||||||||||
|
2017
|
2016
|
2015
|
||||||||||||||||||||||
|
(Dollars in millions)
|
Amortized
Cost
|
Fair
Value
|
Amortized
Cost
|
Fair
Value
|
Amortized
Cost
|
Fair
Value
|
||||||||||||||||||
|
Investment securities available for sale:
|
||||||||||||||||||||||||
|
U.S. Treasury securities
|
$
|
5,168
|
|
$
|
5,171
|
|
$
|
5,103
|
|
$
|
5,065
|
|
$
|
4,664
|
|
$
|
4,660
|
|
||||||
|
RMBS:
|
||||||||||||||||||||||||
|
Agency
|
26,013
|
|
25,678
|
|
26,830
|
|
26,527
|
|
24,332
|
|
24,285
|
|
||||||||||||
|
Non-agency
|
1,722
|
|
2,114
|
|
2,349
|
|
2,722
|
|
2,680
|
|
3,026
|
|
||||||||||||
|
Total RMBS
|
27,735
|
|
27,792
|
|
29,179
|
|
29,249
|
|
27,012
|
|
27,311
|
|
||||||||||||
|
CMBS
|
3,209
|
|
3,175
|
|
5,011
|
|
4,988
|
|
5,413
|
|
5,379
|
|
||||||||||||
|
Other ABS
|
513
|
|
512
|
|
714
|
|
714
|
|
1,345
|
|
1,340
|
|
||||||||||||
|
Other securities
(1)
|
1,003
|
|
1,005
|
|
726
|
|
721
|
|
370
|
|
371
|
|
||||||||||||
|
Total investment securities available for sale
|
$
|
37,628
|
|
$
|
37,655
|
|
$
|
40,733
|
|
$
|
40,737
|
|
$
|
38,804
|
|
$
|
39,061
|
|
||||||
|
(Dollars in millions)
|
Carrying Value
|
Fair
Value
|
Carrying Value
|
Fair
Value
|
Carrying Value
|
Fair
Value
|
||||||||||||||||||
|
Investment securities held to maturity:
|
||||||||||||||||||||||||
|
U.S. Treasury securities
|
$
|
200
|
|
$
|
200
|
|
$
|
199
|
|
$
|
199
|
|
$
|
199
|
|
$
|
198
|
|
||||||
|
Agency RMBS
|
24,980
|
|
25,395
|
|
22,125
|
|
22,573
|
|
21,513
|
|
22,133
|
|
||||||||||||
|
Agency CMBS
|
3,804
|
|
3,842
|
|
3,388
|
|
3,424
|
|
2,907
|
|
2,986
|
|
||||||||||||
|
Total investment securities held to maturity
|
$
|
28,984
|
|
$
|
29,437
|
|
$
|
25,712
|
|
$
|
26,196
|
|
$
|
24,619
|
|
$
|
25,317
|
|
||||||
|
(1)
|
Includes supranational bonds, foreign government bonds, mutual funds and equity investments
.
|
|
50
|
Capital One Financial Corporation (COF)
|
|
Credit Ratings
Our portfolio of investment securities continues to be concentrated in securities that generally have high credit ratings and low credit risk, such as securities issued and guaranteed by the U.S. Treasury and Agencies. As of
December 31, 2017
and
2016
, approximately
96%
and
95%
of our total investment securities portfolio was rated AA+ or its equivalent, or better, respectively, while approximately
3%
and
4%
was below investment grade, respectively. We categorize the credit ratings of our investment securities based on the lower of credit ratings issued by Standard & Poor’s Ratings Services (“S&P”) and Moody’s Investors Service (“Moody’s”).
Table
6
provides information on the credit ratings of our non-agency RMBS, non-agency CMBS, other ABS and other securities in our portfolio as of
December 31, 2017
and
2016
. We sold all of our non-agency CMBS during 2017.
Table
6
:
Non-Agency Investment Securities Credit Ratings
__________
|
December 31, 2017
|
December 31, 2016
|
|||||||||||||||||||||||||
|
(Dollars in millions)
|
Fair Value
|
AAA
|
Other
Investment
Grade
|
Below
Investment
Grade
(1)
|
Fair Value
|
AAA
|
Other
Investment
Grade
|
Below
Investment Grade (1) |
||||||||||||||||||
|
Non-agency RMBS
|
$
|
2,114
|
|
—
|
|
3
|
%
|
97
|
%
|
$
|
2,722
|
|
—
|
|
3
|
%
|
97
|
%
|
||||||||
|
Non-agency CMBS
|
—
|
|
—
|
|
—
|
|
—
|
|
1,684
|
|
100
|
%
|
—
|
|
—
|
|
||||||||||
|
Other ABS
|
512
|
|
100
|
%
|
—
|
|
—
|
|
714
|
|
99
|
|
1
|
|
—
|
|
||||||||||
|
Other securities
|
1,005
|
|
71
|
|
19
|
|
10
|
|
721
|
|
62
|
|
25
|
|
13
|
|
||||||||||
|
(1)
|
Includes investment securities that were not rated.
|
For additional information on our investment securities, see “
Note 3—Investment Securities
.”
Loans Held for Investment
Total loans held for investment consists of both unsecuritized loans and loans held in our consolidated trusts. Table
7
summarizes the carrying value of our portfolio of loans held for investment by portfolio segment, the allowance for loan and lease losses, and net loan balance as of
December 31, 2017
and
2016
.
Table
7
:
Loans Held for Investment
|
|
December 31, 2017
|
December 31, 2016
|
||||||||||||||||||||||
|
(Dollars in millions)
|
Loans
|
Allowance
|
Net Loans
|
Loans
|
Allowance
|
Net Loans
|
||||||||||||||||||
|
Credit Card
|
$
|
114,762
|
|
$
|
5,648
|
|
$
|
109,114
|
|
$
|
105,552
|
|
$
|
4,606
|
|
$
|
100,946
|
|
||||||
|
Consumer Banking
|
75,078
|
|
1,242
|
|
73,836
|
|
73,054
|
|
1,102
|
|
71,952
|
|
||||||||||||
|
Commercial Banking
|
64,575
|
|
611
|
|
63,964
|
|
66,916
|
|
793
|
|
66,123
|
|
||||||||||||
|
Other
|
58
|
|
1
|
|
57
|
|
64
|
|
2
|
|
62
|
|
||||||||||||
|
Total
|
$
|
254,473
|
|
$
|
7,502
|
|
$
|
246,971
|
|
$
|
245,586
|
|
$
|
6,503
|
|
$
|
239,083
|
|
||||||
Loans held for investment
increased
by
$8.9 billion
to
$254.5 billion
as of
December 31, 2017
from
December 31, 2016
primarily due to growth in our domestic credit card loan portfolio, largely driven by loans obtained in the Cabela’s acquisition, as well as growth in our auto loan portfolio, partially offset by run-off of our acquired home loan portfolio
.
We provide additional information on the composition of our loan portfolio and credit quality below in “MD&A—
Credit Risk Profile
,” “MD&A—
Consolidated Results of Operations
” and “
Note 4—Loans
.”
Deposits
Our deposits represent our largest source of funding for our operations and provide a consistent source of low-cost funds. Total deposits
increased
by
$6.9 billion
to
$243.7 billion
as of
December 31, 2017
from
December 31, 2016
. We provide information on the composition of our deposits, average outstanding balances, interest expense and yield in “MD&A—
Liquidity Risk Profile
.”
|
51
|
Capital One Financial Corporation (COF)
|
|
Securitized Debt Obligations
Securitized debt obligations
increased
to
$20.0 billion
as of
December 31, 2017
from
$18.8 billion
as of
December 31, 2016
primarily driven by securitized debt obligations assumed in the Cabela’s acquisition, partially offset by maturities outpacing issuances. We provide additional information on our borrowings in “MD&A—
Liquidity Risk Profile
” and in “
Note 9—Deposits and Borrowings
.”
Other Debt
Other debt, which consists primarily of federal funds purchased and securities loaned or sold under agreements to repurchase, senior and subordinated notes, and FHLB advances, totaled
$40.3 billion
as of
December 31, 2017
, of which
$39.7 billion
represented long-term debt and the remainder represented short-term borrowings.
Other debt totaled
$41.6 billion
as of
December 31, 2016
, of which
$40.6 billion
represented long-term debt and the remainder represented short-term borrowings.
The
decrease
in other debt of
$1.4 billion
in
2017
was
primarily attributable to a decrease in our FHLB advances outstanding, partially offset by an increase in our senior and subordinated notes
. We provide additional information on our borrowings in “MD&A—
Liquidity Risk Profile
” and in “
Note 9—Deposits and Borrowings
.”
Mortgage Representation and Warranty Reserve
We face residual exposure related to subsidiaries that originated residential mortgage loans and sold these loans to various purchasers, including purchasers who created securitization trusts. We establish representation and warranty reserves for losses associated with the mortgage loans sold by each subsidiary that we consider to be both probable and reasonably estimable. These reserves are reported on our consolidated balance sheets as a component of other liabilities. As a result of resolutions and settlements of the substantial majority of our active representation and warranty matters in 2017, our reserve was immaterial as of December 31, 2017. See “
Note 19—Commitments, Contingencies, Guarantees and Others
” for additional information.
Deferred Tax Assets and Liabilities
Deferred tax assets and liabilities represent decreases or increases in taxes expected to be paid in the future because of future reversals of temporary differences between the financial reporting and tax bases of assets and liabilities, as well as from net operating loss and tax credit carryforwards. Deferred tax assets are recognized subject to management’s judgment that realization is more likely than not. We evaluate the recoverability of these future tax deductions by assessing the adequacy of expected taxable income from all sources, including taxable income in carryback years, reversal of taxable temporary differences, forecasted operating earnings and available tax planning strategies. These sources of income rely heavily on estimates. We use our historical experience and our short and long-range business forecasts to provide insight.
Deferred tax assets, net of deferred tax liabilities and valuation allowances, were approximately $2.9 billion as of December 31, 2017, a decrease of $1.4 billion from December 31, 2016. The decrease in our net deferred tax assets was primarily driven by the revaluation reflecting the reduction in the U.S. corporate tax rate from 35% to 21% effective January 1, 2018, as a result of the Tax Act. The impacts of the Tax Act are considered to be reasonable estimates that are provisional in nature and are subject to potential adjustment during the measurement period ending no later than December 2018. See “MD&A—
Accounting Changes and Developments
” for more information on the accounting for the impacts of the Tax Act.
We have recorded valuation allowances of $226 million and $179 million as of December 31, 2017 and 2016, respectively. The increase in valuation allowance was primarily driven by the reduction in federal income tax rate as a result of the Tax Act. We expect to fully realize the 2017 net deferred tax asset amounts in future periods. If changes in circumstances lead us to change our judgment about our ability to realize deferred tax assets in future years, we will adjust our valuation allowances in the period that our change in judgment occurs and record a corresponding increase or charge to income.
We provide additional information on income taxes in “MD&A—
Consolidated Results of Operations
” and in “
Note 16—Income Taxes
.”
|
52
|
Capital One Financial Corporation (COF)
|
|
|
OFF-BALANCE SHEET ARRANGEMENTS
|
In the ordinary course of business, we engage in certain activities that are not reflected on our consolidated balance sheets, generally referred to as off-balance sheet arrangements. These activities typically involve transactions with unconsolidated variable interest entities (“VIEs”) as well as other arrangements, such as letter of credits, loan commitments and guarantees, to meet the financing needs of our customers and support their ongoing operations. We provide additional information regarding these types of activities in “
Note 6—Variable Interest Entities and Securitizations
” and “
Note 19—Commitments, Contingencies, Guarantees and Others
.”
|
BUSINESS SEGMENT FINANCIAL PERFORMANCE
|
Our principal operations are organized into three major business segments, which are defined based on the products and services provided or the type of customer served: Credit Card, Consumer Banking and Commercial Banking. The operations of acquired businesses have been integrated into our existing business segments. Certain activities that are not part of a segment, such as management of our corporate investment portfolio and asset/liability management by our centralized Corporate Treasury group, are included in the Other category.
The results of our individual businesses, which we report on a continuing operations basis, reflect the manner in which management evaluates performance and makes decisions about funding our operations and allocating resources. We may periodically change our business segments or reclassify business segment results based on modifications to our management reporting methodologies and changes in organizational alignment. Our business segment results are intended to reflect each segment as if it were a stand-alone business. We use an internal management and reporting process to derive our business segment results. Our internal management and reporting process employs various allocation methodologies, including funds transfer pricing, to assign certain balance sheet assets, deposits and other liabilities and their related revenue and expenses directly or indirectly attributable to each business segment. Total interest income and net fees are directly attributable to the segment in which they are reported. The net interest income of each segment reflects the results of our funds transfer pricing process, which is primarily based on a matched maturity method that takes into consideration market interest rates. Our funds transfer pricing process provides a funds credit for sources of funds, such as deposits generated by our Consumer Banking and Commercial Banking businesses, and a charge for the use of funds by each segment. The allocation process is unique to each business segment and acquired businesses. We regularly assess the assumptions, methodologies and reporting classifications used for segment reporting, which may result in the implementation of refinements or changes in future periods.
We refer to the business segment results derived from our internal management accounting and reporting process as our “managed” presentation, which differs in some cases from our reported results prepared based on U.S. GAAP. There is no comprehensive authoritative body of guidance for management accounting equivalent to U.S. GAAP; therefore, the managed presentation of our business segment results may not be comparable to similar information provided by other financial services companies. In addition, our individual business segment results should not be used as a substitute for comparable results determined in accordance with U.S. GAAP.
Below we summarize our business segment results, changes in our financial condition and credit performance metrics for the years ended
December 31, 2017
,
2016
and
2015
, as well as a comparative discussion of these results. We provide a reconciliation of our total business segment results to our reported consolidated results in “
Note 18—Business Segments
.”
Business Segment Financial Performance
Table
8
summarizes our business segment results, which we report based on revenue and income from continuing operations, for the years ended
December 31, 2017
,
2016
and
2015
. We provide information on the allocation methodologies used to derive our business segment results in “
Note 18—Business Segments
.”
Table
8
:
Business Segment Results
|
|
Year Ended December 31,
|
|||||||||||||||||||||||||||||||||||||||||
|
|
2017
|
2016
|
2015
|
|||||||||||||||||||||||||||||||||||||||
|
|
Total Net
Revenue (1) |
Net Income
(Loss)
(2)
|
Total Net
Revenue (1) |
Net Income
(2)
|
Total Net
Revenue (1) |
Net Income
(2)
|
||||||||||||||||||||||||||||||||||||
|
(Dollars in millions)
|
Amount
|
% of
Total |
Amount
|
% of
Total |
Amount
|
% of
Total |
Amount
|
% of
Total |
Amount
|
% of
Total |
Amount
|
% of
Total |
||||||||||||||||||||||||||||||
|
Credit Card
|
$
|
16,973
|
|
62
|
%
|
$
|
1,920
|
|
91
|
%
|
$
|
16,015
|
|
62
|
%
|
$
|
2,160
|
|
58
|
%
|
$
|
14,582
|
|
62
|
%
|
$
|
2,354
|
|
59
|
%
|
||||||||||||
|
Consumer Banking
|
7,129
|
|
26
|
|
1,090
|
|
51
|
|
6,562
|
|
26
|
|
870
|
|
23
|
|
6,465
|
|
28
|
|
1,034
|
|
26
|
|
||||||||||||||||||
|
Commercial Banking
(3)
|
2,969
|
|
11
|
|
676
|
|
32
|
|
2,794
|
|
11
|
|
575
|
|
15
|
|
2,352
|
|
10
|
|
570
|
|
14
|
|
||||||||||||||||||
|
Other
(3)
|
166
|
|
1
|
|
(1,569
|
)
|
(74
|
)
|
130
|
|
1
|
|
165
|
|
4
|
|
14
|
|
—
|
|
54
|
|
1
|
|
||||||||||||||||||
|
Total
|
$
|
27,237
|
|
100
|
%
|
$
|
2,117
|
|
100
|
%
|
$
|
25,501
|
|
100
|
%
|
$
|
3,770
|
|
100
|
%
|
$
|
23,413
|
|
100
|
%
|
$
|
4,012
|
|
100
|
%
|
||||||||||||
|
53
|
Capital One Financial Corporation (COF)
|
|
__________
|
(1)
|
Total net revenue consists of net interest income and non-interest income.
|
|
(2)
|
Net income (loss) for our business segments and the Other category is based on income (loss) from continuing operations, net of tax.
|
|
(3)
|
Some of our commercial investments generate tax-exempt income or tax credits. Accordingly, we make certain reclassifications within our Commercial Banking business results to present revenues and yields on a taxable-equivalent basis, calculated assuming an effective tax rate approximately equal to our federal statutory tax rate (35% for all periods presented), with offsetting reductions to the Other category.
|
Credit Card Business
The primary sources of revenue for our Credit Card business are interest income, net interchange income and fees collected from customers. Expenses primarily consist of the provision for credit losses, operating costs and marketing expenses.
Our Credit Card business generated net income from continuing operations of
$1.9 billion
,
$2.2 billion
and
$2.4 billion
in
2017
,
2016
and
2015
, respectively.
Table
9
summarizes the financial results of our Credit Card business and displays selected key metrics for the periods indicated.
Table
9
:
Credit Card Business Results
__________
|
|
Year Ended December 31,
|
Change
|
||||||||||||||||
|
(Dollars in millions, except as noted)
|
2017
|
2016
|
2015
|
2017 vs. 2016
|
2016 vs. 2015
|
|||||||||||||
|
Selected income statement data:
|
||||||||||||||||||
|
Net interest income
|
$
|
13,648
|
|
$
|
12,635
|
|
$
|
11,161
|
|
8
|
%
|
13
|
%
|
|||||
|
Non-interest income
|
3,325
|
|
3,380
|
|
3,421
|
|
(2
|
)
|
(1
|
)
|
||||||||
|
Total net revenue
(1)
|
16,973
|
|
16,015
|
|
14,582
|
|
6
|
|
10
|
|
||||||||
|
Provision for credit losses
|
6,066
|
|
4,926
|
|
3,417
|
|
23
|
|
44
|
|
||||||||
|
Non-interest expense
|
7,916
|
|
7,703
|
|
7,502
|
|
3
|
|
3
|
|
||||||||
|
Income from continuing operations before income taxes
|
2,991
|
|
3,386
|
|
3,663
|
|
(12
|
)
|
(8
|
)
|
||||||||
|
Income tax provision
|
1,071
|
|
1,226
|
|
1,309
|
|
(13
|
)
|
(6
|
)
|
||||||||
|
Income from continuing operations, net of tax
|
$
|
1,920
|
|
$
|
2,160
|
|
$
|
2,354
|
|
(11
|
)
|
(8
|
)
|
|||||
|
Selected performance metrics:
|
||||||||||||||||||
|
Average loans held for investment
(2)
|
$
|
103,468
|
|
$
|
96,560
|
|
$
|
86,735
|
|
7
|
|
11
|
|
|||||
|
Average yield on loans held for investment
(3)
|
15.21
|
%
|
14.68
|
%
|
14.28
|
%
|
53
|
bps
|
40
|
bps
|
||||||||
|
Total net revenue margin
(4)
|
16.40
|
|
16.59
|
|
16.81
|
|
(19
|
)
|
(22
|
)
|
||||||||
|
Net charge-offs
|
$
|
5,054
|
|
$
|
3,953
|
|
$
|
2,918
|
|
28
|
%
|
35
|
%
|
|||||
|
Net charge-off rate
|
4.88
|
%
|
4.09
|
%
|
3.36
|
%
|
79
|
bps
|
73
|
bps
|
||||||||
|
Purchase volume
(5)
|
$
|
336,440
|
|
$
|
307,138
|
|
$
|
271,167
|
|
10
|
%
|
13
|
%
|
|||||
|
(Dollars in millions, except as noted)
|
December 31, 2017
|
December 31, 2016
|
Change
|
|||||||||||||||
|
Selected period-end data:
|
||||||||||||||||||
|
Loans held for investment
(2)
|
$
|
114,762
|
|
$
|
105,552
|
|
9
|
%
|
|
|||||||||
|
30+ day performing delinquency rate
|
3.98
|
%
|
3.91
|
%
|
7
|
bps
|
|
|
||||||||||
|
30+ day delinquency rate
|
3.99
|
|
3.94
|
|
5
|
|
|
|||||||||||
|
Nonperforming loan rate
(6)
|
0.02
|
|
0.04
|
|
(2
|
)
|
|
|
||||||||||
|
Allowance for loan and lease losses
|
$
|
5,648
|
|
$
|
4,606
|
|
23
|
%
|
|
|||||||||
|
Allowance coverage ratio
|
4.92
|
%
|
4.36
|
%
|
56
|
bps
|
|
|||||||||||
|
(1)
|
We recognize billed finance charges and fee income on open-ended loans in accordance with the contractual provisions of the credit arrangements and estimate the uncollectible amount on a quarterly basis. The estimated uncollectible amount of billed finance charges and fees is reflected as a reduction in revenue and is not included in our net charge-offs. Total net revenue was reduced by
$1.4 billion
,
$1.1 billion
and $732 million in
2017
,
2016
and
2015
, respectively, for the estimated uncollectible amount of billed finance charges and fees and related losses. The finance charge and fee reserve totaled
$491 million
and
$402 million
as of
December 31, 2017
and
2016
, respectively.
|
|
(2)
|
Period-end loans held for investment and average loans held for investment include billed finance charges and fees, net of the estimated uncollectible amount.
|
|
54
|
Capital One Financial Corporation (COF)
|
|
|
(3)
|
Average yield on loans held for investment is calculated by dividing interest income for the period by average loans held for investment during the period. Interest income excludes various allocations including funds transfer pricing that assigns certain balance sheet assets, deposits and other liabilities and their related revenue and expenses attributable to each business segment.
|
|
(4)
|
Total net revenue margin is calculated by dividing
total net revenue
for the period by average loans held for investment during the period. Interest income also includes interest income on loans held for sale.
|
|
(5)
|
Purchase volume consists of purchase transactions, net of returns, for the period for loans both classified as held for investment and held for sale, and excludes cash advance and balance transfer transactions.
|
|
(6)
|
Within our credit card loan portfolio, only certain loans in our international card businesses are classified as nonperforming. See “MD&A—
Nonperforming Loans and Other Nonperforming Assets
” for additional information.
|
Key factors affecting the results of our Credit Card business for
2017
compared to
2016
, and changes in financial condition and credit performance between
December 31, 2017
and
December 31, 2016
include the following:
|
•
|
Net Interest Income:
Net interest income
increased
by
$1.0 billion
to
$13.6 billion
in
2017
primarily driven by loan growth in our Domestic Card business.
|
|
•
|
Non-Interest Income:
Non-interest income was substantially flat at
$3.3 billion
in
2017
primarily driven by:
|
|
◦
|
lower service charges and other customer-related fees, including the impact of the exit of our legacy payment protection products in our Domestic Card business during the first quarter of 2016; and
|
|
◦
|
the absence of a gain recorded in the second quarter of 2016 related to the exchange of our ownership interest in Visa Europe with Visa Inc. as a result of Visa Inc.’s acquisition of Visa Europe.
|
These drivers were largely offset by an increase in net interchange fees primarily due to higher purchase volume.
|
•
|
Provision for Credit Losses:
The provision for credit losses
increased
by
$1.1 billion
to
$6.1 billion
in
2017
primarily driven by:
|
|
◦
|
higher charge-offs in our domestic credit card loan portfolio due to growth and portfolio seasoning; and
|
|
◦
|
a larger allowance build in our domestic credit card loan portfolio primarily due to increasing losses from recent vintages and portfolio seasoning.
|
|
•
|
Non-Interest Expense:
Non-interest expense
increased
by
$213 million
to
$7.9 billion
in
2017
, primarily driven by higher operating expenses associated with loan growth and continued investments in technology and infrastructure.
|
This driver was partially offset by:
|
◦
|
lower marketing expenses;
|
|
◦
|
lower amortization of intangibles; and
|
|
◦
|
operating efficiencies.
|
|
•
|
Loans Held for Investment:
Period-end loans held for investment
increased
by
$9.2 billion
to
$114.8 billion
as of
December 31, 2017
from
December 31, 2016
primarily due to:
|
|
◦
|
growth in our domestic credit card loan portfolio, largely driven by loans obtained in the Cabela’s acquisition; and
|
|
◦
|
the impact of foreign exchange rates in our international card businesses driven by the weakening of the U.S. dollar in 2017.
|
Average loans held for investment
increased
by
$6.9 billion
to
$103.5 billion
in
2017
compared to
2016
primarily due to growth in our Domestic Card business.
|
•
|
Net Charge-Off and Delinquency Metrics:
The net charge-off rate
increased
by
79
basis points to
4.88%
in
2017
compared to
2016
primarily driven by
growth and seasoning of recent domestic credit card loan originations
. The 30+ day delinquency rate
increased
by
5
basis points to
3.99%
as of
December 31, 2017
from
December 31, 2016
primarily due to
growth and seasoning of recent domestic credit card loan originations
, partially offset by loans obtained in the Cabela’s acquisition.
|
|
55
|
Capital One Financial Corporation (COF)
|
|
Key factors affecting the results of our Credit Card business for 2016 compared to 2015, and changes in financial condition and credit performance between December 31, 2016 and December 31, 2015 include the following:
|
•
|
Net Interest Income:
Net interest income increased by $1.5 billion to $12.6 billion in 2016 primarily driven by loan growth in our Domestic Card business.
|
|
•
|
Non-Interest Income:
Non-interest income was flat at $3.4 billion in 2016 as an increase in interchange fees driven by higher purchase volume was largely offset by:
|
|
◦
|
higher rewards expense from the continued expansion of our rewards franchise; and
|
|
◦
|
lower service charges and other customer-related fees primarily due to the exit of our legacy payment protection products in our Domestic Card business during the first quarter of 2016.
|
|
•
|
Provision for Credit Losses:
The provision for credit losses increased by $1.5 billion to $4.9 billion in 2016 primarily driven by higher charge-offs and a larger allowance build due to continued loan growth and portfolio seasoning.
|
|
•
|
Non-Interest Expense:
Non-interest expense increased by $201 million to $7.7 billion in 2016 primarily attributable to higher operating expenses associated with loan growth as well as continued investments in technology, partially offset by operating efficiencies.
|
|
•
|
Loans Held for Investment:
Period-end loans held for investment increased by $9.4 billion to $105.6 billion as of December 31, 2016 from December 31, 2015, and average loans held for investment increased by $9.8 billion to $96.6 billion in 2016 compared to 2015, both primarily due to continued loan growth in our Domestic Card business.
|
|
•
|
Net Charge-Off and Delinquency Metrics:
The net charge-off rate increased by 73 basis points to 4.09% in 2016 compared to 2015, and the 30+ day delinquency rate
increased
by 54 basis points to 3.94% as of December 31, 2016 from December 31, 2015. These increases were primarily driven by growth and seasoning of credit card loan originations, partially offset by continued growth in our domestic credit card loan portfolio.
|
Domestic Card Business
Domestic Card generated net income from continuing operations of
$1.7 billion
,
$2.1 billion
and
$2.2 billion
in
2017
,
2016
and
2015
, respectively. In
2017
,
2016
and
2015
, Domestic Card accounted for greater than 90% of total net revenue of our Credit Card business.
Table
9.1
summarizes the financial results for Domestic Card and displays selected key metrics for the periods indicated.
|
56
|
Capital One Financial Corporation (COF)
|
|
Table
9.1
:
Domestic Card Business Results
__________
|
Year Ended December 31,
|
Change
|
|||||||||||||||||
|
(Dollars in millions, except as noted)
|
2017
|
2016
|
2015
|
2017 vs. 2016
|
2016 vs. 2015
|
|||||||||||||
|
Selected income statement data:
|
||||||||||||||||||
|
Net interest income
|
$
|
12,504
|
|
$
|
11,571
|
|
$
|
10,147
|
|
8
|
%
|
14
|
%
|
|||||
|
Non-interest income
|
3,069
|
|
3,116
|
|
3,183
|
|
(2
|
)
|
(2
|
)
|
||||||||
|
Total net revenue
(1)
|
15,573
|
|
14,687
|
|
13,330
|
|
6
|
|
10
|
|
||||||||
|
Provision for credit losses
|
5,783
|
|
4,555
|
|
3,204
|
|
27
|
|
42
|
|
||||||||
|
Non-interest expense
|
7,078
|
|
6,895
|
|
6,627
|
|
3
|
|
4
|
|
||||||||
|
Income from continuing operations before income taxes
|
2,712
|
|
3,237
|
|
3,499
|
|
(16
|
)
|
(7
|
)
|
||||||||
|
Income tax provision
|
990
|
|
1,178
|
|
1,267
|
|
(16
|
)
|
(7
|
)
|
||||||||
|
Income from continuing operations, net of tax
|
$
|
1,722
|
|
$
|
2,059
|
|
$
|
2,232
|
|
(16
|
)
|
(8
|
)
|
|||||
|
Selected performance metrics:
|
||||||||||||||||||
|
Average loans held for investment
(2)
|
$
|
94,923
|
|
$
|
88,394
|
|
$
|
78,743
|
|
7
|
|
12
|
|
|||||
|
Average yield on loans held for investment
(3)
|
15.16
|
%
|
14.62
|
%
|
14.21
|
%
|
54
|
bps
|
41
|
bps
|
||||||||
|
Total net revenue margin
(4)
|
16.41
|
|
16.62
|
|
16.93
|
|
(21
|
)
|
(31
|
)
|
||||||||
|
Net charge-offs
|
$
|
4,739
|
|
$
|
3,681
|
|
$
|
2,718
|
|
29
|
%
|
35
|
%
|
|||||
|
Net charge-off rate
|
4.99
|
%
|
4.16
|
%
|
3.45
|
%
|
83
|
bps
|
71
|
bps
|
||||||||
|
Purchase volume
(5)
|
$
|
306,824
|
|
$
|
280,637
|
|
$
|
246,740
|
|
9
|
%
|
14
|
%
|
|||||
|
(Dollars in millions, except as noted)
|
December 31, 2017
|
December 31, 2016
|
Change
|
|||||||||||||||
|
Selected period-end data:
|
||||||||||||||||||
|
Loans held for investment
(2)
|
$
|
105,293
|
|
$
|
97,120
|
|
8
|
%
|
||||||||||
|
30+ day delinquency rate
|
4.01
|
%
|
3.95
|
%
|
6
|
bps
|
||||||||||||
|
Allowance for loan and lease losses
|
$
|
5,273
|
|
$
|
4,229
|
|
25
|
%
|
||||||||||
|
Allowance coverage ratio
|
5.01
|
%
|
4.35
|
%
|
66
|
bps
|
||||||||||||
|
(1)
|
We recognize billed finance charges and fee income on open-ended loans in accordance with the contractual provisions of the credit arrangements and estimate the uncollectible amount on a quarterly basis. The estimated uncollectible amount of billed finance charges and fees is reflected as a reduction in revenue and is not included in our net charge-offs.
|
|
(2)
|
Period-end loans held for investment and average loans held for investment include billed finance charges and fees, net of the estimated uncollectible amount.
|
|
(3)
|
Average yield on loans held for investment is calculated by dividing interest income for the period by average loans held for investment during the period. Interest income excludes various allocations including funds transfer pricing that assigns certain balance sheet assets, deposits and other liabilities and their related revenue and expenses attributable to each business segment.
|
|
(4)
|
Total net revenue margin is calculated by dividing
total net revenue
for the period by average loans held for investment during the period.
|
|
(5)
|
Purchase volume consists of purchase transactions, net of returns, for the period for loans both classified as held for investment and held for sale, and excludes cash advance and balance transfer transactions.
|
Because our Domestic Card business accounts for the substantial majority of our Credit Card business, the key factors driving the results are similar to the key factors affecting our total Credit Card business. Net income for our Domestic Card business
decreased
in
2017
compared to
2016
primarily driven by:
|
•
|
higher provision for credit losses; and
|
|
•
|
higher operating expenses associated with loan growth and continued investments in technology and infrastructure.
|
These drivers were partially offset by:
|
•
|
higher net interest income primarily driven by loan growth;
|
|
•
|
lower marketing expenses; and
|
|
•
|
operating efficiencies.
|
|
57
|
Capital One Financial Corporation (COF)
|
|
Net income for our Domestic Card business decreased in 2016 compared to 2015 primarily driven by:
|
•
|
higher provision for credit losses; and
|
|
•
|
higher operating expenses associated with continued loan growth.
|
These drivers were partially offset by higher net interest income resulting from loan growth.
Consumer Banking Business
The primary sources of revenue for our Consumer Banking business are net interest income from loans and deposits and non-interest income from service charges and customer-related fees. Expenses primarily consist of the provision for credit losses, operating costs and marketing expenses.
Our Consumer Banking business generated net income from continuing operations of
$1.1 billion
,
$870 million
and
$1.0 billion
in
2017
,
2016
and
2015
, respectively.
|
58
|
Capital One Financial Corporation (COF)
|
|
Table
10
summarizes the financial results of our Consumer Banking business and displays selected key metrics for the periods indicated.
Table
10
:
Consumer Banking Business Results
|
|
Year Ended December 31,
|
Change
|
||||||||||||||||
|
(Dollars in millions, except as noted)
|
2017
|
2016
|
2015
|
2017 vs. 2016
|
2016 vs. 2015
|
|||||||||||||
|
Selected income statement data:
|
||||||||||||||||||
|
Net interest income
|
$
|
6,380
|
|
$
|
5,829
|
|
$
|
5,755
|
|
9
|
%
|
1
|
%
|
|||||
|
Non-interest income
|
749
|
|
733
|
|
710
|
|
2
|
|
3
|
|
||||||||
|
Total net revenue
|
7,129
|
|
6,562
|
|
6,465
|
|
9
|
|
2
|
|
||||||||
|
Provision for credit losses
|
1,180
|
|
1,055
|
|
819
|
|
12
|
|
29
|
|
||||||||
|
Non-interest expense
|
4,233
|
|
4,139
|
|
4,026
|
|
2
|
|
3
|
|
||||||||
|
Income from continuing operations before income taxes
|
1,716
|
|
1,368
|
|
1,620
|
|
25
|
|
(16
|
)
|
||||||||
|
Income tax provision
|
626
|
|
498
|
|
586
|
|
26
|
|
(15
|
)
|
||||||||
|
Income from continuing operations, net of tax
|
$
|
1,090
|
|
$
|
870
|
|
$
|
1,034
|
|
25
|
|
(16
|
)
|
|||||
|
Selected performance metrics:
|
||||||||||||||||||
|
Average loans held for investment:
(1)
|
||||||||||||||||||
|
Auto
|
$
|
51,477
|
|
$
|
44,521
|
|
$
|
39,967
|
|
16
|
|
11
|
|
|||||
|
Home loan
|
19,681
|
|
23,358
|
|
27,601
|
|
(16
|
)
|
(15
|
)
|
||||||||
|
Retail banking
|
3,463
|
|
3,543
|
|
3,582
|
|
(2
|
)
|
(1
|
)
|
||||||||
|
Total consumer banking
|
$
|
74,621
|
|
$
|
71,422
|
|
$
|
71,150
|
|
4
|
|
—
|
|
|||||
|
Average yield on loans held for investment
(2)
|
6.67
|
%
|
6.34
|
%
|
6.26
|
%
|
33
|
bps
|
8
|
bps
|
||||||||
|
Average deposits
|
$
|
185,201
|
|
$
|
177,129
|
|
$
|
170,757
|
|
5
|
%
|
4
|
%
|
|||||
|
Average deposits interest rate
|
0.62
|
%
|
0.56
|
%
|
0.56
|
%
|
6
|
bps
|
—
|
|
||||||||
|
Net charge-offs
|
$
|
1,038
|
|
$
|
820
|
|
$
|
731
|
|
27
|
%
|
12
|
%
|
|||||
|
Net charge-off rate
|
1.39
|
%
|
1.15
|
%
|
1.03
|
%
|
24
|
bps
|
12
|
bps
|
||||||||
|
Net charge-off rate (excluding PCI loans)
|
1.65
|
|
1.49
|
|
1.45
|
|
16
|
|
4
|
|
||||||||
|
Auto loan originations
|
$
|
27,737
|
|
$
|
25,719
|
|
$
|
21,185
|
|
8
|
%
|
21
|
%
|
|||||
|
(Dollars in millions, except as noted)
|
December 31, 2017
|
December 31, 2016
|
Change
|
|||||||||||||||
|
Selected period-end data:
|
||||||||||||||||||
|
Loans held for investment:
(1)
|
||||||||||||||||||
|
Auto
|
$
|
53,991
|
|
$
|
47,916
|
|
13
|
%
|
||||||||||
|
Home loan
|
17,633
|
|
21,584
|
|
(18
|
)
|
||||||||||||
|
Retail banking
|
3,454
|
|
3,554
|
|
(3
|
)
|
||||||||||||
|
Total consumer banking
|
$
|
75,078
|
|
$
|
73,054
|
|
3
|
|
||||||||||
|
30+ day performing delinquency rate
|
4.76
|
%
|
4.10
|
%
|
66
|
bps
|
||||||||||||
|
30+ day performing delinquency rate (excluding PCI loans)
|
5.52
|
|
5.12
|
|
40
|
|
||||||||||||
|
30+ day delinquency rate
|
5.34
|
|
4.67
|
|
67
|
|
||||||||||||
|
30+ day delinquency rate (excluding PCI loans)
|
6.19
|
|
5.82
|
|
37
|
|
||||||||||||
|
Nonperforming loan rate
|
0.78
|
|
0.72
|
|
6
|
|
||||||||||||
|
Nonperforming loan rate (excluding PCI loans)
|
0.91
|
|
0.90
|
|
1
|
|
||||||||||||
|
Nonperforming asset rate
(3)
|
0.91
|
|
1.09
|
|
(18
|
)
|
||||||||||||
|
Nonperforming asset rate (excluding PCI loans)
(3)
|
1.06
|
|
1.36
|
|
(30
|
)
|
||||||||||||
|
Allowance for loan and lease losses
|
$
|
1,242
|
|
$
|
1,102
|
|
13
|
%
|
||||||||||
|
Allowance coverage ratio
(4)
|
1.65
|
%
|
1.51
|
%
|
14
|
bps
|
||||||||||||
|
Deposits
|
$
|
185,842
|
|
$
|
181,917
|
|
2
|
%
|
||||||||||
|
Loans serviced for others
(5)
|
8,598
|
|
8,258
|
|
4
|
|
||||||||||||
|
59
|
Capital One Financial Corporation (COF)
|
|
__________
|
(1)
|
Average consumer banking loans held for investment includes purchased credit-impaired loans (“PCI loans”) of
$12.2 billion
,
$16.4 billion
and $20.7 billion in
2017
,
2016
and
2015
, respectively. Period-end consumer banking loans held for investment includes PCI loans with carrying values of
$10.3 billion
and
$14.5 billion
as of
December 31, 2017
and
2016
, respectively.
|
|
(2)
|
Average yield on loans held for investment is calculated by dividing interest income for the period by average loans held for investment during the period. Interest income excludes various allocations including funds transfer pricing that assigns certain balance sheet assets, deposits and other liabilities and their related revenue and expenses attributable to each business segment.
|
|
(3)
|
Nonperforming assets consist of nonperforming loans, real estate owned (“REO”) and other foreclosed assets. The total nonperforming asset rate is calculated based on total nonperforming assets divided by the combined period-end total loans held for investment, REO and other foreclosed assets.
|
|
(4)
|
Excluding the impact of the PCI loan amounts in footnote 1 above, the allowance coverage ratio for our total consumer banking portfolio was
1.87%
and
1.83%
as of
December 31, 2017
and 2016, respectively.
|
|
(5)
|
Loans serviced for others represents loans serviced for third parties related to our consumer home loan business.
|
Key factors affecting the results of our Consumer Banking business for
2017
compared to
2016
, and changes in financial condition and credit performance between
December 31, 2017
and
December 31, 2016
include the following:
|
•
|
Net Interest Income:
Net interest income
increased
by
$551 million
to
$6.4 billion
in
2017
primarily driven by growth in our auto loan portfolio and higher deposit volumes and margins in our retail banking business.
|
Consumer Banking loan yield
increased
by
33
basis points to
6.7%
in
2017
compared to
2016
. The increase was primarily driven by changes in the product mix in Consumer Banking as a result of growth in our auto loan portfolio and run-off of our acquired home loan portfolio.
|
•
|
Non-Interest Income:
Non-interest income was substantially flat at
$749 million
in
2017
as a mortgage representation and warranty reserve release in the first quarter of 2017 had a similar impact as the customer rewards reserve release within our retail banking business in the first quarter of 2016 related to the discontinuation of certain debit card and deposit products.
|
|
•
|
Provision for Credit Losses:
The provision for credit losses
increased
by
$125 million
to
$1.2 billion
in
2017
primarily driven by higher losses in our auto loan portfolio due to growth.
|
|
•
|
Non-Interest Expense:
Non-interest expense
increased
by
$94 million
to
$4.2 billion
in
2017
primarily due to higher operating expenses driven by growth in our auto loan portfolio and continued investment in technology and infrastructure, partially offset by operating efficiencies.
|
|
•
|
Loans Held for Investment:
Period-end loans held for investment
increased
by
$2.0 billion
to
$75.1 billion
as of
December 31, 2017
from
December 31, 2016
, and average loans held for investment
increased
by
$3.2 billion
to
$74.6 billion
in
2017
compared to
2016
. These increases were due to growth in our auto loan portfolio, partially offset by run-off of our acquired home loan portfolio.
|
|
•
|
Deposits:
Period-end deposits
increased
by
$3.9 billion
to
$185.8 billion
as of
December 31, 2017
from
December 31, 2016
.
|
|
•
|
Net Charge-Off and Delinquency Metrics:
The net charge-off rate
increased
by
24
basis points to
1.39%
in
2017
compared to
2016
. This increase was primarily driven by:
|
|
◦
|
higher losses in our auto loan portfolio due to changes in our charge-off practices for certain bankrupt accounts and growth; and
|
|
◦
|
a greater portion of auto loans in our total consumer banking loan portfolio, which generally have higher charge-off rates than other products within this portfolio.
|
The 30+ day delinquency rate
increased
by
67
basis points to
5.34%
as of
December 31, 2017
from
December 31, 2016
primarily attributable to
higher auto delinquency inventories
.
Key factors affecting the results of our Consumer Banking business for 2016 compared to 2015, and changes in financial condition and credit performance between December 31, 2016 and December 31, 2015 include the following:
|
•
|
Net Interest Income:
Net interest income was flat at $5.8 billion in 2016 as growth in our auto loan portfolio was offset by the continued run-off of our acquired home loan portfolio and margin compression in our auto loan portfolio.
|
|
60
|
Capital One Financial Corporation (COF)
|
|
|
◦
|
Consumer Banking loan yield increased by 8 basis points to 6.3% in 2016 compared to 2015. The increase was primarily driven by changes in the product mix in Consumer Banking as a result of the continued run-off of our acquired home loan portfolio and growth in our auto loan portfolio, partially offset by declining yield in our auto loan portfolio.
|
|
•
|
Non-Interest Income:
Non-interest income was substantially flat at $733 million in 2016.
|
|
•
|
Provision for Credit Losses:
The provision for credit losses increased by $236 million to $1.1 billion in 2016 primarily driven by:
|
|
◦
|
a higher allowance in our auto loan portfolio due to continued loan growth, increasing loss expectations on recent originations and a build reflecting a change in accounting estimate of the timing of charge-offs of bankrupt accounts; and
|
|
◦
|
higher charge-offs in our auto loan portfolio due to seasoning of recent growth.
|
|
•
|
Non-Interest Expense:
Non-interest expense increased by $113 million to $4.1 billion in 2016 primarily due to:
|
|
◦
|
higher operating expenses driven by growth in our auto loan portfolio; and
|
|
◦
|
higher marketing expenses.
|
|
•
|
Loans Held for Investment:
Period-end loans held for investment increased by $2.7 billion to $73.1 billion as of December 31, 2016 from December 31, 2015, and average loans held for investment increased by $272 million to $71.4 billion in 2016 compared to 2015. The increases were primarily due to growth in our auto loan portfolio, partially offset by the continued run-off of our acquired home loan portfolio.
|
|
•
|
Deposits:
Period-end deposits
increased
by $9.2 billion to $181.9 billion as of December 31, 2016 from December 31, 2015 as a result of strong growth in our deposit products that are sold directly to both existing and new customers.
|
|
•
|
Net Charge-Off and Delinquency Metrics:
The net charge-off rate increased by 12 basis points to 1.15% in 2016 compared to 2015. The increase reflects the greater portion of auto loans in our total consumer banking loan portfolio, which generally have higher charge-off rates than other products within this portfolio. The 30+ day delinquency rate was
flat
at 4.67% as of both December 31, 2016 and December 31, 2015.
|
Commercial Banking Business
The primary sources of revenue for our Commercial Banking business are net interest income from loans and deposits and non-interest income from customer fees and other transactions. Because our Commercial Banking business has loans and investments that generate tax-exempt income or tax credits, we make certain reclassifications to present revenues on a taxable-equivalent basis. Expenses primarily consist of the provision for credit losses, operating costs and marketing expenses.
Our Commercial Banking business generated net income from continuing operations of
$676 million
,
$575 million
and
$570 million
in
2017
,
2016
and
2015
, respectively.
Table
11
summarizes the financial results of our Commercial Banking business and displays selected key metrics for the periods indicated.
|
61
|
Capital One Financial Corporation (COF)
|
|
Table
11
:
Commercial Banking Business Results
__________
|
|
Year Ended December 31,
|
Change
|
||||||||||||||||
|
(Dollars in millions, except as noted)
|
2017
|
2016
|
2015
|
2017 vs. 2016
|
2016 vs. 2015
|
|||||||||||||
|
Selected income statement data:
|
||||||||||||||||||
|
Net interest income
|
$
|
2,261
|
|
$
|
2,216
|
|
$
|
1,865
|
|
2
|
%
|
19
|
%
|
|||||
|
Non-interest income
|
708
|
|
578
|
|
487
|
|
22
|
|
19
|
|
||||||||
|
Total net revenue
(1)
|
2,969
|
|
2,794
|
|
2,352
|
|
6
|
|
19
|
|
||||||||
|
Provision (benefit) for credit losses
(2)
|
301
|
|
483
|
|
302
|
|
(38
|
)
|
60
|
|
||||||||
|
Non-interest expense
|
1,603
|
|
1,407
|
|
1,156
|
|
14
|
|
22
|
|
||||||||
|
Income from continuing operations before income taxes
|
1,065
|
|
904
|
|
894
|
|
18
|
|
1
|
|
||||||||
|
Income tax provision
|
389
|
|
329
|
|
324
|
|
18
|
|
2
|
|
||||||||
|
Income from continuing operations, net of tax
|
$
|
676
|
|
$
|
575
|
|
$
|
570
|
|
18
|
|
1
|
|
|||||
|
Selected performance metrics:
|
||||||||||||||||||
|
Average loans held for investment:
(3)
|
||||||||||||||||||
|
Commercial and multifamily real estate
|
$
|
27,370
|
|
$
|
25,821
|
|
$
|
23,728
|
|
6
|
|
9
|
|
|||||
|
Commercial and industrial
|
39,606
|
|
38,852
|
|
28,349
|
|
2
|
|
37
|
|
||||||||
|
Total commercial lending
|
66,976
|
|
64,673
|
|
52,077
|
|
4
|
|
24
|
|
||||||||
|
Small-ticket commercial real estate
|
442
|
|
548
|
|
692
|
|
(19
|
)
|
(21
|
)
|
||||||||
|
Total commercial banking
|
$
|
67,418
|
|
$
|
65,221
|
|
$
|
52,769
|
|
3
|
|
24
|
|
|||||
|
Average yield on loans held for investment
(1)(4)
|
3.87
|
%
|
3.47
|
%
|
3.21
|
%
|
40
|
bps
|
26
|
bps
|
||||||||
|
Average deposits
|
$
|
33,947
|
|
$
|
33,841
|
|
$
|
33,058
|
|
—
|
|
2
|
%
|
|||||
|
Average deposits interest rate
|
0.39
|
%
|
0.28
|
%
|
0.25
|
%
|
11
|
bps
|
3
|
bps
|
||||||||
|
Net charge-offs
|
$
|
465
|
|
$
|
292
|
|
$
|
47
|
|
59
|
%
|
**
|
|
|||||
|
Net charge-off rate
|
0.69
|
%
|
0.45
|
%
|
0.09
|
%
|
24
|
bps
|
36
|
bps
|
||||||||
|
(Dollars in millions, except as noted)
|
December 31, 2017
|
December 31, 2016
|
Change
|
|||||||||||||||
|
Selected period-end data:
|
||||||||||||||||||
|
Loans held for investment:
(3)
|
||||||||||||||||||
|
Commercial and multifamily real estate
|
$
|
26,150
|
|
$
|
26,609
|
|
(2
|
)%
|
||||||||||
|
Commercial and industrial
|
38,025
|
|
39,824
|
|
(5
|
)
|
||||||||||||
|
Total commercial lending
|
64,175
|
|
66,433
|
|
(3
|
)
|
||||||||||||
|
Small-ticket commercial real estate
|
400
|
|
483
|
|
(17
|
)
|
||||||||||||
|
Total commercial banking
|
$
|
64,575
|
|
$
|
66,916
|
|
(3
|
)
|
||||||||||
|
Nonperforming loan rate
|
0.44
|
%
|
1.53
|
%
|
(109
|
)bps
|
||||||||||||
|
Nonperforming asset rate
(5)
|
0.52
|
|
1.54
|
|
(102
|
)
|
||||||||||||
|
Allowance for loan and lease losses
(2)
|
$
|
611
|
|
$
|
793
|
|
(23
|
)%
|
||||||||||
|
Allowance coverage ratio
|
0.95
|
%
|
1.19
|
%
|
(24
|
)bps
|
||||||||||||
|
Deposits
|
$
|
33,938
|
|
$
|
33,866
|
|
—
|
|
||||||||||
|
Loans serviced for others
|
27,764
|
|
22,321
|
|
24
|
%
|
||||||||||||
|
(1)
|
Some of our commercial investments generate tax-exempt income or tax credits. Accordingly, we make certain reclassifications within our Commercial Banking business results to present revenues and yields on a taxable-equivalent basis, calculated assuming an effective tax rate approximately equal to our federal statutory tax rate (35% for all periods presented), with offsetting reductions to the Other category.
|
|
(2)
|
The provision for losses on unfunded lending commitments is included in the provision for credit losses in our consolidated statements of income and the related reserve for unfunded lending commitments is included in other liabilities on our consolidated balance sheets. Our reserve for unfunded lending commitments totaled
$117 million
,
$129 million
and $161 million as of
December 31, 2017
,
2016
and
2015
, respectively.
|
|
(3)
|
Average commercial banking loans held for investment includes PCI loans of
$540 million
, $770 million and $215 million in
2017
,
2016
and
2015
, respectively. Period-end commercial banking loans held for investment includes PCI loans of
$480 million
and $613 million as of
December 31, 2017
and
2016
, respectively.
|
|
62
|
Capital One Financial Corporation (COF)
|
|
|
(4)
|
Average yield on loans held for investment is calculated by dividing interest income for the period by average loans held for investment during the period. Interest income excludes various allocations including funds transfer pricing that assigns certain balance sheet assets, deposits and other liabilities and their related revenue and expenses attributable to each business segment.
|
|
(5)
|
Nonperforming assets consist of nonperforming loans, real estate owned (“REO”) and other foreclosed assets. The total nonperforming asset rate is calculated based on total nonperforming assets divided by the combined period-end total loans held for investment, REO and other foreclosed assets.
|
|
**
|
Change is not meaningful.
|
Key factors affecting the results of our Commercial Banking business for
2017
compared to
2016
, and changes in financial condition and credit performance between
December 31, 2017
and
December 31, 2016
include the following:
|
•
|
Net Interest Income:
Net interest income was substantially flat at
$2.3 billion
in
2017
.
|
|
•
|
Non-Interest Income:
Non-interest income
increased
by
$130 million
to
$708 million
in
2017
primarily driven by:
|
|
◦
|
higher revenue from our commercial investments that generate tax credits; and
|
|
◦
|
higher service charges and other customer-related fees as a result of increased activity across a broad range of products and services provided to our commercial customers.
|
|
•
|
Provision for Credit Losses:
The provision for credit losses
decreased
by
$182 million
to
$301 million
in
2017
primarily driven by
stabilizing industry conditions impacting our oil and gas lending portfolio compared to adverse industry conditions in the prior year
.
|
|
•
|
Non-Interest Expense:
Non-interest expense
increased
by
$196 million
to
$1.6 billion
in
2017
primarily driven by higher operating expenses associated with growth and continued investments in technology and other business initiatives.
|
|
•
|
Loans Held for Investment:
Period-end loans held for investment
decreased
by
$2.3 billion
to
$64.6 billion
as of
December 31, 2017
from
December 31, 2016
primarily due to:
|
◦
paydowns in our commercial and industrial loan portfolios;
◦
charge-offs in our taxi medallion lending portfolio; and
|
◦
|
the transfer of
the substantial majority of our remaining taxi medallion lending portfolio from loans held for investment to loans held for sale
.
|
Average loans held for investment
increased
by
$2.2 billion
to
$67.4 billion
in
2017
compared to
2016
primarily driven by growth across our commercial loan portfolios.
|
•
|
Deposits:
Period-end deposits were substantially flat at
$33.9 billion
as of
December 31, 2017
.
|
|
•
|
Net Charge-Off and Nonperforming Metrics:
The net charge-off rate
increased
by
24
basis points to
0.69%
in
2017
compared to
2016
primarily driven by higher charge-offs in our taxi medallion lending portfolio resulting from declines in taxi medallion values.
|
The nonperforming loan rate
decreased
by
109
basis points to
0.44%
as of
December 31, 2017
from
December 31, 2016
primarily due to:
|
◦
|
a combination of improved credit risk ratings, charge-offs and paydowns in our oil and gas portfolio; and
|
|
◦
|
charge-offs in our taxi medallion lending portfolio resulting from declines in taxi medallion values and the impact of transferring the substantial majority of our remaining taxi medallion lending portfolio, which was downgraded to nonperforming classification in the third quarter of 2017, from loans held for investment to loans held for sale.
|
Key factors affecting the results of our Commercial Banking business for 2016 compared to 2015, and changes in financial condition and credit performance between December 31, 2016 and December 31, 2015 include the following:
|
•
|
Net Interest Income:
Net interest income increased by $351 million to $2.2 billion in 2016 primarily driven by loan growth, including loans obtained in the HFS acquisition.
|
|
63
|
Capital One Financial Corporation (COF)
|
|
|
•
|
Non-Interest Income:
Non-interest income increased by $91 million to $578 million in 2016 primarily driven by fee-based services, including impacts from the HFS acquisition, and products attributable to our multifamily finance business.
|
|
•
|
Provision for Credit Losses:
The provision for credit losses increased by $181 million to $483 million in 2016 primarily driven by higher charge-offs, partially offset by a smaller allowance build, due to continued adverse industry conditions impacting our taxi medallion and oil and gas lending portfolios.
|
|
•
|
Non-Interest Expense:
Non-i
nterest exp
ense increased by $251 million to $1.4 billion in 2016 driven by higher operating expenses due to costs associated with the HFS acquisition and continued growth in our Commercial Banking business.
|
|
•
|
Loans Held for Investment:
Period-end loans held for investment increased by $3.7 billion to $66.9 billion as of December 31, 2016 from December 31, 2015 driven by growth in our commercial loan portfolios. Average loans held for investment increased by $12.5 billion to $65.2 billion in 2016 compared to 2015 primarily driven by the HFS acquisition and growth in our commercial loan portfolios.
|
|
•
|
Deposits:
Period-end deposits decreased by $391 million to $33.9 billion as of December 31, 2016 from December 31, 2015.
|
|
•
|
Net Charge-Off and Nonperforming Metrics:
The net charge-off rate increased by 36 basis points to 0.45% in 2016 compared to 2015, reflecting rising losses in our taxi medallion and oil and gas lending portfolios. Increased credit risk rating downgrades in these same lending portfolios resulted in the nonperforming loan rate increasing by 66 basis points to 1.53% as of December 31, 2016 from December 31, 2015.
|
Other Category
Other includes unallocated amounts related to our centralized Corporate Treasury group activities, such as management of our corporate investment portfolio, asset/liability management and certain capital management activities. Other also includes:
|
•
|
foreign exchange-rate fluctuations on foreign currency-denominated balances;
|
|
•
|
unallocated corporate expenses that do not directly support the operations of the business segments or for which the business segments are not considered financially accountable in evaluating their performance, such as certain restructuring charges;
|
|
•
|
offsets related to certain line-item reclassifications; and
|
|
•
|
residual tax expense or benefit to arrive at the consolidated effective tax rate that is not assessed to our primary business segments
.
|
Table
12
summarizes the financial results of our Other category for the periods indicated.
Table
12
:
Other Category Results
__________
|
|
Year Ended December 31,
|
Change
|
||||||||||||||||
|
(Dollars in millions)
|
2017
|
2016
|
2015
|
2017 vs. 2016
|
2016 vs. 2015
|
|||||||||||||
|
Selected income statement data:
|
||||||||||||||||||
|
Net interest income
|
$
|
171
|
|
$
|
193
|
|
$
|
53
|
|
(11
|
)%
|
**
|
|
|||||
|
Non-interest income
|
(5
|
)
|
(63
|
)
|
(39
|
)
|
(92
|
)
|
62
|
%
|
||||||||
|
Total net revenue
(1)
|
166
|
|
130
|
|
14
|
|
28
|
|
**
|
|
||||||||
|
Provision (benefit) for credit losses
|
4
|
|
(5
|
)
|
(2
|
)
|
**
|
|
150
|
|
||||||||
|
Non-interest expense
|
442
|
|
309
|
|
312
|
|
43
|
|
(1
|
)
|
||||||||
|
Income (loss) from continuing operations before income taxes
|
(280
|
)
|
(174
|
)
|
(296
|
)
|
61
|
|
(41
|
)
|
||||||||
|
Income tax provision (benefit)
|
1,289
|
|
(339
|
)
|
(350
|
)
|
**
|
|
(3
|
)
|
||||||||
|
Income (loss) from continuing operations, net of tax
|
$
|
(1,569
|
)
|
$
|
165
|
|
$
|
54
|
|
**
|
|
**
|
|
|||||
|
(1)
|
Some of our commercial investments generate tax-exempt income or tax credits. Accordingly, we make certain reclassifications within our Commercial Banking business results to present revenues and yields on a taxable-equivalent basis, calculated assuming an effective tax rate approximately equal to our federal statutory tax rate (35% for all periods presented), with offsetting reductions to the Other category.
|
|
**
|
Change is not meaningful.
|
|
64
|
Capital One Financial Corporation (COF)
|
|
Net loss from continuing operations recorded in the Other category was
$1.6 billion
in
2017
compared to net income of
$165 million
in
2016
. The loss in
2017
was primarily driven by:
|
•
|
charges associated with the estimated impacts of the Tax Act
; and
|
|
•
|
higher operating expenses associated with
restructuring activities, which primarily consisted of severance and related benefits pursuant to our ongoing benefit programs, that are the result of exiting certain business activities and locations
, as well as the realignment of resources supporting our businesses.
|
Net income from continuing operations recorded in the Other category was $165 million in 2016 compared to $54 million in 2015. The increase in 2016 was primarily driven by:
|
•
|
higher net interest income due to balance sheet growth, as well as the impact of rates on our other treasury-related activities; and
|
|
•
|
lower restructuring charges for severance and related benefits pursuant to our ongoing benefit programs as a result of the realignment of our workforce.
|
These drivers were partially offset by:
|
•
|
higher bank optimization charges and an impairment charge associated with certain acquired intangible and software assets within non-interest expense;
|
|
•
|
lower non-interest income due to rate-driven hedge ineffectiveness; and
|
|
•
|
a reduced income tax benefit as a result of higher income before taxes and increased discrete tax expense, partially offset by increased tax credits.
|
|
CRITICAL ACCOUNTING POLICIES AND ESTIMATES
|
The preparation of financial statements in accordance with U.S. GAAP requires management to make a number of judgments, estimates and assumptions that affect the amount of assets, liabilities, income and expenses on the consolidated financial statements. Understanding our accounting policies and the extent to which we use management judgment and estimates in applying these policies is integral to understanding our financial statements. We provide a summary of our significant accounting policies under “
Note 1—Summary of Significant Accounting Policies
.”
We have identified the following accounting policies as critical because they require significant judgments and assumptions about highly complex and inherently uncertain matters and the use of reasonably different estimates and assumptions could have a material impact on our results of operations or financial condition. These critical accounting policies govern:
|
•
|
Loan loss reserves
|
|
•
|
Asset impairment
|
|
•
|
Fair value of financial instruments
|
|
•
|
Customer rewards reserve
|
We evaluate our critical accounting estimates and judgments on an ongoing basis and update them, as necessary, based on changing conditions. Management has discussed our critical accounting policies and estimates with the Audit Committee of the Board of Directors.
Loan Loss Reserves
We maintain an allowance for loan and lease losses that represents management’s estimate of incurred loan and lease losses inherent in our credit card, consumer banking and commercial banking loans held for investment portfolios as of each balance sheet date. We also separately reserve for binding unfunded lending commitments, letters of credit and financial guarantees.
|
65
|
Capital One Financial Corporation (COF)
|
|
We build our allowance for loan and lease losses and reserve for unfunded lending commitments through the provision for credit losses. Our provision for credit losses in each period is driven by charge-offs, changes to allowance for loan and lease losses, and changes to the reserve for unfunded lending commitments. We recorded a provision for credit losses of
$7.6 billion
,
$6.5 billion
and
$4.5 billion
in 2017, 2016 and 2015, respectively.
We have an established process, using analytical tools and management judgment, to determine our allowance for loan and lease losses. Losses are inherent in our loan portfolios and we calculate the allowance for loan and lease losses by estimating incurred losses for segments of our loan portfolios with similar risk characteristics and record a provision for credit losses. The allowance totaled
$7.5 billion
as of December 31, 2017, compared to
$6.5 billion
as of December 31, 2016.
We review and assess our allowance methodologies and adequacy of the allowance for loan and lease losses on a quarterly basis. Our assessment involves evaluating many factors including, but not limited to, historical loss and recovery experience, recent trends in delinquencies and charge-offs, risk ratings, the impact of bankruptcy filings, the value of collateral underlying secured loans, account seasoning, changes in our credit evaluation, underwriting and collection management policies, seasonality, general economic conditions, changes in the legal and regulatory environment and uncertainties in forecasting and modeling techniques used in estimating our allowance for loan and lease losses. Key factors that have a significant impact on our allowance for loan and lease losses include assumptions about unemployment rates, home prices and the valuation of commercial properties and other collateral, consumer real estate and automobiles.
In addition to the allowance for loan and lease losses, we review and assess our estimate of probable losses related to binding unfunded lending commitments, such as letters of credit and financial guarantees, and unfunded loan commitments on a quarterly basis. The factors impacting our assessment generally align with those considered in our evaluation of the allowance for loan and lease losses for the Commercial Banking business. Changes to the reserve for losses on unfunded lending commitments are recorded through the provision for credit losses in the consolidated statements of income and to other liabilities on the consolidated balance sheets.
Although we examine a variety of externally available data, as well as our internal loan performance data, to determine our allowance for loan and lease losses and reserve for unfunded lending commitments, our estimation process is subject to risks and uncertainties, including a reliance on historical loss and trend information that may not be representative of current conditions and indicative of future performance. Accordingly, our actual credit loss experience may not be in line with our expectations. We provide additional information on the methodologies and key assumptions used in determining our allowance for loan and lease losses for each of our loan portfolio segments in “Note 1—Summary of Significant Accounting Policies.” We provide information on the components of our allowance, disaggregated by impairment methodology, and changes in our allowance in “Note 5—Allowance for Loan and Lease Losses and Reserve for Unfunded Lending Commitments.”
Finance Charge and Fee Reserves
Finance charges and fees on credit card loans, net of amounts that we consider uncollectible, are included in loan receivables and revenue when the finance charges and fees are earned. We continue to accrue finance charges and fees on credit card loans until the account is charged-off; however, when we do not expect full payment of billed finance charges and fees, we reduce the balance of our credit card loan receivables by the amount of finance charges and fees billed but not expected to be collected and exclude this amount from revenue. Total net revenue was reduced by
$1.4 billion
, $1.1 billion and $732 million in 2017, 2016 and 2015, respectively, for the estimated uncollectible amount of billed finance charges and fees. The finance charge and fee reserve totaled
$491 million
as of December 31, 2017, compared to $402 million as of December 31, 2016.
We review and assess the adequacy of the uncollectible finance charge and fee reserve on a quarterly basis. Our methodology for estimating the uncollectible portion of billed finance charges and fees is consistent with the methodology we use to estimate the allowance for incurred losses on the principal portion of our credit card loan receivables.
Asset Impairment
In addition to our loan portfolio, we review other assets for impairment on a regular basis in accordance with applicable impairment accounting guidance. This process requires significant management judgment and involves various estimates and assumptions. Below we describe our process for assessing impairment of goodwill and intangible assets and the key estimates and assumptions involved in this process.
|
66
|
Capital One Financial Corporation (COF)
|
|
Goodwill and Intangible Assets
Goodwill represents the excess of the fair value of the consideration transferred, plus the fair value of any non-controlling interests in the acquiree, over the fair value of the net assets acquired and liabilities assumed as of the acquisition date.
Goodwill totaled
$14.5 billion
as of both December 31, 2017 and 2016. Intangible assets, which we report on our consolidated balance sheets as a component of other assets, consist primarily of purchased credit card relationships (“PCCR”), core deposit and other intangibles. The net carrying amount of intangible assets decreased to
$421 million
as of December 31, 2017, from $665 million as of December 31, 2016 primarily due to amortization. Goodwill and intangible assets together represented
4%
of our total assets as of both December 31, 2017 and 2016. We did not recognize any goodwill impairment in 2017, 2016 or 2015. See “Note 7—Goodwill and Intangible Assets” for additional information.
Goodwill
We perform our goodwill impairment test annually on October 1 at a reporting unit level. We are also required to test goodwill for impairment whenever events or circumstances make it more-likely-than-not that impairment may have occurred. In 2017, we had four reporting units: Credit Card, Auto, Other Consumer Banking and Commercial Banking.
The goodwill impairment test is a two-step process. The first step involves a comparison of the estimated fair value of a reporting unit to its carrying amount, including goodwill. If the estimated fair value exceeds its carrying amount, goodwill of the reporting unit is not impaired and the second step is not necessary. If the estimated fair value of a reporting unit is below its carrying amount, then the second step, which requires measurement of any potential impairment, must be performed. The second step of goodwill impairment testing requires an extensive effort to build the specific reporting unit’s balance sheet for the test based on applicable accounting guidance.
For the purpose of our goodwill impairment testing, we calculate the carrying amount of a reporting unit using an allocated capital approach based on each reporting unit’s specific regulatory capital, economic capital requirements, and underlying risks. The carrying amount for a reporting unit is the sum of its respective capital requirements, goodwill and intangibles balances. We then compare the carrying amount to our total consolidated stockholders’ equity to assess the reasonableness of our methodology. The total carrying amount of our four reporting units was $43.6 billion, as compared to consolidated stockholder’s equity of $50.2 billion as of October 1, 2017. The $6.6 billion excess in consolidated stockholder’s equity was primarily attributable to capital allocated to our Other category and other future capital needs such as dividends.
Determining the fair value of a reporting unit and the associated assets, liabilities and intangible assets, is a subjective process that requires the use of estimates and the exercise of significant judgment. The fair value of the reporting units was calculated using a discounted cash flow (“DCF”) calculation, a form of the income approach. This income approach calculation used projected cash flows based on each reporting unit’s internal forecast and the perpetuity growth method to calculate terminal values. Our DCF analysis requires management to make estimates about future loan, deposit and revenue growth, as well as credit losses and capital rates. These cash flows and terminal values were then discounted using discount rates based on our external cost of equity with adjustments for the risk inherent in each reporting unit. The reasonableness of the DCF approach was assessed by reference to a market-based approach using comparable market multiples and recent market transactions where available. The results of the 2017 annual impairment test for the Credit Card, Auto, Other Consumer Banking and Commercial Banking reporting units indicated that the estimated fair values of these four reporting units substantially exceeded their carrying amounts.
By definition, assumptions used in estimating the fair value of a reporting unit are judgmental and inherently uncertain. A significant change in the economic conditions of a reporting unit, such as declines in business performance, increases in credit losses, increases in capital requirements, deterioration in market conditions, adverse estimates of regulatory or legislative changes or increases in the estimated cost of equity, could cause the estimated fair values of our reporting units to decline in the future, and increase the risk of a goodwill impairment charge to earnings in a future period.
|
67
|
Capital One Financial Corporation (COF)
|
|
Intangible Assets
Intangible assets with definitive useful lives are amortized over their estimated lives and evaluated for potential impairment whenever events or changes in circumstances suggest that an asset’s or asset group’s carrying amount may not be fully recoverable. An impairment loss, generally calculated as the difference between the estimated fair value and the carrying amount of an asset or asset group, is recognized if the sum of the estimated undiscounted cash flows relating to the asset or asset group is less than the corresponding carrying amount. There was no meaningful impairment of intangible assets in 2017 or 2015. We recorded an impairment charge of $17 million in
2016
related primarily to our brokerage relationship intangibles.
See “
Note 7—Goodwill and Intangible Assets
” for additional information.
Fair Value
Fair value, also referred to as an exit price, is defined as the price that would be received for an asset or paid to transfer a liability in an orderly transaction between market participants on the measurement date. The fair value accounting guidance provides a three-level fair value hierarchy for classifying financial instruments. This hierarchy is based on the markets in which the assets or liabilities trade and whether the inputs to the valuation techniques used to measure fair value are observable or unobservable. Fair value measurement of a financial asset or liability is assigned a level based on the lowest level of any input that is significant to the fair value measurement in its entirety. The three levels of the fair value hierarchy are described below:
Level 1: Quoted prices (unadjusted) in active markets for identical assets or liabilities
Level 2: Observable market-based inputs, other than quoted prices in active markets for identical assets or liabilities
Level 3: Unobservable inputs
The degree of management judgment involved in determining the fair value of a financial instrument is dependent upon the availability of quoted prices in active markets or observable market parameters. When quoted prices and observable data in active markets are not fully available, management judgment is necessary to estimate fair value. Changes in market conditions, such as reduced liquidity in the capital markets or changes in secondary market activities, may reduce the availability and reliability of quoted prices or observable data used to determine fair value.
We have developed policies and procedures to determine when markets for our financial assets and liabilities are inactive if the level and volume of activity has declined significantly relative to normal conditions. If markets are determined to be inactive, it may be appropriate to adjust price quotes received. When significant adjustments are required to price quotes or inputs, it may be appropriate to utilize an estimate based primarily on unobservable inputs.
Significant judgment may be required to determine whether certain financial instruments measured at fair value are classified as Level 2 or Level 3. In making this determination, we consider all available information that market participants use to measure the fair value of the financial instrument, including observable market data, indications of market liquidity and orderliness, and our understanding of the valuation techniques and significant inputs used. Based upon the specific facts and circumstances of each instrument or instrument category, judgments are made regarding the significance of the Level 3 inputs to the instruments’ fair value measurement in its entirety. If Level 3 inputs are considered significant, the instrument is classified as Level 3. The process for determining fair value using unobservable inputs is generally more subjective and involves a high degree of management judgment and assumptions. We discuss changes in the valuation inputs and assumptions used in determining the fair value of our financial instruments, including the extent to which we have relied on significant unobservable inputs to estimate fair value and our process for corroborating these inputs, in “Note 17—Fair Value Measurement.”
Fair Value Measurement
We have a governance framework and a number of key controls that are intended to ensure that our fair value measurements are appropriate and reliable. Our governance framework provides for independent oversight and segregation of duties. Our control processes include review and approval of new transaction types, price verification and review of valuation judgments, methods, models, process controls and results.
Groups independent of our trading and investing functions participate in the review and validation process. Tasks performed by these groups include periodic verification of fair value measurements to determine if assigned fair values are reasonable, including comparing prices from vendor pricing services to other available market information.
|
68
|
Capital One Financial Corporation (COF)
|
|
Our Fair Value Committee (“FVC”), which includes representation from business areas, Risk Management and Finance divisions, provides guidance and oversight to ensure an appropriate valuation control environment. The FVC regularly reviews and approves our fair valuations to ensure that our valuation practices are consistent with industry standards and adhere to regulatory and accounting guidance.
We have a model policy, established by an independent Model Risk Office, which governs the validation of models and related supporting documentation to ensure the appropriate use of models for pricing and fair value measurements. The Model Risk Office validates all models and provides ongoing monitoring of their performance.
The fair value governance process is set up in a manner that allows the Chairperson of the FVC to escalate valuation disputes that cannot be resolved by the FVC to a more senior committee called the Valuations Advisory Committee (“VAC”) for resolution. The VAC is chaired by the Chief Financial Officer and includes other members of senior management. The VAC is only required to convene to review escalated valuation disputes.
Customer Rewards Reserve
We offer products, primarily credit cards, which include programs that allow members to earn rewards, that can be redeemed for cash (primarily in the form of statement credits), gift cards, airline tickets or merchandise, based on account activity. The amount of rewards that a customer earns varies based on the terms and conditions of the rewards program and product. The majority of our rewards do not expire and there is no limit on the amount of rewards an eligible card member can earn. Customer rewards costs, which we generally record as an offset to interchange income, are driven by various factors, such as card member purchase volume, the terms and conditions of the rewards program and rewards redemption cost. We establish a customer rewards reserve that reflects management’s judgment regarding rewards earned that are expected to be redeemed and the estimated redemption cost.
We use financial models to estimate ultimate redemption rates of rewards earned to date by current card members based on historical redemption trends, current enrollee redemption behavior, card product type, year of program enrollment, enrollment tenure and card spend levels. Our current assumption is that the vast majority of all rewards earned will eventually be redeemed. We use a weighted-average redemption cost during the previous twelve months, adjusted as appropriate for recent changes in redemption costs, including mix of rewards redeemed, to estimate future redemption costs. We continually evaluate our reserve and assumptions based on developments in redemption patterns, changes to the terms and conditions of the rewards program and other factors. Changes in the ultimate redemption rate and weighted-average redemption cost have the effect of either increasing or decreasing the reserve through the current period provision by an amount estimated to cover the cost of all rewards earned but not yet redeemed by card members as of the end of the reporting period. We recognized customer rewards expense of
$3.7 billion
,
$3.2 billion
and
$2.7 billion
in 2017, 2016 and 2015, respectively. Our customer rewards liability, which is included in other liabilities on our consolidated balance sheets, totaled
$3.9 billion
and
$3.6 billion
as of December 31, 2017 and 2016, respectively.
|
ACCOUNTING CHANGES AND DEVELOPMENTS
|
In connection with the enactment of the Tax Act, the SEC issued Staff Accounting Bulletin No. 118,
Income Tax Accounting Implications of the Tax Cuts and Jobs Act
to express the views of the Staff of the SEC’s Division of Corporation Finance regarding application of Accounting Standards Codification Topic 740,
Income Taxes
, (“Topic 740”) in the reporting period that includes the date the Tax Act was signed into law. This bulletin states that the financial statements which include the reporting period in which the Tax Act was signed into law, should reflect the income tax impacts of the Tax Act for which the accounting under Topic 740 is complete. To the extent the accounting under Topic 740 is not complete, but a reasonable estimate of the impacts can be determined, such an estimate should be included in the financial statements as a provisional amount. For any specific tax impacts for which a reasonable estimate cannot be determined, a provisional amount should not be reported and Topic 740 should be applied using the provisions of the tax laws that were in effect immediately before the Tax Act.
The bulletin sets forth a measurement period which begins in the reporting period that includes the date the Tax Act was signed into law and ends when the accounting under Topic 740 is complete, subject to a maximum length of one year. During this measurement period, adjustments to provisional amounts may need to be reflected based on facts and circumstances that existed as of the date the Tax Act was signed into law that, if known, would have affected the income tax impacts initially reported as provisional. Finally, the bulletin requires disclosures for any income tax impacts of the Tax Act that are accounted for under a measurement period approach.
|
69
|
Capital One Financial Corporation (COF)
|
|
Under this bulletin, we have determined that we are able to make reasonable estimates for certain effects of the Tax Act for the year ended December 31, 2017. Accordingly, we have recognized provisional amounts for the impacts of the Tax Act based on these reasonable estimates. However, as of the date of this Form 10-K, we are continuing to evaluate the accounting impacts of the Tax Act as we continue to assemble and analyze all the information required to prepare and analyze these effects and await additional guidance from the U.S. Treasury Department, Internal Revenue Service, or other standard-setting bodies. We continue to assess information relating to these amounts, and with respect to the repatriation tax, we continue to assess its application in other jurisdictions. Additionally, we continue to analyze other information and regulatory guidance, and accordingly, we may record additional provisional amounts or adjustments to provisional amounts during the measurement period ending no later than December 2018.
We provide the additional disclosures required by this bulletin in “
Note 16—Income Taxes
.”
See “
Note 1—Summary of Significant Accounting Policies
” for information on accounting standards adopted in 2017, as well as recently issued accounting standards not yet required to be adopted and the expected impact of these changes in accounting standards.
|
CAPITAL MANAGEMENT
|
The level and composition of our capital are determined by multiple factors, including our consolidated regulatory capital requirements and internal risk-based capital assessments such as internal stress testing and economic capital. The level and composition of our capital may also be influenced by rating agency guidelines, subsidiary capital requirements, the business environment, conditions in the financial markets and assessments of potential future losses due to adverse changes in our business and market environments.
Capital Standards and Prompt Corrective Action
We are subject to capital adequacy standards adopted by the Federal Reserve, Office of the Comptroller of the Currency (“OCC”) and Federal Deposit Insurance Corporation (“FDIC”) (collectively, the “Federal Banking Agencies”), including the capital rules that implemented the Basel III capital framework (“Basel III Capital Rule”) developed by the Basel Committee on Banking Supervision (“Basel Committee”). Moreover, the Banks, as insured depository institutions, are subject to prompt corrective action (“PCA”) capital regulations.
In July 2013, the Federal Banking Agencies adopted the Basel III Capital Rule, which, in addition to implementing the Basel III capital framework, also implemented certain Dodd-Frank Act and other capital provisions, and updated the PCA capital framework to reflect the new regulatory capital minimums. The Basel III Capital Rule amended both the Basel I and Basel II Advanced Approaches frameworks, established a new common equity Tier 1 capital requirement and set higher minimum capital ratio requirements. We refer to the amended Basel I framework as the “Basel III Standardized Approach,” and the amended Advanced Approaches framework as the “Basel III Advanced Approaches.”
At the end of 2012, we met one of the two independent eligibility criteria set by banking regulators for becoming subject to the Advanced Approaches capital rules. As a result, we have undertaken a multi-year process of implementing the Advanced Approaches regime for calculating risk-weighted assets and regulatory capital levels. We entered parallel run under Advanced Approaches on January 1, 2015, during which we are required to calculate capital ratios under both the Basel III Standardized Approach and the Basel III Advanced Approaches, though we continue to use the Standardized Approach for purposes of meeting regulatory capital requirements.
The Basel III Capital Rule also introduced the supplementary leverage ratio for all Advanced Approaches banking organizations with a minimum requirement of 3.0%. The supplementary leverage ratio compares Tier 1 capital to total leverage exposure, which includes all on-balance sheet assets and certain off-balance sheet exposures, including derivatives and unused commitments. Given that we are in our Basel III Advanced Approaches parallel run, we calculate the ratio based on Tier 1 capital under the Standardized Approach. The minimum requirement for the supplementary leverage ratio became effective as of January 1, 2018. As an Advanced Approaches banking organization, however, we were required to calculate and publicly disclose our supplementary leverage ratio beginning in the first quarter of 2015.
The Market Risk Rule supplements both the Basel III Standardized Approach and the Basel III Advanced Approaches by requiring institutions subject to the Market Risk Rule to adjust their risk-based capital ratios to reflect the market risk in their trading portfolios. The Market Risk Rule generally applies to institutions with aggregate trading assets and liabilities equal to the lesser of (i) 10%
|
70
|
Capital One Financial Corporation (COF)
|
|
or more of total assets or (ii) $1 billion or more.
As of
December 31, 2017
, the Company and CONA are subject to the Market Risk Rule. See “MD&A—
Market Risk Profile
” below for additional information.
In October 2017, the Federal Banking Agencies proposed certain limited changes to the Basel III Capital Rule. There is uncertainty regarding how any of the proposed changes may impact the Basel III Standardized Approach and the Basel III Advanced Approaches. Additionally, in December 2017, the Basel Committee finalized certain modifications to the international Basel III capital standards, which would require rulemaking in the United States prior to becoming effective for United States banking organizations. There is uncertainty around which of those changes may be adopted in the United States and how those changes may impact the U.S. capital framework.
Table
13
provides a comparison of our regulatory capital ratios under the Basel III Standardized Approach subject to the applicable transition provisions, the regulatory minimum capital adequacy ratios and the PCA well-capitalized level for each ratio, where applicable, as of
December 31, 2017
and
2016
.
Table
13
:
Capital Ratios under Basel III
(1)
__________
|
|
December 31, 2017
|
December 31, 2016
|
||||||||||||||||
|
Capital
Ratio |
Minimum
Capital Adequacy |
Well-
Capitalized |
Capital
Ratio |
Minimum
Capital Adequacy |
Well-
Capitalized |
|||||||||||||
|
Capital One Financial Corp:
|
||||||||||||||||||
|
Common equity Tier 1 capital
(2)
|
10.3
|
%
|
4.5
|
%
|
N/A
|
|
10.1
|
%
|
4.5
|
%
|
N/A
|
|
||||||
|
Tier 1 capital
(3)
|
11.8
|
|
6.0
|
|
6.0
|
%
|
11.6
|
|
6.0
|
|
6.0
|
%
|
||||||
|
Total capital
(4)
|
14.4
|
|
8.0
|
|
10.0
|
|
14.3
|
|
8.0
|
|
10.0
|
|
||||||
|
Tier 1 leverage
(5)
|
9.9
|
|
4.0
|
|
N/A
|
|
9.9
|
|
4.0
|
|
N/A
|
|
||||||
|
Supplementary leverage
(6)
|
8.4
|
|
N/A
|
|
N/A
|
|
8.6
|
|
N/A
|
|
N/A
|
|
||||||
|
COBNA:
|
|
|
||||||||||||||||
|
Common equity Tier 1 capital
(2)
|
14.3
|
|
4.5
|
|
6.5
|
|
12.0
|
|
4.5
|
|
6.5
|
|
||||||
|
Tier 1 capital
(3)
|
14.3
|
|
6.0
|
|
8.0
|
|
12.0
|
|
6.0
|
|
8.0
|
|
||||||
|
Total capital
(4)
|
16.9
|
|
8.0
|
|
10.0
|
|
14.8
|
|
8.0
|
|
10.0
|
|
||||||
|
Tier 1 leverage
(5)
|
12.7
|
|
4.0
|
|
5.0
|
|
10.8
|
|
4.0
|
|
5.0
|
|
||||||
|
Supplementary leverage
(6)
|
10.4
|
|
N/A
|
|
N/A
|
|
8.9
|
|
N/A
|
|
N/A
|
|
||||||
|
CONA:
|
|
|
||||||||||||||||
|
Common equity Tier 1 capital
(2)
|
12.2
|
|
4.5
|
|
6.5
|
|
10.6
|
|
4.5
|
|
6.5
|
|
||||||
|
Tier 1 capital
(3)
|
12.2
|
|
6.0
|
|
8.0
|
|
10.6
|
|
6.0
|
|
8.0
|
|
||||||
|
Total capital
(4)
|
13.4
|
|
8.0
|
|
10.0
|
|
11.8
|
|
8.0
|
|
10.0
|
|
||||||
|
Tier 1 leverage
(5)
|
8.6
|
|
4.0
|
|
5.0
|
|
7.7
|
|
4.0
|
|
5.0
|
|
||||||
|
Supplementary leverage
(6)
|
7.7
|
|
N/A
|
|
N/A
|
|
6.9
|
|
N/A
|
|
N/A
|
|
||||||
|
(1)
|
Capital ratios are calculated based on the Basel III Standardized Approach framework, subject to applicable transition provisions, such as the inclusion of the unrealized gains and losses on securities available for sale included in accumulated other comprehensive income (“AOCI”) and adjustments related to intangible assets other than goodwill. The inclusion of AOCI and the adjustments related to intangible assets are phased-in at 60% for 2016, 80% for 2017 and 100% for 2018.
|
|
(2)
|
Common equity Tier 1 capital ratio is a regulatory capital measure calculated based on common equity Tier 1 capital divided by risk-weighted assets.
|
|
(3)
|
Tier 1 capital ratio is a regulatory capital measure calculated based on Tier 1 capital divided by risk-weighted assets.
|
|
(4)
|
Total capital ratio is a regulatory capital measure calculated based on total capital divided by risk-weighted assets.
|
|
(5)
|
Tier 1 leverage ratio is a regulatory capital measure calculated based on Tier 1 capital divided by adjusted average assets.
|
|
(6)
|
Supplementary leverage ratio is a regulatory capital measure calculated based on Tier 1 capital divided by total leverage exposure.
|
The Company exceeded the minimum capital requirements and each of the Banks exceeded the minimum regulatory requirements and were well capitalized under PCA requirements as of both
December 31, 2017
and
2016
.
|
71
|
Capital One Financial Corporation (COF)
|
|
The Basel III Capital Rule requires banks to maintain a capital conservation buffer, composed of common equity Tier 1 capital, of 2.5% above the regulatory minimum ratios.
The capital conservation buffer is being phased in over a transition period that commenced on January 1, 2016 and will be fully phased in on January 1, 2019. The capital conservation buffer was 1.25% in 2017.
For banks subject to the Advanced Approaches, including the Company and the Banks, the capital conservation buffer may be supplemented by an incremental countercyclical capital buffer of up to 2.5% (once fully phased-in) composed of
common equity Tier 1 capital
and set at the discretion of the Federal Banking Agencies. As of December 31, 2017, the countercyclical capital buffer was zero percent in the United States. A determination to increase the countercyclical capital buffer generally would be effective twelve months after the announcement of such an increase, unless the Federal Banking Agencies set an earlier effective date. The countercyclical capital buffer, if set to an amount greater than zero percent, would be subject to the same transition period as the capital conservation buffer, which commenced on January 1, 2016.
For 2017, the minimum capital requirement plus capital conservation buffer and countercyclical capital buffer for
common equity Tier 1 capital,
Tier 1 capital and total capital ratios were 5.75%, 7.25% and 9.25%, respectively, for the Company and the Banks.
A common equity Tier 1
capital ratio, Tier 1 capital ratio, or total capital ratio below the applicable regulatory minimum ratio plus the applicable capital conservation buffer and the applicable countercyclical buffer (if set to an amount greater than zero percent) might restrict a bank’s ability to distribute capital and make discretionary bonus payments. As of
December 31, 2017
,
the Company and each of the Banks were all above the applicable combined thresholds.
Additionally, banks designated as global systemically important banks (“G-SIBs”) are subject to an additional regulatory capital surcharge above the combined capital conservation and countercyclical capital buffers established by the Basel III Capital Rule. We are currently not designated as a G-SIB and therefore not subject to this surcharge.
The following table compares our common equity Tier 1 capital and risk-weighted assets as of
December 31, 2017
, subject to applicable transition provisions, to our estimated fully phased-in common equity Tier 1 capital and risk-weighted assets, as it applies for Advanced Approaches banks such as ourselves that have not yet exited parallel run. Our estimated common equity Tier 1 capital, risk-weighted assets and common equity Tier 1 capital ratio under the fully phased-in Basel III Standardized Approach are non-GAAP financial measures that we believe provide useful information in evaluating compliance with regulatory capital requirements that are not effective yet. They are calculated based on our interpretations, expectations and assumptions of relevant regulations, as well as interpretations provided by our regulators, and are subject to change based on changes to future regulations and interpretations. As we continue to engage with our regulators, there could be further changes to the calculation.
Table
14
:
Regulatory Capital Reconciliations between Basel III Transition to Fully Phased-in
__________
|
(Dollars in millions)
|
December 31, 2017
|
|||
|
Common equity Tier 1 capital under Basel III Standardized Approach
|
|
$
|
30,036
|
|
|
Adjustments related to AOCI
|
(118
|
)
|
||
|
Adjustments related to intangibles
|
(83
|
)
|
||
|
Estimated common equity Tier 1 capital under fully phased-in Basel III Standardized Approach
|
$
|
29,835
|
|
|
|
Risk-weighted assets under Basel III Standardized Approach
(1)
|
$
|
292,225
|
|
|
|
Adjustments for fully phased-in Basel III Standardized Approach
(2)
|
445
|
|
||
|
Estimated risk-weighted assets under fully phased-in Basel III Standardized Approach
|
$
|
292,670
|
|
|
|
Estimated common equity Tier 1 capital ratio under fully phased-in Basel III Standardized Approach
(3)
|
|
10.2
|
%
|
|
|
(1)
|
Includes credit and market risk-weighted assets.
|
|
(2)
|
Adjustments include higher risk weights for items that are included in capital based on the threshold deduction approach, such as mortgage servicing assets and deferred tax assets. The adjustments also include removal of risk weights for items that are deducted from common equity Tier 1 capital.
|
|
(3)
|
Estimated common equity Tier 1 capital ratio is calculated by dividing estimated common equity Tier 1 capital by estimated risk-weighted assets, which are both calculated under the Basel III Standardized Approach, as it applies when fully phased-in for Advanced Approaches banks that have not yet exited parallel run.
|
|
72
|
Capital One Financial Corporation (COF)
|
|
Under the Basel III Capital Rule, when we complete our parallel run for the Advanced Approaches, our minimum risk-based capital requirement will be determined by the greater of our risk-weighted assets under the Basel III Standardized Approach and the Basel III Advanced Approaches. See “Part I—Item 1. Business—Supervision and Regulation” for additional information.
Once we exit parallel run, based on clarification of the Basel III Capital Rule from our regulators, any amount by which our expected credit losses exceed eligible credit reserves, as each term is defined under the Basel III Capital Rule, will be deducted from our Basel III Standardized Approach numerator, subject to transition provisions. Inclusive of this impact, based on current capital rules and our business mix, we estimate that our Basel III Advanced Approaches ratios will be lower than our Basel III Standardized Approach ratios. However, there is uncertainty whether this will remain the case in light of potential changes to the United States capital rules.
Capital Planning and Regulatory Stress Testing
On June 28, 2017, the Federal Reserve completed its 2017 CCAR and did not object to our proposed capital plan. As a result, in June 2017, the Board of Directors authorized the repurchase of up to $1.85 billion of shares of our common stock from the third quarter of 2017 through the end of the second quarter of 2018 and the quarterly dividend on our common stock of $0.40 per share. As a condition to not objecting to the capital plan, the Federal Reserve required us to submit a revised capital plan by December 28, 2017 to address certain weaknesses it identified in our capital planning process. On December 24, 2017, using data as of June 30, 2017, we resubmitted our capital plan for the 2017 CCAR process. In connection with the resubmission, the Board of Directors reduced the authorized repurchases of our common stock to up to $1.0 billion for the remaining 2017 CCAR period, which ends June 30, 2018. If the Federal Reserve objects to the resubmitted capital plan, it may restrict subsequent capital distributions.
Dividend Policy and Stock Purchases
On February 1, 2018, our Board of Directors declared a quarterly common stock dividend of $0.40 per share, payable on February 23, 2018 to stockholders of record at the close of the business on February 12, 2018. Our Board of Directors also approved quarterly dividends on our 6.00% Fixed Rate Non-Cumulative Perpetual Preferred Stock, Series B (“Series B Preferred Stock”), our 6.25% Fixed Rate Non-Cumulative Perpetual Preferred Stock, Series C (“Series C Preferred Stock”), our 6.70% Fixed Rate Non-Cumulative Perpetual Preferred Stock, Series D (“Series D Preferred Stock”), our 6.20% Fixed Rate Non-Cumulative Perpetual Preferred Stock, Series F (“Series F Preferred Stock”), our 5.20% Fixed Rate Non-Cumulative Perpetual Preferred Stock, Series G (“Series G Preferred Stock”) and our 6.00% Fixed Rate Non-Cumulative Perpetual Preferred Stock, Series H (“Series H Preferred Stock”), payable on March 1, 2018 to stockholders of record at the close of business on February 14, 2018. Based on those declarations, we will pay approximately $196 million in common equity dividends and approximately $52 million in total preferred dividends in the first quarter of 2018. Under the terms of our outstanding preferred stock, our ability to pay dividends on, make distributions with respect to, or to repurchase, redeem or acquire its common stock or any preferred stock ranking on parity with or junior to the preferred stock, is subject to restrictions in the event that we do not declare and either pay or set aside a sum sufficient for payment of dividends on the preferred stock for the immediately preceding dividend period.
We paid common stock dividends of
$0.40
per share in each quarter of
2017
. The following table summarizes the dividends paid per share on our various preferred stock series in each quarter of
2017
.
|
73
|
Capital One Financial Corporation (COF)
|
|
Table
15
:
Preferred Stock Dividends Paid Per Share
|
Series
|
Description
|
Issuance Date
|
Per Annum Dividend Rate
|
Dividend Frequency
|
2017
|
|||||||||||||||||||
|
Q4
|
Q3
|
Q2
|
Q1
|
|||||||||||||||||||||
|
Series B
|
6.00%
Non-Cumulative |
August 20, 2012
|
6.00%
|
Quarterly
|
$
|
15.00
|
|
$
|
15.00
|
|
$
|
15.00
|
|
$
|
15.00
|
|
||||||||
|
Series C
|
6.25%
Non-Cumulative |
June 12, 2014
|
6.25
|
Quarterly
|
15.63
|
|
15.63
|
|
15.63
|
|
15.63
|
|
||||||||||||
|
Series D
|
6.70%
Non-Cumulative |
October 31, 2014
|
6.70
|
Quarterly
|
16.75
|
|
16.75
|
|
16.75
|
|
16.75
|
|
||||||||||||
|
Series E
|
Fixed-to-Floating Rate Non-Cumulative
|
May 14, 2015
|
5.55% through 5/31/2020;
3-mo. LIBOR+ 380 bps thereafter |
Semi-Annually through 5/31/2020; Quarterly thereafter
|
27.75
|
|
—
|
|
27.75
|
|
—
|
|
||||||||||||
|
Series F
|
6.20%
Non-Cumulative |
August 24, 2015
|
6.20
|
Quarterly
|
15.50
|
|
15.50
|
|
15.50
|
|
15.50
|
|
||||||||||||
|
Series G
|
5.20%
Non-Cumulative |
July 29, 2016
|
5.20
|
Quarterly
|
13.00
|
|
13.00
|
|
13.00
|
|
13.00
|
|
||||||||||||
|
Series H
|
6.00%
Non-Cumulative |
November 29, 2016
|
6.00
|
Quarterly
|
15.00
|
|
15.00
|
|
15.00
|
|
15.33
|
|
||||||||||||
The declaration and payment of dividends to our stockholders, as well as the amount thereof, are subject to the discretion of our Board of Directors and depend upon our results of operations, financial condition, capital levels, cash requirements, future prospects and other factors deemed relevant by the Board of Directors. As a bank holding company (“BHC”), our ability to pay dividends is largely dependent upon the receipt of dividends or other payments from our subsidiaries. Regulatory restrictions exist that limit the ability of the Banks to transfer funds to our BHC. As of
December 31, 2017
, funds available for dividend payments from COBNA and CONA were
$4.0 billion
and
$1.6 billion
, respectively. There can be no assurance that we will declare and pay any dividends to stockholders.
On June 29, 2016, the Board of Directors authorized the repurchase of up to $2.5 billion of shares of our common stock (“2016 Stock Repurchase Program”) from the third quarter of 2016 through the end of the second quarter of 2017. Through the end of the second quarter of 2017, we repurchased approximately $2.2 billion of shares of common stock as part of the 2016 Stock Repurchase Program. We repurchased an immaterial amount of our common stock through the end of 2017 as part of the 2017 Stock Repurchase Program.
The timing and exact amount of any future common stock repurchases will depend on various factors, including regulatory approval, market conditions, opportunities for growth, our capital position and the amount of retained earnings. Our stock repurchase program does not include specific price targets, may be executed through open market purchases or privately negotiated transactions, including utilizing Rule 10b5-1 programs, and may be suspended at any time. For additional information on dividends and stock repurchases, see “Part I—Item 1. Business—Supervision and Regulation—Dividends, Stock Repurchases and Transfer of Funds.”
|
RISK MANAGEMENT
|
Risk Framework
We use a risk framework to provide an overall enterprise-wide approach for effectively managing risk. We execute against our risk framework with the “Three Lines of Defense” risk management model to demonstrate and structure the roles, responsibilities and accountabilities in the organization for taking and managing risk.
The “First Line of Defense” is comprised of the business areas that through their day-to-day business activities take risk on our behalf. As the business owner, the first line is responsible for identifying, assessing, managing and controlling that risk. This principle places ultimate accountability for the management of risks and ownership of risk decisions with the CEO and business heads. The “Second Line of Defense” provides oversight of first line risk taking and management, and is primarily comprised of our Risk Management organization. The second line assists in determining risk appetite and the strategies, policies and structures for managing risks. The second line is both an “expert advisor” to the first line and an “effective challenger” of first line risk activities. The “Third Line of Defense” is comprised of our Internal Audit and Credit Review functions. The third line provides
|
74
|
Capital One Financial Corporation (COF)
|
|
independent and objective assurance to senior management and to the Board of Directors that first and second line risk management and internal control systems and its governance processes are well-designed and working as intended.
The risk framework is also used to guide design of risk programs and performance of risk activity within each risk category and across the entire enterprise.
Our risk framework, which is built around governance, processes and people, consists of the following eight key elements:
Establish Governance Processes, Accountabilities and Risk Appetites
The starting point of our risk framework is the establishment of governance processes, accountabilities and risk appetites. Our Board of Directors and senior management establish the tone at the top regarding the importance of internal control, including standards of conduct and the integrity and ethical values of the Company. Management reinforces expectations at the various levels of the organization. This portion of the framework sets the foundation for the methods for governing risk taking, the interactions within and among the lines of defense, and the risk appetites and tolerance limits for risk taking.
Identify and Assess Risks and Ownership
Identifying and assessing risks and ownership is the beginning of the more detailed day-to-day process of managing risk. This portion of the framework clarifies the importance of strong first-line management and accountability for identifying and assessing risk while specifying the role of the second line to identify and assess risk, particularly when taking on new initiatives.
Develop and Operate Controls, Monitoring and Mitigation Plans
We develop, operate and monitor controls to manage risk within tolerance levels. The first line develops controls to oversee and manage identified risks. Controls may prevent risks from occurring or measure the amount of risk being taken so that the amount may be proactively managed. Whenever possible, plans are implemented to mitigate risks or reduce them to lower levels. The first line leads mitigation, control and monitoring actions. The second line is a consultant on control design when needed.
Test and Detect Control Gaps and Perform Corrective Action
While the first line is principally accountable for taking, controlling and monitoring risk, the second line oversees and monitors first line risk taking, including the effectiveness of first line controls, and the third line independently tests and oversees first and second line risk taking. These activities provide the second and third lines of defense with the ability to reduce the likelihood of unauthorized or unplanned risk taking within the organization. Control gaps are closed by first line corrective action.
Escalate Key Risks and Gaps to Executive Management and when appropriate, the Board of Directors
Escalation is an important component of our risk framework. Use of escalation is encouraged and does not necessarily indicate a failure on the part of first, second, or third line risk management. Through escalation in the first line, decisions requiring judgment can be raised to executives who have the broadest possible context and experience to make challenging decisions. Escalation in the second and third lines of defense can also demonstrate part of their core responsibilities of effective challenge. If appropriate, risks are escalated to the Board of Directors to ensure alignment with the most material risk decisions and/or transparency to the largest risks facing the organization.
Calculate and Allocate Capital in Alignment with Risk Management and Measurement Processes (including Stress Testing)
Capital ultimately is held to protect the company from unforeseen risks or unexpected risk severity. As such, it is important that capital planning processes be well linked with risk management practices to ensure the appropriate capital protections are in place for the safety and soundness of the company. Stress testing and economic capital measurement, both of which incorporate inputs from across the risk spectrum, are key tools for evaluating our capital position and risk adjusted returns.
Support with the Right Culture, Talent and Skills
The right culture, talent and skills are critical to effective risk management. Our risk framework is supported with the right culture that promotes the foundation and values of the risk management organization. Skills necessary to effectively manage risk are reinforced through performance management systems. When needed, risk talent is augmented through recruitment of industry experts as well as training and development of internal associates.
|
75
|
Capital One Financial Corporation (COF)
|
|
Enabled by the Right Data, Infrastructure and Programs
Data, infrastructure and programs are key enablers of our risk management processes and practices. These core requirements enable effective risk modeling, efficient first, second and third line risk activity performance, and cross-line interaction.
Risk Appetite
Risk appetite defines the parameters for taking and accepting risks and are used by management and our Board of Directors to make business decisions. Risk appetite refers to the level of risk our business is willing to take in pursuit of our corporate business objectives. The Board of Directors approves our risk appetite including risk appetite statements and associated metrics, Board Notification Thresholds, and Board Limits for each of our eight risk categories. We communicate risk appetite statements, limits and thresholds to the appropriate levels in the organization and monitor adherence. While first line executives manage risk on a day-to-day basis, the Chief Risk Officer provides effective challenge and independent oversight to ensure that risks are within the appetite and specific limits established by the Board of Directors. The Chief Risk Officer reports to the Board of Directors regularly on the nature and level of risk across all eight risk categories. In addition to his broader management responsibilities, our Chief Executive Officer is responsible for developing the strategy and mission of our organization, determining and leading our culture, and reviewing and providing input into our risk appetite.
Risk Categories
We apply our risk framework to protect our company from the eight major categories of risk that we are exposed to through our business activities. Our eight major categories of risk are:
|
•
|
Compliance Risk:
Compliance risk is the risk to current or anticipated earnings or capital arising from violations of laws, rules, or regulations. Compliance risk can also arise from nonconformance with prescribed practices, internal policies and procedures, contractual obligations, or ethical standards that reinforce those laws, rules, or regulations;
|
|
•
|
Credit Risk:
Credit risk is the risk to current or projected financial condition and resilience arising from an obligor’s failure to meet the terms of any contract with the Company or otherwise perform as agreed;
|
|
•
|
Legal Risk:
Legal risk is the risk of material adverse impact due to: new and changed laws and regulations; interpretations of law; drafting, interpretation and enforceability of contracts; adverse decisions/consequences arising from litigation or regulatory action; the establishment, management and governance of our legal entity structure; and the failure to seek/follow appropriate Legal counsel when needed;
|
|
•
|
Liquidity Risk:
Liquidity risk is the risk that the Company will not be able to meet its future financial obligations as they come due, or invest in future asset growth because of an inability to obtain funds at a reasonable price within a reasonable time period;
|
|
•
|
Market Risk:
Market risk is the risk that an institution’s earnings or the economic value of equity could be adversely impacted by changes in interest rates, foreign exchange rates, or other market factors;
|
|
•
|
Operational Risk:
Operational risk is the risk of loss, capital impairment, adverse customer experience, or reputational impact resulting from failure to comply with policies and procedures, failed internal processes or systems, or from external events;
|
|
•
|
Reputation Risk:
Reputation risk is the risk to market value, recruitment and retention of talented associates and maintenance of a loyal customer base due to the negative perceptions of our internal and external constituents regarding our business strategies and activities; and
|
|
•
|
Strategic Risk:
Strategic risk is the risk of a material impact on current or anticipated earnings, capital, franchise or enterprise value arising from: (i) the Company’s competitive and market position and evolving forces in the industry that can affect that position; (ii) lack of responsiveness to these conditions; (iii) strategic decisions to change the Company’s scale, market position or operating model; or (iv) failure to appropriately consider implementation risks inherent in the Company’s strategy.
|
Below we provide an overview of how we manage our eight primary risk categories.
|
76
|
Capital One Financial Corporation (COF)
|
|
Compliance Risk Management
We recognize that compliance requirements for financial institutions are increasingly complex and that there are heightened expectations from our regulators and our customers. In response, we continuously evaluate the regulatory environment and proactively adjust our compliance risk program to fully address these expectations.
Our Compliance Management Program establishes expectations for determining compliance requirements, assessing the risk of new product offerings, creating appropriate controls and training to address requirements, monitoring for control performance, and independently testing for adherence to compliance requirements. The program also establishes regular compliance reporting to senior business leaders, the executive committee and the Board of Directors.
The Chief Compliance Officer is responsible for establishing and overseeing our Compliance Risk Management Program. Business areas incorporate compliance requirements and controls into their business policies, standards, processes and procedures. They regularly monitor and report on the efficacy of their compliance controls and Corporate Compliance periodically independently tests to validate the effectiveness of business controls.
Credit Risk Management
We try to ensure our credit portfolio is resilient to economic downturns. Our most important tool in this endeavor is sound underwriting. In unsecured consumer loan underwriting, we generally assume that loans will be subject to an environment in which losses are higher than those prevailing at the time of underwriting. In commercial underwriting, we generally require strong cash flow, collateral and covenants and guarantees. In addition to sound underwriting, we continually monitor our portfolio and take steps to collect or work out distressed loans.
The Chief Risk Officer, in conjunction with the Consumer and Commercial Chief Credit Officers, is responsible for establishing credit risk policies and procedures, including underwriting and hold guidelines and credit approval authority, and monitoring credit exposure and performance of our lending-related transactions. These responsibilities are fulfilled by the Chief Consumer Credit Officer and the Chief Commercial Credit Officer who are responsible for evaluating the risk implications of credit strategy and for oversight of credit for both the existing portfolio and any new credit investments. The Chief Consumer Credit Officer and the Chief Commercial Credit Officer have formal approval authority for various types and levels of credit decisions, including individual commercial loan transactions. Division Presidents within each segment are responsible for managing the credit risk within their divisions and maintaining processes to control credit risk and comply with credit policies and guidelines. In addition, the Chief Risk Officer establishes policies, delegates approval authority and monitors performance for non-loan credit exposure entered into with financial counterparties or through the purchase of credit sensitive securities in our investment portfolio.
Our credit policies establish standards in five areas: customer selection, underwriting, monitoring, remediation and portfolio management. The standards in each area provide a framework comprising specific objectives and control processes. These standards are supported by detailed policies and procedures for each component of the credit process. Starting with customer selection, our goal is to generally provide credit on terms that generate above hurdle returns. We use a number of quantitative and qualitative factors to manage credit risk, including setting credit risk limits and guidelines for each of our lines of business. We monitor performance relative to these guidelines and report results and any required mitigating actions to appropriate senior management committees and our Board of Directors.
Legal Risk Management
The General Counsel provides legal evaluation and guidance to the enterprise and business areas and partners with other risk management functions such as Compliance and Internal Audit. This evaluation and guidance is based on an assessment of the type and degree of legal risk associated with the internal business area practices and activities and of the controls the business has in place to mitigate legal risks.
Liquidity Risk Management
The Chief Financial Officer and the Chief Risk Officer, in conjunction with the Chief Market and Liquidity Risk Officer, are responsible for the establishment of liquidity risk management policies and standards for governance and monitoring of liquidity risk at a corporate level. We assess liquidity strength by evaluating several different balance sheet metrics under severe stress scenarios to ensure we can withstand significant funding degradation through idiosyncratic, systematic, and combined liquidity stress scenarios. We continuously monitor market and economic conditions to evaluate emerging stress conditions and appropriate
|
77
|
Capital One Financial Corporation (COF)
|
|
action plans in accordance with our Contingency Funding Plan. Management reports liquidity metrics to appropriate senior management committees and our Board of Directors no less than quarterly.
We seek to mitigate liquidity risk strategically and tactically. From a strategic perspective, we have acquired and built deposit gathering businesses and significantly reduced our loan to deposit ratio. From a tactical perspective, we have accumulated a sizable liquidity reserve comprised of cash, high-quality, unencumbered securities and committed collateralized credit lines. We also continue to maintain access to secured and unsecured markets through ongoing issuance. This combination of stable and diversified funding sources and our stockpile of liquidity reserves enables us to maintain confidence in our liquidity position.
Market Risk Management
The Chief Financial Officer and the Chief Risk Officer, in conjunction with the Chief Market and Liquidity Risk Officer, are responsible for the establishment of market risk management policies and standards for the governance and monitoring of market risk at a corporate level. Market risk is inherent from the financial instruments associated with our business operations and activities including loans, deposits, securities, short-term borrowings, long-term debt and derivatives. We manage market risk exposure, which is principally driven by balance sheet interest rate risk, centrally and establish quantitative risk limits to monitor and control our exposure.
We recognize that interest rate and foreign exchange risk is inherent in the banking business due to the nature of the assets and liabilities of banks. Banks typically manage the trade-off between near-term earnings volatility and market value volatility by targeting moderate levels of each. In addition to using industry accepted techniques to analyze and measure interest rate and foreign exchange risk, we perform sensitivity analysis to identify our risk exposures under a broad range of scenarios. Investment securities and derivatives are the main levers for the management of interest rate and foreign exchange risk.
The market risk positions for the Company and each of the Banks are calculated separately and in aggregate, and analyzed against pre-established limits. Results are reported to the Asset Liability Committee monthly and to the Risk Committee of the Board of Directors no less than quarterly. Management is authorized to utilize financial instruments as outlined in our policy to actively manage market risk exposure.
Operational Risk Management
We recognize the criticality of managing operational risk on both a strategic and day-to-day basis and that there are heightened expectations from our regulators and our customers. We have implemented appropriate operational risk management policies, standards, processes and controls to enable the delivery of high quality and consistent customer experiences and to achieve business objectives in a controlled manner.
The Chief Operational Risk Officer is responsible for establishing and overseeing our Operational Risk Management Program. In accordance with Basel III Advanced Approaches requirements, the program establishes practices for assessing the operational risk profile and executing key control processes for operational risks. Corporate Operational Risk Management enforces these practices and delivers reporting of operational risk results to senior business leaders, the executive committee and the Board of Directors.
Reputation Risk Management
We recognize that reputation risk is of particular concern for financial institutions and, increasingly, technology companies, in the current environment. Areas of concern have expanded to include company policies, practices and values and, with the growing use of social and digital platforms, public corporations face a new level of scrutiny and channels for activism and advocacy. The heightened expectations of internal and external stakeholders have made corporate culture, values and conduct pressure points for individuals and advocates voicing concerns or seeking change. We manage both strategic and tactical reputation issues and build our relationships with government officials, media, community and consumer advocates, customers, and other constituencies to help strengthen the reputations of both our company and industry. Our actions include implementing pro-customer practices in our business and serving low to moderate income communities in our market area consistent with a quality bank. The Executive Vice President of External Affairs is responsible for managing our overall reputation risk program. Day-to-day activities are controlled by the frameworks set forth in our Reputation Risk Management Policy and other risk management policies.
|
78
|
Capital One Financial Corporation (COF)
|
|
Strategic Risk Management
We monitor external market and industry developments to identify potential areas of strategic opportunity or risk. These items provide input for development of the Company’s strategy led by the Chief Executive Officer and other senior executives. Through the ongoing development and vetting of the corporate strategy, the Chief Risk Officer identifies and assesses risks associated with the strategy across all risk categories and monitors them throughout the year.
|
CREDIT RISK PROFILE
|
Our loan portfolio accounts for the substantial majority of our credit risk exposure. Our lending activities are governed under our credit policy and are subject to independent review and approval.
Below we provide information about the composition of our loan portfolio, key concentrations and credit performance metrics.
We also engage in certain non-lending activities that may give rise to credit and counterparty settlement risk, including the purchase of securities for our investment securities portfolio, entering into derivative transactions to manage our market risk exposure and to accommodate customers, short-term advances on syndication activity (including bridge financing transactions we have underwritten), certain operational cash balances in other financial institutions, foreign exchange transactions and customer overdrafts.
We provide additional information on credit risk related to our investment securities portfolio under “MD&A—Consolidated Balance Sheets Analysis—Investment Securities” and credit risk related to derivative transactions in “
Note 10—Derivative Instruments and Hedging Activities
.”
Primary Loan Products
We provide a variety of lending products. Our primary loan products include credit cards, auto, home loans and commercial.
|
•
|
Credit cards:
We originate both prime and subprime credit cards through a variety of channels. Our credit cards generally have variable interest rates. Credit card accounts are primarily underwritten using an automated underwriting system based on predictive models that we have developed. The underwriting criteria, which are customized for individual products and marketing programs, are established based on an analysis of the net present value of expected revenues, expenses and losses, subject to further analysis using a variety of stress conditions. Underwriting decisions are generally based on credit bureau information, including payment history, debt burden and credit scores, such as FICO, and on other factors, such as applicant income. We maintain a credit card securitization program and selectively sell charged-off credit card loans.
|
|
•
|
Auto:
We originate both prime and subprime auto loans. Customers are acquired through a network of auto dealers and direct marketing. Our auto loans generally have fixed interest rates and loan terms of
75
months or less, but can go up to
84
months. Loan size limits are customized by program and are generally less than $75,000. Similar to credit card accounts, the underwriting criteria are customized for individual products and marketing programs and based on analysis of net present value of expected revenues, expenses and losses, subject to maintaining resilience under a variety of stress conditions. Underwriting decisions are generally based on an applicant’s income, estimated debt-to-income ratio, and credit bureau information, along with collateral characteristics such as loan-to-value (“LTV”) ratio. We generally retain all of our auto loans, though we have securitized and sold auto loans in the past and may do so in the future.
|
|
•
|
Home loans:
Most of the existing home loans in our loan portfolio were originated by banks we acquired. We previously originated residential mortgage and home equity loans through our branches, direct marketing and dedicated home loan officers.
On November 7, 2017, we announced our decision to cease new originations of residential mortgage and home equity loan products within our Consumer Banking business. We continue to service our existing home loan portfolio.
Our primary home loan products included conforming and non-conforming fixed rate and adjustable rate mortgage loans, as well as first and second lien home equity loans and lines of credit. In general, our underwriting policy limits for such loans were:
|
|
◦
|
a maximum LTV ratio of 90% for loans without mortgage insurance;
|
|
◦
|
a maximum LTV ratio of 97% for loans with mortgage insurance or for home equity products;
|
|
◦
|
a maximum debt-to-income ratio of 50%; and
|
|
◦
|
a maximum loan amount of $3 million.
|
|
79
|
Capital One Financial Corporation (COF)
|
|
Our underwriting procedures were intended to verify the income of applicants and obtain appraisals to determine home values. We might, in limited instances, have used automated valuation models to determine home values. Our underwriting standards for conforming loans were designed to meet the underwriting standards required by the government-sponsored enterprises at a minimum, and we sold most of our conforming loans to these enterprises. We generally retained non-conforming mortgages, home equity loans and lines of credit.
|
•
|
Commercial:
We offer a range of commercial lending products, including loans secured by commercial real estate and loans to middle market commercial and industrial companies. Our commercial loans may have a fixed or variable interest rate; however, the majority of our commercial loans have variable rates. Our underwriting standards require an analysis of the borrower’s financial condition and prospects, as well as an assessment of the industry in which the borrower operates. Where relevant, we evaluate and appraise underlying collateral and guarantees. We maintain underwriting guidelines and limits for major types of borrowers and loan products that specify, where applicable, guidelines for debt service coverage, leverage, LTV ratio and standard covenants and conditions. We assign a risk rating and establish a monitoring schedule for loans based on the risk profile of the borrower, industry segment, source of repayment, the underlying collateral and guarantees (if any) and current market conditions. Although we generally retain commercial loans, we may syndicate positions for risk mitigation purposes (including bridge financing transactions we have underwritten). In addition, we originate and service multifamily commercial real estate loans which are sold to the government-sponsored enterprises.
|
Loans Held for Investment Portfolio Composition
Our loan portfolio consists of loans held for investment, including loans held in our consolidated trusts, and loans held for sale. Table
16
presents the composition of our portfolio of loans held for investment, including PCI loans, by portfolio segment as of
December 31, 2017
and
2016
. Table
16
and the credit metrics presented in this section exclude loans held for sale, which are carried at lower of cost or fair value and totaled
$971 million
and
$1.0 billion
as of
December 31, 2017
and
2016
, respectively.
Table
16
:
Loans Held for Investment Portfolio Composition
|
December 31, 2017
|
December 31, 2016
|
|||||||||||||
|
(Dollars in millions)
|
Loans
|
% of Total
|
Loans
|
% of Total
|
||||||||||
|
Credit Card:
|
||||||||||||||
|
Domestic credit card
|
$
|
105,293
|
|
41.4
|
%
|
$
|
97,120
|
|
39.6
|
%
|
||||
|
International card businesses
|
9,469
|
|
3.7
|
|
8,432
|
|
3.4
|
|
||||||
|
Total credit card
|
114,762
|
|
45.1
|
|
105,552
|
|
43.0
|
|
||||||
|
Consumer Banking:
|
||||||||||||||
|
Auto
|
53,991
|
|
21.2
|
|
47,916
|
|
19.5
|
|
||||||
|
Home loan
|
17,633
|
|
6.9
|
|
21,584
|
|
8.8
|
|
||||||
|
Retail banking
|
3,454
|
|
1.4
|
|
3,554
|
|
1.4
|
|
||||||
|
Total consumer banking
|
75,078
|
|
29.5
|
|
73,054
|
|
29.7
|
|
||||||
|
Commercial Banking:
|
||||||||||||||
|
Commercial and multifamily real estate
|
26,150
|
|
10.3
|
|
26,609
|
|
10.9
|
|
||||||
|
Commercial and industrial
|
38,025
|
|
14.9
|
|
39,824
|
|
16.2
|
|
||||||
|
Total commercial lending
|
64,175
|
|
25.2
|
|
66,433
|
|
27.1
|
|
||||||
|
Small-ticket commercial real estate
|
400
|
|
0.2
|
|
483
|
|
0.2
|
|
||||||
|
Total commercial banking
|
64,575
|
|
25.4
|
|
66,916
|
|
27.3
|
|
||||||
|
Other loans
|
58
|
|
—
|
|
64
|
|
—
|
|
||||||
|
Total loans held for investment
|
$
|
254,473
|
|
100.0
|
%
|
$
|
245,586
|
|
100.0
|
%
|
||||
We market our credit card products throughout the United States, Canada and the United Kingdom. Our credit card loan portfolio is geographically diversified due to our product and marketing approach, with higher concentrations in California, Texas, New York, Florida, Illinois, Pennsylvania and Ohio.
|
80
|
Capital One Financial Corporation (COF)
|
|
Our auto loan portfolio is originated in most regions of the United States with a concentration in Texas, California, Florida, Georgia, Ohio, Louisiana and Illinois. Our home loan portfolio is concentrated in California, New York, Maryland, Virginia, Illinois, New Jersey and Texas. Retail banking includes small business loans and other consumer lending products originated through our branch network with a concentration in New York, Louisiana, Texas, New Jersey, Maryland and Virginia.
Our commercial banking loan portfolio is originated in most regions of the United States with a concentration in the tri-state area of New York, New Jersey and Connecticut, as well as in Texas, California and Louisiana. Our small ticket commercial real estate portfolio, which was originated on a national basis through a broker network, is in a run-off mode.
We provide additional information on the geographic concentration, by loan category, of our loan portfolio in “
Note 4—Loans
.”
Commercial Loans
Table
17
summarizes our commercial loans held for investment portfolio by industry classification as of
December 31, 2017
and
2016
. Industry classifications below are based on our interpretation of the North American Industry Classification System codes as they pertain to each individual loan.
Table
17
:
Commercial Loans by Industry
|
(Percentage of portfolio)
|
December 31,
2017 |
December 31,
2016 |
||||
|
Real estate
|
41
|
%
|
40
|
%
|
||
|
Healthcare
|
14
|
|
14
|
|
||
|
Finance and insurance
|
13
|
|
13
|
|
||
|
Business services
|
5
|
|
5
|
|
||
|
Educational services
|
4
|
|
4
|
|
||
|
Public administration
|
4
|
|
4
|
|
||
|
Oil and gas
|
4
|
|
4
|
|
||
|
Retail trade
|
3
|
|
4
|
|
||
|
Construction and land
|
3
|
|
3
|
|
||
|
Other
|
9
|
|
9
|
|
||
|
Total
|
100
|
%
|
100
|
%
|
||
Purchased Credit-Impaired Loans
Our portfolio of loans includes certain of our consumer and commercial loans obtained in business acquisitions that were recorded at fair value at acquisition and subsequently accounted for using the guidance for accounting for PCI loans and debt securities, which is based upon expected cash flows. These PCI loans totaled
$10.8 billion
as of
December 31, 2017
compared to
$15.1 billion
as of
December 31, 2016
.
The difference between the fair value at acquisition and expected cash flows represents the accretable yield, which is recognized in interest income over the life of the loans. The difference between the contractual payments on the loans and expected cash flows represents the nonaccretable difference, or the amount of principal and interest not considered collectible, which incorporates future expected credit losses over the life of the loans. We regularly update our estimate of expected principal and interest to be collected from these loans and evaluate the results for each accounting pool that was established at acquisition based on loans with common risk characteristics. Probable decreases in expected cash flows would trigger the recognition of an allowance for loan and lease losses through our provision for credit losses. Probable and significant increases in expected cash flows would first reverse any previously recorded allowance for loan and lease losses established subsequent to acquisition, with any remaining increase in expected cash flows recognized prospectively in interest income over the remaining estimated life of the underlying loans. See “
Note 1—Summary of Significant Accounting Policies
” for additional information on PCI loans that are accounted for based on expected cash flows.
|
81
|
Capital One Financial Corporation (COF)
|
|
Home Loans
The majority of our home loan portfolio are PCI loans from previous acquisitions, representing
58%
and
67%
of our total home loan portfolio as of
December 31, 2017
and
2016
, respectively. The expected cash flows for the PCI loans in our home loan portfolio are significantly impacted by future expectations of home prices and interest rates. Decreases in expected cash flows that result from declining conditions, particularly associated with these variables, could result in an increase in the allowance for loan and lease losses and reduction in accretable yield. Charge-offs on these loans are not recorded until the expected credit losses within the nonaccretable difference are depleted. In addition, PCI loans are not classified as delinquent or nonperforming, as we expect to collect our net investment in these loans and the nonaccretable difference is expected to absorb the majority of the losses associated with these loans.
Table
18
presents the break out of our total home loan portfolio by lien priority for PCI loans and remaining loans.
Table
18
:
Home Loans—Risk Profile by Lien Priority
|
|
December 31, 2017
|
||||||||||||||||||||
|
|
Loans
|
PCI Loans
|
Total Home Loans
|
||||||||||||||||||
|
(Dollars in millions)
|
Amount
|
% of
Total |
Amount
|
% of
Total |
Amount
|
% of
Total |
|||||||||||||||
|
Lien type:
|
|||||||||||||||||||||
|
1
st
lien
|
$
|
6,364
|
|
36.1
|
%
|
$
|
10,054
|
|
57.0
|
%
|
$
|
16,418
|
|
93.1
|
%
|
||||||
|
2
nd
lien
|
994
|
|
5.6
|
|
221
|
|
1.3
|
|
1,215
|
|
6.9
|
|
|||||||||
|
Total
|
$
|
7,358
|
|
41.7
|
%
|
$
|
10,275
|
|
58.3
|
%
|
$
|
17,633
|
|
100.0
|
%
|
||||||
|
|
December 31, 2016
|
||||||||||||||||||||
|
|
Loans
|
PCI Loans
|
Total Home Loans
|
||||||||||||||||||
|
(Dollars in millions)
|
Amount
|
% of
Total |
Amount
|
% of
Total |
Amount
|
% of
Total |
|||||||||||||||
|
Lien type:
|
|||||||||||||||||||||
|
1
st
lien
|
$
|
6,182
|
|
28.7
|
%
|
$
|
14,159
|
|
65.5
|
%
|
$
|
20,341
|
|
94.2
|
%
|
||||||
|
2
nd
lien
|
974
|
|
4.5
|
|
269
|
|
1.3
|
|
1,243
|
|
5.8
|
|
|||||||||
|
Total
|
$
|
7,156
|
|
33.2
|
%
|
$
|
14,428
|
|
66.8
|
%
|
$
|
21,584
|
|
100.0
|
%
|
||||||
See “
Note 4—Loans
” in this Report for additional credit quality information. See “
Note 1—Summary of Significant Accounting Policies
” for information on our accounting policies for PCI loans, delinquent loans, nonperforming loans, net charge-offs and troubled debt restructurings (“TDRs”) for each of our loan categories.
|
82
|
Capital One Financial Corporation (COF)
|
|
Loan Maturity Profile
Table
19
presents the maturities of our loans held for investment portfolio as of
December 31, 2017
.
Table
19
: Loan Maturity Schedule
__________
|
|
December 31, 2017
|
|||||||||||||||
|
(Dollars in millions)
|
Due Up to
1 Year
|
> 1 Year
to 5 Years
|
> 5 Years
|
Total
|
||||||||||||
|
Fixed rate:
|
||||||||||||||||
|
Credit card
(1)
|
$
|
987
|
|
$
|
15,593
|
|
—
|
|
$
|
16,580
|
|
|||||
|
Consumer banking
|
683
|
|
34,554
|
|
$
|
26,129
|
|
61,366
|
|
|||||||
|
Commercial banking
|
1,173
|
|
5,804
|
|
7,702
|
|
14,679
|
|
||||||||
|
Other
|
—
|
|
1
|
|
12
|
|
13
|
|
||||||||
|
Total fixed-rate loans
|
2,843
|
|
55,952
|
|
33,843
|
|
92,638
|
|
||||||||
|
Variable rate:
|
||||||||||||||||
|
Credit card
(1)
|
98,181
|
|
1
|
|
—
|
|
98,182
|
|
||||||||
|
Consumer banking
(2)
|
9,193
|
|
3,755
|
|
764
|
|
13,712
|
|
||||||||
|
Commercial banking
|
49,430
|
|
414
|
|
52
|
|
49,896
|
|
||||||||
|
Other
|
37
|
|
—
|
|
8
|
|
45
|
|
||||||||
|
Total variable-rate loans
|
156,841
|
|
4,170
|
|
824
|
|
161,835
|
|
||||||||
|
Total loans
|
$
|
159,684
|
|
$
|
60,122
|
|
$
|
34,667
|
|
$
|
254,473
|
|
||||
|
(1)
|
Due to the revolving nature of credit card loans, we report the majority of our variable-rate credit card loans as due in one year or less. We report fixed-rate credit card loans with introductory rates that expire after a certain period of time as due in one year or less. We assume that the rest of our remaining fixed-rate credit card loans will mature within one to three years.
|
|
(2)
|
We report the maturity period for the home loan portfolio included in the Consumer Banking business based on the earlier of the next re-pricing or contractual maturity date of the loan.
|
Credit Risk Measurement
We closely monitor economic conditions and loan performance trends to assess and manage our exposure to credit risk. Key metrics we track in evaluating the credit quality of our loan portfolio include delinquency and nonperforming asset rates, as well as net charge-off rates and our internal risk ratings of larger-balance commercial loans. Trends in delinquency rates are one of the primary indicators of credit risk within our consumer loan portfolios, particularly in our credit card loan portfolios, as changes in delinquency rates can provide an early warning of changes in credit losses. The primary indicator of credit risk in our commercial loan portfolios is our internal risk ratings. Because we generally classify loans that have been delinquent for an extended period of time and other loans with significant risk of loss as nonperforming, the level of nonperforming assets represents another indicator of the potential for future credit losses. In addition to delinquency rates, the geographic distribution of our loans provides insight as to the exposure of the portfolio to regional economic conditions.
We underwrite most consumer loans using proprietary models, which are typically based on credit bureau data, including borrower credit scores, along with application information and, where applicable, collateral and deal structure data. We continuously adjust our management of credit lines and collection strategies based on customer behavior and risk profile changes. We also use borrower credit scores for subprime classification, for competitive benchmarking and, in some cases, to drive product segmentation decisions.
|
83
|
Capital One Financial Corporation (COF)
|
|
The following table provides details on the credit scores of our domestic credit card and auto loans held for investment portfolios as of
December 31, 2017
and
2016
.
Table
20
:
Credit Score Distribution
__________
|
(Percentage of portfolio)
|
December 31,
2017 |
December 31,
2016 |
||||
|
Domestic credit card—Refreshed FICO scores:
(1)
|
||||||
|
Greater than 660
|
66
|
%
|
64
|
%
|
||
|
660 or below
|
34
|
|
36
|
|
||
|
Total
|
100
|
%
|
100
|
%
|
||
|
Auto
—
At origination FICO scores:
(2)
|
||||||
|
Greater than 660
|
51
|
%
|
52
|
%
|
||
|
621 - 660
|
18
|
|
17
|
|
||
|
620 or below
|
31
|
|
31
|
|
||
|
Total
|
100
|
%
|
100
|
%
|
||
|
(1)
|
Percentages represent period-end loans held for investment in each credit score category. Domestic card credit scores generally represent FICO scores. These scores are obtained from one of the major credit bureaus at origination and are refreshed monthly thereafter. We approximate non-FICO credit scores to comparable FICO scores for consistency purposes. Balances for which no credit score is available or the credit score is invalid are included in the 660 or below category.
|
|
(2)
|
Percentages represent period-end loans held for investment in each credit score category. Auto credit scores generally represent average FICO scores obtained from three credit bureaus at the time of application and are not refreshed thereafter. Balances for which no credit score is available or the credit score is invalid are included in the 620 or below category.
|
We present information in the section below on the credit performance of our loan portfolio, including the key metrics we use in tracking changes in the credit quality of our loan portfolio.
See “
Note 4—Loans
” in this Report for additional credit quality information, and see “
Note 1—Summary of Significant Accounting Policies
” for information on our accounting policies for delinquent and nonperforming loans, net charge-offs and TDRs for each of our loan categories.
Delinquency Rates
We consider the entire balance of an account to be delinquent if the minimum required payment is not received by the customer’s due date, measured at each balance sheet date. Our 30+ day delinquency metrics include all loans held for investment that are 30 or more days past due, whereas our 30+ day performing delinquency metrics include loans that are 30 or more days past due but are currently classified as performing and accruing interest. The 30+ day delinquency and 30+ day performing delinquency metrics are the same for domestic credit card loans, as we continue to classify loans as performing until the account is charged off, typically when the account is 180 days past due. See “
Note 1—Summary of Significant Accounting Policies
” for information on our policies for classifying loans as nonperforming for each of our loan categories. We provide additional information on our credit quality metrics above under “MD&A—Business Segment Financial Performance.”
|
84
|
Capital One Financial Corporation (COF)
|
|
Table
21
presents our 30+ day performing delinquency rates and 30+ day delinquency rates of our portfolio of loans held for investment, including PCI loans, by portfolio segment, as of
December 31, 2017
and
2016
.
Table
21
:
30+ Day Delinquencies
__________
|
|
December 31, 2017
|
December 31, 2016
|
||||||||||||||||||||||||||
|
|
30+ Day Performing Delinquencies
|
30+ Day Delinquencies
|
30+ Day Performing Delinquencies
|
30+ Day Delinquencies
|
||||||||||||||||||||||||
|
(Dollars in millions)
|
Amount
|
Rate
(1)
|
Amount
|
Rate
(1)
|
Amount
|
Rate
(1)
|
Amount
|
Rate
(1)
|
||||||||||||||||||||
|
Credit Card:
|
||||||||||||||||||||||||||||
|
Domestic credit card
(2)
|
$
|
4,219
|
|
4.01
|
%
|
$
|
4,219
|
|
4.01
|
%
|
$
|
3,839
|
|
3.95
|
%
|
$
|
3,839
|
|
3.95
|
%
|
||||||||
|
International card businesses
|
344
|
|
3.64
|
|
359
|
|
3.80
|
|
283
|
|
3.36
|
|
317
|
|
3.76
|
|
||||||||||||
|
Total credit card
(2)
|
4,563
|
|
3.98
|
|
4,578
|
|
3.99
|
|
4,122
|
|
3.91
|
|
4,156
|
|
3.94
|
|
||||||||||||
|
Consumer Banking:
|
||||||||||||||||||||||||||||
|
Auto
|
3,513
|
|
6.51
|
|
3,840
|
|
7.11
|
|
2,931
|
|
6.12
|
|
3,154
|
|
6.58
|
|
||||||||||||
|
Home loan
(3)
|
35
|
|
0.20
|
|
123
|
|
0.70
|
|
43
|
|
0.20
|
|
205
|
|
0.95
|
|
||||||||||||
|
Retail banking
|
26
|
|
0.76
|
|
47
|
|
1.35
|
|
25
|
|
0.70
|
|
49
|
|
1.39
|
|
||||||||||||
|
Total consumer banking
(3)
|
3,574
|
|
4.76
|
|
4,010
|
|
5.34
|
|
2,999
|
|
4.10
|
|
3,408
|
|
4.67
|
|
||||||||||||
|
Commercial Banking:
|
||||||||||||||||||||||||||||
|
Commercial and multifamily real estate
|
69
|
|
0.26
|
|
107
|
|
0.41
|
|
20
|
|
0.07
|
|
45
|
|
0.17
|
|
||||||||||||
|
Commercial and industrial
|
18
|
|
0.05
|
|
158
|
|
0.42
|
|
36
|
|
0.09
|
|
408
|
|
1.02
|
|
||||||||||||
|
Total commercial lending
|
87
|
|
0.14
|
|
265
|
|
0.41
|
|
56
|
|
0.08
|
|
453
|
|
0.68
|
|
||||||||||||
|
Small-ticket commercial real estate
|
1
|
|
0.21
|
|
7
|
|
1.55
|
|
6
|
|
1.31
|
|
10
|
|
2.14
|
|
||||||||||||
|
Total commercial banking
|
88
|
|
0.14
|
|
272
|
|
0.42
|
|
62
|
|
0.09
|
|
463
|
|
0.69
|
|
||||||||||||
|
Other loans
|
2
|
|
3.28
|
|
4
|
|
6.29
|
|
2
|
|
3.66
|
|
8
|
|
12.90
|
|
||||||||||||
|
Total
(2)
|
$
|
8,227
|
|
3.23
|
|
$
|
8,864
|
|
3.48
|
|
$
|
7,185
|
|
2.93
|
|
$
|
8,035
|
|
3.27
|
|
||||||||
|
(1)
|
Delinquency rates are calculated by dividing delinquency amounts by period-end loans held for investment for each specified loan category, including PCI loans as applicable.
|
|
(2)
|
Excluding the impact of the Cabela’s acquisition, the domestic credit card and total credit card 30+ day performing delinquency rates as of December 31, 2017 would have been
4.18%
and
4.14%
, respectively, and the total 30+ day performing delinquency rate would have been
3.28%
.
|
|
(3)
|
Excluding the impact of PCI loans, the 30+ day performing delinquency rate for our home loan and total consumer banking portfolios was
0.48%
and
5.52%
, respectively, as of
December 31, 2017
, and
0.59%
and
5.12%
, respectively, as of
December 31, 2016
. Excluding the impact of PCI loans, the 30+ day delinquency rate for our home loan and total consumer banking portfolios was
1.67%
and
6.19%
, respectively, as of
December 31, 2017
, and
2.86%
and
5.82%
, respectively, as of
December 31, 2016
.
|
|
85
|
Capital One Financial Corporation (COF)
|
|
Table
22
presents an aging and geography of 30+ day delinquent loans as of
December 31, 2017
and
2016
.
Table
22
:
Aging and Geography of 30+ Day Delinquent Loans
__________
|
|
December 31, 2017
|
December 31, 2016
|
||||||||||||
|
(Dollars in millions)
|
Amount
|
Rate
(1)
|
Amount
|
Rate
(1)
|
||||||||||
|
Delinquency status:
|
||||||||||||||
|
30 – 59 days
|
$
|
3,945
|
|
1.55
|
%
|
$
|
3,466
|
|
1.41
|
%
|
||||
|
60 – 89 days
|
2,166
|
|
0.85
|
|
1,920
|
|
0.78
|
|
||||||
|
>
90 days
|
2,753
|
|
1.08
|
|
2,649
|
|
1.08
|
|
||||||
|
Total
|
$
|
8,864
|
|
3.48
|
%
|
$
|
8,035
|
|
3.27
|
%
|
||||
|
Geographic region:
|
||||||||||||||
|
Domestic
|
$
|
8,505
|
|
3.34
|
%
|
$
|
7,718
|
|
3.14
|
%
|
||||
|
International
|
359
|
|
0.14
|
|
317
|
|
0.13
|
|
||||||
|
Total
|
$
|
8,864
|
|
3.48
|
%
|
$
|
8,035
|
|
3.27
|
%
|
||||
|
Total loans held for investment
|
$
|
254,473
|
|
|
|
$
|
245,586
|
|
||||||
|
(1)
|
Delinquency rates are calculated by dividing delinquency amounts by total period-end loans held for investment, including PCI loans as applicable.
|
Table
23
summarizes loans that were 90+ days delinquent as to interest or principal, and still accruing interest as of
December 31, 2017
and
2016
. These loans consist primarily of credit card accounts between 90 days and 179 days past due. As permitted by regulatory guidance issued by the Federal Financial Institutions Examination Council (“FFIEC”), we continue to accrue interest and fees on domestic credit card loans through the date of charge-off, which is typically in the period the account becomes 180 days past due. While domestic credit card loans typically remain on accrual status until the loan is charged off, we reduce the balance of our credit card receivables by the amount of finance charges and fees billed but not expected to be collected and exclude this amount from revenue.
Table
23
:
90+ Day Delinquent Loans Accruing Interest
__________
|
|
December 31, 2017
|
December 31, 2016
|
||||||||||||
|
(Dollars in millions)
|
Amount
|
Rate
(1)
|
Amount
|
Rate
(1)
|
||||||||||
|
Loan category:
|
||||||||||||||
|
Credit card
|
$
|
2,221
|
|
1.94
|
%
|
$
|
1,936
|
|
1.83
|
%
|
||||
|
Commercial banking
|
12
|
|
0.02
|
|
—
|
|
—
|
|
||||||
|
Total
|
$
|
2,233
|
|
0.88
|
|
$
|
1,936
|
|
0.79
|
|
||||
|
Geographic region:
|
||||||||||||||
|
Domestic
|
$
|
2,105
|
|
0.86
|
|
$
|
1,840
|
|
0.78
|
|
||||
|
International
|
128
|
|
1.35
|
|
96
|
|
1.14
|
|
||||||
|
Total
|
$
|
2,233
|
|
0.88
|
|
$
|
1,936
|
|
0.79
|
|
||||
|
(1)
|
Delinquency rates are calculated by dividing delinquency amounts by period-end loans held for investment for each specified loan category, including PCI loans as applicable.
|
Nonperforming Loans and Nonperforming Assets
Nonperforming assets consist of nonperforming loans, foreclosed properties and repossessed assets, and the net realizable value of certain partially charged off auto loans. Nonperforming loans include loans that have been placed on nonaccrual status. See “
Note 1—Summary of Significant Accounting Policies
” for information on our policies for classifying loans as nonperforming for each of our loan categories.
|
86
|
Capital One Financial Corporation (COF)
|
|
Table
24
presents comparative information on nonperforming loans, by portfolio segment, and other nonperforming assets as of
December 31, 2017
and
2016
. We do not classify loans held for sale as nonperforming, as they are recorded at the lower of cost or fair value. We provide additional information on our credit quality metrics above under “MD&A—Business Segment Financial Performance.”
Table
24
:
Nonperforming Loans and Other Nonperforming Assets
(1)
__________
|
|
December 31, 2017
|
December 31, 2016
|
||||||||||||
|
(Dollars in millions)
|
Amount
|
Rate
|
Amount
|
Rate
|
||||||||||
|
Nonperforming loans held for investment:
(2)
|
||||||||||||||
|
Credit Card:
|
||||||||||||||
|
International card businesses
|
$
|
24
|
|
0.25
|
%
|
$
|
42
|
|
0.50
|
%
|
||||
|
Total credit card
|
24
|
|
0.02
|
|
42
|
|
0.04
|
|
||||||
|
Consumer Banking:
|
||||||||||||||
|
Auto
(3)
|
376
|
|
0.70
|
|
223
|
|
0.47
|
|
||||||
|
Home loan
(4)
|
176
|
|
1.00
|
|
273
|
|
1.26
|
|
||||||
|
Retail banking
|
35
|
|
1.00
|
|
31
|
|
0.86
|
|
||||||
|
Total consumer banking
(4)
|
587
|
|
0.78
|
|
527
|
|
0.72
|
|
||||||
|
Commercial Banking:
|
||||||||||||||
|
Commercial and multifamily real estate
|
38
|
|
0.15
|
|
30
|
|
0.11
|
|
||||||
|
Commercial and industrial
|
239
|
|
0.63
|
|
988
|
|
2.48
|
|
||||||
|
Total commercial lending
|
277
|
|
0.43
|
|
1,018
|
|
1.53
|
|
||||||
|
Small-ticket commercial real estate
|
7
|
|
1.65
|
|
4
|
|
0.85
|
|
||||||
|
Total commercial banking
|
284
|
|
0.44
|
|
1,022
|
|
1.53
|
|
||||||
|
Other loans
|
4
|
|
7.71
|
|
8
|
|
13.10
|
|
||||||
|
Total nonperforming loans held for investment
(5)
|
$
|
899
|
|
0.35
|
|
$
|
1,599
|
|
0.65
|
|
||||
|
Other nonperforming assets:
(6)
|
||||||||||||||
|
Foreclosed property
|
$
|
88
|
|
0.03
|
|
$
|
75
|
|
0.03
|
|
||||
|
Other assets
(3)
|
65
|
|
0.03
|
|
205
|
|
0.08
|
|
||||||
|
Total other nonperforming assets
|
153
|
|
0.06
|
|
280
|
|
0.11
|
|
||||||
|
Total nonperforming assets
|
$
|
1,052
|
|
0.41
|
|
$
|
1,879
|
|
0.76
|
|
||||
|
(1)
|
We recognized interest income for loans classified as nonperforming of
$52 million
and
$45 million
in
2017
and
2016
, respectively. Interest income foregone related to nonperforming loans was
$44 million
and
$59 million
in
2017
and
2016
, respectively. Foregone interest income represents the amount of interest income that would have been recorded during the period for nonperforming loans as of the end of the period had the loans performed according to their contractual terms.
|
|
(2)
|
Nonperforming loan rates are calculated based on nonperforming loans for each category divided by period-end total loans held for investment for each respective category.
|
|
(3)
|
Beginning in the first quarter of 2017, partially charged-off auto loans previously presented within other assets were prospectively included within loans held for investment. Other assets includes repossessed assets obtained in satisfaction of auto loans and the net realizable value of certain partially charged-off auto loans, which will continue to decline over time.
|
|
(4)
|
Excluding the impact of PCI loans, the nonperforming loan rates for our home loan and total consumer banking portfolios were
2.39%
and
0.91%
, respectively, as of
December 31, 2017
, compared to
3.81%
and
0.90%
, respectively, as of
December 31, 2016
.
|
|
(5)
|
Excluding the impact of domestic credit card loans, nonperforming loans as a percentage of total loans held for investment was
0.60%
and
1.08%
as of
December 31, 2017
and
2016
, respectively.
|
|
(6)
|
The denominators used in calculating nonperforming asset rates consist of total loans held for investment and total other nonperforming assets.
|
|
87
|
Capital One Financial Corporation (COF)
|
|
Net Charge-Offs
Net charge-offs consist of the unpaid principal balance of loans held for investment that we determine to be uncollectible, net of recovered amounts.
We charge off loans as a reduction to the allowance for loan and lease losses when we determine the loan is uncollectible and record subsequent recoveries of previously charged-off amounts as increases to the allowance for loan and lease losses. Uncollectible finance charges and fees are reversed through revenue and certain fraud losses are recorded in other non-interest expense. Generally, costs to recover charged-off loans are recorded as collection expenses and included in our consolidated statements of income as a component of other non-interest expense as incurred. Our charge-off policy for loans varies based on the loan type. See “
Note 1—Summary of Significant Accounting Policies
” for information on our charge-off policy for each of our loan categories.
Table
25
presents our net charge-off amounts and rates, by portfolio segment, in
2017
,
2016
and
2015
.
Table
25
:
Net Charge-Offs (Recoveries)
__________
|
|
Year Ended December 31,
|
||||||||||||||||||||
|
|
2017
|
2016
|
2015
|
||||||||||||||||||
|
(Dollars in millions)
|
Amount
|
Rate
(1)
|
Amount
|
Rate
(1)
|
Amount
|
Rate
(1)
|
|||||||||||||||
|
Credit Card:
|
|||||||||||||||||||||
|
Domestic credit card
(2)
|
$
|
4,739
|
|
4.99
|
%
|
$
|
3,681
|
|
4.16
|
%
|
$
|
2,718
|
|
3.45
|
%
|
||||||
|
International card businesses
|
315
|
|
3.69
|
|
272
|
|
3.33
|
|
200
|
|
2.50
|
|
|||||||||
|
Total credit card
(2)
|
5,054
|
|
4.88
|
|
3,953
|
|
4.09
|
|
2,918
|
|
3.36
|
|
|||||||||
|
Consumer Banking:
|
|||||||||||||||||||||
|
Auto
|
957
|
|
1.86
|
|
752
|
|
1.69
|
|
674
|
|
1.69
|
|
|||||||||
|
Home loan
(3)
|
15
|
|
0.08
|
|
14
|
|
0.06
|
|
9
|
|
0.03
|
|
|||||||||
|
Retail banking
|
66
|
|
1.92
|
|
54
|
|
1.53
|
|
48
|
|
1.33
|
|
|||||||||
|
Total consumer banking
(3)
|
1,038
|
|
1.39
|
|
820
|
|
1.15
|
|
731
|
|
1.03
|
|
|||||||||
|
Commercial Banking:
|
|||||||||||||||||||||
|
Commercial and multifamily real estate
|
1
|
|
—
|
|
(3
|
)
|
(0.01
|
)
|
(15
|
)
|
(0.06
|
)
|
|||||||||
|
Commercial and industrial
|
463
|
|
1.17
|
|
293
|
|
0.75
|
|
60
|
|
0.21
|
|
|||||||||
|
Total commercial lending
|
464
|
|
0.69
|
|
290
|
|
0.45
|
|
45
|
|
0.09
|
|
|||||||||
|
Small-ticket commercial real estate
|
1
|
|
0.24
|
|
2
|
|
0.30
|
|
2
|
|
0.36
|
|
|||||||||
|
Total commercial banking
|
465
|
|
0.69
|
|
292
|
|
0.45
|
|
47
|
|
0.09
|
|
|||||||||
|
Other loans
|
5
|
|
9.70
|
|
(3
|
)
|
(3.89
|
)
|
(1
|
)
|
(1.66
|
)
|
|||||||||
|
Total net charge-offs
|
$
|
6,562
|
|
2.67
|
|
$
|
5,062
|
|
2.17
|
|
$
|
3,695
|
|
1.75
|
|
||||||
|
Average loans held for investment
|
$
|
245,565
|
|
$
|
233,272
|
|
$
|
210,745
|
|
||||||||||||
|
(1)
|
Net charge-off (recovery)
rate is calculated by dividing net charge-offs by average loans held for investment for the period for each loan category
.
|
|
(2)
|
Excluding the impact of the Cabela’s acquisition, the domestic credit card and total credit card net charge-off rates for the year ended December 31, 2017 would have been
5.07%
and
4.95%
, respectively.
|
|
(3)
|
Excluding the impact of PCI loans, the net charge-off rates for our home loan and total consumer banking portfolios were
0.07%
and
1.65%
, respectively, for
the year ended December 31, 2017
compared to
0.20%
and
1.49%
, respectively, for
the year ended December 31, 2016
, and
0.13%
and
1.45%
, respectively, for
the year ended December 31, 2015
.
|
|
88
|
Capital One Financial Corporation (COF)
|
|
Troubled Debt Restructurings
As part of our loss mitigation efforts, we may provide short-term (three to twelve months) or long-term (greater than twelve months) modifications to a borrower experiencing financial difficulty to improve long-term collectability of the loan and to avoid the need for foreclosure or repossession of collateral.
Table
26
presents our recorded investment of loans modified in TDRs as of
December 31, 2017
and
2016
, which excludes loan modifications that do not meet the definition of a TDR, and PCI loans, which we track and report separately.
Table
26
:
Troubled Debt Restructurings
|
|
December 31, 2017
|
December 31, 2016
|
||||||||||||
|
(Dollars in millions)
|
Amount
|
% of Total Modifications
|
Amount
|
% of Total Modifications
|
||||||||||
|
Credit card
|
$
|
812
|
|
36.9
|
%
|
$
|
715
|
|
29.0
|
%
|
||||
|
Consumer banking:
|
||||||||||||||
|
Auto
|
481
|
|
21.9
|
|
523
|
|
21.2
|
|
||||||
|
Home loan
|
192
|
|
8.7
|
|
241
|
|
9.8
|
|
||||||
|
Retail banking
|
37
|
|
1.7
|
|
43
|
|
1.7
|
|
||||||
|
Total consumer banking
|
710
|
|
32.3
|
|
807
|
|
32.7
|
|
||||||
|
Commercial banking
|
679
|
|
30.8
|
|
944
|
|
38.3
|
|
||||||
|
Total
|
$
|
2,201
|
|
100.0
|
%
|
$
|
2,466
|
|
100.0
|
%
|
||||
|
Status of TDRs:
|
||||||||||||||
|
Performing
|
$
|
1,850
|
|
84.1
|
%
|
$
|
1,631
|
|
66.1
|
%
|
||||
|
Nonperforming
|
351
|
|
15.9
|
|
835
|
|
33.9
|
|
||||||
|
Total
|
$
|
2,201
|
|
100.0
|
%
|
$
|
2,466
|
|
100.0
|
%
|
||||
In the Credit Card business, the majority of our credit card loans modified in TDRs involve reducing the interest rate on the account and placing the customer on a fixed payment plan not exceeding 60 months. The effective interest rate in effect immediately prior to the loan modification is used as the effective interest rate for purposes of measuring impairment using the present value of expected cash flows. If the customer does not comply with the modified payment terms, then the credit card loan agreement may revert to its original payment terms, likely resulting in any loan outstanding reflected in the appropriate delinquency category, and charged off in accordance with our standard charge-off policy.
In the Consumer Banking business, the majority of our loans modified in TDRs receive an extension, an interest rate reduction or principal reduction, or a combination of the three. In addition, TDRs also occur in connection with bankruptcy of the borrower. In certain bankruptcy discharges, the loan is written down to the collateral value and the charged off amount is reported as principal reduction. Their impairment is determined using the present value of expected cash flows or a collateral evaluation for certain auto and home loans where the collateral value is lower than the recorded investment.
In the Commercial Banking business, the majority of loans modified in TDRs receive an extension, with a portion of these loans receiving an interest rate reduction or a gross balance reduction. The impairment on modified commercial loans is generally determined based on the underlying collateral value.
We provide additional information on modified loans accounted for as TDRs, including the performance of those loans subsequent to modification, in “
Note 4—Loans
.”
Impaired Loans
A loan is considered to be impaired when, based on current information and events, it is probable that we will be unable to collect all amounts due from the borrower in accordance with the original contractual terms of the loan. Generally, we report loans as impaired based on the method for measuring impairment in accordance with applicable accounting guidance. Loans defined as individually impaired include larger-balance commercial nonperforming loans and TDRs. Loans held for sale are not reported as impaired, as these loans are recorded at lower of cost or fair value. Impaired loans also exclude PCI loans, which are accounted for based on expected cash flows because this accounting methodology takes into consideration future credit losses expected to be incurred.
|
89
|
Capital One Financial Corporation (COF)
|
|
Impaired loans totaled
$2.4 billion
and
$3.2 billion
as of
December 31, 2017
and
2016
, respectively. These amounts include TDRs of
$2.2 billion
and
$2.5 billion
as of
December 31, 2017
and
2016
, respectively. We provide additional information on our impaired loans, including the allowance for loan and lease losses established for these loans, in “
Note 4—Loans
” and “
Note 5—Allowance for Loan and Lease Losses and Reserve for Unfunded Lending Commitments
.”
Allowance for Loan and Lease Losses and Reserve for Unfunded Lending Commitments
Our allowance for loan and lease losses represents management’s best estimate of incurred loan and lease credit losses inherent to our held for investment portfolio as of each balance sheet date. The allowance for loan and lease losses is increased through the provision for credit losses and reduced by net charge-offs. We provide additional information on the methodologies and key assumptions used in determining our allowance for loan and lease losses under “
Note 1—Summary of Significant Accounting Policies
.”
Table
27
presents changes in our allowance for loan and lease losses and reserve for unfunded lending commitments for
2017
and
2016
, and details by portfolio segment for the provision for credit losses, charge-offs and recoveries.
|
90
|
Capital One Financial Corporation (COF)
|
|
Table
27
:
Allowance for Loan and Lease Losses and Reserve for Unfunded Lending Commitments Activity
__________
|
Credit Card
|
Consumer Banking
|
|||||||||||||||||||||||||||||||||||||||
|
(Dollars in millions)
|
Domestic Card
|
International Card Businesses
|
Total Credit Card
|
Auto
|
Home
Loan |
Retail
Banking |
Total
Consumer Banking |
Commercial Banking
|
Other
(1)
|
Total
|
||||||||||||||||||||||||||||||
|
Allowance for loan and lease losses:
|
||||||||||||||||||||||||||||||||||||||||
|
Balance as of December 31, 2015
|
$
|
3,355
|
|
$
|
299
|
|
$
|
3,654
|
|
$
|
726
|
|
$
|
70
|
|
$
|
72
|
|
$
|
868
|
|
$
|
604
|
|
$
|
4
|
|
$
|
5,130
|
|
||||||||||
|
Charge-offs
|
(4,586
|
)
|
(433
|
)
|
(5,019
|
)
|
(1,135
|
)
|
(22
|
)
|
(69
|
)
|
(1,226
|
)
|
(307
|
)
|
(3
|
)
|
(6,555
|
)
|
||||||||||||||||||||
|
Recoveries
|
905
|
|
161
|
|
1,066
|
|
383
|
|
8
|
|
15
|
|
406
|
|
15
|
|
6
|
|
1,493
|
|
||||||||||||||||||||
|
Net charge-offs
|
(3,681
|
)
|
(272
|
)
|
(3,953
|
)
|
(752
|
)
|
(14
|
)
|
(54
|
)
|
(820
|
)
|
(292
|
)
|
3
|
|
(5,062
|
)
|
||||||||||||||||||||
|
Provision for loan and lease losses
|
4,555
|
|
371
|
|
4,926
|
|
983
|
|
9
|
|
63
|
|
1,055
|
|
515
|
|
(5
|
)
|
6,491
|
|
||||||||||||||||||||
|
Allowance build (release) for loan and lease losses
|
874
|
|
99
|
|
973
|
|
231
|
|
(5
|
)
|
9
|
|
235
|
|
223
|
|
(2
|
)
|
1,429
|
|
||||||||||||||||||||
|
Other changes
(2)
|
—
|
|
(21
|
)
|
(21
|
)
|
—
|
|
—
|
|
(1
|
)
|
(1
|
)
|
(34
|
)
|
—
|
|
(56
|
)
|
||||||||||||||||||||
|
Balance as of December 31, 2016
|
4,229
|
|
377
|
|
4,606
|
|
957
|
|
65
|
|
80
|
|
1,102
|
|
793
|
|
2
|
|
6,503
|
|
||||||||||||||||||||
|
Reserve for unfunded lending commitments:
|
||||||||||||||||||||||||||||||||||||||||
|
Balance as of December 31, 2015
|
—
|
|
—
|
|
—
|
|
—
|
|
—
|
|
7
|
|
7
|
|
161
|
|
—
|
|
168
|
|
||||||||||||||||||||
|
Benefit for losses on unfunded lending commitments
|
—
|
|
—
|
|
—
|
|
—
|
|
—
|
|
—
|
|
—
|
|
(32
|
)
|
—
|
|
(32
|
)
|
||||||||||||||||||||
|
Balance as of December 31, 2016
|
—
|
|
—
|
|
—
|
|
—
|
|
—
|
|
7
|
|
7
|
|
129
|
|
—
|
|
136
|
|
||||||||||||||||||||
|
Combined allowance and reserve as of December 31, 2016
|
$
|
4,229
|
|
$
|
377
|
|
$
|
4,606
|
|
$
|
957
|
|
$
|
65
|
|
$
|
87
|
|
$
|
1,109
|
|
$
|
922
|
|
$
|
2
|
|
$
|
6,639
|
|
||||||||||
|
Allowance for loan and lease losses:
|
||||||||||||||||||||||||||||||||||||||||
|
Balance as of December 31, 2016
|
$
|
4,229
|
|
$
|
377
|
|
$
|
4,606
|
|
$
|
957
|
|
$
|
65
|
|
$
|
80
|
|
$
|
1,102
|
|
$
|
793
|
|
$
|
2
|
|
$
|
6,503
|
|
||||||||||
|
Charge-offs
|
(5,844
|
)
|
(477
|
)
|
(6,321
|
)
|
(1,573
|
)
|
(22
|
)
|
(82
|
)
|
(1,677
|
)
|
(481
|
)
|
(34
|
)
|
(8,513
|
)
|
||||||||||||||||||||
|
Recoveries
|
1,105
|
|
162
|
|
1,267
|
|
616
|
|
7
|
|
16
|
|
639
|
|
16
|
|
29
|
|
1,951
|
|
||||||||||||||||||||
|
Net charge-offs
|
(4,739
|
)
|
(315
|
)
|
(5,054
|
)
|
(957
|
)
|
(15
|
)
|
(66
|
)
|
(1,038
|
)
|
(465
|
)
|
(5
|
)
|
(6,562
|
)
|
||||||||||||||||||||
|
Provision for loan and lease losses
|
5,783
|
|
283
|
|
6,066
|
|
1,119
|
|
10
|
|
51
|
|
1,180
|
|
313
|
|
4
|
|
7,563
|
|
||||||||||||||||||||
|
Allowance build (release) for loan and lease losses
|
1,044
|
|
(32
|
)
|
1,012
|
|
162
|
|
(5
|
)
|
(15
|
)
|
142
|
|
(152
|
)
|
(1
|
)
|
1,001
|
|
||||||||||||||||||||
|
Other changes
(2)
|
—
|
|
30
|
|
30
|
|
—
|
|
(2
|
)
|
—
|
|
(2
|
)
|
(30
|
)
|
—
|
|
(2
|
)
|
||||||||||||||||||||
|
Balance as of December 31, 2017
|
5,273
|
|
375
|
|
5,648
|
|
1,119
|
|
58
|
|
65
|
|
1,242
|
|
611
|
|
1
|
|
7,502
|
|
||||||||||||||||||||
|
Reserve for unfunded lending commitments:
|
||||||||||||||||||||||||||||||||||||||||
|
Balance as of December 31, 2016
|
—
|
|
—
|
|
—
|
|
—
|
|
—
|
|
7
|
|
7
|
|
129
|
|
—
|
|
136
|
|
||||||||||||||||||||
|
Benefit for losses on unfunded lending commitments
|
—
|
|
—
|
|
—
|
|
—
|
|
—
|
|
—
|
|
—
|
|
(12
|
)
|
—
|
|
(12
|
)
|
||||||||||||||||||||
|
Balance as of December 31, 2017
|
—
|
|
—
|
|
—
|
|
—
|
|
—
|
|
7
|
|
7
|
|
117
|
|
—
|
|
124
|
|
||||||||||||||||||||
|
Combined allowance and reserve as of December 31, 2017
|
$
|
5,273
|
|
$
|
375
|
|
$
|
5,648
|
|
$
|
1,119
|
|
$
|
58
|
|
$
|
72
|
|
$
|
1,249
|
|
$
|
728
|
|
$
|
1
|
|
$
|
7,626
|
|
||||||||||
|
(1)
|
Primarily consists of the legacy loan portfolio of our discontinued GreenPoint mortgage operations.
|
|
(2)
|
Represents foreign currency translation adjustments and the net impact of loan transfers and sales.
|
|
91
|
Capital One Financial Corporation (COF)
|
|
Table
28
presents the allowance coverage ratios as of
December 31, 2017
and
2016
.
Table
28
:
Allowance Coverage Ratios
__________
|
December 31, 2017
|
December 31, 2016
|
|||||
|
Total allowance coverage ratio
|
2.95
|
%
|
2.65
|
%
|
||
|
Allowance coverage ratios by loan category:
(1)
|
||||||
|
Credit card (30+ day delinquent loans)
|
123.36
|
|
110.83
|
|
||
|
Consumer banking (30+ day delinquent loans)
|
30.95
|
|
32.32
|
|
||
|
Commercial banking (nonperforming loans)
|
215.14
|
|
77.58
|
|
||
|
(1)
|
Allowance coverage ratios by loan category are calculated based on the allowance for loan and lease losses for each specified portfolio segment divided by period-end loans held for investment within the specified loan category.
|
Our allowance for loan and lease losses
increased
by
$999 million
to
$7.5 billion
as of
December 31, 2017
from
December 31, 2016
, and the allowance coverage ratio
increased
by
30
basis points to
2.95%
as of
December 31, 2017
from
December 31, 2016
. The increases were primarily driven by:
|
•
|
an allowance build in our domestic credit card loan portfolio primarily due to increasing losses from recent vintages and portfolio seasoning
; and
|
|
•
|
an allowance build in our auto loan portfolio due to higher losses associated with growth
.
|
These increases were partially offset by
an allowance decrease in our commercial loan portfolio primarily driven by charge-offs in our taxi medallion lending portfolio, as well as reduced exposure and improved credit risk ratings in our oil and gas portfolio
.
|
LIQUIDITY RISK PROFILE
|
We have established liquidity practices that are intended to ensure that we have sufficient asset-based liquidity to cover our funding requirements and maintain adequate reserves to withstand the potential impact of deposit attrition or diminished liquidity in the funding markets. We maintain these reserves in the form of readily-marketable or pledgeable assets that can be used as a source of liquidity, if needed.
Table
29
below presents the composition of our liquidity reserves as of
December 31, 2017
and
2016
.
Table
29
:
Liquidity Reserves
|
(Dollars in millions)
|
December 31, 2017
|
December 31, 2016
|
||||||
|
Cash and cash equivalents
|
$
|
14,040
|
|
$
|
9,976
|
|
||
|
Investment securities portfolio:
|
||||||||
|
Investment securities available for sale, at fair value
|
37,655
|
|
40,737
|
|
||||
|
Investment securities held to maturity, at fair value
|
29,437
|
|
26,196
|
|
||||
|
Total investment securities portfolio
|
67,092
|
|
66,933
|
|
||||
|
FHLB borrowing capacity secured by loans
|
20,927
|
|
24,078
|
|
||||
|
Outstanding FHLB advances and letters of credit secured by loans
|
(9,115
|
)
|
(17,646
|
)
|
||||
|
Investment securities encumbered for Public Funds and others
|
(8,619
|
)
|
(9,265
|
)
|
||||
|
Total liquidity reserves
|
$
|
84,325
|
|
$
|
74,076
|
|
||
Our liquidity reserves
increased
by
$10.2 billion
to
$84.3 billion
as of
December 31, 2017
from
December 31, 2016
primarily due to the decrease in our FHLB advances outstanding and an increase in our cash and cash equivalents. See “MD&A—
Risk Management
” for additional information on our management of liquidity risk.
|
92
|
Capital One Financial Corporation (COF)
|
|
Liquidity Coverage Ratio
We are subject to the Final Liquidity Coverage Ratio Rule (“Final LCR Rule”) issued by the Federal Banking Agencies. The Final LCR Rule came into effect in January 2015 and required us to calculate the LCR daily starting July 1, 2016. The minimum LCR standard was phased-in beginning January 1, 2015 and is at 100% as of January 1, 2017. At
December 31, 2017
, we exceeded the fully phased-in LCR requirement. The calculation and the underlying components are based on our interpretations, expectations and assumptions of relevant regulations, as well as interpretations provided by our regulators, and are subject to change based on changes to future regulations and interpretations. See “Part I—Item 1. Business—Supervision and Regulation” for additional information.
Borrowing Capacity
We filed a shelf registration statement with the SEC on March 31, 2015, which expires in March 2018. Under this shelf registration, we may periodically offer and sell an indeterminate aggregate amount of senior or subordinated debt securities, preferred stock, depositary shares, common stock, purchase contracts, warrants and units. There is no limit under this shelf registration to the amount or number of such securities that we may offer and sell, subject to market conditions. We expect to file a new shelf registration statement prior to the expiration of our existing shelf registration statement. We also filed a shelf registration statement with the SEC on January 12, 2016, which expires in January 2019 and allows us to periodically offer and sell up to $23 billion of securitized debt obligations from our credit card loan securitization trust.
In addition to our issuance capacity under the shelf registration statements, we also have access to FHLB advances with a maximum borrowing capacity of
$21.0 billion
, of which
$11.9 billion
was still available to us to borrow as of
December 31, 2017
. The ability to draw down funding is based on membership status and the amount is dependent upon the Banks’ ability to post collateral. Our FHLB membership is secured by our investment in FHLB stock of
$360 million
and
$760 million
as of
December 31, 2017
and
2016
, respectively, which was determined in part based on our outstanding advances. We also have access to the Federal Reserve Discount Window through which we had a borrowing capacity of
$7.4 billion
as of
December 31, 2017
. Our membership with the Federal Reserve is secured by our investment in Federal Reserve stock, totaling $1.2 billion as of both December 31, 2017 and 2016.
Funding
The Company’s primary source of funding comes from deposits, which provide a stable and relatively low cost of funds. In addition to deposits, the Company raises funding through the issuance of senior and subordinated notes, FHLB advances secured by certain portions of our loan and securities portfolios, the issuance of securitized debt obligations, the issuance of brokered deposits, federal funds purchased and other borrowings. A key objective in our use of these markets is to maintain access to a diversified mix of wholesale funding sources.
Deposits
Table
30
provides the composition of deposits as of
December 31, 2017
,
2016
and
2015
, as well as a comparison of average balances, interest expense and average deposit interest rates for
the years ended December 31, 2017, 2016 and 2015
.
Table
30
:
Deposits Composition and Average Deposits Interest Rates
|
December 31,
|
||||||||||||
|
(Dollars in millions)
|
2017
|
2016
|
2015
|
|||||||||
|
Non-interest-bearing deposits
|
$
|
26,404
|
|
$
|
25,502
|
|
$
|
25,847
|
|
|||
|
Interest-bearing checking accounts
(1)
|
42,938
|
|
45,820
|
|
44,720
|
|
||||||
|
Saving deposits
(2)
|
144,309
|
|
145,142
|
|
134,075
|
|
||||||
|
Time deposits less than $100,000
|
25,350
|
|
16,949
|
|
10,347
|
|
||||||
|
Total core deposits
|
239,001
|
|
233,413
|
|
214,989
|
|
||||||
|
Time deposits of $100,000 or more
|
4,330
|
|
2,875
|
|
1,889
|
|
||||||
|
Foreign deposits
|
371
|
|
480
|
|
843
|
|
||||||
|
Total deposits
|
$
|
243,702
|
|
$
|
236,768
|
|
$
|
217,721
|
|
|||
|
93
|
Capital One Financial Corporation (COF)
|
|
|
Year Ended December 31,
|
|||||||||||||||||||||||||||||||||
|
2017
|
2016
|
2015
|
|||||||||||||||||||||||||||||||
|
(Dollars in millions)
|
Average
Balance
|
Interest
Expense
|
Average
Deposits
Interest Rate
|
Average
Balance
|
Interest
Expense
|
Average
Deposits
Interest Rate
|
Average
Balance |
Interest
Expense |
Average
Deposits Interest Rate |
||||||||||||||||||||||||
|
Interest-bearing checking accounts
(1)
|
$
|
44,537
|
|
$
|
227
|
|
0.51
|
%
|
$
|
45,339
|
|
$
|
218
|
|
0.48
|
%
|
$
|
42,785
|
|
$
|
208
|
|
0.49
|
%
|
|||||||||
|
Saving deposits
(2)
|
144,273
|
|
982
|
|
0.68
|
|
137,753
|
|
814
|
|
0.59
|
|
132,658
|
|
769
|
|
0.58
|
|
|||||||||||||||
|
Time deposits less than $100,000
|
21,030
|
|
337
|
|
1.60
|
|
12,062
|
|
144
|
|
1.19
|
|
7,213
|
|
74
|
|
1.03
|
|
|||||||||||||||
|
Total interest-bearing core deposits
|
209,840
|
|
1,546
|
|
0.74
|
|
195,154
|
|
1,176
|
|
0.60
|
|
182,656
|
|
1,051
|
|
0.58
|
|
|||||||||||||||
|
Time deposits of $100,000 or more
|
3,661
|
|
54
|
|
1.50
|
|
2,511
|
|
35
|
|
1.39
|
|
2,043
|
|
36
|
|
1.76
|
|
|||||||||||||||
|
Foreign deposits
|
448
|
|
2
|
|
0.38
|
|
639
|
|
2
|
|
0.35
|
|
978
|
|
4
|
|
0.34
|
|
|||||||||||||||
|
Total interest-bearing deposits
|
$
|
213,949
|
|
$
|
1,602
|
|
0.75
|
|
$
|
198,304
|
|
$
|
1,213
|
|
0.61
|
|
$
|
185,677
|
|
$
|
1,091
|
|
0.59
|
|
|||||||||
|
(1)
|
Includes Negotiable Order of Withdrawal (“NOW”) accounts.
|
|
(2)
|
Includes Money Market Deposit Accounts (“MMDA”).
|
Our deposits include brokered deposits, which we obtained through third-party intermediaries. Those brokered deposits are reported as interest-bearing checking, saving deposits and time deposits in the above table and totaled
$25.1 billion
and
$22.5 billion
as of
December 31, 2017
and
2016
, respectively.
The FDIC limits the acceptance of brokered deposits by well-capitalized insured depository institutions and, with a waiver from the FDIC, by adequately-capitalized institutions. COBNA and CONA were well-capitalized, as defined under the federal banking regulatory guidelines, as of
December 31, 2017
and
2016
, respectively. See “Part I—Item 1. Business—Supervision and Regulation” for additional information.
Table
31
presents the contractual maturities of large-denomination domestic time deposits of $100,000 or more as of
December 31, 2017
and
2016
. Our funding and liquidity management activities factor into the expected maturities of these deposits.
Table
31
: Maturities of Large-Denomination Domestic Time Deposits—$100,000 or More
|
December 31,
|
||||||||||||||
|
2017
|
2016
|
|||||||||||||
|
(Dollars in millions)
|
Amount
|
% of Total
|
Amount
|
% of Total
|
||||||||||
|
Up to three months
|
$
|
577
|
|
13.3
|
%
|
$
|
656
|
|
22.8
|
%
|
||||
|
> 3 months to 6 months
|
469
|
|
10.8
|
|
282
|
|
9.8
|
|
||||||
|
> 6 months to 12 months
|
1,030
|
|
23.8
|
|
559
|
|
19.5
|
|
||||||
|
> 12 months
|
2,254
|
|
52.1
|
|
1,378
|
|
47.9
|
|
||||||
|
Total
|
$
|
4,330
|
|
100.0
|
%
|
$
|
2,875
|
|
100.0
|
%
|
||||
We access the capital markets to meet our funding needs through the issuance of senior and subordinated notes, securitized debt obligations, and federal funds purchased and securities loaned or sold under agreements to repurchase. In addition, we may utilize short-term and long-term FHLB advances secured by our investment securities, residential home loans, multifamily real estate loans, commercial real estate loans and home equity lines of credit. Substantially all of our long-term FHLB advances are structured with either a monthly or a quarterly call option at our discretion.
Our short-term borrowings include those borrowings with an original contractual maturity of one year or less and do not include the current portion of long-term debt. The short-term borrowings, which consist of federal funds purchased and securities loaned or sold under agreements to repurchase,
decreased
by
$416 million
to
$576 million
as of
December 31, 2017
from
December 31, 2016
.
|
94
|
Capital One Financial Corporation (COF)
|
|
Our long-term debt, which primarily consists of securitized debt obligations, senior and subordinated notes, and long-term FHLB advances,
increased
by
$237 million
to
$59.7 billion
as of
December 31, 2017
from
December 31, 2016
, primarily attributable to net issuances of senior and subordinated notes and securitized debt obligations, partially offset by a decrease in our FHLB advances outstanding.
The following table summarizes issuances of securitized debt obligations, senior and subordinated notes, and FHLB advances and their respective maturities or redemptions for the years ended December 31, 2017 and 2016.
Table
32
: Long-Term Funding
|
Issuances
|
Maturities/Redemptions
|
|||||||||||||||
|
Year Ended December 31,
|
Year Ended December 31,
|
|||||||||||||||
|
(Dollars in millions)
|
2017
|
2016
|
2017
|
2016
|
||||||||||||
|
Securitized debt obligations
(1)
|
$
|
8,474
|
|
$
|
6,275
|
|
$
|
7,233
|
|
$
|
3,520
|
|
||||
|
Senior and subordinated notes
|
10,300
|
|
4,405
|
|
2,804
|
|
2,650
|
|
||||||||
|
FHLB advances
|
25,180
|
|
18,600
|
|
33,750
|
|
21,520
|
|
||||||||
|
Total
|
$
|
43,954
|
|
$
|
29,280
|
|
$
|
43,787
|
|
$
|
27,690
|
|
||||
__________
|
(1)
|
Includes $2.5 billion of securitized debt assumed in the Cabela’s acquisition for the year ended December 31, 2017.
|
Credit Ratings
Our credit ratings impact our ability to access capital markets and our borrowing costs. Rating agencies base their ratings on numerous factors, including liquidity, capital adequacy, asset quality, quality of earnings and the probability of systemic support. Significant changes in these factors could result in different ratings. Such ratings help to support our cost effective unsecured funding as part of our overall financing programs.
Table
33
provides a summary of the credit ratings for the senior unsecured long-term debt of Capital One Financial Corporation, COBNA and CONA as of
December 31, 2017
and
2016
.
Table
33
:
Senior Unsecured Long-Term Debt Credit Ratings
|
December 31, 2017
|
December 31, 2016
|
|||||||||||
|
Capital One
Financial
Corporation
|
COBNA
|
CONA
|
Capital One
Financial
Corporation
|
COBNA
|
CONA
|
|||||||
|
Moody’s
|
Baa1
|
Baa1
|
Baa1
|
Baa1
|
Baa1
|
Baa1
|
||||||
|
S&P
|
BBB
|
BBB+
|
BBB+
|
BBB
|
BBB+
|
BBB+
|
||||||
|
Fitch
|
A-
|
A-
|
A-
|
A-
|
A-
|
A-
|
||||||
As of February 15, 2018, S&P and Fitch Ratings (“Fitch”) have us on a stable outlook. On November 8, 2017, Moody’s affirmed our senior unsecured long-term debt credit ratings and revised our outlook from stable to negative.
Contractual Obligations
In the normal course of business, we enter into various contractual obligations that may require future cash payments that affect our short-term and long-term liquidity and capital resource needs. Our future cash outflows primarily relate to deposits, borrowings and operating leases. Table
34
summarizes, by remaining contractual maturity, our significant contractual cash obligations as of
December 31, 2017
. The actual timing and amounts of future cash payments may differ from the amounts presented below due to a number of factors, such as discretionary debt repurchases. Table
34
excludes short-term obligations such as trade payables, representation and warranty reserves, and obligations for pension and post-retirement benefit plans, which are discussed in more detail in “
Note 19—Commitments, Contingencies, Guarantees and Others
” and “
Note 15—Employee Benefit Plans
.”
|
95
|
Capital One Financial Corporation (COF)
|
|
Table
34
: Contractual Obligations
__________
|
December 31, 2017
|
||||||||||||||||||||
|
(Dollars in millions)
|
Up to
1 Year |
> 1 Years
to 3 Years |
> 3 Years
to 5 Years |
> 5 Years
|
Total
|
|||||||||||||||
|
Interest-bearing time deposits
(1)(2)
|
$
|
9,025
|
|
$
|
12,542
|
|
$
|
7,955
|
|
$
|
158
|
|
$
|
29,680
|
|
|||||
|
Securitized debt obligations
(2)
|
2,666
|
|
12,117
|
|
4,250
|
|
977
|
|
20,010
|
|
||||||||||
|
Other debt:
|
||||||||||||||||||||
|
Federal funds purchased and securities loaned or sold under agreements to repurchase
|
576
|
|
—
|
|
—
|
|
—
|
|
576
|
|
||||||||||
|
Senior and subordinated notes
|
4,690
|
|
10,027
|
|
5,963
|
|
10,075
|
|
30,755
|
|
||||||||||
|
Other borrowings
(3)
|
230
|
|
8,669
|
|
5
|
|
36
|
|
8,940
|
|
||||||||||
|
Total other debt
(2)
|
5,496
|
|
18,696
|
|
5,968
|
|
10,111
|
|
40,271
|
|
||||||||||
|
Operating leases
|
332
|
|
616
|
|
527
|
|
1,177
|
|
2,652
|
|
||||||||||
|
Purchase obligations
(4)
|
225
|
|
461
|
|
167
|
|
131
|
|
984
|
|
||||||||||
|
Total
|
$
|
17,744
|
|
$
|
44,432
|
|
$
|
18,867
|
|
$
|
12,554
|
|
$
|
93,597
|
|
|||||
|
(1)
|
Includes only those interest-bearing deposits which have a contractual maturity date.
|
|
(2)
|
These amounts represent the carrying value of the obligations and do not include amounts related to contractual interest obligations. Total contractual interest obligations were approximately
$6.8 billion
as of
December 31, 2017
, and represent forecasted net interest payments based on interest rates as of December 31, 2017. These forecasts use the contractual maturity date of each liability and include the impact of hedge accounting where applicable.
|
|
(3)
|
Other borrowings primarily consists of FHLB advances.
|
|
(4)
|
Represents substantial agreements to purchase goods or services that are enforceable and legally binding and specify all significant terms. Purchase obligations are included through the termination date of the agreements even if the contract is renewable.
|
|
MARKET RISK PROFILE
|
Market risk is inherent in the financial instruments associated with our operations and activities, including loans, deposits, securities, short-term borrowings, long-term debt and derivatives. Below we provide additional information about our primary sources of market risk, our market risk management strategies and the measures we use to evaluate our market risk exposure.
Primary Market Risk Exposures
Our primary source of market risk is interest rate risk. We also have exposure to foreign exchange risk and customer-related trading risk, both of which we believe are minimal after considering the impact of our associated risk management activities discussed below.
Interest Rate Risk
Interest rate risk, which represents exposure to instruments whose yield or price varies with the volatility of interest rates, is our most significant source of market risk exposure. Banks are inevitably exposed to interest rate risk due to differences in the timing between the maturities or re-pricing of assets and liabilities.
Foreign Exchange Risk
Foreign exchange risk represents exposure to changes in the values of current holdings and future cash flows denominated in other currencies. Our primary exposure to foreign exchange risk is related to the operations of our international businesses in the U.K. and Canada. The largest foreign exchange exposure arising from these operations is the funding they are provided in the Great British pound (“GBP”) and the Canadian dollar (“CAD”), respectively. We also have foreign exchange exposure through our net equity investments in these operations and through the dollar-denominated value of future earnings and cash flows they generate.
|
96
|
Capital One Financial Corporation (COF)
|
|
Our intercompany funding exposes our consolidated statements of income to foreign exchange transaction risk, while our equity investments in our foreign operations result in translation risk exposure in our AOCI and capital ratios. We manage our transaction risk by entering into forward foreign currency derivative contracts to hedge our exposure to variability in cash flows related to foreign currency-denominated intercompany borrowings. We use foreign currency derivative contracts as net investment hedges to manage our AOCI exposure. We apply hedge accounting to both our intercompany funding hedges and our net investment hedges, with the primary net investments subject to hedging denominated in GBP.
We measure our total exposure from non-dollar-denominated intercompany borrowings to our international businesses by regularly tracking the value of the loans made to our foreign operations and the associated forward foreign currency derivative contracts we use to hedge them. We apply a 1% U.S. dollar appreciation shock against these exposures to measure the impact to our consolidated statements of income from foreign exchange transaction risk. The intercompany borrowings to our international businesses were
741 million
GBP and
786 million
GBP as of
December 31, 2017
and
2016
, respectively, and
6.4 billion
CAD and
6.2 billion
CAD as of
December 31, 2017
and
2016
, respectively.
We measure our total exposure in non-dollar-denominated equity by regularly tracking the value of net equity invested in our foreign operations, the largest of which is in our U.K. and Canadian operations. Our measurement of net equity includes the impact of net investment hedges where applicable. We apply a 30% U.S. dollar appreciation shock against these net investment exposures, which we believe approximates a significant adverse foreign exchange movement over a one-year time horizon. Our gross equity exposures in our U.K. and Canadian operations were
1.6 billion
and
1.5 billion
GBP as of
December 31, 2017
and
2016
, respectively, and
1.0 billion
CAD and
863 million
CAD as of
December 31, 2017
and
2016
, respectively.
As a result of our derivative management activities, we believe our net exposure to foreign exchange risk is minimal.
Customer-Related Trading Risk
We offer various interest rate, foreign exchange rate and commodity derivatives as an accommodation to customers within our Commercial Banking business and offset the majority of these exposures through derivative transactions with other counterparties. These exposures are measured and monitored on a daily basis. As a result of offsetting our customer exposures with other counterparties, we believe our net exposure to customer-related trading risk is minimal.
We employ value-at-risk (“VaR”) as the primary method to both measure and monitor the market risk in our customer-related trading activities. VaR is a statistical-based risk measure used to estimate the potential loss from adverse market movements in a normal market environment. We employ a historical simulation approach using the most recent 500 business days and use a 99 percent confidence level and a holding period of one business day. We use internal models to produce a daily VaR measure of the market risk of all customer-related trading exposures.
For further information on our customer-related trading exposures, see “
Note 10—Derivative Instruments and Hedging Activities
.”
Market Risk Management
We employ several techniques to manage our interest rate and foreign exchange risk, which include, but are not limited to, altering the duration and re-pricing characteristics of our various assets and liabilities and mitigating the foreign exchange exposure of certain non-dollar-denominated equity or transactions. Derivatives are the primary tools that we use for managing interest rate and foreign exchange risk. Use of derivatives is included in our current market risk management policies. We execute our derivative contracts in both over-the-counter (“OTC”) and exchange-traded derivative markets and have exposure to both bilateral and clearinghouse counterparties. Although the majority of our derivatives are interest rate swaps, we also use a variety of other derivative instruments, including caps, floors, options, futures and forward contracts, to manage both our interest rate and foreign currency risk. The outstanding notional amount of our derivative contracts increased to
$196.6 billion
as of
December 31, 2017
from
$142.9 billion
as of
December 31, 2016
primarily driven by an increase in our hedging activities.
|
97
|
Capital One Financial Corporation (COF)
|
|
Market Risk Measurement
We have risk management policies and limits established by our market risk management policies and approved by the Board of Directors. Our objective is to manage our asset and liability risk position and exposure to market risk in accordance with these policies and prescribed limits based on prevailing market conditions and long-term expectations. Because no single measure can reflect all aspects of market risk, we use various industry standard market risk measurement techniques and analysis to measure, assess and manage the impact of changes in interest rates on our net interest income and our economic value of equity and the impact of changes in foreign exchange rates on our non-dollar-denominated earnings and non-dollar equity investments in foreign operations. We provide additional information below in “Economic Value of Equity.”
We consider the impact on both net interest income and economic value of equity in measuring and managing our interest rate risk. Due to the increase in interest rates since December 31, 2016, we have incorporated a 100-basis points decline scenario into our interest rate sensitivity analysis. We use this 100-basis points decrease as our largest magnitude declining interest rate scenario, since a scenario where interest rates would decline by 200 basis points is unlikely. In scenarios where a 100-basis points decline would result in a rate less than 0%, we assume a rate of 0%. Below we discuss the assumptions used in calculating each of these measures.
Net Interest Income Sensitivity
This sensitivity measure estimates the impact on our projected 12-month baseline interest rate-sensitive revenue resulting from movements in interest rates. Interest rate-sensitive revenue consists of net interest income and certain components of other non-interest income significantly impacted by movements in interest rates, including changes in the fair value of mortgage servicing rights and free-standing interest rate swaps. Adjusted net interest income consists of net interest income and changes in the fair value of mortgage servicing rights, including related derivative hedging activity, and changes in the fair value of free-standing interest rate swaps. In addition to our existing assets and liabilities, we incorporate expected future business growth assumptions, such as loan and deposit growth and pricing, and plans for projected changes in our funding mix in our baseline forecast. In measuring the sensitivity of interest rate movements on our projected interest rate-sensitive revenue,
we assume a hypothetical instantaneous parallel shift in the level of interest rates of +200 basis points, +100 basis points, +50 basis points, -50 basis points and -100 basis points to spot rates, with the lower rate scenario limited to zero as described above
. At the current level of interest rates, our net interest income remains mostly unchanged in the -50, +50 and +100 basis points scenarios and decreases slightly in the -100 and +200 basis points scenarios.
Economic Value of Equity
Our economic value of equity sensitivity measure estimates the impact on the net present value of our assets and liabilities, including derivative hedging activity, resulting from movements in interest rates. Our economic value of equity sensitivity measures are calculated based on our existing assets and liabilities, including derivatives, and do not incorporate business growth assumptions or projected plans for funding mix changes. In measuring the sensitivity of interest rate movements on our economic value of equity,
we assume a hypothetical instantaneous parallel shift in the level of interest rates of +200 basis points, +100 basis points, +50 basis points, -50 basis points and -100 basis points to spot rates, with the lower rate scenario limited to zero as described above
.
Calculating our economic value of equity and its sensitivity to interest rates requires projecting cash flows for assets, liabilities and derivative instruments and discounting those cash flows at the appropriate discount rates. Key assumptions in our economic value of equity calculation include projecting rate sensitive prepayments for mortgage securities, loans and other assets, term structure modeling of interest rates, discount spreads, and deposit volume and pricing assumptions.
Our current economic value of equity sensitivity profile demonstrates that our economic value of equity generally decreases as interest rates increase indicating that the economic value of our assets and derivative positions is more sensitive to interest rate changes than our liabilities.
Table
35
shows the estimated percentage impact on our projected baseline net interest income and economic value of equity calculated under the methodology described above as of
December 31, 2017
and
2016
. During the second quarter of 2017, we updated our projected commercial deposit attrition assumptions that resulted in longer life of these deposit balances and accounts for most of the decrease in economic value of equity sensitivity from
December 31, 2016
. Our net interest income sensitivity measures were largely unchanged from this assumption update.
|
98
|
Capital One Financial Corporation (COF)
|
|
Table
35
:
Interest Rate Sensitivity Analysis
|
December 31,
2017 |
December 31,
2016 |
|||||
|
Estimated impact on projected baseline net interest income:
|
||||||
|
+200 basis points
|
(0.8
|
)%
|
(0.1
|
)%
|
||
|
+100 basis points
|
(0.3
|
)
|
0.5
|
|
||
|
+50 basis points
|
—
|
|
0.4
|
|
||
|
–50 basis points
|
(0.3
|
)
|
(1.0
|
)
|
||
|
–100 basis points
|
(1.3
|
)
|
N/A
|
|
||
|
Estimated impact on economic value of equity:
|
||||||
|
+200 basis points
|
(7.5
|
)
|
(9.6
|
)
|
||
|
+100 basis points
|
(3.1
|
)
|
(3.8
|
)
|
||
|
+50 basis points
|
(1.2
|
)
|
(1.5
|
)
|
||
|
–50 basis points
|
0.1
|
|
0.5
|
|
||
|
–100 basis points
|
(1.5
|
)
|
N/A
|
|
||
In addition to these industry standard measures, we will continue to factor into our internal interest rate risk management decisions the potential impact of alternative interest rate scenarios, such as stressed rate shocks as well as steepening and flattening yield curve scenarios.
Limitations of Market Risk Measures
The interest rate risk models that we use in deriving these measures incorporate contractual information, internally-developed assumptions and proprietary modeling methodologies, which project borrower and depositor behavior patterns in certain interest rate environments. Other market inputs, such as interest rates, market prices and interest rate volatility, are also critical components of our interest rate risk measures. We regularly evaluate, update and enhance these assumptions, models and analytical tools as we believe appropriate to reflect our best assessment of the market environment and the expected behavior patterns of our existing assets and liabilities.
There are inherent limitations in any methodology used to estimate the exposure to changes in market interest rates. The sensitivity analysis described above contemplates only certain movements in interest rates and is performed at a particular point in time based on the existing balance sheet and, in some cases, expected future business growth and funding mix assumptions. The strategic actions that management may take to manage our balance sheet may differ significantly from our projections, which could cause our actual earnings and economic value of equity sensitivities to differ substantially from the above sensitivity analysis.
|
99
|
Capital One Financial Corporation (COF)
|
|
|
SUPPLEMENTAL TABLES
|
Table
A
—Loans Held for Investment Portfolio Composition
|
|
December 31,
|
|||||||||||||||||||
|
(Dollars in millions)
|
2017
|
2016
|
2015
|
2014
|
2013
|
|||||||||||||||
|
Credit Card:
|
||||||||||||||||||||
|
Domestic credit card
|
$
|
105,293
|
|
$
|
97,120
|
|
$
|
87,939
|
|
$
|
77,704
|
|
$
|
73,255
|
|
|||||
|
International card businesses
|
9,469
|
|
8,432
|
|
8,186
|
|
8,172
|
|
8,050
|
|
||||||||||
|
Total credit card
|
114,762
|
|
105,552
|
|
96,125
|
|
85,876
|
|
81,305
|
|
||||||||||
|
Consumer Banking:
|
||||||||||||||||||||
|
Auto
|
53,991
|
|
47,916
|
|
41,549
|
|
37,824
|
|
31,857
|
|
||||||||||
|
Home loan
|
17,633
|
|
21,584
|
|
25,227
|
|
30,035
|
|
35,282
|
|
||||||||||
|
Retail banking
|
3,454
|
|
3,554
|
|
3,596
|
|
3,580
|
|
3,623
|
|
||||||||||
|
Total consumer banking
|
75,078
|
|
73,054
|
|
70,372
|
|
71,439
|
|
70,762
|
|
||||||||||
|
Commercial Banking:
|
||||||||||||||||||||
|
Commercial and multifamily real estate
|
26,150
|
|
26,609
|
|
25,518
|
|
23,137
|
|
20,750
|
|
||||||||||
|
Commercial and industrial
|
38,025
|
|
39,824
|
|
37,135
|
|
26,972
|
|
23,309
|
|
||||||||||
|
Total commercial lending
|
64,175
|
|
66,433
|
|
62,653
|
|
50,109
|
|
44,059
|
|
||||||||||
|
Small-ticket commercial real estate
|
400
|
|
483
|
|
613
|
|
781
|
|
952
|
|
||||||||||
|
Total commercial banking
|
64,575
|
|
66,916
|
|
63,266
|
|
50,890
|
|
45,011
|
|
||||||||||
|
Other loans
|
58
|
|
64
|
|
88
|
|
111
|
|
121
|
|
||||||||||
|
Total loans
|
$
|
254,473
|
|
$
|
245,586
|
|
$
|
229,851
|
|
$
|
208,316
|
|
$
|
197,199
|
|
|||||
|
100
|
Capital One Financial Corporation (COF)
|
|
Table
B
—Performing Delinquencies
__________
|
|
December 31,
|
||||||||||||||||||||||||||||||||||
|
|
2017
|
2016
|
2015
|
2014
|
2013
|
||||||||||||||||||||||||||||||
|
(Dollars in millions)
|
Loans
(1)(2)
|
Rate
(3)
|
Loans
(1)(2)
|
Rate
(3)
|
Loans
(1)(2)
|
Rate
(3)
|
Loans
(1)(2)
|
Rate
(3)
|
Loans
(1)(2)
|
Rate
(3)
|
|||||||||||||||||||||||||
|
Delinquent loans:
|
|||||||||||||||||||||||||||||||||||
|
30 – 59 days
|
$
|
3,908
|
|
1.53
|
%
|
$
|
3,416
|
|
1.39
|
%
|
$
|
3,042
|
|
1.33
|
%
|
$
|
2,803
|
|
1.34
|
%
|
$
|
2,584
|
|
1.31
|
%
|
||||||||||
|
60 – 89 days
|
2,086
|
|
0.82
|
|
1,833
|
|
0.75
|
|
1,636
|
|
0.71
|
|
1,394
|
|
0.67
|
|
1,313
|
|
0.67
|
|
|||||||||||||||
|
90 – 119 days
|
862
|
|
0.34
|
|
771
|
|
0.31
|
|
603
|
|
0.26
|
|
508
|
|
0.24
|
|
512
|
|
0.26
|
|
|||||||||||||||
|
120 – 149 days
|
734
|
|
0.29
|
|
628
|
|
0.26
|
|
493
|
|
0.21
|
|
409
|
|
0.20
|
|
418
|
|
0.21
|
|
|||||||||||||||
|
150 or more days
|
637
|
|
0.25
|
|
537
|
|
0.22
|
|
409
|
|
0.18
|
|
346
|
|
0.17
|
|
361
|
|
0.18
|
|
|||||||||||||||
|
Total
(4)
|
$
|
8,227
|
|
3.23
|
%
|
$
|
7,185
|
|
2.93
|
%
|
$
|
6,183
|
|
2.69
|
%
|
$
|
5,460
|
|
2.62
|
%
|
$
|
5,188
|
|
2.63
|
%
|
||||||||||
|
By geographic area:
|
|||||||||||||||||||||||||||||||||||
|
Domestic
|
$
|
7,883
|
|
3.10
|
%
|
$
|
6,902
|
|
2.81
|
%
|
$
|
5,939
|
|
2.58
|
%
|
$
|
5,220
|
|
2.50
|
%
|
$
|
4,889
|
|
2.48
|
%
|
||||||||||
|
International
|
344
|
|
0.13
|
|
283
|
|
0.12
|
|
244
|
|
0.11
|
|
240
|
|
0.12
|
|
299
|
|
0.15
|
|
|||||||||||||||
|
Total
(4)
|
$
|
8,227
|
|
3.23
|
%
|
$
|
7,185
|
|
2.93
|
%
|
$
|
6,183
|
|
2.69
|
%
|
$
|
5,460
|
|
2.62
|
%
|
$
|
5,188
|
|
2.63
|
%
|
||||||||||
|
Total loans held for investment
|
$
|
254,473
|
|
$
|
245,586
|
|
$
|
229,851
|
|
$
|
208,316
|
|
$
|
197,199
|
|
||||||||||||||||||||
|
(1)
|
Credit card loan balances are reported net of the finance charge and fee reserve, which totaled
$491 million
, $402 million, $262 million, $216 million and $190 million as of
December 31, 2017
,
2016
,
2015
,
2014
and
2013
, respectively.
|
|
(2)
|
Performing loan modifications and restructuring totaled
$1.9 billion
, $1.6 billion, $1.4 billion, $1.2 billion and $1.3 billion as of
December 31, 2017
,
2016
,
2015
,
2014
and
2013
, respectively.
|
|
(3)
|
Delinquency rates are calculated by dividing loans in each delinquency status category and geographic region as of the end of the period by the total loan portfolio.
|
|
(4)
|
Excluding the impact of the Cabela’s acquisition, the total 30+ day performing delinquency rate would have been
3.28%
.
|
|
101
|
Capital One Financial Corporation (COF)
|
|
Table
C
—Nonperforming Loans and Other Nonperforming Assets
__________
|
|
December 31,
|
|||||||||||||||||||
|
(Dollars in millions)
|
2017
|
2016
|
2015
|
2014
|
2013
|
|||||||||||||||
|
Nonperforming loans held for investment:
|
||||||||||||||||||||
|
Credit Card:
|
||||||||||||||||||||
|
International card businesses
|
$
|
24
|
|
$
|
42
|
|
$
|
53
|
|
$
|
70
|
|
$
|
88
|
|
|||||
|
Total credit card
|
24
|
|
42
|
|
53
|
|
70
|
|
88
|
|
||||||||||
|
Consumer Banking:
|
||||||||||||||||||||
|
Auto
(1)
|
376
|
|
223
|
|
219
|
|
197
|
|
194
|
|
||||||||||
|
Home loan
|
176
|
|
273
|
|
311
|
|
330
|
|
376
|
|
||||||||||
|
Retail banking
|
35
|
|
31
|
|
28
|
|
22
|
|
41
|
|
||||||||||
|
Total consumer banking
|
587
|
|
527
|
|
558
|
|
549
|
|
611
|
|
||||||||||
|
Commercial Banking:
|
||||||||||||||||||||
|
Commercial and multifamily real estate
|
38
|
|
30
|
|
7
|
|
62
|
|
52
|
|
||||||||||
|
Commercial and industrial
|
239
|
|
988
|
|
538
|
|
106
|
|
93
|
|
||||||||||
|
Total commercial lending
|
277
|
|
1,018
|
|
545
|
|
168
|
|
145
|
|
||||||||||
|
Small-ticket commercial real estate
|
7
|
|
4
|
|
5
|
|
7
|
|
4
|
|
||||||||||
|
Total commercial banking
|
284
|
|
1,022
|
|
550
|
|
175
|
|
149
|
|
||||||||||
|
Other loans
|
4
|
|
8
|
|
9
|
|
15
|
|
19
|
|
||||||||||
|
Total nonperforming loans held for investment
|
$
|
899
|
|
$
|
1,599
|
|
$
|
1,170
|
|
$
|
809
|
|
$
|
867
|
|
|||||
|
Other nonperforming assets:
|
||||||||||||||||||||
|
Foreclosed property
|
$
|
88
|
|
$
|
75
|
|
$
|
126
|
|
$
|
139
|
|
$
|
113
|
|
|||||
|
Other assets
(1)
|
65
|
|
205
|
|
198
|
|
183
|
|
160
|
|
||||||||||
|
Total other nonperforming assets
|
153
|
|
280
|
|
324
|
|
322
|
|
273
|
|
||||||||||
|
Total nonperforming assets
|
$
|
1,052
|
|
$
|
1,879
|
|
$
|
1,494
|
|
$
|
1,131
|
|
$
|
1,140
|
|
|||||
|
Total nonperforming loans
(2)
|
0.35
|
%
|
0.65
|
%
|
0.51
|
%
|
0.39
|
%
|
0.44
|
%
|
||||||||||
|
Total nonperforming assets
(3)
|
0.41
|
|
0.76
|
|
0.65
|
|
0.54
|
|
0.58
|
|
||||||||||
|
(1)
|
Beginning in the first quarter of 2017, partially charged-off auto loans previously presented within other assets were prospectively included within loans held for investment. Other assets includes repossessed assets obtained in satisfaction of auto loans and the net realizable value of certain partially charged-off auto loans, which will continue to decline over time.
|
|
(2)
|
Nonperforming loan rate is calculated based on total nonperforming loans divided by period-end total loans held for investment.
|
|
(3)
|
The denominator used in calculating the total nonperforming assets ratio consists of total loans held for investment and total other nonperforming assets.
|
|
102
|
Capital One Financial Corporation (COF)
|
|
Table
D
—Net Charge-Offs
|
|
December 31,
|
|||||||||||||||||||
|
(Dollars in millions)
|
2017
|
2016
|
2015
|
2014
|
2013
|
|||||||||||||||
|
Average loans held for investment
|
$
|
245,565
|
|
$
|
233,272
|
|
$
|
210,745
|
|
$
|
197,925
|
|
$
|
192,614
|
|
|||||
|
Net charge-offs
|
6,562
|
|
5,062
|
|
3,695
|
|
3,414
|
|
3,934
|
|
||||||||||
|
Net charge-off rate
|
2.67
|
%
|
2.17
|
%
|
1.75
|
%
|
1.72
|
%
|
2.04
|
%
|
||||||||||
|
103
|
Capital One Financial Corporation (COF)
|
|
Table
E
—Summary of Allowance for Loan and Lease Losses and Reserve for Unfunded Lending Commitments
|
|
December 31,
|
|||||||||||||||||||
|
(Dollars in millions)
|
2017
|
2016
|
2015
|
2014
|
2013
|
|||||||||||||||
|
Allowance for loan and lease losses:
|
||||||||||||||||||||
|
Balance at beginning of period
|
$
|
6,503
|
|
$
|
5,130
|
|
$
|
4,383
|
|
$
|
4,315
|
|
$
|
5,156
|
|
|||||
|
Charge-offs:
|
||||||||||||||||||||
|
Credit card
|
(6,321
|
)
|
(5,019
|
)
|
(4,028
|
)
|
(3,963
|
)
|
(4,542
|
)
|
||||||||||
|
Consumer banking
|
(1,677
|
)
|
(1,226
|
)
|
(1,082
|
)
|
(989
|
)
|
(888
|
)
|
||||||||||
|
Commercial banking
|
(481
|
)
|
(307
|
)
|
(76
|
)
|
(34
|
)
|
(49
|
)
|
||||||||||
|
Other loans
|
(34
|
)
|
(3
|
)
|
(7
|
)
|
(10
|
)
|
(26
|
)
|
||||||||||
|
Total charge-offs
|
(8,513
|
)
|
(6,555
|
)
|
(5,193
|
)
|
(4,996
|
)
|
(5,505
|
)
|
||||||||||
|
Recoveries:
|
||||||||||||||||||||
|
Credit card
|
1,267
|
|
1,066
|
|
1,110
|
|
1,235
|
|
1,257
|
|
||||||||||
|
Consumer banking
|
639
|
|
406
|
|
351
|
|
314
|
|
272
|
|
||||||||||
|
Commercial banking
|
16
|
|
15
|
|
29
|
|
24
|
|
35
|
|
||||||||||
|
Other loans
|
29
|
|
6
|
|
8
|
|
9
|
|
7
|
|
||||||||||
|
Total recoveries
|
1,951
|
|
1,493
|
|
1,498
|
|
1,582
|
|
1,571
|
|
||||||||||
|
Net charge-offs
|
(6,562
|
)
|
(5,062
|
)
|
(3,695
|
)
|
(3,414
|
)
|
(3,934
|
)
|
||||||||||
|
Provision for credit losses
|
7,563
|
|
6,491
|
|
4,490
|
|
3,515
|
|
3,401
|
|
||||||||||
|
Allowance build (release) for loan and lease losses
|
1,001
|
|
1,429
|
|
795
|
|
101
|
|
(533
|
)
|
||||||||||
|
Other changes
|
(2
|
)
|
(56
|
)
|
(48
|
)
|
(33
|
)
|
(308
|
)
|
||||||||||
|
Balance at end of period
|
$
|
7,502
|
|
$
|
6,503
|
|
$
|
5,130
|
|
$
|
4,383
|
|
$
|
4,315
|
|
|||||
|
Reserve for unfunded lending commitments:
|
||||||||||||||||||||
|
Balance at beginning of period
|
$
|
136
|
|
$
|
168
|
|
$
|
113
|
|
$
|
87
|
|
$
|
35
|
|
|||||
|
Provision (benefit) for losses on unfunded lending commitments
|
(12
|
)
|
(32
|
)
|
46
|
|
26
|
|
52
|
|
||||||||||
|
Other changes
|
—
|
|
—
|
|
9
|
|
—
|
|
—
|
|
||||||||||
|
Balance at end of period
|
124
|
|
136
|
|
168
|
|
113
|
|
87
|
|
||||||||||
|
Combined allowance and reserve at end of period
|
$
|
7,626
|
|
$
|
6,639
|
|
$
|
5,298
|
|
$
|
4,496
|
|
$
|
4,402
|
|
|||||
|
Allowance for loan and lease losses as a percentage of loans held for investment
|
2.95
|
%
|
2.65
|
%
|
2.23
|
%
|
2.10
|
%
|
2.19
|
%
|
||||||||||
|
Combined allowance and reserve by geographic distribution:
|
||||||||||||||||||||
|
Domestic
|
$
|
7,251
|
|
$
|
6,262
|
|
$
|
4,999
|
|
$
|
4,170
|
|
$
|
4,024
|
|
|||||
|
International
|
375
|
|
377
|
|
299
|
|
326
|
|
378
|
|
||||||||||
|
Total
|
$
|
7,626
|
|
$
|
6,639
|
|
$
|
5,298
|
|
$
|
4,496
|
|
$
|
4,402
|
|
|||||
|
Combined allowance and reserve by loan category:
|
||||||||||||||||||||
|
Credit card
|
$
|
5,648
|
|
$
|
4,606
|
|
$
|
3,654
|
|
$
|
3,204
|
|
$
|
3,214
|
|
|||||
|
Consumer banking
|
1,249
|
|
1,109
|
|
875
|
|
786
|
|
759
|
|
||||||||||
|
Commercial banking
|
728
|
|
922
|
|
765
|
|
501
|
|
418
|
|
||||||||||
|
Other loans
|
1
|
|
2
|
|
4
|
|
5
|
|
11
|
|
||||||||||
|
Total
|
$
|
7,626
|
|
$
|
6,639
|
|
$
|
5,298
|
|
$
|
4,496
|
|
$
|
4,402
|
|
|||||
|
104
|
Capital One Financial Corporation (COF)
|
|
We include certain non-GAAP measures in the following tables. We consider these metrics to be key financial performance measures that management uses in assessing capital adequacy and the level of returns generated. While our non-GAAP measures are widely used by investors, analysts and bank regulatory agencies to assess the capital position of financial services companies, they may not be comparable to similarly-titled measures reported by other companies. These non-GAAP measures are individually identified and calculations are explained in footnotes below the table. The following tables present reconciliations of these non-GAAP measures to the applicable amounts measured in accordance with GAAP.
Table
F
—
Reconciliation of Non-GAAP Measures and Calculation of Regulatory Capital Measures
|
December 31,
|
||||||||||||||||||||
|
(Dollars in millions, except as noted)
|
2017
|
2016
|
2015
|
2014
|
2013
|
|||||||||||||||
|
Tangible Common Equity (Period-End):
|
||||||||||||||||||||
|
Stockholders’ equity
|
$
|
48,730
|
|
$
|
47,514
|
|
$
|
47,284
|
|
$
|
45,053
|
|
$
|
41,632
|
|
|||||
|
Goodwill and intangible assets
(1)
|
(15,106
|
)
|
(15,420
|
)
|
(15,701
|
)
|
(15,383
|
)
|
(15,784
|
)
|
||||||||||
|
Noncumulative perpetual preferred stock
(2)
|
(4,360
|
)
|
(4,360
|
)
|
(3,294
|
)
|
(1,822
|
)
|
(853
|
)
|
||||||||||
|
Tangible common equity
|
$
|
29,264
|
|
$
|
27,734
|
|
$
|
28,289
|
|
$
|
27,848
|
|
$
|
24,995
|
|
|||||
|
Tangible Common Equity (Average):
|
||||||||||||||||||||
|
Stockholders’ equity
|
$
|
49,530
|
|
$
|
48,753
|
|
$
|
47,713
|
|
$
|
44,268
|
|
$
|
41,482
|
|
|||||
|
Goodwill and intangible assets
(1)
|
(15,308
|
)
|
(15,550
|
)
|
(15,273
|
)
|
(15,575
|
)
|
(15,938
|
)
|
||||||||||
|
Noncumulative perpetual preferred stock
(2)
|
(4,360
|
)
|
(3,591
|
)
|
(2,641
|
)
|
(1,213
|
)
|
(853
|
)
|
||||||||||
|
Tangible common equity
|
$
|
29,862
|
|
$
|
29,612
|
|
$
|
29,799
|
|
$
|
27,480
|
|
$
|
24,691
|
|
|||||
|
Tangible Assets (Period-End):
|
||||||||||||||||||||
|
Total assets
|
$
|
365,693
|
|
$
|
357,033
|
|
$
|
334,048
|
|
$
|
308,167
|
|
$
|
296,064
|
|
|||||
|
Goodwill and intangible assets
(1)
|
(15,106
|
)
|
(15,420
|
)
|
(15,701
|
)
|
(15,383
|
)
|
(15,784
|
)
|
||||||||||
|
Tangible assets
|
$
|
350,587
|
|
$
|
341,613
|
|
$
|
318,347
|
|
$
|
292,784
|
|
$
|
280,280
|
|
|||||
|
Tangible Assets (Average)
|
||||||||||||||||||||
|
Total assets
|
$
|
354,924
|
|
$
|
339,974
|
|
$
|
313,474
|
|
$
|
297,659
|
|
$
|
296,200
|
|
|||||
|
Goodwill and intangible assets
(1)
|
(15,308
|
)
|
(15,550
|
)
|
(15,273
|
)
|
(15,575
|
)
|
(15,938
|
)
|
||||||||||
|
Tangible assets
|
$
|
339,616
|
|
$
|
324,424
|
|
$
|
298,201
|
|
$
|
282,084
|
|
$
|
280,262
|
|
|||||
|
Non-GAAP Ratio:
|
||||||||||||||||||||
|
TCE
(3)
|
8.3
|
%
|
8.1
|
%
|
8.9
|
%
|
9.5
|
%
|
8.9
|
%
|
||||||||||
|
Capital Ratios:
(4)
|
||||||||||||||||||||
|
Common equity Tier 1 capital
(5)
|
10.3
|
%
|
10.1
|
%
|
11.1
|
%
|
12.5
|
%
|
N/A
|
|
||||||||||
|
Tier 1 common
(6)
|
N/A
|
|
N/A
|
|
N/A
|
|
N/A
|
|
12.2
|
%
|
||||||||||
|
Tier 1 capital
(7)
|
11.8
|
|
11.6
|
|
12.4
|
|
13.2
|
|
12.6
|
|
||||||||||
|
Total capital
(8)
|
14.4
|
|
14.3
|
|
14.6
|
|
15.1
|
|
14.7
|
|
||||||||||
|
Tier 1 leverage
(9)
|
9.9
|
|
9.9
|
|
10.6
|
|
10.8
|
|
10.1
|
|
||||||||||
|
Supplementary leverage
(10)
|
8.4
|
|
8.6
|
|
9.2
|
|
N/A
|
|
N/A
|
|
||||||||||
|
Regulatory Capital Metrics:
|
||||||||||||||||||||
|
Risk-weighted assets
(11)
|
$
|
292,225
|
|
$
|
285,756
|
|
$
|
265,739
|
|
$
|
236,944
|
|
$
|
224,556
|
|
|||||
|
Adjusted average assets
(9)
|
348,424
|
|
335,835
|
|
309,037
|
|
291,243
|
|
280,574
|
|
||||||||||
|
Total leverage exposure for supplementary leverage ratio
|
407,832
|
|
387,921
|
|
357,794
|
|
N/A
|
|
N/A
|
|
||||||||||
|
105
|
Capital One Financial Corporation (COF)
|
|
|
December 31,
|
||||||||||||||||||||
|
(Dollars in millions)
|
2017
|
2016
|
2015
|
2014
|
||||||||||||||||
|
Regulatory Capital Under Basel III Standardized Approach:
(4)
|
||||||||||||||||||||
|
Common equity excluding AOCI
|
$
|
45,296
|
|
$
|
44,103
|
|
$
|
44,606
|
|
$
|
43,661
|
|
||||||||
|
Adjustments:
|
||||||||||||||||||||
|
AOCI
(12)(13)
|
(808
|
)
|
(674
|
)
|
(254
|
)
|
(69
|
)
|
||||||||||||
|
Goodwill, net of related deferred tax liabilities
(1)
|
(14,380
|
)
|
(14,307
|
)
|
(14,296
|
)
|
(13,805
|
)
|
||||||||||||
|
Intangible assets, net of related deferred tax liabilities
(1)(13)
|
(330
|
)
|
(384
|
)
|
(393
|
)
|
(243
|
)
|
||||||||||||
|
Other
|
258
|
|
65
|
|
(119
|
)
|
(10
|
)
|
||||||||||||
|
Common equity Tier 1 capital
|
30,036
|
|
28,803
|
|
29,544
|
|
29,534
|
|
||||||||||||
|
Tier 1 capital instruments
(2)
|
4,360
|
|
4,359
|
|
3,294
|
|
1,822
|
|
||||||||||||
|
Additional Tier 1 capital adjustments
|
—
|
|
—
|
|
—
|
|
(1
|
)
|
||||||||||||
|
Tier 1 capital
|
34,396
|
|
33,162
|
|
32,838
|
|
31,355
|
|
||||||||||||
|
Tier 2 capital instruments
|
3,865
|
|
4,047
|
|
2,654
|
|
1,542
|
|
||||||||||||
|
Qualifying allowance for loan and lease losses
|
3,701
|
|
3,608
|
|
3,346
|
|
2,981
|
|
||||||||||||
|
Additional Tier 2 capital adjustments
|
—
|
|
—
|
|
—
|
|
1
|
|
||||||||||||
|
Tier 2 capital
|
7,566
|
|
7,655
|
|
6,000
|
|
4,524
|
|
||||||||||||
|
Total capital
|
$
|
41,962
|
|
$
|
40,817
|
|
$
|
38,838
|
|
$
|
35,879
|
|
||||||||
|
(Dollars in millions)
|
December 31, 2013
|
|||
|
Regulatory Capital Under Basel I:
(4)
|
||||
|
Total stockholders’ equity
|
$
|
41,632
|
|
|
|
Adjustments:
|
||||
|
Net unrealized losses (gains) on investment securities available for sale recorded in AOCI
(13)
|
791
|
|
||
|
Net losses on cash flow hedges recorded in AOCI
(13)
|
136
|
|
||
|
Disallowed goodwill and intangible assets
(1)
|
(14,326
|
)
|
||
|
Noncumulative perpetual preferred stock
(2)
|
(853
|
)
|
||
|
Other
|
(5
|
)
|
||
|
Tier 1 common capital
|
27,375
|
|
||
|
Noncumulative perpetual preferred stock
(2)
|
853
|
|
||
|
Tier 1 restricted core capital items
|
2
|
|
||
|
Tier 1 capital
|
28,230
|
|
||
|
Long-term debt qualifying as Tier 2 capital
|
1,914
|
|
||
|
Qualifying allowance for loan and lease losses
|
2,833
|
|
||
|
Other Tier 2 components
|
10
|
|
||
|
Tier 2 capital
|
4,757
|
|
||
|
Total capital
|
$
|
32,987
|
|
|
|
(1)
|
Goodwill and intangible assets includes impact of related deferred taxes.
|
|
(2)
|
Noncumulative perpetual preferred stock and Tier 1 capital instruments include related surplus.
|
|
(3)
|
TCE ratio is a non-GAAP measure calculated by dividing the period-end TCE by period-end tangible assets.
|
|
(4)
|
Beginning on January 1, 2014, we calculate our regulatory capital under the Basel III Standardized Approach subject to transition provisions. Prior to January 1, 2014, we calculated regulatory capital under Basel I.
|
|
(5)
|
Common equity Tier 1 capital ratio is a regulatory capital measure calculated based on common equity Tier 1 capital divided by risk-weighted assets.
|
|
(6)
|
Tier 1 common capital ratio is a regulatory capital measure under Basel I calculated based on Tier 1 common capital divided by Basel I risk-weighted assets.
|
|
(7)
|
Tier 1 capital ratio is a regulatory capital measure calculated based on Tier 1 capital divided by risk-weighted assets.
|
|
(8)
|
Total capital ratio is a regulatory capital measure calculated based on total capital divided by risk-weighted assets.
|
|
(9)
|
Adjusted average assets, for the purpose of calculating our Tier 1 leverage ratio, represent total average assets adjusted for amounts that deducted from Tier 1 capital, predominately goodwill and intangible assets. Tier 1 leverage ratio is a regulatory capital measure calculated based on Tier 1 capital divided by adjusted average assets.
|
|
106
|
Capital One Financial Corporation (COF)
|
|
|
(10)
|
Supplementary leverage ratio is a regulatory capital measure calculated based on Tier 1 capital divided by total leverage exposure. See “MD&A—Capital Management” for additional information.
|
|
(11)
|
As of January 1, 2015, risk-weighted assets are calculated under the Basel III Standardized Approach, subject to transition provisions. Prior to January 1, 2015 risk-weighted assets were calculated under Basel I. Includes credit and market risk weighted assets starting in 2016.
|
|
(12)
|
Amounts presented are net of tax.
|
|
(13)
|
Amounts based on transition provisions for regulatory capital deductions and adjustments of 20% for 2014, 40% for 2015, 60% for 2016 and
80%
for 2017.
|
|
107
|
Capital One Financial Corporation (COF)
|
|
Table G—Selected Quarterly Financial Information
|
(Dollars in millions, except per share data and as noted) (unaudited)
|
2017
|
2016
|
||||||||||||||||||||||||||||||
|
Q4
|
Q3
|
Q2
|
Q1
|
Q4
|
Q3
|
Q2
|
Q1
|
|||||||||||||||||||||||||
|
Summarized results of operations:
|
||||||||||||||||||||||||||||||||
|
Interest income
|
$
|
6,604
|
|
$
|
6,420
|
|
$
|
6,128
|
|
$
|
6,070
|
|
$
|
6,009
|
|
$
|
5,794
|
|
$
|
5,571
|
|
$
|
5,517
|
|
||||||||
|
Interest expense
|
791
|
|
720
|
|
655
|
|
596
|
|
562
|
|
517
|
|
478
|
|
461
|
|
||||||||||||||||
|
Net interest income
|
5,813
|
|
5,700
|
|
5,473
|
|
5,474
|
|
5,447
|
|
5,277
|
|
5,093
|
|
5,056
|
|
||||||||||||||||
|
Provision for credit losses
|
1,926
|
|
1,833
|
|
1,800
|
|
1,992
|
|
1,752
|
|
1,588
|
|
1,592
|
|
1,527
|
|
||||||||||||||||
|
Net interest income after provision for credit losses
|
3,887
|
|
3,867
|
|
3,673
|
|
3,482
|
|
3,695
|
|
3,689
|
|
3,501
|
|
3,529
|
|
||||||||||||||||
|
Non-interest income
|
1,200
|
|
1,285
|
|
1,231
|
|
1,061
|
|
1,119
|
|
1,184
|
|
1,161
|
|
1,164
|
|
||||||||||||||||
|
Non-interest expense
|
3,779
|
|
3,567
|
|
3,414
|
|
3,434
|
|
3,679
|
|
3,361
|
|
3,295
|
|
3,223
|
|
||||||||||||||||
|
Income from continuing operations before income taxes
|
1,308
|
|
1,585
|
|
1,490
|
|
1,109
|
|
1,135
|
|
1,512
|
|
1,367
|
|
1,470
|
|
||||||||||||||||
|
Income tax provision
|
2,170
|
|
448
|
|
443
|
|
314
|
|
342
|
|
496
|
|
424
|
|
452
|
|
||||||||||||||||
|
Income (loss) from continuing operations, net of tax
|
(862
|
)
|
1,137
|
|
1,047
|
|
795
|
|
793
|
|
1,016
|
|
943
|
|
1,018
|
|
||||||||||||||||
|
Income (loss) from discontinued operations, net of tax
|
(109
|
)
|
(30
|
)
|
(11
|
)
|
15
|
|
(2
|
)
|
(11
|
)
|
(1
|
)
|
(5
|
)
|
||||||||||||||||
|
Net income (loss)
|
(971
|
)
|
1,107
|
|
1,036
|
|
810
|
|
791
|
|
1,005
|
|
942
|
|
1,013
|
|
||||||||||||||||
|
Dividends and undistributed earnings allocated to participating securities
(1)
|
(1
|
)
|
(8
|
)
|
(8
|
)
|
(5
|
)
|
(6
|
)
|
(6
|
)
|
(6
|
)
|
(6
|
)
|
||||||||||||||||
|
Preferred stock dividends
|
(80
|
)
|
(52
|
)
|
(80
|
)
|
(53
|
)
|
(75
|
)
|
(37
|
)
|
(65
|
)
|
(37
|
)
|
||||||||||||||||
|
Net income (loss) available to common stockholders
|
$
|
(1,052
|
)
|
$
|
1,047
|
|
$
|
948
|
|
$
|
752
|
|
$
|
710
|
|
$
|
962
|
|
$
|
871
|
|
$
|
970
|
|
||||||||
|
Common share statistics:
|
||||||||||||||||||||||||||||||||
|
Basic earnings per common share:
(1)
|
||||||||||||||||||||||||||||||||
|
Net income (loss) from continuing operations
|
$
|
(1.95
|
)
|
$
|
2.22
|
|
$
|
1.98
|
|
$
|
1.53
|
|
$
|
1.47
|
|
$
|
1.94
|
|
$
|
1.70
|
|
$
|
1.86
|
|
||||||||
|
Income (loss) from discontinued operations
|
(0.22
|
)
|
(0.06
|
)
|
(0.02
|
)
|
0.03
|
|
0.00
|
|
(0.02
|
)
|
0.00
|
|
(0.01
|
)
|
||||||||||||||||
|
Net income (loss) per basic common share
|
$
|
(2.17
|
)
|
$
|
2.16
|
|
$
|
1.96
|
|
$
|
1.56
|
|
$
|
1.47
|
|
$
|
1.92
|
|
$
|
1.70
|
|
$
|
1.85
|
|
||||||||
|
Diluted earnings per common share:
(1)
|
||||||||||||||||||||||||||||||||
|
Net income (loss) from continuing operations
|
$
|
(1.95
|
)
|
$
|
2.20
|
|
$
|
1.96
|
|
$
|
1.51
|
|
$
|
1.45
|
|
$
|
1.92
|
|
$
|
1.69
|
|
$
|
1.85
|
|
||||||||
|
Income (loss) from discontinued operations
|
(0.22
|
)
|
(0.06
|
)
|
(0.02
|
)
|
0.03
|
|
0.00
|
|
(0.02
|
)
|
0.00
|
|
(0.01
|
)
|
||||||||||||||||
|
Net income (loss) per diluted common share
|
$
|
(2.17
|
)
|
$
|
2.14
|
|
$
|
1.94
|
|
$
|
1.54
|
|
$
|
1.45
|
|
$
|
1.90
|
|
$
|
1.69
|
|
$
|
1.84
|
|
||||||||
|
Weighted-average common shares outstanding
(in millions):
|
||||||||||||||||||||||||||||||||
|
Basic common shares
|
485.7
|
|
484.9
|
|
484.0
|
|
482.3
|
|
483.5
|
|
501.1
|
|
511.7
|
|
523.5
|
|
||||||||||||||||
|
Diluted common shares
|
485.7
|
|
489.0
|
|
488.1
|
|
487.9
|
|
489.2
|
|
505.9
|
|
516.5
|
|
528.0
|
|
||||||||||||||||
|
Balance sheet (average balances):
|
||||||||||||||||||||||||||||||||
|
Loans held for investment
|
$
|
252,566
|
|
$
|
245,822
|
|
$
|
242,241
|
|
$
|
241,505
|
|
$
|
240,027
|
|
$
|
235,843
|
|
$
|
230,379
|
|
$
|
226,736
|
|
||||||||
|
Interest-earning assets
|
330,742
|
|
322,015
|
|
318,078
|
|
318,358
|
|
317,853
|
|
310,987
|
|
302,764
|
|
299,456
|
|
||||||||||||||||
|
Total assets
|
363,045
|
|
355,191
|
|
349,891
|
|
351,641
|
|
350,225
|
|
343,153
|
|
334,479
|
|
331,919
|
|
||||||||||||||||
|
Interest-bearing deposits
|
215,258
|
|
213,137
|
|
214,412
|
|
212,973
|
|
206,464
|
|
196,913
|
|
195,641
|
|
194,125
|
|
||||||||||||||||
|
Total deposits
|
241,562
|
|
238,843
|
|
240,550
|
|
238,550
|
|
232,204
|
|
222,251
|
|
221,146
|
|
219,180
|
|
||||||||||||||||
|
Borrowings
|
58,109
|
|
54,271
|
|
48,838
|
|
53,357
|
|
58,624
|
|
60,708
|
|
54,359
|
|
53,761
|
|
||||||||||||||||
|
Common equity
|
46,350
|
|
45,816
|
|
44,645
|
|
43,833
|
|
43,921
|
|
45,314
|
|
45,640
|
|
45,782
|
|
||||||||||||||||
|
Total stockholders’ equity
|
50,710
|
|
50,176
|
|
49,005
|
|
48,193
|
|
47,972
|
|
49,033
|
|
48,934
|
|
49,078
|
|
||||||||||||||||
|
(1)
|
Dividends and undistributed earnings allocated to participating securities and earnings per share are computed independently for each period. Accordingly, the sum of each quarterly amount may not agree to the year-to-date total.
|
|
108
|
Capital One Financial Corporation (COF)
|
|
|
Glossary and Acronyms
|
2016 Stock Repurchase Program:
On June 29, 2016, we announced that our Board of Directors had authorized the repurchase of up to $2.5 billion of shares of our common stock from the third quarter of 2016 through the end of the second quarter of 2017.
2017 Stock Repurchase Program:
On June 28, 2017, we announced that our Board of Directors had authorized the repurchase of up to $1.85 billion of shares of our common stock from the third quarter of 2017 through the end of the second quarter of 2018. In December 2017,
the Board of Directors reduced the authorized repurchases of our common stock to up to $1.0 billion for the remaining 2017 CCAR period, which ends June 30, 2018
. Any common stock repurchases for the remainder of the 2017 Stock Repurchase Program are subject to the Federal Reserve not objecting to our revised capital plan for the 2017 CCAR process submitted on December 24, 2017.
Annual Report:
References to our “2017 Form 10-K” or “2017 Annual Report” are to our Annual Report on Form 10-K for the fiscal year ended December 31, 2017.
Banks:
Refers to COBNA and CONA.
Basel Committee:
The Basel Committee on Banking Supervision.
Basel III Advanced Approaches:
The Basel III Advanced Approaches is mandatory for those institutions with consolidated total assets of $250 billion or more or consolidated total on-balance sheet foreign exposure of $10 billion or more. The Basel III Capital Rule modified the Advanced Approaches version of Basel II to create the Basel III Advanced Approaches.
Basel III Capital Rule:
The Federal Baking Agencies issued a rule in July 2013 implementing the Basel III capital framework developed by the Basel Committee as well as certain Dodd-Frank Act and other capital provisions.
Basel III Standardized Approach:
The Basel III Capital Rule modified Basel I to create the Basel III Standardized Approach, which requires for Basel III Advanced Approaches banking organizations that have yet to exit parallel run to use the Basel III Standardized Approach to calculate regulatory capital, including capital ratios, subject to transition provisions.
Cabela’s acquisition:
On September 25, 2017, we completed the acquisition from Synovus Bank of credit card assets and related liabilities of World’s Foremost Bank, a wholly-owned subsidiary of Cabela’s Incorporated.
Capital One:
Capital One Financial Corporation and its subsidiaries.
Carrying value
(with respect to loans)
:
The amount at which a loan is recorded on the consolidated balance sheets. For loans recorded at amortized cost, carrying value is the unpaid principal balance net of unamortized deferred loan origination fees and costs, and unamortized purchase premium or discount. For loans that are or have been on nonaccrual status, the carrying value is also reduced by any net charge-offs that have been recorded and the amount of interest payments applied as a reduction of principal under the cost recovery method. For credit card loans, the carrying value also includes interest that has been billed to the customer. For loans classified as held for sale, carrying value is the lower of carrying value as described in the sentences above, or fair value. For PCI loans, carrying value represents the present value of all expected cash flows including interest that has not yet been accrued, discounted at the effective interest rate, including any valuation allowance for impaired loans.
CECL:
In June 2016, the FASB issued revised guidance for impairments on financial instruments. The guidance, which becomes effective on January 1, 2020 with early adoption permitted no earlier than January 1, 2019, requires use of a current expected credit loss (“CECL”) model that is based on expected rather than incurred losses, with an anticipated result of more timely loss recognition.
COBNA:
Capital One Bank (USA), National Association, one of our fully owned subsidiaries, which offers credit and debit card products, other lending products and deposit products.
Common equity Tier 1 capital:
Calculated as the sum of common equity, related surplus and retained earnings, and accumulated other comprehensive income net of applicable phase-ins, less goodwill and intangibles net of associated deferred tax liabilities and applicable phase-ins, less other deductions, as defined by regulators.
Company:
Capital One Financial Corporation and its subsidiaries.
CONA:
Capital One, National Association, one of our fully owned subsidiaries, which offers a broad spectrum of banking products and financial services to consumers, small businesses and commercial clients.
Credit risk:
The risk of loss from an obligor’s failure to meet the terms of any contract or otherwise fail to perform as agreed.
|
109
|
Capital One Financial Corporation (COF)
|
|
Derivative:
A contract or agreement whose value is derived from changes in interest rates, foreign exchange rates, prices of securities or commodities, credit worthiness for credit default swaps or financial or commodity indices.
Discontinued operations:
The operating results of a component of an entity, as defined by Accounting Standards Codification (“ASC”) 205, that are removed from continuing operations when that component has been disposed of or it is management’s intention to sell the component.
Dodd-Frank Wall Street Reform and Consumer Protection Act (“Dodd-Frank Act”):
Regulatory reform legislation signed into law on July 21, 2010. This law broadly affects the financial services industry and contains numerous provisions aimed at strengthening the sound operation of the financial services sector.
Exchange Act:
The Securities Exchange Act of 1934.
eXtensible Business Reporting Language (“XBRL”):
A language for the electronic communication of business and financial data.
Federal Banking Agencies:
The Federal Reserve, Office of the Comptroller of the Currency and Federal Deposit Insurance Corporation.
Federal Reserve:
The Board of Governors of the Federal Reserve System.
FICO score:
A measure of consumer credit risk provided by credit bureaus, typically produced from statistical modeling software created by FICO (formerly known as “Fair Isaac Corporation”) utilizing data collected by the credit bureaus.
Final LCR Rule:
In September 2014, the Federal Banking Agencies issued final rules implementing the Basel III Liquidity Coverage Ratio in the United States. The LCR is calculated by dividing the amount of an institution’s high quality, unencumbered liquid assets by its estimated net cash outflow, as defined and calculated in accordance with Final LCR Rule.
Foreign currency derivative contracts:
An agreement to exchange contractual amounts of one currency for another currency at one or more future dates.
Foreign exchange contracts:
Contracts that provide for the future receipt or delivery of foreign currency at previously agreed-upon terms.
GreenPoint:
Refers to our wholesale mortgage banking unit, GreenPoint Mortgage Funding, Inc., which was closed in 2007.
GSE
or
Agency:
A government-sponsored enterprise or agency is a financial services corporation created by the United States Congress. Examples of U.S. government agencies include Federal National Mortgage Association (“Fannie Mae”), Federal Home Loan Mortgage Corporation (“Freddie Mac”), Government National Mortgage Association (“Ginnie Mae”) and the Federal Home Loan Banks (“FHLB”).
HFS acquisition:
On December 1, 2015, we acquired the Healthcare Financial Services business of General Electric Capital Corporation, which provides financing to companies in various healthcare sectors, including hospitals, senior housing, medical offices, pharmaceuticals, medical devices and healthcare technology.
Impaired loans:
A loan is considered impaired when, based on current information and events, it is probable that we will not be able to collect all amounts due from the borrower in accordance with the original contractual terms of the loan.
Interest rate sensitivity:
The exposure to interest rate movements.
Interest rate swaps:
Contracts in which a series of interest rate flows in a single currency are exchanged over a prescribed period. Interest rate swaps are the most common type of derivative contract that we use in our asset/liability management activities.
Investment grade:
Represents Moody’s long-term rating of Baa3 or better; and/or a Standard & Poor’s or DBRS long-term rating of BBB- or better; or if unrated, an equivalent rating using our internal risk ratings. Instruments that fall below these levels are considered to be non-investment grade.
Investor entities:
Entities that invest in community development entities (“CDE”) that provide debt financing to businesses and non-profit entities in low-income and rural communities.
Leverage ratio:
Tier 1 capital divided by average assets after certain adjustments, as defined by the regulators.
Liquidity risk:
The risk that the Company will not be able to meet its future financial obligations as they come due, or invest in future asset growth because of an inability to obtain funds at a reasonable price within a reasonable time period.
|
110
|
Capital One Financial Corporation (COF)
|
|
Loan-to-value (“LTV”) ratio:
The relationship expressed as a percentage, between the principal amount of a loan and the appraised value of the collateral (i.e., residential real estate, autos, etc.) securing the loan.
Managed presentation:
A non-GAAP presentation of financial results that includes reclassifications to present revenue on a fully taxable-equivalent basis. Management uses this non-GAAP financial measure at the segment level, because it believes this provides information to enable investors to understand the underlying operational performance and trends of the particular business segment and facilitates a comparison of the business segment with the performance of competitors.
Market risk:
The risk that an institution’s earnings or the economic value of equity could be adversely impacted by changes in interest rates, foreign exchange rates or other market factors.
Master netting agreement:
An agreement between two counterparties that have multiple contracts with each other that provides for the net settlement of all contracts through a single payment in the event of default or termination of any one contract.
Mortgage-backed security (“MBS”):
An asset-backed security whose cash flows are backed by the principal and interest payments of a set of mortgage loans.
Mortgage servicing rights (“MSR”):
The right to service a mortgage loan when the underlying loan is sold or securitized. Servicing includes collections for principal, interest and escrow payments from borrowers and accounting for and remitting principal and interest payments to investors.
Net interest margin:
The result of dividing net interest income by average interest-earning assets.
Nonperforming loans:
Loans that have been placed on nonaccrual status.
North Fork:
North Fork Bancorporation, Inc., which was acquired by the Company in 2006.
Option-ARM loans:
The option-ARM real estate loan product is an adjustable-rate mortgage loan that initially provides the borrower with the monthly option to make a fully-amortizing, interest-only or minimum fixed payment. After the initial payment option period, usually five years, the recalculated minimum payment represents a fully-amortizing principal and interest payment that would effectively repay the loan by the end of its contractual term.
Other-than-temporary impairment (“OTTI”):
An impairment charge taken on a security whose fair value has fallen below the carrying value on the balance sheet and whose value is not expected to recover through the holding period of the security.
Purchased credit-impaired (“PCI”) loans:
Loans acquired in a business combination that were recorded at fair value at acquisition and subsequently accounted for based on cash flows expected to be collected in accordance with ASC 310-30,
Loans and Debt Securities Acquired with Deteriorated Credit Quality
.
Public Fund deposits:
Deposits that are derived from a variety of political subdivisions such as school districts and municipalities.
Purchase volume:
Includes purchase transactions, net of returns, for the period for loans both classified as held for investment and held for sale. Excludes cash advance and balance transfer transactions.
Rating agency:
An independent agency that assesses the credit quality and likelihood of default of an issue or issuer and assigns a rating to that issue or issuer.
Recorded investment:
The amount of the investment in a loan which includes any direct write-down of the investment.
Repurchase agreement:
An instrument used to raise short-term funds whereby securities are sold with an agreement for the seller to buy back the securities at a later date.
Restructuring charges:
Charges associated with the realignment of resources supporting various businesses, primarily consisting of severance and related benefits pursuant to our ongoing benefit programs and impairment of certain assets related to business locations and activities being exited.
Return on average assets:
Calculated based on income from continuing operations, net of tax, for the period divided by average total assets for the period.
Return on average common equity:
Calculated based on the sum of (i) income from continuing operations, net of tax; (ii) less dividends and undistributed earnings allocated to participating securities; (iii) less preferred stock dividends, for the period, divided by average common equity. Our calculation of return on average common equity may not be comparable to similarly-titled measures reported by other companies.
|
111
|
Capital One Financial Corporation (COF)
|
|
Return on average tangible common equity:
A non-GAAP financial measure calculated based on the sum of (i) income from continuing operations, net of tax; (ii) less dividends and undistributed earnings allocated to participating securities; and (iii) less preferred stock dividends, for the period, divided by average tangible common equity. Our calculation of return on average tangible common equity may not be comparable to similarly-titled measures reported by other companies.
Risk-weighted assets:
Consist of on- and off-balance sheet assets that are assigned to one of several broad risk categories and weighted by factors representing their risk and potential for default.
Securitized debt obligations:
A type of asset-backed security and structured credit product constructed from a portfolio of fixed-income assets.
Subprime:
For purposes of lending in our Credit Card business, we generally consider FICO scores of 660 or below, or other equivalent risk scores, to be subprime. For purposes of auto lending in our Consumer Banking business, we generally consider FICO scores of 620 or below to be subprime.
Tax Act:
The Act to provide for reconciliation pursuant to titles II and V of the concurrent resolution on the budget for fiscal year 2018 enacted on December 22, 2017.
Tangible common equity (“TCE”):
A non-GAAP financial measure. Common equity less goodwill and intangible assets adjusted for deferred tax liabilities associated with non-tax deductible intangible assets and tax deductible goodwill.
Troubled debt restructuring (“TDR”):
A TDR is deemed to occur when the Company modifies the contractual terms of a loan agreement by granting a concession to a borrower that is experiencing financial difficulty.
U.K. PPI Reserve:
U.K. payment protection insurance customer refund reserve.
U.S. GAAP:
Accounting principles generally accepted in the United States of America. Accounting rules and conventions defining acceptable practices in preparing financial statements in the U.S.
Unfunded commitments:
Legally binding agreements to provide a defined level of financing until a specified future date.
Variable interest entity (“VIE”):
An entity that (i) lacks enough equity investment at risk to permit the entity to finance its activities without additional financial support from other parties; (ii) has equity owners that lack the right to make significant decisions affecting the entity’s operations; and/or (iii) has equity owners that do not have an obligation to absorb or the right to receive the entity’s losses or return.
|
112
|
Capital One Financial Corporation (COF)
|
|
|
Acronyms
|
ABS:
Asset-backed security
AFS:
Available for sale
AML:
Anti-money laundering
AOCI:
Accumulated other comprehensive income
ARM:
Adjustable rate mortgage
ASC:
Accounting Standards Codification
BHC:
Bank holding company
bps:
Basis points
CAD:
Canadian dollar
CCAR:
Comprehensive Capital Analysis and Review
CCP
: Central Counterparty Clearinghouse, or Central Clearinghouse
CDE:
Community development entities
CECL:
Current expected credit loss
CEO:
Chief Executive Officer
CFPB
:
Consumer Financial Protection Bureau
CFTC:
Commodity Futures Trading Commission
CIFG:
CIFG Assurance North America, Inc. (“U.S. Bank Litigation”)
CMBS:
Commercial mortgage-backed securities
CME:
Chicago Mercantile Exchange
COEP:
Capital One (Europe) plc
COF:
Capital One Financial Corporation
COSO:
Committee of Sponsoring Organizations of the Treadway Commission
CRA:
Community Reinvestment Act
CVA:
Credit valuation adjustment
DCF:
Discounted cash flow
DCM:
Designated contract market
DDOS:
Distributed denial of service
DIF:
Deposit insurance fund
DRR:
Designated reserve ratio
DUS:
Delegated Underwriting and Servicing
DVA:
Debit valuation adjustment
EU:
European Union
Fannie Mae:
Federal National Mortgage Association
FASB:
Financial Accounting Standards Board
FCA:
Financial Conduct Authority
FCM:
Futures commission merchant
FDIC:
Federal Deposit Insurance Corporation
FDICIA:
The Federal Deposit Insurance Corporation Improvement Act of 1991
FFIEC:
Federal Financial Institutions Examination Council
FHFA:
Federal Housing Finance Agency
FHLB:
Federal Home Loan Banks
FIS:
Fidelity Information Services
FIRREA:
Financial Institutions Reform, Recovery and Enforcement Act
|
113
|
Capital One Financial Corporation (COF)
|
|
Fitch:
Fitch Ratings
FOS:
Financial Ombudsman Service
Freddie Mac:
Federal Home Loan Mortgage Corporation
FVC:
Fair Value Committee
GBP:
Great British pound
GDP:
Gross domestic product
GDPR:
General Data Protection Regulation
Ginnie Mae:
Government National Mortgage Association
GSE
or
Agency:
Government-sponsored enterprise
HELOCs:
Home equity lines of credit
HFI:
Held for investment
HFS:
Healthcare Financial Services
LCR:
Liquidity coverage ratio
LIBOR:
London Interbank Offered Rate
MMDA:
Money market deposit accounts
Moody’s:
Moody’s Investors Service
MSR:
Mortgage servicing rights
NOW:
Negotiable order of withdrawal
NSFR
: Net stable funding ratio
NYSE:
New York Stock Exchange
OCC:
Office of the Comptroller of the Currency
OTC:
Over-the-counter
PCA:
Prompt corrective action
PCI:
Purchased credit-impaired
PCCR:
Purchased credit card relationship
PPI:
Payment protection insurance
PRA:
Prudential Regulatory Authority
PSA:
Performance share award
PSU:
Performance share unit
REO:
Real estate owned
RMBS:
Residential mortgage-backed securities
RSA:
Restricted stock award
RSU:
Restricted stock unit
S&P:
Standard & Poor’s
SEC:
U.S. Securities and Exchange Commission
SEF:
Swap execution facility
TARP:
Troubled Asset Relief Program
TCE:
Tangible common equity
TDR:
Troubled debt restructuring
TILA:
Truth in Lending Act
TSYS:
Total Systems Services, Inc.
U.K.:
United Kingdom
U.S.:
United States of America
VAC:
Valuations Advisory Committee
|
114
|
Capital One Financial Corporation (COF)
|
|
Item 7A.
Quantitative and Qualitative Disclosures about Market Risk
For a discussion of the quantitative and qualitative disclosures about market risk, see “MD&A—
Risk Management
—Market Risk Management” and “MD&A—
Market Risk Profile
.”
|
Item 8. Financial Statements and Supplementary Data
|
|
|
Page
|
|
|
Note 2—
Business Developments and Discontinued Operations
|
|
|
115
|
Capital One Financial Corporation (COF)
|
|
MANAGEMENT’S REPORT ON INTERNAL CONTROL OVER FINANCIAL REPORTING
The management of Capital One Financial Corporation (the “Company” or “Capital One”) is responsible for establishing and maintaining adequate internal control over financial reporting and for the assessment of the effectiveness of internal control over financial reporting. Internal control over financial reporting is a process designed by, or under the supervision of, the Company’s principal executive and principal financial officers, or persons performing similar functions, and effected by the Company’s Board of Directors, management and other personnel, to provide reasonable assurance regarding the reliability of financial reporting and the preparation of financial statements for external reporting purposes in accordance with U.S. generally accepted accounting principles.
Capital One’s internal control over financial reporting includes those policies and procedures that (i) pertain to the maintenance of records that, in reasonable detail, accurately and fairly reflect the transactions and dispositions of the Company’s assets; (ii) provide reasonable assurance that transactions are recorded as necessary to permit preparation of financial statements in accordance with generally accepted accounting principles, and that the Company’s receipts and expenditures are being made only in accordance with authorizations of the Company’s management and directors; and (iii) provide reasonable assurance regarding prevention or timely detection of unauthorized acquisition, use or disposition of the Company’s assets that could have a material effect on its financial statements.
Because of its inherent limitations, internal control over financial reporting may not prevent or detect misstatements. Also, projections of any evaluation of effectiveness to future periods are subject to the risk that controls may become inadequate because of changes in conditions, or that the degree of compliance with the policies or procedures may deteriorate.
Management conducted an assessment of the effectiveness of the Company’s internal control over financial reporting as of
December 31, 2017
, based on the framework in “2013 Internal Control—Integrated Framework” issued by the Committee of Sponsoring Organizations of the Treadway Commission (“COSO”), commonly referred to as the “2013 Framework.”
Based on this assessment, management concluded that, as of
December 31, 2017
, the Company’s internal control over financial reporting was effective based on the criteria established by COSO in the 2013 Framework. Additionally, based upon management’s assessment, the Company determined that there were no material weaknesses in its internal control over financial reporting as of
December 31, 2017
.
The effectiveness of the Company’s internal control over financial reporting as of
December 31, 2017
, has been audited by Ernst & Young LLP, an independent registered public accounting firm, as stated in their accompanying report, which expresses an unqualified opinion on the effectiveness of the Company’s internal control over financial reporting as of
December 31, 2017
.
|
/s/ RICHARD D. FAIRBANK
|
|
Richard D. Fairbank
|
|
Chair, Chief Executive Officer and President
|
|
/s/ R. SCOTT BLACKLEY
|
|
R. Scott Blackley
|
|
Chief Financial Officer
|
|
February 21, 2018
|
|
116
|
Capital One Financial Corporation (COF)
|
|
REPORT OF INDEPENDENT REGISTERED PUBLIC ACCOUNTING FIRM
ON INTERNAL CONTROL OVER FINANCIAL REPORTING
To the Shareholders and the Board of Directors of Capital One Financial Corporation:
Opinion on Internal Control over Financial Reporting
We have audited Capital One Financial Corporation’s internal control over financial reporting as of December 31, 2017, based on criteria established in Internal Control—Integrated Framework issued by the Committee of Sponsoring Organizations of the Treadway Commission (2013 framework)
(the COSO criteria). In our opinion, Capital One Financial Corporation (the “Company”) maintained, in all material respects, effective internal control over financial reporting as of December 31, 2017, based on
the COSO criteria
.
We also have audited, in accordance with the standards of the Public Company Accounting Oversight Board (United States) (PCAOB), the consolidated balance sheets of Capital One Financial Corporation
as of December 31, 2017 and 2016, and the related consolidated statements of income, comprehensive income, changes in stockholders’ equity and cash flows for each of the three years in the period ended December 31, 2017, and the related notes, of the Company and our report dated February 21, 2018 expressed an unqualified opinion thereon.
Basis for Opinion
The Company’s management is responsible for maintaining effective internal control over financial reporting and for its assessment of the effectiveness of internal control over financial reporting included in the accompanying Management’s Report on Internal Control Over Financial Reporting. Our responsibility is to express an opinion on the Company’s internal control over financial reporting based on our audit. We are a public accounting firm registered with the PCAOB and are required to be independent with respect to the Company in accordance with the U.S. federal securities laws and the applicable rules and regulations of the Securities and Exchange Commission and the PCAOB.
We conducted our audit in accordance with the standards of the PCAOB. Those standards require that we plan and perform the audit to obtain reasonable assurance about whether effective internal control over financial reporting was maintained in all material respects.
Our audit included obtaining an understanding of internal control over financial reporting, assessing the risk that a material weakness exists, testing and evaluating the design and operating effectiveness of internal control based on the assessed risk, and performing such other procedures as we considered necessary in the circumstances. We believe that our audit provides a reasonable basis for our opinion.
Definition and Limitations of Internal Control Over Financial Reporting
A company’s internal control over financial reporting is a process designed to provide reasonable assurance regarding the reliability of financial reporting and the preparation of financial statements for external purposes in accordance with generally accepted accounting principles. A company’s internal control over financial reporting includes those policies and procedures that (1) pertain to the maintenance of records that, in reasonable detail, accurately and fairly reflect the transactions and dispositions of the assets of the company; (2) provide reasonable assurance that transactions are recorded as necessary to permit preparation of financial statements in accordance with generally accepted accounting principles, and that receipts and expenditures of the company are being made only in accordance with authorizations of management and directors of the company; and (3) provide reasonable assurance regarding prevention or timely detection of unauthorized acquisition, use, or disposition of the company’s assets that could have a material effect on the financial statements.
Because of its inherent limitations, internal control over financial reporting may not prevent or detect misstatements. Also, projections of any evaluation of effectiveness to future periods are subject to the risk that controls may become inadequate because of changes in conditions, or that the degree of compliance with the policies or procedures may deteriorate.
|
/s/ Ernst & Young LLP
|
|
Tysons, Virginia
|
|
February 21, 2018
|
|
117
|
Capital One Financial Corporation (COF)
|
|
REPORT OF INDEPENDENT REGISTERED PUBLIC ACCOUNTING FIRM
ON THE CONSOLIDATED FINANCIAL STATEMENTS
To the Shareholders and the Board of Directors of Capital One Financial Corporation:
Opinion on the Financial Statements
We have audited the accompanying consolidated balance sheets of Capital One Financial Corporation (the “Company”) as of December 31, 2017 and 2016, and the related consolidated statements of income, comprehensive income, changes in stockholders’ equity and cash flows for each of the three years in the period ended December 31, 2017, and the related notes (collectively referred to as the “financial statements”). In our opinion, the financial statements present fairly, in all material respects, the consolidated financial position of the Company at December 31, 2017 and 2016, and the consolidated results of its operations and its cash flows for each of the three years in the period ended December 31, 2017, in conformity with U.S. generally accepted accounting principles.
We also have audited, in accordance with the standards of the Public Company Accounting Oversight Board (United States) (PCAOB), the Company’s internal control over financial reporting as of December 31, 2017, based on criteria established in Internal Control-Integrated Framework issued by the Committee of Sponsoring Organizations of the Treadway Commission (2013 framework) and our report dated February 21, 2018 expressed an unqualified opinion thereon.
Basis for Opinion
These financial statements are the responsibility of the Company’s management. Our responsibility is to express an opinion on the Company’s financial statements based on our audits. We are a public accounting firm registered with the PCAOB and are required to be independent with respect to the Company in accordance with the U.S. federal securities laws and the applicable rules and regulations of the Securities and Exchange Commission and the PCAOB.
We conducted our audits in accordance with the standards of the PCAOB. Those standards require that we plan and perform the audit to obtain reasonable assurance about whether the financial statements are free of material misstatement, whether due to error or fraud. Our audits included performing procedures to assess the risks of material misstatement of the financial statements, whether due to error or fraud, and performing procedures that respond to those risks. Such procedures included examining, on a test basis, evidence regarding the amounts and disclosures in the financial statements. Our audits also included evaluating the accounting principles used and significant estimates made by management, as well as evaluating the overall presentation of the financial statements. We believe that our audits provide a reasonable basis for our opinion.
|
/s/ Ernst & Young LLP
|
|
We have served as the Company’s auditor since 1994.
|
|
Tysons, Virginia
|
|
February 21, 2018
|
|
118
|
Capital One Financial Corporation (COF)
|
|
|
Year Ended December 31,
|
||||||||||||
|
(Dollars in millions, except per share-related data)
|
2017
|
2016
|
2015
|
|||||||||
|
Interest income:
|
||||||||||||
|
Loans, including loans held for sale
|
$
|
23,388
|
|
$
|
21,203
|
|
$
|
18,785
|
|
|||
|
Investment securities
|
1,711
|
|
1,599
|
|
1,575
|
|
||||||
|
Other
|
123
|
|
89
|
|
99
|
|
||||||
|
Total
interest
income
|
25,222
|
|
22,891
|
|
20,459
|
|
||||||
|
Interest expense:
|
||||||||||||
|
Deposits
|
1,602
|
|
1,213
|
|
1,091
|
|
||||||
|
Securitized debt obligations
|
327
|
|
216
|
|
151
|
|
||||||
|
Senior and subordinated notes
|
731
|
|
476
|
|
330
|
|
||||||
|
Other borrowings
|
102
|
|
113
|
|
53
|
|
||||||
|
Total interest expense
|
2,762
|
|
2,018
|
|
1,625
|
|
||||||
|
Net interest income
|
22,460
|
|
20,873
|
|
18,834
|
|
||||||
|
Provision for credit losses
|
7,551
|
|
6,459
|
|
4,536
|
|
||||||
|
Net interest income after provision for credit losses
|
14,909
|
|
14,414
|
|
14,298
|
|
||||||
|
Non-interest income:
|
||||||||||||
|
Interchange fees, net
|
2,573
|
|
2,452
|
|
2,264
|
|
||||||
|
Service charges and other customer-related fees
|
1,597
|
|
1,646
|
|
1,856
|
|
||||||
|
Net securities gains (losses)
|
65
|
|
(11
|
)
|
(32
|
)
|
||||||
|
Other
|
542
|
|
541
|
|
491
|
|
||||||
|
Total non-interest income
|
4,777
|
|
4,628
|
|
4,579
|
|
||||||
|
Non-interest expense:
|
||||||||||||
|
Salaries and associate benefits
|
5,899
|
|
5,202
|
|
4,975
|
|
||||||
|
Occupancy and equipment
|
1,939
|
|
1,944
|
|
1,829
|
|
||||||
|
Marketing
|
1,670
|
|
1,811
|
|
1,744
|
|
||||||
|
Professional services
|
1,097
|
|
1,075
|
|
1,120
|
|
||||||
|
Communications and data processing
|
1,177
|
|
1,169
|
|
1,055
|
|
||||||
|
Amortization of intangibles
|
245
|
|
386
|
|
430
|
|
||||||
|
Other
|
2,167
|
|
1,971
|
|
1,843
|
|
||||||
|
Total non-interest expense
|
14,194
|
|
13,558
|
|
12,996
|
|
||||||
|
Income from continuing operations before income taxes
|
5,492
|
|
5,484
|
|
5,881
|
|
||||||
|
Income tax provision
|
3,375
|
|
1,714
|
|
1,869
|
|
||||||
|
Income from continuing operations, net of tax
|
2,117
|
|
3,770
|
|
4,012
|
|
||||||
|
Income (loss) from discontinued operations, net of tax
|
(135
|
)
|
(19
|
)
|
38
|
|
||||||
|
Net income
|
1,982
|
|
3,751
|
|
4,050
|
|
||||||
|
Dividends and undistributed earnings allocated to participating securities
|
(13
|
)
|
(24
|
)
|
(20
|
)
|
||||||
|
Preferred stock dividends
|
(265
|
)
|
(214
|
)
|
(158
|
)
|
||||||
|
Net income available to common stockholders
|
$
|
1,704
|
|
$
|
3,513
|
|
$
|
3,872
|
|
|||
|
Basic earnings per common share:
|
||||||||||||
|
Net income from continuing operations
|
$
|
3.80
|
|
$
|
7.00
|
|
$
|
7.08
|
|
|||
|
Income (loss) from discontinued operations
|
(0.28
|
)
|
(0.04
|
)
|
0.07
|
|
||||||
|
Net income per basic common share
|
$
|
3.52
|
|
$
|
6.96
|
|
$
|
7.15
|
|
|||
|
Diluted earnings per common share:
|
||||||||||||
|
Net income from continuing operations
|
$
|
3.76
|
|
$
|
6.93
|
|
$
|
7.00
|
|
|||
|
Income (loss) from discontinued operations
|
(0.27
|
)
|
(0.04
|
)
|
0.07
|
|
||||||
|
Net income per diluted common share
|
$
|
3.49
|
|
$
|
6.89
|
|
$
|
7.07
|
|
|||
|
Dividends declared per common share
|
$
|
1.60
|
|
$
|
1.60
|
|
$
|
1.50
|
|
|||
|
See Notes to Consolidated Financial Statements.
|
||
|
119
|
Capital One Financial Corporation (COF)
|
|
|
|
Year Ended December 31,
|
|||||||||||
|
(Dollars in millions)
|
2017
|
2016
|
2015
|
|||||||||
|
Net income
|
$
|
1,982
|
|
$
|
3,751
|
|
$
|
4,050
|
|
|||
|
Other comprehensive income (loss), net of tax:
|
||||||||||||
|
Net unrealized gains (losses) on securities available for sale
|
21
|
|
(166
|
)
|
(248
|
)
|
||||||
|
Net changes in securities held to maturity
|
97
|
|
104
|
|
96
|
|
||||||
|
Net unrealized gains (losses) on cash flow hedges
|
(203
|
)
|
(198
|
)
|
110
|
|
||||||
|
Foreign currency translation adjustments
|
84
|
|
(79
|
)
|
(135
|
)
|
||||||
|
Other
|
24
|
|
6
|
|
(9
|
)
|
||||||
|
Other comprehensive income (loss), net of tax
|
23
|
|
(333
|
)
|
(186
|
)
|
||||||
|
Comprehensive income
|
$
|
2,005
|
|
$
|
3,418
|
|
$
|
3,864
|
|
|||
|
See Notes to Consolidated Financial Statements.
|
||
|
120
|
Capital One Financial Corporation (COF)
|
|
|
(Dollars in millions, except per share-related data)
|
December 31,
2017 |
December 31,
2016 |
||||||
|
Assets:
|
||||||||
|
Cash and cash equivalents:
|
||||||||
|
Cash and due from banks
|
$
|
4,458
|
|
$
|
4,185
|
|
||
|
Interest-bearing deposits and other short-term investments
|
9,582
|
|
5,791
|
|
||||
|
Total cash and cash equivalents
|
14,040
|
|
9,976
|
|
||||
|
Restricted cash for securitization investors
|
312
|
|
2,517
|
|
||||
|
Securities available for sale, at fair value
|
37,655
|
|
40,737
|
|
||||
|
Securities held to maturity, at carrying value
|
28,984
|
|
25,712
|
|
||||
|
Loans held for investment:
|
||||||||
|
Unsecuritized loans held for investment
|
218,806
|
|
213,824
|
|
||||
|
Loans held in consolidated trusts
|
35,667
|
|
31,762
|
|
||||
|
Total loans held for investment
|
254,473
|
|
245,586
|
|
||||
|
Allowance for loan and lease losses
|
(7,502
|
)
|
(6,503
|
)
|
||||
|
Net loans held for investment
|
246,971
|
|
239,083
|
|
||||
|
Loans held for sale, at lower of cost or fair value
|
971
|
|
1,043
|
|
||||
|
Premises and equipment, net
|
4,033
|
|
3,675
|
|
||||
|
Interest receivable
|
1,536
|
|
1,351
|
|
||||
|
Goodwill
|
14,533
|
|
14,519
|
|
||||
|
Other assets
|
16,658
|
|
18,420
|
|
||||
|
Total assets
|
$
|
365,693
|
|
$
|
357,033
|
|
||
|
Liabilities:
|
||||||||
|
Interest payable
|
$
|
413
|
|
$
|
327
|
|
||
|
Deposits:
|
||||||||
|
Non-interest-bearing deposits
|
26,404
|
|
25,502
|
|
||||
|
Interest-bearing deposits
|
217,298
|
|
211,266
|
|
||||
|
Total deposits
|
243,702
|
|
236,768
|
|
||||
|
Securitized debt obligations
|
20,010
|
|
18,826
|
|
||||
|
Other debt:
|
||||||||
|
Federal funds purchased and securities loaned or sold under agreements to repurchase
|
576
|
|
992
|
|
||||
|
Senior and subordinated notes
|
30,755
|
|
23,431
|
|
||||
|
Other borrowings
|
8,940
|
|
17,211
|
|
||||
|
Total other debt
|
40,271
|
|
41,634
|
|
||||
|
Other liabilities
|
12,567
|
|
11,964
|
|
||||
|
Total liabilities
|
316,963
|
|
309,519
|
|
||||
|
Commitments, contingencies and guarantees (see Note 19)
|
|
|
||||||
|
Stockholders’ equity:
|
||||||||
|
Preferred stock (par value $.01 per share; 50,000,000 shares authorized; 4,475,000 shares issued and outstanding as of both December 31, 2017 and 2016)
|
0
|
|
0
|
|
||||
|
Common stock (par value $.01 per share; 1,000,000,000 shares authorized; 661,724,927 and 653,736,607 shares issued as of December 31, 2017 and 2016, respectively, 485,525,340 and 480,218,547 shares outstanding as of December 31, 2017 and 2016, respectively)
|
7
|
|
7
|
|
||||
|
Additional paid-in capital, net
|
31,656
|
|
31,157
|
|
||||
|
Retained earnings
|
30,700
|
|
29,766
|
|
||||
|
Accumulated other comprehensive loss
|
(926
|
)
|
(949
|
)
|
||||
|
Treasury stock, at cost (par value $.01 per share; 176,199,587 and 173,518,060 shares as of December 31, 2017 and 2016, respectively)
|
(12,707
|
)
|
(12,467
|
)
|
||||
|
Total stockholders’ equity
|
48,730
|
|
47,514
|
|
||||
|
Total liabilities and stockholders’ equity
|
$
|
365,693
|
|
$
|
357,033
|
|
||
|
See Notes to Consolidated Financial Statements.
|
||
|
121
|
Capital One Financial Corporation (COF)
|
|
CAPITAL ONE FINANCIAL CORPORATION
CONSOLIDATED STATEMENTS OF CHANGES IN STOCKHOLDERS’ EQUITY
|
(Dollars in millions)
|
Preferred Stock
|
Common Stock
|
Additional
Paid-In
Capital
|
Retained Earnings
|
Accumulated
Other
Comprehensive
Income (Loss)
|
Treasury
Stock
|
Total
Stockholders’
Equity
|
|||||||||||||||||||||||||||
|
Shares
|
Amount
|
Shares
|
Amount
|
|||||||||||||||||||||||||||||||
|
Balance as of December 31, 2014
|
1,875,000
|
|
$
|
0
|
|
643,557,048
|
|
$
|
6
|
|
$
|
27,869
|
|
$
|
23,973
|
|
$
|
(430
|
)
|
$
|
(6,365
|
)
|
$
|
45,053
|
|
|||||||||
|
Comprehensive income (loss)
|
4,050
|
|
(186
|
)
|
3,864
|
|
||||||||||||||||||||||||||||
|
Dividends—common stock
|
46,846
|
|
0
|
4
|
|
(820
|
)
|
(816
|
)
|
|||||||||||||||||||||||||
|
Dividends—preferred stock
|
(158
|
)
|
(158
|
)
|
||||||||||||||||||||||||||||||
|
Purchases of treasury stock
|
(2,441
|
)
|
(2,441
|
)
|
||||||||||||||||||||||||||||||
|
Issuances of common stock and restricted stock, net of forfeitures
|
2,603,953
|
|
0
|
111
|
|
111
|
|
|||||||||||||||||||||||||||
|
Exercise of stock options and warrants, tax effects of exercises and restricted stock vesting
|
2,109,548
|
|
0
|
71
|
|
71
|
|
|||||||||||||||||||||||||||
|
Issuances of preferred stock
(Series E and Series F)
|
1,500,000
|
|
0
|
|
1,472
|
|
1,472
|
|
||||||||||||||||||||||||||
|
Compensation expense for restricted stock awards, restricted stock units and stock options
|
128
|
|
128
|
|
||||||||||||||||||||||||||||||
|
Balance as of December 31, 2015
|
3,375,000
|
|
$
|
0
|
|
648,317,395
|
|
$
|
6
|
|
$
|
29,655
|
|
$
|
27,045
|
|
$
|
(616
|
)
|
$
|
(8,806
|
)
|
$
|
47,284
|
|
|||||||||
|
Comprehensive income (loss)
|
3,751
|
|
(333
|
)
|
3,418
|
|
||||||||||||||||||||||||||||
|
Dividends—common stock
|
52,338
|
|
0
|
4
|
|
(816
|
)
|
(812
|
)
|
|||||||||||||||||||||||||
|
Dividends—preferred stock
|
(214
|
)
|
(214
|
)
|
||||||||||||||||||||||||||||||
|
Purchases of treasury stock
|
(3,661
|
)
|
(3,661
|
)
|
||||||||||||||||||||||||||||||
|
Issuances of common stock and restricted stock, net of forfeitures
|
3,272,745
|
|
1
|
130
|
|
131
|
|
|||||||||||||||||||||||||||
|
Exercise of stock options, tax effects of exercises and restricted stock vesting
|
2,094,129
|
|
0
|
102
|
|
102
|
|
|||||||||||||||||||||||||||
|
Issuances of preferred stock
(Series G and Series H)
|
1,100,000
|
|
0
|
|
1,066
|
|
1,066
|
|
||||||||||||||||||||||||||
|
Compensation expense for restricted stock awards, restricted stock units and stock options
|
200
|
|
200
|
|
||||||||||||||||||||||||||||||
|
Balance as of December 31, 2016
|
4,475,000
|
|
$
|
0
|
|
653,736,607
|
|
$
|
7
|
|
$
|
31,157
|
|
$
|
29,766
|
|
$
|
(949
|
)
|
$
|
(12,467
|
)
|
$
|
47,514
|
|
|||||||||
|
Comprehensive income
|
1,982
|
|
23
|
|
2,005
|
|
||||||||||||||||||||||||||||
|
Dividends—common stock
|
42,613
|
|
0
|
3
|
|
(783
|
)
|
(780
|
)
|
|||||||||||||||||||||||||
|
Dividends—preferred stock
|
(265
|
)
|
(265
|
)
|
||||||||||||||||||||||||||||||
|
Purchases of treasury stock
|
(240
|
)
|
(240
|
)
|
||||||||||||||||||||||||||||||
|
Issuances of common stock and restricted stock, net of forfeitures
|
4,057,555
|
|
0
|
164
|
|
164
|
|
|||||||||||||||||||||||||||
|
Exercises of stock options and warrants
|
3,888,152
|
|
0
|
124
|
|
124
|
|
|||||||||||||||||||||||||||
|
Compensation expense for restricted stock awards, restricted stock units and stock options
|
208
|
|
208
|
|
||||||||||||||||||||||||||||||
|
Balance as of December 31, 2017
|
4,475,000
|
|
$
|
0
|
|
661,724,927
|
|
$
|
7
|
|
$
|
31,656
|
|
$
|
30,700
|
|
$
|
(926
|
)
|
$
|
(12,707
|
)
|
$
|
48,730
|
|
|||||||||
|
See Notes to Consolidated Financial Statements.
|
||
|
122
|
Capital One Financial Corporation (COF)
|
|
|
|
Year Ended December 31,
|
|||||||||||
|
(Dollars in millions)
|
2017
|
2016
|
2015
|
|||||||||
|
Operating activities:
|
||||||||||||
|
Income from continuing operations, net of tax
|
$
|
2,117
|
|
$
|
3,770
|
|
$
|
4,012
|
|
|||
|
Income (loss) from discontinued operations, net of tax
|
(135
|
)
|
(19
|
)
|
38
|
|
||||||
|
Net income
|
1,982
|
|
3,751
|
|
4,050
|
|
||||||
|
Adjustments to reconcile net income to net cash provided by operating activities:
|
||||||||||||
|
Provision for credit losses
|
7,551
|
|
6,459
|
|
4,536
|
|
||||||
|
Depreciation and amortization, net
|
2,440
|
|
2,428
|
|
2,100
|
|
||||||
|
Deferred tax provision (benefit)
|
1,434
|
|
(686
|
)
|
(402
|
)
|
||||||
|
Net (gains) losses on sales of securities available for sale
|
(70
|
)
|
(6
|
)
|
2
|
|
||||||
|
Impairment losses on securities available for sale
|
5
|
|
17
|
|
30
|
|
||||||
|
Gain on sales of loans held for sale
|
(72
|
)
|
(80
|
)
|
(86
|
)
|
||||||
|
Stock-based compensation expense
|
244
|
|
239
|
|
161
|
|
||||||
|
Other
|
(8
|
)
|
(11
|
)
|
0
|
|
||||||
|
Loans held for sale:
|
||||||||||||
|
Originations and purchases
|
(8,929
|
)
|
(8,645
|
)
|
(6,942
|
)
|
||||||
|
Proceeds from sales and paydowns
|
9,595
|
|
8,390
|
|
6,805
|
|
||||||
|
Changes in operating assets and liabilities:
|
||||||||||||
|
Changes in interest receivable
|
(157
|
)
|
(159
|
)
|
(72
|
)
|
||||||
|
Changes in other assets
|
(714
|
)
|
(1,907
|
)
|
(596
|
)
|
||||||
|
Changes in interest payable
|
85
|
|
28
|
|
45
|
|
||||||
|
Changes in other liabilities
|
1,157
|
|
2,013
|
|
575
|
|
||||||
|
Net change from discontinued operations
|
(361
|
)
|
25
|
|
(79
|
)
|
||||||
|
Net cash from operating activities
|
14,182
|
|
11,856
|
|
10,127
|
|
||||||
|
Investing activities:
|
||||||||||||
|
Securities available for sale:
|
||||||||||||
|
Purchases
|
(12,412
|
)
|
(14,154
|
)
|
(12,200
|
)
|
||||||
|
Proceeds from paydowns and maturities
|
7,213
|
|
7,867
|
|
7,742
|
|
||||||
|
Proceeds from sales
|
8,181
|
|
4,146
|
|
4,379
|
|
||||||
|
Securities held to maturity:
|
||||||||||||
|
Purchases
|
(5,885
|
)
|
(3,787
|
)
|
(4,277
|
)
|
||||||
|
Proceeds from paydowns and maturities
|
2,594
|
|
2,681
|
|
2,163
|
|
||||||
|
Loans:
|
||||||||||||
|
Net changes in loans held for investment
|
(12,315
|
)
|
(22,036
|
)
|
(18,575
|
)
|
||||||
|
Principal recoveries of loans previously charged off
|
1,951
|
|
1,493
|
|
1,498
|
|
||||||
|
Purchases of premises and equipment
|
(1,018
|
)
|
(779
|
)
|
(532
|
)
|
||||||
|
Net cash from acquisition activities
|
(3,187
|
)
|
(629
|
)
|
(9,314
|
)
|
||||||
|
Net cash from other investing activities
|
(663
|
)
|
(432
|
)
|
(610
|
)
|
||||||
|
Net cash from investing activities
|
(15,541
|
)
|
(25,630
|
)
|
(29,726
|
)
|
||||||
|
|
Year Ended December 31,
|
|||||||||||
|
(Dollars in millions)
|
2017
|
2016
|
2015
|
|||||||||
|
Financing activities:
|
||||||||||||
|
Deposits and borrowings:
|
||||||||||||
|
Changes in deposits
|
$
|
6,993
|
|
$
|
19,031
|
|
$
|
12,163
|
|
|||
|
Issuance of securitized debt obligations
|
5,983
|
|
6,259
|
|
5,062
|
|
||||||
|
Maturities and paydowns of securitized debt obligations
|
(7,233
|
)
|
(3,540
|
)
|
(500
|
)
|
||||||
|
Issuance of senior and subordinated notes and long-term FHLB advances
|
35,426
|
|
22,984
|
|
31,830
|
|
||||||
|
Maturities and paydowns of senior and subordinated notes and long-term FHLB advances
|
(36,554
|
)
|
(24,170
|
)
|
(9,579
|
)
|
||||||
|
Changes in other borrowings
|
(400
|
)
|
11
|
|
(16,066
|
)
|
||||||
|
Common stock:
|
||||||||||||
|
Net proceeds from issuances
|
164
|
|
131
|
|
111
|
|
||||||
|
Dividends paid
|
(780
|
)
|
(812
|
)
|
(816
|
)
|
||||||
|
Preferred stock:
|
||||||||||||
|
Net proceeds from issuances
|
0
|
|
1,066
|
|
1,472
|
|
||||||
|
Dividends paid
|
(265
|
)
|
(214
|
)
|
(158
|
)
|
||||||
|
Purchases of treasury stock
|
(240
|
)
|
(3,661
|
)
|
(2,441
|
)
|
||||||
|
Proceeds from share-based payment activities
|
124
|
|
142
|
|
85
|
|
||||||
|
Net cash from financing activities
|
3,218
|
|
17,227
|
|
21,163
|
|
||||||
|
Changes in cash, cash equivalents and restricted cash for securitization investors
|
1,859
|
|
3,453
|
|
1,564
|
|
||||||
|
Cash, cash equivalents and restricted cash for securitization investors, beginning of the period
|
12,493
|
|
9,040
|
|
7,476
|
|
||||||
|
Cash, cash equivalents and restricted cash for securitization investors, ending of the period
|
$
|
14,352
|
|
$
|
12,493
|
|
$
|
9,040
|
|
|||
|
Supplemental cash flow information:
|
||||||||||||
|
Non-cash items:
|
||||||||||||
|
Net transfers from loans held for investment to loans held for sale
|
$
|
674
|
|
$
|
552
|
|
$
|
268
|
|
|||
|
Securitized debt obligations assumed in acquisition
|
2,484
|
|
0
|
|
0
|
|
||||||
|
Loans held for sale acquired by assuming other borrowings
|
283
|
|
0
|
|
0
|
|
||||||
|
Interest paid
|
2,772
|
|
2,250
|
|
1,643
|
|
||||||
|
Income tax paid
|
1,187
|
|
2,121
|
|
1,732
|
|
||||||
|
See Notes to Consolidated Financial Statements.
|
||
|
123
|
Capital One Financial Corporation (COF)
|
|
|
|
The Company
Capital One Financial Corporation, a Delaware Corporation established in 1994 and headquartered in McLean, Virginia, is a diversified financial services holding company with banking and non-banking subsidiaries. Capital One Financial Corporation and its subsidiaries (the “Company”) offer a broad array of financial products and services to consumers, small businesses and commercial clients through branches, the internet and other distribution channels. As of
December 31, 2017
, our principal subsidiaries included:
|
•
|
Capital One Bank (USA), National Association (“COBNA”), which offers credit and debit card products, other lending products and deposit products; and
|
|
•
|
Capital One, National Association (“CONA”), which offers a broad spectrum of banking products and financial services to consumers, small businesses and commercial clients.
|
The Company is hereafter collectively referred to as “we,” “us” or “our.” COBNA and CONA are collectively referred to as the “Banks.”
We also offer products outside of the United States of America (“U.S.”) principally through Capital One (Europe) plc (“COEP”), an indirect subsidiary of COBNA organized and located in the United Kingdom (“U.K.”), and through a branch of COBNA in Canada. COEP has authority, among other things, to provide credit card loans. Our branch of COBNA in Canada also has the authority to provide credit card loans.
Our principal operations are currently organized for management reporting purposes into
three
major business segments, which are defined based on the products and services provided or the type of customer served: Credit Card, Consumer Banking and Commercial Banking. We provide details on our business segments, the integration of recent acquisitions, if any, into our business segments and the allocation methodologies and accounting policies used to derive our business segment results in “
Note 18—Business Segments
.”
Basis of Presentation and Use of Estimates
The accompanying consolidated financial statements have been prepared in accordance with generally accepted accounting principles in the U.S. (“U.S. GAAP”). The preparation of financial statements in conformity with U.S. GAAP requires management to make estimates and assumptions that affect the amounts reported in the consolidated financial statements and in the related disclosures. These estimates are based on information available as of the date of the consolidated financial statements. While management makes its best judgment, actual amounts or results could differ from these estimates. Certain prior period amounts have been reclassified to conform to the current period presentation.
Principles of Consolidation
The consolidated financial statements include the accounts of Capital One Financial Corporation and all other entities in which we have a controlling financial interest. We determine whether we have a controlling financial interest in an entity by first evaluating whether the entity is a voting interest entity or a variable interest entity (“VIE”). All significant intercompany account balances and transactions have been eliminated.
Voting Interest Entities
Voting interest entities are entities that have sufficient equity and provide the equity investors voting rights that give them the power to make significant decisions relating to the entity’s operations. Since a controlling financial interest in an entity is typically obtained through ownership of a majority voting interest, we consolidate our majority-owned subsidiaries and other voting interest entities in which we hold, directly or indirectly, more than 50% of the voting rights or where we exercise control through other contractual rights.
Investments in entities where we do not have a controlling financial interest but we have significant influence over the entity’s financial and operating decisions (generally defined as owning a voting interest of 20% to 50%) are accounted for under the equity method. If we own less than 20% of a voting interest entity, we generally carry the investment at cost, except marketable equity
|
124
|
Capital One Financial Corporation (COF)
|
|
securities, which we carry at fair value with changes in fair value included in accumulated other comprehensive income (“AOCI”). We report investments accounted for under the equity or cost method in other assets on our consolidated balance sheets, and include our share of income or loss on equity method investments and dividends on cost method investments in other non-interest income in our consolidated statements of income.
Variable Interest Entities
VIEs are entities that, by design, either (i) lack sufficient equity to permit the entity to finance its activities without additional subordinated financial support from other parties; or (ii) have equity investors that do not have the ability to make significant decisions relating to the entity’s operations through voting rights, or do not have the obligation to absorb the expected losses, or do not have the right to receive the residual returns of the entity. The entity that has a controlling financial interest in a VIE is referred to as the primary beneficiary and is required to consolidate the VIE. An entity is deemed to be the primary beneficiary of a VIE if that entity has both (i) the power to direct the activities of the VIE that most significantly impact the VIE’s economic performance; and (ii) the obligation to absorb losses or the right to receive benefits that could potentially be significant to the VIE.
In determining whether we are the primary beneficiary of a VIE, we consider both qualitative and quantitative factors regarding the nature, size and form of our involvement with the VIE, such as our role in establishing the VIE and our ongoing rights and responsibilities; our economic interests, including debt and equity investments, servicing fees and other arrangements deemed to be variable interests in the VIE; the design of the VIE, including the capitalization structure, subordination of interests, payment priority, relative share of interests held across various classes within the VIE’s capital structure and the reasons why the interests are held by us.
We perform on-going reassessments to evaluate whether changes in an entity’s capital structure or changes in the nature of our involvement with the entity result in a change to the VIE designation or a change to our consolidation conclusion. See “
Note 6—Variable Interest Entities and Securitizations
” for further details.
Cash and Cash Equivalents
Cash and cash equivalents include cash and due from banks, and interest-bearing deposits and other-short term investments, all of which, if applicable, have stated maturities of three months or less when acquired.
Securities Resale and Repurchase Agreements
Securities purchased under resale agreements and securities loaned or sold under agreements to repurchase, principally U.S. government and agency obligations, are not accounted for as sales but as collateralized financing transactions and recorded at the amounts at which the securities were acquired or sold, plus accrued interest. We continually monitor the market value of these securities and deliver additional collateral to or obtain additional collateral from counterparties, as appropriate.
Investment Securities
Our investment portfolio consists primarily of the following: U.S. Treasury securities; U.S. government-sponsored enterprise or agency (“Agency”) and non-agency residential mortgage-backed securities (“RMBS”); Agency commercial mortgage-backed securities (“CMBS”); other asset-backed securities (“ABS”); and other securities. The accounting and measurement framework for our investment securities differs depending on the security classification. We classify securities as available for sale or held to maturity based on our investment strategy and management’s assessment of our intent and ability to hold the securities until maturity. Securities that we may sell prior to maturity in response to changes in our investment strategy, liquidity needs, interest rate risk profile or for other reasons are classified as available for sale. Securities that we have the intent and ability to hold until maturity are classified as held to maturity.
We report securities available for sale on our consolidated balance sheets at fair value with unrealized gains or losses recorded, net of tax, as a component of AOCI. We report securities held to maturity on our consolidated balance sheets at carrying value. Carrying value generally equals amortized cost. Investment securities transferred into the held to maturity category from the available for sale category are recorded at fair value at the date of transfer. Any unrealized gains or losses at the transfer date are thereafter included in AOCI. Such unrealized gains or losses are accreted over the remaining life of the security and are expected to offset the amortization of the related premium or discount created upon the investment securities transfer into the held to maturity category, with no expected impact on future net income.
|
125
|
Capital One Financial Corporation (COF)
|
|
Unamortized premiums, discounts and other basis adjustments are recognized in interest income over the contractual lives of the securities using the effective interest method. We record purchases and sales of investment securities on a trade date basis. Realized gains or losses from the sale of debt securities are computed using the first in first out method of identification, and are included in non-interest income in our consolidated statements of income. If we intend to sell an available for sale security in an unrealized loss position or it is more likely than not that we will be required to sell the security prior to recovery of its amortized cost basis, the entire difference between the amortized cost basis of the security and its fair value is recognized in our consolidated statements of income.
We regularly evaluate our securities whose values have declined below amortized cost to assess whether the decline in fair value represents an OTTI. Amortized cost reflects historical cost adjusted for amortization of premiums, accretion of discounts and any previously recorded impairments. We discuss our assessment and accounting for OTTI in “
Note 3—Investment Securities
.” We discuss the techniques we use in determining the fair value of our investment securities in “
Note 17—Fair Value Measurement
.”
Our investment portfolio also includes certain acquired debt securities that were deemed to be credit impaired at the acquisition date, and therefore are accounted for in accordance with accounting guidance for purchased credit-impaired (“PCI”) loans and debt securities. These securities are recorded at fair value at the acquisition date using the estimated cash flows we expect to collect discounted by the prevailing market interest rate. The difference between the contractually required payments due and the undiscounted cash flows we expect to collect at acquisition, considering the impact of prepayments, is referred to as the nonaccretable difference. The nonaccretable difference reflects estimated future credit losses expected to be incurred over the life of the security, and is neither accreted into income nor recorded on our consolidated balance sheet. The excess of the undiscounted cash flows expected to be collected over the estimated fair value of credit-impaired debt securities at acquisition is referred to as the accretable yield, which is accreted into interest income using an effective yield method over the remaining life of the security. Decreases in expected cash flows attributable to credit result in the recognition of OTTI. Significant increases in expected cash flows are recognized prospectively over the remaining life of the security as an adjustment to the accretable yield. See “Loans Acquired” section of this Note for further discussion of accounting guidance for purchased credit-impaired loans and debt securities.
Loans
Our loan portfolio consists of loans held for investment, including loans underlying our consolidated securitization trusts, and loans held for sale, and is divided into three portfolio segments: credit card, consumer banking and commercial banking loans. Credit card loans consist of domestic and international credit card loans. Consumer banking loans consist of auto, home and retail banking loans. Commercial banking loans consist of commercial and multifamily real estate, commercial and industrial, and small-ticket commercial real estate loans.
Loan Classification
Upon origination or purchase, we classify loans as held for investment or held for sale based on our investment strategy and management’s intent and ability with regard to the loans which may change over time. The accounting and measurement framework for loans differs depending on the loan classification, whether the loans are originated or purchased and whether purchased loans are considered credit-impaired at the date of acquisition. The presentation within the consolidated statements of cash flows is based on management’s intent at acquisition or origination. Cash flows related to loans held for investment are included in cash flows from investing activities on our consolidated statements of cash flows. Cash flows related to loans held for sale are included in cash flows from operating activities on our consolidated statements of cash flows.
Loans Held for Investment
Loans that we have the ability and intent to hold for the foreseeable future and loans associated with consolidated securitization transactions are classified as held for investment. Loans classified as held for investment, except PCI loans accounted for based upon expected cash flows described below, are reported at their amortized cost, which is the outstanding principal balance, adjusted for any unearned income, unamortized deferred fees and costs, unamortized premiums and discounts and charge-offs. Credit card loans also include billed finance charges and fees, net of the estimated uncollectible amount.
Interest income is recognized on performing loans held for investment on an accrual basis. We generally defer loan origination fees and direct loan origination costs on originated loans, premiums and discounts on purchased loans and loan commitment fees. We recognize these amounts in interest income as yield adjustments over the life of the loan and/or commitment period using the effective interest method. For credit card loans, loan origination fees and direct loan origination costs are amortized on a straight-
|
126
|
Capital One Financial Corporation (COF)
|
|
line basis over a
12
-month period. We establish an allowance for loan losses for probable and incurred losses inherent in our held for investment loan portfolio as of each balance sheet date. Loans held for investment are subject to our allowance for loan and lease losses methodology described below under “Allowance for Loan and Lease Losses.”
Loans Held for Sale
Loans purchased or originated with the intent to sell or for which we do not have the ability and intent to hold for the foreseeable future are classified as held for sale. Interest on these loans is recognized on an accrual basis. These loans are recorded at the lower of cost or fair value. Loan origination fees and direct loan origination costs are deferred until the loan is sold and are then recognized as part of the total gain or loss on sale. The fair value of loans held for sale is determined on an aggregate portfolio basis for each loan type.
If a loan is transferred from held for investment to held for sale, on the transfer date, any decline in fair value related to credit is recorded as a charge-off and amortization of deferred loan origination fees and costs ceases. Subsequent to transfer, we report write-downs or recoveries in fair value up to the carrying value at the date of transfer and realized gains or losses on loans held for sale in our consolidated statements of income as a component of other non-interest income. We calculate the gain or loss on loan sales as the difference between the proceeds received and the carrying value of the loans sold, net of the fair value of any residual interests retained.
Loans Acquired
All purchased loans, including loans transferred in a business combination, are initially recorded at fair value, which includes consideration of expected future losses, as of the date of the acquisition. We account for purchased loans under the accounting guidance for purchased credit-impaired loans and debt securities, which is based upon expected cash flows, if the purchased loans have a discount attributable, at least in part, to credit deterioration and they are not specifically scoped out of the guidance. We refer to these purchased loans that are subsequently accounted for based on expected cash flows to be collected as “PCI loans.” Other purchased loans that do not meet the criteria described above or are specifically scoped out of this guidance are accounted for based on contractual cash flows.
Loans Acquired and Accounted for Based on Expected Cash Flows
In accounting for purchased loans based on expected cash flows, we first determine the contractually required payments due, which represent the total undiscounted amount of all uncollected principal and interest payments, adjusted for the effect of estimated prepayments. We then estimate the undiscounted cash flows we expect to collect, incorporating several key assumptions including expected default rates, loss severities and the amount and timing of prepayments. We estimate the fair value by discounting the estimated cash flows we expect to collect using an observable market rate of interest, when available, adjusted for factors that a market participant would consider in determining fair value at acquisition. We may aggregate loans acquired in the same fiscal quarter into one or more pools if the loans have common risk characteristics. A pool is then accounted for as a single asset, with a single composite interest rate and an aggregate fair value and expected cash flows.
The excess of cash flows expected to be collected over the estimated fair value of purchased loans is referred to as the accretable yield. This amount is not recorded on our consolidated balance sheets, but is accreted into interest income over the life of the loan, or pool of loans, using the effective interest method. The difference between total contractual payments on the loans and all expected cash flows represents the nonaccretable difference or the amount of principal and interest not considered collectible.
Subsequent to acquisition, we evaluate our estimate of cash flows expected to be collected on a quarterly basis. These evaluations require the use of key assumptions and estimates similar to those used in estimating the initial fair value at acquisition. Subsequent changes in the estimated cash flows expected to be collected may result in changes in the accretable yield and nonaccretable difference or reclassifications from the nonaccretable difference to the accretable yield. Decreases in expected cash flows resulting from credit deterioration subsequent to acquisition will generally result in an impairment charge recognized in our provision for credit losses and an increase in the allowance for loan and lease losses. Charge-offs are not recorded until the expected credit losses within the nonaccretable difference are depleted. In addition, PCI loans are not classified as delinquent, nonperforming or criticized, as we expect to collect our net investment in these loans. Increases in the cash flows expected to be collected would first reduce any previously recorded allowance for loan and lease losses established subsequent to acquisition. The excess over the recorded allowance for loan and lease losses would result in a reclassification to the accretable yield from the nonaccretable difference and an increase in interest income recognized over the remaining life of the loan or pool of loans. Disposals of loans in the form of
|
127
|
Capital One Financial Corporation (COF)
|
|
sales to third parties, receipt of payment in full or in part by the borrower, and foreclosure of the collateral, result in removal of the loan from the PCI loans portfolio. See “
Note 4—Loans
” for additional information.
Loans Acquired and Accounted for Based on Contractual Cash Flows
To determine the fair value of loans at acquisition in a business combination, we estimate discounted contractual cash flows due using an observable market rate of interest, when available, adjusted for factors that a market participant would consider in determining fair value. In determining fair value, contractual cash flows are adjusted to include prepayment estimates based upon trends in default rates and loss severities. The difference between the fair value and the contractual cash flows is recorded as a loan discount or premium at acquisition. Subsequent to acquisition, the loans are classified and accounted for as either held for investment or held for sale based on management’s ability and intent with regard to the loans. Loans held for investment are subject to our allowance for loan and lease losses methodology described below under “Allowance for Loan and Lease Losses.”
We are permitted to aggregate loans acquired in the same fiscal quarter into one or more pools if the loans have common risk characteristics. If we elect to pool loans, a pool is then accounted for as a single asset with a single composite interest rate and an aggregate fair value and expected cash flows.
Loan Modifications and Restructurings
As part of our loss mitigation efforts, we may provide modifications to a borrower experiencing financial difficulty to improve long-term collectability of the loan and to avoid the need for foreclosure or repossession of collateral. A loan modification in which a concession is granted to a borrower experiencing financial difficulty is accounted for and reported as a troubled debt restructuring (“TDR”). Our loan modifications typically include an extension of the loan term, a reduction in the interest rate, a reduction in the loan balance, or a combination of these concessions. We describe our accounting for and measurement of impairment on TDR loans below under “Impaired Loans.” See “
Note 4—Loans
” for additional information on our loan modifications and restructurings.
Delinquent and Nonperforming Loans
The entire balance of a loan is considered contractually delinquent if the minimum required payment is not received by the first statement cycle date equal to or following the due date specified on the customer’s billing statement. Delinquency is reported on loans that are
30
or more days past due. Interest and fees continue to accrue on past due loans until the date the loan is placed on nonaccrual status, if applicable. We generally place loans on nonaccrual status when we believe the collectability of interest and principal is not reasonably assured.
Nonperforming loans generally include loans that have been placed on nonaccrual status, but we do not report loans classified as held for sale as nonperforming.
Our policies for classifying loans as nonperforming, by loan category, are as follows:
|
•
|
Credit card loans:
As permitted by regulatory guidance issued by the Federal Financial Institutions Examination Council (“FFIEC”), our policy is generally to exempt credit card loans from being classified as nonperforming, as these loans are generally charged off in the period the account becomes
180
days past due. Consistent with industry conventions, we generally continue to accrue interest and fees on delinquent credit card loans until the loans are charged-off.
|
|
•
|
Consumer banking loans:
We classify consumer banking loans as nonperforming when we determine that the collectability of all interest and principal on the loan is not reasonably assured, generally when the loan becomes
90
days past due.
|
|
•
|
Commercial banking loans
: We classify commercial banking loans as nonperforming as of the date we determine that the collectability of all interest and principal on the loan is not reasonably assured.
|
|
•
|
Modified loans and troubled debt restructurings:
Modified loans, including TDRs, that are current at the time of the restructuring remain on accrual status if there is demonstrated performance prior to the restructuring and continued performance under the modified terms is expected. Otherwise, the modified loan is classified as nonperforming and placed on nonaccrual status until the borrower demonstrates a sustained period of performance over several payment cycles, generally
six
months of consecutive payments, under the modified terms of the loan.
|
|
•
|
PCI loans:
PCI loans are not classified as delinquent, nonperforming or criticized.
|
|
128
|
Capital One Financial Corporation (COF)
|
|
Interest and fees accrued but not collected at the date a loan is placed on nonaccrual status are reversed against earnings. In addition, the amortization of net deferred loan fees is suspended. Interest and fee income is subsequently recognized only upon the receipt of cash payments. However, if there is doubt regarding the ultimate collectability of loan principal, all cash received is generally applied against the principal balance of the loan. Nonaccrual loans are generally returned to accrual status when all principal and interest is current and repayment of the remaining contractual principal and interest is reasonably assured, or when the loan is both well-secured and in the process of collection and collectability is no longer doubtful.
Impaired Loans
A loan is considered impaired when, based on current information and events, it is probable that we will be unable to collect all amounts due from the borrower in accordance with the original contractual terms of the loan. Generally, we report loans as impaired based on the method for measuring impairment in accordance with applicable accounting guidance. Loans held for sale are not reported as impaired, as these loans are recorded at lower of cost or fair value. Impaired loans also exclude PCI loans, as these loans are accounted for based on expected cash flows at acquisition because this accounting methodology takes into consideration future credit losses.
Loans defined as individually impaired, based on applicable accounting guidance, include larger-balance nonperforming loans and TDR loans. Loans modified in a TDR continue to be reported as impaired until maturity. Our policies for identifying loans as individually impaired, by loan category, are as follows:
|
•
|
Credit card loans:
Credit card loans that have been modified in a troubled debt restructuring are identified and accounted for as individually impaired.
|
|
•
|
Consumer banking loans:
Consumer loans that have been modified in a troubled debt restructuring are identified and accounted for as individually impaired.
|
|
•
|
Commercial banking loans:
Commercial loans classified as nonperforming and commercial loans that have been modified in a troubled debt restructuring are reported as individually impaired.
|
The majority of individually impaired loans are evaluated for an asset-specific allowance. We generally measure impairment and the related asset-specific allowance for individually impaired loans based on the difference between the recorded investment of the loan and the present value of the expected future cash flows, discounted at the original effective interest rate of the loan at the time of modification. If the loan is collateral dependent, we measure impairment based upon the fair value of the underlying collateral, which we determine based on the current fair value of the collateral less estimated selling costs, instead of discounted cash flows. Loans are identified as collateral dependent if we believe that collateral is the sole source of repayment.
Charge-Offs
We charge off loans as a reduction to the allowance for loan and lease losses when we determine the loan is uncollectible and record subsequent recoveries of previously charged off amounts as an increase to the allowance for loan and lease losses. We exclude accrued and unpaid finance charges and fees and certain fraud losses from charge-offs. Costs to recover charged-off loans are recorded as collection expense and included in our consolidated statements of income as a component of other non-interest expense as incurred. Our charge-off time frames by loan type are presented below.
|
•
|
Credit card loans:
We generally charge-off credit card loans in the period the account becomes
180
days past due. We charge off delinquent credit card loans for which revolving privileges have been revoked as part of loan workout when the account becomes
120
days past due. Credit card loans in bankruptcy are generally charged-off by the end of the month following
30
days after the receipt of a complete bankruptcy notification from the bankruptcy court. Credit card loans of deceased account holders are charged-off by the end of the month following
60
days of receipt of notification.
|
|
•
|
Consumer banking loans:
We generally charge-off consumer banking loans at the earlier of the date when the account is a specified number of days past due or upon repossession of the underlying collateral. Our charge-off time frame is
180
days for home loans and
120
days for auto loans. Small business banking loans generally charge off at
120
days past due based on when unpaid principal loan amounts are deemed uncollectible. We calculate the initial charge-off amount for home loans based on the excess of our recorded investment in the loan over the fair value of the underlying property less estimated selling costs as of the date of the charge-off. We update our home value estimates on a regular basis and may recognize additional charge-offs for subsequent declines in home values. In the second quarter of 2017, due to clarified regulatory
|
|
129
|
Capital One Financial Corporation (COF)
|
|
guidance, we implemented changes in accounting estimates for auto and home loans where the borrower has filed for bankruptcy and the loan has not been reaffirmed, such that they charge off in the period that the loan is
60
days from the bankruptcy notification date, regardless of delinquency status. Auto and home loans that have been discharged under Chapter 7 bankruptcy, have not been reaffirmed and have not reached
60
days from the bankruptcy notification date are charged off at the end of the month in which the bankruptcy discharge occurs. Remaining consumer loans generally are charged off within
40
days of receipt of notification from the bankruptcy court. Consumer loans of deceased account holders are charged off by the end of the month following
60
days of receipt of notification.
|
•
|
Commercial banking loans:
We charge off commercial loans in the period we determine that the unpaid principal loan amounts are uncollectible.
|
|
•
|
PCI loans:
We do not record charge-offs on PCI loans that are meeting or exceeding our performance expectations as of the date of acquisition, as the fair values of these loans already reflect a discount for expected future credit losses. We record charge-offs on PCI loans only if actual losses exceed estimated credit losses incorporated into the fair value recorded at acquisition.
|
Allowance for Loan and Lease Losses
We maintain an allowance for loan and lease losses (“allowance”) that represents management’s best estimate of incurred loan and lease losses inherent in our held for investment portfolio as of each balance sheet date. The provision for credit losses reflects credit losses we believe have been incurred and will eventually be recognized over time in our charge-offs. Charge-offs of uncollectible amounts are deducted from the allowance and subsequent recoveries are added back.
Management performs a quarterly analysis of our loan portfolio to determine if impairment has occurred and to assess the adequacy of the allowance based on historical and current trends as well as other factors affecting credit losses. We apply documented systematic methodologies to separately calculate the allowance for our consumer loan and commercial loan portfolios. Our allowance for loan and lease losses consists of
three
components that are allocated to cover the estimated probable losses in each loan portfolio based on the results of our detailed review and loan impairment assessment process: (i) a component for loans collectively evaluated for impairment; (ii) an asset-specific component for individually impaired loans; and (iii) a component related to PCI loans that have experienced significant decreases in expected cash flows subsequent to acquisition. Each of our allowance components is supplemented by an amount that represents management’s qualitative judgment of the imprecision and risks inherent in the processes and assumptions used in establishing the allowance. Management’s judgment involves an assessment of subjective factors, such as process risk, modeling assumption and adjustment risks and probable internal and external events that will likely impact losses.
Our consumer loan portfolio consists of smaller-balance, homogeneous loans, divided into
four
primary portfolio segments: credit card loans, auto loans, residential home loans and retail banking loans. Each of these portfolios is further divided by our business units into pools based on common risk characteristics, such as origination year, contract type, interest rate and geography, which are collectively evaluated for impairment. The commercial loan portfolio is primarily composed of larger-balance, non-homogeneous loans. These loans are subject to individual reviews that result in internal risk ratings. In assessing the risk rating of a particular loan, among the factors we consider are the financial condition of the borrower, geography, collateral performance, historical loss experience, and industry-specific information that management believes is relevant in determining the occurrence of a loss event and measuring impairment. These factors are based on an evaluation of historical and current information, and involve subjective assessment and interpretation. Emphasizing one factor over another or considering additional factors could impact the risk rating assigned to that loan.
The component of the allowance related to credit card and other consumer loans that we collectively evaluate for impairment is based on a statistical calculation, which is supplemented by management judgment as described above. Because of the homogeneous nature of our consumer loan portfolios, the allowance is based on the aggregated portfolio segment evaluations. The allowance is established through a process that begins with estimates of incurred losses in each pool based upon various statistical analyses. Loss forecast models are utilized to estimate probable losses incurred and consider several portfolio indicators including, but not limited to, historical loss experience, account seasoning, the value of collateral underlying secured loans, estimated foreclosures or defaults based on observable trends, delinquencies, bankruptcy filings, unemployment, credit bureau scores and general economic and business trends. Management believes these factors are relevant in estimating probable losses incurred and also considers an evaluation of overall portfolio credit quality based on indicators such as changes in our credit evaluation, underwriting and collection
|
130
|
Capital One Financial Corporation (COF)
|
|
management policies, the effect of other external factors such as competition and legal and regulatory requirements, general economic conditions and business trends, and uncertainties in forecasting and modeling techniques used in estimating our allowance. We update our consumer loss forecast models and portfolio indicators on a quarterly basis to incorporate information reflective of the current economic environment.
The component of the allowance for commercial loans that we collectively evaluate for impairment is based on our historical loss experience for loans with similar risk characteristics and consideration of the current credit quality of the portfolio, which is supplemented by management judgment as described above. We apply internal risk ratings to commercial loans, which we use to assess credit quality and derive a total loss estimate based on an estimated probability of default (“default rate”) and loss given default (“loss severity”). Management may also apply judgment to adjust the loss factors derived, taking into consideration both quantitative and qualitative factors, including general economic conditions, industry-specific and geographic trends, portfolio concentrations, trends in internal credit quality indicators, and current and past underwriting standards that have occurred but are not yet reflected in the historical data underlying our loss estimates.
The asset-specific component of the allowance covers smaller-balance homogeneous consumer loans whose terms have been modified in a TDR and larger-balance nonperforming, non-homogeneous commercial loans. As discussed above under “Impaired Loans,” we generally measure the asset-specific component of the allowance based on the difference between the recorded investment of individually impaired loans and the present value of expected future cash flows. When the present value of expected future cash flows is lower than the recorded investment of the loan, impairment is recognized through the provision for credit losses. If the loan is collateral dependent, we measure impairment based on the current fair value of the collateral less estimated selling costs, instead of discounted cash flows. The asset-specific component of the allowance for smaller-balance impaired loans is calculated on a pool basis using historical loss experience for the respective class of assets. The asset-specific component of the allowance for larger-balance impaired loans is individually calculated for each loan. Key considerations in determining the allowance include the borrower’s overall financial condition, resources and payment history, prospects for support from financially responsible guarantors, and when applicable, the estimated realizable value of any collateral.
We record all purchased loans at fair value at acquisition. Applicable accounting guidance prohibits the carry over or creation of valuation allowances in the initial accounting for impaired loans acquired in a transfer. Subsequent to acquisition, decreases in expected principal cash flows of PCI loans would trigger the recognition of impairment through our provision for credit losses. Subsequent increases in expected cash flows would first result in a recovery of any previously recorded allowance, to the extent applicable, and then increase the accretable yield. Write-downs on PCI loans in excess of the nonaccretable difference are charged against the allowance for loan and lease losses. See “
Note 4—Loans
” for information on loan portfolios associated with acquisitions.
In addition to the allowance, we also estimate probable losses related to contractually binding unfunded lending commitments, such as letters of credit, financial guarantees, and binding unfunded loan commitments. The provision for unfunded lending commitments is included in the provision for credit losses in our consolidated statements of income and the related reserve is included in other liabilities on our consolidated balance sheets. Unfunded lending commitments are subject to individual reviews and are analyzed and segregated by risk according to our internal risk rating scale, which we use to assess credit quality and derive a total loss estimate. We assess these risk classifications, taking into consideration both quantitative and qualitative factors, including historical loss experience, utilization assumptions, current economic conditions, performance trends within specific portfolio segments and other pertinent information to estimate the reserve for unfunded lending commitments.
Determining the appropriateness of the allowance is complex and requires judgment by management about the effect of matters that are inherently uncertain. Subsequent evaluations of the loan portfolio, in light of the factors then prevailing, may result in significant changes in the allowance and the reserve for unfunded lending commitments in future periods.
Securitization of Loans
Our loan securitization activities primarily involve the securitization of credit card loans, which have provided a source of funding for us. See “
Note 6—Variable Interest Entities and Securitizations
” for additional details. Loan securitization involves the transfer of a pool of loan receivables from our portfolio to a trust. The trust then sells an undivided interest in the pool of loan receivables to third-party investors through the issuance of debt securities and transfers the proceeds from the debt issuance to us as consideration for the loan receivables transferred. The debt securities are collateralized by the transferred receivables from our portfolio. We remove loans from our consolidated balance sheets when securitizations qualify as sales to non-consolidated VIEs, recognize assets retained and liabilities assumed at fair value and record a gain or loss on the transferred loans. Alternatively, when the
|
131
|
Capital One Financial Corporation (COF)
|
|
transfer does not qualify as a sale but instead is considered a secured borrowing or when the sale is to a consolidated VIE, the asset will remain on our consolidated balance sheets with an offsetting liability recognized for the amount of proceeds received.
Premises and Equipment
Premises and equipment, including leasehold improvements, are carried at cost less accumulated depreciation and amortization. Land is carried at cost. We capitalize direct costs incurred during the application development stage of internally developed software projects. Depreciation and amortization expenses are calculated using the straight-line method over the estimated useful lives of the assets. Useful lives for premises and equipment are estimated as follows:
|
Premises and Equipment
|
Useful Lives
|
|
|
Buildings and improvement
|
5-39 years
|
|
|
Furniture and equipment
|
3-10 years
|
|
|
Computer software
|
3-5 years
|
|
|
Leasehold improvements
|
Lesser of useful life or the remaining
fixed non-cancelable lease term |
|
Expenditures for maintenance and repairs are expensed as incurred and gains or losses upon disposition are recognized in our consolidated statements of income as realized.
Goodwill and Intangible Assets
Goodwill represents the excess of the acquisition price of an acquired business over the fair value of assets acquired and liabilities assumed and is assigned to one or more reporting units at the date of acquisition. A reporting unit is defined as an operating segment, or a business unit that is one level below an operating segment. Goodwill is not amortized but is tested for impairment at the reporting unit level annually or more frequently if adverse circumstances indicate that it is more likely than not that the carrying amount of a reporting unit exceeds its fair value. These indicators include a sustained, significant decline in the Company’s stock price, a decline in its expected future cash flows, significant disposition activity, a significant adverse change in the economic or business environment, and the testing for recoverability of a significant asset group, among others. The annual goodwill impairment test, performed as of October 1 of each year, is a two-step test. The first step identifies whether there is potential impairment by comparing the fair value of a reporting unit to its carrying amount, including goodwill. If fair value is less than the carrying amount, the second step of the impairment test is required to measure the amount of any potential impairment loss. In 2017, we had
four
reporting units: Credit Card, Auto, Other Consumer Banking and Commercial Banking.
Intangible assets with finite useful lives are amortized on either an accelerated or straight-line basis over their estimated useful lives and are evaluated for impairment whenever events or changes in circumstances indicate the carrying amount of the assets may not be recoverable. See “
Note 7—Goodwill and Intangible Assets
” for additional information.
Mortgage Servicing Rights
Mortgage servicing rights (“MSRs”) are initially recorded at fair value when mortgage loans are sold or securitized in the secondary market and the right to service these loans is retained for a fee. Subsequently, our consumer MSRs are carried at fair value on our consolidated balance sheets with changes in fair value recognized in non-interest income. Our commercial MSRs are subsequently accounted for under the amortization method and are periodically evaluated for impairment, which is recognized as a reduction in non-interest income. See “
Note 7—Goodwill and Intangible Assets
” and “
Note 17—Fair Value Measurement
” for additional information.
Foreclosed Property and Repossessed Assets
Foreclosed property and repossessed assets obtained through our lending activities typically include commercial and residential real estate or personal property, such as automobiles, and are recorded at net realizable value. For home loans collateralized by residential real estate, we reclassify loans to foreclosed property at the earlier of when we obtain legal title to the residential real estate property or when the borrower conveys all interest in the property to us. For all other foreclosed property and repossessed assets, we reclassify the loan to repossessed assets upon repossession of the property in satisfaction of the loan. Net realizable value is the estimated fair value of the underlying collateral less estimated selling costs and is based on appraisals, when available.
|
132
|
Capital One Financial Corporation (COF)
|
|
Subsequent to initial recognition, foreclosed property and repossessed assets are recorded at the lower of our initial cost basis or net realizable value, which is routinely monitored and updated. Any changes in net realizable value and gains or losses realized from disposition of the property are recorded in non-interest expense. See “
Note 17—Fair Value Measurement
” for details.
Restricted Equity Investments
We have investments in Federal Home Loan Banks (“FHLB”) stock and in the Board of Governors of the Federal Reserve System (“Federal Reserve”) stock. These investments, which are included in other assets on our consolidated balance sheets, are not marketable and are carried at cost. We assess these investments for OTTI in accordance with applicable accounting guidance for evaluating impairment.
Litigation
In accordance with the current accounting standards for loss contingencies, we establish reserves for litigation-related matters, including mortgage representation and warranty related matters, that arise from the ordinary course of our business activities when it is probable that a loss associated with a claim or proceeding has been incurred and the amount of the loss can be reasonably estimated. See “
Note 19—Commitments, Contingencies, Guarantees and Others
” for additional information.
Customer Rewards Reserve
We offer products, primarily credit cards, which include programs that allow members to earn rewards that can be redeemed for cash (primarily in the form of statement credits), gift cards, airline tickets or merchandise, based on account activity. The amount of reward that a customer earns varies based on the terms and conditions of the rewards program and product.
When rewards are earned by a customer, rewards costs are generally recorded as an offset to interchange income, with a corresponding increase to the customer rewards reserve. The customer rewards reserve is computed based on the estimated future cost of earned rewards that are expected to be redeemed. The customer rewards reserve is reduced as rewards are redeemed. In estimating the customer rewards reserve, we consider historical redemption and spending behavior, as well as the terms and conditions of the current rewards programs, among other factors. The customer rewards reserve is sensitive to changes in the redemption mix and rate. We expect the vast majority of all rewards earned will eventually be redeemed. The customer rewards reserve, which is included in other liabilities on our consolidated balance sheets, totaled
$3.9 billion
and
$3.6 billion
as of
December 31, 2017
and
2016
, respectively.
Revenue Recognition
Interest Income and Fees
Interest income and fees on loans and investment securities are recognized based on the contractual provisions of the underlying arrangements.
Loan origination fees and costs and premiums and discounts on loans held for investment are deferred and generally amortized into interest income as yield adjustments over the contractual life and/or commitment period using the effective interest method. In certain circumstances, we elect to factor prepayment estimates into the calculation of the constant effective yield necessary to apply the interest method. Prepayment estimates are based on historical prepayment data, existing and forecasted interest rates, and economic data. For credit card loans, loan origination fees and direct loan origination costs are amortized on a straight-line basis over a
12
-month period.
Unamortized premiums, discounts and other basis adjustments on investment securities are recognized in interest income over the contractual lives of the securities using the effective interest method.
Finance charges and fees on credit card loans, net of amounts that we consider uncollectible, are included in loan receivables and revenue when the fees are earned. Annual membership fees are deferred and amortized into income over
12
months on a straight line basis. We continue to accrue finance charges and fees on credit card loans until the account is charged-off. Our methodology for estimating the uncollectible portion of billed finance charges and fees is consistent with the methodology we use to estimate the allowance for incurred principal losses on our credit card loan receivables.
|
133
|
Capital One Financial Corporation (COF)
|
|
Interchange Income
Interchange income represents fees for standing ready to authorize and providing settlement on credit card transactions processed through the MasterCard® (“MasterCard”) and Visa® (“Visa”) interchange networks. The levels and structure of interchange rates are set by MasterCard and Visa and can vary based on cardholder purchase volumes. We recognize interchange income upon settlement with the interchange networks.
Card Partnership Agreements
Our partnership agreements relate to alliances with retailers and other partners to provide lending and other services to mutual customers. We primarily issue private-label and co-branded credit card loans to these customers over the term of the partnership agreements, which typically range from
two
to
ten
years.
Certain partners assist in or perform marketing activities on our behalf and promote our products and services to their customers. As compensation for providing these services, we often pay royalties, bounties or other special bonuses to these partners. Depending upon the nature of the payments, they are recorded as a reduction of revenue, marketing expenses or other operating expenses. We have certain credit card partnership arrangements in which our partner agrees to share a portion of the credit losses associated with the partnership.
If a partnership agreement provides for profit, revenue or loss sharing payments, we must determine whether to report those payments on a gross or net basis in our consolidated financial statements. We evaluate the contractual provisions of each transaction and applicable accounting guidance to determine the manner in which to report the impact of sharing arrangements in our consolidated financial statements. Our consolidated net income is the same regardless of whether revenue and loss sharing arrangements are reported on a gross or net basis.
When presented on a net basis, the loss sharing amounts due from partners are recorded as a reduction to our provision for credit losses in our consolidated statements of income and reduce the charge-off amounts that we report. The allowance for loan and lease losses attributable to these portfolios is also reduced by the expected reimbursements from these partners for loss sharing amounts. See “
Note 5—Allowance for Loan and Lease Losses and Reserve for Unfunded Lending Commitments
” for additional information related to our loss sharing arrangements.
Collaborative Arrangements
A collaborative arrangement is a contractual arrangement that involves a joint operating activity between two or more parties that are active participants in the activity. These parties are exposed to significant risks and rewards based upon the economic success of the joint operating activity. We assess each of our partnership agreements with profit, revenue or loss sharing payments to determine if a collaborative arrangement exists and, if so, how revenue generated from third parties, costs incurred and transactions between participants in the collaborative arrangement should be accounted for and reported on our consolidated financial statements. We currently have one partnership agreement that meets the definition of a collaborative agreement.
We share a fixed percentage of revenues, consisting of finance charges and late fees, with the partner, and the partner is required to reimburse us for a fixed percentage of credit losses incurred. Revenues and losses related to the partner’s credit card program and partnership agreement are reported on a net basis in our consolidated financial statements. Revenue sharing amounts attributable to the partner are recorded as an offset against total net revenue in our consolidated statements of income. Interest income was reduced by
$1.2 billion
in both
2017
and
2016
, and
$1.1 billion
in
2015
, for amounts earned by the partner, as part of the revenue sharing agreement. The impact of all of our loss sharing arrangements that are presented on a net basis is included in “
Note 5—Allowance for Loan and Lease Losses and Reserve for Unfunded Lending Commitments
.”
Stock-Based Compensation
We reserve common shares for issuance to employees, directors and third-party service providers, in various forms, including stock options, stock appreciation rights, restricted stock awards and units and performance share awards and units. In addition, we also issue cash equity units and cash-settled restricted stock units which are not counted against the common shares reserved for issuance or available for issuance because they are settled in cash. For awards settled in shares, we generally recognize compensation expense on a straight-line basis over the award’s requisite service period based on the fair value of the award at grant date. If an award settled in shares contains a performance condition with graded vesting, we recognize compensation expense using the accelerated attribution method. Equity units and restricted stock units that are cash-settled are accounted for as liability
|
134
|
Capital One Financial Corporation (COF)
|
|
awards which results in quarterly expense fluctuations based on changes in our stock price through the date that the awards are settled. Awards that continue to vest after retirement are expensed over the shorter of the time period between the grant date and the final vesting period or between the grant date and when the participant becomes retirement eligible; awards to participants who are retirement eligible at the grant date are subject to immediate expense recognition. Stock-based compensation expense is included in salaries and associate benefits in the consolidated statements of income.
Stock-based compensation expense for equity classified stock options is based on the grant date fair value, which is estimated using a Black-Scholes option pricing model. Significant judgment is required when determining the inputs into the fair value model. For awards other than stock options, the fair value of stock-based compensation used in determining compensation expense will generally equal the fair market value of our common stock on the date of grant. Certain share-settled awards have discretionary vesting conditions which result in the remeasurement of these awards at fair value each reporting period and the potential for compensation expense to fluctuate with changes in our stock price.
Marketing Expenses
We expense marketing costs as incurred. Television advertising costs are expensed during the period in which the advertisements are aired.
Income Taxes
We recognize the current and deferred tax consequences of all transactions that have been recognized in the financial statements using the provisions of the enacted tax laws. Current income tax expense represents our estimated taxes to be paid or refunded for the current period and includes income tax expense related to our uncertain tax positions, as well as tax-related interest and penalties. Deferred tax assets and liabilities are determined based on differences between the financial reporting and tax basis of assets and liabilities and are measured using the enacted tax rates and laws that will be in effect when the differences are expected to reverse. We record valuation allowances to reduce deferred tax assets to the amount that is more likely than not to be realized. We record the effect of remeasuring deferred tax assets and liabilities due to a change in tax rates or laws as a component of income tax expense related to continuing operations for the period in which the change is enacted. Income tax benefits are recognized when, based on their technical merits, they are more likely than not to be sustained upon examination. The amount recognized is the largest amount of benefit that is more likely than not to be realized upon settlement.
See “
Note 16—Income Taxes
” for additional detail.
Earnings Per Share
Earnings per share is calculated and reported under the “two-class” method. The “two-class” method is an earnings allocation method under which earnings per share is calculated for each class of common stock and participating security considering both dividends declared or accumulated and participation rights in undistributed earnings as if all such earnings had been distributed during the period. We have unvested share-based payment awards which have a right to receive nonforfeitable dividends. These share-based payment awards are deemed to be participating securities.
We calculate basic earnings per share by dividing net income, after deducting dividends on preferred stock and participating securities as well as undistributed earnings allocated to participating securities, by the average number of common shares outstanding during the period, net of any treasury shares. We calculate diluted earnings per share in a similar manner after consideration of the potential dilutive effect of common stock equivalents on the average number of common shares outstanding during the period. Common stock equivalents include warrants, stock options, restricted stock awards and units, and performance share awards and units. Common stock equivalents are calculated based upon the treasury stock method using an average market price of common shares sold during the period. Dilution is not considered when a net loss is reported. Common stock equivalents that have an antidilutive effect are excluded from the computation of diluted earnings per share.
Derivative Instruments and Hedging Activities
All derivative financial instruments, whether designated for hedge accounting or not, are reported at their fair value on our consolidated balance sheets as either assets or liabilities, with consideration of legally enforceable master netting arrangements that allow us to net settle positive and negative positions and offset cash collateral with the same counterparty. We report net derivatives in a gain position, or derivative assets, on our consolidated balance sheets as a component of other assets. We report net derivatives in a loss position, or derivative liabilities, on our consolidated balance sheets as a component of other liabilities.
|
135
|
Capital One Financial Corporation (COF)
|
|
See “
Note 10—Derivative Instruments and Hedging Activities
” for additional detail on the accounting for derivative instruments, including those designated as qualifying for hedge accounting.
Fair Value
Fair value, also referred to as an exit price, is defined as the price that would be received for an asset or paid to transfer a liability in an orderly transaction between market participants on the measurement date.
The fair value accounting guidance provides a three-level fair value hierarchy for classifying financial instruments. This hierarchy is based on whether the inputs to the valuation techniques used to measure fair value are observable or unobservable. Fair value measurement of a financial asset or liability is assigned to a level based on the lowest level of any input that is significant to the fair value measurement in its entirety. The three levels of the fair value hierarchy are described below:
Level 1: Quoted prices (unadjusted) in active markets for identical assets or liabilities
Level 2: Observable market-based inputs, other than quoted prices in active markets for identical assets or liabilities
Level 3: Unobservable inputs
The accounting guidance for fair value requires that we maximize the use of observable inputs and minimize the use of unobservable inputs in determining fair value. The accounting guidance also provides for the irrevocable option to elect, on a contract-by-contract basis, to measure certain financial assets and liabilities at fair value at inception of the contract and record any subsequent changes to fair value in the consolidated statements of income. We have not made any material fair value option elections as of and for the years ended
December 31, 2017
,
2016
and
2015
. See “
Note 17—Fair Value Measurement
” for additional information.
Accounting for Acquisitions
We account for business combinations under the acquisition method of accounting. Under the acquisition method, tangible and intangible identifiable assets acquired, liabilities assumed and any noncontrolling interest in the acquiree are recorded at fair value as of the acquisition date, with limited exceptions. Transaction costs and costs to restructure the acquired company are expensed as incurred. Goodwill is recognized as the excess of the acquisition price over the estimated fair value of the net assets acquired. Likewise, if the fair value of the net assets acquired is greater than the acquisition price, a bargain purchase gain is recognized and recorded in non-interest income.
If the acquired set of activities and assets do not meet the accounting definition of a business, the transaction is accounted for as an asset acquisition. In an asset acquisition, the assets acquired are recorded at the purchase price plus any transaction costs incurred and no goodwill is recognized.
Newly Adopted Accounting Standards
Restricted Cash
In November 2016
, the Financial Accounting Standards Board (“FASB”) issued revised guidance that requires restricted cash and restricted cash equivalents to be included within beginning and ending total cash amounts reported in the consolidated statements of cash flows. Disclosure of the nature of the restrictions on cash balances is required under the guidance. We elected to early adopt the guidance retrospectively effective as of January 1, 2017. Upon adoption, changes in restricted cash, which had previously been presented as financing activities, are now included within beginning and ending Cash, cash equivalents and restricted cash for securitization investors balances in our consolidated statements of cash flows.
The Cash, cash equivalents and restricted cash for securitization investors balances presented in the consolidated statements of cash flows are comprised of the amounts captioned on the consolidated balance sheets as Total cash and cash equivalents and Restricted cash for securitization investors.
Improvements to Employee Share-Based Accounting
In March 2016, the FASB issued revised guidance for accounting for employee share-based payments. The guidance requires that all excess tax benefits and tax deficiencies that pertain to employee stock-based incentive payments be recognized as income tax expense or benefit in the consolidated statements of income, rather than within additional paid-in capital; and that excess tax benefits be classified as an operating activity rather than financing activity in the consolidated statements of cash flows. The guidance also permits an accounting policy election to either estimate the number of awards that are expected to vest or account
|
136
|
Capital One Financial Corporation (COF)
|
|
for forfeitures when they occur. We adopted the guidance effective in the first quarter of 2017 on a prospective basis related to recognition of excess tax benefits and deficiencies in the consolidated statements of income and presentation of excess tax benefits in the consolidated statements of cash flows. In addition, we made an accounting policy election to account for forfeitures of awards as they occur and applied a modified retrospective transition method. Our adoption of this guidance did not have a material impact to our consolidated financial statements.
Recently Issued but Not Yet Adopted Accounting Standards
Reclassification of Certain Tax Effects Stranded in Accumulated Other Comprehensive Income
In February 2018, the FASB issued revised guidance on the accounting for certain tax effects stranded in AOCI. U.S. GAAP requires the effects of changes in tax rates and laws on deferred tax balances to be recorded as a component of income tax expense from continuing operations in the period of enactment. For deferred tax assets and liabilities related to items in AOCI, this results in the tax effects of such changes being stranded in AOCI. The revised guidance provides an optional reclassification from AOCI to retained earnings for such stranded tax effects resulting from the reduction in the corporate income tax rate enacted by the Tax Act. The reclassification may also include such stranded tax effects resulting from other income tax effects of the Tax Act, such as the effect of the federal benefit of deducting state income taxes. Entities are provided the option to apply the guidance retrospectively or in the period of adoption. The guidance is effective for us on January 1, 2019, with early adoption permitted. We currently plan to adopt the standard in the first quarter of 2018, using the option to make the adjustment in the period of adoption, and anticipate such adoption will result in a decrease to our AOCI and an increase to our retained earnings of approximately
$170 million
.
Targeted Improvements to Accounting for Hedging Activities
In August 2017, the FASB issued amended hedge accounting guidance to better align hedge accounting with risk management activities. It reduces the complexity involved in applying hedging accounting through changes to both the designation and measurement guidance for qualifying hedging relationships and the presentation of the impacts of those hedging relationships. Under the amended guidance, the recognition of hedging instruments has been amended by eliminating the concept of separately measuring and reporting hedge ineffectiveness. The presentation of hedging instruments has been amended as well by requiring the entire change in the fair value of the hedging instrument to be recorded in the same income statement line item that is used to present the earnings effect of the hedged item. With respect to fair value hedges of interest rate risk, the guidance will allow changes in the fair value of the hedged item to be measured using a portion of the term of the hedged item and the benchmark interest rate component of the total coupon determined at hedge inception. In addition, for a closed pool of pre-payable financial assets, entities will be able to hedge an amount that is not expected to be affected by prepayments, defaults and other events under the “last-of-layer” method. The guidance will permit a one-time reclassification of debt securities eligible to be hedged under the “last-of-layer” method from held to maturity to available for sale upon adoption.
We early adopted this guidance in the first quarter of 2018 using the prescribed modified retrospective transition method. As a result we elected to transfer held to maturity securities eligible to be hedged under the “last-of-layer” method to the available for sale category. We made this one-time election to optimize the investment portfolio management for capital and risk management considerations. We will manage the transferred securities collectively with the securities in the available for sale portfolio. We transferred held to maturity securities with a carrying amount of
$9.0 billion
, which resulted in an increase to accumulated other comprehensive income of
$107 million
. The impacts of the transfer, as well as the disclosures required under the new guidance, will be reflected in the first quarter of 2018 Quarterly Report on Form 10-Q.
Premium Amortization on Purchased Callable Debt Securities
In March 2017, the FASB issued revised guidance to shorten the amortization period to the earliest call date for certain purchased callable debt securities held at a premium. There is no change for accounting for securities held at a discount. Under the existing guidance, the premium is generally amortized as an adjustment to interest income over the contractual life of the debt security. We do not expect the adoption of this guidance to have a material impact on our consolidated financial statements. This guidance is effective for us on January 1, 2019, with early adoption permitted, using the modified retrospective method of adoption. We plan to adopt the standard on its effective date.
|
137
|
Capital One Financial Corporation (COF)
|
|
Simplifying the Test for Goodwill Impairment
In January 2017, the FASB issued revised guidance which is intended to reduce the cost and complexity of testing goodwill for impairment by eliminating the second step from the current goodwill impairment test. Under the existing guidance, the first step compares a reporting unit’s carrying value to its fair value. If the carrying value exceeds fair value, an entity performs the second step, which assigns the reporting unit’s fair value to its assets and liabilities, including unrecognized assets and liabilities, in the same manner as required in purchase accounting. Under the new guidance, any impairment of a reporting unit’s goodwill is determined based on the amount by which the reporting unit’s carrying value exceeds its fair value, limited to the amount of goodwill allocated to the reporting unit. This guidance is effective for us on January 1, 2020, with early adoption permitted, using the prospective method of adoption. We plan to adopt the standard on its effective date.
Measurement of Credit Losses on Financial Instruments
In June 2016, the FASB issued revised guidance for impairments on financial instruments. The guidance requires an impairment model (known as the current expected credit loss (“CECL”) model) that is based on expected rather than incurred losses, with an anticipated result of more timely loss recognition. The CECL model is applicable to financial assets measured at amortized cost, net investments in leases that are not accounted for at fair value through net income and certain off-balance sheet arrangements. The CECL model will replace our current accounting for purchased credit-impaired (“PCI”) and impaired loans. The guidance also amends the available for sale (“AFS”) debt securities other-than-temporary impairment (“OTTI”) model. Credit losses (and subsequent recoveries) on AFS debt securities will be recorded through an allowance approach, rather than the current U.S. GAAP practice of permanent write-downs for credit losses and accreting positive changes through interest income over time.
This guidance is effective for us on January 1, 2020, with early adoption permitted no earlier than January 1, 2019, using the modified retrospective method of adoption. We plan to adopt the standard on its effective date. We have established a company-wide, cross-functional governance structure for our implementation of this standard. We are in the process of determining key accounting interpretations, data requirements and necessary changes to our credit loss estimation methods, processes and systems. We continue to assess the potential impact on our consolidated financial statements and related disclosures. Due to the significant differences in the revised guidance from existing U.S. GAAP, the implementation of this guidance may result in increases to our reserves for credit losses on financial instruments.
Leases
In February 2016, the FASB issued revised guidance for leases. The guidance requires lessees to recognize right of use assets and lease liabilities on their consolidated balance sheets and disclose key information about all their leasing arrangements, with certain practical expedients. This guidance is effective for us on January 1, 2019, with early adoption permitted, using the modified retrospective method of adoption. We plan to adopt the standard on the effective date. We are currently in the process of reviewing lease contracts, implementing a new lease accounting and administration software solution, establishing new processes and internal controls and evaluating the impact of various accounting policy elections. Upon adoption, we expect to record a right of use asset and a corresponding lease liability for our operating leases where we are the lessee. The potential impact on our consolidated financial statements is largely based on the present value of future minimum lease payments, the amount of which will depend upon the population of leases in effect at the date of adoption. Future minimum lease payments totaled
$2.7 billion
as of December 31, 2017, as disclosed in “Note 8—Premises, Equipment and Lease Commitments.” We do not expect material changes to the recognition of operating lease expense in our consolidated statements of income.
|
138
|
Capital One Financial Corporation (COF)
|
|
Recognition and Measurement of Financial Assets and Financial Liabilities
In January 2016, the FASB issued revised guidance for the recognition, measurement, presentation and disclosure of financial instruments. The main provisions of the guidance include, (i) the measurement of most equity investments at fair value with changes in fair value recorded through net income, except those accounted for under the equity method of accounting, or those that do not have a readily determinable fair value (for which a practical expedient can be elected); (ii) the required use of the exit price notion when valuing financial instruments for disclosure purposes; (iii) the separate presentation in other comprehensive income of the instrument-specific credit risk portion of the total change in the fair value of a liability under the fair value option; (iv) the determination of the need for a valuation allowance on a deferred tax asset related to AFS securities must be made in combination with other deferred tax assets. The guidance eliminates the current classifications of equity securities as trading or AFS and will require separate presentation of financial assets and liabilities by category and form of the financial assets on the face of the consolidated balance sheets or within the accompanying notes. The guidance also eliminates the requirement to disclose the methods and significant assumptions used to estimate fair value of financial instruments measured at amortized cost on the balance sheet. We adopted this guidance in the first quarter of 2018. Our adoption did not have a material impact on our consolidated financial statements.
Revenue from Contracts with Customers
In May 2014, the FASB issued revised guidance for the recognition, measurement and disclosure of revenue from contracts with customers. The original guidance was amended through subsequent accounting standard updates that resulted in technical corrections, improvements and a one-year deferral of the effective date to January 1, 2018. The guidance, as amended, is applicable to all entities and replaced significant portions of existing industry and transaction-specific revenue recognition rules with a more principles-based recognition model. Entities were given an option to apply either a full or modified retrospective method of adoption. Most revenue associated with financial instruments, including interest income, loan origination fees and credit card fees, is outside the scope of the guidance. Gains and losses on investment securities, derivatives and sales of financial instruments are similarly excluded from the scope. We determined interchange fees earned on credit and debit card transactions, net of any related customer rewards, are in the scope of the amended guidance. We assessed the impact of the new guidance by evaluating our contracts, identifying our performance obligations, determining when the performance obligations were satisfied to allow us to recognize revenue and determining the amount of revenue to recognize. As a result of this analysis, we determined our recognition, measurement and presentation of interchange fees net of customer rewards costs will not change. We adopted this guidance in the first quarter of 2018, using the modified retrospective method of adoption. Our adoption did not have a material impact on our consolidated financial statements.
|
139
|
Capital One Financial Corporation (COF)
|
|
|
|
Business Developments
Cabela’s Acquisition
On September 25, 2017, we completed the acquisition from Synovus Bank of credit card assets and related liabilities of World’s Foremost Bank, a wholly-owned subsidiary of Cabela’s Incorporated (“Cabela’s acquisition”). The Cabela’s acquisition was accounted for as a business combination under the acquisition method of accounting. During the fourth quarter of 2017, we finalized purchase accounting. Including post-closing purchase price adjustments, total cash consideration for the acquisition was
$3.2 billion
net of cash and restricted cash acquired. We recognized approximately
$5.9 billion
in assets, primarily consisting of
$5.7 billion
in credit card receivables. We also assumed
$2.6 billion
of liabilities, of which
$2.5 billion
were securitized debt obligations. Results of the Cabela’s acquisition are included within our Credit Card segment.
Restructuring Activities
We periodically initiate restructuring activities to support business strategies and enhance our overall operational efficiency. These restructuring activities have primarily consisted of exiting certain business locations and activities as well as the realignment of resources supporting various businesses, including the decision in the fourth quarter of 2017 to cease new originations of home loan lending products within our Consumer Banking business. The charges incurred as a result of these restructuring activities have primarily consisted of severance and related benefits pursuant to our ongoing benefit programs, which are included in salaries and associate benefits within non-interest expense in our consolidated statements of income, as well as impairment of certain assets related to business locations and activities being exited, which are generally included in occupancy and equipment within non-interest expense.
During 2017 and 2015, we recognized restructuring charges of
$184 million
and
$120 million
, respectively, which are reflected in the Other category. There were no significant restructuring charges incurred during 2016. As of December 31, 2017, we had a liability of
$124 million
associated with these restructuring activities, which is recorded in other liabilities on our consolidated balance sheets.
Discontinued Operations
Our discontinued operations consist of the mortgage origination operations of our wholesale mortgage banking unit, GreenPoint Mortgage Funding, Inc. (“GreenPoint”) and the manufactured housing operations of GreenPoint Credit, LLC, a subsidiary of GreenPoint, both of which were acquired as part of the North Fork Bancorporation, Inc. (“North Fork”) acquisition in December 2006. Although the manufactured housing operations were sold to a third party in 2004 prior to our acquisition of North Fork, we acquired certain retained interests and obligations related to those operations as part of the acquisition. Separately, in the third quarter of 2007 we closed the mortgage origination operations of the wholesale mortgage banking unit. The results of both the wholesale banking unit and the manufactured housing operations have been accounted for as discontinued operations and are reported as income or loss from discontinued operations, net of tax, on the consolidated statements of income.
The following table summarizes the results from discontinued operations for
the years ended December 31, 2017, 2016 and 2015
:
Table
2.1
: Results of Discontinued Operations
|
|
Year Ended December 31,
|
|||||||||||
|
(Dollars in millions)
|
2017
|
2016
|
2015
|
|||||||||
|
Income (loss) from discontinued operations before income taxes
|
$
|
(215
|
)
|
$
|
(30
|
)
|
$
|
60
|
|
|||
|
Income tax provision (benefit)
|
(80
|
)
|
(11
|
)
|
22
|
|
||||||
|
Income (loss) from discontinued operations, net of tax
|
$
|
(135
|
)
|
$
|
(19
|
)
|
$
|
38
|
|
|||
The loss from discontinued operations for the year ended December 31, 2017 was
primarily driven by a mortgage representation and warranty settlement in the fourth quarter of 2017
, which resulted in a pre-tax charge of
$169 million
representing amounts above previously recognized reserves.
|
140
|
Capital One Financial Corporation (COF)
|
|
As of
December 31, 2017
, we had no significant continuing involvement in the operations of our wholesale mortgage banking unit.
We previously had contingent obligations to exercise mandatory clean-up calls associated with certain securitization transactions undertaken by the discontinued GreenPoint Credit, LLC manufactured housing operations in the event the third-party servicer could not fulfill its obligation to exercise these clean-up calls.
On October 10, 2017, we entered into an agreement with the third-party servicer under which we assumed the mandatory obligation to exercise the remaining clean-up calls as they become due on certain securitization transactions.
See “
Note 6—Variable Interest Entities and Securitizations
” and “
Note 19—Commitments, Contingencies, Guarantees and Others
” for information associated with GreenPoint Credit, LLC manufactured housing operations and our mortgage representation and warranty exposure.
|
141
|
Capital One Financial Corporation (COF)
|
|
|
|
Our investment portfolio consists primarily of the following: U.S. Treasury securities; U.S. government-sponsored enterprise or agency (“Agency”) and non-agency residential mortgage-backed securities (“RMBS”); Agency commercial mortgage-backed securities (“CMBS”); other asset-backed securities (“ABS”); and other securities.
Agency securities include Government National Mortgage Association (“Ginnie Mae”) guaranteed securities, Federal National Mortgage Association (“Fannie Mae”) and Federal Home Loan Mortgage Corporation (“Freddie Mac”) issued securities. The carrying value of our investments in U.S. Treasury and Agency securities represented
95%
and
91%
of our total investment securities as of
December 31, 2017
and
2016
, respectively.
The table below presents the overview of our investment securities portfolio as of
December 31, 2017
and
2016
.
Table
3.1
: Overview of Investment Securities Portfolio
|
(Dollars in millions)
|
December 31, 2017
|
December 31, 2016
|
||||||
|
Securities available for sale, at fair value
|
$
|
37,655
|
|
$
|
40,737
|
|
||
|
Securities held to maturity, at carrying value
|
28,984
|
|
25,712
|
|
||||
|
Total investment securities
|
$
|
66,639
|
|
$
|
66,449
|
|
||
The table below presents the amortized cost, gross unrealized gains and losses, and fair value of securities available for sale as of
December 31, 2017
and
2016
.
Table
3.2
: Investment Securities Available for Sale
|
December 31, 2017
|
||||||||||||||||
|
(Dollars in millions)
|
Amortized
Cost
|
Gross
Unrealized
Gains
|
Gross
Unrealized
Losses
(1)
|
Fair
Value
|
||||||||||||
|
Investment securities available for sale:
|
||||||||||||||||
|
U.S. Treasury securities
|
$
|
5,168
|
|
$
|
11
|
|
$
|
(8
|
)
|
$
|
5,171
|
|
||||
|
RMBS:
|
||||||||||||||||
|
Agency
|
26,013
|
|
67
|
|
(402
|
)
|
25,678
|
|
||||||||
|
Non-agency
|
1,722
|
|
393
|
|
(1
|
)
|
2,114
|
|
||||||||
|
Total RMBS
|
27,735
|
|
460
|
|
(403
|
)
|
27,792
|
|
||||||||
|
Agency CMBS
|
3,209
|
|
10
|
|
(44
|
)
|
3,175
|
|
||||||||
|
Other ABS
|
513
|
|
0
|
|
(1
|
)
|
512
|
|
||||||||
|
Other securities
(2)
|
1,003
|
|
4
|
|
(2
|
)
|
1,005
|
|
||||||||
|
Total investment securities available for sale
|
$
|
37,628
|
|
$
|
485
|
|
$
|
(458
|
)
|
$
|
37,655
|
|
||||
|
142
|
Capital One Financial Corporation (COF)
|
|
|
|
December 31, 2016
|
|||||||||||||||
|
(Dollars in millions)
|
Amortized
Cost
|
Gross
Unrealized
Gains
|
Gross
Unrealized
Losses
(1)
|
Fair
Value
|
||||||||||||
|
Investment securities available for sale:
|
||||||||||||||||
|
U.S. Treasury securities
|
$
|
5,103
|
|
$
|
11
|
|
$
|
(49
|
)
|
$
|
5,065
|
|
||||
|
RMBS:
|
||||||||||||||||
|
Agency
|
26,830
|
|
109
|
|
(412
|
)
|
26,527
|
|
||||||||
|
Non-agency
|
2,349
|
|
382
|
|
(9
|
)
|
2,722
|
|
||||||||
|
Total RMBS
|
29,179
|
|
491
|
|
(421
|
)
|
29,249
|
|
||||||||
|
CMBS:
|
||||||||||||||||
|
Agency
|
3,335
|
|
14
|
|
(45
|
)
|
3,304
|
|
||||||||
|
Non-agency
|
1,676
|
|
21
|
|
(13
|
)
|
1,684
|
|
||||||||
|
Total CMBS
|
5,011
|
|
35
|
|
(58
|
)
|
4,988
|
|
||||||||
|
Other ABS
|
714
|
|
1
|
|
(1
|
)
|
714
|
|
||||||||
|
Other securities
(2)
|
726
|
|
1
|
|
(6
|
)
|
721
|
|
||||||||
|
Total investment securities available for sale
|
$
|
40,733
|
|
$
|
539
|
|
$
|
(535
|
)
|
$
|
40,737
|
|
||||
|
(1)
|
Includes non-credit-related OTTI that is recorded in AOCI of
$1 million
and
$9 million
as of
December 31, 2017
and
2016
, respectively. Substantially all of this amount is related to non-agency RMBS.
|
|
(2)
|
Includes supranational bonds, foreign government bonds, mutual funds and equity investments
.
|
The table below presents the amortized cost, carrying value, gross unrealized gains and losses, and fair value of securities held to maturity as of
December 31, 2017
and
2016
.
Table
3.3
: Investment Securities Held to Maturity
__________
|
December 31, 2017
|
||||||||||||||||||||||||
|
(Dollars in millions)
|
Amortized
Cost
|
Unrealized Losses Recorded in AOCI
(1)
|
Carrying Value
|
Gross
Unrealized
Gains
|
Gross
Unrealized
Losses
|
Fair
Value
|
||||||||||||||||||
|
U.S. Treasury securities
|
$
|
200
|
|
$
|
0
|
|
$
|
200
|
|
$
|
0
|
|
$
|
0
|
|
$
|
200
|
|
||||||
|
Agency RMBS
|
25,741
|
|
(761
|
)
|
24,980
|
|
565
|
|
(150
|
)
|
25,395
|
|
||||||||||||
|
Agency CMBS
|
3,882
|
|
(78
|
)
|
3,804
|
|
70
|
|
(32
|
)
|
3,842
|
|
||||||||||||
|
Total investment securities held to maturity
|
$
|
29,823
|
|
$
|
(839
|
)
|
$
|
28,984
|
|
$
|
635
|
|
$
|
(182
|
)
|
$
|
29,437
|
|
||||||
|
December 31, 2016
|
||||||||||||||||||||||||
|
(Dollars in millions)
|
Amortized
Cost
|
Unrealized
Losses Recorded in AOCI
(1)
|
Carrying Value
|
Gross
Unrealized
Gains
|
Gross
Unrealized
Losses
|
Fair
Value
|
||||||||||||||||||
|
U.S. Treasury securities
|
$
|
199
|
|
$
|
0
|
|
$
|
199
|
|
$
|
0
|
|
$
|
0
|
|
$
|
199
|
|
||||||
|
Agency RMBS
|
23,022
|
|
(897
|
)
|
22,125
|
|
606
|
|
(158
|
)
|
22,573
|
|
||||||||||||
|
Agency CMBS
|
3,480
|
|
(92
|
)
|
3,388
|
|
77
|
|
(41
|
)
|
3,424
|
|
||||||||||||
|
Total investment securities held to maturity
|
$
|
26,701
|
|
$
|
(989
|
)
|
$
|
25,712
|
|
$
|
683
|
|
$
|
(199
|
)
|
$
|
26,196
|
|
||||||
|
(1)
|
Certain investment securities were transferred from the available for sale category to the held to maturity category in 2013. This amount represents the unrealized holding gain or loss at the date of transfer, net of any subsequent accretion. Any bonds purchased into the securities held to maturity portfolio rather than transferred, will not have unrealized losses recognized in AOCI.
|
|
143
|
Capital One Financial Corporation (COF)
|
|
Investment Securities in a Gross Unrealized Loss Position
The table below provides, by major security type, information about our securities available for sale in a gross unrealized loss position and the length of time that individual securities have been in a continuous unrealized loss position as of
December 31, 2017
and
2016
.
Table
3.4
: Securities in a Gross Unrealized Loss Position
|
|
December 31, 2017
|
|||||||||||||||||||||||
|
|
Less than 12 Months
|
12 Months or Longer
|
Total
|
|||||||||||||||||||||
|
(Dollars in millions)
|
Fair Value
|
Gross
Unrealized
Losses
|
Fair Value
|
Gross
Unrealized
Losses
|
Fair Value
|
Gross
Unrealized
Losses
|
||||||||||||||||||
|
Investment securities available for sale:
|
||||||||||||||||||||||||
|
U.S. Treasury securities
|
$
|
2,031
|
|
$
|
(8
|
)
|
$
|
0
|
|
$
|
0
|
|
$
|
2,031
|
|
$
|
(8
|
)
|
||||||
|
RMBS:
|
||||||||||||||||||||||||
|
Agency
|
8,192
|
|
(67
|
)
|
13,175
|
|
(335
|
)
|
21,367
|
|
(402
|
)
|
||||||||||||
|
Non-agency
|
10
|
|
0
|
|
10
|
|
(1
|
)
|
20
|
|
(1
|
)
|
||||||||||||
|
Total RMBS
|
8,202
|
|
(67
|
)
|
13,185
|
|
(336
|
)
|
21,387
|
|
(403
|
)
|
||||||||||||
|
Agency CMBS
|
880
|
|
(8
|
)
|
1,236
|
|
(36
|
)
|
2,116
|
|
(44
|
)
|
||||||||||||
|
Other ABS
|
130
|
|
0
|
|
95
|
|
(1
|
)
|
225
|
|
(1
|
)
|
||||||||||||
|
Other securities
|
371
|
|
(2
|
)
|
0
|
|
0
|
|
371
|
|
(2
|
)
|
||||||||||||
|
Total investment securities available for sale in a gross unrealized loss position
|
$
|
11,614
|
|
$
|
(85
|
)
|
$
|
14,516
|
|
$
|
(373
|
)
|
$
|
26,130
|
|
$
|
(458
|
)
|
||||||
|
|
December 31, 2016
|
|||||||||||||||||||||||
|
|
Less than 12 Months
|
12 Months or Longer
|
Total
|
|||||||||||||||||||||
|
(Dollars in millions)
|
Fair Value
|
Gross
Unrealized
Losses
|
Fair Value
|
Gross
Unrealized
Losses
|
Fair Value
|
Gross
Unrealized
Losses
|
||||||||||||||||||
|
Investment securities available for sale:
|
||||||||||||||||||||||||
|
U.S. Treasury securities
|
$
|
1,060
|
|
$
|
(49
|
)
|
$
|
0
|
|
$
|
0
|
|
$
|
1,060
|
|
$
|
(49
|
)
|
||||||
|
RMBS:
|
||||||||||||||||||||||||
|
Agency
|
16,899
|
|
(329
|
)
|
4,865
|
|
(83
|
)
|
21,764
|
|
(412
|
)
|
||||||||||||
|
Non-agency
|
128
|
|
(2
|
)
|
145
|
|
(7
|
)
|
273
|
|
(9
|
)
|
||||||||||||
|
Total RMBS
|
17,027
|
|
(331
|
)
|
5,010
|
|
(90
|
)
|
22,037
|
|
(421
|
)
|
||||||||||||
|
CMBS:
|
||||||||||||||||||||||||
|
Agency
|
1,624
|
|
(21
|
)
|
745
|
|
(24
|
)
|
2,369
|
|
(45
|
)
|
||||||||||||
|
Non-agency
|
826
|
|
(11
|
)
|
129
|
|
(2
|
)
|
955
|
|
(13
|
)
|
||||||||||||
|
Total CMBS
|
2,450
|
|
(32
|
)
|
874
|
|
(26
|
)
|
3,324
|
|
(58
|
)
|
||||||||||||
|
Other ABS
|
187
|
|
(1
|
)
|
21
|
|
0
|
|
208
|
|
(1
|
)
|
||||||||||||
|
Other securities
|
417
|
|
(6
|
)
|
0
|
|
0
|
|
417
|
|
(6
|
)
|
||||||||||||
|
Total investment securities available for sale in a gross unrealized loss position
|
$
|
21,141
|
|
$
|
(419
|
)
|
$
|
5,905
|
|
$
|
(116
|
)
|
$
|
27,046
|
|
$
|
(535
|
)
|
||||||
As of
December 31, 2017
, the amortized cost of approximately
920
securities available for sale exceeded their fair value by
$458 million
, of which
$373 million
related to securities that had been in a loss position for 12 months or longer. As of
December 31, 2017
, the carrying value of approximately
250
securities classified as held to maturity exceeded their fair value by
$182 million
.
The unrealized losses related to investment securities for which we have not recognized credit impairment were primarily attributable to changes in market interest rates. As discussed in more detail below, we conduct periodic reviews of all investment securities with unrealized losses to assess whether impairment is other-than-temporary.
|
144
|
Capital One Financial Corporation (COF)
|
|
Maturities and Yields of Investment Securities
The table below summarizes, by major security type, the contractual maturities and weighted-average yields of our investment securities as of
December 31, 2017
. Because borrowers may have the right to call or prepay certain obligations, the expected maturities of our securities are likely to differ from the scheduled contractual maturities presented below. The weighted-average yield below represents the effective yield for the investment securities and is calculated based on the amortized cost of each security.
Table
3.5
: Contractual Maturities and Weighted-Average Yields of Securities
__________
|
|
December 31, 2017
|
|||||||||||||||||||
|
(Dollars in millions)
|
Due in
1 Year or Less
|
Due > 1 Year
through
5 Years
|
Due > 5 Years
through
10 Years
|
Due > 10 Years
|
Total
|
|||||||||||||||
|
Fair value of securities available for sale:
|
||||||||||||||||||||
|
U.S. Treasury securities
|
$
|
200
|
|
$
|
1,238
|
|
$
|
3,733
|
|
$
|
0
|
|
$
|
5,171
|
|
|||||
|
RMBS
(1)
:
|
||||||||||||||||||||
|
Agency
|
4
|
|
45
|
|
507
|
|
25,122
|
|
25,678
|
|
||||||||||
|
Non-agency
|
0
|
|
0
|
|
0
|
|
2,114
|
|
2,114
|
|
||||||||||
|
Total RMBS
|
4
|
|
45
|
|
507
|
|
27,236
|
|
27,792
|
|
||||||||||
|
Agency CMBS
(1)
|
19
|
|
592
|
|
1,123
|
|
1,441
|
|
3,175
|
|
||||||||||
|
Other ABS
(1)
|
172
|
|
310
|
|
0
|
|
30
|
|
512
|
|
||||||||||
|
Other securities
|
229
|
|
332
|
|
348
|
|
96
|
|
1,005
|
|
||||||||||
|
Total securities available for sale
|
$
|
624
|
|
$
|
2,517
|
|
$
|
5,711
|
|
$
|
28,803
|
|
$
|
37,655
|
|
|||||
|
Amortized cost of securities available for sale
|
$
|
624
|
|
$
|
2,515
|
|
$
|
5,706
|
|
$
|
28,783
|
|
$
|
37,628
|
|
|||||
|
Weighted-average yield for securities available for sale
|
1.13
|
%
|
1.88
|
%
|
2.05
|
%
|
2.65
|
%
|
2.49
|
%
|
||||||||||
|
Carrying value of securities held to maturity:
|
||||||||||||||||||||
|
U.S. Treasury securities
|
$
|
200
|
|
$
|
0
|
|
$
|
0
|
|
$
|
0
|
|
$
|
200
|
|
|||||
|
Agency RMBS
|
0
|
|
0
|
|
120
|
|
24,860
|
|
24,980
|
|
||||||||||
|
Agency CMBS
|
0
|
|
987
|
|
239
|
|
2,578
|
|
3,804
|
|
||||||||||
|
Total securities held to maturity
|
$
|
200
|
|
$
|
987
|
|
$
|
359
|
|
$
|
27,438
|
|
$
|
28,984
|
|
|||||
|
Fair value of securities held to maturity
|
$
|
200
|
|
$
|
1,031
|
|
$
|
366
|
|
$
|
27,840
|
|
$
|
29,437
|
|
|||||
|
Weighted-average yield for securities held to maturity
|
1.11
|
%
|
2.37
|
%
|
2.87
|
%
|
2.77
|
%
|
2.75
|
%
|
||||||||||
|
(1)
|
As of December 31, 2017, weighted-average expected maturities of RMBS, CMBS and other ABS are
5.0 years
,
4.3 years
and
1.0 years
, respectively.
|
Other-Than-Temporary Impairment
We evaluate all securities in an unrealized loss position at least on a quarterly basis, and more often as market conditions require, to assess whether the impairment is other-than-temporary. Our OTTI assessment is based on a discounted cash flow analysis which requires careful use of judgments and assumptions. A number of qualitative and quantitative criteria may be considered in our assessment as applicable, including the size and the nature of the portfolio; historical and projected performance such as prepayment, default and loss severity for the RMBS portfolio; recent credit events specific to the issuer and/or industry to which the issuer belongs; the payment structure of the security; external credit ratings of the issuer and any failure or delay of the issuer to make scheduled interest or principal payments; the value of underlying collateral; our intent and ability to hold the security; and current and projected market and macro-economic conditions.
If we intend to sell a security in an unrealized loss position or it is more likely than not that we will be required to sell the security prior to recovery of its amortized cost basis, the entire difference between the amortized cost basis of the security and its fair value is recognized in earnings. As of
December 31, 2017
, for any securities with unrealized losses recorded in AOCI, we do not intend to sell, nor believe that we will be required to sell, these securities prior to recovery of their amortized cost.
|
145
|
Capital One Financial Corporation (COF)
|
|
For those securities that we do not intend to sell nor expect to be required to sell, an analysis is performed to determine if any of the impairment is due to credit-related factors or whether it is due to other factors, such as interest rates. Credit-related impairment is recognized in earnings, with the remaining unrealized non-credit-related impairment recorded in AOCI. We determine the credit component based on the difference between the security’s amortized cost basis and the present value of its expected cash flows, discounted based on the effective yield.
Realized Gains and Losses on Securities and OTTI Recognized in Earnings
The following table presents the gross realized gains and losses on the sale and redemption of securities available for sale, and the OTTI losses recognized in earnings for
the years ended December 31, 2017, 2016 and 2015
. We also present the proceeds from the sale of securities available for sale for the periods presented. We did not sell any investment securities that are classified as held to maturity.
Table
3.6
: Realized Gains and Losses and OTTI Recognized in Earnings
|
|
Year Ended December 31,
|
|||||||||||
|
(Dollars in millions)
|
2017
|
2016
|
2015
|
|||||||||
|
Realized gains (losses):
|
||||||||||||
|
Gross realized gains
|
$
|
144
|
|
$
|
12
|
|
$
|
23
|
|
|||
|
Gross realized losses
|
(74
|
)
|
(6
|
)
|
(25
|
)
|
||||||
|
Net realized gains (losses)
|
70
|
|
6
|
|
(2
|
)
|
||||||
|
OTTI recognized in earnings:
|
||||||||||||
|
Credit-related OTTI
|
(2
|
)
|
(11
|
)
|
(25
|
)
|
||||||
|
Intent-to-sell OTTI
|
(3
|
)
|
(6
|
)
|
(5
|
)
|
||||||
|
Total OTTI recognized in earnings
|
(5
|
)
|
(17
|
)
|
(30
|
)
|
||||||
|
Net securities gains (losses)
|
$
|
65
|
|
$
|
(11
|
)
|
$
|
(32
|
)
|
|||
|
Total proceeds from sales
|
$
|
8,181
|
|
$
|
4,146
|
|
$
|
4,379
|
|
|||
The cumulative credit loss component of the OTTI losses that have been recognized in our consolidated statements of income related to the securities that we do not intend to sell was
$147 million
,
$207 million
and
$199 million
for the years ended
December 31, 2017
,
2016
and
2015
, respectively.
Securities Pledged and Received
As part of our liquidity management strategy, we pledge securities to secure borrowings from counterparties including FHLB. We also pledge securities to secure trust and public deposits and for other purposes as required or permitted by law. We pledged securities available for sale with a fair value of
$2.8 billion
and
$1.9 billion
as of
December 31, 2017
and
2016
, respectively. We also pledged securities held to maturity with a carrying value of
$5.7 billion
and
$8.1 billion
as of
December 31, 2017
and
2016
, respectively. We accepted pledges of securities with a fair value of
$1 million
and
$16 million
as of
December 31, 2017
and
2016
, respectively, primarily related to our derivative transactions.
Purchased Credit-Impaired Debt Securities
The table below presents the outstanding balance and carrying value of the purchased credit-impaired debt securities as of
December 31, 2017
and
2016
.
Table
3.7
: Outstanding Balance and Carrying Value of Purchased Credit-Impaired Debt Securities
|
(Dollars in millions)
|
December 31, 2017
|
December 31, 2016
|
||||||
|
Outstanding balance
|
$
|
2,131
|
|
$
|
2,899
|
|
||
|
Carrying value
|
1,843
|
|
2,277
|
|
||||
|
146
|
Capital One Financial Corporation (COF)
|
|
Changes in Accretable Yield of Purchased Credit-Impaired Debt Securities
The following table presents changes in the accretable yield related to the purchased credit-impaired debt securities for
the years ended December 31, 2017, 2016 and 2015
.
Table
3.8
: Changes in the Accretable Yield of Purchased Credit-Impaired Debt Securities
|
Year Ended December 31,
|
||||||||||||
|
(Dollars in millions)
|
2017
|
2016
|
2015
|
|||||||||
|
Accretable yield, beginning of period
|
$
|
1,173
|
|
$
|
1,237
|
|
$
|
1,250
|
|
|||
|
Accretion recognized in earnings
|
(182
|
)
|
(206
|
)
|
(240
|
)
|
||||||
|
Reduction due to payoffs, disposals, transfers and other
|
(157
|
)
|
(2
|
)
|
(1
|
)
|
||||||
|
Net reclassifications (to) from nonaccretable difference
|
(8
|
)
|
144
|
|
228
|
|
||||||
|
Accretable yield, end of period
|
$
|
826
|
|
$
|
1,173
|
|
$
|
1,237
|
|
|||
|
147
|
Capital One Financial Corporation (COF)
|
|
|
|
Loan Portfolio Composition
Our loan portfolio consists of loans held for investment, including loans held in our consolidated trusts and loans held for sale, and is divided into three portfolio segments: credit card, consumer banking and commercial banking. Credit card loans consist of domestic and international credit card loans. Consumer banking loans consist of auto, home and retail banking loans. Commercial banking loans consist of commercial and multifamily real estate, commercial and industrial, and small-ticket commercial real estate loans.
Our portfolio of loans held for investment also includes certain consumer and commercial loans acquired through business combinations that were recorded at fair value at acquisition and subsequently accounted for based on cash flows expected to be collected, which are referred to as PCI loans. See “
Note 1—Summary of Significant Accounting Policies
” for additional information on the accounting guidance for these loans. The credit metrics presented in this section exclude loans held for sale, which are carried at lower of cost or fair value.
Credit Quality
We closely monitor economic conditions and loan performance trends to manage and evaluate our exposure to credit risk. Trends in delinquency rates are an indicator, among other considerations, of credit risk within our loan portfolio. The level of nonperforming loans represents another indicator of the potential for future credit losses. Accordingly, key metrics we track and use in evaluating the credit quality of our loan portfolio include delinquency and nonperforming loan rates, as well as net charge-off rates and our internal risk ratings of larger-balance commercial loans.
The table below presents the composition and an aging analysis of our loans held for investment portfolio as of
December 31, 2017
and
2016
. The delinquency aging includes all past due loans, both performing and nonperforming.
|
148
|
Capital One Financial Corporation (COF)
|
|
Table
4.1
: Loan Portfolio Composition and Aging Analysis
__________
|
|
December 31, 2017
|
|||||||||||||||||||||||||||
|
(Dollars in millions)
|
Current
|
30-59
Days
|
60-89
Days
|
>
90
Days
|
Total
Delinquent
Loans
|
PCI
Loans
|
Total
Loans
|
|||||||||||||||||||||
|
Credit Card:
|
||||||||||||||||||||||||||||
|
Domestic credit card
|
$
|
101,072
|
|
$
|
1,211
|
|
$
|
915
|
|
$
|
2,093
|
|
$
|
4,219
|
|
$
|
2
|
|
$
|
105,293
|
|
|||||||
|
International card businesses
|
9,110
|
|
144
|
|
81
|
|
134
|
|
359
|
|
0
|
|
9,469
|
|
||||||||||||||
|
Total credit card
|
110,182
|
|
1,355
|
|
996
|
|
2,227
|
|
4,578
|
|
2
|
|
114,762
|
|
||||||||||||||
|
Consumer Banking:
|
||||||||||||||||||||||||||||
|
Auto
|
50,151
|
|
2,483
|
|
1,060
|
|
297
|
|
3,840
|
|
0
|
|
53,991
|
|
||||||||||||||
|
Home loan
|
7,235
|
|
37
|
|
16
|
|
70
|
|
123
|
|
10,275
|
|
17,633
|
|
||||||||||||||
|
Retail banking
|
3,389
|
|
24
|
|
5
|
|
18
|
|
47
|
|
18
|
|
3,454
|
|
||||||||||||||
|
Total consumer banking
|
60,775
|
|
2,544
|
|
1,081
|
|
385
|
|
4,010
|
|
10,293
|
|
75,078
|
|
||||||||||||||
|
Commercial Banking:
|
||||||||||||||||||||||||||||
|
Commercial and multifamily real estate
|
26,018
|
|
41
|
|
17
|
|
49
|
|
107
|
|
25
|
|
26,150
|
|
||||||||||||||
|
Commercial and industrial
|
37,412
|
|
1
|
|
70
|
|
87
|
|
158
|
|
455
|
|
38,025
|
|
||||||||||||||
|
Total commercial lending
|
63,430
|
|
42
|
|
87
|
|
136
|
|
265
|
|
480
|
|
64,175
|
|
||||||||||||||
|
Small-ticket commercial real estate
|
393
|
|
2
|
|
1
|
|
4
|
|
7
|
|
0
|
|
400
|
|
||||||||||||||
|
Total commercial banking
|
63,823
|
|
44
|
|
88
|
|
140
|
|
272
|
|
480
|
|
64,575
|
|
||||||||||||||
|
Other loans
|
54
|
|
2
|
|
1
|
|
1
|
|
4
|
|
0
|
|
58
|
|
||||||||||||||
|
Total loans
(1)
|
$
|
234,834
|
|
$
|
3,945
|
|
$
|
2,166
|
|
$
|
2,753
|
|
$
|
8,864
|
|
$
|
10,775
|
|
$
|
254,473
|
|
|||||||
|
% of Total loans
|
92.29
|
%
|
1.55
|
%
|
0.85
|
%
|
1.08
|
%
|
3.48
|
%
|
4.23
|
%
|
100.00
|
%
|
||||||||||||||
|
December 31, 2016
|
||||||||||||||||||||||||||||
|
(Dollars in millions)
|
Current
|
30-59
Days
|
60-89
Days
|
>
90
Days
|
Total
Delinquent
Loans
|
PCI Loans
|
Total
Loans
|
|||||||||||||||||||||
|
Credit Card:
|
||||||||||||||||||||||||||||
|
Domestic credit card
|
$
|
93,279
|
|
$
|
1,153
|
|
$
|
846
|
|
$
|
1,840
|
|
$
|
3,839
|
|
$
|
2
|
|
$
|
97,120
|
|
|||||||
|
International card businesses
|
8,115
|
|
124
|
|
72
|
|
121
|
|
317
|
|
0
|
|
8,432
|
|
||||||||||||||
|
Total credit card
|
101,394
|
|
1,277
|
|
918
|
|
1,961
|
|
4,156
|
|
2
|
|
105,552
|
|
||||||||||||||
|
Consumer Banking:
|
||||||||||||||||||||||||||||
|
Auto
|
44,762
|
|
2,041
|
|
890
|
|
223
|
|
3,154
|
|
0
|
|
47,916
|
|
||||||||||||||
|
Home loan
|
6,951
|
|
44
|
|
20
|
|
141
|
|
205
|
|
14,428
|
|
21,584
|
|
||||||||||||||
|
Retail banking
|
3,477
|
|
22
|
|
7
|
|
20
|
|
49
|
|
28
|
|
3,554
|
|
||||||||||||||
|
Total consumer banking
|
55,190
|
|
2,107
|
|
917
|
|
384
|
|
3,408
|
|
14,456
|
|
73,054
|
|
||||||||||||||
|
Commercial Banking:
|
||||||||||||||||||||||||||||
|
Commercial and multifamily real estate
|
26,536
|
|
45
|
|
0
|
|
0
|
|
45
|
|
28
|
|
26,609
|
|
||||||||||||||
|
Commercial and industrial
|
38,831
|
|
27
|
|
84
|
|
297
|
|
408
|
|
585
|
|
39,824
|
|
||||||||||||||
|
Total commercial lending
|
65,367
|
|
72
|
|
84
|
|
297
|
|
453
|
|
613
|
|
66,433
|
|
||||||||||||||
|
Small-ticket commercial real estate
|
473
|
|
7
|
|
1
|
|
2
|
|
10
|
|
0
|
|
483
|
|
||||||||||||||
|
Total commercial banking
|
65,840
|
|
79
|
|
85
|
|
299
|
|
463
|
|
613
|
|
66,916
|
|
||||||||||||||
|
Other loans
|
56
|
|
3
|
|
0
|
|
5
|
|
8
|
|
0
|
|
64
|
|
||||||||||||||
|
Total loans
(1)
|
$
|
222,480
|
|
$
|
3,466
|
|
$
|
1,920
|
|
$
|
2,649
|
|
$
|
8,035
|
|
$
|
15,071
|
|
$
|
245,586
|
|
|||||||
|
% of Total loans
|
90.59
|
%
|
1.41
|
%
|
0.78
|
%
|
1.08
|
%
|
3.27
|
%
|
6.14
|
%
|
100.00
|
%
|
||||||||||||||
|
(1)
|
Loans, other than PCI loans, include unamortized premiums and discounts, and unamortized deferred fees and costs totaling
$773 million
and
$558 million
as of
December 31, 2017
and
2016
, respectively.
|
|
149
|
Capital One Financial Corporation (COF)
|
|
We pledged loan collateral of
$27.3 billion
and
$29.3 billion
to secure the majority of our FHLB borrowing capacity of
$21.0 billion
and
$24.9 billion
as of
December 31, 2017
and
2016
, respectively.
The following table presents the outstanding balance of loans 90 days or more past due that continue to accrue interest and loans classified as nonperforming as of
December 31, 2017
and
2016
. Nonperforming loans generally include loans that have been placed on nonaccrual status. PCI loans are excluded from the table below. See “
Note 1—Summary of Significant Accounting Policies
” for additional information on our policies for nonperforming loans and accounting for PCI loans.
Table
4.2
: 90+ Day Delinquent Loans Accruing Interest and Nonperforming Loans
|
December 31, 2017
|
December 31, 2016
|
|||||||||||||||
|
(Dollars in millions)
|
>
90 Days and Accruing
|
Nonperforming
Loans
|
>
90 Days and Accruing
|
Nonperforming
Loans
|
||||||||||||
|
Credit Card:
|
||||||||||||||||
|
Domestic credit card
|
$
|
2,093
|
|
N/A
|
|
$
|
1,840
|
|
N/A
|
|
||||||
|
International card businesses
|
128
|
|
$
|
24
|
|
96
|
|
$
|
42
|
|
||||||
|
Total credit card
|
2,221
|
|
24
|
|
1,936
|
|
42
|
|
||||||||
|
Consumer Banking:
|
||||||||||||||||
|
Auto
|
0
|
|
376
|
|
0
|
|
223
|
|
||||||||
|
Home loan
|
0
|
|
176
|
|
0
|
|
273
|
|
||||||||
|
Retail banking
|
0
|
|
35
|
|
0
|
|
31
|
|
||||||||
|
Total consumer banking
|
0
|
|
587
|
|
0
|
|
527
|
|
||||||||
|
Commercial Banking:
|
||||||||||||||||
|
Commercial and multifamily real estate
|
12
|
|
38
|
|
0
|
|
30
|
|
||||||||
|
Commercial and industrial
|
0
|
|
239
|
|
0
|
|
988
|
|
||||||||
|
Total commercial lending
|
12
|
|
277
|
|
0
|
|
1,018
|
|
||||||||
|
Small-ticket commercial real estate
|
0
|
|
7
|
|
0
|
|
4
|
|
||||||||
|
Total commercial banking
|
12
|
|
284
|
|
0
|
|
1,022
|
|
||||||||
|
Other loans
|
0
|
|
4
|
|
0
|
|
8
|
|
||||||||
|
Total
|
$
|
2,233
|
|
$
|
899
|
|
$
|
1,936
|
|
$
|
1,599
|
|
||||
|
% of Total loans
|
0.88
|
%
|
0.35
|
%
|
0.79
|
%
|
0.65
|
%
|
||||||||
Credit Card
Our credit card loan portfolio is highly diversified across millions of accounts and numerous geographies without significant individual exposure. We therefore generally manage credit risk based on portfolios with common risk characteristics. The risk in our credit card loan portfolio correlates to broad economic trends, such as unemployment rates and home values, as well as consumers’ financial condition, all of which can have a material effect on credit performance. The primary indicators we assess in monitoring the credit quality and risk of our credit card portfolio are delinquency and charge-off trends, including an analysis of loan migration between delinquency categories over time.
The table below displays the geographic profile of our credit card loan portfolio as of
December 31, 2017
and
2016
.
Table
4.3
: Credit Card Risk Profile by Geographic Region
|
|
December 31, 2017
|
December 31, 2016
|
||||||||||||
|
(Dollars in millions)
|
Amount
|
% of
Total
|
Amount
|
% of
Total
|
||||||||||
|
Domestic credit card:
|
||||||||||||||
|
California
|
$
|
11,475
|
|
10.0
|
%
|
$
|
11,068
|
|
10.5
|
%
|
||||
|
Texas
|
7,847
|
|
6.8
|
|
7,227
|
|
6.8
|
|
||||||
|
New York
|
7,389
|
|
6.4
|
|
7,090
|
|
6.7
|
|
||||||
|
Florida
|
6,790
|
|
5.9
|
|
6,540
|
|
6.2
|
|
||||||
|
Illinois
|
4,734
|
|
4.1
|
|
4,492
|
|
4.3
|
|
||||||
|
Pennsylvania
|
4,550
|
|
4.0
|
|
4,048
|
|
3.8
|
|
||||||
|
Ohio
|
3,929
|
|
3.4
|
|
3,654
|
|
3.5
|
|
||||||
|
New Jersey
|
3,621
|
|
3.2
|
|
3,488
|
|
3.3
|
|
||||||
|
Michigan
|
3,523
|
|
3.1
|
|
3,164
|
|
3.0
|
|
||||||
|
Other
|
51,435
|
|
44.8
|
|
46,349
|
|
43.9
|
|
||||||
|
Total domestic credit card
|
105,293
|
|
91.7
|
|
97,120
|
|
92.0
|
|
||||||
|
International card businesses:
|
||||||||||||||
|
Canada
|
6,286
|
|
5.5
|
|
5,594
|
|
5.3
|
|
||||||
|
United Kingdom
|
3,183
|
|
2.8
|
|
2,838
|
|
2.7
|
|
||||||
|
Total international card businesses
|
9,469
|
|
8.3
|
|
8,432
|
|
8.0
|
|
||||||
|
Total credit card
|
$
|
114,762
|
|
100.0
|
%
|
$
|
105,552
|
|
100.0
|
%
|
||||
The table below presents net charge-offs for the years ended December 31, 2017 and 2016.
Table
4.4
: Credit Card Net Charge-Offs
__________
|
|
Year Ended December 31,
|
|||||||||||||
|
|
2017
|
2016
|
||||||||||||
|
(Dollars in millions)
|
Amount
|
Rate
(1)
|
Amount
|
Rate
(1)
|
||||||||||
|
Net charge-offs:
(1)
|
||||||||||||||
|
Domestic credit card
(2)
|
$
|
4,739
|
|
4.99
|
%
|
$
|
3,681
|
|
4.16
|
%
|
||||
|
International card businesses
|
315
|
|
3.69
|
|
272
|
|
3.33
|
|
||||||
|
Total credit card
(2)
|
$
|
5,054
|
|
4.88
|
|
$
|
3,953
|
|
4.09
|
|
||||
|
(1)
|
Net charge-offs consist of the unpaid principal balance of loans held for investment that we determine to be uncollectible, net of recovered amounts.
Net charge-off
rate is calculated by dividing net charge-offs by average loans held for investment for the period for each loan category
. Net charge-offs and the net charge-off rate are impacted periodically by fluctuations in recoveries, including loan sales.
|
|
(2)
|
Excluding the impact of the Cabela’s acquisition, the domestic credit card and total credit card net charge-off rates for the year ended December 31, 2017 would have been
5.07%
and
4.95%
, respectively.
|
Consumer Banking
Our consumer banking loan portfolio consists of auto, home and retail banking loans. Similar to our credit card loan portfolio, the risk in our consumer banking loan portfolio correlates to broad economic trends, such as unemployment rates, gross domestic product (“GDP”) and home values, as well as consumers’ financial condition, all of which can have a material effect on credit performance. Delinquency, nonperforming loans and charge-off trends are key indicators we assess in monitoring the credit quality and risk of our consumer banking loan portfolio.
|
150
|
Capital One Financial Corporation (COF)
|
|
The table below displays the geographic profile of our consumer banking loan portfolio, including PCI loans, as of
December 31, 2017
and
2016
.
Table
4.5
: Consumer Banking Risk Profile by Geographic Region
|
|
December 31, 2017
|
December 31, 2016
|
||||||||||||
|
(Dollars in millions)
|
Amount
|
% of Total
|
Amount
|
% of
Total
|
||||||||||
|
Auto:
|
||||||||||||||
|
Texas
|
$
|
7,040
|
|
9.4
|
%
|
$
|
6,304
|
|
8.6
|
%
|
||||
|
California
|
6,099
|
|
8.1
|
|
5,448
|
|
7.5
|
|
||||||
|
Florida
|
4,486
|
|
6.0
|
|
3,985
|
|
5.5
|
|
||||||
|
Georgia
|
2,726
|
|
3.6
|
|
2,506
|
|
3.4
|
|
||||||
|
Ohio
|
2,318
|
|
3.1
|
|
2,017
|
|
2.8
|
|
||||||
|
Louisiana
|
2,236
|
|
3.0
|
|
2,159
|
|
3.0
|
|
||||||
|
Illinois
|
2,181
|
|
2.9
|
|
2,065
|
|
2.8
|
|
||||||
|
Other
|
26,905
|
|
35.8
|
|
23,432
|
|
32.0
|
|
||||||
|
Total auto
|
53,991
|
|
71.9
|
|
47,916
|
|
65.6
|
|
||||||
|
Home loan:
|
||||||||||||||
|
California
|
3,734
|
|
5.0
|
|
4,993
|
|
6.8
|
|
||||||
|
New York
|
1,941
|
|
2.6
|
|
2,036
|
|
2.8
|
|
||||||
|
Maryland
|
1,226
|
|
1.6
|
|
1,409
|
|
1.9
|
|
||||||
|
Virginia
|
1,034
|
|
1.4
|
|
1,204
|
|
1.7
|
|
||||||
|
Illinois
|
976
|
|
1.3
|
|
1,218
|
|
1.7
|
|
||||||
|
New Jersey
|
931
|
|
1.2
|
|
1,112
|
|
1.5
|
|
||||||
|
Texas
|
882
|
|
1.2
|
|
823
|
|
1.1
|
|
||||||
|
Other
|
6,909
|
|
9.2
|
|
8,789
|
|
12.0
|
|
||||||
|
Total home loan
|
17,633
|
|
23.5
|
|
21,584
|
|
29.5
|
|
||||||
|
Retail banking:
|
||||||||||||||
|
New York
|
955
|
|
1.3
|
|
941
|
|
1.3
|
|
||||||
|
Louisiana
|
953
|
|
1.3
|
|
1,010
|
|
1.4
|
|
||||||
|
Texas
|
717
|
|
0.9
|
|
756
|
|
1.0
|
|
||||||
|
New Jersey
|
221
|
|
0.3
|
|
238
|
|
0.3
|
|
||||||
|
Maryland
|
187
|
|
0.2
|
|
190
|
|
0.3
|
|
||||||
|
Virginia
|
154
|
|
0.2
|
|
156
|
|
0.2
|
|
||||||
|
Other
|
267
|
|
0.4
|
|
263
|
|
0.4
|
|
||||||
|
Total retail banking
|
3,454
|
|
4.6
|
|
3,554
|
|
4.9
|
|
||||||
|
Total consumer banking
|
$
|
75,078
|
|
100.0
|
%
|
$
|
73,054
|
|
100.0
|
%
|
||||
|
151
|
Capital One Financial Corporation (COF)
|
|
The table below presents net charge-offs in our consumer banking loan portfolio for the years ended December 31, 2017 and 2016, as well as nonperforming loans as of
December 31, 2017
and
2016
.
Table
4.6
: Consumer Banking Net Charge-Offs and Nonperforming Loans
__________
|
|
Year Ended December 31,
|
|||||||||||||
|
|
2017
|
2016
|
||||||||||||
|
(Dollars in millions)
|
Amount
|
Rate
(1)
|
Amount
|
Rate
(1)
|
||||||||||
|
Net charge-offs:
|
||||||||||||||
|
Auto
|
$
|
957
|
|
1.86
|
%
|
$
|
752
|
|
1.69
|
%
|
||||
|
Home loan
(2)
|
15
|
|
0.08
|
|
14
|
|
0.06
|
|
||||||
|
Retail banking
|
66
|
|
1.92
|
|
54
|
|
1.53
|
|
||||||
|
Total consumer banking
(2)
|
$
|
1,038
|
|
1.39
|
|
$
|
820
|
|
1.15
|
|
||||
|
|
December 31, 2017
|
December 31, 2016
|
||||||||||||
|
(Dollars in millions)
|
Amount
|
Rate
(3)
|
Amount
|
Rate
(3)
|
||||||||||
|
Nonperforming loans:
|
||||||||||||||
|
Auto
|
$
|
376
|
|
0.70
|
%
|
$
|
223
|
|
0.47
|
%
|
||||
|
Home loan
(4)
|
176
|
|
1.00
|
|
273
|
|
1.26
|
|
||||||
|
Retail banking
|
35
|
|
1.00
|
|
31
|
|
0.86
|
|
||||||
|
Total consumer banking
(4)
|
$
|
587
|
|
0.78
|
|
$
|
527
|
|
0.72
|
|
||||
|
(1)
|
Net charge-off
rate is calculated by dividing net charge-offs by average loans held for investment for the period for each loan category
.
|
|
(2)
|
Excluding the impact of PCI loans, the net charge-off rates for our home loan and total consumer banking portfolios were
0.07%
and
1.65%
, respectively, for
the year ended December 31, 2017
compared to
0.20%
and
1.49%
, respectively, for
the year ended December 31, 2016
.
|
|
(3)
|
Nonperforming loan rates are calculated based on nonperforming loans for each category divided by period-end total loans held for investment for each respective category.
|
|
(4)
|
Excluding the impact of PCI loans, the nonperforming loan rates for our home loan and total consumer banking portfolios were
2.39%
and
0.91%
, respectively, as of
December 31, 2017
compared to
3.81%
and
0.90%
, respectively, as of
December 31, 2016
.
|
Home Loan
Our home loan portfolio consists of both first-lien and second-lien residential mortgage loans. In evaluating the credit quality and risk of our home loan portfolio, we monitor a variety of mortgage loan characteristics that may affect the default experience on this loan portfolio, such as vintage, geographic concentrations, lien priority and product type. Certain loan concentrations have experienced higher delinquency rates as a result of the significant decline in home prices after the peak in 2006 and subsequent rise in unemployment. These loan concentrations include loans originated between 2006 and 2008 in an environment of decreasing home sales, broadly declining home prices and more relaxed underwriting standards.
The following table presents the distribution of our home loan portfolio as of
December 31, 2017
and
2016
based on selected key risk characteristics.
|
152
|
Capital One Financial Corporation (COF)
|
|
Table
4.7
: Home Loan Risk Profile by Vintage, Geography, Lien Priority and Interest Rate Type
|
|
December 31, 2017
|
||||||||||||||||||||
|
|
Loans
|
PCI Loans
(1)
|
Total Home Loans
|
||||||||||||||||||
|
(Dollars in millions)
|
Amount
|
% of
Total
|
Amount
|
% of
Total
|
Amount
|
% of
Total
|
|||||||||||||||
|
Origination year:
(2)
|
|||||||||||||||||||||
|
<
2008
|
$
|
1,586
|
|
9.0
|
%
|
$
|
6,919
|
|
39.2
|
%
|
$
|
8,505
|
|
48.2
|
%
|
||||||
|
2009
|
62
|
|
0.4
|
|
769
|
|
4.4
|
|
831
|
|
4.8
|
|
|||||||||
|
2010
|
64
|
|
0.4
|
|
1,078
|
|
6.1
|
|
1,142
|
|
6.5
|
|
|||||||||
|
2011
|
113
|
|
0.6
|
|
1,181
|
|
6.7
|
|
1,294
|
|
7.3
|
|
|||||||||
|
2012
|
673
|
|
3.8
|
|
178
|
|
1.0
|
|
851
|
|
4.8
|
|
|||||||||
|
2013
|
381
|
|
2.2
|
|
46
|
|
0.3
|
|
427
|
|
2.5
|
|
|||||||||
|
2014
|
467
|
|
2.6
|
|
25
|
|
0.1
|
|
492
|
|
2.7
|
|
|||||||||
|
2015
|
905
|
|
5.1
|
|
28
|
|
0.2
|
|
933
|
|
5.3
|
|
|||||||||
|
2016
|
1,604
|
|
9.1
|
|
23
|
|
0.1
|
|
1,627
|
|
9.2
|
|
|||||||||
|
2017
|
1,503
|
|
8.5
|
|
28
|
|
0.2
|
|
1,531
|
|
8.7
|
|
|||||||||
|
Total
|
$
|
7,358
|
|
41.7
|
%
|
$
|
10,275
|
|
58.3
|
%
|
$
|
17,633
|
|
100.0
|
%
|
||||||
|
Geographic concentration:
|
|||||||||||||||||||||
|
California
|
$
|
987
|
|
5.6
|
%
|
$
|
2,747
|
|
15.6
|
%
|
$
|
3,734
|
|
21.2
|
%
|
||||||
|
New York
|
1,427
|
|
8.1
|
|
514
|
|
2.9
|
|
1,941
|
|
11.0
|
|
|||||||||
|
Maryland
|
608
|
|
3.4
|
|
618
|
|
3.5
|
|
1,226
|
|
6.9
|
|
|||||||||
|
Virginia
|
532
|
|
3.0
|
|
502
|
|
2.8
|
|
1,034
|
|
5.8
|
|
|||||||||
|
Illinois
|
163
|
|
0.9
|
|
813
|
|
4.6
|
|
976
|
|
5.5
|
|
|||||||||
|
New Jersey
|
389
|
|
2.2
|
|
542
|
|
3.1
|
|
931
|
|
5.3
|
|
|||||||||
|
Texas
|
811
|
|
4.6
|
|
71
|
|
0.4
|
|
882
|
|
5.0
|
|
|||||||||
|
Louisiana
|
826
|
|
4.7
|
|
17
|
|
0.1
|
|
843
|
|
4.8
|
|
|||||||||
|
Florida
|
186
|
|
1.1
|
|
582
|
|
3.3
|
|
768
|
|
4.4
|
|
|||||||||
|
Arizona
|
91
|
|
0.5
|
|
577
|
|
3.3
|
|
668
|
|
3.8
|
|
|||||||||
|
Other
|
1,338
|
|
7.6
|
|
3,292
|
|
18.7
|
|
4,630
|
|
26.3
|
|
|||||||||
|
Total
|
$
|
7,358
|
|
41.7
|
%
|
$
|
10,275
|
|
58.3
|
%
|
$
|
17,633
|
|
100.0
|
%
|
||||||
|
Lien type:
|
|||||||||||||||||||||
|
1
st
lien
|
$
|
6,364
|
|
36.1
|
%
|
$
|
10,054
|
|
57.0
|
%
|
$
|
16,418
|
|
93.1
|
%
|
||||||
|
2
nd
lien
|
994
|
|
5.6
|
|
221
|
|
1.3
|
|
1,215
|
|
6.9
|
|
|||||||||
|
Total
|
$
|
7,358
|
|
41.7
|
%
|
$
|
10,275
|
|
58.3
|
%
|
$
|
17,633
|
|
100.0
|
%
|
||||||
|
Interest rate type:
|
|||||||||||||||||||||
|
Fixed rate
|
$
|
3,722
|
|
21.1
|
%
|
$
|
1,505
|
|
8.5
|
%
|
$
|
5,227
|
|
29.6
|
%
|
||||||
|
Adjustable rate
|
3,636
|
|
20.6
|
|
8,770
|
|
49.8
|
|
12,406
|
|
70.4
|
|
|||||||||
|
Total
|
$
|
7,358
|
|
41.7
|
%
|
$
|
10,275
|
|
58.3
|
%
|
$
|
17,633
|
|
100.0
|
%
|
||||||
|
153
|
Capital One Financial Corporation (COF)
|
|
|
|
December 31, 2016
|
||||||||||||||||||||
|
|
Loans
|
PCI Loans
(1)
|
Total Home Loans
|
||||||||||||||||||
|
(Dollars in millions)
|
Amount
|
% of
Total
|
Amount
|
% of
Total
|
Amount
|
% of
Total
|
|||||||||||||||
|
Origination year:
(2)
|
|||||||||||||||||||||
|
<
2008
|
$
|
2,166
|
|
10.0
|
%
|
$
|
9,684
|
|
44.9
|
%
|
$
|
11,850
|
|
54.9
|
%
|
||||||
|
2009
|
80
|
|
0.4
|
|
1,088
|
|
5.0
|
|
1,168
|
|
5.4
|
|
|||||||||
|
2010
|
82
|
|
0.4
|
|
1,562
|
|
7.2
|
|
1,644
|
|
7.6
|
|
|||||||||
|
2011
|
139
|
|
0.6
|
|
1,683
|
|
7.8
|
|
1,822
|
|
8.4
|
|
|||||||||
|
2012
|
969
|
|
4.5
|
|
268
|
|
1.2
|
|
1,237
|
|
5.7
|
|
|||||||||
|
2013
|
465
|
|
2.2
|
|
59
|
|
0.2
|
|
524
|
|
2.4
|
|
|||||||||
|
2014
|
557
|
|
2.6
|
|
31
|
|
0.2
|
|
588
|
|
2.8
|
|
|||||||||
|
2015
|
1,024
|
|
4.7
|
|
30
|
|
0.2
|
|
1,054
|
|
4.9
|
|
|||||||||
|
2016
|
1,674
|
|
7.8
|
|
23
|
|
0.1
|
|
1,697
|
|
7.9
|
|
|||||||||
|
Total
|
$
|
7,156
|
|
33.2
|
%
|
$
|
14,428
|
|
66.8
|
%
|
$
|
21,584
|
|
100.0
|
%
|
||||||
|
Geographic concentration:
|
|||||||||||||||||||||
|
California
|
$
|
976
|
|
4.5
|
%
|
$
|
4,017
|
|
18.6
|
%
|
$
|
4,993
|
|
23.1
|
%
|
||||||
|
New York
|
1,343
|
|
6.2
|
|
693
|
|
3.2
|
|
2,036
|
|
9.4
|
|
|||||||||
|
Maryland
|
585
|
|
2.7
|
|
824
|
|
3.9
|
|
1,409
|
|
6.6
|
|
|||||||||
|
Illinois
|
108
|
|
0.5
|
|
1,110
|
|
5.1
|
|
1,218
|
|
5.6
|
|
|||||||||
|
Virginia
|
490
|
|
2.3
|
|
714
|
|
3.3
|
|
1,204
|
|
5.6
|
|
|||||||||
|
New Jersey
|
379
|
|
1.8
|
|
733
|
|
3.4
|
|
1,112
|
|
5.2
|
|
|||||||||
|
Louisiana
|
962
|
|
4.5
|
|
23
|
|
0.1
|
|
985
|
|
4.6
|
|
|||||||||
|
Florida
|
159
|
|
0.7
|
|
772
|
|
3.6
|
|
931
|
|
4.3
|
|
|||||||||
|
Arizona
|
89
|
|
0.4
|
|
799
|
|
3.7
|
|
888
|
|
4.1
|
|
|||||||||
|
Texas
|
725
|
|
3.4
|
|
98
|
|
0.4
|
|
823
|
|
3.8
|
|
|||||||||
|
Other
|
1,340
|
|
6.2
|
|
4,645
|
|
21.5
|
|
5,985
|
|
27.7
|
|
|||||||||
|
Total
|
$
|
7,156
|
|
33.2
|
%
|
$
|
14,428
|
|
66.8
|
%
|
$
|
21,584
|
|
100.0
|
%
|
||||||
|
Lien type:
|
|||||||||||||||||||||
|
1
st
lien
|
$
|
6,182
|
|
28.7
|
%
|
$
|
14,159
|
|
65.5
|
%
|
$
|
20,341
|
|
94.2
|
%
|
||||||
|
2
nd
lien
|
974
|
|
4.5
|
|
269
|
|
1.3
|
|
1,243
|
|
5.8
|
|
|||||||||
|
Total
|
$
|
7,156
|
|
33.2
|
%
|
$
|
14,428
|
|
66.8
|
%
|
$
|
21,584
|
|
100.0
|
%
|
||||||
|
Interest rate type:
|
|||||||||||||||||||||
|
Fixed rate
|
$
|
3,394
|
|
15.8
|
%
|
$
|
1,822
|
|
8.4
|
%
|
$
|
5,216
|
|
24.2
|
%
|
||||||
|
Adjustable rate
|
3,762
|
|
17.4
|
|
12,606
|
|
58.4
|
|
16,368
|
|
75.8
|
|
|||||||||
|
Total
|
$
|
7,156
|
|
33.2
|
%
|
$
|
14,428
|
|
66.8
|
%
|
$
|
21,584
|
|
100.0
|
%
|
||||||
|
(1)
|
PCI loan balances with an origination date in the years subsequent to 2012 represent refinancing of previously acquired home loans.
|
|
(2)
|
Modified loans are reported in the origination year of the initial borrowing.
|
Our recorded investment in home loans that are in process of foreclosure was
$149 million
and
$382 million
as of
December 31, 2017
and
2016
, respectively. We commence the foreclosure process on home loans when a borrower becomes at least
120 days
delinquent in accordance with Consumer Financial Protection Bureau regulations. Foreclosure procedures and timelines vary according to state laws. As of
December 31, 2017
and
2016
, the carrying value of the foreclosed residential real estate properties we hold and include in other assets on our consolidated balance sheets totaled
$39 million
and
$69 million
, respectively.
|
154
|
Capital One Financial Corporation (COF)
|
|
Commercial Banking
We evaluate the credit risk of commercial loans using a risk rating system. We assign internal risk ratings to loans based on relevant information about the ability of the borrowers to repay their debt. In determining the risk rating of a particular loan, some of the factors considered are the borrower’s current financial condition, historical and projected future credit performance, prospects for support from financially responsible guarantors, the estimated realizable value of any collateral and current economic trends. The scale based on our internal risk rating system is as follows:
|
•
|
Noncriticized:
Loans that have not been designated as criticized, frequently referred to as “pass” loans.
|
|
•
|
Criticized performing:
Loans in which the financial condition of the obligor is stressed, affecting earnings, cash flows or collateral values. The borrower currently has adequate capacity to meet near-term obligations; however, the stress, left unabated, may result in deterioration of the repayment prospects at some future date.
|
|
•
|
Criticized nonperforming:
Loans that are not adequately protected by the current net worth and paying capacity of the obligor or the collateral pledged, if any. Loans classified as criticized nonperforming have a well-defined weakness, or weaknesses, which jeopardize the full repayment of the debt. These loans are characterized by the distinct possibility that we will sustain a credit loss if the deficiencies are not corrected and are generally placed on nonaccrual status.
|
We use our internal risk rating system for regulatory reporting, determining the frequency of credit exposure reviews, and evaluating and determining the allowance for loan and lease losses for commercial loans. Loans of
$1 million
or more that are designated as criticized performing and criticized nonperforming are reviewed quarterly by management to determine if they are appropriately classified/rated and whether any impairment exists. Noncriticized loans of
$1 million
or more are specifically reviewed, at least annually, to determine the appropriate risk rating. In addition, we evaluate the risk rating during the renewal process of any loan or if a loan becomes past due.
The following table presents the geographic concentration and internal risk ratings of our commercial loan portfolio as of
December 31, 2017
and
2016
.
Table
4.8
: Commercial Banking Risk Profile by Geographic Region and Internal Risk Rating
|
|
December 31, 2017
|
|||||||||||||||||||||||||||
|
(Dollars in millions)
|
Commercial
and
Multifamily
Real Estate
|
% of
Total
|
Commercial
and
Industrial
|
% of
Total
|
Small-Ticket
Commercial
Real Estate
|
% of
Total
|
Total
Commercial Banking
|
% of
Total
|
||||||||||||||||||||
|
Geographic concentration:
(1)
|
||||||||||||||||||||||||||||
|
Northeast
|
$
|
14,969
|
|
57.3
|
%
|
$
|
7,774
|
|
20.4
|
%
|
$
|
250
|
|
62.4
|
%
|
$
|
22,993
|
|
35.7
|
%
|
||||||||
|
Mid-Atlantic
|
2,675
|
|
10.2
|
|
3,922
|
|
10.3
|
|
15
|
|
3.8
|
|
6,612
|
|
10.2
|
|
||||||||||||
|
South
|
3,719
|
|
14.2
|
|
14,739
|
|
38.8
|
|
22
|
|
5.5
|
|
18,480
|
|
28.6
|
|
||||||||||||
|
Other
|
4,787
|
|
18.3
|
|
11,590
|
|
30.5
|
|
113
|
|
28.3
|
|
16,490
|
|
25.5
|
|
||||||||||||
|
Total
|
$
|
26,150
|
|
100.0
|
%
|
$
|
38,025
|
|
100.0
|
%
|
$
|
400
|
|
100.0
|
%
|
$
|
64,575
|
|
100.0
|
%
|
||||||||
|
Internal risk rating:
(2)
|
||||||||||||||||||||||||||||
|
Noncriticized
|
$
|
25,609
|
|
98.0
|
%
|
$
|
35,161
|
|
92.5
|
%
|
$
|
392
|
|
97.9
|
%
|
$
|
61,162
|
|
94.7
|
%
|
||||||||
|
Criticized performing
|
478
|
|
1.8
|
|
2,170
|
|
5.7
|
|
1
|
|
0.3
|
|
2,649
|
|
4.1
|
|
||||||||||||
|
Criticized nonperforming
|
38
|
|
0.1
|
|
239
|
|
0.6
|
|
7
|
|
1.8
|
|
284
|
|
0.4
|
|
||||||||||||
|
PCI loans
|
25
|
|
0.1
|
|
455
|
|
1.2
|
|
0
|
|
0.0
|
|
480
|
|
0.8
|
|
||||||||||||
|
Total
|
$
|
26,150
|
|
100.0
|
%
|
$
|
38,025
|
|
100.0
|
%
|
$
|
400
|
|
100.0
|
%
|
$
|
64,575
|
|
100.0
|
%
|
||||||||
|
155
|
Capital One Financial Corporation (COF)
|
|
|
|
December 31, 2016
|
|||||||||||||||||||||||||||
|
(Dollars in millions)
|
Commercial
and
Multifamily
Real Estate
|
% of
Total
(1)
|
Commercial
and
Industrial
|
% of
Total
|
Small-Ticket
Commercial
Real Estate
|
% of
Total
|
Total
Commercial Banking
|
% of
Total
|
||||||||||||||||||||
|
Geographic concentration:
(1)
|
||||||||||||||||||||||||||||
|
Northeast
|
$
|
15,714
|
|
59.0
|
%
|
$
|
9,628
|
|
24.2
|
%
|
$
|
298
|
|
61.7
|
%
|
$
|
25,640
|
|
38.3
|
%
|
||||||||
|
Mid-Atlantic
|
3,024
|
|
11.4
|
|
3,450
|
|
8.7
|
|
16
|
|
3.3
|
|
6,490
|
|
9.7
|
|
||||||||||||
|
South
|
4,032
|
|
15.2
|
|
15,193
|
|
38.1
|
|
34
|
|
7.0
|
|
19,259
|
|
28.8
|
|
||||||||||||
|
Other
|
3,839
|
|
14.4
|
|
11,553
|
|
29.0
|
|
135
|
|
28.0
|
|
15,527
|
|
23.2
|
|
||||||||||||
|
Total
|
$
|
26,609
|
|
100.0
|
%
|
$
|
39,824
|
|
100.0
|
%
|
$
|
483
|
|
100.0
|
%
|
$
|
66,916
|
|
100.0
|
%
|
||||||||
|
Internal risk rating:
(2)
|
||||||||||||||||||||||||||||
|
Noncriticized
|
$
|
26,309
|
|
98.9
|
%
|
$
|
36,046
|
|
90.5
|
%
|
$
|
473
|
|
97.9
|
%
|
$
|
62,828
|
|
93.9
|
%
|
||||||||
|
Criticized performing
|
242
|
|
0.9
|
|
2,205
|
|
5.5
|
|
6
|
|
1.3
|
|
2,453
|
|
3.7
|
|
||||||||||||
|
Criticized nonperforming
|
30
|
|
0.1
|
|
988
|
|
2.5
|
|
4
|
|
0.8
|
|
1,022
|
|
1.5
|
|
||||||||||||
|
PCI loans
|
28
|
|
0.1
|
|
585
|
|
1.5
|
|
0
|
|
0.0
|
|
613
|
|
0.9
|
|
||||||||||||
|
Total
|
$
|
26,609
|
|
100.0
|
%
|
$
|
39,824
|
|
100.0
|
%
|
$
|
483
|
|
100.0
|
%
|
$
|
66,916
|
|
100.0
|
%
|
||||||||
|
(1)
|
Geographic concentration is generally determined by the location of the borrower’s business or the location of the collateral associated with the loan.
Northeast consists of CT, MA, ME, NH, NJ, NY, PA and VT. Mid-Atlantic consists of DC,
DE, MD, VA and WV. South consists of AL, AR, FL, GA, KY, LA, MO, MS, NC, SC, TN and TX.
|
|
(2)
|
Criticized exposures correspond to the “Special Mention,” “Substandard” and “Doubtful” asset c
ategories defined by bank regulatory authorities.
|
Impaired Loans
The following table presents information on our impaired loans as of
December 31, 2017
and
2016
, and for
the years ended December 31, 2017, 2016 and 2015
.
Impaired loans include loans modified in TDRs, all nonperforming commercial loans and nonperforming home loans with a specific impairment. Impaired loans without an allowance generally represent loans that have been charged down to the fair value of the underlying collateral for which we believe no additional losses have been incurred, or where the fair value of the underlying collateral meets or exceeds the loan’s amortized cost. PCI loans are excluded from the following tables.
|
156
|
Capital One Financial Corporation (COF)
|
|
Table
4.9
: Impaired Loans
|
|
December 31, 2017
|
|||||||||||||||||||||||
|
(Dollars in millions)
|
With an
Allowance
|
Without
an
Allowance
|
Total
Recorded
Investment
|
Related
Allowance
|
Net
Recorded
Investment
|
Unpaid
Principal
Balance
|
||||||||||||||||||
|
Credit Card:
|
||||||||||||||||||||||||
|
Domestic credit card
|
$
|
639
|
|
$
|
0
|
|
$
|
639
|
|
$
|
208
|
|
$
|
431
|
|
$
|
625
|
|
||||||
|
International card businesses
|
173
|
|
0
|
|
173
|
|
84
|
|
89
|
|
167
|
|
||||||||||||
|
Total credit card
(1)
|
812
|
|
0
|
|
812
|
|
292
|
|
520
|
|
792
|
|
||||||||||||
|
Consumer Banking:
|
||||||||||||||||||||||||
|
Auto
(2)
|
363
|
|
118
|
|
481
|
|
30
|
|
451
|
|
730
|
|
||||||||||||
|
Home loan
|
192
|
|
41
|
|
233
|
|
15
|
|
218
|
|
298
|
|
||||||||||||
|
Retail banking
|
51
|
|
10
|
|
61
|
|
8
|
|
53
|
|
66
|
|
||||||||||||
|
Total consumer banking
|
606
|
|
169
|
|
775
|
|
53
|
|
722
|
|
1,094
|
|
||||||||||||
|
Commercial Banking:
|
||||||||||||||||||||||||
|
Commercial and multifamily real estate
|
138
|
|
2
|
|
140
|
|
13
|
|
127
|
|
143
|
|
||||||||||||
|
Commercial and industrial
|
489
|
|
222
|
|
711
|
|
63
|
|
648
|
|
844
|
|
||||||||||||
|
Total commercial lending
|
627
|
|
224
|
|
851
|
|
76
|
|
775
|
|
987
|
|
||||||||||||
|
Small-ticket commercial real estate
|
7
|
|
0
|
|
7
|
|
0
|
|
7
|
|
9
|
|
||||||||||||
|
Total commercial banking
|
634
|
|
224
|
|
858
|
|
76
|
|
782
|
|
996
|
|
||||||||||||
|
Total
|
$
|
2,052
|
|
$
|
393
|
|
$
|
2,445
|
|
$
|
421
|
|
$
|
2,024
|
|
$
|
2,882
|
|
||||||
|
|
December 31, 2016
|
|||||||||||||||||||||||
|
(Dollars in millions)
|
With an
Allowance
|
Without
an
Allowance
|
Total
Recorded
Investment
|
Related
Allowance
|
Net
Recorded
Investment
|
Unpaid
Principal
Balance
|
||||||||||||||||||
|
Credit Card:
|
||||||||||||||||||||||||
|
Domestic credit card
|
$
|
581
|
|
$
|
0
|
|
$
|
581
|
|
$
|
174
|
|
$
|
407
|
|
$
|
566
|
|
||||||
|
International card businesses
|
134
|
|
0
|
|
134
|
|
65
|
|
69
|
|
129
|
|
||||||||||||
|
Total credit card
(1)
|
715
|
|
0
|
|
715
|
|
239
|
|
476
|
|
695
|
|
||||||||||||
|
Consumer Banking:
|
||||||||||||||||||||||||
|
Auto
(2)
|
316
|
|
207
|
|
523
|
|
24
|
|
499
|
|
807
|
|
||||||||||||
|
Home loan
|
241
|
|
117
|
|
358
|
|
19
|
|
339
|
|
464
|
|
||||||||||||
|
Retail banking
|
52
|
|
10
|
|
62
|
|
14
|
|
48
|
|
65
|
|
||||||||||||
|
Total consumer banking
|
609
|
|
334
|
|
943
|
|
57
|
|
886
|
|
1,336
|
|
||||||||||||
|
Commercial Banking:
|
||||||||||||||||||||||||
|
Commercial and multifamily real estate
|
83
|
|
29
|
|
112
|
|
7
|
|
105
|
|
112
|
|
||||||||||||
|
Commercial and industrial
|
1,249
|
|
144
|
|
1,393
|
|
162
|
|
1,231
|
|
1,444
|
|
||||||||||||
|
Total commercial lending
|
1,332
|
|
173
|
|
1,505
|
|
169
|
|
1,336
|
|
1,556
|
|
||||||||||||
|
Small-ticket commercial real estate
|
4
|
|
0
|
|
4
|
|
0
|
|
4
|
|
4
|
|
||||||||||||
|
Total commercial banking
|
1,336
|
|
173
|
|
1,509
|
|
169
|
|
1,340
|
|
1,560
|
|
||||||||||||
|
Total
|
$
|
2,660
|
|
$
|
507
|
|
$
|
3,167
|
|
$
|
465
|
|
$
|
2,702
|
|
$
|
3,591
|
|
||||||
|
157
|
Capital One Financial Corporation (COF)
|
|
|
Year Ended December 31,
|
||||||||||||||||||||||||
|
2017
|
2016
|
2015
|
||||||||||||||||||||||
|
(Dollars in millions)
|
Average
Recorded Investment |
Interest
Income Recognized |
Average
Recorded Investment |
Interest
Income Recognized |
Average
Recorded Investment |
Interest
Income Recognized |
||||||||||||||||||
|
Credit Card:
|
||||||||||||||||||||||||
|
Domestic credit card
|
$
|
602
|
|
$
|
63
|
|
$
|
540
|
|
$
|
58
|
|
$
|
539
|
|
$
|
57
|
|
||||||
|
International card businesses
|
154
|
|
11
|
|
133
|
|
10
|
|
135
|
|
10
|
|
||||||||||||
|
Total credit card
(1)
|
756
|
|
74
|
|
673
|
|
68
|
|
674
|
|
67
|
|
||||||||||||
|
Consumer Banking:
|
||||||||||||||||||||||||
|
Auto
(2)
|
495
|
|
53
|
|
501
|
|
86
|
|
462
|
|
82
|
|
||||||||||||
|
Home loan
|
299
|
|
5
|
|
361
|
|
5
|
|
364
|
|
4
|
|
||||||||||||
|
Retail banking
|
59
|
|
1
|
|
62
|
|
2
|
|
56
|
|
2
|
|
||||||||||||
|
Total consumer banking
|
853
|
|
59
|
|
924
|
|
93
|
|
882
|
|
88
|
|
||||||||||||
|
Commercial Banking:
|
||||||||||||||||||||||||
|
Commercial and multifamily real estate
|
134
|
|
4
|
|
111
|
|
3
|
|
109
|
|
3
|
|
||||||||||||
|
Commercial and industrial
|
1,118
|
|
18
|
|
1,215
|
|
13
|
|
466
|
|
5
|
|
||||||||||||
|
Total commercial lending
|
1,252
|
|
22
|
|
1,326
|
|
16
|
|
575
|
|
8
|
|
||||||||||||
|
Small-ticket commercial real estate
|
7
|
|
0
|
|
7
|
|
0
|
|
7
|
|
0
|
|
||||||||||||
|
Total commercial banking
|
1,259
|
|
22
|
|
1,333
|
|
16
|
|
582
|
|
8
|
|
||||||||||||
|
Total
|
$
|
2,868
|
|
$
|
155
|
|
$
|
2,930
|
|
$
|
177
|
|
$
|
2,138
|
|
$
|
163
|
|
||||||
|
(1)
|
The period-end and average recorded investments of credit card loans include finance charges and fees.
|
|
(2)
|
Includes certain TDRs that are recorded as other assets on our consolidated balance sheets.
|
Total recorded TDRs were
$2.2 billion
and
$2.5 billion
as of
December 31, 2017
and
2016
, respectively. TDRs classified as performing in our credit card and consumer banking loan portfolios totaled
$1.3 billion
and
$1.1 billion
as of
December 31, 2017
and
2016
, respectively. TDRs classified as performing in our commercial banking loan portfolio totaled
$574 million
and
$487 million
as of
December 31, 2017
and
2016
, respectively. Commitments to lend additional funds on loans modified in TDRs totaled
$241 million
and
$208 million
as of
December 31, 2017
and
2016
, respectively.
As part of our loan modification programs to borrowers experiencing financial difficulty, we may provide multiple concessions to minimize our economic loss and improve long-term loan performance and collectability. The following tables present the major modification types, recorded investment amounts and financial effects of loans modified in TDRs during
the years ended December 31, 2017, 2016 and 2015
.
|
158
|
Capital One Financial Corporation (COF)
|
|
Table
4.10
: Troubled Debt Restructurings
|
|
Total Loans
Modified (1) |
Year Ended December 31, 2017
|
||||||||||||||||||||
|
|
Reduced Interest Rate
|
Term Extension
|
Balance Reduction
|
|||||||||||||||||||
|
(Dollars in millions)
|
% of
TDR Activity (2) |
Average
Rate Reduction |
% of
TDR Activity (2) |
Average
Term Extension (Months) |
% of
TDR Activity (2) |
Gross
Balance Reduction |
||||||||||||||||
|
Credit Card:
|
||||||||||||||||||||||
|
Domestic credit card
|
$
|
406
|
|
100
|
%
|
14.50
|
%
|
0
|
%
|
0
|
0
|
%
|
$
|
0
|
|
|||||||
|
International card businesses
|
169
|
|
100
|
|
26.51
|
|
0
|
|
0
|
0
|
|
0
|
|
|||||||||
|
Total credit card
|
575
|
|
100
|
|
18.02
|
|
0
|
|
0
|
0
|
|
0
|
|
|||||||||
|
Consumer Banking:
|
||||||||||||||||||||||
|
Auto
(3)
|
324
|
|
44
|
|
3.82
|
|
95
|
|
6
|
2
|
|
7
|
|
|||||||||
|
Home loan
|
19
|
|
48
|
|
2.77
|
|
78
|
|
233
|
2
|
|
0
|
|
|||||||||
|
Retail banking
|
13
|
|
22
|
|
5.77
|
|
73
|
|
10
|
0
|
|
0
|
|
|||||||||
|
Total consumer banking
|
356
|
|
44
|
|
3.79
|
|
93
|
|
16
|
2
|
|
7
|
|
|||||||||
|
Commercial Banking:
|
||||||||||||||||||||||
|
Commercial and multifamily real estate
|
29
|
|
7
|
|
0.02
|
|
26
|
|
5
|
0
|
|
0
|
|
|||||||||
|
Commercial and industrial
|
557
|
|
19
|
|
0.80
|
|
59
|
|
17
|
0
|
|
0
|
|
|||||||||
|
Total commercial lending
|
586
|
|
18
|
|
0.79
|
|
57
|
|
16
|
0
|
|
0
|
|
|||||||||
|
Small-ticket commercial real estate
|
3
|
|
0
|
|
0.00
|
|
4
|
|
0
|
0
|
|
0
|
|
|||||||||
|
Total commercial banking
|
589
|
|
18
|
|
0.79
|
|
57
|
|
16
|
0
|
|
0
|
|
|||||||||
|
Total
|
$
|
1,520
|
|
55
|
|
13.19
|
|
44
|
|
16
|
0
|
|
$
|
7
|
|
|||||||
|
Total Loans
Modified (1) |
Year Ended December 31, 2016
|
|||||||||||||||||||||
|
Reduced Interest Rate
|
Term Extension
|
Balance Reduction
|
||||||||||||||||||||
|
(Dollars in millions)
|
% of
TDR Activity (2) |
Average
Rate Reduction |
% of
TDR Activity (2) |
Average
Term Extension (Months) |
% of
TDR Activity (2) |
Gross
Balance Reduction |
||||||||||||||||
|
Credit Card:
|
||||||||||||||||||||||
|
Domestic credit card
|
$
|
312
|
|
100
|
%
|
13.19
|
%
|
0
|
%
|
0
|
0
|
%
|
$
|
0
|
|
|||||||
|
International card businesses
|
138
|
|
100
|
|
25.87
|
|
0
|
|
0
|
0
|
|
0
|
|
|||||||||
|
Total credit card
|
450
|
|
100
|
|
17.09
|
|
0
|
|
0
|
0
|
|
0
|
|
|||||||||
|
Consumer Banking:
|
||||||||||||||||||||||
|
Auto
(3)
|
356
|
|
44
|
|
3.91
|
|
74
|
|
7
|
25
|
|
78
|
|
|||||||||
|
Home loan
|
48
|
|
64
|
|
2.25
|
|
87
|
|
243
|
2
|
|
0
|
|
|||||||||
|
Retail banking
|
18
|
|
23
|
|
7.89
|
|
68
|
|
10
|
9
|
|
1
|
|
|||||||||
|
Total consumer banking
|
422
|
|
46
|
|
3.73
|
|
75
|
|
38
|
22
|
|
79
|
|
|||||||||
|
Commercial Banking:
|
||||||||||||||||||||||
|
Commercial and multifamily real estate
|
38
|
|
0
|
|
0.00
|
|
67
|
|
6
|
32
|
|
3
|
|
|||||||||
|
Commercial and industrial
|
743
|
|
5
|
|
0.09
|
|
57
|
|
20
|
7
|
|
26
|
|
|||||||||
|
Total commercial lending
|
781
|
|
4
|
|
0.09
|
|
57
|
|
19
|
8
|
|
29
|
|
|||||||||
|
Small-ticket commercial real estate
|
1
|
|
0
|
|
0.00
|
|
0
|
|
0
|
0
|
|
0
|
|
|||||||||
|
Total commercial banking
|
782
|
|
4
|
|
0.09
|
|
57
|
|
19
|
8
|
|
29
|
|
|||||||||
|
Total
|
$
|
1,654
|
|
41
|
|
12.42
|
|
46
|
|
27
|
9
|
|
$
|
108
|
|
|||||||
|
159
|
Capital One Financial Corporation (COF)
|
|
|
Total Loans
Modified (1) |
Year Ended December 31, 2015
|
|||||||||||||||||||||
|
Reduced Interest Rate
|
Term Extension
|
Balance Reduction
|
||||||||||||||||||||
|
(Dollars in millions)
|
% of
TDR Activity (2) |
Average
Rate Reduction |
% of
TDR Activity (2) |
Average
Term Extension (Months) |
% of
TDR Activity (2) |
Gross
Balance Reduction |
||||||||||||||||
|
Credit Card:
|
||||||||||||||||||||||
|
Domestic credit card
|
$
|
293
|
|
100
|
%
|
12.28
|
%
|
0
|
%
|
0
|
0
|
%
|
$
|
0
|
|
|||||||
|
International card businesses
|
121
|
|
100
|
|
25.88
|
|
0
|
|
0
|
0
|
|
0
|
|
|||||||||
|
Total credit card
|
414
|
|
100
|
|
16.26
|
|
0
|
|
0
|
0
|
|
0
|
|
|||||||||
|
Consumer Banking:
|
||||||||||||||||||||||
|
Auto
(3)
|
347
|
|
41
|
|
3.49
|
|
69
|
|
8
|
30
|
|
93
|
|
|||||||||
|
Home loan
|
48
|
|
61
|
|
2.70
|
|
79
|
|
231
|
7
|
|
0
|
|
|||||||||
|
Retail banking
|
24
|
|
18
|
|
6.88
|
|
87
|
|
6
|
0
|
|
0
|
|
|||||||||
|
Total consumer banking
|
419
|
|
42
|
|
3.44
|
|
71
|
|
36
|
26
|
|
93
|
|
|||||||||
|
Commercial Banking:
|
||||||||||||||||||||||
|
Commercial and multifamily real estate
|
12
|
|
0
|
|
0.00
|
|
86
|
|
14
|
18
|
|
1
|
|
|||||||||
|
Commercial and industrial
|
249
|
|
0
|
|
0.67
|
|
34
|
|
7
|
0
|
|
0
|
|
|||||||||
|
Total commercial lending
|
261
|
|
0
|
|
0.67
|
|
36
|
|
8
|
1
|
|
1
|
|
|||||||||
|
Small-ticket commercial real estate
|
1
|
|
0
|
|
0.00
|
|
0
|
|
0
|
0
|
|
0
|
|
|||||||||
|
Total commercial banking
|
262
|
|
0
|
|
0.67
|
|
36
|
|
8
|
1
|
|
1
|
|
|||||||||
|
Total
|
$
|
1,095
|
|
54
|
|
12.42
|
|
36
|
|
29
|
10
|
|
$
|
94
|
|
|||||||
__________
|
(1)
|
Represents the recorded investment of total loans modified in TDRs at the end of the quarter in which they were modified. As not every modification type is included in the table above, the total percentage of TDR activity may not add up to 100%. Some loans may receive more than one type of concession as part of the modification.
|
|
(2)
|
Due to multiple concessions granted to some troubled borrowers, percentages may total more than 100% for certain loan types.
|
|
(3)
|
Includes certain TDRs that are recorded as other assets on our consolidated balance sheets.
|
TDR—Subsequent Defaults of Completed TDR Modifications
The following table presents the type, number and recorded investment amount of loans modified in TDRs that experienced a default during the period and had completed a modification event in the twelve months prior to the default. A default occurs if the loan is either 90 days or more delinquent, has been charged off as of the end of the period presented or has been reclassified from accrual to nonaccrual status.
|
160
|
Capital One Financial Corporation (COF)
|
|
Table
4.11
: TDR
—
Subsequent Defaults
|
Year Ended December 31,
|
|||||||||||||||||||||
|
|
2017
|
2016
|
2015
|
||||||||||||||||||
|
(Dollars in millions)
|
Number of
Contracts |
Amount
|
Number of
Contracts |
Amount
|
Number of
Contracts |
Amount
|
|||||||||||||||
|
Credit Card:
|
|||||||||||||||||||||
|
Domestic credit card
|
55,121
|
|
$
|
111
|
|
42,250
|
|
$
|
73
|
|
42,808
|
|
$
|
71
|
|
||||||
|
International card businesses
|
51,641
|
|
93
|
|
40,498
|
|
82
|
|
33,888
|
|
81
|
|
|||||||||
|
Total credit card
|
106,762
|
|
204
|
|
82,748
|
|
155
|
|
76,696
|
|
152
|
|
|||||||||
|
Consumer Banking:
|
|||||||||||||||||||||
|
Auto
|
9,446
|
|
109
|
|
8,587
|
|
96
|
|
8,647
|
|
99
|
|
|||||||||
|
Home loan
|
28
|
|
7
|
|
56
|
|
7
|
|
14
|
|
2
|
|
|||||||||
|
Retail banking
|
41
|
|
4
|
|
48
|
|
9
|
|
26
|
|
2
|
|
|||||||||
|
Total consumer banking
|
9,515
|
|
120
|
|
8,691
|
|
112
|
|
8,687
|
|
103
|
|
|||||||||
|
Commercial Banking:
|
|||||||||||||||||||||
|
Commercial and multifamily real estate
|
0
|
|
0
|
|
1
|
|
1
|
|
0
|
|
0
|
|
|||||||||
|
Commercial and industrial
|
244
|
|
269
|
|
150
|
|
281
|
|
7
|
|
19
|
|
|||||||||
|
Total commercial lending
|
244
|
|
269
|
|
151
|
|
282
|
|
7
|
|
19
|
|
|||||||||
|
Small-ticket commercial real estate
|
2
|
|
1
|
|
7
|
|
1
|
|
3
|
|
0
|
|
|||||||||
|
Total commercial banking
|
246
|
|
270
|
|
158
|
|
283
|
|
10
|
|
19
|
|
|||||||||
|
Total
|
116,523
|
|
$
|
594
|
|
91,597
|
|
$
|
550
|
|
85,393
|
|
$
|
274
|
|
||||||
PCI Loans
Outstanding Balance and Carrying Value of PCI Loans
The table below presents the outstanding balance and the carrying value of PCI loans as of
December 31, 2017
and
2016
. See “
Note 1—Summary of Significant Accounting Policies
” for information related to our accounting policies for impaired loans.
Table
4.12
: PCI Loans
__________
|
|
PCI Loans
|
|||||||
|
(Dollars in millions)
|
December 31, 2017
|
December 31, 2016
|
||||||
|
Outstanding balance
|
$
|
11,855
|
|
$
|
16,506
|
|
||
|
Carrying value
(1)
|
10,767
|
|
15,074
|
|
||||
|
(1)
|
Includes
$37 million
and
$31 million
of allowance for loan and lease losses for these loans as of
December 31, 2017
and
2016
, respectively. We recorded a
$6 million
provision and a
$6 million
release for credit losses for the years ended December 31,
2017
and
2016
, respectively, for PCI loans.
|
|
161
|
Capital One Financial Corporation (COF)
|
|
Changes in Accretable Yield
The following table presents changes in the accretable yield on PCI loans. Reclassification from or to nonaccretable differences represent changes in accretable yield for those loans in pools that are driven primarily by credit performance. Changes in accretable yield for non-credit related changes in expected cash flows are driven primarily by actual prepayments and changes in estimated prepayments.
Table
4.13
: Changes in Accretable Yield on PCI Loans
|
(Dollars in millions)
|
PCI Loans
|
|||
|
Accretable yield as of December 31, 2014
|
$
|
4,653
|
|
|
|
Addition due to acquisition
|
123
|
|
||
|
Accretion recognized in earnings
|
(817
|
)
|
||
|
Reclassifications from nonaccretable differences
|
26
|
|
||
|
Changes in accretable yield for non-credit related changes in expected cash flows
|
(502
|
)
|
||
|
Accretable yield as of December 31, 2015
|
3,483
|
|
||
|
Accretion recognized in earnings
|
(711
|
)
|
||
|
Reclassifications from nonaccretable differences
|
138
|
|
||
|
Changes in accretable yield for non-credit related changes in expected cash flows
|
267
|
|
||
|
Accretable yield as of December 31, 2016
|
3,177
|
|
||
|
Accretion recognized in earnings
|
(594
|
)
|
||
|
Reclassifications to nonaccretable differences
|
(3
|
)
|
||
|
Changes in accretable yield for non-credit related changes in expected cash flows
|
(412
|
)
|
||
|
Accretable yield as of December 31, 2017
|
$
|
2,168
|
|
|
Finance Charge and Fee Reserves
We continue to accrue finance charges and fees on credit card loans until the account is charged off. Our methodology for estimating the uncollectible portion of billed finance charges and fees is consistent with the methodology we use to estimate the allowance for incurred principal losses on our credit card loan receivables. Total net revenue was reduced by
$1.4 billion
,
$1.1 billion
and
$732 million
in 2017, 2016 and 2015, respectively, for the estimated uncollectible amount of billed finance charges and fees and related losses. The finance charge and fee reserve, which is recorded as a contra asset on our consolidated balance sheets, totaled
$491 million
and
$402 million
as of December 31, 2017 and 2016, respectively.
Loans Held for Sale
We had total loans held for sale of
$971 million
and
$1.0 billion
as of December 31, 2017 and 2016, respectively.
We also originated for sale
$8.4 billion
,
$7.6 billion
and
$6.4 billion
of conforming residential mortgage loans and commercial multifamily real estate loans in 2017,
2016
and
2015
, respectively. We retained servicing on approximately
100%
of these loans sold in 2017, 2016 and
2015
.
|
162
|
Capital One Financial Corporation (COF)
|
|
|
|
Our allowance for loan and lease losses represents management’s best estimate of incurred loan and lease losses inherent in our loans held for investment portfolio as of each balance sheet date. In addition to the allowance for loan and lease losses, we also estimate probable losses related to unfunded lending commitments, such as letters of credit, financial guarantees and binding unfunded loan commitments. The provision for losses on unfunded lending commitments is included in the provision for credit losses in our consolidated statements of income and the related reserve for unfunded lending commitments is included in other liabilities on our consolidated balance sheets. See “
Note 1—Summary of Significant Accounting Policies
” for further discussion of the methodology and policy for determining our allowance for loan and lease losses for each of our loan portfolio segments, as well as information on our reserve for unfunded lending commitments.
Allowance for Loan and Lease Losses and Reserve for Unfunded Lending Commitments Activity
The table below summarizes changes in the allowance for loan and lease losses and reserve for unfunded lending commitments by portfolio segment for
the years ended December 31, 2017, 2016 and 2015
.
Table
5.1
: Allowance for Loan and Lease Losses and Reserve for Unfunded Lending Commitments Activity
|
(Dollars in millions)
|
Credit Card
|
Consumer
Banking |
Commercial Banking
|
Other
(1)
|
Total
|
|||||||||||||||
|
Allowance for loan and lease losses:
|
||||||||||||||||||||
|
Balance as of December 31, 2014
|
$
|
3,204
|
|
$
|
779
|
|
$
|
395
|
|
$
|
5
|
|
$
|
4,383
|
|
|||||
|
Charge-offs
|
(4,028
|
)
|
(1,082
|
)
|
(76
|
)
|
(7
|
)
|
(5,193
|
)
|
||||||||||
|
Recoveries
|
1,110
|
|
351
|
|
29
|
|
8
|
|
1,498
|
|
||||||||||
|
Net charge-offs
|
(2,918
|
)
|
(731
|
)
|
(47
|
)
|
1
|
|
(3,695
|
)
|
||||||||||
|
Provision (benefit) for loan and lease losses
|
3,417
|
|
819
|
|
256
|
|
(2
|
)
|
4,490
|
|
||||||||||
|
Allowance build (release) for loan and lease losses
|
499
|
|
88
|
|
209
|
|
(1
|
)
|
795
|
|
||||||||||
|
Other changes
(2)
|
(49
|
)
|
1
|
|
0
|
|
0
|
|
(48
|
)
|
||||||||||
|
Balance as of December 31, 2015
|
3,654
|
|
868
|
|
604
|
|
4
|
|
5,130
|
|
||||||||||
|
Reserve for unfunded lending commitments:
|
||||||||||||||||||||
|
Balance as of December 31, 2014
|
0
|
|
7
|
|
106
|
|
0
|
|
113
|
|
||||||||||
|
Provision for losses on unfunded lending commitments
|
0
|
|
0
|
|
46
|
|
0
|
|
46
|
|
||||||||||
|
Other changes
(2)
|
0
|
|
0
|
|
9
|
|
0
|
|
9
|
|
||||||||||
|
Balance as of December 31, 2015
|
0
|
|
7
|
|
161
|
|
0
|
|
168
|
|
||||||||||
|
Combined allowance and reserve as of December 31, 2015
|
$
|
3,654
|
|
$
|
875
|
|
$
|
765
|
|
$
|
4
|
|
$
|
5,298
|
|
|||||
|
Allowance for loan and lease losses:
|
||||||||||||||||||||
|
Balance as of December 31, 2015
|
$
|
3,654
|
|
$
|
868
|
|
$
|
604
|
|
$
|
4
|
|
$
|
5,130
|
|
|||||
|
Charge-offs
|
(5,019
|
)
|
(1,226
|
)
|
(307
|
)
|
(3
|
)
|
(6,555
|
)
|
||||||||||
|
Recoveries
|
1,066
|
|
406
|
|
15
|
|
6
|
|
1,493
|
|
||||||||||
|
Net charge-offs
|
(3,953
|
)
|
(820
|
)
|
(292
|
)
|
3
|
|
(5,062
|
)
|
||||||||||
|
Provision (benefit) for loan and lease losses
|
4,926
|
|
1,055
|
|
515
|
|
(5
|
)
|
6,491
|
|
||||||||||
|
Allowance build (release) for loan and lease losses
|
973
|
|
235
|
|
223
|
|
(2
|
)
|
1,429
|
|
||||||||||
|
Other changes
(2)
|
(21
|
)
|
(1
|
)
|
(34
|
)
|
0
|
|
(56
|
)
|
||||||||||
|
Balance as of December 31, 2016
|
4,606
|
|
1,102
|
|
793
|
|
2
|
|
6,503
|
|
||||||||||
|
Reserve for unfunded lending commitments:
|
||||||||||||||||||||
|
Balance as of December 31, 2015
|
0
|
|
7
|
|
161
|
|
0
|
|
168
|
|
||||||||||
|
Benefit for losses on unfunded lending commitments
|
0
|
|
0
|
|
(32
|
)
|
0
|
|
(32
|
)
|
||||||||||
|
Balance as of December 31, 2016
|
0
|
|
7
|
|
129
|
|
0
|
|
136
|
|
||||||||||
|
Combined allowance and reserve as of December 31, 2016
|
$
|
4,606
|
|
$
|
1,109
|
|
$
|
922
|
|
$
|
2
|
|
$
|
6,639
|
|
|||||
|
163
|
Capital One Financial Corporation (COF)
|
|
|
(Dollars in millions)
|
Credit Card
|
Consumer
Banking |
Commercial Banking
|
Other
(1)
|
Total
|
|||||||||||||||
|
Allowance for loan and lease losses:
|
||||||||||||||||||||
|
Balance as of December 31, 2016
|
$
|
4,606
|
|
$
|
1,102
|
|
$
|
793
|
|
$
|
2
|
|
$
|
6,503
|
|
|||||
|
Charge-offs
|
(6,321
|
)
|
(1,677
|
)
|
(481
|
)
|
(34
|
)
|
(8,513
|
)
|
||||||||||
|
Recoveries
|
1,267
|
|
639
|
|
16
|
|
29
|
|
1,951
|
|
||||||||||
|
Net charge-offs
|
(5,054
|
)
|
(1,038
|
)
|
(465
|
)
|
(5
|
)
|
(6,562
|
)
|
||||||||||
|
Provision for loan and lease losses
|
6,066
|
|
1,180
|
|
313
|
|
4
|
|
7,563
|
|
||||||||||
|
Allowance build (release) for loan and lease losses
|
1,012
|
|
142
|
|
(152
|
)
|
(1
|
)
|
1,001
|
|
||||||||||
|
Other changes
(2)
|
30
|
|
(2
|
)
|
(30
|
)
|
0
|
|
(2
|
)
|
||||||||||
|
Balance as of December 31, 2017
|
5,648
|
|
1,242
|
|
611
|
|
1
|
|
7,502
|
|
||||||||||
|
Reserve for unfunded lending commitments:
|
||||||||||||||||||||
|
Balance as of December 31, 2016
|
0
|
|
7
|
|
129
|
|
0
|
|
136
|
|
||||||||||
|
Benefit for losses on unfunded lending commitments
|
0
|
|
0
|
|
(12
|
)
|
0
|
|
(12
|
)
|
||||||||||
|
Balance as of December 31, 2017
|
0
|
|
7
|
|
117
|
|
0
|
|
124
|
|
||||||||||
|
Combined allowance and reserve as of December 31, 2017
|
$
|
5,648
|
|
$
|
1,249
|
|
$
|
728
|
|
$
|
1
|
|
$
|
7,626
|
|
|||||
|
(1)
|
Primarily consists of the legacy loan portfolio of our discontinued GreenPoint mortgage operations.
|
|
(2)
|
Represents foreign currency translation adjustments and the net impact of loan transfers and sales.
|
Components of Allowance for Loan and Lease Losses by Impairment Methodology
The table below presents the components of our allowance for loan and lease losses by portfolio segment and impairment methodology as of
December 31, 2017
and
2016
. See “
Note 1—Summary of Significant Accounting Policies
” for further discussion of allowance methodologies for each of the loan portfolios.
Table
5.2
: Components of Allowance for Loan and Lease Losses by Impairment Methodology
|
|
December 31, 2017
|
|||||||||||||||||||
|
(Dollars in millions)
|
Credit
Card
|
Consumer Banking
|
Commercial Banking
|
Other
|
Total
|
|||||||||||||||
|
Allowance for loan and lease losses:
|
||||||||||||||||||||
|
Collectively evaluated
|
$
|
5,356
|
|
$
|
1,158
|
|
$
|
529
|
|
$
|
1
|
|
$
|
7,044
|
|
|||||
|
Asset-specific
|
292
|
|
53
|
|
76
|
|
0
|
|
421
|
|
||||||||||
|
PCI loans
|
0
|
|
31
|
|
6
|
|
0
|
|
37
|
|
||||||||||
|
Total allowance for loan and lease losses
|
$
|
5,648
|
|
$
|
1,242
|
|
$
|
611
|
|
$
|
1
|
|
$
|
7,502
|
|
|||||
|
Loans held for investment:
|
||||||||||||||||||||
|
Collectively evaluated
|
$
|
113,948
|
|
$
|
64,080
|
|
$
|
63,237
|
|
$
|
58
|
|
$
|
241,323
|
|
|||||
|
Asset-specific
|
812
|
|
705
|
|
858
|
|
0
|
|
2,375
|
|
||||||||||
|
PCI loans
|
2
|
|
10,293
|
|
480
|
|
0
|
|
10,775
|
|
||||||||||
|
Total loans held for investment
|
$
|
114,762
|
|
$
|
75,078
|
|
$
|
64,575
|
|
$
|
58
|
|
$
|
254,473
|
|
|||||
|
Allowance coverage ratio
(1)
|
4.92
|
%
|
1.65
|
%
|
0.95
|
%
|
1.72
|
%
|
2.95
|
%
|
||||||||||
|
164
|
Capital One Financial Corporation (COF)
|
|
|
|
December 31, 2016
|
|||||||||||||||||||
|
(Dollars in millions)
|
Credit
Card |
Consumer Banking
|
Commercial Banking
|
Other
|
Total
|
|||||||||||||||
|
Allowance for loan and lease losses:
|
||||||||||||||||||||
|
Collectively evaluated
|
$
|
4,367
|
|
$
|
1,016
|
|
$
|
622
|
|
$
|
2
|
|
$
|
6,007
|
|
|||||
|
Asset-specific
|
239
|
|
57
|
|
169
|
|
0
|
|
465
|
|
||||||||||
|
PCI loans
|
0
|
|
29
|
|
2
|
|
0
|
|
31
|
|
||||||||||
|
Total allowance for loan and lease losses
|
$
|
4,606
|
|
$
|
1,102
|
|
$
|
793
|
|
$
|
2
|
|
$
|
6,503
|
|
|||||
|
Loans held for investment:
|
||||||||||||||||||||
|
Collectively evaluated
|
$
|
104,835
|
|
$
|
57,862
|
|
$
|
64,794
|
|
$
|
64
|
|
$
|
227,555
|
|
|||||
|
Asset-specific
|
715
|
|
736
|
|
1,509
|
|
0
|
|
2,960
|
|
||||||||||
|
PCI loans
|
2
|
|
14,456
|
|
613
|
|
0
|
|
15,071
|
|
||||||||||
|
Total loans held for investment
|
$
|
105,552
|
|
$
|
73,054
|
|
$
|
66,916
|
|
$
|
64
|
|
$
|
245,586
|
|
|||||
|
Allowance coverage ratio
(1)
|
4.36
|
%
|
1.51
|
%
|
1.19
|
%
|
3.13
|
%
|
2.65
|
%
|
||||||||||
__________
|
(1)
|
Allowance coverage ratio is calculated by dividing the period-end allowance for loan and lease losses by period-end loans held for investment within the specified loan category.
|
We have certain credit card partnership arrangements in which our partner agrees to share a portion of the credit losses associated with the partnership that qualify for net accounting treatment. The expected reimbursements from these partners, which are netted against our allowance for loan and lease losses, result in reductions to net charge-offs and provision for credit losses. See “
Note 1—Summary of Significant Accounting Policies
” for further discussion of our card partnership agreements.
The table below summarizes the changes in the estimated reimbursements from these partners for
the years ended December 31, 2017, 2016 and 2015
.
Table
5.3
: Summary of Loss Sharing Arrangements Impacts
|
Year Ended December 31,
|
||||||||||||
|
(Dollars in millions)
|
2017
|
2016
|
2015
|
|||||||||
|
Estimated reimbursements from loss sharing partners:
|
||||||||||||
|
Balance as of beginning of the period
|
$
|
228
|
|
$
|
194
|
|
$
|
143
|
|
|||
|
Amounts charged to partners and impacting net charge-offs
|
(285
|
)
|
(229
|
)
|
(189
|
)
|
||||||
|
Amounts estimated to be charged to partners and impacting provision for credit losses
|
437
|
|
263
|
|
240
|
|
||||||
|
Balance as of end of the period
|
$
|
380
|
|
$
|
228
|
|
$
|
194
|
|
|||
|
165
|
Capital One Financial Corporation (COF)
|
|
|
|
In the normal course of business, we enter into various types of transactions with entities that are considered to be VIEs. Our primary involvement with VIEs has been related to our securitization transactions in which we transferred assets from our balance sheet to securitization trusts. We have primarily securitized credit card and home loans, which have provided a source of funding for us and enabled us to transfer a certain portion of the economic risk of the loans or related debt securities to third parties.
The entity that has a controlling financial interest in a VIE is referred to as the primary beneficiary and is required to consolidate the VIE. The majority of the VIEs in which we are involved have been consolidated in our financial statements.
Summary of Consolidated and Unconsolidated VIEs
The assets of our consolidated VIEs primarily consist of cash, credit card loan receivables and the related allowance for loan and lease losses, which we report on our consolidated balance sheets under restricted cash for securitization investors, loans held in consolidated trusts and allowance for loan and lease losses, respectively. The assets of a particular VIE are the primary source of funding to settle its obligations. Creditors of these VIEs typically do not have recourse to our general credit. Liabilities primarily consist of debt securities issued by the VIEs, which we report under securitized debt obligations. For unconsolidated VIEs, we present the carrying amount of assets and liabilities reflected on our consolidated balance sheets and our maximum exposure to loss. Our maximum exposure to loss is estimated based on the unlikely event that all of the assets in the VIEs become worthless and we are required to meet our maximum remaining funding obligations.
The tables below present a summary of certain VIEs in which we had continuing involvement or held a variable interest, aggregated based on VIEs with similar characteristics as of
December 31, 2017
and
2016
. We separately present information for consolidated and unconsolidated VIEs.
Table
6.1
: Carrying Amount of Consolidated and Unconsolidated VIEs
|
|
December 31, 2017
|
|||||||||||||||||||
|
|
Consolidated
|
Unconsolidated
|
||||||||||||||||||
|
(Dollars in millions)
|
Carrying
Amount
of Assets
|
Carrying
Amount of
Liabilities
|
Carrying
Amount
of Assets
|
Carrying
Amount of
Liabilities
|
Maximum
Exposure to
Loss
|
|||||||||||||||
|
Securitization-Related VIEs:
|
||||||||||||||||||||
|
Credit card loan securitizations
(1)
|
$
|
34,976
|
|
$
|
20,651
|
|
$
|
0
|
|
$
|
0
|
|
$
|
0
|
|
|||||
|
Home loan securitizations
|
0
|
|
0
|
|
455
|
|
390
|
|
1,057
|
|
||||||||||
|
Total securitization-related VIEs
|
34,976
|
|
20,651
|
|
455
|
|
390
|
|
1,057
|
|
||||||||||
|
Other VIEs:
(2)
|
||||||||||||||||||||
|
Affordable housing entities
|
226
|
|
10
|
|
4,175
|
|
1,284
|
|
4,175
|
|
||||||||||
|
Entities that provide capital to low-income and rural communities
|
1,498
|
|
129
|
|
0
|
|
0
|
|
0
|
|
||||||||||
|
Other
|
0
|
|
0
|
|
318
|
|
0
|
|
318
|
|
||||||||||
|
Total other VIEs
|
1,724
|
|
139
|
|
4,493
|
|
1,284
|
|
4,493
|
|
||||||||||
|
Total VIEs
|
$
|
36,700
|
|
$
|
20,790
|
|
$
|
4,948
|
|
$
|
1,674
|
|
$
|
5,550
|
|
|||||
|
166
|
Capital One Financial Corporation (COF)
|
|
|
|
December 31, 2016
|
|||||||||||||||||||
|
|
Consolidated
|
Unconsolidated
|
||||||||||||||||||
|
(Dollars in millions)
|
Carrying
Amount
of Assets
|
Carrying
Amount of
Liabilities
|
Carrying
Amount
of Assets
|
Carrying
Amount of
Liabilities
|
Maximum
Exposure to
Loss
|
|||||||||||||||
|
Securitization-Related VIEs:
|
||||||||||||||||||||
|
Credit card loan securitizations
(1)
|
$
|
33,550
|
|
$
|
19,662
|
|
$
|
0
|
|
$
|
0
|
|
$
|
0
|
|
|||||
|
Home loan securitizations
|
0
|
|
0
|
|
201
|
|
27
|
|
1,276
|
|
||||||||||
|
Total securitization-related VIEs
|
33,550
|
|
19,662
|
|
201
|
|
27
|
|
1,276
|
|
||||||||||
|
Other VIEs:
(2)
|
||||||||||||||||||||
|
Affordable housing entities
|
174
|
|
9
|
|
3,862
|
|
1,093
|
|
3,862
|
|
||||||||||
|
Entities that provide capital to low-income and rural communities
|
927
|
|
127
|
|
0
|
|
0
|
|
0
|
|
||||||||||
|
Other
|
0
|
|
0
|
|
187
|
|
0
|
|
187
|
|
||||||||||
|
Total other VIEs
|
1,101
|
|
136
|
|
4,049
|
|
1,093
|
|
4,049
|
|
||||||||||
|
Total VIEs
|
$
|
34,651
|
|
$
|
19,798
|
|
$
|
4,250
|
|
$
|
1,120
|
|
$
|
5,325
|
|
|||||
|
(1)
|
Represents the carrying amount of assets and liabilities owned by the VIE, which includes the seller’s interest and repurchased notes held by other related parties.
|
|
(2)
|
In certain investment structures, we consolidate a VIE which in turn holds as its primary asset an investment in an unconsolidated VIE. In these instances, we disclose the carrying amount of assets and liabilities on our consolidated balance sheets in the unconsolidated VIEs to avoid duplicating our exposure, as the unconsolidated VIEs are generally the operating entities generating the exposure. The carrying amount of assets and liabilities included in the unconsolidated VIE columns above related to these investment structures were
$2.2 billion
of assets and
$901 million
of liabilities as of
December 31, 2017
and
$1.9 billion
of assets and
$618 million
of liabilities as of
December 31, 2016
.
|
Securitization-Related VIEs
In a securitization transaction, assets are transferred to a trust, which generally meets the definition of a VIE. Our primary securitization activity is in the form of credit card securitizations, conducted through securitization trusts which we consolidate. Our continuing involvement in these securitization transactions mainly consists of acting as the primary servicer and holding certain retained interests.
We transfer residential home loans and multifamily commercial loans that we originate to the government-sponsored enterprises (“GSEs”) and retain the right to service the transferred loans pursuant to the guidelines set forth by the GSEs. Subsequent to such transfers, these loans are commonly securitized into RMBS or CMBS by the GSEs. We also hold RMBS, CMBS and ABS in our investment portfolio, which represent an interest in the respective securitization trusts employed in the transactions under which those securities were issued. We do not consolidate the securitization trusts employed in these transactions as we do not have the power to direct the activities that most significantly impact the economic performance of these securitization trusts. Our maximum exposure to loss as a result of our involvement with these VIEs is the carrying value of MSRs and investment securities on our consolidated balance sheets. See “
Note 7—Goodwill and Intangible Assets
” for information related to our MSRs associated with these residential home loan and multifamily commercial loan securitizations and “
Note 3—Investment Securities
” for more information on the securities held in our investment securities portfolio. We exclude these VIEs from the tables within this note because we do not consider our continuing involvement with these VIEs to be significant; we either invest in securities issued by the VIE and were not involved in the design of the VIE or no transfers have occurred between the VIE and us. In addition, where we have certain lending arrangements in the normal course of business with entities that could be VIEs, we have also excluded these VIEs from the tables presented in this note. See “
Note 4—Loans
” for additional information regarding our lending arrangements in the normal course of business.
We also may have exposure associated with contractual obligations to repurchase previously transferred loans due to breaches of representations and warranties. See “
Note 19—Commitments, Contingencies, Guarantees and Others
” for information related to our mortgage representation and warranty exposure.
|
167
|
Capital One Financial Corporation (COF)
|
|
The table below presents our continuing involvement in certain securitization-related VIEs as of
December 31, 2017
and
2016
.
Table
6.2
: Continuing Involvement in Securitization-Related VIEs
|
|
Mortgage
|
|||||||||||||||
|
(Dollars in millions)
|
Credit
Card
|
Option-
ARM
|
GreenPoint
HELOCs
|
GreenPoint
Manufactured
Housing
|
||||||||||||
|
December 31, 2017:
|
||||||||||||||||
|
Securities held by third-party investors
|
$
|
20,010
|
|
$
|
1,224
|
|
$
|
42
|
|
$
|
508
|
|
||||
|
Receivables in the trust
|
35,667
|
|
1,266
|
|
35
|
|
511
|
|
||||||||
|
Cash balance of spread or reserve accounts
|
0
|
|
8
|
|
N/A
|
|
116
|
|
||||||||
|
Retained interests
|
Yes
|
|
Yes
|
|
Yes
|
|
Yes
|
|
||||||||
|
Servicing retained
|
Yes
|
|
Yes
|
|
No
|
|
No
|
|
||||||||
|
December 31, 2016:
|
||||||||||||||||
|
Securities held by third-party investors
|
$
|
18,826
|
|
$
|
1,499
|
|
$
|
56
|
|
$
|
697
|
|
||||
|
Receivables in the trust
|
31,762
|
|
1,549
|
|
50
|
|
702
|
|
||||||||
|
Cash balance of spread or reserve accounts
|
0
|
|
8
|
|
N/A
|
|
130
|
|
||||||||
|
Retained interests
|
Yes
|
|
Yes
|
|
Yes
|
|
Yes
|
|
||||||||
|
Servicing retained
|
Yes
|
|
Yes
|
|
No
|
|
No
|
|
||||||||
Credit Card Securitizations
We hold certain retained interests in our credit card securitizations and continue to service the receivables in these trusts. As of both
December 31, 2017
and
2016
, we were deemed to be the primary beneficiary, and accordingly, all of these trusts have been consolidated in our financial statements.
Mortgage Securitizations
Option-ARM Loans
We had previously securitized option-ARM loans by transferring these loans to securitization trusts that had issued mortgage-backed securities to investors. The outstanding balance of debt securities held by third-party investors related to these mortgage loan securitization trusts was
$1.2 billion
and
$1.5 billion
as of
December 31, 2017
and
2016
, respectively.
We continue to service a portion of the remaining mortgage loans in these securitizations. We also retain rights to future cash flows arising from these securitizations, the most significant being certificated interest-only bonds issued by the trusts. We generally estimate the fair value of these retained interests based on the estimated present value of expected future cash flows, using our best estimates of the key assumptions which include credit losses, prepayment speeds and discount rates commensurate with the risks involved. For the mortgage loans that we continue to service, we do not consolidate the related trusts because we do not have the right to receive benefits nor the obligation to absorb losses that could potentially be significant to the trusts. For the remaining trusts, for which we no longer service the underlying mortgage loans, we do not consolidate these entities since we do not have the power to direct the activities that most significantly impact the economic performance of the trusts.
|
168
|
Capital One Financial Corporation (COF)
|
|
In connection with the securitization of certain option-ARM loans, a third party is obligated to advance a portion of any “negative amortization” resulting from monthly payments that are less than the interest accrued for that payment period. We have an agreement in place with the third party that mirrors this advance requirement. The amount advanced is tracked through mortgage-backed
securities retained as part of the securitization transaction. As advances occur, we record an asset in the form of negative amortization bonds, which are held at fair value in other assets on our consolidated balance sheets. Our maximum exposure is affected by rate caps and monthly payment change caps, but the funding obligation cannot exceed the difference between the original loan balance multiplied by a preset negative amortization cap and the current unpaid principal balance. For the transactions where the negative amortization funding agreements have been terminated, incremental negative amortization is funded through the available cash flow in each transaction.
We have also entered into certain derivative contracts related to the securitization activities. These are classified as free-standing derivatives, with fair value adjustments recorded in non-interest income in our consolidated statements of income. See “
Note 10—Derivative Instruments and Hedging Activities
” for further details on these derivatives.
GreenPoint Mortgage Home Equity Lines of Credit (“HELOCs”)
Our discontinued wholesale mortgage banking unit, GreenPoint Mortgage Funding, Inc. (“GreenPoint”), previously sold HELOCs in whole loan sales that were subsequently securitized by third parties. GreenPoint acquired residual interests in certain of those securitization trusts. We do not consolidate these trusts because we either lack the power to direct the activities that most significantly impact the economic performance of the trusts or because we do not have the right to receive benefits or the obligation to absorb losses that could potentially be significant to the trusts. As the residual interest holder, GreenPoint is required to fund advances on the HELOCs when certain performance triggers are met due to deterioration in asset performance. On behalf of GreenPoint, we have funded cumulative advances of
$30 million
as of both
December 31, 2017
and
2016
. We also have unfunded commitments of
$4 million
and
$5 million
related to those interests for our non-consolidated VIEs as of
December 31, 2017
and
2016
, respectively.
GreenPoint Credit Manufactured Housing
Prior to October 2017, we had certain retained interests and obligations related to the discontinued manufactured housing operations of GreenPoint Credit, LLC, a subsidiary of GreenPoint. Such discontinued operations, including the related recourse obligations, servicing rights and the primary obligation to execute mandatory clean-up calls in certain securitization transactions were sold to a third party in 2004. These securitization trusts were not consolidated because we did not have the power to direct the activities that most significantly impact the economic performance of the trusts as we did not service the loans.
The unpaid principal receivables balances of these manufactured housing securitization transactions were
$511 million
and
$702 million
as of
December 31, 2017
and
2016
, respectively.
On October 10, 2017, we entered into an agreement with the third-party servicer under which we assumed the mandatory obligation to exercise the remaining clean-up calls as they become due on certain securitization transactions.
As a result of this agreement, we recognized the loan receivables and a corresponding liability on our consolidated balance sheets. During November 2017, we entered into a forward sale agreement pursuant to which we will sell the underlying loans to a third-party purchaser as the clean-up calls are exercised.
Accordingly, we classified these loan receivables as loans held for sale on our consolidated balance sheets. As of December 31, 2017, we had
$283 million
of these loan receivables on our consolidated balance sheets, along with a corresponding liability, which is included as a component of other debt.
We were required to fund letters of credit to cover losses on certain manufactured housing securitizations. We have the right to receive any funds remaining in the letters of credit after the securities are released. The fair value of these letters of credit are included in other assets on our consolidated balance sheets and totaled
$75 million
and
$85 million
as of
December 31, 2017
and
2016
, respectively. We also have credit exposure on an agreement that we entered into to absorb a portion of the risk of loss on certain manufactured housing securitizations not subject to the funded letters of credit. Our expected future obligation under this agreement included in other liabilities on our consolidated balance sheets was
$10 million
and
$8 million
as of
December 31, 2017
and
2016
, respectively.
|
169
|
Capital One Financial Corporation (COF)
|
|
Other VIEs
Affordable Housing Entities
As part of our community reinvestment initiatives, we invest in private investment funds that make equity investments in multi-family affordable housing properties. We receive affordable housing tax credits for these investments. The activities of these entities are financed with a combination of invested equity capital and debt. We account for certain of our investments in qualified affordable housing projects using the proportional amortization method if certain criteria are met. The proportional amortization method amortizes the cost of the investment over the period in which the investor expects to receive tax credits and other tax benefits, and the resulting amortization is recognized as a component of income tax expense attributable to continuing operations. For the years ended December 31, 2017 and
2016
, we recognized amortization of
$582 million
and
$393 million
, respectively, and tax credits of
$504 million
and
$444 million
, respectively, associated with these investments within income tax provision. The carrying value of our equity investments in these qualified affordable housing projects was
$3.9 billion
and
$3.8 billion
as of
December 31, 2017
and
2016
, respectively. We are periodically required to provide additional financial or other support during the period of the investments. Our liability for these unfunded commitments was
$1.4 billion
and
$1.2 billion
as of
December 31, 2017
and
2016
, respectively. Predominantly all of this liability is expected to be paid from
2018
to
2020
.
For those investment funds considered to be VIEs, we are not required to consolidate them if we do not have the power to direct the activities that most significantly impact the economic performance of those entities. We record our interests in these unconsolidated VIEs in loans held for investment, other assets and other liabilities on our consolidated balance sheets. Our maximum exposure to these entities is limited to our variable interests in the entities which consisted of assets of approximately
$4.2 billion
and
$3.9 billion
as of
December 31, 2017
and
2016
, respectively. The creditors of the VIEs have no recourse to our general credit and we do not provide additional financial or other support other than during the period that we are contractually required to provide it. The total assets of the unconsolidated VIE investment funds were approximately
$11.5 billion
as of both
December 31, 2017
and
2016
.
Entities that Provide Capital to Low-Income and Rural Communities
We hold variable interests in entities (“Investor Entities”) that invest in community development entities (“CDEs”) that provide debt financing to businesses and non-profit entities in low-income and rural communities. Variable interests in the CDEs held by the consolidated Investor Entities are also our variable interests. The activities of the Investor Entities are financed with a combination of invested equity capital and debt. The activities of the CDEs are financed solely with invested equity capital. We receive federal and state tax credits for these investments. We consolidate the VIEs in which we have the power to direct the activities that most significantly impact the VIE’s economic performance and where we have the obligation to absorb losses or right to receive benefits that could be potentially significant to the VIE. We have also consolidated other investments and CDEs that are not considered to be VIEs, but where we hold a controlling financial interest. The assets of the VIEs that we consolidated, which totaled approximately
$1.5 billion
and
$927 million
as of
December 31, 2017
and
2016
, respectively, are reflected on our consolidated balance sheets in cash, loans held for investment, and other assets. The liabilities are reflected in other liabilities. The creditors of the VIEs have no recourse to our general credit. We have not provided additional financial or other support other than during the period that we are contractually required to provide it.
Other
Other VIEs include variable interests that we hold in companies that promote renewable energy sources and other equity method investments. We were not required to consolidate these entities because we do not have the power to direct the activities that most significantly impact their economic performance. Our maximum exposure to these entities is limited to the investment on our consolidated balance sheets of
$318 million
and
$187 million
as of
December 31, 2017
and
2016
, respectively. The creditors of the other VIEs have no recourse to our general credit. We have not provided additional financial or other support other than during the period that we are contractually required to provide it.
|
170
|
Capital One Financial Corporation (COF)
|
|
|
|
The table below presents our goodwill, intangible assets and MSRs as of
December 31, 2017
and
2016
. Goodwill is presented separately, while intangible assets and MSRs are included in other assets on our consolidated balance sheets.
Table
7.1
: Components of Goodwill, Intangible Assets and MSRs
__________
|
December 31, 2017
|
||||||||||||||
|
(Dollars in millions)
|
Carrying
Amount of Assets |
Accumulated Amortization
|
Net
Carrying Amount |
Remaining
Amortization Period |
||||||||||
|
Goodwill
|
$
|
14,533
|
|
N/A
|
|
$
|
14,533
|
|
N/A
|
|||||
|
Intangible assets:
|
||||||||||||||
|
Purchased credit card relationship (“PCCR”) intangibles
|
2,105
|
|
$
|
(1,844
|
)
|
261
|
|
3.6 years
|
||||||
|
Core deposit intangibles
|
1,149
|
|
(1,133
|
)
|
16
|
|
1.0 years
|
|||||||
|
Other
(1)
|
300
|
|
(156
|
)
|
144
|
|
7.8 years
|
|||||||
|
Total intangible assets
|
3,554
|
|
(3,133
|
)
|
421
|
|
4.9 years
|
|||||||
|
Total goodwill and intangible assets
|
$
|
18,087
|
|
$
|
(3,133
|
)
|
$
|
14,954
|
|
|
||||
|
MSRs:
|
||||||||||||||
|
Consumer MSRs
(2)
|
$
|
92
|
|
N/A
|
|
$
|
92
|
|
|
|||||
|
Commercial MSRs
(2)
|
355
|
|
$
|
(126
|
)
|
229
|
|
|
||||||
|
Total MSRs
|
$
|
447
|
|
$
|
(126
|
)
|
$
|
321
|
|
|
||||
|
December 31, 2016
|
||||||||||||||
|
(Dollars in millions)
|
Carrying
Amount of Assets |
Accumulated Amortization
|
Net
Carrying Amount |
Remaining
Amortization Period |
||||||||||
|
Goodwill
|
$
|
14,519
|
|
N/A
|
|
$
|
14,519
|
|
N/A
|
|||||
|
Intangible assets:
|
||||||||||||||
|
PCCR intangibles
|
2,151
|
|
$
|
(1,715
|
)
|
436
|
|
4.4 years
|
||||||
|
Core deposit intangibles
|
1,391
|
|
(1,345
|
)
|
46
|
|
2.0 years
|
|||||||
|
Other
(1)
|
314
|
|
(131
|
)
|
183
|
|
8.7 years
|
|||||||
|
Total intangible assets
|
3,856
|
|
(3,191
|
)
|
665
|
|
5.4 years
|
|||||||
|
Total goodwill and intangible assets
|
$
|
18,375
|
|
$
|
(3,191
|
)
|
$
|
15,184
|
|
|||||
|
MSRs:
|
||||||||||||||
|
Consumer MSRs
(2)
|
$
|
80
|
|
N/A
|
|
$
|
80
|
|
||||||
|
Commercial MSRs
(2)
|
276
|
|
$
|
(82
|
)
|
194
|
|
|||||||
|
Total MSRs
|
$
|
356
|
|
$
|
(82
|
)
|
$
|
274
|
|
|||||
|
(1)
|
Primarily consists of intangibles for sponsorship relationships, brokerage relationship intangibles, partnership and other contract intangibles and trade name intangibles.
|
|
(2)
|
Consumer MSRs are carried at fair value and commercial MSRs are accounted for under the amortization method on our consolidated balance sheets. We recorded
$44 million
and
$31 million
of amortization expense for the years ended
December 31, 2017
and
2016
, respectively.
|
|
171
|
Capital One Financial Corporation (COF)
|
|
Goodwill
The following table presents changes in the carrying amount of goodwill as well as goodwill attributable to each of our business segments as of
December 31, 2017
and
2016
. We did not recognize any goodwill impairment during 2017, 2016 or 2015.
Table
7.2
: Goodwill Attributable to Business Segments
__________
|
(Dollars in millions)
|
Credit
Card
|
Consumer
Banking
|
Commercial Banking
|
Total
|
||||||||||||
|
Balance as of December 31, 2015
|
$
|
4,997
|
|
$
|
4,600
|
|
$
|
4,883
|
|
$
|
14,480
|
|
||||
|
Acquisitions
|
36
|
|
0
|
|
18
|
|
54
|
|
||||||||
|
Other adjustments
(1)
|
(15
|
)
|
0
|
|
0
|
|
(15
|
)
|
||||||||
|
Balance as of December 31, 2016
|
5,018
|
|
4,600
|
|
4,901
|
|
14,519
|
|
||||||||
|
Acquisitions
|
6
|
|
0
|
|
0
|
|
6
|
|
||||||||
|
Other adjustments
(1)
|
8
|
|
0
|
|
0
|
|
8
|
|
||||||||
|
Balance as of December 31, 2017
|
$
|
5,032
|
|
$
|
4,600
|
|
$
|
4,901
|
|
$
|
14,533
|
|
||||
|
(1)
|
Represents foreign currency translation adjustments.
|
The goodwill impairment test, performed as of October 1 of each year, is a two-step test. The first step identifies whether there is potential impairment by comparing the fair value of a reporting unit to its carrying amount, including goodwill. If the fair value of a reporting unit is less than its carrying amount, the second step of the impairment test is required to measure the amount of any potential impairment loss.
The fair value of reporting units is calculated using a discounted cash flow methodology, a form of the income approach. The calculation uses projected cash flows based on each reporting unit’s internal forecast and uses the perpetuity growth method to calculate terminal values. These cash flows and terminal values are then discounted using appropriate discount rates, which are largely based on our external cost of equity with adjustments for risk inherent in each reporting unit. Cash flows are adjusted, as necessary, in order to maintain each reporting unit’s equity capital requirements. Our discounted cash flow analysis requires management to make judgments about future loan and deposit growth, revenue growth, credit losses, and capital rates. The key inputs into the discounted cash flow analysis were consistent with market data, where available, indicating that assumptions used were within a reasonable range of observable market data.
Intangible Assets
In connection with our acquisitions, we recorded intangible assets that include PCCR intangibles, core deposit intangibles, brokerage relationship intangibles, partnership contract intangibles, other contract intangibles and trademark intangibles. At acquisition, the PCCR intangibles reflect the estimated value of existing credit card holder relationships and the core deposit intangibles reflect the estimated value of deposit relationships. There were no meaningful intangible asset impairments in
2017
or
2015
. During
2016
, we recorded impairment charges of
$17 million
related primarily to our brokerage relationship intangibles.
|
172
|
Capital One Financial Corporation (COF)
|
|
Intangible assets are typically amortized over their respective estimated useful lives on either an accelerated or straight-line basis. The following table summarizes the actual amortization expense recorded for the years ended
December 31, 2017
,
2016
and
2015
and the estimated future amortization expense for intangible assets as of
December 31, 2017
:
Table
7.3
: Amortization Expense
|
(Dollars in millions)
|
Amortization
Expense |
|||
|
Actual for the year ended December 31,
|
||||
|
2015
|
$
|
430
|
|
|
|
2016
|
386
|
|
||
|
2017
|
245
|
|
||
|
Estimated future amounts for the year ended December 31,
|
||||
|
2018
|
176
|
|
||
|
2019
|
108
|
|
||
|
2020
|
57
|
|
||
|
2021
|
27
|
|
||
|
2022
|
19
|
|
||
|
Thereafter
|
29
|
|
||
|
Total estimated future amounts
|
$
|
416
|
|
|
|
173
|
Capital One Financial Corporation (COF)
|
|
|
|
Premises and Equipment
The following table presents our premises and equipment as of
December 31, 2017
and
2016
:
Table
8.1
: Components of Premises and Equipment
|
|
December 31,
|
|||||||
|
(Dollars in millions)
|
2017
|
2016
|
||||||
|
Land
|
$
|
406
|
|
$
|
423
|
|
||
|
Buildings and improvements
|
3,302
|
|
2,958
|
|
||||
|
Furniture and equipment
|
1,901
|
|
1,834
|
|
||||
|
Computer software
|
1,753
|
|
1,681
|
|
||||
|
In progress
|
902
|
|
591
|
|
||||
|
Total premises and equipment, gross
|
8,264
|
|
7,487
|
|
||||
|
Less: Accumulated depreciation and amortization
|
(4,231
|
)
|
(3,812
|
)
|
||||
|
Total premises and equipment, net
|
$
|
4,033
|
|
$
|
3,675
|
|
||
Depreciation and amortization expense was
$662 million
,
$710 million
and
$638 million
for the years ended
December 31, 2017
,
2016
and
2015
, respectively.
Lease Commitments
Certain premises and equipment are leased under agreements that expire at various dates through 2071, without taking into consideration available renewal options. Many of these leases provide for payment by us, as the lessee, of property taxes, insurance premiums, cost of maintenance and other costs. In some cases, rentals are subject to increases in relation to a cost of living index. Total rent expense was
$307 million
,
$330 million
and
$276 million
for the years ended
December 31, 2017
,
2016
and
2015
, respectively.
Future minimum rental commitments as of
December 31, 2017
, for all non-cancellable operating leases with initial or remaining terms of one year or more are as follows:
Table
8.2
: Lease Commitments
|
(Dollars in millions)
|
Estimated Future
Minimum Rental Commitments |
|||
|
2018
|
$
|
332
|
|
|
|
2019
|
316
|
|
||
|
2020
|
300
|
|
||
|
2021
|
276
|
|
||
|
2022
|
251
|
|
||
|
Thereafter
|
1,177
|
|
||
|
Total
|
$
|
2,652
|
|
|
The table above does not include minimum sublease rental income of
$175 million
expected to be received in future years under all non-cancellable leases.
|
174
|
Capital One Financial Corporation (COF)
|
|
|
|
Our deposits, which are our largest source of funding for our assets and operations, consist of non-interest-bearing and interest-bearing deposits, which include checking accounts, money market deposit accounts, negotiable order of withdrawals, savings deposits and time deposits.
We use a variety of other funding sources including short-term borrowings, senior and subordinated notes, securitized debt obligations and other borrowings. In addition, we utilize FHLB advances, which are secured by certain portions of our loan and investment securities portfolios. Securitized debt obligations are presented separately on our consolidated balance sheets, as they represent obligations of consolidated securitization trusts, while federal funds purchased and securities loaned or sold under agreements to repurchase, senior and subordinated notes and other borrowings, including FHLB advances, are included in other debt on our consolidated balance sheets.
The following tables summarize the components of our deposits, short-term borrowings and long-term debt as of
December 31, 2017
and
2016
. Our total short-term borrowings consist of federal funds purchased and securities loaned or sold under agreements to repurchase. Our long-term debt consists of borrowings with an original contractual maturity of greater than one year. The carrying value presented below for these borrowings include unamortized debt premiums and discounts, net of debt issuance costs and fair value hedge accounting adjustments.
Table
9.1
: Components of Deposits, Short-Term Borrowings and Long-Term Debt
__________
|
(Dollars in millions)
|
December 31,
2017 |
December 31,
2016 |
||||||
|
Deposits:
|
||||||||
|
Non-interest-bearing deposits
|
$
|
26,404
|
|
$
|
25,502
|
|
||
|
Interest-bearing deposits
(1)
|
217,298
|
|
211,266
|
|
||||
|
Total deposits
|
$
|
243,702
|
|
$
|
236,768
|
|
||
|
Short-term borrowings:
|
||||||||
|
Federal funds purchased and securities loaned or sold under agreements to repurchase
|
$
|
576
|
|
$
|
992
|
|
||
|
Total short-term borrowings
|
$
|
576
|
|
$
|
992
|
|
||
|
|
December 31, 2017
|
|
||||||||||||
|
(Dollars in millions)
|
Maturity
Dates
|
Stated Interest Rates
|
Weighted-
Average
Interest Rate
|
Carrying Value
|
December 31,
2016 |
|||||||||
|
Long-term debt:
|
||||||||||||||
|
Securitized debt obligations
|
2018 - 2025
|
1.33 - 2.75%
|
1.89
|
$
|
20,010
|
|
$
|
18,826
|
|
|||||
|
Senior and subordinated notes:
|
||||||||||||||
|
Fixed unsecured senior debt
|
2018 - 2027
|
1.50 - 4.75
|
2.72
|
22,776
|
|
17,546
|
|
|||||||
|
Floating unsecured senior debt
|
2018 - 2023
|
1.83 - 2.57
|
2.27
|
3,446
|
|
1,353
|
|
|||||||
|
Total unsecured senior debt
|
2.66
|
26,222
|
|
18,899
|
|
|||||||||
|
Fixed unsecured subordinated debt
|
2019 - 2026
|
3.38 - 8.80
|
4.09
|
4,533
|
|
4,532
|
|
|||||||
|
Total senior and subordinated notes
|
30,755
|
|
23,431
|
|
||||||||||
|
Other long-term borrowings:
|
||||||||||||||
|
FHLB advances
|
2018 - 2023
|
1.38 - 5.36
|
1.45
|
8,609
|
|
17,179
|
|
|||||||
|
Other borrowings
|
2018 - 2035
|
1.00 - 16.75
|
7.40
|
331
|
|
32
|
|
|||||||
|
Total other long-term borrowings
|
8,940
|
|
17,211
|
|
||||||||||
|
Total long-term debt
|
$
|
59,705
|
|
$
|
59,468
|
|
||||||||
|
Total short-term borrowings and long-term debt
|
$
|
60,281
|
|
$
|
60,460
|
|
||||||||
|
(1)
|
Includes
$1.3 billion
and
$894 million
of time deposits in denominations in excess of the $250,000 federal insurance limit as of December 31, 2017 and 2016, respectively.
|
|
175
|
Capital One Financial Corporation (COF)
|
|
The following table presents the carrying value of our interest-bearing time deposits, securitized debt obligations and other debt by remaining contractual maturity as of
December 31, 2017
.
Table
9.2
: Maturity Profile of Borrowings
|
(Dollars in millions)
|
2018
|
2019
|
2020
|
2021
|
2022
|
Thereafter
|
Total
|
|||||||||||||||||||||
|
Interest-bearing time deposits
|
$
|
9,025
|
|
$
|
7,147
|
|
$
|
5,395
|
|
$
|
3,851
|
|
$
|
4,104
|
|
$
|
158
|
|
$
|
29,680
|
|
|||||||
|
Securitized debt obligations
|
2,666
|
|
6,828
|
|
5,289
|
|
1,698
|
|
2,552
|
|
977
|
|
20,010
|
|
||||||||||||||
|
Federal funds purchased and securities loaned or sold under agreements to repurchase
|
576
|
|
—
|
|
—
|
|
—
|
|
—
|
|
—
|
|
576
|
|
||||||||||||||
|
Senior and subordinated notes
|
4,690
|
|
5,667
|
|
4,360
|
|
3,445
|
|
2,518
|
|
10,075
|
|
30,755
|
|
||||||||||||||
|
Other borrowings
|
230
|
|
66
|
|
8,603
|
|
3
|
|
2
|
|
36
|
|
8,940
|
|
||||||||||||||
|
Total
|
$
|
17,187
|
|
$
|
19,708
|
|
$
|
23,647
|
|
$
|
8,997
|
|
$
|
9,176
|
|
$
|
11,246
|
|
$
|
89,961
|
|
|||||||
|
176
|
Capital One Financial Corporation (COF)
|
|
|
|
Use of Derivatives
We manage asset and liability positions and market risk exposure in accordance with market risk management policies that are approved by our Board of Directors. Our primary market risks stem from the impact on our earnings and economic value of equity from changes in interest rates and, to a lesser extent, changes in foreign exchange rates. We employ several techniques to manage our interest rate sensitivity, which include changing the duration and re-pricing characteristics of various assets and liabilities by using interest rate derivatives. Our current policies also include the use of derivatives to hedge exposures denominated in foreign currency which we use to limit our earnings and capital ratio exposures to foreign exchange risk. We execute our derivative contracts in both the over-the-counter (“OTC”) and exchange-traded derivative markets. Under the Dodd-Frank Act, we are required to clear eligible derivative transactions through Central Counterparty Clearinghouses (“CCPs”) such as the Chicago Mercantile Exchange (“CME”) and LCH Limited (“LCH”), which are often referred to as “central clearinghouses.” The majority of our derivatives are interest rate swaps. In addition, we may use a variety of other derivative instruments, including caps, floors, options, futures and forward contracts, to manage our interest rate and foreign exchange risks. We offer various interest rate, foreign exchange rate and commodity derivatives as an accommodation to our customers within our Commercial Banking business, and usually offset our exposure through derivative transactions with other counterparties.
Derivatives Counterparty Credit Risk
Derivative instruments contain an element of credit risk that arises from the potential failure of a counterparty to perform according to the terms of the contract. Our exposure to derivative counterparty credit risk, at any point in time, is represented by the fair value of derivatives in a gain position, or derivative asset position, assuming no recoveries of underlying collateral.
To mitigate the risk of counterparty default, we enter into legally enforceable master netting agreements and collateral agreements, where possible, with certain derivative counterparties. We generally enter into these agreements on a bilateral basis with our counterparties. These bilateral agreements typically provide the right to offset exposures and require one counterparty to post collateral on derivative instruments in a net liability position to the other counterparty. Certain of these bilateral agreements include provisions requiring that our debt maintain a credit rating of investment grade or above by each of the major credit rating agencies. In the event of a downgrade of our debt credit rating below investment grade, some of our counterparties would have the right to terminate the derivative contract and close out the existing positions.
We also clear certain OTC derivatives with central clearinghouses through futures commission merchants (“FCMs”) as part of the regulatory requirement. The use of the CCPs and the FCMs reduces our bilateral counterparty credit exposures while it increases our credit exposures to CCPs and FCMs. We are required by CCPs to post initial and variation margin to mitigate the risk of non-payment through our FCMs. Our FCM agreements governing these derivative transactions generally include provisions that may require us to post more collateral or otherwise change terms in our agreements under certain circumstances. Effective January 3, 2017, the CME amended its rulebook to legally characterize variation margin cash payments for cleared OTC derivatives as a settlement of the position rather than collateral. We adopted this variation margin rule change in the second quarter of 2017. As a result, the balances for CME-cleared derivatives are reduced to reflect the settlement of these positions. Variation margin payments for LCH-cleared derivatives continued to be characterized as collateral as of December 31, 2017.
We record counterparty credit risk valuation adjustments (“CVAs”) on our derivative contracts to properly reflect the credit quality of the counterparty. We consider collateral and legally enforceable master netting agreements that mitigate our credit exposure to each counterparty in determining the counterparty credit risk valuation adjustment, which may be adjusted in future periods due to changes in the fair value of the derivative contracts, collateral and creditworthiness of the counterparty. We also record debit valuation adjustments (“DVAs”) to adjust the fair value of our derivative liabilities to reflect the impact of our own credit quality. We calculate this adjustment by comparing the spreads on our credit default swaps to the discount benchmark curve.
Accounting for Derivatives
Our derivatives are designated as either qualifying accounting hedges or free-standing derivatives. Qualifying accounting hedges are designated as fair value hedges, cash flow hedges or net investment hedges. Free-standing derivatives primarily consist of customer accommodation derivatives and economic hedges that do not qualify for hedge accounting.
|
177
|
Capital One Financial Corporation (COF)
|
|
|
•
|
Fair Value Hedges:
We designate derivatives as fair value hedges when they are used to manage our exposure to changes in the fair value of certain financial assets and liabilities, which fluctuate in value as a result of movements in interest rates. Changes in the fair value of derivatives designated as fair value hedges are recorded in earnings together with offsetting changes in the fair value of the hedged item and any resulting ineffectiveness. Our fair value hedges consist of interest rate swaps that are intended to modify our exposure to interest rate risk on various fixed-rate assets and liabilities.
|
|
•
|
Cash Flow Hedges:
We designate derivatives as cash flow hedges when they are used to manage our exposure to variability in cash flows related to forecasted transactions. Changes in the fair value of derivatives designated as cash flow hedges are recorded as a component of AOCI, to the extent that the hedge relationships are effective, and amounts are reclassified from AOCI to earnings as the forecasted transactions impact earnings. To the extent that any ineffectiveness exists in the hedge relationships, the amounts are recorded in earnings. Our cash flow hedges use interest rate swaps and floors that are intended to hedge the variability in interest receipts or interest payments on various variable-rate assets or liabilities. We also enter into foreign currency forward derivative contracts to hedge our exposure to variability in cash flows related to intercompany borrowings denominated in a foreign currency.
|
|
•
|
Net Investment Hedges:
We use net investment hedges to manage the foreign currency exposure related to our net investments in foreign operations that have functional currencies other than the U.S. dollar. Changes in the fair value of net investment hedges are recorded in the translation adjustment component of AOCI, offsetting the translation gain or loss from those foreign operations. We execute net investment hedges using foreign exchange forward contracts to hedge the translation exposure of the net investment in our foreign operations.
|
|
•
|
Free-Standing Derivatives:
We use free-standing derivatives to hedge the risk of changes in the fair value of residential MSRs, mortgage loan origination and purchase commitments and other interests held. We also categorize our customer accommodation derivatives and the related offsetting contracts as free-standing derivatives. Changes in the fair value of free-standing derivatives are recorded in earnings as a component of other non-interest income.
|
Balance Sheet Presentation
The following table summarizes the notional and fair values of our derivative instruments as of
December 31, 2017
and
2016
, which are segregated by derivatives that are designated as accounting hedges and those that are not, and are further segregated by type of contract within those two categories. The total derivative assets and liabilities are presented on an aggregate basis to take into consideration the effects of legally enforceable master netting agreements and any associated cash collateral received or pledged.
|
178
|
Capital One Financial Corporation (COF)
|
|
Table
10.1
: Derivative Assets and Liabilities at Fair Value
__________
|
|
December 31, 2017
|
December 31, 2016
|
||||||||||||||||||||||
|
|
Notional or
Contractual
Amount
|
Derivative
(1)(4)
|
Notional or
Contractual
Amount
|
Derivative
(1)
|
||||||||||||||||||||
|
(Dollars in millions)
|
Assets
|
Liabilities
|
Assets
|
Liabilities
|
||||||||||||||||||||
|
Derivatives designated as accounting hedges:
|
||||||||||||||||||||||||
|
Interest rate contracts:
|
||||||||||||||||||||||||
|
Fair value hedges
|
$
|
56,604
|
|
$
|
102
|
|
$
|
164
|
|
$
|
40,480
|
|
$
|
295
|
|
$
|
569
|
|
||||||
|
Cash flow hedges
|
77,300
|
|
30
|
|
125
|
|
50,400
|
|
151
|
|
287
|
|
||||||||||||
|
Total interest rate contracts
|
133,904
|
|
132
|
|
289
|
|
90,880
|
|
446
|
|
856
|
|
||||||||||||
|
Foreign exchange contracts:
|
||||||||||||||||||||||||
|
Cash flow hedges
|
6,086
|
|
19
|
|
75
|
|
5,620
|
|
108
|
|
9
|
|
||||||||||||
|
Net investment hedges
|
3,036
|
|
1
|
|
164
|
|
2,396
|
|
163
|
|
0
|
|
||||||||||||
|
Total foreign exchange contracts
|
9,122
|
|
20
|
|
239
|
|
8,016
|
|
271
|
|
9
|
|
||||||||||||
|
Total derivatives designated as accounting hedges
|
143,026
|
|
152
|
|
528
|
|
98,896
|
|
717
|
|
865
|
|
||||||||||||
|
Derivatives not designated as accounting hedges:
|
||||||||||||||||||||||||
|
Interest rate contracts covering:
|
||||||||||||||||||||||||
|
MSRs
(2)
|
1,033
|
|
7
|
|
1
|
|
1,696
|
|
17
|
|
21
|
|
||||||||||||
|
Customer accommodation
|
48,520
|
|
848
|
|
727
|
|
39,474
|
|
670
|
|
530
|
|
||||||||||||
|
Other interest rate exposures
(2)
|
2,824
|
|
33
|
|
7
|
|
1,105
|
|
33
|
|
8
|
|
||||||||||||
|
Total interest rate contracts
|
52,377
|
|
888
|
|
735
|
|
42,275
|
|
720
|
|
559
|
|
||||||||||||
|
Other contracts
|
1,209
|
|
0
|
|
5
|
|
1,767
|
|
57
|
|
14
|
|
||||||||||||
|
Total derivatives not designated as accounting hedges
|
53,586
|
|
888
|
|
740
|
|
44,042
|
|
777
|
|
573
|
|
||||||||||||
|
Total derivatives
|
$
|
196,612
|
|
$
|
1,040
|
|
$
|
1,268
|
|
$
|
142,938
|
|
$
|
1,494
|
|
$
|
1,438
|
|
||||||
|
Less: netting adjustment
(3)
|
(275
|
)
|
(662
|
)
|
(539
|
)
|
(336
|
)
|
||||||||||||||||
|
Total derivative assets/liabilities
|
$
|
765
|
|
$
|
606
|
|
$
|
955
|
|
$
|
1,102
|
|
||||||||||||
|
(1)
|
Derivative assets and liabilities presented above exclude valuation adjustments related to non-performance risk. As of
December 31, 2017
and
2016
, the cumulative CVA balances were
$2 million
and
$6 million
, respectively, and the cumulative DVA balances were less than
$1 million
as of both
December 31, 2017
and
2016
.
|
|
(2)
|
MSR contracts include interest rate swaps and to-be-announced contracts. Other interest rate exposures include mortgage-related derivatives.
|
|
(3)
|
Represents balance sheet netting of derivative assets and liabilities, and related payables and receivables for cash collateral held or placed with the same counterparty. See Table
10.2
for additional information.
|
|
(4)
|
Reflects an increase of derivative assets of
$38 million
and a reduction of derivative liabilities of
$724 million
on our consolidated balance sheets as of
December 31, 2017
as a result of adoption of the CME variation margin rule change in the second quarter of 2017.
|
Offsetting of Financial Assets and Liabilities
Derivative contracts and repurchase agreements that we execute bilaterally in the OTC market are governed by enforceable master netting arrangements where we generally have the right to offset exposure with the same counterparty. Either counterparty can generally request to net settle all contracts through a single payment upon default on, or termination of, any one contract. We elect to offset the derivative assets and liabilities under netting arrangements for balance sheet presentation where a right of setoff exists. For derivative contracts entered into under master netting arrangements for which we have not been able to confirm the enforceability of the setoff rights, or those not subject to master netting arrangements, we do not offset our derivative positions for balance sheet presentation.
We also maintain collateral agreements with certain derivative counterparties. For bilateral derivatives, we review our collateral positions on a daily basis and exchange collateral with our counterparties in accordance with standard International Swaps and Derivatives Association documentation and other related agreements. Agreements with certain bilateral counterparties require both parties to maintain collateral in the event the fair values of derivative instruments exceed established exposure thresholds. For centrally cleared derivatives, we are subject to initial margin and daily variation margin posting with the central clearinghouses. Acceptable types of collateral are typically in the form of cash or high quality liquid securities.
|
179
|
Capital One Financial Corporation (COF)
|
|
The exchange of collateral is dependent upon the fair value of the derivative instruments as well as the fair value of the pledged collateral. When valuing collateral, an estimate of the variation in price and liquidity over time is subtracted in the form of a “haircut” to discount the value of the collateral pledged.
The following table presents as of
December 31, 2017
and
2016
the gross and net fair values of our derivative assets and liabilities and repurchase agreements, as well as the related offsetting amounts permitted under U.S. GAAP. The table also includes cash and non-cash collateral received or pledged associated with such arrangements. The collateral amounts shown are limited to the extent of the related net derivative fair values or outstanding balances, thus instances of over-collateralization are not shown.
Table
10.2
: Offsetting of Financial Assets and Financial Liabilities
__________
|
|
Gross
Amounts
|
Gross Amounts Offset in the Balance Sheet
|
Net Amounts as Recognized
|
Securities Collateral Held Under Master Netting Agreements
|
|
|
||||||||||||||||||
|
(Dollars in millions)
|
Financial
Instruments
|
Cash Collateral Received
|
|
Net
Exposure
|
||||||||||||||||||||
|
As of December 31, 2017
|
||||||||||||||||||||||||
|
Derivative assets
(1)(2)
|
$
|
1,040
|
|
$
|
(202
|
)
|
$
|
(73
|
)
|
$
|
765
|
|
$
|
0
|
|
$
|
765
|
|
||||||
|
As of December 31, 2016
|
||||||||||||||||||||||||
|
Derivative assets
(2)
|
1,494
|
|
(152
|
)
|
(387
|
)
|
955
|
|
(11
|
)
|
944
|
|
||||||||||||
|
Gross
Amounts
|
Gross Amounts Offset in the Balance Sheet
|
Net Amounts as Recognized
|
Securities Collateral Pledged Under Master Netting Agreements
|
|
|
|||||||||||||||||||
|
(Dollars in millions)
|
Financial
Instruments
|
Cash Collateral Pledged
|
|
Net
Exposure
|
||||||||||||||||||||
|
As of December 31, 2017
|
||||||||||||||||||||||||
|
Derivative liabilities
(1)(2)
|
$
|
1,268
|
|
$
|
(202
|
)
|
$
|
(460
|
)
|
$
|
606
|
|
$
|
0
|
|
$
|
606
|
|
||||||
|
Repurchase agreements
(3)
|
576
|
|
0
|
|
0
|
|
576
|
|
(576
|
)
|
0
|
|
||||||||||||
|
As of December 31, 2016
|
||||||||||||||||||||||||
|
Derivative liabilities
(2)
|
1,438
|
|
(152
|
)
|
(184
|
)
|
1,102
|
|
0
|
|
1,102
|
|
||||||||||||
|
Repurchase agreements
|
992
|
|
0
|
|
0
|
|
992
|
|
(992
|
)
|
0
|
|
||||||||||||
|
(1)
|
Reflects an increase of derivative assets of
$38 million
and a reduction of derivative liabilities of
$724 million
on our consolidated balance sheets as of
December 31, 2017
as a result of adoption of the CME variation margin rule change in the second quarter of 2017.
|
|
(2)
|
We received cash collateral from derivative counterparties totaling
$91 million
and
$448 million
as of
December 31, 2017
and
2016
, respectively. We also received securities from derivative counterparties with a fair value of
$1 million
and
$16 million
as of
December 31, 2017
and
2016
, respectively, which we have the ability to re-pledge. We posted
$966 million
and
$1.5 billion
of cash collateral as of
December 31, 2017
and
2016
, respectively.
|
|
(3)
|
Represents customer repurchase agreements that mature the next business day. As of
December 31, 2017
, we pledged collateral with a fair value of
$588 million
under these customer repurchase agreements, which were primarily agency RMBS securities.
|
Income Statement Presentation and AOCI
Fair Value Hedges and Free-Standing Derivatives
The following table presents gains or losses related to derivatives designated as fair value hedges and free-standing derivatives for
the years ended December 31, 2017, 2016 and 2015
. These gains or losses are included as a component of other non-interest income in our consolidated statements of income. Accrued interest income or expense on fair value hedges is recorded in net interest income or expense in our consolidated statements of income and is excluded from this table.
|
180
|
Capital One Financial Corporation (COF)
|
|
Table
10.3
: Gains and Losses on Fair Value Hedges and Free-Standing Derivatives
|
Year Ended December 31,
|
||||||||||||
|
(Dollars in millions)
|
2017
|
2016
|
2015
|
|||||||||
|
Derivatives designated as fair value hedges:
|
||||||||||||
|
Fair value interest rate contracts:
|
||||||||||||
|
Gains (losses) recognized in earnings on derivatives
|
$
|
(212
|
)
|
$
|
(613
|
)
|
$
|
(66
|
)
|
|||
|
Gains (losses) recognized in earnings on hedged items
|
216
|
|
603
|
|
75
|
|
||||||
|
Net fair value hedge ineffectiveness gains (losses)
|
4
|
|
(10
|
)
|
9
|
|
||||||
|
Derivatives not designated as accounting hedges:
|
||||||||||||
|
Interest rate contracts covering:
|
||||||||||||
|
MSRs
|
3
|
|
(1
|
)
|
3
|
|
||||||
|
Customer accommodation
|
38
|
|
37
|
|
21
|
|
||||||
|
Other interest rate exposures
|
58
|
|
68
|
|
44
|
|
||||||
|
Total interest rate contracts
|
99
|
|
104
|
|
68
|
|
||||||
|
Other contracts
|
0
|
|
(9
|
)
|
(2
|
)
|
||||||
|
Total gains on derivatives not designated as accounting hedges
|
99
|
|
95
|
|
66
|
|
||||||
|
Net derivative gains recognized in earnings
|
$
|
103
|
|
$
|
85
|
|
$
|
75
|
|
|||
|
181
|
Capital One Financial Corporation (COF)
|
|
Cash Flow and Net Investment Hedges
The following table shows the net gains (losses) related to derivatives designated as cash flow hedges and net investment hedges
for
the years ended December 31, 2017, 2016 and 2015
.
Table
10.4
: Gains and Losses on Derivatives Designated as Cash Flow Hedges and Net Investment Hedges
__________
|
|
Year Ended December 31,
|
|||||||||||
|
(Dollars in millions)
|
2017
|
2016
|
2015
|
|||||||||
|
Gains (losses) recorded in AOCI:
|
||||||||||||
|
Cash flow hedges:
|
||||||||||||
|
Interest rate contracts
|
$
|
(113
|
)
|
$
|
(6
|
)
|
$
|
301
|
|
|||
|
Foreign exchange contracts
|
18
|
|
3
|
|
(17
|
)
|
||||||
|
Subtotal
|
(95
|
)
|
(3
|
)
|
284
|
|
||||||
|
Net investment hedges:
|
||||||||||||
|
Foreign exchange contracts
|
(143
|
)
|
280
|
|
83
|
|
||||||
|
Net derivatives gains (losses) recognized in AOCI
|
$
|
(238
|
)
|
$
|
277
|
|
$
|
367
|
|
|||
|
Gains (losses) recorded in earnings:
|
||||||||||||
|
Cash flow hedges:
|
||||||||||||
|
Gains (losses) reclassified from AOCI into earnings:
|
||||||||||||
|
Interest rate contracts
(1)
|
$
|
91
|
|
$
|
192
|
|
$
|
190
|
|
|||
|
Foreign exchange contracts
(2)
|
17
|
|
3
|
|
(16
|
)
|
||||||
|
Subtotal
|
108
|
|
195
|
|
174
|
|
||||||
|
Gains (losses) recognized in earnings due to ineffectiveness:
|
||||||||||||
|
Interest rate contracts
(2)
|
2
|
|
(4
|
)
|
2
|
|
||||||
|
Net derivative gains (losses) recognized in earnings
|
$
|
110
|
|
$
|
191
|
|
$
|
176
|
|
|||
|
(1)
|
Amounts reclassified are recorded in our consolidated statements of income in interest income or interest expense.
|
|
(2)
|
Amounts are recorded in our consolidated statements of income in other non-interest income or other interest income.
|
In the next 12 months, we expect to reclassify to earnings net after-tax losses of
$17 million
currently recorded in AOCI as of
December 31, 2017
. These amounts will offset the cash flows associated with the hedged forecasted transactions. The maximum length of time over which forecasted transactions were hedged was approximately
six
years as of
December 31, 2017
. The amount we expect to reclassify into earnings may change as a result of changes in market conditions and ongoing actions taken as part of our overall risk management strategy.
|
182
|
Capital One Financial Corporation (COF)
|
|
|
|
Preferred Stock
The following table summarizes the Company’s preferred stock issued and outstanding as of
December 31, 2017
and
2016
.
Table
11.1
: Preferred Stock Issued and Outstanding
(1)
__________
|
Redeemable by Issuer Beginning
|
Per Annum Dividend Rate
|
Dividend Frequency
|
Liquidation Preference per Share
|
Carrying Value
(in millions)
|
|||||||||||||||||||||
|
Series
|
Description
|
Issuance Date
|
Total Shares Outstanding
|
December 31, 2017
|
December 31, 2016
|
||||||||||||||||||||
|
Series B
|
6.00%
Non-Cumulative
|
August 20, 2012
|
September 1, 2017
|
6.00%
|
Quarterly
|
$
|
1,000
|
|
875,000
|
|
$
|
853
|
|
$
|
853
|
|
|||||||||
|
Series C
|
6.25%
Non-Cumulative
|
June 12, 2014
|
September 1, 2019
|
6.25
|
Quarterly
|
1,000
|
|
500,000
|
|
484
|
|
484
|
|
||||||||||||
|
Series D
|
6.70%
Non-Cumulative
|
October 31, 2014
|
December 1, 2019
|
6.70
|
Quarterly
|
1,000
|
|
500,000
|
|
485
|
|
485
|
|
||||||||||||
|
Series E
|
Fixed-to-Floating Rate Non-Cumulative
|
May 14, 2015
|
June 1, 2020
|
5.55% through 5/31/2020;
3-mo. LIBOR+ 380 bps thereafter |
Semi-Annually through 5/31/2020; Quarterly thereafter
|
1,000
|
|
1,000,000
|
|
988
|
|
988
|
|
||||||||||||
|
Series F
|
6.20%
Non-Cumulative
|
August 24, 2015
|
December 1, 2020
|
6.20
|
Quarterly
|
1,000
|
|
500,000
|
|
484
|
|
484
|
|
||||||||||||
|
Series G
|
5.20%
Non-Cumulative
|
July 29, 2016
|
December 1, 2021
|
5.20
|
Quarterly
|
1,000
|
|
600,000
|
|
583
|
|
583
|
|
||||||||||||
|
Series H
|
6.00%
Non-Cumulative
|
November 29, 2016
|
December 1, 2021
|
6.00
|
Quarterly
|
1,000
|
|
500,000
|
|
483
|
|
483
|
|
||||||||||||
|
Total
|
$
|
4,360
|
|
$
|
4,360
|
|
|||||||||||||||||||
|
(1)
|
Except for Series E, ownership is held in the form of depositary shares, each representing a 1/40th interest in a share of fixed-rate non-cumulative perpetual preferred stock.
|
|
183
|
Capital One Financial Corporation (COF)
|
|
Accumulated Other Comprehensive Income
Accumulated other comprehensive income primarily consists of accumulated net unrealized gains or losses associated with available for sale securities, the effective portion of the changes in fair value of derivatives designated as cash flow hedges, unrealized gains and losses on securities held to maturity on the transfer date from the available for sale category and foreign currency translation adjustments. Unrealized gains and losses for securities held to maturity are amortized over the remaining life of the security with no expected impact on future net income as amortization of these gains or losses will be offset by the amortization of premium or discount created from the transfer of securities from available to sale to held to maturity. The amount of foreign currency translation adjustments below includes the impact from hedging instruments designated as net investment hedges.
The following table presents the changes in AOCI by component for
the years ended December 31, 2017, 2016 and 2015
.
Table
11.2
: Accumulated Other Comprehensive Income
|
(Dollars in millions)
|
Securities
Available
for Sale
|
Securities Held to Maturity
|
Cash Flow
Hedges
|
Foreign
Currency Translation Adjustments |
Other
|
Total
|
||||||||||||||||||
|
AOCI as of December 31, 2014
|
$
|
410
|
|
$
|
(821
|
)
|
$
|
10
|
|
$
|
(8
|
)
|
$
|
(21
|
)
|
$
|
(430
|
)
|
||||||
|
Other comprehensive income (loss) before reclassifications
|
(268
|
)
|
0
|
|
284
|
|
(135
|
)
|
(5
|
)
|
(124
|
)
|
||||||||||||
|
Amounts reclassified from AOCI into earnings
|
20
|
|
96
|
|
(174
|
)
|
0
|
|
(4
|
)
|
(62
|
)
|
||||||||||||
|
Net other comprehensive income (loss)
|
(248
|
)
|
96
|
|
110
|
|
(135
|
)
|
(9
|
)
|
(186
|
)
|
||||||||||||
|
AOCI as of December 31, 2015
|
162
|
|
(725
|
)
|
120
|
|
(143
|
)
|
(30
|
)
|
(616
|
)
|
||||||||||||
|
Other comprehensive income (loss) before reclassifications
|
(172
|
)
|
0
|
|
(3
|
)
|
(79
|
)
|
7
|
|
(247
|
)
|
||||||||||||
|
Amounts reclassified from AOCI into earnings
|
6
|
|
104
|
|
(195
|
)
|
0
|
|
(1
|
)
|
(86
|
)
|
||||||||||||
|
Net other comprehensive income (loss)
|
(166
|
)
|
104
|
|
(198
|
)
|
(79
|
)
|
6
|
|
(333
|
)
|
||||||||||||
|
AOCI as of December 31, 2016
|
(4
|
)
|
(621
|
)
|
(78
|
)
|
(222
|
)
|
(24
|
)
|
(949
|
)
|
||||||||||||
|
Other comprehensive income (loss) before reclassifications
|
62
|
|
0
|
|
(95
|
)
|
84
|
|
30
|
|
81
|
|
||||||||||||
|
Amounts reclassified from AOCI into earnings
|
(41
|
)
|
97
|
|
(108
|
)
|
0
|
|
(6
|
)
|
(58
|
)
|
||||||||||||
|
Net other comprehensive income (loss)
|
21
|
|
97
|
|
(203
|
)
|
84
|
|
24
|
|
23
|
|
||||||||||||
|
AOCI as of December 31, 2017
|
$
|
17
|
|
$
|
(524
|
)
|
$
|
(281
|
)
|
$
|
(138
|
)
|
$
|
0
|
|
$
|
(926
|
)
|
||||||
|
184
|
Capital One Financial Corporation (COF)
|
|
The following table presents the impacts on net income of amounts reclassified from each component of AOCI for
the years ended December 31, 2017, 2016 and 2015
.
Table
11.3
: Reclassifications from AOCI
|
Amount Reclassified from AOCI
|
||||||||||||||
|
(Dollars in millions)
|
Year Ended December 31,
|
|||||||||||||
|
AOCI Components
|
Affected Income Statement Line Item
|
2017
|
2016
|
2015
|
||||||||||
|
Securities available for sale:
|
||||||||||||||
|
Non-interest income
|
$
|
65
|
|
$
|
(10
|
)
|
$
|
(32
|
)
|
|||||
|
Income tax provision (benefit)
|
24
|
|
(4
|
)
|
(12
|
)
|
||||||||
|
Net income (loss)
|
41
|
|
(6
|
)
|
(20
|
)
|
||||||||
|
Securities held to maturity:
|
||||||||||||||
|
Interest income
|
(150
|
)
|
(164
|
)
|
(151
|
)
|
||||||||
|
Income tax benefit
|
(53
|
)
|
(60
|
)
|
(55
|
)
|
||||||||
|
Net income loss
|
(97
|
)
|
(104
|
)
|
(96
|
)
|
||||||||
|
Cash flow hedges:
|
||||||||||||||
|
Interest rate contracts:
|
Interest income
|
145
|
|
306
|
|
303
|
|
|||||||
|
Foreign exchange contracts:
|
Interest income
|
27
|
|
6
|
|
(5
|
)
|
|||||||
|
Non-interest income
|
1
|
|
(2
|
)
|
(21
|
)
|
||||||||
|
Income from continuing operations before income taxes
|
173
|
|
310
|
|
277
|
|
||||||||
|
Income tax provision
|
65
|
|
115
|
|
103
|
|
||||||||
|
Net income
|
108
|
|
195
|
|
174
|
|
||||||||
|
Other:
|
||||||||||||||
|
Non-interest income and non-interest expense
|
9
|
|
2
|
|
5
|
|
||||||||
|
Income tax provision
|
3
|
|
1
|
|
1
|
|
||||||||
|
Net income
|
6
|
|
1
|
|
4
|
|
||||||||
|
Total reclassifications
|
$
|
58
|
|
$
|
86
|
|
$
|
62
|
|
|||||
The table below summarizes other comprehensive income activity and the related tax impact for
the years ended December 31, 2017, 2016 and 2015
.
Table
11.4
: Other Comprehensive Income (Loss)
|
|
Year Ended December 31,
|
|||||||||||||||||||||||||||||||||||
|
|
2017
|
2016
|
2015
|
|||||||||||||||||||||||||||||||||
|
(Dollars in millions)
|
Before
Tax
|
Provision
(Benefit) |
After
Tax
|
Before
Tax
|
Provision
(Benefit) |
After
Tax
|
Before
Tax
|
Provision
(Benefit) |
After
Tax
|
|||||||||||||||||||||||||||
|
Other comprehensive income (loss):
|
||||||||||||||||||||||||||||||||||||
|
Net unrealized gains (losses) on securities available for sale
|
$
|
23
|
|
$
|
2
|
|
$
|
21
|
|
$
|
(254
|
)
|
$
|
(88
|
)
|
$
|
(166
|
)
|
$
|
(393
|
)
|
$
|
(145
|
)
|
$
|
(248
|
)
|
|||||||||
|
Net changes in securities held to maturity
|
150
|
|
53
|
|
97
|
|
164
|
|
60
|
|
104
|
|
151
|
|
55
|
|
96
|
|
||||||||||||||||||
|
Net unrealized gains (losses) on cash flow hedges
|
(325
|
)
|
(122
|
)
|
(203
|
)
|
(315
|
)
|
(117
|
)
|
(198
|
)
|
175
|
|
65
|
|
110
|
|
||||||||||||||||||
|
Foreign currency translation adjustments
|
3
|
|
(81
|
)
|
84
|
|
86
|
|
165
|
|
(79
|
)
|
(86
|
)
|
49
|
|
(135
|
)
|
||||||||||||||||||
|
Other
|
38
|
|
14
|
|
24
|
|
10
|
|
4
|
|
6
|
|
(14
|
)
|
(5
|
)
|
(9
|
)
|
||||||||||||||||||
|
Other comprehensive income (loss)
|
$
|
(111
|
)
|
$
|
(134
|
)
|
$
|
23
|
|
$
|
(309
|
)
|
$
|
24
|
|
$
|
(333
|
)
|
$
|
(167
|
)
|
$
|
19
|
|
$
|
(186
|
)
|
|||||||||
|
185
|
Capital One Financial Corporation (COF)
|
|
|
|
Regulation and Capital Adequacy
Bank holding companies (“BHCs”) and national banks are subject to capital adequacy standards adopted by the Federal Reserve, Office of the Comptroller of the Currency and Federal Deposit Insurance Corporation (collectively, the “Federal Banking Agencies”), including the Basel III Capital Rule. Moreover, the Banks, as insured depository institutions, are subject to prompt corrective action (“PCA”) capital regulations, which require the Federal Banking Agencies to take prompt corrective action for banks that do not meet PCA capital requirements. We entered parallel run under Advanced Approaches on January 1, 2015, during which we calculate capital ratios under both the Basel III Standardized Approach and the Basel III Advanced Approaches, though we continue to use the Standardized Approach for purposes of meeting regulatory capital requirements.
Under the Basel III Capital Rule, the regulatory minimum risk-based and leverage capital requirements for Advanced Approaches banking organizations include a common equity Tier 1 capital ratio of at least
4.5%
, a Tier 1 capital ratio of at least
6.0%
, a total capital ratio of at least
8.0%
and a Tier 1 leverage capital ratio of at least
4.0%
. The Basel III Capital Rule introduced a supplementary leverage ratio for all Advanced Approaches banking organizations, which compares Tier 1 capital to total leverage exposure, which includes all on-balance sheet assets and certain off-balance sheet exposures, including derivatives and unused commitments. Given that we are in our Basel III Advanced Approaches parallel run, we calculate the ratio based on Tier 1 capital under the Standardized Approach. The supplementary leverage ratio minimum requirement of
3.0%
became effective on January 1, 2018. As an Advanced Approaches banking organization, however, we were required to calculate and publicly disclose our supplementary leverage ratio beginning in the first quarter of 2015.
For additional information about the capital adequacy guidelines we are subject to, see “Part 1—
Item 1.
Business
—
Supervision and Regulation
.”
|
186
|
Capital One Financial Corporation (COF)
|
|
The following table
provides a comparison of our regulatory capital amounts and ratios under the Basel III Standardized Approach subject to the applicable transition provisions, the regulatory minimum capital adequacy ratios and the PCA well-capitalized level for each ratio,where applicable, as of
December 31, 2017
and
2016
.
Table
12.1
: Capital Ratios Under Basel III
(1)
__________
|
|
December 31, 2017
|
December 31, 2016
|
||||||||||||||||||
|
(Dollars in millions)
|
Capital Amount
|
Capital
Ratio |
Minimum
Capital Adequacy |
Well-
Capitalized |
Capital Amount
|
Capital
Ratio |
Minimum
Capital Adequacy |
Well-
Capitalized |
||||||||||||
|
Capital One Financial Corp:
|
||||||||||||||||||||
|
Common equity Tier 1 capital
(2)
|
$
|
30,036
|
|
10.3
|
4.5
|
N/A
|
$
|
28,803
|
|
10.1
|
4.5
|
N/A
|
||||||||
|
Tier 1 capital
(3)
|
34,396
|
|
11.8
|
6.0
|
6.0
|
33,162
|
|
11.6
|
6.0
|
6.0
|
||||||||||
|
Total capital
(4)
|
41,962
|
|
14.4
|
8.0
|
10.0
|
40,817
|
|
14.3
|
8.0
|
10.0
|
||||||||||
|
Tier 1 leverage
(5)
|
34,396
|
|
9.9
|
4.0
|
N/A
|
33,162
|
|
9.9
|
4.0
|
N/A
|
||||||||||
|
Supplementary leverage
(6)
|
34,396
|
|
8.4
|
N/A
|
N/A
|
33,162
|
|
8.6
|
N/A
|
N/A
|
||||||||||
|
COBNA:
|
||||||||||||||||||||
|
Common equity Tier 1 capital
(2)
|
14,791
|
|
14.3
|
4.5
|
6.5
|
11,568
|
|
12.0
|
4.5
|
6.5
|
||||||||||
|
Tier 1 capital
(3)
|
14,791
|
|
14.3
|
6.0
|
8.0
|
11,568
|
|
12.0
|
6.0
|
8.0
|
||||||||||
|
Total capital
(4)
|
17,521
|
|
16.9
|
8.0
|
10.0
|
14,230
|
|
14.8
|
8.0
|
10.0
|
||||||||||
|
Tier 1 leverage
(5)
|
14,791
|
|
12.7
|
4.0
|
5.0
|
11,568
|
|
10.8
|
4.0
|
5.0
|
||||||||||
|
Supplementary leverage
(6)
|
14,791
|
|
10.4
|
N/A
|
N/A
|
11,568
|
|
8.9
|
N/A
|
N/A
|
||||||||||
|
CONA:
|
||||||||||||||||||||
|
Common equity Tier 1 capital
(2)
|
23,771
|
|
12.2
|
4.5
|
6.5
|
20,670
|
|
10.6
|
4.5
|
6.5
|
||||||||||
|
Tier 1 capital
(3)
|
23,771
|
|
12.2
|
6.0
|
8.0
|
20,670
|
|
10.6
|
6.0
|
8.0
|
||||||||||
|
Total capital
(4)
|
26,214
|
|
13.4
|
8.0
|
10.0
|
23,117
|
|
11.8
|
8.0
|
10.0
|
||||||||||
|
Tier 1 leverage
(5)
|
23,771
|
|
8.6
|
4.0
|
5.0
|
20,670
|
|
7.7
|
4.0
|
5.0
|
||||||||||
|
Supplementary leverage
(6)
|
23,771
|
|
7.7
|
N/A
|
N/A
|
20,670
|
|
6.9
|
N/A
|
N/A
|
||||||||||
|
(1)
|
Capital ratios are calculated based on the Basel III Standardized Approach framework, subject to applicable transition provisions, such as the inclusion of the unrealized gains and losses on securities available for sale included in AOCI and adjustments related to intangible assets other than goodwill. The inclusion of AOCI and the adjustments related to intangible assets are phased-in at
60%
for 2016,
80%
for 2017 and
100%
for 2018. Capital ratios that are not applicable are denoted by “N/A.”
|
|
(2)
|
Common equity Tier 1 capital ratio is a regulatory capital measure calculated based on common equity Tier 1 capital divided by risk-weighted assets.
|
|
(3)
|
Tier 1 capital ratio is a regulatory capital measure calculated based on Tier 1 capital divided by risk-weighted assets.
|
|
(4)
|
Total capital ratio is a regulatory capital measure calculated based on total capital divided by risk-weighted assets.
|
|
(5)
|
Tier 1 leverage ratio is a regulatory capital measure calculated based on Tier 1 capital divided by adjusted average assets.
|
|
(6)
|
Supplementary leverage ratio is a regulatory capital measure calculated based on Tier 1 capital divided by total leverage exposure.
|
We exceeded the minimum capital requirements and each of the Banks exceeded the minimum regulatory requirements and were well-capitalized under PCA requirements as of both
December 31, 2017
and
2016
.
Regulatory restrictions exist that limit the ability of the Banks to transfer funds to our BHC. As of
December 31, 2017
, funds available for dividend payments from COBNA and CONA were
$4.0 billion
and
$1.6 billion
, respectively. Applicable provisions that may be contained in our borrowing agreements or the borrowing agreements of our subsidiaries may limit our subsidiaries’ ability to pay dividends to us or our ability to pay dividends to our stockholders.
|
187
|
Capital One Financial Corporation (COF)
|
|
|
|
The following table sets forth the computation of basic and diluted earnings per common share. Dividends and undistributed earnings allocated to participating securities represent the undistributed earnings allocated to participating securities using the two-class method permitted by U.S. GAAP for computing earnings per share.
Table
13.1
: Computation of Basic and Diluted Earnings per Common Share
__________
|
|
Year Ended December 31,
|
|||||||||||
|
(Dollars and shares in millions, except per share data)
|
2017
|
2016
|
2015
|
|||||||||
|
Income from continuing operations, net of tax
|
$
|
2,117
|
|
$
|
3,770
|
|
$
|
4,012
|
|
|||
|
Income (loss) from discontinued operations, net of tax
|
(135
|
)
|
(19
|
)
|
38
|
|
||||||
|
Net income
|
1,982
|
|
3,751
|
|
4,050
|
|
||||||
|
Dividends and undistributed earnings allocated to participating securities
|
(13
|
)
|
(24
|
)
|
(20
|
)
|
||||||
|
Preferred stock dividends
|
(265
|
)
|
(214
|
)
|
(158
|
)
|
||||||
|
Net income available to common stockholders
|
$
|
1,704
|
|
$
|
3,513
|
|
$
|
3,872
|
|
|||
|
Total weighted-average basic shares outstanding
|
484.2
|
|
504.9
|
|
541.8
|
|
||||||
|
Effect of dilutive securities:
|
||||||||||||
|
Stock options
|
2.5
|
|
2.0
|
|
2.6
|
|
||||||
|
Other contingently issuable shares
|
1.2
|
|
1.3
|
|
1.3
|
|
||||||
|
Warrants
(1)
|
0.7
|
|
1.6
|
|
2.3
|
|
||||||
|
Total effect of dilutive securities
|
4.4
|
|
4.9
|
|
6.2
|
|
||||||
|
Total weighted-average diluted shares outstanding
|
488.6
|
|
509.8
|
|
548.0
|
|
||||||
|
Basic earnings per common share:
|
||||||||||||
|
Net income from continuing operations
|
$
|
3.80
|
|
$
|
7.00
|
|
$
|
7.08
|
|
|||
|
Income (loss) from discontinued operations
|
(0.28
|
)
|
(0.04
|
)
|
0.07
|
|
||||||
|
Net income per basic common share
|
$
|
3.52
|
|
$
|
6.96
|
|
$
|
7.15
|
|
|||
|
Diluted earnings per common share:
(2)
|
||||||||||||
|
Net income from continuing operations
|
$
|
3.76
|
|
$
|
6.93
|
|
$
|
7.00
|
|
|||
|
Income (loss) from discontinued operations
|
(0.27
|
)
|
(0.04
|
)
|
0.07
|
|
||||||
|
Net income per diluted common share
|
$
|
3.49
|
|
$
|
6.89
|
|
$
|
7.07
|
|
|||
|
(1)
|
Represents warrants issued as part of the U.S. Department of Treasury’s Troubled Assets Relief Program (“TARP”). There were
1.3 million
warrants to purchase common stock outstanding as of
December 31, 2017
and
4.1 million
warrants to purchase common stock outstanding as of both
December 31, 2016
and
2015
.
|
|
(2)
|
Excluded from the computation of diluted earnings per share were
233,000
shares related to options with exercise prices ranging from
$82.08
to
$86.34
,
1.7 million
shares related to options with exercise prices ranging from
$63.73
to
$88.81
and
1.9 million
shares related to options with exercise prices ranging from
$70.96
to
$88.81
for
the years ended December 31, 2017, 2016 and 2015
, respectively, because their inclusion would be anti-dilutive.
|
|
188
|
Capital One Financial Corporation (COF)
|
|
|
|
Stock Plans
We have
one
active stock-based compensation plan available for the issuance of shares to employees, directors and third-party service providers (if applicable). As of
December 31, 2017
, under the Amended and Restated 2004 Stock Incentive plan (“2004 Plan”), we are authorized to issue
55 million
common shares in various forms, including incentive stock options, nonstatutory stock options, stock appreciation rights, restricted stock awards (“RSAs”), share-settled restricted stock units (“RSUs”), performance share awards (“PSAs”) and performance share units (“PSUs”). Of this amount, approximately
15 million
shares remain available for future issuance as of
December 31, 2017
. The 2004 Plan permits the use of newly issued shares or treasury shares upon the settlement of options and stock-based incentive awards, and we generally settle by issuing new shares.
We also issue cash-settled restricted stock units (and in the past issued cash equity units). These cash-settled units are not counted against the common shares authorized for issuance or available for issuance under the 2004 Plan.
Total stock-based compensation expense recognized during
2017
,
2016
and
2015
was
$244 million
,
$239 million
and
$161 million
, respectively. The total income tax benefit for stock-based compensation recognized during
2017
,
2016
and
2015
was
$92 million
,
$89 million
and
$61 million
, respectively.
Stock Options
Stock options have a maximum contractual term of
ten
years. Generally, the exercise price of stock options will equal the fair market value of our common stock on the date of grant. Option vesting is determined at the time of grant and may be subject to the achievement of any applicable performance conditions. Options generally become exercisable over
three years
beginning on the first anniversary of the date of grant; however, some option grants cliff-vest on or shortly after the first or third anniversary of the grant date.
The following table presents a summary of
2017
activity for stock options and the balance of stock options exercisable as of
December 31, 2017
.
Table
14.1
: Summary of Stock Options Activity
|
(Shares in thousands, and intrinsic value in millions)
|
Shares
Subject to Options |
Weighted-
Average Exercise Price |
Weighted-
Average Remaining Contractual Term |
Aggregate
Intrinsic Value |
|||||||||
|
Outstanding as of January 1, 2017
|
6,985
|
|
$
|
48.03
|
|
||||||||
|
Granted
|
345
|
|
86.34
|
|
|||||||||
|
Exercised
|
(2,431
|
)
|
51.04
|
|
|||||||||
|
Forfeited
|
(133
|
)
|
75.48
|
|
|||||||||
|
Expired
|
0
|
|
0.00
|
|
|||||||||
|
Outstanding as of December 31, 2017
|
4,766
|
|
$
|
48.50
|
|
4.1 years
|
$
|
243
|
|
||||
|
Exercisable as of December 31, 2017
|
3,992
|
|
$
|
43.33
|
|
3.3 years
|
$
|
225
|
|
||||
The weighted-average fair value of stock options granted during
2017
,
2016
and
2015
was
$21.48
,
$16.36
and
$15.11
, respectively. The total intrinsic value of stock options exercised during
2017
,
2016
and
2015
was
$92 million
,
$31 million
and
$23 million
, respectively. The unrecognized compensation expense related to stock options as of
December 31, 2017
was
$2 million
, which is expected to be amortized over a weighted-average period of
nine
months.
|
189
|
Capital One Financial Corporation (COF)
|
|
Effective January 1, 2017, we adopted the new accounting guidance related to employee share-based payments. As a result of the adoption of this new guidance, all excess tax benefits on share-based payment awards are recognized within income tax expense in the consolidated statements of income. The following table presents the cash received from the exercise of stock options under all stock-based incentive arrangements, and the actual income tax benefit for the tax deductions from the exercise of the stock options.
Table
14.2
: Stock Options Cash Flow Impact
|
Year Ended December 31,
|
||||||||||||
|
(Dollars in millions)
|
2017
|
2016
|
2015
|
|||||||||
|
Cash received for options exercised
|
$
|
122
|
|
$
|
135
|
|
$
|
64
|
|
|||
|
Tax benefit
|
34
|
|
12
|
|
9
|
|
||||||
Compensation expense for stock options is based on the grant date fair value, which is estimated using the Black-Scholes option-pricing model. This option pricing model requires the use of numerous assumptions, many of which are subjective. Certain stock options have discretionary vesting conditions and are remeasured at fair value each reporting period.
The following table presents the weighted-average assumptions used to value stock options granted during
2017
,
2016
and
2015
. Dividend yield represents the expected dividend rate over the life of the option, and expected option lives are calculated based on historical activities.
Table
14.3
: Assumptions Used to Value Stock Options Granted
__________
|
|
Year Ended December 31,
|
||||||||
|
2017
|
2016
|
2015
|
|||||||
|
Dividend yield
|
1.85
|
%
|
2.07
|
%
|
1.82
|
%
|
|||
|
Volatility
(1)
|
27.00
|
|
30.00
|
|
24.00
|
|
|||
|
Risk-free interest rate (U.S. Treasury yield curve)
|
2.30
|
|
1.64
|
|
1.55
|
|
|||
|
Expected option lives
|
6.6 years
|
|
6.6 years
|
|
6.3 years
|
|
|||
|
(1)
|
The volatility assumption for 2017 and 2016 grants was based on the implied volatility of exchange-traded options and the historical volatility of common stock. The volatility assumption for 2015 grants was based on the implied volatility of exchange-traded options and warrants.
|
Restricted Stock Awards and Units
RSAs and RSUs represent share-settled awards that do not contain performance conditions and are granted to certain employees at no cost to the recipient. RSAs and RSUs generally vest over
three years
from the date of grant; however, some RSAs and RSUs cliff vest on or shortly after the first or third anniversary of the grant date. These awards and units are subject to forfeiture until certain restrictions have lapsed, including continued employment for a specified period of time. A recipient of an RSA is entitled to voting rights and is generally entitled to dividends on the common stock. A recipient of an RSU is entitled to receive a share of common stock after the applicable restrictions lapse. Additionally, a recipient of an RSU is generally entitled to receive cash payments or additional shares of common stock equivalent to any dividends paid on the underlying common stock during the period the RSU is outstanding, but is not entitled to voting rights.
Generally, the value of RSAs and RSUs will equal the fair value of our common stock on the date of grant and the expense is recognized over the vesting period.
|
190
|
Capital One Financial Corporation (COF)
|
|
The following table presents a summary of
2017
activity for RSAs and RSUs.
Table
14.4
: Summary of Restricted Stock Awards and Units
|
Restricted Stock Awards
|
Restricted Stock Units
|
|||||||||||||
|
(Shares/units in thousands)
|
Shares
|
Weighted-Average
Grant Date Fair Value per Share |
Units
|
Weighted-Average
Grant Date Fair Value per Unit |
||||||||||
|
Unvested as of January 1, 2017
|
67
|
|
$
|
63.34
|
|
3,258
|
|
$
|
66.72
|
|
||||
|
Granted
|
0
|
|
N/A
|
|
1,475
|
|
86.20
|
|
||||||
|
Vested
|
(38
|
)
|
64.21
|
|
(1,223
|
)
|
69.03
|
|
||||||
|
Forfeited
|
(13
|
)
|
69.39
|
|
(131
|
)
|
75.22
|
|
||||||
|
Unvested as of December 31, 2017
|
16
|
|
$
|
56.39
|
|
3,379
|
|
$
|
74.06
|
|
||||
The total fair value of RSAs that vested during
2017
,
2016
and
2015
was
$3 million
,
$21 million
and
$28 million
, respectively. There was
no
unrecognized compensation expense related to unvested RSAs as of
December 31, 2017
.
The weighted-average grant date fair value of RSUs in
2017
,
2016
and
2015
was
$86.20
,
$65.19
and
$76.15
, respectively. The total fair value of RSUs that vested during
2017
,
2016
and
2015
was
$110 million
,
$42 million
and
$27 million
, respectively. The unrecognized compensation expense related to unvested RSUs as of
December 31, 2017
was
$116 million
, which is expected to be amortized over a weighted-average period of approximately
1.7 years
.
Performance Share Awards and Units
PSAs and PSUs represent share-settled awards that contain performance conditions and are granted to certain employees at no cost to the recipient. PSAs and PSUs generally vest over
three years
from the date of grant; however, some PSUs cliff vest on or shortly after the third anniversary of the grant date. Generally, the value of PSAs and PSUs will equal the fair market value of our common stock on the date of grant and the expense is recognized over the vesting period. Certain PSAs and PSUs have discretionary vesting conditions and are remeasured at fair value each reporting period. A recipient of a PSA is entitled to voting rights and is generally entitled to dividends on the common stock. A recipient of a PSU is entitled to receive a share of common stock after the applicable restrictions lapse. Additionally, a recipient of a PSU is generally entitled to receive cash payments or additional shares of common stock equivalent to any dividends paid on the underlying common stock during the period the PSU is outstanding, but is not entitled to voting rights.
The number of PSUs that step vest over three years can be reduced by
50%
or
100%
depending on whether specific performance goals are met during the vesting period. The number of three-year cliff vesting PSUs that will ultimately vest is contingent upon meeting specific performance goals over a
three
-year period. These PSUs also include an opportunity to receive from
0%
to
150%
of the target number of common shares.
The following table presents a summary of
2017
activity for PSAs and PSUs.
Table
14.5
: Summary of Performance Share Awards and Units
__________
|
Performance Share Awards
|
Performance Share Units
|
|||||||||||||
|
(Shares/units in thousands)
|
Shares
|
Weighted-Average
Grant Date Fair Value per Share |
Units
|
Weighted-Average
Grant Date Fair Value per Unit |
||||||||||
|
Unvested as of January 1, 2017
|
6
|
|
$
|
70.96
|
|
2,077
|
|
$
|
69.40
|
|
||||
|
Granted
(1)
|
0
|
|
0.00
|
|
985
|
|
82.48
|
|
||||||
|
Vested
(1)
|
(6
|
)
|
70.96
|
|
(985
|
)
|
70.05
|
|
||||||
|
Forfeited
|
0
|
|
0.00
|
|
(159
|
)
|
74.34
|
|
||||||
|
Unvested as of December 31, 2017
|
0
|
|
$
|
0.00
|
|
1,918
|
|
$
|
75.38
|
|
||||
|
(1)
|
Granted and vested include adjustments for achievement of specific performance goals for performance share units granted in prior periods.
|
|
191
|
Capital One Financial Corporation (COF)
|
|
The total fair value of PSAs that vested during 2017 was less than
$1 million
, and there was
no
unrecognized compensation expense related to unvested PSAs as of
December 31, 2017
. The total fair value of PSAs that vested during
2016
and
2015
was
$11 million
and
$30 million
, respectively.
The weighted-average grant date fair value of PSUs granted during
2017
,
2016
and
2015
was
$82.48
,
$62.89
and
$65.98
, respectively. The total fair value of PSUs that vested on the vesting date was
$90 million
,
$54 million
and
$74 million
in
2017
,
2016
and
2015
, respectively. The unrecognized compensation expense related to unvested PSUs as of
December 31, 2017
was
$32 million
, which is expected to be amortized over a weighted-average period of approximately
1 year
.
Cash-Settled Units
Cash-settled units are recorded as liabilities and measured at fair value on a quarterly basis. Cash-settled units are settled with a cash payment for each unit vested that is equal to the average fair market value of our common stock for the
15
or
20
trading days preceding the vesting date. Cash-settled units generally vest over three years beginning on the first anniversary of the date of grant; however, some cash-settled units cliff vest shortly before the one year anniversary of the grant date or on or shortly after the third anniversary of the grant date. Cash-settled units vesting during
2017
,
2016
and
2015
resulted in cash payments to associates of
$42 million
,
$36 million
and
$70 million
, respectively. There was
no
unrecognized compensation cost for unvested cash-settled units as of
December 31, 2017
.
Associate Stock Purchase Plan
We maintain an Associate Stock Purchase Plan (“Purchase Plan”), which is a compensatory plan under the accounting guidance for stock-based compensation. We recognized
$23 million
,
$18 million
and
$16 million
in compensation expense for
2017
,
2016
and
2015
, respectively, under the Purchase Plan.
Under the Purchase Plan, eligible associates are permitted to contribute between
1%
and
15%
of their base salary through payroll deductions and receive a
17.65%
Company match on the contributions. Effective January 1, 2018, the Company match on contributions is
15%
. Both the associates’ contributions and the Company match are applied to the purchase of our unissued common or treasury stock at the current market price. Shares may also be acquired on the open market. Dividends for active participants are automatically reinvested in additional shares of common stock. Of the
33 million
total authorized shares as of
December 31, 2017
,
18 million
shares were available for issuance.
Dividend Reinvestment and Stock Purchase Plan
We maintain a Dividend Reinvestment and Stock Purchase Plan (“DRP”), which allows participating stockholders to purchase additional shares of our common stock through automatic reinvestment of dividends or optional cash investments. Of the
8 million
total authorized shares as of
December 31, 2017
,
7 million
shares were available for issuance under the DRP.
|
192
|
Capital One Financial Corporation (COF)
|
|
|
|
Defined Contribution Plan
We sponsor a contributory Associate Savings Plan (the “Plan”) in which all full-time and part-time associates over the age of
18
are eligible to participate. We make non-elective contributions to each eligible associates’ account and match a portion of associate contributions. We also sponsor a voluntary non-qualified deferred compensation plan in which select groups of employees are eligible to participate. We make contributions to this plan based on participants’ deferral of salary, bonuses and other eligible pay. In addition, we match participants’ excess compensation (compensation over the Internal Revenue Service compensation limit) less deferrals. We contributed a total of
$282 million
,
$252 million
and
$234 million
to these plans during
the years ended December 31, 2017, 2016 and 2015
, respectively.
Defined Benefit Pension and Other Postretirement Benefit Plans
We sponsor a frozen qualified defined benefit pension plan and several non-qualified defined benefit pension plans. We also sponsor a plan that provides other postretirement benefits, including medical and life insurance coverage.
Our pension plans and the other postretirement benefit plans are valued using
December 31, 2017
and
2016
measurement dates. Our policy is to amortize prior service amounts on a straight-line basis over the average remaining years of service to full eligibility for benefits of active plan participants.
The following table sets forth, on an aggregated basis, changes in the benefit obligation and plan assets, the funded status and how the funded status is recognized on our consolidated balance sheets.
Table
15.1
: Changes in Benefit Obligation and Plan Assets
|
Defined Pension
Benefits |
Other Postretirement
Benefits |
|||||||||||||||
|
(Dollars in millions)
|
2017
|
2016
|
2017
|
2016
|
||||||||||||
|
Change in benefit obligation:
|
||||||||||||||||
|
Accumulated benefit obligation as of January 1,
|
$
|
180
|
|
$
|
185
|
|
$
|
39
|
|
$
|
45
|
|
||||
|
Service cost
|
2
|
|
2
|
|
0
|
|
0
|
|
||||||||
|
Interest cost
|
7
|
|
7
|
|
2
|
|
2
|
|
||||||||
|
Benefits paid
|
(18
|
)
|
(14
|
)
|
(3
|
)
|
(3
|
)
|
||||||||
|
Net actuarial loss (gain)
|
7
|
|
0
|
|
(3
|
)
|
(5
|
)
|
||||||||
|
Accumulated benefit obligation as of December 31,
|
$
|
178
|
|
$
|
180
|
|
$
|
35
|
|
$
|
39
|
|
||||
|
Change in plan assets:
|
||||||||||||||||
|
Fair value of plan assets as of January 1,
|
$
|
226
|
|
$
|
222
|
|
$
|
6
|
|
$
|
5
|
|
||||
|
Actual return on plan assets
|
37
|
|
17
|
|
1
|
|
1
|
|
||||||||
|
Employer contributions
|
1
|
|
1
|
|
2
|
|
3
|
|
||||||||
|
Benefits paid
|
(18
|
)
|
(14
|
)
|
(3
|
)
|
(3
|
)
|
||||||||
|
Fair value of plan assets as of December 31,
|
$
|
246
|
|
$
|
226
|
|
$
|
6
|
|
$
|
6
|
|
||||
|
Over (under) funded status as of December 31,
|
$
|
68
|
|
$
|
46
|
|
$
|
(29
|
)
|
$
|
(33
|
)
|
||||
|
Defined Pension
Benefits |
Other Postretirement
Benefits |
|||||||||||||||
|
(Dollars in millions)
|
2017
|
2016
|
2017
|
2016
|
||||||||||||
|
Balance sheet presentation as of December 31,
|
||||||||||||||||
|
Other assets
|
$
|
80
|
|
$
|
57
|
|
$
|
0
|
|
$
|
0
|
|
||||
|
Other liabilities
|
(12
|
)
|
(11
|
)
|
(29
|
)
|
(33
|
)
|
||||||||
|
Net amount recognized as of December 31,
|
$
|
68
|
|
$
|
46
|
|
$
|
(29
|
)
|
$
|
(33
|
)
|
||||
|
193
|
Capital One Financial Corporation (COF)
|
|
The following table presents the components of net periodic benefit costs and other amounts recognized in other comprehensive income.
Table
15.2
: Components of Net Periodic Benefit Cost
|
Year Ended December 31,
|
||||||||||||||||||||||||
|
2017
|
2016
|
2015
|
2017
|
2016
|
2015
|
|||||||||||||||||||
|
(Dollars in millions)
|
Defined Pension
Benefits |
Other Postretirement
Benefits |
||||||||||||||||||||||
|
Components of net periodic benefit cost:
|
||||||||||||||||||||||||
|
Service cost
|
$
|
2
|
|
$
|
2
|
|
$
|
1
|
|
$
|
0
|
|
$
|
0
|
|
$
|
0
|
|
||||||
|
Interest cost
|
7
|
|
7
|
|
8
|
|
2
|
|
2
|
|
2
|
|
||||||||||||
|
Expected return on plan assets
|
(14
|
)
|
(14
|
)
|
(15
|
)
|
0
|
|
0
|
|
0
|
|
||||||||||||
|
Amortization of transition obligation, prior service credit and net actuarial loss (gain)
|
1
|
|
1
|
|
1
|
|
(6
|
)
|
(6
|
)
|
(4
|
)
|
||||||||||||
|
Net periodic benefit gain
|
$
|
(4
|
)
|
$
|
(4
|
)
|
$
|
(5
|
)
|
$
|
(4
|
)
|
$
|
(4
|
)
|
$
|
(2
|
)
|
||||||
|
Changes recognized in other comprehensive income, pretax:
|
||||||||||||||||||||||||
|
Net actuarial gain (loss)
|
$
|
16
|
|
$
|
4
|
|
$
|
(5
|
)
|
$
|
4
|
|
$
|
5
|
|
$
|
7
|
|
||||||
|
Reclassification adjustments for amounts recognized in net periodic benefit cost
|
1
|
|
1
|
|
1
|
|
(6
|
)
|
(6
|
)
|
(4
|
)
|
||||||||||||
|
Total gain (loss) recognized in other comprehensive income
|
$
|
17
|
|
$
|
5
|
|
$
|
(4
|
)
|
$
|
(2
|
)
|
$
|
(1
|
)
|
$
|
3
|
|
||||||
Pre-tax amounts recognized in AOCI that have not yet been recognized as a component of net periodic benefit cost consist of the following:
Table
15.3
: Amounts Recognized in AOCI
|
December 31,
|
||||||||||||||||
|
2017
|
2016
|
2017
|
2016
|
|||||||||||||
|
(Dollars in millions)
|
Defined Pension
Benefits |
Other Postretirement
Benefits |
||||||||||||||
|
Prior service cost
|
$
|
0
|
|
$
|
0
|
|
$
|
(2
|
)
|
$
|
(2
|
)
|
||||
|
Net actuarial gain (loss)
|
(49
|
)
|
(66
|
)
|
10
|
|
12
|
|
||||||||
|
Accumulated other comprehensive income (loss)
|
$
|
(49
|
)
|
$
|
(66
|
)
|
$
|
8
|
|
$
|
10
|
|
||||
Pre-tax amounts recorded in AOCI as of
December 31, 2017
that are expected to be recognized as a component of our net periodic benefit cost in 2018 consist of net actuarial loss of $
1 million
related to our pension plans and net actuarial gain of $
5 million
related to other postretirement plan. There is no meaningful prior service cost expected to be recognized in 2018.
|
194
|
Capital One Financial Corporation (COF)
|
|
The following table presents weighted-average assumptions used in the accounting for the plans:
Table
15.4
: Assumptions Used in the Accounting for the Plans
|
|
December 31,
|
|||||||||||
|
|
2017
|
2016
|
2015
|
2017
|
2016
|
2015
|
||||||
|
|
Defined Pension
Benefits |
Other Postretirement
Benefits |
||||||||||
|
Assumptions for benefit obligations at measurement date:
|
||||||||||||
|
Discount rate
|
3.5
|
4.0
|
4.2
|
3.5
|
4.0
|
4.2
|
||||||
|
Assumptions for periodic benefit cost for the year ended:
|
||||||||||||
|
Discount rate
|
4.0
|
4.2
|
3.9
|
4.0
|
4.2
|
3.9
|
||||||
|
Expected long-term rate of return on plan assets
|
6.5
|
6.5
|
6.5
|
6.5
|
6.5
|
6.5
|
||||||
|
Assumptions for year-end valuations:
|
||||||||||||
|
Health care cost trend rate assumed for next year:
|
||||||||||||
|
Pre-age 65
|
N/A
|
N/A
|
N/A
|
6.5
|
6.7
|
7.0
|
||||||
|
Post-age 65
|
N/A
|
N/A
|
N/A
|
6.5
|
6.8
|
7.1
|
||||||
|
Rate to which the cost trend rate is assumed to decline (the ultimate trend rate)
|
N/A
|
N/A
|
N/A
|
4.5
|
4.5
|
4.5
|
||||||
|
Year the rate reaches the ultimate trend rate
|
N/A
|
N/A
|
N/A
|
2037
|
2037
|
2037
|
||||||
To develop the expected long-term rate of return on plan assets assumption, consideration was given to the current level of expected returns on risk-free investments (primarily government bonds), the historical level of the risk premium associated with the other asset classes in which the portfolio is invested and the expectations for future returns of each asset class. The expected return for each asset class was then weighted based on the target asset allocation to develop the expected long-term rate of return on the plan assets assumption for the portfolio.
Assumed health care trend rates have a significant effect on the amounts reported for the other postretirement benefit plans. The following table presents the effect of a one-percent change in the assumed health care cost trend rate on our accumulated postretirement benefit obligation. There were insignificant effects on total service and interest cost for
the years ended December 31, 2017, 2016 and 2015
.
Table
15.5
: Sensitivity Analysis
|
|
Year Ended December 31,
|
|||||||||||||||
|
2017
|
2016
|
|||||||||||||||
|
(Dollars in millions)
|
1% Increase
|
1% Decrease
|
1% Increase
|
1% Decrease
|
||||||||||||
|
Effect on year-end postretirement benefit obligation
|
$
|
3
|
|
$
|
(3
|
)
|
$
|
4
|
|
$
|
(4
|
)
|
||||
|
195
|
Capital One Financial Corporation (COF)
|
|
Plan Assets
The following table presents the plan asset allocations as of December 31, 2017 and 2016. Common collective trusts primarily consist of domestic and international equity securities.
Table
15.6
: Plan Assets
|
|
December 31,
|
|||||
|
|
2017
|
2016
|
||||
|
Common collective trusts
|
60
|
%
|
62
|
%
|
||
|
Corporate bonds (Standard & Poor’s (“S&P”) rating of A or higher)
|
6
|
|
6
|
|
||
|
Corporate bonds (S&P rating of lower than A)
|
14
|
|
12
|
|
||
|
Government securities
|
13
|
|
13
|
|
||
|
Mortgage-backed securities
|
5
|
|
5
|
|
||
|
Municipal bonds
|
0
|
|
1
|
|
||
|
Money market fund
|
2
|
|
1
|
|
||
|
Total
|
100
|
%
|
100
|
%
|
||
Plan assets are invested using a total return investment approach whereby a mix of equity securities and debt securities are used to preserve asset values, diversify risk and enhance our ability to achieve our benchmark for long-term investment return. Investment strategies and asset allocations are based on careful consideration of plan liabilities, the plan’s funded status and our financial condition. Investment performance and asset allocation are measured and monitored on a quarterly basis.
Plan assets are managed in a balanced portfolio comprised of three major components: domestic equity, international equity and domestic fixed income investments. The expected role of plan equity investments is to maximize the long-term real growth of fund assets, while the role of fixed income investments is to generate current income, provide for more stable periodic returns and provide some protection against a prolonged decline in the market value of fund equity investments.
The investment guidelines provide the following asset allocation targets and ranges: domestic equity target of
39%
and allowable range of
34%
to
44%
, international equity target of
16%
and allowable range of
11%
to
21%
, fixed income investments target of
45%
and allowable range of
35%
to
55%
.
Fair Value Measurement
For information on fair value measurements, including descriptions of Level 1, 2 and 3 of the fair value hierarchy and the valuation methods we utilize, see “
Note 1—Summary of Significant Accounting Policies
” and “
Note 17—Fair Value Measurement
.” All of our plan assets measured at fair value are classified as Level 2 as of both December 31, 2017 and 2016. The common collective trusts are measured at net asset value per share, or its equivalent, as a practical expedient and therefore are not classified in the fair value hierarchy.
|
196
|
Capital One Financial Corporation (COF)
|
|
Table
15.7
: Plan Assets Measured at Fair Value on a Recurring Basi
s
|
|
December 31, 2017
|
|||||||
|
(Dollars in millions)
|
Fair Value Measurement Using Level 2
|
Assets at Fair Value
|
||||||
|
Plan assets, at fair value:
|
||||||||
|
Corporate bonds (S&P rating of A or higher)
|
$
|
16
|
|
$
|
16
|
|
||
|
Corporate bonds (S&P rating of lower than A)
|
35
|
|
35
|
|
||||
|
Government securities
|
33
|
|
33
|
|
||||
|
Mortgage-backed securities
|
12
|
|
12
|
|
||||
|
Municipal bonds
|
1
|
|
1
|
|
||||
|
Money market fund
|
4
|
|
4
|
|
||||
|
Plan assets in fair value hierarchy
|
101
|
|
101
|
|
||||
|
Plan assets not classified in fair value hierarchy:
|
||||||||
|
Common collective trusts
|
151
|
|
||||||
|
Total plan assets, at fair value
|
$
|
252
|
|
|||||
|
|
December 31, 2016
|
|||||||
|
(Dollars in millions)
|
Fair Value Measurement Using Level 2
|
Assets at Fair Value
|
||||||
|
Plan assets, at fair value:
|
||||||||
|
Corporate bonds (S&P rating of A or higher)
|
$
|
15
|
|
$
|
15
|
|
||
|
Corporate bonds (S&P rating of lower than A)
|
29
|
|
29
|
|
||||
|
Government securities
|
31
|
|
31
|
|
||||
|
Mortgage-backed securities
|
11
|
|
11
|
|
||||
|
Municipal bonds
|
1
|
|
1
|
|
||||
|
Money market fund
|
2
|
|
2
|
|
||||
|
Plan assets in fair value hierarchy
|
89
|
|
89
|
|
||||
|
Plan assets not classified in fair value hierarchy:
|
||||||||
|
Common collective trusts
|
143
|
|
||||||
|
Total plan assets, at fair value
|
$
|
232
|
|
|||||
Expected Future Benefit Payments
The following benefit payments, which reflect expected future service, as appropriate, are expected to be paid:
Table
15.8
: Expected Future Benefits Payments
|
(Dollars in millions)
|
Pension
Benefits |
Postretirement
Benefits |
||||||
|
2018
|
$
|
12
|
|
$
|
3
|
|
||
|
2019
|
12
|
|
3
|
|
||||
|
2020
|
11
|
|
3
|
|
||||
|
2021
|
12
|
|
2
|
|
||||
|
2022
|
11
|
|
2
|
|
||||
|
2023-2027
|
51
|
|
10
|
|
||||
In 2018,
$1 million
in contributions are expected to be made to the pension plans and
$2 million
in contributions are expected to be made to other postretirement benefits plans.
|
197
|
Capital One Financial Corporation (COF)
|
|
|
|
We recognize the current and deferred tax consequences of all transactions that have been recognized in the financial statements using the provisions of the enacted tax laws. Current income tax expense represents our estimated taxes to be paid or refunded for the current period and includes income tax expense related to our uncertain tax positions, as well as tax-related interest and penalties. Deferred tax assets and liabilities are determined based on differences between the financial reporting and tax basis of assets and liabilities and are measured using the enacted tax rates and laws that will be in effect when the differences are expected to reverse. We record valuation allowances to reduce deferred tax assets to the amount that is more likely than not to be realized. We record the effect of remeasuring deferred tax assets and liabilities due to a change in tax rates or laws as a component of income tax expense related to continuing operations for the period in which the change is enacted. Income tax benefits are recognized when, based on their technical merits, they are more likely than not to be sustained upon examination. The amount recognized is the largest amount of benefit that is more likely than not to be realized upon settlement.
The amounts as of and for the year ended December 31, 2017 include the estimated impacts of the Tax Act. Those impacts consist of:
|
•
|
$1.6 billion
due to the revaluation of our net deferred tax assets reflecting the reduction in the U.S. corporate tax rate from 35% to 21%;
|
|
•
|
$125 million
related to the deemed repatriation of our undistributed foreign earnings; and
|
|
•
|
$76 million
associated with the revaluation of our investments in affordable housing projects.
|
The impacts of the Tax Act recorded are considered to be reasonable estimates that are provisional in nature and are subject to potential adjustment during the measurement period ending no later than December 2018. The initial accounting is incomplete as certain information was not yet available or our analysis was not yet completed due to the close proximity of the date the Tax Act was signed into law to the filing date of this Report. The additional information needed includes, but is not limited to, tax-related information pertaining to certain of our partnership investments, final computations of tax depreciation, final calculations of undistributed foreign earnings and the related foreign taxes including the filing of 2017 tax returns in foreign jurisdictions, final tax calculations for certain loan and investment adjustments, and information related to certain payment accruals that is not expected to be available until later in 2018.
The following table presents significant components of the provision for income taxes attributable to continuing operations:
Table
16.1
: Significant Components of the Provision for Income Taxes Attributable to Continuing Operations
|
|
Year Ended December 31,
|
|||||||||||
|
(Dollars in millions)
|
2017
|
2016
|
2015
|
|||||||||
|
Current income tax provision:
|
||||||||||||
|
Federal taxes
|
$
|
1,585
|
|
$
|
2,087
|
|
$
|
1,991
|
|
|||
|
State taxes
|
223
|
|
209
|
|
207
|
|
||||||
|
International taxes
|
133
|
|
104
|
|
73
|
|
||||||
|
Total current provision
|
$
|
1,941
|
|
$
|
2,400
|
|
$
|
2,271
|
|
|||
|
Deferred income tax provision (benefit):
|
||||||||||||
|
Federal taxes
|
$
|
1,509
|
|
$
|
(621
|
)
|
$
|
(368
|
)
|
|||
|
State taxes
|
(69
|
)
|
(63
|
)
|
(39
|
)
|
||||||
|
International taxes
|
(6
|
)
|
(2
|
)
|
5
|
|
||||||
|
Total deferred provision (benefit)
|
1,434
|
|
(686
|
)
|
(402
|
)
|
||||||
|
Total income tax provision
|
$
|
3,375
|
|
$
|
1,714
|
|
$
|
1,869
|
|
|||
The international income tax provision is related to pre-tax earnings from foreign operations of approximately
$410 million
,
$287 million
and
$288 million
in
2017
,
2016
and
2015
, respectively.
|
198
|
Capital One Financial Corporation (COF)
|
|
Total income tax provision does not reflect the tax effects of items that are included in accumulated other comprehensive income, which include a tax benefit of
$134 million
in
2017
and tax provisions of
$24 million
and
$19 million
in
2016
and
2015
, respectively. See “
Note 11—Stockholders’ Equity
”for additional information. In addition, total income tax provision does not reflect tax effects associated with our employee stock-based compensation plan, which decreased our additional paid-in capital by
$33 million
in
2016
and increased our addition paid-in capital by
$7 million
in
2015
.
No
income tax provision was recorded in additional paid-in capital in
2017
as a result of our adoption of the new accounting guidance related to employee share-based payments. See “
Note 1—Summary of Significant Accounting Policies
” for additional information.
The following table presents the reconciliation of the U.S. federal statutory income tax rate to effective income tax rate applicable to income from continuing operations for the years ended
December 31, 2017
,
2016
and
2015
:
Table
16.2
: Effective Income Tax Rate
|
|
Year Ended December 31,
|
||||||||
|
2017
|
2016
|
2015
|
|||||||
|
Income tax at U.S. federal statutory tax rate
|
35.0
|
%
|
35.0
|
%
|
35.0
|
%
|
|||
|
Impacts of the Tax Act
|
32.2
|
|
N/A
|
|
N/A
|
|
|||
|
State taxes, net of federal benefit
|
2.2
|
|
1.9
|
|
1.9
|
|
|||
|
Low-income housing, new markets and other tax credits
|
(5.8
|
)
|
(4.9
|
)
|
(4.0
|
)
|
|||
|
Tax-exempt interest and other nontaxable income
|
(1.5
|
)
|
(1.4
|
)
|
(1.3
|
)
|
|||
|
Other, net
|
(0.6
|
)
|
0.7
|
|
0.2
|
|
|||
|
Effective income tax rate
|
61.5
|
%
|
31.3
|
%
|
31.8
|
%
|
|||
The following table presents significant components of our deferred tax assets and liabilities as of
December 31, 2017
and
2016
. The valuation allowance below represents the adjustment of certain state deferred tax assets and net operating loss carryforwards to the amount we have determined is more likely than not to be realized.
Table
16.3
: Significant Components of Deferred Tax Assets and Liabilities
|
(Dollars in millions)
|
December 31, 2017
|
December 31, 2016
|
||||||
|
Deferred tax assets:
|
||||||||
|
Allowance for loan and lease losses
|
$
|
1,768
|
|
$
|
2,350
|
|
||
|
Rewards programs
|
936
|
|
1,348
|
|
||||
|
Security and loan valuations
|
424
|
|
869
|
|
||||
|
Net operating loss and tax credit carryforwards
|
244
|
|
188
|
|
||||
|
Compensation and employee benefits
|
208
|
|
276
|
|
||||
|
Goodwill and intangibles
|
201
|
|
294
|
|
||||
|
Unearned income
|
130
|
|
186
|
|
||||
|
Net unrealized losses on derivatives
|
104
|
|
35
|
|
||||
|
Representation and warranty reserve
|
8
|
|
234
|
|
||||
|
Other assets
|
278
|
|
270
|
|
||||
|
Subtotal
|
4,301
|
|
6,050
|
|
||||
|
Valuation allowance
|
(226
|
)
|
(179
|
)
|
||||
|
Total deferred tax assets
|
4,075
|
|
5,871
|
|
||||
|
199
|
Capital One Financial Corporation (COF)
|
|
|
(Dollars in millions)
|
December 31, 2017
|
December 31, 2016
|
||||||
|
Deferred tax liabilities:
|
||||||||
|
Original issue discount
|
703
|
|
1,012
|
|
||||
|
Fixed assets and leases
|
168
|
|
221
|
|
||||
|
Loan fees and expenses
|
68
|
|
84
|
|
||||
|
Mortgage servicing rights
|
57
|
|
67
|
|
||||
|
Other liabilities
|
215
|
|
177
|
|
||||
|
Total deferred tax liabilities
|
1,211
|
|
1,561
|
|
||||
|
Net deferred tax assets
|
$
|
2,864
|
|
$
|
4,310
|
|
||
Our federal net operating loss carryforwards were
$15 million
and
$19 million
as of
December 31, 2017
and 2016, respectively. These operating loss carryforwards were attributable to prior acquisitions and will expire from 2018 to 2035. Under IRS rules, our ability to utilize these losses against future income is limited. Our net tax values for state operating loss carryforwards were
$241 million
and
$182 million
as of December 31, 2017 and 2016, respectively, and they will expire from 2018 to 2037.
We recognize accrued interest and penalties related to income taxes as a component of income tax expense. We recognized a
$5 million
expense for
2017
, a
$5 million
benefit for
2016
and a
$3 million
benefit for
2015
.
The following table presents the accrued balance of tax, interest and penalties related to unrecognized tax benefits:
Table
16.4
: Reconciliation of the Change in Unrecognized Tax Benefits
|
(Dollars in millions)
|
Gross
Unrecognized Tax Benefits |
Accrued
Interest and Penalties |
Gross Tax,
Interest and Penalties |
|||||||||
|
Balance as of January 1, 2015
|
$
|
107
|
|
$
|
36
|
|
$
|
143
|
|
|||
|
Additions for tax positions related to prior years
|
38
|
|
8
|
|
46
|
|
||||||
|
Reductions for tax positions related to prior years due to IRS and other settlements
|
(15
|
)
|
(11
|
)
|
(26
|
)
|
||||||
|
Balance as of December 31, 2015
|
130
|
|
33
|
|
163
|
|
||||||
|
Additions for tax positions related to prior years
|
0
|
|
6
|
|
6
|
|
||||||
|
Reductions for tax positions related to prior years due to IRS and other settlements
|
(45
|
)
|
(15
|
)
|
(60
|
)
|
||||||
|
Balance as of December 31, 2016
|
85
|
|
24
|
|
109
|
|
||||||
|
Additions for tax positions related to prior years
|
5
|
|
7
|
|
12
|
|
||||||
|
Reductions for tax positions related to prior years due to IRS and other settlements
|
(4
|
)
|
(2
|
)
|
(6
|
)
|
||||||
|
Balance as of December 31, 2017
|
$
|
86
|
|
$
|
29
|
|
$
|
115
|
|
|||
|
Portion of balance at December 31, 2017 that, if recognized, would impact the effective income tax rate
|
$
|
68
|
|
$
|
23
|
|
$
|
91
|
|
|||
We are subject to examination by the IRS and other tax authorities in certain countries and states in which we operate. The tax years subject to examination vary by jurisdiction. During 2017, the IRS completed its examination of our federal income tax returns for the tax years 2014, 2015 and 2016.
The Company entered into the IRS Compliance Assurance Process (“CAP”) for the Company’s 2014 federal income tax return. The examinations of the Company’s 2014 and 2015 returns were completed in 2017 with no adjustments proposed by the IRS. The IRS also completed its review of the Company’s 2016 return prior to filing the return in 2017 and proposed no adjustments. The Company continued in the CAP examination process for the 2017 tax year during 2017, with a similar expectation that the IRS examination will be completed prior to the filing of its 2017 federal income tax return in 2018. The Company has been accepted into CAP for 2018. The Company has a refund claim for the taxable years 2012 and 2013 pending at the IRS Office of Appeals with respect to the proper timing for the recognition of its credit card rewards costs.
|
200
|
Capital One Financial Corporation (COF)
|
|
It is reasonably possible that further adjustments to the Company’s unrecognized tax benefits may be made within 12 months of the reporting date as a result of future judicial or regulatory interpretations of existing tax laws. At this time, an estimate of the potential change to the amount of unrecognized tax benefits cannot be made.
The Tax Act requires that all unremitted earnings of subsidiaries operating outside the U.S. are deemed to be repatriated as of December 31, 2017. As such, a liability of
$125 million
has been accrued for the deemed repatriation of
$1.5 billion
of undistributed foreign earnings. The amount will be payable on our 2017 and 2018 tax returns. No actual distributions of these earnings have been made as of the balance sheet date. In accordance with the guidance for accounting for income taxes in special areas, these earnings are considered by management to be invested indefinitely. Upon repatriation of these earnings, there would be no additional U.S. income taxes, but certain jurisdictions may have withholding taxes payable on actual distributions.
As of December 31, 2017, U.S. income taxes of
$69 million
have not been provided for approximately
$287 million
of previously acquired thrift bad debt reserves created for tax purposes as of December 31, 1987. These amounts, acquired as a result of previous mergers and acquisitions, are subject to recapture in the unlikely event that CONA, as successor to the merged and acquired entities, makes distributions in excess of earnings and profits, redeems its stock or liquidates.
|
201
|
Capital One Financial Corporation (COF)
|
|
|
|
Fair value, also referred to as an exit price, is defined as the price that would be received for an asset or paid to transfer a liability in an orderly transaction between market participants on the measurement date
. The fair value accounting guidance provides a three-level fair value hierarchy for classifying financial instruments. This hierarchy is based on the markets in which the assets or liabilities trade and whether the inputs to the valuation techniques used to measure fair value are observable or unobservable. The fair value measurement of a financial asset or liability is assigned a level based on the lowest level of any input that is significant to the fair value measurement in its entirety. The three levels of the fair value hierarchy are described below:
|
Level 1:
|
Valuation is based on quoted prices (unadjusted) in active markets for identical assets or liabilities.
|
|
|
Level 2:
|
Valuation is based on observable market-based inputs, other than quoted prices in active markets for identical assets or liabilities, quoted prices in markets that are not active, or models using inputs that are observable or can be corroborated by observable market data of substantially the full term of the assets or liabilities.
|
|
|
Level 3:
|
Valuation is generated from techniques that use significant assumptions not observable in the market. Valuation techniques include pricing models, discounted cash flow methodologies or similar techniques.
|
|
The accounting guidance for fair value measurements requires that we maximize the use of observable inputs and minimize the use of unobservable inputs in determining fair value. The accounting guidance provides for the irrevocable option to elect, on a contract-by-contract basis, to measure certain financial assets and liabilities at fair value at inception of the contract and record any subsequent changes in fair value in earnings. We have not made any material fair value option elections as of or for the periods disclosed herein.
Fair Value Governance and Control
We have a governance framework and a number of key controls that are intended to ensure that our fair value measurements are appropriate and reliable. Our governance framework provides for independent oversight and segregation of duties. Our control processes include review and approval of new transaction types, price verification and review of valuation judgments, methods, models, process controls and results.
Groups independent of our trading and investing functions participate in the review and validation process. Tasks performed by these groups include periodic verification of fair value measurements to determine if assigned fair values are reasonable, including comparing prices from vendor pricing services to other available market information.
Our Fair Value Committee (“FVC”), which includes representation from business areas, Risk Management and Finance divisions, provides guidance and oversight to ensure an appropriate valuation control environment. The FVC regularly reviews and approves our fair valuations to ensure that our valuation practices are consistent with industry standards and adhere to regulatory and accounting guidance.
We have a model policy, established by an independent Model Risk Office, which governs the validation of models and related supporting documentation to ensure the appropriate use of models for pricing and fair value measurements. The Model Risk Office validates all models and provides ongoing monitoring of their performance.
The fair value governance process is set up in a manner that allows the Chairperson of the FVC to escalate valuation disputes that cannot be resolved by the FVC to a more senior committee called the Valuations Advisory Committee (“VAC”) for resolution. The VAC is chaired by the Chief Financial Officer and includes other members of senior management. The VAC is only required to convene to review escalated valuation disputes.
Financial Assets and Liabilities
The following describes the valuation techniques used in estimating the fair value of our financial assets and liabilities recorded at fair value on a recurring basis or nonrecurring basis, and for financial instruments not recorded at fair value. We apply the fair value provisions to the financial instruments not recorded at fair value on the consolidated balance sheets but required to be disclosed in this note. The provisions require us to maximize the use of observable inputs and to measure fair value using a notion of exit price were factored into our selection of inputs for our established valuation techniques.
|
202
|
Capital One Financial Corporation (COF)
|
|
Investment Securities
Quoted prices in active markets are used to measure the fair value of U.S. Treasury securities. For the majority of securities in other investment categories, we utilize multiple vendor pricing services to obtain fair value measurements. A waterfall of pricing vendors is determined in order of preference. The determination of the top ranked pricing vendor is made on an annual basis as part of an assessment of the performance of pricing services provided by the vendors. A pricing service may be considered as the preferred or primary pricing provider depending on how closely aligned its prices are to other vendor prices, and how consistent the prices are with other available market information. The price of each security is confirmed by comparing with other vendor prices before it is finalized.
RMBS and CMBS securities are generally classified as Level 2 or 3. When significant assumptions are not consistently observable, fair values are derived using the best available data. Such data may include quotes provided by dealers, valuation from external pricing services, independent pricing models, or other model-based valuation techniques, for example, calculation of the present values of future cash flows incorporating assumptions such as benchmark yields, spreads, prepayment speeds, credit ratings and losses. Generally, the pricing services utilize observable market data to the extent available. Pricing models may be used, which can vary by asset class and may also incorporate available trade, bid and other market information. Across asset classes, information such as trader/dealer inputs, credit spreads, forward curves and prepayment speeds are used to help determine appropriate valuations. Because many fixed income securities do not trade on a daily basis, the pricing models may apply available information through processes such as benchmarking curves, grouping securities based on their characteristics and using matrix pricing to prepare valuations. In addition, model processes are used by the pricing services to develop prepayment assumptions.
We validate the pricing obtained from the primary pricing providers through comparison of pricing to additional sources, including other pricing services, dealer pricing indications in transaction results and other internal sources. Pricing variances among different pricing sources are analyzed. Additionally, on an on-going basis, we request more detailed information from the valuation vendors to understand the pricing methodology and assumptions used to value the securities.
Derivative Assets and Liabilities
We use both exchange-traded and OTC derivatives to manage our interest rate and foreign currency risk exposures. When quoted market prices are available and used to value our exchange-traded derivatives, we classify them as Level 1. However, predominantly all of our derivatives do not have readily available quoted market prices. Therefore, we value most of our derivatives using vendor-based valuation techniques. We primarily rely on market observable inputs for our models, such as interest rate yield curves, credit curves, option volatility and currency rates. These inputs can vary depending on the type of derivatives and nature of the underlying rate, price or index upon which the derivative’s value is based. We typically classify derivatives as Level 2 when significant inputs can be observed in a liquid market and the model itself does not require significant judgment. When instruments are traded in less liquid markets and significant inputs are unobservable, such as interest rate swaps whose remaining terms do not correlate with market observable interest rate yield curves, such derivatives are classified as Level 3. The impact of counterparty non-performance risk is considered when measuring the fair value of derivative assets. Official internal pricing is compared against additional pricing sources such as external valuation agents and other internal sources. Pricing variances among different pricing sources are analyzed and validated. These derivatives are included in other assets or other liabilities on the consolidated balance sheets.
Mortgage Servicing Rights
We record consumer MSRs at fair value on a recurring basis.We determine the fair value of MSRs using a valuation model that calculates the present value of estimated future net servicing income. The model incorporates assumptions that we believe other market participants use in estimating future net servicing income, including estimates of prepayment speeds, discount rate or option-adjusted spreads, cost to service, contractual servicing fee income, ancillary income and late fees. Fair value measurements of MSRs use significant unobservable inputs and, accordingly, are classified as Level 3. In the event we enter into an agreement with a third party to sell the MSRs, the valuation is based on the agreed upon sale price which is considered to be the exit price and such MSRs are classified as Level 2.
|
203
|
Capital One Financial Corporation (COF)
|
|
Retained Interests in Securitizations
We have retained interests in various mortgage securitizations from previous acquisitions. Our retained interests primarily include amounts previously funded under letters of credit to cover losses on certain manufactured housing securitizations, interest-only bonds issued by a trust and negative amortization bonds. We record these retained interests at fair value using market indications and valuation models to calculate the present value of future cash flows. The models incorporate various assumptions that market participants use in estimating future cash flows including constant prepayment rate, discount rate, default rate and loss severity. Due to the use of significant unobservable inputs, retained interests in securitizations are classified as Level 3 under the fair value hierarchy.
Deferred Compensation Plan Assets
We offer a voluntary non-qualified deferred compensation plan to eligible associates. In addition to participant deferrals, we make contributions to the plan. Participants invest these contributions in a variety of publicly traded mutual funds. The plan assets, which consist of publicly traded mutual funds, are classified as Level 1.
Other Assets
Other assets subject to nonrecurring fair value measurements primarily include foreclosed property, other repossessed assets and long-lived assets held for sale. Foreclosed property, other repossessed assets and long-lived assets held for sale are carried at the lower of the cost or fair value less costs to sell. The fair value is determined based on the appraisal value, listing price of the property or collateral provided by independent appraisers, and is adjusted for the estimated costs to sell. Due to the use of significant unobservable inputs, these assets are generally classified as Level 3 under the fair value hierarchy. Fair value adjustments for these assets are recorded in other non-interest expense in the consolidated statements of income.
Cash and Cash Equivalents
Cash and cash equivalents consist of cash and due from banks, interest bearing deposits and other short-term investments. Cash and due from banks are generally classified as Level 1. Interest bearing deposits and other short-term investments are generally classified as Level 2, as their valuations are based on observable market inputs. Their fair value approximates carrying value.
Restricted Cash for Securitization Investors
Restricted cash for securitization investors are classified as Level 1.
Net Loans Held For Investment
Loans held for investment that are individually impaired are carried at the lower of cost or fair value of the underlying collateral, less the estimated cost to sell. The fair values of credit card loans, auto loans, home loans and commercial loans are estimated using a discounted cash flow method, which is a form of the income approach. Discount rates are determined considering rates at which similar portfolios of loans would be made under current conditions and considering liquidity spreads applicable to each loan portfolio based on the secondary market. The fair value of credit card loans excludes any value related to customer account relationships. For loans held for investment that are recorded at fair value on our consolidated balance sheets and measured on a nonrecurring basis, the fair value is determined using appraisal values that are obtained from independent appraisers, broker pricing opinions or other available market information, adjusted for the estimated cost to sell.
Due to the use of significant unobservable inputs, loans held for investment are classified as Level 3 under the fair value hierarchy. Fair value adjustments for individually impaired collateralized loans held for investment are recorded in provision for credit losses in the consolidated statements of income.
Loans Held For Sale
Loans held for sale are carried at the lower of aggregate cost, net of deferred fees and deferred origination costs, or fair value. Certain commercial mortgage loans we originated with the intent to sell are sold to GSEs as part of a delegated underwriting and servicing (“DUS”) program. For DUS commercial mortgage loans, the fair value is estimated primarily using contractual prices and other market observable inputs. For residential mortgage loans classified as held for sale, the fair value is estimated using observable market prices for loans with similar characteristics as the primary component, with the secondary component derived
|
204
|
Capital One Financial Corporation (COF)
|
|
from typical securitization activities and market conditions. Such loans are, however, valued using market price indications when available. Credit card loans held for sale are valued based on other market observable inputs. These assets are therefore classified as Level 2. Fair value adjustments to loans held for sale are recorded in other non-interest income in our consolidated statements of income.
Interest Receivable
Interest receivable is classified as Level 2, as its fair value estimate uses only observable market inputs.
Other Investments
Other investments include FHLB and Federal Reserve stock and cost method investments. These investments are classified as Level 2 when their fair value estimates use observable market inputs and as Level 3 if any significant unobservable inputs are employed in determining the fair value.
Deposits
Non-interest-bearing deposits are classified as Level 1. Interest-bearing deposits with no stated maturities are classified as Level 2, as the fair value is equal to the amount payable on demand at the reporting date. Interest-bearing deposits with stated maturities are also classified as Level 2, as the fair value is estimated utilizing a discounted cash flow analysis using market observable inputs such as current interest rates.
Securitized Debt Obligations
We utilize multiple vendor pricing services to obtain fair value measurements for the majority of our securitized debt obligations. The pricing services use pricing models that incorporate market observable data to the extent available, such as trade, bid and other market information. We use internal pricing models such as discounted cash flow models or similar techniques to estimate the fair value of certain securitization trusts where vendor pricing is not available. Securitized debt obligations are generally classified as Level 2.
Senior and Subordinated Notes
We also engage multiple vendor pricing services to estimate the fair value of senior and subordinated notes. The pricing services utilize pricing models that incorporate available trade, bid and other market information. The spread assumptions and relevant credit information are also incorporated into the pricing models. Senior and subordinated notes are generally classified as Level 2.
Federal Funds Purchased and Securities Loaned or Sold under Agreements to Repurchase
The federal funds purchased and securities loaned or sold under agreements to repurchase are mainly overnight secured lending transactions. They are classified as Level 2 since their fair value estimates use observable market inputs.
Other Borrowings
Other borrowings primarily consist of FHLB advances. The fair value of FHLB advances is determined based on discounted expected cash flows using discount rates consistent with current market rates for FHLB advances with similar remaining terms. They are classified as Level 2.
Interest Payable
Interest payable is classified as Level 2, as its fair value estimate is based on observable market inputs.
The determination of the leveling of financial instruments in the fair value hierarchy is performed at the end of each reporting period. We consider all available information, including observable market data, indications of market liquidity and orderliness, and our understanding of the valuation techniques and significant inputs. Based upon the specific facts and circumstances of each instrument or instrument category, judgments are made regarding the significance of the observable or unobservable inputs to the instruments’ fair value measurement in its entirety. If unobservable inputs are considered significant, the instrument is classified
|
205
|
Capital One Financial Corporation (COF)
|
|
as Level 3. The process for determining fair value using unobservable inputs is generally more subjective and involves a high degree of management judgment and assumptions. During
2017
, we had minimal movements between Levels 1 and 2.
Assets and Liabilities Measured at Fair Value on a Recurring Basis
The following table displays our assets and liabilities measured on our consolidated balance sheets at fair value on a recurring basis as of
December 31, 2017
and
2016
.
Table
17.1
: Assets and Liabilities Measured at Fair Value on a Recurring Basis
|
|
December 31, 2017
|
|||||||||||||||||||
|
|
Fair Value Measurements Using
|
Netting Adjustments
(1)
|
|
|||||||||||||||||
|
(Dollars in millions)
|
Level 1
|
Level 2
|
Level 3
|
Total
|
||||||||||||||||
|
Assets:
|
||||||||||||||||||||
|
Securities available for sale:
|
||||||||||||||||||||
|
U.S. Treasury securities
|
$
|
5,171
|
|
$
|
0
|
|
$
|
0
|
|
$
|
—
|
|
$
|
5,171
|
|
|||||
|
RMBS
|
0
|
|
27,178
|
|
614
|
|
—
|
|
27,792
|
|
||||||||||
|
CMBS
|
0
|
|
3,161
|
|
14
|
|
—
|
|
3,175
|
|
||||||||||
|
Other ABS
|
0
|
|
512
|
|
0
|
|
—
|
|
512
|
|
||||||||||
|
Other securities
|
320
|
|
680
|
|
5
|
|
—
|
|
1,005
|
|
||||||||||
|
Total securities available for sale
|
5,491
|
|
31,531
|
|
633
|
|
—
|
|
37,655
|
|
||||||||||
|
Other assets:
|
||||||||||||||||||||
|
Derivative assets
(2)
|
1
|
|
1,002
|
|
37
|
|
(275
|
)
|
765
|
|
||||||||||
|
Other
(3)
|
281
|
|
0
|
|
264
|
|
—
|
|
545
|
|
||||||||||
|
Total assets
|
$
|
5,773
|
|
$
|
32,533
|
|
$
|
934
|
|
$
|
(275
|
)
|
$
|
38,965
|
|
|||||
|
Liabilities:
|
||||||||||||||||||||
|
Other liabilities:
|
||||||||||||||||||||
|
Derivative liabilities
(2)
|
$
|
1
|
|
$
|
1,243
|
|
$
|
24
|
|
$
|
(662
|
)
|
$
|
606
|
|
|||||
|
Total liabilities
|
$
|
1
|
|
$
|
1,243
|
|
$
|
24
|
|
$
|
(662
|
)
|
$
|
606
|
|
|||||
|
|
December 31, 2016
|
|||||||||||||||||||
|
|
Fair Value Measurements Using
|
Netting Adjustments
(1)
|
|
|||||||||||||||||
|
(Dollars in millions)
|
Level 1
|
Level 2
|
Level 3
|
Total
|
||||||||||||||||
|
Assets:
|
||||||||||||||||||||
|
Securities available for sale:
|
||||||||||||||||||||
|
U.S. Treasury securities
|
$
|
5,065
|
|
$
|
0
|
|
$
|
0
|
|
$
|
—
|
|
$
|
5,065
|
|
|||||
|
RMBS
|
0
|
|
28,731
|
|
518
|
|
—
|
|
29,249
|
|
||||||||||
|
CMBS
|
0
|
|
4,937
|
|
51
|
|
—
|
|
4,988
|
|
||||||||||
|
Other ABS
|
0
|
|
714
|
|
0
|
|
—
|
|
714
|
|
||||||||||
|
Other securities
|
295
|
|
417
|
|
9
|
|
—
|
|
721
|
|
||||||||||
|
Total securities available for sale
|
5,360
|
|
34,799
|
|
578
|
|
—
|
|
40,737
|
|
||||||||||
|
Other assets:
|
||||||||||||||||||||
|
Derivative assets
(2)
|
7
|
|
1,440
|
|
47
|
|
(539
|
)
|
955
|
|
||||||||||
|
Other
(3)
|
219
|
|
0
|
|
281
|
|
—
|
|
500
|
|
||||||||||
|
Total assets
|
$
|
5,586
|
|
$
|
36,239
|
|
$
|
906
|
|
$
|
(539
|
)
|
$
|
42,192
|
|
|||||
|
Liabilities:
|
||||||||||||||||||||
|
Other liabilities:
|
||||||||||||||||||||
|
Derivative liabilities
(2)
|
$
|
12
|
|
$
|
1,397
|
|
$
|
29
|
|
$
|
(336
|
)
|
$
|
1,102
|
|
|||||
|
Total liabilities
|
$
|
12
|
|
$
|
1,397
|
|
$
|
29
|
|
$
|
(336
|
)
|
$
|
1,102
|
|
|||||
|
206
|
Capital One Financial Corporation (COF)
|
|
__________
|
(1)
|
Represents balance sheet netting of derivative assets and liabilities, and related payable and receivables for cash collateral held or placed with the same counterparty. See “
|
|
(2)
|
Does not reflect
$2 million
and
$5 million
recognized as a net valuation allowance on derivative assets and liabilities for non-performance risk as of
December 31, 2017
and
2016
, respectively. Non-performance risk is included in the derivative assets and liabilities which are part of other assets and liabilities on the consolidated balance sheets and offset through non-interest income in the consolidated statements of income.
|
|
(3)
|
Other includes consumer MSRs of
$92 million
a
nd
$80 million
, retained interests in securitizat
ions of
$172 million
an
d
$201 million
and deferred compensation plan assets of
$281 million
and
$219 million
as of
December 31, 2017
and
2016
, respectively.
|
Level 3 Recurring Fair Val
ue Rollforward
The table below presents a reconciliation for all assets and liabilities measured and recognized at fair value on a recurring basis using significant unobservable inputs (Level 3) for the years ended December 31, 2017,
2016
and 2015. When assets and liabilities are transferred between levels, we recognize the transfer as of the end of the period. Generally, transfers into Level 3 were primarily driven by the usage of unobservable assumptions in the pricing of these financial instruments as evidenced by wider pricing variations among pricing vendors and transfers out of Level 3 were primarily driven by the usage of assumptions corroborated by market observable information as evidenced by tighter pricing among multiple pricing sources.
Table
17.2
: Level 3 Recurring Fair Value Rollforward
|
Fair Value Measurements Using Significant Unobservable Inputs (Level 3)
|
||||||||||||||||||||||||||||||||||||||||||||
|
|
Year Ended December 31, 2017
|
|||||||||||||||||||||||||||||||||||||||||||
|
|
Total Gains (Losses)
(Realized/Unrealized)
|
|
|
|
Net Unrealized
Gains (Losses) Included in Net Income Related to Assets and Liabilities Still Held as of December 31, 2017 (1) |
|||||||||||||||||||||||||||||||||||||||
|
(Dollars in millions)
|
Balance,
January 1,
2017
|
Included
in Net
Income
(1)
|
Included in
OCI
|
Purchases
|
Sales
|
Issuances
|
Settlements
|
Transfers
Into
Level 3
|
Transfers
Out of
Level 3
|
Balance, December 31, 2017
|
||||||||||||||||||||||||||||||||||
|
Securities available for sale:
|
||||||||||||||||||||||||||||||||||||||||||||
|
RMBS
|
$
|
518
|
|
$
|
90
|
|
$
|
(24
|
)
|
$
|
0
|
|
$
|
(116
|
)
|
$
|
0
|
|
$
|
(92
|
)
|
$
|
572
|
|
$
|
(334
|
)
|
$
|
614
|
|
$
|
19
|
|
|||||||||||
|
CMBS
|
51
|
|
0
|
|
0
|
|
110
|
|
(50
|
)
|
0
|
|
(4
|
)
|
0
|
|
(93
|
)
|
14
|
|
0
|
|
||||||||||||||||||||||
|
Other securities
|
9
|
|
0
|
|
0
|
|
0
|
|
0
|
|
0
|
|
(4
|
)
|
0
|
|
0
|
|
5
|
|
0
|
|
||||||||||||||||||||||
|
Total securities available for sale
|
578
|
|
90
|
|
(24
|
)
|
110
|
|
(166
|
)
|
0
|
|
(100
|
)
|
572
|
|
(427
|
)
|
633
|
|
19
|
|
||||||||||||||||||||||
|
Other assets:
|
||||||||||||||||||||||||||||||||||||||||||||
|
Consumer MSRs
|
80
|
|
(5
|
)
|
0
|
|
0
|
|
(3
|
)
|
27
|
|
(7
|
)
|
0
|
|
0
|
|
92
|
|
(5
|
)
|
||||||||||||||||||||||
|
Retained interest in securitizations
|
201
|
|
(29
|
)
|
0
|
|
0
|
|
0
|
|
0
|
|
0
|
|
0
|
|
0
|
|
172
|
|
(29
|
)
|
||||||||||||||||||||||
|
Net derivative assets (liabilities)
(2)
|
18
|
|
0
|
|
0
|
|
0
|
|
0
|
|
46
|
|
(44
|
)
|
0
|
|
(7
|
)
|
13
|
|
0
|
|
||||||||||||||||||||||
|
207
|
Capital One Financial Corporation (COF)
|
|
|
Fair Value Measurements Using Significant Unobservable Inputs (Level 3)
|
||||||||||||||||||||||||||||||||||||||||||||
|
|
Year Ended December 31, 2016
|
|||||||||||||||||||||||||||||||||||||||||||
|
|
Total Gains (Losses)
(Realized/Unrealized)
|
|
|
Net Unrealized
Gains (Losses)
Included in Net
Income Related to Assets and
Liabilities Still Held as of
December 31, 2016
(1)
|
||||||||||||||||||||||||||||||||||||||||
|
(Dollars in millions)
|
Balance,
January 1, 2016 |
Included
in Net
Income
(1)
)
|
Included in
OCI
|
Purchases
|
Sales
|
Issuances
|
Settlements
|
Transfers
Into
Level 3
|
Transfers
Out of
Level 3
|
Balance, December 31, 2016
|
||||||||||||||||||||||||||||||||||
|
Securities available for sale:
|
||||||||||||||||||||||||||||||||||||||||||||
|
RMBS
|
$
|
504
|
|
$
|
31
|
|
$
|
9
|
|
$
|
110
|
|
$
|
0
|
|
$
|
0
|
|
$
|
(98
|
)
|
$
|
380
|
|
$
|
(418
|
)
|
$
|
518
|
|
$
|
32
|
|
|||||||||||
|
CMBS
|
97
|
|
0
|
|
0
|
|
266
|
|
0
|
|
0
|
|
(14
|
)
|
64
|
|
(362
|
)
|
51
|
|
0
|
|
||||||||||||||||||||||
|
Other ABS
|
0
|
|
0
|
|
0
|
|
30
|
|
0
|
|
0
|
|
0
|
|
0
|
|
(30
|
)
|
0
|
|
0
|
|
||||||||||||||||||||||
|
Other securities
|
14
|
|
(9
|
)
|
0
|
|
14
|
|
0
|
|
0
|
|
(10
|
)
|
0
|
|
0
|
|
9
|
|
0
|
|
||||||||||||||||||||||
|
Total securities available for sale
|
615
|
|
22
|
|
9
|
|
420
|
|
0
|
|
0
|
|
(122
|
)
|
444
|
|
(810
|
)
|
578
|
|
32
|
|
||||||||||||||||||||||
|
Other assets:
|
||||||||||||||||||||||||||||||||||||||||||||
|
Consumer MSRs
|
68
|
|
(5
|
)
|
0
|
|
0
|
|
0
|
|
23
|
|
(6
|
)
|
0
|
|
0
|
|
80
|
|
(5
|
)
|
||||||||||||||||||||||
|
Retained interest in securitizations
|
211
|
|
(10
|
)
|
0
|
|
0
|
|
0
|
|
0
|
|
0
|
|
0
|
|
0
|
|
201
|
|
(10
|
)
|
||||||||||||||||||||||
|
Net derivative assets (liabilities)
(2)
|
30
|
|
(5
|
)
|
0
|
|
0
|
|
0
|
|
36
|
|
(33
|
)
|
0
|
|
(10
|
)
|
18
|
|
(5
|
)
|
||||||||||||||||||||||
|
Fair Value Measurements Using Significant Unobservable Inputs (Level 3)
|
||||||||||||||||||||||||||||||||||||||||||||
|
|
Year Ended December 31, 2015
|
|||||||||||||||||||||||||||||||||||||||||||
|
|
Total Gains (Losses)
(Realized/Unrealized)
|
|
|
Net Unrealized
Gains (Losses) Included in Net Income Related to Assets and Liabilities Still Held as of December 31, 2015 (1) |
||||||||||||||||||||||||||||||||||||||||
|
(Dollars in millions)
|
Balance,
January 1,
2015
|
Included
in Net
Income
(1)
)
|
Included in
OCI
|
Purchases
|
Sales
|
Issuances
|
Settlements
|
Transfers
Into
Level 3
|
Transfers
Out of
Level 3
|
Balance,
December 31, 2015 |
||||||||||||||||||||||||||||||||||
|
Securities available for sale:
|
||||||||||||||||||||||||||||||||||||||||||||
|
Corporate debt securities guaranteed by U.S. government agencies
|
$
|
333
|
|
$
|
(1
|
)
|
$
|
6
|
|
$
|
0
|
|
$
|
(226
|
)
|
$
|
0
|
|
$
|
(12
|
)
|
$
|
0
|
|
$
|
(100
|
)
|
$
|
0
|
|
$
|
0
|
|
|||||||||||
|
RMBS
|
561
|
|
35
|
|
(3
|
)
|
0
|
|
0
|
|
0
|
|
(63
|
)
|
343
|
|
(369
|
)
|
504
|
|
36
|
|
||||||||||||||||||||||
|
CMBS
|
228
|
|
0
|
|
(1
|
)
|
138
|
|
0
|
|
0
|
|
(52
|
)
|
0
|
|
(216
|
)
|
97
|
|
0
|
|
||||||||||||||||||||||
|
Other ABS
|
65
|
|
1
|
|
(2
|
)
|
0
|
|
(20
|
)
|
0
|
|
0
|
|
0
|
|
(44
|
)
|
0
|
|
0
|
|
||||||||||||||||||||||
|
Other securities
|
18
|
|
0
|
|
0
|
|
4
|
|
0
|
|
0
|
|
(8
|
)
|
0
|
|
0
|
|
14
|
|
0
|
|
||||||||||||||||||||||
|
Total securities available for sale
|
1,205
|
|
35
|
|
0
|
|
142
|
|
(246
|
)
|
0
|
|
(135
|
)
|
343
|
|
(729
|
)
|
615
|
|
36
|
|
||||||||||||||||||||||
|
Other assets:
|
||||||||||||||||||||||||||||||||||||||||||||
|
Consumer MSRs
|
53
|
|
(1
|
)
|
0
|
|
0
|
|
0
|
|
22
|
|
(6
|
)
|
0
|
|
0
|
|
68
|
|
(1
|
)
|
||||||||||||||||||||||
|
Retained interest in securitizations
|
221
|
|
(10
|
)
|
0
|
|
0
|
|
0
|
|
0
|
|
0
|
|
0
|
|
0
|
|
211
|
|
(10
|
)
|
||||||||||||||||||||||
|
Net derivative assets (liabilities)
(2)
|
23
|
|
5
|
|
0
|
|
0
|
|
0
|
|
29
|
|
(23
|
)
|
0
|
|
(4
|
)
|
30
|
|
5
|
|
||||||||||||||||||||||
|
(1)
|
Gains (losses) related to Level 3 securities available for sale, consumer MSRs, retained interests in securitizations, and derivative assets and liabilities are included as a component of non-interest income in our consolidated statements of income.
|
|
(2)
|
Includes derivative assets and liabilities of
$37 million
and
$24 million
, respectively, as of December 31, 2017,
$47 million
and
$29 million
, respectively, as of December 31, 2016, and
$57 million
and
$27 million
, respectively, as of December 31, 2015.
|
|
208
|
Capital One Financial Corporation (COF)
|
|
Significant Level 3 Fair Value Asset and Liability Input Sensitivity
Changes in unobservable inputs may have a significant impact on fair value. Certain of these unobservable inputs will, in isolation, have a directionally consistent impact on the fair value of the instrument for a given change in that input. Alternatively, the fair value of the instrument may move in an opposite direction for a given change in another input. In general, an increase in the discount rate, default rates, loss severity and credit spreads, in isolation, would result in a decrease in the fair value measurement. In addition, an increase in default rates would generally be accompanied by a decrease in recovery rates, slower prepayment rates and an increase in liquidity spreads.
Techniques and Inputs for Level 3 Fair Value Measurements
The following table presents the significant unobservable inputs used to determine the fair values of our Level 3 financial instruments on a recurring basis. We utilize multiple vendor pricing services to obtain fair value for our securities. Several of our vendor pricing services are only able to provide unobservable input information for a limited number of securities due to software licensing restrictions. Other vendor pricing services are able to provide unobservable input information for all securities for which they provide a valuation. As a result, the unobservable input information for the securities available for sale presented below represents a composite summary of all information we are able to obtain. The unobservable input information for all other Level 3 financial instruments is based on the assumptions used in our internal valuation models.
|
209
|
Capital One Financial Corporation (COF)
|
|
Table
17.3
: Quantitative Information about Level 3 Fair Value Measurements
|
Quantitative Information about Level 3 Fair Value Measurements
|
||||||||||||
|
(Dollars in millions)
|
Fair Value at December 31,
2017 |
Significant
Valuation
Techniques
|
Significant
Unobservable
Inputs
|
Range
|
Weighted
Average
|
|||||||
|
Securities available for sale:
|
||||||||||||
|
RMBS
|
$
|
614
|
|
Discounted cash flows (vendor pricing)
|
Yield
Voluntary prepayment rate Default rate Loss severity |
2-9%
0-15% 0-8% 0-90% |
5%
4% 3% 62% |
|||||
|
CMBS
|
14
|
|
Discounted cash flows (vendor pricing)
|
Yield
Voluntary prepayment rate |
3%
0% |
3%
0% |
||||||
|
Other securities
|
5
|
|
Discounted cash flows
|
Yield
|
2%
|
2%
|
||||||
|
Other assets:
|
||||||||||||
|
Consumer MSRs
|
92
|
|
Discounted cash flows
|
Total prepayment rate
Discount rate Option-adjusted spread rate Servicing cost ($ per loan) |
7-30%
14% 200-1,500 bps $75-$100 |
16%
14% 458 bps $76 |
||||||
|
Retained interests in securitization
(1)
|
172
|
|
Discounted cash flows
|
Life of receivables (months)
Voluntary prepayment rate Discount rate Default rate Loss severity |
6-79
2-12% 3-10% 1-6% 3-115% |
N/A
|
||||||
|
Net derivative assets (liabilities)
|
13
|
|
Discounted cash flows
|
Swap rates
|
2%
|
2%
|
||||||
|
Quantitative Information about Level 3 Fair Value Measurements
|
||||||||||||
|
(Dollars in millions)
|
Fair Value at
December 31,
2016
|
Significant
Valuation
Techniques
|
Significant
Unobservable
Inputs
|
Range
|
Weighted
Average
|
|||||||
|
Securities available for sale:
|
||||||||||||
|
RMBS
|
$
|
518
|
|
Discounted cash flows (vendor pricing)
|
Yield
Voluntary prepayment rate Default rate Loss severity |
0-15%
0-30% 0-16% 9-87% |
5%
4% 4% 57% |
|||||
|
CMBS
|
51
|
|
Discounted cash flows (vendor pricing)
|
Yield
Voluntary prepayment rate |
2%
0% |
2%
0% |
||||||
|
Other securities
|
9
|
|
Discounted cash flows
|
Yield
|
1-2%
|
1%
|
||||||
|
Other assets:
|
||||||||||||
|
Consumer MSRs
|
80
|
|
Discounted cash flows
|
Total prepayment rate
Discount rate Option-adjusted spread rate Servicing cost ($ per loan) |
8-20%
15% 580-1,500 bps $75-$100 |
15%
15% 636 bps $76 |
||||||
|
Retained interests in securitization
(1)
|
201
|
|
Discounted cash flows
|
Life of receivables (months) Voluntary prepayment rate
Discount rate Default rate Loss severity |
6-87
2-11% 4-11% 1-6% 7-102% |
N/A
|
||||||
|
Net derivative assets (liabilities)
|
18
|
|
Discounted cash flows
|
Swap rates
|
2%
|
2%
|
||||||
|
(1)
|
Due to the nature of the various mortgage securitization structures in which we have retained interests, it is not meaningful to present a consolidated weighted average for the significant unobservable inputs.
|
Assets and Liabilities Measured at Fair Value on a Nonrecurring Basis
We are required to measure and recognize certain assets at fair value on a nonrecurring basis on the consolidated balance sheets. These assets are not measured at fair value on an ongoing basis but are subject to fair value adjustments in certain circumstances (for example, from the application of lower of cost or fair value accounting or when we evaluate for impairment).
|
210
|
Capital One Financial Corporation (COF)
|
|
The following table presents the carrying value of the assets measured at fair value on a nonrecurring basis and still held as of
December 31, 2017
and
2016
, and for which a nonrecurring fair value measurement was recorded during the year then ended:
Table
17.4
: Nonrecurring Fair Value Measurements
__________
|
December 31, 2017
|
||||||||||||
|
Estimated Fair Value Hierarchy
|
Total
|
|||||||||||
|
(Dollars in millions)
|
Level 2
|
Level 3
|
||||||||||
|
Loans held for investment
|
$
|
0
|
|
$
|
182
|
|
$
|
182
|
|
|||
|
Loans held for sale
|
177
|
|
1
|
|
178
|
|
||||||
|
Other assets
(1)
|
0
|
|
35
|
|
35
|
|
||||||
|
Total
|
$
|
177
|
|
$
|
218
|
|
$
|
395
|
|
|||
|
December 31, 2016
|
||||||||||||
|
Estimated Fair Value Hierarchy
|
Total
|
|||||||||||
|
(Dollars in millions)
|
Level 2
|
Level 3
|
||||||||||
|
Loans held for investment
|
$
|
0
|
|
$
|
587
|
|
$
|
587
|
|
|||
|
Loans held for sale
|
157
|
|
0
|
|
157
|
|
||||||
|
Other assets
(1)
|
0
|
|
83
|
|
83
|
|
||||||
|
Total
|
$
|
157
|
|
$
|
670
|
|
$
|
827
|
|
|||
|
(1)
|
Other assets includes foreclosed property and repossessed assets of
$17 million
and long-lived assets held for sale of
$18 million
as of
December 31, 2017
, compared to foreclosed property and repossessed assets of
$43 million
and long-lived assets held for sale of
$40 million
as of
December 31, 2016
.
|
In the above table, loans held for investment primarily include nonperforming loans for which specific reserves or charge-offs have been recognized. These loans are classified as Level 3, as they are valued based in part on the estimated fair value of the underlying collateral and the non-recoverable rate, which is considered to be a significant unobservable input. Collateral fair value sources include the appraisal value obtained from independent appraisers, broker pricing opinions or other available market information. The non-recoverable rate ranged from
0%
to
77%
, with a weighted average of
21%
, and from
0%
to
73%
, with a weighted average of
16%
, as of
December 31, 2017
and
2016
, respectively. The fair value of the loans held for sale and the other assets classified as Level 3 is determined based on appraisal value or listing price which involves significant judgment; the significant unobservable inputs and related quantitative information are not meaningful to disclose as they vary significantly across properties and collateral.
The following table presents total nonrecurring fair value measurements for the period, included in earnings, attributable to the change in fair value relating to assets that are still held at
December 31, 2017
,
2016
and
2015
.
Table
17.5
: Nonrecurring Fair Value Measurements Included in Earnings
__________
|
Total Gains (Losses)
|
||||||||||||
|
|
Year Ended December 31,
|
|||||||||||
|
(Dollars in millions)
|
2017
|
2016
|
2015
|
|||||||||
|
Loans held for investment
|
$
|
(100
|
)
|
$
|
(230
|
)
|
$
|
(80
|
)
|
|||
|
Loans held for sale
|
(3
|
)
|
(2
|
)
|
(1
|
)
|
||||||
|
Other assets
(1)
|
(12
|
)
|
(19
|
)
|
(45
|
)
|
||||||
|
Total
|
$
|
(115
|
)
|
$
|
(251
|
)
|
$
|
(126
|
)
|
|||
|
(1)
|
Other assets includes losses related to foreclosed property, repossessed assets and long-lived assets held for sale.
|
|
211
|
Capital One Financial Corporation (COF)
|
|
Fair Value of Financial Instruments
The following table presents the carrying value and estimated fair value, including the level within the fair value hierarchy, of our financial instruments that are not measured at fair value on a recurring basis on our consolidated balance sheets as of
December 31, 2017
and
2016
.
Table
17.6
: Fair Value of Financial Instruments
__________
|
|
December 31, 2017
|
|||||||||||||||||||
|
Carrying
Value
|
Estimated
Fair Value
|
Estimated Fair Value Hierarchy
|
||||||||||||||||||
|
(Dollars in millions)
|
Level 1
|
Level 2
|
Level 3
|
|||||||||||||||||
|
Financial assets:
|
||||||||||||||||||||
|
Cash and cash equivalents
|
$
|
14,040
|
|
$
|
14,040
|
|
$
|
4,458
|
|
$
|
9,582
|
|
$
|
0
|
|
|||||
|
Restricted cash for securitization investors
|
312
|
|
312
|
|
312
|
|
0
|
|
0
|
|
||||||||||
|
Securities held to maturity
|
28,984
|
|
29,437
|
|
200
|
|
29,217
|
|
20
|
|
||||||||||
|
Net loans held for investment
|
246,971
|
|
251,468
|
|
0
|
|
0
|
|
251,468
|
|
||||||||||
|
Loans held for sale
|
971
|
|
952
|
|
0
|
|
949
|
|
3
|
|
||||||||||
|
Interest receivable
|
1,536
|
|
1,536
|
|
0
|
|
1,536
|
|
0
|
|
||||||||||
|
Other investments
(1)
|
1,689
|
|
1,689
|
|
0
|
|
1,680
|
|
9
|
|
||||||||||
|
Financial liabilities:
|
||||||||||||||||||||
|
Deposits
|
243,702
|
|
243,732
|
|
26,404
|
|
217,328
|
|
0
|
|
||||||||||
|
Securitized debt obligations
|
20,010
|
|
20,122
|
|
0
|
|
20,122
|
|
0
|
|
||||||||||
|
Senior and subordinated notes
|
30,755
|
|
31,392
|
|
0
|
|
31,392
|
|
0
|
|
||||||||||
|
Federal funds purchased and securities loaned or sold under agreements to repurchase
|
576
|
|
576
|
|
0
|
|
576
|
|
0
|
|
||||||||||
|
Other borrowings
(2)
|
8,892
|
|
8,892
|
|
0
|
|
8,892
|
|
0
|
|
||||||||||
|
Interest payable
|
413
|
|
413
|
|
0
|
|
413
|
|
0
|
|
||||||||||
|
|
December 31, 2016
|
|||||||||||||||||||
|
Carrying
Value
|
Estimated
Fair Value
|
Estimated Fair Value Hierarchy
|
||||||||||||||||||
|
(Dollars in millions)
|
Level 1
|
Level 2
|
Level 3
|
|||||||||||||||||
|
Financial assets:
|
||||||||||||||||||||
|
Cash and cash equivalents
|
$
|
9,976
|
|
$
|
9,976
|
|
$
|
4,185
|
|
$
|
5,791
|
|
$
|
0
|
|
|||||
|
Restricted cash for securitization investors
|
2,517
|
|
2,517
|
|
2,517
|
|
0
|
|
0
|
|
||||||||||
|
Securities held to maturity
|
25,712
|
|
26,196
|
|
199
|
|
25,962
|
|
35
|
|
||||||||||
|
Net loans held for investment
|
239,083
|
|
242,935
|
|
0
|
|
0
|
|
242,935
|
|
||||||||||
|
Loans held for sale
|
1,043
|
|
1,038
|
|
0
|
|
1,038
|
|
0
|
|
||||||||||
|
Interest receivable
|
1,351
|
|
1,351
|
|
0
|
|
1,351
|
|
0
|
|
||||||||||
|
Other investments
(1)
|
2,029
|
|
2,029
|
|
0
|
|
2,020
|
|
9
|
|
||||||||||
|
Financial liabilities:
|
||||||||||||||||||||
|
Deposits
|
236,768
|
|
237,082
|
|
25,502
|
|
211,580
|
|
0
|
|
||||||||||
|
Securitized debt obligations
|
18,826
|
|
18,920
|
|
0
|
|
18,920
|
|
0
|
|
||||||||||
|
Senior and subordinated notes
|
23,431
|
|
23,774
|
|
0
|
|
23,774
|
|
0
|
|
||||||||||
|
Federal funds purchased and securities loaned or sold under agreements to repurchase
|
992
|
|
992
|
|
0
|
|
992
|
|
0
|
|
||||||||||
|
Other borrowings
|
17,211
|
|
17,180
|
|
0
|
|
17,180
|
|
0
|
|
||||||||||
|
Interest payable
|
327
|
|
327
|
|
0
|
|
327
|
|
0
|
|
||||||||||
|
(1)
|
Other investments includes FHLB, Federal Reserve stock and cost method investments. These investments are included in other assets on our consolidated balance sheets.
|
|
(2)
|
Other borrowings excludes capital lease obligations.
|
|
212
|
Capital One Financial Corporation (COF)
|
|
|
|
Our principal operations are currently organized into
three
major business segments, which are defined based on the products and services provided or the type of customer served: Credit Card, Consumer Banking and Commercial Banking. The operations of acquired businesses have been integrated into our existing business segments. Certain activities that are not part of a segment,
such as management of our corporate investment portfolio and asset/liability management by our centralized Corporate Treasury group, are included in the Other category.
|
•
|
Credit Card:
Consists of our domestic consumer and small business card lending, and international card businesses in Canada and the United Kingdom.
|
|
•
|
Consumer Banking:
Consists of our branch-based lending and deposit gathering activities for consumers and small businesses, national deposit gathering, national auto lending and our consumer home loan portfolio and associated servicing activities.
|
|
•
|
Commercial Banking:
Consists of our lending, deposit gathering, capital markets and treasury management services to commercial real estate and commercial and industrial customers. Our commercial and industrial customers typically include companies with annual revenues between
$20 million
and
$2 billion
.
|
|
•
|
Other category:
Includes the residual impact of the allocation of our centralized Corporate Treasury group activities, such as management of our corporate investment portfolio and asset/liability management, to our business segments. Accordingly, net gains and losses on our investment securities portfolio and certain trading activities are included in the Other category. Other category also includes foreign exchange-rate fluctuations on foreign currency-denominated transactions; unallocated corporate expenses that do not directly support the operations of the business segments or for which the business segments are not considered financially accountable in evaluating their performance, such as certain restructuring charges; certain material items that are non-recurring in nature; offsets related to certain line-item reclassifications; and
residual tax expense or benefit to arrive at the consolidated effective tax rate that is not assessed to our primary business segments
.
|
Basis of Presentation
We report the results of each of our business segments on a continuing operations basis. See “
Note 2—
Business Developments and Discontinued Operations
” for a discussion of our discontinued operations. The results of our individual businesses reflect the manner in which management evaluates performance and makes decisions about funding our operations and allocating resources.
Business Segment Reporting Methodology
The results of our business segments are intended to present each segment as if it were a stand-alone business. Our internal management and reporting process used to derive our segment results employs various allocation methodologies, including funds transfer pricing, to assign certain balance sheet assets, deposits and other liabilities and their related revenue and expenses directly or indirectly attributable to each business segment. Our funds transfer pricing process provides a funds credit for sources of funds, such as deposits generated by our Consumer Banking and Commercial Banking businesses, and a funds charge for the use of funds by each segment. Due to the integrated nature of our business segments, estimates and judgments have been made in allocating certain revenue and expense items. Transactions between segments are based on specific criteria or approximate third-party rates. We regularly assess the assumptions, methodologies and reporting classifications used for segment reporting, which may result in the implementation of refinements or changes in future periods.
The following is additional information on the principles and methodologies used in preparing our business segment results.
|
•
|
Net interest income:
Interest income from loans held for investment and interest expense from deposits and other interest-bearing liabilities are reflected within each applicable business segment. Because funding and asset/liability management are managed centrally by our Corporate Treasury group, net interest income for our business segments also includes the results of a funds transfer pricing process that is intended to allocate a cost of funds used or credit for funds provided to all business segment assets and liabilities, respectively, using a matched funding concept. The taxable-equivalent benefit of tax-exempt products is also allocated to each business unit with a corresponding increase in income tax expense.
|
|
213
|
Capital One Financial Corporation (COF)
|
|
|
•
|
Non-interest income:
Non-interest fees and other revenue associated with loans or customers managed by each business segment and other direct revenues are accounted for within each business segment.
|
|
•
|
Provision for credit losses:
The provision for credit losses is directly attributable to the business segment in accordance with the loans each business segment manages.
|
|
•
|
Non-interest expense:
Non-interest expenses directly managed and incurred by a business segment are accounted for within each business segment. We allocate certain non-interest expenses indirectly incurred by business segments, such as corporate support functions, to each business segment based on various factors, including the actual cost of the services from the service providers, the utilization of the services, the number of employees or other relevant factors.
|
|
•
|
Goodwill and intangible assets:
Goodwill and intangible assets that are not directly attributable to business segments are assigned to business segments based on the relative fair value of each segment. Intangible amortization is included in the results of the applicable segment.
|
|
•
|
Income taxes:
Income taxes are assessed for each business segment based on a standard tax rate with the residual tax expense or benefit to arrive at the consolidated effective tax rate included in the Other category.
|
|
•
|
Loans held for investment:
Loans are reported within each business segment based on product or customer type served by that business segment.
|
|
•
|
Deposits:
Deposits are reported within each business segment based on product or customer type served by that business segment.
|
Segment Results and Reconciliation
We may periodically change our business segments or reclassify business segment results based on modifications to our management reporting methodologies or changes in organizational alignment. The following tables present our business segment results for
the years ended December 31, 2017, 2016 and 2015
, selected balance sheet data as of
December 31, 2017
,
2016
and
2015
, and a reconciliation of our total business segment results to our reported consolidated income from continuing operations, loans held for investment and deposits.
|
214
|
Capital One Financial Corporation (COF)
|
|
Table
18.1
: Segment Results and Reconciliation
|
|
Year Ended December 31, 2017
|
|||||||||||||||||||
|
(Dollars in millions)
|
Credit
Card |
Consumer
Banking |
Commercial
Banking (1) |
Other
(1)
|
Consolidated
Total |
|||||||||||||||
|
Net interest income
|
$
|
13,648
|
|
$
|
6,380
|
|
$
|
2,261
|
|
$
|
171
|
|
$
|
22,460
|
|
|||||
|
Non-interest income
|
3,325
|
|
749
|
|
708
|
|
(5
|
)
|
4,777
|
|
||||||||||
|
Total net revenue
|
16,973
|
|
7,129
|
|
2,969
|
|
166
|
|
27,237
|
|
||||||||||
|
Provision for credit losses
|
6,066
|
|
1,180
|
|
301
|
|
4
|
|
7,551
|
|
||||||||||
|
Non-interest expense
|
7,916
|
|
4,233
|
|
1,603
|
|
442
|
|
14,194
|
|
||||||||||
|
Income (loss) from continuing operations before income taxes
|
2,991
|
|
1,716
|
|
1,065
|
|
(280
|
)
|
5,492
|
|
||||||||||
|
Income tax provision
|
1,071
|
|
626
|
|
389
|
|
1,289
|
|
3,375
|
|
||||||||||
|
Income (loss) from continuing operations, net of tax
|
$
|
1,920
|
|
$
|
1,090
|
|
$
|
676
|
|
$
|
(1,569
|
)
|
$
|
2,117
|
|
|||||
|
Loans held for investment
|
$
|
114,762
|
|
$
|
75,078
|
|
$
|
64,575
|
|
$
|
58
|
|
$
|
254,473
|
|
|||||
|
Deposits
|
0
|
|
185,842
|
|
33,938
|
|
23,922
|
|
243,702
|
|
||||||||||
|
Year Ended December 31, 2016
|
||||||||||||||||||||
|
(Dollars in millions)
|
Credit
Card |
Consumer
Banking |
Commercial
Banking (1) |
Other
(1)
|
Consolidated
Total |
|||||||||||||||
|
Net interest income
|
$
|
12,635
|
|
$
|
5,829
|
|
$
|
2,216
|
|
$
|
193
|
|
$
|
20,873
|
|
|||||
|
Non-interest income
|
3,380
|
|
733
|
|
578
|
|
(63
|
)
|
4,628
|
|
||||||||||
|
Total net revenue
|
16,015
|
|
6,562
|
|
2,794
|
|
130
|
|
25,501
|
|
||||||||||
|
Provision (benefit) for credit losses
|
4,926
|
|
1,055
|
|
483
|
|
(5
|
)
|
6,459
|
|
||||||||||
|
Non-interest expense
|
7,703
|
|
4,139
|
|
1,407
|
|
309
|
|
13,558
|
|
||||||||||
|
Income (loss) from continuing operations before income taxes
|
3,386
|
|
1,368
|
|
904
|
|
(174
|
)
|
5,484
|
|
||||||||||
|
Income tax provision (benefit)
|
1,226
|
|
498
|
|
329
|
|
(339
|
)
|
1,714
|
|
||||||||||
|
Income from continuing operations, net of tax
|
$
|
2,160
|
|
$
|
870
|
|
$
|
575
|
|
$
|
165
|
|
$
|
3,770
|
|
|||||
|
Loans held for investment
|
$
|
105,552
|
|
$
|
73,054
|
|
$
|
66,916
|
|
$
|
64
|
|
$
|
245,586
|
|
|||||
|
Deposits
|
0
|
|
181,917
|
|
33,866
|
|
20,985
|
|
236,768
|
|
||||||||||
|
Year Ended December 31, 2015
|
||||||||||||||||||||
|
(Dollars in millions)
|
Credit
Card
|
Consumer
Banking
|
Commercial
Banking (1) |
Other
(1)
|
Consolidated
Total
|
|||||||||||||||
|
Net interest income
|
$
|
11,161
|
|
$
|
5,755
|
|
$
|
1,865
|
|
$
|
53
|
|
$
|
18,834
|
|
|||||
|
Non-interest income
|
3,421
|
|
710
|
|
487
|
|
(39
|
)
|
4,579
|
|
||||||||||
|
Total net revenue
|
14,582
|
|
6,465
|
|
2,352
|
|
14
|
|
23,413
|
|
||||||||||
|
Provision (benefit) for credit losses
|
3,417
|
|
819
|
|
302
|
|
(2
|
)
|
4,536
|
|
||||||||||
|
Non-interest expense
|
7,502
|
|
4,026
|
|
1,156
|
|
312
|
|
12,996
|
|
||||||||||
|
Income (loss) from continuing operations before income taxes
|
3,663
|
|
1,620
|
|
894
|
|
(296
|
)
|
5,881
|
|
||||||||||
|
Income tax provision (benefit)
|
1,309
|
|
586
|
|
324
|
|
(350
|
)
|
1,869
|
|
||||||||||
|
Income from continuing operations, net of tax
|
$
|
2,354
|
|
$
|
1,034
|
|
$
|
570
|
|
$
|
54
|
|
$
|
4,012
|
|
|||||
|
Loans held for investment
|
$
|
96,125
|
|
$
|
70,372
|
|
$
|
63,266
|
|
$
|
88
|
|
$
|
229,851
|
|
|||||
|
Deposits
|
0
|
|
172,702
|
|
34,257
|
|
10,762
|
|
217,721
|
|
||||||||||
__________
|
(1)
|
Some of our commercial investments generate tax-exempt income or tax credits. Accordingly, we make certain reclassifications within our Commercial Banking business results to present revenues and yields on a taxable-equivalent basis, calculated assuming an effective tax rate approximately equal to our federal statutory tax rate (35% for all periods presented), with offsetting reductions to the Other category.
|
|
215
|
Capital One Financial Corporation (COF)
|
|
|
|
Commitments to Lend
Our unfunded lending commitments primarily consist of credit card lines, loan commitments to customers of both our Commercial Banking and Consumer Banking businesses, as well as standby and commercial letters of credit. These commitments, other than credit card lines, are legally binding conditional agreements that have fixed expirations or termination dates and specified interest rates and purposes. The contractual amount of these commitments represents the maximum possible credit risk to us should the counterparty draw upon the commitment. We generally manage the potential risk of unfunded lending commitments by limiting the total amount of arrangements, monitoring the size and maturity structure of these portfolios and applying the same credit standards for all of our credit activities.
For unused credit card lines, we have not experienced and do not anticipate that all of our customers will access their entire available line at any given point in time. Commitments to extend credit other than credit card lines generally require customers to maintain certain credit standards. Collateral requirements and loan-to-value (“LTV”) ratios are the same as those for funded transactions and are established based on management’s credit assessment of the customer. These commitments may expire without being drawn upon; therefore, the total commitment amount does not necessarily represent future funding requirements.
We also issue letters of credit, such as financial standby, performance standby and commercial letters of credit, to meet the financing needs of our customers. Standby letters of credit are conditional commitments issued by us to guarantee the performance of a customer to a third party in a borrowing arrangement. Commercial letters of credit are short-term commitments issued primarily to facilitate trade finance activities for customers and are generally collateralized by the goods being shipped to the client. These collateral requirements are similar to those for funded transactions and are established based on management’s credit assessment of the customer. Management conducts regular reviews of all outstanding letters of credit and the results of these reviews are considered in assessing the adequacy of reserves for unfunded lending commitments.
The following table presents contractual amount and carrying value of our unfunded lending commitments as of
December 31, 2017
and
2016
. The carrying value represents our reserve and deferred revenue on legally binding commitments.
Table
19.1
: Unfunded Lending Commitments: Contractual Amount and Carrying Value
|
Contractual Amount
|
Carrying Value
|
|||||||||||||||
|
(Dollars in millions)
|
December 31,
2017 |
December 31,
2016 |
December 31,
2017 |
December 31,
2016 |
||||||||||||
|
Standby letter of credit and commercial letter of credit
(1)
|
$
|
2,046
|
|
$
|
1,936
|
|
$
|
43
|
|
$
|
42
|
|
||||
|
Credit card lines
|
351,481
|
|
312,864
|
|
N/A
|
|
N/A
|
|
||||||||
|
Other loan commitments
(2)
|
31,840
|
|
28,402
|
|
84
|
|
98
|
|
||||||||
|
Total unfunded lending commitments
|
$
|
385,367
|
|
$
|
343,202
|
|
$
|
127
|
|
$
|
140
|
|
||||
__________
|
(1)
|
These financial guarantees have expiration dates ranging from 2018 to 2025 as of
December 31, 2017
.
|
|
(2)
|
Includes
$1.0 billion
and
$699 million
of advised lines of credit as of
December 31, 2017
and
2016
, respectively.
|
Loss Sharing Agreements and Other Obligations
Within our Commercial Banking business, we originate multifamily commercial real estate loans with the intent to sell them to the GSEs. We enter into loss sharing agreements with the GSEs upon the sale of the loans. At inception, we record a liability representing the fair value of our obligation which is subsequently amortized as we are released from risk of payment under the loss sharing agreement. If payment under the loss sharing agreement becomes probable and estimable, an additional liability may be recorded on the consolidated balance sheets and a non-interest expense may be recognized in the consolidated statements of income. The liability recognized on our consolidated balance sheets for our loss sharing agreements was
$60 million
and
$48 million
as of
December 31, 2017
and
2016
, respectively.
|
216
|
Capital One Financial Corporation (COF)
|
|
Prior to October 2017, we had an obligation to exercise mandatory clean-up calls related to the discontinued manufactured housing operations of GreenPoint Credit, LLC, a subsidiary of GreenPoint, in the event that our third-party servicer could not fulfill its obligations.
On October 10, 2017, we entered into an agreement with the third-party servicer under which we assumed the mandatory obligation to exercise the remaining clean-up calls as they become due on certain securitization transactions.
As a result of this agreement, we recognized the loan receivables and a corresponding liability on our consolidated balance sheets. During November 2017, we entered into a forward sale agreement pursuant to which we will sell the underlying loans to a third-party purchaser as the clean-up calls are exercised.
Based on the current information and estimates, we expect that we will incur a loss when each clean-up call is exercised, and have recorded a liability of
$78 million
associated with these clean-up call obligations as of December 31, 2017. See “
Note 6—Variable Interest Entities and Securitizations
” for information related to these transactions.
U.K. Payment Protection Insurance
In the U.K., we previously sold payment protection insurance (“PPI”). In response to an elevated level of customer complaints across the industry, heightened media coverage and pressure from consumer advocacy groups, the U.K. Financial Conduct Authority (“FCA”), formerly the Financial Services Authority, investigated and raised concerns about the way the industry has handled complaints related to the sale of these insurance policies. For the past several years, the U.K.’s Financial Ombudsman Service (“FOS”) has been adjudicating customer complaints relating to PPI, escalated to it by consumers who disagree with the rejection of their complaint by firms, leading to customer remediation payments by us and others within the industry. On March 2, 2017, the FCA issued a statement that sets out final rules and guidance on the PPI complaints deadline, which has been set as August 29, 2019. The statement also provides clarity on how to handle PPI complaints under s.140A of the Consumer Credit Act, including guidance on how redress for such complaints should be calculated. The final rules and guidance came into force on August 29, 2017.
In determining our best estimate of incurred losses for future remediation payments, management considers numerous factors, including (i) the number of customer complaints we expect in the future; (ii) our expectation of upholding those complaints; (iii) the expected number of complaints customers escalate to the FOS; (iv) our expectation of the FOS upholding such escalated complaints; (v) the number of complaints that fall under the s.140A of the Consumer Credit Act; and (vi) the estimated remediation payout to customers. We monitor these factors each quarter and adjust our reserves to reflect the latest data.
Management’s best estimate of incurred losses related to U.K. PPI totaled
$249 million
and
$238 million
as of
December 31, 2017
and
December 31, 2016
, respectively. In 2017, the reserve has been increased by
$130 million
in response to the above FCA statement and the commencement of the final rules and guidance. Other movements were due to a combination of utilization of the reserve through customer refund payments and foreign exchange movements. Our best estimate of reasonably possible future losses beyond our reserve as of
December 31, 2017
is approximately
$150 million
.
Litigation
In accordance with the current accounting standards for loss contingencies, we establish reserves for litigation related matters that arise from the ordinary course of our business activities when it is probable that a loss associated with a claim or proceeding has been incurred and the amount of the loss can be reasonably estimated. None of the amounts we currently have recorded individually or in the aggregate are considered to be material to our financial condition. Litigation claims and proceedings of all types are subject to many uncertain factors that generally cannot be predicted with assurance. Below we provide a description of potentially material legal proceedings and claims.
For some of the matters disclosed below, we are able to estimate reasonably possible losses above existing reserves, and for other disclosed matters, such an estimate is not possible at this time. For those matters below where an estimate is possible, management currently estimates the reasonably possible future losses beyond our reserves as of
December 31, 2017
is approximately
$550 million
, which includes estimates related to Mortgage Representation and Warranty exposure. Our reserve and reasonably possible loss estimates involve considerable judgment and reflect that there is still significant uncertainty regarding numerous factors that may impact the ultimate loss levels. Notwithstanding our attempt to estimate a reasonably possible range of loss beyond our current accrual levels for some litigation matters based on current information, it is possible that actual future losses will exceed both the current accrual level and the range of reasonably possible losses disclosed here. Given the inherent uncertainties involved in these matters, especially those involving governmental agencies, and the very large or indeterminate damages sought in some of these matters, there is significant uncertainty as to the ultimate liability we may incur from these litigation matters and an adverse outcome in one or more of these matters could be material to our results of operations or cash flows for any particular reporting period.
|
217
|
Capital One Financial Corporation (COF)
|
|
Interchange
In 2005, a number of entities, each purporting to represent a class of retail merchants, filed antitrust lawsuits against MasterCard and Visa and several member banks, including our subsidiaries and us, alleging among other things, that the defendants conspired to fix the level of interchange fees. The complaints seek injunctive relief and civil monetary damages, which could be trebled. Separately, a number of large merchants have asserted similar claims against Visa and MasterCard only (together with the lawsuits described above, “Interchange Lawsuits”). In October 2005, the class and merchant Interchange Lawsuits were consolidated before the U.S. District Court for the Eastern District of New York for certain purposes, including discovery. In July 2012, the parties executed and filed with the court a Memorandum of Understanding agreeing to resolve the litigation on certain terms set forth in a settlement agreement attached to the Memorandum. The class settlement provides for, among other things, (i) payments by defendants to the class and individual plaintiffs totaling approximately
$6.6 billion
; (ii) a distribution to the class merchants of an amount equal to 10 basis points of certain interchange transactions for a period of
eight months
; and (iii) modifications to certain Visa and MasterCard rules regarding point of sale practices. In December 2013, the district court granted final approval of the proposed class settlement, which was appealed to the Second Circuit Court of Appeals in January 2014. On June 30, 2016, the Second Circuit Court of Appeals vacated the district court’s certification of the class, reversed approval of the proposed class settlement, and remanded the litigation to the district court for further proceedings, ruling that some of the merchants that were part of the proposed class settlement were not adequately represented. Because the Second Circuit ruling remands the litigation to the district court for further proceedings, the ultimate outcome in this matter is uncertain. Several merchant plaintiffs also opted out of the class settlement before it was overturned, and some of those plaintiffs have sued MasterCard, Visa and various member banks, including Capital One. The opt-out cases are consolidated before the U.S. District Court for the Eastern District of New York for certain purposes, including discovery. Visa and MasterCard have settled a number of individual opt-out cases, requiring non-material payments from all banks, including Capital One. Separate settlement and judgment sharing agreements between Capital One, MasterCard and Visa allocate the liabilities of any judgment or settlement arising from the Interchange Lawsuits and associated opt-out cases. Visa created a litigation escrow account following its IPO of stock in 2008, which funds any settlements for its member banks, and any settlements related to MasterCard allocated losses are reflected in Capital One’s reserves.
Mortgage Representation and Warranty
We face residual exposure related to subsidiaries that originated residential mortgage loans and sold these loans to various purchasers, including purchasers who created securitization trusts. In connection with their sales of mortgage loans, these subsidiaries entered into agreements containing varying representations and warranties about, among other things, the ownership of the loan, the validity of the lien securing the loan, the loan’s compliance with any applicable criteria established by the purchaser, including underwriting guidelines and the existence of mortgage insurance, and the loan’s compliance with applicable federal, state and local laws. Each of these subsidiaries may be required to repurchase mortgage loans, or indemnify certain purchasers and others against losses they incur, in the event of certain breaches of these representations and warranties.
The substantial majority of our representation and warranty exposure has been resolved through litigation, and our remaining representation and warranty exposure is almost entirely litigation-related. Accordingly, we establish litigation reserves for representation and warranty losses that we consider to be both probable and reasonably estimable. The reserve process relies heavily on estimates, which are inherently uncertain, and requires the application of judgment. Our reserves and estimates of reasonably possible losses could be impacted by claims which may be brought by securitization trustees and sponsors, bond-insurers, investors, and GSEs, as well as claims brought by governmental agencies under the Financial Institutions Reform, Recovery and Enforcement Act (“FIRREA”), the False Claims Act or other federal or state statutes.
In February 2009, GreenPoint was named as a defendant in a lawsuit commenced in the New York County Supreme Court, by U.S. Bank, N. A., Syncora Guarantee Inc. and CIFG Assurance North America, Inc. (“U.S. Bank Litigation”). Plaintiffs alleged, among other things, that GreenPoint breached certain representations and warranties in
two
contracts pursuant to which GreenPoint sold approximately
30,000
mortgage loans having an aggregate original principal balance of approximately $
1.8 billion
to a purchaser that ultimately transferred most of these mortgage loans to a securitization trust. Some of the securities issued by the trust were insured by Syncora and CIFG. Plaintiffs sought unspecified damages and an order compelling GreenPoint to repurchase the entire portfolio of
30,000
mortgage loans based on alleged breaches of representations and warranties relating to a limited sampling of loans in the portfolio, or, alternatively, the repurchase of specific mortgage loans to which the alleged breaches of representations and warranties relate. GreenPoint resolved the U.S. Bank litigation with U.S. Bank, Syncora and CIFG (and its successor) for a total of
$540 million
in December 2017. Included in discontinued operations is a pre-tax charge of
$169
million related to this settlement, which represents amounts above previously recognized reserves.
|
218
|
Capital One Financial Corporation (COF)
|
|
In May, June and July 2012, the Federal Housing Finance Agency (“FHFA”) (acting as conservator for Freddie Mac) filed
three
summonses with notice in the New York state court against GreenPoint, on behalf of the trustees for
three
RMBS trusts backed by loans originated by GreenPoint with an aggregate original principal balance of
$3.4 billion
. In January 2013, the plaintiffs filed an amended consolidated complaint in the name of the three trusts, acting by the respective trustees, alleging breaches of contractual representations and warranties regarding compliance with GreenPoint underwriting guidelines relating to certain loans (“FHFA Litigation”). Plaintiffs seek specific performance of the repurchase obligations with respect to the loans for which they have provided notice of alleged breaches as well as all other allegedly breaching loans, rescissory damages, indemnification, costs and interest. On March 29, 2017, the trial court granted GreenPoint’s motion for summary judgment and dismissed plaintiff’s claims as untimely. In May 2017, the plaintiff appealed the dismissal to the Second Circuit.
Anti-Money Laundering
Capital One is being investigated by the New York District Attorney’s Office (“NYDA”), the Department of Justice and the Financial Crimes Enforcement Network (“FinCEN”) of the U.S. Department of Treasury with respect to certain former check casher clients of the Commercial Banking business and Capital One’s anti-money laundering (“AML”) program. Capital One is cooperating with all agencies involved in the investigation.
In addition, Capital One is subject to an open consent order with the OCC dated July 10, 2015 concerning regulatory deficiencies in our AML program.
Other Pending and Threatened Litigation
In addition, we are commonly subject to various pending and threatened legal actions relating to the conduct of our normal business activities. In the opinion of management, the ultimate aggregate liability, if any, arising out of all such other pending or threatened legal actions will not be material to our consolidated financial position or our results of operations.
|
219
|
Capital One Financial Corporation (COF)
|
|
|
|
Financial Information
The following parent company only financial statements are prepared in accordance with Regulation S-X of the U.S. Securities and Exchange Commission (“SEC”).
Table
20.1
: Parent Company Statements of Income
|
|
Year Ended December 31,
|
|||||||||||
|
(Dollars in millions)
|
2017
|
2016
|
2015
|
|||||||||
|
Interest income
|
$
|
178
|
|
$
|
120
|
|
$
|
120
|
|
|||
|
Interest expense
|
381
|
|
258
|
|
185
|
|
||||||
|
Dividends from subsidiaries
|
300
|
|
3,936
|
|
450
|
|
||||||
|
Non-interest income (loss)
|
19
|
|
(13
|
)
|
10
|
|
||||||
|
Non-interest expense
|
34
|
|
48
|
|
178
|
|
||||||
|
Income before income taxes and equity in undistributed earnings of subsidiaries
|
82
|
|
3,737
|
|
217
|
|
||||||
|
Income tax provision (benefit)
|
(103
|
)
|
(79
|
)
|
(67
|
)
|
||||||
|
Equity in undistributed earnings of subsidiaries
|
1,797
|
|
(65
|
)
|
3,766
|
|
||||||
|
Net income
|
1,982
|
|
3,751
|
|
4,050
|
|
||||||
|
Other comprehensive income (loss), net of tax
|
23
|
|
(333
|
)
|
(186
|
)
|
||||||
|
Comprehensive income
|
$
|
2,005
|
|
$
|
3,418
|
|
$
|
3,864
|
|
|||
Table
20.2
: Parent Company Balance Sheets
|
|
December 31,
|
|||||||
|
(Dollars in millions)
|
2017
|
2016
|
||||||
|
Assets:
|
||||||||
|
Cash and cash equivalents
|
$
|
8,196
|
|
$
|
7,296
|
|
||
|
Investments in subsidiaries
|
54,712
|
|
48,297
|
|
||||
|
Loans to subsidiaries
|
548
|
|
592
|
|
||||
|
Securities available for sale
|
907
|
|
901
|
|
||||
|
Other assets
|
729
|
|
672
|
|
||||
|
Total assets
|
$
|
65,092
|
|
$
|
57,758
|
|
||
|
Liabilities:
|
||||||||
|
Senior and subordinated notes
|
$
|
14,392
|
|
$
|
8,304
|
|
||
|
Borrowings from subsidiaries
|
1,633
|
|
1,610
|
|
||||
|
Accrued expenses and other liabilities
|
337
|
|
330
|
|
||||
|
Total liabilities
|
16,362
|
|
10,244
|
|
||||
|
Total stockholders’ equity
|
48,730
|
|
47,514
|
|
||||
|
Total liabilities and stockholders’ equity
|
$
|
65,092
|
|
$
|
57,758
|
|
||
|
220
|
Capital One Financial Corporation (COF)
|
|
Table
20.3
: Parent Company Statements of Cash Flows
|
|
Year Ended December 31,
|
|||||||||||
|
(Dollars in millions)
|
2017
|
2016
|
2015
|
|||||||||
|
Operating activities:
|
||||||||||||
|
Net income
|
$
|
1,982
|
|
$
|
3,751
|
|
$
|
4,050
|
|
|||
|
Adjustments to reconcile net income to net cash provided by operating activities:
|
||||||||||||
|
Equity in undistributed earnings of subsidiaries
|
(1,797
|
)
|
65
|
|
(3,766
|
)
|
||||||
|
Other operating activities
|
327
|
|
(10
|
)
|
(300
|
)
|
||||||
|
Net cash from operating activities
|
512
|
|
3,806
|
|
(16
|
)
|
||||||
|
Investing activities:
|
||||||||||||
|
Net payments (to) from subsidiaries
|
(4,956
|
)
|
(163
|
)
|
(172
|
)
|
||||||
|
Proceeds from paydowns and maturities of securities available for sale
|
130
|
|
71
|
|
65
|
|
||||||
|
Changes in loans to subsidiaries
|
44
|
|
(71
|
)
|
973
|
|
||||||
|
Net cash from investing activities
|
(4,782
|
)
|
(163
|
)
|
866
|
|
||||||
|
Financing activities:
|
||||||||||||
|
Borrowings:
|
||||||||||||
|
Changes in borrowings from subsidiaries
|
23
|
|
19
|
|
18
|
|
||||||
|
Issuance of senior and subordinated notes
|
6,948
|
|
1,487
|
|
2,487
|
|
||||||
|
Proceeds from paydowns and maturities of senior and subordinated notes
|
(804
|
)
|
(1,750
|
)
|
(2,625
|
)
|
||||||
|
Common stock:
|
||||||||||||
|
Net proceeds from issuances
|
164
|
|
131
|
|
111
|
|
||||||
|
Dividends paid
|
(780
|
)
|
(812
|
)
|
(816
|
)
|
||||||
|
Preferred stock:
|
||||||||||||
|
Net proceeds from issuances
|
0
|
|
1,066
|
|
1,472
|
|
||||||
|
Dividends paid
|
(265
|
)
|
(214
|
)
|
(158
|
)
|
||||||
|
Purchases of treasury stock
|
(240
|
)
|
(3,661
|
)
|
(2,441
|
)
|
||||||
|
Proceeds from share-based payment activities
|
124
|
|
142
|
|
85
|
|
||||||
|
Net cash from financing activities
|
5,170
|
|
(3,592
|
)
|
(1,867
|
)
|
||||||
|
Changes in cash and cash equivalents
|
900
|
|
51
|
|
(1,017
|
)
|
||||||
|
Cash and cash equivalents at beginning of year
|
7,296
|
|
7,245
|
|
8,262
|
|
||||||
|
Cash and cash equivalents at end of year
|
$
|
8,196
|
|
$
|
7,296
|
|
$
|
7,245
|
|
|||
|
221
|
Capital One Financial Corporation (COF)
|
|
|
|
In the ordinary course of business, we may have loans issued to our executive officers, directors and principal stockholders. Pursuant to our policy, such loans are issued on the same terms as those prevailing at the time for comparable loans to unrelated persons and do not involve more than the normal risk of collectability.
|
222
|
Capital One Financial Corporation (COF)
|
|
Item 9.
Changes in and Disagreements with Accountants on Accounting and Financial Disclosure
None.
Item 9A.
Controls and Procedures
Overview
We are required under applicable laws and regulations to maintain controls and procedures, which include disclosure controls and procedures as well as internal control over financial reporting, as further described below.
(a) Disclosure Controls and Procedures
Disclosure controls and procedures refer to controls and other procedures designed to provide reasonable assurance that information required to be disclosed in our financial reports is recorded, processed, summarized and reported within the time periods specified by the U.S. Securities and Exchange Commission (“SEC”) rules and forms and that such information is accumulated and communicated to management, including our Chief Executive Officer and Chief Financial Officer, as appropriate, to allow timely decisions regarding our required disclosure. In designing and evaluating our disclosure controls and procedures, we recognize that any controls and procedures, no matter how well designed and operated, can provide only reasonable assurance of achieving the desired control objectives, and we must apply judgment in evaluating and implementing possible controls and procedures.
Evaluation of Disclosure Controls and Procedures
As required by Rule 13a-15 of the Securities Exchange Act of 1934 (the “Exchange Act”), our management, including the Chief Executive Officer and Chief Financial Officer, conducted an evaluation of the effectiveness of our disclosure controls and procedures (as that term is defined in Rules 13a-15(e) and 15d-15(e) of the Exchange Act) as of
December 31, 2017
, the end of the period covered by this Annual Report on Form 10-K. Based upon that evaluation, the Chief Executive Officer and Chief Financial Officer concluded that our disclosure controls and procedures were effective as of
December 31, 2017
, at a reasonable level of assurance, in recording, processing, summarizing and reporting information required to be disclosed within the time periods specified by the SEC rules and forms.
(b) Changes in Internal Control Over Financial Reporting
We regularly review our disclosure controls and procedures and make changes intended to ensure the quality of our financial reporting. There have been no changes in internal control over financial reporting that occurred during the fourth quarter of 2017 which have materially affected, or are reasonably likely to materially affect, the Company’s internal control over financial reporting.
(c) Management’s Report on Internal Control Over Financial Reporting
Management’s Report on Internal Control Over Financial Reporting is included in “Part II—Item 8. Financial Statements and Supplementary Data” and is incorporated herein by reference. The Report of Independent Registered Public Accounting Firm on Internal Control Over Financial Reporting also is included in “Part II—Item 8. Financial Statements and Supplementary Data” and incorporated herein by reference.
Item 9B.
Other Information
None.
|
223
|
Capital One Financial Corporation (COF)
|
|
Item 10.
Directors, Executive Officers and Corporate Governance
The information required by Item 10 will be included in our Proxy Statement for the 2018 Annual Stockholder Meeting (“Proxy Statement”) under the headings “Corporate Governance at Capital One” and “Section 16(a) Beneficial Ownership Reporting Compliance,” and is incorporated herein by reference. The Proxy Statement will be filed with the Securities and Exchange Commission pursuant to Regulation 14A within 120 days of the end of our
2017
fiscal year.
Item 11.
Executive Compensation
The information required by Item 11 will be included in the Proxy Statement under the headings “Director Compensation,” “Compensation Discussion and Analysis,” “Named Executive Officer Compensation,” “Compensation Committee Interlocks and Insider Participation” and “Compensation Committee Report,” and is incorporated herein by reference.
Item 12.
Security Ownership of Certain Beneficial Owners and Management and Related Stockholder Matters
The information required by Item 12 will be included in the Proxy Statement under the headings “Security Ownership” and “Equity Compensation Plans,” and is incorporated herein by reference.
Item 13.
Certain Relationships and Related Transactions and Director Independence
The information required by Item 13 will be included in the Proxy Statement under the headings “Related Person Transactions” and “Director Independence,” and is incorporated herein by reference.
Item 14.
Principal Accountant Fees and Services
The information required by Item 14 will be included in the Proxy Statement under the heading “Ratification of Selection of Independent Auditors,” and is incorporated herein by reference.
|
224
|
Capital One Financial Corporation (COF)
|
|
Item 15.
Exhibits, Financial Statements Schedules
(a) Financial Statement Schedules
The following documents are filed as part of this Annual Report in Part II, Item 8 and are incorporated herein by reference.
|
(1)
|
Management’s Report on Internal Control Over Financial Reporting
|
Report of Independent Registered Public Accounting Firm on Internal Control Over Financial Reporting
Report of Independent Registered Public Accounting Firm on the Consolidated Financial Statements
Consolidated Financial Statements:
Consolidated Statements of Income for
the years ended December 31, 2017, 2016 and 2015
Consolidated Statements of Comprehensive Income for
the years ended December 31, 2017, 2016 and 2015
Consolidated Balance Sheets as of
December 31, 2017
and
2016
Consolidated Statements of Changes in Stockholders’ Equity for
the years ended December 31, 2017, 2016 and 2015
Consolidated Statements of Cash Flows for
the years ended December 31, 2017, 2016 and 2015
Notes to Consolidated Financial Statements
|
(2)
|
Schedules
|
None.
(b) Exhibits
An index to exhibits has been filed as part of this Report and is incorporated herein by reference.
Item 16.
Form 10-K Summary
Not applicable.
|
225
|
Capital One Financial Corporation (COF)
|
|
CAPITAL ONE FINANCIAL CORPORATION
ANNUAL REPORT ON FORM 10-K
DATED DECEMBER 31, 2017
Commission File No. 1-13300
The following exhibits are incorporated by reference or filed herewith. References to (i) the “2002 Form 10-K” are to the Company’s Annual Report on Form 10-K for the year ended December 31, 2002, filed on March 17, 2003; (ii) the “2003 Form 10-K” are to the Company’s Annual Report on Form 10-K for the year ended December 31, 2003, filed on March 5, 2004; (iii) the “2004 Form 10-K” are to the Company’s Annual Report on Form 10-K for the year ended December 31, 2004, filed on March 9, 2005; (iv) the “2010 Form 10-K” are to the Company’s Annual Report on Form 10-K for the year ended December 31, 2010, filed on March 1, 2011, as amended on March 7, 2011; (v) the “2011 Form 10-K” are to the Company’s Annual Report on Form 10-K for the year ended December 31, 2011, filed on February 28, 2012; (vi) the “2012 Form 10-K” are to the Company’s Annual Report on Form 10-K for the year ended December 31, 2012, filed on February 28, 2013; (vii) the “2013 Form 10-K” are to the Company’s Annual Report on Form 10-K for the year ended December 31, 2013, filed on February 27, 2014; (viii) the “2014 Form 10-K” are to the Company’s Annual Report on Form 10-K for the year ended December 31, 2014, filed on February 24, 2015; (ix) the “2015 Form 10-K” are to the Company’s Annual Report on Form 10-K for the year ended December 31, 2015, filed on February 25, 2016; and (ix) the “2016 Form 10-K” are to the Company’s Annual Report on Form 10-K for the year ended December 31, 2016, filed on February 23, 2017.
|
Exhibit No.
|
Description
|
|
|
3.1
|
||
|
3.2
|
||
|
3.3.1
|
||
|
3.3.2
|
||
|
3.3.3
|
||
|
3.3.4
|
||
|
3.3.5
|
||
|
3.3.6
|
||
|
3.3.7
|
||
|
4.1.1
|
||
|
4.1.2
|
||
|
4.1.3
|
||
|
4.2
|
Pursuant to Item 601(b)(4)(iii)(A) of Regulation S-K, copies of instruments defining the rights of holders of long-term debt are not filed. The Company agrees to furnish a copy thereof to the SEC upon request.
|
|
|
10.1.1
|
||
|
10.1.2
|
||
|
10.1.3
|
||
|
10.1.4*
|
||
|
10.2.1
|
||
|
226
|
Capital One Financial Corporation (COF)
|
|
|
Exhibit No.
|
Description
|
|
|
10.2.2
|
||
|
10.2.3
|
||
|
10.2.4
|
||
|
10.2.5
|
||
|
10.2.6
|
||
|
10.2.7
|
||
|
10.2.8
|
||
|
10.2.9
|
||
|
10.2.10
|
||
|
10.2.11
|
||
|
10.2.12
|
||
|
10.2.13
|
||
|
10.2.14
|
||
|
10.2.15
|
||
|
10.2.16
|
||
|
10.2.17
|
||
|
10.2.18
|
||
|
10.2.19
|
||
|
10.2.20
|
||
|
10.2.21
|
||
|
227
|
Capital One Financial Corporation (COF)
|
|
|
Exhibit No.
|
Description
|
|
|
10.2.22*
|
||
|
10.2.23*
|
||
|
10.3.1
|
||
|
10.3.2
|
||
|
10.3.3
|
||
|
10.3.4
|
||
|
10.3.5
|
||
|
10.3.6
|
||
|
10.4.1
|
||
|
10.4.2
|
||
|
10.5
|
||
|
10.6.1
|
||
|
10.6.2
|
||
|
10.7.1
|
||
|
10.7.2
|
||
|
10.7.3
|
||
|
10.8.1
|
||
|
10.8.2
|
||
|
10.8.3
|
||
|
10.8.4
|
||
|
10.9
|
||
|
12.1*
|
||
|
21*
|
||
|
23*
|
||
|
31.1*
|
||
|
31.2*
|
||
|
32.1*
|
||
|
32.2*
|
||
|
101.INS*
|
XBRL Instance Document.
|
|
|
101.SCH*
|
XBRL Taxonomy Extension Schema Document.
|
|
|
228
|
Capital One Financial Corporation (COF)
|
|
|
Exhibit No.
|
Description
|
|
|
101.CAL*
|
XBRL Taxonomy Extension Calculation Linkbase Document.
|
|
|
101.DEF*
|
XBRL Taxonomy Extension Definition Linkbase Document.
|
|
|
101.LAB*
|
XBRL Taxonomy Extension Label Linkbase Document.
|
|
|
101.PRE*
|
XBRL Taxonomy Extension Presentation Linkbase Document.
|
|
|
*
|
Indicates a document being filed with this Form 10-K.
|
|
**
|
Information in this Form 10-K furnished herewith shall not be deemed to be “filed” for the purposes of Section 18 of the 1934 Act or otherwise subject to the liabilities of that section.
|
|
229
|
Capital One Financial Corporation (COF)
|
|
SIGNATURES
Pursuant to the requirements of Section 13 of the Securities Exchange Act of 1934, the registrant has duly caused this report to be signed on its behalf by the undersigned, thereunto duly authorized.
|
|
CAPITAL ONE FINANCIAL CORPORATION
|
||||
|
Date: February 21, 2018
|
|
By:
|
|
/s/ RICHARD D. FAIRBANK
|
|
|
|
|
Richard D. Fairbank
|
|||
|
|
|
Chair, Chief Executive Officer and President
|
|||
|
Signature
|
Title
|
Date
|
||
|
/s/ RICHARD D. FAIRBANK
|
Chair, Chief Executive Officer and President
|
February 21, 2018
|
||
|
Richard D. Fairbank
|
(Principal Executive Officer)
|
|||
|
/s/ R. SCOTT BLACKLEY
|
Chief Financial Officer
|
February 21, 2018
|
||
|
R. Scott Blackley
|
(Principal Financial Officer)
|
|||
|
/s/ TIMOTHY P. GOLDEN
|
Controller
|
February 21, 2018
|
||
|
Timothy P. Golden
|
(Principal Accounting Officer)
|
|||
|
/s/ ANN FRITZ HACKETT
|
Director
|
February 21, 2018
|
||
|
Ann Fritz Hackett
|
||||
|
/s/ LEWIS HAY, III
|
Director
|
February 21, 2018
|
||
|
Lewis Hay, III
|
||||
|
/s/ BENJAMIN P. JENKINS, III
|
Director
|
February 21, 2018
|
||
|
Benjamin P. Jenkins, III
|
||||
|
/s/ PETER THOMAS KILLALEA
|
Director
|
February 21, 2018
|
||
|
Peter Thomas Killalea
|
||||
|
/s/ PIERRE E. LEROY
|
Director
|
February 21, 2018
|
||
|
Pierre E. Leroy
|
||||
|
/s/ PETER E. RASKIND
|
Director
|
February 21, 2018
|
||
|
Peter E. Raskind
|
||||
|
/s/ MAYO A. SHATTUCK III
|
Director
|
February 21, 2018
|
||
|
Mayo A. Shattuck III
|
||||
|
/s/ BRADFORD H. WARNER
|
Director
|
February 21, 2018
|
||
|
Bradford H. Warner
|
||||
|
/s/CATHERINE G. WEST
|
Director
|
February 21, 2018
|
||
|
Catherine G. West
|
||||
|
230
|
Capital One Financial Corporation (COF)
|
|
TABLE OF CONTENTS
Part IItem 1. BusinessNote 18 Business SegmentsNote 12 Regulatory and Capital AdequacyItem 1A. Risk FactorsNote 19 Commitments, Contingencies, Guarantees and OthersNote 1 Summary Of Significant Accounting PoliciesItem 1B. Unresolved Staff CommentsItem 2. PropertiesNote 8 Premises, Equipment and Lease CommitmentsItem 3. Legal ProceedingsItem 4. Mine Safety DisclosuresPart IIItem 5. Market For Registrant S Common Equity, Related Stockholder Matters and Issuer Purchases Of Equity SecuritiesItem 6. Summary Of Selected Financial DataItem 7. Management S Discussion and Analysis Of Financial Condition and Results Of Operations ( Md&a )Note 4 LoansNote 5 Allowance For Loan and Lease Losses and Reserve For Unfunded Lending CommitmentsNote 16 Income TaxesNote 3 Investment SecuritiesNote 9 Deposits and BorrowingsNote 6 Variable Interest Entities and SecuritizationsNote 7 Goodwill and Intangible AssetsNote 10 Derivative Instruments and Hedging ActivitiesNote 15 Employee Benefit PlansItem 7A. Quantitative and Qualitative Disclosures About Market RiskNote 17 Fair Value MeasurementNote 2 Business Developments and Discontinued OperationsNote 11 Stockholders EquityNote 13 Earnings Per Common ShareNote 14 Stock-based Compensation PlansNote 20 Capital One Financial Corporation (parent Company Only)Note 21 Related Party TransactionsItem 9. Changes in and Disagreements with Accountants on Accounting and Financial DisclosureItem 9A. Controls and ProceduresItem 9B. Other InformationPart IIIItem 10. Directors, Executive Officers and Corporate GovernanceItem 11. Executive CompensationItem 12. Security Ownership Of Certain Beneficial Owners and Management and Related Stockholder MattersItem 13. Certain Relationships and Related Transactions and Director IndependenceItem 14. Principal Accountant Fees and ServicesPart IVItem 15. Exhibits, Financial Statements SchedulesItem 16. Form 10-k Summary