COOPER COMPANIES, INC.
10-Ks and 10-Qs
|
|
|
|
|
|
|
|
|
|
|
|
|
|
|
|
|
|
|
|
|
|
|
|
|
|
|
|
|
|
|
|
|
|
|
|
|
|
|
|
|
|
|
|
|
|
|
|
|
|
|
|
|
|
|
|
|
|
|
UNITED STATES
SECURITIES AND EXCHANGE COMMISSION
Washington, D.C. 20549
_____________________________________________________________
FORM 10-Q
_____________________________________________________________
|
ý
|
Quarterly Report Pursuant to Section 13 or 15(d) of the Securities Exchange Act of 1934
|
For Quarterly Period Ended
July 31, 2018
|
o
|
Transition Report Pursuant to Section 13 or 15(d) of the Securities Exchange Act of 1934
|
For the transition period from to
Commission File Number 1-8597
_____________________________________________________________
The Cooper Companies, Inc.
(Exact name of registrant as specified in its charter)
_____________________________________________________________
|
Delaware
|
94-2657368
|
|
(State or other jurisdiction of
incorporation or organization)
|
(I.R.S. Employer
Identification No.)
|
6140 Stoneridge Mall Road, Suite 590, Pleasanton, CA 94588
(Address of principal executive offices) (Zip Code)
Registrant’s telephone number, including area code (925) 460-3600
_____________________________________________________________
Indicate by check mark whether the registrant (1) has filed all reports required to be filed by Section 13 or 15(d) of the Securities Exchange Act of 1934 during the preceding 12 months (or for such shorter period that the registrant was required to file such reports), and (2) has been subject to such filing requirements for the past 90 days. Yes
ý
No
o
Indicate by check mark whether the registrant has submitted electronically and posted on its corporate Web site, if any, every Interactive Data File required to be submitted and posted pursuant to Rule 405 of Regulation S-T (§232.405 of this chapter) during the preceding 12 months (or for such shorter period that the registrant was required to submit and post such files). Yes
ý
No
o
Indicate by check mark whether the registrant is a large accelerated filer, an accelerated filer, a non-accelerated filer, a smaller reporting company, or emerging growth company. See definitions of “large accelerated filer,” “accelerated filer,” “smaller reporting company” and "emerging growth company" in Rule 12b-2 of the Exchange Act.
|
Large accelerated filer
|
ý
|
Accelerated filer
|
o
|
|
|
Non-accelerated filer
|
o
|
(Do not check if a smaller reporting company)
|
Smaller reporting company
|
o
|
|
Emerging growth company
|
o
|
|||
If an emerging growth company, indicate by check mark if the registrant has elected not to use the extended transition period for complying with any new or revised financial accounting standards provided pursuant to Section 13(a) of the Exchange Act.
o
Indicate by check mark whether the registrant is a shell company (as defined in Rule 12b-2 of the Exchange Act.): Yes
o
No
ý
Indicate the number of shares outstanding of each of issuer’s classes of common stock, as of the latest practicable date.
|
Common Stock, $.10 par value
|
49,139,682
|
|
|
Class
|
Outstanding at August 24, 2018
|
|
INDEX
|
|
|
Page No.
|
|
PART I.
|
||
|
Item 1.
|
||
|
Consolidated Statements of Income - Three and Nine Months Ended July 31, 2018 and 2017
|
||
|
Consolidated Statements of Comprehensive Income (Loss) - Three and Nine Months Ended July 31, 2018 and 2017
|
||
|
Consolidated Condensed Balance Sheets - July 31, 2018 and October 31, 2017
|
||
|
Consolidated Condensed Statements of Cash Flows - Nine Months Ended July 31, 2018 and 2017
|
||
|
Item 2.
|
||
|
Item 3.
|
||
|
Item 4.
|
||
|
PART II.
|
||
|
Item 1.
|
||
|
Item 1A.
|
||
|
Item 2.
|
||
|
Item 6.
|
||
2
THE COOPER COMPANIES, INC. AND SUBSIDIARIES
Periods Ended July 31,
(In millions, except for earnings per share)
(In millions, except for earnings per share)
(Unaudited)
|
Three Months
|
Nine Months
|
||||||||||||||
|
|
2018
|
2017
|
2018
|
2017
|
|||||||||||
|
Net sales
|
$
|
660.0
|
|
$
|
556.0
|
|
$
|
1,881.3
|
|
$
|
1,577.5
|
|
|||
|
Cost of sales
|
233.2
|
|
199.8
|
|
679.1
|
|
565.1
|
|
|||||||
|
Gross profit
|
426.8
|
|
356.2
|
|
1,202.2
|
|
1,012.4
|
|
|||||||
|
Selling, general and administrative expense
|
251.0
|
|
208.7
|
|
724.7
|
|
590.6
|
|
|||||||
|
Research and development expense
|
22.5
|
|
17.5
|
|
62.2
|
|
50.6
|
|
|||||||
|
Amortization of intangibles
|
37.7
|
|
17.2
|
|
110.5
|
|
50.6
|
|
|||||||
|
Impairment of intangibles
|
—
|
|
—
|
|
24.4
|
|
—
|
|
|||||||
|
Operating income
|
115.6
|
|
112.8
|
|
280.4
|
|
320.6
|
|
|||||||
|
Interest expense
|
22.8
|
|
8.3
|
|
59.9
|
|
23.3
|
|
|||||||
|
Other expense (income), net
|
2.4
|
|
(3.2
|
)
|
1.3
|
|
(0.1
|
)
|
|||||||
|
Income before income taxes
|
90.4
|
|
107.7
|
|
219.2
|
|
297.4
|
|
|||||||
|
(Benefit) provision for income taxes
|
(10.4
|
)
|
4.1
|
|
180.0
|
|
13.1
|
|
|||||||
|
Net income
|
$
|
100.8
|
|
$
|
103.6
|
|
$
|
39.2
|
|
$
|
284.3
|
|
|||
|
Earnings per share - basic
|
$
|
2.05
|
|
$
|
2.12
|
|
$
|
0.80
|
|
$
|
5.81
|
|
|||
|
Earnings per share - diluted
|
$
|
2.03
|
|
$
|
2.09
|
|
$
|
0.79
|
|
$
|
5.74
|
|
|||
|
Number of shares used to compute earnings per share:
|
|
|
|
|
|||||||||||
|
Basic
|
49.1
|
|
48.9
|
|
49.0
|
|
48.9
|
|
|||||||
|
Diluted
|
49.7
|
|
49.6
|
|
49.6
|
|
49.5
|
|
|||||||
See accompanying notes.
3
THE COOPER COMPANIES, INC. AND SUBSIDIARIES
Consolidated Statements of Comprehensive Income (Loss)
Periods Ended July 31,
(In millions)
(In millions)
(Unaudited)
|
Three Months
|
Nine Months
|
||||||||||||||
|
|
2018
|
2017
|
2018
|
2017
|
|||||||||||
|
Net income
|
$
|
100.8
|
|
$
|
103.6
|
|
$
|
39.2
|
|
$
|
284.3
|
|
|||
|
Other comprehensive (loss) income:
|
|||||||||||||||
|
Foreign currency translation adjustment
|
(69.7
|
)
|
38.3
|
|
(10.3
|
)
|
104.8
|
|
|||||||
|
Comprehensive income
|
$
|
31.1
|
|
$
|
141.9
|
|
$
|
28.9
|
|
$
|
389.1
|
|
|||
See accompanying notes.
4
THE COOPER COMPANIES, INC. AND SUBSIDIARIES
(In millions)
(Unaudited)
|
July 31, 2018
|
October 31, 2017
|
||||||
|
ASSETS
|
|||||||
|
Current assets:
|
|||||||
|
Cash and cash equivalents
|
$
|
155.6
|
|
$
|
88.8
|
|
|
|
Trade accounts receivable, net of allowance for doubtful accounts of $18.5 at July 31, 2018 and $10.8 at October 31, 2017
|
375.6
|
|
316.6
|
|
|||
|
Inventories
|
479.6
|
|
454.1
|
|
|||
|
Prepaid expense and other current assets
|
178.0
|
|
93.7
|
|
|||
|
Total current assets
|
1,188.8
|
|
953.2
|
|
|||
|
Property, plant and equipment, at cost
|
1,901.6
|
|
1,757.5
|
|
|||
|
Less: accumulated depreciation and amortization
|
934.2
|
|
847.4
|
|
|||
|
967.4
|
|
910.1
|
|
||||
|
Goodwill
|
2,421.3
|
|
2,354.8
|
|
|||
|
Other intangibles, net
|
1,558.8
|
|
504.7
|
|
|||
|
Deferred tax assets
|
45.7
|
|
60.3
|
|
|||
|
Other assets
|
74.9
|
|
75.6
|
|
|||
|
$
|
6,256.9
|
|
$
|
4,858.7
|
|
||
|
LIABILITIES AND STOCKHOLDERS’ EQUITY
|
|||||||
|
Current liabilities:
|
|||||||
|
Short-term debt
|
$
|
45.3
|
|
$
|
23.4
|
|
|
|
Accounts payable
|
120.8
|
|
142.1
|
|
|||
|
Employee compensation and benefits
|
88.2
|
|
84.1
|
|
|||
|
Other current liabilities
|
207.1
|
|
146.5
|
|
|||
|
Total current liabilities
|
461.4
|
|
396.1
|
|
|||
|
Long-term debt
|
2,248.9
|
|
1,149.3
|
|
|||
|
Deferred tax liabilities
|
37.2
|
|
38.8
|
|
|||
|
Long-term tax payable
|
171.0
|
|
—
|
|
|||
|
Accrued pension liability and other
|
111.8
|
|
98.7
|
|
|||
|
Total liabilities
|
3,030.3
|
|
1,682.9
|
|
|||
|
Commitments and contingencies
|
|
|
|||||
|
Stockholders’ equity:
|
|
||||||
|
Preferred stock, 10 cents par value, shares authorized: 1.0; zero shares issued or outstanding
|
—
|
|
—
|
|
|||
|
Common stock, 10 cents par value, shares authorized: 120.0; issued 52.7 at July 31, 2018 and 52.4 at October 31, 2017
|
5.3
|
|
5.2
|
|
|||
|
Additional paid-in capital
|
1,551.4
|
|
1,526.7
|
|
|||
|
Accumulated other comprehensive loss
|
(385.6
|
)
|
(375.3
|
)
|
|||
|
Retained earnings
|
2,470.5
|
|
2,434.2
|
|
|||
|
Treasury stock at cost: 3.6 shares at July 31, 2018 and 3.6 shares at October 31, 2017
|
(415.1
|
)
|
(415.1
|
)
|
|||
|
Noncontrolling interests
|
0.1
|
|
0.1
|
|
|||
|
Stockholders’ equity
|
3,226.6
|
|
3,175.8
|
|
|||
|
$
|
6,256.9
|
|
$
|
4,858.7
|
|
||
See accompanying notes.
5
THE COOPER COMPANIES, INC. AND SUBSIDIARIES
Nine Months Ended July 31,
(In millions)
(Unaudited)
|
2018
|
2017
|
||||||
|
Cash flows from operating activities:
|
|||||||
|
Net income
|
$
|
39.2
|
|
$
|
284.3
|
|
|
|
Depreciation and amortization
|
204.6
|
|
141.2
|
|
|||
|
Impairment of intangibles
|
24.4
|
|
—
|
|
|||
|
Increase in operating capital
|
(141.1
|
)
|
(58.7
|
)
|
|||
|
Other non-cash items
|
305.2
|
|
27.8
|
|
|||
|
Net cash provided by operating activities
|
432.3
|
|
394.6
|
|
|||
|
Cash flows from investing activities:
|
|||||||
|
Purchases of property, plant and equipment
|
(150.2
|
)
|
(95.4
|
)
|
|||
|
Acquisitions of assets and businesses, net of cash acquired, and other
|
(1,320.8
|
)
|
(197.0
|
)
|
|||
|
Net cash used in investing activities
|
(1,471.0
|
)
|
(292.4
|
)
|
|||
|
Cash flows from financing activities:
|
|||||||
|
Proceeds from long-term debt
|
2,073.1
|
|
1,064.8
|
|
|||
|
Repayments of long-term debt
|
(971.1
|
)
|
(984.6
|
)
|
|||
|
Net proceeds (repayments) from short-term debt
|
21.0
|
|
(202.3
|
)
|
|||
|
Repurchase of common stock
|
—
|
|
(29.5
|
)
|
|||
|
Net payments related to share-based compensation awards
|
(9.8
|
)
|
(5.6
|
)
|
|||
|
Dividends on common stock
|
(1.5
|
)
|
(1.5
|
)
|
|||
|
Debt acquisition costs
|
(3.9
|
)
|
—
|
|
|||
|
Payment of contingent consideration
|
(0.1
|
)
|
(4.3
|
)
|
|||
|
Proceeds from construction allowance
|
—
|
|
2.1
|
|
|||
|
Net cash provided by (used in) financing activities
|
1,107.7
|
|
(160.9
|
)
|
|||
|
Effect of exchange rate changes on cash and cash equivalents
|
(2.2
|
)
|
3.9
|
|
|||
|
Net increase (decrease) in cash and cash equivalents
|
66.8
|
|
(54.8
|
)
|
|||
|
Cash and cash equivalents - beginning of period
|
88.8
|
|
100.8
|
|
|||
|
Cash and cash equivalents - end of period
|
$
|
155.6
|
|
$
|
46.0
|
|
|
See accompanying notes.
6
THE COOPER COMPANIES, INC. AND SUBSIDIARIES
Notes to Consolidated Condensed Financial Statements
(Unaudited)
The accompanying unaudited interim consolidated condensed financial statements and related notes should be read in conjunction with the audited Consolidated Financial Statements of the Cooper Companies, Inc. and its subsidiaries (the Company) and related notes as contained in the Company’s Annual Report on Form 10-K for the fiscal year ended October 31, 2017. The unaudited interim financial statements include all adjustments (consisting only of normal recurring adjustments) and accruals necessary in the judgment of management for a fair statement of the results for the periods presented. Readers should not assume that the results reported here either indicate or guarantee future performance. The terms "the Company", "we", "us", and "our" are used to refer collectively to the Cooper Companies, Inc. and its subsidiaries.
Accounting Pronouncements Issued Not Yet Adopted
In February 2018, the Financial Accounting Standards Board (FASB) issued Accounting Standards Update (ASU) 2018-02,
Income Statement - Reporting Comprehensive Income (Topic 220)
, which allows a reclassification from accumulated other comprehensive income (loss) to retained earnings (accumulated deficit) for stranded tax effects resulting from the Tax Cuts and Jobs Act of 2017 (2017 Act) and requires certain disclosures regarding stranded tax effects in accumulated other comprehensive income (loss). This guidance is effective for fiscal years, and interim periods within those fiscal years, beginning after December 15, 2018, with early adoption permitted during interim or annual periods. We are currently evaluating the impact of ASU 2018-02 which is effective for the Company in our fiscal year and interim periods beginning on November 1, 2019.
In March 2017, the FASB issued ASU 2017-07,
Compensation - Retirement Benefits (Topic 715): Improving the Presentation of Net Periodic Pension Cost and Net Periodic Postretirement Benefit Cost.
The ASU requires an entity to disaggregate the service cost component from the other components of net benefit cost. The service cost component is presented in the same line items as other compensation costs arising from services rendered by the pertinent employees during the period and the other components of net benefit costs are presented separately as other income/expense below income from operations. ASU 2017-07 is effective for the Company in fiscal year and interim periods beginning on November 1, 2019, and is not expected to have a significant impact on the Company's consolidated financial statements.
In November 2016, the FASB issued ASU 2016-18,
Statement of Cash Flows (Topic 230): Restricted Cash.
ASU 2016-18 provides guidance on the classification and presentation of changes in restricted cash and cash equivalents in the statement of cash flows. ASU 2016-18 will be effective for the Company in fiscal year and interim periods beginning on November 1, 2019, and is not expected to have a significant impact on the Company's Consolidated Statements of Cash Flows.
In October 2016, the FASB issued ASU 2016-16,
Income Taxes (Topic 740): Intra-Entity Transfers of Assets Other Than Inventory
, which requires entities to recognize the income tax consequences on an intra-entity transfer of an asset other than inventory when the transfer occurs. The ASU changes the timing of the recognition of the income tax consequences of non-inventory transfers which under current guidance defers the income tax consequences until the asset is sold to an outside party or otherwise recognized. The guidance for the amendments of ASU 2016-16 requires companies to apply a modified retrospective approach with a cumulative catch-up adjustment to opening retained earnings in the period of adoption. We are currently evaluating the impact of ASU 2016-16 which is effective for the Company in our fiscal year and interim periods beginning on November 1, 2018.
In February 2016, the FASB issued ASU 2016-02,
Leases (Topic 842)
. ASU 2016-02 requires that a lessee recognize the assets and liabilities that arise from operating leases. A lessee should recognize in the statement of financial position a liability to make lease payments (the lease liability) and a right-of-use asset representing its right to use the underlying asset for the lease term. For leases with a term of 12 months or less, a lessee is permitted to make an accounting policy election by class of underlying asset not to recognize lease assets and lease liabilities. In transition, lessees and lessors are required to recognize and measure leases at the beginning of the earliest period presented using a modified retrospective approach. In July 2018, the FASB issued ASU 2018-10,
Codification Improvements to Topic 842, Leases
7
THE COOPER COMPANIES, INC. AND SUBSIDIARIES
Notes to Consolidated Condensed Financial Statements
(Unaudited)
and ASU 2018-11,
Leases Topic 842 Target improvements
, which provides an additional (and optional) transition method whereby the new lease standard is applied at the adoption date and recognized as an adjustment to retained earnings. We are currently evaluating the impact of ASU 2016-02, ASU 2018-10 and ASU 2019-11, which is effective for the Company in our fiscal year and interim periods beginning on November 1, 2019.
In May 2014, the FASB issued ASU 2014-09,
Revenue from Contracts with Customers (Topic 606)
. ASU 2014-09 requires revenue recognition to depict the transfer of goods or services to customers in an amount that reflects the consideration to which the entity expects to be entitled in exchange for those goods or services. ASU 2014-09 sets forth a new revenue recognition model that requires identifying the contract, identifying the performance obligations, determining the transaction price, allocating the transaction price to performance obligations and recognizing the revenue upon satisfaction of performance obligations. The amendments in the ASU can be applied either retrospectively to each prior reporting period presented or retrospectively with the cumulative effect of initially applying the update recognized at the date of the initial application along with additional disclosures.
We have been monitoring the activity of the FASB and the Transition Resource Group as it relates to specific industry interpretive guidance and further overall interpretations and clarifications. In fiscal year 2017, we began our plan on adoption of ASU 2014-09. Our plan entails activities such as reviewing significant revenue streams (and related costs) and representative contracts to determine the potential changes to existing accounting policies, completion of an accounting guidance gap analysis, and identifying and addressing the impact that ASU 2014-09 will have on business processes, systems and internal controls to support the recognition and disclosure requirements. We are currently in the process of finalizing our accounting gap analysis and related disclosures. We do not expect a material impact to the Company’s consolidated financial statements on the adoption of ASU 2014-09, but will continue monitoring any changes in contracts that may occur prior to our planned adoption on November 1, 2018.
We will adopt ASU 2014-09, in our fiscal year and interim periods beginning on November 1, 2018 and we will apply the modified retrospective transition method. This would result in an adjustment to retained earnings for the cumulative effect, if any, of applying the ASU 2014-09 to contracts in process as of the adoption date. Under this method, the Company would not restate the prior consolidated financial statements presented. However, the Company would include additional disclosures of the amount by which each financial statement line item is affected in the current reporting period during our fiscal year 2019, as compared to the guidance that was in effect before the change, and an explanation of the reasons for significant changes, if any.
Accounting Pronouncements Recently Adopted
In January 2018, the Company adopted ASU 2018-05,
Income Taxes (Topic 740): Amendments to SEC Paragraphs Pursuant to SEC Staff Accounting Bulletin No. 118,
which updates the income tax accounting in U.S. generally accepted accounting principles (GAAP) to reflect the SEC interpretive guidance released on December 22, 2017, when the 2017 Act was signed into law. Additional information regarding the adoption of this standard is contained in Note 6. Income Taxes.
In May 2017, the FASB issued ASU 2017-09,
Scope of Modification Accounting
. ASU 2017-09 clarifies when changes to the terms or conditions of a share-based payment award must be accounted for as modifications. Entities will apply the modification accounting guidance if the value, vesting conditions or classification of the award changes. The update did not change the accounting for modifications. ASU 2017-09 will be applied prospectively to awards modified on or after the adoption date. Early adoption is permitted, including adoption in any interim period. The Company adopted this guidance on May 1, 2018, and it did not have a material impact on the Company's reported financial results.
In August 2016, the FASB issued ASU No. 2016-15,
Statement of Cash Flow (Topic 230)
. The guidance reduces diversity in how certain cash receipts and cash payments are presented and classified in the Statements of Cash Flows. The guidance also clarifies how the predominance principle should be applied when cash receipts and cash payments have aspects of more than one class of cash flows. The guidance is effective for annual periods beginning after December 15, 2017, and is applicable to the Company in fiscal 2019. Early adoption is permitted. The Company adopted this guidance on May 1, 2018, and it did not have a material impact on the Company's reported financial results.
8
THE COOPER COMPANIES, INC. AND SUBSIDIARIES
Notes to Consolidated Condensed Financial Statements
(Unaudited)
In July 2015, the FASB issued ASU 2015-11,
Simplifying the Measurement of Inventory
. Under current guidance, an entity subsequently measures inventory at the lower of cost or market, with market defined as replacement cost, net realizable value (NRV), or NRV less a normal profit margin. An entity uses current replacement cost provided that it is not above NRV (i.e., the ceiling) or below NRV less an approximately normal profit margin (i.e., the floor). ASU 2015-11 eliminates this analysis and requires entities to measure inventory “at the lower of cost and NRV.” ASU 2015-11 is effective prospectively for annual periods beginning after December 15, 2016, and interim periods therein. The Company adopted this guidance on November 1, 2017, and it did not have a material impact on the Company's reported financial results.
Accounts Receivable Factoring Program
We may factor certain designated trade receivables with one or more third party financial institutions pursuant to a factoring agreement. These are non-recourse factoring arrangements to assist us in managing operating cash flow and meet the requirements to be accounted for as sales in accordance with the “Transfers and Servicing” guidance in ASC 860, where the Company’s continuing involvement subsequent to the transfer is limited to providing certain servicing and collection actions on behalf of the purchasers of the designated trade receivables. Proceeds from amounts factored by the Company are recorded as an increase to cash and a reduction to accounts receivable outstanding in the Consolidated Balance Sheets. Cash flows attributable to factoring are reflected as cash flows from operating activities in the Company’s Consolidated Statements of Cash Flows. Factoring fees associated with the sale of factored receivables for the three and nine months ended July 31, 2018 were
$0.5 million
. We did not factor accounts receivables in the nine months ended July 31, 2017.
9
THE COOPER COMPANIES, INC. AND SUBSIDIARIES
Notes to Consolidated Condensed Financial Statements
(Unaudited)
The following is a summary of the allocation of the total purchase consideration for business and asset acquisitions that the Company completed during fiscal 2018 and 2017:
|
(In millions)
|
July 31, 2018
|
October 31, 2017
|
|||||
|
Technology
|
$
|
—
|
|
$
|
71.7
|
|
|
|
Customer relationships
|
23.5
|
|
43.1
|
|
|||
|
Trademarks
|
100.0
|
|
7.1
|
|
|||
|
Composite intangible asset
|
1,061.9
|
|
—
|
|
|||
|
Other
|
4.2
|
|
—
|
|
|||
|
Total identifiable intangible assets
|
$
|
1,189.6
|
|
$
|
121.9
|
|
|
|
Goodwill
|
70.6
|
|
123.1
|
|
|||
|
Net tangible assets (liabilities)
|
59.6
|
|
(4.8
|
)
|
|||
|
Total purchase price
|
$
|
1,319.8
|
|
$
|
240.2
|
|
|
All the acquisitions were paid in cash and funded by our debt borrowings.
For assets acquisitions, we recorded the tangible and intangible assets acquired and liabilities assumed at their estimated and relative fair values as of the applicable date of acquisition. For business acquisitions, we recorded the tangible and intangible assets acquired and liabilities assumed at their fair values as of the applicable date of acquisition.
We believe these acquisitions strengthen CooperSurgical's and CooperVision's businesses through the addition of new or complementary products and services.
Fiscal Year 2018
PARAGARD
On November 1, 2017, CooperSurgical acquired the assets of the PARAGARD Intrauterine Device (IUD) business (PARAGARD) from Teva Pharmaceuticals Industries Limited for
$1.1 billion
.
This asset acquisition broadens and strengthens CooperSurgical's current product portfolio. PARAGARD
®
is the only hormone-free, long lasting, reversible contraceptive approved by the United States Food and Drug Administration (FDA) available in the United States.
The Company has accounted for the acquisition of PARAGARD as a purchase of assets in accordance with FASB Accounting Standards Codification (ASC) Topic 805,
Business Combinations,
and ASU No. 2017-01,
Business Combinations (Topic 805): Clarifying the Definition of a Business,
whereby the Company recognized assets acquired based on their estimated fair values on the acquisition date. Due to the required screening test, the acquisition does not meet the definition of a business as substantially all the fair value of the gross assets acquired is concentrated in a single identifiable asset. The Company retained independent appraisers to advise management in the determination of the relative fair value of the various assets acquired and liabilities assumed. The values assigned in these financial statements represent management’s best estimate of relative fair values as of the acquisition date.
The following table summarizes the relative fair values of net assets acquired and liabilities assumed using the cost accumulation and allocation model:
10
THE COOPER COMPANIES, INC. AND SUBSIDIARIES
Notes to Consolidated Condensed Financial Statements
(Unaudited)
|
(In millions)
|
Relative Fair Value
|
||
|
Composite intangible asset
(1)
|
$
|
1,061.9
|
|
|
Assembled workforce intangible asset
(2)
|
1.2
|
|
|
|
Property, plant and equipment
|
2.0
|
|
|
|
Inventory
(3)
|
47.3
|
|
|
|
Other assets
|
9.4
|
|
|
|
Total assets acquired
|
$
|
1,121.8
|
|
|
Less: liabilities assumed
|
16.4
|
|
|
|
Total Purchase Price
|
$
|
1,105.4
|
|
The Company proportionally allocated the acquisition costs to the net assets acquired. The acquisition-related costs included advisory, legal, valuation and other professional fees.
(1)
Composite Intangible asset consists of technology, trade name, New Drug Application (NDA) approval and physician relationships, which have been valued as a single composite intangible asset as they are inextricably linked. The composite asset was identified as the primary asset acquired, was valued using the Multi-Period Excess Earnings Method and will be amortized over
15 years
.
(2)
An assembled workforce was recognized as a separate acquired intangible asset, given the purchase of assets and will be amortized over
5 years
.
(3)
Inventory relative fair value includes step up of
$45.4 million
.
As PARAGARD was considered an asset purchase as opposed to a business acquisition in accordance with the guidance under FASB ASC 805,
Business Combinations,
and ASU No. 2017-01,
Business Combinations (Topic 805): Clarifying the Definition of a Business
, the Company has not included proforma financial information which is applicable for a business acquisition.
Other Acquisitions
On April 3, 2018, CooperSurgical completed the acquisition of The LifeGlobal Group (LifeGlobal). LifeGlobal was a privately held company that specializes primarily in the in vitro fertilization (IVF) media. LifeGlobal’s product categories include media products as well as IVF laboratory air filtration products and dishware. The purchase price allocation is preliminary and we are in the process of finalizing information primarily related to property, plant & equipment, inventories, certain accruals and other liabilities and the corresponding impact on goodwill.
On December 1, 2017, CooperVision acquired Paragon Vision Sciences, a leading provider of orthokeratology (ortho-k) specialty contact lenses and oxygen permeable rigid contact lens materials. Ortho-k contact lenses are overnight lenses which enable corneal topography correction for myopia (nearsightedness) patients. The purchase price allocation is preliminary and we are in the process of finalizing information primarily related to property, plant & equipment, inventories and certain other assets and liabilities and the corresponding impact on goodwill.
On January 4, 2018, CooperVision acquired Blueyes Ltd, a long-standing distribution partner, with a leading position in the distribution of contact lenses to the Optical and Pharmacy sector in Israel. The purchase price allocation is preliminary and we are in the process of finalizing information related to tax and the corresponding impact on goodwill.
The pro forma results of operations of these acquisitions have not been presented because the effects of the business combinations described above, individually and in the aggregate, were not material to our consolidated results of operations.
Fiscal Year 2017
On August 3, 2017, CooperVision completed the acquisition of Procornea Holding B.V. (Procornea). Procornea is a Netherlands based manufacturer and distributor of specialty contact lenses, mainly ortho-k which expands CooperVision's access to myopia (nearsightedness) management markets with new products. We have completed the purchase price allocation for this acquisition.
11
THE COOPER COMPANIES, INC. AND SUBSIDIARIES
Notes to Consolidated Condensed Financial Statements
(Unaudited)
On June 30, 2017, CooperVision completed the acquisition of Grand Vista LLC, a long-standing distribution partner in Russia. Grand Vista LLC is engaged in contact lens and contact lens solutions and lens care product distribution business in Russia. We have completed the purchase price allocation for this acquisition.
On November 4, 2016, CooperSurgical completed the acquisition of Wallace, the IVF segment of Smiths Medical International, Ltd., a division of Smiths Group plc. Wallace manufactures a range of IVF and ob/gyn products. We have completed the purchase price allocation for this acquisition.
|
(In millions)
|
July 31, 2018
|
October 31, 2017
|
|||||
|
Raw materials
|
$
|
115.3
|
|
$
|
107.0
|
|
|
|
Work-in-process
|
12.7
|
|
13.3
|
|
|||
|
Finished goods
|
351.6
|
|
333.8
|
|
|||
|
$
|
479.6
|
|
$
|
454.1
|
|
||
Inventories are stated at the lower of cost and net realizable value. Cost is computed using standard cost that approximates actual cost, on a first-in, first-out basis.
12
THE COOPER COMPANIES, INC. AND SUBSIDIARIES
Notes to Consolidated Condensed Financial Statements
(Unaudited)
Goodwill
|
(In millions)
|
CooperVision
|
CooperSurgical
|
Total
|
||||||||
|
Balance at October 31, 2016
|
$
|
1,646.4
|
|
$
|
518.3
|
|
$
|
2,164.7
|
|
||
|
Net additions during the year ended October 31, 2017
|
28.6
|
|
94.4
|
|
123.0
|
|
|||||
|
Translation
|
60.7
|
|
6.4
|
|
67.1
|
|
|||||
|
Balance at October 31, 2017
|
1,735.7
|
|
619.1
|
|
2,354.8
|
|
|||||
|
Net additions during the nine months ended July 31, 2018
|
36.8
|
|
34.4
|
|
71.2
|
|
|||||
|
Translation
|
(4.3
|
)
|
(0.4
|
)
|
(4.7
|
)
|
|||||
|
Balance at July 31, 2018
|
$
|
1,768.2
|
|
$
|
653.1
|
|
$
|
2,421.3
|
|
||
We performed our annual impairment assessment in our third quarter of fiscal 2018 and 2017, and our analysis indicated that we had
no
impairment of goodwill. We evaluate goodwill for impairment annually during the fiscal third quarter and when an event occurs or circumstances change such that it is reasonably possible that impairment may exist. We account for goodwill and evaluate our goodwill balances and test them for impairment in accordance with related accounting standards.
We performed a qualitative assessment to test each reporting unit's goodwill for impairment. Qualitative factors considered in this assessment include industry and market considerations, overall financial performance and other relevant events and factors affecting each reporting unit. Based on our qualitative assessment, if we determine that the fair value of a reporting unit is more likely than not to be less than its carrying amount, the fair value of a reporting unit will be compared with its carrying amount and an impairment charge will be recognized for the carrying amount which exceeds the reporting unit's fair value. A reporting unit is the level of reporting at which goodwill is tested for impairment. Our reporting units are the same as our business segments - CooperVision and CooperSurgical - reflecting the current way we manage our business. Goodwill impairment analysis and measurement is a process that requires significant judgment. If our common stock price trades below book value per share, there are changes in market conditions or future downturn in our business, or a future annual goodwill impairment test indicates an impairment of our goodwill, we may have to recognize a non-cash impairment of goodwill that could be material and could adversely affect our results of operations in the period recognized and also adversely affect our total assets and stockholders' equity.
Other Intangible Assets
|
|
July 31, 2018
|
October 31, 2017
|
|||||||||||||||
|
(In millions)
|
Gross Carrying
Amount
|
Accumulated
Amortization
& Translation
|
Gross Carrying
Amount
|
Accumulated
Amortization
& Translation
|
Weighted Average Amortization Period (In years)
|
||||||||||||
|
Trademarks
|
$
|
139.6
|
|
$
|
14.6
|
|
$
|
44.5
|
|
$
|
10.3
|
|
14
|
||||
|
Composite intangible asset
|
1,061.9
|
|
53.1
|
|
—
|
|
—
|
|
15
|
||||||||
|
Technology
|
396.0
|
|
183.9
|
|
428.8
|
|
173.2
|
|
11
|
||||||||
|
Customer relationships
|
354.6
|
|
163.6
|
|
335.5
|
|
145.3
|
|
13
|
||||||||
|
License and distribution rights and other
|
73.3
|
|
51.4
|
|
69.2
|
|
44.5
|
|
9
|
||||||||
|
2,025.4
|
|
$
|
466.6
|
|
878.0
|
|
$
|
373.3
|
|
14
|
|||||||
|
Less: accumulated amortization and translation
|
466.6
|
|
373.3
|
|
|||||||||||||
|
Other intangible assets, net
|
$
|
1,558.8
|
|
$
|
504.7
|
|
|||||||||||
13
THE COOPER COMPANIES, INC. AND SUBSIDIARIES
Notes to Consolidated Condensed Financial Statements
(Unaudited)
In the second quarter of fiscal 2018, CooperSurgical recognized an impairment charge of
$24.4 million
on the intangible assets acquired from Recombine Inc. as the cash flows expected to be generated by this asset group over its estimated remaining life were not sufficient to recover its carrying value. CooperSurgical acquired Recombine Inc. in fiscal 2016, a clinical genetic testing company specializing in carrier screening. The intangible assets impaired consisted of Technology, Trademark and Customer relationships.
As of July 31, 2018, the estimation of amortization expenses for intangible assets with finite lives is as follows:
|
Fiscal years:
|
(In millions)
|
||
|
Remainder of 2018
|
$
|
36.3
|
|
|
2019
|
143.3
|
|
|
|
2020
|
133.4
|
|
|
|
2021
|
132.2
|
|
|
|
2022
|
130.3
|
|
|
|
Thereafter
|
974.4
|
|
|
|
Total remaining amortization for intangible assets
|
$
|
1,549.9
|
|
|
(In millions)
|
July 31, 2018
|
October 31, 2017
|
|||||
|
Short-term:
|
|||||||
|
Overdraft and other credit facilities
|
$
|
45.3
|
|
$
|
23.4
|
|
|
|
Long term:
|
|||||||
|
2016 Credit Agreement
|
$
|
—
|
|
$
|
323.0
|
|
|
|
Term loans
|
2,255.0
|
|
830.0
|
|
|||
|
Other
|
0.2
|
|
0.2
|
|
|||
|
Less: unamortized debt issuance cost
|
(6.3
|
)
|
(3.9
|
)
|
|||
|
$
|
2,248.9
|
|
$
|
1,149.3
|
|
||
$1.425 billion Term Loan on November 1, 2017
On November 1, 2017, in connection with the PARAGARD acquisition, we entered into a new
five
-year,
$1.425 billion
, senior unsecured term loan agreement (2017 Term Loan Agreement) by and among the Company, the lenders party thereto and DNB Bank ASA, New York Branch, as administrative agent which matures on November 1, 2022. The Company used part of the facility to fund the PARAGARD acquisition and used the remainder of the funds to partially repay outstanding borrowings under our revolving credit agreement.
Amounts outstanding under the 2017 Term Loan Agreement will bear interest, at our option, at either the base rate, or the adjusted LIBO rate (each as defined in the 2017 Term Loan Agreement), plus, in each case, an applicable rate of, between
0.00%
and
0.75%
in respect of base rate loans and between
1.00%
and
1.75%
in respect of adjusted LIBO rate loans, in each case in accordance with a pricing grid tied to the Total Leverage Ratio as defined in the 2017 Term Loan Agreement.
The 2017 Term Loan Agreement contains customary restrictive covenants, as well as financial covenants that require the Company to maintain a certain Total Leverage Ratio and Interest Coverage Ratio (each as defined in the 2017 Term
14
THE COOPER COMPANIES, INC. AND SUBSIDIARIES
Notes to Consolidated Condensed Financial Statements
(Unaudited)
Loan Agreement) consistent with the 2016 Credit Agreement discussed below. At
July 31, 2018
, we had
$1.425 billion
outstanding under the 2017 Term Loan Agreement.
Revolving Credit and Term Loan Agreement on March 1, 2016
On
March 1, 2016
, we entered into a Revolving Credit and Term Loan Agreement (2016 Credit Agreement), among the Company, CooperVision International Holding Company, LP, the lenders party thereto and KeyBank National Association, as administrative agent. The 2016 Credit Agreement provides for a multicurrency revolving credit facility in an aggregate principal amount of
$1.0 billion
and a term loan facility in an aggregate principal amount of
$830.0 million
, each of which, unless terminated earlier, mature on
March 1, 2021
. In addition, we have the ability from time to time to request an increase to the size of the revolving credit facility or establish one or more new term loans under the term loan facility in an aggregate amount up to
$750.0 million
, subject to the discretionary participation of the lenders.
Amounts outstanding under the 2016 Credit Agreement will bear interest, at our option, at either the base rate, or the adjusted LIBO rate or adjusted foreign currency rate (each as defined in the 2016 Credit Agreement), plus, in each case, an applicable rate of between
0.00%
and
0.75%
in respect of base rate loans and between
1.00%
and
1.75%
in respect of adjusted LIBO rate or adjusted foreign currency rate loans, in each case in accordance with a pricing grid tied to the Total Leverage Ratio, as defined in the 2016 Credit Agreement.
We pay an annual commitment fee that ranges from
0.125%
to
0.25%
of the unused portion of the revolving credit facility depending on certain financial ratios. In addition to the annual commitment fee described above, we are also required to pay certain letter of credit and related fronting fees and other administrative fees pursuant to the terms of the 2016 Credit Agreement.
At
July 31, 2018
, we had
$830.0 million
outstanding under the Term Loan and
$999.5 million
available under the 2016 Revolving Credit Agreement.
The 2016 Credit Agreement contains customary restrictive covenants, as well as financial covenants that require us to maintain a certain Total Leverage Ratio and Interest Coverage Ratio (each as defined in the 2016 Credit Agreement):
|
•
|
Interest Coverage Ratio, as defined, to be at least
3.00
to
1.00
at all times.
|
|
•
|
Total Leverage Ratio, as defined, to be no higher than
3.75
to
1.00
.
|
At
July 31, 2018
, we were in compliance with the Interest Coverage Ratio at
12.50
to
1.00
and the Total Leverage Ratio at
2.45
to
1.00
for both the 2017 Term Loan Agreement and the 2016 Credit Agreement.
Refer to our Annual Report on Form 10-K for the fiscal year ended October 31, 2017 for more details.
Recent Tax Legislation
The 2017 Act was enacted into law on December 22, 2017 and significantly changes existing U.S. tax law. The 2017 Act adopts a territorial tax system, imposes a mandatory one-time transition tax on earnings of foreign subsidiaries that were previously tax deferred, and reduces the U.S. federal statutory tax rate from 35% to 21%. The reduction in the U.S. federal statutory tax rate is effective on January 1, 2018 which requires the Company to use a blended tax rate for fiscal 2018. Our blended tax rate is
23.34%
for fiscal 2018 and is calculated by applying a pro-rated percentage based on the number of days in our fiscal 2018 before and after the January 1, 2018 effective date. For fiscal 2019 and subsequent years, the Company will utilize the enacted U.S. federal statutory tax rate of 21%.
The 2017 Act includes several provisions that are effective for our fiscal 2019: (i) tax on global intangible low-taxed income (GILTI) of foreign subsidiaries, (ii) tax on certain payments between a U.S. corporation and its foreign subsidiaries referred to as the base erosion and anti-abuse tax (BEAT), (iii) limitation on the tax deduction for interest payments, and (iv) expanded limitation on the tax deduction for compensation paid to certain executives.
15
THE COOPER COMPANIES, INC. AND SUBSIDIARIES
Notes to Consolidated Condensed Financial Statements
(Unaudited)
The 2017 Act was effective in the first quarter of fiscal 2018. As of July 31, 2018, we have not completed our accounting for the tax effects of the enactment of the 2017 Act. Consistent with SEC guidance, we recorded a provisional tax expense in our financial statements for the first quarter ended January 31, 2018, based on reasonable estimates of the tax effects of the 2017 Act. The provisional tax expense is subject to revisions as we gather and prepare additional information to complete our analysis of the 2017 Act, and interpret additional guidance issued by the FASB, Internal Revenue Service and U.S. Treasury Department. The provisional tax expense will be finalized during the measurement period, which should not extend beyond one year from the enactment date, and could be materially different than our provisional tax expense. The provisional tax expense is described in more detail below.
During the first quarter, the Company recorded a
$177.9 million
provisional tax expense for the mandatory deemed repatriation of deferred foreign earnings and plans to pay the applicable amounts over
eight
years. The 2017 Act requires us to incur a one-time transition tax on deferred foreign income not previously subject to U.S. income tax at a rate of
15.5%
for foreign cash and certain other net current assets, and
8%
on the remaining deferred foreign income. In the third quarter, the Company decreased the provisional tax expense to
$174.1 million
after revising its analysis of the earnings and profits and foreign tax credits, which are critical inputs to the calculation. We have not completed our analysis because we are using estimates for part of fiscal 2018 that impact the final transition tax calculation.
During the first quarter, the Company recorded a provisional tax expense of
$13.2 million
to record changes to the deferred taxes resulting from the U.S. federal rate decreasing from 35% to 21%. The amount is calculated using the applicable tax rates in the years in which the deferred tax assets and liabilities are expected to reverse. The Company is still analyzing certain aspects of the 2017 Act and refining the calculations, which could affect the measurement of the deferred taxes or give rise to new deferred tax amounts. The re-measurement of deferred taxes included in our financial statements will be subject to further revisions if our current estimates vary from our actual future operating results.
Due to the changes in the 2017 Act, we are reviewing our prior assertion that earnings from our foreign subsidiaries are indefinitely reinvested. For purposes of recording the provisional tax expense in fiscal 2018, we are no longer asserting that earnings from our foreign subsidiaries are indefinitely reinvested. Accordingly, in the first quarter we recorded provisional estimates relating to additional state income taxes of
$8.1 million
and withholding taxes of
$2.8 million
relating to the unremitted foreign earnings. In the third quarter, we decreased the provisional estimate relating to additional state taxes to
$7.5 million
and withholding taxes to
$1.9 million
mostly due to the changes made to the transition tax. We have not completed our analysis because we are still gathering additional information to quantify the impact to the individual states and to quantify the withholding taxes that would be owed when future dividends are paid to the U.S. As the Company completes its analysis, it will make appropriate changes to the financial statements within the measurement period.
The 2017 Act imposes a new tax on foreign earnings and profits in excess of a deemed return on tangible assets of foreign subsidiaries referred to as GILTI. The 2017 Act also imposes a new tax on certain payments between a U.S. corporation and its foreign subsidiaries referred to as BEAT. These new provisions are effective for fiscal 2019. Due to the complexity of the new GILTI and BEAT tax rules, we are continuing to evaluate these new provisions and the application of GAAP. With respect to GILTI, the Company has not progressed sufficiently in its analysis and has not made an accounting policy election to treat taxes due on the GILTI inclusion as a current period expense or factor such amounts into the measurement of our deferred taxes. The Company will continue its evaluation and make a policy election within the measurement period.
The 2017 Act limits the future deductions relating to interest expense and certain executive compensation. These provisions are generally effective for the Company in fiscal 2019. Pursuant to transition rules provided in the 2017 Act relating to the deduction for executive compensation, companies will be allowed tax deductions for performance based plans in existence on or before November 2, 2017 and not materially modified after that date. Based on our current interpretation of the transition rules, we believe the Company will be able to deduct the executive compensation relating to those plans. Therefore, we have not recorded any provisional tax expense this quarter or prior quarters. As additional guidance and clarification of the transition rules, is provided by the tax authorities we will make appropriate changes within the measurement period.
16
THE COOPER COMPANIES, INC. AND SUBSIDIARIES
Notes to Consolidated Condensed Financial Statements
(Unaudited)
Effective Tax Rate
The Company's effective tax rates were a benefit of
11.5%
and expense of
3.8%
for the third quarters of fiscal 2018 and 2017, respectively, and an expense of
82.1%
and
4.4%
for the first nine months of fiscal 2018 and 2017, respectively. The decrease in our effective tax rate for the third quarter of fiscal 2018 compared to the third quarter of fiscal 2017 was due primarily to a reduction in U.S. income related to acquisition and integration activities in CooperSurgical and a decrease of
$5.3 million
to the provisional tax expense recorded in Q1 relating to the 2017 Act.
The increase in our effective tax rate for the first nine months of fiscal 2018 compared to the first nine months of fiscal 2017 was primarily due to the charge of
$196.7 million
related to the 2017 Act. Our effective tax rate for the first nine months of fiscal 2018 was higher than the U.S. statutory rate because of the discrete tax expense relating to the 2017 Act, which was partially offset by a favorable mix of income from our foreign jurisdictions with lower tax rates and an excess tax benefit from share-based compensation. Our effective tax rate for the first nine months of fiscal 2017 was lower than the U.S. statutory rate primarily because of a favorable mix of income from our foreign jurisdictions with lower tax rates and an excess tax benefit from share-based compensation.
We recognize the benefit from a tax position only if it is more likely than not that the position would be sustained upon audit based solely on the technical merits of the tax position. As of July 31, 2018 and October 31, 2017, Cooper had unrecognized tax benefits of
$65.3 million
and
$59.9 million
, respectively. The increase is primarily related to current period transfer pricing. It is our policy to recognize interest and penalties directly related to income taxes as additional income tax expense. It is reasonably possible that
$25.3 million
of unrecognized tax benefits could be settled during the next twelve months.
The Company is subject to U.S. Federal income tax examinations for fiscal 2015 through 2017 and the Internal Revenue Service is auditing our U.S. Consolidated Corporation Income Tax Returns for fiscal 2015 and 2016. Cooper remains subject to income tax examinations in other significant tax jurisdictions including the United Kingdom, Japan, France and Australia for the tax years 2013 through 2017.
Diverted Profits Tax (DPT)
The United Kingdom tax authorities (U.K. Tax Authorities) enacted a Diverted Profits Tax (DPT) as of April 1, 2015 on profits of multinationals that they deemed artificially diverted from the United Kingdom. The tax rate is 25%. DPT is intended to apply in two situations: (a) where a foreign company has artificially avoided having a taxable presence in the United Kingdom; and (b) where a group adopts a structure which lacks economic substance in order to divert profits from the United Kingdom.
During fiscal 2017, the U.K. Tax Authorities began an inquiry regarding the application of the DPT in fiscal 2015. We believe that the transactions in question were at arm’s length with no intention to divert profit from the United Kingdom and therefore are outside the intended reach of the DPT.
On December 20, 2017, the U.K. Tax Authorities issued a DPT charging notice of approximately GBP
31.0 million
with respect to the transfer out of the United Kingdom of certain intellectual property rights in connection with the 2014 acquisition of Sauflon Pharmaceutical Ltd. Although taxes were paid on the transfer, the U.K. Tax Authorities are challenging the value assigned to such property. We intend to contest the charging notice vigorously. The process for resolving such a notice can be lengthy and could involve litigation. The DPT legislation provides a one year review period; however, it requires prepayment of the charging notice to be made within 30 days of its issuance. As required, the payment of GBP
31.0 million
was made on January 19, 2018. The Company continues to cooperate with the U.K. Tax Authorities to resolve this issue. The outcome of this matter cannot be predicted with certainty and may have an adverse impact on our financial condition and results.
17
THE COOPER COMPANIES, INC. AND SUBSIDIARIES
Notes to Consolidated Condensed Financial Statements
(Unaudited)
|
Periods Ended July 31,
|
Three Months
|
Nine Months
|
|||||||||||||
|
(In millions, except per share amounts)
|
2018
|
2017
|
2018
|
2017
|
|||||||||||
|
Net income
|
$
|
100.8
|
|
$
|
103.6
|
|
$
|
39.2
|
|
$
|
284.3
|
|
|||
|
Basic:
|
|||||||||||||||
|
Weighted average shares
|
49.1
|
|
48.9
|
|
49.0
|
|
48.9
|
|
|||||||
|
Earnings per share - basic
|
$
|
2.05
|
|
$
|
2.12
|
|
$
|
0.80
|
|
$
|
5.81
|
|
|||
|
Diluted:
|
|||||||||||||||
|
Weighted average shares
|
49.1
|
|
48.9
|
|
49.0
|
|
48.9
|
|
|||||||
|
Effect of potential dilutive shares
|
0.6
|
|
0.7
|
|
0.6
|
|
0.6
|
|
|||||||
|
Diluted weighted average shares
|
49.7
|
|
49.6
|
|
49.6
|
|
49.5
|
|
|||||||
|
Earnings per share - diluted
|
$
|
2.03
|
|
$
|
2.09
|
|
$
|
0.79
|
|
$
|
5.74
|
|
|||
|
|
|||||||||||||||
The following table sets forth stock options to purchase Cooper’s common stock and restricted stock units that were not included in the diluted earnings per share calculation because their effect would have been antidilutive for the periods presented:
|
Periods Ended July 31,
|
Three Months
|
Nine Months
|
|||||||||||
|
(In thousands, except exercise prices)
|
2018
|
2017
|
2018
|
2017
|
|||||||||
|
Number of stock option shares excluded
|
257
|
|
—
|
|
257
|
|
192
|
|
|||||
|
Range of exercise prices
|
$226.30-$230.09
|
|
$
|
—
|
|
$226.30-$230.09
|
|
$
|
175.31
|
|
|||
|
Numbers of restricted stock units excluded
|
78
|
|
2
|
|
78
|
|
3
|
|
|||||
18
THE COOPER COMPANIES, INC. AND SUBSIDIARIES
Notes to Consolidated Condensed Financial Statements
(Unaudited)
Cooper has several share-based compensation plans that are described in the Company’s Annual Report on Form 10‑K for the fiscal year ended
October 31, 2017
. The compensation expense and related income tax benefit recognized in our consolidated condensed financial statements for share-based awards were as follows:
|
Periods Ended July 31,
|
Three Months
|
Nine Months
|
|||||||||||||
|
(In millions)
|
2018
|
2017
|
2018
|
2017
|
|||||||||||
|
Selling, general and administrative expense
|
$
|
6.7
|
|
$
|
7.7
|
|
$
|
30.3
|
|
$
|
24.9
|
|
|||
|
Cost of sales
|
0.9
|
|
(0.1
|
)
|
2.6
|
|
1.9
|
|
|||||||
|
Research and development expense
|
0.5
|
|
0.3
|
|
1.6
|
|
0.9
|
|
|||||||
|
Total share-based compensation expense
|
$
|
8.1
|
|
$
|
7.9
|
|
$
|
34.5
|
|
$
|
27.7
|
|
|||
|
Related income tax benefit
|
$
|
1.5
|
|
$
|
2.6
|
|
$
|
7.1
|
|
$
|
8.5
|
|
|||
Analysis of Changes in Accumulated Other Comprehensive (Loss) Income:
|
(In millions)
|
Foreign Currency Translation Adjustment
|
Minimum Pension Liability
|
Total
|
||||||||
|
Balance at October 31, 2016
|
$
|
(461.4
|
)
|
$
|
(28.2
|
)
|
$
|
(489.6
|
)
|
||
|
Gross change in value during the year ended October 31, 2017
|
107.7
|
|
10.8
|
|
118.5
|
|
|||||
|
Tax effect for the period
|
—
|
|
(4.2
|
)
|
(4.2
|
)
|
|||||
|
Balance at October 31, 2017
|
$
|
(353.7
|
)
|
$
|
(21.6
|
)
|
$
|
(375.3
|
)
|
||
|
Gross change in value during the nine months ended July 31, 2018
|
(10.3
|
)
|
—
|
|
(10.3
|
)
|
|||||
|
Balance at July 31, 2018
|
$
|
(364.0
|
)
|
$
|
(21.6
|
)
|
$
|
(385.6
|
)
|
||
Share Repurchases
In December 2011, our Board of Directors authorized the 2012 Share Repurchase Program. In March 2017, the program was amended and approved by the Company's Board of Directors for an increase of
$500.0 million
providing authorization for a total of
$1.0 billion
of the Company’s common stock. This program has no expiration date and may be discontinued at any time. Purchases under the 2012 Share Repurchase Program are subject to a review of the circumstances in place at the time and may be made from time to time as permitted by securities laws and other legal requirements. We did
no
t repurchase shares during the nine months ended July 31, 2018. During the fiscal year ended October 31, 2017, we repurchased
258 thousand
shares of our common stock for
$55.0 million
. At
July 31, 2018
,
$563.5 million
remains authorized for repurchase under the program.
Dividends
We paid a semiannual dividend of approximately
$1.5 million
or
3 cents
per share on February 9, 2018, to stockholders of record on January 23, 2018. We paid another semiannual dividend of approximately
$1.5 million
or
3 cents
per share on August 7, 2018, to stockholders of record on
July 23, 2018
.
At
July 31, 2018
and
October 31, 2017
, the carrying value of cash and cash equivalents, accounts receivable, prepaid expense and other current assets, lines of credit, accounts payable and other current liabilities approximate fair value due to the short-term nature of such instruments and the ability to obtain financing on similar terms.
19
THE COOPER COMPANIES, INC. AND SUBSIDIARIES
Notes to Consolidated Condensed Financial Statements
(Unaudited)
Assets and liabilities are measured and reported at fair value per related accounting standards that define fair value as the price that would be received to sell an asset or paid to transfer a liability in an orderly transaction between market participants at the measurement date. The fair value hierarchy prioritizes the inputs to valuation techniques used to measure fair value. An asset’s or liability’s level is based on the lowest level of input that is significant to the fair value measurement. Assets and liabilities carried at fair value are valued and disclosed in one of the following three levels of the valuation hierarchy:
Level 1: Quoted market prices in active markets for identical assets or liabilities.
Level 2: Observable market-based inputs or unobservable inputs that are corroborated by market data.
Level 3: Unobservable inputs reflecting the reporting entity’s own assumptions.
We believe that the balances of our revolving credit agreement and term loans approximated their fair values at
July 31, 2018
and
October 31, 2017
and are categorized as Level 2 of the fair value hierarchy. The Company did not have any derivative assets or liabilities that may include interest rate swaps, cross currency swaps or foreign currency forward contracts at
July 31, 2018
and October 31, 2017.
Nonrecurring fair value measurements
On a nonrecurring basis, the Company uses fair value measures when analyzing asset impairment. Generally, assets are recorded at fair value on a nonrecurring basis as a result of impairment charges. In the second quarter of fiscal 2018, we recorded
$24.4 million
of impairment charge related to the intangible assets acquired from Recombine Inc. as the cash flows expected to be generated by this asset group over its estimated remaining life were not sufficient to recover its carrying value. The fair value of these intangible assets determined at April 30, 2018 was
$0
. Our valuation included unobservable Level 3 inputs and was based on expected sales proceeds and discounted cash flows as of April 30, 2018. There was no significant asset impairment for the three months ended July 31, 2018.
Cooper’s Retirement Income Plan (Plan), a defined benefit plan, covers substantially all full-time United States employees. Our contributions are designed to fund normal cost on a current basis and to fund the estimated prior service cost of benefit improvements. The unit credit actuarial cost method is used to determine the annual cost. Cooper pays the entire cost of the Plan and funds such costs as they accrue. Virtually all of the assets of the Plan are comprised of equities and participation in equity and fixed income funds.
Our results of operations for the three and nine months ended
July 31, 2018
and
2017
, reflect the following components of net periodic pension costs:
|
Periods Ended July 31,
|
Three Months
|
Nine Months
|
|||||||||||||
|
(In millions)
|
2018
|
2017
|
2018
|
2017
|
|||||||||||
|
Service cost
|
$
|
2.7
|
|
$
|
2.5
|
|
$
|
8.1
|
|
$
|
7.5
|
|
|||
|
Interest cost
|
1.3
|
|
1.1
|
|
3.8
|
|
3.3
|
|
|||||||
|
Expected return on plan assets
|
(2.3
|
)
|
(1.8
|
)
|
(6.9
|
)
|
(5.4
|
)
|
|||||||
|
Recognized net actuarial loss
|
0.4
|
|
0.7
|
|
1.2
|
|
2.1
|
|
|||||||
|
Net periodic pension cost
|
$
|
2.1
|
|
$
|
2.5
|
|
$
|
6.2
|
|
$
|
7.5
|
|
|||
We contributed
$5.0 million
to the Plan in the first nine months of fiscal 2018, and expect to contribute
$5.0 million
during the remainder of fiscal 2018. We contributed
$5.0 million
to the Plan in the first nine months of fiscal 2017. The expected rate of return on Plan assets for determining net periodic pension cost is
8%
.
20
THE COOPER COMPANIES, INC. AND SUBSIDIARIES
Notes to Consolidated Condensed Financial Statements
(Unaudited)
Since March 2015, over
50
putative class action complaints were filed by contact lens consumers alleging that contact lens manufacturers, in conjunction with their respective Unilateral Pricing Policy (UPP), conspired to reach agreements between each other and certain distributors and retailers regarding the prices at which certain contact lenses could be sold to consumers. The plaintiffs are seeking damages against CooperVision, Inc., other contact lens manufacturers, distributors and retailers, in various courts around the United States. In June 2015, all of the class action cases were consolidated and transferred to the United States District Court for the Middle District of Florida. In August 2017, CooperVision entered into a settlement agreement with the plaintiffs, without any admission of liability, to settle all claims against CooperVision. In July 2018, the Court approved the plaintiffs’ motion for preliminary approval of the settlement, and the Company paid the
$3.0 million
settlement amount into an escrow account. The settlement remains subject to final Court approval at a future hearing to be set by the Court.
The Company is involved in various lawsuits, claims and other legal matters from time to time that arise in the ordinary course of conducting business, including matters involving our products, intellectual property, supplier relationships, distributors, competitor relationships, employees and other matters. The Company does not believe that the ultimate resolution of these proceedings or claims pending against it could have a material adverse effect on its financial condition or results of operations. At each reporting period, the Company evaluates whether or not a potential loss amount or a potential range of loss is probable and reasonably estimable under ASC 450, Contingencies. Legal fees are expensed as incurred.
Diverted Profits Tax (DPT)
As discussed in Note 6. Income Taxes, during fiscal 2017, the U.K. Tax Authorities began an inquiry regarding our application of DPT in fiscal 2015. We believe that the transactions in question were at arm’s length with no intention to divert profit from the United Kingdom and therefore are outside the intended reach of the DPT.
On December 20, 2017, the U.K. Tax Authorities issued a DPT charging notice of approximately GBP
31.0 million
with respect to the transfer out of the United Kingdom of certain intellectual property rights in connection with the 2014 acquisition of Sauflon Pharmaceutical Ltd. Although taxes were paid on the transfer, the U.K. Tax Authorities are challenging the value assigned to such property. We intend to contest the charging notice vigorously. The process for resolving such a notice can be lengthy and could involve litigation. The DPT legislation provides a one year review period, however, it requires prepayment of the charging notice to be made within 30 days of its issuance. As required, the payment of GBP
31.0
million was made on January 19, 2018. The Company continues to cooperate with the U.K. Tax Authorities to resolve this issue. The outcome of this matter cannot be predicted with certainty and may have an adverse impact on our financial condition and results.
21
THE COOPER COMPANIES, INC. AND SUBSIDIARIES
Notes to Consolidated Condensed Financial Statements
(Unaudited)
Cooper uses operating income, as presented in our financial reports, as the primary measure of segment profitability. We do not allocate costs from corporate functions to segment operating income. Items below operating income are not considered when measuring the profitability of a segment. We use the same accounting policies to generate segment results as we do for our consolidated results.
Total assets are those used in continuing operations except cash and cash equivalents, which we include as corporate assets.
Segment information:
|
Periods Ended July 31,
|
Three Months
|
Nine Months
|
|||||||||||||
|
(In millions)
|
2018
|
2017
|
2018
|
2017
|
|||||||||||
|
CooperVision net sales by category:
|
|||||||||||||||
|
Toric lens
|
$
|
153.6
|
|
$
|
138.3
|
|
$
|
442.2
|
|
$
|
390.8
|
|
|||
|
Multifocal lens
|
52.7
|
|
46.8
|
|
148.8
|
|
132.1
|
|
|||||||
|
Single-use sphere lens
|
137.6
|
|
115.8
|
|
378.3
|
|
319.5
|
|
|||||||
|
Non single-use sphere and other
|
145.2
|
|
136.4
|
|
432.1
|
|
392.6
|
|
|||||||
|
Total CooperVision net sales
|
489.1
|
|
437.3
|
|
1,401.4
|
|
1,235.0
|
|
|||||||
|
CooperSurgical net sales
|
170.9
|
|
118.7
|
|
479.9
|
|
342.5
|
|
|||||||
|
Total net sales
|
$
|
660.0
|
|
$
|
556.0
|
|
$
|
1,881.3
|
|
$
|
1,577.5
|
|
|||
|
Operating income (loss):
|
|||||||||||||||
|
CooperVision
|
$
|
125.4
|
|
$
|
109.5
|
|
$
|
361.1
|
|
$
|
308.9
|
|
|||
|
CooperSurgical
|
1.6
|
|
14.9
|
|
(37.5
|
)
|
48.2
|
|
|||||||
|
Corporate
|
(11.4
|
)
|
(11.6
|
)
|
(43.2
|
)
|
(36.5
|
)
|
|||||||
|
Total operating income
|
115.6
|
|
112.8
|
|
280.4
|
|
320.6
|
|
|||||||
|
Interest expense
|
22.8
|
|
8.3
|
|
59.9
|
|
23.3
|
|
|||||||
|
Other expense (income), net
|
2.4
|
|
(3.2
|
)
|
1.3
|
|
(0.1
|
)
|
|||||||
|
Income before income taxes
|
$
|
90.4
|
|
$
|
107.7
|
|
$
|
219.2
|
|
$
|
297.4
|
|
|||
|
(In millions)
|
July 31, 2018
|
October 31, 2017
|
|||||
|
Total assets:
|
|||||||
|
CooperVision
|
$
|
3,766.4
|
|
$
|
3,562.6
|
|
|
|
CooperSurgical
|
2,221.0
|
|
1,107.5
|
|
|||
|
Corporate
|
269.5
|
|
188.6
|
|
|||
|
Total
|
$
|
6,256.9
|
|
$
|
4,858.7
|
|
|
Geographic information:
|
Periods Ended July 31,
|
Three Months
|
Nine Months
|
|||||||||||||
|
(In millions)
|
2018
|
2017
|
2018
|
2017
|
|||||||||||
|
Net sales to external customers by country of domicile:
|
|||||||||||||||
|
United States
|
$
|
302.1
|
|
$
|
235.3
|
|
$
|
856.8
|
|
$
|
694.8
|
|
|||
|
Europe
|
224.0
|
|
200.6
|
|
637.8
|
|
544.5
|
|
|||||||
|
Rest of world
|
133.9
|
|
120.1
|
|
386.7
|
|
338.2
|
|
|||||||
|
Total
|
$
|
660.0
|
|
$
|
556.0
|
|
$
|
1,881.3
|
|
$
|
1,577.5
|
|
|||
22
THE COOPER COMPANIES, INC. AND SUBSIDIARIES
Notes to Consolidated Condensed Financial Statements
(Unaudited)
|
(In millions)
|
July 31, 2018
|
October 31, 2017
|
|||||
|
Net property, plant and equipment by country of domicile:
|
|||||||
|
United States
|
$
|
500.6
|
|
$
|
472.8
|
|
|
|
Europe
|
349.5
|
|
352.3
|
|
|||
|
Rest of world
|
117.3
|
|
85.0
|
|
|||
|
Total
|
$
|
967.4
|
|
$
|
910.1
|
|
|
23
THE COOPER COMPANIES, INC. AND SUBSIDIARIES
Item 2. Management’s Discussion and Analysis of Financial Condition
and Results of Operations
Note numbers refer to “Notes to Consolidated Condensed Financial Statements” in Item 1. Unaudited Financial Statements.
Forward-Looking Statements
This Quarterly Report on Form 10-Q contains “forward-looking statements” as defined by the Private Securities Litigation Reform Act of 1995. These include statements relating to plans, prospects, goals, strategies, future actions, events or performance and other statements which are other than statements of historical fact, including all statements regarding acquisitions including the acquired companies' financial position, market position, product development and business strategy, expected cost synergies, expected timing and benefits of the transaction, difficulties in integrating entities or operations, as well as estimates of our and the acquired entities' future expenses, sales and earnings per share are forward-looking. In addition, all statements regarding anticipated growth in our revenue, anticipated effects of any product recalls, anticipated market conditions, planned product launches and expected results of operations and integration of any acquisition are forward-looking. To identify these statements look for words like “believes,” “expects,” “may,” “will,” “should,” “could,” “seeks,” “intends,” “plans,” “estimates” or “anticipates” and similar words or phrases. Forward-looking statements necessarily depend on assumptions, data or methods that may be incorrect or imprecise and are subject to risks and uncertainties. Among the factors that could cause our actual results and future actions to differ materially from those described in forward-looking statements are:
|
•
|
Adverse changes in the global or regional general business, political and economic conditions, including the impact of continuing uncertainty and instability of certain countries that could adversely affect our global markets, and the potential adverse economic impact and related uncertainty caused by these items, including but not limited to, the United Kingdom’s election to withdraw from the European Union and escalating global trade barriers including additional tariff costs.
|
|
•
|
Foreign currency exchange rate and interest rate fluctuations including the risk of fluctuations in the value of foreign currencies or interest rates that would decrease our revenues and earnings.
|
|
•
|
Changes in tax laws or their interpretation and changes in statutory tax rates, including but not limited to, the U.S., the United Kingdom and other countries with proposed changes to tax laws, some of which may affect our taxation of earnings recognized in foreign jurisdictions and/or negatively impact our effective tax rate.
|
|
•
|
Our existing indebtedness and associated interest expense, most of which is variable and impacted by rate increases, which could adversely affect our financial health or limit our ability to borrow additional funds.
|
|
•
|
Acquisition-related adverse effects including the failure to successfully obtain the anticipated revenues, margins and earnings benefits of acquisitions, integration delays or costs and the requirement to record significant adjustments to the preliminary fair value of assets acquired and liabilities assumed within the measurement period, required regulatory approvals for an acquisition not being obtained or being delayed or subject to conditions that are not anticipated, adverse impacts of changes to accounting controls and reporting procedures, contingent liabilities or indemnification obligations, increased leverage and lack of access to available financing (including financing for the acquisition or refinancing of debt owed by us on a timely basis and on reasonable terms).
|
|
•
|
Compliance costs and potential liability in connection with U.S. and foreign laws and health care regulations pertaining to privacy and security of third- party information, such as HIPAA in the U.S. and the General Data Protection Regulation requirements which took effect in Europe on May 25, 2018, including but not limited to those resulting from data security breaches.
|
|
•
|
A major disruption in the operations of our manufacturing, accounting and financial reporting, research and development, distribution facilities or raw material supply chain due to integration of acquisitions, natural disasters or other causes.
|
|
•
|
A major disruption in the operations of our manufacturing, accounting and financial reporting, research and development or distribution facilities due to technological problems, including any related to our information systems maintenance, enhancements or new system deployments, integrations or upgrades.
|
24
THE COOPER COMPANIES, INC. AND SUBSIDIARIES
Item 2. Management’s Discussion and Analysis of Financial Condition
and Results of Operations
|
•
|
Disruptions in supplies of raw materials, particularly components used to manufacture our silicone hydrogel lenses.
|
|
•
|
New U.S. and foreign government laws and regulations, and changes in existing laws, regulations and enforcement guidance, which affect areas of our operations including, but not limited to, those affecting the health care industry, including the contact lens industry specifically and the medical device or pharmaceutical industries generally.
|
|
•
|
Legal costs, insurance expenses, settlement costs and the risk of an adverse decision, prohibitive injunction or settlement related to product liability, patent infringement or other litigation.
|
|
•
|
Limitations on sales following product introductions due to poor market acceptance.
|
|
•
|
New competitors, product innovations or technologies, including but not limited to, technological advances by competitors, new products and patents attained by competitors, and competitors' expansion through acquisitions.
|
|
•
|
Reduced sales, loss of customers and costs and expenses related to product recalls and warning letters.
|
|
•
|
Failure to receive, or delays in receiving, U.S. or foreign regulatory approvals for products.
|
|
•
|
Failure of our customers and end users to obtain adequate coverage and reimbursement from third-party payors for our products and services.
|
|
•
|
The requirement to provide for a significant liability or to write off, or accelerate depreciation on, a significant asset, including goodwill and idle manufacturing facilities and equipment.
|
|
•
|
The success of our research and development activities and other start-up projects.
|
|
•
|
Dilution to earnings per share from acquisitions or issuing stock.
|
|
•
|
Impact and costs incurred from changes in accounting standards and policies.
|
|
•
|
Environmental risks, including increasing environmental legislation and the broader impacts of climate change.
|
|
•
|
Other events described in our Securities and Exchange Commission filings, including the “Business” and “Risk Factors” sections in our Annual Report on Form 10-K for the fiscal year ended October 31, 2017, as such Risk Factors may be updated in quarterly filings.
|
We caution investors that forward-looking statements reflect our analysis only on their stated date. We disclaim any intent to update them except as required by law.
25
THE COOPER COMPANIES, INC. AND SUBSIDIARIES
Item 2. Management’s Discussion and Analysis of Financial Condition
and Results of Operations
Results of Operations
In this section, we discuss the results of our operations for the fiscal
third
quarter of 2018 ended
July 31, 2018
, and the nine months then ended and compare them with the same periods of fiscal 2017. We discuss our cash flows and current financial condition under “Capital Resources and Liquidity.” Within the tables presented, percentages are calculated based on the underlying whole-dollar amounts and, therefore, may not recalculate from the rounded numbers used for disclosure purposes.
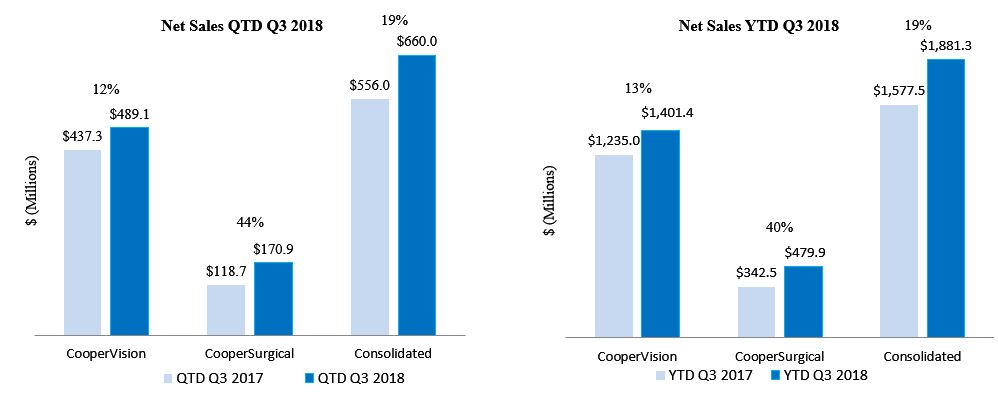
Third
Quarter Highlights
|
•
|
Gross profit
$426.8 million
, up
20%
from
$356.2 million
in the prior year period
|
|
•
|
Operating income
$115.6 million
, up
2%
from
$112.8 million
in the prior year period
|
|
•
|
Diluted earnings per share of
$2.03
, down from
$2.09
in the prior year period
|
|
•
|
Cash provided by operations
$235.3 million
, compared to $
154.6 million
in the prior year period
|
Nine-Month Highlights
|
•
|
Gross profit
$1,202.2 million
, up
19%
from
$1,012.4 million
in the prior year period
|
|
•
|
Operating income
$280.4 million
, down
13%
from
$320.6 million
in the prior year period, primarily due to an increase in amortization expenses as a result of acquisitions and a non-recurring impairment charge
|
|
•
|
Diluted earnings per share of
$0.79
, down from
$5.74
in the prior year period, due to U.S. tax reform charges, an increase in amortization expense and a non-recurring impairment charge
|
|
•
|
Cash provided by operations
$432.3 million
, compared to
$394.6 million
in the prior year period
|
26
THE COOPER COMPANIES, INC. AND SUBSIDIARIES
Item 2. Management’s Discussion and Analysis of Financial Condition
and Results of Operations
Outlook
Overall, we remain optimistic about the long-term prospects for the worldwide contact lens and general health care markets. However, events affecting the economy as a whole, including but not limited to the uncertainty and instability of global markets driven by foreign currency volatility, U.S. tax reform, debt concerns, the uncertainty caused by the United Kingdom's intention to withdraw from the European Union, and the trend of consolidation within the health care industry, impact our current performance and continue to represent a risk to our future performance.
CooperVision
- We compete in the worldwide contact lens market with our spherical, toric and multifocal contact lenses offered in a variety of materials including using silicone hydrogel Aquaform
®
technology and phosphorylcholine technology (PC) Technology™. We believe that there will be lower contact lens wearer dropout rates as technology improves and enhances the wearing experience through a combination of improved designs and materials and the growth of preferred modalities such as single-use and monthly wearing options. CooperVision is focused on greater worldwide market penetration using recently introduced products, and we continue to expand our presence in existing and emerging markets, including through acquisitions.
CooperVision acquired the following entities during the nine months ended July 31, 2018:
|
•
|
Blueyes in January 2018 - a long-standing distribution partner, which had a leading position in the distribution of contact lenses to the Optical and Pharmacy sector in Israel
|
|
•
|
Paragon Vision Sciences in December 2017 - a leading provider of orthokeratology (ortho-k) specialty contact lenses and oxygen permeable rigid contact lens materials
|
CooperVision acquired the following entities in fiscal 2017:
|
•
|
Procornea - a Netherlands based manufacturer of specialty contact lenses, which expanded CooperVision's access to myopia (nearsightedness) management markets with new products
|
|
•
|
Grand Vista LLC - a distributor in Russia of soft contact lenses
|
Sales of contact lenses utilizing silicone hydrogel materials continue to grow and this material represents about half of the industry. Our ability to compete successfully with a full range of silicone hydrogel products is an important factor to achieving our desired future levels of sales growth and profitability. CooperVision manufactures and markets a wide variety of silicone hydrogel contact lenses within the daily, two-week and monthly modalities along with manufacturing some of these lenses as toric and/or multifocal lenses. Single-use lenses are designed for daily replacement and frequently replaced lenses are designed for two-week or monthly replacement.
We market these lenses under a number of different brand names, including but not limited to Biofinity
®
,
MyDay
®
, Avaira
®
and clariti
®
. We manufacture CooperVision’s silicone hydrogel Biofinity brand spherical, toric and multifocal contact lenses, Avaira brand spherical and toric lenses and MyDay brand spherical and toric lenses using proprietary Aquaform technology to increase oxygen transmissibility for longer wear. Our silicone hydrogel clariti brand spherical, toric and multifocal contact lenses are available in monthly and single-use modalities. We believe the clariti single-use silicone hydrogel lens products provide a competitive advantage in approved markets as clariti is the only single-use silicone hydrogel lens available in all vision correction categories - spherical, toric and multifocal. We expect increasing aggregate demand for clariti 1day and MyDay products, as well as future single-use products.
CooperSurgical -
Our CooperSurgical business competes in the general health care market with a focus on advancing the health of families through a diversified portfolio of products and services focusing on women's health, fertility, diagnostics and contraception. CooperSurgical has established its market presence and distribution system by developing products and acquiring companies, products and services that complement its business model. CooperSurgical product sales are categorized based on the point of health care delivery including products used in medical office and surgical procedures primarily by obstetricians and gynecologists (ob/gyns) that represented 61% of CooperSurgical's net sales in the third quarter of fiscal 2018 compared to 45% in the prior year. The remaining sales are specialized products and services that mainly target the IVF process used in fertility including diagnostics testing that represented 39% of CooperSurgical's net sales in the third quarter of fiscal 2018 compared to 55% in the prior year. The change in product mix was primarily attributable to recent acquisitions discussed below, primarily PARAGARD which increased the percentage of revenues of office and surgical products.
27
THE COOPER COMPANIES, INC. AND SUBSIDIARIES
Item 2. Management’s Discussion and Analysis of Financial Condition
and Results of Operations
CooperSurgical acquired the following during the nine months ended July 31, 2018:
|
•
|
LifeGlobal Group on April 3, 2018 - a privately held company that specializes primarily in IVF media. LifeGlobal’s product categories include media products as well as IVF laboratory air filtration products and dishware. This acquisition fits CooperSurgical product portfolio and strengthens our fertility media offerings
|
|
•
|
PARAGARD on November 1, 2017 - CooperSurgical acquired the assets of the PARAGARD IUD business from Teva Pharmaceuticals Industries Limited for $1.1 billion. We acquired PARAGARD as the product broadens and strengthens CooperSurgical's current women's health product portfolio. PARAGARD is the only non-hormonal, long lasting, reversible contraceptive option approved by FDA available in the United States. IUDs represent a large and growing segment of the contraceptive market and this acquisition allows CooperSurgical to accelerate growth providing opportunities for operational synergies. In connection with the acquisition, we entered into a new five-year, $1.425 billion, senior unsecured term loan agreement.
|
In fiscal 2017, CooperSurgical acquired Wallace within Fertility, the IVF segment of Smiths Medical International Ltd. Wallace manufactures a range of IVF and ob/gyn products.
We intend to continue investing in CooperSurgical's business with the goal of expanding our integrated solutions model within the areas of women's health, fertility, diagnostics and contraception.
In the second quarter of fiscal 2018, CooperSurgical recognized an impairment charge of $24.4 million on the intangible assets acquired from Recombine Inc. as the cash flows expected to be generated by this asset group over its estimated remaining life were not sufficient to recover its carrying value. CooperSurgical acquired Recombine Inc. in fiscal 2016, a clinical genetic testing company specializing in carrier screening. In connection with the impairment charge, on June 1, 2018, CooperSurgical announced the exit of the carrier screening and non-invasive prenatal testing (NIPT) product lines in fertility. Exit and restructuring charges, consisting primarily of compensation and benefits to terminated employees, are expected to be approximately $10.0 - $15.0 million. We expect most of the exit and restructuring activities to be completed by end of the fiscal year 2018. The net loss from both product lines are not material to the Company's results of operations.
Capital Resources -
At
July 31, 2018
, we had
$155.6 million
in cash, primarily held outside the United States, and $999.5 million available under our syndicated revolving credit agreement. The $830.0 million term loan entered on March 1, 2016 and $1.425 billion term loan entered on November 1, 2017 remained outstanding at
July 31, 2018
.
On November 1, 2017, we entered into a $1.425 billion syndicated Term Loan Agreement (2017 Term Loan Agreement) with DNB Bank as administrative agent. We used funds from the 2017 Term Loan Agreement to fund the acquisition of PARAGARD, to repay outstanding amounts under the 2016 Credit Agreement, and for general corporate purposes. See Note 5. Debt of the Consolidated Financial Statements for additional information. On March 1, 2016, we entered into a syndicated revolving Credit and Term Loan Agreement with Keybank as administrative agent (2016 Credit Agreement). This agreement, maturing on March 1, 2021, provides for a multi-currency revolving credit facility in an aggregate principal amount of $1.0 billion and a term loan facility in the aggregate principal amount of $830.0 million.
The Company believes that current cash, cash equivalents, restricted cash, and future cash flow from operating activities will be sufficient to meet the Company’s anticipated cash needs, including working capital needs, capital expenditures and contractual obligations for at least 12 months from the issuance date of the financial statements included in this quarterly report. To the extent additional funds are necessary to meet our liquidity needs such as that for acquisitions, share repurchases, cash dividends or other activities as we execute our business strategy, we anticipate that additional funds will be obtained through the incurrence of additional indebtedness, additional equity financings or a combination of these potential sources of funds; however, such financing may not be available on favorable terms, or at all.
28
THE COOPER COMPANIES, INC. AND SUBSIDIARIES
Item 2. Management’s Discussion and Analysis of Financial Condition
and Results of Operations
Selected Statistical Information – Percentage of Sales and Growth
|
Three Months
|
Nine Months
|
||||||||||||||||
|
Percentage of Sales
|
2018 vs 2017 % Change
|
Percentage of Sales
|
2018 vs 2017 % Change
|
||||||||||||||
|
Periods Ended July 31,
|
2018
|
2017
|
2018
|
2017
|
|||||||||||||
|
Net sales
|
100
|
%
|
100
|
%
|
19
|
%
|
100
|
%
|
100
|
%
|
19
|
%
|
|||||
|
Cost of sales
|
35
|
%
|
36
|
%
|
17
|
%
|
36
|
%
|
36
|
%
|
20
|
%
|
|||||
|
Gross profit
|
65
|
%
|
64
|
%
|
20
|
%
|
64
|
%
|
64
|
%
|
19
|
%
|
|||||
|
Selling, general and administrative expense
|
38
|
%
|
38
|
%
|
20
|
%
|
39
|
%
|
37
|
%
|
23
|
%
|
|||||
|
Research and development expense
|
3
|
%
|
3
|
%
|
29
|
%
|
3
|
%
|
3
|
%
|
23
|
%
|
|||||
|
Amortization of intangibles
|
6
|
%
|
3
|
%
|
120
|
%
|
6
|
%
|
3
|
%
|
118
|
%
|
|||||
|
Impairment of intangibles
|
—
|
%
|
—
|
%
|
—
|
%
|
1
|
%
|
—
|
%
|
—
|
%
|
|||||
|
Operating income
|
18
|
%
|
20
|
%
|
2
|
%
|
15
|
%
|
20
|
%
|
(13
|
)%
|
|||||
Net Sales
|
Periods Ended July 31,
|
Three Months
|
Nine Months
|
|||||||||||||||||||||||||
|
($ in millions)
|
2018
|
2017
|
Increase (Decrease)
|
2018 vs 2017 % Change
|
2018
|
2017
|
Increase (Decrease)
|
2018 vs 2017 % Change
|
|||||||||||||||||||
|
CooperVision
|
$
|
489.1
|
|
$
|
437.3
|
|
$
|
51.8
|
|
12
|
%
|
$
|
1,401.4
|
|
$
|
1,235.0
|
|
$
|
166.4
|
|
13
|
%
|
|||||
|
CooperSurgical
|
170.9
|
|
118.7
|
|
52.2
|
|
44
|
%
|
479.9
|
|
342.5
|
|
137.4
|
|
40
|
%
|
|||||||||||
|
Net sales
|
$
|
660.0
|
|
$
|
556.0
|
|
$
|
104.0
|
|
19
|
%
|
$
|
1,881.3
|
|
$
|
1,577.5
|
|
$
|
303.8
|
|
19
|
%
|
|||||
CooperVision Net Sales
The contact lens market has two major product categories:
|
•
|
Spherical lenses including lenses that correct near- and farsightedness uncomplicated by more complex visual defects
|
|
•
|
Toric and multifocal lenses including lenses that, in addition to correcting near- and farsightedness, address more complex visual defects such as astigmatism and presbyopia by adding optical properties of cylinder and axis, which correct for irregularities in the shape of the cornea
|
29
THE COOPER COMPANIES, INC. AND SUBSIDIARIES
Item 2. Management’s Discussion and Analysis of Financial Condition
and Results of Operations
CooperVision Net Sales by Category


|
Three Months Ended July 31,
|
|||||||||||
|
($ in millions)
|
2018
|
2017
|
2018 vs 2017 % Change
|
||||||||
|
Toric
|
$
|
153.6
|
|
$
|
138.3
|
|
11
|
%
|
|||
|
Multifocal
|
52.7
|
|
46.8
|
|
13
|
%
|
|||||
|
Single-use spheres
|
137.6
|
|
115.8
|
|
19
|
%
|
|||||
|
Non single-use sphere, other
|
145.2
|
|
136.4
|
|
7
|
%
|
|||||
|
$
|
489.1
|
|
$
|
437.3
|
|
12
|
%
|
||||
30
THE COOPER COMPANIES, INC. AND SUBSIDIARIES
Item 2. Management’s Discussion and Analysis of Financial Condition
and Results of Operations
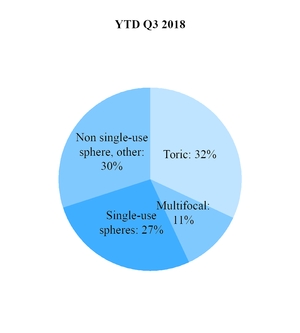
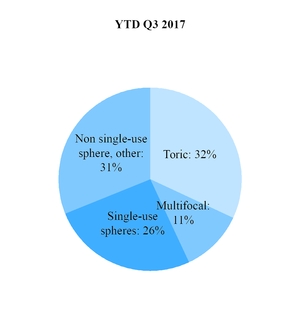
|
Nine Months Ended July 31,
|
|||||||||||
|
($ in millions)
|
2018
|
2017
|
2018 vs 2017 % Change
|
||||||||
|
Toric
|
$
|
442.2
|
|
$
|
390.8
|
|
13
|
%
|
|||
|
Multifocal
|
148.8
|
|
132.1
|
|
13
|
%
|
|||||
|
Single-use spheres
|
378.3
|
|
319.5
|
|
18
|
%
|
|||||
|
Non single-use sphere, other
|
432.1
|
|
392.6
|
|
10
|
%
|
|||||
|
$
|
1,401.4
|
|
$
|
1,235.0
|
|
13
|
%
|
||||
In the three and nine months ended July 31, 2018:
|
•
|
Toric and multifocal lenses grew primarily through the success of our Biofinity, clariti and MyDay portfolios
|
|
•
|
Single-use sphere lenses growth was primarily attributed to clariti and MyDay lenses
|
|
•
|
Non-single-use sph
eres grew primarily on sales of Biofinity
|
|
•
|
Increased sales of silicone hydrogel products in all categories were partially offset by lower sales of older hydrogel products. Total silicone hydrogel products grew 17% in the third quarter of fiscal 2018, representing 69% of net sales compared to 66% in the prior fiscal year, and grew 19% in the nine months ended July 31, 2018, representing 68% of net sales compared to 65% in the same prior year period
|
|
•
|
Foreign exchange rates positively increased sales by $52.8 million in the nine months ended July 31, 2018, primarily attributable to the Euro and British Pound
|
|
•
|
"Other" products primarily include lens care which represent approximately 2% and 3% of net sales in the three and nine months ended July 31, 2018, respectively
|
|
•
|
Sales growth was driven primarily by increases in the volume of lenses sold. Average realized prices by product did not materially influence sales growth
|
31
THE COOPER COMPANIES, INC. AND SUBSIDIARIES
Item 2. Management’s Discussion and Analysis of Financial Condition
and Results of Operations
CooperVision Net Sales by Geography
CooperVision competes in the worldwide soft contact lens market and services three primary regions: the Americas, EMEA (Europe, Middle East and Africa) and Asia Pacific.
|
Periods Ended July 31,
|
|
Three Months
|
|
Nine Months
|
||||||||||||||||||
|
($ in millions)
|
|
2018
|
|
2017
|
|
2018 vs 2017 % Change
|
|
2018
|
|
2017
|
|
2018 vs 2017 % Change
|
||||||||||
|
Americas
|
|
$
|
184.4
|
|
|
$
|
168.7
|
|
|
9
|
%
|
|
$
|
537.1
|
|
|
$
|
503.6
|
|
|
7
|
%
|
|
EMEA
|
|
199.2
|
|
|
179.9
|
|
|
11
|
%
|
|
560.4
|
|
|
477.3
|
|
|
17
|
%
|
||||
|
Asia Pacific
|
|
105.5
|
|
|
88.7
|
|
|
19
|
%
|
|
303.9
|
|
|
254.1
|
|
|
20
|
%
|
||||
|
|
|
$
|
489.1
|
|
|
$
|
437.3
|
|
|
12
|
%
|
|
$
|
1,401.4
|
|
|
$
|
1,235.0
|
|
|
13
|
%
|
CooperVision's regional growth was primarily attributed to market gains of silicone hydrogel contact lenses and positive foreign exchange rates in EMEA. Refer to CooperVision Net Sales by Category above for further discussion.
CooperSurgical Net Sales by Category
CooperSurgical supplies the family health care market with a diversified portfolio of products and services for use in surgical and other medical procedures that are performed primarily by obstetricians and gynecologists in hospitals, surgical centers, fertility clinics and the medical office. Fertility offerings include highly specialized products and services that target the IVF process with a goal to make fertility treatment safer, more efficient and convenient.
The chart below shows the percentage of revenue of office and surgical products and fertility.
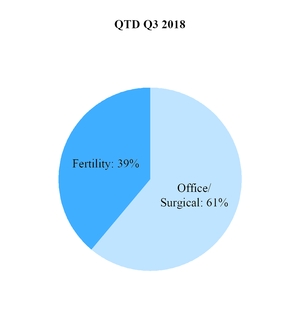
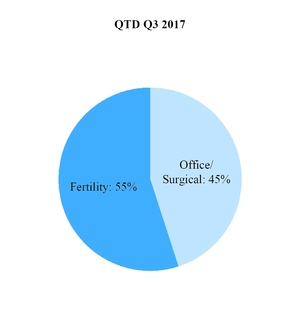
32
THE COOPER COMPANIES, INC. AND SUBSIDIARIES
Item 2. Management’s Discussion and Analysis of Financial Condition
and Results of Operations

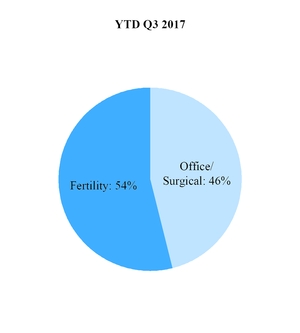
The change in product mix was attributable to recent acquisitions, primarily PARAGARD which increased the revenue of office and surgical products.
|
Periods Ended July 31,
|
Three Months
|
Nine Months
|
||||||||||||||||||||
|
($ in millions)
|
2018
|
2017
|
2018 vs 2017 % Change
|
2018
|
2017
|
2018 vs 2017 % Change
|
||||||||||||||||
|
Office and surgical products
|
$
|
104.4
|
|
$
|
53.2
|
|
96
|
%
|
$
|
290.4
|
|
$
|
159.1
|
|
83
|
%
|
||||||
|
Fertility
|
$
|
66.5
|
|
$
|
65.5
|
|
2
|
%
|
$
|
189.5
|
|
$
|
183.4
|
|
3
|
%
|
||||||
|
$
|
170.9
|
|
$
|
118.7
|
|
44
|
%
|
$
|
479.9
|
|
$
|
342.5
|
|
40
|
%
|
|||||||
In the three and nine months ended July 31, 2018:
|
•
|
CooperSurgical’s net sales growth was primarily due to incremental revenues from the acquisition of PARAGARD IUD, which is categorized in office and surgical products
|
|
•
|
Fertility net sales increased compared to the prior year periods, primarily due to increased sales of IVF equipment and consumables and incremental revenue from LifeGlobal, partially offset by a decrease in diagnostics revenue
|
|
•
|
Office and surgical products increased compared to prior year periods due to continued growth in surgical products and recently acquired products, primarily PARAGARD
|
|
•
|
Unit growth and product mix positively influenced sales growth
|
33
THE COOPER COMPANIES, INC. AND SUBSIDIARIES
Item 2. Management’s Discussion and Analysis of Financial Condition
and Results of Operations
Gross Profit
|
Gross Profit Percentage of Net Sales
|
Three Months
|
Nine Months
|
||||||||||
|
Periods Ended July 31,
|
2018
|
2017
|
2018
|
2017
|
||||||||
|
CooperVision
|
66
|
%
|
65
|
%
|
66
|
%
|
65
|
%
|
||||
|
CooperSurgical
|
62
|
%
|
61
|
%
|
58
|
%
|
61
|
%
|
||||
|
Consolidated
|
65
|
%
|
64
|
%
|
64
|
%
|
64
|
%
|
||||
CooperVision's gross profit in the three and nine months ended July 31, 2018, was positively impacted by the increase in sales of higher margin products including Biofinity and favorable impact to revenue from exchange rate fluctuations. This was offset by $1.9 million and $11.8 million of primarily product transition, integration, and costs associated with the impact of Hurricane Maria on our Puerto Rico manufacturing facility in the three and nine months ended July 31, 2018, respectively.
CooperSurgical's gross margin in the three and nine months ended July 31, 2018, was positively impacted by the inclusion of our PARAGARD IUD product with higher gross margin; however, it was offset by:
|
•
|
$12.7 million and $49.3 million, respectively, of inventory step-up relating to the PARAGARD and LifeGlobal acquisitions; and
|
|
•
|
$3.6 million and $11.5 million, respectively, of primarily integration and acquisition costs.
|
Selling, General and Administrative Expense (SGA)
|
Three Months Ended July 31,
($ in millions) |
2018
|
% Net
Sales
|
2017
|
% Net
Sales
|
2018 vs 2017 % Change
|
||||||||||||
|
CooperVision
|
$
|
168.9
|
|
35
|
%
|
$
|
153.2
|
|
35
|
%
|
10
|
%
|
|||||
|
CooperSurgical
|
70.7
|
|
41
|
%
|
43.9
|
|
37
|
%
|
61
|
%
|
|||||||
|
Corporate
|
11.4
|
|
—
|
|
11.6
|
|
—
|
|
(2
|
)%
|
|||||||
|
$
|
251.0
|
|
38
|
%
|
$
|
208.7
|
|
38
|
%
|
20
|
%
|
||||||
|
Nine Months Ended July 31,
($ in millions)
|
2018
|
% Net
Sales
|
2017
|
% Net
Sales
|
2018 vs 2017 % Change
|
||||||||||||
|
CooperVision
|
$
|
490.9
|
|
35
|
%
|
$
|
432.3
|
|
35
|
%
|
14
|
%
|
|||||
|
CooperSurgical
|
190.6
|
|
40
|
%
|
121.8
|
|
36
|
%
|
56
|
%
|
|||||||
|
Corporate
|
43.2
|
|
—
|
|
36.5
|
|
—
|
|
18
|
%
|
|||||||
|
$
|
724.7
|
|
39
|
%
|
$
|
590.6
|
|
37
|
%
|
23
|
%
|
||||||
CooperVision's SGA increases in the three and nine months ended July 31, 2018 compared to fiscal 2017 were due to investments to support our long-term objectives, including increased headcount in sales, marketing and G&A, investments in information technology and higher distribution expenses to support revenue growth. CooperVision's SGA in the three and nine months ended July 31, 2018 included $1.3 million and $6.7 million of integration and third-party consulting costs, respectively. CooperVision's SGA in the prior year periods included $6.3 million and $10.3 million of acquisition costs and legal costs primarily related to UPP in the three and nine months ended July 31, 2017, respectively.
The increases in CooperSurgical's SGA in the three and nine months ended July 31, 2018 compared to fiscal 2017 in absolute dollars and as a percentage of sales were primarily due to the addition of PARAGARD marketing expenses and sales headcount investment to support growth. CooperSurgical's SGA in the three and nine months ended July 31, 2018, included $11.0 million and $25.8 million, respectively, of primarily acquisition and integration expenses of acquired companies, and carrier screening and NIPT exit costs. CooperSurgical's SGA in the prior year periods included
34
THE COOPER COMPANIES, INC. AND SUBSIDIARIES
Item 2. Management’s Discussion and Analysis of Financial Condition
and Results of Operations
$3.7 million and $10.1 million of primarily acquisitions and integration expenses from acquisition in the three and nine months ended July 31, 2017, respectively.
The increases in Corporate SGA in the nine months ended July 31, 2018 compared to fiscal 2017 were primarily due to $6.2 million of compensation costs related to executives' retirements.
Research and Development Expense (R&D)
|
Three Months Ended July 31,
($ in millions) |
2018
|
% Net
Sales |
2017
|
% Net
Sales |
2018 vs 2017 % Change
|
||||||||||||
|
CooperVision
|
$
|
14.6
|
|
3
|
%
|
$
|
11.7
|
|
3
|
%
|
24
|
%
|
|||||
|
CooperSurgical
|
7.9
|
|
5
|
%
|
5.8
|
|
5
|
%
|
38
|
%
|
|||||||
|
$
|
22.5
|
|
3
|
%
|
$
|
17.5
|
|
3
|
%
|
29
|
%
|
||||||
|
Nine Months Ended July 31,
($ in millions)
|
2018
|
% Net
Sales |
2017
|
% Net
Sales |
2018 vs 2017 % Change
|
||||||||||||
|
CooperVision
|
$
|
39.7
|
|
3
|
%
|
$
|
34.6
|
|
3
|
%
|
15
|
%
|
|||||
|
CooperSurgical
|
22.5
|
|
5
|
%
|
16.0
|
|
5
|
%
|
41
|
%
|
|||||||
|
$
|
62.2
|
|
3
|
%
|
$
|
50.6
|
|
3
|
%
|
23
|
%
|
||||||
In the three and nine months ended July 31, 2018:
|
•
|
CooperVision's R&D increased mainly due to increased costs from acquisitions and increases in headcount. As a percentage of sales, R&D expense remained flat. CooperVision's R&D activities are primarily focused on the development of contact lenses and manufacturing technology and process enhancements.
|
|
•
|
The increases in CooperSurgical's R&D were primarily due to increased investment and activities in developing new projects. As a percentage of sales, R&D expense remained flat. CooperSurgical's R&D activities include diagnostics, IVF product development and the design and upgrade of surgical procedure devices.
|
Amortization Expense
|
Three Months Ended July 31,
($ in millions) |
2018
|
% Net
Sales |
2017
|
% Net
Sales |
2018 vs 2017 % Change
|
|||||||||||
|
CooperVision
|
$
|
11.8
|
|
2
|
%
|
$
|
9.0
|
|
2
|
%
|
31
|
%
|
||||
|
CooperSurgical
|
25.9
|
|
15
|
%
|
8.2
|
|
7
|
%
|
218
|
%
|
||||||
|
$
|
37.7
|
|
6
|
%
|
$
|
17.2
|
|
3
|
%
|
120
|
%
|
|||||
|
Nine Months Ended July 31,
($ in millions)
|
2018
|
% Net
Sales |
2017
|
% Net
Sales |
2018 vs 2017 % Change
|
|||||||||||
|
CooperVision
|
$
|
33.2
|
|
2
|
%
|
$
|
26.7
|
|
2
|
%
|
24
|
%
|
||||
|
CooperSurgical
|
77.3
|
|
16
|
%
|
23.9
|
|
7
|
%
|
224
|
%
|
||||||
|
$
|
110.5
|
|
6
|
%
|
$
|
50.6
|
|
3
|
%
|
118
|
%
|
|||||
The increases in amortization expense in the three and nine months ended July 31, 2018 compared to prior year periods were primarily due to amortization of intangible assets acquired in recent acquisitions in CooperVision and CooperSurgical, primarily PARAGARD which increased amortization expense by $17.7 million and $53.2 million in the three and nine months ended July 31, 2018, respectively.
35
THE COOPER COMPANIES, INC. AND SUBSIDIARIES
Item 2. Management’s Discussion and Analysis of Financial Condition
and Results of Operations
Impairment of Intangible Assets
In the second quarter of fiscal 2018, CooperSurgical recognized an impairment charge of $24.4 million on the intangible assets acquired from Recombine Inc. as the cash flows expected to be generated by this asset group over its estimated remaining life were not sufficient to recover its carrying value. CooperSurgical acquired Recombine Inc., a clinical genetic testing company specializing in carrier screening, in fiscal 2016. In connection with the impairment charge, on June 1, 2018, CooperSurgical announced the exit of the carrier screening and NIPT product lines in fertility. We expect exit and restructuring charges, consisting primarily of compensation and benefits to terminated employees, to be approximately $10.0 - $15.0 million. We expect most of the exit and restructuring activities to be completed by the end of fiscal 2018. The net loss from both product lines are not material to our results of operations.
Operating Income
|
Three Months Ended July 31,
($ in millions) |
2018
|
% Net
Sales |
2017
|
% Net
Sales |
2018 vs 2017 % Change
|
||||||||||||
|
CooperVision
|
$
|
125.4
|
|
26
|
%
|
$
|
109.5
|
|
25
|
%
|
15
|
%
|
|||||
|
CooperSurgical
|
1.6
|
|
1
|
%
|
14.9
|
|
13
|
%
|
(89
|
)%
|
|||||||
|
Corporate
|
(11.4
|
)
|
—
|
|
(11.6
|
)
|
—
|
|
2
|
%
|
|||||||
|
$
|
115.6
|
|
18
|
%
|
$
|
112.8
|
|
20
|
%
|
2
|
%
|
||||||
|
Nine Months Ended July 31,
($ in millions)
|
2018
|
% Net
Sales |
2017
|
% Net
Sales |
2018 vs 2017 % Change
|
||||||||||||
|
CooperVision
|
$
|
361.1
|
|
26
|
%
|
$
|
308.9
|
|
25
|
%
|
17
|
%
|
|||||
|
CooperSurgical
|
(37.5
|
)
|
(8
|
)%
|
48.2
|
|
14
|
%
|
(178
|
)%
|
|||||||
|
Corporate
|
(43.2
|
)
|
—
|
|
(36.5
|
)
|
—
|
|
(18
|
)%
|
|||||||
|
$
|
280.4
|
|
15
|
%
|
$
|
320.6
|
|
20
|
%
|
(13
|
)%
|
||||||
CooperVision operating income increased due to the favorable effect of exchange rate fluctuations and improved sales of higher margin products including Biofinity. CooperSurgical operating income decreased due to higher operating expenses relating to acquisitions, including the PARAGARD inventory step up, amortization and impairment of intangibles. Corporate operating loss increased in the nine months ended July 31, 2018, primarily due to higher compensation costs related to executives' retirements. On a consolidated basis, operating income declined in the nine months ended July 31, 2018 due to CooperSurgical's lower operating income.
Interest Expense
|
Three Months Ended July 31,
($ in millions) |
2018
|
% Net
Sales |
2017
|
% Net
Sales |
2018 vs 2017 % Change
|
|||||||||||
|
Interest expense
|
$
|
22.8
|
|
3
|
%
|
$
|
8.3
|
|
2
|
%
|
174
|
%
|
||||
|
Nine Months Ended July 31,
($ in millions)
|
2018
|
% Net
Sales |
2017
|
% Net
Sales |
2018 vs 2017 % Change
|
|||||||||||
|
Interest expense
|
$
|
59.9
|
|
3
|
%
|
$
|
23.3
|
|
1
|
%
|
157
|
%
|
||||
The increase in interest expense in absolute dollars and as a percentage of sales reflects higher average debt balances as a result of debt incurred in connection with 2018 acquisitions mainly due to the $1.425 billion term loan entered into on November 1, 2017 to primarily fund the PARAGARD acquisition, as well as higher interest rates.
36
THE COOPER COMPANIES, INC. AND SUBSIDIARIES
Item 2. Management’s Discussion and Analysis of Financial Condition
and Results of Operations
Other Expense (Income), Net
|
Periods Ended July 31,
|
Three Months
|
Nine Months
|
||||||||||||||
|
($ in millions)
|
2018
|
2017
|
2018
|
2017
|
||||||||||||
|
Foreign exchange loss (gain)
|
$
|
2.7
|
|
$
|
(2.8
|
)
|
$
|
1.7
|
|
$
|
—
|
|
||||
|
Other, net
|
(0.3
|
)
|
(0.4
|
)
|
(0.4
|
)
|
(0.1
|
)
|
||||||||
|
$
|
2.4
|
|
$
|
(3.2
|
)
|
$
|
1.3
|
|
$
|
(0.1
|
)
|
|||||
Foreign exchange loss (gain) primarily resulted from the revaluation and settlement of foreign currencies-denominated balances.
Provision for Income Taxes
The Company's effective tax rates were a benefit of
11.5%
and expense of
3.8%
for the third quarters of fiscal 2018 and 2017, respectively, and an expense of
82.1%
and
4.4%
for the first nine months of fiscal 2018 and 2017, respectively. The decrease in our effective tax rate for the third quarter of fiscal 2018 compared to the third quarter of fiscal 2017 was due primarily to a reduction in U.S. income related to acquisition and integration activities in CooperSurgical and a decrease of $5.3 million to the provisional tax expense recorded in the first quarter of fiscal 2018 relating to the 2017 Act. The increase in our effective tax rate for the first nine months of fiscal 2018 compared to the first nine months of fiscal 2017 was primarily due to the charge of $196.7 million related to the 2017 Act. Our effective tax rate for the first nine months of fiscal 2018 was higher than the U.S. statutory rate because of the discrete tax expense relating to the 2017 Act, which was partially offset by a favorable mix of income from our foreign jurisdictions with lower tax rates and an excess tax benefit from share-based compensation. Our effective tax rate for the first nine months of fiscal 2017 was lower than the U.S. statutory rate primarily because of a favorable mix of income from our foreign jurisdictions with lower tax rates and an excess tax benefit from share-based compensation.
ASC 740,
Income Taxes
, requires companies to recognize the effect of the tax law changes in the period of enactment. However, in December 2017, the SEC provided regulatory guidance for accounting referred to as SAB 118. Under the guidance in SAB 118, the income tax effects for which the accounting under ASC 740 is incomplete, are reported as a provisional amount based on a reasonable estimate. The reasonable estimate is subject to adjustment during a "measurement period," not to exceed one year, until the accounting is complete. The estimate is also subject to the finalization of management’s analysis related to certain matters, such as developing interpretations of the provision, changes to certain estimates and amounts related to the earnings and profits of certain subsidiaries and the filing of tax returns. The Company recorded a provisional charge for the first quarter of fiscal 2018 and has updated the charge in the third quarter of fiscal 2018, utilizing the most recent information and guidance available related to the calculation of the tax liability and the impact to its deferred tax assets and liabilities, including those recorded for foreign local and withholding taxes that the Company assessed as of July 31, 2018. The provisional charge may require further adjustments and changes to the Company’s estimates as new guidance is made available. Revisions to the provisional charge may be material to the Company's financial results and will be recorded in the quarter in which we complete the analysis.
37
THE COOPER COMPANIES, INC. AND SUBSIDIARIES
Item 2. Management’s Discussion and Analysis of Financial Condition
and Results of Operations
Share-Based Compensation Plans
Cooper has several share-based compensation plans that are described in our Annual Report on Form 10-K for the fiscal year ended October 31, 2017. The compensation expense and related income tax benefit recognized in our consolidated condensed financial statements for share-based awards were as follows:
|
Periods Ended July 31,
|
Three Months
|
Nine Months
|
||||||||||||||
|
($ in millions)
|
2018
|
2017
|
2018
|
2017
|
||||||||||||
|
Selling, general and administrative expense
|
$
|
6.7
|
|
$
|
7.7
|
|
$
|
30.3
|
|
$
|
24.9
|
|
||||
|
Cost of sales
|
0.9
|
|
(0.1
|
)
|
2.6
|
|
1.9
|
|
||||||||
|
Research and development expense
|
0.5
|
|
0.3
|
|
1.6
|
|
0.9
|
|
||||||||
|
Total share-based compensation expense
|
$
|
8.1
|
|
$
|
7.9
|
|
$
|
34.5
|
|
$
|
27.7
|
|
||||
|
Related income tax benefit
|
$
|
1.5
|
|
$
|
2.6
|
|
$
|
7.1
|
|
$
|
8.5
|
|
||||
38
THE COOPER COMPANIES, INC. AND SUBSIDIARIES
Item 2. Management’s Discussion and Analysis of Financial Condition
and Results of Operations
Capital Resources and Liquidity
Third
Quarter Highlights
|
•
|
Operating cash flow was $235.3 million compared to $154.6 million in the prior year period
|
|
•
|
Expenditures for purchases of property, plant and equipment were $52.3 million compared to $38.1 million in the prior year period
|
Nine-Month Highlights
|
•
|
Operating cash flow was $432.3 million compared to $394.6 million in the prior year period
|
|
•
|
Expenditures for purchases of property, plant and equipment were $150.2 million compared to $95.4 million in the prior year period
|
|
•
|
Cash payments for acquisitions of $1,320.8 million, primarily PARAGARD, compared to $197.0 million in the prior year period
|
|
•
|
There was no share repurchase activity during fiscal 2018, compared to $29.5 million of share repurchases in the prior year period
|
Comparative Statistics
|
($ in millions)
|
July 31, 2018
|
October 31, 2017
|
||||||
|
Cash and cash equivalents
|
$
|
155.6
|
|
$
|
88.8
|
|
||
|
Total assets
|
$
|
6,256.9
|
|
$
|
4,858.7
|
|
||
|
Working capital
|
$
|
727.4
|
|
$
|
557.1
|
|
||
|
Total debt
|
$
|
2,294.2
|
|
$
|
1,172.7
|
|
||
|
Stockholders' equity
|
$
|
3,226.6
|
|
$
|
3,175.8
|
|
||
|
Ratio of debt to equity
|
0.71:1
|
|
0.37:1
|
|
||||
|
Debt as a percentage of total capitalization
|
42
|
%
|
27
|
%
|
||||
Working Capital
The increase in working capital at
July 31, 2018
from the end of fiscal 2017 was primarily due to increase in cash ($66.8 million), accounts receivable ($59.0 million) from increased revenue, prepayments and other current assets ($84.3 million) primarily from the $42.0 million payment to UK Tax Authorities relating to DPT, inventories ($25.5 million) and decrease of accounts payable ($21.3 million). This was partially offset by the increase in accrued and other current liabilities ($60.6 million) and short term notes payable ($21.9 million).
At
July 31, 2018
, our inventory months on hand were 6.2 compared to 6.5 at October 31, 2017. The $25.5 million increase in inventories was primarily due to increase in finished goods and raw materials to support product launches and production levels. Our days sales outstanding (DSO) were 56 days at
July 31, 2018
, compared to 53 days at October 31, 2017 and 54 days at July 31, 2017. The increase in DSO was primarily due to higher accounts receivable from increased revenue.
We have reviewed our needs in the United States and have determined there is sufficient cash to fund working capital without repatriating cash from our foreign subsidiaries. For purposes of recording the provisional tax expense for the nine months ended July 31, 2018, we are no longer asserting that earnings from our foreign subsidiaries are indefinitely reinvested. However, the Company has not completed its analysis and will make a final decision within the measurement period. If the Company changes its assertion to not indefinitely reinvest foreign earnings, there will be more flexibility in using the cash from our foreign operations to fund future working capital in the United States.
39
THE COOPER COMPANIES, INC. AND SUBSIDIARIES
Item 2. Management’s Discussion and Analysis of Financial Condition
and Results of Operations
Accounts Receivable Factoring Program - We may factor certain designated trade receivables with one or more third party financial institutions pursuant to a factoring agreement. These are non-recourse factoring arrangements to assist us in managing operating cash flow and meet the requirements to be accounted for as sales in accordance with the “Transfers and Servicing” guidance in ASC 860, where the Company’s continuing involvement subsequent to the transfer is limited to providing certain servicing and collection actions on behalf of the purchasers of the designated trade receivables. See Note 1. General of the Consolidated Financial Statements for additional information.
Operating Cash Flow
Cash provided by operating activities increased by $37.7 million from $394.6 million in the first nine months of fiscal 2017 to $432.3 million in the first nine months of fiscal 2018. This increase in cash flow provided by operating activities primarily consists of an increase of $365.2 million in non-cash items, from $169.0 million in the first nine months of fiscal 2017 to $534.2 million in the first nine months of fiscal 2018. This increase was offset by a decrease in net income of $245.1 million from $284.3 million in the first nine months of fiscal 2017 to $39.2 million in the first nine months of fiscal 2018, primarily due to $196.7 million of provisional tax expense related to the 2017 Act and a decrease of $82.4 million in the net cash outflow from changes in operating capital, from $(58.7) million in the first nine months of fiscal 2017 to $(141.1) million in the first nine months of fiscal 2018.
The $365.2 million increase from non-cash items compared to the prior year period is primarily due to an increase in long-term liabilities of $171.7 million primarily from a provisional tax expense for the mandatory deemed repatriation of deferred foreign earnings under the 2017 Act, a $63.4 million increase in depreciation and amortization, a $50.2 million release of a fair value adjustment to inventory acquired mainly from PARAGARD, impairment of intangibles of $24.4 million, increase in deferred tax of $20.0 million primarily from changes to the deferred taxes resulting from the U.S. federal rate, and increase in share-based compensation expense of $6.2 million.
The $82.4 million decrease in the net cash outflow from changes in operating capital compared to the prior year period is due to a $46.6 million increase in receivables, primarily due to increase in working capital, a $42.6 million increase in prepayments and other assets due to a $42.0 million payment to the U.K. Tax Authorities, and $19.6 million decrease in accounts payable, partially offset by $26.2 million increase in accrued liabilities.
Investing Cash Flow
Cash used in investing activities increased by $1,178.6 million to $1,471.0 million in the first nine months of fiscal 2018. The increase was driven by a $54.8 million increase in capital expenditures, primarily due to increase distribution and manufacturing capacity, and an increase in payments for business and asset acquisitions of $1,123.8 million. The increase in payments related to acquisitions was largely due to the acquisition of PARAGARD as discussed in Outlook above and in Note 2. Acquisitions.
In the prior period, payments related to the acquisitions of Wallace and Grand Vista LLC.
Financing Cash Flow
Cash provided by financing activities increased by $1,268.6 million to $1,107.7 million in the first nine months of fiscal 2018. The increase was driven by a $1,021.8 million increase of net proceeds from long-term debt due to additional debt taken on to fund the PARAGARD acquisition and a $223.3 million change in short-term notes payable.
The 2017 Term Loan Agreement contains customary restrictive covenants, as well as financial covenants that require the Company to maintain a certain Total Leverage Ratio and Interest Coverage Ratio (each as defined in the 2017 Term Loan Agreement) consistent with the 2016 Credit Agreement. As defined, in both the 2017 Term Loan Agreement and the 2016 Credit Agreement, we are required to maintain an Interest Coverage Ratio of at least 3.00 to 1.00, and a Total Leverage Ratio of no higher than 3.75 to 1.00.
40
THE COOPER COMPANIES, INC. AND SUBSIDIARIES
and Results of Operations
At
July 31, 2018
, we had
$999.5 million
available under the 2016 Credit Agreement. We are in compliance with our financial covenants including the Interest Coverage Ratio at
12.50
to
1.00
and the Total Leverage Ratio at
2.45
to
1.00
for both the 2017 Term Loan Agreement and the 2016 Credit Agreement.
Share Repurchase
In December 2011, our Board of Directors authorized the 2012 Share Repurchase Program and through subsequent amendments, the most recent in March 2017, the total repurchase authorization was increased from $500.0 million to $1.0 billion of the Company's common stock. The program has no expiration date and may be discontinued at any time. We did not repurchase any shares during the nine months ended July 31, 2018. At July 31, 2018, we had remaining authorization to repurchase $563.5 million of our common stock.
Estimates and Critical Accounting Policies
Information regarding estimates and critical accounting policies is included in Management's Discussion and Analysis on Form 10-K for the fiscal year ended October 31, 2017. There have been no material changes in our policies from those previously discussed in our Form 10-K for the fiscal year October 31, 2017.
Accounting Pronouncements
Information regarding new accounting pronouncements is included in Note 1. General.
Trademarks
Aquaform
®
, Avaira
®
, Avaira Vitality
®
,
Biofinity
®
, MyDay
®
and Proclear
®
are registered trademarks of The Cooper Companies, Inc., its affiliates and/or subsidiaries. PC Technology™, FIPS™, and A Quality of Life Company™ are trademarks of The Cooper Companies, Inc., its affiliates and/or subsidiaries. The clariti
®
mark is a registered trademark of The Cooper Companies, Inc., its affiliates and/or subsidiaries worldwide except in the United States where the use of clariti
®
is licensed. PARAGARD
®
is a registered trademark of CooperSurgical, Inc.
41
Most of our operations outside the United States have their local currency as their functional currency. We are exposed to risks caused by changes in foreign exchange, principally our British pound sterling, euro, Japanese yen, Danish krone, Swedish krona and Australian dollar denominated debt and receivables denominated in currencies other than the United States dollar, and from operations in other foreign currencies. Although we may enter into foreign exchange agreements with financial institutions to reduce our exposure to fluctuations in foreign currency values relative to our debt or receivables obligations, these hedging transactions do not eliminate that risk entirely. We are also exposed to risks associated with changes in interest rates, as the interest rates on our revolving lines of credit and term loans may vary with the federal funds rate and LIBO rate. We may decrease this interest rate risk by hedging a portion of variable rate debt effectively converting it to fixed rate debt for varying periods. The Company did not have any derivative assets or liabilities that may include interest rate swaps, cross currency swaps or foreign currency forward contracts as of
July 31, 2018
and October 31, 2017.
On March 1, 2016, we entered into a syndicated Revolving Credit and Term Loan Agreement (2016 Credit Agreement) with Keybank as administrative agent. The agreement provides for a multicurrency revolving credit facility in an aggregate principal amount of $1.0 billion and a term loan facility in the aggregate principal amount of $830.0 million. The 2016 Credit Agreement replaced our previous credit agreement and funds from the new term loan were used to repay the outstanding amounts under the previous credit agreement, to partially repay our other outstanding term loans and for general corporate purposes. At
July 31, 2018
, we had
$999.5 million
available under the revolving credit facility and $830.0 million outstanding under the term loan.
On November 1, 2017, in connection with the PARAGARD acquisition, we entered into a new
five
-year,
$1.425 billion
, senior unsecured term loan agreement (2017 Term Loan Agreement) by and among the Company, the lenders party thereto and DNB Bank ASA, New York Branch, as administrative agent which matures on November 1, 2022. The Company used part of the facility to fund the PARAGARD acquisition and used the remainder of the funds to partially repay outstanding borrowings under our revolving credit agreement. At July 31, 2018, we had $1.425 billion outstanding under the term loan.
If interest rates were to increase or decrease by 1% or 100 basis points, quarterly interest expense would increase or decrease by approximately $6.1 million based on average debt outstanding for the third fiscal quarter of 2018.
See Note 5. Debt of the Consolidated Financial Statements for additional information.
42
Evaluation of Disclosure Controls and Procedures
Based on management’s evaluation (with the participation of our Chief Executive Officer (our Principal Executive Officer) and Chief Financial Officer (our Principal Financial Officer)), as of the end of the period covered by this report, our Chief Executive Officer and Chief Financial Officer have concluded that our disclosure controls and procedures (as defined in Rules 13a-15(e) and 15d-15(e) under the Securities Exchange Act of 1934, as amended, (the “Exchange Act”)) are effective to provide reasonable assurance that information required to be disclosed by us in reports that we file or submit under the Exchange Act is recorded, processed, summarized and reported within the time periods specified in Securities and Exchange Commission rules and forms and is accumulated and communicated to management, including our Chief Executive Officer and Chief Financial Officer, as appropriate to allow timely decisions regarding required disclosure.
Changes in Internal Control over Financial Reporting
On November 1, 2017, the Company acquired PARAGARD. Management is reviewing and evaluating its internal control procedures and the design of those control procedures related to the PARAGARD acquisition and will complete by the end of fiscal 2018.
Except as described above, there has been no change in our internal control over financial reporting that occurred during our third quarter of fiscal 2018, that has materially affected, or is reasonably likely to materially affect, our internal control over financial reporting.
43
Since March 2015, over
50
putative class action complaints were filed by contact lens consumers alleging that contact lens manufacturers, in conjunction with their respective Unilateral Pricing Policy (UPP), conspired to reach agreements between each other and certain distributors and retailers regarding the prices at which certain contact lenses could be sold to consumers. The plaintiffs are seeking damages against CooperVision, Inc., other contact lens manufacturers, distributors and retailers, in various courts around the United States. In June 2015, all of the class action cases were consolidated and transferred to the United States District Court for the Middle District of Florida. In August 2017, CooperVision entered into a settlement agreement with the plaintiffs, without any admission of liability, to settle all claims against CooperVision. In July 2018, the Court approved the plaintiffs’ motion for preliminary approval of the settlement, and the Company paid the
$3.0 million
settlement amount into an escrow account. The settlement remains subject to final Court approval at a future hearing to be set by the Court.
The Company is involved in various lawsuits, claims and other legal matters from time to time that arise in the ordinary course of conducting business, including matters involving our products, intellectual property, supplier relationships, distributors, competitor relationships, employees and other matters. The Company does not believe that the ultimate resolution of these proceedings or claims pending against it could have a material adverse effect on its financial condition or results of operations. At each reporting period, the Company evaluates whether or not a potential loss amount or a potential range of loss is probable and reasonably estimable under ASC 450, Contingencies. Legal fees are expensed as incurred.
Risk factors describing the major risks to our business can be found under Item 1A. Risk Factors in our Annual Report on Form 10-K for the fiscal year ended October 31, 2017. Except for the risk factors set forth below, there have been no material changes in our risk factors from those previously discussed in our Form 10-K for the fiscal year October 31, 2017.
Tax Reform
On December 22, 2017, the U.S. President signed 2017 Act into law. Consistent with SEC guidance, the Company has made a reasonable estimate of the effects of the 2017 Act and recorded provisional income tax expense of
$196.7 million
in the financial statements through the third quarter of fiscal 2018. Compliance with the 2017 Act may require the collection of information not regularly produced within the Company, the use of estimates in our financial statements, and the exercise of significant judgment in accounting for its provisions. As regulations and guidance evolve with respect to the 2017 Act, and as we gather more information and perform additional analysis, our results may differ from previous estimates and may materially affect our financial position. For additional information regarding the 2017 Act, see Note 6. Income Taxes of the Consolidated Financial Statements.
We manage our businesses utilizing complex integrated software and hardware information technology operating systems that are regularly maintained and upgraded; an interruption or disruption to these systems could disrupt our business or force us to expend excessive costs
.
We utilize complex integrated software and hardware operating systems, including enterprise resource planning and warehouse management systems, to support our business units and we have a continuous improvement strategy in place to keep our systems and overarching technology stable and in line with business needs and growth. Regular upgrades of our computer hardware and software revisions are typical and expected. We employ controlled change management methodologies to plan, test and execute all such system upgrades and improvements, and we believe that we assign adequate staffing and other resources to projects to ensure successful implementation. However, we cannot assure that our systems will meet our future business needs or that upgrades will operate as designed. We cannot assure that there
44
will not be associated excessive costs or disruptions in portions of our business in the course of our maintenance, support and/or upgrade of these systems.
We are in the midst of a multiyear process of implementing a new enterprise resource planning (ERP) system at CooperVision. Implementing a new ERP system is not only costly but complex and difficult. Implementing a new ERP system can negatively affect not only financial accounting and reporting processes but also external commercial activities such as order receipt and product delivery. There can be no assurance that we will successfully implement our new ERP system or that we will avoid these and other negative impacts from our implementation efforts.
The size and complexity of our information systems make such systems potentially vulnerable to service interruptions or to security breaches from inadvertent or intentional actions by our employees or vendors, or from attacks by malicious third parties. Such attacks are of ever-increasing levels of sophistication and are made by groups and individuals with a wide range of motives and expertise. While we have invested in the protection of data and information technology, there can be no assurance that our efforts will prevent or quickly identify service interruptions or security breaches. Any such interruption or breach of our systems could adversely affect our business operations and/or result in the loss of critical or sensitive confidential information or intellectual property, and could result in financial, legal, business and reputational harm to us. We maintain cyber liability insurance; however, this insurance may not be sufficient to cover the financial, legal, business or reputational losses that may result from an interruption or breach of our systems.
45
Issuer Purchases of Equity Securities
There was no share repurchase activity during the three-month period ended
July 31, 2018
.
The Share Repurchase Program was approved by the Company’s Board of Directors in December 2011 (2012 Share Repurchase Program). The program as amended in December 2012 and December 2013 provides authorization for a total of $500.0 million. In March 2017, the program was amended and approved by the Company's Board of Directors for an increase of $500.0 million, providing authorization for a total of $1.0 billion. Purchases under the 2012 Share Repurchase Program may be made from time-to-time on the open market at prevailing market prices or in privately negotiated transactions and are subject to a review of the circumstances in place at the time and will be made from time to time as permitted by securities laws and other legal requirements. This program has no expiration date and may be discontinued at any time.
At
July 31, 2018
, approximately
$563.5 million
remained authorized under the 2012 Share Repurchase Program.
46
|
Exhibit
Number
|
Description
|
|
11*
|
Calculation of Earnings Per Share
|
|
31.1
|
|
|
31.2
|
|
|
32.1
|
|
|
32.2
|
|
|
101
|
The following materials from the Company's Quarterly Report on Form 10-Q for the three and nine months periods ended July 31, 2018, formatted in Extensible Business Reporting Language (XBRL): (i) Consolidated Statements of Income for the three and nine months ended July 31, 2018 and 2017, (ii) Consolidated Statements of Comprehensive Income (Loss) for the three and nine months ended July 31, 2018 and 2017, (iii) Consolidated Condensed Balance Sheets at July 31, 2018 and October 31, 2017, (iv) Consolidated Condensed Statements of Cash Flows for the nine months ended July 31, 2018 and 2017 and (v) related notes to consolidated condensed financial statements.
|
|
*
|
The information called for in this Exhibit is provided in Note 7. Earnings Per Share to the Consolidated Condensed Financial Statements in this report
|
47
SIGNATURE
Pursuant to the requirements of the Securities Exchange Act of 1934, the Registrant has duly caused this report to be signed on its behalf by the undersigned thereunto duly authorized.
|
The Cooper Companies, Inc.
|
|
|
(Registrant)
|
|
|
Date: August 31, 2018
|
/s/ Brian G. Andrews
|
|
Brian G. Andrews
|
|
|
Senior Vice President, Chief Financial Officer & Treasurer
(Principal Financial Officer)
|
|
|
Date: August 31, 2018
|
/s/ Agostino Ricupati
|
|
Agostino Ricupati
|
|
|
Chief Accounting Officer & Senior Vice President, Finance & Tax (Principal Accounting Officer)
|
|
48
TABLE OF CONTENTS
Part I. Financial InformationItem 1. Unaudited Financial StatementsNote 1. GeneralNote 2. AcquisitionsNote 3. InventoriesNote 4. Intangible AssetsNote 5. DebtNote 6. Income TaxesNote 7. Earnings Per ShareNote 8. Share-based Compensation PlansNote 9. Stockholders EquityNote 10. Fair Value MeasurementsNote 11. Employee BenefitsNote 12. ContingenciesNote 13. Business Segment InformationItem 2. Management S Discussion and Analysis Of Financial ConditionItem 3. Quantitative and Qualitative Disclosure About Market RiskItem 4. Controls and ProceduresPart II Other InformationItem 1. Legal ProceedingsItem 1A. Risk FactorsItem 2. Unregistered Sales Of Equity Securities and Use Of ProceedsItem 6. Exhibits