CONOCOPHILLIPS
10-Qs and 10-Ks
PROXIES
UNITED STATES
SECURITIES AND EXCHANGE COMMISSION
Washington, D.C. 20549
FORM
10-Q
(Mark One)
|
|
QUARTERLY REPORT PURSUANT TO SECTION 13 OR 15(d) OF THE SECURITIES EXCHANGE ACT OF 1934
|
||||
For the quarterly period ended
June 30, 2023
or
|
|
TRANSITION REPORT PURSUANT TO SECTION 13 OR 15(d) OF THE SECURITIES EXCHANGE ACT OF 1934
|
||||
For the transition period from ___________________ to ___________________
Commission file number:
001-32395

(Exact name of registrant as specified in its charter)
|
|
|
||||||||||
| (State or other jurisdiction of incorporation or organization) | (I.R.S. Employer Identification No.) | ||||||||||
(Address of principal executive offices) (Zip Code)
(Registrant's telephone number, including area code)
Securities registered pursuant to Section 12(b) of the Act:
|
Title of each class
|
Trading symbols
|
Name of each exchange on which registered
|
||||||
|
|
|
|
||||||
|
|
|
|
||||||
Indicate by check mark whether the registrant (1) has filed all reports required to be filed by Section 13 or 15(d) of the Securities Exchange Act of 1934 during the preceding 12 months (or for such shorter period that the registrant was required to file such reports), and (2) has been subject to such filing requirements for the past 90 days.
Yes
☒
No
☐
Indicate by check mark whether the registrant has submitted electronically every Interactive Data File required to be submitted pursuant to Rule 405 of Regulation S-T (§232.405 of this chapter) during the preceding 12 months (or for such shorter period that the registrant was required to submit such files).
Yes
☒
No
☐
Indicate by check mark whether the registrant is a large accelerated filer, an accelerated filer, a non-accelerated filer, a smaller reporting company, or an emerging growth company. See the definitions of “large accelerated filer,” “accelerated filer,” “smaller reporting company” and “emerging growth company” in Rule 12b-2 of the Exchange Act.
Emerging growth company
☐
If an emerging growth company, indicate by check mark if the registrant has elected not to use the extended transition period for complying with any new or revised financial accounting standards provided pursuant to Section 13(a) of the Exchange Act.
☐
Indicate by check mark whether the registrant is a shell company (as defined in Rule 12b-2 of the Exchange Act). Yes
☐
No
☒
The registrant had
1,197,490,673
shares of common stock, $.01 par value, outstanding at June 30, 2023.
Table of Contents
| Page | |||||
| Commonly Used Abbreviations | |||||
Commonly Used Abbreviations
The following industry-specific, accounting and other terms, and abbreviations may be commonly used in this report.
|
Currencies
|
Accounting
|
||||||||||
|
$ or USD
|
U.S. dollar
|
ARO
|
asset retirement obligation
|
||||||||
|
CAD
|
Canadian dollar
|
ASC
|
accounting standards codification
|
||||||||
|
EUR
|
Euro
|
ASU
|
accounting standards update
|
||||||||
|
GBP
|
British pound
|
DD&A
|
depreciation, depletion and amortization
|
||||||||
|
Units of Measurement
|
FASB
|
Financial Accounting Standards
Board
|
|||||||||
|
BBL
|
barrel
|
||||||||||
|
BCF
|
billion cubic feet
|
FIFO
|
first-in, first-out
|
||||||||
|
BOE
|
barrels of oil equivalent
|
G&A
|
general and administrative
|
||||||||
|
MBD
|
thousands of barrels per day
|
GAAP
|
generally accepted accounting principles
|
||||||||
|
MCF
|
thousand cubic feet
|
||||||||||
|
MM
|
million
|
LIFO
|
last-in, first-out
|
||||||||
|
MMBOE
|
million barrels of oil equivalent
|
NPNS
|
normal purchase normal sale
|
||||||||
|
MBOED
|
thousands of barrels of oil equivalent per day
|
PP&E
|
properties, plants and equipment
|
||||||||
|
MMBOED
|
millions of barrels of oil equivalent
per day
|
VIE
|
variable interest entity
|
||||||||
|
MMBTU
|
million British thermal units
|
||||||||||
|
MMCFD
|
million cubic feet per day
|
Miscellaneous
|
|||||||||
| MTPA | million tonnes per annum | CERCLA | Federal Comprehensive Environmental Response Compensation and Liability Act | ||||||||
|
Industry
|
DEI
|
diversity, equity and inclusion | |||||||||
|
BLM
|
Bureau of Land Management
|
EPA
|
Environmental Protection Agency
|
||||||||
|
CBM
|
coalbed methane
|
ESG
|
Environmental, Social and Corporate Governance
|
||||||||
|
CCS
|
carbon capture and storage
|
||||||||||
|
E&P
|
exploration and production
|
EU
|
European Union
|
||||||||
|
FEED
|
front-end engineering and design
|
FERC
|
Federal Energy Regulatory Commission | ||||||||
| FID | final investment decision | ||||||||||
|
FPS
|
floating production system
|
GHG
|
greenhouse gas
|
||||||||
| FPSO | floating production, storage and |
HSE
|
health, safety and environment
|
||||||||
|
|
offloading
|
ICC
|
International Chamber of Commerce
|
||||||||
|
G&G
|
geological and geophysical
|
ICSID
|
World Bank’s International
|
||||||||
|
JOA
|
joint operating agreement
|
Centre for Settlement of
|
|||||||||
|
LNG
|
liquefied natural gas
|
Investment Disputes | |||||||||
|
NGLs
|
natural gas liquids
|
IRS
|
Internal Revenue Service
|
||||||||
|
OPEC
|
Organization of Petroleum
|
OTC
|
over-the-counter
|
||||||||
|
Exporting Countries
|
NYSE
|
New York Stock Exchange
|
|||||||||
|
PSC
|
production sharing contract
|
SEC
|
U.S. Securities and Exchange
|
||||||||
|
PUDs
|
proved undeveloped reserves
|
Commission
|
|||||||||
|
SAGD
|
steam-assisted gravity drainage
|
TSR
|
total shareholder return
|
||||||||
|
WCS
|
Western Canadian Select
|
U.K.
|
United Kingdom
|
||||||||
|
WTI
|
West Texas Intermediate
|
U.S.
|
United States of America
|
||||||||
| VROC | variable return of cash | ||||||||||
|
1
|
ConocoPhillips 2023 Q2 10-Q
|
|||||||
| Financial Statements | |||||
PART I. Financial Information
Item 1. Financial Statements
|
Consolidated Income Statement
|
ConocoPhillips | ||||
|
|
Millions of Dollars
|
|||||||||||||
|
|
Three Months Ended
June 30
|
Six Months Ended
June 30
|
||||||||||||
| 2023 | 2022 | 2023 | 2022 | |||||||||||
|
Revenues and Other Income
|
||||||||||||||
|
Sales and other operating revenues
|
$ |
|
|
|
|
|||||||||
|
Equity in earnings of affiliates
|
|
|
|
|
||||||||||
|
Gain (loss) on dispositions
|
(
|
|
|
|
||||||||||
|
Other income
|
|
|
|
|
||||||||||
|
Total Revenues and Other Income
|
|
|
|
|
||||||||||
|
Costs and Expenses
|
|
|
||||||||||||
|
Purchased commodities
|
|
|
|
|
||||||||||
|
Production and operating expenses
|
|
|
|
|
||||||||||
|
Selling, general and administrative expenses
|
|
|
|
|
||||||||||
|
Exploration expenses
|
|
|
|
|
||||||||||
|
Depreciation, depletion and amortization
|
|
|
|
|
||||||||||
|
Impairments
|
|
|
|
|
||||||||||
|
Taxes other than income taxes
|
|
|
|
|
||||||||||
|
Accretion on discounted liabilities
|
|
|
|
|
||||||||||
|
Interest and debt expense
|
|
|
|
|
||||||||||
|
Foreign currency transaction gain
|
(
|
(
|
(
|
(
|
||||||||||
|
Other expenses
|
(
|
|
(
|
(
|
||||||||||
|
Total Costs and Expenses
|
|
|
|
|
||||||||||
|
Income before income taxes
|
|
|
|
|
||||||||||
|
Income tax provision
|
|
|
|
|
||||||||||
|
Net Income
|
$ |
|
|
|
|
|||||||||
|
Net Income Per Share of Common Stock
(dollars)
|
||||||||||||||
| Basic | $ |
|
|
|
|
|||||||||
| Diluted |
|
|
|
|
||||||||||
|
Average Common Shares Outstanding
(in thousands)
|
||||||||||||||
| Basic |
|
|
|
|
||||||||||
| Diluted |
|
|
|
|
||||||||||
See Notes to Consolidated Financial Statements.
|
ConocoPhillips 2023 Q2 10-Q
|
2
|
|||||||
|
Financial Statements
|
|||||
|
Consolidated Statement of Comprehensive Income
|
ConocoPhillips | ||||
| Millions of Dollars | ||||||||||||||
|
Three Months Ended
June 30
|
Six Months Ended
June 30
|
|||||||||||||
| 2023 | 2022 | 2023 | 2022 | |||||||||||
|
Net Income
|
$ |
|
|
|
|
|||||||||
|
Other comprehensive income
|
||||||||||||||
|
Defined benefit plans
|
||||||||||||||
|
Reclassification adjustment for amortization of prior service credit included in net income
|
(
|
(
|
(
|
(
|
||||||||||
| Net change |
(
|
(
|
(
|
(
|
||||||||||
|
Net actuarial loss arising during the period
|
|
(
|
|
(
|
||||||||||
|
Reclassification adjustment for amortization of net actuarial losses included in net income
|
|
|
|
|
||||||||||
| Net change |
|
(
|
|
(
|
||||||||||
|
Income taxes on defined benefit plans
|
(
|
|
(
|
|
||||||||||
|
Defined benefit plans, net of tax
|
|
(
|
|
(
|
||||||||||
|
Unrealized holding gain (loss) on securities
|
(
|
(
|
|
(
|
||||||||||
| Reclassification adjustment for gain included in net income |
(
|
|
(
|
|
||||||||||
|
Income taxes on unrealized holding gain (loss) on securities
|
|
|
|
|
||||||||||
|
Unrealized holding gain (loss) on securities, net of tax
|
(
|
(
|
|
(
|
||||||||||
|
Foreign currency translation adjustments, net of tax
|
|
(
|
|
(
|
||||||||||
|
Other Comprehensive Income (Loss), Net of Tax
|
|
(
|
|
(
|
||||||||||
|
Comprehensive Income
|
$ |
|
|
|
|
|||||||||
See Notes to Consolidated Financial Statements.
|
3
|
ConocoPhillips 2023 Q2 10-Q
|
|||||||
| Financial Statements | |||||
|
Consolidated Balance Sheet
|
ConocoPhillips | ||||
|
Millions of Dollars
|
||||||||
|
|
June 30
2023 |
December 31
2022 |
||||||
|
Assets
|
|
|
||||||
|
Cash and cash equivalents
|
$ |
|
|
|||||
|
Short-term investments
|
|
|
||||||
|
Accounts and notes receivable (net of allowance of $
|
|
|
||||||
|
Accounts and notes receivable—related parties
|
|
|
||||||
|
Inventories
|
|
|
||||||
|
Prepaid expenses and other current assets
|
|
|
||||||
|
Total Current Assets
|
|
|
||||||
|
Investments and long-term receivables
|
|
|
||||||
|
Net properties, plants and equipment (net of accumulated DD&A of $
|
|
|
||||||
|
Other assets
|
|
|
||||||
|
Total Assets
|
$ |
|
|
|||||
|
Liabilities
|
|
|||||||
|
Accounts payable
|
$ |
|
|
|||||
|
Accounts payable—related parties
|
|
|
||||||
|
Short-term debt
|
|
|
||||||
|
Accrued income and other taxes
|
|
|
||||||
|
Employee benefit obligations
|
|
|
||||||
|
Other accruals
|
|
|
||||||
|
Total Current Liabilities
|
|
|
||||||
|
Long-term debt
|
|
|
||||||
|
Asset retirement obligations and accrued environmental costs
|
|
|
||||||
|
Deferred income taxes
|
|
|
||||||
|
Employee benefit obligations
|
|
|
||||||
|
Other liabilities and deferred credits
|
|
|
||||||
|
Total Liabilities
|
|
|
||||||
| Equity |
|
|||||||
|
Common stock (
|
||||||||
|
Issued (2023—
|
||||||||
|
Par value
|
|
|
||||||
|
Capital in excess of par
|
|
|
||||||
|
Treasury stock (at cost: 2023—
|
(
|
(
|
||||||
|
Accumulated other comprehensive loss
|
(
|
(
|
||||||
|
Retained earnings
|
|
|
||||||
|
Total Equity
|
|
|
||||||
|
Total Liabilities and Equity
|
$ |
|
|
|||||
See Notes to Consolidated Financial Statements.
|
ConocoPhillips 2023 Q2 10-Q
|
4
|
|||||||
|
Financial Statements
|
|||||
|
Consolidated Statement of Cash Flows
|
ConocoPhillips | ||||
|
|
Millions of Dollars
|
|||||||
|
|
Six Months Ended
June 30
|
|||||||
|
|
2023 | 2022 | ||||||
|
Cash Flows From Operating Activities
|
||||||||
|
Net income
|
$ |
|
|
|||||
|
Adjustments to reconcile net income to net cash provided by operating activities
|
||||||||
|
Depreciation, depletion and amortization
|
|
|
||||||
|
Impairments
|
|
|
||||||
|
Dry hole costs and leasehold impairments
|
|
|
||||||
|
Accretion on discounted liabilities
|
|
|
||||||
|
Deferred taxes
|
|
|
||||||
|
Undistributed equity earnings
|
|
|
||||||
|
Gain on dispositions
|
(
|
(
|
||||||
|
Gain on investment in Cenovus Energy
|
|
(
|
||||||
|
Other
|
(
|
(
|
||||||
|
Working capital adjustments
|
|
|||||||
|
Decrease (increase) in accounts and notes receivable
|
|
(
|
||||||
|
Increase in inventories
|
(
|
(
|
||||||
|
Decrease (increase) in prepaid expenses and other current assets
|
|
(
|
||||||
|
Increase (decrease) in accounts payable
|
(
|
|
||||||
|
Decrease in taxes and other accruals
|
(
|
(
|
||||||
|
Net Cash Provided by Operating Activities
|
|
|
||||||
|
Cash Flows From Investing Activities
|
|
|||||||
|
Capital expenditures and investments
|
(
|
(
|
||||||
|
Working capital changes associated with investing activities
|
|
|
||||||
|
Acquisition of businesses, net of cash acquired
|
|
|
||||||
|
Proceeds from asset dispositions
|
|
|
||||||
|
Net (purchase) sale of investments
|
|
(
|
||||||
|
Collection of advances/loans—related parties
|
|
|
||||||
|
Other
|
(
|
(
|
||||||
|
Net Cash Used in Investing Activities
|
(
|
(
|
||||||
|
Cash Flows From Financing Activities
|
||||||||
|
Issuance of debt
|
|
|
||||||
|
Repayment of debt
|
(
|
(
|
||||||
|
Issuance of company common stock
|
(
|
|
||||||
|
Repurchase of company common stock
|
(
|
(
|
||||||
|
Dividends paid
|
(
|
(
|
||||||
|
Other
|
(
|
(
|
||||||
|
Net Cash Used in Financing Activities
|
(
|
(
|
||||||
|
Effect of Exchange Rate Changes on Cash, Cash Equivalents and Restricted Cash
|
(
|
(
|
||||||
|
Net Change in Cash, Cash Equivalents and Restricted Cash
|
(
|
|
||||||
|
Cash, cash equivalents and restricted cash at beginning of period
|
|
|
||||||
|
Cash, Cash Equivalents and Restricted Cash at End of Period
|
$ |
|
|
|||||
See Notes to Consolidated Financial Statements.
|
5
|
ConocoPhillips 2023 Q2 10-Q
|
|||||||
| Notes to Consolidated Financial Statements | |||||
Notes to Consolidated Financial Statements
Note 1—Basis of Presentation
Note 2—Inventories
|
Millions of Dollars
|
||||||||
|
June 30
2023 |
December 31
2022 |
|||||||
|
Crude oil and natural gas
|
$ |
|
|
|||||
|
Materials and supplies
|
|
|
||||||
|
Total Inventories
|
$ |
|
|
|||||
|
Inventories valued on the LIFO basis
|
$ |
|
|
|||||
Note 3—Acquisitions and Dispositions
Acquisitions
Qatar Liquefied Gas Company Limited (12) (QG12)
During 2022, we were awarded a
25
percent interest in QG12, a new joint venture with QatarEnergy, to participate in the North Field South (NFS) LNG project. Formation of the NFS joint venture, QG12, closed in June 2023. QG12 has a
25
percent interest in the NFS project and is reported as an equity method investment in our Europe, Middle East and North Africa segment.
See Note
4
.
Port Arthur Liquefaction Holdings, LLC (PALNG)
In March 2023, we acquired a
30
percent direct equity investment in PALNG, a joint venture for the development of a large-scale LNG facility for the first phase of the Port Arthur LNG project ("Phase 1"). Sempra PALNG Holdings, LLC owns the remaining
70
percent interest in the joint venture. PALNG is reported as an equity method investment in our Corporate and Other segment.
See Note
4
.
Planned Acquisitions
Surmont
In July 2023, we executed an agreement to purchase the remaining
50
percent interest in Surmont, an asset in our Canada segment, from TotalEnergies EP Canada Ltd. for approximately $
4
billion CAD ($
3
billion), subject to customary adjustments, as well as contingent payments over a
five-year
term of up to $
440
million CAD ($
325
million). These contingent payments represent $
2.7
million CAD ($
2.0
million) for every dollar that WCS pricing exceeds $
52
per barrel during the month, subject to certain production targets being achieved. The transaction is expected to close in the second half of 2023, with an effective date of April 1, 2023. Upon closing, we will hold
100
percent interest in the Surmont asset. This transaction is subject to regulatory approvals and other customary closing conditions.
Australia Pacific LNG Pty Ltd (APLNG)
|
ConocoPhillips 2023 Q2 10-Q
|
6
|
|||||||
|
Notes to Consolidated Financial Statements
|
|||||
Note 4—Investments and Long-Term Receivables
APLNG
In 2012, APLNG executed an $
8.5
billion project finance facility that became non-recourse following financial completion in 2017. The facility is currently composed of a financing agreement with the Export-Import Bank of the United States, a commercial bank facility and two United States Private Placement note facilities. APLNG principal and interest payments commenced in March 2017 and are scheduled to occur bi-annually until September 2030. At June 30, 2023, a balance of $
4.9
billion was outstanding on these facilities.
See Note
8
.
At June 30, 2023, the carrying value of our equity method investment in APLNG was approximately $
5.6
billion.
PALNG
In March 2023, we acquired a
30
percent direct equity investment in PALNG, a joint venture for the development of a large-scale LNG facility. At June 30, 2023, the carrying value of our equity method investment in PALNG was approximately $
0.7
billion.
See Note
3.
Qatar Liquefied Gas Company Limited
Our equity method investments in Qatar include the following:
•
Qatar Liquefied Gas Company Limited (3) (QG3)—
30
percent owned joint venture with affiliates of QatarEnergy (
68.5
percent) and Mitsui (
1.5
percent)—produces and liquefies natural gas from Qatar’s North Field, as well as exports LNG.
•
Qatar Liquefied Gas Company Limited (8) (QG8)—
25
percent owned joint venture with an affiliate of QatarEnergy (
75
percent)—participant in the North Field East LNG project.
•
Qatar Liquefied Gas Company Limited (12) (QG12)—
25
percent owned joint venture with an affiliate of QatarEnergy (
75
percent)—participant in the NFS LNG project.
See Note
3.
At June 30, 2023, the carrying value of our Qatar equity method investments was approximately $
1.1
billion.
Note 5—Investment in Cenovus Energy
During the first quarter of 2022, we sold our remaining
91
million common shares of Cenovus Energy (CVE), recognizing proceeds of $
1.4
billion and a net gain of $
251
million. The gain was recognized within
"
Other income” on our consolidated income statement. Proceeds related to the sale of our CVE shares were included within "Cash Flows From Investing Activities" on our consolidated statement of cash flows.
|
7
|
ConocoPhillips 2023 Q2 10-Q
|
|||||||
| Notes to Consolidated Financial Statements | |||||
Note 6—Debt
In the second quarter of 2023, as described further below, we initiated and completed two concurrent transactions as part of our debt refinancing strategy. We issued $
1.1
billion in new Notes through our universal shelf registration statement and prospectus supplement and used the funds to repurchase $
1.1
billion of existing debt.
New Debt Issuance
On May 23, 2023, we issued $
1.1
billion in
5.3
% Notes due 2053.
Tender Offer
On Ma
y 25, 2023, we repurchased a total of $
1,133
million aggregate principal amount of debt as listed below. We paid $
33
million below face value to repurchase these debt instruments and recognized a gain on debt extinguishment of $
27
million which is included in the "Other expenses" line on our consolidated income statement.
•
2.125
% Notes due 2024 with principal of $
900
million (partial repurchase of $
439
million)
•
3.350
% Notes due 2024 with principal of $
426
million (partial repurchase of $
160
million)
•
2.400
% Notes due 2025 with principal of $
900
million (partial repurchase of $
534
million)
Our debt balance at June 30, 2023
was $
16.4
billion, compared with $
16.6
billion at December 31, 2022
.
Our revolving credit facility provides a total borrowing capacity of $
5.5
billion with an expiration date of February 2027. Our revolving credit facility may be used for direct bank borrowings, the issuance of letters of credit totaling up to $
500
million, or as support for our commercial paper program. The revolving credit facility is broadly syndicated among financial institutions and does not contain any material adverse change provisions or any covenants requiring maintenance of specified financial ratios or credit ratings. The facility agreement contains a cross-default provision relating to the failure to pay principal or interest on other debt obligations of $
200
million or more by ConocoPhillips, or any of its consolidated subsidiaries. The amount of the facility is not subject to redetermination prior to its expiration date.
Credit facility borrowings may bear interest at a margin above the Secured Overnight Financing Rate (SOFR). The facility agreement calls for commitment fees on available, but unused, amounts. The facility agreement also contains early termination rights if our current directors or their approved successors cease to be a majority of the Board of Directors.
The revolving credit facility supports our ability to issue up to $
5.5
billion of commercial paper. Commercial paper is generally limited to maturities of 90 days and is included in short-term debt on our consolidated balance sheet. With no commercial paper outstanding and no direct borrowings or letters of credit, we had access to $
5.5
billion in available borrowing capacity under our revolving credit facility at June 30, 2023. At December 31, 2022, we had no commercial paper outstanding and no direct borrowings or letters of credit issued.
We do not have any ratings triggers on any of our corporate debt that would cause an automatic default, and thereby impact our access to liquidity upon downgrade of our credit ratings. If our credit ratings are downgraded from their current levels, it could increase the cost of corporate debt available to us and restrict our access to the commercial paper markets. If our credit ratings were to deteriorate to a level prohibiting us from accessing the commercial paper market, we would still be able to access funds under our revolving credit facility.
At June 30, 2023, we had $
283
million of certain variable rate demand bonds (VRDBs) outstanding with maturities ranging through 2035. The VRDBs are redeemable at the option of the bondholders on any business day. If they are ever redeemed, we have the ability and intent to refinance on a long-term basis; therefore, the VRDBs are included in the “Long-term debt” line on our consolidated balance sheet.
|
ConocoPhillips 2023 Q2 10-Q
|
8
|
|||||||
|
Notes to Consolidated Financial Statements
|
|||||
Note 7—Changes in Equity
|
Millions of Dollars
|
||||||||||||||||||||
|
Common Stock
|
||||||||||||||||||||
|
Par
Value
|
Capital in
Excess of
Par
|
Treasury
Stock
|
Accum. Other
Comprehensive
Income (Loss)
|
Retained
Earnings
|
Total
|
|||||||||||||||
|
For the three months ended June 30, 2023
|
||||||||||||||||||||
| Balances at March 31, 2023 | $ |
|
|
(
|
(
|
|
|
|||||||||||||
| Net income |
|
|
||||||||||||||||||
| Other comprehensive income |
|
|
||||||||||||||||||
| Dividends declared | ||||||||||||||||||||
|
Ordinary ($
|
(
|
(
|
||||||||||||||||||
|
Variable return of cash ($
|
(
|
(
|
||||||||||||||||||
| Repurchase of company common stock |
(
|
(
|
||||||||||||||||||
| Excise tax on share repurchases |
(
|
(
|
||||||||||||||||||
| Distributed under benefit plans |
|
|
||||||||||||||||||
| Other |
|
|
||||||||||||||||||
| Balances at June 30, 2023 | $ |
|
|
(
|
(
|
|
|
|||||||||||||
|
For the six months ended June 30, 2023
|
||||||||||||||||||||
|
Balances at December 31, 2022
|
$ |
|
|
(
|
(
|
|
|
|||||||||||||
|
Net income
|
|
|
||||||||||||||||||
|
Other comprehensive income
|
|
|
||||||||||||||||||
| Dividends declared | ||||||||||||||||||||
|
Ordinary ($
|
(
|
(
|
||||||||||||||||||
|
Variable return of cash ($
|
(
|
(
|
||||||||||||||||||
|
Repurchase of company common stock
|
(
|
(
|
||||||||||||||||||
| Excise tax on share repurchases |
(
|
(
|
||||||||||||||||||
|
Distributed under benefit plans
|
|
|
||||||||||||||||||
|
Other
|
|
|
||||||||||||||||||
|
Balances at June 30, 2023
|
$ |
|
|
(
|
(
|
|
|
|||||||||||||
|
Millions of Dollars
|
||||||||||||||||||||
|
Common Stock
|
||||||||||||||||||||
|
Par
Value
|
Capital in
Excess of
Par
|
Treasury
Stock
|
Accum. Other
Comprehensive
Income (Loss)
|
Retained
Earnings
|
Total
|
|||||||||||||||
|
For the three months ended June 30, 2022
|
||||||||||||||||||||
| Balances at March 31, 2022 | $ |
|
|
(
|
(
|
|
|
|||||||||||||
| Net income |
|
|
||||||||||||||||||
| Other comprehensive loss |
(
|
(
|
||||||||||||||||||
| Dividends declared | ||||||||||||||||||||
|
Ordinary ($
|
(
|
(
|
||||||||||||||||||
|
Variable return of cash ($
|
(
|
(
|
||||||||||||||||||
| Repurchase of company common stock |
(
|
(
|
||||||||||||||||||
|
Distributed under benefit plans
|
|
|
||||||||||||||||||
| Other | — | — | — | |||||||||||||||||
|
Balances at June 30, 2022
|
$ |
|
|
(
|
(
|
|
|
|||||||||||||
|
For the six months ended June 30, 2022
|
||||||||||||||||||||
|
Balances at December 31, 2021
|
$ |
|
|
(
|
(
|
|
|
|||||||||||||
|
Net income
|
|
|
||||||||||||||||||
|
Other comprehensive loss
|
(
|
(
|
||||||||||||||||||
| Dividends declared | ||||||||||||||||||||
|
Ordinary ($
|
(
|
(
|
||||||||||||||||||
|
Variable return of cash ($
|
(
|
(
|
||||||||||||||||||
|
Repurchase of company common stock
|
(
|
(
|
||||||||||||||||||
|
Distributed under benefit plans
|
|
|
||||||||||||||||||
|
Other
|
|
|
|
|||||||||||||||||
|
Balances at June 30, 2022
|
$ |
|
|
(
|
(
|
|
|
|||||||||||||
|
9
|
ConocoPhillips 2023 Q2 10-Q
|
|||||||
| Notes to Consolidated Financial Statements | |||||
Note 8—Guarantees
At June 30, 2023, we were liable for certain contingent obligations under various contractual arrangements as described below. We recognize a liability, at inception, for the fair value of our obligation as a guarantor for newly issued or modified guarantees. Unless the carrying amount of the liability is noted below, we have not recognized a liability because the fair value of the obligation is immaterial. In addition, unless otherwise stated, we are not currently performing with any significance under the guarantee and expect future performance to be either immaterial or have only a remote chance of occurrence.
APLNG Guarantees
At June 30, 2023, we had outstanding multiple guarantees in connection with our
47.5
percent ownership interest in APLNG. The following is a description of the guarantees with values calculated utilizing June 2023 exchange rates:
•
During the third quarter of 2016, we issued a guarantee to facilitate the withdrawal of our pro-rata portion of the funds in a project finance reserve account. We estimate the remaining term of this guarantee to be
eight years
. Our maximum exposure under this guarantee is approximately $
210
million and may become payable if an enforcement action is commenced by the project finance lenders against APLNG. At June 30, 2023, the carrying value of this guarantee was approximately $
14
million.
•
In conjunction with our original purchase of an ownership interest in APLNG from Origin Energy Limited in October 2008, we agreed to reimburse Origin Energy Limited for our share of the existing contingent liability arising under guarantees of an existing obligation of APLNG to deliver natural gas under several sales agreements. The final guarantee expires in the fourth quarter of 2041. Our maximum potential liability for future payments, or cost of volume delivery, under these guarantees is estimated to be $
740
million ($
1.3
billion in the event of intentional or reckless breach) and would become payable if APLNG fails to meet its obligations under these agreements and the obligations cannot otherwise be mitigated. Future payments are considered unlikely, as the payments, or cost of volume delivery, would only be triggered if APLNG does not have enough natural gas to meet these sales commitments and if the co-venturers do not make necessary equity contributions into APLNG.
•
We have guaranteed the performance of APLNG with regard to certain other contracts executed in connection with the project’s continued development. The guarantees have remaining terms of
14
to
22
years or the life of the venture. Our maximum potential amount of future payments related to these guarantees is approximately $
390
million and would become payable if APLNG does not perform. At June 30, 2023, the carrying value of these guarantees was approximately $
29
million.
Qatar Liquefied Gas Company Limited Guarantees
We have guaranteed our portion of certain fiscal and other joint venture obligations as a shareholder in QG8 and QG12. These guarantees have an approximate
30
-year term with no maximum limit. At June 30, 2023, the carrying value of these guarantees was approximately $
14
million.
Other Guarantees
We have other guarantees with maximum future potential payment amounts totaling approximately $
600
million, which consist primarily of guarantees of the residual value of leased office buildings and guarantees of the residual value of corporate aircraft. These guarantees have remaining terms of
to
four years
and would become payable if certain asset values are lower than guaranteed amounts at the end of the lease or contract term, business conditions decline at guaranteed entities, or as a result of nonperformance of contractual terms by guaranteed parties. At June 30, 2023, there was
no
carrying value associated with these guarantees.
Indemnifications
Over the years, we have entered into agreements to sell ownership interests in certain legal entities, joint ventures and assets that gave rise to qualifying indemnifications. These agreements include indemnifications for taxes and environmental liabilities. The carrying amount recorded for these indemnification obligations at June 30, 2023, was approximately $
20
million. Those related to environmental issues have terms that are generally indefinite, and the maximum amounts of future payments are generally unlimited. Although it is reasonably possible future payments may exceed amounts recorded, due to the nature of the indemnifications, it is not possible to make a reasonable estimate of the maximum potential amount of future payments.
See Note
9
for additional information about environmental liabilities.
|
ConocoPhillips 2023 Q2 10-Q
|
10
|
|||||||
|
Notes to Consolidated Financial Statements
|
|||||
Note 9—Contingencies and Commitments
A number of lawsuits involving a variety of claims arising in the ordinary course of business have been filed against ConocoPhillips. We also may be required to remove or mitigate the effects on the environment of the placement, storage, disposal or release of certain chemical, mineral and petroleum substances at various active and inactive sites. We regularly assess the need for accounting recognition or disclosure of these contingencies. In the case of all known contingencies (other than those related to income taxes), we accrue a liability when the loss is probable and the amount is reasonably estimable. If a range of amounts can be reasonably estimated and no amount within the range is a better estimate than any other amount, then the low end of the range is accrued. We do not reduce these liabilities for potential insurance or third-party recoveries. We accrue receivables for insurance or other third-party recoveries when applicable. With respect to income tax-related contingencies, we use a cumulative probability-weighted loss accrual in cases where sustaining a tax position is less than certain.
Based on currently available information, we believe it is remote that future costs related to known contingent liability exposures will exceed current accruals by an amount that would have a material adverse impact on our consolidated financial statements. As we learn new facts concerning contingencies, we reassess our position both with respect to accrued liabilities and other potential exposures. Estimates particularly sensitive to future changes include contingent liabilities recorded for environmental remediation, tax and legal matters. Estimated future environmental remediation costs are subject to change due to such factors as the uncertain magnitude of cleanup costs, the unknown time and extent of such remedial actions that may be required, and the determination of our liability in proportion to that of other responsible parties. Estimated future costs related to tax and legal matters are subject to change as events evolve and as additional information becomes available during the administrative and litigation processes.
Environmental
We are subject to international, federal, state and local environmental laws and regulations and record accruals for environmental liabilities based on management’s best estimates. These estimates are based on currently available facts, existing technology, and presently enacted laws and regulations, taking into account stakeholder and business considerations. When measuring environmental liabilities, we also consider our prior experience in remediation of contaminated sites, other companies’ cleanup experience, and data released by the U.S. EPA or other organizations. We consider unasserted claims in our determination of environmental liabilities, and we accrue them in the period they are both probable and reasonably estimable.
Although liability of those potentially responsible for environmental remediation costs is generally joint and several for federal sites and frequently so for other sites, we are usually only one of many companies cited at a particular site. Due to the joint and several liabilities, we could be responsible for all cleanup costs related to any site at which we have been designated as a potentially responsible party. We have been successful to date in sharing cleanup costs with other financially sound companies. Many of the sites at which we are potentially responsible are still under investigation by the EPA or the agency concerned. Prior to actual cleanup, those potentially responsible normally assess the site conditions, apportion responsibility and determine the appropriate remediation. In some instances, we may have no liability or may attain a settlement of liability. Where it appears that other potentially responsible parties may be financially unable to bear their proportional share, we consider this inability in estimating our potential liability, and we adjust our accruals accordingly. As a result of various acquisitions in the past, we assumed certain environmental obligations. Some of these environmental obligations are mitigated by indemnifications made by others for our benefit, and some of the indemnifications are subject to dollar limits and time limits.
We are currently participating in environmental assessments and cleanups at numerous CERCLA and other comparable state and international sites. After an assessment of environmental exposures for cleanup and other costs, we make accruals on an undiscounted basis (except those acquired in a purchase business combination, which we record on a discounted basis) for planned investigation and remediation activities for sites where it is probable future costs will be incurred and these costs can be reasonably estimated. We have not reduced these accruals for possible insurance recoveries.
For remediation activities in the U.S. and Canada, our balance sheet included a total environmental accrual of $
185
million at June 30, 2023, compared with $
182
million at December 31, 2022. We expect to incur a substantial amount of these expenditures within the next
30
years. In the future, we may be involved in additional environmental assessments, cleanups and proceedings.
|
11
|
ConocoPhillips 2023 Q2 10-Q
|
|||||||
| Notes to Consolidated Financial Statements | |||||
Litigation and Other Contingencies
We are subject to various lawsuits and claims including, but not limited to, matters involving oil and gas royalty and severance tax payments, gas measurement and valuation methods, contract disputes, environmental damages, climate change, personal injury, and property damage. Our primary exposures for such matters relate to alleged royalty and tax underpayments on certain federal, state and privately owned properties, claims of alleged environmental contamination and damages from historic operations, and climate change. We will continue to defend ourselves vigorously in these matters.
Our legal organization applies its knowledge, experience and professional judgment to the specific characteristics of our cases, employing a litigation management process to manage and monitor the legal proceedings against us. Our process facilitates the early evaluation and quantification of potential exposures in individual cases. This process also enables us to track those cases that have been scheduled for trial and/or mediation. Based on professional judgment and experience in using these litigation management tools and available information about current developments in all our cases, our legal organization regularly assesses the adequacy of current accruals and determines if adjustment of existing accruals, or establishment of new accruals, is required.
We have contingent liabilities resulting from throughput agreements with pipeline and processing companies not associated with financing arrangements. Under these agreements, we may be required to provide any such company with additional funds through advances and penalties for fees related to throughput capacity not utilized. In addition, at June 30, 2023, we had performance obligations secured by letters of credit of $
261
million (issued as direct bank letters of credit) related to various purchase commitments for materials, supplies, commercial activities and services incident to the ordinary conduct of business.
In 2007, ConocoPhillips was unable to reach agreement with respect to the empresa mixta structure mandated by the Venezuelan government’s Nationalization Decree. As a result, Venezuela’s national oil company, Petróleos de Venezuela, S.A. (PDVSA), or its affiliates, directly assumed control over ConocoPhillips’ interests in the Petrozuata and Hamaca heavy oil ventures and the offshore Corocoro development project. In response to this expropriation, ConocoPhillips initiated international arbitration on November 2, 2007, with the ICSID. On September 3, 2013, an ICSID arbitration tribunal ("Tribunal") held that Venezuela unlawfully expropriated ConocoPhillips’ significant oil investments in June 2007. On January 17, 2017, the Tribunal reconfirmed the decision that the expropriation was unlawful. In March 2019, the Tribunal unanimously ordered the government of Venezuela to pay ConocoPhillips approximately $
8.7
billion in compensation for the government’s unlawful expropriation of the company’s investments in Venezuela in 2007. On August 29, 2019, the Tribunal issued a decision rectifying the award and reducing it by approximately $
227
million. The award now stands at $
8.5
billion plus interest. The government of Venezuela sought annulment of the award, which automatically stayed enforcement of the award. On September 29, 2021, the ICSID annulment committee lifted the stay of enforcement of the award. The annulment proceedings are underway.
In 2014, ConocoPhillips filed a separate and independent arbitration under the rules of the ICC against PDVSA under the contracts that had established the Petrozuata and Hamaca projects. The ICC Tribunal issued an award in April 2018, finding that PDVSA owed ConocoPhillips approximately $
2
billion under their agreements in connection with the expropriation of the projects and other pre-expropriation fiscal measures. In August 2018, ConocoPhillips entered into a settlement with PDVSA to recover the full amount of this ICC award, plus interest through the payment period, including initial payments totaling approximately $
500
million within a period of 90 days from the time of signing the settlement agreement. The balance of the settlement is to be paid quarterly over a period of four and a half years. Per the settlement, PDVSA recognized the ICC award as a judgment in various jurisdictions, and ConocoPhillips agreed to suspend its legal enforcement actions. ConocoPhillips sent notices of default to PDVSA on October 14 and November 12, 2019, and to date PDVSA has failed to cure its breach. As a result, ConocoPhillips has resumed legal enforcement actions. To date, ConocoPhillips has received approximately $
776
million in connection with the ICC award. ConocoPhillips has ensured that the settlement and any actions taken in enforcement thereof meet all appropriate U.S. regulatory requirements, including those related to any applicable sanctions imposed by the U.S. against Venezuela.
In 2016, ConocoPhillips filed a separate and independent arbitration under the rules of the ICC against PDVSA under the contracts that had established the Corocoro Project. On August 2, 2019, the ICC Tribunal awarded ConocoPhillips approximately $
33
million plus interest under the Corocoro contracts. ConocoPhillips is seeking recognition and enforcement of the award in various jurisdictions. ConocoPhillips has ensured that all the actions related to the award meet all appropriate U.S. regulatory requirements, including those related to any applicable sanctions imposed by the U.S. against Venezuela.
|
ConocoPhillips 2023 Q2 10-Q
|
12
|
|||||||
|
Notes to Consolidated Financial Statements
|
|||||
Beginning in 2017, governmental and other entities in several states/territories in the U.S. have filed lawsuits against oil and gas companies, including ConocoPhillips, seeking compensatory damages and equitable relief to abate alleged climate change impacts. Additional lawsuits with similar allegations are expected to be filed. The legal and factual issues are unprecedented, therefore, there is significant uncertainty about the scope of the claims and alleged damages and any potential impact on the Company’s financial condition. ConocoPhillips believes these lawsuits are factually and legally meritless and are an inappropriate vehicle to address the challenges associated with climate change and will vigorously defend against such lawsuits.
Several Louisiana parishes and the State of Louisiana have filed
43
lawsuits under Louisiana’s State and Local Coastal Resources Management Act (SLCRMA) against oil and gas companies, including ConocoPhillips, seeking compensatory damages for contamination and erosion of the Louisiana coastline allegedly caused by historical oil and gas operations. ConocoPhillips entities are defendants in
22
of the lawsuits and will vigorously defend against them. On October 17, 2022, the Fifth Circuit affirmed remand of lead cases to state court and the subsequent request for rehearing was denied. On February 27, 2023, the Supreme Court denied a certiorari petition from the defendants regarding the Fifth Circuit ruling. Accordingly, the federal district courts have issued remands to state court. Because Plaintiffs’ SLCRMA theories are unprecedented, there is uncertainty about these claims (both as to scope and damages) and we continue to evaluate our exposure in these lawsuits.
In October 2020, the Bureau of Safety and Environmental Enforcement (BSEE) ordered the prior owners of Outer Continental Shelf (OCS) Lease P-0166, including ConocoPhillips, to decommission the lease facilities, including two offshore platforms located near Carpinteria, California. This order was sent after the current owner of OCS Lease P-0166 relinquished the lease and abandoned the lease platforms and facilities. BSEE’s order to ConocoPhillips is premised on its connection to Phillips Petroleum Company, a legacy company of ConocoPhillips, which held a historical
25
percent interest in this lease and operated these facilities but sold its interest approximately
30
years ago. ConocoPhillips continues to evaluate its exposure in this matter.
On May 10, 2021, ConocoPhillips filed arbitration under the rules of the Singapore International Arbitration Centre (SIAC) against Santos KOTN Pty Ltd. and Santos Limited for their failure to timely pay the $
200
million bonus due upon final investment decision of the Barossa development project under the sale and purchase agreement for the sale of our Australia-West asset and operations. The matter was resolved in April 2023 to our satisfaction.
In July 2021, a federal securities class action was filed against Concho, certain of Concho’s officers, and ConocoPhillips as Concho’s successor in the United States District Court for the Southern District of Texas. On October 21, 2021, the court issued an order appointing Utah Retirement Systems and the Construction Laborers Pension Trust for Southern California as lead plaintiffs (Lead Plaintiffs). On January 7, 2022, the Lead Plaintiffs filed their consolidated complaint alleging that Concho made materially false and misleading statements regarding its business and operations in violation of the federal securities laws and seeking unspecified damages, attorneys’ fees, costs, equitable/injunctive relief, and such other relief that may be deemed appropriate. The defendants filed a motion to dismiss the consolidated complaint on March 8, 2022. On June 23, 2023, the court denied defendants’ motion as to most defendants including Concho/ConocoPhillips. We believe the allegations in the action are without merit and are vigorously defending this litigation.
ConocoPhillips is involved in pending disputes with commercial counterparties relating to the propriety of its force majeure notices following Winter Storm Uri in 2021.
We believe these claims are without merit and are vigorously defending them.
Long-Term Unconditional Purchase Obligations and Commitments, Including Throughput and Take-or-Pay Agreements
We have certain throughput agreements and take-or-pay agreements in support of financing arrangements. The agreements typically provide for natural gas or crude oil transport and LNG purchase commitments. The fixed and determinable portion of the remaining estimated payments under these various agreements as of June 30, 2023 are: 2023—$
4
million; 2024—$
7
million; 2025—$
7
million; 2026—$
7
million; 2027—$
7
million; and 2028 and after—$
11
billion. Generally, variable components of these obligations include commodity futures prices and inflation rates. Purchases of LNG under these commitments are expected to be offset in the same or approximately same periods by cash received from the related sales transactions.
|
13
|
ConocoPhillips 2023 Q2 10-Q
|
|||||||
| Notes to Consolidated Financial Statements | |||||
Note 10—Derivative and Financial Instruments
We use futures, forwards, swaps and options in various markets to meet our customer needs, capture market opportunities and manage foreign exchange currency risk. Certain of our equity method investments use swaps to manage interest rate risk.
Commodity Derivative Instruments
Our commodity business primarily consists of natural gas, crude oil, bitumen, LNG, NGLs and power.
Commodity derivative instruments are held at fair value on our consolidated balance sheet. Where these balances have the right of setoff, they are presented on a net basis. Related cash flows are recorded as operating activities on our consolidated statement of cash flows. On our consolidated income statement, gains and losses are recognized either on a gross basis if directly related to our physical business or a net basis if held for trading. Gains and losses related to contracts that meet and are designated with the NPNS exception are recognized upon settlement. We generally apply this exception to eligible crude contracts and certain gas contracts. We do not apply hedge accounting for our commodity derivatives.
The following table presents the gross fair values of our commodity derivatives, excluding collateral, on our consolidated balance sheet:
|
Millions of Dollars
|
||||||||
|
June 30
2023 |
December 31
2022 |
|||||||
| Assets | ||||||||
|
Prepaid expenses and other current assets
|
$ |
|
|
|||||
|
Other assets
|
|
|
||||||
| Liabilities | ||||||||
|
Other accruals
|
|
|
||||||
|
Other liabilities and deferred credits
|
|
|
||||||
The gains (losses) from commodity derivatives included in our consolidated income statement are presented in the following table:
|
Millions of Dollars
|
||||||||||||||
|
Three Months Ended
June 30
|
Six Months Ended
June 30
|
|||||||||||||
| 2023 | 2022 | 2023 | 2022 | |||||||||||
|
Sales and other operating revenues
|
$ |
(
|
(
|
|
(
|
|||||||||
|
Other income
|
(
|
|
(
|
|
||||||||||
|
Purchased commodities
|
|
(
|
(
|
|
||||||||||
The table below summarizes our net exposures resulting from outstanding commodity derivative contracts:
|
Open Position
Long (Short) |
||||||||
|
June 30
2023 |
December 31
2022 |
|||||||
| Commodity | ||||||||
| Natural gas and power (billions of cubic feet equivalent) | ||||||||
| Fixed price |
(
|
(
|
||||||
| Basis |
(
|
(
|
||||||
|
ConocoPhillips 2023 Q2 10-Q
|
14
|
|||||||
|
Notes to Consolidated Financial Statements
|
|||||
Foreign Currency Exchange Derivatives
At June 30, 2023, we had outstanding foreign currency forward contracts to buy $
5.2
billion CAD at $
0.751
against the U.S. dollar in anticipation of our planned acquisition of the additional interest in Surmont.
See Note
3.
The forward contracts are carried at a fair value of $
19
million and are reported within the "Prepaid expenses and other current assets" line on our consolidated balance sheet. For the three- and six-month periods ended June 30, 2023, we recorded an unrealized gain of $
19
million in the "Foreign currency transaction gain" line on our consolidated income statement.
Interest Rate Derivative Instruments
During 2023, PALNG executed interest rate swaps that had the effect of converting
60
percent of the projected term loans outstanding to finance the cost of development and construction of Phase 1 from floating to fixed rate. These swaps were designated and qualify for hedge accounting under ASC Topic 815, "Derivatives and Hedging", as a cash flow hedge with changes in the fair value of the designated hedging instrument reported as a component of other comprehensive income and reclassified into earnings in the same periods that the hedged transactions will affect earnings. We recognize our proportionate share of PALNG’s adjustments for other comprehensive income as a change to our equity method investment with corresponding adjustments in equity. For the three- and six-month periods ended June 30, 2023, the impact of these adjustments on our financial statements was negligible.
Financial Instruments
We invest in financial instruments with maturities based on our cash forecasts for the various accounts and currency pools we manage. The types of financial instruments in which we currently invest include:
•
Time deposits: Interest bearing deposits placed with financial institutions for a predetermined amount of time.
•
Demand deposits: Interest bearing deposits placed with financial institutions. Deposited funds can be withdrawn without notice.
•
Commercial paper: Unsecured promissory notes issued by a corporation, commercial bank or government agency purchased at a discount, reaching par value at maturity.
•
U.S. government or government agency obligations: Securities issued by the U.S. government or U.S. government agencies.
•
Foreign government obligations: Securities issued by foreign governments.
•
Corporate bonds: Unsecured debt securities issued by corporations.
•
Asset-backed securities: Collateralized debt securities.
The following investments are carried on our consolidated balance sheet at cost, plus accrued interest, and the table reflects remaining maturities at June 30, 2023, and December 31, 2022:
|
Millions of Dollars
|
||||||||||||||
|
Carrying Amount
|
||||||||||||||
|
Cash and Cash Equivalents
|
Short-Term Investments
|
|||||||||||||
|
June 30
2023 |
December 31
2022 |
June 30
2023 |
December 31
2022 |
|||||||||||
| Cash | $ |
|
|
|||||||||||
|
Demand Deposits
|
|
|
||||||||||||
|
Time Deposits
|
||||||||||||||
|
1 to 90 days
|
|
|
|
|
||||||||||
|
91 to 180 days
|
|
|
||||||||||||
|
Within one year
|
|
|
||||||||||||
|
U.S. Government Obligations
|
||||||||||||||
|
1 to 90 days
|
|
|
|
|
||||||||||
| $ |
|
|
|
|
||||||||||
|
15
|
ConocoPhillips 2023 Q2 10-Q
|
|||||||
| Notes to Consolidated Financial Statements | |||||
The following investments in debt securities classified as available for sale are carried at fair value on our consolidated balance sheet at June 30, 2023, and December 31, 2022:
| Millions of Dollars | ||||||||||||||||||||
| Carrying Amount | ||||||||||||||||||||
| Cash and Cash Equivalents | Short-Term Investments |
Investments and Long-Term
Receivables |
||||||||||||||||||
|
June 30
2023 |
December 31
2022 |
June 30
2023 |
December 31
2022 |
June 30
2023 |
December 31
2022 |
|||||||||||||||
| Major Security Type | ||||||||||||||||||||
|
Corporate Bonds
|
$ |
|
|
|
|
|
|
|||||||||||||
|
Commercial Paper
|
|
|
|
|
||||||||||||||||
| U.S. Government Obligations |
|
|
|
|
|
|
||||||||||||||
|
U.S. Government Agency Obligations
|
|
|
|
|
||||||||||||||||
|
Foreign Government Obligations
|
|
|
|
|
||||||||||||||||
|
Asset-backed Securities
|
|
|
|
|
||||||||||||||||
| $ |
|
|
|
|
|
|
||||||||||||||
Cash and Cash Equivalents and Short-Term Investments have remaining maturities within one year.
Investments and Long-Term Receivables have remaining maturities greater than
one year
through
five years
.
The following table summarizes the amortized cost basis and fair value of investments in debt securities classified as available for sale:
|
Millions of Dollars
|
||||||||||||||
|
Amortized Cost Basis
|
Fair Value
|
|||||||||||||
|
June 30
2023 |
December 31
2022 |
June 30
2023 |
December 31
2022 |
|||||||||||
| Major Security Type | ||||||||||||||
|
Corporate Bonds
|
$ |
|
|
|
|
|||||||||
|
Commercial Paper
|
|
|
|
|
||||||||||
|
U.S. Government Obligations
|
|
|
|
|
||||||||||
|
U.S. Government Agency Obligations
|
|
|
|
|
||||||||||
|
Foreign Government Obligations
|
|
|
|
|
||||||||||
|
Asset-backed Securities
|
|
|
|
|
||||||||||
| $ |
|
|
|
|
||||||||||
As of June 30, 2023, and December 31, 2022, total unrealized losses for debt securities classified as available for sale with net losses were $
14
million and $
12
million, respectively.
No
allowance for credit losses has been recorded on investments in debt securities which are in an unrealized loss position.
For the three- and six-month periods ended June 30, 2023, proceeds from sales and redemptions of investments in debt securities classified as available for sale were $
251
million and $
551
million, respectively. For the three- and six-month periods ended June 30, 2022, proceeds from sales and redemptions of investments in debt securities classified as available for sale were $
86
million and $
201
million, respectively. Gross realized gains and losses included in earnings from those sales and redemptions were negligible. The cost of securities sold and redeemed is determined using the specific identification method.
|
ConocoPhillips 2023 Q2 10-Q
|
16
|
|||||||
|
Notes to Consolidated Financial Statements
|
|||||
Credit Risk
Financial instruments potentially exposed to concentrations of credit risk consist primarily of cash equivalents, short-term investments, long-term investments in debt securities, OTC derivative contracts and trade receivables. Our cash equivalents and short-term investments are placed in high-quality commercial paper, government money market funds, U.S. government and government agency obligations, time deposits with major international banks and financial institutions, high-quality corporate bonds, foreign government obligations and asset-backed securities. Our long-term investments in debt securities are placed in high-quality corporate bonds, asset-backed securities, U.S. government and government agency obligations, and foreign government obligations.
The credit risk from our OTC derivative contracts, such as forwards, swaps and options, derives from the counterparty to the transaction. Individual counterparty exposure is managed within predetermined credit limits and includes the use of cash-call margins when appropriate, thereby reducing the risk of significant nonperformance. We also use futures, swaps and option contracts that have a negligible credit risk because these trades are cleared primarily with an exchange clearinghouse and subject to mandatory margin requirements until settled; however, we are exposed to the credit risk of those exchange brokers for receivables arising from daily margin cash calls, as well as for cash deposited to meet initial margin requirements.
Our trade receivables result primarily from our oil and gas operations and reflect a broad national and international customer base, which limits our exposure to concentrations of credit risk. The majority of these receivables have payment terms of
30
days or less, and we continually monitor this exposure and the creditworthiness of the counterparties. We may require collateral to limit the exposure to loss including letters of credit, prepayments and surety bonds, as well as master netting arrangements to mitigate credit risk with counterparties that both buy from and sell to us, as these agreements permit the amounts owed by us or owed to others to be offset against amounts due to us.
Certain of our derivative instruments contain provisions that require us to post collateral if the derivative exposure exceeds a threshold amount. We have contracts with fixed threshold amounts and other contracts with variable threshold amounts that are contingent on our credit rating. The variable threshold amounts typically decline for lower credit ratings, while both the variable and fixed threshold amounts typically revert to zero if we fall below investment grade. Cash is the primary collateral in all contracts; however, many also permit us to post letters of credit as collateral, such as transactions administered through the New York Mercantile Exchange.
The aggregate fair value of all derivative instruments with such credit risk-related contingent features that were in a liability position at June 30, 2023, and December 31, 2022, was $
166
million and $
333
million, respectively. For these instruments,
no
collateral was posted at June 30, 2023 and $
42
million of collateral was posted at December 31, 2022. If our credit rating had been downgraded below investment grade at June 30, 2023, we would have been required to post $
131
million of additional collateral, either with cash or letters of credit.
|
17
|
ConocoPhillips 2023 Q2 10-Q
|
|||||||
| Notes to Consolidated Financial Statements | |||||
Note 11—Fair Value Measurement
We carry a portion of our assets and liabilities at fair value that are measured at the reporting date using an exit price (i.e., the price that would be received to sell an asset or paid to transfer a liability) and disclosed according to the quality of valuation inputs under the fair value hierarchy.
The classification of an asset or liability is based on the lowest level of input significant to its fair value. Those that are initially classified as Level 3 are subsequently reported as Level 2 when the fair value derived from unobservable inputs is inconsequential to the overall fair value, or if corroborated market data becomes available. Assets and liabilities initially reported as Level 2 are subsequently reported as Level 3 if corroborated market data is no longer available. There were no material transfers into or out of Level 3 during the six-month period ended June 30, 2023, nor during the year ended December 31, 2022.
Recurring Fair Value Measurement
Financial assets and liabilities reported at fair value on a recurring basis include our investments in debt securities classified as available for sale and commodity derivatives.
•
Level 1 derivative assets and liabilities primarily represent exchange-traded futures and options that are valued using unadjusted prices available from the underlying exchange. Level 1 also includes our investments in U.S. government obligations classified as available for sale debt securities, which are valued using exchange prices.
•
Level 2 derivative assets and liabilities primarily represent OTC swaps, options and forward purchase and sale contracts that are valued using adjusted exchange prices, prices provided by brokers or pricing service companies that are all corroborated by market data. Level 2 also includes our investments in debt securities classified as available for sale including investments in corporate bonds, commercial paper, asset-backed securities, U.S. government agency obligations and foreign government obligations that are valued using pricing provided by brokers or pricing service companies that are corroborated with market data.
•
Level 3 derivative assets and liabilities consist of OTC swaps, options and forward purchase and sale contracts where a significant portion of fair value is calculated from underlying market data that is not readily available. The derived value uses industry standard methodologies that may consider the historical relationships among various commodities, modeled market prices, time value, volatility factors and other relevant economic measures. The use of these inputs results in management’s best estimate of fair value. Level 3 activity was not material for all periods presented.
The following table summarizes the fair value hierarchy for gross financial assets and liabilities (i.e., unadjusted where the right of setoff exists for commodity derivatives accounted for at fair value on a recurring basis):
|
Millions of Dollars
|
|||||||||||||||||||||||||||||
| June 30, 2023 | December 31, 2022 | ||||||||||||||||||||||||||||
|
Level 1
|
Level 2
|
Level 3
|
Total
|
Level 1
|
Level 2
|
Level 3
|
Total
|
||||||||||||||||||||||
| Assets | |||||||||||||||||||||||||||||
|
Investments in debt securities
|
$ |
|
|
|
|
|
|
|
|
||||||||||||||||||||
|
Commodity derivatives
|
|
|
|
|
|
|
|
|
|||||||||||||||||||||
|
Total assets
|
$ |
|
|
|
|
|
|
|
|
||||||||||||||||||||
| Liabilities | |||||||||||||||||||||||||||||
| Commodity derivatives | $ |
|
|
|
|
|
|
|
|
||||||||||||||||||||
|
Total liabilities
|
$ |
|
|
|
|
|
|
|
|
||||||||||||||||||||
|
ConocoPhillips 2023 Q2 10-Q
|
18
|
|||||||
|
Notes to Consolidated Financial Statements
|
|||||
The following table summarizes those commodity derivative balances subject to the right of setoff as presented on our consolidated balance sheet. We have elected to offset the recognized fair value amounts for multiple derivative instruments executed with the same counterparty in our financial statements when a legal right of setoff exists.
|
Millions of Dollars
|
|||||||||||||||||||||||
|
Amounts Subject to Right of Setoff
|
|||||||||||||||||||||||
|
Gross
Amounts
Recognized
|
Amounts Not
Subject to
Right of Setoff
|
Gross
Amounts
|
Gross
Amounts
Offset
|
Net
Amounts
Presented
|
Cash
Collateral
|
Net
Amounts
|
|||||||||||||||||
| June 30, 2023 | |||||||||||||||||||||||
| Assets | $ |
|
|
|
|
|
|
|
|||||||||||||||
| Liabilities |
|
|
|
|
|
|
|
||||||||||||||||
| December 31, 2022 | |||||||||||||||||||||||
| Assets | $ |
|
|
|
|
|
|
|
|||||||||||||||
| Liabilities |
|
|
|
|
|
|
|
||||||||||||||||
At June 30, 2023 and December 31, 2022, we did not present any amounts gross on our consolidated balance sheet where we had the right of setoff.
Reported Fair Values of Financial Instruments
We used the following methods and assumptions to estimate the fair value of financial instruments:
•
Cash and cash equivalents and short-term investments: The carrying amount reported on the balance sheet approximates fair value. For those investments classified as available for sale debt securities, the carrying amount reported on the balance sheet is fair value.
•
Accounts and notes receivable (including long-term and related parties): The carrying amount reported on the balance sheet approximates fair value.
•
Investments in debt securities classified as available for sale: The fair value of investments in debt securities categorized as Level 1 in the fair value hierarchy is measured using exchange prices. The fair value of investments in debt securities categorized as Level 2 in the fair value hierarchy is measured using pricing provided by brokers or pricing service companies that are corroborated with market data.
See
Note
10
.
•
Accounts payable (including related parties) and floating-rate debt: The carrying amount of accounts payable and floating-rate debt reported on the balance sheet approximates fair value.
•
Fixed-rate debt: The estimated fair value of fixed-rate debt is measured using prices available from a pricing service that is corroborated by market data; therefore, these liabilities are categorized as Level 2 in the fair value hierarchy.
•
Commercial paper: The carrying amount of our commercial paper instruments approximates fair value and is reported on the balance sheet as short-term debt.
The following table summarizes the net fair value of financial instruments (i.e., adjusted where the right of setoff exists for commodity derivatives):
|
Millions of Dollars
|
|||||||||||||||||
|
Carrying Amount
|
Fair Value
|
||||||||||||||||
|
June 30
2023 |
December 31
2022 |
June 30
2023 |
December 31
2022 |
||||||||||||||
| Financial assets | |||||||||||||||||
|
Commodity derivatives
|
|
|
|
|
|||||||||||||
|
Investments in debt securities
|
|
|
|
|
|||||||||||||
| Financial liabilities | |||||||||||||||||
|
Total debt, excluding finance leases
|
|
|
|
|
|||||||||||||
|
Commodity derivatives
|
|
|
|
|
|||||||||||||
|
19
|
ConocoPhillips 2023 Q2 10-Q
|
|||||||
| Notes to Consolidated Financial Statements | |||||
Note 12—Accumulated Other Comprehensive Loss
Accumulated other comprehensive loss in the equity section of our consolidated balance sheet includes:
|
|
Millions of Dollars
|
|||||||||||||
|
|
Defined Benefit
Plans
|
Net Unrealized
Loss on
Securities
|
Foreign
Currency
Translation
|
Accumulated
Other
Comprehensive
Loss
|
||||||||||
| December 31, 2022 | $ |
(
|
(
|
(
|
(
|
|||||||||
|
Other comprehensive income
|
|
|
|
|
||||||||||
| June 30, 2023 | $ |
(
|
(
|
(
|
(
|
|||||||||
The following table summarizes reclassifications out of accumulated other comprehensive loss and into net income:
|
|
Millions of Dollars
|
|||||||||||||
|
|
Three Months Ended
June 30
|
Six Months Ended
June 30
|
||||||||||||
|
|
2023 | 2022 | 2023 | 2022 | ||||||||||
|
Defined benefit plans
|
$ |
|
|
|
|
|||||||||
The above amounts are included in the computation of net periodic benefit cost and are presented net of tax expense of $
3
million and $
3
million for the three-month periods ended June 30, 2023 and June 30, 2022, respectively, and $
6
million and $
5
million for the six-month periods ended
Note 13—Cash Flow Information
|
|
Millions of Dollars
|
|||||||
|
|
Six Months Ended
June 30
|
|||||||
| 2023 | 2022 | |||||||
|
Cash Payments
|
||||||||
|
Interest
|
$ |
|
|
|||||
|
Income taxes
|
|
|
||||||
| Net Sales (Purchases) of Investments | ||||||||
|
Short-term investments purchased
|
$ |
(
|
(
|
|||||
|
Short-term investments sold
|
|
|
||||||
|
Long-term investments purchased
|
(
|
(
|
||||||
|
Long-term investments sold
|
|
|
||||||
|
|
$ |
|
(
|
|||||
|
ConocoPhillips 2023 Q2 10-Q
|
20
|
|||||||
|
Notes to Consolidated Financial Statements
|
|||||
Note 14—Employee Benefit Plans
Pension and Postretirement Plans
|
Millions of Dollars
|
|||||||||||||||||||||||||||||||||||
|
Pension Benefits
|
Other Benefits
|
||||||||||||||||||||||||||||||||||
| 2023 | 2022 | 2023 | 2022 | ||||||||||||||||||||||||||||||||
|
U.S.
|
Int'l.
|
U.S.
|
Int'l.
|
||||||||||||||||||||||||||||||||
|
Components of Net Periodic Benefit Cost
|
|||||||||||||||||||||||||||||||||||
|
Three Months Ended June 30
|
|||||||||||||||||||||||||||||||||||
|
Service cost
|
$ |
|
|
|
|
|
|
||||||||||||||||||||||||||||
|
Interest cost
|
|
|
|
|
|
|
|||||||||||||||||||||||||||||
|
Expected return on plan assets
|
(
|
(
|
(
|
(
|
|
|
|||||||||||||||||||||||||||||
|
Amortization of prior service credit
|
|
|
|
|
(
|
(
|
|||||||||||||||||||||||||||||
|
Recognized net actuarial loss (gain)
|
|
|
|
|
(
|
|
|||||||||||||||||||||||||||||
|
Settlements
|
|
|
|
|
|
|
|||||||||||||||||||||||||||||
|
Net periodic benefit cost
|
$ |
|
|
|
|
(
|
(
|
||||||||||||||||||||||||||||
|
Six Months Ended June 30
|
|||||||||||||||||||||||||||||||||||
| Service cost | $ |
|
|
|
|
|
|
||||||||||||||||||||||||||||
|
Interest cost
|
|
|
|
|
|
|
|||||||||||||||||||||||||||||
|
Expected return on plan assets
|
(
|
(
|
(
|
(
|
|
|
|||||||||||||||||||||||||||||
|
Amortization of prior service credit
|
|
|
|
|
(
|
(
|
|||||||||||||||||||||||||||||
|
Recognized net actuarial loss (gain)
|
|
|
|
|
(
|
|
|||||||||||||||||||||||||||||
|
Settlements
|
|
|
|
|
|
|
|||||||||||||||||||||||||||||
| Net periodic benefit cost | $ |
|
|
|
|
(
|
(
|
||||||||||||||||||||||||||||
The components of net periodic benefit cost, other than the service cost component, are included in the "Other expenses" line of our consolidated income statement.
During the first six months of 2023, we contributed $
71
million to our domestic benefit plans and $
13
million to our international benefit plans. We expect our total contributions in 2023 to be approximately $
135
million to our domestic qualified and nonqualified pension and postretirement benefit plans and $
65
million to our international qualified and nonqualified pension and postretirement benefit plans.
Note 15—Related Party Transactions
Our related parties primarily include equity method investments and certain trusts for the benefit of employees.
|
|
Millions of Dollars
|
||||||||||||||||
|
|
Three Months Ended
June 30
|
Six Months Ended
June 30
|
|||||||||||||||
| 2023 | 2022 | 2023 | 2022 | ||||||||||||||
|
Significant Transactions with Equity Affiliates
|
|||||||||||||||||
|
Operating revenues and other income
|
$ |
|
|
|
|
||||||||||||
|
Operating expenses and selling, general and administrative expenses
|
|
|
|
|
|||||||||||||
|
Net interest income
|
|
|
|
(
|
|||||||||||||
|
21
|
ConocoPhillips 2023 Q2 10-Q
|
|||||||
| Notes to Consolidated Financial Statements | |||||
Note 16—Sales and Other Operating Revenues
Revenue from Contracts with Customers
The following table provides further disaggregation of our consolidated sales and other operating revenues:
|
|
Millions of Dollars
|
|||||||||||||
|
|
Three Months Ended
June 30
|
Six Months Ended
June 30
|
||||||||||||
|
|
2023 | 2022 | 2023 | 2022 | ||||||||||
|
Revenue from contracts with customers
|
$ |
|
|
|
|
|||||||||
| Revenue from contracts outside the scope of ASC Topic 606 | ||||||||||||||
|
Physical contracts meeting the definition of a derivative
|
|
|
|
|
||||||||||
|
Financial derivative contracts
|
(
|
|
(
|
|
||||||||||
|
Consolidated sales and other operating revenues
|
$ |
|
|
|
|
|||||||||
Revenues from contracts outside the scope of ASC Topic 606 relate primarily to physical gas contracts at market prices, which qualify as derivatives accounted for under ASC Topic 815, “Derivatives and Hedging,” and for which we have not elected NPNS. There is no significant difference in contractual terms or the policy for recognition of revenue from these contracts and those within the scope of ASC Topic 606.
The following disaggregation of revenues is provided in conjunction with
Note
18
—Segment Disclosures and Related Information:
|
Millions of Dollars
|
||||||||||||||
|
Three Months Ended
June 30
|
Six Months Ended
June 30
|
|||||||||||||
| 2023 | 2022 | 2023 | 2022 | |||||||||||
|
Revenue from Contracts Outside the Scope of ASC Topic 606 by Segment
|
||||||||||||||
|
Lower 48
|
$ |
|
|
|
|
|||||||||
| Canada |
|
|
|
|
||||||||||
|
Europe, Middle East and North Africa
|
|
|
|
|
||||||||||
|
Physical contracts meeting the definition of a derivative
|
$ |
|
|
|
|
|||||||||
|
|
Millions of Dollars
|
|||||||||||||
|
|
Three Months Ended
June 30
|
Six Months Ended
June 30
|
||||||||||||
| 2023 | 2022 | 2023 | 2022 | |||||||||||
|
Revenue from Contracts Outside the Scope of ASC Topic 606 by Product
|
||||||||||||||
|
Crude oil
|
$ |
|
|
|
|
|||||||||
|
Natural gas
|
|
|
|
|
||||||||||
|
Other
|
|
|
|
|
||||||||||
|
Physical contracts meeting the definition of a derivative
|
$ |
|
|
|
|
|||||||||
Practical Expedients
Typically, our commodity sales contracts are less than 12 months in duration; however, in certain specific cases may extend longer, which may be out to the end of field life. We have long-term commodity sales contracts which use prevailing market prices at the time of delivery, and under these contracts, the market-based variable consideration for each performance obligation (i.e., delivery of commodity) is allocated to each wholly unsatisfied performance obligation within the contract. Accordingly, we have applied the practical expedient allowed in ASC Topic 606 and do not disclose the aggregate amount of the transaction price allocated to performance obligations or when we expect to recognize revenues that are unsatisfied (or partially unsatisfied) as of the end of the reporting period.
|
ConocoPhillips 2023 Q2 10-Q
|
22
|
|||||||
|
Notes to Consolidated Financial Statements
|
|||||
Receivables and Contract Liabilities
Receivables from Contracts with Customers
At June 30, 2023, the “Accounts and notes receivable” line on our consolidated balance sheet included trade receivables of $
3,511
million compared with $
5,241
million at December 31, 2022, and included both contracts with customers within the scope of ASC Topic 606 and those that are outside the scope of ASC Topic 606. We typically receive payment within 30 days or less (depending on the terms of the invoice) once delivery is made. Revenues that are outside the scope of ASC Topic 606 relate primarily to physical gas sales contracts at market prices for which we do not elect NPNS and are therefore accounted for as a derivative under ASC Topic 815. There is little distinction in the nature of the customer or credit quality of trade receivables associated with gas sold under contracts for which NPNS has not been elected compared to trade receivables where NPNS has been elected.
Contract Liabilities from Contracts with Customers
Note 17—Earnings Per Share
The following table presents the calculation of net income available to common shareholders and basic and diluted EPS. For the periods presented in the table below, diluted EPS calculated under the two-class method was more dilutive.
|
Millions of Dollars
(except per share amounts) |
||||||||||||||
|
Three Months Ended
June 30 |
Six Months Ended
June 30 |
|||||||||||||
| 2023 | 2022 | 2023 | 2022 | |||||||||||
| Basic earnings per share | ||||||||||||||
| Net Income | $ |
|
|
|
|
|||||||||
| Less: Dividends and undistributed earnings | ||||||||||||||
| allocated to participating securities |
|
|
|
|
||||||||||
| Net Income available to common shareholders | $ |
|
|
|
|
|||||||||
| Average common shares outstanding (in Millions) |
|
|
|
|
||||||||||
| Net Income Per Share of Common Stock | $ |
|
|
|
|
|||||||||
| Diluted earnings per share | ||||||||||||||
| Net Income available to common shareholders | $ |
|
|
|
|
|||||||||
| Average common shares outstanding (in Millions) |
|
|
|
|
||||||||||
| Add: Dilutive impact of options and unvested | ||||||||||||||
| non-participating RSU/PSUs (in Millions) |
|
|
|
|
||||||||||
| Average diluted shares outstanding (in Millions) |
|
|
|
|
||||||||||
| Net Income Per Share of Common Stock | $ |
|
|
|
|
|||||||||
|
23
|
ConocoPhillips 2023 Q2 10-Q
|
|||||||
| Notes to Consolidated Financial Statements | |||||
Note 18—Segment Disclosures and Related Information
We explore for, produce, transport and market crude oil, bitumen, natural gas, LNG and NGLs on a worldwide basis. We manage our operations through
six
operating segments, which are primarily defined by geographic region: Alaska; Lower 48; Canada; Europe, Middle East and North Africa; Asia Pacific; and Other International.
Corporate and Other represents income and costs not directly associated with an operating segment, such as most interest income and expense; impacts from certain debt transactions; consolidating tax adjustments; corporate overhead and certain technology activities, including licensing revenues; and unrealized holding gains or losses on equity securities. All cash and cash equivalents and short-term investments are included in Corporate and Other.
We evaluate performance and allocate resources based on net income (loss). Intersegment sales are at prices that approximate market.
Analysis of Results by Operating Segment
|
|
Millions of Dollars
|
|||||||||||||
|
|
Three Months Ended
June 30
|
Six Months Ended
June 30
|
||||||||||||
| 2023 | 2022 | 2023 | 2022 | |||||||||||
|
Sales and Other Operating Revenues
|
||||||||||||||
|
Alaska
|
$ |
|
|
|
|
|||||||||
|
Lower 48
|
|
|
|
|
||||||||||
|
Intersegment eliminations
|
(
|
(
|
(
|
(
|
||||||||||
|
Lower 48
|
|
|
|
|
||||||||||
|
Canada
|
|
|
|
|
||||||||||
|
Intersegment eliminations
|
(
|
(
|
(
|
(
|
||||||||||
|
Canada
|
|
|
|
|
||||||||||
|
Europe, Middle East and North Africa
|
|
|
|
|
||||||||||
|
Asia Pacific
|
|
|
|
|
||||||||||
|
Other International
|
|
|
|
|
||||||||||
|
Corporate and Other
|
|
|
|
|
||||||||||
|
Consolidated sales and other operating revenues
|
$ |
|
|
|
|
|||||||||
|
Sales and Other Operating Revenues by Geographic Location
(1)
|
||||||||||||||
|
United States
|
$ |
|
|
|
|
|||||||||
|
Canada
|
|
|
|
|
||||||||||
|
China
|
|
|
|
|
||||||||||
|
Indonesia
|
|
|
|
|
||||||||||
| Libya |
|
|
|
|
||||||||||
|
Malaysia
|
|
|
|
|
||||||||||
|
Norway
|
|
|
|
|
||||||||||
|
United Kingdom
|
|
|
|
|
||||||||||
|
Other foreign countries
|
|
|
|
|
||||||||||
|
Worldwide consolidated
|
$ |
|
|
|
|
|||||||||
|
Sales and Other Operating Revenues by Product
|
||||||||||||||
|
Crude oil
|
$ |
|
|
|
|
|||||||||
|
Natural gas
|
|
|
|
|
||||||||||
|
Natural gas liquids
|
|
|
|
|
||||||||||
|
Other
(2)
|
|
|
|
|
||||||||||
|
Consolidated sales and other operating revenues by product
|
$ |
|
|
|
|
|||||||||
(1)
Sales and other operating revenues are attributable to countries based on the location of the selling operation.
(2)
Includes bitumen and power.
|
ConocoPhillips 2023 Q2 10-Q
|
24
|
|||||||
|
Notes to Consolidated Financial Statements
|
|||||
|
Millions of Dollars
|
||||||||||||||
|
Three Months Ended
June 30
|
Six Months Ended
June 30
|
|||||||||||||
| 2023 | 2022 | 2023 | 2022 | |||||||||||
| Net Income (Loss) | ||||||||||||||
|
Alaska
|
$ |
|
|
|
|
|||||||||
|
Lower 48
|
|
|
|
|
||||||||||
| Canada |
|
|
|
|
||||||||||
|
Europe, Middle East and North Africa
|
|
|
|
|
||||||||||
|
Asia Pacific
|
|
|
|
|
||||||||||
|
Other International
|
(
|
|
(
|
|
||||||||||
|
Corporate and Other
|
(
|
(
|
(
|
|
||||||||||
|
Consolidated net income
|
$ |
|
|
|
|
|||||||||
|
Millions of Dollars
|
||||||||
|
June 30
2023 |
December 31
2022 |
|||||||
| Total Assets | ||||||||
|
Alaska
|
$ |
|
|
|||||
|
Lower 48
|
|
|
||||||
| Canada |
|
|
||||||
|
Europe, Middle East and North Africa
|
|
|
||||||
|
Asia Pacific
|
|
|
||||||
|
Other International
|
|
|
||||||
|
Corporate and Other
|
|
|
||||||
|
Consolidated total assets
|
$ |
|
|
|||||
Note 19—Income Taxes
Our effective tax rate for the three-month periods ended June 30, 2023 and 2022 was
33.6
percent and
32.8
percent, respectively, and our effective tax rate for the six-month periods ended June 30, 2023 and 2022, was
35.0
percent and
29.9
percent, respectively. The change in our effective tax rate for the six-month period ended June 30, 2023 is primarily due to the absence of a release of tax reserves as described below and a shift in our mix of income among our tax jurisdictions.
In the first quarter of 2022, the IRS closed the 2017 audit of our U.S. federal income tax return. As a result, we recognized federal and state tax benefits totaling $
515
million relating to the recovery of outside tax basis previously offset by a full reserve.
The Company has ongoing income tax audits in a number of jurisdictions. The government agents in charge of these audits regularly request additional time to complete audits, which we generally grant, and conversely occasionally close audits unpredictably. Within the next twelve months, we may have audit periods close that could significantly impact our total unrecognized tax benefits. The amount of such change is not estimable but could be significant when compared with our total unrecognized tax benefits.
|
25
|
ConocoPhillips 2023 Q2 10-Q
|
|||||||
| Management’s Discussion and Analysis | |||||
Item 2. Management’s Discussion and Analysis of Financial Condition and Results of Operations
Management’s Discussion and Analysis is the company’s analysis of its financial performance and of significant trends that may affect future performance. It should be read in conjunction with the financial statements and notes. It contains forward-looking statements including, without limitation, statements relating to the company’s plans, strategies, objectives, expectations and intentions that are made pursuant to the “safe harbor” provisions of the Private Securities Litigation Reform Act of 1995. The words “anticipate,” “believe,” “budget,” “continue,” “could,” “effort,” “estimate,” “expect,” “forecast,” “goal,” “guidance,” “intend,” “may,” “objective,” “outlook,” “plan,” “potential,” “predict,” “projection,” “seek,” “should,” “target,” “will,” “would” and similar expressions identify forward-looking statements. The company does not undertake to update, revise or correct any of the forward-looking information unless required to do so under the federal securities laws. Readers are cautioned that such forward-looking statements should be read in conjunction with the company’s disclosures under the heading: “CAUTIONARY STATEMENT FOR THE PURPOSES OF THE ‘SAFE HARBOR’ PROVISIONS OF THE PRIVATE SECURITIES LITIGATION REFORM ACT OF 1995,” beginning on page
47
.
The terms “earnings” and “loss” as used in Management’s Discussion and Analysis refer to net income (loss).
Business Environment and Executive Overview
ConocoPhillips is one of the world’s leading E&P companies based on production and reserves, with operations and activities in 13 countries. Our diverse, low cost of supply portfolio includes resource-rich unconventional plays in North America; conventional assets in North America, Europe and Asia; LNG developments; oil sands in Canada; and an inventory of global exploration prospects. Headquartered in Houston, Texas, at June 30, 2023, we employed approximately 9,700 people worldwide and had total assets of $90 billion.
Overview
At ConocoPhillips, we anticipate that commodity prices will continue to be cyclical and volatile, and our view is that a successful business strategy in the E&P industry must be resilient in lower price environments, while also retaining full upside exposure during periods of higher prices. As such, we are unhedged, remain committed to our disciplined investment framework and continually monitor market fundamentals, including the impacts associated with the conflict in Ukraine, OPEC Plus crude supplies, global demand for our products, oil and gas inventory levels, governmental policies, inflation and supply chain disruptions.
The macro-environment, including the energy transition, also continues to evolve. We believe ConocoPhillips will continue to play an essential role by executing on three objectives: reliably and responsibly meeting energy transition pathway demand, delivering competitive returns on and of capital and focusing on achieving our net-zero operational emissions ambition. We call this our Triple Mandate, and it represents our commitment to create long-term value for our stakeholders.
Our value proposition to deliver superior returns to stockholders through price cycles is guided by foundational principles and capital allocation priorities that support our Triple Mandate. Our foundational principles consist of maintaining balance sheet strength, providing peer-leading distributions, making disciplined investments and demonstrating responsible and reliable ESG performance.
In the second quarter of 2023, we completed a strategic debt refinancing that extends the weighted average maturity of our portfolio from 15 years to 17 years and reduces near term debt maturities.
See Note
6
.
In July, as a part of ongoing portfolio optimization geared towards our returns-focused value proposition, we executed an agreement to purchase the remaining 50 percent interest in Surmont, an asset in our Canada segment. Surmont's long life and durable, low cost of supply barrels play an important role in our portfolio. The transaction is expected to close in the second half of 2023, subject to regulatory approvals and other customary closing conditions. Upon close, as the 100 percent owner and operator of Surmont, we will seek to optimize the asset while remaining on track to achieve our previously announced corporate emissions intensity objectives.
See Note
3
.
|
ConocoPhillips 2023 Q2 10-Q
|
26
|
|||||||
|
Management’s Discussion and Analysis
|
|||||
As the energy transition continues, we expect demand for lower GHG intensity fuels, such as LNG, to grow to displace coal. In the second quarter of 2023, we continued pursuing expansion of our global LNG portfolio. In June, we closed on the formation of the North Field South (NFS) joint venture, Qatar Liquefied Gas Company Limited (12) (QG12). Participation in the Qatar Liquefied Gas Company Limited (8) (QG8) (North Field East) and QG12 joint ventures will add approximately 2 MTPA net to ConocoPhillips.
See Note
4.
Additionally, we signed 20-year offtake agreements at the Saguaro LNG export facility on the west coast of Mexico for approximately 2.2 MTPA, subject to Mexico Pacific reaching FID and other certain conditions precedent.
In August, we reconfirmed our 2023 planned return of capital to shareholders of $11 billion through our three-tier return of capital framework, significantly exceeding our goal of 30 percent of our anticipated cash provided by operating activities for the full year. We also declared an ordinary dividend of $0.51 per share and a fourth-quarter VROC payment of $0.60 per share.
Operationally, we remain focused on safely executing the business. Production was 1,805 MBOED in the second quarter of 2023, an increase of 113 MBOED from the same period a year ago. After adjusting for impacts from closed acquisitions and dispositions, second-quarter 2023 production increased by 100 MBOED or six percent from the same period a year ago. Organic growth from Lower 48 and other development programs more than offset normal field decline and downtime.
Second-quarter production resulted in $3.9 billion of cash provided by operating activities. We returned $1.3 billion to shareholders through share repurchases and $1.4 billion through our ordinary dividend and a VROC. We ended the quarter with cash, cash equivalents and short-term investments totaling $6.8 billion.
We re-invested $2.9 billion into the business in the form of capital expenditures and investments during the second quarter of 2023, with over half of the expenditures related to flexible, short-cycle unconventional plays in the Lower 48 segment, where our production has access to both domestic and export markets.
|
27
|
ConocoPhillips 2023 Q2 10-Q
|
|||||||
| Management’s Discussion and Analysis | |||||
Business Environment
Commodity prices are the most significant factor impacting our profitability and related returns on and of capital to our shareholders. Dynamics that could influence world energy markets and commodity prices include, but are not limited to, global economic health, supply or demand disruptions or fears thereof caused by civil unrest, global pandemics, military conflicts, actions taken by OPEC Plus and other major oil producing countries, environmental laws, tax regulations, governmental policies and weather-related disruptions. Our strategy is to create value through price cycles by delivering on the financial, operational and ESG priorities that underpin our value proposition.
Our earnings and operating cash flows generally correlate with price levels for crude oil and natural gas, which are subject to factors external to the company and over which we have no control. The following graph depicts the trend in average benchmark prices for WTI crude oil, Brent crude oil and Henry Hub natural gas:
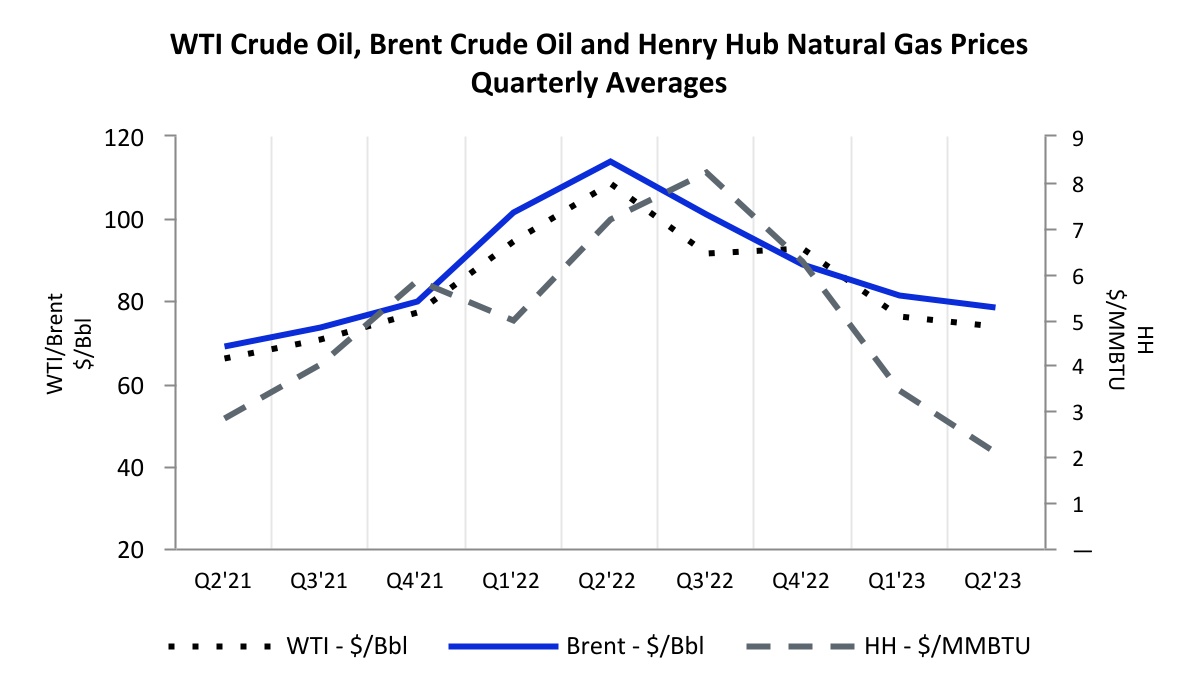
Brent crude oil prices averaged $78.39 per barrel in the second quarter of 2023, a decrease of 31 percent compared with $113.78 per barrel in the second quarter of 2022. WTI at Cushing crude oil prices averaged $73.78 per barrel in the second quarter of 2023, a decrease of 32 percent compared with $108.41 per barrel in the second quarter of 2022. Oil prices decreased due to persistent macroeconomic headwinds and refinery outages impacting demand concurrent with higher global supplies versus the prior year.
Henry Hub natural gas prices averaged $2.09 per MMBTU in the second quarter of 2023, a decrease of 71 percent compared with $7.17 per MMBTU in the second quarter of 2022. Henry Hub prices decreased due to higher North American production concurrent with excess inventories following a mild winter.
Our realized bitumen price averaged $41.01 per barrel in the second quarter of 2023, a decrease of 46 percent compared with $75.42 per barrel in the second quarter of 2022. The decrease in the second quarter of 2023 was driven by lower blend prices for Surmont sales, largely attributed to a weakening of WTI price and widening WCS differentials. WCS differentials widened due to weaker demand at the U.S. Gulf Coast. We continue to optimize bitumen price realizations through diluent recovery unit operating improvements as well as blending and transportation strategies.
For the second quarter of 2023, our total average realized price was $54.50 per BOE compared with $88.57 per BOE in the second quarter of 2022.
|
ConocoPhillips 2023 Q2 10-Q
|
28
|
|||||||
|
Management’s Discussion and Analysis
|
|||||
Key Operating and Financial Summary
Significant items during the second quarter of 2023 and recent announcements included the following:
•
Delivered record company and Lower 48 production of 1,805 MBOED and 1,063 MBOED, respectively.
•
Executed agreement to purchase the remaining 50% interest in Surmont, subject to regulatory approvals and other closing conditions.
•
Completed acquisition of an equity interest in Qatar's NFS project.
•
Signed 20-year offtake agreements at the Saguaro LNG export facility on the west coast of Mexico for approximately 2.2 MPTA, subject to Mexico Pacific reaching FID.
•
Generated cash provided by operating activities of $3.9 billion.
•
Distributed $2.7 billion to shareholders through a three-tier framework, including $1.4 billion through the ordinary dividend and VROC and $1.3 billion through share repurchases.
•
Ended the quarter with cash, cash equivalents and restricted cash of $6.0 billion and short-term investments of $1.1 billion.
Outlook
Production, Capital and DD&A
Third-quarter 2023 production is expected to be 1.78 to 1.82 MMBOED. Full-year production guidance is now expected to be 1.80 to 1.81 MMBOED, as compared to prior guidance of 1.78 to 1.80 MMBOED.
2023 capital guidance has been narrowed to $10.8 billion to $11.2 billion versus the prior guidance of $10.7 billion to $11.3 billion reflecting ongoing progress on the company's development plans.
2023 guidance for DD&A has increased from $8.1 billion to $8.2 billion.
All guidance excludes any impact from the previously announced Surmont and APLNG transactions.
|
29
|
ConocoPhillips 2023 Q2 10-Q
|
|||||||
| Results of Operations | |||||
Results of Operations
Unless otherwise indicated, discussion of consolidated results for the three- and six-month periods ended June 30, 2023, is based on a comparison with the corresponding period of 2022.
Consolidated Results
A summary of the company's net income (loss) by business segment follows:
|
Millions of Dollars
|
|||||||||||||||||
|
Three Months Ended
June 30 |
Six Months Ended
June 30 |
||||||||||||||||
| 2023 | 2022 | 2023 | 2022 | ||||||||||||||
|
Alaska
|
$ | 372 | 687 | 788 | 1,271 | ||||||||||||
|
Lower 48
|
1,230 | 3,581 | 3,082 | 6,371 | |||||||||||||
|
Canada
|
32 | 316 | 38 | 607 | |||||||||||||
|
Europe, Middle East and North Africa
|
264 | 385 | 629 | 797 | |||||||||||||
|
Asia Pacific
|
387 | 525 | 909 | 1,661 | |||||||||||||
|
Other International
|
(4) | — | (3) | — | |||||||||||||
|
Corporate and Other
|
(49) | (349) | (291) | 197 | |||||||||||||
|
Net income
|
$ | 2,232 | 5,145 | 5,152 | 10,904 | ||||||||||||
Net income in the second quarter of 2023 decreased $2,913 million. Second quarter earnings were negatively impacted by:
•
Lower realized commodity prices.
•
Absence of gains from dispositions related to the sale of certain noncore assets in the Lower 48 segment as well as contingent payments associated with previous asset sales.
•
Higher DD&A expenses primarily due to higher overall production volumes and higher rates from impacts to reserve revisions driven by higher operating expenses.
•
Higher production and operating expenses primarily driven by higher production volumes in the Lower 48 segment and increased well work activity.
•
Lower LNG sales prices, reflected in equity in earnings of affiliates.
Offsets to the earnings decreases include:
•
Lower taxes other than income taxes primarily driven by lower commodity prices, partially offset by higher production volumes.
•
Higher sales volumes driven primarily by development in the Lower 48 segment.
Net income in the six-month period ended June 30, 2023, decreased $5,752 million. In addition to the items mentioned above, earnings in the six-month period were negatively impacted by:
•
Absence of a $515 million tax benefit related to the closing of an IRS audit in the first quarter of 2022.
See Note
19
.
•
Absence of gains from dispositions associated with the divestiture of our Indonesia assets in the first quarter of 2022.
•
Absence of gains associated with our Cenovus Energy (CVE) common shares which were fully divested in the first quarter of 2022.
See Note
5
.
Offsets to the earnings decreases in the six-month period include improved commercial performance and timing.
See the “Segment Results”
section for additional information.
|
ConocoPhillips 2023 Q2 10-Q
|
30
|
|||||||
|
Results of Operations
|
|||||
Income Statement Analysis
Unless otherwise indicated, all results in Income Statement Analysis are before-tax.
Sales and other operating revenues
for the three- and six-month periods of 2023 decreased $8,810 million and $11,761 million, respectively, primarily due to lower realized commodity prices, partially offset by higher sales volumes driven primarily by development in the Lower 48 segment. Decreases in the six-month period also include the impact of the divestiture of our Indonesia assets in the first quarter of 2022.
Equity in earnings of affiliates
in the second quarter of 2023 decreased $112 million due to lower earnings primarily driven by lower LNG and crude prices
.
Gain (loss) on dispositions
for the three- and six-month periods of 2023 decreased $263 million and $987 million, respectively, primarily due to the absence of gains associated with the divestiture of noncore assets in the Lower 48 segment in the second quarter of 2022, the absence of contingent payments associated with previous dispositions in our Canada and Lower 48 segments as well as the divestiture of our Indonesia assets in the first quarter of 2022.
Purchased commodities
for the three- and six-month periods of 2023 decreased $4,618 million and $5,231 million, respectively, primarily due to lower prices across all commodities in the U.S. and Europe.
Production and operating expenses
for the three- and six-month periods of 2023 increased $145 million and $343 million, respectively, primarily due to higher production volumes in the Lower 48 segment and increased well work activity.
Selling, general and administrative expenses
increased $109 million in the second quarter of 2023 primarily due to mark to market adjustments associated with certain compensation programs.
DD&A expenses
for the three- and six-month periods of 2023 increased $200 million and $319 million, respectively, mainly due to higher overall production volumes primarily due to development in the Lower 48 segment and higher rates from impacts to reserve revisions driven by higher operating expenses, partially offset by the absence of DD&A from disposed assets.
Taxes other than income taxes
for the three- and six-month periods of 2023 decreased $508 million and $746 million, respectively, driven by lower commodity prices, partially offset by higher production volumes.
Other expenses
decreased $109 million in the second quarter of 2023 primarily related to the absence of premiums paid to repurchase debt in the second quarter of 2022 as well as a gain of $27 million associated with extinguishment of debt in the second quarter of 2023.
See
Note
19
—Income Taxes
for information regarding our
Income tax provision
and effective tax rate.
|
31
|
ConocoPhillips 2023 Q2 10-Q
|
|||||||
| Results of Operations | |||||
Summary Operating Statistics
|
Three Months Ended
June 30 |
Six Months Ended
June 30 |
|||||||||||||
| 2023 | 2022 | 2023 | 2022 | |||||||||||
| Average Net Production | ||||||||||||||
| Crude oil (MBD) | ||||||||||||||
|
Consolidated operations
|
918 | 857 | 922 | 880 | ||||||||||
|
Equity affiliates
|
13 | 14 | 12 | 13 | ||||||||||
|
Total crude oil
|
931 | 871 | 934 | 893 | ||||||||||
| Natural gas liquids (MBD) | ||||||||||||||
|
Consolidated operations
|
275 | 236 | 270 | 227 | ||||||||||
|
Equity affiliates
|
8 | 8 | 7 | 7 | ||||||||||
|
Total natural gas liquids
|
283 | 244 | 277 | 234 | ||||||||||
|
Bitumen (MBD)
|
66 | 59 | 67 | 63 | ||||||||||
| Natural gas (MMCFD) | ||||||||||||||
|
Consolidated operations
|
1,896 | 1,872 | 1,909 | 1,999 | ||||||||||
|
Equity affiliates
|
1,251 | 1,235 | 1,209 | 1,181 | ||||||||||
|
Total natural gas
|
3,147 | 3,107 | 3,118 | 3,180 | ||||||||||
|
Total Production
(MBOED)
|
1,805 | 1,692 | 1,798 | 1,720 | ||||||||||
|
|
Dollars Per Unit
|
|||||||||||||
|
Average Sales Prices
|
||||||||||||||
|
Crude oil (per bbl)
|
||||||||||||||
|
Consolidated operations
|
$ | 74.18 | 111.49 | 75.85 | 102.97 | |||||||||
|
Equity affiliates
|
75.10 | 111.97 | 77.90 | 105.20 | ||||||||||
|
Total crude oil
|
74.19 | 111.50 | 75.88 | 103.00 | ||||||||||
|
Natural gas liquids (per bbl)
|
||||||||||||||
| Consolidated operations | 20.05 | 42.20 | 22.41 | 41.61 | ||||||||||
|
Equity affiliates
|
43.62 | 72.44 | 50.13 | 69.99 | ||||||||||
|
Total natural gas liquids
|
20.72 | 43.26 | 23.18 | 42.57 | ||||||||||
|
Bitumen (per bbl)
|
41.01 | 75.42 | 34.93 | 70.25 | ||||||||||
|
Natural gas (per MCF)
|
||||||||||||||
| Consolidated operations | 2.89 | 10.19 | 4.27 | 9.46 | ||||||||||
|
Equity affiliates
|
8.23 | 10.08 | 9.06 | 9.51 | ||||||||||
|
Total natural gas
|
5.04 | 10.15 | 6.16 | 9.48 | ||||||||||
|
Millions of Dollars
|
||||||||||||||
|
Exploration Expenses
|
||||||||||||||
|
General administrative, geological and geophysical,
lease rental and other
|
$ | 49 | 46 | 119 | 108 | |||||||||
|
Leasehold impairment
|
11 | 10 | 30 | 16 | ||||||||||
|
Dry holes
|
23 | 87 | 72 | 88 | ||||||||||
| $ | 83 | 143 | 221 | 212 | ||||||||||
|
ConocoPhillips 2023 Q2 10-Q
|
32
|
|||||||
|
Results of Operations
|
|||||
We explore for, produce, transport and market crude oil, bitumen, natural gas, LNG and NGLs on a worldwide basis. At June 30, 2023, our operations were producing in the U.S., Norway, Canada, Australia, China, Malaysia, Qatar and Libya.
Total production of 1,805 MBOED increased 113 MBOED or 7 percent in the second quarter of 2023 and 78 MBOED or 5 percent in the six-month period of 2023, primarily due to new wells online in the Lower 48, Alaska, Australia, Canada, China, Malaysia and Libya.
Production increases in the second quarter of 2023 were partially offset due to normal field decline.
After adjusting for impacts from closed acquisitions and dispositions, second-quarter 2023 production increased by 100 MBOED or six percent from the same period a year ago. Organic growth from Lower 48 and other development programs more than offset normal field decline and downtime.
Production for the first six months of 2023 was 1,798 MBOED, an increase of 78 MBOED from the same period a year ago. After adjusting for impacts from closed acquisitions and dispositions, production increased 82 MBOED or five percent from the same period a year ago. Organic growth from Lower 48 and other development programs more than offset normal field decline and downtime.
|
33
|
ConocoPhillips 2023 Q2 10-Q
|
|||||||
| Results of Operations | |||||
Segment Results
Unless otherwise indicated, discussion of segment results for the three- and six-month periods ended June 30, 2023, is based on a comparison with the corresponding period of 2022 and are shown after-tax.
Alaska
|
|
Three Months Ended
June 30 |
Six Months Ended
June 30 |
||||||||||||
|
|
2023 | 2022 | 2023 | 2022 | ||||||||||
|
Net Income
($MM)
|
$ | 372 | 687 | 788 | 1,271 | |||||||||
|
Average Net Production
|
||||||||||||||
|
Crude oil (MBD)
|
176 | 177 | 177 | 180 | ||||||||||
|
Natural gas liquids (MBD)
|
16 | 16 | 18 | 17 | ||||||||||
|
Natural gas (MMCFD)
|
34 | 34 | 38 | 34 | ||||||||||
|
Total Production
(MBOED)
|
198 | 199 | 201 | 203 | ||||||||||
|
Average Sales Prices
|
||||||||||||||
|
Crude oil ($ per bbl)
|
$ | 76.09 | 114.77 | 79.08 | 105.26 | |||||||||
|
Natural gas ($ per MCF)
|
4.38 | 3.34 | 4.49 | 3.66 | ||||||||||
The Alaska segment primarily explores for, produces, transports and markets crude oil, NGLs and natural gas. As of June 30, 2023, Alaska contributed 15 percent of our consolidated liquids production and two percent of our consolidated natural gas production.
Net Income
Earnings from Alaska decreased $315 million and $483 million in the three- and six-month periods of 2023, respectively. Decreases to earnings were primarily due to lower realized crude oil prices.
Offsets to the earnings decreases include lower taxes other than income taxes driven by lower realized crude oil prices.
Production
Average production decreased 1 MBOED and 2 MBOED in the three- and six-month periods of 2023, respectively. Decreases to production were primarily due to normal field decline.
Offsets to the production decreases were new wells online at our Western North Slope and Greater Kuparuk Area assets.
|
ConocoPhillips 2023 Q2 10-Q
|
34
|
|||||||
|
Results of Operations
|
|||||
Lower 48
|
Three Months Ended
June 30 |
Six Months Ended
June 30 |
|||||||||||||
| 2023 | 2022 | 2023 | 2022 | |||||||||||
|
Net Income
($MM)
|
$ | 1,230 | 3,581 | 3,082 | 6,371 | |||||||||
| Average Net Production | ||||||||||||||
|
Crude oil (MBD)
|
565 | 528 | 563 | 533 | ||||||||||
|
Natural gas liquids (MBD)
|
252 | 214 | 245 | 203 | ||||||||||
|
Natural gas (MMCFD)
|
1,478 | 1,411 | 1,448 | 1,419 | ||||||||||
|
Total Production
(MBOED)
|
1,063 | 977 | 1,049 | 972 | ||||||||||
|
Average Sales Prices
|
||||||||||||||
|
Crude oil ($ per bbl)
|
$ | 72.06 | 109.14 | 73.19 | 101.34 | |||||||||
|
Natural gas liquids ($ per bbl)
|
19.61 | 42.00 | 22.01 | 41.26 | ||||||||||
|
Natural gas ($ per MCF)
|
1.43 | 6.85 | 2.16 | 5.74 | ||||||||||
The Lower 48 segment consists of operations located in the U.S. Lower 48 states, as well as producing properties in the Gulf of Mexico. As of June 30, 2023, the Lower 48 contributed 64 percent of our consolidated liquids production and 76 percent of our consolidated natural gas production.
Net Income
Earnings from the Lower 48 decreased $2,351 million and $3,289 million in the three- and six-month periods of 2023, respectively. Decreases to earnings include:
•
Lower realized commodity prices.
•
Higher DD&A expenses primarily due to higher production volumes as well as higher rates from impacts to reserve revisions driven by higher operating expenses.
•
Higher production and operating expenses primarily due to higher production volumes, increased well work activity and inflation.
•
Absence of gains on disposition of $63 million related to the sale of certain noncore assets as well as contingent payments associated with previous asset sales.
Offsets to the earnings decrease include:
•
Higher sales volumes.
•
Lower taxes other than income taxes driven by lower realized crude oil prices.
In addition to the items mentioned above, in the six-month period of 2023, earnings impacts include higher earnings associated with improved commercial performance and timing.
Production
Average production increased 86 MBOED and 77 MBOED in the three- and six-month periods of 2023, respectively. Increases to production were primarily due to new wells online from our development programs in the Delaware Basin, Eagle Ford, Midland Basin and Bakken.
Offsets to the production increases were primarily due to normal field decline.
|
35
|
ConocoPhillips 2023 Q2 10-Q
|
|||||||
| Results of Operations | |||||
Canada
|
Three Months Ended
June 30 |
Six Months Ended
June 30 |
|||||||||||||
| 2023 | 2022 | 2023 | 2022 | |||||||||||
|
Net Income
($MM)
|
$ | 32 | 316 | 38 | 607 | |||||||||
|
Average Net Production
|
||||||||||||||
|
Crude oil (MBD)
|
6 | 5 | 6 | 6 | ||||||||||
|
Natural gas liquids (MBD)
|
3 | 3 | 3 | 3 | ||||||||||
|
Bitumen (MBD)
|
66 | 59 | 67 | 63 | ||||||||||
|
Natural gas (MMCFD)
|
58 | 66 | 61 | 65 | ||||||||||
|
Total Production
(MBOED)
|
85 | 78 | 87 | 83 | ||||||||||
|
Average Sales Prices
|
||||||||||||||
|
Crude oil ($ per bbl)
|
$ | 59.40 | 94.79 | 62.56 | 88.04 | |||||||||
|
Natural gas liquids ($ per bbl)
|
17.11 | 44.93 | 22.94 | 43.44 | ||||||||||
|
Bitumen ($ per bbl)
|
41.01 | 75.42 | 34.93 | 70.25 | ||||||||||
|
Natural gas ($ per MCF)
|
0.56 | 4.47 | 2.70 | 3.88 | ||||||||||
Average sales prices include unutilized transportation costs.
Our Canadian operations mainly consist of the Surmont oil sands development in Alberta and the liquids-rich Montney unconventional play in British Columbia. As of June 30, 2023, Canada contributed six percent of our consolidated liquids production and three percent of our consolidated natural gas production.
Net Income
Earnings from Canada decreased $284 million and $569 million in the three- and six-month periods of 2023, respectively. Decreases to earnings include:
•
Lower realized commodity prices.
•
The absence of contingent payments associated with the prior sale of certain assets to CVE. The term for contingent payments for our Canada segment ended in the second quarter of 2022.
Production
Average production increased 7 MBOED and 4 MBOED in the three- and six-month periods of 2023, respectively. Increases to production include:
•
Absence of a planned turnaround at the Surmont Central Processing Facility 1 during the second quarter of 2022.
•
New wells online from our development program in the Montney.
Offsets to the production increases include downtime and normal field decline.
Planned Acquisition
In July 2023, we executed an agreement to purchase the remaining 50 percent interest in the Surmont asset. The effective date is April 1, 2023 with closing expected in the second half of 2023. This transaction is subject to regulatory approvals and other customary closing conditions.
See N
ote
3
.
|
ConocoPhillips 2023 Q2 10-Q
|
36
|
|||||||
|
Results of Operations
|
|||||
Europe, Middle East and North Africa
|
Three Months Ended
June 30 |
Six Months Ended
June 30 |
|||||||||||||
| 2023 | 2022 | 2023 | 2022 | |||||||||||
|
Net Income
($MM)
|
$ | 264 | 385 | 629 | 797 | |||||||||
|
Consolidated Operations
|
||||||||||||||
| Average Net Production | ||||||||||||||
|
Crude oil (MBD)
|
113 | 90 | 116 | 101 | ||||||||||
|
Natural gas liquids (MBD)
|
4 | 3 | 4 | 4 | ||||||||||
|
Natural gas (MMCFD)
|
286 | 306 | 313 | 318 | ||||||||||
|
Total Production
(MBOED)
|
165 | 144 | 172 | 158 | ||||||||||
|
Average Sales Prices
|
|
|
||||||||||||
|
Crude oil ($ per bbl)
|
$ | 79.64 | 115.61 | 81.48 | 103.21 | |||||||||
|
Natural gas liquids ($ per bbl)
|
37.06 | 68.00 | 40.63 | 60.49 | ||||||||||
|
Natural gas ($ per MCF)
|
10.83 | 28.32 | 14.31 | 28.77 | ||||||||||
Production and sales prices exclude equity affiliates. See
Summary Operating Statistics
for equity affiliate totals.
The Europe, Middle East and North Africa segment consists of operations principally located in the Norwegian sector of the North Sea and the Norwegian Sea, Qatar, Libya and commercial and terminalling operations in the U.K. As of June 30, 2023, our Europe, Middle East and North Africa operations contributed 10 percent of our consolidated liquids production and 16 percent of our consolidated natural gas production.
Net Income
Earnings from Europe, Middle East and North Africa decreased by $121 million and $168 million in the three- and six-month periods of 2023, respectively. Decreases to earnings include:
•
Lower realized commodity prices.
•
Lower earnings from equity affiliates due to lower LNG sales prices.
•
Less foreign exchange gains related to the USD strengthening against the Norwegian Kroner.
Offsets to the earnings decreases include:
•
Improved commercial performance and timing.
•
Absence of the establishment of a valuation allowance against certain deferred tax assets associated with changes to the Petroleum Tax System in Norway in the second quarter of 2022.
Consolidated Production
Average consolidated production increased 21 MBOED and 14 MBOED in the three- and six-month periods of 2023, respectively. Increases to production include:
•
Absence of fieldwide turnarounds in the Greater Ekofisk Area of Norway in the second quarter of 2022.
•
Additional interest acquired in Libya's Waha Concession that increased our interest 4.1 percent to 20.4 percent in the fourth quarter of 2022.
•
Improved well performance in Norway.
Offsets to the production increases include normal field decline.
Qatar Interest
During 2022, we were awarded a 25 percent interest in QG12, a new joint venture with QatarEnergy to participate in the NFS LNG project. Formation of QG12 closed in June 2023.
See Note
s
3
and
4
.
|
37
|
ConocoPhillips 2023 Q2 10-Q
|
|||||||
| Results of Operations | |||||
Asia Pacific
|
Three Months Ended
June 30 |
Six Months Ended
June 30 |
|||||||||||||
| 2023 | 2022 | 2023 | 2022 | |||||||||||
|
Net Income
($MM)
|
$ | 387 | 525 | 909 | 1,661 | |||||||||
|
Consolidated Operations
|
||||||||||||||
|
Average Net Production
|
||||||||||||||
| Crude oil (MBD) | 58 | 57 | 60 | 60 | ||||||||||
|
Natural gas (MMCFD)
|
40 | 55 | 49 | 163 | ||||||||||
|
Total Production
(MBOED)
|
65 | 66 | 68 | 87 | ||||||||||
|
Average Sales Prices
|
||||||||||||||
|
Crude oil ($ per bbl)
|
$ | 78.64 | 117.14 | 81.07 | 110.89 | |||||||||
|
Natural gas ($ per MCF)
|
4.10 | 4.17 | 4.22 | 6.53 | ||||||||||
Production and sales prices exclude equity affiliates. See
Summary Operating Statistics
for equity affiliate totals.
The Asia Pacific segment has operations in China, Malaysia, Australia and commercial operations in China, Singapore and Japan. As of June 30, 2023, Asia Pacific contributed five percent of our consolidated liquids production and three percent of our consolidated natural gas production.
Net Income
Earnings from Asia Pacific decreased $138 million and $752 million in the three- and six-month periods of 2023, respectively. Decreases to earnings include:
•
Lower realized commodity prices.
•
Lower earnings from equity affiliates due to lower LNG sales prices.
Offsets to the earnings decreases include lower taxes other than income taxes driven by lower realized commodity prices.
In addition to the items mentioned above, in the six-month period of 2023, earnings impacts include:
•
Decrease due to the absence of an after-tax gain of $534 million associated with the divestiture of our Indonesia assets in the first quarter of 2022.
•
Decrease due to lower sales volumes primarily driven by the divestiture of our Indonesia assets in the first quarter of 2022.
Consolidated Production
Average consolidated production decreased 1 MBOED and 19 MBOED in the three- and six-month periods of 2023, respectively. Decreases to production were primarily due to normal field decline.
Offsets to the production decreases include:
•
Bohai Bay development activity and production optimization in China.
•
First production from development activity in Gumusut Phase 3 in Malaysia.
In addition to the items mentioned above, in the six-month period of 2023, production also decreased due to the divestiture of our Indonesia assets in the first quarter of 2022.
Planned Acquisition
In March 2023, we announced that, subject to the closing of EIG's transaction with Origin Energy, we intend to take over operatorship of the upstream assets and purchase up to an additional 2.49 percent shareholding interest in Australia Pacific LNG Pty Ltd (APLNG). Both EIG's transaction with Origin Energy and our shareholder acquisition are subject to Australian regulatory approvals and other customary closing conditions.
See Note 3.
|
ConocoPhillips 2023 Q2 10-Q
|
38
|
|||||||
|
Results of Operations
|
|||||
Other International
|
Three Months Ended
June 30 |
Six Months Ended
June 30 |
|||||||||||||
| 2023 | 2022 | 2023 | 2022 | |||||||||||
|
Net Loss
($MM)
|
$ | (4) | — | (3) | — | |||||||||
The Other International segment consists of activities associated with prior operations in other countries.
Corporate and Other
|
|
Millions of Dollars
|
|||||||||||||
|
|
Three Months Ended
June 30 |
Six Months Ended
June 30 |
||||||||||||
|
|
2023 | 2022 | 2023 | 2022 | ||||||||||
| Net Income (Loss) | ||||||||||||||
|
Net interest expense
|
$ | (86) | (164) | (176) | (382) | |||||||||
|
Corporate general and administrative expenses
|
(96) | (16) | (186) | (95) | ||||||||||
|
Technology
|
(11) | (9) | (5) | 49 | ||||||||||
|
Other income (expense)
|
144 | (160) | 76 | 625 | ||||||||||
|
|
$ | (49) | (349) | (291) | 197 | |||||||||
Net interest expense consists of interest and financing expense, net of interest income and capitalized interest. Net interest expense improved by $78 million and $206 million in the three- and six-month periods of 2023, respectively, primarily due to higher interest income as well as lower interest expenses.
Corporate G&A expenses include compensation programs and staff costs. Corporate G&A expenses increased $80 million and $91 million in the three- and six-month periods of 2023, respectively, primarily due to mark to market adjustments associated with certain compensation programs.
Technology includes our investment in low-carbon technologies as well as other new technologies or businesses and licensing revenues. Other new technologies or businesses and licensing activities are focused on both conventional and tight oil reservoirs, shale gas, oil sands, enhanced oil recovery, as well as LNG.
See Note
16
.
Earnings from Technology decreased $54 million in the six-month period of 2023, primarily due to lower licensing revenues.
Other income (expense) or “Other” includes certain consolidating tax-related items, foreign currency transaction gains and losses, environmental costs associated with sites no longer in operation, other costs not directly associated with an operating segment, gains/losses on the early retirement of debt, holding gains or losses on equity securities, and pension settlement expense. In the second quarter of 2023, “Other” increased $304 million primarily due to a consolidating tax adjustment, the absence of premiums paid on the early retirement of debt in 2022 coupled with a gain on the early retirement of debt in 2023 and foreign exchange impacts. In the six-month period of 2023, "Other" decreased $549 million. Decreases include the absence of a $474 million federal tax benefit, the absence of $251 million gain associated with our CVE common shares, which were fully divested in the first quarter of 2022, and the absence of an after-tax gain of $62 million associated with debt restructuring transactions. The decreases were offset by the increases described above as well as the absence of $101 million tax impact associated with the disposition of our Indonesia assets in the first quarter of 2022.
See Note
5
for information on our CVE common shares,
Note
6
for information regarding our debt transactions and
Note
19
for information regarding income taxes.
|
39
|
ConocoPhillips 2023 Q2 10-Q
|
|||||||
| Capital Resources and Liquidity | |||||
Capital Resources and Liquidity
Financial Indicators
| Millions of Dollars | ||||||||
|
June 30
2023 |
December 31
2022 |
|||||||
| Cash and cash equivalents | $ | 5,735 | 6,458 | |||||
| Short-term investments | 1,080 | 2,785 | ||||||
| Total debt | 16,444 | 16,643 | ||||||
| Total equity | 47,531 | 48,003 | ||||||
| Percent of total debt to capital* | 26 | % | 26 | |||||
| Percent of floating-rate debt to total debt | 2 | % | 2 | |||||
*
Capital includes total debt and total equity.
To meet our short-term and long-term liquidity requirements, we look to a variety of funding sources, including cash generated from operating activities, our commercial paper and credit facility programs, and our ability to sell securities using our shelf registration statement. During the first six months of 2023, the primary uses of our available cash were $5.8 billion to support our ongoing capital expenditures and investments program, $3.0 billion to repurchase common stock, and $2.8 billion to pay the ordinary dividend and VROC.
At June 30, 2023, we had total liquidity of $12.3 billion, comprised of cash and cash equivalents of $5.7 billion, short-term investments of $1.1 billion, and available borrowing capacity under our credit facility of $5.5 billion. We beli
eve current cash balances and cash generated by operating activities, together with access to external sources of funds as described below in the “Significant Changes in Capital” section, will be sufficient to meet our funding requirements in t
he near- and long-term, including our capital spending program, acquisitions, dividend payments and debt obligations.
Significant Changes in Capital
Operating Activities
Cash provided by operating activities was $9.3 billion for the first six months of 2023, compared with $13.0 billion for the corresponding period of 2022. The decrease is primarily due to lower realized commodity prices across all products, partially offset by higher produced sales volumes in the Lower 48.
Our short-term and long-term operating cash flows are highly dependent upon prices for crude oil, bitumen, natural gas, LNG and NGLs. Prices and margins in our industry have historically been volatile and are driven by market conditions over which we have no control. Absent other mitigating factors, as these prices and margins fluctuate, we would expect a corresponding change in our operating cash flows.
The level of production volumes, as well as product and location mix, impacts our cash flows. Future production is subject to numerous uncertainties, including, among others, the volatile crude oil and natural gas price environment, which may impact investment decisions; the effects of price changes on production sharing and variable-royalty contracts; acquisition and disposition of fields; field production decline rates; new technologies; operating efficiencies; timing of startups and major turnarounds; political instability; impacts of a global pandemic; weather-related disruptions; and the addition of proved reserves through exploratory success and their timely and cost-effective development. While we actively manage for these factors, production levels can cause variability in cash flows, although generally this variability has not been as significant as that caused by commodity prices.
To maintain or grow our production volumes, we must continue to add to our proved reserve base. See the “Capital Expenditures and Investments” section.
|
ConocoPhillips 2023 Q2 10-Q
|
40
|
|||||||
|
Capital Resources and Liquidity
|
|||||
Investing Activities
For the first six months of 2023, we invested $5.8 billion in capital expenditures and investments. Our 2023 operating plan capital expenditures are currently expected to be between $10.8 billion to $11.2 billion. This guidance excludes any impact from the previously announced Surmont and APLNG transactions. Our 2022 capital expenditures and investments were $10.2 billion. See the “Capital Expenditures and Investments” section.
In the first six months of 2023, we invested $0.9 billion in LNG projects, including PALNG, QG8, and QG12.
See Note
3.
Proceeds from asset sales were $0.4 billion in the first six months of 2023 compared with $3.0 billion for the corresponding period in 2022. In the first six months of 2022, we received proceeds of $1.4 billion for the sale of our remaining 91 million common shares of CVE, proceeds of $1.2 billion primarily from asset divestitures in our Asia Pacific and Lower 48 segments after customary adjustments and $0.4 billion in contingent payments associated with prior divestitures.
See Note
5
.
We invest in short-term and long-term investments as part of our cash investment strategy, the primary objective of which is to protect principal, maintain liquidity and provide yield and total returns. These investments include time deposits, commercial paper, as well as debt securities classified as available for sale. Funds for short-term needs to support our operating plan and provide resiliency to react to short-term price volatility are invested in highly liquid instruments with maturities within the year. Funds we consider available to maintain resiliency in longer term price downturns and to capture opportunities outside a given operating plan may be invested in instruments with maturities greater than one year.
Investing activities in the first six months of 2023 included net sales of $1,549 million of investments. We had net sales of $1,893 million of short-term instruments and net purchases of $344 million of long-term instruments
.
See Note
13.
In July 2023, we executed an agreement to purchase the remaining 50 percent interest in Surmont from TotalEnergies EP Canada Ltd. for approximately $4.0 billion CAD ($3.0 billion), subject to customary adjustments. The transaction is subject to contingent payments for a five-year term of up to approximately $440 million CAD ($325 million), subject to certain production targets being achieved. Closing of this transaction is anticipated in the second half of 2023, subject to regulatory approvals and other customary closing conditions.
Financing Activities
We have a revolving credit facility totaling $5.5 billion with an expiration date of February 2027. The credit facility may be used for direct bank borrowings, the issuance of letters of credit totaling up to $500 million, or as support for our commercial paper program. With no commercial paper outstanding and no direct borrowings or letters of credit, we had access to $5.5 billion in available borrowing capacity under our revolving credit facility at June 30, 2023.
In the second quarter of 2023, we initiated and completed concurrent debt transactions as part of our debt refinancing strategy that extends the weighted average maturity of our portfolio from 15 years to 17 years and reduces our near-term debt maturities. The refinancing consisted of tender offers to repurchase existing debt with cash and a new debt issuance to fund the repurchase.
See Note
6
.
Our debt balance at
June 30, 2023
was $16.4 billion compared with $16.6 billion at December 31, 2022. The current portion of debt, including payments for finance leases, is $879 million.
Payments are expected to b
e made using current cash balances and cash generated by operating activities.
In May 2023, S&P affirmed our long-term credit rating included below.
The current credit ratings on our long-term debt are:
•
Fitch: “A” with a “stable” outlook
•
S&P: “A-” with a “stable” outlook
•
Moody's: "A2" with a "stable" outlook
See Note
6
for additional information on debt and the revolving credit facility.
|
41
|
ConocoPhillips 2023 Q2 10-Q
|
|||||||
| Capital Resources and Liquidity | |||||
Certain of our project-related contracts, commercial contracts and derivative instruments contain provisions requiring us to post collateral. Many of these contracts and instruments permit us to post either cash or letters of credit as collateral. At June 30, 2023, and December 31, 2022, we had direct bank letters of credit of $261 million and $368 million, respectively, which secured performance obligations related to various purchase commitments incident to the ordinary conduct of business. In the event of a credit rating downgrade, we may be required to post additional letters of credit.
Shelf Registration
We have a universal shelf registration statement on file with the SEC under which we have the ability to issue and sell an indeterminate number of various types of debt and equity securities.
Capital Requirements
For information about our capital expenditures and investments, see the “Capital Expenditures and Investments” section.
We believe in delivering value to our shareholders through our current three-tier return of capital framework. The framework is structured to deliver a compelling, growing ordinary dividend, a discretionary VROC payment, and through-cycle share repurchases. The VROC provides a flexible tool for meeting our commitment of returning greater than 30 percent of cash from operating activities during periods where commodity prices are meaningfully higher than our planning price range. Our expected 2023 total return of capital is $11 billion.
In the first six months of 2023, we paid ordinary dividends of $1.02 cents per common share and VROC payments of $1.30 cents per common share. In the first six months of 2022, we paid ordinary dividends of $0.92 cents per common share and VROC payments of $0.50 cents per common share.
In August 2023, we declared both an ordinary dividend of $0.51 cents per share and a VROC payment of $0.60 cents per share. The ordinary dividend of $0.51 cents per share is payable September 1, 2023, to shareholders of record on August 16, 2023. The VROC of $0.60 cents per share is payable October 16, 2023, to shareholders of record on September 28, 2023.
In late 2016, we initiated our current share repurchase program. As of October 2022, we had announced a total authorization to repurchase up to $45 billion of our common stock. Repurchases are made at management’s discretion, at prevailing prices, subject to market conditions and other factors. As of June 30, 2023, share repurchases since the inception of our current program totaled 362.9 million shares and $26.4 billion. In the six months ended June 30, 2023, we repurchased 28.1 million shares for a cost of $3.0 billion.
See Part I—Item 1A—Risk Factors –
“
Our ability to execute our capital return program is subject to certain considerations
” in our 2022 Annual Report on Form 10-K.
|
ConocoPhillips 2023 Q2 10-Q
|
42
|
|||||||
|
Capital Resources and Liquidity
|
|||||
Capital Expenditures and Investments
|
|
Millions of Dollars
|
|||||||
|
|
Six Months Ended
June 30 |
|||||||
|
|
2023 | 2022 | ||||||
| Alaska | $ | 769 | 471 | |||||
| Lower 48 | 3,357 | 2,347 | ||||||
| Canada | 228 | 247 | ||||||
| Europe, Middle East and North Africa | 567 | 364 | ||||||
| Asia Pacific | 142 | 1,664 | ||||||
| Other International | — | — | ||||||
| Corporate and Other | 757 | 36 | ||||||
| Capital expenditures and investments | $ | 5,820 | 5,129 | |||||
During the first six months of 2023, capital expenditures and investments supported key operating activities and acquisitions, primarily:
•
Appraisal and development activities in Alaska related to the Western North Slope and development activities in the Greater Kuparuk Area.
•
Development activities in the Lower 48, primarily in the Delaware Basin, Eagle Ford, Midland Basin and Bakken.
•
Appraisal and development activities in the Montney as well as development and optimization of oil sands in Canada.
•
Development activities across assets in Norway.
•
Continued development activities in Malaysia and China.
•
Capital primarily associated with our investments in PALNG, QG8, and QG12.
Our 2023 operating plan capital expenditure guidance is currently expected to be $10.8 billion to $11.2 billion. This guidance excludes any impact from the previously announced Surmont and APLNG transactions. Our operating plan capital was $10.2 billion in 2022.
|
43
|
ConocoPhillips 2023 Q2 10-Q
|
|||||||
| Capital Resources and Liquidity | |||||
Guarantor Summarized Financial Information
We have various cross guarantees among our Obligor group; ConocoPhillips, ConocoPhillips Company and Burlington Resources LLC, with respect to publicly held debt securities. ConocoPhillips Company is 100 percent owned by ConocoPhillips. Burlington Resources LLC is 100 percent owned by ConocoPhillips Company. ConocoPhillips and/or ConocoPhillips Company have fully and unconditionally guaranteed the payment obligations of Burlington Resources LLC, with respect to its publicly held debt securities. Similarly, ConocoPhillips has fully and unconditionally guaranteed the payment obligations of ConocoPhillips Company with respect to its publicly held debt securities. In addition, ConocoPhillips Company has fully and unconditionally guaranteed the payment obligations of ConocoPhillips with respect to its publicly held debt securities. All guarantees are joint and several.
The following tables present summarized financial information for the Obligor Group, as defined below:
•
The Obligor Group will reflect guarantors and issuers of guaranteed securities consisting of ConocoPhillips, ConocoPhillips Company and Burlington Resources LLC.
•
Consolidating adjustments for elimination of investments in and transactions between the collective guarantors and issuers of guaranteed securities are reflected in the balances of the summarized financial information.
•
Non-Obligated Subsidiaries are excluded from the presentation.
Transactions and balances reflecting activity between the Obligors and Non-Obligated Subsidiaries are presented below:
Summarized Income Statement Data
|
|
Millions of Dollars
|
||||
|
|
Six Months Ended
June 30, 2023 |
||||
|
Revenues and Other Income
|
$ | 18,194 | |||
|
Income before income taxes*
|
5,098 | ||||
|
Net Income
|
5,152 | ||||
*Includes approximately $3.6 billion of purchased commodities expense for transactions with Non-Obligated Subsidiaries.
Summarized Balance Sheet Data
|
|
Millions of Dollars
|
|||||||
|
|
June 30,
2023 |
December 31,
2022 |
||||||
|
Current assets
|
$ | 7,254 | 10,766 | |||||
|
Amounts due from Non-Obligated Subsidiaries, current
|
1,559 | 1,892 | ||||||
|
Noncurrent assets
|
86,501 | 79,269 | ||||||
|
Amounts due from Non-Obligated Subsidiaries, noncurrent
|
7,752 | 6,552 | ||||||
|
Current liabilities
|
6,078 | 8,201 | ||||||
|
Amounts due to Non-Obligated Subsidiaries, current
|
2,771 | 3,248 | ||||||
|
Noncurrent liabilities
|
46,702 | 40,389 | ||||||
|
Amounts due to Non-Obligated Subsidiaries, noncurrent
|
31,465 | 24,594 | ||||||
|
ConocoPhillips 2023 Q2 10-Q
|
44
|
|||||||
|
Capital Resources and Liquidity
|
|||||
Contingencies
We are subject to legal proceedings, claims and liabilities that arise in the ordinary course of business. We accrue for losses associated with legal claims when such losses are considered probable and the amounts can be reasonably estimated.
See Note
9
.
Legal and Tax Matters
We are subject to various lawsuits and claims including but not limited to matters involving oil and gas royalty and severance tax payments, gas measurement and valuation methods, contract disputes, environmental damages, climate change, personal injury and property damage. Our primary exposures for such matters relate to alleged royalty and tax underpayments on certain federal, state and privately owned properties, claims of alleged environmental contamination and damages from historic operations and climate change. We will continue to defend ourselves vigorously in these matters.
Our legal organization applies its knowledge, experience and professional judgment to the specific characteristics of our cases, employing a litigation management process to manage and monitor the legal proceedings against us. Our process facilitates the early evaluation and quantification of potential exposures in individual cases. This process also enables us to track those cases that have been scheduled for trial and/or mediation. Based on professional judgment and experience in using these litigation management tools and available information about current developments in all our cases, our legal organization regularly assesses the adequacy of current accruals and determines if adjustment of existing accruals, or establishment of new accruals, is required.
Environmental
We are subject to the same numerous international, federal, state and local environmental laws and regulations as other companies in our industry. For a discussion of the most significant of these environmental laws and regulations, including those with associated remediation obligations, see the “Environmental” section in Management’s Discussion and Analysis of Financial Condition and Results of Operations on pages 54–56 of our 2022 Annual Report on Form 10-K.
We occasionally receive requests for information or notices of potential liability from the EPA and state environmental agencies alleging that we are a potentially responsible party under the CERCLA or an equivalent state statute. On occasion, we also have been made a party to cost recovery litigation by those agencies or by private parties. These requests, notices and lawsuits assert potential liability for remediation costs at various sites that typically are not owned by us, but allegedly contain waste attributable to our past operations. As of June 30, 2023, there were 15 sites around the U.S. in which we were identified as a potentially responsible party under CERCLA and comparable state laws.
For remediation activities in the U.S. and Canada, our balance sheet included a total environmental accrual of $185 million at June 30, 2023, compared with $182 million at December 31, 2022. We expect to incur a substantial amount of these expenditures within the next 30 years.
Notwithstanding any of the foregoing, and as with other companies engaged in similar businesses, environmental costs and liabilities are inherent concerns in our operations and products, and there can be no assurance that material costs and liabilities will not be incurred. However, we currently do not expect any material adverse effect upon our results of operations or financial position as a result of compliance with current environmental laws and regulations.
See Part I—Item 1A—Risk Factors – "We expect to continue to incur substantial capital expenditures and operating costs as a result of our compliance with existing and future environmental laws and regulations" in our 2022 Annual Report on Form 10-K and
Note
9
for information on environmental litigation.
Climate Change
Continuing political and social attention to the issue of global climate change has resulted in a broad range of proposed or promulgated state, national and international laws focusing on GHG emissions reduction. These proposed or promulgated laws apply or could apply in countries where we have interests or may have interests in the future. Laws in this field continue to evolve, and while it is not possible to accurately estimate either a timetable for implementation or our future compliance costs relating to implementation, such laws, if enacted, could have a material impact on our results of operations and financial condition. For examples of legislation and precursors for possible regulation that do or could affect our operations, see the “Climate Change” section in Management’s Discussion and Analysis of Financial Condition and Results of Operations on pages 56–57 of our 2022 Annual Report on Form 10-K.
|
45
|
ConocoPhillips 2023 Q2 10-Q
|
|||||||
| Capital Resources and Liquidity | |||||
Company Response to Climate-Related Risks
Our current Climate Risk Strategy and actions for our oil and gas operations are aligned with the aims of the Paris Agreement while being responsive to shareholder interests for long-term value and competitive returns. It is also aligned with our Triple Mandate to responsibly meet energy transition pathway demand, deliver competitive returns on and of capital and achieve our net-zero operational emissions ambition.
In 2020 we became the first U.S.-based oil and gas company to adopt a Paris-aligned climate-risk strategy with an ambition to become a net-zero company for operational (Scope 1 and 2) emissions by 2050. The objective of our Climate Risk Strategy is to manage climate-related risk, optimize opportunities and better equip the company to respond to evolving investor sentiment, technologies for emissions reduction, alternative energy technologies and uncertainties such as government policies. The strategy sets out our choices around portfolio composition, emissions reductions, targets and incentives, emissions-related technology development, and our climate-related policy and financial sector engagement.
In early 2022, we published our Plan for the Net-Zero Energy Transition (the 'Plan'), to outline how we intend to apply our strategic capabilities and resources to meet the challenges posed by climate change in an economically viable, accountable and actionable way that balances the interests of our stakeholders. A progress report on the Plan was published in March 2023.
Key elements of our plan include:
•
Maintain strategic flexibility:
◦
Build a resilient asset portfolio with a focus on low cost of supply and low GHG intensity to meet transition pathway energy demand.
◦
Commit to capital discipline through use of a fully burdened cost of supply, including cost of carbon, as the primary basis for capital allocation.
◦
Track the energy transition through a comprehensive scenario planning process to calibrate and understand alternative energy transition pathways and test the resilience of our corporate strategy to climate risk.
•
Reduce Scope 1 and 2 emissions:
◦
Set targets for emissions over which we have ownership and control, with an ambition to become a net-zero company for Scope 1 and 2 emissions by 2050.
•
Address Scope 3 emissions:
◦
Advocate for a well-designed, economy-wide price on carbon and engage in development of other policies and legislation to address end-use emissions.
◦
Work with our suppliers for alignment on GHG emissions reductions.
•
Contribute to the energy transition:
◦
Build an attractive LNG portfolio.
◦
Evaluate potential investments in emerging energy transition and low-carbon technologies.
Our Plan recognizes the importance of reducing society’s end-use emissions to meet global climate goals. As an upstream producer, we do not control how our total production is ultimately processed into consumer products. This is why we have consistently taken a prominent role in advocating for a well-designed, economy-wide price on carbon and engaged in development of other policies or legislation that could address end-use emissions. We have also expanded policy advocacy beyond carbon pricing to include regulatory action, such as support for the direct regulation of methane.
See Part I—Item 1A—Risk Factors – "Existing and future laws, regulations and internal initiatives relating to global climate changes, such as limitations on GHG emissions may impact or limit our business plans, result in significant expenditures, promote alternative uses of energy or reduce demand for our products"
and "Broader investor and societal attention to and efforts to address global climate change may limit who can do business with us or our access to capital and could subject us to litigation"
in our 2022 Annual Report on Form 10-K and
Note
9
for information on climate change litigation.
|
ConocoPhillips 2023 Q2 10-Q
|
46
|
|||||||
Cautionary Statement for the Purposes of the “Safe Harbor” Provisions of the Private Securities Litigation Reform Act of 1995
This report includes forward-looking statements within the meaning of Section 27A of the Securities Act of 1933 and Section 21E of the Securities Exchange Act of 1934. All statements other than statements of historical fact included or incorporated by reference in this report, including, without limitation, statements regarding our future financial position, business strategy, budgets, projected revenues, projected costs and plans, and objectives of management for future operations, are forward-looking statements. Examples of forward-looking statements contained in this report include our expected production growth and outlook on the business environment generally, our expected capital budget and capital expenditures, and discussions concerning future dividends. You can often identify our forward-looking statements by the words “anticipate,” “believe,” “budget,” “continue,” “could,” “effort,” “estimate,” “expect,” “forecast,” “intend,” “goal,” “guidance,” “may,” “objective,” “outlook,” “plan,” “potential,” “predict,” “projection,” “seek,” “should,” “target,” “will,” “would” and similar expressions.
We based the forward-looking statements on our current expectations, estimates and projections about ourselves and the industries in which we operate in general. We caution you these statements are not guarantees of future performance as they involve assumptions that, while made in good faith, may prove to be incorrect, and involve risks and uncertainties we cannot predict. In addition, we based many of these forward-looking statements on assumptions about future events that may prove to be inaccurate. Accordingly, our actual outcomes and results may differ materially from what we have expressed or forecast in the forward-looking statements. Any differences could result from a variety of factors and uncertainties, including, but not limited to, the following:
•
Fluctuations in crude oil, bitumen, natural gas, LNG and NGLs prices, including a prolonged decline in these prices relative to historical or future expected levels.
•
Global and regional changes in the demand, supply, prices, differentials or other market conditions affecting oil and gas, including changes as a result of any ongoing military conflict, including the conflict between Russia and Ukraine, and the global response to such conflict, security threats on facilities and infrastructure, or from a public health crisis or from the imposition or lifting of crude oil production quotas or other actions that might be imposed by OPEC and other producing countries and the resulting company or third-party actions in response to such changes.
•
The impact of significant declines in prices for crude oil, bitumen, natural gas, LNG and NGLs, which may result in recognition of impairment charges on our long-lived assets, leaseholds and nonconsolidated equity investments.
•
The potential for insufficient liquidity or other factors, such as those described herein, that could impact our ability to repurchase shares and declare and pay dividends, whether fixed or variable.
•
Potential failures or delays in achieving expected reserve or production levels from existing and future oil and gas developments, including due to operating hazards, drilling risks and the inherent uncertainties in predicting reserves and reservoir performance.
•
Reductions in reserves replacement rates, whether as a result of the significant declines in commodity prices or otherwise.
•
Unsuccessful exploratory drilling activities or the inability to obtain access to exploratory acreage.
•
Unexpected changes in costs, inflationary pressures or technical requirements for constructing, modifying or operating E&P facilities.
•
Legislative and regulatory initiatives addressing environmental concerns, including initiatives addressing the impact of global climate change or further regulating hydraulic fracturing, methane emissions, flaring or water disposal.
•
Significant operational or investment changes imposed by existing or future environmental statutes and regulations, including international agreements and national or regional legislation and regulatory measures to limit or reduce GHG emissions.
•
Substantial investment in and development use of, competing or alternative energy sources, including as a result of existing or future environmental rules and regulations.
•
The impact of broader societal attention to and efforts to address climate change may impact our access to capital and insurance.
•
Potential failures or delays in delivering on our current or future low-carbon strategy, including our inability to develop new technologies.
•
The impact of public health crises, including pandemics (such as COVID-19) and epidemics and any related company or government policies or actions.
|
47
|
ConocoPhillips 2023 Q2 10-Q
|
|||||||
•
Lack of, or disruptions in, adequate and reliable transportation for our crude oil, bitumen, natural gas, LNG and NGLs.
•
Inability to timely obtain or maintain permits, including those necessary for construction, drilling and/or development, or inability to make capital expenditures required to maintain compliance with any necessary permits or applicable laws or regulations.
•
Failure to complete definitive agreements and feasibility studies for, and to complete construction of, announced and future E&P and LNG development in a timely manner (if at all) or on budget.
•
Potential disruption or interruption of our operations and any resulting consequences due to accidents, extraordinary weather events, supply chain disruptions, civil unrest, political events, war, terrorism, cybersecurity threats, and information technology failures, constraints or disruptions.
•
Changes in international monetary conditions and foreign currency exchange rate fluctuations.
•
Changes in international trade relationships, including the imposition of trade restrictions or tariffs relating to crude oil, bitumen, natural gas, LNG, NGLs and any materials or products (such as aluminum and steel) used in the operation of our business, including any sanctions imposed as a result of any ongoing military conflict, including the conflict between Russia and Ukraine.
•
Liability for remedial actions, including removal and reclamation obligations, under existing and future environmental regulations and litigation.
•
Liability resulting from litigation, including litigation directly or indirectly related to the transaction with Concho Resources Inc., or our failure to comply with applicable laws and regulations.
•
General domestic and international economic and political developments, including armed hostilities; expropriation of assets; changes in governmental policies relating to crude oil, bitumen, natural gas, LNG and NGLs pricing, including the imposition of price caps; regulation or taxation; and other political, economic or diplomatic developments, including as a result of any ongoing military conflict, including the conflict between Russia and Ukraine.
•
Volatility in the commodity futures markets.
•
Changes in tax and other laws, regulations (including alternative energy mandates) or royalty rules applicable to our business.
•
Competition and consolidation in the oil and gas E&P industry, including competition for personnel and equipment.
•
Any limitations on our access to capital or increase in our cost of capital, including as a result of illiquidity or uncertainty in domestic or international financial markets or investment sentiment, including as a result of increased societal attention to and efforts to address climate change.
•
Our inability to execute, or delays in the completion of, any asset dispositions or acquisitions we elect to pursue.
•
Potential failure to obtain, or delays in obtaining, any necessary regulatory approvals for pending or future asset dispositions or acquisitions, or that such approvals may require modification to the terms of the transactions or the operation of our remaining business.
•
Potential disruption of our operations as a result of pending or future asset dispositions or acquisitions, including the diversion of management time and attention.
•
Our inability to deploy the net proceeds from any asset dispositions that are pending or that we elect to undertake in the future in the manner and timeframe we currently anticipate, if at all.
•
The operation and financing of our joint ventures.
•
The ability of our customers and other contractual counterparties to satisfy their obligations to us, including our ability to collect payments when due from the government of Venezuela or PDVSA.
•
Our inability to realize anticipated cost savings and capital expenditure reductions.
•
The inadequacy of storage capacity for our products, and ensuing curtailments, whether voluntary or involuntary, required to mitigate this physical constraint.
•
The risk that we will be unable to retain and hire key personnel.
•
Uncertainty as to the long-term value of our common stock.
•
The factors generally described in
Part I—Item 1A
in our 2022 Annual Report on Form 10-K and any additional risks described in our other filings with the SEC.
|
ConocoPhillips 2023 Q2 10-Q
|
48
|
|||||||
Item 3. Quantitative and Qualitative Disclosures About Market Risk
Information about market risks for the six months ended June 30, 2023 does not differ materially from that discussed under Item 7A in our 2022 Annual Report on Form 10-K except for foreign currency exchange risks.
Foreign Currency Exchange Risk
At June 30, 2023, we had outstanding foreign currency exchange forward contracts to buy $5.2 billion CAD at $0.751 against the U.S. dollar in anticipation of our future acquisition of the additional interest in Surmont. The forward contracts have a gross notional value of $5.2 billion CAD and are carried at a fair value of $19 million. Based on the assumed volatility in the fair value, the net fair value of these foreign currency contracts at June 30, 2023, was a before-tax gain of $19 million. Based on an adverse hypothetical 10 percent change in the June 30, 2023 exchange rate, this would result in an additional before-tax loss of approximately $350 million. The sensitivity analysis is based on changing one assumption while holding all other assumptions constant, which in practice may be unlikely to occur, as changes in some of the assumptions may be correlated. The contracts will settle in the second half of 2023.
Item 4. Controls and Procedures
We maintain disclosure controls and procedures designed to ensure information required to be disclosed in reports we file or submit under the Securities Exchange Act of 1934, as amended (the Act), is recorded, processed, summarized and reported within the time periods specified in SEC rules and forms, and that such information is accumulated and communicated to management, including our principal executive and principal financial officers, as appropriate, to allow timely decisions regarding required disclosure. At June 30, 2023, with the participation of our management, our Chairman and Chief Executive Officer (principal executive officer) and our Executive Vice President and Chief Financial Officer (principal financial officer) carried out an evaluation, pursuant to Rule 13a-15(b) of the Act, of ConocoPhillips’ disclosure controls and procedures (as defined in Rule 13a-15(e) of the Act). Based upon that evaluation, our Chairman and Chief Executive Officer and our Executive Vice President and Chief Financial Officer concluded our disclosure controls and procedures were operating effectively at June 30, 2023.
There have been no changes in our internal control over financial reporting, as defined in Rule 13a-15(f) of the Act, in the period covered by this report that have materially affected, or are reasonably likely to materially affect, our internal control over financial reporting.
PART II. Other Information
Item 1. Legal Proceedings
ConocoPhillips has elected to use a $1 million threshold for disclosing certain proceedings arising under federal, state or local environmental laws when a governmental authority is a party. ConocoPhillips believes proceedings under this threshold are not material to ConocoPhillips' business and financial condition. Applying this threshold, there are no such proceedings to disclose for the quarter ended June 30, 2023.
See Note
9
for information regarding other legal and administrative proceedings.
Item 1A. Risk Factors
There have been no material changes from the risk factors disclosed in Item 1A of our 2022 Annual Report on Form 10-K.
|
49
|
ConocoPhillips 2023 Q2 10-Q
|
|||||||
Item 2. Unregistered Sales of Equity Securities and Use of Proceeds
Issuer Purchases of Equity Securities
|
|
|
|
|
Millions of Dollars
|
||||||||||
|
Period
|
Total Number of
Shares
Purchased*
|
Average Price Paid
per Share
|
Total Number of
Shares Purchased as
Part of Publicly
Announced Plans or
Programs
|
Approximate Dollar
Value of Shares That
May Yet Be Purchased
Under the Plans or
Programs
|
||||||||||
| April 1 - 30, 2023 | 2,924,079 | $ | 104.80 | 2,924,079 | $ | 19,584 | ||||||||
| May 1 - 31, 2023 | 4,401,055 | 101.07 | 4,401,055 | 19,139 | ||||||||||
| June 1 - 30, 2023 | 5,356,292 | 102.44 | 5,356,292 | 18,591 | ||||||||||
| 12,681,426 | 12,681,426 | |||||||||||||
*There were no repurchases of common stock from company employees in connection with the company's broad-based employee incentive plans.
In late 2016, we initiated our current share repurchase program. As of October 2022, we had announced a total authorization to repurchase up to $45 billion of our common stock. As of June 30, 2023, we had repurchased $26.4 billion of shares. Repurchases are made at management’s discretion, at prevailing prices, subject to market conditions and other factors. Except as limited by applicable legal requirements, repurchases may be increased, decreased or discontinued at any time without prior notice. Shares of stock repurchased under the plan are held as treasury shares.
See Part I—Item 1A—Risk Factors –
“
Our ability to execute our capital return program is subject to certain considerations
” in our 2022 Annual Report on Form 10-K.
Item 5. Other Information
Insider Trading Arrangements
During the three-month period ended June 30, 2023, no officers or directors of the company have
adopted
or
terminated
any Rule 10b5-1 trading arrangements or non-Rule 10b5-1 trading arrangements.
|
ConocoPhillips 2023 Q2 10-Q
|
50
|
|||||||
Item 6. Exhibits
| 3.1* | |||||
| 10.1 | |||||
| 101.INS* |
Inline XBRL Instance Document.
|
||||
| 101.SCH* |
Inline XBRL Schema Document.
|
||||
| 101.CAL* |
Inline XBRL Calculation Linkbase Document.
|
||||
| 101.LAB* |
Inline XBRL Labels Linkbase Document.
|
||||
| 101.PRE* |
Inline XBRL Presentation Linkbase Document.
|
||||
| 101.DEF* |
Inline XBRL Definition Linkbase Document.
|
||||
| 104* |
Cover Page Interactive Data File (formatted as Inline XBRL and contained in Exhibit 101).
|
||||
* Filed herewith.
|
51
|
ConocoPhillips 2023 Q2 10-Q
|
|||||||
Signature
Pursuant to the requirements of the Securities Exchange Act of 1934, the registrant has duly caused this report to be signed on its behalf by the undersigned thereunto duly authorized.
| CONOCOPHILLIPS | |||||
| /s/ Christopher P. Delk | |||||
|
Christopher P. Delk
|
|||||
| Vice President, Controller | |||||
| and General Tax Counsel | |||||
| August 3, 2023 | |||||
|
ConocoPhillips 2023 Q2 10-Q
|
52
|
|||||||
TABLE OF CONTENTS
Part I Item 1AprintItem 3. Quantitative and Qualitative Disclosures About Market RiskprintItem 4. Controls and ProceduresprintPart II. Other InformationprintItem 1. Legal ProceedingsprintItem 1A. Risk FactorsprintItem 2. Unregistered Sales Of Equity Securities and Use Of ProceedsprintItem 5. Other InformationprintItem 6. Exhibitsprint