COTY INC.
10-Ks and 10-Qs
|
|
|
|
|
|
|
|
|
|
|
|
|
|
|
|
|
|
|
|
|
|
|
|
|
|
|
|
|
|
|
|
|
|
|
|
|
|
UNITED STATES
SECURITIES AND EXCHANGE COMMISSION
WASHINGTON, D.C. 20549
Form
10-K
(Mark One)
|
ý
|
ANNUAL REPORT PURSUANT TO SECTION 13 OR 15(d) OF THE SECURITIES EXCHANGE ACT OF 1934
|
|||||
|
|
FOR THE FISCAL YEAR ENDED JUNE 30, 2014
|
|||||
|
|
OR
|
|||||
|
¨
|
TRANSITION REPORT PURSUANT TO SECTION 13 OR 15(d) OF THE SECURITIES EXCHANGE ACT OF 1934
|
|||||
|
|
FOR THE TRANSITION PERIOD FROM TO
|
|||||
|
COMMISSION FILE NUMBER 001-35964
|
||||||
COTY INC.
(Exact name of registrant as specified in its charter)
|
Delaware
|
13-3823358
|
|
|
(State or other jurisdiction of incorporation or organization)
|
(I.R.S. Employer Identification Number)
|
|
|
350 Fifth Avenue, New York, NY
|
10118
|
|
|
(Address of principal executive offices)
|
(Zip Code)
|
|
(212) 389-7300
Registrant’s telephone number, including area code
|
SECURITIES REGISTERED PURSUANT TO SECTION 12(b) OF THE ACT:
|
||
|
Title of each class
|
Name of each exchange on which registered
|
|
|
Class A Common Stock, $0.01 par value
|
New York Stock Exchange
|
|
|
SECURITIES REGISTERED PURSUANT TO SECTION 12(g) OF THE ACT:
|
||
|
None
|
||
Indicate by check mark if the registrant is a well-known seasoned issuer, as defined in Rule 405 of the Securities Act. Yes
x
No
o
Indicate by check mark if the registrant is not required to file reports pursuant to Section 13 or Section 15(d) of the Act. Yes
o
No
x
Indicate by check mark whether the registrant (1) has filed all reports required to be filed by Section 13 or 15(d) of the Securities Exchange Act of 1934 during the preceding 12 months (or for such shorter period that the registrant was required to file such reports), and (2) has been subject to such filing requirements for the past 90 days. Yes
ý
No
¨
Indicate by check mark whether the registrant has submitted electronically and posted on its corporate Web site, if any, every Interactive Data File required to be submitted and posted pursuant to Rule 405 of Regulation S-T (§232.405 of this chapter) during the preceding 12 months (or for such shorter period that the registrant was required to submit and post such files). Yes
ý
No
¨
Indicate by check mark if disclosure of delinquent filers pursuant to Item 405 of Regulation S-K (§229.405 of this chapter) is not contained herein, and will not be contained, to the best of registrant’s knowledge, in definitive proxy or information statements incorporated by reference in Part III of this Form 10-K or any amendment to this Form 10-K.
o
Indicate by check mark whether the registrant is a large accelerated filer, an accelerated filer, a non-accelerated filer, or a smaller reporting company. See the definitions of “large accelerated filer,” “accelerated filer” and “smaller reporting company” in Rule 12b-2 of the Exchange Act.
|
|
Large accelerated filer
ý
|
Accelerated filer
¨
|
|
|
|
Non-accelerated filer
¨
|
Smaller reporting company
¨
|
|
|
|
(Do not check if a smaller reporting company)
|
|
|
Indicate by check mark whether the registrant is a shell company (as defined in Rule 12b-2 of the Exchange Act). Yes
¨
No
ý
As of December 31,
2013
, the aggregate market value of the registrant’s Class A Common Stock and Class B Common Stock held by non-affiliates was
$1,151,146,875
based on the number of shares held by non-affiliates as of December 31,
2013
and the last reported sale price of the registrant’s Class A Common Stock on December 31,
2013
.
At
August 26, 2014
,
90,344,831
shares of the registrant’s Class A Common Stock, $0.01 par value, and
263,752,817
shares of the registrant’s Class B Common Stock, $0.01 par value, were outstanding.
DOCUMENTS INCORPORATED BY REFERENCE
Portions of the Registrant's definitive proxy statement for the 2014 Annual Meeting of Stockholders are incorporated by reference into Part III of this Form 10K.
COTY INC.
INDEX TO ANNUAL REPORT ON FORM 10-K
|
Page
|
||
Forward-looking Statements
This Annual Report on Form 10-K includes forward-looking statements within the meaning of Section 27A of the Securities Act of 1933, as amended, and Section 21E of the Securities Exchange Act of 1934, as amended (“Exchange Act”). These forward-looking statements reflect our current views with respect to, among other things, our operations and financial performance. All statements in this Annual Report on Form 10-K that are not historical facts, including statements about our beliefs or expectations, are forward-looking statements. We generally identify these statements by words or phrases such as “anticipate,” “estimate,” “plan,” “project,” “expect,” “believe,” “intend,” “foresee,” “forecast,” “will,” “may,” “outlook,” “target” or other similar words or phrases. These statements discuss, among other things, our strategy, integration, future financial or operational performance, outcome or impact of pending or threatened litigation, domestic or international developments, planned organizational changes and their effects, nature and allocation of future expenses, marketing and growth initiatives, inventory levels and returns, cost of goods, future financings, other goals and targets and statements of the assumptions underlying or relating to any such statements. The inclusion of this forward-looking information should not be regarded as a representation by us or any other person that the future plans, estimates or expectations that we contemplate will be achieved.
Although we believe that the expectations reflected in the forward-looking statements are reasonable, we cannot guarantee future results, events, favorable circumstances or conditions, levels of activity or performance. Actual results could differ materially and adversely from those anticipated or implied in the forward-looking statements, and you are cautioned not to place undue reliance on these statements. Important factors that could cause actual results to differ materially from those in the forward-looking statements include those described under “Risk Factors.” If one or more of these or other risks or uncertainties materialize, or if our underlying assumptions prove to be incorrect, actual results may vary materially from our projections. These factors should not be construed as exhaustive, and should be read in conjunction with the other cautionary statements included in this report.
We undertake no obligation to publicly update any forward-looking statements in light of new information, subsequent events or otherwise except as required by law.
Industry, Ranking and Market Data
Unless otherwise indicated, information contained in this Annual Report on Form 10-K concerning our industry and the market in which we operate, including our general expectations about our industry, market position, market opportunity and market size, is based on data from various sources including internal data and estimates as well as third party sources widely available to the public such as independent industry publications (including Euromonitor International Ltd, or “Euromonitor”), government publications, reports by market research firms or other published independent sources and on our assumptions based on that data and other similar sources. We did not fund and are not otherwise affiliated with the third party sources that we cite. Industry publications and other published sources generally state that the information contained therein has been obtained from third-party sources believed to be reliable. Internal data and estimates are based upon information obtained from trade and business organizations and other contacts in the markets in which we operate and management’s understanding of industry conditions, and such information has not been verified by any independent sources. These data involve a number of assumptions and limitations, and you are cautioned not to give undue weight to such estimates. While we believe the market, industry and other information included in this Annual Report on Form 10-K to be the most recently available and to be generally reliable, such information is inherently imprecise and we have not independently verified any third-party information or verified that more recent information is not available.
We refer to North America, Western Europe and Japan as “developed markets,” and all other markets as “emerging markets.” We define North America as the United States of America ("U.S.") and Canada. Except as specifically indicated, all references to rankings are based on retail value market share.
Our fiscal year ends on June 30. Unless otherwise noted, any reference to a year preceded by the word “fiscal” refers to the fiscal year ended June 30 of that year. For example, references to “fiscal 2014” refer to the fiscal year ended June 30, 2014. Any reference to a year not preceded by “fiscal” refers to a calendar year.
Item 1.
Business.
We are a leading global beauty company. Founded in Paris in 1904, Coty is a pure play beauty company with a portfolio of well-known brands that compete in the three segments in which we operate: Fragrances, Color Cosmetics and Skin & Body Care. We hold the #2 global position in fragrances, the #5 global position in color cosmetics and have a strong regional presence in skin & body care. Our top 10 brands, which we refer to as our “power brands”, generated 72% of our net revenues in fiscal 2014 and comprise the following globally recognized brands:
adidas, Calvin Klein, Chloé, Davidoff, Marc Jacobs, OPI, philosophy, Playboy, Rimmel
and
Sally Hansen.
Our brands compete in all key distribution channels across both prestige and mass markets and in over 130 countries and territories.
Coty has transformed itself into a multi-segment beauty company with market leading positions in both North America and Europe through new product offerings, diversified sales channels and its global growth strategy. Today, our business has a diversified revenue base that generated net revenues in fiscal 2014 of 55%, 30% and 15% from Fragrances, Color Cosmetics and Skin & Body Care, respectively.
For segment and geographic area financial information and information about our long-lived foreign assets, see Note 3, “Segment Reporting” in the notes to our Consolidated Financial Statements, and for information about recent acquisitions or dispositions of any material amount of assets, see Note 4, “Business Combinations” in the notes to our Consolidated Financial Statements.
Our Brands
We grow organically through our focus on supporting and expanding global brands while consistently developing and seeking to acquire new brands and licenses. Brand innovation and new product development are critical components of our success.
Our “power brands”, each of which we describe in further detail below, are at the core of our accomplishments. We invest aggressively behind current and prospective power brands, which are our largest brands and those that we believe to have the greatest global potential, to enhance our scale in the three beauty segments in which we compete.
•
adidas. adidas
is one of the biggest licensed brands in the global mass skin & body care market and maintains a significant presence in deodorants and shower gels. Our
adidas
products for both men and women blend distinctive brand identity (through each fragrance and product design) and aspirations of performance (epitomized by the “developed with athletes” signature) to appeal to a broad range of consumers. The brand is sold and holds strong market positions in developed markets, such as Western Europe and North America, and in certain emerging markets.
•
Calvin Klein. Calvin Klein
is our largest brand by net revenues and one of the largest fragrance brands by net revenues in the world. It holds strong positions in most developed markets, including the U.S., the United Kingdom, Germany and Spain, and in emerging markets, such as China and the Middle East. The brand is also sold in the travel retail sales channel, including duty-free shops. The brand reaches a diverse consumer base through several strong product lines, including
ck one, Eternity
and
Euphoria.
In fiscal 2012, we launched
ck one color
, a new line of color cosmetics under the
ck one
product line sold in prestige distribution channels. We intend to increase the consumer reach and market share of our
Calvin Klein
brand in emerging markets.
•
Chloé. Chloé
is one of the fastest growing prestige fragrance brands for women over the past five years and is now one of the top 20 women’s fragrances in the global prestige market.
Chloé
’s sales results are particularly strong in travel retail and in the U.S., China, France, Germany, Italy, Spain and the Middle East. Notable launches for the brand include
Chloé Signature
,
Love, Chloé
and
See by Chloé
.
•
Davidoff. Davidoff
is the #10 men’s fragrance brand in the worldwide prestige market.
Cool Water
,
Davidoff’s
most successful line, is the #2 men’s fragrance brand in the German prestige market and the #7 men's prestige fragrance brand in the world. It has been one of the world’s leading prestige men’s fragrances since its initial launch in 1988. In 1996, we launched our
Cool Water
women’s fragrance, which has also enjoyed success. In fiscal 2013 we launched
Game
under the
Davidoff
brand, and in fiscal 2014 we launched
Night Dive
and
Coral Reef
under the
Davidoff Cool Water
fragrance line, with sales from the latter benefiting the National Geographic Society's "Pristine Seas" program to protect the oceans.
•
Marc Jacobs. Marc Jacobs
is an iconic fragrance brand, with
Daisy Marc Jacobs
,
Marc Jacobs Lola
and
Dot Marc Jacobs.
In calendar year 2013,
Marc Jacobs
was the #6 women’s fragrance brand in the U.S. prestige market and
1
the #4 women’s fragrance brand in the U.K. prestige market. The brand has been particularly successful in certain Asian markets, including China, and has sold well in duty free shops.
•
OPI. OPI
is a leader in professional nail care. With its portfolio of over 400 creatively-named unique shades,
OPI
links fashion and entertainment with color cosmetics. OPI regularly creates limited-edition collections with celebrities and entertainment franchises and works with fashion houses and fashion publications to promote the brand. Our
OPI
brand product lines include
OPI
(which is sold through salons, travel retail and traditional retailers) and
Nicole by OPI
(which is sold through mass retailers). OPI also markets nail gels, nail care products and nail accessories through salons.
OPI
is sold in over 100 countries and territories.
•
philosophy. philosophy
enjoys strong market position in skin & body care in the U.S. prestige market and leverages multiple distribution channels, including direct television sales and e-commerce.
philosophy
’s
miracle worker
line one of the most successful skin care launches in the U.S. prestige market the year it was launched. Building on the brand's existing skincare franchises,
philosophy
has had several new launches in fiscal 2014, including
hope in a jar light-as-air hydrating fluid makeup SPF 20
,
miracle worker anti-aging liquid makeup SPF 30
and
time in a bottle daily age-defying serum
. In recent years, we commenced distribution of
philosophy
in certain international markets, including Canada, the Netherlands, the United Kingdom, Singapore and South Korea.
•
Playboy. Playboy
has quickly become a strong mass market brand with established positions in North America and Europe as well as an expanding presence in emerging markets.
Playboy
offers a variety of deodorant, shower gel and fragrance products in both men and women markets.
•
Rimmel.
The
Rimmel
brand comprises a broad line of color cosmetics products covering the entire range of women’s color cosmetics needs, including eye, face, lip and nail products.
Rimmel
is sold in drugstores and other mass distribution channels.
Rimmel
is the #3 color cosmetics brand in the European retail mass market and has rapidly increased net sales in the Americas and Asia Pacific over the course of the past several years.
Rimmel
has been represented for more than ten years by Kate Moss, who has also recently developed and promoted her own signature line of
Rimmel
lipsticks.
•
Sally Hansen. Sally Hansen
is the #1 nail care product brand in North America. We believe that
Sally Hansen
has the most diversified and successful line of nail products in North America. Products in our
Sally Hansen
line include nail care products, nail color lacquers and nail and beauty implements. We also sell a broad range of depilatory and wax products through our
Sally Hansen
brand.
Sally Hansen
is sold in drugstores and other mass retailers. Although
Sally Hansen
is currently primarily a North American brand, we are expanding its presence in Europe, Asia and South America by focusing on nail care and color.
In addition to our power brands, we have a broad and deep portfolio of over 60 other brands, which accounted for 28% of our net revenues in fiscal 2014. These include regional brands such as
Astor
,
Jil Sander
,
Lancaster
and
Manhattan
, celebrity brands such as
Beyoncé
,
David Beckham
,
Jennifer Lopez
and
Katy Perry
and emerging brands such as
Roberto Cavalli, Bottega Veneta
and
Balenciaga.
A description of each of our brands is available at www.coty.com.
Our Strategic Vision
Our strategic vision is to strengthen Coty’s position as a global leader in beauty, with brand building and creativity at its core. Our long-term financial targets are unchanged: growing our net revenues in line with or faster than the markets and segments in which we compete, expanding profitability and margins and generating strong cash flow. We believe our organic growth has outpaced the markets and segments in which we compete in two of the past three years and has been in line with the markets and segments in which we compete in the cumulative three-year period, according to Euromonitor data. To achieve our strategic vision and long-term financial targets, we have developed Coty 2020, our comprehensive plan which is based on the following five drivers:
|
•
|
Developing our power brands, with a strong focus on superior innovation and increased investment in brand support.
|
|
•
|
Strengthening our global positions in fragrances and color cosmetics and expanding our presence in skin & body care through organic growth and a well-targeted acquisition strategy. Our ambition is to become the undisputed number one global player in fragrances and to be among the top three global players in color cosmetics. We also plan to expand our presence in skin & body care with a particular focus on opportunities in emerging markets.
|
2
|
•
|
Progressing our emerging markets expansion strategy, with the objective of generating more than one third of our net revenues from emerging markets.
|
|
•
|
Leveraging our multichannel distribution capabilities in order to seize growth opportunities across a broad consumer universe with product offerings spanning across price points.
|
|
•
|
Gaining efficiency and simplification in our operating model through a global efficiency plan. We believe our global efficiency plan will address the different cost components of our business, and we anticipate that annual savings from the plan will be over $200 million by the end of fiscal 2017.
|
Fragrances
Our Fragrances segment net revenues represented 55%, 54% and 53% of our net revenues in fiscal 2014, 2013 and 2012, respectively. In fiscal 2014, 2013 and 2012, our Fragrances segment generated $2.498 billion, $2.491 billion and $2.453 billion in net revenues, respectively, and $355.6 million, $369.7 million and $340.5 million in operating income, respectively.
We hold the #2 global position in fragrances. We believe that our success in fragrances results from a combination of strong executive leadership, global expansion, innovation, organic growth, acquisitions, product line extensions and new licenses.
Our fragrance products include a variety of men’s and women’s products. The brands in our Fragrances segment include brands associated with fashion designers, lifestyle brands and brands associated with entertainment personalities. We sell our fragrance products in all distribution channels, from mass to prestige, including travel and retail, to target consumers across all incomes, ages and geographies that we consider important to our business.
We own certain of the trademarks associated with our fragrance products and license other trademarks from celebrities, fashion houses and other lifestyle brands. In fiscal 2014, we manufactured 75% of our fragrance products at our manufacturing facilities, and we market and distribute our fragrance products globally through local affiliates and third-party distributors. In fiscal 2014, 2013 and 2012, the Americas represented 30%, 33% and 32%, respectively, EMEA represented 54%, 52% and 54%, respectively, and Asia Pacific represented 16%, 15% and 14%, respectively, of our net revenues from our Fragrances segment.
Our top fragrance brands by percentage of net revenues are
Calvin Klein
,
Marc Jacobs
,
Davidoff
,
Playboy
and
Chloé.
We have launched several new fragrance brands since 2010, including
Balenciaga
,
Beyoncé
,
Bottega Veneta
,
Guess?
,
Katy Perry
and
Roberto Cavalli.
Color Cosmetics
Net revenues from our Color Cosmetics segment represented 30%, 31% and 31% of our net revenues in fiscal 2014, 2013 and 2012, respectively. In fiscal 2014, 2013 and 2012, our Color Cosmetics segment generated $1.366 billion, $1.468 billion and $1.431 billion in net revenues, respectively, and $154.2 million, $208.8 million and $200.2 million in operating income, respectively.
We are an emerging leader in color cosmetics. We are ranked 5th globally and 3rd in the combined North American and European mass retail markets. Our color cosmetics products include lip, eye, nail and facial color products. We maintain a #2 position in nail care products globally.
We have ten brands in our Color Cosmetics segment. Our top color cosmetics brands by percentage of net revenues are
Rimmel, Sally Hansen
and
OPI.
Most of our color cosmetics products are sold within mass distribution channels, with
OPI
mostly sold in professional distribution channels. Our strength in color cosmetics is driven our
OPI, Rimmel
and
Sally Hansen
brands.
We own all the brands in our Color Cosmetics segment and their associated trademarks, except for
Cutex
, which we license. We associate celebrities’ images in the advertising of some of our color cosmetics brands such as Georgia May Jagger and Rita Ora for
Rimmel
, Demi Lovato for
N.Y.C. New York Color
and Gwen Stefani for
OPI
. In fiscal 2014, we manufactured 74% of our color cosmetics products at our manufacturing facilities. We market and distribute our color cosmetics products globally through our subsidiaries and our third-party distributors. In fiscal 2014, 2013 and 2012, the Americas represented 51%, 57% and 57%, respectively, EMEA represented 44%, 38% and 38%, respectively, and Asia Pacific represented 5%, 5% and 5%, respectively, of our net revenues from our Color Cosmetics segment.
Skin & Body Care
Our Skin & Body Care segment net revenues represented 15%, 15% and 16% of our net revenues in fiscal 2014, 2013 and 2012, respectively. In fiscal 2014, 2013 and 2012, our Skin & Body Care segment generated $687.2 million, $689.9 million and
3
$727.9 million in net revenues, respectively and $(351.7) million, $(5.7) million and $(577.8) million in operating (loss) income, respectively.
In our Skin & Body Care segment, we are continuing to develop our brands and product lines and expanding our product offerings. Our skin & body care products include shower gels, deodorants, skin care and sun treatment products. Our skin & body care brands are
adidas, Lancaster
and
philosophy. Lancaster
and
philosophy
are sold in prestige distribution channels, and
adidas
is sold in mass distribution channels.
We own
Lancaster
,
philosophy
and
TJoy
and their trademarks, and we license the trademarks associated with
adidas.
In fiscal 2014, we manufactured 62% of our skin & body care products at our manufacturing facilities. We market and distribute our skin & body care products globally through our subsidiaries and our third-party distributors. In fiscal 2014, 2013 and 2012, the Americas represented 38%, 38% and 37%, respectively, EMEA represented 50%, 48% and 49%, respectively, and Asia Pacific represented 12%, 14% and 14%, respectively, of our net revenues from our Skin & Body Care segment.
Research and Development
Research and development is a pillar of our innovation. It combines cutting-edge research and technology, new ingredients and precise market testing, enabling us to develop and support the development of new products while continuing to improve our existing products. Our key new product developments with significant product innovation components in fiscal 2014 included
Sally Hansen Miracle Gel,
the only two-step gel manicure that does not require light,
philosophy time in a bottle daily age-defying serum
, which helps defy the appearance of all major signs of aging with a breakthrough DNA renewal complex and high-potency vitamin c8 activator, and
Lancaster Total Age Correction
, featuring our exclusive infrared technology. Our products have received numerous awards, including awards from The Fragrance Foundation and CLIO.
We continuously seek to improve our products through research and development, and strive to provide the consumer with the best possible products. Our research and development teams work with our marketing and operations teams to identify recent trends and consumer needs and to bring products quickly to market. Additionally, our basic and applied research groups, which conduct longer-term research such as “blue sky” research, seek to develop proprietary new technologies for first-to-market products and for improving existing products. This research and development is done both internally and through affiliations with various universities, technical centers, supply partners, industry associations and technical associations. As of August 2014, we owned approximately 750 patents and patent applications globally.
We perform extensive testing on our products, including testing for safety, packaging, toxicology, in vitro eye irritation, microbiology, quality and stability. We also have a robust internal and external testing program that includes sensory, consumer and clinical testing. We do not conduct animal testing on our products or ingredients, nor do we engage others to undertake such testing on our behalf, except when required by local country laws.
As of August 2014, we had approximately 250 employees engaged in research and development. Research and development expenditures totaled 1.0%, 1.0% and 0.9% of net revenues in fiscal 2014, 2013 and 2012, respectively. We maintain five research and development centers, which are located in the U.S., Europe and China.
Suppliers, Manufacturing and Related Operations
We manufacture approximately 72% of our products in eight facilities around the world. These facilities are located in the U.S., Europe and China. Several of these locations provide multi-segment manufacturing. Approximately 28% of our finished products are manufactured to our specifications by third parties.
We continue to streamline our manufacturing processes and identify sourcing opportunities to improve innovation, increase efficiencies and reduce costs. We have a dedicated worldwide procurement team that we believe follows industry best practices and that is making a concentrated effort to reduce costs associated with our third-party suppliers. While we believe that our manufacturing facilities are sufficient to meet current and reasonably anticipated manufacturing requirements, we continue to identify opportunities to make improvements in capacity and productivity. For example, we are streamlining our manufacturing facilities to make distribution more efficient. To capitalize on supply chain benefits, we will continue to utilize third parties on a global basis for finished goods production.
The principal raw materials used in the manufacture of our products are essential oils, alcohol and specialty chemicals. The essential oils in our fragrance products are generally sourced from fragrance houses. As a result, we realize material cost savings and benefits from the technology, innovation and resources provided by these fragrance houses.
We purchase the raw materials for all our products from various third parties. We also purchase packaging components that are manufactured to our design specifications. We work in collaboration with our suppliers to meet our stringent design and creative criteria. In fiscal 2014, no single supplier accounted for more than 7% of the materials used in the manufacture of our products.
4
We regularly benchmark the performance of our supply chain and change suppliers and adjust our distribution networks and manufacturing footprint based upon the changing needs of our business. We are always considering new ways to improve our overall supply chain performance through better use of our production and sourcing capabilities. We believe that we currently have adequate sources of supply for all our products. We have not experienced disruptions in our supply chain in the past, and we believe we have robust practices in place to respond to any potential disruptions in our supply chain.
We have established a global distribution network designed to meet the changing demands of our customers while maintaining service levels. In calendar year 2013, we received a Frost & Sullivan Manufacturing Leadership 100 award for leadership in global value chain. We are continuing to evaluate and restructure our physical distribution network to increase efficiency and reduce our order lead times.
We also recognize the importance of our employees and have programs in place designed to ensure operating safety. We also have in place programs designed to ensure that our manufacturing and distribution facilities comply with applicable environmental rules and regulations, and these programs have improved our employee safety as benchmarked against industry levels.
Marketing and Sales
We have dedicated marketing and sales forces (including ancillary support services) in most of our significant markets. We believe that local teams dedicated to the commercialization of our brands give us the greatest opportunity to execute our business strategy. We are also developing branding and marketing execution strategies with our top customers.
Our marketing strategy creates a distinct image and personality for each brand. Many of our products are linked to recognized designers and design houses such as
Balenciaga, Bottega Veneta, Calvin Klein, Chloé, Nautica, Guess?
and
Marc Jacobs
, celebrities, such as Beyoncé Knowles, David Beckham, Jennifer Lopez and Enrique Iglesias, and lifestyle brands, such as
adidas
,
Davidoff
and
Playboy.
Each of our brands is promoted with consistent logos, packaging and advertising designed to enhance its image and the uniqueness of each brand. Our strategy is to promote these brands mostly in television, print, outdoor ads, in-store displays and online on brand sites and social networks. We also leverage our relationships with celebrities to endorse certain of our products. Recent campaigns include Kate Moss, Georgia May Jagger and Rita Ora for
Rimmel
, Gwen Stefani for
OPI
, Christy Turlington and Ed Burns for
Calvin Klein Eternity
and a television spot for
Marc Jacobs Daisy Dream
directed by long-time
Marc Jacobs
muse Sofia Coppola
.
Our marketing efforts also benefit from cooperative advertising programs with retailers, often in connection with in-store marketing activities. Such activities are designed to attract consumers to our counters, displays and walls and make them try, or purchase, our products. We also engage in sampling and “gift-with-purchase” programs designed to stimulate product trials. We have more recently been expanding our digital marketing efforts, including through websites we do not control or operate, with a multi-pronged strategy that ranges from brand sites, social networking campaigns and blogs, to e-commerce. Forty-six of our brands currently have marketing sites, forty-three have social networking activities and fifteen are sold on branded e-commerce sites. We also partner with key “brick and mortar” retailers in their expansion into e-commerce.
Our consolidated expenses for advertising and promotional costs were $1.070 billion, $1.072 billion and $1.086 billion in fiscal 2014, 2013 and 2012, respectively. Our consolidated expenses for total marketing and advertising were $1.563 billion, $1.574 billion and $1.605 billion in fiscals 2014, 2013 and 2012, respectively.
Distribution Channels and Retail Sales
We currently have offices in more than 40 countries and market, sell and distribute our products in over 130 countries and territories.
We have a balanced multi-channel distribution strategy and market products across price points in prestige and mass channels of distribution. We offer certain products through multiple distribution channels to reach a broader range of customers. We sell products in each of our segments through retailers, including hypermarkets, supermarkets, independent and chain drug stores and pharmacies, upscale perfumeries, upscale and mid-tier department stores, nail salons, specialty retailers, duty-free shops and traditional food, drug and mass retailers. Our principal retailers in the mass distribution channel include CVS, Kmart, Target, Walgreens and Wal-Mart in the U.S. and Boots, DM, Carrefour and Watson’s in Europe. Our principal retailers in the prestige distribution channel include Macy’s, Neiman Marcus, Nordstrom and Saks Fifth Avenue in the U.S., AS Watson and Douglas in Europe and Sephora in multiple geographic regions. In fiscal 2014, no retailer accounted for more than 10% of our global net revenues; however, certain retailers accounted for more than 10% of net revenues within certain geographic markets. In fiscal 2014, our top ten retailers combined accounted for 29% of our net revenues and Wal-Mart, our top retailer, accounted for 6% of our net revenues. We are pursuing our strategy of geographic expansion by selling through retailers, our subsidiaries or third-party distributors and our strategy of increasing our presence in e-commerce by selling through websites that support an e-commerce-only product distribution business, including our own branded websites. We believe our commercial expertise
5
enhances our capabilities when we enter new markets where products must suit local consumer preferences, incomes and demographics.
We also sell a broad range of our products through travel retail sales channels, including duty-free shops, airlines, cruise lines and other tax-free zones. Travel retail sales channels represented 7% of our net revenues in fiscal 2014. In addition, we sell our products through the internet over our retail partners’ e-commerce sites and through online retailers, and we sell our
philosophy
products through
philosophy
-branded websites
and through direct marketing via television.
In countries and territories in which we sell our products but where we do not have a subsidiary, our products are sold through third-party distributors. Distributors in different countries or territories may sell to different types of customers, such as traditional retailers or via direct marketing. In some cases, we also outsource functions or parts of functions that can be performed more effectively by external service providers. For example, we have outsourced significant portions of our logistics management for our European prestige and mass distribution and our U.S. mass distribution, as well as certain technology-related functions, to third-party service providers. We direct our third-party service providers and distributors in the marketing, advertising and promotion of our products. Our third-party distributors contribute knowledge of the local market and dedicated sales personnel.
In accordance with accounting principles generally accepted in the U.S. (“GAAP”), we report revenues on a net basis, which reflects the amount of actual returns received and the amount established for anticipated returns. As a percentage of gross sales, returns accounted for approximately 3.9%, 3.7% and 3.5% in fiscal 2014, 2013 and 2012, respectively.
Competition
We compete against a number of manufacturers and marketers of fragrances, color cosmetics and personal care products. In addition to the established multinational brands against which we compete, small targeted niche brands continue to enter the market. Competition is also increasing from private label products sold by apparel retailers and mass distribution retailers.
We believe that we compete primarily on the basis of perceived value, including pricing and innovation, service to the consumer, promotional activities, advertising, special events, new product introductions, e-commerce and mobile-commerce initiatives, direct sales and other activities. It is difficult for us to predict the timing and scale of our competitors’ actions in these areas. Refining product portfolios with more enhanced, newer and redesigned products has become a priority as we compete in the slower-growing developed markets.
Intellectual Property
Our success depends, at least in part, on our ability to protect our proprietary technology and intellectual property, and to operate without infringing the proprietary rights of others. We rely on a combination of trademarks, patents, copyrights, trade secrets and know-how, intellectual property licenses and other contractual rights (including confidentiality and invention assignment agreements) to establish and protect our proprietary rights.
We own the trademark rights in key sales countries in international Class 3 trademark class (cosmetics and cleaning preparations) for use in connection with the distribution of the following brands:
Astor, Coty, Jovan, Joop!, Lancaster, Manhattan, N.Y.C. New York Color, OPI, philosophy, Rimmel
and
Sally Hansen.
We license the trademarks for the balance of our material products, and we are generally the exclusive trademark licensee for all Class 3 trademarks used in connection with our products in certain fields. We or our licensors, as the case may be, actively protect the trademarks used in our principal products in the U.S. and significant markets worldwide. We consider the protection of our trademarks to be essential to our business.
A number of our products also incorporate patented, patent-pending or proprietary technology in their respective formulations and/or packaging, and in some cases our product packaging is subject to copyright, trade dress or community design protection. While we consider our patents and copyrights, and the protection thereof, to be important, no single patent or copyright, or group of patents or copyrights, is material to the conduct of our business. As of August 2014, we owned approximately 750 patents and patent applications globally.
Products representing a significant portion of our net revenues are manufactured and marketed under exclusive license agreements granted to us for use on a worldwide and/or regional basis. As of June 30, 2014, we maintained 34 brand licenses, two of which were entered into during fiscal 2014. In fiscal 2014, 60% of our net revenues were generated from licensed brands, with our licensed power brands (our top six licenses) representing between 4% and 17% of total net revenues. In each of fiscals 2013 and 2012, 58% of our net revenues were generated from licensed brands.
Our existing licenses, including those for our power brands, impose obligations on us that we believe are common to many licensing relationships in the beauty industry. These obligations include:
•
paying annual royalties on net sales of the licensed products;
6
•
maintaining the quality of the licensed products and the applicable trademarks;
|
•
|
permitting the licensor’s involvement in and, in some cases, approval of advertising, packaging and marketing plans relating to the licensed products;
|
•
maintaining minimum royalty payments and/or minimum sales levels for the licensed products;
•
actively promoting the sales of the licensed products;
•
spending a certain amount of net sales on marketing and advertising for the licensed products;
•
maintaining the integrity of the specified distribution channel for the licensed products;
•
expanding the sales of the licensed products and/or the markets in which it is sold;
•
agreeing not to enter into licensing arrangements with competitors of certain of our licensors;
•
indemnifying the licensor in the event of product liability or other claims related to our products;
•
limiting assignment and sub-licensing to third parties without the licensor’s consent; and
|
•
|
in some cases, requiring notice to, or approval by, the licensor of certain changes in control as a condition to continuation of the license.
|
We are currently in compliance with all material terms of our brand license agreements.
Most brand licenses have renewal options for one or more terms, which can range from one to twenty years. Certain brand licenses provide for automatic extensions, so long as minimum annual royalty payments are made, while renewal of others is contingent upon attaining of specified sales levels. The next power brand license scheduled to expire that does not provide for automatic renewal or renewal at our option expires in fiscal 2022. Five of our brand licenses expire during fiscal 2015. We expect to renew four of these brand licenses, two of which provide for automatic renewal or renewal at our option. For additional risks associated with our licensing arrangements, see “—Risk Factors —Our business is dependent upon certain licenses.”
We may be unable to obtain, maintain and protect the intellectual property rights necessary to conduct our business, and may be subject to claims that we infringe or otherwise violate the intellectual property rights of others, which could materially harm our business. For more information, see “—Risk Factors —Our business is dependent upon certain licenses,” “—Risk Factors —If we are unable to obtain, maintain and protect our intellectual property rights, in particular trademarks, patents and copyrights, or if our brand partners and licensors are unable to maintain and protect their intellectual property rights that we use in connection with our products, our ability to compete could be negatively impacted,” “—Risk Factors —Our success depends on our ability to operate our business without infringing, misappropriating or otherwise violating the trademarks, patents, copyrights and proprietary rights of other parties” and “—Risk Factors —The illegal distribution and sale by third parties of counterfeit versions of our products could have a negative impact on our reputation and business.”
Employees
As of August 2014, we had approximately 9,000 full-time employees in over 40 countries. In addition, we employ a large number of seasonal contractors during our peak manufacturing and promotional season, primarily at our manufacturing facility in Sanford, North Carolina. We recognize the importance of our employees to our business and believe our relationship with our employees is satisfactory.
Our employees in the U.S. are not covered by collective bargaining agreements. Our employees in certain countries in Europe are subject to works council arrangements. We have not experienced a material strike or work stoppage in the U.S. or any other country where we have a significant number of employees.
Government Regulation
We and our products are subject to regulation by various U.S. federal regulatory agencies as well as by various state and local regulatory authorities and by the applicable regulatory authorities in the countries in which our products are produced or sold. Such regulations principally relate to the ingredients, labeling, packaging, advertising and marketing of our products. Because we have commercial operations overseas, we are subject to the U.S. Foreign Corrupt Practices Act (the “FCPA”) as well as other countries’ anti-corruption and anti-bribery regimes, such as the U.K. Bribery Act.
Environmental, Health and Safety
We are subject to numerous foreign, federal, provincial, state, municipal and local environmental, health and safety laws and regulations relating to, among other matters, safe working conditions, product stewardship and environmental protection,
7
including those relating to emissions to the air, discharges to land and surface waters, generation, handling, storage, transportation, treatment and disposal of hazardous substances and waste materials, and the registration and evaluation of chemicals. We maintain policies and procedures to monitor and control environmental, health and safety risks, and to monitor compliance with applicable environmental, health and safety requirements. Compliance with such laws and regulations pertaining to the discharge of materials into the environment, or otherwise relating to the protection of the environment, has not had a material effect upon our capital expenditures, earnings or competitive position. However, environmental laws and regulations have tended to become increasingly stringent and, to the extent regulatory changes occur in the future, they could result in, among other things, increased costs to us. For example, certain states, such as California, and the U.S. Congress have proposed legislation relating to chemical disclosure and other requirements related to the content of our products. For more information, see “—Risk Factors —We are subject to environmental, health and safety laws and regulations that could affect our business or financial results.”
Seasonality
Our sales generally increase during our second fiscal quarter as a result of increased demand by retailers associated with the holiday season. Working capital requirements, sales, and cash flows generally experience variability during the three to six months preceding the holiday period due in part to product innovations and new product launches and the size and timing of certain orders from our customers. While we continue to attempt to reduce this seasonality, sales volume of holiday gift items is, by its nature, difficult to forecast.
We generally experience peak inventory levels from July to October and peak receivable balances from September to December. During the months of November, December and January of each year, cash is normally generated as customer payments for holiday season orders are received.
In response to this seasonality and other factors, management has implemented various working capital programs aimed at optimizing the effectiveness of our inventories, customer receivables and accounts payable. For example, to improve inventory productivity, we have enhanced our sales and operational planning forecasting processes. To improve accounts payable efficiency, we have commenced a harmonization of our vendor management practices across geographies to optimize our payments to vendors.
Availability of Reports
We make available financial information, news releases and other information on our website at www.coty.com. There is a direct link from the website to our Securities and Exchange Commission (“SEC”) filings via the EDGAR database at www.sec.gov, where our annual reports on Form 10-K, quarterly reports on Form 10-Q, current reports on Form 8-K and any amendments to these reports filed or furnished pursuant to Section 13(a) or 15(d) of the Securities Exchange Act of 1934 are available free of charge as soon as reasonably practicable after we file such reports and amendments with, or furnish them to, the SEC. Stockholders may also contact Investor Relations at 350 Fifth Avenue, New York, New York 10118 or call 212-389-7300 to obtain hard copies of these reports without charge.
Item 1A.
Risk Factors.
You should consider the following risks and all of the other information in this Annual Report in connection with evaluating our business and the forward-looking information contained in this Annual Report on Form 10-K. Our business may also be adversely affected by risks and uncertainties not presently known to us or that we currently believe to be immaterial. If any of the events contemplated by the following discussion of risks should occur or other risks arise or develop, our business, prospects, financial condition and results of operations, may be materially and adversely affected.
The beauty business is highly competitive, and if we are unable to compete effectively our results will suffer.
We face vigorous competition from companies throughout the world, including large multinational consumer products companies. Some of our competitors have greater resources than we do and may be able to respond more effectively to changing business and economic conditions than we can. Most of our products compete with other widely-advertised brands within each product segment. Competition in the beauty business is based on pricing of products, quality of products and packaging, perceived value and quality of brands, innovation, in-store presence and visibility, promotional activities, advertising, editorials, e-commerce and mobile-commerce initiatives and other activities. It is difficult for us to predict the timing and scale of our competitors’ actions in these areas or whether new competitors will emerge in the beauty business, including competitors who offer comparable products at more attractive prices. In particular, the fragrances segment and nail category in the U.S. are being influenced by the high volume of new product introductions by diverse companies across several different distribution channels, including private label brands and lower cost brands that have increased pricing pressure. In
8
addition, further technological breakthroughs, new product offerings by competitors, and the strength and success of our competitors’ marketing programs may impede our growth and the implementation of our business strategy. Our ability to compete also depends on the continued strength of our products, both power brands and other brands, the success of our branding, innovation and execution strategies, our ability to acquire or enter into new licenses and to continue to act as licensee of choice for various brands, the continued diversity of our product offerings to help us compete effectively, the successful management of new product introductions and innovations, our success in entering new markets and expanding our business in existing geographies, the success of any future acquisitions and our ability to protect our intellectual property. If we are unable to continue to compete effectively on a global basis, it could have an adverse impact on our business, results of operations and financial condition.
Rapid changes in market trends and consumer preferences could adversely affect our financial results.
Our continued success depends on our ability to anticipate, gauge and react in a timely and cost-effective manner to industry trends and to changes in consumer preferences for fragrances, color cosmetics and skin & body care products, consumer attitudes toward our industry and brands and changes in where and how consumers shop for those products. We must continually work to develop, produce and market new products, maintain and enhance the recognition of our brands, achieve a favorable mix of products and refine our approach as to how and where we market and sell our products. Net revenues and margins on beauty products tend to decline as they advance in their life cycles, so our net revenues and margins could suffer if we do not successfully and continuously develop new products. While we devote considerable effort and resources to shape, analyze and respond to consumer preferences, consumer tastes cannot be predicted with certainty and can change rapidly, which could impact demand for our products. Additionally, due to the increasing use of social and digital media by consumers and the speed by which information and opinions are shared, trends and tastes may continue to change even more quickly. If we are unable to anticipate and respond to trends in the market for beauty and related products and changing consumer demands, our brand names and brand images may be impaired. Even if we react appropriately to changing trends and consumer preferences, consumers may consider our brand images to be outdated or associate our brands with styles that are no longer popular or trend-setting. Any of these outcomes could have a material adverse effect on our brands, business, financial condition and operating results.
Our success depends on our ability to achieve our global business strategy.
Our future growth, profitability and cash flows depend upon our ability to successfully implement our global business strategy, which is dependent upon a number of factors, including our ability to:
|
Ÿ
|
develop our power brands portfolio through branding, innovation and execution;
|
||
|
Ÿ
|
identify and incubate new and existing brands with the potential to develop into global power brands;
|
||
|
Ÿ
|
innovate and develop new products that are appealing to the consumer;
|
||
|
Ÿ
|
extend our brands into the other segments of the beauty industry in which we compete and develop new brands;
|
||
|
Ÿ
|
acquire or enter into new licenses;
|
||
|
Ÿ
|
expand our geographic presence to take advantage of opportunities in developed and emerging markets;
|
||
|
Ÿ
|
continue to expand our distribution channels within existing geographies to increase market presence, brand recognition and sales;
|
||
|
Ÿ
|
expand our market presence through alternative distribution channels;
|
||
|
Ÿ
|
expand margins through sales growth, the development of higher margin products and supply chain integration and efficiency initiatives;
|
||
|
Ÿ
|
manage capital investments and working capital effectively to improve the generation of cash flow;
|
||
|
Ÿ
|
execute any acquisitions quickly and efficiently and integrate businesses successfully; and
|
||
|
Ÿ
|
implement our recently announced new organizational structure as planned.
|
||
There can be no assurance that we can successfully achieve any or all of the above initiatives in the manner or time period that we expect. Further, achieving these objectives will require investments which may result in short-term costs without generating any current net revenues and, therefore, may be dilutive to our earnings, at least in the short term. In addition, we may decide to divest or discontinue certain brands or streamline operations and incur other costs or special charges in doing so.
9
We cannot give any assurance that we will realize, in full or in part, the anticipated strategic benefits we expect our strategy will achieve. The failure to realize those benefits could have a material adverse effect on our business, financial condition and results of operations.
We may not realize the benefits that we expect from our new organizational structure.
On July 9, 2014, we announced a new organizational structure aimed at reinforcing our growth path and strengthening our position as a global leader in beauty. We anticipate that our new organizational structure (“Organizational Redesign”) will result in annual savings as well as material restructuring and other special charges as it is implemented.
The successful implementation of our Organizational Redesign presents significant organizational challenges and uncertainties and may also require successful negotiations with third parties, including labor organizations, suppliers and other business partners. As a result, we may not be able to realize, in full or in part, the anticipated benefits from Organizational Redesign. Events and circumstances such as financial or strategic difficulties, unexpected employee turnover, delays and unexpected costs may occur that could result in us not realizing all or any of the anticipated benefits or us not realizing the anticipated benefits on our expected timetable.
If we are unable to realize the anticipated savings of our Organizational Redesign, our ability to fund other initiatives may be adversely affected. Any failure to implement our Organizational Redesign in accordance with our expectations could adversely affect our business, results of operations and financial condition.
We may not be able to identify suitable acquisition targets or realize the full intended benefit of acquisitions we undertake.
During the past several years, we have explored and undertaken opportunities to acquire other companies and assets as part of our growth strategy. The assets we have acquired in the past several years represent a significant portion of our net assets. We continue to seek financially accretive acquisitions that strengthen our competitive position in our key segments or accelerate our ability to grow our emerging markets presence. There can be no assurance that we will be able to continue to identify suitable acquisition candidates in the future or consummate acquisitions on favorable terms or otherwise realize the full intended benefit of such transactions. For example, this fiscal year, despite efforts to organize the management team and introduce new product innovation, the execution of the brand revamp plan by the management team for TJoy did not gain expected results, resulting in TJoy performing below our expectations and impairments of trademarks. In June 2014, we made the decision to discontinue the TJoy brand at this time. Similarly, Philosophy earned lower net revenues than expected in the first fiscal year after its acquisition primarily due to delays in planned international distribution expansion, an innovation plan that was less successful than expected and a slowdown of brand sales momentum in certain key retailers, all of which also resulted in impairments of trademarks. See “—Our goodwill and other assets have been subject to impairment and may continue to be subject to impairment in the future” and “—The purchase price of future acquisitions may not be representative of the operations acquired.” Our failure to achieve intended benefits from any future acquisitions could cause a material adverse effect on our results, business or financial condition.
Our acquisition activities may present managerial, integration, operational and financial risks.
Our acquisition activities expose us to certain risks, including diversion of management attention from existing core businesses and potential loss of customers or key employees of acquired businesses. If required, the financing for an acquisition could increase our indebtedness, dilute the interests of our stockholders or both. The assumptions we use to evaluate acquisition opportunities may not prove to be accurate, and intended benefits may not be realized. In addition, acquisitions of foreign businesses entail certain particular risks, including difficulties in markets and environments where we lack a significant presence, including inability to seize opportunities available in those markets in comparison to our global or local competitors. For example, our growth strategy may require us to seek market penetration through sales channels with which we are not familiar, which may be the dominant sales channels in the relevant geographies. To the extent we acquire businesses located in countries or jurisdictions with currencies other than the U.S. dollar, the U.S. dollar equivalent cost of the acquisition, as well as future profits and revenues, may be adversely impacted should exchange rates vary in unexpected ways. We may experience difficulties in integrating newly acquired businesses, such as the difficulties we experienced in our acquisition of TJoy relating to the earlier than expected departure of key employees and transition to new leadership. Even if we are able to integrate our acquired businesses, such transactions involve the risk of unanticipated or unknown liabilities, including with respect to environmental and regulatory matters. Our failure to successfully integrate any acquired business could have a material adverse effect on our business, financial condition and operating results.
Our operations and acquisitions in certain foreign areas expose us to political, regulatory, economic and reputational risks.
We currently have offices in more than 40 countries and market, sell and distribute our products in over 130 countries and territories. Our growth strategy depends in part on our ability to grow in emerging markets including expanding our operations
10
in China and Russia and building our business in Brazil and South East Asia. In addition, our acquisitions and operations in some emerging markets may be subject to greater political and economic volatility and greater vulnerability to infrastructure and labor disruptions than are common in established areas.
Although we have implemented policies, procedures and trainings designed to ensure compliance with anti-bribery laws, trade controls and economic sanctions, and similar regulations, our employees, contractors and agents, as well as those companies to which we outsource certain of our business operations, may take actions in violation of our policies. We may incur costs or other penalties in the event that any such violations occur, which could have an adverse effect on our business and reputation.
The U.S. has imposed export controls and economic sanctions that prohibit export or re-export of products subject to U.S. jurisdiction to specified end users and destinations, and/or prohibit U.S. companies and other U.S. persons from engaging in business activities with certain persons, entities, countries or governments that it determines are adverse to U.S. foreign policy interests, including Iran and Syria. In 2012, we determined that our majority-owned subsidiary in the United Arab Emirates (“UAE”) had re-exported certain of our products manufactured in the U.S. to Syria, which may have been in violation of U.S. export control laws. We have taken remedial action to cease further sales to Syria. After voluntarily reporting these re-exports to the U.S. Department of Commerce’s Bureau of Industry and Security’s Office of Export Enforcement (the "OEE"), we received a warning letter from the OEE on January 6, 2014 stating that the OEE had closed its investigation. No financial penalties were imposed. In addition, we voluntarily reported to the U.S. Treasury Department's Office of Foreign Assets Control ("OFAC") that some of the affiliate’s Syria sales were made to a party that was designated as a target of U.S. economic sanctions by OFAC. We also determined that the same affiliate had re-exported some of our products to Iran through an intermediary UAE entity. We ceased all sales to the OFAC-designated party in January 2010 and have ceased all sales to Iran, Syria and OFAC-designated parties. We do not believe these sales constituted a violation of U.S. trade sanctions administered by OFAC. We may experience reputational harm and increased regulatory scrutiny as a result of our subsidiary’s sales to Syria and Iran. In addition, the U.S. may impose additional sanctions at any time on other countries where we sell our products. If so, our existing activities may be adversely affected, or we may incur costs in order to come into compliance with future sanctions, depending on the nature of any further sanctions that may be imposed.
Under U.S. law, U.S. companies and their controlled-in-fact foreign subsidiaries and affiliates are prohibited from participating in unsanctioned foreign boycotts. Currently, the U.S. considers the Arab League boycott of Israel to constitute an unsanctioned foreign boycott. In the course of our internal investigation into compliance with U.S. export laws by our majority-owned subsidiary in the UAE, we determined that the subsidiary may have violated EAR anti-boycott laws by certifying on invoices (including some that involved goods manufactured in the U.S.) that the orders did not contain any materials of Israeli origin. See “—We may incur penalties and experience other adverse effects on our business as a result of possible EAR violations” for additional information regarding risks related to such certifications.
In addition, some of our recent acquisitions have required us to integrate non-U.S. companies which had not, until our acquisition, been subject to U.S. law. In many countries outside of the U.S., particularly in those with developing economies, it may be common for persons to engage in business practices prohibited by laws and regulations applicable to us, such as the FCPA or similar local anti-bribery laws. These laws generally prohibit companies and their employees, contractors or agents from making improper payments to government officials for the purpose of obtaining or retaining business. Failure by us and our subsidiaries to comply with these laws could subject us to civil and criminal penalties that could materially and adversely affect our business, financial condition, cash flows and results of operations.
We may incur penalties and experience other adverse effects on our business as a result of possible EAR violations.
In 2012, we determined that our majority-owned subsidiary in the UAE had re-exported certain of our products to Syria, and we voluntarily reported these transactions to OEE. We also undertook remedial action to prevent any further such transactions, including auditing the subsidiary and notifying each of the subsidiary’s employees and distributors of the current U.S. sanctions and export control laws and asking that each distributor acknowledge the same. We also notified OFAC of our voluntary disclosure to the OEE. We received a warning letter from the OEE on January 6, 2014 stating that the OEE had closed its investigation, and that the OEE imposed no financial penalties. However, in the course of our internal investigation into compliance by our majority-owned subsidiary in the UAE with U.S. export control laws, we also determined that the subsidiary may have violated EAR anti-boycott laws by including a legend on invoices confirming that the corresponding goods did not contain materials of Israeli origin. A number of the invoices involved U.S.-origin goods. We voluntarily disclosed the potential violations to the U.S. Department of Commerce, Bureau of Industry and Security, Office of Antiboycott Compliance (“OAC”) and undertook remedial action to prevent any further inclusion of the legends on invoices.
11
Penalties for EAR violations can be significant and civil penalties can be imposed on a strict liability basis, without any showing of knowledge or willfulness. OFAC and OAC each have wide discretion to settle claims for violations. We believe that a penalty or penalties that would result in a material loss are reasonably possible. Irrespective of any penalty, we could suffer other adverse effects on our business as a result of any violations or the potential violations, including legal costs and harm to our reputation, and we also will incur costs associated with our efforts to improve our compliance procedures. We have not established a reserve for potential penalties. We do not know whether OFAC or OAC will assess a penalty or what the amount of any penalty would be, if a penalty or penalties were assessed. See Note 24, “Commitments and Contingencies” in our notes to Consolidated Financial Statements.
Our business is dependent upon certain licenses.
Products covering a significant portion of our net revenues are marketed under exclusive license agreements which grant us and/or our subsidiaries the rights to use certain intellectual property (trademarks, trade dress, names and likeness, etc.) in certain fields on a worldwide and/or regional basis. As of June 30, 2014, we maintained 34 brand license agreements, which collectively accounted for 60% of our net revenues in fiscal 2014. In addition to our brand licenses, we also have other arrangements in place granting us rights to use trademarks and certain other intellectual property in products marketed under both our licensed and owned brands. In fiscal 2014, our top six licensed brands collectively accounted for 43% of our net revenues, and each represented between 4% and 17% of net revenues. The termination of one or more of our brand license agreements or the renewal of a brand license agreement on less favorable terms could have a material adverse effect on our business, financial condition and results of operations. While we may enter into additional brand license agreements in the future, the terms of such brand license agreements may be less favorable than the terms of our existing brand license agreements.
We rely on our brand licensors to manage and maintain their brands. Many of our brand licenses are with celebrities whose public personae we believe are in line with our business strategy. Since we do not maintain control over such celebrities’ brand and image, however, they are subject to change at any time without notice, and there can be no assurance that these celebrity licensors will maintain the appropriate celebrity status or positive association among the consumer public to maintain sales of products bearing their names and likeness at the projected sales levels. Similarly, since we are not responsible for the brand or image of our designer licensors, sales of related products or projected sales of related products could suffer if the designer suffers a general decline in the popularity of its brands due to mismanagement, changes in fashion or consumer preferences, or other factors beyond our control.
Our existing brand licenses run for varying periods with varying renewal options and may be terminated if certain conditions, such as royalty payments, are not met. These brand licenses impose various obligations on us which we believe are common to many licensing relationships in the beauty industry. These obligations include:
|
Ÿ
|
maintaining the quality of the licensed product and the applicable trademarks;
|
||
|
Ÿ
|
permitting the licensor’s involvement in and, in some cases, approval of advertising, packaging and marketing plans;
|
||
|
Ÿ
|
paying royalties at minimum levels and/or maintaining minimum sales levels;
|
||
|
Ÿ
|
promoting the sales of the licensed product actively;
|
||
|
Ÿ
|
spending a certain amount of net sales on marketing and advertising for the licensed product;
|
||
|
Ÿ
|
maintaining the integrity of the specified distribution channel for the licensed product;
|
||
|
Ÿ
|
expanding the sales of the product and/or the jurisdictions in which the product is sold;
|
||
|
Ÿ
|
agreeing not to enter into licensing arrangements with competitors of certain of our licensors;
|
||
|
Ÿ
|
indemnifying the licensor in the event of product liability or other claims related to our products;
|
||
|
Ÿ
|
limiting assignment and sub-licensing to third parties without the licensor’s consent; and
|
||
|
Ÿ
|
requiring, in some cases, notice to the licensor or its approval of certain changes in control.
|
||
If we breach any of these obligations or any other obligations set forth in any of our brand license agreements, our rights under the brand license agreements that we have breached could be terminated, which could have a material adverse effect on our business, financial condition and results of operations.
12
Our success is also partially dependent on the reputation of our brand licensors and the goodwill associated with their intellectual property. Our licensors’ reputation or goodwill may be harmed due to factors outside our control, which could have a material adverse effect on our business, financial condition and results of operations. In addition, in the event that any of our licensors were to enter bankruptcy proceedings, we could lose our rights to use the intellectual property that the applicable licensors license us to use.
If we are unable to obtain, maintain and protect our intellectual property rights, in particular trademarks, patents and copyrights, or if our brand partners and licensors are unable to maintain and protect their intellectual property rights that we use in connection with our products, our ability to compete could be negatively impacted.
Our intellectual property is a valuable asset of our business. For example, the market for our products depends to a significant extent upon the value associated with our product innovations and our owned and licensed brands. Although certain of our intellectual property is registered in the U.S. and in several of the foreign countries in which we operate, there can be no assurances with respect to the rights associated with such intellectual property in those countries, including our ability to register, use or defend key trademarks. We rely on a combination of trademark, trade dress, patent, copyright, unfair competition and trade secret laws, as well as confidentiality procedures and contractual restrictions, to establish and protect our proprietary rights. However, these laws, procedures and restrictions provide only limited and uncertain protection and any of our intellectual property rights may be challenged, invalidated, circumvented, infringed or misappropriated, including by counterfeiters as discussed under “—The illegal distribution and sale by third parties of counterfeit versions of our products could have a negative impact on our reputation and business,” which could adversely affect our competitive position or ability to sell our products. In addition, our intellectual property portfolio in many foreign countries is less extensive than our portfolio in the U.S., and the laws of foreign countries, including many emerging markets in which we operate, such as China, may not protect our intellectual property rights to the same extent as the laws of the U.S. The costs required to protect our trademarks and patents may be substantial.
In addition, we may fail to apply for, or be unable to obtain, intellectual property protection for certain aspects of our business. For example, we cannot provide assurance that our applications for patents, trademarks and other intellectual property rights will be granted, or, if granted, will provide meaningful protection. In addition, third parties have in the past and could in the future bring infringement, invalidity, co-inventorship, re-examination, opposition or similar claims with respect to any of our current trademarks, patents and copyrights, or any trademarks, patents or copyrights that we may seek to obtain in the future. Any such claims, whether or not successful, could be extremely costly to defend, divert management’s attention and resources, damage our reputation and brands, and substantially harm our business and results of operations. Even if we have an agreement to indemnify us against such costs, the indemnifying party may be unable to uphold its contractual obligations. Furthermore, patent expirations may affect our business and operating results. As patents expire, competitors may be able to legally produce and market products similar to ours, which could have a material adverse effect on our sales and results of operations.
In order to protect or enforce our intellectual property and other proprietary rights, or to determine the enforceability, scope or validity of the intellectual or proprietary rights of others, we may initiate litigation or other proceedings against third parties, such as infringement suits, opposition proceedings or interference proceedings. Any lawsuits or proceedings that we initiate could be expensive, take significant time and divert management’s attention from other business concerns. Litigation and other proceedings also put our intellectual property at risk of being invalidated or interpreted narrowly. Additionally, we may provoke third parties to assert claims against us. We may not prevail in any lawsuits or other proceedings that we initiate and the damages or other remedies awarded, if any, may not be commercially valuable. The occurrence of any of these events may have a material adverse effect on our business, financial condition and results of operations.
In addition, many of our products bear, and the value of our brands is affected by, the trademarks and other intellectual property rights of our brand partners and licensors. Our brand partners’ and licensors’ ability to maintain and protect their trademark and other intellectual property rights is subject to risks similar to those described above with respect to our intellectual property. We do not control the protection of the trademarks and other intellectual property rights of our brand partners and licensors and cannot ensure that our brand partners and licensors will be able to secure or protect their trademarks and other intellectual property rights. The loss of any of our significant owned or licensed trademarks, patents, copyrights or other intellectual property in any jurisdiction where we conduct a material portion of our business or where we plan geographic expansion could have a material adverse effect on our business, financial condition and results of operations.
Our success depends on our ability to operate our business without infringing, misappropriating or otherwise violating the trademarks, patents, copyrights and proprietary rights of other parties.
13
Our commercial success depends at least in part on our ability to operate without infringing, misappropriating or otherwise violating the trademarks, patents, copyrights and other proprietary rights of others. However, we cannot be certain that the conduct of our business does not and will not infringe, misappropriate or otherwise violate such rights. Many companies have employed intellectual property litigation as a way to gain a competitive advantage, and to the extent we gain greater visibility and market exposure as a public company, we may also face a greater risk of being the subject of such litigation. For these and other reasons, third parties may allege that our products, services or activities infringe, misappropriate or otherwise violate their trademark, patent, copyright or other proprietary rights. Defending against allegations and litigation could be expensive, take significant time, divert management’s attention from other business concerns, and delay getting our products to market. In addition, if we are found to be infringing, misappropriating or otherwise violating third party trademark, patent, copyright or other proprietary rights, we may need to obtain a license, which may not be available on commercially reasonable terms or at all, or redesign or rebrand our products, which may not be possible. We may also be required to pay substantial damages or be subject to a court order prohibiting us and our customers from selling certain products or engaging in certain activities. Our inability to operate our business without infringing, misappropriating or otherwise violating the trademarks, patents, copyrights and proprietary rights of others could therefore have a material adverse effect on our business, financial condition and results of operations.
Our goodwill and other assets have been subject to impairment and may continue to be subject to impairment in the future.
We are required, at least annually, or as facts and circumstances warrant, to test goodwill and other assets to determine if impairment has occurred. Impairment may result from any number of factors, including adverse changes in assumptions used for valuation purposes, such as actual or projected net revenue growth rates, profitability or discount rates, or other variables. If the testing indicates that impairment has occurred, we are required to record a non-cash impairment charge for the difference between the carrying value of the goodwill or other assets and the implied fair value of the goodwill or the fair value of other assets in the period the determination is made. We cannot always accurately predict the amount and timing of any impairment of assets. Should the value of goodwill or other assets become impaired, it would have an adverse effect on our financial condition and results of operations. During fiscal 2014 and fiscal 2012 we recorded asset impairment charges of $316.9 million and $575.9 million, respectively. The fiscal 2014 impairment charge of $60.5 million primarily related to TJoy’s trademark, customer relationships and manufacturing facility. The fiscal 2012 impairment charges primarily included trademark impairment charges of $58.0 million on TJoy’s tradenames and $130.6 million on Philosophy’s tradenames. Additionally, goodwill impairment charges of $256.4 on our Beauty - Skin & Body Care reporting unit were included in the fiscal 2014 impairment charges and goodwill impairment charges of $384.4 million on our Prestige - Skin & Body Care reporting unit were included in the fiscal 2012 impairment charges. These asset impairment charges are described under Item 7, “Management’s Discussion and Analysis of Financial Condition and Results of Operations —Results of Operations —Operating Income —Adjusted Operating Income —Asset Impairment Charges.”
The purchase price of future acquisitions may not be representative of the operations acquired.
During the past several years, we have taken advantage of selected acquisition opportunities that we believed would complement our current product offerings, expand our distribution channels, increase the size and geographic scope of our operations or otherwise offer operating efficiency opportunities and growth potential. Among other acquisitions in fiscal 2011, we acquired 100% of TJoy for a total cash purchase price of $351.7 million and 100% of Philosophy for $929.7 million cash, each via a stock purchase. Both of these acquisitions resulted in impairment charges. In fiscal 2014, we incurred asset impairment charges of $316.9 million, representing the write-off of goodwill, identifiable intangible assets and certain tangible assets with respect to our Beauty - Skin & Body Care reporting unit. These impairment charges were driven by TJoy, where cash outflows significantly exceeded management expectations notwithstanding the reorganization of the management team and distribution network and the launch of new product offerings. TJoy also incurred a trademark impairment charge of $58.0 million in fiscal 2012, resulting from business performance that was impacted by the departure of key employees and the related transition to new leadership. In fiscal 2012, we also incurred a trademark impairment charge of $130.6 on Philosophy’s tradenames and a goodwill impairment charge of $384.4 million on our Prestige - Skin & Body Care reporting unit. These charges were both related to our Philosophy acquisition and were caused by lower than projected net revenues from
philosophy
in the U.S. market due to an innovation plan that was less successful than expected and a slowdown of brand sales momentum in certain key retailers, delays in planned expansion of the Philosophy business in certain international markets and a delay in anticipated cost savings associated with consolidating Philosophy’s operations into our existing operations.
We are not aware of any other impairments at this time, and we cannot accurately predict the amount and timing of any other such impairments, if any. We may experience subsequent impairment charges with respect to goodwill, intangible assets or other items, as we did in fiscal years 2014 and 2012. It is possible that future acquisitions may result in acquisition of additional goodwill and/or other intangible assets. Any such goodwill or assets acquired may become subject to impairment,
14
which would reflect that the purchase price paid or owed with respect to such acquisitions is not representative of the operations or business acquired, which could have an adverse effect on our financial condition and results of operations.
A general economic downturn, the debt crisis and economic environment in Europe or a sudden disruption in business conditions may affect consumer purchases of our products, which could adversely affect our financial results.
The general level of consumer spending is affected by a number of factors, including general economic conditions, inflation, interest rates, energy costs and consumer confidence, each of which is beyond our control. Consumer purchases of discretionary items tend to decline during recessionary periods and otherwise weak economic environments, when disposable income is lower, and may impact sales of our products. For example, our net revenues declined in the 2008-09 economic downturn, and our fiscal 2014 net revenues were affected by a slowdown in the U.S. beauty market in the segments in which we compete, particularly in the mass channel. Global events beyond our control may impact our business, operating results and financial condition.
Weak economic environments in Europe, the U.S. and elsewhere could affect the demand for our products and may result in longer sales cycles, slower acceptance of new products and increased competition for sales. For example, the weak economic environment in the U.S. and Europe has contributed to declines in the fragrances segment and nail category in the combined region. Deterioration of economic conditions in Europe or elsewhere could also impair collections on accounts receivable. In addition, sudden disruptions in business conditions, for example, as a consequence of events such as a pandemic, or as a result of a terrorist attack, retaliation or the threat of further attacks or retaliation, or as a result of adverse weather conditions or climate changes, can have a short- and, sometimes, long-term impact on consumer spending. Events that impact consumers’ willingness or ability to travel and/or purchase our products while traveling have impacted our travel retail business, and may continue to do so in the future. A downturn in the economies in which we sell our products or a sudden disruption of business conditions in those economies where our travel retail business is located could adversely affect our net revenues and profitability.
If consumer purchases decrease, we may not be able to generate enough cash flow to meet our obligations and commitments. If we cannot generate sufficient cash flow from operations to service our debt, we may need to refinance our debt, dispose of assets or issue equity to raise necessary funds. We cannot predict whether we would be able to undertake any of these actions to raise funds on a timely basis or on satisfactory terms.
A sudden disruption in business conditions or a general economic downturn may affect the financial strength of our customers that are retailers, which could adversely affect our financial results.
A decline in consumer purchases tends to impact our retailer customers. The financial difficulties of a retailer could cause us to curtail or eliminate business with that customer. We may also decide to assume more credit risk relating to the receivables from that retailer. Our inability to collect receivables from one of our largest customers that is a retailer, or from a group of these customers, could have a material adverse effect on our business, results of operations and financial condition. If a retailer were to go into liquidation, we could incur additional costs if we choose to purchase the retailer’s inventory of our products to protect brand equity.
Volatility in the financial markets could have a material adverse effect on our business.
While we currently generate significant cash flows from our ongoing operations and have access to global credit markets through our various financing activities, credit markets may experience significant disruptions. Deterioration in global financial markets could make future financing difficult or more expensive. If any financial institutions that are parties to our credit facility or other financing arrangements, such as interest rate or foreign currency exchange hedging instruments, were to declare bankruptcy or become insolvent, they may be unable to perform under their agreements with us. This could leave us with reduced borrowing capacity or could leave us unhedged against certain interest rate or foreign currency exposures, which could have an adverse impact on our business, financial condition and results of operations. In addition, the cost of certain items required by our operations, such as raw materials, transportation and freight, may be affected by changes in the value of the relevant currencies in which their price or cost is quoted or analyzed. We hedge certain exposures to foreign currency exchange rates arising in the ordinary course of business in order to mitigate the effect of such fluctuations.
Our debt facilities require us to comply with specified financial covenants that may restrict our current and future operations and limit our flexibility and ability to respond to changes or take certain actions.
We remain dependent upon others for our financing needs, and our debt agreements contain restrictive covenants. Our principal credit facility and the agreement governing our private placement of notes each contains covenants requiring us to
15
maintain specific financial ratios and contain certain restrictions on us with respect to guarantees, liens, sales of certain assets, consolidations and mergers, affiliate transactions, indebtedness, dividends and other distributions and changes of control. There is a risk that these covenants could constrain execution of our business strategy and growth plans, including acquisitions. Should we decide to pursue an acquisition that requires financing that would result in a violation of our existing debt covenants, refusal of our current lenders to permit waivers or amendments to our existing covenants could delay or prevent consummation of our plans. This principal credit facility will expire in April 2018 and the notes are due in 2017, 2020 and 2022. There is no assurance that alternative financing or financing on as favorable terms will be found when these agreements expire.
We are subject to risks related to our international operations.
We operate on a global basis, and the majority of our fiscal 2014 net revenues was generated outside the U.S. We maintain offices in over 40 countries and have key operational facilities located outside the U.S. that manufacture, warehouse or distribute goods for sale throughout the world. As of June 30, 2014, approximately 71% of our total net revenues, and approximately 21% of our long-lived assets were attributable to our foreign operations. Non-U.S. operations are subject to many risks and uncertainties, including:
|
Ÿ
|
fluctuations in foreign currency exchange rates, which have affected and may in the future affect our results of operations, reported earnings, the value of our foreign assets, the relative prices at which we and foreign competitors sell products in the same markets and the cost of certain inventory and non-inventory items required by our operations;
|
||
|
Ÿ
|
changes in foreign laws, regulations and policies, including restrictions on foreign investment, trade, import and export license requirements, quotas, trade barriers and other protection measures imposed by foreign countries, and tariffs and taxes, as well as changes in U.S. laws and regulations relating to foreign trade and investment;
|
||
|
Ÿ
|
difficulties and costs associated with complying with, and enforcing remedies under, a wide variety of complex domestic and international laws, treaties and regulations, including the FCPA, and different regulatory structures and unexpected changes in regulatory environments;
|
||
|
Ÿ
|
lack of well-established or reliable legal and administrative systems;
|
||
|
Ÿ
|
failure to effectively and immediately implement processes and policies across our diverse operations and employee base; and
|
||
|
Ÿ
|
adverse weather conditions, social and economic conditions, terrorist attacks, war or other military action or violent revolution, such as recent events in Ukraine and Russia and the Middle East, and other geopolitical conditions.
|
||
We intend to reinvest undistributed earnings and profits from our foreign operations indefinitely, except where we are able to repatriate these earnings to the U.S. without material incremental tax expenditures. Any repatriation of funds currently held in foreign jurisdictions may result in higher effective tax rates. In addition, there have been proposals to change U.S. tax laws that would significantly impact how U.S. multinational corporations are taxed on foreign earnings. We cannot predict whether or in what form this proposed legislation may pass. If enacted, such legislation could have a material adverse impact on our tax expense and cash flow. Further, certain U.S. tax provisions are due to expire within the next year that, if not extended, could materially and adversely affect the tax positions of many U.S. multinationals, including ourselves.
Substantially all of our cash and cash equivalents that result from these earnings remain outside the U.S. As of June 30, 2014, 2013 and 2012, cash and cash equivalents in foreign operations included $1.233 billion, $914.2 million and $605.0 million, or 99.6%, 99.3% and 99.2% of aggregate cash and cash equivalents, respectively.
We are also subject to the interpretation and enforcement by governmental agencies of other foreign laws, rules, regulations or policies, including any changes thereto, such as restrictions on trade, import and export license requirements, privacy and data protection laws, and tariffs and taxes, which may require us to adjust our operations in certain markets where we do business. We face legal and regulatory risks in the U.S. and, in particular, cannot predict with certainty the outcome of various contingencies or the impact that pending or future legislative and regulatory changes may have on our business. It is not possible to gauge what any final regulation may provide, its effective date or its impact at this time. These risks could have a material adverse effect on our business, prospects, financial condition and results of operations.
Fluctuations in currency exchange rates may negatively impact our financial condition and results of operations.
Exchange rate fluctuations may affect the costs that we incur in our operations. The main currencies to which we are exposed are the euro, the British pound, the Swiss franc, the Russian ruble, the Polish zloty, the Australian dollar and the Canadian dollar. The exchange rates between these currencies and the U.S. dollar in recent years have fluctuated significantly
16
and may continue to do so in the future. A depreciation of these currencies against the U.S. dollar will decrease the U.S. dollar equivalent of the amounts derived from foreign operations reported in our consolidated financial statements and an appreciation of these currencies will result in a corresponding increase in such amounts. The cost of certain items, such as raw materials, transportation and freight, required by our operations may be affected by changes in the value of the relevant currencies. To the extent that we are required to pay for goods or services in foreign currencies, the appreciation of such currencies against the U.S. dollar will tend to negatively impact our financial condition and results of operations.
Our failure to protect our reputation, or the failure of our partners to protect their reputations, could have a material adverse effect on our brand images.
Our ability to maintain our reputation is critical to our various brand images. Our reputation could be jeopardized if we fail to maintain high standards for product quality and integrity or if we, or the third parties with whom we do business, do not comply with regulations or accepted practices. Any negative publicity about these types of concerns may reduce demand for our products. Failure to comply with ethical, social, product, labor and environmental standards, or related political considerations, such as animal testing, could also jeopardize our reputation and potentially lead to various adverse consumer actions, including boycotts. Failure to comply with local laws and regulations, including applicable U.S. trade sanctions, to maintain an effective system of internal controls or to provide accurate and timely financial statement information could also hurt our reputation. See “—Our operations and acquisitions in certain foreign areas expose us to political, regulatory, economic and reputational risks” and “—We may incur penalties and experience other adverse effects on our business as a result of possible EAR violations.” We are also dependent on the reputations of our brand partners and licensors, which can be affected by matters outside of our control. Damage to our reputation or the reputations of our brand partners or licensors or loss of consumer confidence for any of these or other reasons could have a material adverse effect on our results of operations, financial condition and cash flows, as well as require additional resources to rebuild our reputation.
Our business is subject to seasonal variability.
Our sales generally increase during our second fiscal quarter as a result of increased demand by retailers associated with the holiday season. Accordingly, our financial performance, sales, working capital requirements, cash flow and borrowings generally experience variability during the three to six months preceding the holiday period. Any substantial decrease in net revenues, in particular during periods of increased sales due to seasonality, could have a material adverse effect on our financial condition, results of operations and cash flows.
We sell our products in a continually changing retail environment.
The retail industry, particularly in the U.S. and Europe, has continued to experience consolidation and other ownership changes, and the business environment for selling fragrances, color cosmetics, and skin & body care products may change further. During the last several years, significant consolidation has occurred. The trend toward consolidation, particularly in developed markets such as the U.S. and Western Europe, has resulted in us becoming increasingly dependent on key retailers that control a higher percentage of retail locations, including large-format retailers and consolidated entities that own retail chains in both the mass and prestige distribution channels, which have increased their bargaining strength. Major retailers may, in the future, continue to consolidate, undergo restructuring or realign their affiliations, which could decrease the number of stores that sell our products or increase ownership concentration within the retail industry. Further business combinations among retailers may impede our growth and the implementation of our business strategy. In addition, the highly competitive U.S. discount and drug store environment has resulted in financial difficulties and store closings for a number of retailers, several of whom have liquidated or been acquired as a result. In addition, during the first half of fiscal 2014, retailers, particularly in North America, reduced to a substantial extent their inventories of products, including our products. In fiscal 2014, no retailer accounted for more than 10% of our global net revenues; however, certain retailers accounted for more than 10% of net revenues within certain geographic markets, including the U.S.
This trend towards consolidation has also resulted in an increased risk related to the concentration of our customers with respect to which we do not have long-term sales agreements or other contractual assurances as to future sales. Accordingly, these customers could reduce their purchasing levels or cease buying products from us at any time and for any reason, which, in addition to a general deterioration of our customers’ business operations, could have a corresponding material adverse effect on our business.
As the retail industry changes, consumers may prefer to purchase their fragrances and cosmetics from other distribution channels than those we use, and we may not be as successful in penetrating those channels as we currently are in other channels, or as successful as our competitors are. For example, we have historically not sold products through the direct sales channel in the markets where it is significant, and we are less experienced in e-commerce, direct response and door-to-door
17
than in our more traditional distribution channels. Assuming e-commerce, direct response and door-to-door sales continue to grow worldwide, we will need to continue to develop strategies for these channels in order to remain competitive. If we are not successful in the direct sales channel, we may experience lower than expected revenues or be required to recognize impairments, as we did in the first year after our Philosophy acquisition. See “—Our goodwill and other assets have been subject to impairment and may continue to be subject to impairment in the future.”
In addition, as we expand into new markets, other distribution channels that we do not utilize may be more significant. Although we have been able to recognize and adjust to many such changes in the retail industry to date, we can make no assurance as to our ability to make such adjustments in the future or the future effect of any such changes, including any potential material adverse effect such changes could have on our business, results of operations and financial condition. This concern is also valid with respect to new markets with which we are less familiar.
A disruption in operations could adversely affect our business.
As a company engaged in manufacturing and distribution on a global scale, we are subject to the risks inherent in such activities, including industrial accidents, environmental events, strikes and other labor disputes, disruptions in supply chain or information systems, loss or impairment of key manufacturing sites, product quality control, safety, licensing requirements and other regulatory issues, as well as natural disasters, pandemics, border disputes, acts of terrorism, and other external factors over which we have no control. The loss of, or damage to, any of our manufacturing facilities or distribution centers could have a material adverse effect on our business, results of operations and financial condition.
Our decision to outsource certain functions means that we are dependent on the entities performing those functions.
As part of our long-term strategy, we are continually looking for opportunities to provide essential business services in a more cost-effective manner. In some cases, this requires the outsourcing of functions or parts of functions that can be performed more effectively by external service providers. We have outsourced significant portions of our logistics management for our European prestige and mass businesses and our U.S. mass business, as well as certain technology-related functions, to third-party service providers. The dependence on a third party could lessen our control over deliveries to our customers. For example, in the third quarter of fiscal 2013 we transitioned to a new third-party logistics provider in Europe, which negatively impacted our sales. While we believe we conduct appropriate due diligence before entering into agreements with outsourcing entities, the failure of one or more such entities to provide the expected services, provide them on a timely basis or provide them at the prices we expect, or the costs incurred in returning these outsourced functions to being performed under our management and direct control, may have a material adverse effect on our results of operations or financial condition.
Third-party suppliers provide, among other things, the raw materials used to manufacture our products, and the loss of these suppliers, damage to our third-party suppliers’ reputations or a disruption or interruption in the supply chain may adversely affect our business.
We manufacture and package a majority of our products. Raw materials, consisting chiefly of essential oils, chemicals, containers and packaging components, are purchased from various third-party suppliers. The loss of multiple suppliers or a significant disruption or interruption in the supply chain could have a material adverse effect on the manufacturing and packaging of our products. Increases in the costs of raw materials or other commodities may adversely affect our profit margins if we are unable to pass along any higher costs in the form of price increases or otherwise achieve cost efficiencies in manufacturing and distribution. In addition, failure by our third-party suppliers to comply with ethical, social, product, labor and environmental laws, regulations or standards, such as conflict minerals requirements, or their engagement in politically or socially controversial conduct, such as animal testing, could negatively impact their reputations. Any of these failures or behaviors could lead to various adverse consequences, including damage to our reputation, decreased sales and consumer boycotts.
We are increasingly dependent on information technology, and if we are unable to protect against service interruptions, data corruption, cyber-based attacks or network security breaches, our operations could be disrupted.
We rely on information technology networks and systems, including the Internet, to process, transmit and store electronic and financial information, to manage a variety of business processes and activities, and to comply with regulatory, legal and tax requirements. We also depend on our information technology infrastructure for digital marketing activities and for electronic communications among our locations, personnel, customers and suppliers around the world. These information technology systems, some of which are managed by third parties that we do not control, may be susceptible to damage, disruptions or shutdowns due to failures during the process of upgrading or replacing software, databases or components thereof, power outages, hardware failures, computer viruses, attacks by computer hackers, telecommunication failures, user errors or
18
catastrophic events. If our information technology systems suffer severe damage, disruption or shutdown and our business continuity plans do not effectively resolve the issues in a timely manner, our product sales, financial condition and results of operations may be materially and adversely affected, and we could experience delays in reporting our financial results.
In addition, if we are unable to prevent security breaches, we may suffer financial and reputational damage or penalties because of the unauthorized disclosure of confidential information belonging to us or to our partners, customers or suppliers. In addition, the unauthorized disclosure of nonpublic sensitive information could lead to the loss of intellectual property or damage our reputation and brand image or otherwise adversely affect our ability to compete.
Our success depends, in part, on our employees.
Our success depends, in part, on our ability to retain our employees, including our key personnel, such as our executive officers and senior management team and our research and development and marketing personnel. The unexpected loss of one or more of our key employees could adversely affect our business. Our success also depends, in part, on our continuing ability to identify, hire, train and retain other highly qualified personnel. Competition for these employees can be intense, and although our key personnel have signed non-compete agreements, it is possible that these agreements would be unenforceable in some jurisdictions, permitting employees in those jurisdictions to transfer their skills and knowledge to the benefit of our competitors with little or no restriction. We may not be able to attract, assimilate or retain qualified personnel in the future, and our failure to do so could adversely affect our business. These risks may be exacerbated by the stresses associated with the implementation of our strategic plan, our recently announced reorganization, recent changes in our senior management team and other initiatives.
Our success depends, in part, on the quality, efficacy and safety of our products.
Product safety or quality failures, actual or perceived, or allegations of product contamination, even when false or unfounded, or inclusion of regulated ingredients could tarnish the image of our brands and could cause consumers to choose other products. Allegations of contamination or other adverse effects on product safety or suitability for use by a particular consumer, even if untrue, may require us from time to time to recall a product from all of the markets in which the affected production was distributed. Such issues or recalls could negatively affect our profitability and brand image.
If our products are perceived to be defective or unsafe, or if they otherwise fail to meet our consumers’ standards, our relationships with customers or consumers could suffer, the appeal of one or more of our brands could be diminished, and we could lose sales or become subject to liability claims. In addition, safety or other defects in our competitors’ products could reduce consumer demand for our own products if consumers view them to be similar. Any of these outcomes could result in a material adverse effect on our business, financial condition and results of operations.
Our success depends, in part, on our ability to successfully manage our inventories.
We currently engage in a program seeking to improve control over our inventories. This program has identified, and may continue to identify, inventories that are not saleable in the ordinary course, and that may have an adverse effect on our financial results. Moreover, there is no assurance that any inventory management program will be successful. If we misjudge consumer preferences or demands or future sales do not reach forecasted levels, we could have excess inventory that we may need to hold for a long period of time, write down, sell at prices lower than expected or discard. If we are not successful in managing our inventory, our business, financial condition and results of operations could be adversely affected.
Changes in laws, regulations and policies that affect our business or products could adversely affect our financial results.
Our business is subject to numerous laws, regulations and policies. Changes in the laws, regulations and policies, including the interpretation or enforcement thereof, that affect, or will affect, our business or products, including changes in accounting standards, tax laws and regulations, environmental or climate change laws, restrictions or requirements related to product content, labeling and packaging, regulations or accords, trade rules and customs regulations, and the outcome and expense of legal or regulatory proceedings, and any action we may take as a result, could adversely affect our financial results.
Our new product introductions may not be as successful as we anticipate, which could have a material adverse effect on our business, financial condition and/or results of operations.
We have a rigorous process for the continuous development and evaluation of new product concepts, led by executives in marketing, sales, research and development, product development, operations, law and finance. Each new product launch,
19
including those resulting from this new product development process, carries risks, as well as the possibility of unexpected consequences, including:
|
Ÿ
|
our advertising, promotional and marketing strategies for our new products may be less effective than planned and may fail to effectively reach the targeted consumer base or engender the desired consumption;
|
||
|
Ÿ
|
product purchases by our consumers may not be as high as we anticipate;
|
||
|
Ÿ
|
we may experience out-of-stocks and/or product returns exceeding our expectations as a result of our new product launches or retailer space reconfigurations or our net revenues may be impacted by retailer inventory management or changes in retailer pricing or promotional strategies;
|
||
|
Ÿ
|
we may incur costs exceeding our expectations as a result of the continued development and launch of new products, including, for example, advertising, promotional and marketing expenses, sales return expenses or other costs related to launching new products;
|
||
|
Ÿ
|
we may experience a decrease in sales of certain of our existing products as a result of newly-launched products; and
|
||
|
Ÿ
|
our product pricing strategies for new product launches may not be accepted by our retail customers or their consumers, which may result in our sales being less than anticipated.
|
||
The illegal distribution and sale by third parties of counterfeit versions of our products or the unauthorized diversion by third parties of our products could have a negative impact on our reputation and business.
Third parties may illegally distribute and sell counterfeit versions of our products, which may be inferior or pose safety risks. Consumers could confuse our products with these counterfeit products, which could cause them to refrain from purchasing our brands in the future and in turn could adversely affect our business. While many fragrance brands are distributed in either the prestige or mass market, over the past several years “prestige” brands have become increasingly available in other outlets through unauthorized means. The presence of counterfeit versions of our products in the market and of prestige products in mass distribution channels could also dilute the value of our brands or otherwise have a negative impact on our reputation and business.
We believe our trademarks, copyrights, patents, and other intellectual property rights are extremely important to our success and our competitive position. While we devote significant resources to the registration and protection of our intellectual property and the protection of our brand image and are aggressive in pursuing entities involved in the trafficking and sale of counterfeit products and the unauthorized diversion of our products, we have not been able to prevent, and may in the future be unable to prevent, the imitation and counterfeiting of our products, the infringement of our trademarks or the unauthorized diversion of our products. In recent years, there has been an increase in the availability of counterfeit goods, including fragrances, in various markets by street vendors and small retailers, as well as on the internet. There can be no assurance that counterfeiting of our products and the unauthorized diversion of our prestige products into mass distribution channels will not have an adverse impact on our business, prospects, financial condition or results of operations.
We are subject to environmental, health and safety laws and regulations that could affect our business or financial results.
We are subject to various foreign, federal, provincial, state, municipal and local environmental, health and safety laws and regulations relating to or imposing liability with respect to, among other things, the use, storage, handling, transportation and disposal of hazardous substances and wastes as well as the emission and discharge of such into the ground, air or water at our facilities or off-site, and the registration and evaluation of chemicals. Certain environmental laws and regulations also may impose liability for the costs of cleaning up contamination, without regard to fault, on current or previous owners or operators of real property and any person who arranges for the disposal or treatment of hazardous substances, regardless of whether the affected site is owned or operated by such person. We are currently involved in investigation or removal and/or remediation activities at certain sites. For example, prior to its acquisition by us, Del Labs sold its LaCross facility in Newark, New Jersey. The buyer gave Del Labs certain indemnities and agreed to remediate the property. Recently, Coty received a demand from the New Jersey Department of Environmental Protection (the “NJDEP”) to complete the remediation of the property. We are currently in discussions with the NJDEP. While there can be no assurances as to remediation costs, we do not expect the remediation to result in material expenditures. Third parties may also make claims for personal injuries and property damage associated with releases of hazardous substances from these or other sites in the future.
Environmental laws and regulations are complex, change frequently and have tended to become increasingly stringent and, as a result, environmental liabilities, costs or expenditures could adversely affect our financial results or results of operations.
20
We are involved in a class action lawsuit and other litigation matters that are expensive and time consuming, and, if resolved adversely, could harm our business, financial condition, or results of operations.
We are currently the subject of a stockholder class action suit in connection with our initial public offering. While we believe this lawsuit is without merit and intend to vigorously defend against it, there can be no assurances that a favorable final outcome will be obtained and defending any lawsuit is costly and can impose a significant burden on management and employees.
In addition to the class action lawsuit, we are involved in other lawsuits in the ordinary course of our business. Any litigation to which we are a party may result in an onerous or unfavorable judgment that may not be reversed upon appeal or in payments of substantial monetary damages or fines, or we may decide to settle lawsuits on similarly unfavorable terms, either of which could adversely affect our business, financial conditions, or results of operations.
Our stock repurchase program could affect our stock price and increase stock price volatility.
Any repurchases pursuant to our stock repurchase program initially announced on February 14, 2014 could affect our stock price and increase volatility. The existence of a stock repurchase program could potentially reduce the market liquidity for our stock. Additionally, we are permitted to and could discontinue our stock repurchase program at any time and any such discontinuation could cause the market price of our stock to decline.
We are controlled by JAB Holdings B.V. (“JAB”), Lucresca SE (formerly known as Donata Holdings SE, “Lucresca”), and Agnaten SE (formerly known as Parentes Holding SE, “Agnaten”). As a result of their control of us, they have the ability to prevent or cause a change in control or approve, prevent or influence certain actions by us.
As of August 28, 2014, we are controlled by JAB. Lucresca and Agnaten indirectly share voting and investment control over the shares held by JAB. JAB does not hold any of our Class A Common Stock, but holds 100% of our outstanding Class B Common Stock and 97% of the combined voting power of our outstanding common stock. Each share of our Class B common stock has ten votes per share, and our Class A Common Stock has one vote per share. As a result, JAB, Lucresca and Agnaten have the ability to exercise control over decisions requiring stockholder approval, including the election of directors, amendments to our Certificate of Incorporation and significant corporate transactions, such as a merger or other sale of the Company or its assets. JAB, Lucresca and Agnaten have the ability to make these decisions regardless of whether others believe that such change or transaction is in our best interests. So long as JAB or affiliates of JAB continue to beneficially own a sufficient number of shares of Class B Common Stock, even if they own significantly less than 50% of the shares of our outstanding common stock, they will continue to be able to effectively control stockholder decisions.
This concentration of ownership may have the effect of delaying, preventing or deterring a change in control of the Company, could deprive stockholders of an opportunity to receive a premium for their Class A Common Stock as part of a sale of the Company and may negatively affect the market price of our Class A Common Stock. Also, JAB and its affiliates are in the business of making investments in companies and may from time to time acquire and hold interests in businesses that compete indirectly with us. JAB or its affiliates may also pursue acquisition opportunities that are complementary to our business and, as a result, those acquisition opportunities may not be available to us.
We are a “controlled company” within the meaning of the New York Stock Exchange rules and, as a result, are relying on exemptions from certain corporate governance requirements that are designed to provide protection to stockholders of companies that are not “controlled companies”.
JAB, Lucresca and Agnaten collectively own more than 50% of the total voting power of our common shares and, as a result, we are a “controlled company” under the New York Stock Exchange (“NYSE”) corporate governance standards. As a controlled company, we are exempt under the NYSE standards from the obligation to comply with certain NYSE corporate governance requirements, including the requirements:
|
Ÿ
|
that a majority of our board of directors consists of independent directors;
|
||
|
Ÿ
|
that we have a nominating committee that is composed entirely of independent directors with a written charter addressing the committee’s purpose and responsibilities; and
|
||
|
Ÿ
|
that we have a compensation committee that is composed entirely of independent directors with a written charter addressing the committee’s purpose and responsibilities.
|
||
While we have voluntarily caused our Board to have a majority of independent directors, our Remuneration and Nomination Committee is not comprised solely of independent directors. As a result of our use of the “controlled company”
21
exemptions, investors will not have the same protection afforded to stockholders of companies that are subject to all of the NYSE corporate governance requirements.
Item 2.
Properties.
W
e occupy numerous offices, manufacturing and distribution facilities in the U.S. and abroad. Our principal executive office is located in New York, New York. We have five research and development facilities worldwide, located in the United States, Europe and China. We also operate manufacturing facilities in the United States, England, France, Spain and China. Effective fiscal 2012, we created a fragrance “Center of Excellence” for research and development and centralized global supply chain management in Geneva, Switzerland.
We consider our properties to be generally in good condition and believe that our facilities are adequate for our operations and provide sufficient capacity to meet anticipated requirements. The following table sets forth our principal owned and leased corporate, manufacturing and research and development facilities as of August 28, 2014. The leases expire at various times subject to certain renewal options at our option.
|
|
|
|
|
Location/Facility
|
|
Use
|
|
New York, New York (leased)
|
|
Corporate/Commercial
|
|
Phoenix, Arizona (multiple locations) (leased)
|
|
Manufacturing
|
|
North Hollywood, California (multiple locations) (leased)
|
|
Manufacturing/Commercial/R&D
|
|
Morris Plains, New Jersey (leased)
|
|
R&D
|
|
Sanford, North Carolina (owned)
|
|
Manufacturing
|
|
Ashford, England (land leased, building owned)
|
|
Manufacturing
|
|
Chartres, France (owned)
|
|
Manufacturing
|
|
Paris, France (2 locations) (leased)
|
|
Corporate/Commercial
|
|
Geneva, Switzerland (leased)
|
|
Corporate/Commercial/R&D
|
|
Monaco (2 locations) (leased)
|
|
Manufacturing/R&D
|
|
Granollers, Spain (owned)
|
|
Manufacturing
|
|
Jiangsu Province, China (land leased, building owned)
|
|
Manufacturing/Commercial/R&D
|
Item 3.
Legal Proceedings.
On June 28, 2013, we submitted our final voluntary disclosure to the U.S. Commerce Department’s Bureau of Industry and Security’s Office of Export Enforcement (“OEE”) which disclosed the results of our internal due diligence review conducted with the advice of outside counsel regarding certain export transactions from January 2008 through March 2012. In particular, we disclosed information relating to overall compliance with U.S. export control laws by our majority-owned subsidiary in the UAE, and the nature and quantity of its re-exports to Syria that we believe may constitute violations of the U.S. Export Administration Regulations (“EAR”). The disclosure addressed the above described findings and the remedial actions we have taken to date.
On January 6, 2014, we received a warning letter from the OEE stating that the bureau has closed its investigation of our final voluntary disclosure and determined not to pursue administrative or criminal prosecution even though the transactions violated EAR. The OEE imposed no financial penalties.
Our June 28, 2013 letter to OEE also disclosed that prior to January 2010 some of our subsidiary’s sales to Syria were made to a party that was designated as a target of U.S. economic sanctions by the U.S. Treasury Department’s Office of Foreign Assets Control (“OFAC”). We do not believe these sales constituted a violation of U.S. trade sanctions administered by OFAC, however, we also notified OFAC of our final voluntary disclosure to the OEE. We are working with OFAC to provide responses to any questions posed by to us by OFAC. OFAC continues to review our final voluntary disclosure. We cannot predict when OFAC will complete its review.
On June 28, 2013, we also voluntarily disclosed to the U.S. Department of Commerce’s Bureau of Industry and Security’s Office of Antiboycott Compliance (“OAC”) the final results of our internal due diligence review. In particular, we disclosed information relating to overall compliance with U.S. antiboycott laws by our majority-owned subsidiary in the UAE, including with respect to the former inclusion of a legend on invoices, confirming that the corresponding goods did not contain materials of Israeli origin. A number of the invoices involved U.S. origin goods. We believe the inclusion of this legend may constitute
22
violations of U.S. antiboycott laws. The disclosure addressed the above described findings and the remedial actions we have taken to date. OAC continues to review our voluntary disclosure. We cannot predict when OAC will complete its review.
Penalties for EAR violations can be significant and civil penalties can be imposed on a strict liability basis, without any showing of knowledge or willfulness. OFAC and OAC each have wide discretion to settle claims for violations. We believe that a penalty or penalties that would result in a material loss are reasonably possible. Irrespective of any penalty, we could suffer other adverse effects on our business as a result of any violations or the potential violations, including legal costs and harm to our reputation, and we also will incur costs associated with our efforts to improve our compliance procedures. We have not established a reserve for potential penalties. We do not know whether OFAC or OAC will assess a penalty or what the amount of any penalty would be, if a penalty or penalties were assessed. See “Risk Factors-We may incur penalties and experience other adverse effects on our business as a result of possible EAR violations” and Note 24, “Commitments and Contingencies” in our notes to Consolidated Financial Statements in fiscal 2014.
Earlier this year, two putative class action complaints were filed in the United States Southern District of New York against the Company, our directors and certain of our executive officers alleging violations of the federal securities laws in connection with our initial public offering (“IPO”). The first complaint, filed on February 13, 2014, was captioned Eugene Stricker vs. Coty Inc., et al. (the “Stricker Action”), while the second complaint, filed on February 21, 2014, was captioned Norman C. Carey vs. Coty Inc., et al. (the “Carey Action”).
The Stricker Action and the Carey Action have been consolidated under the caption In re Coty Inc. Securities Litigation, and following the court’s appointment of lead plaintiffs and lead counsel, a consolidated and amended complaint (the “Securities Complaint”) was filed on July 7, 2014. The Securities Complaint asserts claims against Coty Inc., its directors, certain of its executive officers, and the underwriters of the IPO under Sections 11, 12 and 15 of the Securities Act of 1933, as amended (the “Securities Act”), and seeks, on behalf of persons who purchased our Class A Common Stock in the IPO, damages of an unspecified amount and equitable or injunctive relief.
Our motion to dismiss is due on September 23, 2014. We believe the Securities Complaint is without merit and intend to vigorously defend it.
In addition, we are involved, from time to time, in litigation, other regulatory actions and other legal proceedings incidental to our business. Prior to its acquisition by Coty, Del Labs sold its LaCross facility in Newark, New Jersey. The buyer gave Del Labs certain indemnities and agreed to remediate the property. In May 2013, we received a demand from the New Jersey Department of Environmental Protection to complete the remediation of the property. We are currently in discussions with the NJDEP. While we cannot predict the outcome of the Newark matter, management believes that the outcome of this matter and other current litigation, regulatory actions and legal proceedings will not have a material effect upon our business, results of operations, financial condition or cash flows. However, management’s assessment of our current litigation, regulatory actions and other legal proceedings could change in light of the discovery of facts with respect to litigation, regulatory actions or other proceedings pending against us not presently known to us or determinations by judges, juries or other finders of fact which are not in accord with management’s evaluation of the possible liability or outcome of such litigation, regulatory actions and legal proceedings.
PART
II
Item 5.
Market for Registrant’s Common Equity, Related Stockholder Matters and Issuer Purchases of Equity Securities.
Market Information
Our Class A Common Stock is listed and publicly traded on the New York Stock Exchange (“NYSE”) under the symbol “COTY” as of June 13, 2013.
|
High
|
Low
|
Cash Dividends
|
||||||||||
|
July 1 – September 30, 2013
|
$
|
17.74
|
|
$
|
14.46
|
|
$
|
—
|
|
|||
|
October 1 – December 31, 2013
|
16.68
|
|
14.63
|
|
0.20
|
|
||||||
|
January 1 – March 31, 2014
|
15.92
|
|
12.83
|
|
—
|
|
||||||
|
April 1 – June 30, 2014
|
18.95
|
|
14.85
|
|
—
|
|
||||||
Our Common Stock was not listed on the New York Stock Exchange or any other exchange prior to June 13, 2013. Our Class B Common Stock is not listed or publicly traded on any exchange.
Stockholders of Record
23
As of June 30, 2014 there were 27 stockholders of record of our Class A Common Stock and one stockholder of record of our Class B Common Stock. The actual number of stockholders is greater than this number of record holders, and includes stockholders who are beneficial owners, but whose shares are held in street name by brokers and other nominees. This number of holders of record also does not include stockholders whose shares may be held in trust by other entities.
Dividend Policy
Subject to legally available funds, we intend to pay an annual cash dividend on our Class A Common Stock and Class B Common Stock in the second quarter of each fiscal year. Our ability to pay dividends has certain risks and limitations, and we cannot assure you that any dividends will be paid in the anticipated amounts and frequency, or at all. Our Board of Directors retains the right to change our intention to pay dividends at any time. The declaration and payment of all future dividends, if any, will be at the sole discretion of our Board of Directors.
In the second quarter of fiscal 2013, we declared a cash dividend of $0.15 per share, or approximately $57.8 million, on our then existing common stock, of which $57.4 million was paid in the second quarter of fiscal 2013. The remaining $0.4 million is paid as shares of restricted stock and restricted stock units vest or settle, as applicable.
In the first quarter of fiscal 2014, we declared a cash dividend of $0.20 per share, or approximately $77.6 million, on our Class A Common Stock and Class B Common Stock, of which $76.9 million was paid in the second quarter of fiscal 2014 to holders of record on October 11, 2013. The remaining $0.7 million is paid as shares of restricted stock and restricted stock units vest or settle, as applicable.
Market Performance Graph
Comparison of Cumulative 5 Year Total Return
(a)
Coty Inc., The S&P 500 Index, and Fiscal 2014 Peer Group
(b)
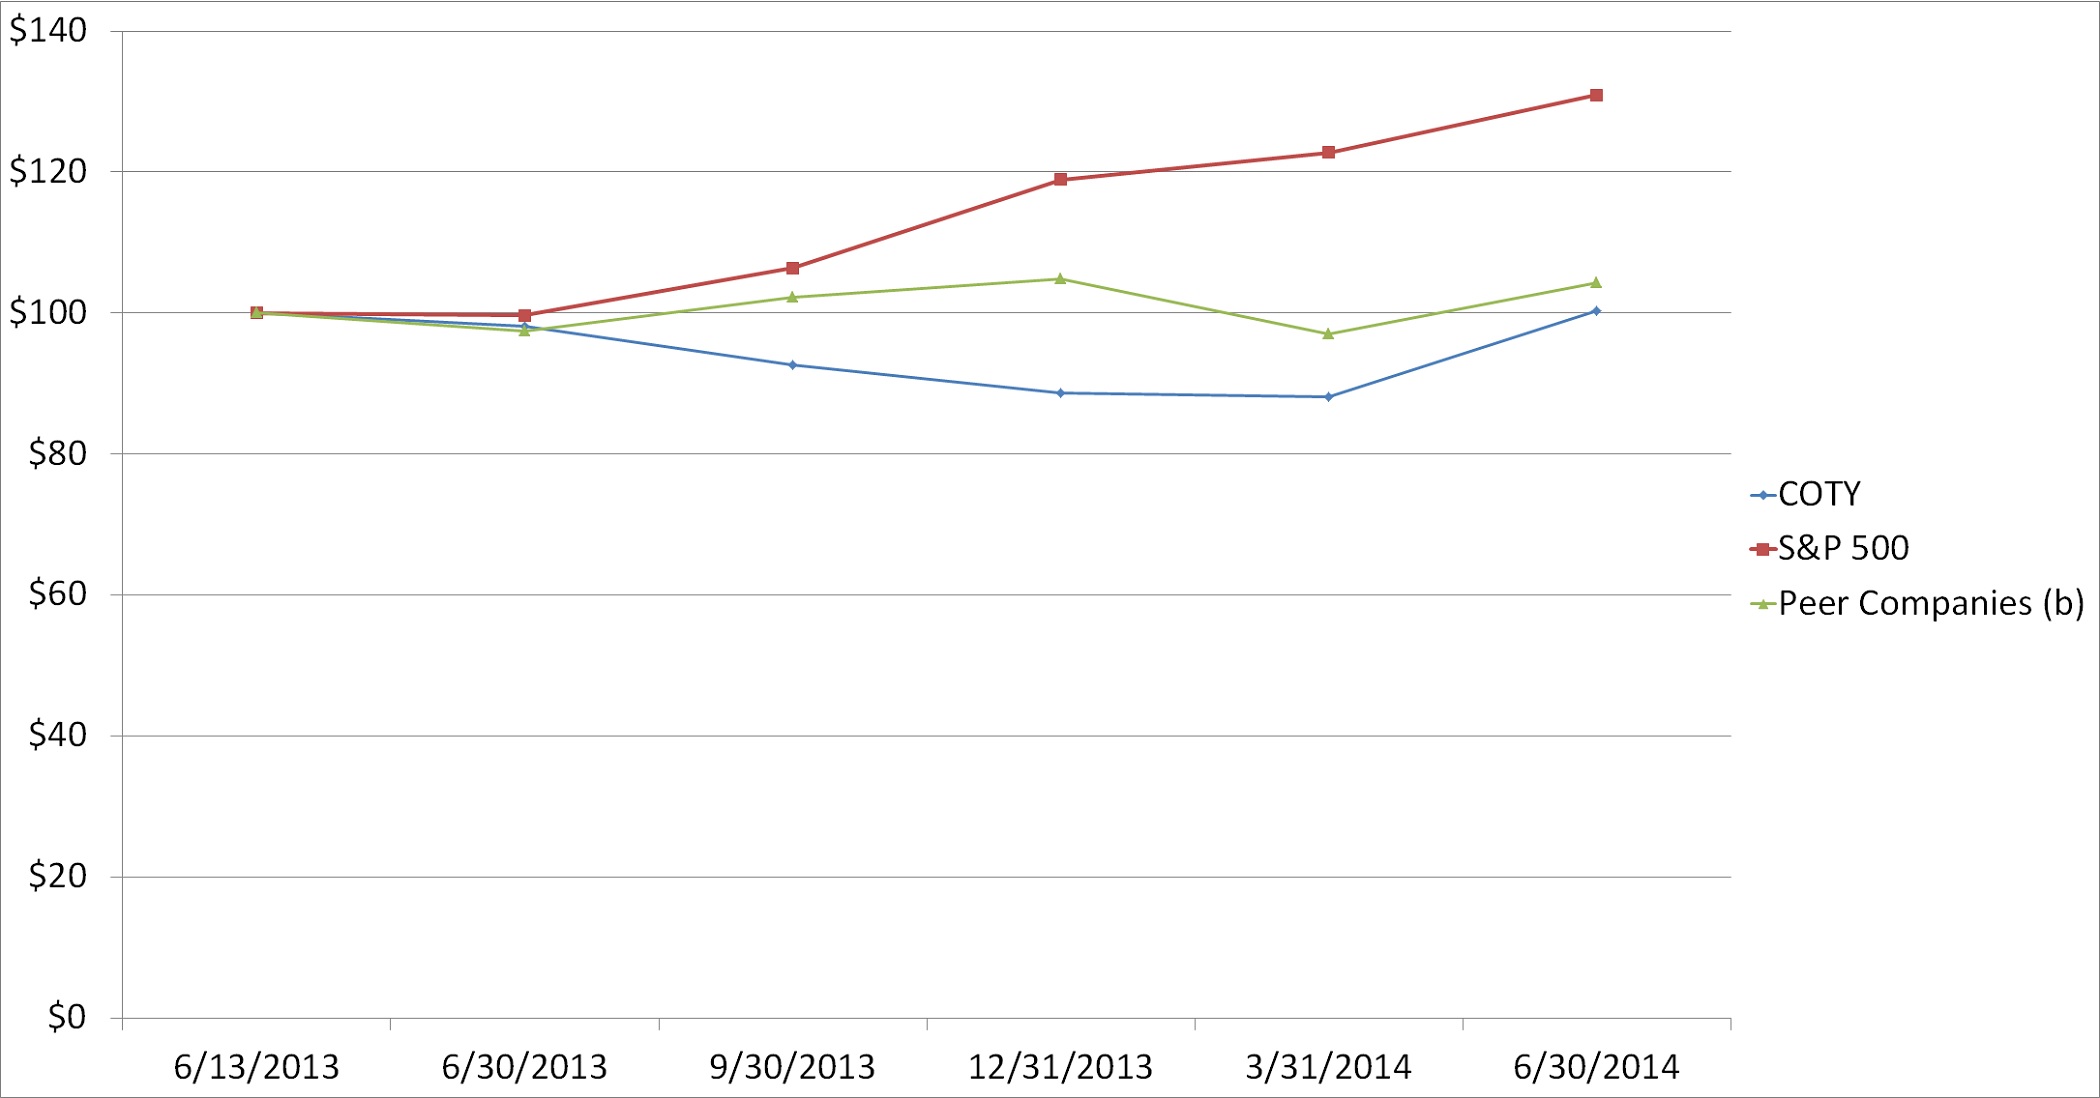
(a)
Total return assumes reinvestment of dividends at the closing price at the end of each quarter.
(b)
The Peer Group includes L'Oréal S.A., Avon Products, Inc., Estee Lauder Companies, Inc., Revlon, Inc., and Elizabeth Arden, Inc.
The Market Performance Graph above assumes a $100.00 investment on June 13, 2013, in Coty Inc.’s common stock (on the date the of the IPO), the S&P 500 Index and the Peer Group. The dollar amounts indicated in the graph above and in the chart below are as of the last trading day in the quarter.
24
Equity Compensation Plan Information
|
Plan Category
|
(a)
|
(b)
|
(c)
|
|||||||
|
Number of securities
to be issued upon
exercise of outstanding
options, warrants
and rights
|
Weighted-average
exercise price
of outstanding
options, warrants
and rights
|
Number of securities
remaining available
for future issuance
under equity
compensation plans
(excluding securities
reflected in column
(a)
)
|
||||||||
|
Equity compensation plans approved by security holders
|
|
|
|
|||||||
|
Options
|
18,416,694
|
|
$
|
9.17
|
|
|
||||
|
Restricted Stock Units
|
4,374,461
|
|
n/a
|
|
|
|||||
|
Subtotal
|
22,791,155
|
|
—
|
|
16,494,303
|
|
||||
|
Equity compensation plans not approved by security holders
|
|
|
|
|||||||
|
Options
(a)
|
4,756,022
|
|
$
|
9.89
|
|
—
|
|
|||
|
Subtotal
|
4,756,022
|
|
—
|
|
—
|
|
||||
|
Total
|
27,547,177
|
|
|
16,494,303
|
|
|||||
|
|
||||||||||||||||||
|
n/a
|
|
is not applicable
|
||||||||||||||||
|
|
||||||||||||||||||
|
(a)
|
|
Executive Ownership Plan
|
||||||||||||||||
|
|
|
From fiscal 2008 until December 2012, we invited certain key executives to purchase shares of our common stock, and receive stock options to match such purchases, through our Executive Ownership Plan. The Executive Ownership Plan was replaced by the Platinum Program in December 2012. Executives who participated in the Executive Ownership Plan could purchase an amount of restricted shares of our common stock, equal to their APP award for the prior fiscal year. If an executive purchased restricted shares under the Executive Ownership Plan, such executive would receive matching stock options. All matching stock options have five-year cliff vesting tied to continued employment with us and continued ownership of the restricted shares that the matching stock options match.
|
||||||||||||||||
Issuer Purchases of Equity Securities
The table below provides information with respect to repurchases of shares of our Class A Common Stock during the fiscal quarter ended June 30, 2014.
No shares of Class A Common Stock were repurchased during the month of May.
|
Period
|
Total Number of Shares Purchased
(a)
|
Average Price Paid per Share
(b)
|
Total Number of Shares Purchased as Part of Publicly Announced Plans or Programs
|
Approximate Dollar Value of Shares That May Yet be Purchased Under the Plans or Programs
(c)
|
||||
|
April 1 - April 30, 2014
|
2,123,983
(d)
|
$15.23
|
2,123,983
(d)
|
$300.0 million
|
||||
|
June 1 - June 30, 2014
|
27,952,604
(e)
|
$16.78
|
N/A
|
N/A
(e)
|
||||
(a)
During the three months ended June 30, 2014, we repurchased 30,076,587 shares of Class A Common Stock for approximately $501.4 million.
(b)
Includes fees and commissions.
(c)
Excludes fees and commissions.
(d)
These shares of Class A Common Stock were purchased for approximately $32.4 million under our publicly announced share repurchase program (the “Repurchase Program”) authorized by our Board of Directors on February 12, 2014. In the third quarter of fiscal 2014, the Company repurchased under the Repurchase Program 4,484,963 shares of Class A Common Stock for approximately $67.6 million. Our Board of Directors initially authorized our repurchase of shares of Class A Common Stock having an aggregate market value not exceeding $200.0 million, which was subsequently increased to $400.0 million on June 3, 2014. No time has been set for the completion of the Repurchase Program, and the Repurchase Program may be suspended or discontinued at any time. The timing and exact amount of any repurchases will depend on various factors, including ongoing assessments of the capital needs of our business, the market price of our Class A Common Stock, and general market conditions. The Repurchase Program may be executed through open market purchases or privately negotiated transactions, including pursuant to Rule 10b5-1 trading plans. As of June 30, 2014, approximately $300.0 million of authorized purchases remained under the Repurchase Program.
(e)
These shares of Class A Common Stock were purchased pursuant to a Stock Purchase Agreement, entered into on June 5, 2014 among the Company, Worldwide Beauty Offshore L.P. and Worldwide Beauty Onshore L.P., (together, "Rhône"), Berkshire Fund
25
VII, L.P., Berkshire Fund VII-A L.P., Berkshire Investors III LLC and Berkshire Investors IV LLC (together, “Berkshire”), M. Steven Langman and Bradley M. Bloom, under which we agreed to purchase all Class B Common Stock held by Rhône and Berkshire and all Class A Common Stock received by Mr. Langman and Mr. Bloom in their capacities as members of our board of directors (the “Purchased Shares”) for $16.78 per share, which was determined by calculating the volume weighted average price of the Company's Class A Common Stock from May 30, 2014 through June 5, 2014, inclusive. The fair value of Class B Common Stock and Class A Common Stock repurchased was $468.0 million and $1.0 million, respectively. The Purchased Shares that were shares of Class B Common Stock converted to shares of Class A Common Stock upon transfer.
Item 6.
Selected Financial Data.
|
(in millions, except per share data)
|
Year Ended June 30,
|
||||||||||||||||||
|
2014
|
2013
|
2012
|
2011
(a)
|
2010
|
|||||||||||||||
|
Consolidated Statements of Operations Data:
|
|||||||||||||||||||
|
Net revenues
|
$
|
4,551.6
|
|
$
|
4,649.1
|
|
$
|
4,611.3
|
|
$
|
4,086.1
|
|
$
|
3,482.9
|
|
||||
|
Gross profit
|
2,685.9
|
|
2,788.8
|
|
2,787.3
|
|
2,446.1
|
|
2,009.7
|
|
|||||||||
|
Asset impairment charges
|
316.9
|
|
1.5
|
|
575.9
|
|
—
|
|
5.3
|
|
|||||||||
|
Operating income (loss)
|
25.7
|
|
394.4
|
|
(209.5
|
)
|
280.9
|
|
184.5
|
|
|||||||||
|
Interest expense—related party
|
—
|
|
—
|
|
—
|
|
5.9
|
|
31.9
|
|
|||||||||
|
Interest expense, net
|
68.5
|
|
76.5
|
|
89.6
|
|
85.6
|
|
41.7
|
|
|||||||||
|
Other expense (income), net
|
1.3
|
|
(0.8
|
)
|
32.0
|
|
4.4
|
|
(8.8
|
)
|
|||||||||
|
(Loss) Income before income taxes
|
(44.1
|
)
|
318.7
|
|
(331.1
|
)
|
185.0
|
|
119.7
|
|
|||||||||
|
Provision (benefit) for income taxes
|
20.1
|
|
116.8
|
|
(37.8
|
)
|
95.1
|
|
32.4
|
|
|||||||||
|
Net (loss) income
|
(64.2
|
)
|
201.9
|
|
(293.3
|
)
|
89.9
|
|
87.3
|
|
|||||||||
|
Net income attributable to noncontrolling interests
|
17.8
|
|
15.7
|
|
13.7
|
|
12.5
|
|
11.9
|
|
|||||||||
|
Net income attributable to redeemable noncontrolling interests
|
15.4
|
|
18.2
|
|
17.4
|
|
15.7
|
|
13.7
|
|
|||||||||
|
Net (loss) income attributable to Coty Inc.
|
(97.4
|
)
|
168.0
|
|
(324.4
|
)
|
61.7
|
|
61.7
|
|
|||||||||
|
Per Share Data:
|
|||||||||||||||||||
|
Weighted-average common shares
|
|||||||||||||||||||
|
Basic
|
381.7
|
|
381.7
|
|
373.0
|
|
329.4
|
|
280.2
|
|
|||||||||
|
Diluted
|
381.7
|
|
396.4
|
|
373.0
|
|
339.1
|
|
280.2
|
|
|||||||||
|
Cash dividends declared per common share
|
$
|
—
|
|
$
|
0.15
|
|
$
|
—
|
|
$
|
0.10
|
|
$
|
—
|
|
||||
|
Net (loss) income attributable to Coty Inc. per common share:
|
|||||||||||||||||||
|
Basic
|
$
|
(0.26
|
)
|
$
|
0.44
|
|
$
|
(0.87
|
)
|
$
|
0.19
|
|
$
|
0.22
|
|
||||
|
Diluted
|
(0.26
|
)
|
0.42
|
|
(0.87
|
)
|
0.18
|
|
0.22
|
|
|||||||||
|
(in millions)
|
Year Ended June 30,
|
||||||||||||||||||
|
2014
|
2013
|
2012
|
2011
(a)
|
2010
|
|||||||||||||||
|
Consolidated Cash Flows Data:
|
|||||||||||||||||||
|
Net cash provided by operating activities
|
$
|
536.5
|
|
$
|
463.9
|
|
$
|
589.3
|
|
$
|
417.5
|
|
$
|
494.0
|
|
||||
|
Net cash (used in) investing activities
|
(257.6
|
)
|
(229.9
|
)
|
(333.9
|
)
|
(2,252.5
|
)
|
(149.9
|
)
|
|||||||||
|
Net cash (used in) provided by financing activities
|
(5.7
|
)
|
69.0
|
|
(97.7
|
)
|
1,903.8
|
|
(7.0
|
)
|
|||||||||
26
|
(in millions)
|
As of June 30,
|
||||||||||||||||||
|
2014
|
2013
|
2012
|
2011
(a)
|
2010
|
|||||||||||||||
|
Consolidated Balance Sheet Data:
|
|||||||||||||||||||
|
Cash and cash equivalents
|
$
|
1,238.0
|
|
$
|
920.4
|
|
$
|
609.4
|
|
$
|
510.8
|
|
$
|
387.5
|
|
||||
|
Total assets
|
6,592.5
|
|
6,470.0
|
|
6,183.4
|
|
6,813.9
|
|
3,781.8
|
|
|||||||||
|
Total debt
|
3,293.5
|
|
2,630.2
|
|
2,460.3
|
|
2,622.4
|
|
1,416.0
|
|
|||||||||
|
Total Coty Inc. stockholders’ equity
|
843.8
|
|
1,494.0
|
|
857.2
|
|
1,361.9
|
|
419.7
|
|
|||||||||
|
(a)
|
Fiscal 2011 data includes results from the acquisitions of TJOY Holdings Co., Ltd. (“TJoy”), Dr. Scheller Cosmetics AG, OPI Products, Inc., and Philosophy Acquisition Company, Inc. (“Philosophy”) as of the date of their respective acquisition during fiscal 2011.
|
Item 7.
Management’s Discussion and Analysis of Financial Condition and Results of Operations.
The following discussion and analysis of the financial condition and results of operations of Coty Inc. and its majority and wholly-owned subsidiaries, should be read in conjunction with the information contained in the Consolidated Financial Statements and related notes included elsewhere in this document. When used in this discussion, the terms “Coty,” the “Company,” “we,” “our,” or “us” mean, unless the context otherwise indicates, Coty Inc. and its majority and wholly-owned subsidiaries. The following discussion contains forward-looking statements. See “Special Note Regarding Forward-Looking Statements” and “Risk Factors” for a discussion on the uncertainties, risks and assumptions associated with these statements. Actual results may differ materially from those contained in any forward-looking statements. The following discussion includes certain non-GAAP financial measures. See “Overview—Non-GAAP Financial Measures” for a discussion of non-GAAP financial measures and how they are calculated.
All dollar amounts in the following discussion are in millions of United States (“U.S.”) dollars, unless otherwise indicated.
OVERVIEW
We are a leading global beauty company. We manufacture and market beauty products in the Fragrances, Color Cosmetics and Skin & Body Care segments with distribution in over 130 countries and territories across both prestige and mass markets. We continue to operate in a challenging market environment particularly in mass fragrance and color cosmetics with heightened promotional activities in mass retail in Western Europe and the U.S. A significant part of our strategy is to expand our geographic footprint into emerging markets and diversify our distribution channels within existing geographies to increase market presence. As part of our expansion efforts, we entered into agreements to broaden distribution in Asia, South Africa, Brazil, the United Kingdom (“U.K.”), and the United Arab Emirates (“U.A.E.”) during fiscal 2014 and our results from certain of these efforts reflect incremental net revenues from joint venture consolidations and conversion from third party to direct distribution in these geographies.
Non-GAAP Financial Measures
Adjusted Operating Income, Adjusted Income Before Income Taxes, Adjusted Net Income Attributable to Coty Inc. and Adjusted Net Income Attributable to Coty Inc. per Common Share are non-GAAP financial measures which we believe better enable management and investors to analyze and compare the underlying business results from period to period.
These non-GAAP financial measures should not be considered in isolation, or as a substitute for or superior to, financial measures calculated in accordance with GAAP. Moreover, these non-GAAP financial measures have limitations in that they do not reflect all the items associated with the operations of our business as determined in accordance with GAAP. We compensate for these limitations by analyzing current and future results on a GAAP basis as well as a non-GAAP basis, and we provide reconciliations from the most directly comparable GAAP financial measures to the non-GAAP financial measures. Our non-GAAP financial measures may not be comparable to similarly titled measures of other companies. Other companies, including companies in our industry, may calculate similarly titled non-GAAP financial measures differently than we do, limiting the usefulness of those measures for comparative purposes.
Adjusted Operating Income, Adjusted Income Before Income Taxes, Adjusted Net Income Attributable to Coty Inc. and Adjusted Net Income Attributable to Coty Inc. per Common Share provide an alternative view of performance used by management and we believe that an investor’s understanding of our performance is enhanced by disclosing these adjusted
27
performance measures. In addition, our financial covenant compliance calculations under our debt agreements are substantially derived from these adjusted performance measures. The following are examples of how these adjusted performance measures are utilized by management:
|
•
|
senior management receives a monthly analysis of our operating results that are prepared on an adjusted performance basis;
|
|
•
|
strategic plans and annual budgets are prepared on an adjusted performance basis; and
|
|
•
|
senior management’s annual compensation is calculated, in part, using adjusted performance measures.
|
Adjusted Operating Income
We define Adjusted Operating Income as operating income adjusted for the following:
|
•
|
Share-based compensation adjustment:
|
|
•
|
As of June 12, 2013, the effective date of the share-based compensation plan amendments, the share-based compensation expense adjustment represents the difference between equity plan accounting using the grant date fair value and equity plan accounting using the June 12, 2013 fair value. Prior to June 12, 2013, the share-based compensation expense adjustment represents the difference between share-based compensation expense accounted for under equity plan accounting based on grant date fair value, and under liability plan accounting based on reporting date fair value.
|
|
•
|
Future adjustments for share-based compensation will consist of the difference between expense under equity plan accounting based on the grant date fair value and total estimated share-based compensation expense, which is based on (i) the fair value on June 12, 2013 for nonqualified stock option awards and restricted stock units (“RSUs”) and (ii) all costs associated with the special incentive awards granted in fiscal 2012 and 2011. The estimated aggregate expense is approximately $12, $7, $2, and $0 for the fiscal years ended June 30, 2015, 2016, 2017, and 2018 respectively. Refer to “Management Discussion and Analysis of Financial Condition and Results of Operations—Critical Accounting Policies and Estimates” for a full discussion of the share-based compensation adjustment; and
|
|
•
|
Other adjustments, which include:
|
|
•
|
asset impairment charges;
|
|
•
|
restructuring costs and business structure realignment programs;
|
|
•
|
acquisition-related costs and certain acquisition accounting impacts; and
|
|
•
|
other adjustments that we believe investors may find useful.
|
Adjusted Net Income and Net Income per Common Share Attributable to Coty Inc.
We define Adjusted Net Income Attributable to Coty Inc. as net income attributable to Coty Inc. adjusted for the following:
|
•
|
adjustment made to reconcile operating income to Adjusted Operating Income, net of the income tax effect thereon (see Adjusted Operating Income);
|
|
•
|
certain interest and other (income) expense, net of the income tax effect thereon, that we do not consider indicative of our performance; and
|
|
•
|
certain tax effects that are not indicative of our performance.
|
Adjusted basic and diluted Net Income Attributable to Coty Inc. per Common Share is calculated as:
|
•
|
Adjusted Net Income Attributable to Coty Inc.
divided by
|
|
•
|
Adjusted weighted-average basic and diluted common shares using the treasury stock method.
|
Constant Currency
We operate on a global basis, with the majority of our net revenues generated outside of the U.S. Accordingly, fluctuations in foreign currency exchange rates can affect our results of operations. Therefore, to supplement financial results presented in accordance with GAAP, certain financial information is presented excluding the impact of foreign currency exchange translations to provide a framework for assessing how our underlying businesses performed excluding the impact of foreign currency exchange translations (“constant currency”). Constant currency information compares results between periods as if exchange rates had remained constant period-over-period. We calculate constant currency information by translating current and prior-period results for entities reporting in currencies other than U.S. dollars into U.S. dollars using constant foreign
28
currency exchange rates. The constant currency calculations do not adjust for the impact of revaluing specific transactions denominated in a currency that is different to the functional currency of that entity when exchange rates fluctuate. The constant currency information we present may not be comparable to similarly titled measures reported by other companies.
Marketing and Advertising Costs
Management reviews marketing and advertising costs on an aggregated basis, including trade marketing spend activities and advertising and consumer promotional costs, which are included as a reduction to gross revenue and in selling, general and administrative expenses, respectively, based on the counterparty. Marketing and advertising costs for the year ended
June 30, 2014
,
2013
and
2012
are presented below:
|
Year Ended June 30,
|
|||||||||||
|
2014
|
2013
|
2012
|
|||||||||
|
Trade marketing spend activities
|
$
|
492.9
|
|
$
|
502.1
|
|
$
|
519.5
|
|
||
|
% of Net revenues
|
10.8
|
%
|
10.8
|
%
|
11.3
|
%
|
|||||
|
Advertising and consumer promotional costs
|
1,070.0
|
|
1,072.3
|
|
1,085.8
|
|
|||||
|
% of Net revenues
|
23.5
|
%
|
23.1
|
%
|
23.5
|
%
|
|||||
|
Total marketing and advertising costs
|
$
|
1,562.9
|
|
$
|
1,574.4
|
|
$
|
1,605.3
|
|
||
|
% of Net revenues
|
34.3
|
%
|
33.9
|
%
|
34.8
|
%
|
|||||
NET REVENUES
In fiscal 2014, net revenues decreased 2%, or $97.5, to $4,551.6 from $4,649.1 in fiscal 2013. Foreign currency exchange translations had an immaterial impact on total net revenues.
The decrease was primarily the result of a decline in unit volume of 3% partially offset by a positive price and mix impact of 1%. In fiscal 2013, one of our licenses was divested and a certain North American service agreement expired and was not renewed (“2013 Ceased Activities”). The 2013 Ceased Activities had an immaterial impact on our consolidated results, however negatively affected the Fragrances segment, particularly in the Americas and EMEA. In the quarter ended June 30, 2014, we announced the discontinuation of our
TJoy
brand and the reorganization of our mass business in China, which resulted in a one-time charge related to product returns. This one-time charge had an immaterial impact on our consolidated results, h
owever it negatively affected primarily our Skin & Body Care segment in Asia Pacific. New launches represented approximately 15% of our net revenues for fiscal 2014. The contribution from new launches was partially offset by an approximate 16% decline in net revenues from existing products that are later in their life cycles.
In fiscal 2013, net revenues increased 1%, or $37.8, to $4,649.1 from $4,611.3 in fiscal 2012. Excluding the negative impact of foreign currency exchange translations, net revenues increased 2
%. The negative impact of foreign currency exchange translations primarily reflected the weakening of the Euro in fiscal 2013 compared to fiscal 2012.
New launches represented approximately 16% of our net revenues for fiscal 2013. The contribution from new launches was partially offset by an approximate 15% decline in net revenues from existing products that are later in their life cycles.
Net Revenues by Segment
|
Year Ended June 30,
|
Change %
|
||||||||||||||||
|
(in millions)
|
2014
|
2013
|
2012
|
2014/2013
|
2013/2012
|
||||||||||||
|
NET REVENUES
|
|||||||||||||||||
|
Fragrances
|
$
|
2,498.2
|
|
$
|
2,490.7
|
|
$
|
2,452.8
|
|
—
|
|
2
|
%
|
||||
|
Color Cosmetics
|
1,366.2
|
|
1,468.5
|
|
1,430.6
|
|
(7
|
%)
|
3
|
%
|
|||||||
|
Skin & Body Care
|
687.2
|
|
689.9
|
|
727.9
|
|
—
|
|
(5
|
%)
|
|||||||
|
Total
|
$
|
4,551.6
|
|
$
|
4,649.1
|
|
$
|
4,611.3
|
|
(2
|
%)
|
1
|
%
|
||||
Fragrances
In fiscal 2014, net revenues of Fragr
ances increased $7.5 to $2,498.2 from $2,490.7 in fiscal 2013. Foreign currency exchange translations had an immaterial impact on net revenues in Fragrances. An increase in
unit volume of 2%, which includes a negative impact on net revenues related to the 2013 Ceased Activities of 1%, was offset by a negative price and mix impact of 2%. Excluding t
he impact to net revenues from the 2013 Ceased Activities of 1%, net revenues of Fragrances
29
increased 1%
. Segment growth was primarily driven by incremental net revenues from the newly established brand
Katy Perry Killer Queen
and higher net revenues from
Calvin Klein
,
Davidoff
and
Roberto Cavalli
in part due to the launches of
Calvin Klein Downtown, Calvin Klein Endless Euphoria, Davidoff Cool Water Night Dive, Davidoff Cool Water Woman Sea Rose, Davidoff the Game, Roberto Cavalli Nero Assoluto
and
Just Cavalli for Him
. Power brands
Marc Jacobs
and
Chloé
also positively impacted segment results in part due to the launches of
Marc Jacobs Honey
,
Roses de
Chloé
and continued growth of
Marc Jacobs Daisy
. Also contributing to segment growth were higher net revenues from
David Beckham
,
Jil Sander, Guess
,
Botega Venetta
and
Nautica
. Partially offsetting the increase in the segment was a decline in net revenues from
Lady Gaga
,
Beyoncé
and
Vera Wang
in part due to a lower level of new launch activity for these brands in fiscal 2014 compared to fiscal 2013, the expiration of certa
in licenses and lower net revenues from existing celebrity brands that are later in their lifecycles. Power brand,
Playboy
, also negatively impacted segment results primarily due lower holiday customer orders in fiscal 2014 compared to fiscal 2013.
Segment growth reflects weak market conditions in developed markets that we expect to continue. T
he negative price and mix impact primarily reflects an increased level of promotional and discounted pricing activity in select developed markets, reflecting a competitive retail environment. Also contributing to lower price and mix was lower prices for select brands as we cascade them into different distribution channels in accordance with our strategy.
In fiscal 2013, net revenues of Fragrances increased 2%, or $37.9, to $2,490.7 from $2,452.8 in fiscal 2012. The increase was primarily the result of unit volume growth of 8%, partially offset by a negative price and mix impact of 5% and a negative impact of foreign currency exchange translations of 1%. Excluding the negative impact of foreign currency exchange translations, net revenues of Fragrances increased 3% reflecting our continued focus on introducing new products into the market. Segment growth was primarily driven by net revenues from newly-established brand
Lady Gaga Fame
, the strengthening of the
Roberto Cavalli
brand through new launches
Just Cavalli, Roberto Cavalli Acqua
and our special edition fragrance for the Middle East,
Roberto Cavalli Oud
, and growth in our power brands
Marc Jacobs
,
Chloé
, and
Playboy
driven by the successful new launches
DOT Marc Jacobs, See by
Chloé
and
Playboy
VIP
. The segment also benefited from the acquisition of licensing rights to distribute
Katy Perry
’s existing fragrance portfolio. Partially offsetting this growth were lower net revenues from brands such as
Calvin Klein
and
Davidoff
, primarily due to challenging market conditions in Southern Europe and a lower level of new launch activity in fiscal 2013 compared to fiscal 2012, the expiration of the
Kenneth Cole
license and lower net revenues from existing celebrity brands that are later in their life cycles. The negative price and mix impact primarily reflects higher relative volumes of lower-priced products for select brands and an overall increase in customer discounts and allowances in the segment.
Color Cosmetics
In
fiscal 2014, net revenues of Color Cosmetics decreased 7%, or $102.3, to $1,366.2 from $1,468.5 in fiscal 2013. Foreign curre
ncy exchange translations had an immaterial impact on net revenues in Color Cos
metics. The decrease was primarily the result of a decline in unit volume of 5% and a negative price and mix impact of 2%. Th
e decline in the segment was primarily driven by lower net revenues from nail products, in part reflecting continued declines since the first quarter of fiscal 2014 in the U.S. retail nail market. The
Sally Hansen
brand was the
largest contributor to the segment decline, in part due to lower net revenues from
Sally Hansen Insta Gel
and
Sally Hansen Salon Effects
nail products that generated stronger net revenues in fiscal 2013, partially offset by higher net revenues from new launches
Sally Hansen Triple Shine
,
Sally Hansen Miracle Gel
and
Sally Hansen I Heart Nail Art
in fiscal 2014. Also contributing to the decline in
Sally Hansen
was the impact of several key U.S. mass retailers significantly reducing their inventory on hand, particularly in the first quarter of fiscal 2014 in response to the sudden decline in consumer demand for nail products, resulting in lower replenishment orders in fiscal 2014 compared to fiscal 2013. Net revenues for
Sally Hansen
were also negatively affected by an increasingly competitive retail environment, decline in market share and the aforementioned weaker demand in the nail category in the U.S
. We expect weakness in the color cosmetics market in the U.S. to continue, including further reduction of inventory on hand by retailers. Lo
wer net revenues from
OPI
also contributed to the decline in the Color Cosmetics segment, reflecting a decline in the U.S. retail channel driven by lower net revenues of
Nicole by OPI
and the discontinuation of a particular product line sold exclusively by a large retailer. These decreases in
OPI
were partially offset by incremental net revenues attributable to new distribution through a professional salon chain in the U.S., incremental net revenues in the U.K. following the acquisition of a U.K. distributor and expanded distribution in Australia and our travel retail business. Partially offsetting the decline in the segment was an increase in
Rimmel
primarily reflecting strong growth of
Rimmel Scandal’eyes
mascara and
Rimmel Stay Matte
foundation. The negative price and mix impact for the segment was primarily driven by unit price declines in most key brands within the segment primarily driven by an increased level of highly promotional and discounted pricing activity, reflecting a competitive retail environment.
In fiscal 2013, net revenues of Color Cosmetics increased 3%, or $37.9, to $1,468.5 from $1,430.6 in fiscal 2012. The increase was primarily the result of unit volume growth of 4%, partially offset by a negative impact of foreign currency exchange translations of 1%. Excluding the negative impact of foreign currency exchange translations, net revenues of Color Cosmetics increased 4%, primarily driven by strong growth in
Rimmel
.
Rimmel
brand growth reflects the success of new launches
Rimmel Scandal’eyes
mascara and
Rimmel Apocalips
lip lacquer along with higher net revenues of
Rimmel Match
30
Perfection
foundation and
Rimmel Kate
lipstick. Higher net revenues in
Rimmel
also reflect expanded distribution in one of our key retailers in the U.S., expanded distribution in France and expansion in the pharmacy and discount department store retail channels in Australia. Growth in
N.Y.C. New York Color
and
Manhattan
also contributed to the increase in the Color Cosmetics segment. Higher net revenues in
N.Y.C. New York Color
were primarily driven by strong growth in the U.S. along with increased net revenues in Canada and certain EMEA markets, while the increase in
Manhattan
was driven by strong growth in Germany.
OPI
net revenues were in line with fiscal 2012 as higher net revenues from expanded distribution in Europe
and in our travel retail businesses in all three geographic regions was offset by a decline in the U.S. The decline in
OPI
in the U.S. reflects lower net revenues of
Nicole by OPI
and the discontinuation of a particular product line sold exclusively by a large retailer, along with lower net revenues of
OPI Shatter
and
OPI GelColor
which generated strong net revenues in fiscal 2012 as new launches.
Sally Hansen
net revenues were in line with fiscal 2012 as higher net revenues from the brand’s introduction into the German market along with strong net revenues growth in Mexico, Argentina and the U.K., primarily driven by new launches and expanded distribution, were offset by a decline in the U.S. Despite growth from our entry into the gel nail color category where
Sally Hansen
earned a market share lead, the brand declined in the U.S. in part due to an intensified competitive environment. Partially offsetting segment growth was a decline in
Astor
primarily driven by lower net revenues in Spain, reflecting difficult economic conditions, and in Germany, as results in fiscal 2012 reflected the rollout of the brand in one of our key customers.
Skin & Body Care
In fiscal 2014, net revenues of Skin & Body Care decreased $2.7, to $687.2 from $689.9 in fiscal 2013. Results were
primarily driven by a positive price and mix impact of 7% and a positive foreign currency exchange translations impact of 1%, offset by a decline in unit volume of 6% and a decline related to product returns associated with reorganization of our mass business in China of 2%. Excluding the impact to net revenues associated with the reorganization of our mass business in China and the positive impact of foreign currency exchange translations, net revenues of Skin & Body Care increased 1% driven by higher net revenues from
philosophy
,
Lancaster
and
adidas
. Net revenues from
philosophy
increased primarily due to higher net revenues in key distribution channels in the U.S., in part due to expanded distribution and new launches, and strong growth in Asia Pacific in part due to expanded distribution. Net revenues from
Lancaster
reflected strong growth primarily due to strong growth in sun care products and new launch
Lancaster Total Age Correction
, along with expanded distribution in China
.
Net revenues from
adidas
increased reflecting strong growth in emerging markets such as Southeast Asia, Brazil, China, and South Africa, partially offset by lower net revenues in developed markets such as the U.S., Germany, the Netherlands and Southern Europe in part due to an increased level of highly promotional and discounted pricing activity. Partially offsetting these increases in the segment were declines in
TJoy
reflecting weak demand for the products which led to our decision to discontinue the brand along with the one-time impact to net revenues associated with the discontinuation of the brand.
The positive price and mix impact for the segment was primarily driven by lower relative volumes of lower-priced
TJoy
products and higher relative volumes of higher-priced
philosophy
and
Lancaster
products.
In fiscal 2013, net revenues of Skin & Body Care decreased 5%, or $38.0, to $689.9 from $727.9 in fiscal 2012. The decrease was primarily the result of a decline in unit volume of 5% and a negative impact of foreign currency exchange translations of 1%, partially offset by a positive price and mix impact of 1%. Excluding the negative impact of foreign currency exchange translations, net revenues of Skin & Body Care decreased 4%. Lower net revenues in
TJoy
partially reflect the impact of a sales force reorganization that occurred in the first half of fiscal 2013 as well as reduced customer orders. Lower net revenues in
adidas
primarily reflected decreases in EMEA, in part due to the negative impact of foreign currency exchange translations, the challenging market conditions in Southern and Eastern Europe and the lack of mega promotions related to major sports events compared to fiscal 2012, which benefited from UEFA European Football Championship
promotional activities. Partially offsetting these declines was growth in the U.S., primarily due to the reintroduction of shower gels, body sprays and deodorants with a key customer in the market in January 2012, expansion in China, through the TJoy distribution channel and market-specific product introduction, and strong growth in Russia. The slight decline in
philosophy
was primarily due to lower net revenues in the U.S. from one of our key customers and the direct-to-consumer business, partially offset by increased net revenues from expanded international distribution. The
philosophy
brand gained some momentum in the fourth quarter of fiscal 2013 generating strong net revenues growth. Higher net revenues of
Lancaster
were driven by growth in sun care and skin care products primarily due to new launches and our efforts to develop a presence in China. The positive price and mix impact for the segment was primarily driven by positive product mix in
philosophy
, reflecting an increase in higher priced products.
Net Revenues by Geographic Regions
In addition to our reporting segments, management also analyzes our net revenues by geographic region. We define our geographic regions as Americas (comprising North, Central and South America), EMEA (comprising Europe, the Middle East and Africa) and Asia Pacific (comprising Asia and Australia).
31
|
Year Ended June 30,
|
Change %
|
||||||||||||||||
|
(in millions)
|
2014
|
2013
|
2012
|
2014/2013
|
2013/2012
|
||||||||||||
|
NET REVENUES
|
|||||||||||||||||
|
Americas
|
$
|
1,703.8
|
|
$
|
1,914.8
|
|
$
|
1,874.5
|
|
(11
|
%)
|
2
|
%
|
||||
|
EMEA
|
2,302.9
|
|
2,188.9
|
|
2,218.0
|
|
5
|
%
|
(1
|
%)
|
|||||||
|
Asia Pacific
|
544.9
|
|
545.4
|
|
518.8
|
|
—
|
|
5
|
%
|
|||||||
|
Total
|
$
|
4,551.6
|
|
$
|
4,649.1
|
|
$
|
4,611.3
|
|
(2
|
%)
|
1
|
%
|
||||
Americas
In fiscal 201
4, net revenues in the Americas decreased 11%, or $211.0, to $1,703.8 from $1,914.8 in fiscal 2013. Excluding the negative impact of foreign currency exchange translations of 1% and the impact of net revenues related to the 2013 Ceased Activities of 1%, net revenues in the Americas decreased 9% primarily driven by lower net revenues in the U.S. The decline in the U.S. was largely driven by lower net revenues in Color Cosmetics, primarily due to a decline in
Sally Hansen
and
OPI
as described under “Net Revenues by Segment—Color Cosmetics
” above, and Fragrances. The decline in Fragrances in the U.S. primarily reflects lower net revenues from
Lady Gaga, Beyoncé
and
Vera Wang,
in part due to a lower level of new launch activity in fiscal 2014 compared to fiscal 2013, the expiration of certain licenses, lower net revenues from existing celebrity brands that are later in th
eir lifecycles and a decline in mature products in our power brands
Playboy
,
Chloé
,
Calvin Klein
and
Davido
ff.
Results in the U.S. reflect weak market conditions and reduction of inventory on hand by retailers, which we expect to continue. Lo
wer net revenues from Canada also contributed to the decline in the region, in part reflecting a decrease in
Sally Hansen,
Lady Gaga
, due to a lower level of new launch activity in fiscal 2014 compared to fiscal 2013, and lower net revenues from fragrances in the prestige market.
Slightly offsetting the decline in the Americas were higher net revenues in Brazil, primarily reflecting the impact of our joint venture and commercial partnership established in fiscal 2013, and our travel retail business in th
e region, primarily due to growth from fragrances in the prestige market.
In fiscal 2013, net revenues in the Americas increased 2%, or $40.3, to $1,914.8 from $1,874.5 in fiscal 2012. Foreign currency exchange translations had an immaterial impact on net revenues in the Americas. The increase in net revenues reflects growth in virtually all countries in the region, with the largest increase in the U.S., followed by Latin America and Canada. Growth in the U.S. was primarily driven by higher net revenues in Fragrances and Color Cosmetics. Although the U.S. mass fragrance market continued to decline, our net revenues in the Fragrances segment in the mass distribution channel increased reflecting the new launch of
Lady Gaga Fame
along with incremental net revenues from the acquisition of licensing rights to distribute
Katy Perry
’s existing fragrance portfolio. Higher net revenues in the prestige distribution channel primarily reflect new launches
DOT Marc Jacobs, Encounter Calvin Klein, Calvin Klein Eternity Aqua for Her, Calvin Klein Dark Obsession
, and
See by
Chloé.
Partially offsetting this increase in Fragrances in the U.S. were lower net revenues due to the expiration of the
Kenneth Cole
license and lower net revenues from existing celebrity brands that are later in their life cycles. Higher net revenues in Color Cosmetics in the U.S. were primarily due to growth in
Rimmel
, in part due to increased distribution in one of our key retailers, and
N.Y.C. New York Color
, as the brand has benefited from its positioning in the growing entry level price point category. Partially offsetting this growth in Color Cosmetics were lower net revenues of
OPI
and
Sally Hansen
. Higher net revenues in Latin America reflect our strategy of accelerated growth in emerging markets. Increases in Mexico, Chile, Brazil and Argentina contributed to this growth. Growth in Canada is driven by higher net revenues in
Rimmel
, primarily due to successful new launches, and strong growth in Fragrances. Partially offsetting growth in the Americas were lower net revenues in our travel retail business in the region primarily due to stock reductions by key customers as a result of a slowdown in retail sales.
EMEA
In fiscal 2014, net revenues in EMEA increased 5%, or $114.0, to $2,302.9 from $2,188.9 in fiscal 2013. Excluding the positive impact of foreign currency exchange translations of 3% and the impact of net revenues related to the 2013 Ceased Activities of 1%, net revenues in EMEA increased 3%. Growth in EMEA was primarily driven by the U.K., Eastern Europe, the Middle East, where we have transitioned to a new U.A.E. joint venture, and our new subsidiary in South Africa, reflecting our strategy of expanding our geographic footprint into emerging markets. Higher net revenues in the U.K. reflected incremental net revenues from
OPI
resulting from the acquisition of a U.K. distributor and from newly-established brand
Katy Perry Killer Queen
, strong growth from
David Beckham
and
Rimmel
, along with the positive impact of foreign currency translations resulting from the improvement of the British Pound exchange rate. Higher net revenues in Eastern Europe primarily reflect strong growth in our power brands,
Calvin Klein
,
Rimmel
,
Davidoff
, and
adidas
, in addition to the positive impact of foreign currency exchange translations. Also generating strong growth were higher net revenues in our travel retail business in the
32
region driven by growth in Fragrances from new launches within the
Calvin Klein
,
Marc Jacobs
,
Davidoff, Jil Sander
and
Chloé
brands, along with higher net revenues due to expanded distribution of
OPI
. Net revenues in Germany and Southern Europe increased reflecting the positive impact from foreign currency exchange translations. Excluding the impact of foreign currency exchange translations and the net revenues related to the 2013 Ceased Activities, net revenues in Germany declined primarily due to lower net revenues from Color Cosmetics, in part due to a shift in the market towards value brands and the planned withdrawal of the
Rimmel
brand from the market, along with a decline in
adidas
.
Excluding the im
pact of foreign currency exchange translations, net revenues in Southern Europe declined primarily due to lower net revenues in part reflecting weak market trends. We do not anticipate the Southern European market conditions to improve in the foreseeable future. Partially offsetting growth in the region were lower net revenues in Russia, in part reflecting the negative impact of the devaluation of the Russian Ruble and a more challenging retail environment.
In fiscal 2013, net revenues in EMEA decreased 1%, or $29.1, to $2,188.9 from $2,218.0 in fiscal 2012. Excluding the negative impact of foreign currency exchange translations, net revenues in EMEA increased 1%. The U.K., the Middle East and Russia generated growth primarily reflecting new launches within the
Roberto Cavalli
brand, new launches
Lady Gaga Fame
and
DOT Marc Jacobs
and continued growth in
Rimmel
, partly offset by lower net revenues in
Calvin Klein
. Growth in Russia also reflects the introduction of
OPI
in the Russian retail market and growth in
adidas.
Results in the region were impacted by lower net revenues in our Southern European markets, particularly in Spain and Italy. The decline in Southern Europe primarily reflects difficult economic conditions, lower levels of new launch activity in Fragrances in fiscal 2013 compared to fiscal 2012 and declines in
adidas
and
Astor
. Net revenues in Germany, our largest market in the region, were negatively impacted by foreign currency translations. Excluding the impact of foreign currency translations, net revenues growth in Germany was strong, primarily reflecting higher net revenues in Fragrances and Color Cosmetics.
Asia Pacific
In fiscal 2014, net revenues in Asia Pacific decreased $0.5, to $544.9 from $545.4 in fiscal 2013. The negative impact of foreign currency exchange translations of approximately 4% was predominantly driven by the devaluation of the Australian Dollar and Japanese Yen. Excluding the impact to net revenues associated with the reorganization of our mass business in China of 3% and the negative impact of foreign currency exchange translations, net revenues in Asia Pacific increased 7%.
N
ew subsidiaries in Taiwan, Korea and Southeast Asia contributed incremental net revenue growth to the region. Higher net revenues in Hong Kong, Australia, Singapore and our travel retail business in the region also positively impacted results. Growth in Hong Kong and Singapore primarily reflected higher net
revenues in Fragrances while the increase in our travel retail business was primarily due to expanded distribution of
OPI
. Higher net revenues from Australia also positively impacted the region primarily reflecting strong growth in Fragrances,
Rim
mel
and incremental net revenues from the introduction of
OPI
, partially offset by the negative impact of foreign currency exchange translations. Results in the region were adversely impacted by lower net revenues in Japan and China. Lower net revenues in Japan primarily reflected the negative impact of foreign currency exchange translations as mentioned above. The decline in China was primarily driven by lower net revenues from
TJoy
, partially offset by growth in Fragrances,
adidas
and
Lancaster
. Excluding the impact associated with the reorganization of our mass business in China, net revenues in China increased primarily due to growth in Fragrances an
d
adidas
, despite overall deceleration in consumer demand particularly in the prestige distribution channel.
In fiscal 2013, net revenues in Asia Pacific increased 5%, or $26.6, to $545.4 from $518.8 in fiscal 2012. Foreign currency exchange translations had an immaterial impact on net revenues in Asia Pacific. Growth in Asia Pacific was driven by all countries in the region, with the exception of Japan and China. Higher net revenues in Australia led growth in the region primarily reflecting higher net revenues from the launch of
Lady Gaga Fame
and expanded distribution of certain fragrances into the pharmacy retail channel and
Rimmel
color cosmetics products into the pharmacy retail channel and discount department stores. Higher net revenues in Singapore and our travel retail business also contributed to growth in Asia Pacific. The increase in net revenues in Singapore primarily reflects growth in
Calvin Klein
along with expanded distribution of
philosophy
. Our travel retail business in the region primarily reflects higher net revenues from new launch
Lady Gaga Fame
, the introduction of
OPI
and
philosophy
, and higher net revenues of
Davidoff
and
Roberto Cavalli
, partially offset by lower net revenues of
Calvin Klein
. Lower net revenues in Japan were primarily driven by difficult economic conditions. The decline in China was primarily driven by lower net revenues of
TJoy
. Excluding net revenues of
TJoy
, net revenues growth in China was strong, primarily driven by
adidas
,
Lancaster
and
Calvin Klein
.
COST OF SALES
In fiscal 2014, cost of sales increased $5.4, to $1,865.7 from $1,860.3 in fiscal 2013. Cost of sales as a percentage of net revenues increased to 41.0% in fiscal 2014 from 40.0% in fiscal 2013, resulting i
n a gross margin decline of approximately 100 basis points. The decline in gross margin includes the impact of product returns and inventory obsolescence associated with the reorganization of our mass business in China and the revaluation of inventory acquired through business acquisitions.
33
Excluding the impact of these items on net revenues and cost of sales, gross margin declined approximately 40 basis points primarily reflecting the negative impact of higher customer discounts and allowances necessary to compete in the difficult market environment, reported in net revenues, and the negative impact of foreign currency exchange transactions, partially offset by continued contribution from our supply chain savings program, reported in cost of sales, and positive product mix. We expect a higher level of customer discounts and allowances to continue until there is improvement in the overall economic environment.
In fiscal 2013, cost of sales increased $36.3, to $1,860.3 from $1,824.0 in fiscal 2012. Cost of sales as a percentage of net revenues increased to 40.0% in fiscal 2013 from 39.6% in fiscal 2012, resulting in a gross margin decline of approximately 40 basis points. This decline in gross margin primarily reflects the negative impact of higher customer discounts and allowances necessary to compete in the difficult market environment, partially offset by continued contribution from our supply chain savings program. Since its implementation in fiscal 2010, the supply chain savings program has contributed to improvements in manufacturing costs resulting from more streamlined manufacturing processes, procurement savings programs with suppliers, and supply chain redesign, including improved management of third-party contractors.
SELLING, GENERAL AND ADMINISTRATIVE EXPENSES
In fiscal 2014, selling, general and administrative expenses decreased 3%, or $72.3, to $2,220.3 from $2,292.6 in fiscal 2013. Selling, general and administrative expenses as a percentage of net revenues decreased to 48.8% in fiscal 2014 from 49.3% in fiscal 2013. This decrease of 50 basis points includes approximately 170
basis points related to lower share-based compensation expense adjustment and public entity preparedness costs partially
offset by higher real estate consolidation program costs and acquisition-related costs. See “Operating Income —Adjusted Operating Income.” Excluding the items described above and the impact to net revenues associated with the reorganization of our mass business in China, selling, general and administrative expenses increased $8.3, to $2,134.1, in fiscal 2014 from $2,125.8 in fiscal 2013 and increased as a percentage of net revenues to 46.7% from 45.7%. This increase of 100 basis points primarily reflects our investment in new subsidiaries in emerging markets, higher advertising and consumer promotion spending as a percentage of net revenues and the negative impact from foreign currency exchange translations, partially offset by lower discretionary costs reflecting our focus on cost containment in developed markets.
In fiscal 2013, selling, general and administrative expenses decreased $17.1, to $2,292.6 from $2,309.7 in fiscal 2012. Selling, general and administrative expenses as a percentage of net revenues decreased to 49.3% in fiscal 2013 from 50.0% in fiscal 2012. This decrease of approximately 70 basis points primarily reflects lower advertising consumer and promotion spending primarily due to savings achieved through vendor negotiations and a shift in promotional spend towards customer discounts and allowances driven by our mass retail business, specifically in Southern Europe where it is necessary to compete in the difficult market environment, and in the U.K. where there has been a significant slowdown in the market segments in which we compete, as well as, lower administrative costs and efficiencies in indirect spending.
OPERATING INCOME
In fiscal 2014, operating income decreased 93%, or $368.7, to $25.7 from $394.4 in fiscal 2013. Operating margin, or operating income as a percentage of net revenues, decreased to 0.6% of net revenues in fiscal 2014 as compared to 8.5% in fiscal 2013. This margin decline primarily reflects the impact of asset impairment charges in our Skin & Body Care segment of approximately 700 basis points. Also contributing to margin decline was approximately 100 basis points driven by higher cost of sales, approximately 40 basis points due to a gain on sale of assets in fiscal 2013 not repeated in fiscal 2014 and approximately 20 basis points related to higher restructuring expense, partially offset by approximately 50 basis points of lower selling, general and administrative expenses and approximately 10 basis points related lower amortization expense.
In fiscal 2013, operating income increased $603.9, to $394.4 from $(209.5) in fiscal 2012. Operating margin, or operating income as a percentage of net revenues, increased approximately 1,300 basis points to 8.5% of net revenues in fiscal 2013 as compared to (4.5%) in fiscal 2012. This increase primarily reflects margin improvement of approximately 1,250 basis points driven by lower asset impairment charges and approximately 130 basis points of margin improvement primarily driven by lower selling, general and administrative expenses, the gain on sale of assets and lower amortization expense. This margin improvement was slightly offset by approximately 80 basis points related to higher cost of sales and restructuring expense.
34
Operating Income by Segment
|
Year Ended June 30,
|
Change %
|
||||||||||||||||
|
(in millions)
|
2014
|
2013
|
2012
|
2014/2013
|
2013/2012
|
||||||||||||
|
OPERATING INCOME (LOSS)
|
|||||||||||||||||
|
Fragrances
|
$
|
355.6
|
|
$
|
369.7
|
|
$
|
340.5
|
|
(4
|
%)
|
9
|
%
|
||||
|
Color Cosmetics
|
154.2
|
|
208.8
|
|
200.2
|
|
(26
|
%)
|
4
|
%
|
|||||||
|
Skin & Body Care
(a)
|
(351.7
|
)
|
(5.7
|
)
|
(577.8
|
)
|
<(100%)
|
|
99
|
%
|
|||||||
|
Corporate
|
(132.4
|
)
|
(178.4
|
)
|
(172.4
|
)
|
26
|
%
|
(3
|
%)
|
|||||||
|
Total
|
$
|
25.7
|
|
$
|
394.4
|
|
$
|
(209.5
|
)
|
(93
|
%)
|
>100%
|
|
||||
(a)
In fiscal 2014, we recorded an impairment charge of $316.9, of which $256.4 related to goodwill and $60.5 to other long lived assets, reported in the Skin & Body Care segment. In fiscal 2012, we recorded an impairment charge of $575.9, primarily related to goodwill of $384.4 and certain trademarks of $188.6 reported in the Skin & Body Care segment.
Fragrances
In fiscal 2014, operating income for Fragrances decreased 4%, or $14.1, to $355.6 from $369.7 in fiscal 2013. Operating margin decreased to 14.2% of net revenues in fiscal 2014 as compared to 14.8% in fiscal 2013, primarily driven by higher cost of sales as a percentage of net revenues.
In fiscal 2013, operating income for Fragrances increased 9%, or $29.2, to $369.7 from $340.5 in fiscal 2012. The increase in operating income reflects higher net revenues and improved operating margin. Operating margin increased to 14.8% of net revenues in fiscal 2013 as compared to 13.9% in fiscal 2012, driven by lower selling, general and administrative expenses as a percentage of net revenues and lower amortization expense as a percentage of net revenues, reflecting the end of the amortization period for a certain license, partially offset by higher cost of sales as a percentage of net revenues.
Color Cosmetics
In fiscal 2014, operating income for Color Cosmetics decreased 26%, or $54.6, to $154.2 f
rom $208.8 in fiscal 2013. The decrease in operating income reflects lower net revenues and a decline in operating margin. Operating margin decreased to 11.3% of net revenues in fiscal 2014 as compared to 14.2% in fiscal 2013, primarily driven by higher selling, general and administrative expenses and cost of sales as percentages of net revenues.
In fiscal 2013, operating income for Color Cosmetics increased 4%, or $8.6, to $208.8 from $200.2 in fiscal 2012. The increase in operating income reflects higher net revenues and improved operating margin. Operating margin increased to 14.2% of net revenues in fiscal 2013 as compared to 14.0% in fiscal 2012, driven by lower selling, general and administrative expenses as a percentage of net revenues, partially offset by higher cost of sales as a percentage of net revenues.
Skin & Body Care
In fiscal 2014, operating loss for Skin & Body Care increased $346.0, to $(351.7) from $(5.7) in fiscal 2013, primarily reflecting asset impairment charges of $316.9 and the impact of the reorganization of our mass business in China of $23.0. The impairment represents the write-off of goodwill, identifiable intangible assets and certain tangible assets associated with the Beauty - Skin & Body Care reporting unit which is included in the Skin & Body Care segment.
One-time charges related to the reorganization of our mass business in China primarily include product returns, inventory obsolescence, the write-off of marketing material and accelerated depreciation of building furniture.
Excluding asset impairment charges and the one-time charge related to the reorganization of our mass business in China, operating loss increased $6.1, to $(11.8) in fiscal 2014 from $(5.7) in fiscal 2013. Operating margin decreased to (1.7%) of net revenues in fiscal 2014 as compared to (0.8%) in fiscal 2013, primarily driven by higher selling, general and administrative expenses primarily due to higher advertising and consumer promotion spending partially offset by lower cost of sales and amortization expense as percentages of net revenues.
In fiscal 2013, operating loss for Skin & Body Care decreased 99%, or
$572.1, to $(5.7) from $(577.8) in fiscal 2012. Operating margin increased to (0.8%) of net revenues in fiscal 2013 as compared to (79.4%) in fiscal 2012, primarily due to asset impairment charges as a percentage of net revenues. No asset impairment charges were recorded in fiscal 2013, compared
35
to asset impairment charges of certain trademarks related to the TJoy and Philosophy acquisitions of $58.0 and $130.6, respectively, and a goodwill impairment charge incurred by the Prestige-Skin & Body Care reporting unit of $384.4, recorded in fiscal 2012. Excluding the impact of asset impairment charges, operating margin declined to (0.8%) of net revenues in fiscal 2013 as compared to (0.7%) in fiscal 2012, primarily driven by higher cost of sales and amortization expense as percentages of net revenues, partially offset by lower selling, general and administrative expenses as a percentage of net revenues.
Corporate
Corporate primarily includes corporate expenses not directly relating to our operating activities. These items are included in Corporate since we consider them to be Corporate responsibilities, and these items are not used by our management to measure the underlying performance of the segments.
Operating loss for Corporate was $132.4, $178.4 and $172.4
in fiscal 2014, 2013 and 2012, respectively
, as described unde “Adjusted Operating Income” below.
Adjusted Operating Income
We believe that Adjusted Operating Income further enhances an investor’s understanding of our performance. See “Overview—Non-GAAP Financial Measures.” Reconciliation of reported operating income to Adjusted Operating Income is presented below:
|
Year Ended June 30,
|
Change %
|
||||||||||||||||
|
(in millions)
|
2014
|
2013
|
2012
|
2014/2013
|
2013/2012
|
||||||||||||
|
Reported Operating Income (Loss)
|
$
|
25.7
|
|
$
|
394.4
|
|
$
|
(209.5
|
)
|
(93
|
%)
|
>100%
|
|
||||
|
% of Net revenues
|
0.6
|
%
|
8.5
|
%
|
(4.5
|
%)
|
|||||||||||
|
Asset impairment charges
|
316.9
|
|
1.5
|
|
575.9
|
|
>100%
|
|
(100
|
%)
|
|||||||
|
China Optimization
|
35.9
|
|
—
|
|
—
|
|
N/A
|
|
N/A
|
|
|||||||
|
Restructuring and other business realignment costs
|
34.1
|
|
36.1
|
|
24.0
|
|
(6
|
%)
|
50
|
%
|
|||||||
|
Real estate consolidation program costs
|
32.3
|
|
22.5
|
|
12.4
|
|
44
|
%
|
81
|
%
|
|||||||
|
Share-based compensation expense adjustment
|
27.6
|
|
120.3
|
|
109.9
|
|
(77
|
%)
|
9
|
%
|
|||||||
|
Acquisition-related costs
|
26.9
|
|
9.6
|
|
18.7
|
|
>100%
|
|
(49
|
%)
|
|||||||
|
Public entity preparedness costs
|
1.2
|
|
7.7
|
|
4.5
|
|
(84
|
%)
|
71
|
%
|
|||||||
|
Gain on sale of asset
|
—
|
|
(19.3
|
)
|
—
|
|
100
|
%
|
N/A
|
|
|||||||
|
Total adjustments to Reported Operating Income (Loss)
|
474.9
|
|
178.4
|
|
745.4
|
|
>100%
|
|
(76
|
%)
|
|||||||
|
Adjusted Operating Income
|
$
|
500.6
|
|
$
|
572.8
|
|
$
|
535.9
|
|
(13
|
%)
|
7
|
%
|
||||
|
% of Net revenues
|
11.0
|
%
|
12.3
|
%
|
11.6
|
%
|
|
|
|||||||||
In fiscal 2014, Adjusted Operating Income decreased 13%, or $72.2, to $500.6 from $572.8 in fiscal 2013. Adjusted operating margin decreased to 11.0% of net revenues in fiscal 2014 as compared to 12.3% in fiscal 2013, primarily driven by higher selling, general and administrative expenses and cost of sales as a percentage of net revenues. Excluding the impact of foreign currency exchange translations, Adjusted Operating Income decreased 12.0%.
In fiscal 2013, Adjusted Operating Income increased 7%, or $36.9, to $572.8 from $535.9 in fiscal 2012. Adjusted operating margin increased to 12.3% of net revenues in fiscal 2013 as compared to 11.6% in fiscal 2012. This margin improvement reflects approximately 110 basis points of lower selling, general and administrative expenses and amortization expense, partially offset by approximately 40 basis points of higher cost of sales. Excluding the negative impact of foreign currency exchange translations, Adjusted Operating Income increased 8.0%.
Asset Impairment Charges
In fiscal
2014, asset impairment charges of $316.9 were reported in the Consolidated Statements of Operations. The impairment represents the write-off of goodwill, identifiable intangible assets and certain tangible assets associated with the Beauty - Skin & Body Care reporting unit which is included in the Skin & Body Care segment.
In fiscal 2014, we had anticipated realizing significant improvements in cash flows in our Beauty - Skin & Body Care Reporting Units China operations beginning in the third quarter due to the reorganization of the management team and distribution network in China
36
and the launch of new product offerings. In the course of evaluating the results for the third quarter and the preparation of third quarter financial statements, we noted the net cash outflows associated with the TJoy mass channel business in China were significantly in excess of previous expectations and management concluded that the results in China represented an indicator of impairment that warranted an interim impairment test for goodwill and certain other intangible assets in the Beauty - Skin & Body Care Reporting Unit.
In fiscal 2013, we sold a manufacturing facility for $2.0, which had a net book value of $3.5 resulting in an asset impairment charge of $1.5. These costs were recorded in asset impairment charges in the Consolidated Statements of Operations and were included in Corporate.
In fiscal 2012, asset impairment charges of $575.9 were reported in the Consolidated Statements of Operations, $573.0 of which were included in the Skin & Body Care segment and $2.9 of which were included in Corporate. The impairment in the Skin & Body Care segment represents a reduction in carrying value of certain trademarks with indefinite lives of $188.6 and goodwill of $384.4. These impairments were primarily attributable to reductions in both actual and projected cash flows of selected Skin & Body Care products related to the TJoy and Philosophy acquisitions.
China Optimization Costs
During the fourth quarter of fiscal 2014, we entered into a distribution agreement with a third-party distributor for some of our brands sold through the mass distribution channel in China and announced that we are discontinuing our TJoy brand. In conjunction with these events, we commenced implementation of restructuring and product rationalization activities of our mass business in China (“China Optimization”) that are expected to generate operating efficiencies. The China Optimization pre-tax restructuring costs and related charges are expected to be approximately $35.0 to $45.0, of which $20.0 to $30.0 will result in net cash payments in fiscal 2015. We anticipate that annual savings expected from China Optimization will be approximately $20.0 by the end of fiscal 2015.
In fiscal 2014, we incurred costs associated with the reorganization of our mass business in China of $35.9 which consist of the one-time charge of $25.6 (as explained below), restructuring costs of $9.8 included in restructuring costs in the Consolidated Statements of Operations in Corporate and consulting costs of $0.5 included in selling, general and administrative expenses in the Consolidated Statements of Operations in Corporate. The one-time charge consists of the following: $15.4 of costs related to product returns included in net revenues in the Consolidated Statements of Operations of which $14.4 is reported in the Skin & Body Care segment and $1.0 is reported in the Color Cosmetics segment, $8.5 of costs related to inventory obsolescence included in cost of sales in the Consolidated Statements of Operations of which $6.9 is reported in the Skin & Body Care segment and $1.6 is reported in the Color Cosmetics segment, and $1.7 of costs primarily related to
the write-off of marketing material and accelerated depreciation of building furniture
included in selling, general and administrative expenses in the Consolidated Statements of Operations reported in the Skin & Body Care segment.
Restructuring and Other Business Realignment Costs
During the fourth quarter of fiscal 2014, our Board of Directors approved a program associated with a new organizational structure (“Organizational Redesign”) that aims to reinforce our growth path and strengthen our position as a global leader in beauty. We anticipate pre-tax restructuring and related costs will be approximately $145.0 to $180.0, all of which will result in cash payments through fiscal 2017. We expect our accrual of $11.0 at June 30, 2014 to result in cash expenditures of $9.1 and $1.9 in fiscal 2015 and 2016, respectively. We anticipate that annual savings from the Organizational Redesign will be over $120.0 by the end of fiscal 2017.
During the fourth quarter of fiscal 2013, we implemented a number of business integration and productivity initiatives aimed at enhancing long-term operating margins (the “Productivity Program”). The Productivity Program is progressing as planned and we continue to estimate pre-tax charges of approximately $70.0 to $75.0, of which $70.0 is expected to result in cash payments through 2016. We expect our total remaining accrual of
$16.2
will result in cash expenditures of approximately
$12.8
and
$3.4
in fiscal
2015
and
2016
, respectively. The Company continues to target annual savings of $60.0 by the end of fiscal 2016.
In fiscal 2014, we incurred restructuring and other business structure realignment costs of $34.1.
•
We incurred restructuring costs of $27.5, included in restructuring costs in the Consolidated Statements of Operations, which primarily relate to $13.0 of costs for the 2014 Organizational Redesign and $14.2 of costs primarily related to the 2013 Productivity Program. These costs exclude $9.8 of costs associated with the reorganization of our mass business in China. See “China Optimization Costs”.
37
•
We incurred business structure realignment costs of $6.6 related to certain other programs that primarily includes
$4.7 of program costs in North America
, of which $0.4 consisted of accelerated depreciation, included in selling, general and administrative expenses in the Consolidated Statements of Operations.
In fiscal 2013, we incurred restructuring and other business structure realignment costs of $36
.1.
•
We incurred restructuring costs of $29.4, included in restructuring costs in the Consolidated Statement of Operations, which primarily related to the Productivity Program which targeted the integration of supply chain and selling activities within the Skin & Body Care segment, as well as certain commercial organization re-design activities, primarily in Europe, productivity programs across our supply chain and optimization of selected administrative support functions.
•
We incurred business structure realignment program costs of $6.7 which consist of costs related to position eliminations in certain administrative functions of $2.2, costs related to structural reorganization in Geneva related to the creation of a fragrance “Center of Excellence” for research and development and the centralization of global supply chain management in Geneva of $1.2 and costs related to certain other programs in North America of $3.3, of which $1.0 consisted of accelerated depreciation. All business structure realignment program costs were included in
selling, general and administrative expenses in the Consolidated Statements of Operations.
In fiscal 2012, we incurred restructuring and other business structure realignment costs of $
24.0.
•
We incurred restructuring costs of $11.1, included in restructuring costs in the Consolidated Statement of Operations, of which $7.3 related to the 2009 Cost Savings Program and $3.8 related to the Acquisition Integration Program. The 2009 Cost Savings program included organizational headcount reductions, workforce realignments and outsourcing of certain North American manufacturing and distribution operations and was finalized in fiscal 2012, while the Acquisition Integration Program related to the four acquisitions we made in 2011.
•
We incurred business structure realignment program costs of $12.9 which consist of costs related to structural reorganization in Geneva related to the creation of a fragrance “Center of Excellence” for research and development and the centralization of global supply chain management in Geneva of $7.0, of which $0.5 consisted of accelerated depreciation, costs incurred in connection with the buy-back of distribution rights for a brand in selected EMEA markets of $4.5 and costs related to certain other programs in North America of $1.4, of which $0.4 consisted of accelerated depreciation. All business structure realignment program costs were included in
selling, general and administrative expenses in the Consolidated Statements of Operations.
In all reported periods, all restructuring and other business realignment costs were reported in Corporate.
Real Estate Consolidation Program Costs
In fiscal 2014, we incurred $32.3 of costs in connection with the consolidation of real estate in New York. The real estate consolidation program costs primarily consist of $21.4 of lease loss expense, $5.0 of duplicative rent expense and $4.1 of accelerated depreciation.
In fiscal 2013, we incurred $22.5 of costs in connection with the consolidation of real estate in New York. The real estate consolidation program costs primarily consist of $16.5 of accelerated depreciation and $5.3 of duplicative rent expense.
In fiscal 2012, we incurred $12.4 of costs in connection with the consolidation of real estate in New York. The real estate consolidation program costs primarily consist of $6.1 of accelerated depreciation and $5.0 of lease loss expenses.
In all reported periods, all real estate consolidation program costs were recorded in selling, general and administrative expenses in the Consolidated Statements of Operations and were included in Corporate.
Share-Based Compensation Adjustment
Share-based compensation expense adjustment incl
uded in the calculation of the Adjusted Operating Income was $27.6, $120.3 and $109.9 in fiscal 2014, 2013 and 2012, respectively. The decrease in the share-based compensation expense adjustment in fiscal 2014 primarily reflects the impact of the accounting modification from liability plan accounting to equity plan accounting as of June 12, 2013, the effective date of the share-based compensation plan amendments.
38
The increase in the share-based compensation expense adjustment in fiscal 2013 compared to fiscal 2012 primarily reflects the impact of an increase in the underlying value of common stock on the share-based awards, a difference in the amortization period of special incentive awards due to the IPO and a charge of $4.2 recorded in fiscal 2013 resulting from an amendment to the Executive Ownership Program, which governs certain share-based compensation instruments, partially offset by fewer shares subject to fair value adjustment on common stock purchased by directors in fiscal 2013 as compared to fiscal 2012.
Senior management evaluates operating performance of our segments based on the share-based expense calculated under equity plan accounting for the recurring stock option awards, share-based awards, and director-owned and employee-owned shares, and we follow the same treatment of the share-based compensation for the financial covenant compliance calculations under our debt agreements. See “Overview—Non-GAAP Financial Measures.” Share-based compensation expense calculated under equity plan accounting for the recurring nonqualified stock option awards and director-owned and employee-owned shares, restricted shares, and RSUs is reflected in the operating results of the segments. Share-based compensation adjustment is included in Corporate. See Note 3, “Segment Reporting” in our notes to Consolidated Financial Statements.
Acquisition-Related Costs
In fiscal 2014, we incurred acquisition-related costs of $26.9. These costs primarily include $15.2 of fees related to the termination of a pre-existing manufacturing and distribution contract in South Africa after forming our wholly-owned subsidiary in South Africa and $1.1 of costs related to certain completed or contemplated business combinations included in selling, general and administrative expenses in the Consolidated Statements of Operations, and $10.6 of costs related to acquisition accounting impacts of revaluation of acquired inventory, included in cost of sales in the Consolidated Statements of Operations.
In fiscal 2013, we incurred acquisition-related costs of $9.6. These costs primarily include $6.7 of an additional charge related to the settlement reached between us and the seller of TJoy, $2.2 of external costs directly related to completed or contemplated business combinations and $0.7 of internal integration costs in connection with the four acquisitions we acquired in 2011 included in selling, general and administrative expenses in the Consolidated Statements of Operations.
In fiscal 2012, we incurred acquisition-related costs of $18.7 in connection with the four acquisitions we made in 2011 as well as certain due diligence and acquisition-related costs incurred in connection with certain contemplated acquisitions that were withdrawn. These costs include internal integration costs of $7.9, transaction-related costs of $10.3, and $0.5 related to acquisition accounting impacts of revaluation of acquired inventory. The internal integration costs include $6.8 of expense related to amortization of a deferred brand growth charge in connection with the TJoy acquisition that was included in amortization expense in the Consolidated Statements of Operations and $1.1 of costs related to consulting, legal services and travel included in selling, general and administrative expenses in the Consolidated Statements of Operations. Transaction-related costs represent external costs directly related to acquiring a company, for both completed and contemplated business combinations and can include expenditures for finder’s fees, legal, accounting, valuation and other professional or consulting fees which are included in selling, general and administrative expenses in the Consolidated Statements of Operations. In connection with the acquisitions, we recorded acquired net assets at fair value, including a fair value increase of inventories acquired of $0.5. This fair value increase of inventory resulted in an increase in cost of sales in the Consolidated Statements of Operations as the inventory was sold following the acquisition.
In all reported periods, all acquisition-related costs were reported in Corporate.
Public Entity Preparedness Costs
In fiscal 201
4, we incurred public entity preparedness costs of $1.2 primarily consisting of a third-party expense reimbursement for legal fees and expense related to our IPO and the restatement of the Certificate of Incorporation, Bylaws and stockholders agreement to JAB Holdings B.V., which is the successor to JAB Holdings II B.V., Berkshire Partners LLC and Rhône Capital L.L.C. and remaining miscellaneous costs associated with our IPO.
In fiscal 2013, we incurred public entity preparedness costs of $7.7 primarily consisting of consulting, audit, legal, filing and printing costs associated with preparation and filing of the registration statement.
In fiscal 2012, we incurred public entity preparedness costs of $4.5 primarily consisting of consulting, audit, legal, filing and printing costs associated with preparation and filing of the registration statement and consulting costs related to Sarbanes-Oxley compliance.
39
In all reported periods, all public entity preparedness costs were recorded in selling, general and administrative expenses in the Consolidated Statements of Operations and were included in Corporate.
Gain on Sale of Asset
In fiscal 2013, we received $25.0 related to the termination of one of our licenses by mutual agreement with the original licensor. The license had a net book value of $5.7 and, therefore, we recorded a gain of $19.3 in the Consolidated Statements of Operations and included in Corporate.
INTEREST EXPENSE, NET
In fiscal 2014, net interest expense was $68.5 as compared with $76.5 in fiscal 2013. This decrease is due to lower interest rates on our long-term debt partially offset by a higher year-over-year average debt balance for a total decrease of $3.9. Other factors include a $2.6 decrease in interest on third-party borrowings by our foreign subsidiaries and $3.9 lower deferred debt amortization, partially offset by an increase in losses related to foreign exchange of $2.5, net of derivative foreign exchange contracts.
In fiscal 2013, net interest expense was $76.5 as compared with $89.6 in fiscal 2012. The decrease primarily relates to lower accretion of the obligations related to the purchase of TJoy of $6.8, lower expense of $4.9 due to the maturity of interest rate swaps, and lower interest expense on our debt instruments.
INCOME TAXES
The following table presents our provision for income taxes, and effective tax rates for the periods presented
|
2014
|
2013
|
2012
|
|||||||||||
|
Provision (benefit) for income taxes
|
$
|
20.1
|
|
$
|
116.8
|
|
$
|
(37.8
|
)
|
||||
|
Effective income tax rate
|
(45.6
|
)%
|
36.6
|
%
|
11.4
|
%
|
|||||||
The effective income tax rate for fiscal 2014 was (45.6%) as compared with 36.6% in fiscal 2013 and 11.4% in fiscal 2012. The effective income tax rate in fiscal 2014 reflects tax expense of $36.1 in valuation allowances primarily due to TJoy’s ongoing operating losses and excess U.S. net deferred tax assets that cannot be recognized, asset impairment charges of $67.4 offset by a change in recognized tax benefit of $49.2 due to the settlement of tax audits in multiple foreign jurisdictions and the expiration of foreign and state statutes of limitation. The effective income tax rate in fiscal 2013 reflects tax expense of $18.2 in valuation allowances primarily due to TJoy’s ongoing operating losses, $16.0 associated with the non-deductibility of certain share-based compensation offset by a change in recognized tax benefit of $28.8 due to federal, state and foreign expirations in statutes of limitations and settlements. The effective income tax rate in fiscal 2012 reflects tax expense of $14.9 associated with the inclusion in U.S. income of activities of certain foreign subsidiaries, $80.1 associated with asset impairment charges and $27.9 associated with the non-deductibility of certain share-based compensation.
The effective rates vary from the U.S. federal statutory rate of 35% due to the effect of (1) jurisdictions with different statutory rates, (2) adjustments to our unrecognized tax benefits and accrued interest, (3) non-deductible expenses and (4) valuation allowance changes. Our effective tax rate could fluctuate significantly and could be adversely affected to the extent earnings are lower than anticipated in countries that have lower statutory rates and higher than anticipated in countries that have higher statutory rates.
Reconciliation of Reported Income Before Income Taxes to Adjusted Income Before Income Taxes and Effective Tax Rates:
40
|
Year Ended June 30, 2014
|
Year Ended June 30, 2013
|
Year Ended June 30, 2012
|
||||||||||||||||||||||||||||||
|
(in millions)
|
Income Before Income Taxes
|
Provision for Income Taxes
|
Effective Tax Rate
|
Income Before Income Taxes
|
Provision for Income Taxes
|
Effective Tax Rate
|
Income Before Income Taxes
|
Provision for Income Taxes
|
Effective Tax Rate
|
|||||||||||||||||||||||
|
Reported (Loss) Income Before Income Taxes
|
$
|
(44.1
|
)
|
20.1
|
|
(45.6
|
)%
|
$
|
318.7
|
|
116.8
|
|
36.6
|
%
|
$
|
(331.1
|
)
|
(37.8
|
)
|
11.4
|
%
|
|||||||||||
|
Adjustments to Reported Operating Income
(a)
|
474.9
|
|
61.3
|
|
178.4
|
|
23.2
|
|
745.4
|
|
149.3
|
|
||||||||||||||||||||
|
Other adjustments
(b)
|
—
|
|
—
|
|
—
|
|
—
|
|
44.4
|
|
15.4
|
|
||||||||||||||||||||
|
Adjusted Income Before Income Taxes
|
$
|
430.8
|
|
$
|
81.4
|
|
18.9
|
%
|
(c)
|
$
|
497.1
|
|
$
|
140.0
|
|
28.2
|
%
|
$
|
458.7
|
|
$
|
126.9
|
|
27.7
|
%
|
|||||||
|
(a)
|
See the reconciliation included in Item 7, “Management’s Discussion and Analysis of Financial Condition and Results of Operations
—
Results of Operations
—
Net Revenues
—
Operating Income
—
Adjusted Operating Income”.
|
|
(b)
|
See the reconciliation included in Item 7, “Management’s Discussion and Analysis of Financial Condition and Results of Operations
—
Results of Operations-Net Income Attributable to Coty Inc.”.
|
(c)
Our normalized tax rate excluding the benefits associated with the foreign audit settlements was 27.7% for the year ended June 30, 2014.
The adjusted effective tax rate was 18.9% compared to 28.2% in the prior-year period. The decrease was a result of reversal of certain unrecognized tax benefits associated with the settlement of tax audits in multiple foreign jurisdictions. Cash paid during the year ended June 30, 2014, 2013 and 2012, for income taxes of $84.1, $84.0 and $67.4 represents 19.5%, 16.9% and 14.7% of Adjusted income before income taxes for the fiscal year then ended, respectively.
NET INCOME ATTRIBUTABLE TO COTY INC.
In fiscal 201
4, net income attributable to Coty Inc. decreased $265.4, to $(97.4), from $168.0 in fiscal 2013. This decrease primarily reflects lower operating income partially offset by lower interest expense and lower tax expense as described in “Interest Expense, Net” and “Income Taxes” above.
In fiscal 2013, net income attributable to Coty Inc. increased $492.4, to $168.0, from $(324.4) in fiscal 2012. This increase primarily reflects higher operating income along with lower other expense, net, and interest expense, net partially offset by higher tax expense (as discussed above).
We believe that Adjusted Net Income Attributable to Coty Inc. provides an enhanced understanding of our performance. See “Overview—Non-GAAP Financial Measures.”
41
|
Year Ended June 30,
|
Change %
|
||||||||||||||||
|
(in millions)
|
2014
|
2013
|
2012
|
2014/2013
|
2013/2012
|
||||||||||||
|
Reported Net (Loss) Income Attributable to Coty Inc.
|
$
|
(97.4
|
)
|
$
|
168.0
|
|
$
|
(324.4
|
)
|
<(100%)
|
|
>100%
|
|
||||
|
% of Net revenues
|
(2.1
|
%)
|
3.6
|
%
|
(7.0
|
%)
|
|||||||||||
|
Adjustments to Reported Operating Income (Loss)
(a)
|
474.9
|
|
178.4
|
|
745.4
|
|
>100%
|
|
(76
|
%)
|
|||||||
|
Loss on foreign currency contract
(b)
|
—
|
|
—
|
|
37.4
|
|
N/A
|
|
(100
|
%)
|
|||||||
|
Acquisition-related interest expense
(c)
|
—
|
|
—
|
|
7.0
|
|
N/A
|
|
(100
|
%)
|
|||||||
|
Tax impact on foreign income inclusion
(d)
|
—
|
|
—
|
|
14.9
|
|
N/A
|
|
(100
|
%)
|
|||||||
|
Change in tax provision due to adjustments to Reported Net (Loss) Income Attributable to Coty Inc.
|
(61.3
|
)
|
(23.2
|
)
|
(179.6
|
)
|
<(100%)
|
|
87
|
%
|
|||||||
|
Adjusted Net Income Attributable to Coty Inc.
|
$
|
316.2
|
|
$
|
323.2
|
|
$
|
300.7
|
|
(2
|
%)
|
7
|
%
|
||||
|
% of Net revenues
|
6.9
|
%
|
7.0
|
%
|
6.5
|
%
|
|
|
|||||||||
|
Per Share Data
|
|||||||||||||||||
|
Adjusted weighted-average common shares
(e)
|
|||||||||||||||||
|
Basic
|
381.7
|
|
381.7
|
|
373.0
|
|
|||||||||||
|
Diluted
|
390.7
|
|
396.4
|
|
384.6
|
|
|||||||||||
|
Adjusted net income attributable to Coty Inc. per common share
|
|||||||||||||||||
|
Basic
|
$
|
0.83
|
|
$
|
0.85
|
|
$
|
0.81
|
|
||||||||
|
Diluted
|
0.81
|
|
0.82
|
|
0.78
|
|
|||||||||||
|
(a)
|
See the reconciliation included in Item 7, “Management’s Discussion and Analysis of Financial Condition and Results of Operations—Results of Operations—Net Revenues—Operating Income-Adjusted Operating Income”.
|
|
(b)
|
Loss on foreign currency contract to hedge foreign currency exposure associated with a contemplated acquisition opportunity that was withdrawn. These amounts are included in other expense, net in the Consolidated Statements of Operations.
|
|
(c)
|
Interest expense for fiscal 2012 associated with the obligations related to the purchase of TJoy.
|
|
(d)
|
Reflects an adjustment to our tax provision equal to the tax expense associated with certain foreign income that was subject to tax in the U.S. during fiscal 2011 and 2010 under the provisions of Internal Revenue Code Sections 951 through 954 (“Subpart F”), but that should no longer be subject to Subpart F as a result of structural changes in our organization. Effective fiscal 2012, we created a fragrance “Center of Excellence” for research and development and supply chain management by relocating and centralizing selected manufacturing and product development processes to Geneva, Switzerland. As a result of these changes to our organizational and management structure, Subpart F should no longer apply to income associated with our operations in Geneva and, accordingly, tax expense associated with certain foreign-based income will be reduced in the future. This change is reflected in the provision for income taxes in the Consolidated Statements of Operations for periods following its implementation.
|
|
(e)
|
In fiscal 2014 and 2012, using the treasury stock method, the number of adjusted diluted common shares to calculate non-GAAP adjusted diluted net income per common share was 9.0 and 11.6 million higher, respectively, than the number of common shares used to calculate GAAP diluted net loss per common share, due to the potentially dilutive effect of certain securities issuable under our share-based compensation plans, which were considered anti-dilutive for calculating GAAP diluted net loss per common share. In fiscal 2013, the adjusted number of common shares used to calculate non-GAAP adjusted basic and diluted net income attributable to Coty Inc. per common share is identical to the number of common and diluted shares used to calculate GAAP net income (loss) per common share.
|
Quarterly Results of Operations Data
The following tables set forth our unaudited quarterly consolidated statements of operations data for each of the eight quarters in the period ended June 30,
2014
. We have prepared the quarterly consolidated statements of operations data on a basis consistent with the consolidated financial statements included in Part II, Item 8, “Financial Statements and Supplementary Data” in this Annual Report on Form 10-K. In the opinion of management, the financial information reflects all adjustments, consisting only of normal recurring adjustments, which we consider necessary for a fair presentation of this data. This information should be read in conjunction with the consolidated financial statements and related notes included in Part II, Item 8, “Financial Statements and Supplementary Data” in this Annual Report. The results of historical periods are not necessarily
42
indicative of the results of operations for any future period.
|
Three Months Ended
|
|||||||||||||||||||||||||||||||
|
Fiscal 2014
|
Fiscal 2013
|
||||||||||||||||||||||||||||||
|
June 30,
|
March 31,
|
December 31,
|
September 30,
|
June 30,
|
March 31,
|
December 31,
|
September 30,
|
||||||||||||||||||||||||
|
(in millions, except per share data)
|
2014
|
2014
|
2013
|
2013
|
2013
|
2013
|
2012
|
2012
|
|||||||||||||||||||||||
|
Consolidated Statements of Operations Data:
|
|||||||||||||||||||||||||||||||
|
Net revenues
|
$
|
1,041.5
|
|
$
|
1,008.7
|
|
$
|
1,323.2
|
|
$
|
1,178.2
|
|
$
|
1,058.8
|
|
$
|
997.7
|
|
$
|
1,379.5
|
|
$
|
1,213.1
|
|
|||||||
|
Gross profit
|
592.7
|
|
613.1
|
|
773.9
|
|
706.2
|
|
620.4
|
|
615.1
|
|
816.6
|
|
736.7
|
|
|||||||||||||||
|
Asset impairment charges
|
—
|
|
316.9
|
|
—
|
|
—
|
|
—
|
|
—
|
|
1.5
|
|
—
|
|
|||||||||||||||
|
Operating (loss) income
|
(11.4
|
)
|
(272.0
|
)
|
143.5
|
|
165.6
|
|
(23.9
|
)
|
30.1
|
|
222.3
|
|
165.9
|
|
|||||||||||||||
|
Interest expense, net
|
17.1
|
|
17.3
|
|
16.7
|
|
17.4
|
|
21.0
|
|
20.2
|
|
18.4
|
|
16.9
|
|
|||||||||||||||
|
Other expense (income), net
|
3.6
|
|
(2.1
|
)
|
—
|
|
(0.2
|
)
|
(0.2
|
)
|
(0.2
|
)
|
(0.2
|
)
|
(0.2
|
)
|
|||||||||||||||
|
(Loss) income before income taxes
|
(32.1
|
)
|
(287.2
|
)
|
126.8
|
|
148.4
|
|
(44.7
|
)
|
10.1
|
|
204.1
|
|
149.2
|
|
|||||||||||||||
|
Provision (benefit) for income taxes
|
(19.3
|
)
|
(40.5
|
)
|
33.7
|
|
46.2
|
|
11.5
|
|
(19.8
|
)
|
70.7
|
|
54.4
|
|
|||||||||||||||
|
Net (loss) income
|
$
|
(12.8
|
)
|
$
|
(246.7
|
)
|
$
|
93.1
|
|
$
|
102.2
|
|
$
|
(56.2
|
)
|
$
|
29.9
|
|
$
|
133.4
|
|
$
|
94.8
|
|
|||||||
|
Net income attributable to noncontrolling interests
|
$
|
3.3
|
|
$
|
3.4
|
|
$
|
6.8
|
|
$
|
4.3
|
|
$
|
2.9
|
|
$
|
3.8
|
|
$
|
5.2
|
|
$
|
3.8
|
|
|||||||
|
Net income attributable to redeemable noncontrolling interests
|
$
|
4.0
|
|
$
|
3.2
|
|
$
|
3.8
|
|
$
|
4.4
|
|
$
|
3.2
|
|
$
|
5.7
|
|
$
|
5.0
|
|
$
|
4.3
|
|
|||||||
|
Net (loss) income attributable to Coty Inc.
|
$
|
(20.1
|
)
|
$
|
(253.3
|
)
|
$
|
82.5
|
|
$
|
93.5
|
|
$
|
(62.3
|
)
|
$
|
20.4
|
|
$
|
123.2
|
|
$
|
86.7
|
|
|||||||
|
Per Share Data:
|
|
|
|
|
|||||||||||||||||||||||||||
|
Weighted-average common shares:
|
|
|
|
|
|||||||||||||||||||||||||||
|
Basic
|
374.3
|
|
384.0
|
|
384.4
|
|
384.0
|
|
383.0
|
|
382.8
|
|
381.3
|
|
379.6
|
|
|||||||||||||||
|
Diluted
|
374.3
|
|
384.0
|
|
393.3
|
|
393.5
|
|
383.0
|
|
396.7
|
|
397.7
|
|
395.8
|
|
|||||||||||||||
|
Cash dividends declared per common share
|
$
|
—
|
|
$
|
—
|
|
$
|
0.20
|
|
$
|
—
|
|
$
|
—
|
|
$
|
—
|
|
$
|
0.15
|
|
$
|
—
|
|
|||||||
|
Net (loss) income attributable to Coty Inc. per common share:
|
|
|
|
|
|||||||||||||||||||||||||||
|
Basic
|
$
|
(0.05
|
)
|
$
|
(0.66
|
)
|
$
|
0.21
|
|
$
|
0.24
|
|
$
|
(0.16
|
)
|
$
|
0.05
|
|
$
|
0.32
|
|
$
|
0.23
|
|
|||||||
|
Diluted
|
(0.05
|
)
|
(0.66
|
)
|
0.21
|
|
0.24
|
|
(0.16
|
)
|
0.05
|
|
0.31
|
|
0.22
|
|
|||||||||||||||
FINANCIAL CONDITION
LIQUIDITY AND CAPITAL RESOURCES
Overview
Our primary sources of funds include cash generated from operations, borrowings from issuance of debt and committed and uncommitted lines of credit provided by banks and lenders in the U.S. and abroad. As of
June 30, 2014
, we had cash and cash equivalents of
$1,238.0
compared with $920.4 at June 30, 2013.
Our cash flows are subject to seasonal variation throughout the year, including demands on cash made during our first fiscal quarter in anticipation of higher global sales during the second quarter and strong cash generation in the second fiscal quarter as a result of increased demand by retailers associated with the holiday season. Our principal uses of cash are to fund planned operating expenditures, capital expenditures, interest payments, acquisitions, dividends, share repurchases and any principal payments on debt. The working capital movements are based on the sourcing of materials related to the production of our Fragrances, Color Cosmetics, and Skin & Body Care products.
As a result of the cash on hand, our ability to generate cash from operations and through access to our revolving credit facility and other lending sources, we believe we have sufficient liquidity to meet our ongoing needs on both a near term and long-term basis.
Debt
43
|
June 30,
2014 |
June 30,
2013 |
|||||||
|
Short-term debt
|
$
|
18.8
|
|
$
|
35.1
|
|
||
|
Coty Inc. Credit Facility due April 2018
|
|
|||||||
|
Term Loan
|
1,875.0
|
|
1,250.0
|
|
||||
|
Revolving Loan Facility
|
899.5
|
|
845.0
|
|
||||
|
Senior Notes
|
|
|
||||||
|
5.12% Series A notes due June 2017
|
100.0
|
|
100.0
|
|
||||
|
5.67% Series B notes due June 2020
|
225.0
|
|
225.0
|
|
||||
|
5.82% Series C notes due June 2022
|
175.0
|
|
175.0
|
|
||||
|
Capital lease obligations
|
0.2
|
|
0.1
|
|
||||
|
Total debt
|
3,293.5
|
|
2,630.2
|
|
||||
|
Less: Short-term debt and current portion of long-term debt
|
(33.4
|
)
|
(40.1
|
)
|
||||
|
Total Long-term debt
|
$
|
3,260.1
|
|
$
|
2,590.1
|
|
||
We maintain short-term lines of credit with financial institutions around the world. Total available lines of credit were
$141.4
and
$162.7
, of which
$18.8
and
$35.1
were outstanding at June 30,
2014
and
2013
, respectively. Interest rates on these short-term lines of credit vary depending on market rates for borrowings within the respective geographic locations plus applicable spreads. Interest rates plus applicable spreads on these lines ranged from
1.3%
and
13.5%
and
0.9%
and
9.5%
as of June 30,
2014
and
2013
. The weighted-average interest rate on short-term debt outstanding was
6.7%
and
6.8%
as of June 30,
2014
and
2013
, respectively. In addition, we had undrawn letters of credit of
$3.6
and
$3.3
as of June 30,
2014
and
2013
, respectively.
Long-Term Debt
On June 25, 2014, we entered into the Incremental Term Loan Amendment to the 2013 Credit Agreement (as defined below). The amendment provides for an incremental term loan of
$625.0
("Incremental Term Loan") and the Incremental Term Loan has substantially the same terms and conditions as those of the 2013 Term Loan (as defined below), except with respect to principal repayment. The Incremental Term Loan is payable in full on April 2, 2018. We entered into the Incremental Term Loan in connection with the share purchase agreement (see Note 21 to our Consolidated Financial Statements) and for general corporate purposes. Applicable spreads on the borrowings under the Incremental Term Loan may range from 0.0% to 1.5% based on our consolidated leverage ratio, as defined in the 2013 Credit Agreement. Deferred financing fees of
$2.2
were recorded in Other noncurrent assets in the Consolidated Balance Sheet in connection with the amendment as of June 30, 2014 and there were no deferred financing fees written off as a result of the amendment.
On April 2, 2013, we refinanced our then-existing credit facility, entering into a Credit Agreement (the “2013 Credit Agreement”) with JP Morgan Chase Bank, N.A. as administrative agent and Bank of America, N.A., BNP Paribas, Crédit Agricole Corporate & Investment Bank, Deutsche Bank Securities Inc., ING Bank N.V., Morgan Stanley MUFG Loan Partners, LLC and Wells Fargo Bank, N.A., as syndication agents. The 2013 Credit Agreement expires on April 2, 2018 and provides (i) a term loan of
$1,250.0
(the “2013 Term Loan”) and (ii) a revolving loan facility of
$1,250.0
(the “2013 Revolving Loan Facility”), which includes up to
$80.0
in swingline loans under the 2013 Revolving Loan Facility. Rates of interest on amounts borrowed under the 2013 Credit Agreement are based on the London Interbank Offer Rate (“LIBOR”), a qualified Eurocurrency LIBOR, an alternative base rate, or a qualified local currency rate, as applicable to the borrowings, plus applicable spreads determined by the consolidated leverage ratio. Applicable spreads on the borrowings under the 2013 Credit Agreement may range from 0.0% to 1.5% based on our consolidated leverage ratio, as defined in the 2013 Credit Agreement. In addition to interest on amounts borrowed under the 2013 Credit Agreement, we pay a quarterly commitment fee, as defined in the 2013 Credit Agreement, on the 2013 Revolving Loan Facility that can range from
0.15%
to
0.23%
based on our consolidated leverage ratio, as defined in the 2013 Credit Agreement. Quarterly repayments of the 2013 Term Loan will commence on July 1, 2015 and will total
10%
in fiscal 2016,
20%
in fiscal 2017 and
70%
in fiscal 2018. The 2013 Revolving Loan Facility is payable in full in fiscal 2018. We used the proceeds from the 2013 Credit Agreement to repay amounts outstanding under the 2011 Credit Agreement described below and for general corporate purposes. In April 2013, we wrote off
$2.6
of deferred financing fees associated with the refinancing, which was included in interest expense, net in the Consolidated Statements of Operations in fiscal 2013. As of
June 30, 2014
, we had
$350.5
available for borrowings under the 2013 Credit Agreement.
Interest is payable quarterly or on the last day of the interest period applicable to the borrowings under the 2013 Credit Agreement. The weighted-average interest rate on the 2013 Term Loan was approximately
1.6%
in both fiscal 2014 and 2013
44
and the weighted-average interest rate on the 2013 Revolving Loan Facility was approximately
1.3%
and
1.4%
in fiscal 2014 and 2013, respectively.The weighted-average interest rate on the 2011 Term Loan was approximately
2.0%
for the period in fiscal 2013 before the refinancing of the 2011 Credit Agreement and approximately
2.1%
in fiscal 2012. The weighted-average interest rate on the 2011 Revolving Loan Facility was approximately 1.7% for the period in fiscal 2013 before the refinancing and approximately
1.7%
in fiscal 2012.
On June 16, 2010, we issued
$500.0
of Senior Secured Notes (the “Senior Notes”) in three series in a private placement transaction pursuant to a Note Purchase Agreement (the “NPA”): (i)
$100.0
in aggregate principal amount of
5.12%
Series A Senior Secured Notes due June 16, 2017, (ii)
$225.0
in aggregate principal amount of
5.67%
Series B Senior Secured Notes due June 16, 2020 and (iii)
$175.0
in aggregate principal amount of
5.82%
Series C Senior Secured Notes due June 16, 2022. Interest payments are payable semi-annually in December and June. In connection with the refinancing of the credit facility in August 2011, the liens that secured the Senior Notes were released as provided in the NPA.
As of June 30,
2014
, we are required to comply with certain covenants contained within the 2013 Credit Agreement and the NPA (each, as amended, the “Agreements”). These covenants within the Agreements contain customary representations and warranties as well as customary affirmative and negative covenants, including but not limited to, restrictions on incurrence of additional debt, liens, dividends and other restricted payments, asset sales, investments, mergers, acquisitions and affiliate transactions. Events of default permitting acceleration under the Agreements include, among others, nonpayment of principal or interest, covenant defaults, material breaches of representations and warranties, bankruptcy and insolvency events and certain cross defaults. In addition, a change of control is a default under the 2013 Credit Agreement and requires a prepayment offer under the NPA, as amended. Financial covenants in the Agreements require us to maintain, at the end of each fiscal quarter, a consolidated leverage ratio of consolidated total debt to consolidated EBITDA, as defined in the Agreements, equal to or less than 3.5 to 1.0 for the previous 12-month period, and a consolidated interest coverage ratio, as these terms are defined in the 2013 Credit Agreement, as amended, equal to or greater than 3.0 to 1.0 for the previous 12-month period, except that the 2013 Credit Agreement permits us to maintain a consolidated leverage ratio equal to or less than 4.0 to 1.0 for the 12-month period following an acquisition, as defined in the 2013 Credit Agreement.
We are in compliance with all financial covenants in the Agreements as of June 30,
2014
and 2013. Our consolidated leverage ratios were 3.0 and 3.2 and our consolidated interest coverage ratios were 11.0 and 10.1 under the 2013 Credit Agreement and NPA, respectively, as of June 30, 2014. Failure to comply with the financial and other covenants under the Agreements may constitute a default and may allow the lenders to accelerate the maturity of all indebtedness under these agreements, in certain instances after an applicable cure period. If such acceleration were to occur, we may not have sufficient liquidity available to repay the indebtedness. We would likely have to seek amendments under these agreements for relief from the financial covenants or repay the debt with proceeds from the issuance of new debt or equity, and/or asset sales, if necessary.
We generally do not expect our current debt covenants to prevent us from undertaking additional debt or equity financing. However, should we decide to pursue an acquisition that requires financing that would result in a violation of our existing debt covenants, refusal of our current lenders to permit waivers or amendments to our existing covenants could delay or prevent consummation of our plans.
Cash Flows
|
Year Ended June 30,
|
|||||||||||
|
2014
|
2013
|
2012
|
|||||||||
|
Consolidated Statements of Cash Flows Data:
(in millions)
|
|||||||||||
|
Net cash provided by operating activities
|
$
|
536.5
|
|
$
|
463.9
|
|
$
|
589.3
|
|
||
|
Net cash used in investing activities
|
(257.6
|
)
|
(229.9
|
)
|
(333.9
|
)
|
|||||
|
Net cash (used in) provided by financing activities
|
(5.7
|
)
|
69.0
|
|
(97.7
|
)
|
|||||
Net cash provided by operating activities
Net cash provided by operating activities was $536.5, $463.9 and $589.3 for fiscal 2014, 2013 and 2012, respectively. The increase in operating cash inflows in fiscal 2014 compared with fiscal 2013 is primarily due to an increase in accrued expenses and other current liabilities of $235.8 primarily due to the elimination of cash exercises related to share-based compensation programs of $154.5 as a result of shared-based compensation plan amendments upon our initial public offering at the end of fiscal 2013 and lower bonus payments of $56.8 and an increase in accounts payable of $70.0 as a result of our initiatives to obtain more favorable vendor payment terms. These inflows were partially offset by lower cash provided by net income of $84.1 which includes the reversal of certain unrecognized tax benefits associated with the settlement of tax audits in multiple foreign jurisdictions of $38.1, higher cash outflows for prepaid advertising-related items for fiscal 2014 launches and other miscellaneous items of $30.2, higher cash outflows from other noncurrent assets of $45.9 mainly attributable to timing of
45
advance royalty payments made to a licensor during the second quarter of fiscal 2014 and higher cash outflows for inventory of $46.6 from acquisitions in fiscal 2014 and the build up of inventory for future launches.
The decrease in operating cash inflows in fiscal 2013 compared with fiscal 2012 is primarily due to increased cash outflow for accrued expenses and other liabilities of $238.6 which includes higher cash exercises of share-based compensation awards of $150.5, cash payments for fiscal 2012 awards under the annual performance plan of approximately $30.0, and professional fees paid of approximately $15.0 in fiscal 2013. The decrease in operating cash flows also relates to the decrease in accounts payable of $61.2 as a result of payments made during fiscal 2013 for higher inventory purchases and advertising and promotional expenses made through June of fiscal 2012. These decreases were offset by increased cash inflow from increased net income adjusted for non-cash items of $38.7, decreased cash outflow as a result of an inventory reduction initiative of $64.5 and decreased cash outflow for prepaid expenses and other assets of $65.0 as a result of holding less marketing materials and less spending on advertising in fiscal 2013.
Net cash used in investing activities
Net cash used in investing activities was $257.6, $229.9 and $333.9 for fiscal 2014, 2013 and 2012, respectively. The increase in cash outflows in fiscal 2014 as compared to fiscal 2013 is primarily driven by a decrease in proceeds from the sale of an asset of $25.0, which occurred in fiscal 2013, related to the termination of one of our licenses by mutual agreement with the original licensor, and higher capital expenditure spending of $7.6 during fiscal 2014. During fiscal 2014 and 2013, we had similar cash outflows for two acquisitions in each of the fiscal years.
The decrease in investing cash outflows in fiscal 2013 compared with fiscal 2012 is primarily due to lower payments for acquisitions. The payments for acquisitions in fiscal 2013 include $23.0 paid for 8% of TJoy shares and the deferred brand growth liability and $8.0 for license rights to distribute a celebrity’s existing fragrance portfolio and develop new fragrances compared to $129.1 paid in fiscal 2012 for 32% of TJoy shares. Additionally, the decrease in net investing cash outflows is due to the proceeds from a sale of an asset of $25.0 related to the termination of one of our licenses by mutual agreement with the original licensor. The decrease is offset by higher capital expenditures.
Net cash (used in) provided by financing activities
Net cash (used in) provided by financing activities was $(5.7), $69.0 and $(97.7) for fiscal 2014, 2013 and 2012, respectively. The increase in financing cash outflows is primarily due to a $569.3 cash outflow for our new share repurchase program and share purchase agreement in fiscal 2014 and higher dividend payments of $19.5, offset by an increase in net proceeds from borrowings under our Credit Agreement of $488.0.
The increase in financing cash inflows in fiscal 2013 compared with fiscal 2012 is primarily due to increase in net proceeds from our Credit Agreements of $378.0. The increase in cash inflow is offset by lower net proceeds from issuance of common stock of $120.8, a dividend payment of $57.4, and higher repayment of short-term debt of $47.8.
Dividends
On September 17, 2013, we announced a cash dividend of $0.20 per share, or $77.6 on our Class A and Class B Common Stock. Of the $77.6, which was recorded as a decrease to APIC in the Consolidated Balance Sheet as of
June 30, 2014
, $76.9 was paid on October 31, 2013 to holders of record of Class A and Class B Common Stock on October 11, 2013. The remaining $0.7 is payable upon settlement of RSUs and vesting of restricted shares of Class A Common Stock, each outstanding as of October 11, 2013, and is recorded as Other noncurrent liabilities in the Consolidated Balance Sheet.
Additionally, we reduced the dividend accrual recorded in a prior period by $0.2 to adjust for accrued dividends on RSUs no longer expected to vest, which was recorded as an increase to APIC in the Consolidated Balance Sheet. Total accrued dividends on unvested RSUs of $0.9 are included in Other noncurrent liabilities in the Consolidated Balance Sheet as of
June 30, 2014
.
Share Repurchase
On
February 14, 2014
, we announced that we would repurchase shares of Class A Common Stock having an aggregate market value not exceeding $200.0, which was subsequently increased to $400.0 on June 3, 2014, in order to invest into the business and further enhance shareholder value. In connection with the new program, we repurchased
6.6 million
shares of our Class A Common Stock during the year ended June 30, 2014. The shares were purchased in multiple transactions at prices ranging from
$14.64
to
$15.69
per share. The fair value of all shares repurchased was
$100.0
and was reflected as an increase to Treasury stock in our Consolidated Balance Sheets and Consolidated Statements of Equity and Redeemable Noncontrolling Interests.
On June 5, 2014, we entered into a Stock Purchase Agreement with Worldwide Beauty Offshore L.P. and Worldwide Beauty Onshore L.P. (“Rhone”),Berkshire Fund VII, L.P., Berkshire Fund VII-A, L.P., Berkshire Investors III LLC and Berkshire Investor IV LLC ("Berkshire"), M. Steven Langman and Bradley Bloom. In connection with the repurchase, we
46
agreed to repurchase a total of
27.9 million
and less than
0.1 million
shares of Class B Common Stock and Class A Common Stock, respectively, on June 12, 2014 for $16.78 per share, which was determined by calculating the volume weighted average price of the Company's Class A Common Stock from May 30, 2014 through June 5, 2014, inclusive. The shares of Class B Common Stock repurchased converted to shares of Class A Common Stock upon the repurchase. The fair value of Class B shares and Class A shares repurchased was
$468.0
and
$1.0
, respectively, and was reflected as an increase to Treasury stock in our Consolidated Balance Sheets and Consolidated Statements of Equity and Redeemable Noncontrolling Interests.
Contractual Obligations and Commitments
Our principal contractual obligations and commitments as of
June 30, 2014
are presented below:
|
(in millions)
|
Total
|
Payments Due in Fiscal
|
Thereafter
|
||||||||||||||||||||||||
|
2015
|
2016
|
2017
|
2018
|
2019
|
|||||||||||||||||||||||
|
Long-term debt obligations
|
$
|
3,274.5
|
|
$
|
14.5
|
|
$
|
125.0
|
|
$
|
350.0
|
|
$
|
2,385.0
|
|
$
|
—
|
|
$
|
400.0
|
|
||||||
|
Interest on long-term debt obligations
(a)
|
410.0
|
|
85.0
|
|
88.0
|
|
94.0
|
|
77.0
|
|
23.0
|
|
43.0
|
|
|||||||||||||
|
Operating lease obligations
|
487.5
|
|
67.6
|
|
54.7
|
|
44.0
|
|
40.6
|
|
37.4
|
|
243.2
|
|
|||||||||||||
|
License agreements:
(b)
|
|
|
|||||||||||||||||||||||||
|
Royalty payments
|
308.9
|
|
37.0
|
|
30.6
|
|
28.7
|
|
29.4
|
|
29.6
|
|
153.6
|
|
|||||||||||||
|
Advertising and promotional spend obligations
|
690.1
|
|
62.3
|
|
39.2
|
|
48.1
|
|
52.1
|
|
62.6
|
|
425.8
|
|
|||||||||||||
|
Other contractual obligations
(c)
|
183.0
|
|
79.2
|
|
18.7
|
|
16.8
|
|
16.5
|
|
16.5
|
|
35.3
|
|
|||||||||||||
|
Other long-term obligations:
|
|
|
|||||||||||||||||||||||||
|
Pension obligations (mandated)
(d)
|
17.8
|
|
10.7
|
|
6.9
|
|
0.1
|
|
0.1
|
|
—
|
|
—
|
|
|||||||||||||
|
Total
|
$
|
5,371.8
|
|
$
|
356.3
|
|
$
|
363.1
|
|
$
|
581.7
|
|
$
|
2,600.7
|
|
$
|
169.1
|
|
$
|
1,300.9
|
|
||||||
|
(a)
|
|
Interest costs on our variable rate debt are determined based on an interest rate forecast using the forward interest rate curve and assumptions of the amount of debt outstanding. A 25 basis-point increase in our variable interest rate debt would have increased our interest costs by $25.0 over the term of our long-term debt.
|
||||||||||||||||
|
|
||||||||||||||||||
|
(b)
|
|
Obligations under license agreements relate to royalty payments and required advertising and promotional spending levels for our products bearing the licensed trademark. Royalty payments are typically made based on contractually defined net sales. However, certain licenses require minimum guaranteed royalty payments regardless of sales levels. Minimum guaranteed royalty payments and required minimums for advertising and promotional spending have been included in the table above. Actual royalty payments and advertising and promotional spending are expected to be higher. Furthermore, early termination of any of these license agreements could result in potential cash outflows that have not been reflected above.
|
||||||||||||||||
|
|
(c)
|
|
Other contractual obligations primarily represent advertising/marketing, logistics and capital improvements commitments. Additionally, we have included the mandatorily redeemable financial instruments arising out of our joint ventures as discussed in Note 5, “Joint Venture Arrangements”. We also maintain several distribution agreements for which early termination could result in potential future cash outflows that have not been reflected above.
|
||||||||||||||||
|
|
|||||||||||||||||||
|
|
(d)
|
|
Represents future contributions to our pension plans mandated by local regulations or statutes. See Note 17, “Employee Benefit Plans” in our notes to Consolidated Financial Statements for additional information on our benefit plans’ investment strategies and expected contributions and for information regarding our total underfunded pension and post-employment benefit plans of $280.8 at June 30, 2014.
|
||||||||||||||||
The table above excludes obligations for uncertain tax benefits, including interest and penalties, of
$159.4
as of June 30, 2014, as we are unable to predict when, or if, any payments would be made. See Note 15, “Income Taxes” in our notes to Consolidated Financial Statements for additional information on our uncertain tax benefits. See Note 25, “Subsequent Events” in our notes to Consolidated Financial Statements for further information on our Senior Notes included in our Long-term debt obligations.
Under the agreement relating to our fiscal 2006 acquisition of Unilever Cosmetics International, we are subject to contingent purchase price consideration payments of up to $30.0 per calendar year through 2014, depending on contractually agreed upon sales targets. In March 2014, we made a contingent purchase price consideration payment of $30.0 and currently are required to make one additional payment of $30.0 in calendar year 2015.
We have a 40% and 45% redeemable noncontrolling interest in our consolidated subsidiaries in the UAE and Hong Kong, respectively. We have the right to purchase the noncontrolling interests in these subsidiaries from the noncontrolling interest holders (“call right”) and the noncontrolling interest holders have the right to sell their noncontrolling interests (“put right”) to us at certain points in time. Given the provisions of the put and call rights, the entire noncontrolling interests are redeemable outside of our control and are recorded in temporary equity at the estimated redemption value of
$106.2
and
$105.8
as of June 30, 2014 and 2013 respectively. See Note 20, “Noncontrolling Interests and Redeemable Noncontrolling Interests” in our notes to Consolidated Financial Statements for further discussion related to the calculation of the redemption value for each of these noncontrolling interests.
47
Derivative Financial Instruments and Hedging Activities
We are exposed to foreign currency exchange fluctuations and interest rate volatility through our global operations. We utilize natural offsets to the fullest extent possible in order to identify net exposures. In the normal course of business, established policies and procedures are employed to manage these net exposures using a variety of financial instruments. We do not enter into derivative financial instruments for trading or speculative purposes.
Foreign Currency Exchange Risk Management
We operate in multiple functional currencies and are exposed to the impact of foreign currency fluctuations. For foreign currency exposures, which primarily relate to receivables, inventory purchases and sales, payables and intercompany loans, derivatives are used to better manage the earnings and cash flow volatility arising from foreign currency exchange rate fluctuations. We recorded foreign currency (losses) gains of
$(18.7)
,
$0.1
and
$(1.9)
in fiscal
2014
,
2013
and
2012
, respectively, resulting from non-financing foreign currency exchange transactions which are included in their associated expense type and are included in the Consolidated Statements of Operations. In addition, we recorded foreign currency losses of
$2.8
,
$0.2
and
$39.7
in fiscal
2014
,
2013
and
2012
, respectively, resulting from financing foreign currency exchange transactions that have been included within interest expense, net and other (income) expense, net. These expenses are net of hedging impact.
Exchange gains or losses are also partially offset through the use of qualified derivatives under hedge accounting, for which we record accumulated gains or losses in Accumulated other comprehensive income until the underlying transaction occurs at which time the gain or loss is reclassified into the respective account in the Consolidated Statement of Operations. The accumulated loss on these derivative instruments in AOCI, net of tax, was
$(8.9)
and
nil
as of
June 30, 2014
and
June 30, 2013
, respectively.
We have experienced and will continue to experience fluctuations in our net income as a result of balance sheet transactional exposures. As of June 30, 2014, a 10% unfavorable change in the exchange rate of the U.S. dollar against the prevailing market rates of foreign currencies involving balance sheet transactional exposures are estimated to result in a pretax loss of approximately $16.7. In the view of management, these hypothetical losses resulting from an assumed change in foreign currency exchange rates are not material to our consolidated financial statement position or results of operations. This loss does not include the impact on our underlying foreign currency exposures.
Interest Rate Risk Management
We are exposed to interest rate risk that relates primarily to our indebtedness, which is affected by changes in the general level of the interest rates in the United States. We periodically enter into interest rate swap agreements to facilitate our interest rate management activities. In some instances, we have designated some of these agreements as cash flow hedges and, accordingly, applied hedge accounting. The effective changes in fair value of these agreements are recorded in accumulated other comprehensive income (loss) (“AOCI/(L)”), net of tax, and ineffective portions are recorded in current- period earnings. Amounts in AOCI/(L) are subsequently reclassified to earnings as interest expense when the hedged transactions are settled. For interest rate swap agreements not designated as hedge accounting instruments, the changes in fair value from period to period are recorded in current-period earnings in the Consolidated Statements of Operations.
We expect that both at the inception and on an ongoing basis, the hedging relationship between any designated interest rate hedges and underlying variable rate debt will be highly effective in achieving offsetting cash flows attributable to the hedged risk during the term of the hedge. If it is determined that a derivative is not highly effective, or that it has ceased to be a highly effective hedge, we will be required to discontinue hedge accounting with respect to that derivative prospectively. The corresponding gain or loss position of the ineffective hedge recorded to AOCI/(L) will be reclassified to current-period earnings.
If interest rates had been 10% higher/lower and all other variables were held constant, operating income in fiscal 2014 and 2013 would decrease/increase by $3.2 and $3.5, respectively.
Credit Risk Management
We attempt to minimize credit exposure to counterparties by generally entering into derivative contracts with counterparties that have an “A” (or equivalent) credit rating. The counterparties to these contracts are major financial institutions. Exposure to credit risk in the event of nonperformance by any of the counterparties is limited to the fair value of contracts in net asset positions, which totaled
$2.1
and
$0.6
as of June 30,
2014
and
2013
, respectively. Accordingly, management believes risk of material loss under these hedging contracts is remote.
Inflation Risk
To date, we do not believe inflation has had a material effect on our business, financial condition or results of operations. However, if our costs were to become subject to significant inflationary pressures in the future, we may not be able to fully
48
offset such higher costs through price increases. Our inability or failure to do so could harm our business, financial condition and results of operations.
Off-Balance Sheet Arrangements
We had undrawn letters of credit of
$3.6
and
$3.3
as of
June 30, 2014
and
2013
, respectively.
Critical Accounting Policies
We prepare our Consolidated Financial Statements in conformity with U.S. generally accepted accounting principles. The preparation of these Consolidated Financial Statements requires us to make estimates, assumptions and judgments that affect the reported amounts of assets, liabilities, revenues and expenses related disclosures. These estimates and assumptions can be subjective and complex and, consequently, actual results may differ from those estimates that would result in material changes to our operating results and financial condition. We evaluate our estimates and assumptions on an ongoing basis. Our estimates are based on historical experience and various other assumptions that we believe to be reasonable under the circumstances. Our most critical accounting policies relate to revenue recognition, goodwill, other intangible and long-lived assets, pension and other post-employment benefit costs, share-based compensation and income taxes.
Our management has discussed the selection of significant accounting policies and the effect of estimates with the Audit and Finance Committee of our Board of Directors.
Revenue Recognition
Revenue is recognized when realized or realizable and earned. Our policy is to recognize revenue when risk of loss and title to the product transfers to the customer, which usually occurs upon delivery. Net revenues comprise gross revenues less customer discounts and allowances, actual and expected returns (estimated based on returns history and position in product life cycle) and various trade spending activities. Trade spending activities relate to advertising, product promotions and demonstrations, some of which involve cooperative relationships with customers. Returns represent
3.9%
,
3.7%
and
3.5%
of gross revenue after customer discounts and allowances in fiscal
2014
,
2013
and
2012
, respectively. Trade spending activities represent
9.4%
,
9.4%
and
9.8%
in fiscal
2014
,
2013
and
2012
, respectively.
Our sales return accrual, which primarily relates to our Fragrances and Skin & Body Care segments, reflects seasonal fluctuations, including those related to the holiday season in our second quarter. This accrual is a subjective critical estimate that has a direct impact on reported net revenues, and is calculated based on history of actual returns, estimated future returns and information provided by retailers regarding their inventory levels. In addition, as necessary, specific accruals may be established for significant future known or anticipated events. The types of known or anticipated events that we have considered, and will continue to consider, include, but are not limited to, the financial condition of our customers, store closings by retailers, changes in the retail environment, and our decision to continue to support new and existing brands. If the historical data we use to calculate these estimates does not approximate future returns, additional allowances may be required.
Goodwill, Other Intangible Assets and Long-Lived Assets
Goodwill is calculated as the excess of the cost of purchased businesses over the fair value of their underlying net assets. Other intangible assets consist of indefinite-lived trademarks. Goodwill and other indefinite-lived intangible assets are not amortized.
We assess goodwill at least annually as of May 1 for impairment, or more frequently, if certain events or circumstances warrant. We test goodwill for impairment at the reporting unit level, which is one level below our reportable segments. We identify our reporting units by assessing whether the components of our reporting segments constitute businesses for which discrete financial information is available and management of each reporting unit regularly reviews the operating results of those components. We have identified five reporting units. Color Cosmetics is considered an operating segment and a reporting unit and our Fragrances and Skin & Body Care operating segments each includes two reporting units.
Impairment testing for goodwill is performed in two steps: (i) the determination of possible impairment, based upon the fair value of a reporting unit as compared to its carrying value; and (ii) if there is a possible impairment indicated, this step measures the amount of impairment loss, if any, by comparing the implied fair value of goodwill with the carrying amount of that goodwill. We make certain judgments and assumptions in allocating assets and liabilities to determine carrying values for our reporting units.
Testing goodwill for impairment requires us to estimate fair values of reporting units using significant estimates and assumptions. The assumptions made will impact the outcome and ultimate results of the testing. We use industry accepted valuation models and set criteria that are reviewed and approved by various levels of management and, in certain instances, we engage independent third-party valuation specialists for advice. To determine fair value of the reporting unit, we used a combination of the income and market approaches, giving heavier weighting to the income approach. We believe the blended
49
use of both models compensates for the inherent risk associated with either model if used on a stand-alone basis, and this combination is indicative of the factors a market participant would consider when performing a similar valuation.
Under the income approach, we determine fair value using a discounted cash flow method, projecting future cash flows of each reporting unit, as well as a terminal value, and discounting such cash flows at a rate of return that reflects the relative risk of the cash flows. Under the market approach, we utilize information from comparable publicly traded companies with similar operating and investment characteristics as the reporting units, which creates valuation multiples that are applied to the operating performance of the reporting units being tested, to value the reporting unit.
The key estimates and factors used in these approaches include, but are not limited to, revenue growth rates and profit margins based on our internal forecasts, our specific weighted-average cost of capital used to discount future cash flows, and comparable market multiples for the industry segment as well as our historical operating trends. Certain future events and circumstances, including deterioration of market conditions, higher cost of capital, a decline in actual and expected consumer consumption and demands, could result in changes to these assumptions and judgments. A downward revision of these assumptions could cause the fair values of the reporting units to fall below their respective carrying values. We would then perform the second step of the goodwill impairment test to determine the amount of any non-cash impairment charge. Such charge could have a material effect on the Consolidated Statements of Operations and Balance Sheets.
In fiscal 2014, we anticipated realizing significant improvements in cash flows in our Beauty - Skin & Body Care Reporting Units China operations beginning in the third quarter due to the reorganization of our management team and distribution network in China and the launch of new product offerings. In the course of evaluating the results for the third quarter and the preparation of third quarter financial statements, we noted the net cash outflows associated with the TJoy mass channel business in China were significantly in excess of previous expectations and management concluded that the results in China represented an indicator of impairment that required an interim impairment test for goodwill and certain other intangible assets in the Beauty - Skin & Body Care Reporting Unit.
In step one of the goodwill impairment test, we identified that the carrying value of the reporting unit exceeded its fair value based on a re-evaluation of discounted cash flows and confirmed by using a market approach to value the reporting unit. The main drivers of the decline were a decrease in average net sales growth rates for the reporting unit from high-single digits to mid-single digits and an increase in weighted average cost of capital, each based on management's recent estimates.
In step two of the test, the implied fair value of goodwill was determined by comparing the fair value of the other assets in the reporting unit to the fair value of the reporting unit. Predominantly as a result of the fair value of the
adidas
license, the implied fair value of goodwill was determined to be nil. Consequently, goodwill was fully impaired, resulting from a reduction in fair value of the Beauty - Skin & Body Care reporting unit of 43.4% from the May 1, 2013 fair value and a total non-cash impairment charge of $316.9, of which $256.4 related to goodwill and $60.5 to other assets.
There were no impairments of goodwill at other reporting units. Based on the annual impairment test performed at May 1, 2014, we determined that the fair values of its other reporting units significantly exceeded their respective carrying values at that date by a range of approximately 25% to greater than 100%. To determine the fair value of our reporting units, we have used expected growth rates that are in line with expected market growth rates for the respective product categories and include a discount rate of 10.5%.
Due to lower than expected actual net revenues of the Philosophy business, lower than expected actual and projected future cash flows and a delay in anticipated cost savings due to a re-prioritization of cost savings projects across all reporting segments, in fiscal 2012 we performed an impairment test for the Prestige-Skin & Body Care reporting unit. Decreases in assumptions resulted in a reduction of the fair value of the Prestige-Skin & Body Care reporting unit below its carrying value. As a result, we performed the second step of the goodwill impairment test to calculate the implied fair value of goodwill, by allocating the calculated fair value to the assets and liabilities (other than goodwill) of the Prestige-Skin & Body Care reporting unit. Based on this impairment test, we recorded a pre-tax non-cash impairment of goodwill at the Prestige-Skin & Body Care reporting unit of $384.4 in asset impairment charges in the Consolidated Statements of Operations, reducing goodwill at this reporting unit from $437.1 to $52.7 during fiscal 2012.
We believe the assumptions used in calculating the estimated fair value of the reporting units are reasonable and attainable. However, we can provide no assurances that we will achieve such projected results. Further, we can provide no assurances that we will not have to recognize additional impairment of goodwill in the future due to other market conditions or changes in our interest rates. Recognition of additional impairment of a significant portion of our goodwill would negatively affect our reported results of our operations and total capitalization.
None of the reporting units were impaired or at a high risk of failing step one of the impairment test during fiscal 2013.
Other Intangible Assets
50
We assess indefinite-lived other intangible assets at least annually as of May 1 for impairment, or more frequently if certain events occur or circumstances change that would more likely than not reduce the fair value of an indefinite-lived intangible asset below its carrying value. Trademarks are tested for impairment on a brand level basis.
The trademarks’ fair values are based upon the income approach, primarily utilizing the relief from royalty methodology. This methodology assumes that, in lieu of ownership, a third party would be willing to pay a royalty in order to obtain the rights to use the comparable asset. An impairment loss is recognized when the estimated fair value of the intangible asset is less than the carrying value. Fair value calculation requires significant judgments in determining both the assets’ estimated cash flows as well as the appropriate discount and royalty rates applied to those cash flows to determine fair value. Variations in the economic conditions or a change in general consumer demands, operating results estimates or the application of alternative assumptions could produce significantly different results.
In the course of evaluating the results for the third quarter and the preparation of third quarter financial statements, we noted the net cash outflows associated with the TJoy mass channel business in China were significantly in excess of previous expectations and management concluded that the results in China represented an indicator of impairment that required an interim impairment test for goodwill and certain other intangible assets in the Beauty - Skin & Body Care Reporting Unit.
Concurrent with the evaluation of future cash flows of the reporting unit, we also re-evaluated future cash flows from other long lived assets in China, consisting of the TJoy trademark, customer relationships and a manufacturing facility, with a total carrying value of $69.1. It was determined that the carrying value of this asset group exceeded its fair value resulting in an impairment charge of
$60.5
. The TJoy trademark and customer relationships of
$21.0
and
$33.5
, respectively, were fully impaired and the remaining $6.0 impairment charge was attributable to the reduction of the carrying value of a manufacturing facility.
In fiscal 2013 and 2012, we performed our annual impairment testing of indefinite-lived intangibles and noted no impairments were required in fiscal 2013 and adjustments for Philosophy trademark of $130.6 and TJoy trademark of $58.0 were required in 2012.
We believe the assumptions used in calculating the estimated fair value of the trademarks are reasonable and attainable. However, we can provide no assurances that we will not have to recognize additional impairment of indefinite-lived intangible assets in the future due to other market conditions or changes in our interest rates. Recognition of additional impairment of a significant portion of our indefinite-lived intangible assets would negatively affect our reported results of operations and total capitalization.
Long-Lived Assets
Long-lived assets, including tangible and intangible assets with finite lives, are amortized over their respective lives to their estimated residual values and are also reviewed for impairment whenever certain triggering events may indicate impairment. When such events or changes in circumstances occur, a recoverability test is performed comparing projected undiscounted cash flows from the use and eventual disposition of an asset or asset group to its carrying value. If the projected undiscounted cash flows are less than the carrying value, an impairment would be recorded for the excess of the carrying value over the fair value, which is determined by discounting future cash flows.
During fiscal 2014, we recorded a $6.0 impairment charge in asset impairment charges in the Consolidated Statements of Operations related to a manufacturing facility in China as discussed above in "Other Intangible Assets". During fiscal 2013, we sold a manufacturing facility for $2.0. The manufacturing facility had a net book value of $3.5, resulting in an asset impairment charge of $1.5. During fiscal 2012, we recorded an asset impairment charge for a manufacturing facility totaling $2.9. Each of the impairment charges were included in Corporate.
Pension and Other Post-Employment Benefit Costs
We sponsor both funded and unfunded pension and other post-employment plans in various forms covering employees who meet the applicable eligibility requirements. We use several statistical and other factors in an attempt to estimate future events in calculating the liability and expense related to these plans. Certain significant variables require us to make assumptions that are within our control such as anticipated discount rate, expected rate of return on plan assets and future compensation levels. We evaluate these assumptions with our actuarial advisors and select assumptions that we believe reflect the economics underlying our pension and post-employment obligations. While we believe these assumptions are within accepted industry ranges, an increase or decrease in the assumptions or economic events outside our control could have a direct impact on reported net income.
The discount rates used to measure the benefit obligations at the measurement date and the net periodic benefit cost for the subsequent fiscal year are reset annually using data available at the measurement date.
51
The long-term rates of return on our pension plan assets are based on management’s expectations of long-term average rates of return to be achieved by the underlying investment portfolios. In establishing this assumption, management considers historical and expected returns for the assets in which the plan is invested, as well as current economic and market conditions. The difference between actual and expected return on plan assets is reported as a component of accumulated other comprehensive income (loss). Those gains or losses that are subject to amortization over future periods will be recognized as a component of the net periodic benefit cost in such future periods. In fiscal 2014, our pension plans had actual returns on assets of $6.1 as compared with expected return on assets of $3.7, which resulted in a net deferred gain of $2.4, substantially all of which is currently subject to be amortized over periods ranging from approximately 8 to 36 years. The actual return on assets was primarily related to the performance of equity markets during the past fiscal year.
The rate of future compensation increases is another assumption used by our third-party actuarial consultants for pension accounting.
The weighted-average assumptions used to determine our projected benefit obligation were as follows:
|
Pension Plans
|
Other Post-Employment Benefits
|
||||||||||
|
U.S
|
International
|
||||||||||
|
2014
|
2013
|
2014
|
2013
|
2014
|
2013
|
||||||
|
Discount rates
|
3.1%-4.4%
|
3.6%-5.0%
|
1.8%-3.2%
|
2.3%-3.8%
|
4.8%
|
5.4%
|
|||||
|
Future compensation growth rates
|
N/A
|
N/A
|
2.0%-2.5%
|
2.0%-2.5%
|
N/A
|
N/A
|
|||||
The weighted-average assumptions used to determine our net periodic benefit cost during the fiscal year were as follows:
|
Pension Plans
|
Other Post-
Employment Benefits |
||||||||||||||||||
|
U.S.
|
International
|
||||||||||||||||||
|
2014
|
2013
|
2012
|
2014
|
2013
|
2012
|
2014
|
2013
|
2012
|
|||||||||||
|
Discount rates
|
3.6%-5.0%
|
|
3.4%-4.6%
|
4.3%-5.6%
|
2.3%-3.8%
|
2.2%-4.5%
|
2.7%-6.1%
|
5.4
|
%
|
4.9%
|
5.9%
|
||||||||
|
Future compensation growth rates
|
N/A
|
|
N/A
|
N/A
|
2.0%-2.5%
|
2.5%-3.0%
|
2.0%-3.0%
|
N/A
|
|
N/A
|
N/A
|
||||||||
|
Expected long-term rates of return on plan assets
|
6.5
|
%
|
6.5%
|
6.5%
|
3.3%-4.3%
|
3.3%-4.3%
|
3.3%-5.5%
|
N/A
|
|
N/A
|
N/A
|
||||||||
Our post-employment plans comprise health care plans that could be impacted by health care cost trend rates, which may have a significant effect on the amounts reported. A one-percentage point change in assumed health care cost trend rates would have the following effects:
|
One Percentage Point Increase
|
One Percentage Point Decrease
|
||||||||||||||
|
Effect on total service cost and interest cost
|
$
|
1.0
|
|
$
|
(0.8
|
)
|
|||||||||
|
Effect on post-employment benefit obligation
|
17.1
|
|
(13.3
|
)
|
|||||||||||
In addition, our actuarial consultants use other factors such as withdrawal and mortality rates. The actuarial assumptions used by us may differ materially from actual results due to changing market and economic conditions, higher or lower withdrawal rates or longer or shorter life spans of participants, among other things. Differences from these assumptions could significantly impact the actual amount of net periodic benefit cost and liability recorded by us.
Share-Based Compensation
As of June 12, 2013, the date the amendment and restatement of our share-based compensation plans became effective, we account for our share-based compensation plans as equity plans. Accordingly, share-based compensation is estimated and fixed based on the fair value of outstanding share-based instruments on June 12, 2013, net of estimated forfeitures and recognized over the requisite service period. Prior to June 12, 2013, our share-based compensation plans were accounted for as liability plans as they allowed for cash settlement or contained put features to sell shares back to us for cash. Accordingly, share-based compensation expense was measured at the end of each reporting period based on the fair value of the award on each reporting date and was recognized as an expense to the extent vested until the award was settled. On June 12, 2013, the ability to settle the awards for cash and the put features to sell the shares back to us for cash was eliminated. The share-based compensation plans provide only a share settlement option and, as such the plans are accounted for as equity plans.
Prior to June 12, 2013, if the award was settled for shares, the shares were included in the number of shares of common stock outstanding, and the fair value of the shares was classified as either a liability, and included in accrued expenses and other
52
current liabilities, or classified as Redeemable common stock, provided that holders have retained the risks and rewards of share ownership for a reasonable period of time. The fair value of the shares was re-measured at each reporting period date through Selling, general and administrative expense as share-based compensation expense if the shares were classified as Accrued expenses and other current liabilities or through Additional paid-in capital if the shares were classified between liability and equity as redeemable common stock.
Prior to June 12, 2013, the fair value of stock options and special incentive awards was determined using the Black-Scholes and Monte Carlo valuation models, respectively, using the following weighted-average assumptions, in addition to the estimated value of our common stock as of June 12, 2013, and June 30, 2012. During fiscal 2013, prior to achieving a target fair value for our share price, we used the Monte Carlo valuation method to value the special incentive award. After achieving the target fair value for our share price in December 2012 we used the estimated value of our common stock at each reporting date to value the special incentive award.
|
|
Year Ended June 30,
|
|||
|
2013
|
2012
|
|||
|
Expected life of option
|
4.03 yrs
|
4.32 yrs
|
|
|
|
Expected life of awards
|
5.00 yrs
|
5.00 yrs
|
|
|
|
Risk-free interest rate
|
0.84%–1.51%
|
0.72%–1.77%
|
|
|
|
Expected volatility
|
32.53%–33.01%
|
32.80
|
%
|
|
|
Expected dividend yield
|
0.86%–0.97%
|
—
|
%
|
|
Share-based compensation expense totaled $46.8, $144.4 and $142.6 in fiscal 2014, 2013 and 2012, respectively. Share-based compensation expense is recorded in Selling, general and administrative expenses in the Consolidated Statements of Operations.
Prior to June 12, 2013, management evaluated the impact of share-based compensation on operating income by comparing the expense that was recorded under liability plan accounting to the expense that would have been recorded if the plans had been accounted for as equity plans. This evaluation was relevant to management for the following reasons:
|
|
|||||||||||||||||||
|
•
|
|
several of our main competitors account for their share-based compensation plans as equity plans;
|
|||||||||||||||||
|
|
|||||||||||||||||||
|
•
|
|
our share-based compensation plans would be accounted for as equity plans in connection with our IPO, because the participants would no longer be able to settle the awards under the plan in cash or sell the shares back to us for cash; and
|
|||||||||||||||||
|
|
|||||||||||||||||||
|
•
|
|
certain financial covenant calculations for our debt agreements were derived from calculations including share-based compensation expenses based on the equity method of accounting.
|
|||||||||||||||||
The following table compares the impact of share-based compensation expense in total to share-based compensation expense under equity plan accounting based on grant date fair value, which is used to measure the performance of segments:
|
|
Year Ended June 30,
|
|||||||||||
|
2014
|
2013
|
2012
|
||||||||||
|
Share-based compensation expense:
|
|
|
|
|||||||||
|
Expense under liability plan accounting prior to June 12, 2013
|
$
|
—
|
|
$
|
142.2
|
|
$
|
142.6
|
|
|||
|
Expense under equity plan accounting based on June 12, 2013 fair value
|
46.8
|
|
2.2
|
|
—
|
|
||||||
|
Total share-based compensation expense
(a)
|
46.8
|
|
144.4
|
|
142.6
|
|
||||||
|
Expense under equity plan accounting based on grant date fair value
(b)
|
19.2
|
|
24.1
|
|
32.7
|
|
||||||
|
Share-based compensation expense adjustment
(c)
|
$
|
27.6
|
|
$
|
120.3
|
|
$
|
109.9
|
|
|||
53
|
|
||||||||||||||||||||
|
|
(a)
|
|
See Note 22, “Share-Based Compensation Plans,” in our notes to the Consolidated Financial Statements.
|
|||||||||||||||||
|
|
||||||||||||||||||||
|
|
(b)
|
|
Share-based compensation expense calculated as if we had applied equity plan accounting since the grant date of the award for our recurring nonqualified stock option awards and director-owned and employee-owned shares, restricted shares, and restricted stock units.
|
|||||||||||||||||
|
|
||||||||||||||||||||
|
|
(c)
|
|
Share-based compensation adjustment in fiscal 2014, 2013, and 2012 consisted of (i) the difference between share-based compensation expense accounted for under equity plan accounting based on the grant date fair value and total share-based compensation expense, which was accounted for under liability plan accounting prior to June 12, 2013 and equity plan accounting subsequent to the IPO based on the fair value on June 12, 2013, for the recurring nonqualified stock option awards and director-owned and employee-owned shares, restricted shares and restricted stock units and (ii) all costs associated with the special incentive awards granted in fiscal 2012 and 2011. Vesting of the special incentive awards is dependent upon the occurrence of (i) an initial public offering by September 14, 2015, or (ii) if an initial public offering has not occurred by September 14, 2015, upon achievement of a target fair value of our share price and the completion of the service period on September 14, 2015. On June 13, 2013, the date our Class A common stock began trading on the New York Stock Exchange, 50% of the special incentive awards vested.
|
|||||||||||||||||
|
The remaining 50% of the special incentive awards vested on June 13, 2014 the one-year anniversary of the IPO. Prior to the IPO, we used liability plan accounting to measure share-based compensation expense in the Consolidated Statements of Operations on common stock issued to employees and directors to the extent the holders have not retained the risks and rewards of share ownership for a reasonable period of time, as determined under applicable accounting guidance. Once the holders have retained these risks and rewards for a reasonable period of time, generally deemed to be a period of six months from vesting and issuance, the liability recorded in our Consolidated Balance Sheets was reclassified as Redeemable common stock at fair value. Subsequent changes in fair value of the shares classified as Redeemable common stock were recognized in retained earnings or, in the absence of retained earnings, in additional paid-in capital. We use equity plan accounting based on grant date fair value to measure the performance of the segments.
|
||||||||||||||||||||
As a result of the transition from liability plan accounting to equity plan accounting for our share-based awards, a final “mark to market” of the liability related to such awards was recorded. Based on our IPO price, we recorded share-based compensation expense of $34.0, reclassified $188.9 from Accrued expenses and other current liabilities and $256.5 from Redeemable common stock to Additional paid in capital which reflects the change in the pre-IPO carrying amount and the estimated fair value of outstanding share-based awards and other share-based compensation activity as of June 12, 2013. The expense was recorded as an increase in share-based compensation expense and included in Selling, general and administrative expenses in the Consolidated Statements of Operations.
Income Taxes
We are subject to income taxes in the U.S. and various foreign jurisdictions. We account for income taxes under the asset and liability method. Therefore, income tax expense is based on reported income before income taxes, and deferred income taxes reflect the effect of temporary differences between the amounts of assets and liabilities that are recognized for financial reporting purposes and the amounts that are recognized for income tax purposes. Deferred taxes are recorded at currently enacted statutory tax rates and are adjusted as enacted tax rates change.
Classification of deferred tax assets and liabilities corresponds with the classification of the underlying assets and liabilities, giving rise to the temporary differences or the period of expected reversal, as applicable. A valuation allowance is established, when necessary, to reduce deferred tax assets to the amount that is more likely than not to be realized based on currently available evidence. We consider how to recognize, measure, present and disclose in financial statements uncertain tax positions taken or expected to be taken on a tax return.
We are subject to tax audits in various jurisdictions. We regularly assess the likely outcomes of such audits in order to determine the appropriateness of liabilities for unrecognized tax benefits. We classify interest and penalties related to unrecognized tax benefits as a component of the provision for income taxes.
For unrecognized tax benefits, we first determine whether it is more-likely-than-not (defined as a likelihood of more than fifty percent) that a tax position will be sustained based on its technical merits as of the reporting date, assuming that taxing authorities will examine the position and have full knowledge of all relevant information. A tax position that meets this more-likely-than-not threshold is then measured and recognized at the largest amount of benefit that is greater than fifty percent likely to be realized upon effective settlement with a taxing authority. As the determination of liabilities related to unrecognized tax benefits, associated interest and penalties requires significant estimates to be made by us, there can be no assurance that we will accurately predict the outcomes of these audits, and thus the eventual outcomes could have a material impact on our operating results or financial condition.
Unrecognized tax benefits are reviewed on an ongoing basis and are adjusted in light of changing facts and circumstances, including progress of examinations by tax authorities, developments in case law and closing of statute of limitations. Such adjustments are reflected in the provision for income taxes as appropriate. In addition, we are present in over 35 tax jurisdictions and we are subject to the continuous examination of our income tax returns by the Internal Revenue Service (IRS)
54
and other tax authorities. We regularly assess the likelihood of adverse outcomes resulting from these examinations to determine the adequacy of our provision for income taxes.
It is our intention to permanently reinvest undistributed earnings and profits from our foreign operations that have been generated through June 30, 2014 and future plans do not demonstrate a need to repatriate the foreign amounts to fund U.S. operations. Accordingly, no provision has been made for U.S. income taxes on undistributed earnings of foreign subsidiaries as of June 30, 2014. It is not practicable for us to determine the amount of additional income and withholding taxes that may be payable in the event the remaining undistributed earnings are repatriated.
The balance of cumulative undistributed earnings of non-U.S. subsidiaries was
$1,879.1
and $1,535.0 as of June 30, 2014 and 2013, respectively. Our cash and cash equivalents balance at June 30, 2014 and 2013, includes $1,233.1 and $914.2, respectively, of cash held by foreign operations associated with our permanent reinvestment strategy.
Item 7A.
Quantitative and Qualitative Disclosures About Market Risk.
We have operations both within the U.S. and internationally, and we are exposed to market risks in the ordinary course of our business, including the effect of foreign currency fluctuations, interest rate changes ad inflation. Information relating to quantitative and qualitative disclosures about these market risks is set forth in under the captions “Foreign Currency Exchange Risk Management,” “Interest Rate Risk Management,” and “Credit Risk Management” within Item 7, “Management’s Discussion and Analysis of Financial Condition and Results of Operations—Liquidity and Capital Resources” and is incorporated in this Item 7A by reference.
Item 8.
Financial Statements and Supplementary Data.
The information required by this Item appears beginning on page F-1 of this Annual Report on Form 10-K and is incorporated in this Item 8 by reference.
Item 9A.
Controls and Procedures.
Evaluation of Disclosure Controls and Procedures
We maintain “disclosure controls and procedures,” as defined in Rules 13a-15(e) and 15d-15(e) under the Exchange Act, that are designed to ensure that information required to be disclosed by a company in the reports that it files or submits under the Exchange Act is recorded, processed, summarized and reported within the time periods specified in the SEC’s rules and forms. Disclosure controls and procedures include, without limitation, controls and procedures designed to ensure that information required to be disclosed by a company in the reports that it files or submits under the Exchange Act is accumulated and communicated to our management, including its principal executive and principal financial officers, as appropriate to allow timely decisions regarding required disclosure.
Our management, with the participation of our Chief Executive Officer (“CEO”) and our Chief Financial Officer (“CFO”), evaluated the effectiveness of our disclosure controls and procedures as of
June 30, 2014
. Based on the evaluation of our disclosure controls and procedures as of
June 30, 2014
, our CEO and CFO concluded that, as of such date, our disclosure controls and procedures were effective at the reasonable assurance level.
We have included our Management Report over Internal Control over Financial Reporting in “Item 15. Exhibits, Financial Statement Schedules” and is incorporated in this Item 9A by reference.
Changes in Internal Control over Financial Reporting
There were no changes in our internal control over financial reporting identified in management’s evaluation pursuant to Rules 13a-15(f) and 15d-15(f) of the Exchange Act during the year that materially affected, or are reasonably likely to materially affect, our internal control over financial reporting.
Inherent Limitations on Effectiveness of Controls
Our management, including our CEO and CFO, believes that our disclosure controls and procedures and internal control over financial reporting are designed to provide reasonable assurance of achieving our objectives and are effective at the reasonable assurance level. However, our management does not expect that our disclosure controls and procedures or our internal control over financial reporting will prevent all errors and all fraud. A control system, no matter how well conceived and operated, can provide only reasonable, not absolute, assurance that the objectives of the control system are met. Further, the
55
design of a control system must reflect the fact that there are resource constraints, and the benefits of controls must be considered relative to their costs. Because of the inherent limitations in all control systems, no evaluation of controls can provide absolute assurance that all control issues and instances of fraud, if any, have been detected. These inherent limitations include the realities that judgments in decision making can be faulty, and that breakdowns can occur because of a simple error or mistake. Additionally, controls can be circumvented by the individual acts of some persons, by collusion of two or more people or by management override of the controls. The design of any system of controls is also based in part upon certain assumptions about the likelihood of future events, and there can be no assurance that any design will succeed in achieving its stated goals under all potential future conditions; over time, controls may become inadequate because of changes in conditions, or the degree of compliance with policies or procedures may deteriorate. Because of the inherent limitations in a cost-effective control system, misstatements due to error or fraud may occur and not be detected.
Item 10.
Directors, Executive Officers and Corporate Governance.
Directors
Information regarding directors is incorporated by reference to the “Directors” and “Corporate Governance” sections of our proxy statement on Schedule 14A for the 2014 Annual Meeting of Shareholders (“2014 Proxy Statement”).
Executive Officers
Information regarding executive officers is incorporated by reference to the “Executive Officers” section of our 2014 Proxy Statement.
Section 16(a) Beneficial Ownership Reporting Compliance
This information is incorporated by reference to the “Section 16(a) Beneficial Ownership Reporting Compliance” section of our 2014 Proxy Statement.
Code of Ethics
T
his information is incorporated by reference to the “Corporate Governance Guidelines and Code of Business Conduct” section of our 2014 Proxy Statement.
Item 11.
Executive Compensation.
This information is incorporated by reference to the “Executive Compensation” and “Director Compensation” sections of our 2014 Proxy Statement.
Item 12.
Security Ownership of Certain Beneficial Owners and Management and Related Stockholder Matters.
This information is incorporated by reference to the “Security Ownership of Certain Beneficial Owners and Management” section of our 2014 Proxy Statement.
Item 13.
Certain Relationships and Related Transactions, and Director Independence.
This information is incorporated by reference to the “Certain Relationships and Transactions of Related Persons” and “Corporate Governance” section of our 2014 Proxy Statement.
Item 14.
Principal Accounting Fees and Services
.
This information is incorporated by reference to the “Audit Fees and Other Fees” section of our 2014 Proxy Statement.
List of documents filed as part of this Report:
|
(1)
|
Consolidated Financial Statements and Reports of Independent Registered Public Accounting Firm included herein: See Index on page F-1.
|
|
(2)
|
Financial Statement Schedule: See S-1.
|
56
|
(3)
|
All other schedules are omitted as they are inapplicable or the required information is furnished in the Company’s Consolidated Financial Statements or the Notes thereto.
|
|
(4)
|
List of Exhibits:
|
|
Exhibit
Number
|
Document
|
||
|
3.1
|
|
Form of Amended and Restated Certificate of Incorporation (previously filed on May 14, 2013 as Exhibit 3.1 to Amendment No. 5 to the registrant’s Registration Statement on Form S-1)
|
|
|
3.2
|
|
Amended and Restated By-Laws (previously filed on April 24, 2013 as Exhibit 3.2 to Amendment No. 4 to the registrant’s Registration Statement on Form S-1)
|
|
|
4.1
|
|
Specimen Class A Common Stock Certificate of the registrant (previously filed on May 28, 2013 as Exhibit 4.1 to Amendment No. 6 to the registrant’s Registration Statement on Form S-1)
|
|
|
4.2
|
|
Specimen Class B Common Stock Certificate of the registrant (previously filed on May 28, 2013 as Exhibit 4.1 to Amendment No. 6 to the registrant’s Registration Statement on Form S-1)
|
|
|
10.1
|
|
Credit Agreement, dated as of April 2, 2013, among the registrant, JPMorgan Chase Bank, N.A. as Administrative Agent, Bank of America, N.A., BNP Paribas, Crédit Agricole Corporate & Investment Bank, Deutsche Bank Securities Inc., ING Bank N.V., Morgan Stanley MUFG Loan Partners, LLC and Wells Fargo Bank, N.A. as Syndication Agents, J.P. Morgan Securities LLC, BNP Paribas Securities Corp., Crédit Agricole Corporate & Investment Bank, Deutsche Bank Securities Inc., ING Bank N.V., Merrill Lynch Pierce, Fenner & Smith Incorporated, Morgan Stanley MUFG Loan Partners, LLC and Wells Fargo Securities, LLC as Lead Arrangers and Joint Bookrunners, and the lenders party thereto (previously filed on April 24, 2013 as Exhibit 10.1 to Amendment No. 4 to the registrant’s Registration Statement on Form S-1)
|
|
|
10.2
|
|
Incremental Term Loan Amendment, dated as of June 25, 2014, to the Credit Agreement among the Company, JPMorgan Chase Bank, N.A., as administrative agent, and the Lenders listed on the signature page thereto (previously filed on June 25, 2014 as Exhibit 10.1 to the registrant's current report on Form 8-K)
|
|
|
10.3
|
|
Agreement of Lease, dated as of July 14, 2008 and amended as of March 17, 2009, May 19, 2011 and April 6, 2012, between the registrant and Empire State Building Company L.L.C. (previously filed on January 24, 2013 as Exhibit 10.4 to Amendment No. 2 to the registrant’s Registration Statement on Form S-1)
|
|
|
10.4
|
|
Lease Agreement, dated as of July 12, 2013, between Coty France S.A.S. and Patrizia Gewerbeinvest KAG MBH (previously filed on November 8, 2013 as Exhibit 10.8 to the registrant’s Annual Report on Form 10-K)
|
|
|
10.5
|
|
Lease Agreement, dated as of January 22, 2014, between the Company and Westinvest Gesellschaft Für Ivesmentfonds mbH (previously filed on May 14, 2014 as Exhibit 10.8 to the registrant's quarterly report on Form 10-Q)
|
|
|
10.6
|
|
Lease Agreement, dated as of November 12, 1992 and amended as of February 4, 1994, March 10, 1997, January 23, 2000, March 31, 2000, August 1, 2006, January 28, 2008 and August 14, 2012 between Baker-Properties Limited Partnership and Coty US LLC (previously filed on January 24, 2013 as Exhibit 10.9 to Amendment No. 2 to the registrant’s Registration Statement on Form S-1)
|
|
|
10.7
|
|
Lease, entered into as of March 31, 2000 and amended as of August 1, 2006, September 8, 2009, August 16, 2010 and August 14, 2012 between WU/LH 100 American L.L.C., as successor to Baker Properties Limited Partnership, and Coty US LLC (previously filed on January 24, 2013 as Exhibit 10.10 to Amendment No. 2 to the registrant’s Registration Statement on Form S-1)
|
|
|
10.8
|
|
Lease, dated as of July 25, 2011, between Terinvest SA and Coty Geneva S.A. (previously filed on January 24, 2013 as Exhibit 10.11 to Amendment No. 2 to the registrant’s Registration Statement on Form S-1)
|
|
|
10.9
|
|
Lease Agreement, dated August 14, 2012 between WU/LH 500 American L.L.C. and Coty US LLC (previously filed on January 24, 2013 as Exhibit 10.12 to Amendment No. 2 to the registrant’s Registration Statement on Form S-1)
|
|
57
|
10.10
|
|
Lease Agreement, dated April 17, 2014 between Coty Lancaster S.A.M. and Catherine Matthyssens
|
|
|
10.11
|
|
Employment Agreement, dated September 25, 2012, between Coty Italia S.P.A. and Michele Scannavini (previously filed on May 14, 2013 as Exhibit 10.14 to Amendment No. 5 to the registrant’s Registration Statement on Form S-1)
|
|
|
10.12
|
|
Employment Agreement, dated November 19, 2007, between the registrant and Jules Kaufman (previously filed on May 14, 2013 as Exhibit 10.15 to Amendment No. 5 to the registrant’s Registration Statement on Form S-1)
|
|
|
10.13
|
|
Employment Agreement, dated February 18, 1998, between Coty S.A. and Géraud-Marie Lacassagne (previously filed on May 14, 2013 as Exhibit 10.16 to Amendment No. 5 to the registrant’s Registration Statement on Form S-1)
|
|
|
10.14
|
|
Employment Agreement, dated September 15, 2013, between Coty Inc. and Darryl McCall (previously filed on September 17, 2013 as Exhibit 10.17 to the registrant's Annual Report on Form 10-K)
|
|
|
10.15
|
|
Employment Agreement, dated October 1, 2012, between Coty S.A.S. and Jean Mortier (previously filed on May 14, 2013 as Exhibit 10.19 to Amendment No. 5 to the registrant’s Registration Statement on Form S-1)
|
|
|
10.16
|
|
Rider, dated October 15, 2012, to Employment Agreement, dated July 20, 2006, between Coty S.A.S. and Jean Mortier (previously filed on May 14, 2013 as Exhibit 10.20 to Amendment No. 5 to the registrant’s Registration Statement on Form S-1)
|
|
|
10.17
|
|
Employment Agreement, dated November 18, 2008, between the registrant and Sérgio Pedreiro (previously filed on May 14, 2013 as Exhibit 10.21 to Amendment No. 5 to the registrant’s Registration Statement on Form S-1)
|
|
|
10.18
|
|
Employment Agreement, dated July 4, 2012, between Coty Geneva S.A. Versoix. and Renato Semerari (previously filed on May 14, 2013 as Exhibit 10.22 to Amendment No. 5 to the registrant’s Registration Statement on Form S-1)
|
|
|
10.19
|
|
Employment Agreement, dated December 3, 2013, between the registrant and Patrice de Talhouët (previously filed on December 6, 2013 as Exhibit 10.1 to the registrant's current report on Form 8-K)
|
|
|
10.20
|
|
Letter Agreement, dated December 3, 2013, between the registrant and Sergio Pedreiro (previously filed on December 6, 2013 as Exhibit 10.2 to the registrant's current report on Form 8-K)
|
|
|
10.21
|
|
Employment Agreement, dated January 22, 2014, between Coty Geneva S.A. Versoix and Catia Cesari (previously filed on May 14, 2014 as Exhibit 10.48 to the registrant's quarterly report on Form 10-Q)
|
|
|
10.22
|
|
Employment Agreement, dated January 2014, between Coty Geneva S.A. Versoix and Mario Reis
|
|
|
10.23
|
|
Employment Agreement, dated January 18, 2008 between Coty S.A.S. and Thomas Muench (previously filed on May 16, 2014 as Exhibit 10.1 to the registrant's current report on Form 8-K)
|
|
|
10.24
|
|
Short Term Transfer Agreement Letter, dated May 5, 2014, between the registrant and Thomas Muench (previously filed on May 16, 2014 as Exhibit 10.2 to the registrant's current report on Form 8-K)
|
|
|
10.25
|
|
Separation Agreement, dated July 21, 2014, between the registrant and Ralph Macchio
|
|
|
10.26
|
|
Separation Agreement, dated June 24, 2014, between the registrant and James E. Shiah
|
|
|
10.27
|
|
Form of Indemnification Agreement between the registrant and its directors and officers (previously filed on April 24, 2013 as Exhibit 10.24 to Amendment No. 4 to the registrant’s Registration Statement on Form S-1)
|
|
|
10.28
|
|
Coty Inc. Annual Performance Plan, as amended and restated on April 8, 2013 (previously filed on April 24, 2013 as Exhibit 10.27 to Amendment No. 4 to the registrant’s Registration Statement on Form S-1)
|
|
|
10.29
|
|
Coty Inc. Long-Term Incentive Plan, as amended and restated on April 8, 2013 (previously filed on April 24, 2013 as Exhibit 10.28 to Amendment No. 4 to the registrant’s Registration Statement on Form S-1)
|
|
58
|
10.30
|
|
Nonqualified Stock Option Award Terms and Conditions Under Coty Inc. Long-Term Incentive Plan, as amended April 8, 2013 (previously filed on April 24, 2013 as Exhibit 10.29 to Amendment No. 4 to the registrant’s Registration Statement on Form S-1)
|
|
|
10.31
|
|
Form of IPO Unit Incentive Award Under Coty Inc. Long-Term Incentive Plan (previously filed on April 24, 2013 as Exhibit 10.30 to Amendment No. 4 to the registrant’s Registration Statement on Form S-1)
|
|
|
10.32
|
|
Restricted Stock Unit Award Terms and Conditions Under Coty Inc. Long-Term Incentive Plan, as amended April 8, 2013 (previously filed on April 24, 2013 as Exhibit 10.31 to Amendment No. 4 to the registrant’s Registration Statement on Form S-1)
|
|
|
10.33
|
|
Coty Inc. Executive Ownership Plan, as amended and restated on April 8, 2013 (previously filed on April 24, 2013 as Exhibit 10.32 to Amendment No. 4 to the registrant’s Registration Statement on Form S-1)
|
|
|
10.34
|
|
Adoption of Amendments to Restricted Stock Units Under the Coty Inc. Executive Ownership Plan (applicable to awards outstanding on September 14, 2010) (previously filed on April 24, 2013 as Exhibit 10.33 to Amendment No. 4 to the registrant’s Registration Statement on Form S-1)
|
|
|
10.35
|
|
Adoption of Amendments to Restricted Stock Units Under the Coty Inc. Executive Ownership Plan (applicable to awards outstanding on December 7, 2012) (previously filed on April 24, 2013 as Exhibit 10.34 to Amendment No. 4 to the registrant’s Registration Statement on Form S-1)
|
|
|
10.36
|
|
Form of Restricted Stock Agreement Under Coty Inc. Executive Ownership Plan, as amended on April 8, 2013 (previously filed on April 24, 2013 as Exhibit 10.35 to Amendment No. 4 to the registrant’s Registration Statement on Form S-1)
|
|
|
10.37
|
|
Matching Option Award Terms and Conditions Under Coty Inc. Executive Ownership Plan, as amended on April 8, 2013 (previously filed on April 24, 2013 as Exhibit 10.36 to Amendment No. 4 to the registrant’s Registration Statement on Form S-1)
|
|
|
10.38
|
|
Coty Inc. Stock Plan for Non-Employee Directors (previously filed on April 24, 2013 as Exhibit 10.37 to Amendment No. 4 to the registrant’s Registration Statement on Form S-1)
|
|
|
10.39
|
|
Form of Nonqualified Stock Option Award Agreement Under Coty Inc. Stock Plan for Non-Employee Directors (previously filed on April 24, 2013 as Exhibit 10.38 to Amendment No. 4 to the registrant’s Registration Statement on Form S-1)
|
|
|
10.40
|
|
Coty Inc. 2007 Stock Plan for Directors, as amended and restated on April 8, 2013 (previously filed on April 24, 2013 as Exhibit 10.39 to Amendment No. 4 to the registrant’s Registration Statement on Form S-1)
|
|
|
10.41
|
|
Adoption of Amendments to Pre-2008 Stock Options Granted Under the Coty Inc. 2007 Stock Plan for Directors Or the Coty Inc. Stock Plan for Non-Employee Directors (applicable to awards outstanding on September 14, 2010) (previously filed on April 24, 2013 as Exhibit 10.40 to Amendment No. 4 to the registrant’s Registration Statement on Form S-1)
|
|
|
10.42
|
|
Form of Restricted Stock Unit Award under Coty Inc. 2007 Stock Plan for Directors, as amended on April 8, 2013 (previously filed on April 24, 2013 as Exhibit 10.41 to Amendment No. 4 to the registrant’s Registration Statement on Form S-1)
|
|
|
10.43
|
|
Coty Inc. Stock Purchase Program for Directors, as amended and restated on April 8, 2013 (previously filed on April 24, 2013 as Exhibit 10.42 to Amendment No. 4 to the registrant’s Registration Statement on Form S-1)
|
|
|
10.44
|
|
Coty Inc. Equity and Long-Term Incentive Plan, as amended and restated on April 8, 2013 (previously filed on April 24, 2013 as Exhibit 10.43 to Amendment No. 4 to the registrant’s Registration Statement on Form S-1)
|
|
|
10.45
|
|
Restricted Stock Unit Award Terms and Conditions Under Coty Inc. Equity and Long-Term Incentive Plan, as amended and restated on April 8, 2013 (previously filed on April 24, 2013 as Exhibit 10.44 to Amendment No. 4 to the registrant’s Registration Statement on Form S-1)
|
|
59
|
10.46
|
|
Restricted Stock and Restricted Stock Unit Tandem Award Terms and Conditions under the Coty Inc. Equity and Long-Term Incentive Plan, as amended and restated on April 8, 2013 (previously filed on April 24, 2013 as Exhibit 10.45 to Amendment No. 4 to the registrant’s Registration Statement on Form S-1)
|
|
|
21.1
|
|
List of significant subsidiaries
|
|
|
23.1
|
|
Consent of Deloitte & Touche LLP
|
|
|
24.1
|
|
Power of Attorney (included in signature page)
|
|
|
31.1
|
|
Certification of Chief Executive Officer, pursuant to Rules 13a-14a and15d-14(a)
|
|
|
31.2
|
|
Certification of Chief Financial Officer, pursuant to Rules 13a-14(d) and 15d-14(d)
|
|
|
32.1
|
|
Certification of Chief Executive Officer, pursuant to 18 U.S. C. Section 1350
|
|
|
32.2
|
|
Certification of Chief Financial Officer, pursuant to 18 U.S. C. Section 1350
|
|
|
101.INS
|
|
XBRL Instance Document
|
|
|
101.SCH
|
|
XBRL Taxonomy Extension Schema Document
|
|
|
101.CAL
|
|
XBRL Taxonomy Extension Calculation Linkbase Document
|
|
|
101.DEF
|
|
XBRL Taxonomy Extension Definition Linkbase Document
|
|
|
101.LAB
|
|
XBRL Taxonomy Extension Labels Linkbase Document
|
|
|
101.PRE
|
|
XBRL Taxonomy Extension Presentation Linkbase Document
|
|
60
SIGNATURES
Pursuant to the requirements of Section 13 or 15(d) of the Securities Exchange Act of 1934, the registrant has duly caused this report to be signed on its behalf by the undersigned, thereunto duly authorized, in the city of New York, New York on August 28, 2014.
|
COTY INC.
|
|||
|
By:
|
/s/Patrice de Talhouët
|
||
|
Name: Patrice de Talhouët
|
|||
|
Title: Chief Financial Officer
|
|||
POWER OF ATTORNEY
KNOW ALL PERSONS BY THESE PRESENTS, that each person whose signature appears below constitutes and appoints Jules P. Kaufman, as his true and lawful attorney-in-fact and agent, with full power of substitution and resubstitution, for him and in his name, place and stead, in any and all capacities, to sign any and all amendments to this Annual Report on Form 10-K, and to file the same, with all exhibits thereto, and other documents in connection therewith, with the Securities and Exchange Commission, granting unto said attorney-in-fact and agent, full power and authority to do and perform each and every act and thing requisite and necessary to be done in connection therewith, as fully to all intents and purposes as he or she might or could do in person, hereby ratifying and confirming that all said attorney-in-fact and agent, or his or her substitute or substitutes, may lawfully do or cause to be done by virtue hereof.
Pursuant to the requirements of the Securities Exchange Act of 1934, this report has been signed by the following persons on behalf of the registrant and in the capacities and on the dates indicated:
|
Signature
|
Title
|
Date
|
||
|
/s/Michele Scannavini
|
Chief Executive Officer and Director
(Principal Executive Officer)
|
August 28, 2014
|
||
|
(Michele Scannavini)
|
||||
|
/s/Patrice de Talhouët
|
Chief Financial Officer
(Principal Financial Officer)
|
August 28, 2014
|
||
|
(Patrice de Talhouët)
|
||||
|
/s/Thomas Muench
|
Senior Vice President, Group Controller
(Principal Accounting Officer)
|
August 28, 2014
|
||
|
(Thomas Muench)
|
||||
|
/s/Lambertus J.H. Becht
|
Chairman of the Board of Directors
|
August 28, 2014
|
||
|
(Lambertus J.H. Becht)
|
||||
|
/s/Olivier Goudet
|
Director
|
August 28, 2014
|
||
|
(Olivier Goudet)
|
||||
|
/s/Peter Harf
|
Director
|
August 28, 2014
|
||
|
(Peter Harf)
|
||||
|
/s/Joachim Faber
|
Director
|
August 28, 2014
|
||
|
(Joachim Faber)
|
||||
|
/s/Erhard Schoewel
|
Director
|
August 28, 2014
|
||
|
(Erhard Schoewel)
|
||||
|
/s/Robert Singer
|
Director
|
August 28, 2014
|
||
|
(Robert Singer)
|
||||
|
/s/Jack Stahl
|
Director
|
August 28, 2014
|
||
|
(Jack Stahl)
|
||||
61
MANAGEMENT'S REPORT ON INTERNAL CONTROL OVER FINANCIAL REPORTING
Coty’s management is responsible for establishing and maintaining adequate internal control over financial reporting (as defined in Rules 13a-15(f) of the Securities Exchange Act of 1934) to provide reasonable assurance regarding the reliability of financial reporting and the preparation of financial statements for external purposes in accordance with generally accepted accounting principles in the United States of America ("GAAP"). Coty’s internal control over financial reporting includes those policies and procedures that:
(i) pertain to the maintenance of records that in reasonable detail accurately and fairly reflect the transactions and dispositions of the assets; and
(ii) provide reasonable assurance that transactions are recorded as necessary to permit preparation of financial statements in accordance with GAAP, and that receipts and expenditures of the Company are being made only in accordance with authorizations of management and directors; and
(iii) provide reasonable assurance regarding prevention or timely detection of unauthorized acquisition, use or disposition of the Company’s assets that could have a material effect on the financial statements.
Because of its inherent limitations, internal control over financial reporting may not prevent or detect misstatements.
Also, projections of any evaluation of effectiveness to future periods are subject to the risk that controls may become inadequate because of changes in conditions, or that the degree of compliance with the policies or procedures may deteriorate.
Coty’s management evaluated the effectiveness of internal control over financial reporting as of June 30, 2014 based on the criteria established in “Internal Control - Integrated Framework (1992)” issued by the Committee of Sponsoring Organizations of the Treadway Commission (COSO). Based on the evaluation, management has concluded that Coty maintained effective internal control over financial reporting as of June 30, 2014.
The Company's internal control over financial reporting as of June 30, 2014 has been audited by Deloitte & Touche LLP, an independent registered public accounting firm, as stated in their attestation report which appears herein.
/s/
Michele Scannavini
/s/Patrice deTalhouët
Michele Scannavini Patrice deTalhouët
Chief Executive Officer Chief Financial Officer
August 28,
2014
62
REPORT OF INDEPENDENT REGISTERED PUBLIC ACCOUNTING FIRM
To the Board of Directors and Stockholders of Coty Inc.,
New York, New York
We have audited the internal control over financial reporting of Coty Inc. and its subsidiaries (the “Company”) as of June 30, 2014, based on criteria established in Internal Control - Integrated Framework (1992) issued by the Committee of Sponsoring Organizations of the Treadway Commission. The Company's management is responsible for maintaining effective internal control over financial reporting and for its assessment of the effectiveness of internal control over financial reporting, included in the accompanying Management’s Report on Internal Control over Financial Reporting. Our responsibility is to express an opinion on the Company's internal control over financial reporting based on our audit.
We conducted our audit in accordance with the standards of the Public Company Accounting Oversight Board (United States). Those standards require that we plan and perform the audit to obtain reasonable assurance about whether effective internal control over financial reporting was maintained in all material respects. Our audit included obtaining an understanding of internal control over financial reporting, assessing the risk that a material weakness exists, testing and evaluating the design and operating effectiveness of internal control based on the assessed risk, and performing such other procedures as we considered necessary in the circumstances. We believe that our audit provides a reasonable basis for our opinion.
A company's internal control over financial reporting is a process designed by, or under the supervision of, the company's principal executive and principal financial officers, or persons performing similar functions, and effected by the company's board of directors, management, and other personnel to provide reasonable assurance regarding the reliability of financial reporting and the preparation of financial statements for external purposes in accordance with generally accepted accounting principles. A company's internal control over financial reporting includes those policies and procedures that (1) pertain to the maintenance of records that, in reasonable detail, accurately and fairly reflect the transactions and dispositions of the assets of the company; (2) provide reasonable assurance that transactions are recorded as necessary to permit preparation of financial statements in accordance with generally accepted accounting principles, and that receipts and expenditures of the company are being made only in accordance with authorizations of management and directors of the company; and (3) provide reasonable assurance regarding prevention or timely detection of unauthorized acquisition, use, or disposition of the company's assets that could have a material effect on the financial statements.
Because of the inherent limitations of internal control over financial reporting, including the possibility of collusion or improper management override of controls, material misstatements due to error or fraud may not be prevented or detected on a timely basis. Also, projections of any evaluation of the effectiveness of the internal control over financial reporting to future periods are subject to the risk that the controls may become inadequate because of changes in conditions, or that the degree of compliance with the policies or procedures may deteriorate.
In our opinion, the Company maintained, in all material respects, effective internal control over financial reporting as of June 30, 2014, based on the criteria established in Internal Control - Integrated Framework (1992) issued by the Committee of Sponsoring Organizations of the Treadway Commission.
We have also audited, in accordance with the standards of the Public Company Accounting Oversight Board (United States), the consolidated financial statements and financial statement schedule as of and for the year ended June 30, 2014 of the Company and our report dated August 28, 2014 expressed an unqualified opinion on those financial statements and financial statement schedule.
/s/ Deloitte & Touche LLP
New York, New York
August 28,
2014
63
REPORT OF INDEPENDENT REGISTERED PUBLIC ACCOUNTING FIRM
To the Board of Directors and Stockholders of Coty Inc.,
New York, New York
We have audited the accompanying consolidated balance sheets of Coty Inc. and its subsidiaries (the “Company”) as of June 30,
2014
and
2013
, and the related consolidated statements of operations, comprehensive income (loss), equity, redeemable common stock and redeemable noncontrolling interests, and cash flows for each of the three years in the period ended June 30,
2014
. Our audits also included the financial statement schedule listed in the Index at Item 15. These financial statements and financial statement schedule are the responsibility of the Company’s management. Our responsibility is to express an opinion on the financial statements and financial statement schedule based on our audits.
We conducted our audits in accordance with the standards of the Public Company Accounting Oversight Board (United States). Those standards require that we plan and perform the audit to obtain reasonable assurance about whether the financial statements are free of material misstatement. An audit includes examining, on a test basis, evidence supporting the amounts and disclosures in the financial statements. An audit also includes assessing the accounting principles used and significant estimates made by management, as well as evaluating the overall financial statement presentation. We believe that our audits provide a reasonable basis for our opinion.
In our opinion, such consolidated financial statements present fairly, in all material respects, the financial position of Coty Inc. and its subsidiaries as of June 30,
2014
and
2013
, and the results of its operations and its cash flows for each of the three years in the period ended June 30,
2014
in conformity with accounting principles generally accepted in the United States of America. Also, in our opinion, such financial statement schedule, when considered in relation to the basic consolidated financial statements taken as a whole, presents fairly, in all material respects, the information set forth therein.
We have also audited, in accordance with the standards of the Public Company Accounting Oversight Board (United States), the Company's internal control over financial reporting as of June 30,
2014
, based on the criteria established in
Internal Control - Integrated Framework (1992)
issued by the Committee of Sponsoring Organizations of the Treadway Commission and our report dated August 28,
2014
, which expressed an unqualified opinion on the Company's internal control over financial reporting.
/s/ Deloitte & Touche LLP
New York, New York
August 28,
2014
COTY INC. & SUBSIDIARIES
INDEX TO THE CONSOLIDATED FINANCIAL STATEMENTS
|
F-1
|
||
|
F-2
|
||
|
F-3
|
||
|
F-4
|
||
|
F-6
|
||
|
F-7
|
||
|
Financial Statement Schedule:
|
||
F-1
COTY INC. & SUBSIDIARIES
(In millions, except per share data
)
|
Year Ended
June 30, |
||||||||||||
|
2014
|
2013
|
2012
|
||||||||||
|
Net revenues
|
$
|
4,551.6
|
|
$
|
4,649.1
|
|
$
|
4,611.3
|
|
|||
|
Cost of sales
|
1,865.7
|
|
1,860.3
|
|
1,824.0
|
|
||||||
|
Gross profit
|
2,685.9
|
|
2,788.8
|
|
2,787.3
|
|
||||||
|
Selling, general and administrative expenses
|
2,220.3
|
|
2,292.6
|
|
2,309.7
|
|
||||||
|
Amortization expense
|
85.7
|
|
90.2
|
|
100.1
|
|
||||||
|
Restructuring costs
|
37.3
|
|
29.4
|
|
11.1
|
|
||||||
|
Asset impairment charges
|
316.9
|
|
1.5
|
|
575.9
|
|
||||||
|
Gain on sale of asset
|
—
|
|
(19.3
|
)
|
—
|
|
||||||
|
Operating income (loss)
|
25.7
|
|
394.4
|
|
(209.5
|
)
|
||||||
|
Interest expense, net
|
68.5
|
|
76.5
|
|
89.6
|
|
||||||
|
Other expense (income), net
|
1.3
|
|
(0.8
|
)
|
32.0
|
|
||||||
|
(Loss) income before income taxes
|
(44.1
|
)
|
318.7
|
|
(331.1
|
)
|
||||||
|
Provision (benefit) for income taxes
|
20.1
|
|
116.8
|
|
(37.8
|
)
|
||||||
|
Net (loss) income
|
(64.2
|
)
|
201.9
|
|
(293.3
|
)
|
||||||
|
Net income attributable to noncontrolling interests
|
17.8
|
|
15.7
|
|
13.7
|
|
||||||
|
Net income attributable to redeemable noncontrolling interests
|
15.4
|
|
18.2
|
|
17.4
|
|
||||||
|
Net (loss) income attributable to Coty Inc.
|
$
|
(97.4
|
)
|
$
|
168.0
|
|
$
|
(324.4
|
)
|
|||
|
Net (loss) income attributable to Coty Inc. per common share:
|
||||||||||||
|
Basic
|
$
|
(0.26
|
)
|
$
|
0.44
|
|
$
|
(0.87
|
)
|
|||
|
Diluted
|
(0.26
|
)
|
0.42
|
|
(0.87
|
)
|
||||||
|
Weighted-average common shares outstanding:
|
||||||||||||
|
Basic
|
381.7
|
|
381.7
|
|
373.0
|
|
||||||
|
Diluted
|
381.7
|
|
396.4
|
|
373.0
|
|
||||||
See notes to Consolidated Financial Statements.
F-1
COTY INC. & SUBSIDIARIES
CONSOLIDATED STATEMENTS OF COMPREHENSIVE INCOME (LOSS)
(In millions)
|
Year Ended
June 30, |
|||||||||||
|
2014
|
2013
|
2012
|
|||||||||
|
Net (loss) income
|
$
|
(64.2
|
)
|
$
|
201.9
|
|
$
|
(293.3
|
)
|
||
|
Other comprehensive income (loss):
|
|||||||||||
|
Foreign currency translation adjustment
|
63.8
|
|
19.9
|
|
(119.8
|
)
|
|||||
|
Net unrealized derivative (loss) gain on cash flow hedges, net of taxes of $1.6, nil and $(2.7), respectively
|
(8.9
|
)
|
—
|
|
2.2
|
|
|||||
|
Pension and other post-employment benefits, net of tax of $9.8, $(6.0) and $16.1, respectively
|
(21.3
|
)
|
7.5
|
|
(30.3
|
)
|
|||||
|
Total other comprehensive income (loss), net of tax
|
33.6
|
|
27.4
|
|
(147.9
|
)
|
|||||
|
Comprehensive (loss) income:
|
(30.6
|
)
|
229.3
|
|
(441.2
|
)
|
|||||
|
Comprehensive income attributable to noncontrolling interests:
|
|
|
|
|
|||||||
|
Net income
|
17.8
|
|
15.7
|
|
13.7
|
|
|||||
|
Foreign currency translation adjustment
|
0.3
|
|
(0.2
|
)
|
(0.5
|
)
|
|||||
|
Total comprehensive income attributable to noncontrolling interests
|
18.1
|
|
15.5
|
|
13.2
|
|
|||||
|
Comprehensive income attributable to redeemable noncontrolling interests:
|
|||||||||||
|
Net income
|
15.4
|
|
18.2
|
|
17.4
|
|
|||||
|
Foreign currency translation adjustment
|
(0.2
|
)
|
(1.0
|
)
|
—
|
|
|||||
|
Total comprehensive income attributable to redeemable noncontrolling interests
|
15.2
|
|
17.2
|
|
17.4
|
|
|||||
|
Comprehensive (loss) income attributable to Coty Inc.
|
$
|
(63.9
|
)
|
$
|
196.6
|
|
$
|
(471.8
|
)
|
||
See notes to Consolidated Financial Statements.
F-2
COTY INC. & SUBSIDIARIES
(In millions, except per share data
)
|
June 30,
2014 |
June 30,
2013 |
||||||
|
ASSETS
|
|||||||
|
Current assets:
|
|||||||
|
Cash and cash equivalents
|
$
|
1,238.0
|
|
$
|
920.4
|
|
|
|
Trade receivables—less allowances of $16.7 and $14.5, respectively
|
664.8
|
|
622.7
|
|
|||
|
Inventories
|
617.4
|
|
608.2
|
|
|||
|
Prepaid expenses and other current assets
|
201.2
|
|
191.2
|
|
|||
|
Deferred income taxes
|
63.4
|
|
74.4
|
|
|||
|
Total current assets
|
2,784.8
|
|
2,416.9
|
|
|||
|
Property and equipment, net
|
540.3
|
|
500.7
|
|
|||
|
Goodwill
|
1,342.8
|
|
1,543.2
|
|
|||
|
Other intangible assets, net
|
1,837.1
|
|
1,956.6
|
|
|||
|
Deferred income taxes
|
11.4
|
|
9.2
|
|
|||
|
Other noncurrent assets
|
76.1
|
|
43.4
|
|
|||
|
TOTAL ASSETS
|
$
|
6,592.5
|
|
$
|
6,470.0
|
|
|
|
LIABILITIES AND EQUITY
|
|
|
|
|
|||
|
Current liabilities:
|
|
|
|
|
|||
|
Accounts payable
|
$
|
810.2
|
|
$
|
711.7
|
|
|
|
Accrued expenses and other current liabilities
|
723.6
|
|
671.1
|
|
|||
|
Short-term debt and current portion of long-term debt
|
33.4
|
|
40.1
|
|
|||
|
Income and other taxes payable
|
29.4
|
|
34.8
|
|
|||
|
Deferred income taxes
|
0.7
|
|
5.5
|
|
|||
|
Total current liabilities
|
1,597.3
|
|
1,463.2
|
|
|||
|
Long-term debt
|
3,260.1
|
|
2,590.1
|
|
|||
|
Pension and other post-employment benefits
|
272.5
|
|
241.3
|
|
|||
|
Deferred income taxes
|
273.3
|
|
320.0
|
|
|||
|
Other noncurrent liabilities
|
228.7
|
|
239.9
|
|
|||
|
Total liabilities
|
5,631.9
|
|
4,854.5
|
|
|||
|
COMMITMENTS AND CONTINGENCIES (Note 24)
|
|
|
|
|
|||
|
REDEEMABLE NONCONTROLLING INTERESTS
|
106.2
|
|
105.8
|
|
|||
|
EQUITY:
|
|||||||
|
Preferred stock, $0.01 par value; 20.0 shares authorized; none issued and outstanding at June 30, 2014 and 2013
|
—
|
|
—
|
|
|||
|
Class A Common Stock, $0.01 par value; 800.0 shares authorized, 125.1 and 73.6 issued, respectively, and 90.2 and 73.2 outstanding, respectively, at June 30, 2014 and 2013
|
1.2
|
|
0.7
|
|
|||
|
Class B Common Stock, $0.01 par value; 263.7 and 310.6 shares authorized, issued and outstanding, respectively, at June 30, 2014 and 2013
|
2.6
|
|
3.1
|
|
|||
|
Additional paid-in capital
|
1,926.9
|
|
1,943.9
|
|
|||
|
Accumulated deficit
|
(426.4
|
)
|
(329.0
|
)
|
|||
|
Accumulated other comprehensive loss
|
(85.1
|
)
|
(118.6
|
)
|
|||
|
Treasury stock—at cost, shares: 34.9 and 0.4 at June 30, 2014 and 2013, respectively
|
(575.4
|
)
|
(6.1
|
)
|
|||
|
Total Coty Inc. stockholders’ equity
|
843.8
|
|
1,494.0
|
|
|||
|
Noncontrolling interests
|
10.6
|
|
15.7
|
|
|||
|
Total equity
|
854.4
|
|
1,509.7
|
|
|||
|
TOTAL LIABILITIES, REDEEMABLE NONCONTROLLING INTERESTS AND EQUITY
|
$
|
6,592.5
|
|
$
|
6,470.0
|
|
|
See notes to Consolidated Financial Statements.
F-3
COTY INC. & SUBSIDIARIES
CONSOLIDATED STATEMENTS OF EQUITY, REDEEMABLE COMMON STOCK
AND REDEEMABLE NONCONTROLLING INTERESTS
(In millions)
|
Common Stock
|
Additional
Paid-in
|
(Accumulated
|
Accumulated
Other
Comprehensive
|
Treasury Stock
|
Total Coty Inc.
Stockholders’
|
Noncontrolling
|
Total
|
Redeemable Common
|
Redeemable
Noncontrolling
|
||||||||||||||||||||||||||||||||||||
|
Shares
|
Amount
|
Capital
|
Deficit)
|
Income (Loss)
|
Shares
|
Amount
|
Equity
|
Interests
|
Equity
|
Stock
|
Interests
|
||||||||||||||||||||||||||||||||||
|
BALANCE—July 1, 2011
|
387.5
|
|
$
|
3.9
|
|
$
|
1,529.2
|
|
$
|
(65.9
|
)
|
$
|
0.2
|
|
17.5
|
|
$
|
(105.5
|
)
|
$
|
1,361.9
|
|
$
|
11.5
|
|
$
|
1,373.4
|
|
$
|
—
|
|
$
|
86.6
|
|
|||||||||||
|
Issuance of Common Stock
|
11.9
|
|
0.1
|
|
128.7
|
|
128.8
|
|
128.8
|
|
|||||||||||||||||||||||||||||||||||
|
Reclassification of common stock to liability
|
(128.7
|
)
|
(128.7
|
)
|
(128.7
|
)
|
|||||||||||||||||||||||||||||||||||||||
|
Reclassification of liability to redeemable common stock
|
|
|
|
|
156.4
|
|
|||||||||||||||||||||||||||||||||||||||
|
Fair value adjustment of redeemable common stock
|
(16.0
|
)
|
(16.0
|
)
|
(16.0
|
)
|
16.0
|
|
|||||||||||||||||||||||||||||||||||||
|
Acquisition of noncontrolling interest
|
(6.6
|
)
|
(6.6
|
)
|
(1.4
|
)
|
(8.0
|
)
|
|||||||||||||||||||||||||||||||||||||
|
Net income
|
(324.4
|
)
|
(324.4
|
)
|
13.7
|
|
(310.7
|
)
|
17.4
|
|
|||||||||||||||||||||||||||||||||||
|
Other comprehensive income (loss)
|
(147.4
|
)
|
(147.4
|
)
|
(0.5
|
)
|
(147.9
|
)
|
|||||||||||||||||||||||||||||||||||||
|
Distribution to noncontrolling interests, net
|
|
|
(11.3
|
)
|
(11.3
|
)
|
(18.5
|
)
|
|||||||||||||||||||||||||||||||||||||
|
Adjustment of redeemable noncontrolling interests to redemption value
|
(10.4
|
)
|
(10.4
|
)
|
(10.4
|
)
|
10.4
|
|
|||||||||||||||||||||||||||||||||||||
|
BALANCE—July 1, 2012
|
399.4
|
|
$
|
4.0
|
|
$
|
1,496.2
|
|
$
|
(390.3
|
)
|
$
|
(147.2
|
)
|
17.5
|
|
$
|
(105.5
|
)
|
$
|
857.2
|
|
$
|
12.0
|
|
$
|
869.2
|
|
$
|
172.4
|
|
$
|
95.9
|
|
|||||||||||
F-4
COTY INC. & SUBSIDIARIES
CONSOLIDATED STATEMENTS OF EQUITY, REDEEMABLE COMMON STOCK
AND REDEEMABLE NONCONTROLLING INTERESTS
(In millions)
|
Common Stock
|
Class A
Common Stock |
Class B
Common Stock |
Additional
Paid-in
|
(Accumulated
|
Accumulated
Other
Comprehensive
|
Treasury Stock
|
Total Coty Inc.
Stockholders’
|
Noncontrolling
|
Total
|
Redeemable Common
|
Redeemable
Noncontrolling
|
||||||||||||||||||||||||||||||||||||||||||||||||
|
Shares
|
Amount
|
Shares
|
Amount
|
Shares
|
Amount
|
Capital
|
Deficit)
|
Income (Loss)
|
Shares
|
Amount
|
Equity
|
Interests
|
Equity
|
Stock
|
Interests
|
||||||||||||||||||||||||||||||||||||||||||||
|
BALANCE—July 1, 2012
|
399.4
|
|
$
|
4.0
|
|
$
|
1,496.2
|
|
$
|
(390.3
|
)
|
$
|
(147.2
|
)
|
17.5
|
|
$
|
(105.5
|
)
|
$
|
857.2
|
|
$
|
12.0
|
|
$
|
869.2
|
|
$
|
172.4
|
|
$
|
95.9
|
|
|||||||||||||||||||||||||
|
Issuance of Common Stock
|
1.0
|
|
—
|
|
15.6
|
|
15.6
|
|
15.6
|
|
|||||||||||||||||||||||||||||||||||||||||||||||||
|
Reclassification of Common Stock to liability
|
(15.6
|
)
|
(15.6
|
)
|
(15.6
|
)
|
|||||||||||||||||||||||||||||||||||||||||||||||||||||
|
Reclassification of liability to redeemable Common Stock
|
—
|
|
—
|
|
131.2
|
|
|||||||||||||||||||||||||||||||||||||||||||||||||||||
|
Fair value adjustment of redeemable Common Stock
|
(47.1
|
)
|
(47.1
|
)
|
(47.1
|
)
|
47.1
|
|
|||||||||||||||||||||||||||||||||||||||||||||||||||
|
Transfer of redeemable Common Stock to JAB
|
93.5
|
|
93.5
|
|
93.5
|
|
(93.5
|
)
|
|||||||||||||||||||||||||||||||||||||||||||||||||||
|
Purchases of redeemable Common Stock
|
2.5
|
|
0.2
|
|
(2.5
|
)
|
—
|
|
—
|
|
(0.7
|
)
|
|||||||||||||||||||||||||||||||||||||||||||||||
|
Retirement of Treasury Stock
|
(17.6
|
)
|
(0.2
|
)
|
(106.7
|
)
|
(17.6
|
)
|
106.9
|
|
—
|
|
—
|
|
|||||||||||||||||||||||||||||||||||||||||||||
|
Conversion of Common Stock to Class A and Class B Common Stock
|
(382.8
|
)
|
(3.8
|
)
|
72.2
|
|
0.7
|
|
310.6
|
|
3.1
|
|
—
|
|
—
|
|
|||||||||||||||||||||||||||||||||||||||||||
|
Reclassification of redeemable Common Stock to APIC
|
256.5
|
|
256.5
|
|
256.5
|
|
(256.5
|
)
|
|||||||||||||||||||||||||||||||||||||||||||||||||||
|
Reclassification of liability to APIC
|
188.9
|
|
188.9
|
|
188.9
|
|
|||||||||||||||||||||||||||||||||||||||||||||||||||||
|
Settlement of employee IPO restricted stock units
|
1.2
|
|
21.0
|
|
21.0
|
|
21.0
|
|
|||||||||||||||||||||||||||||||||||||||||||||||||||
|
Purchase of Class A Common Stock
|
0.3
|
|
(5.0
|
)
|
(5.0
|
)
|
(5.0
|
)
|
|||||||||||||||||||||||||||||||||||||||||||||||||||
|
Exercise of employee stock options
|
0.2
|
|
1.2
|
|
1.2
|
|
1.2
|
|
|||||||||||||||||||||||||||||||||||||||||||||||||||
|
Share-based compensation expense
|
2.2
|
|
2.2
|
|
2.2
|
|
|||||||||||||||||||||||||||||||||||||||||||||||||||||
|
Dividends ($0.15 per common share)
|
(57.8
|
)
|
(57.8
|
)
|
(57.8
|
)
|
|||||||||||||||||||||||||||||||||||||||||||||||||||||
|
Net income
|
168.0
|
|
168.0
|
|
15.7
|
|
183.7
|
|
18.2
|
|
|||||||||||||||||||||||||||||||||||||||||||||||||
|
Other comprehensive income (loss)
|
28.6
|
|
28.6
|
|
(0.2
|
)
|
28.4
|
|
(1.0
|
)
|
|||||||||||||||||||||||||||||||||||||||||||||||||
|
Distribution to noncontrolling interests, net
|
—
|
|
(11.8
|
)
|
(11.8
|
)
|
(20.5
|
)
|
|||||||||||||||||||||||||||||||||||||||||||||||||||
|
Adjustment of redeemable noncontrolling interests to redemption value
|
(13.2
|
)
|
(13.2
|
)
|
(13.2
|
)
|
13.2
|
|
|||||||||||||||||||||||||||||||||||||||||||||||||||
|
BALANCE—June 30, 2013
|
—
|
|
$
|
—
|
|
73.6
|
|
$
|
0.7
|
|
310.6
|
|
$
|
3.1
|
|
$
|
1,943.9
|
|
$
|
(329.0
|
)
|
$
|
(118.6
|
)
|
0.4
|
|
$
|
(6.1
|
)
|
$
|
1,494.0
|
|
$
|
15.7
|
|
$
|
1,509.7
|
|
$
|
—
|
|
$
|
105.8
|
|
|||||||||||||||
See notes to Consolidated Financial Statements.
F-5
COTY INC. & SUBSIDIARIES
CONSOLIDATED STATEMENTS OF EQUITY
AND REDEEMABLE NONCONTROLLING INTERESTS
(In millions)
|
Class A
Common Stock
|
Class B
Common Stock
|
Additional
Paid-in
|
(Accumulated
|
Accumulated
Other
Comprehensive
|
Treasury Stock
|
Total Coty Inc.
Stockholders’
|
Noncontrolling
|
Total
|
Redeemable
Noncontrolling
|
|||||||||||||||||||||||||||||||||||||||
|
Shares
|
Amount
|
Shares
|
Amount
|
Capital
|
Deficit)
|
Income (Loss)
|
Shares
|
Amount
|
Equity
|
Interests
|
Equity
|
Interests
|
||||||||||||||||||||||||||||||||||||
|
BALANCE—July 1, 2013
|
73.6
|
|
$
|
0.7
|
|
310.6
|
|
$
|
3.1
|
|
$
|
1,943.9
|
|
$
|
(329.0
|
)
|
$
|
(118.6
|
)
|
0.4
|
|
$
|
(6.1
|
)
|
$
|
1,494.0
|
|
$
|
15.7
|
|
$
|
1,509.7
|
|
$
|
105.8
|
|
||||||||||||
|
Conversion of Class B to Class A Common Stock
|
46.9
|
|
0.5
|
|
(46.9
|
)
|
(0.5
|
)
|
—
|
|
—
|
|
||||||||||||||||||||||||||||||||||||
|
Purchase of Class A Common Stock
|
0.3
|
|
34.5
|
|
(569.3
|
)
|
(569.0
|
)
|
(569.0
|
)
|
||||||||||||||||||||||||||||||||||||||
|
Exercise of employee stock options
|
4.6
|
|
—
|
|
21.9
|
|
21.9
|
|
21.9
|
|
||||||||||||||||||||||||||||||||||||||
|
Share-based compensation expense
|
41.9
|
|
41.9
|
|
41.9
|
|
||||||||||||||||||||||||||||||||||||||||||
|
Dividends ($0.20 per common share)
|
(77.4
|
)
|
(77.4
|
)
|
(77.4
|
)
|
||||||||||||||||||||||||||||||||||||||||||
|
Net (loss) income
|
(97.4
|
)
|
(97.4
|
)
|
17.8
|
|
(79.6
|
)
|
15.4
|
|
||||||||||||||||||||||||||||||||||||||
|
Other comprehensive income
|
33.5
|
|
33.5
|
|
0.3
|
|
33.8
|
|
(0.2
|
)
|
||||||||||||||||||||||||||||||||||||||
|
Distribution to noncontrolling interests, net
|
(23.0
|
)
|
(23.0
|
)
|
(14.3
|
)
|
||||||||||||||||||||||||||||||||||||||||||
|
Noncontrolling interest purchase adjustment
|
(4.2
|
)
|
(4.2
|
)
|
(0.2
|
)
|
(4.4
|
)
|
||||||||||||||||||||||||||||||||||||||||
|
Adjustment of redeemable noncontrolling interests to redemption value
|
0.5
|
|
0.5
|
|
|
|
0.5
|
|
(0.5
|
)
|
||||||||||||||||||||||||||||||||||||||
|
BALANCE—June 30, 2014
|
125.1
|
|
$
|
1.2
|
|
263.7
|
|
$
|
2.6
|
|
$
|
1,926.9
|
|
$
|
(426.4
|
)
|
$
|
(85.1
|
)
|
34.9
|
|
$
|
(575.4
|
)
|
$
|
843.8
|
|
$
|
10.6
|
|
$
|
854.4
|
|
$
|
106.2
|
|
||||||||||||
See notes to Consolidated Financial Statements.
F-6
COTY INC. & SUBSIDIARIES
(In millions)
|
Year Ended
June 30, |
|||||||||||
|
2014
|
2013
|
2012
|
|||||||||
|
CASH FLOWS FROM OPERATING ACTIVITIES:
|
|||||||||||
|
Net (loss) income
|
$
|
(64.2
|
)
|
$
|
201.9
|
|
$
|
(293.3
|
)
|
||
|
Adjustments to reconcile net income to net cash provided by operating activities:
|
|||||||||||
|
Depreciation and amortization
|
250.7
|
|
259.6
|
|
246.0
|
|
|||||
|
Asset impairment charges
|
316.9
|
|
1.5
|
|
575.9
|
|
|||||
|
Deferred income taxes
|
(38.4
|
)
|
29.9
|
|
(153.6
|
)
|
|||||
|
Provision for bad debts
|
3.2
|
|
3.2
|
|
5.5
|
|
|||||
|
Provision for pension and other post-employment benefits
|
17.9
|
|
16.1
|
|
14.2
|
|
|||||
|
Share-based compensation
|
46.8
|
|
144.4
|
|
142.6
|
|
|||||
|
Gain on sale of asset
|
—
|
|
(19.3
|
)
|
—
|
|
|||||
|
Other
|
15.0
|
|
(5.3
|
)
|
18.8
|
|
|||||
|
Change in operating assets and liabilities, net of effects from purchase of acquired companies:
|
|
|
|
|
|||||||
|
Trade receivables
|
(31.1
|
)
|
(36.7
|
)
|
(42.9
|
)
|
|||||
|
Inventories
|
2.2
|
|
48.8
|
|
(15.7
|
)
|
|||||
|
Prepaid expenses and other current assets
|
(2.3
|
)
|
27.9
|
|
(22.6
|
)
|
|||||
|
Accounts payable
|
72.4
|
|
2.4
|
|
63.6
|
|
|||||
|
Accrued expenses and other current liabilities
|
20.3
|
|
(215.5
|
)
|
12.0
|
|
|||||
|
Tax accruals
|
(31.9
|
)
|
(6.7
|
)
|
30.5
|
|
|||||
|
Other noncurrent assets
|
(34.4
|
)
|
11.5
|
|
(3.0
|
)
|
|||||
|
Other noncurrent liabilities
|
(6.6
|
)
|
0.2
|
|
11.3
|
|
|||||
|
Net cash provided by operating activities
|
536.5
|
|
463.9
|
|
589.3
|
|
|||||
|
CASH FLOWS FROM INVESTING ACTIVITIES:
|
|||||||||||
|
Capital expenditures
|
(201.5
|
)
|
(193.9
|
)
|
(177.4
|
)
|
|||||
|
Payments for business combinations, net of cash acquired
|
(29.5
|
)
|
(31.0
|
)
|
(129.1
|
)
|
|||||
|
Additions of goodwill
|
(30.0
|
)
|
(30.0
|
)
|
(30.0
|
)
|
|||||
|
Proceeds from sale of asset
|
3.4
|
|
25.0
|
|
2.6
|
|
|||||
|
Net cash used in investing activities
|
(257.6
|
)
|
(229.9
|
)
|
(333.9
|
)
|
|||||
|
CASH FLOWS FROM FINANCING ACTIVITIES:
|
|||||||||||
|
Proceeds from short-term debt, original maturity more than three months
|
39.4
|
|
43.1
|
|
34.6
|
|
|||||
|
Repayments of short-term debt, original maturity more than three months
|
(48.1
|
)
|
(55.5
|
)
|
(23.6
|
)
|
|||||
|
Net (repayments of) proceeds from short-term debt, original maturity less than three months
|
(8.4
|
)
|
(10.7
|
)
|
13.7
|
|
|||||
|
Proceeds from revolving loan facilities
|
750.0
|
|
1,148.5
|
|
1,554.5
|
|
|||||
|
Repayments of revolving loan facilities
|
(695.5
|
)
|
(957.0
|
)
|
(1,841.0
|
)
|
|||||
|
Proceeds from issuance of term loans
|
625.0
|
|
1,250.0
|
|
1,250.0
|
|
|||||
|
Repayments of term loans
|
—
|
|
(1,250.0
|
)
|
(1,150.0
|
)
|
|||||
|
Dividend payment
|
(76.9
|
)
|
(57.4
|
)
|
—
|
|
|||||
|
Net proceeds from issuance of Common Stock
|
21.9
|
|
6.2
|
|
127.0
|
|
|||||
|
Payments for purchases of related party Common Stock held as Treasury Stock
|
(469.0
|
)
|
—
|
|
—
|
|
|||||
|
Payments for purchases of Common Stock held as Treasury Stock
|
(100.3
|
)
|
(7.5
|
)
|
—
|
|
|||||
|
Net (payments for) proceeds from foreign currency contracts
|
(2.1
|
)
|
1.5
|
|
(4.8
|
)
|
|||||
|
Net payments of interest rate swaps
|
—
|
|
—
|
|
(4.0
|
)
|
|||||
|
Acquisition on noncontrolling interests
|
—
|
|
—
|
|
(8.0
|
)
|
|||||
|
Payment for business combinations – contingent consideration
|
(1.1
|
)
|
—
|
|
—
|
|
|||||
|
Proceeds from mandatorily redeemable noncontrolling interests
|
3.8
|
|
—
|
|
—
|
|
|||||
|
Proceeds from noncontrolling interests
|
—
|
|
1.7
|
|
—
|
|
|||||
|
Distributions to noncontrolling interests
|
(23.0
|
)
|
(13.5
|
)
|
(11.3
|
)
|
|||||
|
Purchase of additional noncontrolling interests
|
(4.4
|
)
|
—
|
|
—
|
|
|||||
|
Distributions to redeemable noncontrolling interests
|
(14.3
|
)
|
(20.5
|
)
|
(18.5
|
)
|
|||||
|
Payment of deferred financing fees
|
(2.7
|
)
|
(9.9
|
)
|
(16.3
|
)
|
|||||
|
Net cash (used in) provided by financing activities
|
(5.7
|
)
|
69.0
|
|
(97.7
|
)
|
|||||
|
EFFECT OF EXCHANGE RATES ON CASH AND CASH EQUIVALENTS
|
44.4
|
|
8.0
|
|
(59.1
|
)
|
|||||
|
NET INCREASE IN CASH AND CASH EQUIVALENTS
|
317.6
|
|
311.0
|
|
98.6
|
|
|||||
|
CASH AND CASH EQUIVALENTS—Beginning of period
|
920.4
|
|
609.4
|
|
510.8
|
|
|||||
|
CASH AND CASH EQUIVALENTS—End of period
|
$
|
1,238.0
|
|
$
|
920.4
|
|
$
|
609.4
|
|
||
|
SUPPLEMENTAL DISCLOSURE OF CASH FLOWS INFORMATION:
|
|||||||||||
|
Cash paid during the year for interest
|
$
|
63.7
|
|
$
|
71.0
|
|
$
|
76.4
|
|
||
|
Cash paid during the year for income taxes, net of refunds received
|
84.1
|
|
84.0
|
|
67.4
|
|
|||||
|
SUPPLEMENTAL DISCLOSURE OF NONCASH FINANCING AND INVESTING ACTIVITIES:
|
|||||||||||
|
Accrued capital expenditure additions
|
$
|
59.2
|
|
$
|
56.7
|
|
$
|
44.6
|
|
||
See notes to Consolidated Financial Statements.
F-7
COTY INC. & SUBSIDIARIES
NOTES TO CONSOLIDATED FINANCIAL STATEMENTS
($ in millions, except per share data)
1. DESCRIPTION OF BUSINESS
Coty Inc. and its subsidiaries (collectively, the “Company” or “Coty”) engage in the manufacturing, marketing and distribution of fragrances, color cosmetics and skin & body care related products in numerous countries throughout the world.
The Company operates on a fiscal year basis with a year-end of
June 30
. Unless otherwise noted, any reference to a year preceded by the word “fiscal” refers to the fiscal year ended
June 30
of that year. For example, references to “fiscal
2014
” refer to the fiscal year ending
June 30, 2014
.
The Company’s revenues generally increase during the second fiscal quarter as a result of increased demand associated with the holiday season. Accordingly, the Company’s financial performance, working capital requirements, cash flow and borrowings experience seasonal variability during the three to six months preceding this season.
In
June 2013
, the Company completed an initial public offering (“IPO”) in a secondary offering on the New York Stock Exchange (“NYSE”).
2. SUMMARY OF SIGNIFICANT ACCOUNTING POLICIES
Basis of Presentation and Principles of Consolidation
The accompanying financial statements of the Company are presented on a consolidated basis in accordance with accounting principles generally accepted in the United States of America (“GAAP”). All intercompany accounts and transactions have been eliminated in consolidation.
The Company also consolidates majority-owned entities in the United Arab Emirates, Malaysia, Indonesia, Philippines, Singapore, Hong Kong, China, Japan, South Korea, Thailand, Taiwan and Brazil where the Company has the ability to exercise controlling influence and a variable interest entity (“VIE”) in the United Arab Emirates (“U.A.E.”) for which the Company is the primary beneficiary. Ownership interests of noncontrolling parties are presented as noncontrolling interests or redeemable noncontrolling interests, as applicable.
During fiscal 2014, the Company revised its Consolidated Statements of Cash Flows to reflect other noncurrent assets and other noncurrent liabilities as separate line items within net cash flows provided by operating activities. At June 30, 2014,
$11.5
and
$(3.0)
of Other noncurrent assets and
$0.2
and
$11.3
of Other noncurrent liabilities related to fiscal 2013 and 2012, respectively, were reclassified out of Prepaid and other assets and Accrued expenses and other liabilities, respectively on the Consolidated Statements of Cash Flows to conform to the current period presentation.
During fiscal 2014, the Company reclassified acquisition related costs of
$8.9
and
$10.3
in fiscal 2013 and 2012, respectively, from Acquisition related costs to Selling, General and Administrative costs within the Consolidated Statements of Operations to conform to the current period presentation.
Related Parties
As of June 30, 2014, the Company is a majority-owned subsidiary of JAB Holdings B.V. (“JAB”). Lucresca SE (formerly known as Donata Holding SE) and Agnaten SE (formerly known as Parentes Holding SE) indirectly control JAB and the shares of the Company held by JAB. Donata Holdings B.V. (“DH BV”) is also controlled by Lucresca SE and Agnaten.
Use of Estimates
The preparation of financial statements in conformity with GAAP requires management to make estimates and assumptions that affect the reported amounts of assets and liabilities and disclosure of contingent assets and liabilities at the date of the financial statements and revenues and expenses during the period reported. Significant accounting policies that contain subjective management estimates and assumptions include those related to revenue recognition, the market value of inventory, the fair value of acquired assets and liabilities associated with acquisitions, the fair value of share-based compensation, pension and other post-employment benefit costs, the fair value of the Company's reporting units and the assessment of goodwill, other intangible assets and long-lived assets for impairment, income taxes, derivatives and redeemable noncontrolling interests when calculating the impact on Earnings Per Share (“EPS”). Management evaluates its estimates and assumptions on an ongoing basis using historical experience and other factors, including the current economic environment, and makes adjustments when facts and circumstances dictate. As future events and their effects cannot be determined with precision, actual results could differ significantly from those estimates and assumptions. Significant changes, if any, in those estimates and assumptions resulting from continuing changes in the economic environment will be reflected in the Consolidated Financial Statements in future periods.
Cash Equivalents
F-8
COTY INC. & SUBSIDIARIES
NOTES TO CONSOLIDATED FINANCIAL STATEMENTS
($ in millions, except per share data)
Cash equivalents include all highly liquid investments with original maturities of three months or less at the time of purchase.
Trade Receivables
Trade receivables are stated net of the allowance for doubtful accounts and cash discounts, which is based on the evaluation of the accounts receivable aging, specific exposures, and historical trends. The Company reviews its allowances by assessing factors such as an individual trade receivable aging and liquidity. Trade receivables are written off on a case-by-case basis, net of any amounts that may be collected.
Inventories
Inventories include items which are considered salable or usable in future periods, and are stated at the lower of cost or market value, with cost being based on standard cost which approximates actual cost on a first-in, first-out basis. Costs include direct materials, direct labor and overhead (e.g., indirect labor, rent and utilities, depreciation, purchasing, receiving, inspection and quality control) and in-bound freight costs. The Company classifies inventories into various categories based upon their stage in the product life cycle, future marketing sales plans and the disposition process.
The Company also records an inventory obsolescence reserve, which represents the excess of the cost of the inventory over its estimated realizable value, based on various product sales projections. This reserve is calculated using an estimated obsolescence percentage applied to the inventory based on age, historical trends, and requirements to support forecasted sales. In addition, and as necessary, the Company may establish specific reserves for future known or anticipated events.
Property and Equipment and Other Long-lived Assets
Property and equipment is stated at cost less accumulated depreciation or amortization. The cost of renewals and betterments is capitalized and depreciated. Expenditures for maintenance and repairs are expensed as incurred. Property and equipment that is disposed of through sale, trade-in, donation, or scrapping is written off, and any gain or loss on the transaction, net of costs to dispose, is recorded in Gain (loss) on sale of assets. Depreciation and amortization are computed principally using the straight-line method over the following estimated useful lives:
|
Description
|
Estimated Useful Lives
|
|
|
Buildings
|
20-40 years
|
|
|
Marketing furniture and fixtures
|
2-4 years
|
|
|
Machinery and equipment
|
2-15 years
|
|
|
Computer equipment and software
|
2-5 years
|
|
|
Property and equipment under capital leases and leasehold improvements
|
Lesser of lease term
|
|
|
or economic life
|
||
Intangible assets with finite lives are amortized principally using the straight-line method over the following estimated useful lives:
|
Description
|
Estimated Useful Lives
|
|
|
License agreements
|
Lesser of agreement term or economic life
|
|
|
Customer relationships
|
5-20 years
|
|
|
Trademarks
|
5-20 years
|
|
|
Product formulations
|
3-7 years
|
|
Long-lived assets, including tangible and intangible assets with finite lives, are tested for recoverability whenever events or changes in circumstances indicate that their carrying amount may not be recoverable. When such events or changes in circumstances occur, a recoverability test is performed comparing projected undiscounted cash flows from the use and eventual disposition of an asset or asset group to its carrying value. If the projected undiscounted cash flows are less than the carrying value, an impairment charge would be recorded for the excess of the carrying value over the fair value. The Company estimates fair value based on the best information available, including discounted cash flows or the use of third-party valuations.
Goodwill and Other Indefinite-lived Intangible Assets
Goodwill is calculated as the excess of the cost of purchased businesses over the fair value of their underlying net assets. Indefinite-lived other intangible assets principally consist of trademarks. Goodwill is allocated and evaluated at the reporting unit level which is at, or one level below, the Company’s operating segments. The Company identifies its operating segments,
F-9
COTY INC. & SUBSIDIARIES
NOTES TO CONSOLIDATED FINANCIAL STATEMENTS
($ in millions, except per share data)
which are also its reportable segments, by assessing whether the components of the Company’s reportable segments constitute businesses for which discrete financial information is available and management of each operating segment regularly reviews the operating results of those components. The Company has identified
five
reporting units. Color Cosmetics is considered an operating segment and a reporting unit and the Fragrances and Skin & Body Care operating segments each include
two
reporting units. The Company allocates goodwill to one or more reporting units that are expected to benefit from synergies of the business combination.
Goodwill and other intangible assets with indefinite lives are not amortized, but are evaluated for impairment annually as of May 1 or whenever events or changes in circumstances indicate that their carrying amount may not be recoverable. Impairment testing for goodwill is performed in two steps: (i) the determination of possible impairment, based upon the fair value of a reporting unit as compared to its carrying value; and (ii) if there is a possible impairment indicated, this step measures the amount of impairment loss, if any, by comparing the implied fair value of goodwill with the carrying amount of that goodwill.
The fair values of indefinite-lived other intangible assets are estimated and compared to their respective carrying values. The trademarks’ fair values are based upon the income approach, utilizing the relief from royalty or excess earnings methodology. An impairment loss is recognized when the estimated fair value of the intangible asset is less than its carrying value.
Deferred Financing Fees
The Company capitalizes costs related to the issuance of debt instruments, as applicable. Such costs are amortized over the contractual term of the related debt instrument in interest expense, net using the straight line method, which approximates the effective interest method, in the Consolidated Statements of Operations.
Noncontrolling Interests and Redeemable Noncontrolling Interests
Interests held by partners in consolidated majority-owned subsidiaries are presented as noncontrolling interests, which represents the noncontrolling stockholders’ interests in the underlying net assets of the Company’s consolidated majority-owned subsidiaries. Noncontrolling interests that are not redeemable are reported in the equity section of the Consolidated Balance Sheets.
Noncontrolling interests, where the Company may be required to repurchase the noncontrolling interest under a put option or other contractual redemption requirement are reported in the Consolidated Balance Sheets between liabilities and equity, as redeemable noncontrolling interests. The Company adjusts the redeemable noncontrolling interests to the redemption values on each balance sheet date with changes recognized as an adjustment to retained earnings, or in the absence of retained earnings, as an adjustment to additional paid-in capital.
Revenue Recognition
Revenue is recognized when realized or realizable and earned. The Company’s policy is to recognize revenue when risk of loss and title to the product transfers to the customer, which usually occurs upon delivery. Net revenues comprise gross revenues less customer discounts and allowances, actual and expected returns (estimated based on returns history and position in product life cycle) and various trade spending activities. Trade spending activities primarily relate to advertising, product promotions and demonstrations, some of which involve cooperative relationships with customers. Returns represent
3.9%
,
3.7%
and
3.5%
of gross revenue after customer discounts and allowances in fiscal
2014
,
2013
and
2012
, respectively. Trade spending activities recorded as a reduction to gross revenue after customer discounts and allowances represent
9.4%
,
9.4%
and
9.8%
in fiscal
2014
,
2013
and
2012
, respectively.
Cost of Sales
Cost of sales includes all of the costs to manufacture the Company’s products. For products manufactured in the Company’s own facilities, such costs include raw materials and supplies, direct labor and factory overhead. For products manufactured for the Company by third-party contractors, such costs represent the amounts invoiced by the contractors. Cost of sales also includes royalty expense associated with license agreements as discussed in Note 10. Additionally, shipping costs and depreciation and amortization expenses related to manufacturing equipment and facilities are included in Cost of sales in the Consolidated Statements of Operations.
Selling, General and Administrative Expenses
Selling, general and administrative expenses include advertising and promotional costs and research and development costs. Also included in Selling, general and administrative expenses are share-based compensation, certain warehousing fees, non-manufacturing overhead, personnel and related expenses, rent on operating leases, and professional fees.
F-10
COTY INC. & SUBSIDIARIES
NOTES TO CONSOLIDATED FINANCIAL STATEMENTS
($ in millions, except per share data)
Advertising and promotional costs are expensed as incurred and totaled
$1,070.0
,
$1,072.3
and
$1,085.8
in fiscal
2014
,
2013
and
2012
, respectively. Included in advertising and promotional costs are
$67.5
,
$65.2
, and
$57.8
of depreciation of marketing furniture and fixtures, such as product displays, in fiscal
2014
,
2013
and
2012
, respectively. Research and development costs are expensed as incurred and totaled
$46.5
,
$44.6
and
$40.3
in fiscal
2014
,
2013
and
2012
, respectively.
Share-Based Compensation
As of June 12, 2013, the effective date of the amendment and restatement of the share-based compensation plans, the Company’s share-based compensation plans are accounted for as equity plans, as the plans no longer allow for cash settlement or contain put features to sell shares back to the Company. Share-based compensation expense is now measured and fixed at the grant date, based on the estimated fair value of the award and is recognized on a straight-line basis, net of estimated forfeitures, over the employee’s requisite service period.
Prior to June 12, 2013, the Company’s share-based compensation plans were accounted for as liability plans as they allowed for cash settlement or contained put features to sell shares back to the Company. Accordingly, share-based compensation expense was measured at the end of each reporting period based on the fair value of the award on each reporting date and was recognized as an expense to the extent vested until the award was settled. Once the holders had retained the risks and rewards of share ownership by holding the shares for a reasonable period of time after they were vested and issued, generally a period of six months from vesting and issuance, the liability was reclassified, in the Consolidated Balance Sheets, between liabilities and equity as Redeemable common stock at fair value. Subsequent changes in fair value of the shares classified as Redeemable common stock were recognized in Retained earnings or, in the absence of Retained earnings, in Additional paid-in capital.
Shares are available to be awarded for stock options, restricted shares and restricted stock units (“RSUs”). The fair value of stock options is determined using the Black-Scholes valuation model using the weighted-average assumptions discussed in Note 22. Following June 12, 2013, the fair value of restricted shares and RSUs is determined on the date of grant based on the Company’s stock price. Prior to June 12, 2013, the fair value of restricted shares and RSUs and common shares outstanding under liability plan accounting was based on the share value on the reporting date.
Income Taxes
The Company is subject to income taxes in the U.S. and various foreign jurisdictions. The Company accounts for income taxes under the asset and liability method. Therefore, income tax expense is based on reported income before income taxes, and deferred income taxes reflect the effect of temporary differences between the carrying amounts of assets and liabilities that are recognized for financial reporting purposes and the carrying amounts that are recognized for income tax purposes. Classification of deferred tax assets and liabilities corresponds with the classification of the underlying assets and liabilities, giving rise to the temporary differences or the period of expected reversal, as applicable. A valuation allowance is established, when necessary, to reduce deferred tax assets to the amount that is more likely than not to be realized based on currently available evidence.
The Company is subject to tax audits in various jurisdictions. The Company regularly assesses the likely outcomes of such audits in order to determine the appropriateness of liabilities for unrecognized tax benefits (“UTBs”). The Company classifies interest and penalties related to UTBs as a component of the provision for income taxes.
For UTBs, the Company first determines whether it is more-likely-than-not (defined as a likelihood of more than fifty percent) that a tax position will be sustained based on its technical merits as of the reporting date, assuming that taxing authorities will examine the position and have full knowledge of all relevant information. A tax position that meets this more-likely-than-not threshold is then measured and recognized at the largest amount of benefit that is greater than fifty percent likely to be realized upon effective settlement with a taxing authority. As the determination of liabilities related to UTBs and associated interest and penalties requires significant estimates to be made by the Company, there can be no assurance that the Company will accurately predict the outcomes of these audits, and thus the eventual outcomes could have a material impact on the Company’s operating results or financial condition and cash flows.
It is the Company’s intention to permanently reinvest undistributed earnings and profits from the Company’s foreign operations that have been generated through June 30, 2014, and future plans do not demonstrate a need to repatriate the foreign amounts to fund U.S. operations. Accordingly, no provision has been made for U.S. income taxes on undistributed earnings of foreign subsidiaries as of June 30, 2014. It is not practicable for the Company to determine the amount of additional income and withholding taxes that may be payable in the event the remaining undistributed earnings are repatriated.
Restructuring Costs
Charges incurred in connection with plans to restructure and integrate acquired businesses or in connection with cost-reduction initiatives that are initiated from time to time are included in Restructuring costs in the Consolidated Statements of
F-11
COTY INC. & SUBSIDIARIES
NOTES TO CONSOLIDATED FINANCIAL STATEMENTS
($ in millions, except per share data)
Operations if such costs are directly associated with an exit or disposal activity, a reorganization, or with integrating an acquired business.
Business Combinations
The Company accounts for business combinations using the acquisition method of accounting. The acquisition method of accounting requires that purchase price, including the fair value of contingent consideration, of the acquisition be allocated to the assets acquired and liabilities assumed using the fair values determined by management as of the acquisition date. Payments made for contingent consideration recorded as part of an acquisition’s purchase price are reflected as financing activities in the Company’s Consolidated Statements of Cash Flows, if paid more than three months after the acquisition date. If paid within three months of the acquisition date, these payments are reflected as investing activities in the Company’s Consolidated Statements of Cash Flows.
The Company remeasures the fair value of contingent consideration at each reporting period using a probability-adjusted discounted cash flow method based on significant inputs not observable in the market and any change in the fair value from either the passage of time or events occurring after the acquisition date, is recorded in earnings. Contingent consideration payments that exceed the acquisition date fair value of the contingent consideration are reflected as an operating activity in the Consolidated Statements of Cash Flows.
For acquisitions completed prior to January 1, 2009, contingent consideration is recognized when the contingency is resolved pursuant to the authoritative guidance on business combinations in effect at the date of the closing of the acquisition and reflected as an investing activity in the Consolidated Statements of Cash Flows.
Acquisition-related costs, such as banking, legal, accounting and other costs incurred in connection with an acquisition are expensed as incurred. The Company includes the results of all acquisitions in its Consolidated Financial Statements from the date of acquisition.
Fair Value Measurements
The following fair value hierarchy is used in selecting inputs for those assets and liabilities measured at fair value that distinguishes between assumptions based on market data (observable inputs) and the Company’s assumptions (unobservable inputs). The Company evaluates these inputs and recognizes transfers between levels, if any, at the end of each reporting period. The hierarchy consists of three levels:
Level 1
- Valuation based on quoted market prices in active markets for identical assets or liabilities;
Level 2
- Valuation based on inputs other than Level 1 inputs that are observable for the assets or liabilities either directly or indirectly;
Level 3
- Valuation based on prices or valuation techniques that require inputs that are both significant to the fair value measurement and supported by little or no observable market activity.
The Company has not elected the fair value measurement option for any financial instruments or other assets not required to be measured at fair value on a recurring basis.
Derivative Instruments and Hedging Activities
The Company utilizes derivative instruments to manage certain foreign currency and interest rate exposures. The Company may also utilize derivative instruments to hedge anticipated transactions where there is a high probability that anticipated exposures will materialize. Derivative financial instruments are recorded as either assets or liabilities on the balance sheet and are measured at fair value. For derivatives not designated as hedging instruments, changes in fair value are recorded in the line item in the Consolidated Statements of Operations to which the derivative relates. For derivatives designated as hedging instruments, changes in the fair value are recorded in Accumulated other comprehensive income (loss) (“AOCI/(L)”). Gains and losses deferred in AOCI/(L) are then recognized in net income (loss) in a manner that matches the timing of the actual income or expense related to the hedging instruments with the hedged transaction or if it is determined that the derivatives are not highly effective or have ceased to be highly effective. The gains and losses related to designated hedging instruments are also recorded in the line item in the Consolidated Statements of Operations to which the derivative relates.
Foreign Currency
Exchange gains or losses incurred on transactions conducted by one of the Company’s operations in a currency other than the operation’s functional currency are reflected in Cost of sales or operating expenses. Net (losses)gains of
$(18.7)
,
$0.1
and
$(1.9)
in fiscal
2014
,
2013
and
2012
, respectively resulting from non-financing foreign exchange currency transactions are included in the Consolidated Statements of Operations.
F-12
COTY INC. & SUBSIDIARIES
NOTES TO CONSOLIDATED FINANCIAL STATEMENTS
($ in millions, except per share data)
Assets and liabilities of foreign operations are translated into U.S. dollars at the rates of exchange in effect at the end of the reporting period. Income and expense items are translated at the average exchange rates prevailing during each reporting period presented. Translation gains or losses are reported as cumulative adjustments in AOCI/(L).
Net losses of
$2.8
,
$0.2
and
$39.7
in fiscal
2014
,
2013
and
2012
, respectively, resulting from financing foreign exchange currency transactions are included in Interest expense, net and Other expense (income), net in the Consolidated Statements of Operations.
Recently Adopted Accounting Pronouncements
In December 2011, the Financial Accounting Standards Board (“FASB”) enhanced its disclosure requirements regarding offsetting assets and liabilities as a joint effort with the International Accounting Standards Board. This amendment increases the comparability of the balance sheet prepared under GAAP and International Financial Reporting Standards (“IFRS”) by enhancing disclosures about financial instruments and derivative instruments that are either offset on the balance sheet or subject to an enforceable master netting arrangement or similar agreement, irrespective of whether they are offset on the balance sheet. Entities are required to provide both net and gross information for these assets and liabilities in order to enhance comparability between GAAP financial statements and IFRS financial statements. This pronouncement was later amended to limit the scope of the disclosure to derivatives within the balance sheet. This amendment was adopted during the first quarter of fiscal 2014. See Note 19 for disclosures required by the adoption of this amendment for the years ended June 30, 2014 and 2013.
In February 2013, the FASB issued authoritative guidance that requires entities to disclose information about significant items reclassified, in their entirety, out of Accumulated other comprehensive income (“AOCI”) either in the statement where net income is disclosed or in the notes to the financial statements. This guidance was adopted for fiscal 2014 and the required additional disclosure has been included in Note 21.
Recently Issued Accounting Pronouncements
In June 2014, the FASB issued authoritative guidance that implements a common revenue model that will enhance comparability across industries and require enhanced disclosures. The new standard introduces a five step principles based process to determine the timing and amount of revenue ultimately expected to be received by the customer. This amendment will be effective for the Company’s interim and annual consolidated financial statements for fiscal 2018 with either retrospective or modified retrospective treatment applied, and the Company is evaluating the impact this will have on the Consolidated Financial Statements upon implementation.
In May 2014, the FASB issued authoritative guidance on the treatment of a stock-based compensation award issued with a performance target that could be achieved subsequent to the requisite service period. The guidance will require the performance target to be treated as a performance condition that effects vesting or as a non-vesting condition that affects the grant-date fair value of the award. This amendment will be effective for the Company’s interim and annual consolidated financial statements for fiscal 2017 with either prospective or retrospective treatment applied, and is not expected to have a material impact on the Company’s Consolidated Financial Statements.
In April 2014, the FASB issued authoritative guidance that modified the criteria utilized to determine discontinued operations. In accordance with the new guidance, only disposals of a component that represent a strategic shift that has (or will have) a major effect on an entity's operations and financial results are considered discontinued operations. The modified guidance also requires expanded disclosures about discontinued operations and disposals of a significant part of an entity that does not qualify for discontinued operations reporting. This amendment will be effective for the Company’s interim and annual consolidated financial statements for fiscal 2016 with early adoption permitted, but only for disposals (or classifications as held for sale) that have not been reported in previously-issued financial statements. The adoption of this guidance is not expected to have a material impact on the Company’s Consolidated Financial Statements.
3. SEGMENT REPORTING
Operating segments (referred to as “segments”) include components of the enterprise for which separate financial information is available and evaluated regularly by the chief operating decision maker (“CODM”) in deciding how to allocate resources and assess performance. The Company has designated its Chief Executive Officer as the CODM.
The Company has determined that its operating and reportable segments are Fragrances, Color Cosmetics and Skin & Body Care (also referred to as “segments”). The reportable segments also represent the Company’s product groupings. In addition to reflecting the Company’s business model, these segments also reflect how the CODM reviews operating results when making decisions about resources to be allocated to the segments and when assessing their performance. Fragrances products include a variety of men’s and women’s products and include fashion designer, celebrity and lifestyle brands. Color Cosmetics products
F-13
COTY INC. & SUBSIDIARIES
NOTES TO CONSOLIDATED FINANCIAL STATEMENTS
($ in millions, except per share data)
include nail and other color cosmetics, consisting of lip, eye and other facial color products. Skin & Body Care products include shower gels, deodorants, skin care and sun treatment products.
The Company evaluates segment performance based on several factors, including Operating income (loss). The Company uses Operating income (loss) as a measure of the segment performance as it excludes the impact of corporate-driven decisions related to interest expense and income taxes.
The items within Corporate relate to corporate-based responsibilities and decisions and are not used by the CODM to measure the underlying performance of the segments. Corporate primarily includes a component of share-based compensation expense, restructuring costs and certain other expense items not attributable to ongoing operating activities of the segments.
From June 12, 2013, the effective date of the share-based compensation plan amendments, the component of share-based compensation expense included in Corporate represents the difference between equity plan accounting, using the grant date fair value, which the Company uses to measure the performance of the Company’s segments and equity plan accounting using the June 12, 2013 fair value which the Company uses to measure share-based compensation in the Consolidated Financial Statements. Prior to June 12, 2013, the component of the share-based compensation expense included in Corporate represented the difference between share-based compensation expense accounted for under equity plan accounting based on grant date fair value which the Company used to measure the performance of the Company’s segments, and under liability plan accounting, which the Company used to measure the share-based compensation in the Consolidated Financial Statements.
With the exception of goodwill and acquired intangible assets, the Company does not identify or monitor assets by segment. The Company does not present assets by reportable segment since various assets are shared between reportable segments. The allocation of goodwill and acquired intangible assets by segment is presented in Note 10.
|
Year Ended June 30,
|
||||||||||||
|
SEGMENT DATA
|
2014
|
2013
|
2012
|
|||||||||
|
Net revenues:
|
||||||||||||
|
Fragrances
|
$
|
2,498.2
|
|
$
|
2,490.7
|
|
$
|
2,452.8
|
|
|||
|
Color Cosmetics
|
1,366.2
|
|
1,468.5
|
|
1,430.6
|
|
||||||
|
Skin & Body Care
|
687.2
|
|
689.9
|
|
727.9
|
|
||||||
|
Total
|
$
|
4,551.6
|
|
$
|
4,649.1
|
|
$
|
4,611.3
|
|
|||
|
Depreciation and amortization:
|
||||||||||||
|
Fragrances
|
$
|
86.2
|
|
$
|
82.5
|
|
$
|
82.5
|
|
|||
|
Color Cosmetics
|
82.3
|
|
81.2
|
|
79.3
|
|
||||||
|
Skin & Body Care
|
43.2
|
|
46.5
|
|
43.2
|
|
||||||
|
Corporate
|
39.0
|
|
49.4
|
|
41.0
|
|
||||||
|
Total
|
$
|
250.7
|
|
$
|
259.6
|
|
$
|
246.0
|
|
|||
|
Operating income (loss):
|
||||||||||||
|
Fragrances
|
$
|
355.6
|
|
$
|
369.7
|
|
$
|
340.5
|
|
|||
|
Color Cosmetics
|
154.2
|
|
208.8
|
|
200.2
|
|
||||||
|
Skin & Body Care
|
(351.7
|
)
|
(5.7
|
)
|
(577.8
|
)
|
||||||
|
Corporate
|
(132.4
|
)
|
(178.4
|
)
|
(172.4
|
)
|
||||||
|
Total
|
$
|
25.7
|
|
$
|
394.4
|
|
$
|
(209.5
|
)
|
|||
|
Reconciliation:
|
||||||||||||
|
Operating income (loss)
|
$
|
25.7
|
|
$
|
394.4
|
|
$
|
(209.5
|
)
|
|||
|
Interest expense, net
|
68.5
|
|
76.5
|
|
89.6
|
|
||||||
|
Other expense (income), net
|
1.3
|
|
(0.8
|
)
|
32.0
|
|
||||||
|
(Loss) income before income taxes
|
$
|
(44.1
|
)
|
$
|
318.7
|
|
$
|
(331.1
|
)
|
|||
F-14
COTY INC. & SUBSIDIARIES
NOTES TO CONSOLIDATED FINANCIAL STATEMENTS
($ in millions, except per share data)
|
Year Ended June 30,
|
||||||||||||
|
2014
|
2013
|
2012
|
||||||||||
|
GEOGRAPHIC DATA
|
||||||||||||
|
Net revenues:
|
||||||||||||
|
Americas
(a)
|
$
|
1,703.8
|
|
$
|
1,914.8
|
|
$
|
1,874.5
|
|
|||
|
EMEA
(b)
|
2,302.9
|
|
2,188.9
|
|
2,218.0
|
|
||||||
|
Asia Pacific
(c)
|
544.9
|
|
545.4
|
|
518.8
|
|
||||||
|
Total
|
$
|
4,551.6
|
|
$
|
4,649.1
|
|
$
|
4,611.3
|
|
|||
|
(a)
|
includes North & South America
|
|
(b)
|
includes Europe, Middle East and Africa
|
(c)
includes Asia and Australia
|
Year Ended June 30,
|
|||||||||||||
|
2014
|
2013
|
2012
|
|||||||||||
|
Net revenues:
|
|||||||||||||
|
U.S.
|
$
|
1,338.6
|
|
$
|
1,537.4
|
|
$
|
1,510.9
|
|
||||
|
Switzerland
(a)
:
|
|||||||||||||
|
Travel Retail and Export
|
497.8
|
|
500.6
|
|
491.6
|
|
|||||||
|
United Kingdom
|
415.1
|
|
388.1
|
|
373.3
|
|
|||||||
|
Netherlands
|
93.8
|
|
98.1
|
|
102.1
|
|
|||||||
|
Domestic
|
34.8
|
|
36.3
|
|
38.3
|
|
|||||||
|
Total Switzerland
|
1,041.5
|
|
1,023.1
|
|
1,005.3
|
|
|||||||
|
Germany
|
451.8
|
|
442.2
|
|
442.7
|
|
|||||||
|
All other
|
1,719.7
|
|
1,646.4
|
|
1,652.4
|
|
|||||||
|
Total
|
$
|
4,551.6
|
|
$
|
4,649.1
|
|
$
|
4,611.3
|
|
||||
|
Long-lived assets:
|
|||||||||||||
|
U.S.
|
$
|
2,921.2
|
|
$
|
2,924.3
|
|
$
|
2,926.8
|
|
||||
|
All other
|
799.0
|
|
1,076.2
|
|
1,063.4
|
|
|||||||
|
Total
|
$
|
3,720.2
|
|
$
|
4,000.5
|
|
$
|
3,990.2
|
|
||||
|
(a)
|
The Company’s subsidiaries in Switzerland generate revenues from sales in the United Kingdom (“U.K.”), the Netherlands and domestic sales in Switzerland as well as the Travel Retail and Export business (which sells to a large number of travel outlets, including duty free shops, airlines and other tax-free zones in several countries), as specified separately in the table above.
|
For Net revenues, a major country is defined as a group of subsidiaries in a country with combined revenues greater than
10%
of consolidated net revenues or as otherwise deemed significant.
For Long-lived assets, a major country is defined as a group of subsidiaries within a country with combined long-lived assets greater than
10%
of consolidated long-lived assets or as otherwise deemed significant. Long-lived assets include property and equipment, goodwill and other intangible assets.
No customer or group of affiliated customers accounted for more than
10%
of the Company’s Net revenues in fiscal
2014
,
2013
and
2012
or are deemed significant.
Within the Company’s reportable segments, product categories exceeding 5% of consolidated net revenues are presented below; no individual Skin & Body Care product category exceeded
5%
of consolidated net revenues:
F-15
COTY INC. & SUBSIDIARIES
NOTES TO CONSOLIDATED FINANCIAL STATEMENTS
($ in millions, except per share data)
|
Year Ended June 30,
|
|||||||||
|
PRODUCT CATEGORY
|
2014
|
2013
|
2012
|
||||||
|
Fragrances:
|
|||||||||
|
Designer
|
37.4
|
%
|
35.8
|
%
|
35.7
|
%
|
|||
|
Lifestyle
|
11.5
|
|
10.8
|
|
11.2
|
|
|||
|
Celebrity
|
6.0
|
|
7.0
|
|
6.3
|
|
|||
|
Total
|
54.9
|
%
|
53.6
|
%
|
53.2
|
%
|
|||
|
Color Cosmetics:
|
|||||||||
|
Nail Care
|
14.0
|
%
|
16.1
|
%
|
16.3
|
%
|
|||
|
Other Color Cosmetics
|
16.0
|
|
15.5
|
|
14.7
|
|
|||
|
Total
|
30.0
|
%
|
31.6
|
%
|
31.0
|
%
|
|||
|
Skin & Body Care
|
15.1
|
%
|
14.8
|
%
|
15.8
|
%
|
|||
|
Total
|
100.0
|
%
|
100.0
|
%
|
100.0
|
%
|
|||
4. BUSINESS COMBINATIONS
The Company completed
two
acquisitions during fiscal 2014:
|
Acquired entity
|
Date acquired
|
Purchase Price
|
Segment
|
||||
|
Lena White, Ltd. (“Lena White”)
|
January 2, 2014
|
$
|
11.0
|
|
Color Cosmetics
|
||
|
StarAsia Group Pte Ltd. (“StarAsia”)
|
July 1, 2013
|
23.5
|
|
All segments
|
|||
Lena White
On January 2, 2014, the Company executed a Share Purchase Agreement (“Lena White SPA”) to acquire
100%
of the shares of Lena White, a U.K. distribution business for approximately
£6.6
million (
$11.0
), subject to post-closing net working capital adjustments. The acquisition allowed the Company to integrate sales and distribution of certain Color Cosmetic products in the U.K. Included in the consideration paid is
£0.5
million (
$0.8
) that the Company deposited into escrow under the Lena White SPA, which will be released to the seller subject to subsequent adjustments for indemnities against the seller’s warranties. Also included in the cost of the acquisition is
£0.7
million (
$1.1
) of estimated contingent consideration calculated using a pre-determined formula in the SPA, payable upon completion of a
three
-year period following the execution of the Lena White SPA and is subject to adjustments based on final calculations. Future adjustments to the estimated contingent consideration will be included in Selling, general, and administrative expenses in the Consolidated Statements of Operations. Contingent consideration will range between
nil
and
£1.5
million (
$2.5
).
As of the date of this Annual Report on Form 10-K and in accordance with the terms set forth in the Lena White SPA, the purchase price and purchase price allocation as it relates to post-closing net working capital adjustments have not been finalized. The purchase price is expected to be finalized during fiscal 2015. The following table summarizes the preliminary consideration and the allocation of the purchase price to the net assets acquired in the Lena White acquisition:
Consideration:
|
Cash paid
|
$
|
8.3
|
|
|
Cash received from seller for initial net working capital adjustment
|
(0.3
|
)
|
|
|
Noncash consideration for pre-acquisition trade receivables
|
1.9
|
|
|
|
Contingent consideration payable
|
1.1
|
|
|
|
Purchase price
|
$
|
11.0
|
|
F-16
COTY INC. & SUBSIDIARIES
NOTES TO CONSOLIDATED FINANCIAL STATEMENTS
($ in millions, except per share data)
|
Estimated
fair value
|
Estimated
useful life
(in years)
|
||||
|
Goodwill
|
$
|
1.9
|
|
||
|
Customer relationships
|
4.0
|
|
7
|
||
|
Other net assets
|
5.1
|
|
|||
|
Total identifiable net assets
|
$
|
11.0
|
|
||
The goodwill is not deductible for tax purposes and represents expected benefits associated with the Company’s control over future expansion in the U.K. and the Color Cosmetics segment. Goodwill of
$1.9
was allocated to the Color Cosmetics segment.
For the
year ended June 30, 2014
, Net revenues and Net loss of Lena White included in the Company’s Consolidated Statements of Operations from the date of acquisition were
$7.8
and
$(1.7)
, respectively.
Transaction-related costs associated with this acquisition of
$0.1
during the
year ended June 30, 2014
were expensed as incurred and included in Selling, general, and administrative expenses in the Consolidated Statements of Operations.
StarAsia
On July 1, 2013, the Company executed a Share Purchase Agreement to acquire
100%
of the shares of StarAsia for net consideration of
$23.5
, after final post-closing adjustments. StarAsia is a regional distribution company that acted as a third party distributor of the Company’s fragrance, color cosmetics and skin & body care products in South East Asia, as well as beauty products supplied by parties other than the Company.
The following tables summarize the consideration and purchase price allocation to the net assets acquired in the StarAsia acquisition:
|
Consideration:
|
|||
|
Cash paid
|
$
|
25.0
|
|
|
Noncash consideration for pre-acquisition trade receivables
|
2.0
|
|
|
|
Net working capital adjustment received from seller
|
(3.5
|
)
|
|
|
Purchase price
|
$
|
23.5
|
|
|
Estimated
fair value
|
Estimated
useful life
(in years)
|
||||
|
Goodwill
|
$
|
11.5
|
|
||
|
Customer relationships
|
7.4
|
|
12
|
||
|
Other net assets
|
4.6
|
|
|||
|
Total identifiable net assets
|
$
|
23.5
|
|
||
The goodwill is not deductible for tax purposes and represents expected benefits associated with the Company’s control over future expansion in Asia and all of the Company's segments. Goodwill of
$7.0
,
$3.8
, and
$0.7
is allocated to the Skin & Body Care, Fragrances and Color Cosmetics segments, respectively.
For the
year ended June 30, 2014
, Net revenues and Net loss included in the Company’s Consolidated Statements of Operations from the date of acquisition were
$24.6
and
$(4.4)
, respectively.
Transaction-related costs associated with this acquisition of
$0.4
and
$1.1
during fiscal 2014 and 2013 were expensed as incurred and included in Selling, general, and administrative expenses in the Consolidated Statements of Operations.
Acquisition of Licensing Rights
On
October 29, 2012
, the Company acquired licensing rights from a third party to distribute a celebrity’s existing fragrance portfolio and develop new fragrances. The transaction was accounted for as a business combination with a total consideration of
$11.7
, including a contingent consideration of
$3.5
. The total consideration was allocated to license agreement of
$6.1
, which is
F-17
COTY INC. & SUBSIDIARIES
NOTES TO CONSOLIDATED FINANCIAL STATEMENTS
($ in millions, except per share data)
amortized over its estimated useful life of
12
years, goodwill of
$7.4
(net of deferred tax adjustment of
$1.2
), and net other liabilities of
$3.0
. This goodwill is deductible for tax purposes and represents expected synergies associated with integrating the acquired business into the Company’s operations and is included in the Fragrances segment. The Company settled the contingent consideration with the third party for
$1.1
in July 2013.
5. JOINT VENTURE ARRANGEMENTS
United Arab Emirates
On January 1, 2014, a shareholders agreement (“U.A.E. Shareholders Agreement”) entered into by the Company through a majority-owned subsidiary and
two
third parties to create a new subsidiary (“U.A.E. JV”) in the U.A.E. became effective. In connection with the capitalization of the JV, the Company contributed
18.0
million AED (
$4.9
) in cash and the third parties contributed
6.0
million AED (
$1.6
). The U.A.E. JV will focus on the sale, promotion and distribution of fragrances, skin and body care and color cosmetics products in the local markets of the U.A.E. The Company will also guarantee up to
18.0 million
AED (
$4.9
) in bank financing to support initial operation requirements if required and as a result of this additional financing requirement, the U.A.E. JV was determined to be a VIE. The Company is considered the primary beneficiary with
49%
ownership since the Company has: (a) the power to direct, supervise, and manage the activities of the VIE that most significantly impact the entity’s economic performance, and (b) the obligation to absorb losses of the entity that could potentially be significant to the variable interest entity or the right to receive benefits from the entity that could potentially be significant to the variable interest entity. Accordingly, the Company includes the assets and liabilities and results of operations of the U.A.E. JV in its consolidated financial statements.
The Company is required under the U.A.E. Shareholders Agreement to purchase all of the shares held by
one
of the third parties equal to
25%
of the outstanding shares of the U.A.E. JV at the termination of the agreement. The Company has determined such shares to be a mandatorily redeemable financial instrument and is recorded as a liability in Other noncurrent liabilities on the Consolidated Balance Sheet. The liability is calculated based upon a pre-determined formula in accordance with the shareholders agreement and was
$3.7
at
June 30, 2014
.
The assets of the JV are restricted in that they are not available for general business use outside the context of the U.A.E. JV and the creditors (or beneficial interest holders) do not have recourse to the Company or to its other assets. The U.A.E. JV has total assets and total liabilities of
$18.0
and
$10.5
as of
June 30, 2014
, respectively.
Brazil
On
April 4, 2013
, the Company entered into agreements with a third party to establish an entity that exclusively markets and sells beauty products in retail channels in Brazil. The third party provided
4.9 million
Brazilian reais (
$2.2
) of funding for
49%
of the shares of the entity during the
year ended June 30, 2014
. The funding is classified as Other noncurrent liabilities as of
June 30, 2014
since the Company is obligated to repay the funding to the third party on
April 4, 2023
, which is the maximum contract term. The liability is calculated as the combination of contributed capital and the pro-rata share of income less dividends paid to the third party and was
$1.8
at June 30, 2014. The third party is entitled to its proportionate share of the earnings of the Brazil entity, payable annually for the expected life of the contract.
6. RESTRUCTURING COSTS
Restructuring costs for the years ended June 30,
2014
,
2013
and
2012
are presented below:
|
Year Ended June 30,
|
|||||||||||
|
2014
|
2013
|
2012
|
|||||||||
|
Organizational Redesign
|
$
|
13.0
|
|
$
|
—
|
|
$
|
—
|
|
||
|
China Optimization
|
9.8
|
|
—
|
|
—
|
|
|||||
|
Productivity Program
|
14.2
|
|
25.3
|
|
—
|
|
|||||
|
Other restructuring programs
(a)
|
0.3
|
|
4.1
|
|
11.1
|
|
|||||
|
Total
|
$
|
37.3
|
|
$
|
29.4
|
|
$
|
11.1
|
|
||
(a)
Includes Service Agreement Termination, Acquisition Integration Program and the 2009 Cost Savings Program.
F-18
COTY INC. & SUBSIDIARIES
NOTES TO CONSOLIDATED FINANCIAL STATEMENTS
($ in millions, except per share data)
Organizational Redesign
During the fourth quarter of fiscal 2014, the Company’s Board of Directors approved a program associated with a new organizational structure (“Organizational Redesign”) that aims to reinforce the Company’s growth path and strengthen its position as a global leader in beauty. The Company anticipates that the Organizational Redesign will result in pre-tax restructuring and related costs of
$145.0
to
$180.0
, all of which will result in cash payments. The Company anticipates substantial completion of all project activities by the end of fiscal 2017, with the remaining costs primarily charged to Corporate.
The Company incurred
$13.0
of restructuring charges during fiscal 2014 in the Corporate segment.
The related liability balance and activity for the restructuring costs are presented below:
|
Severance and
Employee Benefits |
Other
Exit Costs |
Total
Program Costs |
|||||||||
|
Initial provision
|
$
|
9.4
|
|
$
|
3.6
|
|
$
|
13.0
|
|
||
|
Payments
|
(0.3
|
)
|
(0.4
|
)
|
(0.7
|
)
|
|||||
|
Payables
|
—
|
|
(1.3
|
)
|
(1.3
|
)
|
|||||
|
Balance—June 30, 2014
|
$
|
9.1
|
|
$
|
1.9
|
|
$
|
11.0
|
|
||
The Company currently estimates that the total remaining accrual of
$11.0
will result in cash expenditures of
$9.1
and
$1.9
in fiscal 2015 and 2016, respectively.
China Optimization
During the fourth quarter of fiscal 2014, the Company entered into a distribution agreement with a third-party distributor for certain of the Company’s brands sold through the mass distribution channel in China and announced the discontinuation of the Company’s TJoy brand. In conjunction with these events, the Company commenced implementation of restructuring and product rationalization activities of the Company's mass business in China (“China Optimization”) that are expected to generate operating efficiencies. The China Optimization pre-tax restructuring costs and related charges are expected to be approximately
$35.0
to
$45.0
, of which
$35.9
was incurred as of June 30, 2014. Of the
$35.9
,
$23.0
,
$10.3
, and
$2.6
were recorded in the Skin and Body Care, Corporate and Color Cosmetics segments, respectively. The Company expects to complete all program activities during fiscal 2015, with the remaining costs primarily charged to Corporate.
The related liability balance and activity for the restructuring costs are presented below:
|
Restructuring Costs
|
Related Charges
|
||||||||||||||||||||||||||
|
Severance and
Employee Benefits |
Other
Exit Costs |
Total
Restructuring Costs |
Product Returns
|
Inventory Write-offs
|
Other Charges
|
Total Restructuring and Related Charges
|
|||||||||||||||||||||
|
Initial provision
|
$
|
9.6
|
|
$
|
0.2
|
|
$
|
9.8
|
|
$
|
15.4
|
|
$
|
8.5
|
|
$
|
2.2
|
|
$
|
35.9
|
|
||||||
Product returns are recorded as a reduction to gross sales, inventory write-offs as cost of sales and other charges as Selling, general and administrative in the Company’s Consolidated Statements of Operations for the year ended June 30, 2014. Additionally, the Company recorded
$16.0
of income tax benefit associated with the TJoy brand discontinuation. As a result of China Optimization, the Company classified $
6.8
of land and building as assets held for sale within Prepaid expenses and other current assets on the Company’s Consolidated Balance Sheets as of June 30, 2014.
The Company currently estimates that the total remaining restructuring accrual of
$9.8
will result in cash expenditures in fiscal 2015.
Productivity Program
During the fourth quarter of fiscal
2013
, the Company’s Board of Directors approved a number of business integration and productivity initiatives aimed at enhancing long-term operating margins (the “Productivity Program”). Such activities primarily relate to integration of supply chain and selling activities within the Skin & Body Care segment, as well as certain commercial organization re-design activities, primarily in Europe and optimization of selected administrative support functions.
The Company anticipates completing the implementation of all project activities by the end of fiscal
2016
. The total charge associated with the Productivity Program is expected to be approximately
$70.0
to
$75.0
, of which
$39.5
and
$25.3
was incurred as of
June 30, 2014
and
June 30, 2013
, respectively, in Corporate.
F-19
COTY INC. & SUBSIDIARIES
NOTES TO CONSOLIDATED FINANCIAL STATEMENTS
($ in millions, except per share data)
The related liability balance and activity for the restructuring costs are presented below:
|
Severance and
Employee
Benefits
|
Third-Party
Contract
Terminations
|
Other
Exit
Costs
|
Total
Program
Costs
|
||||||||||||
|
Initial provision
|
$
|
24.7
|
|
$
|
0.5
|
|
$
|
0.1
|
|
$
|
25.3
|
|
|||
|
Payments
|
(2.9
|
)
|
(0.1
|
)
|
—
|
|
(3.0
|
)
|
|||||||
|
Effect of exchange rates
|
(0.1
|
)
|
—
|
|
—
|
|
(0.1
|
)
|
|||||||
|
Balance—July 1, 2013
|
21.7
|
|
0.4
|
|
0.1
|
|
22.2
|
|
|||||||
|
Restructuring charges
|
13.7
|
|
0.3
|
|
2.1
|
|
16.1
|
|
|||||||
|
Payments
|
(18.0
|
)
|
(0.5
|
)
|
(2.0
|
)
|
(20.5
|
)
|
|||||||
|
Changes in estimates
(a)
|
(1.9
|
)
|
—
|
|
—
|
|
(1.9
|
)
|
|||||||
|
Effect of exchange rates
|
0.3
|
|
—
|
|
—
|
|
0.3
|
|
|||||||
|
Balance—June 30, 2014
|
$
|
15.8
|
|
$
|
0.2
|
|
$
|
0.2
|
|
$
|
16.2
|
|
|||
(a)
The decrease in severance and employee benefits is primarily attributable to employees who have voluntarily left positions that were later eliminated.
The Company currently estimates that the total remaining accrual of
$16.2
will result in cash expenditures of approximately
$12.8
and
$3.4
in fiscal
2015
and
2016
, respectively.
Other Restructuring Programs
During fiscal 2013 and 2012, the Company maintained several restructuring initiatives aimed at integrating acquired companies and reducing costs. The related liability was
$1.2
and
$6.6
and related costs were
$0.3
and
$4.1
as of June 30, 2014 and 2013, respectively. The Company paid
$4.8
and
$9.7
in fiscal 2014 and 2013 related to its Other Restructuring Programs and changed its estimates for other restructuring charges by
$(0.9)
and
$0.2
in fiscal 2014 and 2013. The Company currently estimated that the total remaining accrual of
$1.2
will result in cash expenditures in fiscal 2015.
7. TRADE RECEIVABLES—FACTORING
The Company factors a portion of its trade receivables with unrelated third-party factoring companies on a non-recourse basis. Trade receivables factored throughout the year with the factoring companies amounted to
$401.7
and
$389.3
in fiscal
2014
and
2013
, respectively. Remaining balances due from factors amounted to
$5.6
and
$17.6
as of June 30,
2014
and
2013
, respectively, and are included in Trade receivables, net in the Consolidated Balance Sheets. Factoring fees paid under these arrangements were
$0.8
,
$0.9
and
$1.4
in fiscal
2014
,
2013
and
2012
, respectively, which were recorded in Selling, general and administrative expenses in the Consolidated Statements of Operations.
8. INVENTORIES
Inventories as of
June 30, 2014
and
2013
are presented below:
|
June 30,
2014 |
June 30,
2013 |
||||||
|
Raw materials
|
$
|
189.3
|
|
$
|
184.4
|
|
|
|
Work-in-process
|
12.3
|
|
35.6
|
|
|||
|
Finished goods
|
415.8
|
|
388.2
|
|
|||
|
Total inventories
|
$
|
617.4
|
|
$
|
608.2
|
|
|
9. PROPERTY AND EQUIPMENT, NET
Property and equipment, net as of June 30,
2014
and
2013
are presented below:
F-20
COTY INC. & SUBSIDIARIES
NOTES TO CONSOLIDATED FINANCIAL STATEMENTS
($ in millions, except per share data)
|
June 30,
2014 |
June 30,
2013 |
|||||||
|
Land, buildings and leasehold improvements
|
$
|
230.7
|
|
$
|
230.9
|
|
||
|
Machinery and equipment
|
492.8
|
|
491.8
|
|
||||
|
Marketing furniture and fixtures
|
278.1
|
|
258.0
|
|
||||
|
Computer equipment and software
|
339.8
|
|
300.3
|
|
||||
|
Construction in progress
|
45.4
|
|
73.8
|
|
||||
|
1,386.8
|
|
1,354.8
|
|
|||||
|
Accumulated depreciation and amortization
|
(846.5
|
)
|
(854.1
|
)
|
||||
|
Property and equipment, net
|
$
|
540.3
|
|
$
|
500.7
|
|
||
Depreciation and amortization expense of property and equipment totaled
$165.0
,
$169.4
and
$145.9
in fiscal
2014
,
2013
and
2012
, respectively, and is recorded in Cost of sales and Selling, general and administrative expenses in the Consolidated Statements of Operations.
In fiscal
2014
,
2013
and
2012
, the Company recorded asset impairment charges of
$6.0
,
$1.5
and
$2.9
, respectively, primarily relating to the disposal of various manufacturing facilities.
During fiscal 2014 and 2013, the Company removed certain fully depreciated assets from service that had original costs of
$175.2
and
$81.9
and no net book value at the date they were removed from service.
10. GOODWILL AND OTHER INTANGIBLE ASSETS, NET
Goodwill
The Company tests goodwill and indefinite lived intangible assets for impairment at least annually as of May 1, or more frequently, if certain events or circumstances warrant. In the first half of fiscal 2014, the Company anticipated realizing significant improvements in cash flows in its Beauty - Skin & Body Care Reporting Units China operations beginning in the third quarter due to the reorganization of the management team and distribution network in China and the launch of new product offerings. In the course of evaluating the results for the third quarter and the preparation of third quarter financial statements, the Company noted the net cash outflows associated with the TJOY Holdings Co., Ltd. (“TJoy”) mass channel business in China were significantly in excess of previous expectations and management concluded that the results in China represented an indicator of impairment that warranted an interim impairment test for goodwill and certain other intangible assets in the Beauty - Skin & Body Care Reporting Unit of
$316.9
, of which
$256.4
related to goodwill and
$60.5
to other long lived assets, as described below and recorded in Asset impairment charges in the Consolidated Statements of Operations.
In step one of the goodwill impairment test, the Company identified that the carrying value of the reporting unit exceeded its fair value based on a re-evaluation of discounted cash flows and confirmed by using a market approach to value the reporting units. The main drivers of the decline were a decrease in average net sales growth rates for the reporting unit from high-single digits to mid-single digits and an increase in weighted average cost of capital, based on management's recent estimates.
In step two of the test, the implied fair value of goodwill was determined by comparing the fair value of the other assets in the reporting unit to the fair value of the reporting unit. Predominantly as a result of the fair value of the adidas license, the implied fair value of goodwill was determined to be nil. As a result, goodwill for the Beauty - Skin & Body Care reporting unit was fully impaired, resulting in a reduction in fair value of the Beauty - Skin & Body Care reporting unit of
43.4%
from the May 1, 2013 fair value and a total non-cash impairment charge of
$316.9
, of which
$256.4
related to goodwill and
$60.5
to other assets.
The Company believes the assumptions used in calculating the estimated fair values of the other reporting units are reasonable and attainable. However, the Company can provide no assurances that it will achieve such projected results. Further, the Company can provide no assurances that it will not have to recognize additional impairment of goodwill in the future due to other market conditions or changes in interest rates in these other reporting units. Recognition of additional impairment of a significant portion of the Company’s goodwill would negatively affect the Company’s reported results of operations and total capitalization.
F-21
COTY INC. & SUBSIDIARIES
NOTES TO CONSOLIDATED FINANCIAL STATEMENTS
($ in millions, except per share data)
Goodwill as of
June 30, 2014
and
June 30, 2013
is presented below:
|
Fragrances
|
Color Cosmetics
|
Skin & Body Care
|
Total
|
||||||||||||
|
Gross balance at June 30, 2013
|
$
|
711.0
|
|
$
|
529.8
|
|
$
|
686.8
|
|
$
|
1,927.6
|
|
|||
|
Accumulated impairments
(a)
|
—
|
|
—
|
|
(384.4
|
)
|
(384.4
|
)
|
|||||||
|
Net balance at June 30, 2013
|
$
|
711.0
|
|
$
|
529.8
|
|
$
|
302.4
|
|
$
|
1,543.2
|
|
|||
|
Changes during the year ended June 30, 2014:
|
|||||||||||||||
|
Acquisition contingent payment
(b)
|
$
|
30.0
|
|
$
|
—
|
|
$
|
—
|
|
$
|
30.0
|
|
|||
|
Acquisitions
(c)
|
3.8
|
|
2.6
|
|
7.0
|
|
13.4
|
|
|||||||
|
Foreign currency translation
|
7.1
|
|
5.8
|
|
(0.3
|
)
|
12.6
|
|
|||||||
|
Impairment charges
|
—
|
|
—
|
|
(256.4
|
)
|
(256.4
|
)
|
|||||||
|
Gross balance at June 30, 2014
|
$
|
751.9
|
|
$
|
538.2
|
|
$
|
693.5
|
|
$
|
1,983.6
|
|
|||
|
Accumulated impairments
|
—
|
|
—
|
|
(640.8
|
)
|
(640.8
|
)
|
|||||||
|
Net balance at June 30, 2014
|
$
|
751.9
|
|
$
|
538.2
|
|
$
|
52.7
|
|
$
|
1,342.8
|
|
|||
(a)
In fiscal 2012, the Company recorded pre-tax non-cash impairment at the Prestige—Skin & Body Care reporting unit of
$384.4
in Asset impairment charges in the Consolidated Statements of Operations, reducing goodwill at this reporting unit from
$437.1
to
$52.7
.
(b)
Pursuant to the Company's fiscal 2006 acquisition of Unilever Cosmetics International, the Company is contractually obligated to make future annual contingent purchase price consideration payments for a
10
-year period following the acquisition to the seller. Payments are based on contractually agreed upon sales targets and can range up to
$30.0
per year. The Company paid
$30.0
during the third quarter of both fiscal 2014 and 2013 for such contingent consideration.
(c)
During the
year ended June 30, 2014
, the Company acquired
100%
of the shares of StarAsia and Lena White. These transactions were accounted for as business combinations (See Note 4).
Other Intangible Assets
Other intangible assets, net as of
June 30, 2014
and
June 30, 2013
are presented below:
|
June 30,
2014 |
June 30,
2013 |
||||||
|
Indefinite-lived other intangible assets
(a)
|
$
|
1,167.8
|
|
$
|
1,171.9
|
|
|
|
Finite-lived other intangible assets, net
(b)
|
669.3
|
|
784.7
|
|
|||
|
Total Other intangible assets, net
|
$
|
1,837.1
|
|
$
|
1,956.6
|
|
|
|
|
|
(a)
Net of accumulated impairments of
$188.6
as of
June 30, 2014
and
June 30, 2013
.
(b)
Net of accumulated impairments of
$21.0
and
$33.5
related to the TJoy trademark and customer relationships, respectively, recorded in fiscal 2014.
F-22
COTY INC. & SUBSIDIARIES
NOTES TO CONSOLIDATED FINANCIAL STATEMENTS
($ in millions, except per share data)
The changes in the carrying amount of indefinite-lived other intangible assets are presented below:
|
Fragrances
|
Color
Cosmetics |
Skin & Body
Care |
Total
|
||||||||||||
|
Gross balance at June 30, 2013
|
30.8
|
|
885.0
|
|
453.9
|
|
1,369.7
|
|
|||||||
|
Accumulated impairments
(a)
|
—
|
|
(9.2
|
)
|
(188.6
|
)
|
(197.8
|
)
|
|||||||
|
Balance—June 30, 2013
|
30.8
|
|
875.8
|
|
265.3
|
|
1,171.9
|
|
|||||||
|
Changes during the period ended June 30, 2014
|
|||||||||||||||
|
Foreign currency translation
|
1.2
|
|
1.5
|
|
—
|
|
2.7
|
|
|||||||
|
Reclassification to definite-lived trademark
|
(6.8
|
)
|
—
|
|
—
|
|
(6.8
|
)
|
|||||||
|
Gross balance at June 30, 2014
|
25.2
|
|
886.5
|
|
453.9
|
|
1,365.6
|
|
|||||||
|
Accumulated impairments
|
—
|
|
(9.2
|
)
|
(188.6
|
)
|
(197.8
|
)
|
|||||||
|
Net balance at June 30, 2014
|
$
|
25.2
|
|
$
|
877.3
|
|
$
|
265.3
|
|
$
|
1,167.8
|
|
|||
(a)
Impairment charges of
$188.6
were recorded in fiscal 2012 as discussed above. Impairment of
$9.2
was recorded prior to June 30, 2011.
Intangible assets subject to amortization are presented below:
|
Cost
|
Accumulated Amortization
|
Accumulated Impairment
|
Net
|
||||||||||||
|
June 30, 2013
|
|||||||||||||||
|
License agreements
|
$
|
827.0
|
|
$
|
(451.6
|
)
|
$
|
—
|
|
$
|
375.4
|
|
|||
|
Customer relationships
|
543.3
|
|
(173.1
|
)
|
—
|
|
370.2
|
|
|||||||
|
Trademarks
|
145.9
|
|
(112.5
|
)
|
—
|
|
33.4
|
|
|||||||
|
Product formulations
|
31.8
|
|
(26.1
|
)
|
—
|
|
5.7
|
|
|||||||
|
Total
|
$
|
1,548.0
|
|
$
|
(763.3
|
)
|
$
|
—
|
|
$
|
784.7
|
|
|||
|
June 30, 2014
|
|||||||||||||||
|
License agreements
|
$
|
835.0
|
|
$
|
(490.8
|
)
|
$
|
—
|
|
$
|
344.2
|
|
|||
|
Customer relationships
|
510.8
|
|
(169.4
|
)
|
(33.5
|
)
|
307.9
|
|
|||||||
|
Trademarks
|
125.8
|
|
(90.1
|
)
|
(21.0
|
)
|
14.7
|
|
|||||||
|
Product formulations
|
31.8
|
|
(29.3
|
)
|
—
|
|
2.5
|
|
|||||||
|
Total
|
$
|
1,503.4
|
|
$
|
(779.6
|
)
|
$
|
(54.5
|
)
|
$
|
669.3
|
|
|||
Concurrently with the evaluation of future cash flows of the reporting unit, the Company also re-evaluated future cash flows from other long lived assets in China, consisting of the TJoy trademark, customer relationships and a manufacturing facility, with a total carrying value of
$69.1
. It was determined that the carrying value of this asset group exceeded its fair value resulting in an impairment charge of
$60.5
. The TJoy trademark and customer relationships of
$21.0
and
$33.5
, respectively, were fully impaired and the remaining
$6.0
impairment charge was attributable to the reduction of the carrying value of a manufacturing facility.
Intangible assets subject to amortization are amortized principally using the straight-line method and have the following weighted-average remaining lives:
|
Description
|
|
|
License agreements
|
11.0 years
|
|
Customer relationships
|
8.5 years
|
|
Trademarks
|
12.2 years
|
|
Product formulations
|
3.5 years
|
As of
June 30, 2014
, the remaining weighted-average life of all intangible assets subject to amortization is
9.8 years
.
F-23
COTY INC. & SUBSIDIARIES
NOTES TO CONSOLIDATED FINANCIAL STATEMENTS
($ in millions, except per share data)
Amortization expense totaled
$85.7
,
$90.2
and
$93.2
for the fiscal years ended
June 30, 2014
, 2013 and 2012, respectively. The estimated aggregate amortization expense for each of the following fiscal years ending June 30 is presented below:
|
2015
|
$
|
76.3
|
|
|
2016
|
74.5
|
|
|
|
2017
|
74.1
|
|
|
|
2018
|
73.7
|
|
|
|
2019
|
73.0
|
|
|
License Agreements
The Company records assets for license agreements (“licenses”) acquired in transactions accounted for as business combinations. These licenses provide the Company with the exclusive right to manufacture and market on a worldwide and/or regional basis, certain of the Company’s products which comprise a significant portion of the Company’s revenues. These licenses have initial terms covering various periods. Certain licenses provide for automatic extensions ranging from
5
to
10
-year terms, contingent upon attaining specified sales levels. Based on the current sales and the time until renewal, management cannot determine whether specified sales levels will be attained, which will permit extensions.
There were no licenses acquired during fiscal 2014. During fiscal 2013, the Company acquired
one
new license with rights to manufacture and distribute fragrance products under certain trademarks. During fiscal 2013, the Company received
$25.0
related to the termination of one of its licenses by mutual agreement with the original licensor. The license had a net book value of
$5.7
and, therefore, the Company recorded a gain of
$19.3
in the Consolidated Statements of Operations, which was included in “Corporate” in Note 3.
11. ACCRUED EXPENSES AND OTHER CURRENT LIABILITIES
Accrued expenses and other current liabilities as of June 30,
2014
and
2013
are presented below:
|
|
|
June 30,
2014 |
June 30,
2013 |
|||||
|
Customer returns, discounts, allowances and bonuses
|
$
|
196.4
|
|
$
|
199.0
|
|
||
|
Advertising, marketing and licensing
|
194.8
|
|
198.2
|
|
||||
|
Other compensation and related benefits
|
129.3
|
|
119.4
|
|
||||
|
VAT, sales and other non-income taxes
|
41.1
|
|
38.6
|
|
||||
|
Restructuring costs
|
32.9
|
|
23.8
|
|
||||
|
Payroll and payroll related taxes
|
23.2
|
|
24.5
|
|
||||
|
Unfavorable lease contracts
|
18.6
|
|
2.6
|
|
||||
|
Derivative liabilities
|
11.5
|
|
0.8
|
|
||||
|
Auditing and consulting fees
|
8.7
|
|
7.6
|
|
||||
|
Deferred Income
|
8.3
|
|
7.4
|
|
||||
|
Interest
|
3.9
|
|
3.6
|
|
||||
|
Rent
|
3.7
|
|
7.0
|
|
||||
|
Other
|
51.2
|
|
38.6
|
|
||||
|
Total accrued expenses and other current liabilities
|
$
|
723.6
|
|
$
|
671.1
|
|
||
12. DEBT
F-24
COTY INC. & SUBSIDIARIES
NOTES TO CONSOLIDATED FINANCIAL STATEMENTS
($ in millions, except per share data)
|
|
|
June 30,
2014 |
June 30,
2013 |
|||||
|
Short-term debt
|
|
$
|
18.8
|
|
$
|
35.1
|
|
|
|
Coty Inc. Credit Facility due April 2018
|
|
|
||||||
|
Term Loan
|
|
1,875.0
|
|
1,250.0
|
|
|||
|
Revolving Loan Facility
|
|
899.5
|
|
845.0
|
|
|||
|
Senior Notes
|
|
|
|
|||||
|
5.12% Series A notes due June 2017
|
|
100.0
|
|
100.0
|
|
|||
|
5.67% Series B notes due June 2020
|
|
225.0
|
|
225.0
|
|
|||
|
5.82% Series C notes due June 2022
|
|
175.0
|
|
175.0
|
|
|||
|
Capital lease obligations
|
|
0.2
|
|
0.1
|
|
|||
|
Total debt
|
|
3,293.5
|
|
2,630.2
|
|
|||
|
Less: Short-term debt and current portion of long-term debt
|
|
(33.4
|
)
|
(40.1
|
)
|
|||
|
Total Long-term debt
|
|
$
|
3,260.1
|
|
$
|
2,590.1
|
|
|
Short-Term Debt
The Company maintains short-term lines of credit with financial institutions around the world. Total available lines of credit were
$141.4
and
$162.7
, of which
$18.8
and
$35.1
were outstanding at June 30,
2014
and
2013
, respectively. Interest rates on these short-term lines of credit vary depending on market rates for borrowings within the respective geographic locations plus applicable spreads. Interest rates plus applicable spreads on these lines ranged from
1.3%
and
13.5%
and
0.9%
and
9.5%
as of June 30,
2014
and
2013
. The weighted-average interest rate on short-term debt outstanding was
6.7%
and
6.8%
as of June 30,
2014
and
2013
, respectively. In addition, the Company had undrawn letters of credit of
$3.6
and
$3.3
as of June 30,
2014
and
2013
, respectively.
Term Loan and Revolving Loan Facility
On June 25, 2014, the Company entered into the Incremental Term Loan Amendment to the Credit Agreement (as defined below). The amendment provides for an incremental term loan of
$625.0
(“Incremental Term Loan”), and the Incremental Term Loan has substantially the same terms and conditions as those of the 2013 Term Loan (as defined below), except with respect to principal repayments. The Incremental Term Loan is payable in full on April 2, 2018. The Company entered into the Incremental Term Loan in connection with the share purchase agreement (see Note 21) and for general corporate purposes. Applicable spreads on the borrowings under the Incremental Term Loan Amendment may range from
0.0%
to
1.5%
based on the Company’s consolidated leverage ratio, as defined in the 2013 Credit Agreement. Deferred financing fees of
$2.2
were recorded in Other noncurrent assets in the Consolidated Balance Sheet in connection with the amendment as of June 30, 2014 and there were no deferred financing fees written off as a result of the amendment.
On April 2, 2013, the Company refinanced its then-existing credit facility, entering into a Credit Agreement (the “2013 Credit Agreement”), with JP Morgan Chase Bank, N.A. as administrative agent and Bank of America, N.A., BNP Paribas, Crédit Agricole Corporate & Investment Bank, Deutsche Bank Securities Inc., ING Bank N.V., Morgan Stanley MUFG Loan Partners, LLC and Wells Fargo Bank, N.A., as syndication agents. The 2013 Credit Agreement that expires on April 2, 2018 and provides (i) a term loan of
$1,250.0
(the “2013 Term Loan”) and (ii) a revolving loan facility of
$1,250.0
(the “2013 Revolving Loan Facility”), which includes up to
$80.0
in swingline loans under the 2013 Revolving Loan Facility. Rates of interest on amounts borrowed under the 2013 Credit Agreement are based on the London Interbank Offer Rate (“LIBOR”), a qualified Eurocurrency LIBOR, an alternative base rate, or a qualified local currency rate, as applicable to the borrowings, plus applicable spreads determined by the consolidated leverage ratio. Applicable spreads on the borrowings under the 2013 Credit Agreement may range from
0.0%
to
1.5%
based on the Company’s consolidated leverage ratio, as defined in the 2013 Credit Agreement. In addition to interest on amounts borrowed under the 2013 Credit Agreement, the Company pays a quarterly commitment fee, as defined in the 2013 Credit Agreement, on the 2013 Revolving Loan Facility that can range from
0.15%
to
0.23%
based on the Company’s consolidated leverage ratio, as defined in the 2013 Credit Agreement. Quarterly repayments of the 2013 Term Loan will commence on July 1, 2015 and will total
10%
in fiscal 2016,
20%
in fiscal 2017 and
70%
in fiscal 2018. The 2013 Revolving Loan Facility is payable in full in fiscal 2018. The Company used the proceeds from the 2013 Credit Agreement to repay amounts outstanding under the 2011 Credit Agreement described below and for general corporate purposes. In April 2013, the Company wrote off
$2.6
of deferred financing fees associated with the refinancing, which was included in interest expense, net in the Consolidated Statements of Operations in fiscal 2013. As of
June 30, 2014
, the Company had
$350.5
available for borrowings under the 2013 Credit Agreement.
F-25
COTY INC. & SUBSIDIARIES
NOTES TO CONSOLIDATED FINANCIAL STATEMENTS
($ in millions, except per share data)
On August 22, 2011, the Company refinanced its then-existing credit facility, entering into a credit agreement with JP Morgan Chase Bank, N.A. as administrative agent and Bank of America, N.A. and Wells Fargo Bank, N.A. as co-syndication agents (the “2011 Credit Agreement”). By its terms, the 2011 Credit Agreement would have expired on August 22, 2015. The 2011 Credit Agreement provided a term loan of
$1,250.0
(the “2011 Term Loan”) and a revolving loan facility of
$1,250.0
(the “2011 Revolving Loan Facility”). Rates of interest on amounts borrowed under the 2011 Credit Agreement were based on either LIBOR, a qualified Eurocurrency LIBOR, an alternative base rate, or a qualified local currency rate, as applicable to the borrowings, plus applicable spreads determined by the Company’s consolidated leverage ratio or, if applicable, the Company’s credit rating by Moody’s or S&P. Applicable spreads on the borrowings under the 2011 Credit Agreement could have ranged from
0.05%
to
2.5%
. In addition to interest on amounts borrowed under the 2011 Credit Agreement, the Company paid a quarterly commitment fee, as defined in the 2011 Credit Agreement, on the 2011 Revolving Loan Facility that could have ranged from
0.2%
to
0.4%
. In August 2011, The Company wrote off
$1.4
of deferred financing fees associated with the refinancing, which was included in interest expense, net in the Consolidated Statements of Operations in fiscal 2012.
Interest is payable quarterly or on the last day of the interest period applicable to the borrowings under the 2013 Credit Agreement. The weighted-average interest rate on the Incremental Term Loan was approximately
1.6%
in both fiscal 2014 and 2013 and the weighted-average interest rate on the 2013 Revolving Loan Facility was approximately
1.3%
and
1.4%
in fiscal 2014 and 2013, respectively.The weighted-average interest rate on the 2011 Term Loan was approximately
2.0%
for the period in fiscal 2013 before the refinancing of the 2011 Credit Agreement and approximately
2.1%
in fiscal 2012. The weighted-average interest rate on the 2011 Revolving Loan Facility was approximately
1.7%
for the period in fiscal 2013 before the refinancing and approximately
1.7%
in fiscal 2012.
Senior Notes
On
July 22, 2013
, the Company amended the Note Purchase Agreement relating to its Senior Notes to, among other things, align the definition of “Change of Control” with the 2013 Credit Agreement, and to modify the definition of “Consolidated EBITDA” to include or increase certain add-backs related to non-recurring expenses similar to those contained in the 2013 Credit Agreement. Deferred financing fees of
$0.4
were recorded in Other noncurrent assets in the Consolidated Balance Sheet in connection with the amendment as of
June 30, 2014
.
On June 16, 2010, the Company issued
$500.0
of Senior Secured Notes (the “Senior Notes”) in three series in a private placement transaction pursuant to a Note Purchase Agreement (the “NPA”): (i)
$100.0
in aggregate principal amount of
5.12%
Series A Senior Secured Notes due June 16, 2017, (ii)
$225.0
in aggregate principal amount of
5.67%
Series B Senior Secured Notes due June 16, 2020 and (iii)
$175.0
in aggregate principal amount of
5.82%
Series C Senior Secured Notes due June 16, 2022. Interest payments are payable semi-annually in December and June. In connection with the refinancing of the credit facility in August 2011, the liens that secured the Senior Notes were released as provided in the NPA. See Note 25 for additional disclosures surrounding the Senior Notes.
Financial Covenants
As of June 30,
2014
, the Company is required to comply with certain covenants contained within the 2013 Credit Agreement and the NPA (each, as amended, the “Agreements”). These covenants within the Agreements contain customary representations and warranties as well as customary affirmative and negative covenants, including but not limited to, restrictions on incurrence of additional debt, liens, dividends and other restricted payments, asset sales, investments, mergers, acquisitions and affiliate transactions. Events of default permitting acceleration under the Agreements include, among others, nonpayment of principal or interest, covenant defaults, material breaches of representations and warranties, bankruptcy and insolvency events and certain cross defaults. In addition, a change of control is a default under the 2013 Credit Agreement, as amended and requires a prepayment offer under the NPA, as amended. Financial covenants in the Agreements require the Company to maintain, at the end of each fiscal quarter, a consolidated leverage ratio of consolidated total debt to consolidated EBITDA, as defined in the Agreements, equal to or less than
3.5
to 1.0 for the previous 12-month period, and a consolidated interest coverage ratio, as these terms are defined in the Agreements, equal to or greater than
3.0
to 1.0 for the previous 12-month period, except that the 2013 Credit Agreement permits us to maintain a consolidated leverage ratio equal to or less than
4.0
to 1.0 for the 12-month period following an acquisition, as defined in the 2013 Credit Agreement.
The Company is in compliance with all financial covenants within the Agreements as of June 30,
2014
.
Repayment Schedule
Aggregate maturities of all long-term debt, including current portion of long-term debt and excluding capital lease obligations as of June 30,
2014
, are presented below:
F-26
COTY INC. & SUBSIDIARIES
NOTES TO CONSOLIDATED FINANCIAL STATEMENTS
($ in millions, except per share data)
|
Fiscal Year Ending June 30
|
|
||
|
2015
|
$
|
14.5
|
|
|
2016
|
125.0
|
|
|
|
2017
|
350.0
|
|
|
|
2018
|
2,385.0
|
|
|
|
2019
|
—
|
|
|
|
Thereafter
|
400.0
|
|
|
|
Total
|
$
|
3,274.5
|
|
13. LEASE COMMITMENTS
The Company has various buildings and equipment under leasing arrangements. The leases generally provide for payment of additional rent based upon increases in items such as real estate taxes and insurance. Certain lease agreements have renewal options for periods typically ranging between
two
and
five years
. Certain lease agreements have escalation clauses, which have been straight-lined over the life of the respective lease agreements. The minimum rental lease commitments for non-cancellable operating leases as of June 30,
2014
are presented below:
|
Fiscal Year Ending June 30
|
|
||
|
2015
|
$
|
67.6
|
|
|
2016
|
54.7
|
|
|
|
2017
|
44.0
|
|
|
|
2018
|
40.6
|
|
|
|
2019
|
37.4
|
|
|
|
Thereafter
|
243.2
|
|
|
|
487.5
|
|
||
|
Less: sublease income
|
(28.9
|
)
|
|
|
Total minimum payments required
|
$
|
458.6
|
|
Rent expense relating to operating leases in fiscal
2014
,
2013
and
2012
is presented below:
|
Year Ended June 30,
|
||||||||||||
|
|
|
2014
|
2013
|
2012
|
||||||||
|
Rent expense
|
|
$
|
112.5
|
|
$
|
89.7
|
|
$
|
86.1
|
|
||
|
Less: sublease income
|
|
(1.4
|
)
|
(1.2
|
)
|
(1.4
|
)
|
|||||
|
Total
|
|
$
|
111.1
|
|
$
|
88.5
|
|
$
|
84.7
|
|
||
Reflected in rent expense above are lease loss expenses of
$21.4
,
nil
and
$5.0
and duplicative rent expenses of
$5.0
,
$5.3
and
nil
in fiscal 2014, 2013 and 2012, respectively. In addition, the Company incurred accelerated depreciation of
$4.1
,
$16.5
and
$6.1
, in fiscal 2014, 2013 and 2012, respectively. These costs relate to the New York real estate consolidation program and were recorded in Selling, general and administrative expenses in the Consolidated Statements of Operations and included in Corporate (Note 3).
14. INCOME TAXES
(Loss) income from operations before income taxes in fiscal
2014
,
2013
and
2012
is presented below:
|
Year Ended June 30,
|
||||||||||||
|
|
|
2014
|
2013
|
2012
|
||||||||
|
United States
|
|
$
|
(119.1
|
)
|
$
|
(53.5
|
)
|
$
|
(616.6
|
)
|
||
|
Foreign
|
|
75.0
|
|
372.2
|
|
285.5
|
|
|||||
|
Total
|
|
$
|
(44.1
|
)
|
$
|
318.7
|
|
$
|
(331.1
|
)
|
||
The components of the Company’s total provision (benefit) for income taxes during fiscal
2014
,
2013
and
2012
are presented below:
F-27
COTY INC. & SUBSIDIARIES
NOTES TO CONSOLIDATED FINANCIAL STATEMENTS
($ in millions, except per share data)
|
Year Ended June 30,
|
||||||||||||
|
|
|
2014
|
2013
|
2012
|
||||||||
|
Provision (benefit) for income taxes:
|
|
|
|
|
||||||||
|
Current:
|
|
|
|
|
||||||||
|
Federal
|
|
$
|
5.6
|
|
$
|
(26.5
|
)
|
$
|
24.7
|
|
||
|
State and local
|
|
2.1
|
|
2.8
|
|
3.3
|
|
|||||
|
Foreign
|
|
50.8
|
|
110.6
|
|
87.8
|
|
|||||
|
Total
|
|
58.5
|
|
86.9
|
|
115.8
|
|
|||||
|
Deferred:
|
|
|
|
|
||||||||
|
Federal
|
|
(30.6
|
)
|
8.3
|
|
(104.0
|
)
|
|||||
|
State and local
|
|
(0.7
|
)
|
2.6
|
|
(27.8
|
)
|
|||||
|
Foreign
|
|
(7.1
|
)
|
19.0
|
|
(21.8
|
)
|
|||||
|
Total
|
|
(38.4
|
)
|
29.9
|
|
(153.6
|
)
|
|||||
|
Provision (benefit) for income taxes
|
|
$
|
20.1
|
|
$
|
116.8
|
|
$
|
(37.8
|
)
|
||
The reconciliation of the U.S. Federal statutory tax rate to the Company’s effective income tax rate during fiscal
2014
,
2013
and
2012
is presented below:
|
Year Ended June 30,
|
||||||||||||
|
|
|
2014
|
2013
|
2012
|
||||||||
|
(Loss) income before income taxes
|
|
$
|
(44.1
|
)
|
$
|
318.7
|
|
$
|
(331.1
|
)
|
||
|
(Benefit) provision for income taxes at statutory rate
|
|
$
|
(15.4
|
)
|
$
|
111.6
|
|
$
|
(115.9
|
)
|
||
|
State and local taxes—net of federal benefit
|
|
0.9
|
|
3.5
|
|
(15.9
|
)
|
|||||
|
Foreign tax differentials
|
|
(53.0
|
)
|
(44.2
|
)
|
(51.9
|
)
|
|||||
|
Change in valuation allowances
|
|
36.1
|
|
18.2
|
|
3.8
|
|
|||||
|
Change in unrecognized tax benefit
|
|
(24.4
|
)
|
4.8
|
|
36.2
|
|
|||||
|
Asset impairment charges
|
|
67.4
|
|
—
|
|
80.1
|
|
|||||
|
Share-based compensation
|
|
1.8
|
|
16.0
|
|
27.9
|
|
|||||
|
Permanent differences—net
|
|
1.8
|
|
7.2
|
|
(2.5
|
)
|
|||||
|
Other
|
|
4.9
|
|
(0.3
|
)
|
0.4
|
|
|||||
|
Provision (benefit) for income taxes
|
|
$
|
20.1
|
|
$
|
116.8
|
|
$
|
(37.8
|
)
|
||
|
Effective income tax rate
|
|
(45.6
|
)%
|
36.6
|
%
|
11.4
|
%
|
|||||
Significant components of Deferred income tax assets and liabilities as of June 30,
2014
and
2013
are presented below:
F-28
COTY INC. & SUBSIDIARIES
NOTES TO CONSOLIDATED FINANCIAL STATEMENTS
($ in millions, except per share data)
|
|
|
June 30,
2014 |
June 30,
2013 |
|||||
|
Deferred income tax assets:
|
|
|
|
|||||
|
Inventories
|
|
$
|
20.2
|
|
$
|
13.6
|
|
|
|
Accruals and allowances
|
|
87.4
|
|
82.4
|
|
|||
|
Sales returns
|
|
20.1
|
|
19.4
|
|
|||
|
Share-based compensation
|
|
35.4
|
|
37.2
|
|
|||
|
Employee benefits
|
|
50.9
|
|
43.7
|
|
|||
|
Net operating loss carry forwards and tax credits
|
|
102.2
|
|
118.9
|
|
|||
|
Other
|
|
45.3
|
|
38.3
|
|
|||
|
Less: valuation allowances
|
|
(98.6
|
)
|
(61.5
|
)
|
|||
|
Net deferred income tax assets
|
|
262.9
|
|
292.0
|
|
|||
|
Deferred income tax liabilities:
|
|
|
|
|||||
|
Intangible assets
|
|
421.9
|
|
423.4
|
|
|||
|
Licensing rights
|
|
6.4
|
|
84.6
|
|
|||
|
Other
|
|
33.8
|
|
25.9
|
|
|||
|
Deferred income tax liabilities
|
|
462.1
|
|
533.9
|
|
|||
|
Net deferred income tax liabilities
|
|
$
|
(199.2
|
)
|
$
|
(241.9
|
)
|
|
The expirations of tax loss carry forwards, amounting to
$251.0
as of June 30,
2014
, in each of the fiscal years ending June 30, are presented below:
|
Fiscal Year Ending June 30
|
|
United States
|
|
Western Europe
|
|
Rest of World
|
|
Total
|
||||||||
|
2015
|
$
|
—
|
|
$
|
—
|
|
$
|
0.9
|
|
$
|
0.9
|
|
||||
|
2016
|
—
|
|
—
|
|
1.3
|
|
1.3
|
|
||||||||
|
2017
|
—
|
|
—
|
|
36.8
|
|
36.8
|
|
||||||||
|
2018
|
—
|
|
—
|
|
53.8
|
|
53.8
|
|
||||||||
|
2019 and thereafter
|
65.1
|
|
25.9
|
|
67.2
|
|
158.2
|
|
||||||||
|
Total
|
$
|
65.1
|
|
$
|
25.9
|
|
$
|
160.0
|
|
$
|
251.0
|
|
||||
The total valuation allowances recorded are
$98.6
and
$61.5
as of June 30,
2014
and
2013
, respectively. In fiscal
2014
, the change in the valuation allowance was due primarily to an increase in valuation allowance for net operating losses.
A reconciliation of the beginning and ending amount of UTBs is presented below:
|
Year Ended June 30,
|
||||||||||||
|
2014
|
2013
|
2012
|
||||||||||
|
UTBs—July 1
|
$
|
331.4
|
|
$
|
326.5
|
|
$
|
308.6
|
|
|||
|
Additions based on tax positions related to the current year
|
29.5
|
|
36.8
|
|
38.3
|
|
||||||
|
Additions for tax positions of prior years
|
91.9
|
|
5.0
|
|
6.3
|
|
||||||
|
Reductions for tax positions of prior years
|
(9.9
|
)
|
—
|
|
(6.8
|
)
|
||||||
|
Settlements
|
(33.8
|
)
|
(27.9
|
)
|
(0.7
|
)
|
||||||
|
Lapses in statutes of limitations
|
(11.6
|
)
|
(13.8
|
)
|
(8.5
|
)
|
||||||
|
Foreign currency translation
|
3.0
|
|
4.8
|
|
(10.7
|
)
|
||||||
|
UTBs—June 30
|
$
|
400.5
|
|
$
|
331.4
|
|
$
|
326.5
|
|
|||
As of June 30,
2014
, the Company had
$400.5
of UTBs of which
$140.6
represents the amount that, if recognized, would impact the effective income tax rate in future periods. As of June 30,
2014
and
2013
, the liability associated with UTBs, including accrued interest and penalties, is
$159.4
and
$189.6
, respectively, which is recorded in Income and other taxes payable and Other non-current liabilities in the Consolidated Balance Sheets.
F-29
COTY INC. & SUBSIDIARIES
NOTES TO CONSOLIDATED FINANCIAL STATEMENTS
($ in millions, except per share data)
During fiscal
2014
, the Company released interest accruals of
$(1.7)
, while in fiscal 2013 and 2012 the Company accrued total interest of
$1.1
and
$5.3
, respectively, and penalty benefit of
nil
,
$0.9
and
$0.8
, respectively. The total gross accrued interest and penalties recorded in the Other noncurrent liabilities in the Consolidated Balance Sheets related to UTBs as of June 30, 2014 and 2013 is
$25.5
and
$25.7
, respectively.
The Company is present in over
35
tax jurisdictions, and any point in time is subject to several audits at various stages of completion. As a result, the Company evaluates tax positions and establishes liabilities for UTBs that may be challenged by local authorities and may not be fully sustained, despite a belief that the underlying tax positions are fully supportable. UTBs are reviewed on an ongoing basis and are adjusted in light of changing facts and circumstances, including progress of tax audits, developments in case law, and closing of statute of limitations. Such adjustments are reflected in the provision for income taxes as appropriate. In fiscal 2014, the Company recognized a tax benefit of
$49.2
associated with the settlement of tax audits in multiple jurisdictions and the expiration of foreign and state statutes of limitation. The Company has open tax years ranging from 2004 and forward.
On the basis of information available at June 30, 2014, it is reasonably possible that a decrease of up to
$29.2
in UTBs related to U.S. and foreign exposures may be necessary within the coming year. It is also possible the ongoing audits by tax authorities may result in increases or decreases to the balance of UTBs. Since it is common practice to extend audits beyond the Statute of Limitations, the Company is unable to predict the timing or conclusion of these audits and, accordingly, the Company is unable to estimate the amount of changes to the balance of UTBs that are reasonably possible at this time. However, the Company believes it has adequately provided for its UTBs for all open tax years in each tax jurisdiction.
It is the Company’s intention to permanently reinvest undistributed earnings and income from the Company’s foreign operations that have been generated through June 30, 2014. Accordingly, no provision has been made for U.S. income taxes on the remaining undistributed earnings of foreign subsidiaries as of June 30, 2014. Cumulative undistributed earnings of non-U.S. subsidiaries was
$1,879.1
as of June 30, 2014. It is not practicable for the Company to determine the amount of additional income and withholding taxes that may be payable in the event the remaining undistributed earnings are repatriated.
15. OTHER NONCURRENT LIABILITIES
Other noncurrent liabilities as of June 30,
2014
and
2013
are presented below:
|
|
|
June 30,
2014 |
June 30,
2013 |
|||||
|
Noncurrent income tax liabilities
|
$
|
154.3
|
|
$
|
184.7
|
|
||
|
Rent
|
37.5
|
|
29.4
|
|
||||
|
Unfavorable lease contracts
|
11.2
|
|
4.1
|
|
||||
|
Deferred income
|
8.1
|
|
11.0
|
|
||||
|
Mandatorily redeemable financial instruments
|
5.5
|
|
—
|
|
||||
|
Restructuring
|
5.3
|
|
5.0
|
|
||||
|
Other
|
6.8
|
|
5.7
|
|
||||
|
Total noncurrent liabilities
|
$
|
228.7
|
|
$
|
239.9
|
|
||
16. INTEREST EXPENSE, NET AND OTHER EXPENSE (INCOME), NET
Interest expense, net for the years ended June 30,
2014
,
2013
and
2012
is presented below:
|
Year Ended June 30,
|
||||||||||||
|
2014
|
2013
|
2012
|
||||||||||
|
Interest expense
|
$
|
69.8
|
|
$
|
77.2
|
|
$
|
81.8
|
|
|||
|
Foreign exchange losses, net of derivative contracts
|
2.8
|
|
—
|
|
5.8
|
|
||||||
|
Deferred financing fees write-off
|
—
|
|
2.6
|
|
1.4
|
|
||||||
|
Accretion of acquisition-related liability
|
—
|
|
0.6
|
|
7.0
|
|
||||||
|
Interest income
|
(4.1
|
)
|
(3.9
|
)
|
(6.4
|
)
|
||||||
|
Total interest expense, net
|
$
|
68.5
|
|
$
|
76.5
|
|
$
|
89.6
|
|
|||
F-30
COTY INC. & SUBSIDIARIES
NOTES TO CONSOLIDATED FINANCIAL STATEMENTS
($ in millions, except per share data)
Other expense (income), net for the years ended June 30,
2014
,
2013
and
2012
is presented below:
|
Year Ended June 30,
|
||||||||||||
|
2014
|
2013
|
2012
|
||||||||||
|
Derivative losses - foreign exchange contracts
|
$
|
—
|
|
$
|
—
|
|
$
|
33.6
|
|
|||
|
Foreign exchange transaction losses
|
—
|
|
—
|
|
1.9
|
|
||||||
|
Miscellaneous expense (income)
|
1.3
|
|
(0.8
|
)
|
(3.5
|
)
|
||||||
|
Total other expense (income)
|
$
|
1.3
|
|
$
|
(0.8
|
)
|
$
|
32.0
|
|
|||
17. EMPLOYEE BENEFIT PLANS
Savings and Retirement Plans
-The Company’s Savings and Retirement Plans include a U.S. defined contribution plan for employees primarily in the U.S. and international savings plans for employees in certain other countries. In the U.S., hourly and salary based employees are eligible to participate in the plan after 90 days of service and the Company matches
100%
of employee contributions up to
6.0%
of employee compensation. In addition, the Company makes contributions to the plan on behalf of employees determined by their age and compensation.
During fiscal
2014
,
2013
and
2012
, the defined contribution expense for the U.S. defined contribution plan was
$12.7
,
$15.0
and
$13.3
, respectively, and the defined contribution expense for the international savings plans was
$10.6
,
$6.4
and
$3.8
, respectively.
Pension Plans
-The Company sponsors contributory and noncontributory defined benefit pension plans covering certain U.S. and international employees primarily in Austria, France, Germany, the Netherlands, Spain and Switzerland. Participants in the U.S. defined benefit pension plan no longer accrue benefits. The Company measures defined benefit plan assets and obligations as of the date of the Company’s fiscal year-end. The Company’s defined benefit pension plans are funded primarily through contributions from the Company after consideration of recommendations from the pension plans’ independent actuaries and are funded at levels sufficient to comply with local requirements.
Other Post-Employment Benefit Plans
-The Company provides certain post-employment health and life insurance benefits for certain employees and spouses principally in the U.S. and Canada if certain age and service requirements are met. Estimated benefits to be paid by the Company are expensed over the service period of each employee based on calculations performed by an independent actuary. In addition, the Company has a supplemental retirement plan and a termination benefit plan for selected salaried employees.
The aggregate reconciliation of the projected benefit obligations, plan assets, funded status and amounts recognized in the Company’s Consolidated Financial Statements related to the Company’s pension plans and other post-employment benefit plans is presented below:
F-31
COTY INC. & SUBSIDIARIES
NOTES TO CONSOLIDATED FINANCIAL STATEMENTS
($ in millions, except per share data)
|
Pension Plans
|
Other Post-Employment Benefits
|
Total
|
|||||||||||||||||||||||||||||
|
U.S.
|
International
|
||||||||||||||||||||||||||||||
|
2014
|
2013
|
2014
|
2013
|
2014
|
2013
|
2014
|
2013
|
||||||||||||||||||||||||
|
Change in benefit obligation
|
|||||||||||||||||||||||||||||||
|
Benefit obligation-July 1
|
$
|
72.8
|
|
$
|
76.0
|
|
$
|
166.6
|
|
$
|
148.0
|
|
$
|
77.7
|
|
$90.1
|
$
|
317.1
|
|
$314.1
|
|||||||||||
|
Service cost
|
—
|
|
—
|
|
5.7
|
|
4.5
|
|
2.3
|
|
2.8
|
8.0
|
|
7.3
|
|||||||||||||||||
|
Interest cost
|
3.4
|
|
3.3
|
|
5.5
|
|
5.6
|
|
3.4
|
|
3.6
|
12.3
|
|
12.5
|
|||||||||||||||||
|
Plan participants’ contributions
|
—
|
|
—
|
|
1.7
|
|
1.7
|
|
—
|
|
—
|
1.7
|
|
1.7
|
|||||||||||||||||
|
Plan amendments
|
—
|
|
—
|
|
2.1
|
|
—
|
|
—
|
|
—
|
2.1
|
|
—
|
|||||||||||||||||
|
Benefits paid
|
(4.3
|
)
|
(4.2
|
)
|
(9.0
|
)
|
(7.0
|
)
|
(2.0
|
)
|
(1.7)
|
(15.3
|
)
|
(12.9)
|
|||||||||||||||||
|
Premiums paid
|
—
|
|
—
|
|
(0.9
|
)
|
(1.0
|
)
|
—
|
|
—
|
(0.9
|
)
|
(1.0)
|
|||||||||||||||||
|
Acquisition and transfer
|
—
|
|
—
|
|
1.3
|
|
1.7
|
|
—
|
|
—
|
1.3
|
|
1.7
|
|||||||||||||||||
|
Actuarial loss (gain)
|
8.9
|
|
(2.3
|
)
|
17.3
|
|
9.2
|
|
5.4
|
|
(17.2)
|
31.6
|
|
(10.3)
|
|||||||||||||||||
|
Effect of exchange rates
|
—
|
|
—
|
|
7.8
|
|
5.1
|
|
—
|
|
—
|
7.8
|
|
5.1
|
|||||||||||||||||
|
Other
|
—
|
|
—
|
|
(0.7
|
)
|
(1.2
|
)
|
(0.8
|
)
|
0.1
|
(1.5
|
)
|
(1.1)
|
|||||||||||||||||
|
Benefit obligation-June 30
|
$
|
80.8
|
|
$
|
72.8
|
|
$
|
197.4
|
|
$
|
166.6
|
|
$
|
86.0
|
|
$
|
77.7
|
|
$
|
364.2
|
|
$
|
317.1
|
|
|||||||
|
Change in plan assets
|
|||||||||||||||||||||||||||||||
|
Fair value of plan assets-July 1
|
$
|
36.9
|
|
$
|
34.8
|
|
$
|
30.6
|
|
$
|
25.5
|
|
$
|
—
|
|
$
|
—
|
|
$
|
67.5
|
|
$
|
60.3
|
|
|||||||
|
Actual return on plan assets
|
4.3
|
|
2.7
|
|
1.8
|
|
0.8
|
|
—
|
|
—
|
6.1
|
|
3.5
|
|||||||||||||||||
|
Employer contributions
|
9.0
|
|
3.6
|
|
10.3
|
|
9.5
|
|
2.0
|
|
1.7
|
21.3
|
|
14.8
|
|||||||||||||||||
|
Plan participants’ contributions
|
—
|
|
—
|
|
1.7
|
|
1.7
|
|
—
|
|
—
|
1.7
|
|
1.7
|
|||||||||||||||||
|
Benefits paid
|
(4.3
|
)
|
(4.2
|
)
|
(9.0
|
)
|
(7.0
|
)
|
(2.0
|
)
|
(1.7)
|
(15.3
|
)
|
(12.9)
|
|||||||||||||||||
|
Premiums paid
|
—
|
|
—
|
|
(0.9
|
)
|
(1.0
|
)
|
—
|
|
—
|
(0.9
|
)
|
(1.0)
|
|||||||||||||||||
|
Acquisition and transfer
|
—
|
|
—
|
|
1.3
|
|
1.7
|
|
—
|
|
—
|
1.3
|
|
1.7
|
|||||||||||||||||
|
Effect of exchange rates
|
—
|
|
—
|
|
1.7
|
|
0.6
|
|
—
|
|
—
|
1.7
|
|
0.6
|
|||||||||||||||||
|
Other
|
—
|
|
—
|
|
—
|
|
(1.2
|
)
|
—
|
|
—
|
—
|
|
(1.2)
|
|||||||||||||||||
|
Fair value of plan assets-June 30
|
45.9
|
|
36.9
|
|
37.5
|
|
30.6
|
|
—
|
|
—
|
83.4
|
|
67.5
|
|||||||||||||||||
|
Funded status-June 30
|
$
|
(34.9
|
)
|
$
|
(35.9
|
)
|
$
|
(159.9
|
)
|
$
|
(136.0
|
)
|
$
|
(86.0
|
)
|
$
|
(77.7
|
)
|
$
|
(280.8
|
)
|
|
$
|
(249.6
|
)
|
||||||
With respect to the Company’s pension plans and other post-employment benefit plans, amounts recognized in the Company’s Consolidated Balance Sheets as of
June 30, 2014
and
2013
, are presented below:
F-32
COTY INC. & SUBSIDIARIES
NOTES TO CONSOLIDATED FINANCIAL STATEMENTS
($ in millions, except per share data)
|
Pension Plans
|
Other Post-Employment Benefits
|
Total
|
|||||||||||||||||||||||||||||
|
U.S.
|
International
|
||||||||||||||||||||||||||||||
|
2014
|
2013
|
2014
|
2013
|
2014
|
2013
|
2014
|
2013
|
||||||||||||||||||||||||
|
Noncurrent assets
|
$
|
—
|
|
$
|
—
|
|
$
|
—
|
|
$
|
0.1
|
|
$
|
—
|
|
$
|
—
|
|
$
|
—
|
|
$
|
0.1
|
|
|||||||
|
Current liabilities
|
(1.5
|
)
|
(1.5
|
)
|
(5.0
|
)
|
(5.1
|
)
|
(1.8
|
)
|
(1.8
|
)
|
(8.3
|
)
|
(8.4
|
)
|
|||||||||||||||
|
Noncurrent liabilities
|
(33.4
|
)
|
(34.4
|
)
|
(154.9
|
)
|
(131.0
|
)
|
(84.2
|
)
|
(75.9
|
)
|
(272.5
|
)
|
(241.3
|
)
|
|||||||||||||||
|
Funded Status
|
(34.9
|
)
|
(35.9
|
)
|
(159.9
|
)
|
(136.0
|
)
|
(86.0
|
)
|
(77.7
|
)
|
(280.8
|
)
|
(249.6
|
)
|
|||||||||||||||
|
AOC(L)/I
|
(17.4
|
)
|
(11.3
|
)
|
(56.1
|
)
|
(37.6
|
)
|
(0.8
|
)
|
5.7
|
|
(74.3
|
)
|
(43.2
|
)
|
|||||||||||||||
|
Net amount recognized
|
$
|
(52.3
|
)
|
$(47.2)
|
$
|
(216.0
|
)
|
$(173.6)
|
$
|
(86.8
|
)
|
$
|
(72.0
|
)
|
$
|
(355.1
|
)
|
$
|
(292.8
|
)
|
|||||||||||
The accumulated benefit obligation for the U.S. defined benefit pension plans was
$80.8
and
$72.8
as of
June 30, 2014
and
2013
, respectively. The accumulated benefit obligation for international defined benefit pension plans was
$189.3
and
$160.4
as of
June 30, 2014
and
2013
, respectively.
Pension plans with accumulated benefit obligations in excess of plan assets and projected benefit obligations in excess of plan assets are presented below:
|
Pension plans with accumulated benefit obligations in excess of plan assets
|
Pension plans with projected benefit obligations in excess of plan assets
|
||||||||||||||||||||||||||||||
|
U.S.
|
International
|
U.S.
|
International
|
||||||||||||||||||||||||||||
|
2014
|
2013
|
2014
|
2013
|
2014
|
2013
|
2014
|
2013
|
||||||||||||||||||||||||
|
Projected benefit obligation
|
$
|
80.8
|
|
$
|
72.8
|
|
$
|
195.7
|
|
$
|
164.2
|
|
$
|
80.8
|
|
$
|
72.8
|
|
$
|
197.6
|
|
$
|
164.5
|
|
|||||||
|
Accumulated benefit obligation
|
$
|
80.8
|
|
$
|
72.8
|
|
$
|
187.7
|
|
$
|
158.2
|
|
$
|
80.8
|
|
$
|
72.8
|
|
$
|
189.3
|
|
$
|
158.2
|
|
|||||||
|
Fair value of plan assets
|
$
|
45.9
|
|
$
|
36.9
|
|
$
|
35.6
|
|
$
|
28.0
|
|
$
|
45.9
|
|
$
|
36.9
|
|
$
|
37.5
|
|
$
|
28.3
|
|
|||||||
Net Periodic Benefit Cost
The components of net periodic benefit cost for pension plans and other post-employment benefit plans recognized in the Consolidated Statements of Operations are presented below:
|
Year Ended June 30,
|
|||||||||||||||||||||||||||||||||||||||||||||||
|
Pension Plans
|
Other Post-
Employment Benefits
|
||||||||||||||||||||||||||||||||||||||||||||||
|
U.S.
|
International
|
Total
|
|||||||||||||||||||||||||||||||||||||||||||||
|
2014
|
2013
|
2012
|
2014
|
2013
|
2012
|
2014
|
2013
|
2012
|
2014
|
2013
|
2012
|
||||||||||||||||||||||||||||||||||||
|
Service cost
|
$
|
—
|
|
$
|
—
|
|
$
|
—
|
|
$
|
5.7
|
|
$
|
4.5
|
|
$
|
3.6
|
|
$
|
2.3
|
|
$
|
2.8
|
|
$
|
3.2
|
|
$
|
8.0
|
|
$
|
7.3
|
|
$
|
6.8
|
|
|||||||||||
|
Interest cost
|
3.4
|
|
3.3
|
|
3.6
|
|
5.5
|
|
5.6
|
|
6.5
|
|
3.4
|
|
3.6
|
|
4.2
|
|
12.3
|
|
12.5
|
|
14.3
|
|
|||||||||||||||||||||||
|
Expected return on plan assets
|
(2.5
|
)
|
(2.3
|
)
|
(2.3
|
)
|
(1.2
|
)
|
(1.0
|
)
|
(0.9
|
)
|
—
|
|
—
|
|
—
|
|
(3.7
|
)
|
(3.3
|
)
|
(3.2
|
)
|
|||||||||||||||||||||||
|
Amortization of prior service credit (cost)
|
—
|
|
—
|
|
—
|
|
0.2
|
|
0.1
|
|
0.1
|
|
(0.2
|
)
|
(0.2
|
)
|
(0.3
|
)
|
—
|
|
(0.1
|
)
|
(0.2
|
)
|
|||||||||||||||||||||||
|
Amortization of net loss (gain)
|
1.0
|
|
2.9
|
|
(0.1
|
)
|
2.1
|
|
1.3
|
|
0.1
|
|
(1.1
|
)
|
—
|
|
(0.1
|
)
|
2.0
|
|
4.2
|
|
(0.1
|
)
|
|||||||||||||||||||||||
|
Other
|
—
|
|
—
|
|
—
|
|
(0.7
|
)
|
(0.1
|
)
|
—
|
|
—
|
|
—
|
|
—
|
|
(0.7
|
)
|
(0.1
|
)
|
—
|
|
|||||||||||||||||||||||
|
Net periodic benefit cost
|
$
|
1.9
|
|
$
|
3.9
|
|
$
|
1.2
|
|
$
|
11.6
|
|
$
|
10.4
|
|
$
|
9.4
|
|
$
|
4.4
|
|
$
|
6.2
|
|
$
|
7.0
|
|
$
|
17.9
|
|
$
|
20.5
|
|
$
|
17.6
|
|
|||||||||||
Pre-tax amounts recognized in AOC(L)/I, which have not yet been recognized as a component of net periodic benefit cost are presented below:
F-33
COTY INC. & SUBSIDIARIES
NOTES TO CONSOLIDATED FINANCIAL STATEMENTS
($ in millions, except per share data)
|
Pension Plans
|
Other Post-Employment Benefits
|
||||||||||||||||||||||||||||||
|
U.S.
|
International
|
Total
|
|||||||||||||||||||||||||||||
|
2014
|
2013
|
2014
|
2013
|
2014
|
2013
|
2014
|
2013
|
||||||||||||||||||||||||
|
Net actuarial (loss) gain
|
$
|
(17.4
|
)
|
$
|
(11.3
|
)
|
$
|
(52.9
|
)
|
$
|
(36.5
|
)
|
$
|
(1.0
|
)
|
$
|
5.3
|
|
$
|
(71.3
|
)
|
$
|
(42.5
|
)
|
|||||||
|
Prior service (cost) credit
|
—
|
|
—
|
|
(3.2
|
)
|
(1.1
|
)
|
0.2
|
|
0.4
|
|
(3.0
|
)
|
(0.7
|
)
|
|||||||||||||||
|
Total recognized in AOC(L)/I
|
$
|
(17.4
|
)
|
$
|
(11.3
|
)
|
$
|
(56.1
|
)
|
$
|
(37.6
|
)
|
$
|
(0.8
|
)
|
$
|
5.7
|
|
$
|
(74.3
|
)
|
$
|
(43.2
|
)
|
|||||||
Changes in plan assets and benefit obligations recognized in OCI/(L) during the fiscal year are presented below:
|
Pension Plans
|
Other Post-Employment Benefits
|
||||||||||||||||||||||||||||||
|
U.S.
|
International
|
Total
|
|||||||||||||||||||||||||||||
|
2014
|
2013
|
2014
|
2013
|
2014
|
2013
|
2014
|
2013
|
||||||||||||||||||||||||
|
Net actuarial (loss) gain
|
$
|
(7.1
|
)
|
$
|
2.7
|
|
$
|
(16.7
|
)
|
$
|
(9.4
|
)
|
$
|
(5.4
|
)
|
$
|
17.2
|
|
$
|
(29.2
|
)
|
$
|
10.5
|
|
|||||||
|
Amortization of prior service cost (credit)
|
—
|
|
—
|
|
0.2
|
|
0.1
|
|
(0.2
|
)
|
(0.2
|
)
|
—
|
|
(0.1
|
)
|
|||||||||||||||
|
Recognized net actuarial loss (gain)
|
1.0
|
|
2.9
|
|
2.1
|
|
1.2
|
|
(1.1
|
)
|
—
|
|
2.0
|
|
4.1
|
|
|||||||||||||||
|
Prior service cost
|
—
|
|
—
|
|
(2.1
|
)
|
—
|
|
—
|
|
—
|
|
(2.1
|
)
|
—
|
|
|||||||||||||||
|
Effect of exchange rates
|
—
|
|
—
|
|
(2.0
|
)
|
(1.0
|
)
|
0.2
|
|
—
|
|
(1.8
|
)
|
(1.0
|
)
|
|||||||||||||||
|
Total recognized in OC(L)/I
|
$
|
(6.1
|
)
|
$
|
5.6
|
|
$
|
(18.5
|
)
|
$
|
(9.1
|
)
|
$
|
(6.5
|
)
|
$
|
17.0
|
|
$
|
(31.1
|
)
|
$
|
13.5
|
|
|||||||
Amounts in AOC(L)/I expected to be amortized as components of net periodic benefit cost during fiscal 2015 are presented below:
|
Pension Plans
|
Other Post-Employment Benefits
|
Total
|
|||||||||||||
|
U.S
|
International
|
||||||||||||||
|
Prior service cost
|
$
|
—
|
|
$
|
(0.3
|
)
|
$
|
(0.2
|
)
|
$
|
(0.5
|
)
|
|||
|
Net loss
|
(2.1
|
)
|
(3.6
|
)
|
—
|
|
(5.7
|
)
|
|||||||
|
$
|
(2.1
|
)
|
$
|
(3.9
|
)
|
$
|
(0.2
|
)
|
$
|
(6.2
|
)
|
||||
Pension and Other Post-Employment Benefit Assumptions
The weighted-average assumptions used to determine the Company’s projected benefit obligation above are presented below:
|
Pension Plans
|
Other Post-Employment Benefits
|
||||||||||
|
U.S
|
International
|
||||||||||
|
2014
|
2013
|
2014
|
2013
|
2014
|
2013
|
||||||
|
Discount rates
|
3.1%-4.4%
|
3.6%-5.0%
|
1.8%-3.2%
|
2.3%-3.8%
|
4.8%
|
5.4%
|
|||||
|
Future compensation growth rates
|
N/A
|
N/A
|
2.0%-2.5%
|
2.0%-2.5%
|
N/A
|
N/A
|
|||||
The weighted-average assumptions used to determine the Company’s net periodic benefit cost in fiscal
2014
,
2013
and
2012
are presented below:
|
Pension Plans
|
Other Post-
Employment Benefits |
||||||||||||||||||
|
U.S.
|
International
|
||||||||||||||||||
|
2014
|
2013
|
2012
|
2014
|
2013
|
2012
|
2014
|
2013
|
2012
|
|||||||||||
|
Discount rates
|
3.6%-5.0%
|
|
3.4%-4.6%
|
4.3%-5.6%
|
2.3%-3.8%
|
2.2%-4.5%
|
2.7%-6.1%
|
5.4
|
%
|
4.9%
|
5.9%
|
||||||||
|
Future compensation growth rates
|
N/A
|
|
N/A
|
N/A
|
2.0%-2.5%
|
2.5%-3.0%
|
2.0%-3.0%
|
N/A
|
|
N/A
|
N/A
|
||||||||
|
Expected long-term rates of return on plan assets
|
6.5
|
%
|
6.5%
|
6.5%
|
3.3%-4.3%
|
3.3%-4.3%
|
3.3%-5.5%
|
N/A
|
|
N/A
|
N/A
|
||||||||
F-34
COTY INC. & SUBSIDIARIES
NOTES TO CONSOLIDATED FINANCIAL STATEMENTS
($ in millions, except per share data)
The health care cost trend rate assumptions have a significant effect on the amounts reported.
|
2014
|
2013
|
2012
|
|||
|
Health care cost trend rate assumed for next year
|
6.3%-6.9%
|
7.1%-8.0%
|
7.5%-8.5%
|
||
|
Rate to which the cost trend rate is assumed to decline (the ultimate trend rate)
|
5%
|
5%
|
5%
|
||
|
Year that the rate reaches the ultimate trend rate
|
2021-2023
|
2018-2019
|
2018-2019
|
||
A one-percentage point change in assumed health care cost trend rates would have the following effects:
|
One Percentage Point Increase
|
One Percentage Point Decrease
|
||||||||||||||
|
Effect on total service cost and interest cost
|
$
|
1.0
|
|
$
|
(0.8
|
)
|
|||||||||
|
Effect on post-employment benefit obligation
|
17.1
|
|
(13.3
|
)
|
|||||||||||
Pension Plan Investment Policy
The Company’s investment policies and strategies for plan assets are to achieve the greatest return consistent with the fiduciary character of the plan and to maintain a level of liquidity that is sufficient to meet the need for timely payment of benefits. The goals of the investment managers include minimizing risk and achieving growth in principal value so that the purchasing power of such value is maintained with respect to the rate of inflation.
The pension plan’s return on assets is based on management’s expectations of long-term average rates of return to be achieved by the underlying investment portfolios. In establishing this assumption, management considers historical and expected returns for the assets in which the plan is invested, as well as current economic and market conditions.
The asset allocation decision includes consideration of future retirements, lump-sum elections, growth in the number of participants, company contributions and cash flow. These actual characteristics of the plan place certain demands upon the level, risk and required growth of trust assets. Actual asset allocation is regularly reviewed and periodically rebalanced to the strategic allocation when considered appropriate.
The target and weighted-average asset allocations for the Company’s U.S. pension plans as of
June 30, 2014
and
2013
, by asset category are presented below:
|
% of Plan Assets at Year Ended
|
||||||||
|
Target
|
2014
|
2013
|
||||||
|
Equity securities
|
45
|
%
|
44
|
%
|
44
|
%
|
||
|
Fixed income securities
|
55
|
%
|
53
|
%
|
53
|
%
|
||
|
Cash and other investments
|
—
|
%
|
3
|
%
|
3
|
%
|
||
The following is a description of the valuation methodologies used for plan assets measured at fair value:
Equity securities (domestic and international)
-The fair values reflect the closing price reported on a major market where the individual securities are traded. These investments are classified within Level 1 of the valuation hierarchy.
U.S. government and government agencies fixed income securities
-When quoted prices are available in an active market, the investments are classified as Level 1. When quoted market prices are not available in an active market, these investments are classified as Level 2.
Corporate securities
-The fair values are based on a compilation of primarily observable market information or a broker quote in a non-active market. These investments are primarily classified within Level 2 of the valuation hierarchy.
Cash and cash equivalents
-The carrying amount approximates fair value, primarily because of the short maturity of cash equivalent instruments. These investments are classified within Level 1 of the valuation hierarchy.
Insurance contracts
-These instruments are issued by insurance companies. Insurance contracts are generally classified as Level 3 as there are neither quoted prices nor other observable inputs for pricing.
Fair Value of Plan Assets
F-35
COTY INC. & SUBSIDIARIES
NOTES TO CONSOLIDATED FINANCIAL STATEMENTS
($ in millions, except per share data)
The U.S. and international pension plan assets that the Company measures at fair value on a recurring basis, based on the fair value hierarchy as described in Note 2, as of
June 30, 2014
and
2013
are presented below:
|
Level 1
|
Level 2
|
Level 3
|
Total
|
||||||||||||||||||||||||||||
|
2014
|
2013
|
2014
|
2013
|
2014
|
2013
|
2014
|
2013
|
||||||||||||||||||||||||
|
Equity securities:
|
|||||||||||||||||||||||||||||||
|
Domestic equity securities
|
$
|
15.2
|
|
$
|
13.0
|
|
$
|
—
|
|
$
|
—
|
|
$
|
—
|
|
$
|
—
|
|
$
|
15.2
|
|
$
|
13.0
|
|
|||||||
|
International equity securities
|
4.7
|
|
3.3
|
|
—
|
|
—
|
|
—
|
|
—
|
|
4.7
|
|
3.3
|
|
|||||||||||||||
|
Fixed income securities:
|
|||||||||||||||||||||||||||||||
|
U.S. Government and government agencies
|
5.7
|
|
4.3
|
|
10.8
|
|
9.0
|
|
—
|
|
—
|
|
16.5
|
|
13.3
|
|
|||||||||||||||
|
Corporate securities
|
—
|
|
—
|
|
8.3
|
|
6.1
|
|
—
|
|
—
|
|
8.3
|
|
6.1
|
|
|||||||||||||||
|
Other:
|
|||||||||||||||||||||||||||||||
|
Cash and cash equivalents
|
1.2
|
|
1.2
|
|
—
|
|
—
|
|
—
|
|
—
|
|
1.2
|
|
1.2
|
|
|||||||||||||||
|
Insurance contracts
|
—
|
|
—
|
|
—
|
|
—
|
|
37.5
|
|
30.6
|
|
37.5
|
|
30.6
|
|
|||||||||||||||
|
Total pension plan assets at fair value-June 30
|
$
|
26.8
|
|
$
|
21.8
|
|
$
|
19.1
|
|
$
|
15.1
|
|
$
|
37.5
|
|
$
|
30.6
|
|
$
|
83.4
|
|
$
|
67.5
|
|
|||||||
The Company sponsors a qualified defined benefit pension plan for all eligible Swiss employees. Retirement benefits are provided based on employees’ years of service and earnings, or in accordance with applicable employee regulations. Consistent with typical Swiss practice, the pension plan is funded through a guaranteed insurance contract with an insurance company (“IC”). The IC is responsible for the investment strategy of the insurance premiums that the Company submits and does not hold individual assets per participating employer. Assets are invested in accordance with the IC’s own strategies and risk assessments. Under the terms of the contract, the interest rate as well as the capital value is guaranteed for each participant, with the IC assuming any risk to the value of the underlying assets. The IC is a member of a security fund, whose purpose is to cover any shortfall in the event they are not able to fulfill its contractual agreements. The plan assets of the Swiss plan are included in the Level 3 valuation.
The benefits of the pension plans in the Netherlands are fully insured with an IC which meets all the benefit payments directly to the beneficiaries as they fall due. The contracts included in the Level 3 valuation reflect the expected benefit payments, discounted using the same rate used to determine the projected benefit obligation.
In Spain, the plans’ assets represent the computed value of the insurance contracts owned by the Company. These insurance contracts represent a portion of the IC’s general investments linked to the Company. The value of these contracts is determined by the IC. However, a minimum of
4.0%
rate of return is stipulated. Upon retirement, the Company calculates the annuity due to a given participant and to the extent that the amounts linked to that specific employee are not sufficient, the Company funds the difference. In the event that a participant terminates employment prior to retirement, the value for that individual reverts back to the Company. The plan assets of the Spanish plan are included in the Level 3 valuation.
The reconciliations of Level 3 plan assets measured at fair value in fiscal
2014
and
2013
are presented below:
|
June 30,
2014 |
June 30,
2013 |
||||||
|
Insurance contract:
|
|||||||
|
Fair value-July 1
|
$
|
30.6
|
|
$
|
25.5
|
|
|
|
Return on plan assets
|
1.8
|
|
0.8
|
|
|||
|
Purchases, sales and settlements, net
|
3.4
|
|
3.7
|
|
|||
|
Effect of exchange rates
|
1.7
|
|
0.6
|
|
|||
|
Fair value-June 30
|
$
|
37.5
|
|
$
|
30.6
|
|
|
Contributions
The Company expects to contribute approximately
$8.2
,
$11.5
, and
$1.7
to its U.S. and international pension plans and other post-employment benefit plans, respectively, during fiscal 2015.
Estimated Future Benefit Payments
Expected benefit payments, which reflect expected future service, as appropriate, are presented below:
F-36
COTY INC. & SUBSIDIARIES
NOTES TO CONSOLIDATED FINANCIAL STATEMENTS
($ in millions, except per share data)
|
Pension Plans
|
Other Post-Employment Benefits
|
Total
|
|||||||||||||||
|
Fiscal Year Ending June 30
|
U.S
|
International
|
|||||||||||||||
|
2015
|
$
|
4.5
|
|
$
|
9.0
|
|
$
|
2.0
|
|
$
|
15.5
|
|
|||||
|
2016
|
4.5
|
|
8.6
|
|
2.2
|
|
15.3
|
|
|||||||||
|
2017
|
5.0
|
|
8.7
|
|
2.5
|
|
16.2
|
|
|||||||||
|
2018
|
5.1
|
|
8.8
|
|
2.8
|
|
16.7
|
|
|||||||||
|
2019
|
5.1
|
|
9.3
|
|
3.1
|
|
17.5
|
|
|||||||||
|
2020 - 2023
|
25.0
|
|
49.7
|
|
20.8
|
|
95.5
|
|
|||||||||
18. FAIR VALUE MEASUREMENTS
The financial assets and liabilities that the Company measures at fair value on a recurring basis based on the fair value hierarchy, as of
June 30, 2014
and
2013
are presented below:
|
Level 1
|
Level 2
|
Level 3
|
|||||||||||||||||||||
|
June 30, 2014
|
June 30, 2013
|
June 30, 2014
|
June 30, 2013
|
June 30, 2014
|
June 30, 2013
|
||||||||||||||||||
|
Financial assets and liabilities
|
|||||||||||||||||||||||
|
Recurring fair value measurements
|
|||||||||||||||||||||||
|
Assets:
|
|||||||||||||||||||||||
|
Foreign exchange contracts
|
$
|
—
|
|
$
|
—
|
|
$
|
2.1
|
|
$
|
0.6
|
|
$
|
—
|
|
$
|
—
|
|
|||||
|
Liabilities:
|
|||||||||||||||||||||||
|
Foreign exchange contracts
|
$
|
—
|
|
$
|
—
|
|
$
|
11.5
|
|
$
|
0.8
|
|
$
|
—
|
|
$
|
—
|
|
|||||
|
Contingent consideration - business combinations
|
—
|
|
—
|
|
—
|
|
—
|
|
1.1
|
|
3.5
|
|
|||||||||||
|
Total Liabilities
|
$
|
—
|
|
$
|
—
|
|
$
|
11.5
|
|
$
|
0.8
|
|
$
|
1.1
|
|
$
|
3.5
|
|
|||||
|
Total recurring fair value measurements
|
$
|
—
|
|
$
|
—
|
|
$
|
(9.4
|
)
|
$
|
(0.2
|
)
|
$
|
(1.1
|
)
|
$
|
(3.5
|
)
|
|||||
The reconciliation of Level 3 liabilities recorded at fair value for the fiscal years ended
June 30, 2014
and
2013
are presented below:
|
June 30,
2014 |
June 30,
2013 |
||||||
|
Contingent consideration - business combinations:
|
|||||||
|
Fair Value - July 1
|
$
|
3.5
|
|
$
|
—
|
|
|
|
Addition
|
1.1
|
|
3.5
|
|
|||
|
Gain on change in settlement value
(a)
|
(2.4
|
)
|
—
|
|
|||
|
Settlement
|
(1.1
|
)
|
—
|
|
|||
|
Effect of exchange rates
|
—
|
|
—
|
|
|||
|
Transfers out of Level 3
|
—
|
|
—
|
|
|||
|
Fair value - June 30
|
$
|
1.1
|
|
$
|
3.5
|
|
|
(a)
Gain on change in settlement value was recorded in Selling General and Administrative expense in the Consolidated Statements of Operations.
F-37
COTY INC. & SUBSIDIARIES
NOTES TO CONSOLIDATED FINANCIAL STATEMENTS
($ in millions, except per share data)
The fair values of the Company’s financial instruments estimated as of
June 30, 2014
and
2013
are presented below:
|
June 30, 2014
|
June 30, 2013
|
||||||||||||||
|
Carrying
Amount
|
Fair
Value
|
Carrying
Amount
|
Fair
Value
|
||||||||||||
|
Coty Inc. Credit Facility
|
$
|
2,774.5
|
|
$
|
2,763.2
|
|
$
|
2,095.0
|
|
$
|
2,086.1
|
|
|||
|
Senior Notes - Series A
|
100.0
|
|
109.7
|
|
100.0
|
|
108.3
|
|
|||||||
|
Senior Notes - Series B
|
225.0
|
|
256.3
|
|
225.0
|
|
244.4
|
|
|||||||
|
Senior Notes - Series C
|
175.0
|
|
199.9
|
|
175.0
|
|
190.0
|
|
|||||||
|
Dividends payable
|
0.9
|
|
0.7
|
|
0.4
|
|
0.3
|
|
|||||||
The Company has concluded that the carrying amounts of cash and cash equivalents, trade receivables, accounts payable, certain accrued expenses, and short-term debt approximate their fair values due to their short-term nature.
The following methods and assumptions were used to estimate the fair value of the Company’s other financial instruments for which it is practicable to estimate that value:
Foreign exchange contracts
—The Company uses currency spot and forward rates to value the foreign exchange contracts, which were obtained from an independent pricing service. Based on the assumptions used to value foreign exchange contracts at fair value, these assets and/or liabilities are categorized as Level 2 in the fair value hierarchy.
Contingent consideration - business combinations
— The Company uses an industry standard valuation model within the option pricing framework to value the Contingent Consideration. The inputs used to measure the fair value included weighted net sales projections through the settlement date of the contingent consideration, revenue volatility using comparable companies' historical performance and a present value calculation to discount the expected settlement. Based on the assumptions used to value the contingent consideration, these liabilities are categorized as Level 3 in the fair value hierarchy.
Coty Inc. Credit Facility and Senior Notes
—The Company uses the income approach to value the Credit Facility and the Senior Notes. The Company uses a present value calculation to discount interest payments and the final maturity payment on the Credit Facility and the Senior Notes using a discounted cash flow model based on observable inputs. The Company discounts the debt based on what the current market rates would offer the Company as of the reporting date. Based on the assumptions used to value the Credit Facility and the Senior Notes at fair value, this debt is categorized as Level 2 in the fair value hierarchy.
Dividends payable
— The Company uses the income approach to value the long-term portion of Dividends Payable by utilizing a present value calculation to discount the settlements of the long-term portion of Dividends Payable which is calculated using a discounted cash flow model based on observable inputs. The Company discounts the liability based on an internally developed discount rate as of the reporting date. Based on the assumptions used to value the long-term portion of Dividends Payable at fair value, this debt is categorized as Level 3 in the fair value hierarchy.
19. DERIVATIVE INSTRUMENTS
The Company is exposed to foreign currency exchange fluctuations through its global operations, with manufacturing and distribution facilities in various countries around the world. The Company may reduce its exposure to fluctuations in the cash flows associated with changes in foreign exchange rates by creating offsetting positions through the use of derivative instruments. The Company expects that any gain or loss on the derivative instruments would generally offset the expected increase or decrease in the value of the underlying firm commitments or forecasted transactions. During fiscal 2014, the Company launched a program to qualify derivatives for hedge accounting treatment using foreign currency forward contracts. The Company began entering into derivatives for which hedge accounting treatment has been applied in the second quarter of fiscal 2014 which the Company anticipates realizing in the Consolidated Statement of Operations in fiscal 2015. The Company also continued to use certain derivatives as economic hedges of foreign currency exposure on firm commitments and forecasted transactions. Although these derivatives were not designated for hedge accounting, the overall objective of mitigating foreign currency exposure is the same for all derivative instruments. The Company does not enter into derivative financial instruments for trading or speculative purposes, nor is the Company a party to leveraged derivatives.
For derivatives accounted for as hedging instruments, the Company formally designates and documents, at inception, the financial instrument as a hedge of specific underlying forecasted transactions, the risk management objective and the strategy for undertaking the hedge transaction. In addition, the Company formally assesses both at inception and at least quarterly thereafter, whether the financial instruments used in hedging transactions are effective at offsetting changes in either the fair values or cash flows of the related underlying exposures. Any ineffective portion of a financial instrument's change in fair value
F-38
COTY INC. & SUBSIDIARIES
NOTES TO CONSOLIDATED FINANCIAL STATEMENTS
($ in millions, except per share data)
is immediately recognized into earnings. If it is determined that a derivative or a portion of a derivative is not highly effective as a hedge, the Company will discontinue hedge accounting for the affected derivative or related portion in the related period. Additionally, all of the master agreements governing the Company’s derivative contracts contain standard provisions that could trigger early termination of the contracts in certain circumstances which would require the Company to discontinue hedge accounting, including if the Company were to merge with another entity and the creditworthiness of the surviving entity were to be “materially weaker” than that of the Company prior to the merger. As of
June 30, 2014
, foreign currency forward contracts in net liability positions that contained credit-risk-related features were
$11.5
.
The Company also attempts to minimize credit exposure to counterparties by entering into derivative contracts with counterparties that are major financial institutions. Exposure to credit risk in the event of nonperformance by any of the counterparties is limited to the fair value of contracts in net asset positions, which totaled
$2.1
and
$0.6
at
June 30, 2014
and
2013
, respectively. Accordingly, management of the Company believes risk of material loss under these hedging contracts is remote.
Quantitative Information
Derivatives are recognized on the balance sheet at their fair values. The following table presents the fair value of derivative instruments outstanding at
June 30, 2014
and
2013
:
|
Asset
|
Liability
|
||||||||||||||||||
|
Balance Sheet Classification
|
Fair Value
|
Balance Sheet Classification
|
Fair Value
|
||||||||||||||||
|
June 30, 2014
|
June 30, 2013
|
June 30, 2014
|
June 30, 2013
|
||||||||||||||||
|
Derivatives designated as hedges:
|
|||||||||||||||||||
|
Foreign exchange forward contracts
|
Prepaid expenses and
other current assets
|
$
|
—
|
|
$
|
—
|
|
Accrued expenses and
other current liabilities
|
$
|
10.5
|
|
$
|
—
|
|
|||||
|
Total derivatives designated as hedges
|
$
|
—
|
|
$
|
—
|
|
$
|
10.5
|
|
$
|
—
|
|
|||||||
|
Derivatives not designated as hedges:
|
|||||||||||||||||||
|
Foreign exchange forward contracts
|
Prepaid expenses and
other current assets
|
$
|
2.1
|
|
$
|
0.6
|
|
Accrued expenses and
other current liabilities
|
$
|
1.0
|
|
$
|
0.8
|
|
|||||
|
Total derivatives not designated as hedges
|
$
|
2.1
|
|
$
|
0.6
|
|
$
|
1.0
|
|
$
|
0.8
|
|
|||||||
|
Total derivatives
|
$
|
2.1
|
|
$
|
0.6
|
|
$
|
11.5
|
|
$
|
0.8
|
|
|||||||
The table below presents the gross amount of foreign exchange contract hedges recorded as assets and liabilities in Prepaid expenses and other current assets and Accrued expenses and other current liabilities in the Consolidated Balance Sheet, respectively, as of
June 30, 2014
:
|
Gross Amounts Not Offset in the Consolidated Balance Sheets
|
|||||||||||||||||||||||
|
Gross Amounts Recognized
|
Gross Amounts Offset in the Consolidated Balance Sheets
|
Net Amount Presented in the Consolidated Balance Sheets
|
Financial Instruments
|
Cash Collateral Received
|
Net Amount
|
||||||||||||||||||
|
Assets
|
$
|
2.2
|
|
$
|
(0.1
|
)
|
$
|
2.1
|
|
$
|
—
|
|
$
|
—
|
|
$
|
2.1
|
|
|||||
|
Liabilities
|
$
|
(12.9
|
)
|
$
|
1.4
|
|
$
|
(11.5
|
)
|
$
|
—
|
|
$
|
—
|
|
$
|
(11.5
|
)
|
|||||
The table below presents the gross amount of foreign exchange contract hedges recorded as assets and liabilities in Prepaid expenses and other current assets and Accrued expenses and other current liabilities in the Consolidated Balance Sheet, respectively, as of
June 30, 2013
:
|
Gross Amounts Not Offset in the Consolidated Balance Sheets
|
|||||||||||||||||||||||
|
Gross Amounts Recognized
|
Gross Amounts Offset in the Consolidated Balance Sheets
|
Net Amount Presented in the Consolidated Balance Sheets
|
Financial Instruments
|
Cash Collateral Received
|
Net Amount
|
||||||||||||||||||
|
Assets
|
$
|
0.9
|
|
$
|
(0.3
|
)
|
$
|
0.6
|
|
$
|
—
|
|
$
|
—
|
|
$
|
0.6
|
|
|||||
|
Liabilities
|
$
|
(1.2
|
)
|
$
|
0.4
|
|
$
|
(0.8
|
)
|
$
|
—
|
|
$
|
—
|
|
$
|
(0.8
|
)
|
|||||
F-39
COTY INC. & SUBSIDIARIES
NOTES TO CONSOLIDATED FINANCIAL STATEMENTS
($ in millions, except per share data)
The amount of gains and losses related to the Company’s derivative financial instruments not designated as hedging instruments during the fiscal years ended June 30, 2014, 2013 and 2012 is presented below:
|
Consolidated Statements of Operations
Classification of Gain (Loss) on Forward Exchange Contracts Recognized in Operations |
Gain (Loss) Recognized
in Operations Year Ended June 30, |
|||||||||||
|
2014
|
2013
|
2012
|
||||||||||
|
Interest expense, net
|
$
|
0.4
|
|
$
|
0.8
|
|
$
|
(6.5
|
)
|
|||
|
Cost of Sales
|
$
|
0.1
|
|
$
|
0.9
|
|
$
|
—
|
|
|||
|
Selling, general and administrative
|
$
|
(0.1
|
)
|
$
|
—
|
|
$
|
—
|
|
|||
|
Other (expense) income, net
|
$
|
—
|
|
$
|
—
|
|
$
|
(33.6
|
)
|
|||
The Company enters into foreign currency forward contracts for anticipated transactions for periods consistent with the Company’s identified exposures to minimize the effect of foreign exchange rate movements on revenues and costs and on the cash flows that the Company receives from foreign subsidiaries and third parties where there is a high probability that anticipated exposures will materialize. The foreign currency forward contracts entered into for these anticipated transactions have been designated as foreign currency cash-flow hedges and have varying maturities through the end of
June 2015
. Hedge effectiveness of foreign currency forward contracts is based on the forward-to-forward hypothetical derivative methodology and includes all changes in value.
The ineffective portion of foreign currency forward contracts is recorded in current-period earnings. For derivative contracts that are no longer deemed highly effective, hedge accounting is discontinued and gains and losses accumulated in Other comprehensive income (loss) (“AOCI”) are reclassified to earnings when the underlying forecasted transaction occurs. If it is no longer probable that the forecasted transaction will occur, then any gains or losses in AOCI are reclassified to current-period earnings. As of
June 30, 2014
, all of the Company’s foreign currency forward contracts designated as hedges were highly effective in all material respects. The accumulated loss on these derivative instruments in AOCI, net of tax, was
$(8.9)
and
nil
as of
June 30, 2014
and
June 30, 2013
, respectively. The estimated net loss related to these effective hedges that is expected to be reclassified from AOCI into earnings, net of tax, within the next
twelve months
is
$(8.9)
. A gain of less than
$0.1
was reclassified from AOCI into earnings during the
year ended June 30, 2014
.
As of
June 30, 2014
, the Company had foreign currency forward contracts designated as effective hedges in the amount of
$361.3
, that mature at various dates through
June 2015
. The foreign currencies of the counterparties in the hedged foreign currency forward contracts (notional value stated in U.S. dollars) are principally the British pound
($108.5)
, euro
($85.8)
, Australian dollar
($42.4)
, Canadian dollar
($49.5)
, Russian ruble
($38.3)
, Polish zloty
($30.2)
, U.S. dollar
($17.4)
, and Japanese yen
($2.5)
. As of
June 30, 2013
, the Company had
no
foreign currency forward contracts designated as effective hedges.
As of
June 30, 2014
and
June 30, 2013
, the Company had foreign currency forward contracts not designated as hedges with a notional value of
$535.4
and
$260.6
, respectively, which mature at various dates through
June 2015
.
20. NONCONTROLLING INTERESTS AND REDEEMABLE NONCONTROLLING INTERESTS
Noncontrolling Interests
- On December 21, 2011, the Company purchased the remaining outstanding common stock of its majority-owned subsidiary in Greece from its noncontrolling interest partner for
€6.1
million (
$8.0
). Upon acquisition of the additional ownership interest, the remaining noncontrolling interest was eliminated and the difference between the purchase price paid and the carrying value of the noncontrolling interest acquired was recognized as a reduction of Additional paid-in capital amounting to
$6.6
in the Consolidated Balance Sheet as of June 30, 2012. As part of the purchase, the Company also granted the former noncontrolling interest partner a call option to buy back all of the shares it sold to the Company for a purchase price that approximates its fair value. Exercise of the call option is subject to the Company’s consent following a legal and financial diligence review by an independent accountant of the former noncontrolling interest’s financial position and business viability. The call option is exercisable for a period of
five years
and is potentially renewable.
The Company has the right to purchase the noncontrolling interests (“NCI”) in certain subsidiaries from the NCI holders (each such right, a “Call right”) at certain points in time. On
August 23, 2013
, the Company exercised its Call right for
7%
of a certain Hong Kong subsidiary from the NCI holder, and it consummated the purchase on
January 10, 2014
for
$4.4
. The
$4.4
is recorded as a reduction to Additional paid-in capital (“APIC”) and NCI of
$4.2
and
$0.2
, respectively. The effect of the change in the ownership percentage of the NCI on Net income attributable to Coty Inc. is presented below:
F-40
COTY INC. & SUBSIDIARIES
NOTES TO CONSOLIDATED FINANCIAL STATEMENTS
($ in millions, except per share data)
|
Year Ended June 30,
|
|||||||||||
|
2014
|
2013
|
2012
|
|||||||||
|
Net (loss) income attributable to Coty Inc.
|
$
|
(97.4
|
)
|
$
|
168.0
|
|
$
|
(324.4
|
)
|
||
|
Decrease in APIC for purchase of Greece NCI
|
—
|
|
—
|
|
(6.6
|
)
|
|||||
|
Decrease in APIC for purchase of Hong Kong NCI
|
(4.2
|
)
|
—
|
|
—
|
|
|||||
|
Net (loss) income attributable to Coty Inc. and transfers from NCI
|
$
|
(101.6
|
)
|
$
|
168.0
|
|
$
|
(331.0
|
)
|
||
Redeemable Noncontrolling Interests
-The redeemable noncontrolling interests consist of a
40.0%
interest in a consolidated subsidiary in the United Arab Emirates and a
45.0%
interest in a consolidated subsidiary in Hong Kong.
In addition to the Call right feature, the noncontrolling interest holders of the Company’s consolidated foreign subsidiaries in the United Arab Emirates (“Middle East”) and Hong Kong have the right to sell the noncontrolling interests to the Company at certain points in time (each such right, a “Put right”). The amount at which the Put right and Call right can be exercised is based on a formula prescribed by the stockholder agreements as summarized in the table below, multiplied by the noncontrolling interest holder’s percentage of stock-holding in the Company. Given the provision of the Put right, the entire noncontrolling interests are redeemable outside of the Company’s control and are recorded in the Consolidated Balance Sheets at the estimated redemption value. The Company adjusts the redeemable noncontrolling interests to the redemption values at the end of each reporting period with changes recognized as adjustments to APIC.
|
Middle East
|
Hong Kong
|
||
|
Percentage of redeemable noncontrolling interest
|
40%
|
45%
|
|
|
Earliest exercise date(s)
|
7.0% in July 2014
(a)
;
|
June 2016
|
|
|
remaining 33.0% or
|
|||
|
entire 40.0% in July 2029
|
|||
|
Formula of redemption value
(b)
|
3-year average
|
3-year average
|
|
|
of EBIT
(c)
* 6
|
of EBIT
(c)
* 8 plus
|
||
|
retained earnings less
|
|||
|
liabilities
(d)
|
|||
|
(a)
|
The Company exercised its Call right on September 20, 2013 to purchase
7%
of the Middle East subsidiary. The Company and the NCI holder amended the Shareholders' Agreement so that effective July 1, 2014, the Company will record its purchase of the additional
7%
interest in the Coty M.E. subsidiary as of July 1, 2014. The Company expects to consummate the purchase during the first quarter of fiscal 2015 for a purchase price of
$16.2
. The Company also has the ability to exercise the Call right for the remaining noncontrolling interest of
33%
on July 1, 2028, with such transaction to close on July 1, 2029.
|
|
(b)
|
The redemption value formula related to Hong Kong is subject to a
110%
of
three
year’s averaged net sales cap and net asset value minimum.
|
|
(c)
|
EBIT is defined in the respective stockholder agreements as earnings before interest and income taxes.
|
|
(d)
|
Liabilities are defined in the stockholder agreement as all financial indebtedness except bank overdraft required for normalized trading working capital.
|
21. EQUITY
Initial Public Offering
In
June 2013
, the Company completed an IPO in which the selling stockholders sold
57.1 million
shares of Class A Common Stock. The Company did not receive any proceeds from the sale of shares. Prior to the IPO, the Company’s outstanding shares consisted of
382.8 million
shares of Common Stock and
no
Preferred Stock, each with a value of
$0.01
. On the date of the IPO, all shares of Common Stock converted to
72.2 million
shares of Class A Common Stock and
310.6 million
shares of Class B Common Stock.
Common Stock
As of
June 30, 2014
, the Company’s capital structure consisted of Class A Common Stock, Class B Common Stock and Preferred Stock, each with a par value of $0.01. Class A Common Stock and Class B Common Stock are identical in all respects except for voting rights, certain conversion rights, and transfer restrictions in respect to the shares of Class B Common Stock.
F-41
COTY INC. & SUBSIDIARIES
NOTES TO CONSOLIDATED FINANCIAL STATEMENTS
($ in millions, except per share data)
The holders of Class A Common Stock are entitled to
one
vote per share and the holders of Class B Common Stock are entitled to
ten
votes per share. Holders of Class A Common Stock and Class B Common Stock are entitled to pro rata distribution of dividends if and when declared by the Board of Directors. As of
June 30, 2014
, total authorized shares of Class A Common Stock, Class B Common Stock and Preferred Stock are
800.0 million
,
263.7 million
and
20.0 million
, respectively, and total outstanding shares of Class A Common Stock and Class B Common Stock are
90.2 million
and
263.7 million
, respectively. There was
no
Preferred Stock outstanding as of
June 30, 2014
.
During the
year ended June 30, 2014
the Company issued
4.6 million
shares of its Class A Common Stock and received
$21.9
in cash in connection with exercise of employee stock options, settlement of restricted stock units (“RSUs”) and special incentive awards, and purchase of shares by employees under the Platinum Program (“Platinum”), which is an employee stock ownership program under the Omnibus Equity and Long-Term Incentive Plan (“Omnibus LTIP”).
On June 5, 2014, the Company entered into a Stock Purchase Agreement (the “PE Stock Purchase Agreement”) with Worldwide Beauty Offshore L.P. and Worldwide Beauty Onshore L.P. (“Rhone”), Berkshire Fund VII, L.P., Berkshire Fund VII-A, L.P., Berkshire Investors III LLC and Berkshire Investor IV LLC ("Berkshire"), M. Steven Langman and Bradley Bloom. Rhone, Berkshire, M. Steven Langman and Bradley Bloom are all considered related parties. In connection with the agreement, the Company agreed to repurchase a total of
27.9 million
and less than
0.1 million
shares of Class B Common Stock and Class A Common Stock, respectively, on June 12, 2014, as further discussed in the Treasury Stock section below.
On
December 13, 2013
, Berkshire distributed
4.0 million
shares of its Class B Common Stock to its general and limited partners and members. On March 14 and June 6, 2014, Berkshire distributed an additional
6.0 million
shares and
1.0
million shares of its Class B Common Stock, respectively. The Company did not receive any shares or proceeds from the distribution of shares by Berkshire.
On July 12, 2013, the underwriters of the Company’s IPO exercised their option under the underwriting agreement to purchase from the selling stockholders
8.0 million
additional shares of Class A Common Stock at the initial offering price (the “Overallotment Option”). The Company did not receive any proceeds from the sale of shares by the selling stockholders.
In connection with the Overallotment Option, the distributions of Class B Common Stock and repurchase of Class B Common Stock disclosed above, the Company reclassified
46.9 million
shares from Class B Common Stock to Class A Common Stock on the Consolidated Balance Sheets and Consolidated Statements of Equity and Redeemable Noncontrolling Interests as of
June 30, 2014
.
Accumulated Other Comprehensive Income (Loss)
|
Losses on Cash Flow Hedges
|
Pension and Other Post-Employment Benefit Plans
|
Foreign Currency Translation Adjustments
|
Total
|
||||||||||||
|
Beginning Balance at July 1, 2013
|
$
|
—
|
|
$
|
(33.4
|
)
|
$
|
(85.2
|
)
|
$
|
(118.6
|
)
|
|||
|
Other Comprehensive income before reclassifications
|
(8.9
|
)
|
(22.7
|
)
|
63.7
|
|
32.1
|
|
|||||||
|
Amounts reclassified from AOCL
(a)
|
—
|
|
1.4
|
|
—
|
|
1.4
|
|
|||||||
|
Net current-period other comprehensive income
|
(8.9
|
)
|
(21.3
|
)
|
63.7
|
|
33.5
|
|
|||||||
|
Ending balance at June 30, 2014
|
$
|
(8.9
|
)
|
$
|
(54.7
|
)
|
$
|
(21.5
|
)
|
$
|
(85.1
|
)
|
|||
(a)
Amortization of actuarial losses of
$2.0
, net of taxes of
$(0.6)
, were reclassified out of AOCL and included in the computation of net period pension costs (see Note 17).
Treasury Stock
On June 12, 2014, in connection with the PE Stock Purchase Agreement, a related party transaction, the Company repurchased a total of
27.9 million
and less than
0.1 million
shares of Class B Common Stock and Class A Common Stock, respectively, for
$16.78
per share, which was determined by calculating the volume weighted average price of the Company's Class A Common Stock from May 30, 2014 through June 5, 2014, inclusive. The fair value of Class B shares and Class A shares repurchased was
$468.0
and
$1.0
, respectively, and was reflected as an increase to Treasury stock in the Company’s Consolidated Balance Sheets and Consolidated Statements of Equity and Redeemable Noncontrolling Interests.
On
February 14, 2014
, the Company announced that it would repurchase shares of Class A Common Stock having an aggregate market value not exceeding
$200.0
, which was subsequently increased to
$400.0
on June 3, 2014, in order to invest into the business and further enhance shareholder value. In connection with this repurchase program, the Company repurchased
F-42
COTY INC. & SUBSIDIARIES
NOTES TO CONSOLIDATED FINANCIAL STATEMENTS
($ in millions, except per share data)
6.6 million
shares of its Class A Common Stock during fiscal 2014. The shares were purchased in multiple transactions at prices ranging from
$14.64
to
$15.69
. The fair value of all shares repurchased was
$100.0
and was reflected as an increase to Treasury stock in the Company’s Consolidated Balance Sheets and Consolidated Statements of Equity and Redeemable Noncontrolling Interests.
On September 13, 2013, the Company purchased less than
0.1 million
shares of its Class A Common Stock that had been issued upon the exercise of certain stock options. The purchase was in connection with the net settlement of an employee’s stock option exercise and payment of related withholding taxes. Additionally, on November 14, 2013, the Company purchased less than
0.1 million
shares of its Class A Common Stock that had been issued upon the settlement of certain RSUs. The purchase was in connection with payment of withholding taxes related to settlement of RSUs owned by
two
board directors. The settlement occurred under the Company’s 2007 Stock Plan for Directors, which provides for automatic settlement of outstanding RSUs upon vesting. The fair value of the shares on the transaction dates were
$0.2
and
$0.1
, respectively, and classified within Class A Common Stock and APIC. These purchases were reflected as an increase to Treasury stock of
$0.3
in the Company’s Consolidated Balance Sheets and Consolidated Statements of Equity and Redeemable Noncontrolling Interests.
Dividends
On
September 17, 2013
, the Company declared a cash dividend of
$0.20
per share, or
$77.6
on its Class A Common Stock and Class B Common Stock. Of the
$77.6
, which was recorded as a decrease to APIC in the Consolidated Balance Sheet as of
June 30, 2014
,
$76.9
was paid on
October 31, 2013
to holders of record of Class A Common Stock and Class B Common Stock on
October 11, 2013
. The remaining
$0.7
is payable upon settlement of RSUs and vesting of restricted shares of Class A Common Stock, each outstanding as of
October 11, 2013
, and is recorded as Other noncurrent liabilities in the Consolidated Balance Sheet.
Additionally, the Company reduced the dividend accrual recorded in a prior period by
$0.2
to adjust for accrued dividends on RSUs no longer expected to vest, which was recorded as an increase to APIC in the Consolidated Balance Sheet. Total accrued dividends on unvested RSUs of
$0.9
are included in Other noncurrent liabilities in the Consolidated Balance Sheet as of
June 30, 2014
.
22. SHARE-BASED COMPENSATION PLANS
The Company has various share-based compensation programs (the “Plans”) under which awards, including non-qualified stock options, RSUs and other share-based awards, may be granted or shares of Class A Common Stock may be purchased. As of
June 30, 2014
, approximately
16.5 million
shares of the Company's Class A Common Stock were reserved and available to be granted pursuant to these Plans.
Prior to
June 12, 2013
, the Company’s Plans were accounted for under liability plan accounting, as they allowed for cash settlement or contained put features that allowed the holders to sell shares to the Company for cash. On June 12, 2013, the Plans were amended, and the terms were restated in order to eliminate the put features and transition issued and outstanding shares as of June 12, 2013 to equity plan accounting.
Total share-based compensation expense for fiscal 2014, 2013 and 2012 of
$46.8
,
$144.4
and
$142.6
, respectively, is included in Selling, general and administrative expenses in the Consolidated Statements of Operations. As of
June 30, 2014
, the total unrecognized share-based compensation expense related to unvested stock options and restricted and other share awards is
$36.2
and
$40.5
, respectively. The unrecognized share-based compensation expense related to unvested stock options and restricted and other share awards is expected to be recognized over a weighted-average period of
1.94
and
3.60
years, respectively.
Nonqualified Stock Options
Prior to
June 12, 2013
, the Company’s nonqualified and tandem stock option plans allowed all option holders to exercise their vested options for cash or for shares of Common Stock. These options were granted to eligible employees as specified in the terms of the plans. For these liability awards, the fair value of the award which determined the measurement of the liability on the balance sheet was re-measured at each reporting period. Fluctuations in the fair value of the liability awards were recorded as increases or decreases in share-based compensation expense until the award was settled. Subsequent to
June 12, 2013
, the share-based compensation expense recognized on nonqualified stock options is based upon the fair value on
June 12, 2013
.
The fair value of the Company’s outstanding stock option liability on
June 12, 2013
and
June 30, 2012
were estimated using the Black-Scholes valuation model with the following assumptions:
F-43
COTY INC. & SUBSIDIARIES
NOTES TO CONSOLIDATED FINANCIAL STATEMENTS
($ in millions, except per share data)
|
2013
|
2012
|
||||
|
Expected life of option
|
4.03 years
|
|
4.32 years
|
|
|
|
Risk-free interest rate
|
0.84
|
%
|
0.72
|
%
|
|
|
Expected volatility
|
32.53
|
%
|
32.80
|
%
|
|
|
Expected dividend yield
|
0.86
|
%
|
0.00
|
%
|
|
Expected life of option
—The expected life of the option represents the period of time (years) that options granted are expected to be outstanding, which the Company calculates using a formula based on the vesting term and the contractual life of the respective option.
Risk-free interest rate
—The Company bases the risk-free interest rate on the implied yield available on a U.S. Treasury note with a term equal to the expected term of the underlying options, which ranged from
0.11%
to
1.30%
as of
June 12, 2013
and from
0.16%
to
1.12%
as of
June 30, 2012
.
Expected volatility
—The Company calculates expected volatility based on median volatility for peer companies using
7.5
years of daily stock price history.
Expected dividend yield
—The Company used an expected dividend yield of
0.86%
and
0.00%
as of
June 12, 2013
and
June 30, 2012
, respectively, which is based upon the Company’s expectation to pay dividends over the contractual term of the options.
Prior to
June 12, 2013
, all options related to share-based compensation plans were granted at the estimated fair value of Common Stock, which was determined based upon, in each instance, an evaluation by management with assistance from a major investment banking firm. The valuation of shares was based on (i) an aggregate value Earnings Before Interest, Taxes, Depreciation and Amortization (“EBITDA”) benchmark of future earnings and (ii) a price earnings growth rate benchmark, with a comparison to peer group companies and market multiples. Additionally, the Company applied a theoretical liquidity discount of
10%
to the valuation associated with the illiquidity of the Common Stock due to the absence of a public market for the stock and certain restrictions from the transfer of stock in a private entity.
Nonqualified stock options generally become exercisable
5 years
from the date of the grant and have a
5
-year exercise period from the date the grant becomes fully vested for a total contractual life of
10 years
.
The Company’s outstanding nonqualified stock options as of
June 30, 2014
and activity during the fiscal year then ended are presented below:
|
Shares
(in millions)
|
Weighted
Average
Exercise
Price
|
Aggregate
Intrinsic
Value
|
Weighted
Average
Remaining
Contractual
Term
|
|||||||||
|
Outstanding at July 1, 2013
|
28.2
|
|
$
|
9.05
|
|
|||||||
|
Exercised
|
(3.1
|
)
|
6.81
|
|
||||||||
|
Forfeited or expired
|
(1.9
|
)
|
9.54
|
|
||||||||
|
Outstanding at June 30, 2014
|
23.2
|
|
$
|
9.32
|
|
|||||||
|
Vested and expected to vest at June 30, 2014
|
20.8
|
|
$
|
9.25
|
|
$
|
163.8
|
|
5.59
|
|||
|
Exercisable at June 30, 2014
|
7.0
|
|
$
|
8.47
|
|
$
|
60.6
|
|
3.69
|
|||
There were
no
options granted in the current year. The grant prices of the outstanding options as of
June 30, 2014
ranged from
$4.65
to
$11.60
. The grant prices for exercisable options ranged from
$4.65
to
$10.50
.
A summary of the aggregated weighted-average grant date fair value of stock options granted, total intrinsic value of stock options exercised and payment to settle nonqualified stock options for fiscal 2014, 2013 and 2012 is presented below:
|
2014
|
2013
|
2012
|
|||||||||
|
Weighted-average grant date fair value of stock options
|
$
|
—
|
|
$
|
—
|
|
$
|
4.1
|
|
||
|
Intrinsic value of options exercised
|
28.3
|
|
160.6
|
|
5.2
|
|
|||||
|
Payment to settle nonqualified stock options
|
—
|
|
154.4
|
|
3.6
|
|
|||||
The Company’s non-vested nonqualified stock options as of
June 30, 2014
and activity during the fiscal year then ended are presented below:
F-44
COTY INC. & SUBSIDIARIES
NOTES TO CONSOLIDATED FINANCIAL STATEMENTS
($ in millions, except per share data)
|
Shares
(in millions)
|
Weighted
Average
Grant Date
Fair Value
|
|||||
|
Non-vested at July 1, 2013
|
22.7
|
|
$
|
3.57
|
|
|
|
Vested
|
(4.6
|
)
|
2.69
|
|
||
|
Forfeited
|
(1.9
|
)
|
3.74
|
|
||
|
Non-vested at June 30, 2014
|
16.2
|
|
$
|
3.81
|
|
|
The share-based compensation expense recognized on the nonqualified stock options is
$28.6
,
$98.8
and
$84.8
during fiscal
2014
,
2013
and
2012
, respectively.
Prior to
June 12, 2013
, the share-based compensation plans governing the exercised options contained a clause permitting the participants to sell their unrestricted shares of Common Stock back to the Company without restrictions. During the period of time that the Company retained the risks and rewards of share ownership, the Company recorded the value of Common Stock in excess of par value to Accrued expenses and other current liabilities and the change in fair value of Common Stock issued to option holders of
$0.4
and
$(0.6)
to share-based compensation expense (income) in fiscal
2013
and
2012
.
Restricted Share Units
During fiscal
2014
,
2.1 million
RSUs were granted under the Omnibus LTIP and
0.1 million
RSUs were granted under the 2007 Stock Plan for Directors.
The Company’s outstanding RSUs as of
June 30, 2014
and activity during the fiscal year then ended are presented below:
|
Shares
(in millions)
|
Aggregate
Intrinsic
Value
|
Weighted
Average
Remaining
Contractual
Term
|
||||||
|
Outstanding at July 1, 2013
|
2.7
|
|
||||||
|
Granted
|
2.2
|
|
||||||
|
Settled
|
(0.2
|
)
|
||||||
|
Cancelled
|
(0.3
|
)
|
||||||
|
Outstanding at June 30, 2014
|
4.4
|
|
||||||
|
Vested and expected to vest at June 30, 2014
|
3.6
|
|
$
|
60.9
|
|
3.51
|
||
The share-based compensation expense recorded in connection with the RSUs was
$10.8
,
$9.1
and
$4.7
during fiscal
2014
,
2013
and
2012
, respectively.
Prior to
June 12, 2013
, the share-based compensation plans governing the released awards contained a clause permitting the participants to sell their unrestricted shares of Common Stock back to the Company without restrictions. During the period of time that the Company retained the risks and rewards of ownership, the Company recorded the value of Common Stock in excess of par value to Accrued expenses and other current liabilities and the change in fair value of Common Stock issued to holders of RSUs of
$0.7
to share-based compensation expense for fiscal
2013
. There was no fair value adjustment recorded for fiscal
2012
.
The Company’s outstanding and non-vested RSUs as of
June 30, 2014
and activity during the fiscal year then ended are presented below:
|
Shares
(in millions)
|
Weighted
Average
Grant Date
Fair Value
|
|||||
|
Outstanding and nonvested at July 1, 2013
|
2.3
|
|
$
|
15.49
|
|
|
|
Granted
|
2.2
|
|
16.05
|
|
||
|
Vested
|
(0.2
|
)
|
14.54
|
|
||
|
Cancelled
|
(0.3
|
)
|
15.76
|
|
||
|
Outstanding and nonvested at June 30, 2014
|
4.0
|
|
$
|
15.77
|
|
|
The total intrinsic value of RSUs vested and settled during fiscal
2014
,
2013
, and 2012 is
$2.8
,
$4.2
and
$0.4
, respectively.
F-45
COTY INC. & SUBSIDIARIES
NOTES TO CONSOLIDATED FINANCIAL STATEMENTS
($ in millions, except per share data)
Executive Ownership Programs
The Company encourages stock ownership through various programs. These programs govern shares purchased by employees (“Purchased Shares”). During fiscal
2012
, the Company adopted the Omnibus LTIP, which governs Platinum, and amended and restated the previous ownership program. As a result, all outstanding shares purchased by employees were considered vested as of the adoption date or the amendment date, as applicable, and no longer incur expense.
Employees purchased
0.1 million
and
0.3 million
shares in fiscal 2014 and 2013, respectively, and received matching RSUs in accordance with the terms of Platinum under the Omnibus LTIP. There were
1.3 million
and
1.2 million
Purchased Shares outstanding as of June 30, 2014 and 2013, respectively.
There was
no
share-based compensation expense recorded in connection with Purchased Shares during fiscal
2014
. Share-based compensation expense recorded for fiscal
2013
and fiscal
2012
was
$10.7
and
$8.3
, respectively. The total intrinsic value of Purchased shares vested and settled under the EOP during the
year ended June 30, 2013
is
$13.7
. No Purchased shares vested or settled during fiscal 2012.
Prior to
June 12, 2013
, the share-based compensation plans governing the restricted and released shares contained a clause permitting the participants to sell their Purchased Shares of Common Stock back to the Company without restrictions once the restriction period on the Purchased Shares expired. During the period of time that the Company retained the risks and rewards of ownership, the Company recorded the value of Common Stock in excess of par value to Accrued expenses and other current liabilities and the change in fair value of Common Stock issued to holders of Purchased Shares of
$5.8
to share-based compensation expense for fiscal
2013
. There was no fair value adjustment recorded for fiscal
2012
.
Special Incentive Award
In February 2012 and September 2010, the Company granted a special incentive award to a select group of key executives that, upon vesting, provides
3.9 million
shares of Common Stock, of which
1.5 million
shares of Common Stock were forfeited by
one
holder during fiscal 2013. Prior to June 13, 2013, the date the Class A Common Stock began trading on the NYSE, vesting of these awards was dependent upon the occurrence of (i) an initial public offering by September 14, 2015 or (ii) if an initial public offering had not occurred by September 14, 2015, upon achievement of a target fair value of the Company’s share price and the completion of the service period upon the vesting date of September 14, 2015.
During December 2012, the target fair value of the Company’s share price was achieved and as a result, share-based compensation expense was recorded based on the fair value of the Company’s Common Shares on each reporting period date from December 2012 through June 13, 2013.
On June 13, 2013, the date Class A Common Stock began trading on the New York Stock Exchange, the special incentive awards were re-measured at the IPO price and
50%
of the outstanding awards vested immediately. The remaining awards vested on June 13, 2014, the one-year anniversary date of the IPO. The
1.2 million
shares that vested during fiscal 2013 and 2014 had a weighted average grant date fair value of
$6.82
. There were no special incentive awards outstanding as of June 30, 2014.
Share-based compensation expense recorded in connection with special incentive awards is
$7.4
,
$18.9
and
$11.6
for fiscal 2014, 2013 and 2012, respectively. The total intrinsic value of special incentive awards vested and settled during fiscal
2014
and
2013
is
$20.4
and
$20.9
, respectively. There were no special incentive awards vested and settled during fiscal 2012.
Share Purchase Program and Other Share Purchase Transactions
In September 2011, the Company introduced the Share Purchase Program for Directors to align the interests of the Company and its stockholders by enabling the members of the Board of Directors to acquire an increased stake in the Company through purchases of shares of Common Stock. There were
10.0 million
shares authorized to be purchased under the program of which the Directors purchased
10.0 million
shares during fiscal 2012. In addition, certain senior executives elected to purchase
0.6 million
shares of Common Stock at the fair value on the purchase date through separate agreements with the Company. There are no vesting conditions for either program. There were no purchases of Common Stock during fiscal 2013.
Prior to the IPO, directors and certain senior executives could sell their shares back to the Company without restrictions. As such, these shares were recorded as a liability at the fair value as of June 30, 2012 to the extent the holders have not retained the risks and rewards of share ownership for a reasonable period of time. The Company recorded the change in fair value of such shares from the share purchase date to June 30, 2012 of
$33.8
to share-based compensation expense. All shares purchased as part of the program had been reclassified from Accrued expenses and other current liabilities to Redeemable common stock by the first quarter of fiscal 2013. As such, the change in fair value of the shares outstanding was recorded to Additional paid-in capital and no share-based compensation expense was incurred for the years ended June 30, 2014 and 2013.
23. NET (LOSS) INCOME ATTRIBUTABLE TO COTY INC. PER COMMON SHARE
F-46
COTY INC. & SUBSIDIARIES
NOTES TO CONSOLIDATED FINANCIAL STATEMENTS
($ in millions, except per share data)
Net (loss) income attributable to Coty Inc. per common share (“basic EPS”) is computed by dividing net (loss) income attributable to Coty Inc. by the weighted-average number of common shares outstanding during the period. Net income (loss) attributable to Coty Inc. per common share assuming dilution (“diluted EPS”) is computed by using the basic EPS weighted-average number of common shares and the effect of potentially dilutive securities outstanding during the period. Potentially dilutive securities consist of nonqualified stock options and RSUs as of June 30, 2014. Potentially dilutive securities also included restricted shares and special incentive awards as of June 30, 2013 and 2012. The dilutive effect of these outstanding instruments is reflected in diluted EPS by application of the treasury stock method. Due to the net loss incurred in fiscal 2014 and 2012, no stock options, restricted shares, restricted stock units or special incentive awards were included in the computation of diluted loss per share.
Net (loss) income attributable to Coty Inc. is adjusted through the application of the two-class method of income per share to reflect a portion of the periodic adjustment of the redemption value in excess of fair value of the redeemable noncontrolling interests. There is no excess of redemption value over fair value of the redeemable noncontrolling interests in fiscal 2014, 2013 and 2012. In addition, there are no participating securities requiring the application of the two-class method of income per share.
Reconciliation between the numerators and denominators of the basic and diluted EPS computations is presented below:
|
Year Ended June 30,
|
|||||||||||
|
2014
|
2013
|
2012
|
|||||||||
|
Net (loss) income attributable to Coty Inc.
|
$
|
(97.4
|
)
|
$
|
168.0
|
|
$
|
(324.4
|
)
|
||
|
Weighted-average common shares outstanding—Basic
|
381.7
|
|
381.7
|
|
373.0
|
|
|||||
|
Effect of dilutive stock options
(a)
|
—
|
|
12.3
|
|
—
|
|
|||||
|
Effect of restricted stock and RSUs
(b)
|
—
|
|
2.4
|
|
—
|
|
|||||
|
Weighted-average common shares outstanding—Diluted
|
$
|
381.7
|
|
$
|
396.4
|
|
$
|
373.0
|
|
||
|
Net (loss) income attributable to Coty Inc. per common share:
|
|||||||||||
|
Basic
|
$
|
(0.26
|
)
|
$
|
0.44
|
|
$
|
(0.87
|
)
|
||
|
Diluted
|
(0.26
|
)
|
0.42
|
|
(0.87
|
)
|
|||||
|
(a)
|
As of June 30, 2013, outstanding stock options to purchase
1.2 million
shares of Common Stock are excluded from the computation of diluted EPS as their inclusion would be anti-dilutive. Due to the net loss incurred in fiscal 2014 and 2012, stock options are excluded from the computation of diluted EPS as their inclusion would be anti-dilutive.
|
|
(b)
|
As of June 30, 2013, there are
no
anti-dilutive RSUs excluded from the computation of diluted EPS as their inclusion would be anti-dilutive. Due to the net loss incurred in fiscal 2014 and 2012, RSUs are excluded from the computation of diluted EPS as their inclusion would be anti-dilutive.
|
24. COMMITMENTS AND CONTINGENCIES
Legal Matters
The Company is involved, from time to time, in litigation, other regulatory actions and other legal proceedings incidental to the business. Other than as described below, management believes that the outcome of current litigation will not have a material adverse impact on the Company's results of operations, financial condition, or cash flows. However, management’s assessment of the Company’s current litigation, regulatory actions and other legal proceedings could change in light of the discovery of facts with respect to litigation, regulatory actions or other proceedings pending against the Company not presently known to the Company or determinations by judges, juries or other finders of fact which are not in accord with management’s evaluation of the possible liability or outcome of such litigation, regulatory actions and legal proceedings.
During fiscal 2014,
two
putative class action complaints were filed in the United States Southern District of New York against the Company, its directors and certain of its executive officers alleging violations of the federal securities laws in connection with the Company's IPO. The first complaint, filed on February 13, 2014, was captioned Eugene Stricker vs. Coty Inc., et al., (the “Stricker Action”), while the second complaint, filed February 21, 2014, was captioned Norman C. Carey vs. Coty Inc., et al., (the “Carey Action”).
F-47
COTY INC. & SUBSIDIARIES
NOTES TO CONSOLIDATED FINANCIAL STATEMENTS
($ in millions, except per share data)
The Stricker Action and the Carey Action have been consolidated under the caption In re Coty Inc. Securities Litigation, and following the court’s appointment of lead plaintiffs and lead counsel, a consolidated and amended complaint (the “Securities Complaint”) was filed on July 7, 2014. The Securities Complaint asserts claims against the Company, its directors, certain of its executive officers, and the underwriters of the IPO under Sections 11, 12 and 15 of the Securities Act of 1933, as amended (the “Securities Act”), and seeks, on behalf of persons who purchased the Company's Class A Common Stock in the IPO, rescission, damages of an unspecified amount and equitable or injunctive relief.
The Company’s motion to dismiss is due on September 23, 2014. The Company believes both lawsuits are without merit and intends to vigorously defend them.
On
December 21, 2012
, the Company voluntarily disclosed to the U.S. Commerce Department’s Bureau of Industry and Security’s Office of Export Enforcement (“OEE”) results of the Company’s internal due diligence review conducted with the advice of outside counsel regarding certain export transactions from
January 2008
through
March 2012
. In particular, the Company disclosed information relating to overall compliance with U.S. Export Administration Regulations (“EAR”). In its submission, the Company has provided OEE with an explanation of the activities that led to the sales of its products in Syria. In addition, the Company disclosed that prior to
January 2010
some of its subsidiary’s sales to Syria were made to a party that was designated as a target of U.S. economic sanctions by the U.S. Treasury Department’s Office of Foreign Assets Control (“OFAC”). The Company does not believe these sales constituted a violation of U.S. trade sanctions administered by OFAC. The Company also notified the Office of Foreign Assets Control of its voluntary disclosure to the OEE.
On
June 28, 2013
, the Company submitted the final voluntary disclosure to the OEE which disclosed the results of the Company's internal due diligence review conducted with the advice of outside counsel regarding certain export transactions from January 2008 through March 2012. In particular, the Company disclosed information relating to overall compliance with U.S. export control laws by its majority-owned subsidiary in the UAE, and the nature and quantity of its re-exports to Syria that the Company believed may constitute violations of the EAR. The disclosure addressed the above described findings and the remedial actions the Company has taken to date. On January 6, 2014, the Company received a warning letter from the OEE stating that the bureau has closed its investigation of the Company's final voluntary disclosure and determined not to pursue administrative or criminal prosecution even though the transactions violated EAR. The OEE imposed no financial penalties.
On
January 14, 2013
, the Company voluntarily disclosed to the U.S. Department of Commerce’s Bureau of Industry and Security’s Office of Antiboycott Compliance (“OAC”) additional results of the Company’s internal due diligence review. In particular, the Company disclosed information relating to overall compliance with U.S. antiboycott laws by a majority-owned subsidiary in the UAE, including with respect to the former inclusion of a legend on invoices, confirming that the corresponding goods did not contain materials of Israeli origin. A number of the invoices involved U.S. origin goods. The Company believes inclusions of this legend may constitute violations of U.S. antiboycott laws. On
June 28, 2013
, the Company voluntarily disclosed to the OAC the final results of the Company’s internal due diligence review. The disclosure addressed the above described findings and the remedial actions the Company has taken to date. The Company cannot predict when the OAC will complete its review.
Penalties for EAR violations can be significant and civil penalties can be imposed on a strict liability basis, without any showing of knowledge or willfulness. OFAC and OAC each have wide discretion to settle claims for violations. As previously disclosed, the Company believes that a penalty or penalties could be imposed from its voluntary disclosures, and that such penalty or penalties would result in a material loss is reasonably possible. Irrespective of any penalty, the Company could suffer other adverse effects on its business as a result of any violations or the potential violations, including legal costs and harm to its reputation, and the Company also will incur costs associated with its efforts to improve its compliance procedures. The Company has not established a reserve for potential penalties and does not know whether OFAC or OAC will assess a penalty or what the amount of any penalty would be, if a penalty or penalties were assessed.
25. SUBSEQUENT EVENTS
On August 28, 2014, the Company offered to repurchase up to the aggregate principal amount outstanding of the Senior Notes (see Note 12) for cash, prior to the maturity date (the “Note Repurchase”). Pursuant to the terms of the NPA, in connection with the Note Repurchase, the Company will also pay a “make-whole amount” of approximately
$85.0
-
$95.0
(the “Make-Whole Amount”). The Note Repurchase offer is binding on the Company, and the Company expects to pay a total amount of approximately
$585.0
to
$595.0
in connection with the Note Repurchase and payment of the Make-Whole Amount. The Company expects to consummate the Note Repurchase and pay the Make-Whole Amount on or about September 27, 2014. In order to finance the Note Repurchase and the payment of the Make-Whole Amount, the Company intends to enter into a new credit agreement, under which it intends to borrow an aggregate principal amount of up to
$600
million (the “2014 Term Loan”). The Company has received commitments for the 2014 Term Loan.
F-48
COTY INC. & SUBSIDIARIES
SCHEDULE II - VALUATION AND QUALIFYING ACCOUNTS
Years Ended June 30,
2014
,
2013
, and
2012
($ in millions, except per share data)
Valuation and Qualifying Accounts
|
Description
|
Three Years Ended June 30,
|
|||||||||||||||||||
|
Balance at
Beginning of Period |
Charged to
Costs and Expenses |
Deductions
|
Balance at
End of Period |
|||||||||||||||||
|
Allowance for doubtful accounts:
|
||||||||||||||||||||
|
2014
|
$
|
14.5
|
|
$
|
3.2
|
|
$
|
(1.0
|
)
|
(a)
|
$
|
16.7
|
|
|||||||
|
2013
|
19.6
|
|
3.2
|
|
(8.3
|
)
|
(a)
|
14.5
|
|
|||||||||||
|
2012
|
19.2
|
|
5.5
|
|
(5.1
|
)
|
(a)
|
19.6
|
|
|||||||||||
|
Allowance for customer returns:
|
||||||||||||||||||||
|
2014
|
$
|
76.0
|
|
$
|
173.8
|
|
$
|
(162.5
|
)
|
$
|
87.3
|
|
||||||||
|
2013
|
74.9
|
|
158.6
|
|
(157.5
|
)
|
76.0
|
|
||||||||||||
|
2012
|
84.2
|
|
151.8
|
|
(161.1
|
)
|
74.9
|
|
||||||||||||
|
Deferred tax allowances:
|
||||||||||||||||||||
|
2014
|
$
|
61.5
|
|
$
|
42.2
|
|
(b)
|
$
|
(5.1
|
)
|
$
|
98.6
|
|
|||||||
|
2013
|
47.1
|
|
20.6
|
|
(b)
|
(6.2
|
)
|
61.5
|
|
|||||||||||
|
2012
|
45.6
|
|
4.9
|
|
(b)
|
(3.4
|
)
|
47.1
|
|
|||||||||||
|
(a)
|
Includes amounts written-off, net of recoveries and cash discounts.
|
|
(b)
|
Includes foreign currency translation adjustments unless otherwise noted.
|
S-1
TABLE OF CONTENTS
Part IItem 1. BusinessItem 1A. Risk FactorsItem 2. PropertiesItem 3. Legal ProceedingsPart IIItem 5. Market For Registrant S Common Equity, Related Stockholder Matters and Issuer Purchases Of Equity SecuritiesItem 6. Selected Financial DataItem 7. Management S Discussion and Analysis Of Financial Condition and Results Of OperationsItem 7A. Quantitative and Qualitative Disclosures About Market RiskItem 8. Financial Statements and Supplementary DataItem 9A. Controls and ProceduresPart IIIItem 10. Directors, Executive Officers and Corporate GovernanceItem 11. Executive CompensationItem 12. Security Ownership Of Certain Beneficial Owners and Management and Related Stockholder MattersItem 13. Certain Relationships and Related Transactions, and Director IndependenceItem 14. Principal Accounting Fees and ServicesPart IVItem 15. Exhibits, Financial Statement Schedules