COTY INC.
10-Ks and 10-Qs
|
|
|
|
|
|
|
|
|
|
|
|
|
|
|
|
|
|
|
|
|
|
|
|
|
|
|
|
|
|
|
|
|
|
|
|
|
|
UNITED STATES
SECURITIES AND EXCHANGE COMMISSION
WASHINGTON, D.C. 20549
Form
10-K
(Mark One)
|
ý
|
ANNUAL REPORT PURSUANT TO SECTION 13 OR 15(d) OF THE SECURITIES EXCHANGE ACT OF 1934
|
|
FOR THE FISCAL YEAR ENDED JUNE 30, 2017
|
|
|
OR
|
|
|
¨
|
TRANSITION REPORT PURSUANT TO SECTION 13 OR 15(d) OF THE SECURITIES EXCHANGE ACT OF 1934
|
|
FOR THE TRANSITION PERIOD FROM TO
|
|
|
COMMISSION FILE NUMBER 001-35964
|
|
COTY INC.
(Exact name of registrant as specified in its charter)
|
Delaware
|
13-3823358
|
|
|
(State or other jurisdiction of incorporation or organization)
|
(I.R.S. Employer Identification Number)
|
|
|
350 Fifth Avenue, New York, NY
|
10118
|
|
|
(Address of principal executive offices)
|
(Zip Code)
|
|
(212) 389-7300
Registrant’s telephone number, including area code
|
SECURITIES REGISTERED PURSUANT TO SECTION 12(b) OF THE ACT:
|
||
|
Title of each class
|
Name of each exchange on which registered
|
|
|
Class A Common Stock, $0.01 par value
|
New York Stock Exchange
|
|
|
SECURITIES REGISTERED PURSUANT TO SECTION 12(g) OF THE ACT:
|
||
|
None
|
||
Indicate by check mark if the registrant is a well-known seasoned issuer, as defined in Rule 405 of the Securities Act. Yes
ý
No
o
Indicate by check mark if the registrant is not required to file reports pursuant to Section 13 or Section 15(d) of the Act. Yes
o
No
ý
Indicate by check mark whether the registrant (1) has filed all reports required to be filed by Section 13 or 15(d) of the Securities Exchange Act of 1934 during the preceding 12 months (or for such shorter period that the registrant was required to file such reports), and (2) has been subject to such filing requirements for the past 90 days. Yes
ý
No
o
Indicate by check mark whether the registrant has submitted electronically and posted on its corporate Web site, if any, every Interactive Data File required to be submitted and posted pursuant to Rule 405 of Regulation S-T (§232.405 of this chapter) during the preceding 12 months (or for such shorter period that the registrant was required to submit and post such files). Yes
ý
No
o
Indicate by check mark if disclosure of delinquent filers pursuant to Item 405 of Regulation S-K (§229.405 of this chapter) is not contained herein, and will not be contained, to the best of registrant’s knowledge, in definitive proxy or information statements incorporated by reference in Part III of this Form 10-K or any amendment to this Form 10-K.
o
Indicate by check mark whether the registrant is a large accelerated filer, an accelerated filer, a non-accelerated filer, or a smaller reporting company. See the definitions of “large accelerated filer,” “accelerated filer” and “smaller reporting company” in Rule 12b-2 of the Exchange Act.
|
|
Large accelerated filer
ý
|
Accelerated filer
o
|
|
|
|
Non-accelerated filer
o
|
(Do not check if a smaller reporting company)
|
|
|
|
Smaller reporting company
o
|
||
|
Emerging growth company
o
|
|||
|
If an emerging growth company, indicate by check mark if the registrant has elected not to use the extended transition period for complying with any new or revised financial accounting standards provided pursuant to Section 13(a) of the Exchange Act.
o
|
|||
Indicate by check mark whether the registrant is a shell company (as defined in Rule 12b-2 of the Exchange Act). Yes
o
No
ý
As of December 31,
2016
, the aggregate market value of the registrant’s Class A Common Stock held by non-affiliates was
$13,541,968,117
based on the number of shares held by non-affiliates as of December 31,
2016
and the last reported sale price of the registrant’s Class A Common Stock on December 31,
2016
.
At August 16,
2017
,
748,686,540
shares of the registrant’s Class A Common Stock, $0.01 par value were outstanding.
COTY INC.
INDEX TO ANNUAL REPORT ON FORM 10-K
|
Page
|
||
Forward-looking Statements
Certain statements in this Form 10-K are “forward-looking statements” within the meaning of the Private Securities Litigation Reform Act of 1995. These forward-looking statements reflect our current views with respect to, among other things, our future operations and financial performance, ongoing cost efficiency initiatives, the timing and presentation of future cost saving plans, expected growth (including revenue declines and trends), our ability to support our planned business operations on a near- and long-term basis, mergers and acquisitions, future dividend payments, divestitures, transitions, synergies or growth from acquisitions, the success of the integration of the P&G Beauty Business (as defined below) and our outlook and future reporting periods. These forward-looking statements are generally identified by words or phrases, such as “anticipate”, “are going to”, “estimate”, “plan”, “project”, “expect”, “believe”, “intend”, “foresee”, “forecast”, “will”, “may”, “should”, “outlook”, “continue”, “target”, “aim”, “potential” and similar words or phrases. These statements are based on certain assumptions and estimates that we consider reasonable and are subject to a number of risks and uncertainties, many of which are beyond our control, which could cause actual events or results to differ materially from such statements, including:
|
•
|
our ability to achieve our global business strategies, compete effectively in the beauty industry and achieve the benefits contemplated by our strategic transactions, including our joint ventures and recent acquisitions, within the expected time frame or at all;
|
|
•
|
use of estimates and assumptions in preparing our financial statements, including with regard to revenue recognition, stock compensation expense, the assessment of goodwill, other intangible assets and long-lived assets for impairment, the market value of inventory, pension expense and the fair value of acquired assets and liabilities associated with acquisitions;
|
|
•
|
managerial, integration, operational, regulatory, legal and financial risks, including management of cash flows, and expenses associated with our strategic transactions and internal reorganizations;
|
|
•
|
the integration of the P&G Beauty Business (as defined below) with our business, operations, systems, financial data and culture (including the recent exits and anticipated future exit of the Transition Services Agreement and implementation of our Global Integration Activities (as defined below)) and the ability to realize synergies, reduce costs and other potential efficiencies and benefits at the levels and at the costs and within the time frames currently contemplated or at all;
|
|
•
|
our ability to anticipate, gauge and respond to market trends and consumer preferences, which may change rapidly, and the market acceptance of new products, including any relaunched or rebranded products;
|
|
•
|
increased competition, consolidation among retailers, shifts in consumers’ preferred distribution channels (including to digital channels) and other changes in the retail, e-commerce and wholesale environment in which we do business and sell our products;
|
|
•
|
changes in law, regulations and policies that affect our business, operations or products;
|
|
•
|
our and our brand partners' and licensors' ability to obtain, maintain and protect the intellectual property rights, including trademarks, brand names and other intellectual property used in their respective businesses, products and software, and their abilities to protect their respective reputations and defend claims by third parties for infringement of intellectual property rights;
|
|
•
|
our ability to implement (and the cost of) the Global Integration Activities, Acquisition Integration Program, the Organizational Redesign restructuring program and the Post-Merger Reorganization (each as defined below) as planned and the success of the programs or any anticipated programs in delivering anticipated improvements and efficiencies;
|
|
•
|
our ability to successfully execute our announced intent to divest and/or discontinue non-core brands and to rationalize wholesale distribution by reducing the amount of product diversion to the value and mass channels;
|
|
•
|
any unanticipated problems, liabilities or other challenges associated with an acquired business which could result in increased risk of new, unanticipated or unknown liabilities, including with respect to environmental, competition and other regulatory matters;
|
|
•
|
our international operations and joint ventures, including reputational, compliance, regulatory, economic and foreign political risks, including difficulties and costs associated with maintaining compliance with a broad variety of complex domestic and international regulations;
|
|
•
|
our dependence on certain licenses, entities performing outsourced functions and third-party suppliers, including third party software providers;
|
|
•
|
administrative, development and other difficulties in meeting the expected timing of market expansions, product launches and marketing efforts;
|
|
•
|
global political and/or economic uncertainties or disruptions, including the impact of Brexit and the new U.S. administration;
|
|
•
|
the number, type, outcomes (by judgment, order or settlement) and costs of legal, tax, regulatory or administrative proceedings, and/or litigation;
|
|
•
|
our ability to manage seasonal and other variability and to anticipate future business trends based on the information available to it under the TSA with respect to the P&G Beauty Business;
|
|
•
|
disruptions in operations, including due to disruptions or consolidation in supply chain, restructurings, manufacturing rights or information systems, labor disputes and natural disasters;
|
|
•
|
restrictions imposed on us through our license agreements and credit facilities and changes in the manner in which we finance our debt and future capital needs, including potential acquisitions;
|
|
•
|
increasing dependency on information technology and our ability to protect against service interruptions, data corruption, cyber-based attacks or network security breaches, costs and timing of implementation and effectiveness of any upgrades to information technology systems, inability to control the quality or level of detail of financial data provided by third parties, and our failure to comply with any privacy or data security laws or to protect against theft of customer, employee and corporate sensitive information;
|
|
•
|
our ability to attract and retain key personnel, including during times of transition and restructurings;
|
|
•
|
the distribution and sale by third parties of counterfeit and/or gray market versions of our products; and
|
|
•
|
other factors described elsewhere in this document and from time to time in documents that we file with the SEC.
|
When used in this Annual Report on Form 10-K, the term “includes” and “including” means, unless the context otherwise indicates, including without limitation. More information about potential risks and uncertainties that could affect our business and financial results is included under the heading “Risk Factors” and “Management’s Discussion and Analysis of Financial Condition and Results of Operations” in this Annual Report on Form 10-K and other periodic reports we have filed and may file with the SEC from time to time.
All forward-looking statements made in this document are qualified by these cautionary statements. These forward-looking statements are made only as of the date of this document, and we do not undertake any obligation, other than as may be required by law, to update or revise any forward-looking or cautionary statements to reflect changes in assumptions, the occurrence of events, unanticipated or otherwise, or changes in future operating results over time or otherwise.
Comparisons of results for current and any prior periods are not intended to express any future trends or indications of future performance unless expressed as such, and should only be viewed as historical data.
Industry, Ranking and Market Data
Unless otherwise indicated, information contained in this Annual Report on Form 10-K concerning our industry and the market in which we operate, including our general expectations about our industry, market position and ranking, market opportunity and market size, is based on data from various sources including internal data and estimates as well as third party sources widely available to the public such as independent industry publications, government publications, reports by market research firms or other published independent sources and on our assumptions based on that data and other similar sources. We did not fund and are not otherwise affiliated with the third party sources that we cite. Industry publications and other published sources generally state that the information contained therein has been obtained from third-party sources believed to be reliable. Internal data and estimates are based upon information obtained from trade and business organizations and other contacts in the markets in which we operate and management’s understanding of industry conditions, and such information has not been verified by any independent sources. This data involves a number of assumptions and limitations, and you are cautioned not to give undue weight to such estimates. While we believe the market, industry and other information included in this Annual Report on Form 10-K to be the most recently available and to be generally reliable, such information is inherently imprecise and we have not independently verified any third-party information or verified that more recent information is not available.
We refer to North America, Western Europe and Japan as “developed markets,” and all other markets as “emerging markets.” We define North America as the United States of America (“U.S.”) and Canada. Except as specifically indicated, all references to rankings are based on retail value market share.
Our fiscal year ends on June 30. Unless otherwise noted, any reference to a year preceded by the word “fiscal” refers to the fiscal year ended June 30 of that year. For example, references to “fiscal
2017
” refer to the fiscal year ended June 30,
2017
. Any reference to a year not preceded by “fiscal” refers to a calendar year.
Item 1.
Business.
Overview
Coty Inc. is one of the world’s largest beauty companies with a purpose to celebrate and liberate the diversity of consumers’ beauty. Founded in 1904, over the years Coty has grown into a multi-segment beauty company with market leading positions in both North America and Europe through new product offerings, diversified sales channels, acquisitions and a global growth strategy. During fiscal 2017, we transformed into a new company with the ambition to be a new leader and challenger in the beauty industry. We acquired certain assets and liabilities related to The Procter & Gamble Company’s (“P&G”) global fine fragrances, salon professional, cosmetics and retail hair color businesses, along with select hair styling brands (the “P&G Beauty Business”), which strengthened and diversified our presence across the countries, categories and channels in which we compete. We also acquired ghd, a premium brand in high-end hair styling appliances, which exposed us to a new product category; entered into a joint venture with Younique LLC (“Younique”), a leading online peer-to-peer social selling platform in beauty, which enhances our direct-to-consumer capabilities through a digital distribution channel; and entered into an agreement to acquire the exclusive long-term global license rights for Burberry Beauty luxury fragrances, cosmetics and skincare, which augments our presence in prestige fragrances, cosmetics and skincare. These acquisitions complement the addition of the personal care and beauty business of Hypermarcas S.A. (the “Hypermarcas Brands”) to our business in fiscal 2016, which further strengthens our position in the Brazilian beauty and personal care category. Following this transformation, in addition to continuing to grow our portfolio through acquisitions and other strategic transactions, we continue to focus on expanding our global brands into new markets and channels through the introduction of new products and the support of established products. Today, we are the global leader in fragrance, a strong number two in professional salon hair color & styling, and number three in color cosmetics.
Segments
We are organized into three divisions, which are also our operating and reportable segments: Consumer Beauty, Luxury and Professional Beauty. Our organizational structure is product category focused, putting the consumer first, by specifically targeting how and where they shop and what and why they purchase. Each division has end-to-end responsibility to optimize the consumers’ beauty experiences in their relevant categories.
Consumer Beauty is primarily focused on color cosmetics, retail hair coloring and styling products, body care and mass fragrances primarily in the mass retail channel, e-commerce and social selling direct-to-consumer platform.
Luxury is primarily focused on prestige fragrances, premium skincare and premium cosmetics across all regions and luxury channels, including travel retail.
Professional Beauty is primarily focused on servicing salon owners and salon professionals in both hair and nail care, covering all key salon segments and salon client needs.
For segment and geographic area financial information and information about our long-lived assets, see Note 4, “Segment Reporting” in the notes to our Consolidated Financial Statements, and for information about recent acquisitions or dispositions of any material amount of assets, see Note 3, “Business Combinations” in the notes to our Consolidated Financial Statements.
1
Brands
The following chart reflects our iconic brand portfolio by segment:
2
Marketing and Sales
We have dedicated marketing and sales forces in most of our significant markets. We believe that local teams dedicated to the commercialization of our brands give us the greatest opportunity to execute our business strategy. We also develop branding and marketing execution strategies with our top customers.
Our marketing strategy varies by brand and market. We have a diverse portfolio of over 75 brands, and we employ different models to create a distinct image and personality suited to each brand’s equity, distribution, product focus and consumer. Each of our brands is promoted with logos, packaging and advertising designed to enhance its image and the uniqueness of each brand. We manage our creative marketing work through a combination of our in-house teams and external agencies that design and produce the sales materials, social media strategies, advertisements and packaging for products in each brand. Our marketing teams are also focused on utilizing our digital marketing agency Beamly’s (“Beamly”) digital social listening and trend spotting capabilities to expand digital marketing of our brands.
One of our strategies is to promote our brands in television, print, outdoor ads, in-store and in-salon displays and to develop and grow promotion on digital and social networks. We also seek editorial coverage for products and brands in both traditional media and digital and social media. We also leverage our relationships with celebrities and on-line influencers to endorse certain of our products.
We are focused on revamping our in-store execution and deploying new brand visuals for certain of our brands. Our marketing efforts benefit from cooperative advertising programs with retailers, often in connection with in-store marketing activities. Such activities are designed to attract consumers to our counters, displays and walls and so that they try, or purchase, our products. We also engage in sampling and “gift-with-purchase” programs designed to stimulate product trials.
Our consolidated expenses for advertising and promotional costs were
$1,883.3
,
$967.6
and
$1,007.7
in fiscal
2017
,
2016
and
2015
, respectively. Our consolidated expenses for total marketing and advertising, which includes trade marketing spend, were $2,493.0, $1,363.9 and $1,470.9 in fiscal 2017, 2016 and 2015, respectively.
Distribution Channels and Retail Sales
We market, sell and distribute our products in over 130 countries and territories. We have a balanced multi-channel distribution strategy which complements our product category focused divisions. The Consumer Beauty division primarily sells products through hypermarkets, supermarkets, drug stores and pharmacies, mid-tier department stores, and traditional food and drug retailers. Certain products are sold through our own branded e-commerce websites and direct to consumer websites and third party operated e-commerce websites. The Luxury division primarily sells products through prestige retailers, including upscale perfumeries, upscale department stores and duty-free shops, with travel retail sales channels accounting for 14% of the division’s net revenues. The Professional Beauty division primarily sells products to nail and hair salons, nail and hair professionals and professionals stores. We also sell our products through third-party distributors in countries and territories where we do not have direct distribution. In fiscal 2017, no retailer accounted for more than 10% of our global net revenues; however, certain retailers accounted for more than 10% of net revenues within certain geographic markets and segments. In fiscal 2017, Wal-Mart, our top retailer, accounted for 7% of our net revenues.
Research and Development
Research and development is a pillar of our innovation. Select key new product developments included
COVERGIRL
So Lashy,
Rimmel
Brow Shake Brow Filling Powder and
Bourjois
Rouge Lacque Lip for Consumer Beauty,
System Professional
care line,
Wella
Professionals’ Les beige shades on Koleston Perfect and Color Touch,
Wella
Professionals Fusion care line for Professional Beauty, and
Gucci
Bloom and
philosophy
purity pore extractor for Luxury.
We continuously seek to improve our products through research and development and strive to provide the consumer with the best possible products. Our research and development teams work with our marketing and operations teams, as well as our internal digital agency, Beamly, to identify recent trends and consumer needs and to bring products quickly to market. Additionally, our basic and applied research groups, which conduct longer-term research such as “blue sky” research, seek to develop proprietary new technologies for first-to-market products and for improving existing products. This research and development is done both internally and through affiliations with various universities, technical centers, supply partners, industry associations and technical associations. As of June 30, 2017, we owned approximately 3000 patents and patent applications globally.
Our principal research and development centers are located in the U.S. and Europe. See “Item 2. Properties.”
3
We do not perform, nor do we commission any third parties on our behalf to perform, testing of our products or ingredients on animals except where required by law.
Manufacturing and Related Operations and Raw Materials
We manufactured approximately 82% of our products in fiscal 2017, primarily in the United States, Europe and Brazil. Our manufacturing facilities provide multi-segment manufacturing. We recognize the importance of our employees at our manufacturing facilities and have in place programs designed to ensure operating safety. In addition, we implement programs designed to ensure that our manufacturing and distribution facilities comply with applicable environmental rules and regulations. To capitalize on innovation and other supply chain benefits, we continue to utilize a network of third-party manufacturers on a global basis. In connection with the acquisition of the P&G Beauty Business, we have incurred and expect to continue to incur operating expenses, including restructuring and related costs aimed at integrating and optimizing the combined organization (“Global Integration Activities”). For more information about the Global Integration Activities, please refer to “Management’s Discussion and Analysis of Financial Condition and Results of Operations—Operating (Loss) Income—Restructuring and Other Business Realignment Costs” and Note 6 “Restructuring Costs” in the notes to our Consolidated Financial Statements.
The principal raw materials used in the manufacture of our products are primarily essential oils, alcohols and specialty chemicals. The essential oils in our fragrance products are generally sourced from fragrance houses. As a result, we realize material cost savings and benefits from the technology, innovation and resources provided by these fragrance houses.
We purchase the raw materials for all our products from various third parties. We also purchase packaging components that are manufactured to our design specifications. We collaborate with our suppliers to meet our stringent design and creative criteria. We believe that we currently have adequate sources of supply for all our products. We have not experienced material disruptions in our supply chain in the past, and we believe we have robust practices in place to respond to potential disruptions in our supply chain. In fiscal 2017, no single supplier accounted for more than 10% of the materials used in the manufacture of our products.
We have established a global distribution network designed to meet the changing demands of our customers while maintaining service levels. We are continuing to evaluate and restructure our physical distribution network to improve utilization, increase efficiency and reduce our order lead times.
Competition
We compete against a number of manufacturers and marketers of fragrances, color
cosmetics, hair care, salon professional and personal care products. In addition to the established multinational brands against which we compete, small targeted niche brands continue to enter the beauty market. Competition is also increasing from private label products sold by apparel retailers and mass distribution retailers.
We believe that we compete primarily on the basis of perceived value, including pricing and innovation, service to the consumer, promotional activities, advertising, special events, new product introductions, e-commerce and mobile-commerce initiatives, direct sales and other activities (including influencers). It is difficult for us to predict the timing, scale and effectiveness of our competitors’ actions in these areas or the timing and impact of new entrants into the marketplace.
Intellectual Property
We generally own the trademark rights in key sales countries in Trademark International Class 3 (covering cosmetics and perfumery) for use in connection with, among others, the following brands:
Astor
,
Bourjois
,
Clairol
,
Coty
,
COVERGIRL
,
Joop!
,
Jovan
,
Lancaster
,
Manhattan
,
Max Factor
,
Nioxin
,
N.Y.C. New York Color
,
OPI
,
philosophy
,
Rimmel
,
Sally Hansen
,
System Professional
and
Wella
. We license trademarks for the balance of our material product lines, and we are generally the exclusive trademark licensee for all Class 3 trademarks as used in connection with our products. We or our licensors, as the case may be, actively protect the trademarks used in our principal products in the U.S. and significant markets worldwide. We consider the protection of our trademarks to be essential to our business.
A number of our products also incorporate patented, patent-pending or proprietary technology in their respective formulations and/or packaging, and in some cases our product packaging is subject to copyright, trade dress or design protection. While we consider our patents and copyrights, and the protection thereof, to be important, no single patent or copyright, or group of patents or copyrights, is material to the conduct of our business. Products representing a significant portion of our net revenues are manufactured and marketed under exclusive license agreements granted to us for use on a
4
worldwide and/or regional basis. As of June 30, 2017, we maintained 37 brand licenses. In fiscal 2017, 39% of our net revenues were generated from licensed brands.
Our licenses impose obligations and restrictions on us that we believe are common to many licensing relationships in the beauty industry, such as paying annual royalties on net sales of the licensed products and maintaining the quality of the licensed products and the image of the applicable trademarks. We are currently in material compliance with all terms of our brand license agreements.
Most brand licenses have renewal options for one or more terms, which can range from three to ten years. Certain brand licenses provide for automatic extensions, so long as minimum annual royalty payments are made, while renewal of others is contingent upon attaining of specified sales levels. Seven of our brand licenses expire during fiscal 2018. For additional risks associated with our licensing arrangements, see “Risk Factors—Our brand licenses may be terminated if specified conditions are not met” and “Risk Factors—Our failure to protect our reputation, or the failure of our partners or brand licensors to protect their reputations, could have a material adverse effect on our brand images”.
Employees
As of June 30, 2017, we had approximately 22,000 full-time employees in over 46 countries. In addition, we employ a large number of seasonal contractors during our peak manufacturing and promotional season. We recognize the importance of our employees to our business and believe our relationship with our employees is satisfactory.
Our employees in the U.S. are not covered by collective bargaining agreements. Our employees in certain countries in Europe are subject to works council arrangements. We have not experienced a material strike or work stoppage in the U.S. or any other country where we have a significant number of employees.
Government Regulation
We and our products are subject to regulation by various U.S. federal regulatory agencies as well as by various state and local regulatory authorities and by the applicable regulatory authorities in the countries in which our products are produced or sold. Such regulations principally relate to the ingredients, labeling, manufacturing, packaging, advertising and marketing and sales and distribution
of our products. Because we have commercial operations overseas, we are subject to the U.S. Foreign Corrupt Practices Act (the “FCPA”) as well as other countries’ anti-corruption and anti-bribery regimes, such as the U.K. Bribery Act.
We are also subject to numerous foreign, federal, provincial, state, municipal and local environmental, health and safety laws and regulations relating to, among other matters, safe working conditions, product stewardship and environmental protection, including those relating to emissions to the air, discharges to land and surface waters, generation, handling, storage, transportation, treatment and disposal of hazardous substances and waste materials, and the registration and evaluation of chemicals. We maintain policies and procedures to monitor and control environmental, health and safety risks, and to monitor compliance with applicable environmental, health and safety requirements. Compliance with such laws and regulations pertaining to the discharge of materials into the environment, or otherwise relating to the protection of the environment, has not had a material effect upon our capital expenditures, earnings or competitive position. However, environmental and social responsibility laws and regulations have tended to become increasingly stringent and, to the extent regulatory changes occur in the future, they could result in, among other things, increased costs and risks of non-compliance for us. For example, certain states in the U.S., such as California, and the U.S. Congress have proposed legislation relating to chemical disclosure and other requirements related to the content of our products. For more information, see “Risk Factors—Changes in laws, regulations and policies that affect our business or products could adversely affect our business, financial condition and results of operations.”
Seasonality
Our sales generally increase during our second fiscal quarter as a result of increased demand by retailers associated with the holiday season. We also experience an increase in sales during our fourth quarter in our Professional Beauty segment as a result of stronger activity prior to the summer holiday season. Working capital requirements, sales, and cash flows generally experience variability during the three to six months preceding the holiday period due in part to product innovations and new product launches and the size and timing of certain orders from our customers. While we continue to attempt to reduce this seasonality, sales volume is, by its nature, difficult to forecast.
We generally experience peak inventory levels from July to October and peak receivable balances from September to December. During the months of November, December and January of each year, cash is normally generated as customer payments for holiday season orders are received.
5
In response to this seasonality and other factors, management has implemented various working capital programs aimed at optimizing the effectiveness of our inventories, customer receivables and accounts payable. For example, to improve inventory productivity, we have worked to enhance our sales and operational planning forecasting processes. To improve accounts payable efficiency, we have commenced a harmonization of our vendor management practices across geographies to optimize our payments to vendors. For more information, see “Risk Factors—Our business is subject to seasonal variability.”
Availability of Reports
We make available financial information, news releases and other information on our website at www.coty.com. There is a direct link from our website to our Securities and Exchange Commission (“SEC”) filings via the EDGAR database at www.sec.gov, where our annual reports on Form 10-K, quarterly reports on Form 10-Q, current reports on Form 8-K and any amendments to these reports filed or furnished pursuant to Section 13(a) or 15(d) of the Securities Exchange Act of 1934, as amended, are available free of charge as soon as reasonably practicable after we file such reports and amendments with, or furnish them to, the SEC. Stockholders may also contact Investor Relations at 350 Fifth Avenue, New York, New York 10118 or call 212-389-7300 to obtain hard copies of these filings without charge.
Item 1A.
Risk Factors.
You should consider the following risks and uncertainties and all of the other information in this Annual Report on Form 10-K and our other filings in connection with evaluating our business and the forward-looking information contained in this Annual Report on Form 10-K. Our business and financial results may also be adversely affected by risks and uncertainties not presently known to us or that we currently believe to be immaterial. If any of the events contemplated by the following discussion of risks should occur or other risks arise or develop, our business, prospects, financial condition, results of operations, cash flows, as well as the trading price of our securities, may be materially and adversely affected. When used in this discussion, the term “includes” and “including” means, unless the context otherwise indicates, including without limitation and the terms “Coty,” the “Company,” “we,” “our,” or “us” mean, unless the context otherwise indicates, Coty Inc. and its majority and wholly-owned subsidiaries.
The beauty industry is highly competitive, and if we are unable to compete effectively, our business, prospects, financial condition and results of operations could suffer.
The beauty industry is highly competitive and can change rapidly due to consumer preferences and industry trends, such as the expansion of digital channels. Competition in the beauty industry is based on several factors, including pricing, value and quality, packaging and brands, speed or quality of innovation and new product introductions, in-store presence and visibility, promotional activities and brand recognition, distribution channels, advertising, editorials and e-commerce and mobile-commerce initiatives. Our competitors include large multinational consumer products companies, private label brands and emerging companies, among others, and some have greater resources than we do or may be able to respond more quickly or effectively to changing business and economic conditions than we can. It is difficult for us to predict the timing and scale of our competitors’ actions and their impact on the industry or on our business. For example, the fragrance category is being influenced by new product introductions, niche brands and growing e-commerce distribution, and the nail category in the U.S. by lower cost brands, which have increased pricing pressure and shifts in consumer preference away from certain traditional formulations. The color cosmetics category has been influenced by entry by new competitors and smaller competitors that are fast to respond to trends and engage with their customers through digital platforms and innovative in-store activations. In addition, the hair color category is being influenced by new product introductions in the premium category and innovations by competitors to meet growing category needs. If we are unable to compete effectively on a global basis or in our key product categories or geographies, it could have an adverse impact on our business, prospects, financial condition, results of operations, cash flows, as well as the trading price of our securities.
Further consolidation in the retail industry and shifting preferences in how and where consumers shop may adversely affect our business, prospects, financial condition and results of operations.
Significant consolidation in the retail industry has occurred during the last several years. The trend toward consolidation, particularly in developed markets such as the U.S. and Western Europe, has resulted in our becoming increasingly dependent on our relationships with, and the overall business health of, fewer key retailers that control an increasing percentage of retail locations, which trend may continue. For example,
certain retailers account for over 10% of our net revenues in certain geographies, including the U.S. Our success is dependent on our ability to manage our retailer relationships, including offering trade terms on mutually acceptable terms. Furthermore, increased online competition and declining in-store traffic has resulted, and may continue to result, in brick-and-mortar retailers closing physical stores, which could negatively impact our distribution strategies and/or sales if such retailers decide to significantly reduce their inventory levels for our products or to designate more floor space to our competitors. Further consolidation and store closures could have a material adverse effect on our business, prospects, financial condition, results of operations, cash flows, as well as the trading price of our securities. We generally do not have long-term sales contracts or other sales assurances with our retail customers.
6
Consumer shopping preferences have also shifted, and may continue to shift in the future, to distribution channels other than traditional retail in which we have more limited experience, presence and development, such as direct sales and e-commerce. In addition, our entry into new categories and geographies has exposed, and may continue to expose, us to new distribution channels or risks about which we have less experience. If we are not successful in developing and utilizing these channels or other channels that future consumers may prefer, we may experience lower than expected revenues.
Changes in industry trends and consumer preferences could adversely affect our business, prospects, financial condition and results of operations.
Our success depends on our products’ appeal to a broad range of consumers whose preferences cannot be predicted with certainty and may change rapidly, and on our ability to anticipate and respond in a timely and cost-effective manner to industry trends through product innovations, product line extensions and marketing and promotional activities, among other things. Product life cycles and consumer preferences continue to be affected by the rapidly increasing use and proliferation of social and digital media by consumers, and the speed with which information and opinions are shared. As product life cycles shorten, we must continually work to develop, produce, and market new products and maintain and enhance the recognition of our brands. For example, the mass fragrance category performance has been declining due to, we believe, the shortening of fame longevity for celebrities and channel limitations for in-store displays.
In addition, net revenues and margins on beauty products tend to decline as they advance in their life cycles, so our net revenues and margins could suffer if we do not successfully and continuously develop new products. This product innovation also can place a strain on our employees and our financial resources, including possibly incurring expenses in connection with product innovation and development, marketing and advertising that are not subsequently supported by a sufficient level of sales. Furthermore, we cannot predict how consumers will react to any new products that we launch. The amount of positive or negative sales contribution of any of our products may change significantly within a period or from period to period. The above-referenced factors, as well as new product risks, could have an adverse effect on our business, prospects, financial condition, results of operations, cash flows, as well as the trading price of our securities.
Our success depends on our ability to achieve our global business strategies.
Our future growth depends on our ability to successfully implement our global business strategies, which includes leveraging the strength and scale of the combined company and combining new organic growth opportunities with a well-targeted acquisition strategy to strive to become, over time, the global industry leader by being a clear challenger in beauty, and delighting our consumers which we believe should ultimately translate into revenue growth, strong cash flow and the creation of long-term shareholder value. Achieving our global business strategies will require investment in new capabilities, products and brands, categories, distribution channels, technologies and emerging and more mature geographies and beauty markets. These investments may result in short-term costs without any current revenues and, therefore, may be dilutive to our earnings and negatively impact our cash flows. We will also seek to reduce fixed costs, which may be unpredictable in periods following acquisitions as we implement our integration efforts and undertake other cost efficiency measures.
In addition, we have identified our non-core portfolio brands, representing approximately 6% to 8% of combined legacy Coty and P&G Beauty Business net revenues on a full year basis for fiscal 2017, and are exploring alternatives for these brands, including divestiture. We are likely to dispose of or discontinue select brands and/or streamline operations in the future, and incur costs or restructuring and/or other charges in doing so. We may face risks of declines in brand performance and license terminations, due to allegations of breach or for other reasons, including with regard to our potentially divested or discontinued brands. If and when we decide to divest or discontinue any brands or lines of business, we cannot be sure that we will be able to locate suitable buyers or that we will be able to complete such divestitures or discontinuances successfully, timely, on commercially advantageous terms or without significant costs, including relating to any post-closing purchase price adjustments or claims for indemnification. Activities associated with any divestiture or discontinuance may also divert significant financial, operational and managerial resources from our existing operations, and make it more difficult to achieve our operating and strategic objectives. We also cannot be sure of the effect such divestitures or discontinuances would have on the performance of our remaining business or ability to execute our global strategies.
Although we believe that our strategy will lead to long-term growth in revenue and profitability, we may not realize, in full or in part, the anticipated benefits. The failure to realize benefits, which may be due to our inability to execute plans, global or local economic conditions, competition, changes in the beauty industry and the other risks described herein, could have a material adverse effect on our business, prospects, financial condition, results of operations, cash flows, as well as the trading price of our securities.
7
We have incurred significant costs associated with the acquisition of the P&G Beauty Business (the “Transactions”) that could affect our period-to-period operating results, and we may not realize the benefits that we expect from our Post-Merger Reorganization (as defined below).
We anticipate that we will incur a total of approximately $1.2 billion of operating expenses and capital expenditures of approximately $500 million in connection with the Transactions. Through June 30, 2017, we incurred life-to-date operating expenses and capital expenditures against these estimates of approximately $850 million and $250 million, respectively, and we expect the remaining operating expenses, including any anticipated restructuring activities, and capital expenditures to be incurred in future periods through fiscal 2020. Some of the factors affecting the costs associated with the Transactions and potential impact on our operations and financials, include the length of time during which the remaining transitions services are provided to us by P&G, the resources required in optimizing the integration of the P&G Beauty Business with our existing businesses following the termination of the transition services provided to us by P&G, management and employee changes, reliance on financial and other data from P&G and integration of IT systems and the integration of employees in jurisdictions where we did not previously have operations. Due to the Transactions, we have significantly more sales, assets and employees, and, as a result, a higher fixed cost base, than we did prior to the Transactions. The integration process has required us to expand the scope of our operations and financial, accounting and control systems. Our management has been, and will continue to be, required to devote a substantial amount of time and attention to the process of integrating Galleria with our business operations, which has diverted attention from ongoing operations of both our legacy Coty business and the P&G Beauty Business and has affected our period-to-period operating results. If our management is not able to effectively manage the integration process, address fixed and other costs, or if any significant business activities are interrupted as a result of the integration process, our business, prospects, financial condition, results of operations, cash flows, as well as the trading price of our securities may be materially adversely affected. In addition, we intend to complete the exit of our transition services agreement with P&G in calendar year 2017. We can provide no assurances that we will be able to anticipate future business trends based on the information available to us under the terms of the transition services agreement or that we will be able to successfully manage integration and operation of the P&G Beauty Business thereafter, which could increase costs and management distraction. The amount and timing of the above-referenced charges and management distraction could further adversely affect our business, prospects, financial condition, results of operations, cash flows, as well as the trading price of our securities.
Moreover, following the close of the Transactions on October 1, 2016, we reorganized our business into three new divisions: Luxury, Consumer Beauty and Professional Beauty (the “Post-Merger Reorganization”). The successful implementation of our Post-Merger Reorganization presents significant organizational challenges and uncertainties and requires successful negotiations with third parties, including labor organizations, suppliers, distributors and other business partners. We may not be successful in these negotiations. As a result, we may not be able to realize the anticipated benefits from our Post-Merger Reorganization. Events and circumstances such as financial or strategic difficulties, unexpected employee turnover and delays may occur or continue, resulting in new, unexpected or increased costs that could result in us not realizing all of the anticipated benefits on our expected timetable or at all. Any failure to implement the Post-Merger Reorganization in accordance with our expectations could adversely affect our business, prospects, financial condition, results of operations, cash flows, as well as the trading price of our securities.
Our new product introductions may not be as successful as we anticipate, which could have a material adverse effect on our business, prospects, financial condition and results of operations.
We must continually work to develop, produce and market new products and maintain a favorable mix of products in order to respond in an effective manner to changing consumer preferences. We continually develop our approach as to how and where we market and sell our products. In addition, we believe that we must maintain and enhance the recognition of our brands, which may require us to quickly and continuously adapt in a highly competitive industry to deliver desirable products to our consumers. In particular, we intend to launch new initiatives to rebrand certain brands, particularly in Consumer Beauty. There is no assurance that these or other initiatives will be successful and, if they are not, our business, prospects, financial condition, results of operations, cash flows, as well as the trading price of our securities could be adversely impacted.
We have a specific process for the continuous development and evaluation of new product concepts, however, each new product launch carries risks. For example, we may incur costs exceeding our expectations, our advertising, promotional and marketing strategies may be less effective than planned or customer purchases may not be as high as anticipated. In addition, we may experience a decrease in sales of certain of our existing products as a result of consumer preferences shifting to our newly-launched products or to the products of our competitors as a result of unsuccessful or unpopular product launches harming our brands. Any of these could have a material adverse effect on our business, prospects, financial condition, results of operations, cash flows, as well as the trading price of our securities.
As part of our ongoing business strategy we expect that we will need to continue to introduce new products in our traditional product categories, while also expanding our product launches into adjacent categories in which we may have little to no operating experience. For example, we acquired professional and retail hair brands in connection with the Transactions,
8
recently purchased a premium brand in high-end hair styling and appliances and entered into a joint venture with an online peer-to-peer social selling platform in beauty, all of which are new product categories and channels for us. The success of product launches in adjacent product categories could be hampered by our relative inexperience operating in such categories, the strength of our competitors or any of the other risks referred to herein. Our inability to introduce successful products in our traditional categories or in these or other adjacent categories could limit our future growth and have a material adverse effect on our business, prospects, financial condition, results of operations, cash flows, as well as the trading price of our securities.
We may not be able to identify suitable acquisition targets and our acquisition activities and other strategic transactions may present managerial, integration, operational and financial risks, which may prevent us from realizing the full intended benefit of the acquisitions we undertake.
Our acquisition activities and other strategic transactions expose us to certain risks related to integration, including diversion of management attention from existing core businesses and substantial investment of resources to support integration. During the past several years, we have explored and undertaken opportunities to acquire other companies and assets as part of our growth strategy. For example, we completed the acquisition of the Hypermarcas Brands in February 2016, acquired the P&G Beauty Business in October 2016 and ghd in November 2016 and entered into a joint venture with Younique in February 2017. These assets represent a significant portion of our net assets, particularly the P&G Beauty Business. We continue to seek acquisitions that we believe strengthen our competitive position in our key segments and geographies or accelerate our ability to grow into adjacent product categories or emerging markets or which otherwise fit our strategy. There can be no assurance that we will be able to identify suitable acquisition candidates, be the successful bidder or consummate acquisitions on favorable terms or otherwise realize the full intended benefit of such transactions.
The assumptions we use to evaluate acquisition opportunities may not prove to be accurate, and intended benefits may not be realized. Our due diligence investigations may fail to identify all of the problems, liabilities or other challenges associated with an acquired business which could result in increased risk of unanticipated or unknown issues or liabilities, including with respect to environmental, competition and other regulatory matters. As a result, we may not achieve some or any of the benefits, including anticipated synergies or accretion to earnings, that we expect to achieve in connection with our acquisitions, including the Transactions, or we may not accurately anticipate the fixed and other costs associated with such acquisitions, which may materially adversely affect our business, prospects, financial condition, results of operations, cash flows, as well as the trading price of our securities. Any financing for an acquisition could increase our indebtedness or result in a potential violation of the debt covenants under our existing facilities requiring consent or waiver from our lenders, which could delay or prevent the acquisition, or dilute the interests of our stockholders. For example, in connection with the Transactions, Green Acquisition Sub Inc., a wholly-owned subsidiary of the Company, was merged with and into Galleria Co., with Galleria continuing as the surviving corporation and a direct wholly-owned subsidiary of the Company (the “Merger”) and pre-Merger holders of our stock were diluted to 46% of the fully diluted shares of common stock immediately following the Merger. In addition, acquisitions of foreign businesses, new entrepreneurial businesses and businesses in new distribution channels, such as our acquisition of the Hypermarcas Brands, Younique and ghd, entail certain particular risks, including potential difficulties in geographies and channels in which we lack a significant presence, difficulty in seizing business opportunities compared to local or other global competitors, difficulty in complying with new regulatory frameworks, the adverse impact of fluctuating exchange rates and entering lines of business where we have limited or no direct experience. See “—Fluctuations in currency exchange rates may negatively impact our financial condition and results of operations” and “—We are subject to risks related to our international operations.”
We face risks associated with our joint ventures.
We are party to several joint ventures in both the U.S. and abroad. Going forward, we may acquire interests in more joint venture enterprises to execute our business strategy by utilizing our partners’ skills, experiences and resources. These joint ventures involve risks that our joint venture partners may:
|
•
|
have economic or business interests or goals that are inconsistent with or adverse to ours;
|
|
•
|
take actions contrary to our requests or contrary to our policies or objectives, including actions that may violate applicable law;
|
|
•
|
be unable or unwilling to fulfill their obligations under the relevant joint venture agreements;
|
|
•
|
have financial difficulties; or
|
|
•
|
have disputes with us as to the scope of their rights, responsibilities and obligations.
|
In certain cases, joint ventures may present us with a lack of ability to fully control all aspects of their operations, including due to veto rights, and we may not have full visibility with respect to all operations, customer relations and compliance practices, among others.
9
Our present or future joint venture projects may not be successful. We have had, and cannot assure you that we will not in the future have, disputes or encounter other problems with respect to our present or future joint venture partners or that we will be able to resolve such disputes and solve such problems in a timely manner or on favorable economic terms, or at all. Any failure by us to address these potential disputes or conflict of interests effectively could have a material adverse effect on our business, prospects, financial condition, results of operations, cash flows, as well as the trading price of our securities.
If we are unable to obtain, maintain and protect our intellectual property rights, in particular trademarks, patents and copyrights, or if our brand partners and licensors are unable to maintain and protect their intellectual property rights that we use in connection with our products, our ability to compete could be negatively impacted.
Our intellectual property is a valuable asset of our business. Although certain of the intellectual property we use is registered in the U.S. and in many of the foreign countries in which we operate, there can be no assurances with respect to such intellectual property rights, including our ability to further register, use or defend key current or future trademarks. Further, applicable law may provide only limited and uncertain protection, particularly in emerging markets, such as China.
Furthermore, we may fail to apply for, or be unable to obtain, intellectual property protection for certain aspects of our business. Third parties have in the past and could in the future bring infringement, invalidity, co-inventorship, re-examination, opposition or similar claims with respect to our current or future intellectual property. Any such claims, whether or not successful, could be costly to defend, may not be sufficiently covered by any indemnification provisions to which we are party, divert management’s attention and resources, damage our reputation and brands, and substantially harm our business, prospects, financial condition, results of operations, cash flows, as well as the trading price of our securities. Patent expirations may also affect our business. As patents expire, competitors may be able to legally produce and market products similar to the ones that were patented, which could have a material adverse effect on our business, prospects, financial condition, results of operations, cash flows, as well as the trading price of our securities.
In addition, third parties may illegally distribute and sell counterfeit versions of our products, which may be inferior or pose safety risks and could confuse consumers, which could cause them to refrain from purchasing our brands in the future or otherwise damage our reputation. In recent years, there has been an increase in the availability of counterfeit goods, including fragrances, in various markets by street vendors and small retailers, as well as on the Internet. The presence of counterfeit versions of our products in the market and of prestige products in mass distribution channels could also dilute the value of our brands, force us and our distributors to compete with heavily discounted products, cause us to be in breach of contract or otherwise have a negative impact on our reputation and business, prospects, financial condition or results of operations. We are rationalizing our wholesale distribution and continue efforts to reduce the amount of product diversion to the value and mass channels, however, stopping such commerce could result in a potential adverse impact to our sales and net revenues, including to those customers who are selling our products to unauthorized retailers, or an increase in returns over historical levels.
In order to protect or enforce our intellectual property and other proprietary rights, we may initiate litigation or other proceedings against third parties, such as infringement suits, opposition proceedings or interference proceedings. Any lawsuits or proceedings that we initiate could be expensive, take significant time and divert management’s attention from other business concerns, adversely impact customer relations and we may not be successful. Litigation and other proceedings may also put our intellectual property at risk of being invalidated or interpreted narrowly. The occurrence of any of these events may have a material adverse effect on our business, prospects, financial condition, results of operations, cash flows, as well as the trading price of our securities.
In addition, many of our products bear, and the value of our brands is affected by, the trademarks and other intellectual property rights of our brand and joint venture partners and licensors. Our brand and joint venture partners’ and licensors’ ability to maintain and protect their trademark and other intellectual property rights is subject to risks similar to those described above with respect to our intellectual property. We do not control the protection of the trademarks and other intellectual property rights of our brand and joint venture partners and licensors and cannot ensure that our brand and joint venture partners and licensors will be able to secure or protect their trademarks and other intellectual property rights, which could have a material adverse effect on our business, prospects, financial condition, results of operations, cash flows, as well as the trading price of our securities.
Our success depends on our ability to operate our business without infringing, misappropriating or otherwise violating the intellectual property of third parties.
Our commercial success depends in part on our ability to operate without infringing, misappropriating or otherwise violating the trademarks, patents, copyrights and other proprietary rights of third parties. However, we cannot be certain that the conduct of our business does not and will not infringe, misappropriate or otherwise violate such rights. Moreover, our acquisition targets and other businesses in which we make strategic investments are often smaller or younger companies with less robust intellectual property clearance practices, and we may face challenges on the use of their trademarks and other proprietary rights. For example, we are facing oppositions to our use of the “Younique” mark, including in the U.S. and Europe. If we are found to be infringing, misappropriating or otherwise violating a third party trademark, patent, copyright or other
10
proprietary rights, we may need to obtain a license, which may not be available in a timely manner on commercially reasonable terms or at all, or redesign or rebrand our products, which may not be possible or result in a significant delay to market or otherwise have an adverse commercial impact. We may also be required to pay substantial damages or be subject to a court order prohibiting us and our customers from selling certain products or engaging in certain activities, which could therefore have a material adverse effect on our business, prospects, financial condition, results of operations, cash flows, as well as the trading price of our securities.
Our goodwill and other assets have been subject to impairment and may continue to be subject to impairment in the future.
We are required, at least annually, to test goodwill and indefinite intangible assets to determine if any impairment has occurred. Impairment may result from various factors, including adverse changes in assumptions used for valuation purposes, such as actual or projected revenue growth rates, profitability or discount or interest rates. If the testing indicates that an impairment has occurred, we are required to record a non-cash impairment charge for the difference between the carrying value of the goodwill or indefinite intangible assets and the implied fair value of the goodwill or the fair value of indefinite intangible assets.
We cannot predict the amount and timing of any future impairments, if any. We have experienced impairment charges with respect to goodwill, intangible assets or other items in connection with past acquisitions, and we may experience such charges in connection with recent and future acquisitions. Any future impairment of our goodwill or other intangible assets could have an adverse effect on our business, prospects, financial condition, results of operations, cash flows, as well as the trading price of our securities. For a further discussion of our impairment testing, please refer to “Management’s Discussion and Analysis of Financial Condition and Results of Operations—Financial Condition—Liquidity and Capital Resources—Goodwill, Other Intangible Assets and Long-Lived Assets”.
A general economic downturn, credit constriction, uncertainty in global economic or political conditions or other global events or a sudden disruption in business conditions may affect consumer spending, which could adversely affect our financial results.
Global events may impact our business, prospects, financial condition, results of operations, cash flows, as well as the trading price of our securities. Weak economic environments in Europe, China, the U.S. or elsewhere could affect the demand for our products and may result in longer sales cycles, slower acceptance of new products and increased competition for sales. For example, the weak economic environment in the U.S. and Europe has contributed to declines in the retail nail, color cosmetics and hair color categories in the U.S. and mass fragrance in Western Europe and the U.S. Deterioration of social or economic conditions in Europe or elsewhere could also impair collections on accounts receivable. For example, the June 23, 2016 referendum in the U.K. in which voters approved an exit from the E.U., commonly referred to as “Brexit,” and subsequent initiation of formal withdrawal procedures by the U.K. government has caused significant volatility in the financial and credit markets and may impact consumer spending and economic conditions generally in Europe. The global markets and currencies have been adversely impacted, including a sharp decline in the value of the British pound as compared to the U.S. dollar. Volatility in exchange rates resulting from Brexit is expected to continue at least in the short term as the U.K. continues to negotiate its exit from the E.U. Although it is unknown what those terms will be, it is possible that there will be greater restrictions on imports and exports between the U.K. and E.U. countries and increased regulatory complexities. These changes may adversely affect our operations and financial results. See “—We are subject to risks related to our international operations.” Further, the impact of recent political and economic developments in the United States, the U.K. and Europe, including the change in administration in the U.S., and the results of several 2017 elections in European nations are uncertain. These political and economic developments could result in changes to legislation or reformation of government policies, rules and regulations pertaining to trade. Such changes could have a significant impact on our business by increasing the cost of doing business, affecting our ability to sell our products and negatively impacting our profitability.
In addition, our sales are affected by the overall level of consumer spending. The general level of consumer spending is affected by a number of factors, including general economic conditions, inflation, interest rates, energy costs and consumer confidence, each of which is beyond our control. Consumer purchases of discretionary and other items and services, including beauty products, tend to decline during recessionary periods and otherwise weak economic environments, when disposable income is lower. A decline in consumer spending may have a negative impact on our direct sales and could cause financial difficulties at our retailer and other customers. If consumer purchases decrease, we may not be able to generate enough cash flow to meet our debt obligations and other commitments and may need to refinance our debt, dispose of assets or issue equity to raise necessary funds. We cannot predict whether we would be able to undertake any of these actions to raise funds on a timely basis or on satisfactory terms or at all. The financial difficulties of a customer or retailer could also cause us to curtail or eliminate business with that customer or retailer. We may also decide to assume more credit risk relating to the receivables from our customers or retailers, which increases the possibility of late or non-payment of receivables. Our inability to collect receivables from a significant retailer or customer, or from a group of these customers, could have a material adverse effect on our business, prospects, results of operations, financial condition, results of operations, cash flows, as well as the trading price
11
of our securities. If a retailer or customer were to go into liquidation, we could incur additional costs if we choose to purchase the retailer’s or customer’s inventory of our products to protect brand equity.
Volatility in the financial markets could have a material adverse effect on our business, prospects, financial condition, results of operations, cash flows, as well as the trading price of our securities.
While we currently generate significant cash flows from our ongoing operations and have access to global credit markets through our various financing activities, credit markets may experience significant disruptions. Deterioration in global financial markets could make future financing difficult or more expensive. If any financial institutions that are parties to our credit facilities or other financing arrangements, such as interest rate or foreign currency exchange hedging instruments, were to declare bankruptcy or become insolvent, they may be unable to perform under their agreements with us. This could leave us with reduced borrowing capacity or could leave us unhedged against certain interest rate or foreign currency exposures, which could have an adverse impact on our business, prospects, financial condition, results of operations, cash flows, as well as the trading price of our securities.
Fluctuations in currency exchange rates may negatively impact our financial condition and results of operations.
Exchange rate fluctuations have affected and may in the future affect our results of operations, financial condition, reported earnings, the value of our foreign assets, the relative prices at which we and foreign competitors sell products in the same markets and the cost of certain inventory and non-inventory items required by our operations. The currencies to which we are exposed include
the euro, the British pound, the Chinese yuan, the Polish zloty, the Russian ruble, the Brazilian real, the Australian dollar and the Canadian dollar. The exchange rates between these currencies and the U.S. dollar in recent years have fluctuated significantly and may continue to do so in the future. A depreciation of these currencies against the U.S. dollar would decrease the U.S. dollar equivalent of the amounts derived from foreign operations reported in our consolidated financial statements and an appreciation of these currencies would result in a corresponding increase in such amounts. The cost of certain items, such as raw materials, transportation and freight, required by our operations may be affected by changes in the value of the various relevant currencies. To the extent that we are required to pay for goods or services in foreign currencies, the appreciation of such currencies against the U.S. dollar would tend to negatively impact our financial condition and results of operations. We hedge certain exposures to foreign currency exchange rates arising in the ordinary course of business in order to mitigate the effect of such fluctuations.
Our debt facilities require us to comply with specified financial covenants that may restrict our current and future operations and limit our flexibility and ability to respond to changes or take certain actions.
We remain dependent upon others for our financing needs, and our debt agreements, including the Coty Credit Agreement and the Galleria Credit Agreement (collectively, the “Debt Agreements”), each contain covenants that could constrain execution of our business strategies and growth plans. These covenants include a requirement that we maintain specific financial ratios (including with respect to Total Indebtedness to Adjusted EBITDA (each as defined within the Debt Agreements)) and meet certain restrictions with respect to the incurrence of indebtedness, guarantees and liens, sales of certain assets, consolidations and mergers, acquisitions, investments, loans and advances, swap agreements, dividends and distributions, burdensome agreements, amendments of material debt documents and affiliate transactions. Our ability to comply with these covenants is affected by our business performance, including our indebtedness, operating performance and profitability, and may be affected by events beyond our control, including prevailing economic, financial and industry conditions. A breach of any of these covenants could result in a default under the Debt Agreements. If a default under the Debt Agreements is not cured or waived, the default could result in the acceleration of debt under the Debt Agreements that contain cross-acceleration or cross-default provisions, which could require us to repay debt prior to the date it is otherwise due and that could adversely affect our business, prospects, financial condition, results of operations, cash flows, as well as the trading price of our securities.
In addition, our debt service obligations may increase our vulnerability to adverse economic, industry or competitive developments and expose us to the risk of increased interest rates on indebtedness bearing interest at variable rates and there is no assurance that alternative financing or financing on as favorable terms will be found when our existing credit facilities expire.
Furthermore, our ability to make scheduled payments under, or to refinance, our indebtedness depends on our financial and operating performance, which is subject, in part, to factors beyond our control and the risks and uncertainties described herein. We may not be able to maintain a level of cash flow from operations sufficient to permit us to pay the principal, premium, if any, and interest on our indebtedness, which may force us to reduce or delay capital expenditures and/or dividend, sell assets or operations, seek additional capital or restructure or refinance our indebtedness, which we may not be able to do. If new debt is added to our and our subsidiaries’ existing debt levels, the related risks that we now face would increase.
We are subject to risks related to our international operations.
We operate on a global basis, and approximately 67% of our net revenues in fiscal 2017 were generated outside North America. We maintain offices in over 35 countries and market, sell and distribute our products in over 150 countries and
12
territories. Our presence in such geographies has expanded as a result of our acquisitions, including the acquisition of the Hypermarcas Brands, ghd, and the Transactions, and we are exposed to risks inherent in operating in geographies in which we have not operated in or have been less present in the past.
Non-U.S. operations are subject to many risks and uncertainties, including ongoing instability or changes in a country’s or region’s economic, regulatory or political conditions, including inflation, recession, interest rate fluctuations, sovereign default risk and actual or anticipated military or political conflicts (including any other change resulting from Brexit), labor market disruptions, new or increased tariffs, quotas, exchange or price controls, trade barriers or other restrictions on foreign businesses, our failure to effectively and timely implement processes and policies across our diverse operations and employee base and difficulties and costs associated with complying with a wide variety of complex and potentially conflicting regulations across multiple jurisdictions.
In addition, sudden disruptions in business conditions as a consequence of events such as a terrorist attacks, war or other military action or the threat of further attacks, pandemics or other crises or vulnerabilities or as a result of adverse weather conditions or climate changes, may have an impact on consumer spending, which could have a material adverse effect on our business, prospects, financial condition, results of operations, cash flows, as well as the trading price of our securities.
In addition, we intend to reinvest undistributed earnings and profits from our foreign operations indefinitely, except where we are able to repatriate these earnings to the U.S. without material incremental tax expenditures. Any repatriation of funds currently held in foreign jurisdictions may result in higher effective tax rates. In addition, there have been proposals to change U.S. tax laws that would significantly impact how U.S. multinational corporations are taxed on foreign earnings. We cannot predict whether or in what form this proposed legislation may pass. If enacted, such legislation could have a material adverse impact on our tax expense and cash flow. Substantially all of our cash and cash equivalents that result from these earnings remain outside the U.S. As of June 30, 2017, 2016 and 2015, our cash and cash equivalents held in foreign operations included $470.2 million, $364.8 million and $337.7 million, or 88%, 98% and 99% of aggregate cash and cash equivalents, respectively.
We are subject to legal proceedings and legal compliance risks.
We are subject to a variety of legal proceedings and legal compliance risks in the countries in which we do business, including the matters described under the heading “Legal Proceedings” in Part I, Item 3 of this report. We are under the jurisdiction of regulators and other governmental authorities which may, in certain circumstances, lead to enforcement actions, changes in business practices, fines and penalties, the assertion of private litigation claims and damages and adversely impact our customer relationships, particularly to the extent customers were implicated by such proceedings. Since closing the Transactions in October 2016, we have also been subject to legal proceedings and legal compliance risks in connection with legacy matters involving the P&G Beauty Business, and those relating to ghd, that were previously outside our control and that we are now independently addressing, which may result in unanticipated or new liabilities. While we believe that we have adopted, and /or will adopt, appropriate risk management and compliance programs, the global nature of our operations and many laws and regulations to which we are subject mean that legal and compliance risks will continue to exist with respect to our business, and additional legal proceedings and other contingencies, the outcome and impact of which cannot be predicted with certainty, will arise from time to time.
Our operations and acquisitions in certain foreign areas expose us to political, regulatory, economic and reputational risks.
We operate on a global basis. Our employees, contractors and agents, business partners, joint venture and joint venture partners and companies to which we outsource certain of our business operations, may take actions in violation of our compliance policies or applicable law. In addition, some of our recent acquisitions have required us to integrate non-U.S. companies that had not, until our acquisition, been subject to U.S. law or other laws to which we are subject. In many countries, particularly in those with developing economies, it may be common for persons to engage in business practices prohibited by the laws and regulations applicable to us. Failure by us or our subsidiaries to comply with these laws or policies could subject us to civil and criminal penalties, cause us to be in breach of contract or damage to our or our licensors’ reputation, each of which could materially and adversely affect our business, prospects, financial condition, cash flows, results of operations, cash flows, as well as the trading price of our securities.
For example, in 2012, we voluntarily disclosed to the U.S. Department of Commerce, Bureau of Industry and Security, Office of Antiboycott Compliance (“OAC”) that our majority-owned subsidiary in the UAE may have violated certain antiboycott regulations. In October 2016, we settled this matter with the OAC for an immaterial amount. We may experience reputational harm and increased regulatory scrutiny, and the U.S. may impose additional sanctions at any time on other countries where we sell our products. If so, our existing activities may be adversely affected, or we may incur costs in order to come into compliance with future sanctions, depending on the nature of any further sanctions that may be imposed.
We are subject to the interpretation and enforcement by governmental agencies of other foreign laws, rules, regulations or policies, including any changes thereto, such as restrictions on trade, import and export license requirements, and tariffs and taxes, which may require us to adjust our operations in certain areas where we do business. We face legal and regulatory risks
13
in the U.S. and abroad and, in particular, cannot predict with certainty the outcome of various contingencies or the impact that pending or future legislative and regulatory changes may have on our business. It is not possible to gauge what any final regulation may provide, its effective date or its impact at this time. These risks could have a material adverse effect on our business, prospects, financial condition, results of operations, cash flows, as well as the trading price of our securities.
Our failure to protect our reputation, or the failure of our brand partners or licensors to protect their reputations, could have a material adverse effect on our brand images.
Our ability to maintain our reputation is critical to our business and our various brand images. Our reputation could be jeopardized if we fail to maintain high standards for product quality and integrity (including should we be perceived as violating the law) or if we, or the third parties with whom we do business, do not comply with regulations or accepted practices and are subject to a significant product recall, litigation, or allegations of tampering, animal testing or use of certain ingredients (such as certain palm oil). Any negative publicity about these types of concerns or other concerns, whether actual or perceived or directed towards us or our competitors, may reduce demand for our products. Failure to comply with ethical, social, product, labor and environmental standards, or related political considerations, could also jeopardize our reputation and potentially lead to various adverse consumer actions, including boycotts.
Additionally, our success is also partially dependent on the reputations of our brand partners and licensors and the goodwill associated with their intellectual property. We often rely on our brand partners or licensors to manage and maintain their brands, but these licensors’ reputation or goodwill may be harmed due to factors outside our control, which could be attributed to our other brands and have a material adverse effect on our business, prospects, financial condition, results of operations, cash flows, as well as the trading price of our securities. Many of these brand licenses are with fashion houses, whose popularity may decline due to mismanagement, changes in fashion or consumer preferences or other factors beyond our control. Similarly, certain of our products bear the names and likeness of celebrities, whose brand or image may change without notice and who may not maintain the appropriate celebrity status or positive association among the consumer public to support projected sales levels. In addition, in the event that any of these licensors were to enter bankruptcy proceedings, we could lose our rights to use the intellectual property that the applicable licensors license to us.
Damage to our reputation or the reputations of our brand partners or licensors or loss of consumer confidence for any of these or other reasons could have a material adverse effect on our results of operations, financial condition and cash flows, as well as require additional resources to rebuild our reputation.
Our brand licenses may be terminated if specified conditions are not met.
We license trademarks for many of our product lines. Our brand licenses typically impose various obligations on us, including the payment of annual royalties, maintenance of the quality of the licensed products, achievement of minimum sales levels, promotion of sales and qualifications and behavior of our suppliers, distributors and retailers. We have breached, and may in the future breach, certain terms of our brand licenses. If we breach our obligations, our rights under the applicable brand license agreements could be terminated by the licensor and we could, among other things, lose our ability to sell products related to that brand, lose any upfront investments made in connection with such license and sustain reputational damage. We may also face difficulties in finding replacements for terminated licenses. Each of the aforementioned risks could have a material adverse effect on our business, prospects, financial condition, results of operations, cash flows, as well as the trading price of our securities.
Our business is subject to seasonal variability.
Our sales generally increase during our second fiscal quarter as a result of increased demand by retailers associated with the holiday season. We also experience an increase in sales during our fourth quarter in our Professional Beauty segment as a result of stronger activity prior to the summer holiday season. Accordingly, our financial performance, sales, working capital requirements, cash flow and borrowings generally experience variability during the three to six months preceding and during the holiday period. As a result of this seasonality, our expenses, including working capital expenditures and advertising spend, are typically higher during the period before a high-demand season. Consequently, any substantial decrease in, or inaccurate forecasting with respect to, net revenues during such periods of high demand including as a result of decreased customer purchases, increased product returns, production or distribution disruptions or other events (many of which are outside of our control), would prevent us from being able to recoup our earlier expenses and could have a material adverse effect on our financial condition, results of operations and cash flows.
A disruption in operations could adversely affect our business.
As a company engaged in manufacturing and distribution on a global scale, we are subject to the risks inherent in such activities, including industrial accidents, environmental events, strikes and other labor disputes, disruptions in supply chain or information systems, loss or impairment of key manufacturing sites or distribution centers, product quality control, safety, licensing requirements and other regulatory issues, as well as natural disasters, pandemics, border disputes, acts of terrorism, and other external factors over which we have no control. The loss of, or damage or disruption to, any of our manufacturing
14
facilities or distribution centers could have a material adverse effect on our business, prospects, results of operations, financial condition, results of operations, cash flows, as well as the trading price of our securities.
We manufacture and package a majority of our products. Raw materials, consisting chiefly of essential oils, alcohols, chemicals, containers and packaging components, are purchased from various third-party suppliers. The loss of multiple suppliers or a significant disruption or interruption in the supply chain could have a material adverse effect on the manufacturing and packaging of our products. Increases in the costs of raw materials or other commodities may adversely affect our profit margins if we are unable to pass along any higher costs in the form of price increases or otherwise achieve cost efficiencies in manufacturing and distribution. In addition, failure by our third-party suppliers to comply with ethical, social, product, labor and environmental laws, regulations or standards, or their engagement in politically or socially controversial conduct, such as animal testing, could negatively impact our reputations and lead to various adverse consequences, including decreased sales and consumer boycotts. The Dodd-Frank Wall Street Reform and Consumer Protection Act includes disclosure requirements regarding the use of certain minerals mined from the Democratic Republic of Congo and adjoining countries (each, a “covered country”) and procedures pertaining to a manufacturer’s efforts regarding the source of such minerals. SEC rules implementing these requirements may have the effect of reducing the pool of suppliers who can supply covered country “conflict free” products, and we may not be able to obtain covered country conflict free products or supplies in sufficient quantities for our operations. For calendar year 2016, we determined that we have no reason to believe that any products we manufactured or contracted to manufacture contained conflict minerals that may have originated in the covered countries. However, since our supply chain is complex, we may face operational obstacles and reputational challenges with our customers and stockholders if we are unable to continue to sufficiently verify the origins for the minerals used in our products.
We have also outsourced certain functions, and we are dependent on the entities performing those functions. The failure of one or more such entities to provide the expected services, provide them on a timely basis or provide them at the prices we expect, or the costs incurred in returning these outsourced functions to being performed under our management and direct control, may have a material adverse effect on our results of operations or financial condition. Further, we intend to exit the remaining stage of the transition services agreement with P&G in calendar year 2017. Any interruption in our business operations connected to this exit may impact our quarterly results and could have a material adverse effect on our business, prospects, results of operations, financial condition, results of operations, cash flows, as well as the trading price of our securities.
We are increasingly dependent on information technology, and if we are unable to protect against service interruptions, corruption of our data and privacy protections, cyber-based attacks or network security breaches, our operations could be disrupted.
We rely on information technology networks and systems, including the Internet, to process, transmit and store electronic and financial information, to manage a variety of business processes and activities, and to comply with regulatory, legal and tax requirements. We also depend on our information technology infrastructure for digital marketing activities and for electronic communications among our locations, personnel, customers and suppliers around the world. We are subject to an evolving body of federal, state and foreign laws, regulations, guidelines, and principles regarding data privacy and security. A data breach or inability on our part to comply with such laws, regulations, guidelines, and principles or to quickly adapt our practices to reflect them as they develop, could potentially subject us to significant liabilities and reputational harm. Several foreign governments, including the European Union, have regulations dealing with the collection and use of personal information obtained from their citizens, and we cannot assure you that we, our business partners or third-parties engaged by us will successfully comply with such laws. These information technology systems, some of which are managed by our business partners or third parties that we do not control, may be susceptible to damage, disruptions or shutdowns due to failures during the process of upgrading or replacing software, databases or components thereof, power outages, hardware failures, computer viruses, attacks by computer hackers, telecommunication failures, user errors or catastrophic events. If our information technology systems suffer severe damage, disruption or shutdown and our business continuity plans do not effectively resolve the issues in a timely manner, our product sales, financial condition and results of operations may be materially and adversely affected, and we could experience delays in reporting our financial results. There are further risks associated with the information systems of companies we acquire, both in terms of systems compatibility, level of security and functionality. It may cost us significant money and resources to address these risks and we may fail to address them successfully, adversely impacting our financial condition, results of operations and cash flows.
In addition, if we are unable to prevent security breaches, we may suffer financial and reputational damage or penalties because of the unauthorized disclosure of confidential information belonging to us or to our partners, customers or suppliers, including personal consumer or presenter information stored our or third-party systems. In addition, the unauthorized disclosure of nonpublic sensitive information could lead to the loss of intellectual property or damage our reputation and brand image or otherwise adversely affect our ability to compete.
From time to time, we undertake significant information technology systems projects, including enterprise resource planning updates, modifications and roll-outs. These projects may be subject to cost overruns and delays and may cause
15
disruptions in our daily business operations. These cost overruns and delays and distractions as well as our reliance on certain third parties, including P&G, for certain business and financial information could impact our financial statements and could adversely impact our ability to run our business, correctly forecast future performance and make fully informed decisions. For example, we intend to exit the remaining stage of the transition services agreement in calendar year 2017, which undertaking relies significantly upon our information technology infrastructure. Any delay in timing of shipment of orders linked to unexpected technical challenges with such exits may impact our quarterly results.
Our success depends, in part, on our employees, including our key personnel.
Our success depends, in part, on our ability to identify, hire, train and retain our employees, including our key personnel, such as our executive officers and senior management team and our research and development and marketing personnel. The unexpected loss of one or more of our key employees could adversely affect our business. Competition for highly qualified individuals can be intense, and although many of our key personnel have signed non-compete agreements, it is possible that these agreements would be unenforceable, in whole or in part, in some jurisdictions, permitting employees in those jurisdictions to transfer their skills and knowledge to the benefit of our competitors with little or no restriction. We may not be able to attract, assimilate or retain qualified personnel in the future, and our failure to do so could adversely affect our business. Further, other companies may attempt to recruit our key personnel, even if bound by non-competes, which could result in diversion of management attention and our resources to litigation related to such recruitment. These risks may be exacerbated by the stresses associated with the integration of the P&G Beauty Business, implementation of our strategic plan, our recently announced reorganization, recent changes in our senior management team, recent acquisitions and other initiatives.
Our success depends, in part, on the quality, efficacy and safety of our products.
Product safety or quality failures, actual or perceived, or allegations of product contamination, even when false or unfounded, or inclusion of regulated ingredients could tarnish the image of our brands and could cause consumers to choose other products. Allegations of contamination, allergens or other adverse effects on product safety or suitability for use by a particular consumer, even if untrue, may require us from time to time to recall a product from all of the markets in which the affected production was distributed. Such issues or recalls and any related litigation could negatively affect our profitability and brand image.
In addition, government authorities regulate advertising and product claims regarding the performance and benefits of our products. These regulatory authorities typically require a reasonable basis to support any marketing claims. What constitutes a reasonable basis for substantiation can vary widely based on geography, and there is no assurance that the efforts that we undertake to support our claims will be deemed adequate for any particular product or claim. If we are unable to show adequate substantiation for our product claims, or our promotional materials make claims that exceed the scope of allowed claims for the classification of the specific product, regulatory authorities could take enforcement action or impose penalties, such as monetary consumer redress, requiring us to revise our marketing materials, amend our claims or stop selling or recalling certain products, all of which could harm our business, prospects, financial condition, results of operations, cash flows, as well as the trading price of our securities. Any regulatory action or penalty could lead to private party actions, which could further harm our business, prospects, financial condition, results of operations, cash flows, as well as the trading price of our securities.
If our products are perceived to be defective or unsafe, or if they otherwise fail to meet our consumers’ expectations, our relationships with customers or consumers could suffer, the appeal of one or more of our brands could be diminished, and we could lose sales or become subject to liability claims. In addition, safety or other defects in our competitors’ products could reduce consumer demand for our own products if consumers view them to be similar or view the defects as symptomatic of the product category. Any of these outcomes could result in a material adverse effect on our business, prospects, financial condition, results of operations, cash flows, as well as the trading price of our securities.
If we underestimate or overestimate demand for our products and do not maintain appropriate inventory levels, our net revenues or working capital could be negatively impacted.
We currently engage in a program seeking to improve control over our product demand and inventories. We have identified, and may continue to identify, inventories that are not saleable in the ordinary course, but there is no assurance that our existing program or any future inventory management program will be successful in improving our inventory control. Our ability to manage our inventory levels to meet demand for our products is important for our business. If we overestimate or underestimate demand for any of our products, we may not maintain appropriate inventory levels, we could have excess inventory that we may need to hold for a long period of time, write down, sell at prices lower than expected or discard, which could negatively impact our net sales or working capital, hinder our ability to meet demand, or cause us to incur excess and obsolete inventory charges. We are also seeking to improve our payable terms, which could adversely affect our relations with our suppliers.
In addition, we have significant working capital needs, as the nature of our business requires us to maintain inventories that enable us to fulfill customer demand. We generally finance our working capital needs through cash flows from operations and
16
borrowings under our credit facilities. If we are unable to finance our working capital needs on the same or more favorable terms going forward, or if our working capital requirements increase and we are unable to finance the increase, we may not be able to produce the inventories required by demand, which could result in a loss of sales.
Changes in laws, regulations and policies that affect our business or products could adversely affect our business, financial condition, results of operations, cash flows, as well as the trading price of our securities.
Our business is subject to numerous laws, regulations and policies. Changes in the laws (both foreign and domestic), regulations and policies, including the interpretation or enforcement thereof, that affect, or will affect, our business or products, including those related to taxes, tariffs, corruption, the environment or climate change, immigration, restrictions or requirements related to product content, labeling and packaging, trade and customs (including, among others, import and export license requirements, quotas, trade barriers, and other measures imposed by foreign countries), restrictions on foreign investment, the outcome and expense of legal or regulatory proceedings, and any action we may take as a result, and changes in accounting standards, could adversely affect our financial results. For example, any potential changes in sanctions against Russia or Iran may hinder our ability to conduct business with potential or existing customers and vendors in these countries. Also, the new U.S. administration and key members of Congress have made public statements indicating that U.S. corporate tax reform is a high priority, and the U.S. Congress is expected to propose sweeping changes to the U.S. tax system, including changes to corporate tax rates and the taxation of income earned outside the U.S. (including the taxation of previously unrepatriated foreign earnings). There remains a substantial lack of clarity around the likelihood, timing and details of any potential tax reform and the impact that such tax reform may have on us. Any changes to these sanctions, tax laws and other regulations, with or without retroactive application, could materially and adversely affect our business. See “—We are subject to risks related to our international operations”, “—Network marketing is subject to intense government scrutiny, and regulation and changes in the law, or the interpretation and enforcement of the law, might adversely affect our business” and “—We face risks associated with our independent contractors.”
We are also subject to legal proceedings and legal compliance risks in connection with legacy matters related to recently acquired companies that were previously outside our control. Such matters may result in our incurring unanticipated costs which may negatively impact the positive financial contributions of such acquisitions at least in the periods in which such liability is incurred or require operational adjustments that affect our results of operations with respect to such investments. We may not have adequate or any insurance coverage for some of these legacy matters, including matters assumed in the Transactions. While we believe that we have adopted, and will adopt, appropriate risk management and compliance programs, the global nature of our operations and many laws and regulations to which we are subject mean that legal and compliance risks will continue to exist with respect to our business, and additional legal proceedings and other contingencies, the outcome of which cannot be predicted with certainty, will arise from time to time, which could adversely affect our business, prospects, financial condition, results of operations, cash flows, as well as the trading price of our securities.
Network marketing is subject to intense government scrutiny, and regulation and changes in the law, or the interpretation and enforcement of the law, might adversely affect our business.
On February 1, 2017, we entered into a joint venture with the founders of Younique, a leading online peer-to-peer social selling platform in beauty. We are now subject to a number of federal and state regulations administered by the Federal Trade Commission (the “FTC”) and various federal and state agencies in the United States related to Younique’s network marketing program, as well as regulations on direct selling in foreign countries administered by foreign agencies. We are subject to the risk that, in one or more countries, Younique’s network marketing program could be found by federal, state or foreign regulators not to be in compliance with applicable law or regulations which could result in significant fines, changes in business practices or a permanent injunction.
Regulations applicable to network marketing organizations generally are directed at preventing fraudulent or deceptive schemes, often referred to as “pyramid” or “chain sales” schemes, by ensuring that product sales ultimately are made to consumers and that advancement within an organization is based on sales of the organization’s products rather than investments in the organization or other non-retail sales-related criteria. The regulatory requirements concerning network marketing programs do not include “bright line” rules and are inherently fact-based and, thus, we are subject to the risk that these laws or regulations or the enforcement or interpretation of these laws and regulations by governmental agencies or courts can change and business practices can evolve. There is no assurance that the FTC or other federal, state or foreign courts or agencies will consider us to be in compliance.
The ambiguity surrounding these laws can also affect the public perception of us. The failure of the network marketing program to comply with current or newly adopted regulations or any allegations or charges to that effect brought by federal, state, or foreign regulators could negatively impact our brands and business in a particular market or in general and may adversely affect our share price.
We are also subject to the risk of private party challenges to the legality of the network marketing program. Some network marketing programs of other companies have been successfully challenged in the past. Adverse judicial determinations with
17
respect to the network marketing program, or in proceedings not involving us directly but which challenge the legality of network marketing systems, in any other market in which we operate, could increase costs to the extent we are obligated to contribute to the cost of defense and could negatively impact our business, prospects, financial condition, results of operations, cash flows, as well as the trading price of our securities.
We face risks associated with our independent contractors.
We have personnel that we classify as independent contractors for U.S. federal and state and international employment law purposes in certain positions in our business. For example, Younique relies on independent presenters that it classifies as independent contractors to sell its products through its peer-to-peer social selling platform and we are subject to risks related to Younique presenters’ status as independent contractors.
We are not in a position to directly provide the same direction, motivation and oversight to our independent contractors as we would if such personnel were our own employees. As a result, there can be no assurance that our independent contractors will comply with applicable law or our policies and procedures. Violations by our independent contractors of applicable law or of our policies and procedures in dealing with customers and other third parties could reflect negatively on our products and operations and harm our business reputation and also negatively impact our business, prospects, financial condition, results of operations, cash flows, as well as the trading price of our securities. In addition, it is possible that a court could hold us civilly or criminally accountable based on vicarious liability because of the actions of our independent contractors. In addition, our independent contractors are not subject to employment agreements with us and our ability to retain such personnel or enforce non-competes or other restrictions against them may be limited.
In addition, we are subject to the Internal Revenue Service regulations and applicable state law guidelines regarding independent contractor classification. These regulations and guidelines are subject to changes in judicial and agency interpretation, and it could be determined that the independent contractor classification is inapplicable. If legal standards for classification of independent contractors change, it may be necessary to modify our compensation structure for these personnel, including by paying additional compensation and taxes and/or reimbursing expenses. In addition, if we are determined to have misclassified such personnel as independent contractors, we would incur additional exposure under federal and state law, including workers' compensation, unemployment benefits, labor, employment and tort laws, including for prior periods, as well as potential liability for employee benefits and tax withholdings. Any of these outcomes could result in costs to us, could impair our financial condition and our ability to conduct our business and could damage our reputation and our ability to attract and retain other personnel.
We are subject to risks related to our common stock and our stock repurchase program.
Any repurchases pursuant to our stock repurchase program, or a decision to discontinue our stock repurchase program, which may be discontinued at any time, could affect our stock price and increase volatility. For a two-year period following the closing of the Transactions, we are subject to certain restrictions in repurchasing our stock. For more information on our stock repurchase restrictions, see “—We could be adversely affected by significant restrictions following the Transactions in order to avoid tax-related liabilities.” In addition, the timing and actual number of any shares repurchased will depend on a variety of factors including the timing of open trading windows, price, corporate and regulatory requirements, an assessment by management and our board of directors of cash availability, capital allocation priorities and other market conditions. Further, we allow pledging by our employees in connection with certain executive ownership programs. A drop in the share price could result in pledged shares being sold pursuant to the terms of the pledge, which could result in a decrease in the trading price of our stock and subject us to civil and criminal investigations, including with respect to insider trading.
If the Distribution (as defined below) does not qualify as a tax-free transaction under sections 355 or 368(a)(1)(D) of the Code or the Merger does not qualify as a tax-free “reorganization” under section 368(a) of the Code, including as a result of actions taken in connection with the Distribution or the Merger or as a result of subsequent acquisitions of Company, P&G or Galleria common stock, then P&G and its shareholders may incur substantial U.S. federal income tax liability, and we may have substantial indemnification obligations to P&G under the Tax Matters Agreement.
In connection with the closing of the Transactions on October 1, 2016, we and P&G received written opinions from special tax counsel regarding the intended tax treatment of the Merger, and P&G received an additional written opinion from special tax counsel regarding the intended tax treatment of the Distribution. The opinions were based on, among other things, certain assumptions and representations as to factual matters and certain covenants made by us, P&G, Galleria and Green Acquisition Sub Inc. (“Merger Sub”) which, if incorrect or inaccurate in any material respect, could jeopardize the conclusions reached by special tax counsel in their opinions. We are not aware of any facts or circumstances that would cause the assumptions or representations to be relied upon in the above-described tax opinions to be untrue or incomplete in any material respect or that would preclude any of us, P&G, Galleria or Merger Sub from complying with all applicable covenants. Any change in currently applicable law, which may be retroactive, or the failure of any representation or assumption to be true, correct and complete or any applicable covenant to be satisfied in all material respects, could adversely affect the conclusions reached by counsel. Furthermore, it should be noted that there is a lack of binding administrative and judicial authority addressing the tax-free
18
treatment of transactions substantially similar to the distribution by P&G of its shares of Galleria common stock to P&G shareholders by way of an exchange offer (the “Distribution”) and the Merger, the opinions will not be binding on the IRS or a court, and the IRS or a court may not agree with the opinions. As a result, while it is impossible to determine the likelihood that the IRS or a court could disagree with the conclusions of the above-described opinions, the IRS could assert, and a court could determine, that the Distribution and Merger should be treated as taxable transactions.
If, notwithstanding the receipt of the above-described opinion received by P&G, the Distribution is determined to be a taxable transaction, each P&G shareholder who receives shares of Galleria common stock in the Distribution would generally be treated as recognizing taxable gain equal to the difference between the fair market value of the shares of Galleria common stock received by the shareholder and its tax basis in the shares of P&G common stock exchanged therefor. Additionally, in such case, P&G would generally recognize taxable gain equal to the excess of the fair market value of the assets transferred to Galleria plus liabilities assumed by Galleria over P&G’s tax basis in those assets, and this would likely produce substantial income tax adjustments to P&G.
Even if the Galleria Transfer (as used herein, “Galleria Transfer” means the contribution of certain specified assets related to P&G Beauty Business by P&G to Galleria in exchange for Galleria common stock, any distribution to P&G of a portion of the amount calculated pursuant to the Transaction Agreement for the recapitalization of Galleria and the assumption of certain liabilities related to P&G Beauty Business, in each case in accordance with the Transaction Agreement) and the Distribution, taken together, were otherwise to qualify as a tax-free transaction under section 368(a)(1)(D) of the Code, and the Distribution were otherwise to qualify as a distribution to P&G shareholders pursuant to section 355 of the Code, the Distribution would become taxable to P&G (but not P&G shareholders) pursuant to section 355(e) of the Code if a 50% or greater interest (by vote or value) of either P&G or Galleria was acquired (including, in the latter case, through the acquisition of our stock in or after the Merger), directly or indirectly, by certain persons as part of a plan or series of related transactions that included the Distribution. For this purpose, any acquisitions of shares of our common stock, P&G common stock or Galleria common stock within the period beginning two years before the Distribution and ending two years after the Distribution are presumed to be part of such a plan, although we, P&G or Galleria may be able to rebut that presumption. While the Merger will be treated as part of such a plan for purposes of the test, standing alone, it should not cause the Distribution to be taxable to P&G under section 355(e) of the Code because P&G shareholders held over 54% of our outstanding common stock immediately following the Merger. However, if the IRS were to determine that other acquisitions of our shares of stock, P&G common stock or Galleria common stock, either before or after the Distribution, were part of a plan or series of related transactions that included the Distribution, that determination could result in the recognition of a taxable gain by P&G. While P&G generally would recognize gain as if it had sold the shares of Galleria common stock distributed to P&G shareholders in the Distribution for an amount equal to the fair market value of such stock, P&G has agreed under the Tax Matters Agreement among us, P&G, Galleria and Merger Sub to make a protective election under section 336(e) of the Code with respect to the Distribution, which generally causes a deemed sale of Galleria’s assets upon a taxable Distribution. In such case, to the extent that P&G is responsible for the resulting transaction taxes, we generally would be required to make periodic payments to P&G equal to the tax savings arising from a “step up” in the tax basis of Galleria’s assets as a result of the protective election under section 336(e) of the Code taking effect.
Under the Tax Matters Agreement, we and each of our consolidated subsidiaries, including Galleria after the consummation of the Merger (the “Coty Group”), are required to indemnify P&G against tax-related losses (e.g., increased taxes, penalties and interest required to be paid by P&G) if the Distribution were taxable to P&G as a result of the acquisition of a 50% or greater interest (by vote or value) in us as part of a plan or series of related transactions that included the Distribution, except where such acquisition would not have been taxable but for P&G’s breach of certain provisions described in the Tax Matters Agreement. In addition, the Coty Group is required to indemnify P&G for any tax liabilities resulting from the failure of the Merger to qualify as a reorganization under section 368(a) of the Code or the failure of the Distribution to qualify as a tax-free reorganization under sections 355 and 368(a) of the Code (including, in each case, failure to so qualify under a similar provision of state or local law) to the extent that such failure is attributable to a breach of certain representations and warranties by us or certain actions or omissions of the Coty Group. Tax-related losses attributable both to actions or omissions by the Coty Group, on the one hand, and certain actions or omissions by P&G, on the other hand, would be shared according to the relative fault of us and P&G. If the Coty Group is required to indemnify P&G in the event of a taxable Distribution, this indemnification obligation would be substantial and could have a material adverse effect on us, including with respect to our financial condition and results of operations. Except as described above, P&G would not be entitled to indemnification under the Tax Matters Agreement with respect to any taxable gain recognized in the Distribution. To the extent that we have any liability for any taxes of P&G, Galleria or any of their affiliates with respect to the Transactions that do not result from actions or omissions for which the Coty Group is liable as described above, P&G must indemnify us for such tax-related losses.
19
We could be adversely affected by significant restrictions following the Transactions in order to avoid tax-related liabilities.
The Tax Matters Agreement among us, P&G, Galleria and Merger Sub requires that we and Galleria, for a two-year period following the closing of the Merger, generally avoid taking certain actions. These limitations are designed to restrict actions that might cause the Distribution to be treated under section 355(e) of the Code as part of a plan under which a 50% or greater interest (by vote or value) in us is acquired or that could otherwise cause the Distribution, Merger and/or certain related transactions to become taxable to P&G. Unless we deliver an unqualified opinion of tax counsel reasonably acceptable to P&G, confirming that a proposed action would not cause the Distribution, Merger and/or certain related transactions to become taxable, or P&G otherwise consents to the action, we and Galleria are each generally prohibited or restricted during the two-year period following the closing of the Merger from:
|
•
|
subject to specified exceptions, issuing stock (or stock equivalents) or recapitalizing, repurchasing, redeeming or otherwise participating in acquisitions of its stock;
|
|
•
|
amending our or Galleria’s certificate of incorporation or other organizational documents to affect the voting rights of our or Galleria’s stock;
|
|
•
|
merging or consolidating with another entity, or liquidating or partially liquidating, except for any merger, consolidation, liquidation or partial liquidation that is disregarded for U.S. federal income tax purposes;
|
|
•
|
discontinuing, selling, transferring or ceasing to maintain the Galleria active business under section 355(b) of the Code;
|
|
•
|
taking any action that permits a proposed acquisition of our stock or Galleria stock to occur by means of an agreement to which none of us, Galleria or their affiliates is a party (including by soliciting a tender offer for Galleria stock or our stock, participating in or otherwise supporting any unsolicited tender offer for such stock or redeeming rights under a shareholder rights plan with respect to such stock); and
|
|
•
|
engaging in other actions or transactions that could jeopardize the tax-free status of the Distribution, Merger and/or certain related transactions.
|
In addition, even if we deliver such an unqualified opinion, or P&G otherwise consents, we generally would be required to indemnify P&G if an action that would be otherwise restricted results in tax-related losses to P&G.
Due to these restrictions and indemnification obligations under the Tax Matters Agreement, including the indemnification obligations described in the preceding risk factor, many strategic alternatives may be unavailable to us during the two-year period following the consummation of the Merger, which could have a material adverse effect on our liquidity and financial condition. We may be limited during this period in our ability to pursue strategic transactions, equity or convertible debt financings, internal restructurings or other transactions that may maximize the value of our business and that may otherwise be in our best interests. Also, the restrictions and our potential indemnity obligation to P&G might discourage, delay or prevent a change of control transaction during this two-year period that our stockholders may consider favorable to our ability to pursue strategic alternatives.
We are no longer a “controlled company” within the meaning of the New York Stock Exchange rules.
Until October 2016, JABC beneficially owned a majority of the voting power of our outstanding stock. As a result, we were a “controlled company” within the meaning of NYSE corporate governance standards, and we were not required to comply with certain NYSE corporate governance standards, including that our compensation committee consist entirely of independent directors, until September 30, 2017. We chose to comply with the NYSE corporate governance standards prior to the deadline and have been in compliance since December 8, 2016.
JABC is a significant shareholder of the Company, owning approximately 37% of the fully diluted shares of Class A Common Stock, and has the ability to exercise significant influence over decisions requiring stockholder approval, which may be inconsistent with the interests of our other stockholders.
Prior to the close of the Transactions, we were controlled by JABC, Lucresca and Agnaten. Lucresca and Agnaten indirectly share voting and investment control over the shares of the Class A Common Stock held by JABC. Following the completion of the Transactions, JABC remains our largest stockholder, owning approximately 37% of the fully diluted shares of Class A Common Stock following the close of the Transactions. As a result, JABC, Lucresca and Agnaten continue to have the ability to exercise significant influence over decisions requiring stockholder approval, including the election of directors, amendments to our certificate of incorporation and approval of significant corporate transactions, such as a merger or other sale of the Company or our assets. In addition, several of the directors on our Board of Directors are affiliated with JABC.
JABC’s interests may be different from or conflict with the interests of our other shareholders and, as a result, this concentration of ownership may have the effect of delaying, preventing or deterring a change in control of us and may negatively affect the market price of our stock. Also, JABC and its affiliates are in the business of making investments in
20
companies and may from time to time acquire and hold interests in businesses that compete indirectly with us. JABC or its affiliates may also pursue acquisition opportunities that are complementary to our business and, as a result, those acquisition opportunities may not be available to us.
Item 1B.
Unresolved Staff Comments.
None.
Item 2.
Properties.
W
e occupy numerous offices, manufacturing, distribution and research and development facilities in the U.S. and abroad. Our principal executive offices are located in New York, U.S. and our division corporate headquarters are located in New York for Consumer Beauty, Paris, France for Luxury and Geneva, Switzerland for Professional Beauty.
We consider our properties to be generally in good condition and believe that our facilities are adequate for our operations and provide sufficient capacity to meet anticipated requirements. The following table sets forth our principal owned and leased corporate, manufacturing and research and development facilities as of
June 30, 2017
. The leases expire at various times subject to certain renewal options at our option.
|
|
|
|
||
|
Location/Facility
|
|
Use
|
Segment
|
|
|
London, England (leased)
|
Corporate/Commercial
|
Corporate
|
||
|
New York, New York, U.S. (leased)
|
|
Corporate/Commercial
|
Corporate / Consumer Beauty
|
|
|
Paris, France (3 locations) (leased)
|
|
Corporate/Commercial
|
Corporate / Luxury
|
|
|
Geneva, Switzerland (2 locations) (leased)
|
|
Corporate/Commercial/R&D
|
Corporate / Professional Beauty
|
|
|
Ashford, England (land leased, building owned)
|
|
Manufacturing
|
Consumer Beauty
|
|
|
Bangkok, Thailand (owned)
|
Manufacturing
|
Professional Beauty
|
||
|
Chartres, France (owned)
|
|
Manufacturing
|
Luxury
|
|
|
Cologne, Germany (owned)
|
Manufacturing
|
Luxury
|
||
|
Granollers, Spain (owned)
|
|
Manufacturing
|
Luxury
|
|
|
Hünfeld, Germany (owned)
|
Manufacturing
|
Professional Beauty
|
||
|
Hunt Valley, U.S. (owned)
|
Manufacturing
|
Consumer Beauty
|
||
|
Mariscala, Mexico (owned)
|
Manufacturing
|
Professional Beauty
|
||
|
Monaco, Monaco (leased)
|
|
Manufacturing
|
Luxury
|
|
|
Nenagh, Ireland (owned)
|
Manufacturing
|
Consumer Beauty
|
||
|
Rothenkirchen, Germany (owned)
|
Manufacturing
|
Professional Beauty
|
||
|
Sanford, North Carolina, U.S. (owned)
|
|
Manufacturing
|
Luxury
|
|
|
Seaton Delaval, United Kingdom (owned)
|
Manufacturing
|
Luxury
|
||
|
Senador Canedo, Brazil (owned)
|
Manufacturing
|
Consumer Beauty
|
||
|
Morris Plains, New Jersey, U.S. (leased)
|
|
R&D
|
All segments
|
|
Item 3.
Legal Proceedings.
We are involved, from time to time, in various litigation and administrative and other legal proceedings including regulatory actions, incidental or related to our business, including consumer class or collective action, personal injury, intellectual property, competition, and advertising claims litigation, among others (“Legal Proceedings”). While we cannot predict any final outcomes relating thereto, management believes that the outcome of current Legal Proceedings will not have a material effect upon our business, prospects, financial condition, results of operations, cash flows, as well as the trading price of our securities. However, management’s assessment of our Legal Proceedings, especially those related to the P&G Beauty Business and our other recently completed acquisitions, is ongoing, and could change in light of the discovery of additional facts with respect to
Legal Proceedings pending
against us not presently known to us or determinations by judges, arbitrators, juries or other finders of fact or deciders of law which are not in accord with management’s evaluation of the probable liability or outcome of such Legal Proceedings. From time to time, we are in discussions with regulators, including discussions initiated by us, about actual or potential violations of law in order to remediate or mitigate associated legal or compliance risks. As the outcomes of such proceedings are unpredictable, we can give no assurance that the results of any such proceedings will not materially affect our reputation, our business, prospects, financial condition, results of operations, cash flows, as well as the trading price of our securities.
21
PART
II
Item 5.
Market for Registrant’s Common Equity, Related Stockholder Matters and Issuer Purchases of Equity Securities.
Market Information
Our Class A Common Stock is listed and publicly traded on the New York Stock Exchange (“NYSE”) under the symbol “COTY”.
|
Fiscal 2017
|
Fiscal 2016
|
|||||||||||||||||||||||
|
High
|
Low
|
Cash Dividends
|
High
|
Low
|
Cash Dividends
|
|||||||||||||||||||
|
July 1 - September 30
|
$
|
30.13
|
|
$
|
23.06
|
|
$
|
0.275
|
|
$
|
32.72
|
|
$
|
24.90
|
|
$
|
—
|
|
||||||
|
October 1 - December 31
|
25.34
|
|
17.94
|
|
0.125
|
|
30.76
|
|
25.17
|
|
0.25
|
|
||||||||||||
|
January 1 - March 31
|
20.09
|
|
18.12
|
|
0.125
|
|
29.59
|
|
21.48
|
|
—
|
|
||||||||||||
|
April 1 - June 30
|
20.51
|
|
16.95
|
|
0.125
|
|
31.60
|
|
24.74
|
|
—
|
|
||||||||||||
Stockholders of Record
As of June 30, 2017 there were 1,114 stockholders of record of our Class A Common Stock. The actual number of stockholders is greater than this number of record holders, and includes stockholders who are beneficial owners, but whose shares are held in street name by brokers and other nominees. This number of holders of record also does not include stockholders whose shares may be held in trust by other entities.
Dividend Policy
We have paid an annual dividend since Fiscal 2011, and we began paying a quarterly dividend in the Fiscal 2017. Subject to legally available funds, we expect to continue to pay a quarterly cash dividend on our Class A Common Stock, but there can be no assurance that our Board of Directors (“Board”) will continue to declare dividends or that any dividends will be paid in the anticipated amounts and frequency, or at all.
Furthermore, we are required to comply with certain covenants contained within the Coty Credit Agreement and Galleria Credit Agreement (each as defined in “Management’s Discussion and Analysis of Financial Condition and Results of Operations—Financial Condition—Liquidity and Capital Resources—Debt”). These covenants within each of these credit agreements contain customary representations and warranties as well as customary affirmative and negative covenants, including but not limited to, restrictions on incurrence of additional debt, liens, dividends and other restricted payments, asset sales, investments, mergers, acquisitions and affiliate transactions. See “Management’s Discussion and Analysis of Financial Condition and Results of Operations—Financial Condition—Liquidity and Capital Resources—Debt.”
22
Market Performance Graph
Comparison of Cumulative Total Return Since Date of IPO
(a)
Coty Inc., The S&P 500 Index, and Fiscal
2017
Peer Group
(b)
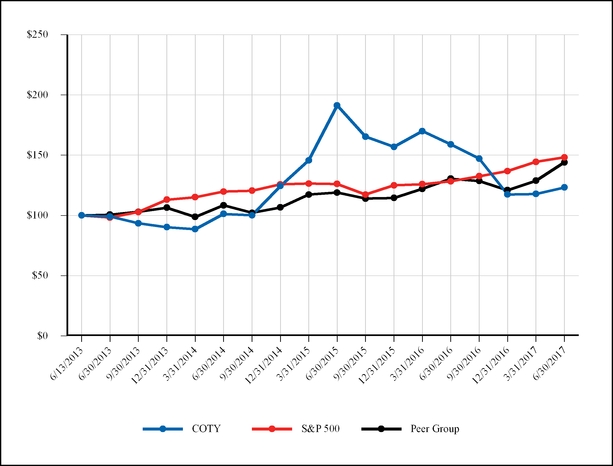
(a)
Total return assumes reinvestment of dividends at the closing price at the end of each quarter, since June 13, 2013, the date of the initial public offering (“IPO”).
(b)
The Peer Group includes L'Oréal S.A., Avon Products, Inc., Estee Lauder Companies, Inc. and Revlon, Inc.
The Market Performance Graph above assumes a $100.00 investment on June 13, 2013, in Coty Inc.’s common stock (on the date of the IPO), the S&P 500 Index and the Peer Group. The dollar amounts indicated in the graph above are as of the last trading day in the quarter.
23
Equity Compensation Plan Information
|
Plan Category
|
||||||||||
|
(1)
Number of securities
to be issued upon
exercise of outstanding
options, warrants
and rights
|
Weighted-average
exercise price
of outstanding
options, warrants
and rights
|
Number of securities
remaining available
for future issuance
under equity
compensation plans
(e
)
(excluding securities
reflected in column
(1)
)
|
||||||||
|
Equity compensation plans approved by security holders
|
|
|
||||||||
|
Options
|
11,425,247
|
|
$
|
15.91
|
|
|
||||
|
Series A Preferred Stock
(a)
|
2,511,172
|
|
24.71
|
|
||||||
|
Restricted Stock Units
|
5,630,188
|
|
N/A
|
|
|
|||||
|
Subtotal
|
19,566,607
|
|
—
|
|
54,979,175
|
|
||||
|
Equity compensation plans not approved by security holders
|
|
|
|
|||||||
|
Options
(b)
|
526,505
|
|
$
|
9.90
|
|
—
|
|
|||
|
Series A Preferred Stock
(a)(c)
|
1,645,921
|
|
24.58
|
|
||||||
|
Phantom Units
(d)
|
349,432
|
|
N/A
|
|
||||||
|
Subtotal
|
2,521,858
|
|
—
|
|
—
|
|
||||
|
Total
|
22,088,465
|
|
|
54,979,175
|
|
|||||
N/A is not applicable
(a)
Upon vesting of the Series A Preferred Stock, the recipient receives, in cash or shares, at our sole election, the fair market value of our Class A Common Stock on the vest date of the Series A Preferred Stock less the sum of the fair market value of our Class A Common Stock on the original issue date of the Series A Preferred Stock and a hurdle price specified in the recipient’s subscription agreement. As such, the benefit provided under the Series A Preferred Stock will always be based solely on the increase in value of our Class A Common Stock after the date of grant and the Series A Preferred Stock will not have any value until the value of our Class A Common Stock exceeds the value of such shares on the date of grant plus the specified hurdle.
(b)
Executive Ownership Plan. From fiscal 2008 until December 2012, we invited certain key executives to participate in our Executive Ownership Plan by purchasing shares of our common stock and receiving stock options to match such purchases. The Executive Ownership Plan was replaced by the Platinum Program in December 2012. All matching stock options have five-year cliff vesting tied to continued employment with us and continued ownership of the restricted shares that the matching stock options match.
(c)
On April 14, 2015, a duly constituted committee of the Board approved employment inducement awards outside of the Company’s Equity and Long-Term Incentive Plan of Series A Preferred Stock in the amount of 645,921 shares to Camillo Pane who had, at that time, been announced as the Company’s new Executive Vice President of Category Development. On March 27, 2017, the Board approved an award of 1,000,000 shares of Series A Preferred Stock, par value $0.01 per share, to Lambertus J.H. Becht in his capacity as a non-employee director to compensate him for services performed in connection with closing the P&G Beauty Business transaction, aiding with the transition of the new chief executive officer into his role and integrating the P&G Beauty Business.
(d)
On December 1, 2014, the Board granted Lambertus J.H. Becht an award of 49,432 phantom units (the “December Grant”). On July 21, 2015, the Board granted to Mr. Becht an award of 300,000 phantom units (the “July Grant”). Both the December Grant and July Grant to Mr. Becht were outside of the Company’s Equity and Long-Term Incentive Plan. At the time of December Grant, the phantom units had a value of $1,000,009 based on the closing price of the Company’s Class A Common Stock on December 1, 2014, and at the time of the July Grant, the phantom units had a value of approximately $8,106,000 based on the closing price of the Class A Common Stock on July 21, 2015. Each phantom unit has an economic value equivalent to one share of the Company’s Class A Common Stock. The phantom units vest on the fifth anniversary of the grant date and, in the event of a change in control or Mr. Becht’s death or disability, the phantom units shall vest immediately. Within 30 days of the grant date, Mr. Becht had the ability to elect whether to receive payment in respect of the phantom units in cash or shares of Class A Common Stock. Mr. Becht elected to receive payment in respect of the December Grant and the July Grant in shares of Class A Common Stock.
(e)
Reflects number of securities remaining available for future issuance under equity compensation plans, excluding share reserves related to terminated equity plans.
Issuer Purchases of Equity Securities
No shares of Class A Common Stock were repurchased during the fiscal quarter ended June 30, 2017.
24
Item 6.
Selected Financial Data.
|
(in millions, except per share data)
|
Year Ended June 30,
|
||||||||||||||||||
|
2017
(a)
|
2016
(b)
|
2015
(b)
|
2014
|
2013
|
|||||||||||||||
|
Consolidated Statements of Operations Data:
|
|||||||||||||||||||
|
Net revenues
|
$
|
7,650.3
|
|
$
|
4,349.1
|
|
$
|
4,395.2
|
|
$
|
4,551.6
|
|
$
|
4,649.1
|
|
||||
|
Gross profit
|
4,621.8
|
|
2,603.1
|
|
2,638.2
|
|
2,685.9
|
|
2,788.8
|
|
|||||||||
|
Restructuring costs
|
372.2
|
|
86.9
|
|
75.4
|
|
37.3
|
|
29.4
|
|
|||||||||
|
Acquisition-related costs
|
355.4
|
|
174.0
|
|
34.1
|
|
0.7
|
|
8.9
|
|
|||||||||
|
Asset impairment charges
|
—
|
|
5.5
|
|
—
|
|
316.9
|
|
1.5
|
|
|||||||||
|
Operating (loss) income
|
(437.8
|
)
|
254.2
|
|
395.1
|
|
25.7
|
|
394.4
|
|
|||||||||
|
Interest expense, net
|
218.6
|
|
81.9
|
|
73.0
|
|
68.5
|
|
76.5
|
|
|||||||||
|
Loss on early extinguishment of debt
|
—
|
|
3.1
|
|
88.8
|
|
—
|
|
—
|
|
|||||||||
|
Other expense (income), net
|
1.6
|
|
30.4
|
|
—
|
|
1.3
|
|
(0.8
|
)
|
|||||||||
|
(Loss) income before income taxes
|
(658.0
|
)
|
138.8
|
|
233.3
|
|
(44.1
|
)
|
318.7
|
|
|||||||||
|
(Benefit) provision for income taxes
|
(259.5
|
)
|
(40.4
|
)
|
(26.1
|
)
|
20.1
|
|
116.8
|
|
|||||||||
|
Net (loss) income
|
(398.5
|
)
|
179.2
|
|
259.4
|
|
(64.2
|
)
|
201.9
|
|
|||||||||
|
Net income attributable to noncontrolling interests
|
15.4
|
|
7.6
|
|
15.1
|
|
17.8
|
|
15.7
|
|
|||||||||
|
Net income attributable to redeemable noncontrolling interests
|
8.3
|
|
14.7
|
|
11.8
|
|
15.4
|
|
18.2
|
|
|||||||||
|
Net (loss) income attributable to Coty Inc.
|
$
|
(422.2
|
)
|
$
|
156.9
|
|
$
|
232.5
|
|
$
|
(97.4
|
)
|
$
|
168.0
|
|
||||
|
Per Share Data:
|
|||||||||||||||||||
|
Weighted-average common shares
|
|||||||||||||||||||
|
Basic
|
642.8
|
|
345.5
|
|
353.3
|
|
381.7
|
|
381.7
|
|
|||||||||
|
Diluted
|
642.8
|
|
354.2
|
|
362.9
|
|
381.7
|
|
396.4
|
|
|||||||||
|
Cash dividends declared per common share
|
$
|
0.65
|
|
$
|
0.25
|
|
$
|
0.20
|
|
$
|
0.20
|
|
$
|
0.15
|
|
||||
|
Net (loss) income attributable to Coty Inc. per common share:
|
|||||||||||||||||||
|
Basic
|
$
|
(0.66
|
)
|
$
|
0.45
|
|
$
|
0.66
|
|
$
|
(0.26
|
)
|
$
|
0.44
|
|
||||
|
Diluted
|
(0.66
|
)
|
0.44
|
|
0.64
|
|
(0.26
|
)
|
0.42
|
|
|||||||||
|
(in millions)
|
Year Ended June 30,
|
||||||||||||||||||
|
2017
(a)
|
2016
(b)
|
2015
(b)
|
2014
|
2013
|
|||||||||||||||
|
Consolidated Cash Flows Data:
|
|||||||||||||||||||
|
Net cash provided by operating activities
|
$
|
757.5
|
|
$
|
501.4
|
|
$
|
526.3
|
|
$
|
536.5
|
|
$
|
463.9
|
|
||||
|
Net cash (used in) investing activities
|
(1,163.6
|
)
|
(1,059.2
|
)
|
(171.2
|
)
|
(257.6
|
)
|
(229.9
|
)
|
|||||||||
|
Net cash provided by (used in) financing activities
|
595.2
|
|
592.6
|
|
(1,138.2
|
)
|
(5.7
|
)
|
69.0
|
|
|||||||||
25
|
(in millions)
|
As of June 30,
|
||||||||||||||||||
|
2017
(a)
|
2016
(b)
|
2015
(b)
|
2014
|
2013
|
|||||||||||||||
|
Consolidated Balance Sheet Data:
|
|||||||||||||||||||
|
Cash and cash equivalents
|
$
|
535.4
|
|
$
|
372.4
|
|
$
|
341.3
|
|
$
|
1,238.0
|
|
$
|
920.4
|
|
||||
|
Total assets
(c)
|
22,548.2
|
|
7,035.6
|
|
5,998.0
|
|
6,570.8
|
|
6,446.3
|
|
|||||||||
|
Total debt, net of discount
|
7,205.0
|
|
4,162.8
|
|
2,634.7
|
|
3,293.5
|
|
2,630.2
|
|
|||||||||
|
Total Coty Inc. stockholders’ equity
|
9,314.7
|
|
360.2
|
|
969.8
|
|
843.8
|
|
1,494.0
|
|
|||||||||
(a)
Included in fiscal 2017 are the financial impacts of the acquisitions of the P&G Beauty Business as of October 1, 2016, ghd as of November 21, 2016 and Younique as of February 1, 2017.
(b)
Included in fiscal 2016 and 2015 are the financial impacts of the Hypermarcas Brands as of February 1, 2016 and the Bourjois acquisition as of April 1, 2015.
(c)
In fiscal 2017, we adopted authoritative guidance issued by the Financial Accounting Standards Board requiring that debt issuance costs be presented in the balance sheet as a direct deduction from the carrying amount of the related debt liability, consistent with debt discounts. Prior to the adoption of this guidance, debt issuance costs were presented within Total assets in the Consolidated Balance Sheets. Total assets for all periods presented in the table above have been conformed to the current balance sheet presentation.
Item 7.
Management’s Discussion and Analysis of Financial Condition and Results of Operations.
The following discussion and analysis of the financial condition and results of operations of Coty Inc. and its consolidated subsidiaries, should be read in conjunction with the information contained in the Consolidated Financial Statements and related notes included elsewhere in this document. When used in this discussion, the terms “Coty,” the “Company,” “we,” “our,” or “us” mean, unless the context otherwise indicates, Coty Inc. and its majority and wholly-owned subsidiaries. The following discussion contains forward-looking statements. See “Special Note Regarding Forward-Looking Statements” and “Risk Factors” for a discussion on the uncertainties, risks and assumptions associated with these statements as well as any updates to such discussion as may be included in subsequent reports we file with the SEC. Actual results may differ materially from those contained in any forward-looking statements. The following discussion includes certain non-GAAP financial measures. See “Overview—Non-GAAP Financial Measures” for a discussion of non-GAAP financial measures and how they are calculated.
All dollar amounts in the following discussion are in millions of United States (“U.S.”) dollars, unless otherwise indicated.
OVERVIEW
We are a global beauty company and our strategic vision is to be a new global leader and challenger in the beauty industry. We manufacture, market, sell and distribute branded beauty products, including fragrances, color cosmetics, hair care products and skin & body related products throughout the world.
Operating and Reportable Segments
On October 1, 2016, we acquired certain assets and liabilities related to The Procter & Gamble Company’s global fine fragrances, salon professional, cosmetics and retail hair color businesses, along with select hair styling brands (such brands “P&G Beauty Business”, and such acquisition and the other transactions contemplated by the related acquisition agreement, the “Transactions”). Prior to the Transactions, we operated and managed our business as four operating and reportable segments: Fragrances, Color Cosmetics, Skin & Body Care, and the Brazil Acquisition. Following the close of the Transactions, we reorganized our business into three divisions: Luxury, Consumer Beauty and Professional Beauty, and we determined that our operating and reportable segments would reflect this new divisional structure. As a result of this change in segment reporting, we retrospectively revised prior period results, by segment, to conform to current period presentation. Certain shared costs and the results of corporate initiatives are managed outside of our three segments by Corporate.
Our organizational structure is product category focused, putting the consumer first, by specifically targeting how and where they shop and what and why they purchase. Each division has full end-to-end responsibility to optimize the consumers’ beauty experiences in their relevant categories and channels in this new organizational design and translate this into profitable growth.
The new operating and reportable segments are:
Luxury — primarily focused on prestige fragrances, premium skin care and premium cosmetics;
Consumer Beauty — primarily focused on color cosmetics, retail hair coloring and styling products, mass fragrance, mass skin care and body care;
Professional Beauty — primarily focused on hair and nail care products for professionals.
26
Geographic Structure
Additionally, in connection with the Company’s acquisition of the P&G Beauty Business, the Company reorganized its geographical structure to be North America (Canada and the United States), Europe and ALMEA (Asia, Latin America, the Middle East, Africa and Australia).
Business Overview
We continue to operate in a challenging environment, currently with declines in several of our segments and geographies in which we compete and, particularly for our Consumer Beauty segment, increasing competitive pressure and changing consumer preferences. In particular, declines in the retail nail, color cosmetics and hair color categories in the U.S. and mass fragrance in Western Europe and the U.S. continue to impact our business and financial results.
We consistently introduce new products and support new and established products through our focus on strategic advertising and merchandising, which we must continuously develop and evolve in response to competitors’ new products and shifting consumer preferences in order to offset the gradual decline of demand for products that are later in their lifecycles. The economics of developing, producing, launching, supporting and discontinuing products impact the timing of our sales and operating performance each period. We also continuously evaluate strategic transactions and new brand licenses to enhance our portfolio. During the fiscal year, we entered into an agreement to acquire the exclusive long-term global license rights for Burberry Beauty luxury fragrances, cosmetics and skincare, which will be managed within the Luxury division.
We believe our business has attractive opportunities, including the continued performance of our Professional Beauty segment and improving performance of our Luxury segment. However, in certain categories, our net revenues are declining faster than the category or despite category growth, and we have experienced challenges in our Consumer Beauty segment, including declines in distribution and reduction in shelf space for certain brands. We are focused on addressing those challenges through brand repositioning, innovation, in-store execution and end-to-end digital capabilities. We have also identified our non-core portfolio of brands, representing approximately 6% to 8% of our net revenues, and are exploring alternatives for these brands, including divestiture.
The diversion of resources to closing the Transactions and integrating the P&G Beauty Business, the recent changes in our management teams as we reorganized our business and transitional factors, including significantly higher than expected trade inventory prior to the closing of the Transactions, have negatively impacted our fiscal year results from certain P&G Beauty Business brands. However, we successfully exited the first two stages of our transition services agreement with P&G in our North American and European businesses, which positively impacted our annual and fourth quarter net revenues. We intend to complete the exit of the transition services agreement in calendar year 2017, which may impact our quarterly results in the remainder of the calendar year due to timing of shipment of orders or unexpected technical or other challenges with such exits. We are also working to address increases in our fixed cost base as a combined company. Such costs may be less predictable during the course of our integration efforts than in other periods.
As previously disclosed in connection with the Transactions, we expect to incur a total of approximately $1.2 billion of operating expenses and approximately $500 million of capital expenditures. Through
June 30, 2017
, we incurred life-to-date operating expenses and capital expenditures against these estimates of approximately $850 million and $250 million, respectively, and we expect the remaining operating expenses, including any anticipated restructuring activities, and capital expenditures to be incurred in future periods through fiscal 2020. Further, in connection with the Transactions, we are implementing our plan through which we continue to target realizing approximately $750 million of synergies driven by cost, procurement, supply chain and selling, general, and administrative savings over the next four years. We realized cumulative synergies of approximately 20% in fiscal 2017, and we expect to cumulatively generate approximately 50% of the net synergies through fiscal 2018, approximately 80% through fiscal 2019 and the full $750 million through fiscal 2020.
Non-GAAP Financial Measures
To supplement the financial measures prepared in accordance with GAAP, we use non-GAAP financial measures including Adjusted operating income, Adjusted net income attributable to Coty Inc. and Adjusted net income attributable to Coty Inc. per common share (collectively, the “Adjusted Performance Measures”). The reconciliations of these non-GAAP financial measures to the most directly comparable financial measures calculated and presented in accordance with GAAP are shown in the tables below. See “Management’s Discussion and Analysis of Financial Condition and Results of Operations—Twelve Months Ended June 30, 2017 As Compared To Twelve Months Ended June 30, 2016.” These non-GAAP financial measures should not be considered in isolation from, or as a substitute for or superior to, financial measures reported in accordance with GAAP. Moreover, these non-GAAP financial measures have limitations in that they do not reflect all the items associated with the operations of the business as determined in accordance with GAAP. Other companies, including companies in the beauty industry, may calculate similarly titled non-GAAP financial measures differently than we do, limiting the usefulness of those measures for comparative purposes.
27
Despite the limitations of these non-GAAP financial measures, our management uses the Adjusted Performance Measures as key metrics in the evaluation of our performance and annual budgets and to benchmark performance of our business against our competitors. The following are examples of how these Adjusted Performance Measures are utilized by our management:
|
•
|
strategic plans and annual budgets are prepared using the Adjusted Performance Measures;
|
|
•
|
senior management receives a monthly analysis comparing budget to actual operating results that is prepared using the Adjusted Performance Measures; and
|
|
•
|
senior management’s annual compensation is calculated, in part, by using the Adjusted Performance Measures.
|
In addition, our financial covenant compliance calculations under our debt agreements are substantially derived from these
Adjusted Performance Measures.
Our management believes that Adjusted Performance Measures are useful to investors in their assessment of our operating performance and the valuation of the Company. In addition, these non-GAAP financial measures address questions we routinely receive from analysts and investors and, in order to ensure that all investors have access to the same data, our management has determined that it is appropriate to make this data available to all investors. The Adjusted Performance Measures exclude the impact of certain items (as further described below) and provide supplemental information regarding our operating performance. By disclosing these non-GAAP financial measures, our management intends to provide investors with a supplemental comparison of our operating results and trends for the periods presented. Our management believes these measures are also useful to investors as such measures allow investors to evaluate our performance using the same metrics that our management uses to evaluate past performance and prospects for future performance. We provide disclosure of the effects of these non-GAAP financial measures by presenting the corresponding measure prepared in conformity with GAAP in our financial statements, and by providing a reconciliation to the corresponding GAAP measure so that investors may understand the adjustments made in arriving at the non-GAAP financial measures and use the information to perform their own analyses.
Adjusted operating income excludes restructuring costs and business structure realignment programs, amortization, acquisition-related costs and acquisition accounting impacts, the impact of accounting modifications from liability plan accounting to equity plan accounting as a result of amended share-based compensation plans, asset impairment charges and other adjustments as described below. We do not consider these items to be reflective of our core operating performance due to the variability of such items from period-to-period in terms of size, nature and significance. They are primarily incurred to realign our operating structure and integrate new acquisitions, and fluctuate based on specific facts and circumstances. Additionally, Adjusted net income attributable to Coty Inc. and Adjusted net income attributable to Coty Inc. per common share are adjusted for certain interest and other (income) expense as described below and the related tax effects of each of the items used to derive Adjusted net income as such charges are not used by our management in assessing our operating performance period-to-period.
The Adjusted Performance Measures were changed in the fourth quarter of fiscal 2016 to incorporate the exclusion of expense and tax effects associated with the amortization of acquisition-related intangible assets. Our management believes that such amortization is not reflective of the results of operations in a particular year because the intangible assets result from the allocation of the acquisition purchase price to the fair value of identifiable intangible assets acquired. The effect of this exclusion on our non-GAAP presentation was to amend Adjusted operating income in a manner that provides investors with a measure of our operating performance that facilitates period to period comparisons, as well as comparability to our peers. Exclusion of the amortization expense allows investors to compare operating results that are consistent over time for the consolidated company, including newly acquired and long-held businesses, to both acquisitive and nonacquisitive peer companies.
Adjusted Performance Measures reflect adjustments based on the following items:
|
•
|
Costs related to acquisition activities: We have excluded acquisition-related costs and acquisition accounting impacts such as those related to transaction costs and costs associated with the revaluation of acquired inventory in connection with business combinations because these costs are unique to each transaction. The nature and amount of such costs vary significantly based on the size and timing of the acquisitions and the maturities of the businesses being acquired. Also, the size, complexity and/or volume of past acquisitions, which often drives the magnitude of such expenses, may not be indicative of the size, complexity and/or volume of any future acquisitions.
|
|
•
|
Restructuring and other business realignment costs: We have excluded costs associated with restructuring and business structure realignment programs to allow for comparable financial results to historical operations and forward-looking guidance. In addition, the nature and amount of such charges vary significantly based on the size and timing of the programs. By excluding the referenced expenses from our non-GAAP financial measures, our management is able to further evaluate our ability to utilize existing assets and estimate their long-term value. Furthermore, our management
|
28
believes that the adjustment of these items supplement the GAAP information with a measure that can be used to assess the sustainability of our operating performance.
|
•
|
Amortization expense: We have excluded the impact of amortization of finite-lived intangible assets, as such non-cash amounts are inconsistent in amount and frequency and are significantly impacted by the timing and/or size of acquisitions. Our management believes that the adjustment of these items supplement the GAAP information with a measure that can be used to assess the sustainability of our operating performance. Although we exclude amortization of intangible assets from our non-GAAP expenses, our management believes that it is important for investors to understand that such intangible assets contribute to revenue generation. Amortization of intangible assets that relate to past acquisitions will recur in future periods until such intangible assets have been fully amortized. Any future acquisitions may result in the amortization of additional intangible assets.
|
|
•
|
Asset impairment charges: We have excluded the impact of asset impairments as such non-cash amounts are inconsistent in amount and frequency and are significantly impacted by the timing and/or size of acquisitions. Our management believes that the adjustment of these items supplement the GAAP information with a measure that can be used to assess the sustainability of our operating performance.
|
|
•
|
Share-based compensation adjustment: During fiscal 2016 and 2015, we excluded the impact of the fiscal 2013 accounting modification from liability plan to equity plan accounting for the share-based compensation plans as well as other share-based compensation transactions that are not reflective of the ongoing and planned pattern of recognition for such expense. Refer to “Management’s Discussion and Analysis of Financial Condition and Results of Operations – Critical Accounting Policies and Estimates” contained in our Annual Report on Form 10-K filed with the SEC for the fiscal year ended June 30, 2016 for a full discussion of the share-based compensation adjustment.
|
|
•
|
Interest and other (income) expense: We have excluded foreign currency impacts associated with acquisition-related and debt financing related forward contracts as the nature and amount of such charges are not consistent and are significantly impacted by the timing and size of such transactions.
|
|
•
|
Loss on early extinguishment of debt: We have excluded loss on extinguishment of debt as this represents a non-cash charge, and the amount and frequency of such charges is not consistent and is significantly impacted by the timing and size of debt financing transactions.
|
|
•
|
Redeemable noncontrolling interest: This adjustment represents the after-tax impact of the non-GAAP adjustments included in Net income attributable to redeemable noncontrolling interests based on the relevant non-controlling interest percentage.
|
|
•
|
Tax: This adjustment represents the impact of the tax effect of the pretax items excluded from Adjusted net income. The tax impact of the non-GAAP adjustments are based on the tax rates related to the jurisdiction in which the adjusted items are received or incurred.
|
While acquiring brands and licenses comprises a part of our overall growth strategy, along with targeting organic growth opportunities, we have excluded acquisition-related costs and acquisition accounting impacts in connection with business combinations because these costs are unique to each transaction and the amount and frequency are not consistent and are significantly impacted by the timing and size of our acquisitions. Our management assesses the success of an acquisition as a component of performance using a variety of indicators depending on the size and nature of the acquisition, including:
|
•
|
the scale of the combined company by evaluating consolidated and segment financial metrics;
|
|
•
|
the expansion of product offerings by evaluating segment, brand, and geographic performance and the respective strength of the brands;
|
|
•
|
the evaluation of market share expansion in categories and geographies;
|
|
•
|
the earnings per share accretion and substantial incremental free cash flow generation providing financial flexibility for us; and
|
|
•
|
the comparison of actual and projected results, including achievement of projected synergies, post integration; provided that timing for any such comparison will depend on the size and complexity of the acquisition.
|
29
Constant Currency
We operate on a global basis, with the majority of our net revenues generated outside of the U.S. Accordingly, fluctuations in foreign currency exchange rates can affect our results of operations. Therefore, to supplement financial results presented in accordance with GAAP, certain financial information is presented in “constant currency”, excluding the impact of foreign currency exchange translations to provide a framework for assessing how our underlying businesses performed excluding the impact of foreign currency exchange translations. Constant currency information compares results between periods as if exchange rates had remained constant period-over-period. We calculate constant currency information by translating current and prior-period results for entities reporting in currencies other than U.S. dollars into U.S. dollars using prior year foreign currency exchange rates. The constant currency calculations do not adjust for the impact of revaluing specific transactions denominated in a currency that is different to the functional currency of that entity when exchange rates fluctuate. The constant currency information we present may not be comparable to similarly titled measures reported by other companies.
Basis of Presentation of Acquisitions
We closed the following acquisitions during the periods presented in this Management’s Discussion and Analysis of Financial Condition and Results of Operations: (i) the P&G Beauty Business during the second quarter of fiscal 2017, (ii) ghd during the second quarter of fiscal 2017, (iii) Younique during the third quarter of fiscal 2017, (iv) the Hypermarcas Brands during the third quarter of fiscal 2016, and (v) Bourjois during the fourth quarter of fiscal 2015. In addition, we divested one of our fragrance brands in the third quarter of fiscal 2017, the
Cutex
brand in the fourth quarter of fiscal 2016, and the
TJoy
brand in fiscal 2014. We also reorganized our mass business in China in fiscal 2014. Collectively, the impact of the discontinuation of the
TJoy
brand and the reorganization of our mass business in China is referred to herein as the “China Optimization”.
During the period we complete an acquisition or divestiture, the financial results of the current period are not comparable to the financial results presented in the prior year period. To maintain a consistent basis between periods, we exclude the financial contribution of the respective brands or businesses until we have twelve months of comparable financial results. When used herein, the terms “Acquisitions” and “Divestitures” refer collectively to the financial contributions during the period that are not comparable to the prior period as a result of the acquisitions and divestitures, respectively.
NET REVENUES
In fiscal
2017
, net revenues
increased
76%
, or
$3,301.2
, to
$7,650.3
from
$4,349.1
in fiscal
2016
. The acquisition of the P&G Beauty Business comprised
41%
of total net revenues for the fiscal year and the Hypermarcas Brands, ghd and Younique combined comprised
7%
of the total net revenues for the fiscal year. The acquisition of the P&G Beauty Business was the primary driver of the significant increase in total net revenues in all of our segments and geographic regions. The increase in net revenues in fiscal
2017
reflects an increase in unit volume of 75% and a positive price and mix impact of 4%, partially offset by a negative foreign currency exchange translations impact of 3%. Excluding the impacts of the Acquisitions and Divestitures, total net revenues in fiscal
2017
decreased 8% reflecting a negative price and mix impact of 4%, a decrease in unit volume of 3% and a negative foreign currency exchange translations impact of 1%.
In fiscal
2016
, net revenues decreased
1%
, or
$46.1
, to
$4,349.1
from
$4,395.2
in fiscal
2015
. The decrease was the result of a negative price and mix impact of 9% and a negative foreign currency exchange translations impact of 5%, partially offset by an increase in unit volume of 13%. The incremental net revenues from the Hypermarcas Brands and the Bourjois Acquisition comprised 5% of total net revenues for the fiscal year. Excluding the impacts from the Acquisitions and Divestitures and foreign currency exchange translations, total net revenues in fiscal 2016 decreased 1% reflecting a decrease in unit volume of 5%, partially offset by a positive price and mix impact of 4%.
Net Revenues by Segment
|
Year Ended June 30,
|
Change %
|
||||||||||||||||
|
(in millions)
|
2017
|
2016
|
2015
|
2017/2016
|
2016/2015
|
||||||||||||
|
NET REVENUES
|
|||||||||||||||||
|
Luxury
|
$
|
2,566.6
|
|
$
|
1,836.6
|
|
$
|
1,938.3
|
|
40
|
%
|
(5
|
%)
|
||||
|
Consumer Beauty
|
3,688.2
|
|
2,262.5
|
|
2,185.4
|
|
63
|
%
|
4
|
%
|
|||||||
|
Professional Beauty
|
1,395.5
|
|
250.0
|
|
271.5
|
|
>100%
|
|
(8
|
%)
|
|||||||
|
Total
|
$
|
7,650.3
|
|
$
|
4,349.1
|
|
$
|
4,395.2
|
|
76
|
%
|
(1
|
%)
|
||||
Luxury
30
In fiscal
2017
, net revenues from the Luxury segment
increased
40%
, or
$730.0
to
$2,566.6
from
$1,836.6
in fiscal
2016
, primarily due to the impact of the Acquisitions. The acquisition of the P&G Beauty Business comprised 33% of the total net revenues for the segment.
Hugo Boss
and
Gucci
fragrances were the largest contributors to net revenues as a result of the acquisition of the P&G Beauty Business. Excluding the impacts of the Acquisitions and Divestitures, net revenues from the Luxury segment decreased 6%, or $110.0, to $1,726.6 in fiscal
2017
from
$1,836.6
in fiscal
2016
, reflecting a negative price and mix impact of 3%, a decrease in unit volume of 2%, and a negative foreign currency exchange translations impact of 1%. This decrease primarily reflects lower net revenues from
Calvin Klein
and
Marc Jacobs
fragrances. Net revenues from
Calvin Klein
declined due to: (i) our strategic efforts to rationalize wholesale distribution by reducing the amount of product diversion to the value and mass channels resulting in a lower volume and (ii) a higher level of discounting and promotional activities resulting in a negative price and mix. The decline in
Marc Jacobs
primarily reflects declines in volumes from existing product lines and a lower level of launch activity in fiscal
2017
as compared to fiscal
2016
.
In fiscal
2016
, net revenues from the Luxury segment
decreased
5%
or
$101.7
to
$1,836.6
from
$1,938.3
in fiscal
2015
, reflecting a negative foreign currency exchange translations impact of 4% and a negative price and mix impact of 1%, while volume remained consistent. Contributing to the segment declines were lower net revenues from
Calvin Klein
and
Davidoff
reflecting declines in existing product lines, a lower level of launch activity in fiscal 2016 as compared to fiscal 2015 and a negative foreign currency exchange translations impact. Net revenue declines in the segment were partially offset by the launch of the
Miu Miu
fragrance as well as growth from
Marc Jacobs
. Growth from
Marc Jacobs
primarily reflects incremental net revenues from the launches of
Marc Jacobs Decadence
and
Marc Jacobs Splash,
partially offset by declines in existing product lines. Additionally, lower net revenues from
philosophy
contributed to the decline in the segment in part reflecting a different timing of orders and a lower level of promotional campaigns at a key U.S. customer. The negative price and mix impact for the segment primarily reflects a higher relative volume of lower-priced
Calvin Klein
products.
Consumer Beauty
In fiscal
2017
, net revenues from the Consumer Beauty segment
increased
63%
, or
$1,425.7
, to
$3,688.2
from
$2,262.5
in fiscal
2016
, primarily due to the impact of the Acquisitions. The acquisition of the P&G Beauty Business, Younique and the incremental net revenues from the seven months of the Hypermarcas Brands in fiscal 2017, comprised 35%, 5% and 5%, respectively, of the total net revenues for the segment.
CoverGirl
and
Max Factor
cosmetics and the retail product line of
Wella
and
Clairol
hair products were the largest contributors to net revenues as a result of the acquisition of the P&G Beauty Business, although these and other brands were negatively impacted as we reorganized our business and by transitional factors, including significantly higher than expected trade inventory prior to the closing of the Transactions. Additionally, a reduction in shelf space and declines in certain of these brands negatively impacted our results. Excluding the impacts of the Acquisitions and the Divestitures, net revenues from the Consumer Beauty segment decreased 10%, or $217.7, to $2,038.5 in fiscal 2017 from $2,256.2 in fiscal 2016, primarily reflecting a negative price and mix impact of 5%, a decrease in unit volume of 3%, and a negative foreign currency exchange translations impact of 2%. The decrease in net revenues primarily reflects lower net revenues from mass fragrances, as well as
Sally Hansen
and
Rimmel
. Mass fragrances declined in part due to a decrease in volume from brands that are later in their lifecycles and our continued efforts to execute portfolio rationalization in non-strategic distribution channels, and have also been adversely impacted by a negative market trend in the U.S. Lower net revenues from
Sally Hansen
and
Rimmel
reflect a decrease in volume as the result of the implementation of a new inventory management system by a key U.S. customer and a negative foreign currency translations impact. Lower net revenues from
Sally Hansen
also reflect the negative retail nail market trend in the U.S. and a lower volume of relative higher priced products. The declines in the segment were partially offset by higher net revenues from an increase in volume from the Hypermarcas Brands during the five months of the comparable periods and an increase in volume from Bourjois due to continued expansion in Eastern Europe.
In fiscal
2016
, net revenues from the Consumer Beauty segment
increased
4%
, or
$77.1
, to
$2,262.5
from
$2,185.4
in fiscal
2015
. The acquisition of the Hypermarcas Brands and the incremental net revenues from the nine months of
Bourjois
in fiscal 2016 comprised 4% and 6%, respectively, of the total net revenues for the segment. Excluding the net revenues from the Acquisitions and Divestitures, net revenues from the Consumer Beauty segment decreased 7%, or $147.9, to $2,028.7 in fiscal 2016 from $2,176.6 in fiscal 2015, primarily reflecting a negative foreign currency exchange translations impact of 7% and a decrease in unit volume of 5%, partially offset by a positive price and mix impact of 5%. The decrease in net revenues primarily reflects: (i) lower net revenues from mass fragrances, in part due to brands that are later in their lifecycles and our continued efforts to execute portfolio rationalization on lower-volume product lines in non-strategic distribution channels, and have also been adversely impacted by a negative market trend in the U.S. and have also been adversely impacted by a negative market trend in the U.S., (ii) lower net revenues from
Playboy
due to declines in existing product lines, partially offset by incremental net revenues from the launch of the
Playboy Play It Wild
franchise and (iii) lower net revenues from
N.Y.C. New York Color
which declined in part due to shelf space reduction at certain retailers in the U.S. as well as a management decision to discontinue the brand in the U.K. The positive price and mix impact in part reflects lower relative volumes of lower-priced products, such as
N.Y.C. New York Color
and higher relative volumes of higher-priced products, such as
Sally Hansen
.
31
Professional Beauty
In fiscal
2017
, net revenues from the Professional Beauty segment increased greater than 100%, or
$1,145.5
, to
$1,395.5
from
$250.0
in fiscal
2016
, primarily due to the impact of the Acquisitions. The acquisitions of the P&G Beauty Business and ghd comprised 74% and 10%, respectively, of the total net revenues for the segment. The professional product line of
Wella
hair products was the largest contributor to net revenues as a result of the P&G Beauty Business acquisition. Excluding the impacts of the Acquisitions and Divestitures, net revenues from the Professional Beauty segment decreased 12%, or $30.5 to $219.5 in fiscal 2017, from $250.0 in fiscal 2016, primarily reflecting the following activity related to
OPI
: (i) a decrease in unit volume of 8% as a result of declines from existing lacquer product lines, partially offset by an increase in volume of gel and long wear product lines, (ii) a negative price and mix impact of 3% as a result of unfavorable regional, channel and promotional mix and (iii) a negative foreign currency exchange translations impact of 1%.
In fiscal
2016
, net revenues from the Professional Beauty segment
decreased
8%
, or
$21.5
, to
$250.0
from
$271.5
in fiscal
2015
, with declines in
OPI
. The net revenues decrease was primarily the result of a decrease in unit volume of 10%, and a negative foreign currency exchange translations impact of 2%, partially offset by a positive price and mix impact of 4%.
OPI
net revenues decreased primarily due to declining lacquer products in the U.S. professional channel. Partially offsetting the overall declines in
OPI
were incremental net revenues from product launches such as the
OPI Hello Kitty
collection and
OPI Infinite Shine
as well as growth in ALMEA. The positive price and mix impact in part reflects higher relative volumes of higher-priced
OPI
products.
Net Revenues by Geographic Regions
In addition to our reporting segments, net revenues by geographic regions are as follows. We define our geographic regions as North America (comprising Canada and the United States), Europe and ALMEA (comprising Asia, Latin America, the Middle East, Africa and Australia):
|
Year Ended June 30,
|
Change %
|
||||||||||||||||
|
(in millions)
|
2017
|
2016
|
2015
|
2017/2016
|
2016/2015
|
||||||||||||
|
NET REVENUES
|
|||||||||||||||||
|
North America
|
$
|
2,506.9
|
|
$
|
1,413.0
|
|
$
|
1,499.7
|
|
77
|
%
|
(6
|
%)
|
||||
|
Europe
|
3,325.7
|
|
1,924.6
|
|
1,961.6
|
|
73
|
%
|
(2
|
%)
|
|||||||
|
ALMEA
|
1,817.7
|
|
1,011.5
|
|
933.9
|
|
80
|
%
|
8
|
%
|
|||||||
|
Total
|
$
|
7,650.3
|
|
$
|
4,349.1
|
|
$
|
4,395.2
|
|
76
|
%
|
(1
|
%)
|
||||
North America
In fiscal
2017
, net revenues in North America
increased
77%
or
$1,093.9
, to
$2,506.9
from
$1,413.0
in fiscal
2016
, primarily due to the impact of the Acquisitions. Excluding the impact of the Acquisitions and Divestitures, net revenues in North America decreased
10%
or
$141.8
, to
$1,271.2
in fiscal 2017 from
$1,413.0
in fiscal
2016
, primarily due to lower net revenues in the U.S. from
Sally Hansen
, in part reflecting negative market trends in the retail nail market in the U.S.,
N.Y.C. New York Color
and
Rimmel
in the Consumer Beauty division, as well as,
OPI
in the Professional Beauty division. There was no impact from foreign currency exchange translations in North America.
In fiscal
2016
, net revenues in North America decreased
6%
or
$86.7
, to
$1,413.0
from
$1,499.7
in fiscal
2015
, primarily due to
lower net revenues in the U.S. Lower net revenues in the U.S. were primarily due to a decline in mass fragrances in the Consumer Beauty division, in part due to brands that are later in their life cycles and have been adversely impacted by negative market trends, as well as the Professional Beauty division. Excluding the negative foreign currency exchange translations impact of 1%, net revenues in North America decreased 5%.
Europe
In fiscal
2017
, net revenues in Eu
rope increased
73%
, or
1,401.1
, to
$3,325.7
from
$1,924.6
in fiscal
2016
, primarily due to the impact of the Acquisitions. Excluding the impacts of the Acquisitions and Divestitures, net revenues in Europe decreased
13%
, or
$242.2
, to
$1,682.4
in fiscal 2017 from
$1,924.6
in fiscal 2016, primarily due to lower net revenues from mass fragrances across the region as a result of a negative market trend in Europe,
Rimmel
in the U.K.,
Astor
in Germany and Eastern Europe,
Playboy
in Germany, France, and Eastern Europe and
adidas
in the U.K. and Germany, partially offset by growth in
Bourjois
in Eastern Europe. Excluding the impact of the Acquisitions, Divestitures and the negative foreign currency exchange translations impact of 4%, net revenues in Europe decreased 9%.
In fiscal
2016
, net revenues in Europe decreased
2%
, or
$37.0
, to
$1,924.6
from
$1,961.6
in fiscal
2015
, primarily due to declines in Germany and the U.K., partially offset by increases in the regional export business and France from incremental net
32
revenues from
Bourjois
. Declines in Germany reflect a negative foreign currency exchange translations impact. Excluding this impact, net revenues in Germany increased primarily driven by growth in
Rimmel
and
Sally Hansen
, partially offset by declines in mass fragrances. Net revenues in the U.K. were adversely impacted by a negative foreign currency exchange translations impact, as well as declines in mass fragrances and
Calvin Klein
, partially offset by incremental net revenues from
Bourjois
. Excluding the impact of the Acquisitions and Divestitures of 6% and a negative foreign currency exchange translations impact of 7%, net revenues in Europe for fiscal 2016 decreased 1%.
ALMEA
In fiscal
2017
, net revenues in ALMEA
increased
80%
, or
$806.2
, to
$1,817.7
from
$1,011.5
in fiscal
2016
, primarily due to the impact of the Acquisitions. Excluding the impacts of the Acquisitions and Divestitures, net revenues in ALMEA increased
2%
, or
$19.4
, to
$1,030.9
in fiscal 2017 from
$1,011.5
in fiscal 2016, primarily due to the Hypermarcas Brands in Brazil during the five months of the comparable periods, partially offset by declines in Calvin Klein in China and Marc Jacobs in our travel retail business in Latin America. Excluding the impact of the Acquisitions, Divestitures and the positive foreign currency exchange translations impact of 1%, net revenues in ALMEA increased 1%.
In fiscal
2016
, net revenues in ALMEA
increased
8%
or
$77.6
, to
$1,011.5
from
$933.9
in fiscal
2015
, primarily due to the acquisition of the Hypermarcas Brands. Additionally, an increase in net revenues in the Middle East from prestige fragrances contributed to the overall increase in the region, partially offset by a decrease in our travel retail business. Excluding the impact of the Acquisitions and Divestitures of 9% and a negative foreign currency exchange translations impact of 7%, net revenues in ALMEA for fiscal 2016 increased 6%.
COST OF SALES
In fiscal
2017
, cost of sales
increased
73%
, or
$1,282.5
, to
$3,028.5
from
$1,746.0
in fiscal
2016
, primarily due to the impact of the Acquisitions. Cost of sales as a percentage of net revenues decreased to
39.6%
in fiscal
2017
from
40.1%
in fiscal
2016
, resulting in a gross margin improvement of approximately
50
basis points primarily reflecting the acquisitions of higher margin businesses in fiscal 2017 including the P&G Beauty Business and Younique and continued contribution from our supply chain savings program partially offset by: (i) the negative impact of the revaluation of acquired inventory from the Acquisitions, (ii) the negative impact of inventory buyback associated with distributor terminations relating to the acquisition of the P&G Beauty Business and (iii) higher promotional and discounted pricing activity reported in net revenues.
In fiscal
2016
, cost of sales
decreased
1%
, or
$11.0
, to
$1,746.0
from
$1,757.0
in fiscal
2015
. Cost of sales as a percentage of net revenues increased to
40.1%
in fiscal
2016
from
40.0%
in fiscal
2015
, resulting in a gross margin decline of approximately 10 basis points. In fiscal
2016
, cost of sales was negatively impacted by certain items, such as the revaluation of acquired inventory related to the Hypermarcas Brands and Bourjois Acquisition. In fiscal
2015
, cost of sales included the positive impact from refinement of estimates associated with China Optimization and the negative impacts from the Bourjois Acquisition, primarily reflecting revaluation of acquired inventory, as well as inventory buyback as we converted one of our distributors to a subsidiary distribution model in the Middle East. Excluding these items, gross margin improved by approximately 30 basis points, which includes a positive impact of approximately 20 basis points from the addition of the Bourjois Acquisition and a negative impact of approximately 70 basis points from the addition of the Hypermarcas Brands. The improvement in gross margin primarily reflects the positive impact of lower promotional and discounted pricing activity, reported in net revenues, and continued contribution from our supply chain savings program, reported in cost of sales.
SELLING, GENERAL AND ADMINISTRATIVE EXPENSES
In fiscal
2017
, selling, general and administrative expenses increased greater than 100%, or
$2,032.2
, to
$4,060.0
from
$2,027.8
in fiscal
2016
, primarily due to the impact of the Acquisitions. Selling, general and administrative expenses as a percentage of net revenues increased to
53.1%
in fiscal
2017
from
46.6%
in fiscal
2016
, or approximately 650 basis points. This increase primarily reflects approximately 500 basis points related to higher administrative costs and approximately 240 basis points related to higher advertising and consumer promotion spending, partially offset by approximately 50 basis points related to the transactional impact from our exposure to foreign currency exchange fluctuations and 40 basis points related to lower share-based compensation expenses. The higher administrative costs as a percentage of net revenues is primarily due to consulting expenses and compensations costs incurred in connection with the integration of the P&G Beauty Business and the new organizational structure in the Professional Beauty division where we acquired a large sales organization to service the salon business. The higher advertising and consumer promotion spending as a percentage of net revenues is primarily due to (i) the impact of the higher spending ratio for the P&G Beauty Business as compared with the Legacy-Coty business in fiscal 2016 and (ii) increased spending primarily supporting
Rimmel
,
Sally Hansen
and
Bourjois
.
In fiscal
2016
, selling, general and administrative expenses
decreased
2%
, or
$38.3
, to
$2,027.8
from
$2,066.1
in fiscal
2015
. Selling, general and administrative expenses as a percentage of net revenues decreased to
46.6%
in fiscal
2016
from
47.0%
in fiscal
2015
. This decrease of
40
basis points includes approximately 10 basis points related to lower costs related to acquisition activities, business realignment costs, share-based compensation expense adjustment, China Optimization costs and
33
real estate consolidation program costs. Excluding these items described above, selling, general and administrative expenses decreased 2%, or $32.7, to
$2,001.7
from $2,034.4 in fiscal
2015
and decreased as a percentage of net revenues to
46.0%
from 46.3%, or approximately 30 basis points. This decrease primarily reflects approximately 80 basis points related to lower advertising and consumer promotion spending and approximately 50 basis points related to lower administrative costs, partially offset by approximately 40 basis points related to reserves in connection with liquidity issues at a key distributor in China, approximately 30 basis points of higher share-based compensation expenses and approximately 30 basis points related to the transactional impact from our exposure to foreign currency exchange fluctuations. Advertising and consumer promotion expense decreased due to a reduction in non-strategic spending and a positive foreign exchange translations impact, which enabled us to increase investment in consumer-facing media and absorb added costs related to the Bourjois Acquisition and the acquisition of the Hypermarcas Brands. Despite added costs from acquisitions, administrative costs decreased primarily reflecting a positive foreign currency exchange translations impact, lower costs related to the management incentive program and savings from our Organizational Redesign and cost control measures. Increased share-based compensation primarily reflects a higher level of options exercises resulting in increased fringe benefit expense in fiscal 2016.
OPERATING (LOSS) INCOME
In fiscal
2017
, operating loss of
$437.8
declined greater than 100%, or
$692.0
, from income of
$254.2
in fiscal
2016
. Operating margin, or operating (loss) income as a percentage of net revenues, declined to
(5.7)%
of net revenues in fiscal
2017
as compared to
5.8%
in fiscal
2016
. This margin decline of approximately 1150 basis points primarily reflects approximately
650
basis points related to higher selling, general and administrative expenses, approximately
290
basis points related to higher restructuring expenses, approximately
180
basis points related to higher amortization expense, approximately
60
basis points related to higher acquisition-related costs and approximately
50
basis points related to lower gains on sale of assets, partially offset by approximately
50
basis points related to lower cost of sales and
10
basis points related to asset impairment charges in fiscal 2016 that did not recur in fiscal 2017.
In fiscal
2016
, operating income
decreased
36%, or
$140.9
, to
$254.2
from
$395.1
in fiscal
2015
. Operating margin, or operating income as a percentage of net revenues, decreased
to
5.8%
of net revenues in fiscal
2016
as compared to
9.0%
in fiscal
2015
.
This margin decline of approximately 320 basis points reflects approximately 320 basis points related to higher acquisition-related costs, approximately 30 basis points related to higher restructuring expense, approximately 30 basis points related to higher amortization expense and asset impairment charges and approximately 10 basis points related to higher cost of sales, partially offset by approximately 40 basis points related to gains on the sale of assets and approximately 40 basis points related to lower selling, general and administrative expenses.
Operating (Loss) Income by Segment
|
Year Ended June 30,
|
Change %
|
||||||||||||||||
|
(in millions)
|
2017
|
2016
|
2015
|
2017/2016
|
2016/2015
|
||||||||||||
|
OPERATING (LOSS) INCOME
|
|||||||||||||||||
|
Luxury
|
$
|
158.0
|
|
$
|
228.9
|
|
$
|
313.1
|
|
(31
|
%)
|
(27
|
%)
|
||||
|
Consumer Beauty
|
261.2
|
|
246.5
|
|
156.4
|
|
6
|
%
|
58
|
%
|
|||||||
|
Professional Beauty
|
78.5
|
|
68.0
|
|
74.8
|
|
15
|
%
|
(9
|
%)
|
|||||||
|
Corporate
|
(935.5
|
)
|
(289.2
|
)
|
(149.2
|
)
|
<(100%)
|
|
(94
|
%)
|
|||||||
|
Total
|
$
|
(437.8
|
)
|
$
|
254.2
|
|
$
|
395.1
|
|
<(100%)
|
|
(36
|
%)
|
||||
Luxury
In fiscal
2017
, operating income for Luxury decreased
31%
, or
$70.9
, to
$158.0
from
$228.9
in fiscal
2016
. Operating margin
decreased
to
6.2%
of net revenues in fiscal
2017
as compared to
12.5%
in fiscal
2016
, primarily driven by higher selling, general and administrative expenses as a percentage of net revenues and amortization expense as a percentage of net revenues, partially offset by lower cost of goods sold as a percentage of net revenues.
In fiscal
2016
, operating income for Luxury
decreased
27%
, or
$84.2
, to
$228.9
from
$313.1
in fiscal
2015
. Operating margin
decreased
to
12.5%
of net revenues in fiscal
2016
as compared to
16.2%
in fiscal
2015
,
primarily driven by higher cost of sales as a percentage of net revenues, partially offset by lower selling, general and administrative expenses as a percentage of net revenues.
Consumer Beauty
In fiscal
2017
, operating income for Consumer Beauty increased
6%
, or
$14.7
, to
$261.2
from
$246.5
in fiscal
2016
. Operating margin
decreased
to
7.1%
of net revenues in fiscal
2017
as compared to
10.9%
in fiscal
2016
, primarily driven by
34
higher selling, general and administrative expenses as a percentage of net revenues and higher amortization expense as a percentage of net revenues, partially offset by lower cost of goods sold as a percentage of net revenues.
In fiscal
2016
, operating income for Consumer Beauty
increased
58%
, or
$90.1
, to
$246.5
f
rom
$156.4
in fiscal
2015
.
Operating margin
increased
to
10.9%
of net revenues in fiscal
2016
as compared to
7.2%
in fiscal
2015
, primarily driven by lower selling, general and administrative expenses and lower cost of sales as a percentage of net revenues.
Professional Beauty
In fiscal
2017
, operating income for Professional Beauty increased
15%
, or
$10.5
to
$78.5
from
$68.0
in fiscal
2016
. Operating margin
decreased
to
5.6%
of net revenues in fiscal
2017
as compared to
27.2%
in fiscal
2016
primarily driven by higher selling, general and administrative expenses as a percentage of net revenues and higher amortization expense as a percentage of net revenues, partially offset by lower cost of goods sold as a percentage of net revenues.
In fiscal
2016
, operating income for Professional Beauty decreased
9%
, or
$6.8
, to
$68.0
from
$74.8
in fiscal
2015
. Operating margin in fiscal
2016
remained relatively consistent with fiscal
2015
as selling, general and administrative expenses, cost of sales and amortization expense in fiscal
2016
were all relatively consistent with fiscal
2015
.
Corporate
Corporate primarily includes corporate expenses not directly relating to our operating activities. These items are included in Corporate since we consider them to be Corporate responsibilities, and these items are not used by our management to measure the underlying performance of the segments.
Operating loss for Corporate was
$935.5
,
$289.2
and
$149.2
in fiscal
2017
,
2016
and
2015
, r
espectively
, as described under “Adjusted Operating Income” below.
Adjusted Operating Income
Adjusted Operating Income provides investors with supplementary information relating to our performance. See “Overview—Non-GAAP Financial Measures.” Reconciliation of reported operating (loss) income to Adjusted Operating Income is presented below:
|
Year Ended June 30,
|
Change %
|
||||||||||||||||
|
(in millions)
|
2017
|
2016
|
2015
|
2017/2016
|
2016/2015
|
||||||||||||
|
Reported Operating (Loss) Income
|
$
|
(437.8
|
)
|
$
|
254.2
|
|
$
|
395.1
|
|
<(100%)
|
|
(36
|
%)
|
||||
|
% of Net revenues
|
(5.7
|
)%
|
5.8
|
%
|
9.0
|
%
|
|||||||||||
|
Costs related to acquisition activities
|
494.9
|
|
197.5
|
|
44.2
|
|
>100%
|
|
>100%
|
|
|||||||
|
Restructuring and other business realignment costs
|
426.2
|
|
109.7
|
|
90.7
|
|
>100%
|
|
21
|
%
|
|||||||
|
Amortization expense
|
275.1
|
|
79.5
|
|
74.7
|
|
>100%
|
|
6
|
%
|
|||||||
|
Pension Settlement
|
17.5
|
|
—
|
|
—
|
|
100
|
%
|
N/A
|
|
|||||||
|
Asset impairment charges
|
—
|
|
5.5
|
|
—
|
|
(100
|
%)
|
N/A
|
|
|||||||
|
Share-based compensation expense adjustment
|
—
|
|
1.3
|
|
18.3
|
|
(100
|
%)
|
(93
|
%)
|
|||||||
|
Gain on sale of assets
(a)
|
(3.1
|
)
|
(24.8
|
)
|
—
|
|
88
|
%
|
(100
|
%)
|
|||||||
|
China optimization
|
—
|
|
—
|
|
(19.4
|
)
|
N/A
|
|
100
|
%
|
|||||||
|
Total adjustments to Reported Operating (Loss) Income
|
1,210.6
|
|
368.7
|
|
208.5
|
|
>100%
|
|
77
|
%
|
|||||||
|
Adjusted Operating Income
|
$
|
772.8
|
|
$
|
622.9
|
|
$
|
603.6
|
|
24
|
%
|
3
|
%
|
||||
|
% of Net revenues
|
10.1
|
%
|
14.3
|
%
|
13.7
|
%
|
|
|
|||||||||
(a)
In fiscal 2015, gain on sale of assets of $7.2 in the Consolidated Statements of Operations is related to the sale of a China facility, which is included in China Optimization. See “China Optimization.”
In fiscal
2017
, adjusted operating income
increased
24%
, or
$149.9
, to
$772.8
from
$622.9
in fiscal
2016
. Adjusted operating margin decreased to
10.1%
of net revenues in fiscal
2017
as compared to
14.3%
in fiscal
2016
, driven by approximately 630 basis points related to higher adjusted selling, general and administrative expenses partially offset by approximately 200 basis points related to lower adjusted cost of sales as a percentage of net revenues. Excluding the impact of foreign currency exchange translations, adjusted operating income increased 23%.
In fiscal
2016
, adjusted operating income
increased
3%
, or
$19.3
, to
$622.9
from
$603.6
in fiscal
2015
. Adjusted operating margin increased to
14.3%
of net revenues in fiscal
2016
as compared to
13.7%
in fiscal
2015
, driven by approximately 30
35
basis points related to lower cost of sales as described in “Cost of Sales” and approximately 30 basis points related to lower selling, general and administrative expenses as described under “Selling, General and Administrative Expenses”. Excluding the impact of foreign currency exchange translations, adjusted operating income
increased
9%
Costs related to acquisition activities
In fiscal
2017
, we incurred
$494.9
of costs related to acquisition activities. We recognized Acquisition-related costs of
$355.4
, primarily in connection with the acquisition of P&G Beauty Business, ghd and Younique, included in the Consolidated Statements of Operations. These costs may include finder’s fees, legal, accounting, valuation, and other professional or consulting fees, and other internal costs which may include compensation related expenses for dedicated internal resources. We also incurred $48.8, $44.4, and $40.8 in costs of sales primarily reflecting revaluation of acquired inventory in connection with the acquisition of the P&G Beauty Business, ghd, and Younique, respectively in the Consolidated Statements of Operations.
In fiscal
2016
, we incurred
$197.5
of costs related to acquisition activities. This includes Acquisition-related costs of $174.0, primarily in connection with the acquisition of P&G Beauty Business, included in the Consolidated Statements of Operations. These costs may include finder’s fees, legal, accounting, valuation, and other professional or consulting fees, and other internal costs which may include compensation related expenses for dedicated internal resources. We also incurred $20.3 of costs, primarily reflecting revaluation of acquired inventory in connection with the acquisition of the Hypermarcas Brands and Bourjois acquisition, included in Cost of sales in the Consolidated Statements of Operations. We also incurred $3.2 of costs related to acquisition activities, included in Selling, general and administrative expense in the Consolidated Statements of Operations.
In fiscal
2015
, we incurred acquisition-related costs of
$44.2
. These costs primarily consist of consulting and legal fees related to the P&G Beauty Business and Bourjois Acquisition of $30.2 and $3.9, respectively, included in Acquisition-related costs in the Consolidated Statements of Operations. Also included in connection with the Bourjois Acquisition are $3.3 of costs related to acquisition accounting impacts of revaluation of acquired inventory and $0.9 of costs related to inventory obsolescence, included in Cost of sales in the Consolidated Statements of Operations, and $2.5 of costs related to sales returns, included in Net revenues in the Consolidated Statements of Operations. In addition, we incurred $3.4 of costs related to the revaluation of an inventory buyback associated with the conversion of one of our distributors to a subsidiary distribution model in the Middle East, included in Cost of sales in the Consolidated Statements of Operations. Acquisition-related costs of $40.8 and $3.4 were reported in Corporate and the Consumer Beauty segment, respectively.
In all reported periods, all acquisition-related costs were reported in Corporate, except where otherwise noted.
Restructuring and Other Business Realignment Costs
In connection with the acquisition of the P&G Beauty Business, we anticipate that we will incur a total of approximately $1,200.0 of operating expenses, including restructuring and related costs aimed at integrating and optimizing the combined organization (“Global Integration Activities”).
We are continuing to evaluate actions and associated costs, and plan to approve specific restructuring actions over a multi-year period. We expect that the Global Integration Activities will result in pre-tax restructuring and related costs of approximately $700.0 to $800.0, out of which approximately $640.0 has been approved through fiscal year 2017.
In the first quarter of fiscal 2016, our Board approved an expansion to the Acquisition Integration Program in connection with the acquisition of the Bourjois Acquisition. Actions associated with the program were initiated after the Bourjois Acquisition and substantially completed during fiscal 2017. We incurred
$59.9
of restructuring costs life-to-date as of June 30, 2017, which have been recorded in Corporate.
During the fourth quarter of fiscal 2014, the Board approved a program associated with a new organizational structure (“Organizational Redesign”) that aims to reinforce our growth path and strengthen our position as a new global leader and challenger in beauty. The Organizational Redesign was substantially completed during fiscal 2017. We incurred
$111.2
of restructuring costs life-to-date as of June 30, 2017, which have been recorded in Corporate.
In fiscal
2017
, we incurred restructuring and other business realignment costs of
$426.2
, as follows:
|
•
|
We incurred restructuring costs of
$372.2
primarily related to the Global Integration Activities, included in the Consolidated Statements of Operations.
|
|
•
|
We incurred business structure realignment costs of $54.0 primarily related to our Global Integration Activities, Organizational Redesign and certain other programs. This amount primarily includes $37.4 in Selling, general and administrative expenses and $16.6 in Cost of sales.
|
36
In fiscal
2016
, we incurred restructuring and other business realignment costs of
$109.7
, as follows:
|
•
|
We incurred Restructuring costs of $86.9 primarily related to the Acquisition Integration Program and Organizational Redesign, included in the Consolidated Statements of Operations.
|
|
•
|
We incurred other business realignment costs of $21.6 primarily related to our Organizational Redesign and the 2013 Productivity Program, included in Selling, general and administrative expenses in the Consolidated Statements of Operations. We incurred $1.2 of accelerated depreciation for fiscal 2016 resulting from a change in the estimated useful life of manufacturing equipment reported in Cost of goods sold in the Consolidated Statements of Operations in Corporate.
|
In fiscal
2015
, we incurred restructuring and other business realignment costs of
$90.7
, as follows:
|
•
|
We incurred restructuring costs of $76.0, included in Restructuring costs in the Consolidated Statements of Operations, which primarily relate to $58.6 of costs for the Organizational Redesign, $15.3 of costs for the Acquisition Integration Program, and $2.1 of costs related to the 2013 Productivity Program. These costs exclude $0.6 of income related to the refinement in estimates associated with China Optimization. See “China Optimization”.
|
|
•
|
We incurred other business realignment costs of $14.7 primarily related to our Organizational Redesign and the 2013 Productivity Program, which includes $1.3 of accelerated depreciation expense. All other business realignment costs were included in Selling, general and administrative expenses in the Consolidated Statements of Operations.
|
In all reported periods, all restructuring and other business realignment costs were reported in Corporate.
Amortization Expense
In fiscal
2017
, amortization expense increased to
$275.1
from
$79.5
in fiscal
2016
primarily as a result of the Acquisitions. In fiscal
2017
, amortization expense of $
124.4
, $
94.9
, and $
55.8
were reported in the Luxury, Consumer Beauty, and Professional Beauty segments, respectively.
In fiscal
2016
, amortization expense increased to
$79.5
from
$74.7
in fiscal
2015
, primarily as a result of the Hypermarcas Brands and Bourjois Acquisition. In fiscal
2016
, amortization expense of $50.4, $20.6 and $8.5 were reported in the Luxury, Consumer Beauty, and Professional Beauty segments, respectively.
In fiscal
2015
, amortization expense of $60.1, $6.0, and $8.6 were reported
in the Luxury, Consumer Beauty, and Professional Beauty segments, respectively.
Pension Settlement Charges
In fiscal 2017, we incurred charges of $
17.5
primarily in connection with the settlement of obligations related to the U.S. Del Laboratories, Inc. pension plan. The settlement of the plan was effectuated through lump sum payments to eligible participants during the three months ended September 30, 2016, in addition to, the purchase of annuity contracts from a third-party insurance provider, effectively transferring the U.S. Del Laboratories, Inc. pension plan obligation to the insurance provider, during fiscal 2017. The settlement charge for fiscal 2017 is as a result of accelerating the recognition of losses previously deferred in other comprehensive income (loss).
In fiscal
2016
and
2015
, we did not incur any pension settlement charges. Pension settlement charges were reported in Corporate.
Asset Impairment Charges
In fiscal
2017
and fiscal
2015
, we did not incur any asset impairment charges. In fiscal
2016
, Asset impairment charges of
$5.5
were reported in the Consolidated Statements of Operations. The impairment represents the write-off of long-lived assets in Southeast Asia consisting of customer relationships reported in Corporate.
Share-Based Compensation Adjustment
Senior management evaluates operating performance of our segments based on the share-based compensation expense calculated under equity and liability plan accounting, but excludes the share based compensation related to the fiscal 2013 accounting modification from liability plan to equity plan accounting for share-based compensation that are not reflective of the ongoing and planned pattern of recognition for such expense. We follow the same treatment of the share-based compensation for the financial covenant compliance calculations under our debt agreements. See “Overview-Non-GAAP Financial Measures.” All other share-based compensation expense is reflected in the operating results of the segments. Share-based compensation adjustment is included in Corporate. See Note 4, “Segment Reporting” in the notes to our Consolidated Financial Statements.
There was no share-based compensation expense adjustment included in the calculation of Adjusted Operating Income in fiscal 2017. Share-based compensation adjustment for Pre-IPO grants in fiscal 2016 and 2015 of $1.3 and $2.5, respectively,
37
consisted of the difference between share-based compensation expense accounted for under equity plan accounting based on the grant date fair value and total share-based compensation expense, which was accounted for under liability plan accounting prior to June 12, 2013 and equity plan accounting subsequent to the IPO based on the fair value on June 12, 2013, for the recurring nonqualified stock option awards and director-owned and employee-owned shares, restricted shares and restricted stock units. In fiscal 2015, the adjustment also includes $15.8 million associated with shares sold and shares repurchased related to the termination of an employment agreement with a potential CEO incurred by our controlling shareholder on our behalf, which are considered an incremental contribution to us. Refer to Note 21 “Equity,” in the notes to our Consolidated Financial Statements. This expense is excluded from our segments and operating income as management views the discounted sale of shares and subsequent repurchase as outside the normal course of business
|
2016
|
2015
|
|||||||
|
Total share-based compensation expense
|
35.4
|
|
35.9
|
|
||||
|
Expense under equity plan accounting based on grant date fair value and expense for Series A Preferred Stock
|
34.1
|
|
17.6
|
|
||||
|
Share-based compensation expense adjustment for pre-IPO grants and special transactions
|
$
|
1.3
|
|
$
|
18.3
|
|
||
Gain on sale of assets
In fiscal
2017
, we sold certain assets relating to one of our fragrance
brands and recorded a gain of $3.1 which has been reflected in Gain on sale of assets in the Consolidated Statements of Operations.
In fiscal
2016
, we sold the
Cutex
brand and related assets and recorded a gain of $24.8 which has been reflected in Gain on sale of assets in the Consolidated Statements of Operations.
In fiscal
2015
, we did not have a gain on sale of assets.
China Optimization
In fiscal
2017
and
2016
, we did not incur any China Optimization costs.
In fiscal
2015
,
we recognized income of
$19.4
related to China Optimization, of which $7.3, $7.2, $3.0, $1.3 and $0.6 was recorded in Net revenues, Gain on sale of assets, Cost of sales, Selling, general and administrative expenses and Restructuring costs in the Consolidated Statements of Operations, respectively. Income of $11.6 was restructuring related primarily consisting of $5.3 due to the gain on sale of a facility of $7.2 net of real estate tax expense related to the sale of $1.9 and $5.7 due to a change in estimates related to inventory obsolescence and sales returns recorded in connection with the China Optimization at June 30, 2014. Income of $7.8 primarily reflects changes in estimates associated with pre-restructuring related activities. We primarily attribute the changes in estimates to the sale of the TJoy brand and supporting production facility to a single buyer at the beginning of the third quarter, allowing the brand to remain viable in the marketplace. We believe that this resulted in lower than initially estimated returns, customer incentives payments and related costs. Income of $18.8 and $0.6 related to China Optimization was reported in the Consumer Beauty segment and Corporate, respectively.
INTEREST EXPENSE, NET
In fiscal
2017
, Interest expense, net was
$218.6
as compared with
$81.9
in fiscal
2016
. This increase is primarily a result of higher average debt balances at increased interest rates due to the assumption of debt under the Galleria Credit Agreement and the financings of the acquisitions of ghd and Younique. Additionally included in the prior period interest expense is a one-time foreign currency exchange gain of $11.1 related to our debt refinancing in fiscal 2016.
In fiscal
2016
, net interest expense was
$81.9
as compared with
$73.0
in fiscal
2015
. Interest expense increased primarily due to higher interest rates on higher average debt balances and increased deferred financing costs. Offsetting the increased interest expense was a one-time net derivative gain of $11.1 related to foreign currency forward contracts to facilitate debt refinancing and a foreign currency net gain of $12.8 in connection with the acquisition of the Hypermarcas Brands and subsequent intercompany loans.
LOSS ON EARLY EXTINGUISHMENT OF DEBT
In fiscal
2017
, there were no losses related to the early extinguishment of debt.
In fiscal
2016
, we incurred $3.1 in losses related to the write-off of deferred financing costs in connection with the refinancing of the Prior Coty Inc. Credit Facilities (as later defined).
In fiscal
2015
, we incurred $88.8 in losses on the early extinguishment of debt in conjunction with the repurchase of our Senior Notes as described in “-Financial Condition-Liquidity and Capital Resources” below.
38
INCOME TAXES
The following table presents our provision for income taxes, and effective tax rates for the periods presented
|
2017
|
2016
|
2015
|
||||||||||
|
(Benefit) Provision for income taxes
|
$
|
(259.5
|
)
|
$
|
(40.4
|
)
|
$
|
(26.1
|
)
|
|||
|
Effective income tax rate
|
39.4
|
%
|
(29.1
|
)%
|
(11.2
|
)%
|
||||||
The effective income tax rate for fiscal
2017
was
39.4%
as compared with
(29.1)%
in fiscal
2016
and
(11.2)%
in fiscal
2015
. The effective income tax rate in fiscal
2017
includes the release of a valuation allowance in the U.S. as a result of the P&G Beauty Business acquisition of $111.2.
The negative effective income tax rate in fiscal 2016 reflects a change in recognized tax benefit of $51.4 due settlement of tax audits in multiple jurisdictions and the expiration of foreign and state statutes of limitation. The effective income tax rate in fiscal 2015 reflects a change in recognized tax benefit of $62.0 due to the settlement of tax audits in multiple foreign jurisdictions and the expiration of foreign and state statutes of limitation.
During fiscal 2015, we transferred certain international intellectual property rights to our wholly owned subsidiary in Switzerland in order to align our ownership of these international intellectual property rights with our global operations. Although the transfer of foreign intellectual property rights between consolidated entities did not result in any gain in the consolidated results of operations, we generated a taxable gain in the U.S. that was offset by net operating loss carryforwards. Income taxes incurred related to the intercompany transactions are treated as a prepaid income tax in our Consolidated Balance Sheet and amortized to income tax expense over the life of the intellectual property. For the fiscal years ending June 30,
2017
and
2016
, the prepaid income taxes of
$7.6
and
$7.6
, respectively, are included in Prepaid expenses and other current assets and
$128.2
and
$135.8
, respectively, are included in Other noncurrent assets in the Consolidated Balance Sheets. The prepaid income taxes are amortized as a component of income tax expense over twenty years.
The effective rates vary from the U.S. federal statutory rate of 35% due to the effect of (i) jurisdictions with different statutory rates, (ii) adjustments to our unrecognized tax benefits and accrued interest, (iii) non-deductible expenses, (iv) audit settlements and (v) valuation allowance changes. Our effective tax rate could fluctuate significantly and could be adversely affected to the extent earnings are lower than anticipated in countries that have lower statutory rates and higher than anticipated in countries that have higher statutory rates.
Reconciliation of Reported (Loss) Income Before Income Taxes to Adjusted Income Before Income Taxes and Effective Tax Rates:
|
Year Ended June 30, 2017
|
Year Ended June 30, 2016
|
Year Ended June 30, 2015
|
||||||||||||||||||||||||||||||
|
(in millions)
|
(Loss)/ Income Before Income Taxes
|
Provision for Income Taxes
|
Effective Tax Rate
|
Income Before Income Taxes
|
Provision for Income Taxes
|
Effective Tax Rate
|
Income Before Income Taxes
|
Provision for Income Taxes
|
Effective Tax Rate
|
|||||||||||||||||||||||
|
Reported (Loss) Income Before Income Taxes
|
$
|
(658.0
|
)
|
(259.5
|
)
|
39.4
|
%
|
$
|
138.8
|
|
(40.4
|
)
|
(29.1
|
)%
|
$
|
233.3
|
|
(26.1
|
)
|
(11.2
|
)%
|
|||||||||||
|
Adjustments to Reported Operating (Loss) Income
(a) (b)
|
1,210.6
|
|
355.0
|
|
368.7
|
|
50.7
|
|
208.5
|
|
86.1
|
|
||||||||||||||||||||
|
Other adjustments
(b)(c)
|
1.4
|
|
0.4
|
|
9.6
|
|
(0.7
|
)
|
88.8
|
|
34.0
|
|
||||||||||||||||||||
|
Adjusted Income Before Income Taxes
|
$
|
554.0
|
|
$
|
95.9
|
|
17.3
|
%
|
$
|
517.1
|
|
$
|
9.6
|
|
1.9
|
%
|
$
|
530.6
|
|
$
|
94.0
|
|
17.7
|
%
|
||||||||
|
(a)
|
See “Reconciliation of Reported Operating Income to Adjusted Operating Income”.
|
|
(b)
|
The tax effects of each of the items included in adjusted income are calculated in a manner that results in a corresponding income tax expense/provision for adjusted income. In preparing the calculation, each adjustment to reported income is first analyzed to determine if the adjustment has an income tax consequence. The provision for taxes is then calculated based on the jurisdiction in which the adjusted items are incurred, multiplied by the respective statutory rates and offset by the increase or reversal of any valuation allowances commensurate with the non-GAAP measure of profitability.
|
|
(c)
|
See “Reconciliation of Reported Net (Loss) Income Attributable to Coty Inc. to Adjusted Net Income Attributable to Coty Inc.”.
|
The adjusted effective tax rate was
17.3%
compared to
1.9%
in the prior-year period. The differences were primarily due to the release of a valuation allowance in the US as a result of the P&G Beauty Business acquisition. Cash paid during the years
39
ended June 30,
2017
,
2016
and
2015
, for income taxes of
$90.1
,
$118.1
and
$104.8
represents
16.3%
,
22.8%
and
19.8%
of Adjusted income before income taxes for the fiscal year ended, respectively.
NET (LOSS) INCOME ATTRIBUTABLE TO COTY INC.
In fiscal
2017
, net loss attributable to Coty Inc. of
$422.2
declined greater than 100%, or
$579.1
, from income of
$156.9
in fiscal
2016
. This decrease primarily reflects lower operating income and higher interest expense in fiscal
2017
, partially offset by a higher tax benefit in the fiscal
2017
than in fiscal
2016
and losses related to hedges on the acquisition of the Hypermarcas Brands in fiscal
2016
.
In fiscal
2016
, net income attributable to Coty Inc.
decreased
$75.6
to
$156.9
, from
$232.5
in fiscal
2015
.
This decrease primarily reflects lower operating income and losses on foreign currency contracts in fiscal 2016, partially offset by lower loss on early extinguishment of debt and higher tax benefit in fiscal 2016 related to a tax settlement with the IRS.
We believe that Adjusted Net Income Attributable to Coty Inc. provides an enhanced understanding of our performance. See “Overview—Non-GAAP Financial Measures.”
|
Year Ended June 30,
|
Change %
|
||||||||||||||||
|
(in millions)
|
2017
|
2016
|
2015
|
2017/2016
|
2016/2015
|
||||||||||||
|
Reported Net (Loss) Income Attributable to Coty Inc.
|
$
|
(422.2
|
)
|
$
|
156.9
|
|
$
|
232.5
|
|
<(100%)
|
|
(33
|
%)
|
||||
|
% of Net revenues
|
(5.5
|
%)
|
3.6
|
%
|
5.3
|
%
|
|||||||||||
|
Adjustments to Reported Operating Income
(a)
|
1,210.6
|
|
368.7
|
|
208.5
|
|
>100%
|
|
77
|
%
|
|||||||
|
Adjustments to other expense
(b)
|
—
|
|
30.4
|
|
—
|
|
(100
|
%)
|
N/A
|
|
|||||||
|
Loss on early extinguishment of debt
(c)
|
—
|
|
3.1
|
|
88.8
|
|
(100
|
%)
|
(97
|
%)
|
|||||||
|
Adjustments to interest expense
(d)
|
1.4
|
|
(23.9
|
)
|
—
|
|
>100%
|
|
N/A
|
|
|||||||
|
Adjustments to noncontrolling interest expense
(e)
|
(25.9
|
)
|
—
|
|
(1.2
|
)
|
(100
|
%)
|
100
|
%
|
|||||||
|
Change in tax provision due to adjustments to Reported Net (Loss) Income Attributable to Coty Inc.
|
(355.4
|
)
|
(50.0
|
)
|
(120.1
|
)
|
<(100%)
|
|
58
|
%
|
|||||||
|
Adjusted Net Income Attributable to Coty Inc.
|
$
|
408.5
|
|
$
|
485.2
|
|
$
|
408.5
|
|
(16
|
%)
|
19
|
%
|
||||
|
% of Net revenues
|
5.3
|
%
|
11.2
|
%
|
9.3
|
%
|
|
|
|||||||||
|
Per Share Data
|
|||||||||||||||||
|
Adjusted weighted-average common shares
(f)
|
|||||||||||||||||
|
Basic
|
642.8
|
|
345.5
|
|
353.3
|
|
|||||||||||
|
Diluted
|
647.8
|
|
354.2
|
|
362.9
|
|
|||||||||||
|
Adjusted net income attributable to Coty Inc. per common share
|
|||||||||||||||||
|
Basic
|
$
|
0.64
|
|
$
|
1.40
|
|
$
|
1.16
|
|
||||||||
|
Diluted
|
$
|
0.63
|
|
$
|
1.37
|
|
$
|
1.13
|
|
||||||||
|
(a)
|
See the reconciliation included in Results of Operations—Net Revenues—Operating Income-Adjusted Operating Income”.
|
|
(b)
|
In fiscal 2016, we incurred losses of $29.6 on foreign currency contracts related to payments for the acquisition of the Hypermarcas Brands and expenses of $0.8 related to the purchase of the remaining mandatorily redeemable financial interest in a subsidiary, included in Other expense, net in the Consolidated Statements of Operations.
|
|
(c)
|
In fiscal 2016, the amount represents the write-off of deferred financing costs in connection with the refinancing of the Prior Coty Inc. Credit Facilities, included in Loss on early extinguishment of debt in the Consolidated Statements of Operations. In fiscal 2015, the amount represents the repurchase of our previously existing Senior Notes, included in Loss on early extinguishment of debt in the Consolidated Statements of Operations.
|
|
(d)
|
The amount in fiscal 2017 represents a net loss of $1.4 incurred in connection with the acquisition of the Hypermarcas Brands and subsequent intercompany loans, included in Interest expense, net in the Condensed Consolidated Statements of Operations. The amount in fiscal 2016 primarily represents one-time gains of $11.1 on short-term forward contracts to exchange Euros for U.S. Dollars related to the Euro-denominated portion of the Term Loan B Facility and a net gain of $12.8 in connection with the acquisition of the Hypermarcas Brands and subsequent intercompany loans, included in Interest expense, net in the Consolidated Statements of Operations.
|
|
(e)
|
The amounts represent the after-tax impact of the non-GAAP adjustments included in Net income attributable to noncontrolling interest based on the relevant noncontrolling interest percentage in the Consolidated Statements of Operations.
|
|
(f)
|
In fiscal 2017, using the treasury stock method, the number of adjusted diluted common shares to calculate non-GAAP adjusted diluted net income per common share was five million shares higher than the number of common shares used to calculate GAAP diluted net loss per common share, due to the potentially dilutive effect of certain securities issuable under our share-based compensation plans, which were
|
40
considered anti-dilutive for calculating GAAP diluted net loss per common share. In fiscal 2016 and 2015, respectively, the adjusted number of common shares used to calculate non-GAAP adjusted diluted net income attributable to Coty Inc. per common share was the same as the number of diluted shares used to calculate GAAP net (loss) income per common share.
In fiscal
2017
,
2016
, and
2015
, respectively, the adjusted number of common shares used to calculate non-GAAP adjusted basic net income attributable to Coty Inc. per common share was identical to the number of basic shares used to calculate GAAP net (loss) income per common share.
Quarterly Results of Operations Data
The following tables set forth our unaudited quarterly consolidated statements of operations data for each of the eight quarters in the periods ended June 30,
2017
. We have prepared the quarterly consolidated statements of operations data on a basis consistent with the consolidated financial statements included in Part II, Item 8, “Financial Statements and Supplementary Data” in this Annual Report on Form 10-K. In the opinion of management, the financial information reflects all adjustments, consisting only of normal recurring adjustments, which we consider necessary for a fair presentation of this data. This information should be read in conjunction with the consolidated financial statements and related notes included in Part II, Item 8, “Financial Statements and Supplementary Data” in this Annual Report. The results of historical periods are not necessarily indicative of the results of operations for any future period.
|
Fiscal 2017
(a)
|
Fiscal 2016
(b)
|
||||||||||||||||||||||||||||||
|
Three Months Ended
|
Three Months Ended
|
||||||||||||||||||||||||||||||
|
June 30,
|
March 31,
|
December 31,
|
September 30,
|
June 30,
|
March 31,
|
December 31,
|
September 30,
|
||||||||||||||||||||||||
|
(in millions, except per share data)
|
2017
|
2017
|
2016
|
2016
|
2016
|
2016
|
2015
|
2015
|
|||||||||||||||||||||||
|
Consolidated Statements of Operations Data:
|
|||||||||||||||||||||||||||||||
|
Net revenues
|
$
|
2,241.3
|
|
$
|
2,032.1
|
|
$
|
2,296.7
|
|
$
|
1,080.2
|
|
$
|
1,075.6
|
|
$
|
950.7
|
|
$
|
1,210.5
|
|
$
|
1,112.3
|
|
|||||||
|
Gross profit
|
1,366.0
|
|
1,216.0
|
|
1,404.4
|
|
635.4
|
|
610.0
|
|
581.7
|
|
742.8
|
|
668.6
|
|
|||||||||||||||
|
Restructuring costs
|
193.2
|
|
155.8
|
|
15.8
|
|
7.4
|
|
7.6
|
|
6.6
|
|
10.6
|
|
62.1
|
|
|||||||||||||||
|
Acquisition-related costs
|
80.3
|
|
57.7
|
|
135.9
|
|
81.5
|
|
75.7
|
|
37.0
|
|
45.5
|
|
15.8
|
|
|||||||||||||||
|
Asset impairment charges
|
—
|
|
—
|
|
—
|
|
—
|
|
—
|
|
—
|
|
—
|
|
5.5
|
|
|||||||||||||||
|
Operating (loss) income
|
(279.0
|
)
|
(192.5
|
)
|
(12.7
|
)
|
46.4
|
|
(2.9
|
)
|
23.0
|
|
152.4
|
|
81.7
|
|
|||||||||||||||
|
Interest expense, net
|
59.5
|
|
60.8
|
|
57.9
|
|
40.4
|
|
26.2
|
|
25.1
|
|
14.6
|
|
16.0
|
|
|||||||||||||||
|
Other expense (income), net
|
1.4
|
|
(0.5
|
)
|
(0.6
|
)
|
1.3
|
|
—
|
|
6.6
|
|
24.1
|
|
(0.3
|
)
|
|||||||||||||||
|
(Loss) income before income taxes
|
(339.9
|
)
|
(252.8
|
)
|
(70.0
|
)
|
4.7
|
|
(29.1
|
)
|
(8.7
|
)
|
110.6
|
|
66.0
|
|
|||||||||||||||
|
(Benefit) provision for income taxes
|
(38.9
|
)
|
(93.4
|
)
|
(122.1
|
)
|
(5.1
|
)
|
2.1
|
|
11.6
|
|
13.0
|
|
(67.1
|
)
|
|||||||||||||||
|
Net (loss) income
|
$
|
(301.0
|
)
|
$
|
(159.4
|
)
|
$
|
52.1
|
|
$
|
9.8
|
|
$
|
(31.2
|
)
|
$
|
(20.3
|
)
|
$
|
97.6
|
|
$
|
133.1
|
|
|||||||
|
Net income (loss) attributable to noncontrolling interests
|
$
|
1.2
|
|
$
|
3.5
|
|
$
|
2.5
|
|
$
|
8.2
|
|
$
|
(4.5
|
)
|
$
|
2.4
|
|
$
|
5.3
|
|
$
|
4.4
|
|
|||||||
|
Net income attributable to redeemable noncontrolling interests
|
$
|
2.6
|
|
$
|
1.3
|
|
$
|
2.8
|
|
$
|
1.6
|
|
$
|
4.3
|
|
$
|
4.1
|
|
$
|
3.3
|
|
$
|
3.0
|
|
|||||||
|
Net (loss) income attributable to Coty Inc.
|
$
|
(304.8
|
)
|
$
|
(164.2
|
)
|
$
|
46.8
|
|
$
|
—
|
|
$
|
(31.0
|
)
|
$
|
(26.8
|
)
|
$
|
89.0
|
|
$
|
125.7
|
|
|||||||
|
Per Share Data:
|
|
|
|
|
|||||||||||||||||||||||||||
|
Weighted-average common shares:
|
|
|
|
|
|||||||||||||||||||||||||||
|
Basic
|
747.7
|
|
747.3
|
|
746.6
|
|
336.3
|
|
338.8
|
|
337.9
|
|
345.0
|
|
360.0
|
|
|||||||||||||||
|
Diluted
|
747.7
|
|
747.3
|
|
752.4
|
|
336.6
|
|
338.8
|
|
337.9
|
|
354.3
|
|
369.9
|
|
|||||||||||||||
|
Cash dividends declared per common share
|
$
|
0.125
|
|
$
|
0.125
|
|
$
|
0.125
|
|
$
|
0.275
|
|
$
|
—
|
|
$
|
—
|
|
$
|
—
|
|
$
|
0.25
|
|
|||||||
|
Net (loss) income attributable to Coty Inc. per common share:
|
|
|
|
|
|||||||||||||||||||||||||||
|
Basic
|
$
|
(0.41
|
)
|
$
|
(0.22
|
)
|
$
|
0.06
|
|
$
|
—
|
|
$
|
(0.09
|
)
|
$
|
(0.08
|
)
|
$
|
0.26
|
|
$
|
0.35
|
|
|||||||
|
Diluted
|
(0.41
|
)
|
(0.22
|
)
|
0.06
|
|
—
|
|
(0.09
|
)
|
(0.08
|
)
|
0.25
|
|
0.34
|
|
|||||||||||||||
(a)
Beginning in the second quarter of fiscal 2017, the financial results presented above include the impacts of the acquisitions of the P&G Beauty Business and ghd. Beginning in the third quarter of fiscal 2017, the financial results presented above include the impacts of the Younique acquisition.
(b)
Beginning in the third quarter of fiscal 2016, the financial results presented above include the impacts of the Hypermarcas Brands.
41
FINANCIAL CONDITION
LIQUIDITY AND CAPITAL RESOURCES
Overview
Our cash and cash equivalents balances increased by approximately
$198.3
during fiscal
2017
primarily as a result of our cash generated from operations, borrowings from issuance of debt and committed and uncommitted lines of credit provided by banks and lenders in the U.S. and abroad, offset by the repayment of debt and cash used for acquisitions. As of
June 30, 2017
, we had cash and cash equivalents of
$535.4
compared with
$372.4
at
June 30, 2016
.
Our cash flows are subject to seasonal variation throughout the year, including demands on cash made during our first fiscal quarter in anticipation of higher global sales during the second quarter and strong cash generation in the second fiscal quarter as a result of increased demand by retailers associated with the holiday season. Our principal uses of cash are to fund planned operating expenditures, capital expenditures, interest payments, acquisitions, dividends, share repurchases and any principal payments on debt. The working capital movements are based on the sourcing of materials related to the production of products within each of our segments.
As a result of the cash on hand, our ability to generate cash from operations and through access to our revolving credit facility and other lending sources, we believe we have sufficient liquidity to meet our ongoing needs on both a near term and long-term basis.
Debt
The balances consisted of the following as of
June 30, 2017
and
June 30, 2016
, respectively:
|
June 30,
2017 |
June 30,
2016 |
||||||
|
Short-term debt
|
$
|
3.7
|
|
$
|
19.8
|
|
|
|
Galleria Credit Agreement
|
|||||||
|
Galleria Revolving Credit Facility due September 2021
|
—
|
|
—
|
|
|||
|
Galleria Term Loan A Facility due September 2021
|
944.3
|
|
—
|
|
|||
|
Galleria Term Loan B Facility due September 2023
|
1,000.0
|
|
—
|
|
|||
|
Coty Credit Agreement
|
|||||||
|
Coty Revolving Credit Facility due October 2020
|
810.0
|
|
670.0
|
|
|||
|
Coty Term Loan A Facility due October 2020
|
1,792.8
|
|
1,883.6
|
|
|||
|
Coty Term Loan A Facility due October 2021
|
950.6
|
|
—
|
|
|||
|
Coty Term Loan B Facility due October 2022
|
1,712.5
|
|
1,596.0
|
|
|||
|
Other long-term debt and capital lease obligations
|
1.7
|
|
0.7
|
|
|||
|
Total debt
|
7,215.6
|
|
4,170.1
|
|
|||
|
Less: Short-term debt and current portion of long-term debt
|
(209.1
|
)
|
(161.8
|
)
|
|||
|
Total Long-term debt
|
7,006.5
|
|
4,008.3
|
|
|||
|
Less: Unamortized debt issuance costs
(a)
|
(67.6
|
)
|
(64.6
|
)
|
|||
|
Less: Discount on Long-term debt
|
(10.6
|
)
|
(7.3
|
)
|
|||
|
Total Long-term debt, net
|
$
|
6,928.3
|
|
$
|
3,936.4
|
|
|
(a)
Consists of unamortized debt issuance costs of
$17.5
and
$22.7
for the Coty Revolving Credit Facility,
$33.2
and
$30.3
for the Coty Term Loan A Facility and
$11.3
and
$11.6
for the Coty Term Loan B Facility as of
June 30, 2017
and
June 30, 2016
, respectively.
Consists of unamortized debt issuance costs of
$2.7
and
$0.0
for the Galleria Term Loan A Facility and
$3.0
and
$0.0
for the Galleria Term Loan B Facility as of
June 30, 2017
and
June 30, 2016
, respectively. Unamortized debt issuance costs of
$4.2
for the Galleria Revolving Credit Facility were classified as Other noncurrent assets as of
June 30, 2017
.
Short-Term Debt
We maintain short-term lines of credit with financial institutions around the world. Total available lines of credit were
$132.4
and
$108.5
, of which
$3.2
and
$19.8
were outstanding at June 30,
2017
and
2016
, respectively. Interest rates on these short-term lines of credit vary depending on market rates for borrowings within the respective geographic locations plus applicable spreads. Interest rates plus applicable spreads on these lines ranged from
0.4%
to
11.2%
and from
0.5%
to
16.5%
as of June 30,
2017
and
2016
, respectively. The weighted-average interest rate on short-term debt outstanding was
3.0%
and
42
14.0%
as of June 30,
2017
and
2016
, respectively. In addition, we had undrawn letters of credit of
$5.5
and
$4.6
as of June 30,
2017
and
2016
, respectively.
Our long term debt facilities consisted of the following as of
June 30, 2017
:
|
Facility
|
Maturity Date
|
Borrowing Capacity (in millions)
|
Interest Rate Terms
|
Applicable Interest Rate Spread as of
June 30, 2017 |
Debt Discount
|
Repayment Schedule
|
||||||
|
Galleria Revolving Credit Facility
(a)
|
September 2021
|
$1,500.0
|
LIBOR
(a)
plus a margin ranging from 1.00% to 2.00% per annum or a base rate plus a margin ranging from 0.00% to 1.00% per annum, based on the Company’s total net leverage ratio
(c) (d) (f)
|
1.75%
|
N/A
(b)
|
Payable in full at maturity date
|
||||||
|
Galleria Term Loan A Facility
(a)
|
September 2021
|
$2,000.0
(g)
|
LIBOR
(a)
plus a margin ranging from 1.00% to 2.00% per annum or a base rate plus a margin ranging from 0.00% to 1.00% per annum, based on the Company’s total net leverage ratio
(c) (f)
|
1.75%
|
N/A
(b)
|
Quarterly repayments beginning December 31, 2017 at 1.25% of original principal amount
|
||||||
|
Galleria Term Loan B Facility
(a)
|
September 2023
|
$1,000.0
|
LIBOR
(a)
plus a margin of 3.00% or a base rate, plus a margin of 2.00%
(f)
|
3.00%
|
0.50%
|
Quarterly repayments
beginning December 31, 2017 at 0.25% of original principal amount |
||||||
|
Coty Revolving Credit Facility
(a)
|
October 2020
|
$1,500.0
|
LIBOR
(a)
plus a margin ranging from 1.00% to 2.00% per annum or a base rate plus a margin ranging from 0.00% to 1.00% per annum, based on the Company’s total net leverage ratio
(c) (d)
(f)
|
1.75%
|
N/A
(b)
|
Payable in full at maturity date
|
||||||
|
Coty Term Loan A Facility
(a)
- USD Portion |
October 2020
|
$1,750.0
|
LIBOR
(a)
plus a margin ranging from 1.00% to 2.00% per annum or a base rate plus a margin ranging from 0.00% to 1.00% per annum, based on the Company’s total net leverage ratio
(c)
(f)
|
1.75%
|
N/A
(b)
|
Quarterly repayments beginning June 30, 2016 at 1.25% of original principal amount
|
||||||
|
Coty Term Loan A Facility
(a)
- Euro Portion |
October 2020
|
€140.0
|
EURIBOR
(a)
plus a margin of 1.00% to 2.00% per annum, based on the Company’s total net leverage ratio
(c)
(f)
|
1.75%
|
N/A
(b)
|
Quarterly repayments beginning September 30, 2016 at 1.25% of original principal amount
|
||||||
|
Incremental Term A Facility
(a)
|
October 2021
|
$975.0
|
LIBOR
(a)
plus a margin ranging from 1.00% to 2.00% per annum or a base rate plus a margin ranging from 0.00% to 1.00% per annum, based on the Company’s total net leverage ratio
(c)
(f)
|
1.75%
|
N/A
(b)
|
Quarterly repayments beginning March 31, 2017 at 1.25% of original principal amount
|
||||||
|
Coty Term Loan B Facility
(a)(h)
- USD Portion and Incremental Term B Facility (a) |
October 2022
|
$600.0
|
LIBOR
(a)
plus a margin of 2.50% or a base rate, plus a margin of 2.00%
(f)
|
2.50%
|
0.50%
|
Quarterly repayments beginning June 30, 2016 at 0.25% of original principal amount
|
||||||
|
Coty Term Loan B Facility
(a)
- Euro Portion |
October 2022
|
€990.0
(e)
|
EURIBOR
(a)
plus a margin of 2.75%
|
2.75%
|
0.50%
|
See below.
(e)
|
||||||
(a)
As defined below.
(b)
N/A - Not Applicable.
(c)
As defined per the respective loan agreement.
(d)
Additionally we will pay to the Coty Revolving Credit Facility and Galleria Credit Facility lenders an unused commitment fee calculated at a rate ranging from
0.25%
to
0.50%
per annum, based on our total net leverage ratio
(c)
. As of
June 30, 2017
, the applicable rate on the unused commitment fee was
0.50%
.
(e)
Includes
€665.0 million
of the Euro portion of Coty Term Loan B Facility originated on October 27, 2015, and the
€325.0 million
from the Incremental Term Loans, as defined below, originated on April 8, 2016. Repayments on the
€665.0 million
portion are payable quarterly beginning on June 30, 2016 at
0.25%
of the original principal amount. Repayments on the
€325.0 million
Incremental Term Loan B are payable quarterly beginning on September 30, 2016 at
0.25%
of the original principal amount.
(f)
The selection of the applicable interest rate for the period is at the discretion of Coty.
43
(g)
At the closing of the P&G Beauty Business acquisition,
$944.3
were assumed under the Galleria Credit Agreement. The remaining unused loan commitments for the Galleria Term Loan A Facility expired.
(h)
Refinanced as part of the Incremental Assumption Agreement
(a)
on October 28, 2016 and part of the Refinancing Facilities
(a)
.
Our long term debt facilities consisted of the following as of June 30, 2016:
|
Facility
|
Maturity Date
|
Borrowing Capacity (in millions)
|
Interest Rate Terms
|
Applicable Interest Rate Spread as of
June 30, 2016
|
Debt Discount
|
Repayment Schedule
|
||||||
|
Coty Revolving Credit Facility
(a)
|
October 2020
|
$1,500.0
|
LIBOR
(a)
plus a margin ranging from 1.00% to 2.00% per annum or a base rate plus a margin ranging from 0.00% to 1.00% per annum, based on the Company’s total net leverage ratio
(c) (d)
(f)
|
1.75%
|
N/A
(b)
|
Payable in full at maturity date
|
||||||
|
Coty Term Loan A Facility
(a)
- USD Portion |
October 2020
|
$1,750.0
|
LIBOR
(a)
plus a margin ranging from 1.00% to 2.00% per annum or a base rate plus a margin ranging from 0.00% to 1.00% per annum, based on the Company’s total net leverage ratio
(c)
(f)
|
1.75%
|
N/A
(b)
|
Quarterly repayments beginning June 30, 2016 at 1.25% of original principal amount
|
||||||
|
Coty Term Loan A Facility
(a)
- Euro Portion |
October 2020
|
€140.0
|
EURIBOR
(a)
plus a margin of 1.00% to 2.00% per annum, based on the Company’s total net leverage ratio
(c)
(f)
|
1.75%
|
N/A
(b)
|
Quarterly repayments beginning September 30, 2016 at 1.25% of original principal amount
|
||||||
|
Coty Term Loan B Facility
(a)
- USD portion |
October 2022
|
$500.0
|
LIBOR
(a)
(subject to a 0.75% floor) plus a margin of 3.00% or a base rate (subject to a 1.75% floor), plus a margin of 2.00%
(f)
|
3.00%
|
0.50%
|
Quarterly repayments beginning June 30, 2016 at 0.25% of original principal amount
|
||||||
|
Coty Term Loan B Facility
(a)
- Euro portion |
October 2022
|
€990.0 (e)
|
EURIBOR
(a)
(subject to a 0.75% floor) plus a margin of 2.75%
|
2.75%
|
0.50%
|
Quarterly repayments beginning June 30, 2016 at 0.25% of original principal amount
(e)
|
||||||
(a)
As defined below.
(b)
N/A - Not Applicable.
(c)
As defined per the respective loan agreement.
(d)
Additionally we will pay to the Coty Revolving Credit Facility lenders an unused commitment fee calculated at a rate ranging from 0.25% to 0.50% per annum, based on our total net leverage ratio
(c)
. As of June 30, 2016, the applicable rate on the unused commitment fee was 0.50%.
(e)
Includes €665.0 million of the Euro portion of Term Loan B originated on October 27, 2015, and the €325.0 million from the Incremental Term Loans, as defined below, originated on April 8, 2016. Repayments on the €325.0 million Incremental Term Loan B are payable quarterly beginning on September 30, 2016 at 0.25% of the original principal amount.
(f)
The selection of the applicable interest rate for the period is at the discretion of Coty.
44
On October 27, 2015, we refinanced our long term debt facilities. Our long term debt facilities that were outstanding prior to our refinancing consisted of the following as of June 30, 2015:
|
Facility
|
Maturity Date
|
Borrowing Capacity (in millions)
|
Interest Rate Terms
|
Applicable Interest Rate Spread as of
June 30, 2015 |
Debt Discount
|
Repayment Schedule
|
||||||
|
2013 Term Loan
(a)
|
March 2018
|
$1,250.0
|
LIBOR
(c)
plus a margin ranging from 0.0% to 1.75% based on the Company’s consolidated leverage ratio
(d)
|
1.50%
|
N/A
(b)
|
Quarterly repayments commence on October 1, 2016 and will total $175.0, and $875.0 in fiscal 2017, and 2018 respectively
|
||||||
|
Incremental Term Loan
(a)
|
April 2018
|
$625.0
|
LIBOR
(c)
plus a margin ranging from 0.0% to 1.75% based on the Company’s consolidated leverage ratio
(d)
|
1.50%
|
N/A
(b)
|
Payable in full on April 2, 2018
|
||||||
|
2013 Revolving Loan Facility
(a)
|
April 2018
|
$1,250.0
|
LIBOR
(c)
plus a margin ranging from 0.15% to 0.25% based on the Company’s consolidated leverage ratio
(d)
|
1.28%
|
N/A
(b)
|
Payable in full at maturity date
|
||||||
|
2015 Credit Agreement
(a)
|
March 2018
|
$800.0
|
Applicable base rate
(c)
plus a margin ranging from 0.125% to 1.875% based on the Company’s consolidated leverage ratio
(d)
|
1.63%
|
N/A
(b)
|
Payable in full on March 31, 2018
|
||||||
(a)
As defined below.
(b)
N/A - Not Applicable.
(c)
Applicable base rates of interest on amounts borrowed under the 2015 Credit Agreement were based on the London Interbank Offered Rate (“LIBOR”), a qualified Eurocurrency LIBOR, an alternative base rate, or a qualified local currency rate, as applicable to the borrowings.
(d)
As defined per the respective loan agreement.
Coty Credit Agreement
On October 27, 2015, we entered into a Credit Agreement (the “Coty Credit Agreement”) with JPMorgan Chase Bank, N.A., as administrative agent. The Coty Credit Agreement provides for senior secured credit facilities comprised of (i) a revolving credit facility in an aggregate principal amount up to
$1,500.0
(the “Coty Revolving Credit Facility”), which includes up to
$80.0
in swingline loans available for short term borrowings, (ii) a
$1,750.0
term loan A Facility (“Term Loan A Facility”) and (iii) a term loan B Facility comprising of a
$500.0
tranche and a
€665.0
million tranche (“Coty Term Loan B Facility”). The Coty Term Loan B Facility was issued at a
0.50%
discount. The proceeds of the Coty Credit Agreement were primarily used to refinance the Company’s previously existing debt, which included the 2015 Credit Agreement due March 2018 and facilities under the Coty Inc. Credit Facility (together, the “Prior Coty Inc. Credit Facilities”).
On April 8, 2016, we entered into an Incremental Assumption Agreement and Amendment No. 1 (the “Incremental Credit Agreement”) to the Coty Credit Agreement. The Incremental Credit Agreement provides for an additional
€140.0 million
in commitments under the Coty Term Loan A Facility and an additional
€325.0 million
in commitments under the Coty Term Loan B Facility of the Coty Credit Agreement (the “Incremental Term Loans”). The proceeds of the Incremental Term Loans were used to partially repay outstanding balances under the Revolving Credit Facility. The terms of the
€140.0 million
and
€325.0 million
portions of the Incremental Term Loans are substantially the same as the respective existing Coty Term Loan A Facility and Euro denominated portion of the Term Loan B Facility.
On October 28, 2016, we entered into an Incremental Assumption Agreement and Refinancing Amendment (the “Incremental and Refinancing Agreement”), which amended the Coty Credit Agreement. The Incremental and Refinancing Agreement provides for: (i) an additional Coty Term Loan A Facility in aggregate principal amount of
$975.0
in commitments (the “Incremental Term A Facility”), (ii) an additional Coty Term Loan B Facility in aggregate principal amount of
$100.0
in commitments (the “Incremental Term B Facility”) and (iii) a refinancing of the previously existing USD and Euro denominated Coty Term Loan B Facility loans (the “Refinancing Facilities”) under the Coty Credit Agreement.
The loans made under the Incremental Term A Facility have terms that are substantially identical to the existing Coty Term Loan A Facility except that the loans will mature on the date that is
five
years after October 28, 2016. The loans under the Incremental Term B Facility and the Refinancing Facilities have substantially identical terms as the term B loans existing under the Coty Credit Agreement prior to effectiveness of the Incremental and Refinancing Agreement, except that, among other things: (i) the interest rate with respect to the USD denominated tranche of the Refinancing Facilities and the Incremental Term B Facility will be, at our option, either the London Interbank Offered Rate (“LIBOR”) plus an applicable margin of
2.50%
or an alternate base rate (“ABR”) equal to the highest of (1) JPMorgan Chase Bank N.A.’s prime rate, (2) the federal funds rate plus
45
0.50%
and (3) one-month LIBOR plus
1.0%
, in each case plus an applicable margin of
1.50%
and (ii) the LIBOR floor with respect to the LIBOR loans under the Incremental Term B Facility and the Refinancing Facilities is
0.00%
.
We recognized
$13.0
of deferred debt issuance costs in connection with the Incremental and Refinancing Agreement.
The Coty Credit Agreement is guaranteed by our wholly-owned domestic subsidiaries and secured by a first priority lien on substantially all of our and our wholly-owned domestic subsidiaries’ assets, in each case subject to certain carve outs and exceptions.
Galleria Credit Agreement
On October 1, 2016, at the closing of the P&G Beauty Business acquisition, we assumed the debt facilities available under the Galleria Credit Agreement (the “Galleria Credit Agreement”), which were initially entered into by Galleria on January 26, 2016. The Galleria Credit Agreement provides for the senior secured credit facilities comprised of (i) a
$2,000.0
five
year term loan A facility (“Galleria Term Loan A Facility”), (ii) a
$1,000.0
seven
year term loan B facility (“Galleria Term Loan B Facility”) and (iii) a
$1,500.0
five
year revolving credit facility (“Galleria Revolving Facility”). The Galleria Term Loan B Facility was issued at a
0.5%
discount. In connection with the closing of the P&G Beauty Business acquisition, we assumed $1,941.8 of aggregate debt outstanding consisting of
$944.3
Galleria Term Loan A Facility,
$995.0
Galleria Term Loan B Facility, net of a discount and
$0.0
outstanding under the Galleria Revolving Facility, as well as
$2.5
in assumed fees payable. At the closing of the P&G Beauty Business acquisition, the remaining unused loan commitments for the Galleria Term Loan A Facility expired.
We recognized
$11.4
of deferred debt issuance costs in connection with the Galleria Credit Agreement.
The Galleria Credit Agreement is guaranteed by us and our wholly-owned domestic subsidiaries (other than Galleria) and secured by a first priority lien on substantially all of our and our wholly-owned domestic subsidiaries’ assets, in each case subject to certain carve outs and exceptions.
Scheduled Amortization
Beginning in the second quarter of fiscal 2018 and ending at maturity, we will make quarterly repayments of
1.25%
and
0.25%
of the initial aggregate Galleria Term Loan A Facility and Galleria Term Loan B Facility, respectively. The remaining balance of the initial aggregate Galleria Term Loan A Facility and Galleria Term Loan B Facility amount will be payable on the maturity date for each facility, respectively.
Prior Coty Inc. Credit Facilities
2015 Credit Agreement
On March 24, 2015, we entered into a Credit Agreement (the “2015 Credit Agreement”) with JPMorgan Chase Bank, N.A., as administrative agent, and Bank of America, N.A., BNP Paribas, Crédit Agricole Corporate & Investment Bank, ING Bank, N.V., Morgan Stanley MUFG Loan Partners, LLC and Wells Fargo Bank, N.A., as syndication agents. The 2015 Credit Agreement provided for a term loan of
$800.0
(the “2015 Term Loan”) payable in full on March 31, 2018.
Coty Inc. Credit Facility
On June 25, 2014, we entered into an Incremental Term Loan Amendment (the “Incremental Amendment”) to the 2013 Credit Agreement. The 2014 Incremental Amendment provided for an incremental term loan of
$625.0
(the “Incremental Term Loan”), which had substantially the same terms and conditions as the 2013 Term Loan, except with respect to principal repayments.
On April 2, 2013, we refinanced our then-existing credit facility by entering into a Credit Agreement (the “2013 Credit Agreement”), with JP Morgan Chase Bank, N.A. as administrative agent and Bank of America, N.A., BNP Paribas, Crédit Agricole Corporate & Investment Bank, Deutsche Bank Securities Inc., ING Bank N.V., Morgan Stanley MUFG Loan Partners, LLC and Wells Fargo Bank, N.A., as syndication agents. The 2013 Credit Agreement provided a term loan of
$1,250.0
(the “2013 Term Loan”), which would have expired on March 31, 2018. The 2013 Credit Agreement additionally provided a revolving loan facility of
$1,250.0
(the “2013 Revolving Loan Facility”), which would have expired on April 2, 2018, which provided for up to
$80.0
in swingline loans.
Deferred Financing Fees
For the fiscal years ended
June 30, 2017, 2016 and 2015
, we recognized deferred financing fees of
$24.4
,
$59.0
, and
$11.2
, respectively. For the fiscal years ended
June 30, 2017, 2016 and 2015
, we wrote-off deferred financing fees of
$0.0
,
$3.1
, and
$5.1
, respectively, of which
$3.1
and
$4.2
in fiscal 2016 and 2015, respectively, were recorded to Loss on early extinguishment of debt in the Consolidated Statement of Operations. The remaining
$0.9
of the fees written off in fiscal 2015 was recorded to Interest expense in the Consolidated Statement of Operations. As of
June 30, 2017
and
2016
, we had deferred financing fees of
$4.2
and
$0.0
recorded in Other noncurrent assets on our Consolidated Balance Sheet.
46
Interest
The Coty Credit Agreement and Galleria Credit Agreement facilities will bear interest at rates equal to, at our option, either:
|
•
|
the LIBOR of the applicable qualified currency plus the applicable margin; or
|
|
•
|
ABR plus the applicable margin.
|
In the case of the Coty Revolving Credit Facility, Coty Term Loan A Facilities, Galleria Revolving Facility and Galleria Term Loan A Facility, the applicable margin means a percentage per annum to be determined in accordance with a leverage-based pricing grid below:
|
Pricing Tier
|
Total Net Leverage Ratio:
|
LIBOR plus:
|
Alternative Base Rate Margin:
|
|||
|
1.0
|
Greater than or equal to 5.00:1
|
2.000%
|
1.000%
|
|||
|
2.0
|
Less than 5.00:1 but greater than or equal to 4.00:1
|
1.750%
|
0.750%
|
|||
|
3.0
|
Less than 4.00:1 but greater than or equal to 2.75:1
|
1.500%
|
0.500%
|
|||
|
4.0
|
Less than 2.75:1 but greater than or equal to 2.00:1
|
1.250%
|
0.250%
|
|||
|
5.0
|
Less than 2.00:1 but greater than or equal to 1.50:1
|
1.125%
|
0.125%
|
|||
|
6.0
|
Less than 1.50:1
|
1.000%
|
—%
|
|||
In the case of the USD portion of the Coty Term Loan B Facility, the applicable margin means 2.50% per annum, in the case of LIBOR loans, and 2.00% per annum, in the case of ABR loans. In the case of the Euro portion of the Coty Term Loan B Facility, the applicable margin means 2.75% per annum, in the case of EURIBOR loans. In the case of the Galleria Term Loan B Facility, the applicable margin means 3.00% per annum, in the case of LIBOR loans, and 2.00% per annum, in the case of ABR loans. With respect to the Galleria Term Loan B Facility, in no event will (i) LIBOR be deemed to be less than 0.75% per annum and (ii) ABR be deemed to be less than 1.75% per annum.
Interest is payable quarterly or on the last day of the interest period applicable to borrowings under our long-term debt facilities. For fiscal
2017
, the weighted-average interest rates for the Revolving Credit Facility, Term Loan A Facility, and Term Loan B Facility under the Coty Credit Agreement collectively were
2.43%
,
2.45%
and
3.15%
, respectively. For fiscal
2017
, the weighted-average interest rates for the Revolving Credit Facility, Term Loan A Facility, and Term Loan B Facility under the Galleria Credit Agreement collectively were
2.06%
,
2.42%
and
3.86%
, respectively.
With respect to the Prior Coty Inc. Credit Facilities, the weighted-average interest rates on our 2015 Term Loan, Incremental Term Loan and the 2013 Term Loan collectively were
1.77%
and
1.70%
in fiscal
2016
, and
2015
, respectively. The weighted-average interest rates on our 2013 Revolving Loan Facility were
1.67%
and
1.40%
in fiscal
2016
, and
2015
.
Senior Notes
On September 29, 2014, we prepaid the Senior Notes as defined below. The prepayment included the principal amount of Senior Notes of
$500.0
, accrued interest of
$8.0
and a make-whole amount of
$84.6
. In connection with the prepayment, we incurred a loss on early extinguishment of debt of
$88.8
, which included the make-whole amount and the write-off of
$4.2
of deferred financing fees related to the Senior Notes.
On June 16, 2010, we issued
$500.0
of Senior Secured Notes (the “Senior Notes”) in
three
series in a private placement transaction: (i)
$100.0
in aggregate principal amount of
5.12%
Series A Senior Secured Notes due June 16, 2017, (ii)
$225.0
in aggregate principal amount of
5.67%
Series B Senior Secured Notes due June 16, 2020 and (iii)
$175.0
in aggregate principal amount of
5.82%
Series C Senior Secured Notes due June 16, 2022.
47
Debt Maturities Schedule
Aggregate maturities of all long-term debt, including current portion of long-term debt and excluding capital lease obligations as of June 30,
2017
, are presented below:
|
Fiscal Year Ending June 30,
|
|||
|
2018
|
$
|
204.4
|
|
|
2019
|
218.8
|
|
|
|
2020
|
218.8
|
|
|
|
2021
|
2,439.5
|
|
|
|
2022
|
1,550.2
|
|
|
|
Thereafter
|
2,578.5
|
|
|
|
Total
|
$
|
7,210.2
|
|
Debt Covenants
We are required to comply with certain affirmative and negative covenants contained within the Coty Credit Agreement and the Galleria Credit Agreement (collectively the “Debt Agreements”). With certain exceptions as described below, the Debt Agreements include a financial covenant that requires us to maintain a Total Net Leverage Ratio (as defined below), equal to or less than the ratios shown below for each respective test period.
|
Test Period Ending
|
Total Net Leverage Ratio
(a)
|
|
September 30, 2017
|
5.00 to 1.00
|
|
December 31, 2017
|
5.00 to 1.00
|
|
March 31, 2018
|
4.75 to 1.00
|
|
June 30, 2018
|
4.75 to 1.00
|
|
September 30, 2018
|
4.50 to 1.00
|
|
December 31, 2018
|
4.50 to 1.00
|
|
March 31, 2019
|
4.25 to 1.00
|
|
June 30, 2019
|
4.25 to 1.00
|
|
September 30, 2019
|
4.00 to 1.00
|
|
December 31, 2019
|
4.00 to 1.00
|
|
March 31, 2020
|
4.00 to 1.00
|
|
June 30, 2020
|
4.00 to 1.00
|
|
September 30, 2020
|
4.00 to 1.00
|
(a)
Total Net Leverage Ratio means, as of any date of determination, the ratio of: (a) (i) Total Indebtedness minus (ii) unrestricted cash and Cash Equivalents of the Parent Borrower and its Restricted Subsidiaries as determined in accordance with GAAP to (b) Adjusted EBITDA for the most recently ended Test Period (each of the defined terms used within the definition of Total Net Leverage Ratio have the meanings ascribed to them within the Debt Agreements).
In the four fiscal quarters following the closing of any Material Acquisition (as defined in the Debt Agreements), including the fiscal quarter in which such Material Acquisition occurs, the maximum Total Net Leverage Ratio shall be the lesser of (i)
5.95
to 1.00 and (ii)
1.00
higher than the otherwise applicable maximum Total Net Leverage Ratio for such quarter (as set forth in the table above). Immediately after any such four fiscal quarter period, there shall be at least two consecutive fiscal quarters during which our Total Net Leverage Ratio is no greater than the maximum Total Net Leverage Ratio that would otherwise have been required in the absence of such Material Acquisition, regardless of whether any additional Material Acquisitions are consummated during such period. As of
June 30, 2017
, we were in compliance with all covenants contained within the Debt Agreements.
48
Business Combinations
P&G Beauty Business Acquisition
On October 1, 2016, we acquired the P&G Beauty Business in order to further strengthen our position in the global beauty industry. The purchase price was
$11,570.4
and consisted of
$9,628.6
of total equity consideration and
$1,941.8
of assumed debt.
The P&G Beauty Business acquisition was completed pursuant to the Transaction Agreement, dated July 8, 2015 (the “Transaction Agreement”), by and among Coty, P&G, Galleria Co. (“Galleria”) and Green Acquisition Sub Inc., a wholly-owned subsidiary of Coty (“Merger Sub”). On October 1, 2016, (i) Merger Sub was merged with and into Galleria, with Galleria continuing as the surviving corporation and a direct, wholly-owned subsidiary of Coty (the “Merger”) and (ii) each share of Galleria common stock was converted into the right to receive
one
share of our common stock.
We issued
409.7 million
shares of common stock to the former holders of Galleria common stock, together with cash in lieu of fractional shares. Immediately after consummation of the Merger, approximately
54%
of the fully-diluted shares of our common stock was held by pre-Merger holders of Galleria common stock, and approximately
46%
of the fully-diluted shares of our common stock was held by pre-Merger holders of our common stock. Coty Inc. is considered to be the acquiring company for accounting purposes.
Acquisition of ghd
On November 21, 2016, we completed the acquisition of
100%
of the equity interest of Lion/Gloria Topco Limited, which held the assets of ghd (“ghd”) which stands for “Good Hair Day”, a premium brand in high-end hair styling appliances, pursuant to a sale and purchase agreement. The ghd acquisition further strengthens our professional hair category and is included in the Professional Beauty segment’s results after the acquisition date. The total cash consideration paid net of acquired cash and cash equivalents was
£430.2 million
, the equivalent of
$531.5
, at the time of closing, which was funded through cash on hand and available debt.
Acquisition of Younique
On February 1, 2017, we completed our acquisition of
60%
of the membership interest in Foundation, LLC (“Foundation”), which held the net assets of Younique, LLC, a Utah limited liability company (“Younique”), for cash consideration of
$600.0
, net of acquired cash and debt assumed, and an additional payment of
$7.5
for working capital adjustments expected to be paid in the first half of fiscal 2018. The existing Younique membership holders contributed their
100%
membership interest in Younique to Foundation in exchange for a
40%
membership interest in Foundation and
$600.0
of cash consideration plus the additional payment of
$7.5
. Younique strengthens the Consumer Beauty division’s color cosmetics and skin and body care product offerings. The acquisition was funded with a combination of cash on hand and borrowings under available debt facilities. We account for the noncontrolling interest portion of the acquisition as a redeemable noncontrolling interest. Refer to Note
20
—Noncontrolling Interests and Redeemable Noncontrolling Interests for information regarding valuation method and significant assumptions used to calculate the fair value.
Hypermarcas Brands Acquisition
On February 1, 2016, we completed the acquisition of 100% of the net assets of the personal care and beauty business of Hypermarcas S.A. (the “Hypermarcas Brands”) pursuant to a share purchase agreement in order to further strengthen our position in the Brazilian beauty and personal care market. This acquisition was included in the Consumer Beauty segment. The total consideration of
R$3,599.5 million
, the equivalent of
$901.9
, at the time of closing, was paid during fiscal 2016.
Dispositions
During fiscal 2017, we sold assets of one of our fragrance brands for a total purchase price of
$10.5
. We allocated
$2.4
of goodwill to the brand as part of the sale. We recorded a gain of
$3.1
which has been reflected in Gain sale of assets in the Consolidated Statement of Operations for the year June 30, 2017.
During fiscal 2016, we sold the
Cutex
brand and related assets for a total disposal price of
$29.2
. We allocated
$4.2
of goodwill to the brand as part of the sale. We recorded a gain of
$24.8
which has been reflected in Gain on sale of assets in the Consolidated Statements of Operations for the fiscal year ended June 30, 2016.
49
Cash Flows
|
Year Ended June 30,
|
|||||||||||
|
2017
|
2016
|
2015
|
|||||||||
|
Consolidated Statements of Cash Flows Data:
(in millions)
|
|||||||||||
|
Net cash provided by operating activities
|
$
|
757.5
|
|
$
|
501.4
|
|
$
|
526.3
|
|
||
|
Net cash (used in) investing activities
|
(1,163.6
|
)
|
(1,059.2
|
)
|
(171.2
|
)
|
|||||
|
Net cash provided by (used in) financing activities
|
595.2
|
|
592.6
|
|
(1,138.2
|
)
|
|||||
Net cash provided by operating activities
Net cash provided by operating activities was
$757.5
,
$501.4
and
$526.3
for fiscal
2017
,
2016
and
2015
, respectively. The
increase
in operating cash inflows in fiscal 2017 compared with fiscal 2016 was
$256.1
. This increase is primarily due to an increase of
$687.0
resulting from the change in operating assets and liabilities acquired in the P&G Beauty Business acquisition during the post-acquisition period, coupled with an improvement in working capital due to timing of invoices. In addition, the increase also included a change of
$323.1
for depreciation and amortization as a result of the new acquisitions. This is offset by a decrease in deferred income tax of
$250.8
primarily due to a release of valuation allowance as a result of the P&G Beauty Business acquisition and a decrease of
$577.7
in Net income (loss).
The decrease in operating cash inflows in fiscal 2016 compared with fiscal 2015 was
$24.9
. This decrease is primarily due to the change in Gain on sale of assets relating to the Cutex brand, Loss on extinguishment of debt and lower cash provided by Net income totaling
$183.5
. Offsetting the decrease in cash inflows was an increase of bad debt provision of
$17.4
, as well as an increase in accounts payable of
$141.2
relating to additional operating expenses as well as a change in the frequency of our payables processing from a bi-monthly to a monthly basis.
Net cash (used in) investing activities
Net cash used in investing activities was
$(1,163.6)
,
$(1,059.2)
and
$(171.2)
for fiscal
2017
,
2016
and
2015
, respectively. The increase in cash outflows in fiscal 2017 as compared to fiscal 2016 of
$104.4
is primarily driven by higher cash payments for capital projects of
$282.2
, partially offset by a decrease of
$166.1
for net payments in connection with the P&G Beauty Business, ghd and Younique acquisitions.
The increase in cash outflows in fiscal 2016 as compared to fiscal 2015 of
$888.0
is primarily driven by
$890.8
paid in connection with the acquisition of the Hypermarcas Brands, net of cash received,
$17.9
paid in connection with the acquisition of Beamly and a loss of
$29.6
on a foreign currency forward contract related to the acquisition of the Hypermarcas Brands. This is partially offset by lower capital expenditures in the current year of
$20.8
and the elimination of
$30.0
of annual contingent purchase price payments made in connection with the acquisition of the Calvin Klein license from Unilever in 2006.
Net cash provided by (used in) financing activities
Net cash provided by (used in) financing activities was
$595.2
,
$592.6
and
$(1,138.2)
for fiscal
2017
,
2016
and
2015
, respectively. The increase in cash inflows in fiscal 2017 as compared to fiscal 2016 of
$2.6
is primarily driven by a decrease of
$758.6
in payments for Class A Common Stock compared to the prior year, partially offset by an increase of
$474.0
in net repayments of short term debt, the revolving loan and term loan facilities and an increase of
$283.6
in cash dividends paid.
The increase in cash inflows in fiscal 2016 as compared to fiscal 2015 of
$1,730.8
is primarily attributable to higher net cash inflows from debt transactions of
$2,270.9
substantially related to the net proceeds from the Coty Credit Agreement used to refinance the Prior Coty Inc. Credit Facilities. The increase in the financing cash inflows was also attributable to a decrease of net payments for foreign currency forward contracts of
$28.2
, which were partially offset by year over year cash outflows of
$531.8
for the purchase of treasury shares, and higher payments of deferred financing fees of
$46.4
.
Dividends
Prior to October 2016, we declared annual cash dividends in the first quarter of the fiscal year. Beginning after October 2016, we began declaring cash dividends on a quarterly basis.
The following dividends were declared during fiscal years
2017
,
2016
and
2015
:
50
|
Declaration Date
|
Dividend Type
|
Dividend Per Share
|
Holders of Record Date
|
Dividend Value
|
Dividend Payment Date
|
Dividends Paid
|
Dividends Payable
|
|||||||||||||||
|
Fiscal 2017
|
||||||||||||||||||||||
|
August 1, 2016
|
Annual
|
$
|
0.275
|
|
August 11, 2016
|
$
|
93.4
|
|
August 19, 2016
|
$
|
92.4
|
|
$
|
1.0
|
|
|||||||
|
December 9, 2016
|
Quarterly
|
$
|
0.125
|
|
December 19, 2016
|
$
|
94.0
|
|
December 28, 2016
|
$
|
93.4
|
|
$
|
0.6
|
|
|||||||
|
February 9, 2017
|
Quarterly
|
$
|
0.125
|
|
February 28, 2017
|
$
|
94.0
|
|
March 10, 2017
|
$
|
93.4
|
|
$
|
0.6
|
|
|||||||
|
May 10, 2017
|
Quarterly
|
$
|
0.125
|
|
May 31, 2017
|
$
|
94.0
|
|
June 13, 2017
|
$
|
93.4
|
|
$
|
0.6
|
|
|||||||
|
Fiscal 2017
|
$
|
0.650
|
|
$
|
375.4
|
|
$
|
372.6
|
|
$
|
2.8
|
|
||||||||||
|
Fiscal 2016
|
||||||||||||||||||||||
|
September 11, 2015
|
Annual
|
$
|
0.250
|
|
October 1, 2015
|
$
|
90.1
|
|
October 15, 2015
|
$
|
89.0
|
|
$
|
1.1
|
|
|||||||
|
Fiscal 2015
|
||||||||||||||||||||||
|
September 16, 2014
|
Annual
|
$
|
0.200
|
|
October 1, 2014
|
$
|
71.9
|
|
October 15, 2014
|
$
|
71.0
|
|
$
|
0.9
|
|
|||||||
Treasury Stock - Share Repurchase Program
Since February 2014, the Board has authorized us to repurchase our Class A Common Stock under approved repurchase programs. Repurchases may be made from time to time at our discretion, based, among other things, on ongoing assessments of the capital needs of the business, the market price of our Class A Common Stock, and general market conditions. As of
June 30, 2017
, we had $396.8 remaining under the current repurchase program that was approved by our Board on February 3, 2016. The following table summarizes the share repurchase activities during the years ended
June 30, 2017
,
2016
, and
2015
:
|
Period
|
Number of shares repurchased
(in millions) |
Cost of shares repurchased
(in millions) |
Lowest fair value of shares repurchased per share
|
Highest fair value of shares repurchased per share
|
|||||||||||
|
Fiscal Year Ended June 30, 2017
|
1.4
|
|
$
|
36.3
|
|
$
|
25.35
|
|
$
|
27.40
|
|
||||
|
Fiscal Year Ended June 30, 2016
|
27.4
|
|
767.0
|
|
25.10
|
|
30.35
|
|
|||||||
|
Fiscal Year Ended June 30, 2015
|
13.4
|
|
263.1
|
|
18.64
|
|
21.99
|
|
|||||||
Treasury Stock - Other Repurchases
In addition to the above mentioned repurchase activities, on December 3, 2015, we entered into a stock purchase agreement with a shareholder holding more than 5% of our Class A Common Stock to repurchase 1.0 million shares of our Class A Common Stock. On December 17, 2015, we remitted payment for the repurchased shares at a price of $27.91 per share. The fair value of shares repurchased was approximately $27.9, which was recorded as an increase to Treasury stock in the Consolidated Balance Sheets and Consolidated Statements of Equity and Redeemable Noncontrolling Interests.
On April 1, 2015, we completed our previously announced purchase of 100% of the net assets of the Bourjois cosmetics brand (“Bourjois”) from Chanel International B.V. (“CHANEL”) pursuant to the Stock Purchase Agreement, dated as of March 12, 2015, between the us and CHANEL (the “Stock Purchase Agreement”). We issued to our foreign subsidiaries 15.5 million shares of our Class A Common Stock for $376.8 in cash and subsequently exchanged these shares with CHANEL as consideration for Bourjois. The shares had an approximate value of $376.8 based on the closing value of our Class A Common Stock on the New York Stock Exchange. As a result of the purchase, we reissued the total of $269.9 Treasury Stock with a charge to Additional paid-in capital (“APIC”) of $106.9.
On September 29, 2014, we entered into an agreement with Mr. Scannavini, our former Chief Executive Officer in connection with his resignation. The agreement required that we purchase on or before January 27, 2015 all Class A Common Stock Mr. Scannavini held directly or indirectly, including shares of Class A Common Stock obtained upon the exercise of certain stock options, for a share price of $17.21. As a result of the agreement, we purchased 2.4 million shares of our Class A Common Stock for $42.0 and reflected as an increase to Treasury stock in our Consolidated Balance Sheets and Consolidated Statements of Equity and Redeemable Noncontrolling Interests during the year ended June 30, 2015. We made a net payment to Mr. Scannavini of $29.5, which is the purchase amount of $42.0 net of the aggregate exercise price of his vested stock options of $12.5.
51
Contractual Obligations and Commitments
Our principal contractual obligations and commitments as of
June 30, 2017
are presented below:
|
(in millions)
|
Total
|
Payments Due in Fiscal
|
Thereafter
|
||||||||||||||||||||||||
|
2018
|
2019
|
2020
|
2021
|
2022
|
|||||||||||||||||||||||
|
Long-term debt obligations
|
$
|
7,210.2
|
|
$
|
204.4
|
|
$
|
218.8
|
|
$
|
218.8
|
|
$
|
2,439.5
|
|
$
|
1,550.2
|
|
$
|
2,578.5
|
|
||||||
|
Interest on long-term debt obligations
(a)
|
1,547.7
|
|
245.9
|
|
263.9
|
|
282.0
|
|
298.4
|
|
254.7
|
|
202.8
|
|
|||||||||||||
|
Operating lease obligations
|
785.0
|
|
126.1
|
|
114.3
|
|
98.3
|
|
82.2
|
|
73.7
|
|
290.4
|
|
|||||||||||||
|
License agreements:
(b)
|
|
|
|||||||||||||||||||||||||
|
Royalty payments
|
709.2
|
|
95.1
|
|
87.0
|
|
78.1
|
|
61.3
|
|
48.5
|
|
339.2
|
|
|||||||||||||
|
Advertising and promotional spend obligations
|
127.1
|
|
27.6
|
|
29.5
|
|
31.0
|
|
13.0
|
|
13.0
|
|
13.0
|
|
|||||||||||||
|
Other contractual obligations
(c)
|
305.1
|
|
118.2
|
|
109.1
|
|
29.4
|
|
24.6
|
|
23.8
|
|
—
|
|
|||||||||||||
|
Other long-term obligations:
|
|
|
|||||||||||||||||||||||||
|
Pension obligations (mandated)
(d)
|
139.7
|
|
29.6
|
|
28.6
|
|
27.8
|
|
27.1
|
|
26.6
|
|
—
|
|
|||||||||||||
|
Total
|
$
|
10,824.0
|
|
$
|
846.9
|
|
$
|
851.2
|
|
$
|
765.4
|
|
$
|
2,946.1
|
|
$
|
1,990.5
|
|
$
|
3,423.9
|
|
||||||
(a)
Interest costs on our variable rate debt after consideration of our interest rate swap arrangements are determined based on an interest rate forecast using the forward interest rate curve and assumptions of the amount of debt outstanding. A 25 basis-point increase in our variable interest rate debt would have increased our interest costs by
$97.3
over the term of our long-term debt.
(b)
Obligations under license agreements relate to royalty payments and required advertising and promotional spending levels for our products bearing the licensed trademark. Royalty payments are typically made based on contractually defined net sales. However, certain licenses require minimum guaranteed royalty payments regardless of sales levels. Minimum guaranteed royalty payments and required minimums for advertising and promotional spending have been included in the table above. Actual royalty payments and advertising and promotional spending are expected to be higher. Furthermore, early termination of any of these license agreements could result in potential cash outflows that have not been reflected above.
(c)
Other contractual obligations primarily represent advertising/marketing, manufacturing, logistics and capital improvements commitments. Additionally, we have included the mandatorily redeemable financial instruments arising out of our joint ventures as discussed in Note
19
—
Mandatorily Redeemable Financial Interest. We also maintain several distribution agreements for which early termination could result in potential future cash outflows that have not been reflected above.
(d)
Represents future contributions to our pension and other post retirement benefit plans over the next five years mandated by local regulations or statutes. Subsequent funding requirements cannot be reasonably estimated as the return on plan assets in future periods, as well as future assumptions are not known.
The table above excludes obligations for uncertain tax benefits, including interest and penalties, of
$154.6
as of
June 30, 2017
, as we are unable to predict when, or if, any payments would be made. See Note
15
—Income Taxes in the notes to our Consolidated Financial Statements for additional information on our uncertain tax benefits.
The table excludes
$551.1
of RNCI which is reflected in Redeemable noncontrolling interests in the Consolidated Balance Sheet as of
June 30, 2017
related to our
33.0%
RNCI in the United Arab Emirates subsidiary and our
40.0%
interest in Foundation. Given the provisions of the associated Put and Call rights, both RNCI are redeemable outside of our control and are recorded in temporary equity.
See Note
20
—Noncontrolling Interests and Redeemable Noncontrolling Interests in the notes to our Consolidated Financial Statements for further discussion related to the calculation of the redemption value for each of these noncontrolling interests.
Derivative Financial Instruments and Hedging Activities
We are exposed to foreign currency exchange fluctuations and interest rate volatility through our global operations. We utilize natural offsets to the fullest extent possible in order to identify net exposures. In the normal course of business, established policies and procedures are employed to manage these net exposures using a variety of financial instruments. We do not enter into derivative financial instruments for trading or speculative purposes.
Foreign Currency Exchange Risk Management
We operate in multiple functional currencies and are exposed to the impact of foreign currency fluctuations. For foreign currency exposures, which primarily relate to receivables, inventory purchases and sales, payables and intercompany loans, derivatives are used to better manage the earnings and cash flow volatility arising from foreign currency exchange rate fluctuations. We recorded foreign currency losses (gains) of
$1.5
,
$7.2
and
$(7.9)
in fiscal
2017
,
2016
and
2015
, respectively, resulting from non-financing foreign currency exchange transactions which are included in their associated expense type and
52
are included in the Consolidated Statements of Operations. Net gains (losses) of
$(12.8)
,
$19.2
and
$(4.1)
in fiscal
2017
,
2016
and
2015
, respectively, resulting from financing foreign exchange currency transactions are included in Interest expense, net in the Consolidated Statements of Operations. Net (losses) of
$(1.7)
,
$(29.4)
and
nil
in fiscal
2017
,
2016
and
2015
, respectively, resulting from acquisition-related foreign exchange currency transactions are included in Other expense, net in the Consolidated Statements of Operations.
Exchange gains or losses are also partially offset through the use of qualified derivatives under hedge accounting, for which we record accumulated gains or losses in Accumulated other comprehensive income until the underlying transaction occurs at which time the gain or loss is reclassified into the respective account in the Consolidated Statements of Operations. The accumulated gain (loss) on these derivative instruments in Accumulated other comprehensive income (loss) (“AOCI/(L)”), net of tax, was
$12.6
and
$(28.9)
as of
June 30, 2017
and
June 30, 2016
, respectively.
We have experienced and will continue to experience fluctuations in our net income as a result of balance sheet transactional exposures. As of
June 30, 2017
, in the event of a 10.0% unfavorable change in the prevailing market rates of hedged foreign currencies versus the U.S. dollar, the change in fair value of all foreign exchange forward contracts would result in a
$29.4
increase in the fair value of the forward contracts. In the view of management, these hypothetical gains resulting from an assumed change in foreign currency exchange rates are not material to our consolidated financial statement position or results of operations. This gain does not include the impact on our underlying foreign currency exposures.
Interest Rate Risk Management
We are exposed to interest rate risk that relates primarily to our indebtedness, which is affected by changes in the general level of the interest rates primarily in the United States and Europe. We periodically enter into interest rate swap agreements to facilitate our interest rate management activities. We have designated these agreements as cash flow hedges and, accordingly, applied hedge accounting. The effective changes in fair value of these agreements are recorded in AOCI/(L), net of tax, and ineffective portions are recorded in current- period earnings. Amounts in AOCI/(L) are subsequently reclassified to earnings as interest expense when the hedged transactions are settled.
We expect that both at the inception and on an ongoing basis, the hedging relationship between any designated interest rate hedges and underlying variable rate debt will be highly effective in achieving offsetting cash flows attributable to the hedged risk during the term of the hedge. If it is determined that a derivative is not highly effective, or that it has ceased to be a highly effective hedge, we will be required to discontinue hedge accounting with respect to that derivative prospectively. The corresponding gain or loss position of the ineffective hedge recorded to AOCI/(L) will be reclassified to current-period earnings.
If interest rates had been 10% higher/lower and all other variables were held constant,
(Loss) income before income taxes
in fiscal
2017
would decrease/increase by
$17.4
.
Credit Risk Management
We attempt to minimize credit exposure to counterparties by generally entering into derivative contracts with counterparties that have an “A” (or equivalent) credit rating. The counterparties to these contracts are major financial institutions. Exposure to credit risk in the event of nonperformance by any of the counterparties is limited to the fair value of contracts in net asset positions, which totaled
$22.5
as of
June 30, 2017
. Accordingly, management believes risk of material loss under these hedging contracts is remote.
Inflation Risk
To date, we do not believe inflation has had a material effect on our business, financial condition or results of operations. However, if our costs were to become subject to significant inflationary pressures in the future, we may not be able to fully offset such higher costs through price increases. Our inability or failure to do so could harm our business, prospects, financial condition, results of operations, cash flows, as well as the trading price of our securities.
Off-Balance Sheet Arrangements
We had undrawn letters of credit of
$5.5
and
$4.6
as of
June 30, 2017
and
2016
, respectively.
Critical Accounting Policies
We prepare our Consolidated Financial Statements in conformity with U.S. generally accepted accounting principles. The preparation of these Consolidated Financial Statements requires us to make estimates, assumptions and judgments that affect the reported amounts of assets, liabilities, revenues and expenses related disclosures. These estimates and assumptions can be subjective and complex and, consequently, actual results may differ from those estimates that would result in material changes to our operating results and financial condition. We evaluate our estimates and assumptions on an ongoing basis. Our estimates are based on historical experience and various other assumptions that we believe to be reasonable under the circumstances. Our
53
most critical accounting policies relate to revenue recognition, the assessment of goodwill, other intangible and long-lived assets for impairment, business combinations, inventory, pension benefit costs, income taxes and redeemable noncontrolling interests.
Our management has discussed the selection of significant accounting policies and the effect of estimates with the Audit and Finance Committee of our Board of Directors.
Revenue Recognition
Revenue is recognized when realized or realizable and earned. Our policy is to recognize revenue when risk of loss and title to the product transfers to the customer, which usually occurs upon delivery. Net revenues comprise gross revenues less customer discounts and allowances, actual and expected returns (estimated based on returns history and position in product life cycle) and various trade spending activities. Trade spending activities relate to advertising, product promotions and demonstrations, some of which involve cooperative relationships with customers. Returns represent
2%
,
3%
and
3%
of gross revenue after customer discounts and allowances in fiscal
2017
,
2016
and
2015
, respectively. Trade spending activities recorded as a reduction to gross revenue after customer discounts and allowances represent
7%
,
8%
, and
9%
in fiscal
2017
,
2016
and
2015
, respectively.
Our sales return accrual reflects seasonal fluctuations, including those related to the holiday season in our second quarter. This accrual is a subjective critical estimate that has a direct impact on reported net revenues, and is calculated based on history of actual returns, estimated future returns and information provided by retailers regarding their inventory levels. In addition, as necessary, specific accruals may be established for significant future known or anticipated events. The types of known or anticipated events that we have considered, and will continue to consider, include, but are not limited to, the financial condition of our customers, store closings by retailers, changes in the retail environment, and our decision to continue to support new and existing brands. If the historical data we use to calculate these estimates does not approximate future returns, additional allowances may be required.
Goodwill, Other Intangible Assets and Long-Lived Assets
Goodwill
Goodwill is calculated as the excess of the cost of purchased businesses over the fair value of their underlying net assets. Other intangible assets consist of indefinite-lived trademarks. Goodwill and other indefinite-lived intangible assets are not amortized.
We assess goodwill at least annually as of May 1 for impairment, or more frequently, if certain events or circumstances warrant. We test goodwill for impairment at the reporting unit level, which is the same level as our reportable segments. We identify our reporting units by assessing whether the components of our reporting segments constitute businesses for which discrete financial information is available and management of each reporting unit regularly reviews the operating results of those components.
When testing goodwill for impairment, we have the option of first performing a qualitative assessment to determine whether it is more likely than not that the fair value of a reporting unit is less than its carrying amount as the basis to determine if it is necessary to perform a quantitative goodwill impairment test. In performing our qualitative assessment, we consider the extent to which unfavorable events or circumstances identified, such as changes in economic conditions, industry and market conditions or company specific events, could affect the comparison of the reporting unit’s fair value with its carrying amount. If we conclude that it is more likely than not that the fair value of a reporting unit is less than its carrying amount, we are required to perform a quantitative impairment test.
Quantitative impairment testing for goodwill is performed in two steps: (i) the determination of possible impairment, based upon the fair value of a reporting unit as compared to its carrying value; and (ii) if there is a possible impairment indicated, this step measures the amount of impairment loss, if any, by comparing the implied fair value of goodwill with the carrying amount of that goodwill. We make certain judgments and assumptions in allocating assets and liabilities to determine carrying values for our reporting units.
Testing goodwill for impairment requires us to estimate fair values of reporting units using significant estimates and assumptions. The assumptions made will impact the outcome and ultimate results of the testing. We use industry accepted valuation models and set criteria that are reviewed and approved by various levels of management and, in certain instances, we engage independent third-party valuation specialists for advice. To determine fair value of the reporting unit, we used a combination of the income and market approaches. We believe the blended use of both models compensates for the inherent risk associated with either model if used on a stand-alone basis, and this combination is indicative of the factors a market participant would consider when performing a similar valuation.
Under the income approach, we determine fair value using a discounted cash flow method, projecting future cash flows of each reporting unit, as well as a terminal value, and discounting such cash flows at a rate of return that reflects the relative risk
54
of the cash flows. Under the market approach, we utilize information from comparable publicly traded companies with similar operating and investment characteristics as the reporting units, which creates valuation multiples that are applied to the operating performance of the reporting units being tested, to value the reporting unit.
The key estimates and factors used in these approaches include, but are not limited to, revenue growth rates and profit margins based on our internal forecasts, our specific weighted-average cost of capital used to discount future cash flows, and comparable market multiples for the industry segment as well as our historical operating trends. Certain future events and circumstances, including deterioration of market conditions, higher cost of capital, a decline in actual and expected consumer consumption and demands, could result in changes to these assumptions and judgments. A revision of these assumptions could cause the fair values of the reporting units to fall below their respective carrying values. We would then perform the second step of the goodwill impairment test to determine the amount of any non-cash impairment charge. Such charge could have a material effect on the Consolidated Statements of Operations and Balance Sheets.
There were no impairments of goodwill at our reporting units in fiscal 2017, 2016 and 2015.
Based on the annual impairment test performed at May 1, 2017, we determined that the fair values of our reporting units exceeded their respective carrying values at that date by a range of approximately
11.5%
to
81.9%
. To determine the fair value of our reporting units, we have used expected growth rates that are in line with expected market growth rates for the respective product categories and include a discount rate of 7.75%. The impact of recent acquisitions of the P&G Beauty Business, ghd and Younique is significant to the reporting units as day one carrying values of the recently acquired assets represent 71.1%, 79.1% and 77.8% of Luxury, Consumer Beauty and Professional Beauty reporting units’ carrying values, respectively, as of the date of the test and on acquisition their carrying values approximate their fair values. Accordingly, the newly acquired assets initially did not have any excess of their fair values over their carrying values, and therefore lowered the overall excess for the reporting units as of May 1, 2017.
We believe the assumptions used in calculating the estimated fair value of the reporting units are reasonable. However, we can provide no assurances that we will achieve such projected results. Further, we can provide no assurances that we will not have to recognize additional impairment of goodwill in the future due to other market conditions or changes in our interest rates. Recognition of additional impairment of a significant portion of our goodwill would negatively affect our reported results of our operations and total capitalization.
Other Intangible Assets
We assess indefinite-lived other intangible assets (trademarks) at least annually as of May 1 for impairment, or more frequently if certain events occur or circumstances change that would more likely than not reduce the fair value of an indefinite-lived intangible asset below its carrying value. Trademarks are tested for impairment on a brand level basis.
The trademarks’ fair values are based upon the income approach, primarily utilizing the relief from royalty methodology. This methodology assumes that, in lieu of ownership, a third party would be willing to pay a royalty in order to obtain the rights to use the comparable asset. An impairment loss is recognized when the estimated fair value of the intangible asset is less than the carrying value. Fair value calculation requires significant judgments in determining both the assets’ estimated cash flows as well as the appropriate discount and royalty rates applied to those cash flows to determine fair value. Variations in the economic conditions or a change in general consumer demands, operating results estimates or the application of alternative assumptions could produce significantly different results.
On May 1,
2017
,
2016
and
2015
, we performed our annual impairment testing of indefinite-lived other intangible assets and determined that no adjustments to carrying values were required.
The carrying value of our indefinite-lived other intangible assets was
$3,186.9
as of June 30, 2017, and is comprised of trademarks for the following brands: OPI of $662.6, philosophy of $269.8, Sally Hansen of $183.4, Galleria related trademarks of $1,575.0, ghd related trademark of $172.7, and other brands totaling $323.4. As of May 1, 2017, we determined that the fair value of our Sally Hansen brand exceeded its carrying value by approximately 8% using projections that assumed a discount rate of 8.5%. The fair value of the Sally Hansen trademark would fall below its carrying value if the weighted average annual growth rate decreased by approximately 49 basis points or the discount rate increased by 50 basis points. The fair value of one of our regional brands exceeded its carrying value of
$13.0
approximately 8% using projections that assumed a discount rate of 13.5%. The fair value of this regional brand would fall below its carrying value if the weighted average annual growth rate decreased by approximately 122 basis points or the discount rate increased by 150 basis points. The fair values of the remaining indefinite-lived trademarks exceeded their carrying values by amounts ranging from 19.0% to 92.0%.
We believe the assumptions used in calculating the estimated fair value of the trademarks are reasonable and attainable. However, we can provide no assurances that we will not have to recognize additional impairment of indefinite-lived intangible assets in the future due to other market conditions or changes in our interest rates. Recognition of additional impairment of a significant portion of our indefinite-lived intangible assets would negatively affect our reported results of operations and total capitalization.
55
Long-Lived Assets
Long-lived assets, including tangible and intangible assets with finite lives, are amortized over their respective lives to their estimated residual values and are also reviewed for impairment whenever certain triggering events may indicate impairment. When such events or changes in circumstances occur, a recoverability test is performed comparing projected undiscounted cash flows from the use and eventual disposition of an asset or asset group to its carrying value. If the projected undiscounted cash flows are less than the carrying value, an impairment would be recorded for the excess of the carrying value over the fair value, which is determined by discounting future cash flows.
There were no impairments of long-lived assets in fiscal 2017.
In conjunction with our analysis of our go-to-market strategy in Southeast Asia during the first quarter of fiscal 2016, we evaluated future cash flows for this asset group and determined that the carrying value exceeded the undiscounted cash flows. As a result, we evaluated the fair value of the long-lived assets in the asset group, through an analysis of discounted future cash flows, and determined that the customer relationships were fully impaired and thus recorded $5.5 of Asset impairment charges in the Consolidated Statements of Operations for the fiscal year ended June 30, 2016.
There were no impairments of long-lived assets in fiscal 2015.
Business Combinations
We allocate the cost of an acquired business to the assets acquired and liabilities assumed based on their estimated fair values as of the date of acquisition. The excess value of the cost of an acquired business over the estimated fair value of the assets acquired and liabilities assumed is recognized as goodwill. The valuation of the acquired assets and liabilities will impact our future operating results, as we recognize depreciation and amortization expense on long lived assets. We use a variety of information sources to determine the value of acquired assets and liabilities including: third-party appraisers for the values and lives of property, identifiable intangibles and inventories; and legal counsel or other experts to assess the obligations and liabilities associated with legal, environmental or other claims.
Significant judgment is required in estimating the fair value of intangible assets and in assigning their respective useful lives. The fair value estimates are based on historical information and on future expectations and assumptions deemed reasonable by management, but are inherently uncertain. Determining the useful life of an intangible asset also requires judgment. Certain brand intangibles are expected to have indefinite lives based on their history and our plans to manage the acquired brands. Other intangible assets are expected to have determinable useful lives. Our assessment of intangible assets that have an indefinite life and those that have a determinable life is based on a number of factors including the competitive environment, market share, brand history, underlying product life cycles, operating plans and the macroeconomic environment. The costs of determinable-lived intangible assets are amortized to expense over the estimated useful life.
We generally use the following methodologies for valuing our significant acquired intangibles assets:
|
•
|
Trademarks (indefinite or finite) - We use a relief from royalty method to value trademarks. The key assumptions for the model are forecasted net revenue, the royalty rate, the effective tax rate and the discount rate.
|
|
•
|
Customer relationships and license agreements - We use an excess earnings method to value customer relationships. The key assumptions for the model are forecasted net revenue and EBITDA, the estimated allocation of earnings between different classes of assets, the attrition rate, the effective tax rate and the discount rate.
|
Inventory
Inventories include items which are considered salable or usable in future periods, and are stated at the lower of cost or market value, with cost being based on standard cost which approximates actual cost on a first-in, first-out basis. Costs include direct materials, direct labor and overhead (e.g., indirect labor, rent and utilities, depreciation, purchasing, receiving, inspection and quality control) and in-bound freight costs. We classify inventories into various categories based upon their stage in the product life cycle, future marketing sales plans and the disposition process.
We also record an inventory obsolescence reserve, which represents the excess of the cost of the inventory over its estimated market value, based on various product sales projections. This reserve is calculated using an estimated obsolescence percentage applied to the inventory based on age, historical trends, and requirements to support forecasted sales. In addition, and as necessary, we may establish specific reserves for future known or anticipated events. These estimates could vary significantly, either favorably or unfavorably, from the amounts that we may ultimately realize upon the disposition of inventories if future economic conditions, customer inventory levels, product discontinuances, sales return levels, competitive conditions or other factors differ from the our estimates and expectations.
Pension Benefit Costs
56
We sponsor both funded and unfunded pension plans in various forms covering employees who meet the applicable eligibility requirements. We use several statistical and other factors in an attempt to estimate future events in calculating the liability and expense related to these plans. Certain significant variables require us to make assumptions such as anticipated discount rate and expected rate of return on plan assets. We evaluate these assumptions with our actuarial advisors and select assumptions that we believe reflect the economics underlying our pension obligations. While we believe these assumptions are within accepted industry ranges, an increase or decrease in the assumptions or economic events outside our control could have a material impact on reported net income.
The discount rates used to measure the benefit obligations at the measurement date and the net periodic benefit cost for the subsequent fiscal year are reset annually using data available at the measurement date.
The long-term rates of return on our pension plan assets are based on management’s expectations of long-term average rates of return to be achieved by the underlying investment portfolios. In establishing this assumption, management considers historical and expected returns for the assets in which the plan is invested, as well as current economic and market conditions. The difference between actual and expected return on plan assets is reported as a component of accumulated other comprehensive income (loss). Those gains or losses that are subject to amortization over future periods will be recognized as a component of the net periodic benefit cost in such future periods. In fiscal 2017, our pension plans (including the acquired plans after October 1, 2016) had actual returns on assets of
$9.8
as compared with expected return on assets of
$7.2
, which resulted in a net deferred gain of
$2.6
, substantially all of which is currently subject to be amortized over periods ranging from approximately 9 to 30 years. The actual return on assets was primarily related to the performance of equity markets during the past fiscal year.
The weighted-average assumptions used to determine our projected benefit obligation were as follows:
|
Pension Plans
|
|||||||
|
U.S.
|
International
|
||||||
|
2017
|
2016
|
2017
|
2016
|
||||
|
Discount rates
|
3.6%
|
3.3%-3.8%
|
0.4%-7.5%
|
0.2%-1.9%
|
|||
The weighted-average assumptions used to determine our net periodic benefit cost during the fiscal year were as follows:
|
Pension Plans
|
|||||||||||
|
U.S.
|
International
|
||||||||||
|
2017
|
2016
|
2015
|
2017
|
2016
|
2015
|
||||||
|
Discount rates
|
3.3%-3.8%
|
4.1%-4.5%
|
3.1%-4.5%
|
0.2%-7.8%
|
1.0%-2.7%
|
1.8%-3.2%
|
|||||
|
Expected long-term rates of return on plan assets
|
N/A
|
5.1%
|
6.5%
|
1.6%-6.0%
|
2.3%-4.3%
|
2.8%-4.3%
|
|||||
The actuarial assumptions used by us may differ materially from actual results due to changing market and economic conditions. Differences from these assumptions could significantly impact the actual amount of net periodic benefit cost and liability recorded by us.
Income Taxes
We are subject to income taxes in the U.S. and various foreign jurisdictions. We account for income taxes under the asset and liability method. Therefore, income tax expense is based on reported income before income taxes, and deferred income taxes reflect the effect of temporary differences between the amounts of assets and liabilities that are recognized for financial reporting purposes and the amounts that are recognized for income tax purposes. Deferred taxes are recorded at currently enacted statutory tax rates and are adjusted as enacted tax rates change.
In November 2015, the FASB issued authoritative guidance to eliminate the requirement to present deferred tax assets and liabilities as current and noncurrent amounts in a classified balance sheet. The new standard requires deferred tax assets and liabilities to be classified as noncurrent. We early adopted this guidance as of the fourth quarter of fiscal 2017 on a prospective basis beginning with the fiscal 2017 period presented. Accordingly, deferred tax assets and liabilities as well as corresponding valuation allowances have been classified as noncurrent in our Consolidated Balance Sheet. A valuation allowance is established, when necessary, to reduce deferred tax assets to the amount that is more likely than not to be realized based on currently available evidence. We consider how to recognize, measure, present and disclose in financial statements uncertain tax positions taken or expected to be taken on a tax return.
We are subject to tax audits in various jurisdictions. We regularly assess the likely outcomes of such audits in order to determine the appropriateness of liabilities for unrecognized tax benefits. We classify interest and penalties related to unrecognized tax benefits as a component of the provision for income taxes.
57
For unrecognized tax benefits, we first determine whether it is more-likely-than-not (defined as a likelihood of more than fifty percent) that a tax position will be sustained based on its technical merits as of the reporting date, assuming that taxing authorities will examine the position and have full knowledge of all relevant information. A tax position that meets this more-likely-than-not threshold is then measured and recognized at the largest amount of benefit that is greater than fifty percent likely to be realized upon effective settlement with a taxing authority. As the determination of liabilities related to unrecognized tax benefits, including associated interest and penalties, requires significant estimates to be made by us, there can be no assurance that we will accurately predict the outcomes of these audits, and thus the eventual outcomes could have a material impact on our operating results or financial condition and cash flows.
Unrecognized tax benefits are reviewed on an ongoing basis and are adjusted in light of changing facts and circumstances, including progress of examinations by tax authorities, developments in case law and closing of statute of limitations. Such adjustments are reflected in the provision for income taxes as appropriate. In addition, we are present in approximately 55 tax jurisdictions and we are subject to the continuous examination of our income tax returns by the Internal Revenue Service (IRS) and other tax authorities. We regularly assess the likelihood of adverse outcomes resulting from these examinations to determine the adequacy of our provision for income taxes.
It is our intention to permanently reinvest undistributed earnings and profits from our foreign operations that have been generated through June 30,
2017
, except where we are able to repatriate these earnings to the U.S. without material incremental tax expenditures. Our future plans do not demonstrate a need to repatriate the foreign amounts to fund U.S. operations. Accordingly, no provision has been made for U.S. income taxes on undistributed earnings of foreign subsidiaries as of June 30,
2017
. It is not practicable for us to determine the amount of additional income and withholding taxes that may be payable in the event the undistributed earnings are repatriated.
The balance of cumulative undistributed earnings of non-U.S. subsidiaries was
$2,412.7
and $2,426.0 as of June 30,
2017
and
2016
, respectively. Our cash and cash equivalents balance at June 30,
2017
and
2016
includes $470.2 and $364.8, respectively, of cash held by foreign operations associated with our permanent reinvestment strategy.
Redeemable Noncontrolling Interests
Interests held by third parties in consolidated majority-owned subsidiaries are presented as noncontrolling interests, which represents the noncontrolling stockholders’ interests in the underlying net assets of Coty consolidated majority-owned subsidiaries.
Noncontrolling interests, where we may be required to repurchase the noncontrolling interest under a put option or other contractual redemption requirement, are reported in the Consolidated Balance Sheets between liabilities and equity, as redeemable noncontrolling interests (“RNCI”). We adjust the redeemable noncontrolling interests to the redemption values on each balance sheet date with changes recognized as an adjustment to retained earnings, or in the absence of retained earnings, as an adjustment to additional paid-in capital.
Younique
We use an income approach, a market approach or a combination of these approaches to estimate the fair value of the RNCI related to our subsidiary Foundation, LLC, which holds a 100% interest in Younique, LLC. The income approach is used to determine the fair value of the Foundation RNCI using a discounted cash flow method, projecting future cash flows of the business, as well as a terminal value, and discounting such cash flows at a rate of return that reflects the relative risk of the cash flows. For the market approach, we use a selected multiple based on comparable companies multiplied by the forecasted cash flows. The key estimates and factors used in this approach include, but are not limited to, revenue growth rates and profit margins based on our internal forecasts and the entity specific weighted-average cost of capital used to discount future cash flows.
Item 7A.
Quantitative and Qualitative Disclosures About Market Risk.
We have operations both within the U.S. and internationally, and we are exposed to market risks in the ordinary course of our business, including the effect of foreign currency fluctuations, interest rate changes and inflation. Information relating to quantitative and qualitative disclosures about these market risks is set forth in under the captions “Foreign Currency Exchange Risk Management,” “Interest Rate Risk Management,” and “Credit Risk Management” within Item 7, “Management’s Discussion and Analysis of Financial Condition and Results of Operations—Liquidity and Capital Resources” and is incorporated in this Item 7A by reference.
Item 8.
Financial Statements and Supplementary Data.
58
The information required by this Item appears beginning on page F-1 of this Annual Report on Form 10-K and is incorporated in this Item 8 by reference.
Item 9A.
Controls and Procedures.
Evaluation of Disclosure Controls and Procedures
We maintain “disclosure controls and procedures,” as defined in Rules 13a-15(e) and 15d-15(e) under the Exchange Act, that are designed to ensure that information required to be disclosed by a company in the reports that it files or submits under the Exchange Act is recorded, processed, summarized and reported within the time periods specified in the SEC’s rules and forms. Disclosure controls and procedures include, without limitation, controls and procedures designed to ensure that information required to be disclosed by a company in the reports that it files or submits under the Exchange Act is accumulated and communicated to our management, including its principal executive and principal financial officers, as appropriate to allow timely decisions regarding required disclosure.
Our management, with the participation of our Chief Executive Officer (“CEO”) and our Chief Financial Officer (“CFO”), evaluated the effectiveness of our disclosure controls and procedures as of
June 30, 2017
. Based on the evaluation of our disclosure controls and procedures as of
June 30, 2017
, our CEO and CFO concluded that, as of such date, our disclosure controls and procedures were effective at the reasonable assurance level.
We have included our Management Report over Internal Control over Financial Reporting in “Item 15. Exhibits, Financial Statement Schedules” and is incorporated in this Item 9A by reference.
Changes in Internal Control over Financial Reporting
We completed the acquisitions of the P&G Beauty Business, ghd, and Younique on October 1, 2016, November 21, 2016 and February 1, 2017, respectively. Collectively, the P&G Beauty Business, ghd and Younique accounted for
42%
of our total assets as of June 30, 2017 and
45%
of our total net sales for the year ended June 30, 2017. As part of our ongoing integration of the P&G Beauty Business, ghd and Younique we are continuing to incorporate our controls and procedures into these subsidiaries and to augment our company-wide controls to reflect the risks inherent in these acquisitions. As permitted by the SEC guidance for newly acquired businesses, our Management Report over Internal Control over Financial Reporting for the year ended June 30, 2017 includes a scope exception that excludes the acquired P&G Beauty Business, ghd and Younique subsidiaries in order for management to have sufficient time to evaluate and implement our internal control structure over the operations of these subsidiaries.
There were no changes in our internal control over financial reporting identified in management’s evaluation pursuant to Rules 13a-15(f) and 15d-15(f) of the Exchange Act during the year that materially affected, or are reasonably likely to materially affect, our internal control over financial reporting.
Inherent Limitations on Effectiveness of Controls
Our management, including our CEO and CFO, believes that our disclosure controls and procedures and internal control over financial reporting are designed to provide reasonable assurance of achieving our objectives and are effective at the reasonable assurance level. However, our management does not expect that our disclosure controls and procedures or our internal control over financial reporting will prevent all errors and all fraud. A control system, no matter how well conceived and operated, can provide only reasonable, not absolute, assurance that the objectives of the control system are met. Further, the design of a control system must reflect the fact that there are resource constraints, and the benefits of controls must be considered relative to their costs. Because of the inherent limitations in all control systems, no evaluation of controls can provide absolute assurance that all control issues and instances of fraud, if any, have been detected. These inherent limitations include the realities that judgments in decision making can be faulty, and that breakdowns can occur because of a simple error or mistake. Additionally, controls can be circumvented by the individual acts of some persons, by collusion of two or more people or by management override of the controls. The design of any system of controls is also based in part upon certain assumptions about the likelihood of future events, and there can be no assurance that any design will succeed in achieving its stated goals under all potential future conditions; over time, controls may become inadequate because of changes in conditions, or the degree of compliance with policies or procedures may deteriorate. Because of the inherent limitations in a cost-effective control system, misstatements due to error or fraud may occur and not be detected.
Item 10.
Directors, Executive Officers and Corporate Governance.
Directors
59
Information regarding directors is incorporated by reference to the “Directors” and “Corporate Governance” sections of our proxy statement on Schedule 14A for the 2017 Annual Meeting of Stockholders (the “2017 Proxy Statement”).
Executive Officers
Information regarding executive officers is incorporated by reference to the “Executive Officers” section of our 2017 Proxy Statement.
Section 16(a) Beneficial Ownership Reporting Compliance
This information is incorporated by reference to the “Section 16(a) Beneficial Ownership Reporting Compliance” section of our 2017 Proxy Statement.
Code of Ethics
This information is incorporated by reference to the “Corporate Governance Guidelines and Code of Business Conduct” section of our 2017 Proxy Statement.
Item 11.
Executive Compensation.
This information is incorporated by reference to the “Executive Compensation” and “Director Compensation” sections of our 2017 Proxy Statement.
Item 12.
Security Ownership of Certain Beneficial Owners and Management and Related Stockholder Matters.
This information is incorporated by reference to the “Security Ownership of Certain Beneficial Owners and Management” section of our 2017 Proxy Statement.
Item 13.
Certain Relationships and Related Transactions, and Director Independence.
This information is incorporated by reference to the “Certain Relationships and Transactions of Related Persons” and “Corporate Governance” section of our 2017 Proxy Statement.
Item 14.
Principal Accounting Fees and Services.
This information is incorporated by reference to the “Audit Fees and Other Fees” section of our 2017 Proxy Statement.
Item 15.
Exhibits, Financial Statement Schedules.
List of documents filed as part of this Report:
|
(1)
|
Consolidated Financial Statements and Reports of Independent Registered Public Accounting Firm included herein: See Index on page F-1.
|
|
(2)
|
Financial Statement Schedule: See S-1.
|
|
(3)
|
All other schedules are omitted as they are inapplicable or the required information is furnished in the Company’s Consolidated Financial Statements or the Notes thereto.
|
|
(4)
|
List of Exhibits:
|
|
Exhibit
Number
|
Document
|
||
|
2.2
|
|
Transaction Agreement dated as of July 8, 2015 among The Procter & Gamble Company, the registrant, Galleria Co. and Green Acquisition Sub Inc. (previously filed on August 17, 2015 as Exhibit 2.2 to the registrant’s Annual Report on Form 10-K).*
|
|
|
2.3
|
|
Repurchase Letter Agreement dated August 13, 2015 among The Procter & Gamble Company, the registrant, Galleria Co. and Green Acquisition Sub Inc. (previously filed on August 17, 2015 as Exhibit 2.3 to the registrant’s Annual Report on Form 10-K).
|
|
|
2.4
|
|
Letter Agreement, dated February 19, 2016, by and among The Procter & Gamble Company, the registrant, Galleria Co. and Green Acquisition Sub Inc. (previously filed on February 25, 2016 as Exhibit 10.1 to the registrant’s Current Report on Form 8-K).
|
|
|
2.5
|
|
Third Amendment to Transaction Agreement, dated May 25, 2016, by and among The Procter & Gamble Company, the registrant, Galleria Co. and Green Acquisition Sub Inc. (previously filed on May 27, 2016 as Exhibit 10.1 to the registrant’s Current Report on Form 8-K).
|
|
60
|
2.6
|
|
Fourth Amendment to Transaction Agreement, dated August 25, 2016, by and among The Procter & Gamble Company, Coty Inc., Galleria Co. and Green Acquisition Sub Inc. (incorporated by reference to Exhibit 2.5 to Amendment No. 4 to Coty Inc.’s Registration Statement on Form S-4, filed on August 25, 2016).*
|
|
|
2.7
|
|
Side Letter, dated September 13, 2016, between Coty Inc. and The Procter & Gamble Company (previously filed on November 9, 2016 as Exhibit 10.1 to the registrant’s Quarterly Report on Form 10-Q).
|
|
|
2.8
|
|
Assignment and Transfer Agreement, dated as of November 2, 2015, by and between JAB Cosmetics B.V. and Coty Inc., including as an exhibit thereto that certain Shares and Trademarks Sale and Purchase Agreement, dated as of November 2, 2015, by and among JAB Cosmetics B.V., Hypermarcas S.A., Cosmed Indústria de Cosméticos e Medicamentos S.A., and as intervening and consenting parties, Novita Distribuição, Armazenamento e Transportes S.A., and Savoy Indústria de Cosméticos S.A. (previously filed on November 3, 2015 as Exhibit 10.1 to the registrant’s Current Report on Form 8-K).
|
|
|
2.9
|
|
Sale and Purchase Agreement, dated as of October 17, 2016, by and among Coty Inc., Gloria Coinvest 1 L.P., Lion Capital Fund III L.P., Lion Capital Fund III SBS L.P., Lion Capital Fund III (USD) L.P., Lion Capital Fund III SBS (USD) L.P., Ghd Nominees Limited (“GHD”), the management sellers named therein, and the other individual sellers named therein (previously filed on October 17, 2016 as Exhibit 2.1 to the registrant’s Current Report on Form 8-K).*
|
|
|
2.10
|
|
Tax Matters Agreement, effective as of October 1, 2016, by and among Coty Inc., The Procter & Gamble Company, Galleria Co. and Green Acquisition Sub Inc. (incorporated by reference to Exhibit 10.1 to the Company’s Current Report on Form 8-K filed on October 3, 2016).
|
|
|
2.11
|
|
Contribution Agreement, dated as of January 10, 2017, by and among Coty Inc., Coty US Holdings Inc., Foundation, LLC, Younique, LLC, UEV Holdings, LLC, Aspen Cove Holdings, Inc., each of the other unit holders of Younique, LLC, and Derek Maxfield (incorporated by reference to Exhibit 2.1 to the Company’s Current Report on Form 8-K filed on February 1, 2017).
|
|
|
3.1
|
|
Certificate of Amendment to the Amended and Restated Certificate of Incorporation of Coty Inc.(previously filed on October 3, 2016 as Exhibit 3.1 to the registrant’s Current Report on Form 8-K).
|
|
|
3.2
|
|
Amended and Restated By-Laws (previously filed on April 24, 2013 as Exhibit 3.2 to Amendment No. 4 to the registrant’s Registration Statement on Form S-1).
|
|
|
4.1
|
|
Specimen Class A Common Stock Certificate of the registrant (previously filed on May 28, 2013 as Exhibit 4.1 to Amendment No. 6 to the registrant’s Registration Statement on Form S-1)
|
|
|
4.2
|
|
Specimen Class B Common Stock Certificate of the registrant (previously filed on May 28, 2013 as Exhibit 4.1 to Amendment No. 6 to the registrant’s Registration Statement on Form S-1)
|
|
|
4.3
|
|
Certificate of Designations of Preferred Stock, Series A, dated April 17, 2015 (previously filed on April 20, 2015 as Exhibit 4.1 to the registrant’s Current Report on Form 8-K).
|
|
|
10.1
|
|
Form of Phantom Unit Award Terms and Conditions (previously filed on December 5, 2014 as Exhibit 10.1 to the registrant’s Current Report on Form 8-K).†
|
|
|
10.2
|
|
Credit Agreement, dated as of October 27, 2015, by and among Coty Inc., the other borrowers party thereto from time to time, the lenders party thereto, JPMorgan Chase Bank, N.A., as administrative agent, and the other agents from time to time party thereto (previously filed on October 30, 2015 as Exhibit 10.1 to the registrant’s Current Report on Form 8-K).
|
|
|
10.3
|
|
Pledge and Security Agreement, dated as of October 27, 2015, by and among Coty Inc., its subsidiaries signatory thereto and any other subsidiary who may become a party thereto and JPMorgan Chase Bank, N.A, as collateral agent (previously filed on October 30, 2015 as Exhibit 10.2 to the registrant’s Current Report on Form 8-K).
|
|
|
10.4
|
|
Credit Agreement, dated January 26, 2016, among Galleria Co., as initial borrower, the other borrowers from time to time party thereto, J.P. Morgan Chase Bank, N.A., as administrative agent and collateral agent, and the other agents and lenders party thereto (incorporated by reference to Exhibit 10.4 of Galleria Co.’s Registration Statement on Form S-4 filed on April 22, 2016).
|
|
|
10.5
|
|
Guaranty Agreement, dated as of October 27, 2015, by and among Coty Inc., its subsidiaries signatory thereto and any other subsidiary who may become a party thereto and JPMorgan Chase Bank, N.A., as administrative agent and collateral agent (previously filed on October 30, 2015 as Exhibit 10.3 to the registrant’s Current Report on Form 8-K).
|
|
|
10.6
|
|
Incremental Assumption Agreement and Amendment No. 1, dated April 8, 2016 to the Credit Agreement, by and among Coty Inc., Coty B.V., certain subsidiaries of Coty Inc. party thereto, the incremental lenders party thereto and JPMorgan Chase Bank, N.A., as administrative agent (previously filed on April 14, 2016 as Exhibit 10.1 to the registrant’s Current Report on Form 8-K).
|
|
|
10.7
|
|
Incremental Assumption Agreement and Refinancing Amendment to Credit Agreement, dated as of October 28, 2016, among Coty Inc., Coty B.V., the other loan parties party thereto, the lenders party thereto and JPMorgan Chase Bank, N.A., as administrative agent (incorporated by reference to Exhibit 10.1 to the Company’s Current Report on Form 8-K filed on October 28, 2016).
|
|
61
|
10.8
|
|
Registration Rights Agreement, dated April 1, 2015, between the registrant and Mousseluxe S.a.r.l. (previously filed on April 1, 2015 as Exhibit 10.1 to the registrant’s Current Report on Form 8-K).
|
|
|
10.9
|
|
Transition Services Agreement, effective as of October 1, 2016, by and between The Procter & Gamble Company and Galleria Co. (incorporated by reference to Exhibit 10.2 to the Company’s Current Report on Form 8-K filed on October 3, 2016).
|
|
|
10.10
|
|
Incremental Facility Activation Notice, dated as of October 28, 2016, among Coty Inc., each incremental term A lender and JPMorgan Chase Bank, N.A. as administrative agent (incorporated by reference to Exhibit 10.2 to the Company’s Current Report on Form 8-K filed on October 28, 2016).
|
|
|
10.11
|
|
Employment Agreement, dated June 20, 2016, between Coty Services UK Limited and Patrice de Talhouët (previously filed on June 24, 2016 as Exhibit 10.1 to the registrant’s Current Report on From 8-K).†
|
|
|
10.12
|
|
Employment Agreement, dated January 2014, between Coty Geneva S.A. Versoix and Mario Reis (previously filed on August 28, 2014 as Exhibit 10.22 to the registrant’s Annual Report on Form 10-K).†
|
|
|
10.13
|
|
Employment Agreement, dated July 20, 2016, by and between Camillo Pane and Coty Services UK Limited, as amended October 24, 2016 incorporated by reference to Exhibit 10.4 to the Company’s Current Report on Form 8-K filed on October 28, 2016).†
|
|
|
10.14
|
|
Open-Ended Employment Agreement, dated August 24, 2015, between Coty S.A.S. and Sebastien Froidefond (previously filed on November 5, 2016 as Exhibit 10.58 to the registrant’s Current Report on Form 8-K).†
|
|
|
10.15
|
|
Side Letter, dated as of March 31, 2017, between Coty Services UK Limited and Sébastien Froidefond (previously filed on May 10, 2017 as Exhibit 10.7 to the registrant’s Quarterly Report on Form 10-Q).†
|
|
|
10.16
|
|
Offer Letter, dated as of April 1, 2016, between Ayesha Zafar and the registrant (previously filed on May 11, 2016 as Exhibit 10.1 to the registrant’s Current Report on Form 8-K).†
|
|
|
10.17
|
|
Employment Agreement, dated October 12, 2015, between Coty Geneva S.A. Versoix and Esi Eggleston Bracey (previously filed on February 4, 2016 as Exhibit 10.29 to the registrant’s Quarterly Report on Form 10-Q).†
|
|
|
10.18
|
|
Termination Agreement, dated January 31, 2017, between Coty Geneva SA Versoix and Esi Eggleston Bracey.†
|
|
|
10.19
|
|
Employment Agreement, dated October 12, 2015, between Coty Geneva SA Versoix and Sylvie Moreau (previously filed on February 4, 2016 as Exhibit 10.30 to the registrant’s Quarterly Report on Form 10-Q).†
|
|
|
10.20
|
|
Employment Agreement, dated November 2, 2015, between Coty S.A.S. and Edgar Huber (previously filed on February 4, 2016 as Exhibit 10.31 to the registrant’s Quarterly Report on Form 10-Q).†
|
|
|
10.21
|
|
Separation Agreement, dated July 21, 2014, between the registrant and Ralph Macchio (previously filed on August 28, 2014 as Exhibit 10.25 to the registrant’s Annual Report on Form 10-K).†
|
|
|
10.22
|
|
Separation Agreement Amendment, dated January 21, 2015, between the registrant and Ralph Macchio (previously filed on August 17, 2015 as Exhibit 10.30 to the registrant’s Annual Report on Form 10-K).†
|
|
|
10.23
|
|
Separation Agreement Amendment, dated September 17, 2015, between the registrant and Ralph Macchio (previously filed on November 5, 2015 as Exhibit 10.57 to the registrant’s Current Report on Form 8-K).†
|
|
|
10.24
|
|
Third Amendment to the Separation Agreement, dated as of November 8, 2016, between Coty Inc. and Ralph Macchio (previously filed on February 9, 2017 as Exhibit 10.9 to the registrant’s Quarterly Report on Form 10-Q).†
|
|
|
10.25
|
|
Employment Agreement, dated as of October 1, 2016, between Coty Services UK Limited and Greerson McMullen (previously filed on February 9, 2017 as Exhibit 10.7 to the registrant’s Quarterly Report on Form 10-Q).†
|
|
|
10.26
|
|
Employment Agreement, dated as of January 16, 2017, between Coty Inc. and Laurent Kleitman.†
|
|
|
10.27
|
|
Form of Indemnification Agreement between the registrant and its directors and officers (previously filed on April 24, 2013 as Exhibit 10.24 to Amendment No. 4 to the registrant’s Registration Statement on Form S-1).
|
|
|
10.28
|
|
Amended and Restated Annual Performance Plan, as of February 1, 2017 (previously filed on May 10, 2017 as Exhibit 10.3 to the registrant’s Quarterly Report on Form 10-Q).†
|
|
|
10.29
|
Adoption of Amendments to Pre-2008 Stock Options Granted Under the Coty Inc. 2007 Stock Plan for Directors Or the Coty Inc. Stock Plan for Non-Employee Directors (applicable to awards outstanding on September 14, 2010) (previously filed on April 24, 2013 as Exhibit 10.40 to Amendment No. 4 to the registrant’s Registration Statement on Form S-1).†
|
||
|
10.30
|
Form of Restricted Stock Unit Award under Coty Inc. 2007 Stock Plan for Directors, as amended on April 8, 2013 (previously filed on April 24, 2013 as Exhibit 10.41 to Amendment No. 4 to the registrant’s Registration Statement on Form S-1).†
|
||
62
|
10.31
|
Amended and Restated Coty Inc. Equity and Long-Term Incentive Plan, as amended and restated on February 1, 2017. (previously filed on May 10, 2017 as Exhibit 10.2 to the registrant’s Quarterly Report on Form 10-Q).†
|
||
|
10.32
|
Restricted Stock Unit Award Terms and Conditions Under Coty Inc. Equity and Long-Term Incentive Plan, as amended and restated on April 8, 2013 (previously filed on April 24, 2013 as Exhibit 10.44 to Amendment No. 4 to the registrant’s Registration Statement on Form S-1).†
|
||
|
10.33
|
Restricted Stock and Restricted Stock Unit Tandem Award Terms and Conditions under the Coty Inc. Equity and Long-Term Incentive Plan, as amended and restated on April 8, 2013 (previously filed on April 24, 2013 as Exhibit 10.45 to Amendment No. 4 to the registrant’s Registration Statement on Form S-1).†
|
||
|
10.34
|
Form of Subscription Agreement for Series A Preferred Stock (previously filed on August 17, 2015 as Exhibit 10.55 to the registrant’s Annual Report on Form 10-K).†
|
||
|
10.35
|
Subscription Agreement, dated as of November 23, 2016, between Coty Inc. and Camillo Pane (previously filed on February 9, 2017 as Exhibit 10.10 to the registrant’s Quarterly Report on Form 10-Q).†
|
||
|
10.36
|
|
Subscription Agreement, dated as of February 16, 2017, between Coty Inc. and Sébastien Froidefond (previously filed on May 10, 2017 as Exhibit 10.6 to the registrant’s Quarterly Report on Form 10-Q).†
|
|
|
10.37
|
|
Subscription Agreement, dated as of March 27, 2017, between Coty Inc. and Lambertus J.H. Becht. (previously filed on May 10, 2017 as Exhibit 10.8 to the registrant’s Quarterly Report on Form 10-Q).†
|
|
|
10.38
|
Form of Elite Subscription and Stock Option Agreement (previously filed on February 9, 2017 as Exhibit 10.11 to the registrant’s Quarterly Report on Form 10-Q).†
|
||
|
10.39
|
|
Amended Form of Elite Subscription and Stock Option Agreement (previously filed on May 10, 2017 as Exhibit 10.5 to the registrant’s Quarterly Report on Form 10-Q).†
|
|
|
21.1
|
|
List of significant subsidiaries.
|
|
|
23.1
|
|
Consent of Deloitte & Touche LLP.
|
|
|
24.1
|
|
Power of Attorney (included in signature page).
|
|
|
31.1
|
|
Certification of Chief Executive Officer, pursuant to Rules 13a-14a and15d-14(a)
|
|
|
31.2
|
|
Certification of Chief Financial Officer, pursuant to Rules 13a-14(d) and 15d-14(d)
|
|
|
32.1
|
|
Certification of Chief Executive Officer, pursuant to 18 U.S. C. Section 1350
|
|
|
32.2
|
|
Certification of Chief Financial Officer, pursuant to 18 U.S. C. Section 1350
|
|
|
101.INS
|
|
XBRL Instance Document
|
|
|
101.SCH
|
|
XBRL Taxonomy Extension Schema Document
|
|
|
101.CAL
|
|
XBRL Taxonomy Extension Calculation Linkbase Document
|
|
|
101.DEF
|
|
XBRL Taxonomy Extension Definition Linkbase Document
|
|
|
101.LAB
|
|
XBRL Taxonomy Extension Labels Linkbase Document
|
|
|
101.PRE
|
|
XBRL Taxonomy Extension Presentation Linkbase Document
|
|
|
*
|
|
Schedules and similar attachments have been omitted pursuant to Item 601(b)(2) of Regulation S-K. The Company agrees to furnish supplementary to the Securities and Exchange Commission a copy of any omitted schedule or similar attachment upon request.
|
|
|
†
|
|
Exhibit is a management contract or compensatory plan or arrangement.
|
|
63
SIGNATURES
Pursuant to the requirements of Section 13 or 15(d) of the Securities Exchange Act of 1934, the registrant has duly caused this report to be signed on its behalf by the undersigned, thereunto duly authorized, in the city of New York, New York on August 23, 2017.
|
COTY INC.
|
|||
|
By:
|
/s/Patrice de Talhouët
|
||
|
Name: Patrice de Talhouët
|
|||
|
Title: Chief Financial Officer
|
|||
POWER OF ATTORNEY
KNOW ALL PERSONS BY THESE PRESENTS, that each person whose signature appears below constitutes and appoints Greerson G. McMullen, as his true and lawful attorney-in-fact and agent, with full power of substitution and resubstitution, for him and in his name, place and stead, in any and all capacities, to sign any and all amendments to this Annual Report on Form 10-K, and to file the same, with all exhibits thereto, and other documents in connection therewith, with the Securities and Exchange Commission, granting unto said attorney-in-fact and agent, full power and authority to do and perform each and every act and thing requisite and necessary to be done in connection therewith, as fully to all intents and purposes as he or she might or could do in person, hereby ratifying and confirming that all said attorney-in-fact and agent, or his or her substitute or substitutes, may lawfully do or cause to be done by virtue hereof.
Pursuant to the requirements of the Securities Exchange Act of 1934, this report has been signed by the following persons on behalf of the registrant and in the capacities and on the dates indicated:
|
Signature
|
Title
|
Date
|
||
|
/s/Camillo Pane
|
Chief Executive Officer and Director
(Principal Executive Officer)
|
August 23, 2017
|
||
|
(Camillo Pane)
|
||||
|
/s/Patrice de Talhouët
|
Chief Financial Officer
(Principal Financial Officer)
|
August 23, 2017
|
||
|
(Patrice de Talhouët)
|
||||
|
/s/Ayesha Zafar
|
Senior Vice President, Group Controller
(Principal Accounting Officer)
|
August 23, 2017
|
||
|
(Ayesha Zafar)
|
||||
|
/s/ Lambertus J.H. Becht
|
Chairman of the Board of Directors
|
August 23, 2017
|
||
|
(Lambertus J.H. Becht)
|
||||
|
/s/Sabine Chalmers
|
Director
|
August 23, 2017
|
||
|
(Sabine Chalmers)
|
||||
|
/s/Joachim Faber
|
Director
|
August 23, 2017
|
||
|
(Joachim Faber)
|
||||
|
/s/Olivier Goudet
|
Director
|
August 23, 2017
|
||
|
(Olivier Goudet)
|
||||
|
/s/Peter Harf
|
Director
|
August 23, 2017
|
||
|
(Peter Harf)
|
||||
|
/s/Paul Michaels
|
Director
|
August 23, 2017
|
||
|
(Paul Michaels)
|
||||
|
/s/Erhard Schoewel
|
Director
|
August 23, 2017
|
||
|
(Erhard Schoewel)
|
||||
|
/s/Robert Singer
|
Director
|
August 23, 2017
|
||
|
(Robert Singer)
|
||||
64
MANAGEMENT'S REPORT ON INTERNAL CONTROL OVER FINANCIAL REPORTING
Coty’s management is responsible for establishing and maintaining adequate internal control over financial reporting (as defined in Rules 13a-15(f) of the Securities Exchange Act of 1934) to provide reasonable assurance regarding the reliability of financial reporting and the preparation of financial statements for external purposes in accordance with generally accepted accounting principles in the United States of America ("GAAP"). Coty’s internal control over financial reporting includes those policies and procedures that:
(i) pertain to the maintenance of records that in reasonable detail accurately and fairly reflect the transactions and dispositions of the assets;
(ii) provide reasonable assurance that transactions are recorded as necessary to permit preparation of financial statements in accordance with GAAP, and that receipts and expenditures of the Company are being made only in accordance with authorizations of management and directors; and
(iii) provide reasonable assurance regarding prevention or timely detection of unauthorized acquisition, use or disposition of the Company’s assets that could have a material effect on the financial statements.
Because of its inherent limitations, internal control over financial reporting may not prevent or detect misstatements.
Also, projections of any evaluation of effectiveness to future periods are subject to the risk that controls may become inadequate because of changes in conditions, or that the degree of compliance with the policies or procedures may deteriorate.
We completed the acquisitions of certain assets and liabilities related to The Procter & Gamble Company’s (“P&G”) global fine fragrances, salon professional, cosmetics and retail hair color businesses, along with select hair styling brands (the “P&G Beauty Business”), 100% of the equity interest of Lion/Gloria Topco Limited which held the net assets of ghd (“ghd”), and 60% of the membership interest in Foundation, LLC which held the net assets of Younique, LLC, a Utah limited liability company (“Younique”) on October 1, 2016, November 21, 2016 and February 1, 2017, respectively. As a result, we have excluded the internal controls of the P&G Beauty Business, ghd and Younique from our annual evaluation of the effectiveness of internal control over financial reporting for our Company. Collectively, the P&G Beauty Business, ghd and Younique accounted for
42%
of our total assets as of June 30, 2017 and
45%
of our total net sales for the year ended June 30, 2017.
Coty’s management evaluated the effectiveness of internal control over financial reporting as of June 30, 2016 based on the criteria established in “Internal Control - Integrated Framework (2013)” issued by the Committee of Sponsoring Organizations of the Treadway Commission (COSO). Based on the evaluation, management has concluded that Coty maintained effective internal control over financial reporting as of June 30, 2017.
The Company's internal control over financial reporting as of June 30, 2017 has been audited by Deloitte & Touche LLP, an independent registered public accounting firm, as stated in their attestation report which appears herein.
/s/Camillo Pane
/s/Patrice de Talhouët
Camillo Pane Patrice de Talhouët
Chief Executive Officer and Director Chief Financial Officer
August 23, 2017
65
REPORT OF INDEPENDENT REGISTERED PUBLIC ACCOUNTING FIRM
To the Board of Directors and Stockholders of Coty Inc.,
New York, New York
We have audited the internal control over financial reporting of Coty Inc. and subsidiaries (the "Company") as of June 30, 2017, based on criteria established in
Internal Control - Integrated Framework (2013)
issued by the Committee of Sponsoring Organizations of the Treadway Commission. The Company's management is responsible for maintaining effective internal control over financial reporting and for its assessment of the effectiveness of internal control over financial reporting, included in the accompanying Management’s Report on Internal Control over Financial Reporting. Our responsibility is to express an opinion on the Company's internal control over financial reporting based on our audit.
As described in Management’s Report on Internal Control over Financial Reporting, management excluded from its assessment the internal control over financial reporting of The Procter & Gamble Company’s (“P&G”) global fine fragrances, salon professional, cosmetics and retail hair color businesses, along with select hair styling brands (the “P&G Beauty Business”), Lion/Gloria Topco Limited which held the net assets of ghd (“ghd”), and Foundation, LLC which held the net assets of Younique, LLC, a Utah limited liability company (“Younique”), which were acquired on October 1, 2016, November 21, 2016, and February 1, 2017, respectively and whose financial statements constituted
42%
of total assets and
45%
of total net revenues of the consolidated financial statement amounts as of and for the year ended June 30, 2017. Accordingly, our audit did not include the internal control over financial reporting of the P&G Beauty Business, ghd and Younique.
We conducted our audit in accordance with the standards of the Public Company Accounting Oversight Board (United States). Those standards require that we plan and perform the audit to obtain reasonable assurance about whether effective internal control over financial reporting was maintained in all material respects. Our audit included obtaining an understanding of internal control over financial reporting, assessing the risk that a material weakness exists, testing and evaluating the design and operating effectiveness of internal control based on the assessed risk, and performing such other procedures as we considered necessary in the circumstances. We believe that our audit provides a reasonable basis for our opinion.
A company's internal control over financial reporting is a process designed by, or under the supervision of, the company's principal executive and principal financial officers, or persons performing similar functions, and effected by the company's board of directors, management, and other personnel to provide reasonable assurance regarding the reliability of financial reporting and the preparation of financial statements for external purposes in accordance with generally accepted accounting principles. A company's internal control over financial reporting includes those policies and procedures that (1) pertain to the maintenance of records that, in reasonable detail, accurately and fairly reflect the transactions and dispositions of the assets of the company; (2) provide reasonable assurance that transactions are recorded as necessary to permit preparation of financial statements in accordance with generally accepted accounting principles, and that receipts and expenditures of the company are being made only in accordance with authorizations of management and directors of the company; and (3) provide reasonable assurance regarding prevention or timely detection of unauthorized acquisition, use, or disposition of the company's assets that could have a material effect on the financial statements.
Because of the inherent limitations of internal control over financial reporting, including the possibility of collusion or improper management override of controls, material misstatements due to error or fraud may not be prevented or detected on a timely basis. Also, projections of any evaluation of the effectiveness of the internal control over financial reporting to future periods are subject to the risk that the controls may become inadequate because of changes in conditions, or that the degree of compliance with the policies or procedures may deteriorate.
In our opinion, the Company maintained, in all material respects, effective internal control over financial reporting as of June 30, 2017, based on the criteria established in
Internal Control - Integrated Framework (2013)
issued by the Committee of Sponsoring Organizations of the Treadway Commission.
We have also audited, in accordance with the standards of the Public Company Accounting Oversight Board (United States), the consolidated financial statements and financial statement schedule as of and for the year ended June 30, 2017 of the Company and our report dated
August 23, 2017
expressed an unqualified opinion on those financial statements and financial statement schedule.
/s/ Deloitte & Touche LLP
New York, New York
August 23, 2017
REPORT OF INDEPENDENT REGISTERED PUBLIC ACCOUNTING FIRM
To the Board of Directors and Stockholders of Coty Inc.,
New York, New York
We have audited the accompanying consolidated balance sheets of Coty Inc. and subsidiaries (the "Company") as of June 30, 2017 and 2016, and the related consolidated statements of operations, comprehensive income (loss), equity and redeemable noncontrolling interests, and cash flows for each of the three years in the period ended June 30, 2017. Our audits also included the financial statement schedule listed in the Index at Item 15. These financial statements and financial statement schedule are the responsibility of the Company's management. Our responsibility is to express an opinion on the financial statements and financial statement schedule based on our audits.
We conducted our audits in accordance with the standards of the Public Company Accounting Oversight Board (United States). Those standards require that we plan and perform the audit to obtain reasonable assurance about whether the financial statements are free of material misstatement. An audit includes examining, on a test basis, evidence supporting the amounts and disclosures in the financial statements. An audit also includes assessing the accounting principles used and significant estimates made by management, as well as evaluating the overall financial statement presentation. We believe that our audits provide a reasonable basis for our opinion.
In our opinion, such consolidated financial statements present fairly, in all material respects, the financial position of Coty Inc. and subsidiaries as of June 30, 2017 and 2016, and the results of its operations and its cash flows for each of the three years in the period ended June 30, 2017, in conformity with accounting principles generally accepted in the United States of America. Also, in our opinion, such financial statement schedule, when considered in relation to the basic consolidated financial statements taken as a whole, presents fairly, in all material respects, the information set forth therein.
We have also audited, in accordance with the standards of the Public Company Accounting Oversight Board (United States), the Company's internal control over financial reporting as of June 30, 2017, based on the criteria established in
Internal Control - Integrated Framework (2013)
issued by the Committee of Sponsoring Organizations of the Treadway Commission and our report dated
August 23, 2017
, expressed an unqualified opinion on the Company's internal control over financial reporting.
/s/ Deloitte & Touche LLP
New York, New York
August 23, 2017
COTY INC. & SUBSIDIARIES
INDEX TO THE CONSOLIDATED FINANCIAL STATEMENTS
|
Financial Statement Schedule:
|
||
COTY INC. & SUBSIDIARIES
(In millions, except per share data
)
|
Year Ended
June 30, |
|||||||||||
|
2017
|
2016
|
2015
|
|||||||||
|
Net revenues
|
$
|
7,650.3
|
|
$
|
4,349.1
|
|
$
|
4,395.2
|
|
||
|
Cost of sales
|
3,028.5
|
|
1,746.0
|
|
1,757.0
|
|
|||||
|
Gross profit
|
4,621.8
|
|
2,603.1
|
|
2,638.2
|
|
|||||
|
Selling, general and administrative expenses
|
4,060.0
|
|
2,027.8
|
|
2,066.1
|
|
|||||
|
Amortization expense
|
275.1
|
|
79.5
|
|
74.7
|
|
|||||
|
Restructuring costs
|
372.2
|
|
86.9
|
|
75.4
|
|
|||||
|
Acquisition-related costs
|
355.4
|
|
174.0
|
|
34.1
|
|
|||||
|
Asset impairment charges
|
—
|
|
5.5
|
|
—
|
|
|||||
|
Gain on sale of assets
|
(3.1
|
)
|
(24.8
|
)
|
(7.2
|
)
|
|||||
|
Operating (loss) income
|
(437.8
|
)
|
254.2
|
|
395.1
|
|
|||||
|
Interest expense, net
|
218.6
|
|
81.9
|
|
73.0
|
|
|||||
|
Loss on early extinguishment of debt
|
—
|
|
3.1
|
|
88.8
|
|
|||||
|
Other expense, net
|
1.6
|
|
30.4
|
|
—
|
|
|||||
|
(Loss) income before income taxes
|
(658.0
|
)
|
138.8
|
|
233.3
|
|
|||||
|
Benefit for income taxes
|
(259.5
|
)
|
(40.4
|
)
|
(26.1
|
)
|
|||||
|
Net (loss) income
|
(398.5
|
)
|
179.2
|
|
259.4
|
|
|||||
|
Net income attributable to noncontrolling interests
|
15.4
|
|
7.6
|
|
15.1
|
|
|||||
|
Net income attributable to redeemable noncontrolling interests
|
8.3
|
|
14.7
|
|
11.8
|
|
|||||
|
Net (loss) income attributable to Coty Inc.
|
$
|
(422.2
|
)
|
$
|
156.9
|
|
$
|
232.5
|
|
||
|
Net (loss) income attributable to Coty Inc. per common share:
|
|||||||||||
|
Basic
|
$
|
(0.66
|
)
|
$
|
0.45
|
|
$
|
0.66
|
|
||
|
Diluted
|
(0.66
|
)
|
0.44
|
|
0.64
|
|
|||||
|
Weighted-average common shares outstanding:
|
|||||||||||
|
Basic
|
642.8
|
|
345.5
|
|
353.3
|
|
|||||
|
Diluted
|
642.8
|
|
354.2
|
|
362.9
|
|
|||||
See notes to Consolidated Financial Statements.
F-1
COTY INC. & SUBSIDIARIES
CONSOLIDATED STATEMENTS OF COMPREHENSIVE INCOME (LOSS)
(In millions)
|
Year Ended
June 30, |
|||||||||||
|
2017
|
2016
|
2015
|
|||||||||
|
Net (loss) income
|
$
|
(398.5
|
)
|
$
|
179.2
|
|
$
|
259.4
|
|
||
|
Other comprehensive income (loss):
|
|||||||||||
|
Foreign currency translation adjustment
|
121.9
|
|
83.3
|
|
(228.4
|
)
|
|||||
|
Net unrealized derivative gain (loss) on cash flow hedges, net of taxes of $(7.7), $0.3 and $(1.6), respectively
|
41.5
|
|
(28.8
|
)
|
8.8
|
|
|||||
|
Pension and other post-employment benefits, net of tax of $(25.1), $7.9 and $(17.6), respectively
|
80.6
|
|
(19.7
|
)
|
30.1
|
|
|||||
|
Total other comprehensive income (loss), net of tax
|
244.0
|
|
34.8
|
|
(189.5
|
)
|
|||||
|
Comprehensive (loss) income:
|
(154.5
|
)
|
214.0
|
|
69.9
|
|
|||||
|
Comprehensive income attributable to noncontrolling interests:
|
|
|
|
|
|||||||
|
Net income
|
15.4
|
|
7.6
|
|
15.1
|
|
|||||
|
Foreign currency translation adjustment
|
(0.1
|
)
|
0.1
|
|
(0.4
|
)
|
|||||
|
Total comprehensive income attributable to noncontrolling interests
|
15.3
|
|
7.7
|
|
14.7
|
|
|||||
|
Comprehensive income attributable to redeemable noncontrolling interests:
|
|||||||||||
|
Net income
|
8.3
|
|
14.7
|
|
11.8
|
|
|||||
|
Foreign currency translation adjustment
|
—
|
|
0.4
|
|
(0.2
|
)
|
|||||
|
Total comprehensive income attributable to redeemable noncontrolling interests
|
8.3
|
|
15.1
|
|
11.6
|
|
|||||
|
Comprehensive (loss) income attributable to Coty Inc.
|
$
|
(178.1
|
)
|
$
|
191.2
|
|
$
|
43.6
|
|
||
See notes to Consolidated Financial Statements.
F-2
COTY INC. & SUBSIDIARIES
(In millions, except per share data
)
|
June 30,
2017 |
June 30,
2016 |
||||||
|
ASSETS
|
|||||||
|
Current assets:
|
|||||||
|
Cash and cash equivalents
|
$
|
535.4
|
|
$
|
372.4
|
|
|
|
Restricted cash
|
35.3
|
|
—
|
|
|||
|
Trade receivables—less allowances of $58.5 and $35.2, respectively
|
1,470.3
|
|
682.9
|
|
|||
|
Inventories
|
1,052.6
|
|
565.8
|
|
|||
|
Prepaid expenses and other current assets
|
487.9
|
|
206.8
|
|
|||
|
Deferred income taxes
|
—
|
|
110.5
|
|
|||
|
Total current assets
|
3,581.5
|
|
1,938.4
|
|
|||
|
Property and equipment, net
|
1,632.1
|
|
638.6
|
|
|||
|
Goodwill
|
8,555.5
|
|
2,212.7
|
|
|||
|
Other intangible assets, net
|
8,425.2
|
|
2,050.1
|
|
|||
|
Deferred income taxes
|
72.6
|
|
15.7
|
|
|||
|
Other noncurrent assets
|
281.3
|
|
180.1
|
|
|||
|
TOTAL ASSETS
|
$
|
22,548.2
|
|
$
|
7,035.6
|
|
|
|
LIABILITIES AND EQUITY
|
|
|
|
|
|||
|
Current liabilities:
|
|
|
|
|
|||
|
Accounts payable
|
$
|
1,732.1
|
|
$
|
921.4
|
|
|
|
Accrued expenses and other current liabilities
|
1,796.4
|
|
748.4
|
|
|||
|
Short-term debt and current portion of long-term debt
|
209.1
|
|
161.8
|
|
|||
|
Income and other taxes payable
|
66.0
|
|
18.7
|
|
|||
|
Deferred income taxes
|
—
|
|
4.9
|
|
|||
|
Total current liabilities
|
3,803.6
|
|
1,855.2
|
|
|||
|
Long-term debt, net
|
6,928.3
|
|
3,936.4
|
|
|||
|
Pension and other post-employment benefits
|
549.2
|
|
230.6
|
|
|||
|
Deferred income taxes
|
924.9
|
|
339.2
|
|
|||
|
Other noncurrent liabilities
|
473.4
|
|
233.8
|
|
|||
|
Total liabilities
|
12,679.4
|
|
6,595.2
|
|
|||
|
COMMITMENTS AND CONTINGENCIES (Note 24)
|
|
|
|
|
|||
|
REDEEMABLE NONCONTROLLING INTERESTS
|
551.1
|
|
73.3
|
|
|||
|
EQUITY:
|
|||||||
|
Preferred stock, $0.01 par value; 20.0 shares authorized; 4.2 and 1.7 issued and outstanding, at June 30, 2017 and 2016, respectively
|
—
|
|
—
|
|
|||
|
Class A Common Stock, $0.01 par value; 1,000.0 and 800.0 shares authorized, 812.9 and 138.7 issued and 747.9 and 75.1 outstanding at June 30, 2017 and 2016, respectively
|
8.1
|
|
1.4
|
|
|||
|
Class B Common Stock, $0.01 par value; 0.0 and 262.0 shares authorized, 0.0 and 262.0 issued and outstanding at June 30, 2017 and 2016, respectively
|
—
|
|
2.6
|
|
|||
|
Additional paid-in capital
|
11,203.2
|
|
2,038.4
|
|
|||
|
Accumulated deficit
|
(459.2
|
)
|
(37.0
|
)
|
|||
|
Accumulated other comprehensive income (loss)
|
4.4
|
|
(239.7
|
)
|
|||
|
Treasury stock—at cost, shares: 65.0 and 63.6 at June 30, 2017 and 2016, respectively
|
(1,441.8
|
)
|
(1,405.5
|
)
|
|||
|
Total Coty Inc. stockholders’ equity
|
9,314.7
|
|
360.2
|
|
|||
|
Noncontrolling interests
|
3.0
|
|
6.9
|
|
|||
|
Total equity
|
9,317.7
|
|
367.1
|
|
|||
|
TOTAL LIABILITIES, REDEEMABLE NONCONTROLLING INTERESTS AND EQUITY
|
$
|
22,548.2
|
|
$
|
7,035.6
|
|
|
See notes to Consolidated Financial Statements.
F-3
COTY INC. & SUBSIDIARIES
CONSOLIDATED STATEMENTS OF EQUITY
AND REDEEMABLE NONCONTROLLING INTERESTS
(In millions)
|
|
Preferred Stock
|
Class A
Common Stock |
Class B
Common Stock |
Additional
Paid-in |
(Accumulated
|
Accumulated
Other Comprehensive |
Treasury Stock
|
Total Coty Inc.
Stockholders’ |
Noncontrolling
|
Total
|
Redeemable
Noncontrolling |
||||||||||||||||||||||||||||||||||||||||||||
|
|
Shares
|
Amount
|
Shares
|
Amount
|
Shares
|
Amount
|
Capital
|
Deficit)
|
(Loss)
|
Shares
|
Amount
|
Equity
|
Interests
|
Equity
|
Interests
|
||||||||||||||||||||||||||||||||||||||||
|
BALANCE—July 1, 2014
|
—
|
|
$
|
—
|
|
125.1
|
|
$
|
1.2
|
|
263.7
|
|
$
|
2.6
|
|
$
|
1,926.9
|
|
$
|
(426.4
|
)
|
$
|
(85.1
|
)
|
34.9
|
|
$
|
(575.4
|
)
|
$
|
843.8
|
|
$
|
10.6
|
|
$
|
854.4
|
|
$
|
106.2
|
|
||||||||||||||
|
Issuance of Preferred Stock
|
1.9
|
|
—
|
|
—
|
|
—
|
|
|||||||||||||||||||||||||||||||||||||||||||||||
|
Conversion of Class B to Class A Common Stock
|
1.7
|
|
—
|
|
(1.7
|
)
|
—
|
|
—
|
|
—
|
|
|||||||||||||||||||||||||||||||||||||||||||
|
Purchase of Class A Common Stock
|
—
|
|
13.4
|
|
(263.1
|
)
|
(263.1
|
)
|
(263.1
|
)
|
|||||||||||||||||||||||||||||||||||||||||||||
|
Re-issuance of Treasury Stock for Bourjois Acquisition
|
106.9
|
|
(15.5
|
)
|
269.9
|
|
376.8
|
|
376.8
|
|
|||||||||||||||||||||||||||||||||||||||||||||
|
Reclassification of common stock and stock options to liability
|
(29.5
|
)
|
(29.5
|
)
|
(29.5
|
)
|
|||||||||||||||||||||||||||||||||||||||||||||||||
|
Reclassification of Class A Common Stock from liability to APIC
|
29.5
|
|
29.5
|
|
29.5
|
|
|||||||||||||||||||||||||||||||||||||||||||||||||
|
Exercise of former CEO stock options
|
1.4
|
|
—
|
|
12.5
|
|
12.5
|
|
12.5
|
|
|||||||||||||||||||||||||||||||||||||||||||||
|
Purchase of Class A Common Stock from former CEO
|
2.4
|
|
(42.0
|
)
|
(42.0
|
)
|
(42.0
|
)
|
|||||||||||||||||||||||||||||||||||||||||||||||
|
Discount of Class A Common Stock
|
1.9
|
|
1.9
|
|
1.9
|
|
|||||||||||||||||||||||||||||||||||||||||||||||||
|
Exercise of employee stock options and settlement of restricted stock units
|
5.8
|
|
0.1
|
|
48.4
|
|
48.5
|
|
48.5
|
|
|||||||||||||||||||||||||||||||||||||||||||||
|
Share-based compensation expense
|
14.3
|
|
14.3
|
|
14.3
|
|
|||||||||||||||||||||||||||||||||||||||||||||||||
|
Dividends ($0.20 per common share)
|
(71.6
|
)
|
(71.6
|
)
|
(71.6
|
)
|
|||||||||||||||||||||||||||||||||||||||||||||||||
|
Net income
|
232.5
|
|
232.5
|
|
15.1
|
|
247.6
|
|
11.8
|
|
|||||||||||||||||||||||||||||||||||||||||||||
|
Other comprehensive loss
|
(188.9
|
)
|
(188.9
|
)
|
(0.4
|
)
|
(189.3
|
)
|
(0.2
|
)
|
|||||||||||||||||||||||||||||||||||||||||||||
|
Proceeds from noncontrolling interests
|
1.8
|
|
1.8
|
|
—
|
|
|||||||||||||||||||||||||||||||||||||||||||||||||
|
Distribution to noncontrolling interests, net
|
(12.2
|
)
|
(12.2
|
)
|
(10.6
|
)
|
|||||||||||||||||||||||||||||||||||||||||||||||||
|
Redeemable noncontrolling interest purchase
|
(15.8
|
)
|
|||||||||||||||||||||||||||||||||||||||||||||||||||||
|
Adjustment of redeemable noncontrolling interests to redemption value
|
5.1
|
|
5.1
|
|
5.1
|
|
(5.1
|
)
|
|||||||||||||||||||||||||||||||||||||||||||||||
|
BALANCE—June 30, 2015
|
1.9
|
|
$
|
—
|
|
134.0
|
|
$
|
1.3
|
|
262.0
|
|
$
|
2.6
|
|
$
|
2,044.4
|
|
$
|
(193.9
|
)
|
$
|
(274.0
|
)
|
35.2
|
|
$
|
(610.6
|
)
|
$
|
969.8
|
|
$
|
14.9
|
|
$
|
984.7
|
|
$
|
86.3
|
|
||||||||||||||
See notes to Consolidated Financial Statements.
F-4
COTY INC. & SUBSIDIARIES
CONSOLIDATED STATEMENTS OF EQUITY
AND REDEEMABLE NONCONTROLLING INTERESTS
(In millions)
|
|
Preferred Stock
|
Class A
Common Stock |
Class B
Common Stock |
Additional
Paid-in |
(Accumulated
|
Accumulated
Other Comprehensive |
Treasury Stock
|
Total Coty Inc.
Stockholders’ |
Noncontrolling
|
Total
|
Redeemable
Noncontrolling |
||||||||||||||||||||||||||||||||||||||||||||
|
|
Shares
|
Amount
|
Shares
|
Amount
|
Shares
|
Amount
|
Capital
|
Deficit)
|
Income (Loss)
|
Shares
|
Amount
|
Equity
|
Interests
|
Equity
|
Interests
|
||||||||||||||||||||||||||||||||||||||||
|
BALANCE—July 1, 2015
|
1.9
|
|
—
|
|
|
134.0
|
|
|
1.3
|
|
|
262.0
|
|
|
2.6
|
|
|
2,044.4
|
|
|
(193.9
|
)
|
|
(274.0
|
)
|
|
35.2
|
|
|
(610.6
|
)
|
|
969.8
|
|
|
14.9
|
|
|
984.7
|
|
|
86.3
|
|
||||||||||||
|
Cancellation of Preferred Stock
|
(0.2
|
)
|
—
|
|
(0.1
|
)
|
(0.1
|
)
|
(0.1
|
)
|
|||||||||||||||||||||||||||||||||||||||||||||
|
Purchase of Class A Common Stock
|
—
|
|
28.4
|
|
(794.9
|
)
|
|
(794.9
|
)
|
|
(794.9
|
)
|
|||||||||||||||||||||||||||||||||||||||||||
|
Reclassification of Class A Common Stock from liability to APIC
|
13.8
|
|
|
13.8
|
|
|
13.8
|
|
|||||||||||||||||||||||||||||||||||||||||||||||
|
Exercise of employee stock options and restricted stock units and related tax benefits
|
4.7
|
|
0.1
|
|
44.7
|
|
|
44.8
|
|
|
44.8
|
|
|||||||||||||||||||||||||||||||||||||||||||
|
Series A Preferred Share based compensation expense
|
1.6
|
|
|
1.6
|
|
|
1.6
|
|
|||||||||||||||||||||||||||||||||||||||||||||||
|
Share-based compensation expense
|
20.6
|
|
|
20.6
|
|
|
20.6
|
|
|||||||||||||||||||||||||||||||||||||||||||||||
|
Dividends ($0.25 per common share)
|
(89.8
|
)
|
|
(89.8
|
)
|
|
(89.8
|
)
|
|||||||||||||||||||||||||||||||||||||||||||||||
|
Net income
|
156.9
|
|
|
156.9
|
|
7.6
|
|
|
164.5
|
|
14.7
|
|
|||||||||||||||||||||||||||||||||||||||||||
|
Other comprehensive income
|
34.3
|
|
|
34.3
|
|
0.1
|
|
|
34.4
|
|
0.4
|
|
|||||||||||||||||||||||||||||||||||||||||||
|
Distribution to noncontrolling interests, net
|
(15.7
|
)
|
|
(15.7
|
)
|
|
(14.8
|
)
|
|||||||||||||||||||||||||||||||||||||||||||||||
|
Adjustment of redeemable noncontrolling interests to redemption value
|
3.2
|
|
|
3.2
|
|
|
3.2
|
|
(3.2
|
)
|
|||||||||||||||||||||||||||||||||||||||||||||
|
Repurchase of redeemable noncontrolling interest
|
(10.1
|
)
|
|||||||||||||||||||||||||||||||||||||||||||||||||||||
|
BALANCE—June 30, 2016
|
1.7
|
|
$
|
—
|
|
|
138.7
|
|
|
$
|
1.4
|
|
|
262.0
|
|
|
$
|
2.6
|
|
|
$
|
2,038.4
|
|
|
$
|
(37.0
|
)
|
|
$
|
(239.7
|
)
|
63.6
|
|
|
$
|
(1,405.5
|
)
|
|
$
|
360.2
|
|
|
$
|
6.9
|
|
|
$
|
367.1
|
|
|
$
|
73.3
|
|
||
See notes to Consolidated Financial Statements.
F-5
COTY INC. & SUBSIDIARIES
CONSOLIDATED STATEMENTS OF EQUITY
AND REDEEMABLE NONCONTROLLING INTERESTS
(In millions)
|
Preferred Stock
|
Class A
Common Stock
|
Class B
Common Stock
|
Additional
Paid-in
|
(Accumulated
|
Accumulated
Other
Comprehensive
|
Treasury Stock
|
Total Coty Inc.
Stockholders’
|
Noncontrolling
|
Total
|
Redeemable
Noncontrolling
|
|||||||||||||||||||||||||||||||||||||||||||||
|
Shares
|
Amount
|
Shares
|
Amount
|
Shares
|
Amount
|
Capital
|
Deficit)
|
Income (Loss)
|
Shares
|
Amount
|
Equity
|
Interests
|
Equity
|
Interests
|
|||||||||||||||||||||||||||||||||||||||||
|
BALANCE—July 1, 2016
|
1.7
|
|
$
|
—
|
|
138.7
|
|
$
|
1.4
|
|
262.0
|
|
$
|
2.6
|
|
$
|
2,038.4
|
|
$
|
(37.0
|
)
|
$
|
(239.7
|
)
|
63.6
|
|
$
|
(1,405.5
|
)
|
$
|
360.2
|
|
$
|
6.9
|
|
$
|
367.1
|
|
$
|
73.3
|
|
||||||||||||||
|
Issuance of Class A Common Stock for acquisition
|
409.7
|
|
4.1
|
|
9,624.5
|
|
9,628.6
|
|
9,628.6
|
|
|||||||||||||||||||||||||||||||||||||||||||||
|
Issuance of Preferred Stock
|
2.5
|
|
—
|
|
—
|
|
—
|
|
|||||||||||||||||||||||||||||||||||||||||||||||
|
Conversion of Class B to Class A Common Stock
|
262.0
|
|
2.6
|
|
(262.0
|
)
|
(2.6
|
)
|
—
|
|
—
|
|
—
|
|
|||||||||||||||||||||||||||||||||||||||||
|
Purchase of Class A Common Stock
|
1.4
|
|
(36.3
|
)
|
(36.3
|
)
|
(36.3
|
)
|
|||||||||||||||||||||||||||||||||||||||||||||||
|
Exercise of employee stock options and restricted stock units and related tax benefits
|
2.5
|
|
—
|
|
22.8
|
|
22.8
|
|
22.8
|
|
|||||||||||||||||||||||||||||||||||||||||||||
|
Share-based compensation expense
|
20.0
|
|
20.0
|
|
20.0
|
|
|||||||||||||||||||||||||||||||||||||||||||||||||
|
Dividends ($0.650 per common share)
|
(375.0
|
)
|
(375.0
|
)
|
(375.0
|
)
|
|||||||||||||||||||||||||||||||||||||||||||||||||
|
Net (loss) income
|
(422.2
|
)
|
(422.2
|
)
|
15.4
|
|
(406.8
|
)
|
8.3
|
|
|||||||||||||||||||||||||||||||||||||||||||||
|
Other comprehensive (loss) income
|
244.1
|
|
244.1
|
|
(0.1
|
)
|
244.0
|
|
—
|
|
|||||||||||||||||||||||||||||||||||||||||||||
|
Distribution to noncontrolling interests, net
|
—
|
|
—
|
|
(10.0
|
)
|
(10.0
|
)
|
(32.3
|
)
|
|||||||||||||||||||||||||||||||||||||||||||||
|
Redeemable noncontrolling interest due to business combination (Note 3)
|
—
|
|
|
|
—
|
|
415.9
|
|
|||||||||||||||||||||||||||||||||||||||||||||||
|
Reclassification of noncontrolling interest to mandatory redeemable financial interest
|
(40.7
|
)
|
(40.7
|
)
|
(9.2
|
)
|
(49.9
|
)
|
—
|
|
|||||||||||||||||||||||||||||||||||||||||||||
|
Adjustment of redeemable noncontrolling interests to redemption value
|
(86.8
|
)
|
(86.8
|
)
|
(86.8
|
)
|
86.8
|
|
|||||||||||||||||||||||||||||||||||||||||||||||
|
Adjustment to repurchase of redeemable noncontrolling interests
|
—
|
|
(0.9
|
)
|
|||||||||||||||||||||||||||||||||||||||||||||||||||
|
BALANCE—June 30, 2017
|
4.2
|
|
$
|
—
|
|
812.9
|
|
$
|
8.1
|
|
—
|
|
$
|
—
|
|
$
|
11,203.2
|
|
$
|
(459.2
|
)
|
$
|
4.4
|
|
65.0
|
|
$
|
(1,441.8
|
)
|
$
|
9,314.7
|
|
$
|
3.0
|
|
$
|
9,317.7
|
|
$
|
551.1
|
|
||||||||||||||
See notes to Consolidated Financial Statements.
F-6
COTY INC. & SUBSIDIARIES
(In millions)
|
Year Ended
June 30, |
|||||||||||
|
2017
|
2016
|
2015
|
|||||||||
|
CASH FLOWS FROM OPERATING ACTIVITIES:
|
|||||||||||
|
Net (loss) income
|
$
|
(398.5
|
)
|
$
|
179.2
|
|
$
|
259.4
|
|
||
|
Adjustments to reconcile net income (loss) to net cash provided by operating activities:
|
|||||||||||
|
Depreciation and amortization
|
555.1
|
|
232.0
|
|
230.9
|
|
|||||
|
Asset impairment charges
|
—
|
|
5.5
|
|
—
|
|
|||||
|
Deferred income taxes
|
(390.0
|
)
|
(139.2
|
)
|
(87.2
|
)
|
|||||
|
Provision for bad debts
|
23.4
|
|
21.9
|
|
4.5
|
|
|||||
|
Provision for pension and other post-employment benefits
|
53.6
|
|
9.2
|
|
16.2
|
|
|||||
|
Share-based compensation
|
24.6
|
|
22.2
|
|
30.6
|
|
|||||
|
Gain on sale of assets
|
(3.1
|
)
|
(24.8
|
)
|
(7.2
|
)
|
|||||
|
Loss on extinguishment of debt
|
—
|
|
3.1
|
|
88.8
|
|
|||||
|
Other
|
25.9
|
|
12.8
|
|
20.5
|
|
|||||
|
Change in operating assets and liabilities, net of effects from purchase of acquired companies:
|
|
|
|
|
|||||||
|
Trade receivables
|
(279.8
|
)
|
(44.5
|
)
|
(43.5
|
)
|
|||||
|
Inventories
|
162.3
|
|
27.2
|
|
29.4
|
|
|||||
|
Prepaid expenses and other current assets
|
(105.7
|
)
|
6.7
|
|
6.0
|
|
|||||
|
Accounts payable
|
540.9
|
|
148.2
|
|
7.0
|
|
|||||
|
Accrued expenses and other current liabilities
|
479.2
|
|
23.3
|
|
16.1
|
|
|||||
|
Income and other taxes payable
|
85.0
|
|
15.7
|
|
127.7
|
|
|||||
|
Other noncurrent assets
|
23.4
|
|
9.0
|
|
(136.7
|
)
|
|||||
|
Other noncurrent liabilities
|
(38.8
|
)
|
(6.1
|
)
|
(36.2
|
)
|
|||||
|
Net cash provided by operating activities
|
757.5
|
|
501.4
|
|
526.3
|
|
|||||
|
CASH FLOWS FROM INVESTING ACTIVITIES:
|
|||||||||||
|
Capital expenditures
|
(432.3
|
)
|
(150.1
|
)
|
(170.9
|
)
|
|||||
|
Payments for business combinations, net of cash acquired
|
(742.6
|
)
|
(908.7
|
)
|
11.7
|
|
|||||
|
Additions of goodwill
|
—
|
|
—
|
|
(30.0
|
)
|
|||||
|
Proceeds from sale of assets
|
11.3
|
|
29.2
|
|
14.8
|
|
|||||
|
Payments related to loss on foreign currency contracts
|
—
|
|
(29.6
|
)
|
—
|
|
|||||
|
Other
|
—
|
|
—
|
|
3.2
|
|
|||||
|
Net cash used in investing activities
|
(1,163.6
|
)
|
(1,059.2
|
)
|
(171.2
|
)
|
|||||
|
CASH FLOWS FROM FINANCING ACTIVITIES:
|
|||||||||||
|
Proceeds from short-term debt, original maturity more than three months
|
9.5
|
|
19.1
|
|
652.2
|
|
|||||
|
Repayments of short-term debt, original maturity more than three months
|
(10.2
|
)
|
(28.3
|
)
|
(655.0
|
)
|
|||||
|
Net (repayments of) proceeds from short-term debt, original maturity less than three months
|
(49.2
|
)
|
25.4
|
|
11.6
|
|
|||||
|
Proceeds from revolving loan facilities
|
2,244.4
|
|
1,940.0
|
|
853.0
|
|
|||||
|
Repayments of revolving loan facilities
|
(2,074.4
|
)
|
(1,430.0
|
)
|
(1,616.0
|
)
|
|||||
|
Proceeds from term loans and other long term debt
|
1,075.0
|
|
3,506.2
|
|
800.9
|
|
|||||
|
Repayments of term loans and other long term debt
|
(136.1
|
)
|
(2,499.4
|
)
|
(784.6
|
)
|
|||||
|
Dividend payment
|
(372.6
|
)
|
(89.0
|
)
|
(71.0
|
)
|
|||||
|
Net proceeds from issuance of Class A Common Stock and Series A Preferred Stock and related tax benefits
|
22.8
|
|
44.7
|
|
48.5
|
|
|||||
|
Net proceeds from issuance of Class A Common Stock to former CEO
|
—
|
|
—
|
|
12.5
|
|
|||||
|
Purchase of Class A Common Stock from former CEO
|
—
|
|
—
|
|
(42.0
|
)
|
|||||
|
Payments for purchases of Class A Common Stock held as Treasury Stock
|
(36.3
|
)
|
(794.9
|
)
|
(263.1
|
)
|
|||||
|
Net payments for foreign currency contracts
|
(1.2
|
)
|
(9.7
|
)
|
(37.9
|
)
|
|||||
F-7
|
Payment for business combinations – contingent consideration
|
—
|
|
—
|
|
(0.8
|
)
|
|||||
|
Proceeds from mandatorily redeemable noncontrolling interests and noncontrolling interests
|
—
|
|
—
|
|
1.8
|
|
|||||
|
Distributions to mandatorily redeemable noncontrolling interests, redeemable noncontrolling interests and noncontrolling interests
|
(42.3
|
)
|
(33.2
|
)
|
(21.3
|
)
|
|||||
|
Purchase of additional mandatorily redeemable noncontrolling interests, redeemable noncontrolling interests and noncontrolling interests
|
(9.8
|
)
|
(0.7
|
)
|
(15.8
|
)
|
|||||
|
Payment of deferred financing fees
|
(24.4
|
)
|
(57.6
|
)
|
(11.2
|
)
|
|||||
|
Net cash provided by (used in) financing activities
|
595.2
|
|
592.6
|
|
(1,138.2
|
)
|
|||||
|
EFFECT OF EXCHANGE RATES ON CASH, CASH EQUIVALENTS AND RESTRICTED CASH
|
9.2
|
|
(3.7
|
)
|
(113.6
|
)
|
|||||
|
NET INCREASE (DECREASE) IN CASH, CASH EQUIVALENTS AND RESTRICTED CASH
|
198.3
|
|
31.1
|
|
(896.7
|
)
|
|||||
|
CASH, CASH EQUIVALENTS AND RESTRICTED CASH—Beginning of period
|
372.4
|
|
341.3
|
|
1,238.0
|
|
|||||
|
CASH, CASH EQUIVALENTS AND RESTRICTED CASH—End of period
|
$
|
570.7
|
|
$
|
372.4
|
|
$
|
341.3
|
|
||
|
SUPPLEMENTAL DISCLOSURE OF CASH FLOWS INFORMATION:
|
|||||||||||
|
Cash paid during the year for interest
|
$
|
190.2
|
|
$
|
90.3
|
|
$
|
64.7
|
|
||
|
Cash paid during the year for income taxes, net of refunds received
|
90.1
|
|
118.1
|
|
104.8
|
|
|||||
|
SUPPLEMENTAL DISCLOSURE OF NONCASH FINANCING AND INVESTING ACTIVITIES:
|
|||||||||||
|
Accrued capital expenditure additions
|
$
|
106.7
|
|
$
|
78.0
|
|
$
|
41.2
|
|
||
|
Non-cash stock issued for business combination
|
9,628.6
|
|
—
|
|
376.8
|
|
|||||
|
Non-cash debt assumed for business combination
|
1,943.0
|
|
—
|
|
—
|
|
|||||
|
Non-cash capital contribution associated with special share purchase transaction
|
—
|
|
13.8
|
|
—
|
|
|||||
|
Non-cash acquisition of additional redeemable noncontrolling interests
|
415.9
|
|
10.1
|
|
—
|
|
|||||
|
Non-cash reclassification from noncontrolling interest to mandatorily redeemable financial interest
|
49.9
|
|
—
|
|
—
|
|
|||||
See notes to Consolidated Financial Statements.
F-8
COTY INC. & SUBSIDIARIES
NOTES TO CONSOLIDATED FINANCIAL STATEMENTS
($ in millions, except per share data)
1
. DESCRIPTION OF BUSINESS
Coty Inc. and its subsidiaries (collectively, the “Company” or “Coty”) manufacture, market, sell and distribute branded beauty products, including fragrances, color cosmetics, hair care products and skin & body related products. Coty is a global beauty company and a new leader and challenger in the beauty industry.
On October 1, 2016, the Company completed its acquisition of certain assets and liabilities related to The Procter & Gamble Company’s (“P&G”) global fine fragrances, salon professional, cosmetics and retail hair color businesses, along with select hair styling brands (the “P&G Beauty Business”). The P&G Beauty Business manufactures, markets and sells various branded beauty products globally including professional and retail hair care, coloring and styling products, fine fragrances and color cosmetics primarily through salons, mass merchandisers, grocery stores, drug stores, department stores and distributors. Refer to Note
3
—Business Combinations.
After the closing of the P&G Beauty Business acquisition, the Company reorganized its business into
three
new divisions: the Luxury division, focused on prestige fragrances, premium skin care and premium cosmetics; the Consumer Beauty division, focused on color cosmetics, retail hair coloring and styling products, mass fragrance, mass skin care and body care; and the Professional Beauty division, focused on hair and nail care products for professionals. In this new organizational structure, each division has full end-to-end responsibility to optimize consumers’ beauty experience in the relevant categories and channels. The
three
divisions also comprise the Company’s operating and reportable segments.
The Company operates on a fiscal year basis with a year-end of
June 30
. Unless otherwise noted, any reference to a year preceded by the word “fiscal” refers to the fiscal year ended
June 30
of that year. For example, references to “fiscal
2017
” refer to the fiscal year ended
June 30, 2017
.
The Company’s revenues generally increase during the second fiscal quarter as a result of increased demand associated with the holiday season. Accordingly, the Company’s financial performance, working capital requirements, cash flow and borrowings experience seasonal variability during the three to six months preceding this season.
2
. SUMMARY OF SIGNIFICANT ACCOUNTING POLICIES
Basis of Presentation and Principles of Consolidation
The accompanying financial statements of the Company are presented on a consolidated basis in accordance with accounting principles generally accepted in the United States of America (“GAAP”). All intercompany accounts and transactions have been eliminated in consolidation.
The Company also consolidates majority-owned entities in the United States of America, United Arab Emirates, Kingdom of Saudi Arabia, Malaysia, Indonesia, Philippines, Singapore, Hong Kong, China, South Korea, Thailand and Taiwan where the Company has the ability to exercise controlling influence. Ownership interests of noncontrolling parties are presented as mandatorily redeemable financial interests, noncontrolling interests or redeemable noncontrolling interests, as applicable.
Use of Estimates
The preparation of financial statements in conformity with GAAP requires management to make estimates and assumptions that affect the reported amounts of assets and liabilities and disclosure of contingent assets and liabilities at the date of the financial statements and revenues and expenses during the period reported. Significant accounting policies that contain subjective management estimates and assumptions include those related to revenue recognition, the market value of inventory, the fair value of acquired assets and liabilities associated with acquisitions, pension benefit costs, the assessment of goodwill, other intangible assets and long-lived assets for impairment, income taxes, and redeemable noncontrolling interests. Management evaluates its estimates and assumptions on an ongoing basis using historical experience and other factors, including the current economic environment, and makes adjustments when facts and circumstances dictate. As future events and their effects cannot be determined with precision, actual results could differ significantly from those estimates and assumptions. Significant changes, if any, in those estimates and assumptions resulting from continuing changes in the economic environment will be reflected in the Consolidated Financial Statements in future periods.
Cash Equivalents
Cash equivalents include all highly liquid investments with original maturities of three months or less at the time of purchase.
Restricted Cash
F-9
COTY INC. & SUBSIDIARIES
NOTES TO CONSOLIDATED FINANCIAL STATEMENTS
($ in millions, except per share data)
Restricted cash represents funds that are not readily available for general purpose cash needs due to contractual limitations. Restricted cash is classified as a current or long-term asset based on the timing and nature of when or how the cash is expected to be used or when the restrictions are expected to lapse. As of June 30, 2017 and June 30, 2016, the Company had restricted cash of
$35.3
and
nil
, respectively, included in Restricted cash in the Consolidated Balance Sheets. The restricted cash balance as of June 30, 2017 provides collateral for certain bank guarantees on rent, customs and duty accounts. Restricted cash is included as a component of Cash, cash equivalents, and restricted cash in the Consolidated Statement of Cash Flows.
Trade Receivables
Trade receivables are stated net of the allowance for doubtful accounts and cash discounts, which is based on the evaluation of the accounts receivable aging, specific exposures, and historical trends. The Company reviews its allowances by assessing factors such as an individual trade receivable aging and liquidity. Trade receivables are written off on a case-by-case basis, net of any amounts that may be collected.
Inventories
Inventories include items which are considered salable or usable in future periods, and are stated at the lower of cost or market value, with cost being based on standard cost which approximates actual cost on a first-in, first-out basis. Costs include direct materials, direct labor and overhead (e.g., indirect labor, rent and utilities, depreciation, purchasing, receiving, inspection and quality control) and in-bound freight costs. The Company classifies inventories into various categories based upon their stage in the product life cycle, future marketing sales plans and the disposition process.
The Company also records an inventory obsolescence reserve, which represents the excess of the cost of the inventory over its estimated market value, based on various product sales projections. This reserve is calculated using an estimated obsolescence percentage applied to the inventory based on age, historical trends, and requirements to support forecasted sales. In addition, and as necessary, the Company may establish specific reserves for future known or anticipated events.
Property and Equipment and Other Long-lived Assets
Property and equipment is stated at cost less accumulated depreciation or amortization. The cost of renewals and betterments is capitalized and depreciated. Expenditures for maintenance and repairs are expensed as incurred. Property and equipment that is disposed of through sale, trade-in, donation, or scrapping is written off, and any gain or loss on the transaction, net of costs to dispose, is recorded in Gain (loss) on sale of assets. Depreciation and amortization are computed principally using the straight-line method over the following estimated useful lives:
|
Description
|
Estimated Useful Lives
|
|
Buildings
|
20-40 years
|
|
Marketing furniture and fixtures
|
3-5 years
|
|
Machinery and equipment
|
2-15 years
|
|
Computer equipment and software
|
2-5 years
|
|
Property and equipment under capital leases and leasehold improvements
|
Lesser of lease term or economic life
|
Intangible assets with finite lives are amortized principally using the straight-line method over the following estimated useful lives:
|
Description
|
Estimated Useful Lives
|
|
License agreements
|
5-34 years
|
|
Customer relationships
|
2-28 years
|
|
Trademarks
|
2-30 years
|
|
Product formulations and technology
|
3-29 years
|
Long-lived assets, including tangible and intangible assets with finite lives, are tested for recoverability whenever events or changes in circumstances indicate that their carrying amount may not be recoverable. When such events or changes in circumstances occur, a recoverability test is performed comparing projected undiscounted cash flows from the use and eventual disposition of an asset or asset group to its carrying value. If the projected undiscounted cash flows are less than the carrying value, an impairment charge would be recorded for the excess of the carrying value over the fair value. The Company estimates fair value based on the best information available, including discounted cash flows and/or the use of third-party valuations.
Goodwill and Other Indefinite-lived Intangible Assets
F-10
COTY INC. & SUBSIDIARIES
NOTES TO CONSOLIDATED FINANCIAL STATEMENTS
($ in millions, except per share data)
Goodwill is calculated as the excess of the cost of purchased businesses over the fair value of their underlying net assets. Goodwill is allocated and evaluated at the reporting unit level, which are the Company’s operating segments. The Company identifies its operating segments, which are also its reportable segments, by assessing whether the components of the Company’s reportable segments constitute businesses for which discrete financial information is available and management of each operating segment regularly reviews the operating results of those components. The Company has identified
three
reporting units. Luxury, Consumer Beauty and Professional Beauty are considered operating segments and each a reporting unit. The Company allocates goodwill to one or more reporting units that are expected to benefit from synergies of the business combination.
Goodwill and other intangible assets with indefinite lives are not amortized, but are evaluated for impairment annually as of May 1 or whenever events or changes in circumstances indicate that their carrying amount may not be recoverable. When testing goodwill for impairment, the Company has the option of first performing a qualitative assessment to determine whether it is more likely than not that the fair value of a reporting unit is less than its carrying amount as the basis to determine if it is necessary to perform a quantitative goodwill impairment test. In performing its qualitative assessment, the Company considers the extent to which unfavorable events or circumstances identified, such as changes in economic conditions, industry and market conditions or company specific events, could affect the comparison of the reporting unit’s fair value with its carrying amount. If the Company concludes that it is more likely than not that the fair value of a reporting unit is less than its carrying amount, the Company is required to perform a quantitative impairment test.
Quantitative impairment testing for goodwill is performed in two steps: (i) the determination of possible impairment, based upon the fair value of a reporting unit as compared to its carrying value; and (ii) if there is a possible impairment indicated, this step measures the amount of impairment loss, if any, by comparing the implied fair value of goodwill with the carrying amount of that goodwill. The Company makes certain judgments and assumptions in allocating assets and liabilities to determine carrying values for its reporting units.
Indefinite-lived other intangible assets principally consist of trademarks. The fair values of indefinite-lived other intangible assets are estimated and compared to their respective carrying values. The trademarks’ fair values are based upon the income approach, utilizing the relief from royalty or excess earnings methodology. An impairment loss is recognized when the estimated fair value of the intangible asset is less than its carrying value.
Deferred Financing Fees
The Company capitalizes costs related to the issuance of debt instruments, as applicable. Such costs are amortized over the contractual term of the related debt instrument in Interest expense, net using the straight-line method, which approximates the effective interest method, in the Consolidated Statements of Operations.
Noncontrolling Interests and Redeemable Noncontrolling Interests
Interests held by third parties in consolidated majority-owned subsidiaries are presented as noncontrolling interests, which represents the noncontrolling stockholders’ interests in the underlying net assets of the Company’s consolidated majority-owned subsidiaries. Noncontrolling interests that are not redeemable are reported in the equity section of the Consolidated Balance Sheets.
Noncontrolling interests, where the Company may be required to repurchase the noncontrolling interest under a put option or other contractual redemption requirement, are reported in the Consolidated Balance Sheets between liabilities and equity, as redeemable noncontrolling interests. The Company adjusts the redeemable noncontrolling interests to the redemption values on each balance sheet date with changes recognized as an adjustment to retained earnings, or in the absence of retained earnings, as an adjustment to additional paid-in capital.
Revenue Recognition
Revenue is recognized when realized or realizable and earned. The Company’s policy is to recognize revenue when risk of loss and title to the product transfers to the customer, which usually occurs upon delivery. Net revenues comprise gross revenues less customer discounts and allowances, actual and expected returns (estimated based on returns history and position in product life cycle) and various trade spending activities. Trade spending activities primarily relate to advertising, product promotions and demonstrations, some of which involve cooperative relationships with customers. Returns represented
2%
,
3%
and
3%
of gross revenue after customer discounts and allowances in fiscal
2017
,
2016
and
2015
, respectively. Trade spending activities recorded as a reduction to gross revenue after customer discounts and allowances represented
7%
,
8%
, and
9%
in fiscal
2017
,
2016
and
2015
, respectively.
Cost of Sales
F-11
COTY INC. & SUBSIDIARIES
NOTES TO CONSOLIDATED FINANCIAL STATEMENTS
($ in millions, except per share data)
Cost of sales includes all of the costs to manufacture the Company’s products. For products manufactured in the Company’s own facilities, such costs include raw materials and supplies, direct labor and factory overhead. For products manufactured for the Company by third-party contractors, such costs represent the amounts invoiced by the contractors. Cost of sales also includes royalty expense associated with license agreements. Additionally, shipping costs, freight-in and depreciation and amortization expenses related to manufacturing equipment and facilities are included in Cost of sales in the Consolidated Statements of Operations.
Selling, General and Administrative Expenses
Selling, general and administrative expenses include advertising and promotional costs and research and development costs. Also included in Selling, general and administrative expenses are share-based compensation, certain warehousing fees, non-manufacturing overhead, personnel and related expenses, rent on operating leases, and professional fees.
Advertising and promotional costs are expensed as incurred and totaled
$1,883.3
,
$967.6
and
$1,007.7
in fiscal
2017
,
2016
and
2015
, respectively. Included in advertising and promotional costs are
$107.4
,
$65.0
, and
$69.8
of depreciation of marketing furniture and fixtures, such as product displays, in fiscal
2017
,
2016
and
2015
, respectively. Research and development costs are expensed as incurred and totaled
$139.2
,
$47.7
and
$47.4
in fiscal
2017
,
2016
and
2015
, respectively.
Share-Based Compensation
Common Stock
Common shares are available to be awarded for the exercise of phantom units, vested stock options, the settlement of restricted stock units (“RSUs”), and the conversion of Series A Preferred Stock.
Share-based compensation expense is measured and fixed at the grant date, based on the estimated fair value of the award and is recognized on a straight-line basis, net of estimated forfeitures, over the employee’s requisite service period.
The fair value of stock options is determined using the Black-Scholes valuation model using the assumptions discussed in Note
22
—Share-Based Compensation Plans. The fair value of RSUs is determined on the date of grant based on the Company’s stock price.
Preferred Stock
The Company has issued Series A Preferred Stock that can be converted into Class A Common Stock or settled in cash. Series A Preferred Stock is accounted for using liability plan accounting to the extent the award is expected to be settled in cash. Accordingly, share-based compensation expense for the portion that is liability accounted is measured based on the fair value of the award on each reporting date and recognized as an expense to the extent earned. Share-based compensation expense for the portion of the grants that the Company is not required to settle in cash is measured based on the estimated fair value of the award at the time it is known that they are going to be settled in shares and is recognized on a straight-line basis, net of estimated forfeitures, over the employee’s requisite service period.
The fair value of Series A Preferred Stock is determined using the binomial valuation model for fiscal 2017 using the weighted-average assumptions discussed in Note
22
—Share-Based Compensation Plans. The fair value of Series A Preferred Stock was determined using the Black-Scholes valuation model for fiscal 2016 and 2015 using the weighted-average assumptions discussed in Note
22
—Share-Based Compensation Plans.
Treasury Stock
The Company accounts for treasury stock under the cost method. When shares are reissued or retired from treasury stock they are accounted for at an average price. When treasury stock is re-issued at a price higher than its cost, the difference is recorded as a component of Additional paid-in-capital in the Company’s Consolidated Balance Sheets. When treasury stock is re-issued at a price lower than its cost, the difference is recorded as a reduction of Additional paid-in-capital to the extent that there are treasury stock gains to offset the losses. If there are no treasury stock gains in Additional paid-in-capital, the losses upon re-issuance of treasury stock are recorded as a reduction of Retained earnings in the Company’s Consolidated Balance Sheets.
Income Taxes
The Company is subject to income taxes in the U.S. and various foreign jurisdictions. The Company accounts for income taxes under the asset and liability method. Therefore, income tax expense is based on reported (Loss) income before income taxes, and deferred income taxes reflect the effect of temporary differences between the carrying amounts of assets and liabilities that are recognized for financial reporting purposes and the carrying amounts that are recognized for income tax purposes. Prior to the fourth quarter of fiscal 2017, the classification of deferred tax assets and liabilities corresponds with the classification of the underlying assets and liabilities, giving rise to the temporary differences or the period of expected reversal, as applicable. In the fourth quarter of fiscal 2017 the Company adopted guidance issued by the Financial Accounting Standards
F-12
COTY INC. & SUBSIDIARIES
NOTES TO CONSOLIDATED FINANCIAL STATEMENTS
($ in millions, except per share data)
Board (“FASB”) (as later discussed) which allows for presentation of deferred tax assets and liabilities as noncurrent. This guidance was adopted on a prospective basis and Deferred taxes in the Consolidated Balance Sheet for the year ended June 30, 2017 are presented as noncurrent. A valuation allowance is established, when necessary, to reduce deferred tax assets to the amount that is more likely than not to be realized based on currently available evidence. The Company considers how to recognize, measure, present and disclose in financial statements uncertain tax positions taken or expected to be taken on a tax return.
The Company is subject to tax audits in various jurisdictions. The Company regularly assesses the likely outcomes of such audits in order to determine the appropriateness of liabilities for unrecognized tax benefits (“UTBs”). The Company classifies interest and penalties related to UTBs as a component of the provision for income taxes.
For UTBs, the Company first determines whether it is more-likely-than-not (defined as a likelihood of more than fifty percent) that a tax position will be sustained based on its technical merits as of the reporting date, assuming that taxing authorities will examine the position and have full knowledge of all relevant information. A tax position that meets this more-likely-than-not threshold is then measured and recognized at the largest amount of benefit that is greater than fifty percent likely to be realized upon effective settlement with a taxing authority. As the determination of liabilities related to UTBs and associated interest and penalties requires significant estimates to be made by the Company, there can be no assurance that the Company will accurately predict the outcomes of these audits, and thus the eventual outcomes could have a material impact on the Company’s operating results or financial condition and cash flows.
It is the Company’s intention to permanently reinvest undistributed earnings and profits from the Company’s foreign operations that have been generated through
June 30, 2017
, except where we are able to repatriate these earnings to the U.S. without material incremental tax expenditures. The Company’s future plans do not demonstrate a need to repatriate the foreign amounts to fund U.S. operations. Accordingly, no provision has been made for U.S. income taxes on undistributed earnings of foreign subsidiaries as of
June 30, 2017
. It is not practicable for the Company to determine the amount of additional income and withholding taxes that may be payable in the event the undistributed earnings are repatriated.
Restructuring Costs
Charges incurred in connection with plans to restructure and integrate acquired businesses or in connection with cost-reduction initiatives that are initiated from time to time are included in Restructuring costs in the Consolidated Statements of Operations if such costs are directly associated with an exit or disposal activity, a reorganization, or with integrating an acquired business. These costs can include employee separations, contract and lease terminations, and other direct exit costs. Employee severance and other termination benefits are primarily determined based on established benefit arrangements, local statutory requirements or historical practices. The Company recognizes these benefits when payment is probable and estimable. Additional elements of severance and termination benefits associated with non-recurring benefits are recognized ratably over each employee’s required future service period.
Costs to terminate a contract before the end of its term are recognized and measured at their fair value when the Company gives written notice to the counterparty. For lease terminations, a liability based on the remaining lease rentals, reduced by estimated sublease rentals is measured at the cease-use date. All other costs are recognized as incurred.
Other business realignment costs represent the incremental cost directly related to the restructuring activities which can include accelerated depreciation, professional or consulting fees and other internal costs including compensation related costs for dedicated internal resources. Other business realignment costs are generally recorded in Selling, general and administrative expenses in the Consolidated Statements of Operations.
Charges for accelerated depreciation are recognized on long-lived assets that will be taken out of service before the end of their normal service, in which case depreciation estimates are revised to reflect the use of the asset over its shortened useful life. All other costs are recognized as incurred.
Business Combinations
The Company accounts for business combinations using the acquisition method of accounting. The acquisition method of accounting requires that purchase price, including the fair value of contingent consideration, of the acquisition be allocated to the assets acquired and liabilities assumed using the fair values determined by management as of the acquisition date.
The Company remeasures the fair value of contingent consideration at each reporting period using a probability-adjusted discounted cash flow method based on significant inputs not observable in the market and any change in the fair value from either the passage of time or events occurring after the acquisition date, is recorded in earnings. Contingent consideration payments that exceed the acquisition date fair value of the contingent consideration are reflected as an operating activity in the Consolidated Statements of Cash Flows. Payments made for contingent consideration recorded as part of an acquisition’s purchase price are reflected as financing activities in the Company’s Consolidated Statements of Cash Flows, if paid more than
F-13
COTY INC. & SUBSIDIARIES
NOTES TO CONSOLIDATED FINANCIAL STATEMENTS
($ in millions, except per share data)
three months after the acquisition date. If paid within three months of the acquisition date, these payments are reflected as investing activities in the Company’s Consolidated Statements of Cash Flows.
The Company generally uses the following methodologies for valuing our significant acquired intangibles assets:
|
•
|
Trademarks (indefinite or finite) - The Company uses a relief from royalty method to value trademarks. The key assumptions for the model are forecasted net revenue, the royalty rate, the effective tax rate and the discount rate.
|
|
•
|
Customer relationships and license agreements - The Company uses an excess earnings method to value customer relationships and license agreements. The key assumptions for the model are forecasted net revenue, EBITDA, the estimated allocation of earnings between different classes of assets, the attrition rate, the effective tax rate and the discount rate.
|
Fair Value Measurements
The following fair value hierarchy is used in selecting inputs for those assets and liabilities measured at fair value that distinguishes between assumptions based on market data (observable inputs) and the Company’s assumptions (unobservable inputs). The Company evaluates these inputs and recognizes transfers between levels, if any, at the end of each reporting period. The hierarchy consists of three levels:
Level 1
- Valuation based on quoted market prices in active markets for identical assets or liabilities;
Level 2
- Valuation based on inputs other than Level 1 inputs that are observable for the assets or liabilities either directly or indirectly;
Level 3
- Valuation based on prices or valuation techniques that require inputs that are both significant to the fair value measurement and supported by little or no observable market activity.
The Company has not elected the fair value measurement option for any financial instruments or other assets not required to be measured at fair value on a recurring basis.
Derivative Instruments and Hedging Activities
Refer to Note
18
—Derivative Instruments for the Company’s policies for Derivative Instruments and Hedging Activities.
Foreign Currency
Exchange gains or losses incurred on non-financing foreign exchange currency transactions conducted by one of the Company’s operations in a currency other than the operation’s functional currency are reflected in Cost of sales or operating expenses. Net losses (gains) of
$1.5
,
$7.2
and
$(7.9)
in fiscal
2017
,
2016
and
2015
, respectively resulting from non-financing foreign exchange currency transactions are included in the Consolidated Statements of Operations.
Assets and liabilities of foreign operations are translated into U.S. dollars at the rates of exchange in effect at the end of the reporting period. Income and expense items are translated at the average exchange rates prevailing during each reporting period presented. Translation gains or losses are reported as cumulative adjustments in Accumulated other comprehensive income (loss) (“AOCI/(L)”).
Net gains (losses) of
$(12.8)
,
$19.2
and
$(4.1)
in fiscal
2017
,
2016
and
2015
, respectively, resulting from financing foreign exchange currency transactions are included in Interest expense, net in the Consolidated Statements of Operations. Net (losses) of
$(1.7)
,
$(29.4)
and
nil
in fiscal
2017
,
2016
and
2015
, respectively, resulting from acquisition-related foreign exchange currency transactions are included in Other expense, net in the Consolidated Statements of Operations.
Recently Adopted Accounting Pronouncements
In November 2016, the FASB issued authoritative guidance amending the classification and presentation of restricted cash on the statement of cash flows. The amendments require that a statement of cash flows explain the change during the period in the total of cash, cash equivalents, and amounts generally described as restricted cash or restricted cash equivalents. Therefore, amounts generally described as restricted cash and restricted cash equivalents should be included with cash and cash equivalents when reconciling the beginning-of-period and end-of-period total amounts shown on the statement of cash flows. The Company early adopted this guidance in the second quarter of fiscal 2017 and has applied a retrospective transition method for each period presented. Accordingly, restricted cash and restricted cash equivalents have been reclassified as a component of Cash, cash equivalents, and restricted cash in the Consolidated Statement of Cash Flows for all periods presented.
In November 2015, the FASB issued authoritative guidance to eliminate the requirement to present deferred tax assets and liabilities as current and noncurrent amounts in a classified balance sheet. The new standard requires deferred tax assets and liabilities to be classified as noncurrent. The Company early adopted this guidance as of the fourth quarter of fiscal 2017 on a
F-14
COTY INC. & SUBSIDIARIES
NOTES TO CONSOLIDATED FINANCIAL STATEMENTS
($ in millions, except per share data)
prospective basis beginning with the fiscal 2017 period presented. Accordingly, deferred tax assets and liabilities as well as corresponding valuation allowances have been classified as noncurrent in the Company’s Consolidated Balance Sheet.
In April 2015, the FASB issued authoritative guidance on the treatment of debt issuance costs. The guidance requires that debt issuance costs related to a recognized debt liability be presented in the balance sheet as a direct deduction from the carrying amount of that debt liability, consistent with debt discounts. The Company adopted this guidance as of the first quarter of fiscal 2017. With respect to the Company’s revolving credit facilities (as discussed in Note
13
—Debt), the Company has elected to classify unamortized debt issuance costs within the liability section of the balance sheet (as a contra-liability). In circumstances where the unamortized debt issuance costs exceeds the related outstanding balance of the Coty Revolving Credit Facility or the Galleria Revolving Credit Facility (as both defined in Note
13
—Debt), the amount of unamortized debt issuance costs exceeding the outstanding balance will be reclassified to assets. The Company has applied the change in accounting principle with retrospective application to prior periods. As such, the amounts previously reported as Other noncurrent assets and Long-term debt, net in the Consolidated Balance Sheet as of June 30, 2016 were decreased by
$64.6
, respectively, for the reclassification of debt issuance costs from assets to liabilities. The change in accounting principle does not have an impact on the Company’s Consolidated Statements of Operations, Statements of Cash Flows and Consolidated Statements of Equity and Redeemable Noncontrolling Interests.
In April 2015, the FASB issued authoritative guidance to clarify the accounting treatment for fees paid by a customer in cloud computing arrangements. Under the revised guidance, if a cloud computing arrangement includes a software license, then the customer should account for the software license element of the arrangement consistent with the acquisition of other software licenses. If the cloud computing arrangement does not include a software license, the customer should account for the arrangement as a service contract. The revised guidance does not change a customer’s accounting for service contracts. The Company adopted this guidance as of the first quarter of fiscal 2017 on a prospective basis. The adoption of this guidance did not have a material impact on the Company’s Consolidated Financial Statements.
In February 2015, the FASB issued authoritative guidance on a revised consolidation model for all reporting entities to use in evaluating whether they should consolidate certain legal entities. All legal entities will be subject to reevaluation under this revised consolidation model. The revised consolidation model, among other things, (i) modifies the evaluation of whether limited partnerships and similar legal entities are VIEs or voting interest entities, (ii) eliminates the presumption that a general partner should consolidate a limited partnership, and (iii) modifies the consolidation analysis of reporting entities that are involved with VIEs through fee arrangements and related party relationships. This amendment was effective for the Company’s interim and annual financial statements for fiscal 2017. The Company adopted this guidance retrospectively. The adoption of this guidance did not have an impact on the Company’s Consolidated Financial statements.
Recently Issued and Not Yet Adopted Accounting Pronouncements
|
Accounting Standard Update(s)
|
Topic
|
Effective Period
|
Summary
|
|||
|
2017-09
|
Scope of Modification Accounting
|
Fiscal 2019. Early adoption is permitted for the Company beginning in fiscal 2018.
|
The FASB issued authoritative guidance regarding changes to terms or conditions of share-based payment awards that require an entity to apply modification accounting. Under this amendment, an entity should not account for the effects of a modification if all of the following conditions are met: i) the fair value (or calculated value or intrinsic value, if such an alternative measurement method is used) of the modified and original award (immediately before modification) is the same; ii) the vesting conditions of the modified and original award (immediately before modification) are the same; iii) the classification of the modified and original award (immediately before modification) as an equity or a liability instrument is the same. The Company is currently evaluating the impact this guidance will have on the Company’s Consolidated Financial Statements.
|
|||
|
2017-07
|
Improving the Presentation of Net Periodic Pension Cost and Net Periodic Postretirement Benefit Cost
|
Fiscal 2019. Early adoption is permitted for the Company beginning in fiscal 2018.
|
The FASB issued authoritative guidance that requires an employer to report the service cost component of an employee benefits plan in the same line item or items as other compensation costs arising from services rendered by the pertinent employees during the period. The other components of net periodic benefit cost as defined in the current guidance are required to be presented in the income statement separately from the service cost component and outside the subtotal of income from operations, if one is presented. If separate line item or items are not used, the line item or items used in the income statement to present the other components of net periodic benefit cost must be disclosed. The amendment allows only the service cost component to be eligible for capitalization, when applicable. The Company is currently evaluating the impact this guidance will have on the Company’s Consolidated Financial Statements.
|
|||
F-15
COTY INC. & SUBSIDIARIES
NOTES TO CONSOLIDATED FINANCIAL STATEMENTS
($ in millions, except per share data)
|
Accounting Standard Update(s)
|
Topic
|
Effective Period
|
Summary
|
|||
|
2017-04
|
Simplifying the Test for Goodwill Impairment
|
Fiscal 2021. Early adoption is permitted for the Company beginning in fiscal 2018.
|
The FASB issued authoritative guidance that simplifies the subsequent measurement of goodwill by eliminating step two from the goodwill impairment test. Under this amendment, an entity should recognize a goodwill impairment charge for the amount by which the carrying amount exceeds the reporting unit’s fair value; however, the loss recognized should not exceed the total amount of goodwill allocated to that reporting unit. The amendment also eliminated the requirements for any reporting unit with a zero or negative carrying amount to perform a qualitative assessment and, if it fails that qualitative test, to perform step two of the goodwill impairment test. The Company does not expect this guidance to impact the Company’s Consolidated Financial Statements.
|
|||
|
2016-16
|
Intra-Entity Transfers of Assets Other Than Inventory
|
Fiscal 2019. Early adoption is permitted for the Company beginning in fiscal 2018.
|
The FASB issued authoritative guidance that amends accounting guidance for intra-entity transfer of assets other than inventory to require the recognition of taxes when the transfer occurs. The Company is currently evaluating the impact this guidance will have on the Company’s Consolidated Financial Statements.
|
|||
|
2016-15
|
Classification of Certain Cash Receipts and Cash Payments
|
Fiscal 2019. Early adoption is permitted for the Company beginning in fiscal 2018.
|
The FASB issued authoritative guidance that changes the classification and presentation of certain items within the statement of cash flows including but not limited to debt prepayment or debt extinguishment costs; contingent consideration payments made after a business combination; proceeds from the settlement of insurance claims; proceeds from the settlement of corporate-owned life insurance policies and distributions received from equity method investees. The Company is currently evaluating the effect that this guidance will have on the Company’s Consolidated Financial Statements.
|
|||
|
2014-09
2015-14
2016-08
2016-10
2016-12
|
Revenue from Contracts with Customers
|
Fiscal 2019 with either retrospective or modified retrospective treatment applied. Early adoption is permitted for the Company beginning in fiscal 2018.
|
In June 2014, the FASB issued authoritative guidance that implements a common revenue model that will enhance comparability across industries and require enhanced disclosures. The new standard introduces a five step principles based process to determine the timing and amount of revenue ultimately expected to be received. In March 2016, the FASB issued authoritative guidance amending certain portions of this standard to clarify the implementation guidance on principal versus agent considerations. In April 2016, the FASB issued authoritative guidance amending certain portions of this standard to clarify the considerations for identifying performance obligations and to clarify the implementation guidance for revenue recognized from licensing arrangements. In May 2016, the FASB issued authoritative guidance amending certain portions of the standard to narrow the scope over, or to provide practical expedients, for assessing collectibility, presentation of sales taxes, noncash consideration, and completed contracts and contract modifications at transition. The Company is currently evaluating the impact this standard will have on the Company’s Consolidated Financial Statements. The Company is in the early stages and has an implementation team in place that is performing a comprehensive evaluation of the impact this standard will have on its Consolidated Financial Statements and related disclosures. The Company has selected the modified retrospective transition method, but has not yet determined the effect of the standard on its ongoing financial reporting.
|
|||
|
2016-02
|
Leases
|
Fiscal 2020 with early adoption permitted. Lessees and lessors are required to recognize and measure leases at the beginning of the earliest period presented using a modified retrospective approach.
|
The FASB issued authoritative guidance requiring that a lessee recognize the assets and liabilities that arise from operating leases. A lessee should recognize in its balance sheet a liability to make lease payments (the lease liability) and a right-of-use asset representing its right to use the underlying asset for the lease term. For leases with a term of 12 months or less, a lessee is permitted to make an accounting policy election by class of underlying asset not to recognize lease assets and lease liabilities. The Company is currently evaluating the impact the standard will have on the Company’s Consolidated Financial Statements.
|
|||
3
. BUSINESS COMBINATIONS
F-16
COTY INC. & SUBSIDIARIES
NOTES TO CONSOLIDATED FINANCIAL STATEMENTS
($ in millions, except per share data)
P&G Beauty Business Acquisition
On October 1, 2016 the Company acquired the P&G Beauty Business in order to further strengthen the Company’s position in the global beauty industry. The purchase price was
$11,570.4
and consisted of
$9,628.6
of total equity consideration and
$1,941.8
of assumed debt.
The P&G Beauty Business acquisition was completed pursuant to the Transaction Agreement, dated July 8, 2015 (the “Transaction Agreement”), by and among the Company, P&G, Galleria Co. (“Galleria”) and Green Acquisition Sub Inc., a wholly-owned subsidiary of the Company (“Merger Sub”). On October 1, 2016, (i) Merger Sub was merged with and into Galleria, with Galleria continuing as the surviving corporation and a direct, wholly-owned subsidiary of the Company (the “Merger”) and (ii) each share of Galleria common stock was converted into the right to receive
one
share of the Company’s common stock.
The Company issued
409.7 million
shares of common stock to the former holders of Galleria common stock, together with cash in lieu of fractional shares. Immediately after consummation of the Merger, approximately
54%
of the fully-diluted shares of the Company’s common stock was held by pre-Merger holders of Galleria common stock, and approximately
46%
of the fully-diluted shares of the Company’s common stock was held by pre-Merger holders of the Company’s common stock. Coty Inc. is considered to be the acquiring company for accounting purposes.
The Company estimated the preliminary fair value of acquired assets and liabilities as of the date of acquisition based on information currently available. The preliminary fair values are substantially complete with the exception of identifiable intangible assets, fixed assets, taxes and goodwill. As the Company finalizes the fair value of assets acquired and liabilities assumed, additional purchase price adjustments may be recorded during the measurement period. The Company will reflect measurement period adjustments, if any, in the period in which the adjustments are recognized.
The following table summarizes the estimated allocation of the purchase price to the net assets of the P&G Beauty Business as of the October 1, 2016 acquisition date:
|
Estimated
fair value as previously reported (a) |
Measurement period adjustments
(b)
|
Estimated fair value adjusted
|
Estimated
useful life (in years) |
||||||||||
|
Cash and cash equivalents
|
$
|
387.6
|
|
$
|
—
|
|
$
|
387.6
|
|
||||
|
Inventories
|
506.7
|
|
(41.2
|
)
|
465.5
|
|
|||||||
|
Property, plant and equipment
|
770.4
|
|
(27.5
|
)
|
742.9
|
|
3 - 40
|
||||||
|
Goodwill
|
5,081.8
|
|
446.6
|
|
5,528.4
|
|
Indefinite
|
||||||
|
Trademarks — indefinite
|
1,890.0
|
|
(315.0
|
)
|
1,575.0
|
|
Indefinite
|
||||||
|
Trademarks — finite
|
879.1
|
|
(131.4
|
)
|
747.7
|
|
10 - 30
|
||||||
|
Customer relationships
|
1,795.8
|
|
(721.6
|
)
|
1,074.2
|
|
2 - 17
|
||||||
|
License agreements
|
1,836.0
|
|
463.0
|
|
2,299.0
|
|
10 - 30
|
||||||
|
Product formulations
|
183.8
|
|
—
|
|
183.8
|
|
5 - 29
|
||||||
|
Other net working capital
|
10.8
|
|
(34.0
|
)
|
(23.2
|
)
|
|||||||
|
Net other assets
|
54.9
|
|
9.7
|
|
64.6
|
|
|||||||
|
Unfavorable contract liabilities
|
(130.0
|
)
|
—
|
|
(130.0
|
)
|
|||||||
|
Pension liabilities
|
(394.9
|
)
|
(9.2
|
)
|
(404.1
|
)
|
|||||||
|
Deferred tax liability, net
|
(1,301.6
|
)
|
360.6
|
|
(941.0
|
)
|
|||||||
|
Total purchase price
|
$
|
11,570.4
|
|
$
|
—
|
|
$
|
11,570.4
|
|
||||
(a)
As previously reported in the Company’s Quarterly Report on Form 10-Q for the quarter ended December 31, 2016. This was the quarter in which the business combination was completed.
(b)
The measurement period adjustments related to indefinite- and finite-lived trademarks, Customer relationships and License agreements of
$(705.0)
were a result of changes in assumptions used for valuation purposes such as projected growth rates, profitability and discount rates. The decrease to net deferred tax liabilities was primarily a result of the decrease to intangible values. Additional measurement period adjustments were recorded as a result of further validating tangible assets, such as inventory and property, plant and equipment, based on
F-17
COTY INC. & SUBSIDIARIES
NOTES TO CONSOLIDATED FINANCIAL STATEMENTS
($ in millions, except per share data)
obtaining new facts and circumstances about acquired assets and liabilities that existed at the acquisition date. All measurement period adjustments were offset against goodwill.
Goodwill is primarily attributable to the anticipated company-specific synergies and economies of scale expected from the operations of the combined company. The synergies include certain cost savings, operating efficiencies, and leverage of the acquired brand recognition to be achieved as a result of the P&G Beauty Business acquisition. Goodwill is not expected to be deductible for tax purposes. Goodwill of
$2,030.1
,
$2,965.2
and
$533.1
is allocated to the Luxury, Consumer Beauty and Professional Beauty segments, respectively. The allocation of goodwill to segments was based on the relative fair values of synergies.
For the
fiscal year ended June 30, 2017
, net revenues and net loss of the P&G Beauty Business included in the Company’s Consolidated Statements of Operations from the date of acquisition were
$3,140.4
and
$(129.4)
, respectively. Net loss for the fiscal year ended June 30, 2017 was impacted by the amortization of certain asset values based on the estimated fair values of the acquired assets as determined during the initial purchase accounting, such as the amortization of inventory step-up and finite intangibles. Such amortization activity had an impact to net loss for the fiscal year ended June 30,
2017
of
$(166.9)
, net of tax.
The Company recognized acquisition-related costs of
$344.3
,
$163.8
and
$30.2
for the fiscal years ended
June 30, 2017, 2016 and 2015
, respectively, which are included in Acquisition-related costs in the Consolidated Statements of Operations.
ghd Acquisition
On November 21, 2016, the Company completed the acquisition of
100%
of the equity interest of Lion/Gloria Topco Limited, which held the net assets of ghd (“ghd”) which stands for “Good Hair Day”, a premium brand in high-end hair styling appliances, pursuant to a sale and purchase agreement. The ghd acquisition further strengthens the Company’s professional hair category and is included in the Professional Beauty segment’s results after the acquisition date. The total cash consideration paid net of acquired cash and cash equivalents was
£430.2 million
, the equivalent of
$531.5
, at the time of closing, which was funded through cash on hand and available debt.
The Company estimated the preliminary fair value of acquired assets and liabilities as of the date of acquisition based on information currently available. The preliminary fair values are substantially complete with the exception of identifiable intangible assets, accrued expenses, taxes and goodwill. As the Company finalizes the fair value of assets acquired and liabilities assumed, additional purchase price adjustments may be recorded during the measurement period. The Company will reflect measurement period adjustments, if any, in the period in which the adjustments are recognized.
The following table summarizes the estimated allocation of the purchase price to the net assets of ghd as of the November 21, 2016 acquisition date:
|
Estimated
fair value as previously reported (a) |
Measurement period adjustments
(b)
|
Estimated fair value adjusted
|
Estimated
useful life (in years) |
||||||||||
|
Cash and cash equivalents
|
$
|
7.1
|
|
$
|
—
|
|
$
|
7.1
|
|
||||
|
Inventories
|
79.8
|
|
(0.2
|
)
|
79.6
|
|
|||||||
|
Property, plant and equipment
|
11.3
|
|
(1.3
|
)
|
10.0
|
|
3 - 10
|
||||||
|
Goodwill
|
175.5
|
|
(1.1
|
)
|
174.4
|
|
Indefinite
|
||||||
|
Indefinite-lived other intangibles assets
|
163.8
|
|
—
|
|
163.8
|
|
Indefinite
|
||||||
|
Customer relationships
|
44.2
|
|
(7.6
|
)
|
36.6
|
|
11 - 24
|
||||||
|
Technology
|
138.6
|
|
8.0
|
|
146.6
|
|
11 - 16
|
||||||
|
Other net working capital
|
(7.4
|
)
|
(9.2
|
)
|
(16.6
|
)
|
|||||||
|
Net other assets
|
0.9
|
|
—
|
|
0.9
|
|
|||||||
|
Deferred tax liability, net
|
(75.3
|
)
|
11.4
|
|
(63.9
|
)
|
|||||||
|
Total purchase price
|
$
|
538.5
|
|
$
|
—
|
|
$
|
538.5
|
|
||||
(a)
As previously reported in the Company’s Quarterly Report on Form 10-Q for the quarter ended December 31, 2016. This was the quarter in which the business combination was completed.
(b)
The Company recorded measurement period adjustments in the third and fourth quarters of fiscal 2017 due to obtaining new facts and circumstances about acquired assets and liabilities that existed at the acquisition date. The adjustments included a decrease to customer relationships and deferred tax liability, net of
$7.6
and
$11.4
, respectively and an increase to technology of
$8.0
and a decrease in the
F-18
COTY INC. & SUBSIDIARIES
NOTES TO CONSOLIDATED FINANCIAL STATEMENTS
($ in millions, except per share data)
estimated other net working capital of
$(9.2)
primarily related to accrued expenses as of the November 21, 2016 acquisition date. These adjustments were offset against goodwill.
Goodwill is
not
expected to be deductible for tax purposes. The goodwill is attributable to expected synergies resulting from integrating ghd’s products into the Company’s existing sales channels. Goodwill of
$49.0
,
$42.0
, and
$83.4
is allocated to Luxury, Consumer Beauty, and Professional Beauty segments, respectively. The allocation of goodwill to the segments were due to the reduction in corporate and regional overhead allocated to these segments due to the addition of the ghd acquisition.
For the
fiscal year ended June 30, 2017
, net revenues and net loss of ghd included in the Company’s Consolidated Statements of Operations were
$137.3
and
$(40.6)
, respectively. Net loss for the
fiscal year ended June 30, 2017
was impacted by the amortization of certain asset values based on the estimated fair values of acquired assets as determined during the initial purchase accounting, such as the amortization of inventory step-up and finite intangibles. Such amortization activity had an impact to net loss for the
fiscal year ended June 30, 2017
of
$(42.9)
, net of tax.
The Company recognized acquisition-related costs of
$3.2
,
nil
and
nil
during the fiscal year ended
June 30, 2017, 2016 and 2015
, respectively, which is included in Acquisition-related costs in the Consolidated Statements of Operations.
Younique Acquisition
On February 1, 2017, the Company completed its acquisition of
60%
of the membership interest in Foundation, LLC (“Foundation”), which held the net assets of Younique, LLC, a Utah limited liability company (“Younique”), for cash consideration of
$600.0
, net of acquired cash and debt assumed, and an additional payment of
$7.5
for working capital adjustments expected to be paid in the first half of fiscal 2018. The existing Younique membership holders contributed their
100%
membership interest in Younique to Foundation in exchange for a
40%
membership interest in Foundation and
$600.0
of cash consideration plus the additional payment of
$7.5
. Younique strengthens the Consumer Beauty division’s color cosmetics and skin and body care product offerings. The acquisition was funded with a combination of cash on hand and borrowings under available debt facilities. The Company accounts for the noncontrolling interest portion of the acquisition as a redeemable noncontrolling interest. Refer to Note
20
—Noncontrolling Interests and Redeemable Noncontrolling Interests for information regarding valuation method and significant assumptions used to calculate the fair value.
The Company estimated the preliminary fair value of acquired assets and liabilities as of the date of acquisition based on information currently available. The preliminary fair values are substantially complete with the exception of identifiable intangible assets, accrued expenses, taxes and goodwill. As the Company finalizes the fair value of assets acquired and liabilities assumed, additional purchase price adjustments may be recorded during the measurement period. The Company will reflect measurement period adjustments, if any, in the period in which the adjustments are recognized.
F-19
COTY INC. & SUBSIDIARIES
NOTES TO CONSOLIDATED FINANCIAL STATEMENTS
($ in millions, except per share data)
The following table summarizes the estimated allocation of the purchase price to the net assets of Younique as of the February 1, 2017 acquisition date:
|
Estimated
fair value as previously reported (a) |
Measurement period adjustments
(b)
|
Estimated
fair value as adjusted |
Estimated
useful life (in years) |
||||||||||
|
Cash and cash equivalents
|
$
|
17.5
|
|
$
|
—
|
|
$
|
17.5
|
|
||||
|
Inventories
|
106.5
|
|
(18.4
|
)
|
88.1
|
|
|||||||
|
Property, plant and equipment
|
64.1
|
|
3.0
|
|
67.1
|
|
3 - 7
|
||||||
|
Goodwill
|
559.5
|
|
15.8
|
|
575.3
|
|
Indefinite
|
||||||
|
Trademark — finite
|
121.0
|
|
2.0
|
|
123.0
|
|
20
|
||||||
|
Product formulations
|
0.6
|
|
—
|
|
0.6
|
|
5
|
||||||
|
Customer relationships
|
184.0
|
|
13.0
|
|
197.0
|
|
7 - 10
|
||||||
|
Other net working capital
|
(24.8
|
)
|
(2.9
|
)
|
(27.7
|
)
|
|||||||
|
Short-term and long-term debt
|
(1.2
|
)
|
—
|
|
(1.2
|
)
|
|||||||
|
Total equity value
|
1,027.2
|
|
12.5
|
|
1,039.7
|
|
|||||||
|
Redeemable noncontrolling interest
|
410.9
|
|
5.0
|
|
415.9
|
|
|||||||
|
Net cash and debt acquired
|
16.3
|
|
—
|
|
16.3
|
|
|||||||
|
Total purchase price
|
$
|
600.0
|
|
$
|
7.5
|
|
$
|
607.5
|
|
||||
(a)
As previously reported in the Company’s Quarterly Report on Form 10-Q for the quarter ended March 31, 2017. This was the quarter in which the business combination was completed.
(b)
The Company recorded measurement period adjustments in the fourth quarter of fiscal 2017 due to obtaining new facts and circumstances about acquired assets and liabilities that existed at the acquisition date. The adjustments included a decrease in inventories of
$18.4
and an increase in trademark — finite of
$2.0
and customer relationships of
$13.0
. These adjustments were offset against goodwill.
Goodwill is expected to be deductible for tax purposes. The goodwill is attributable to expected synergies resulting from certain manufacturing and supply chain cost savings. Goodwill of
$95.0
,
$420.3
, and
$60.0
is allocated to Luxury, Consumer Beauty, and Professional Beauty segments, respectively. The allocation of goodwill to the segments were due to the reduction in corporate and regional overhead allocated to these segments due to the addition of the Younique acquisition.
For the
fiscal year ended June 30, 2017
, net revenues and net income attributable to Coty Inc. of Younique were included in the Company’s Consolidated Statements of Operations from the date of acquisition were
$199.2
and
$1.3
, respectively. Net income for the
fiscal year ended June 30, 2017
was impacted by the amortization of certain asset values based on the estimated fair values of the acquired assets as determined during the initial purchase accounting, such as the amortization of inventory step-up and finite intangibles. Such amortization activity had an impact to net income for the
fiscal year ended June 30, 2017
of
$(21.0)
, net of tax.
The Company recognized acquisition-related costs of
$0.9
,
nil
and
nil
during the fiscal years ended
June 30, 2017, 2016 and 2015
, respectively, which is included in Acquisition-related costs in the Consolidated Statements of Operations.
Hypermarcas Brands Acquisition
On February 1, 2016, the Company completed the acquisition of
100%
of the net assets of the personal care and beauty business of Hypermarcas S.A. (the “Hypermarcas Brands”) pursuant to a share purchase agreement in order to further strengthen its position in the Brazilian beauty and personal care market. This acquisition was included in the Consumer Beauty segment. The total consideration of
R$3,599.5 million
, the equivalent of
$901.9
, at the time of closing, was paid during fiscal 2016.
The Company has finalized the valuation of assets acquired and liabilities assumed for the Hypermarcas Brands. The Company recognized certain measurement period adjustments as disclosed below during the quarter ended September 30, 2016. The measurement period for the Hypermarcas Brands was closed as of September 30, 2016.
F-20
COTY INC. & SUBSIDIARIES
NOTES TO CONSOLIDATED FINANCIAL STATEMENTS
($ in millions, except per share data)
The following table summarizes the allocation of the purchase price to the net assets acquired as of the February 1, 2016 acquisition date:
|
Estimated
fair value as previously reported (a) |
Measurement period adjustments
(b)
|
Estimated
fair value as adjusted |
Estimated
useful life (in years) |
||||||||||
|
Cash and cash equivalents
|
$
|
11.1
|
|
$
|
—
|
|
$
|
11.1
|
|
||||
|
Inventories
|
45.6
|
|
—
|
|
45.6
|
|
|||||||
|
Property, plant and equipment
|
95.4
|
|
—
|
|
95.4
|
|
2 - 40
|
||||||
|
Goodwill
|
553.7
|
|
(16.6
|
)
|
537.1
|
|
Indefinite
|
||||||
|
Trademarks — indefinite
|
147.1
|
|
—
|
|
147.1
|
|
Indefinite
|
||||||
|
Trademarks — finite
|
10.3
|
|
—
|
|
10.3
|
|
5 - 15
|
||||||
|
Customer relationships
|
44.6
|
|
—
|
|
44.6
|
|
13 - 28
|
||||||
|
Product formulations
|
12.8
|
|
—
|
|
12.8
|
|
3
|
||||||
|
Other net working capital
|
0.7
|
|
—
|
|
0.7
|
|
|||||||
|
Net other assets
|
2.1
|
|
(0.7
|
)
|
1.4
|
|
|||||||
|
Deferred tax liability, net
|
(21.5
|
)
|
17.3
|
|
(4.2
|
)
|
|||||||
|
Total purchase price
|
$
|
901.9
|
|
$
|
—
|
|
$
|
901.9
|
|
||||
(a)
As previously reported in the Company’s Annual Report on Form 10-K for the fiscal year ended June 30, 2016. This was the fiscal year in which the business combination was completed.
(b)
The Company recorded measurement period adjustments in the first quarter of fiscal 2017 to account for a
$0.7
asset retirement obligation, as well as a net decrease in net deferred tax liability of
$17.3
as of the February 1, 2016 acquisition date. These adjustments were offset against Goodwill.
The Company has completed the local tax requirements allowing approximately
$500.0
of goodwill and
$44.6
of customer relationships assets to be tax deductible.
The Company recognized acquisition-related costs of
$2.2
,
$4.8
and
nil
during fiscal years ended
2017
,
2016
and 2015, respectively, which are included in Acquisition-related costs in the Consolidated Statements of Operations.
Unaudited Pro Forma Information
The unaudited pro forma financial information in the table below summarizes the combined results of the Company and the P&G Beauty Business, Younique and the Hypermarcas Brands (the “Pro Forma Acquisitions”). The information in the table below is presented to reflect the pro forma results as if the combination of the P&G Beauty Business and Younique occurred on July 1, 2015 and the Hypermarcas Brands occurred on July 1, 2014. The
fiscal years ended June 30, 2017 and 2016
include pro forma adjustments for all the Pro Forma Acquisitions.
The pro forma adjustments include incremental amortization of intangible assets and depreciation adjustment of property, plant and equipment, based on the values of each asset as well as costs related to financing the Pro Forma Acquisitions. The unaudited pro forma information also includes non-recurring acquisition-related costs as well as amortization of the inventory step-up. Pro forma adjustments were tax-effected at the Company’s statutory rates. For the pro forma basic and diluted earnings per share calculation,
409.7 million
shares issued in connection with the P&G Beauty Business acquisition were considered as if issued on July 1, 2015. The pro forma information is presented for informational purposes only and may not be indicative of the results of operations that would have been achieved if the Pro Forma Acquisitions had taken place on July 1, 2015 or that may occur in the future, and does not reflect future synergies, integration costs, or other such costs or savings. The pro forma information for the fiscal years ended 2017 and 2016, respectively, are as follows:
F-21
COTY INC. & SUBSIDIARIES
NOTES TO CONSOLIDATED FINANCIAL STATEMENTS
($ in millions, except per share data)
|
Year Ended June 30,
|
|||||||
|
2017
(a)
|
2016
(b)
|
||||||
|
Pro forma Net revenues
|
$
|
8,889.2
|
|
$
|
8,219.6
|
|
|
|
Pro forma Net income
|
(111.9
|
)
|
159.1
|
|
|||
|
Pro forma Net income attributable to Coty Inc.
|
(148.0
|
)
|
125.2
|
|
|||
|
Pro forma Net income attributable to Coty Inc. per common share
|
|||||||
|
Basic
|
$
|
(0.20
|
)
|
$
|
0.17
|
|
|
|
Diluted
|
$
|
(0.20
|
)
|
$
|
0.16
|
|
|
(a)
For the twelve months ended
June 30, 2017
, the pro forma information excluded
$465.4
of non-recurring acquisition-related costs and
$89.6
of amortization of inventory step up, respectively.
(b
)
For the twelve months ended
June 30, 2016
, the pro forma information included
$45.8
of non-recurring acquisition-related costs and
$80.1
of amortization of inventory step up, respectively.
4
. SEGMENT REPORTING
Operating and reportable segments (referred to as “segments”) reflect the way the Company is managed and for which separate financial information is available and evaluated regularly by the chief operating decision maker (“CODM”) in deciding how to allocate resources and assess performance. The Company has designated its Chief Executive Officer as the CODM.
In connection with the Company’s acquisition of the P&G Beauty Business, the Company realigned its operations and determined management’s internal and external reporting based on the following
three
divisions – Luxury, Consumer Beauty and Professional Beauty. The new organizational structure is category focused, putting the consumer first, by specifically targeting how and where they shop and what and why they purchase. Each division has full end-to-end responsibility to optimize consumers’ beauty experience in the relevant categories and channels. The Company has determined that its
three
divisions are its operating segments and reportable segments. The operating and reportable segments are:
Luxury — primarily focused on prestige fragrances, premium skin care and premium cosmetics;
Consumer Beauty — primarily focused on color cosmetics, retail hair coloring and styling products, mass fragrance, mass skin care and body care;
Professional Beauty — primarily focused on hair and nail care products for professionals.
As a result of this change in segment reporting, the Company retrospectively revised prior period results, by segment, to conform to current period presentation. Prior to the realignment, the Company operated and managed its business as
four
operating and reportable segments: Fragrances, Color Cosmetics, Skin & Body Care, and the Brazil Acquisition.
Certain revenues and shared costs and the results of corporate initiatives are being managed outside of the
three
segments by Corporate. The items within Corporate relate to corporate-based responsibilities and decisions and are not used by the CODM to measure the underlying performance of the segments. Corporate primarily includes restructuring costs, costs related to acquisition activities and certain other expense items not attributable to ongoing operating activities of the segments.
With the exception of goodwill and acquired intangible assets, the Company does not identify or monitor assets by segment. The Company does not present assets by reportable segment since various assets are shared between reportable segments. The allocation of goodwill and acquired intangible assets by segment is presented in Note
10
—Goodwill.
F-22
COTY INC. & SUBSIDIARIES
NOTES TO CONSOLIDATED FINANCIAL STATEMENTS
($ in millions, except per share data)
|
Year Ended June 30,
|
|||||||||||
|
SEGMENT DATA
|
2017
|
2016
|
2015
|
||||||||
|
Net revenues:
|
|||||||||||
|
Luxury
|
$
|
2,566.6
|
|
$
|
1,836.6
|
|
$
|
1,938.3
|
|
||
|
Consumer Beauty
|
3,688.2
|
|
2,262.5
|
|
2,185.4
|
|
|||||
|
Professional Beauty
|
1,395.5
|
|
250.0
|
|
271.5
|
|
|||||
|
Total
|
$
|
7,650.3
|
|
$
|
4,349.1
|
|
$
|
4,395.2
|
|
||
|
Depreciation and amortization:
|
|||||||||||
|
Luxury
|
$
|
203.5
|
|
$
|
99.1
|
|
$
|
113.0
|
|
||
|
Consumer Beauty
|
256.2
|
|
114.6
|
|
99.7
|
|
|||||
|
Professional Beauty
|
95.4
|
|
18.0
|
|
16.9
|
|
|||||
|
Corporate
|
—
|
|
0.3
|
|
1.3
|
|
|||||
|
Total
|
$
|
555.1
|
|
$
|
232.0
|
|
$
|
230.9
|
|
||
|
Operating income (loss):
|
|||||||||||
|
Luxury
|
$
|
158.0
|
|
$
|
228.9
|
|
$
|
313.1
|
|
||
|
Consumer Beauty
|
261.2
|
|
246.5
|
|
156.4
|
|
|||||
|
Professional Beauty
|
78.5
|
|
68.0
|
|
74.8
|
|
|||||
|
Corporate
|
(935.5
|
)
|
(289.2
|
)
|
(149.2
|
)
|
|||||
|
Total
|
$
|
(437.8
|
)
|
$
|
254.2
|
|
$
|
395.1
|
|
||
|
Reconciliation:
|
|||||||||||
|
Operating (loss) income
|
$
|
(437.8
|
)
|
$
|
254.2
|
|
$
|
395.1
|
|
||
|
Interest expense, net
|
218.6
|
|
81.9
|
|
73.0
|
|
|||||
|
Loss on early extinguishment of debt
|
—
|
|
3.1
|
|
88.8
|
|
|||||
|
Other expense, net
|
1.6
|
|
30.4
|
|
—
|
|
|||||
|
(Loss) income before income taxes
|
$
|
(658.0
|
)
|
$
|
138.8
|
|
$
|
233.3
|
|
||
Additionally, in connection with the Company’s acquisition of the P&G Beauty Business, the Company reorganized its geographical structure into
three
regions: North America (Canada and the United States), Europe and ALMEA (Asia, Latin America, the Middle East, Africa and Australia).
|
Year Ended June 30,
|
|||||||||||
|
GEOGRAPHIC DATA
|
2017
|
2016
|
2015
|
||||||||
|
Net revenues:
|
|||||||||||
|
North America
|
$
|
2,506.9
|
|
$
|
1,413.0
|
|
$
|
1,499.7
|
|
||
|
Europe
|
3,325.7
|
|
1,924.6
|
|
1,961.6
|
|
|||||
|
ALMEA
|
1,817.7
|
|
1,011.5
|
|
933.9
|
|
|||||
|
Total
|
$
|
7,650.3
|
|
$
|
4,349.1
|
|
$
|
4,395.2
|
|
||
|
Long-lived assets:
|
|||||||||||
|
U.S.
|
$
|
7,662.4
|
|
$
|
2,688.7
|
|
$
|
2,713.9
|
|
||
|
Switzerland
|
6,899.8
|
|
508.0
|
|
297.4
|
|
|||||
|
Brazil
|
863.3
|
|
882.7
|
|
1.4
|
|
|||||
|
All other
|
3,187.3
|
|
830.9
|
|
931.8
|
|
|||||
|
Total
|
$
|
18,612.8
|
|
$
|
4,910.3
|
|
$
|
3,944.5
|
|
||
For Net revenues, a major country is defined as a group of subsidiaries in a country with combined revenues greater than
10%
of consolidated net revenues or as otherwise deemed significant. The United States and United Kingdom are the only
two
countries that account for more than
10%
of total net revenue for fiscal years 2017, 2016, and 2015. The United States had net
F-23
COTY INC. & SUBSIDIARIES
NOTES TO CONSOLIDATED FINANCIAL STATEMENTS
($ in millions, except per share data)
revenues of
$2,220.4
,
$1,256.0
and
$1,342.9
in fiscal 2017, 2016, and 2015, respectively. The United Kingdom had net revenues of
$735.1
,
$429.5
, and
$450.4
in fiscal 2017, 2016, and 2015, respectively.
For Long-lived assets, a major country is defined as a group of subsidiaries within a country with combined long-lived assets greater than
10%
of consolidated long-lived assets or as otherwise deemed significant. Long-lived assets include property and equipment, goodwill and other intangible assets.
No
customer or group of affiliated customers accounted for more than
10%
of the Company’s Net revenues in fiscal
2017
,
2016
and
2015
or are otherwise deemed significant.
Presented below are the net revenues associated with Company’s product categories:
|
Year Ended June 30,
|
||||||||
|
PRODUCT CATEGORY
|
2017
|
2016
|
2015
|
|||||
|
Fragrances
|
36.1
|
%
|
46.3
|
%
|
49.6
|
%
|
||
|
Color Cosmetics
|
29.6
|
%
|
35.9
|
%
|
32.9
|
%
|
||
|
Skin & Body Care
|
12.4
|
%
|
17.6
|
%
|
17.5
|
%
|
||
|
Hair Care
|
21.9
|
%
|
0.2
|
%
|
—
|
%
|
||
|
Total
|
100.0
|
%
|
100.0
|
%
|
100.0
|
%
|
||
5
. ACQUISITION-RELATED COSTS
Acquisition-related costs, which are expensed as incurred, represent non-restructuring costs directly related to acquiring and integrating an entity, for both completed and contemplated acquisitions and can include finder’s fees, legal, accounting, valuation, other professional or consulting fees, and other internal costs which can include compensation related expenses for dedicated internal resources. The Company recognized acquisition-related costs of
$355.4
,
$174.0
and
$34.1
for the fiscal years ended
2017
,
2016
and
2015
, respectively, which have been recorded in Acquisition-related costs in the Consolidated Statements of Operations.
6
. RESTRUCTURING COSTS
Restructuring costs for the fiscal years ended June 30,
2017
,
2016
and
2015
are presented below:
|
Year Ended June 30,
|
|||||||||||
|
2017
|
2016
|
2015
|
|||||||||
|
Global Integration Activities
|
$
|
364.2
|
|
$
|
—
|
|
$
|
—
|
|
||
|
Acquisition Integration Program
|
2.3
|
|
42.3
|
|
15.3
|
|
|||||
|
Organizational Redesign
|
5.1
|
|
34.5
|
|
58.6
|
|
|||||
|
Other Restructuring
|
0.6
|
|
10.1
|
|
1.5
|
|
|||||
|
Total
|
$
|
372.2
|
|
$
|
86.9
|
|
$
|
75.4
|
|
||
Global Integration Activities
In connection with the acquisition of the P&G Beauty Business, the Company anticipates that it will incur restructuring and related costs aimed at integrating and optimizing the combined organization (“Global Integration Activities”).
Of the expected costs, the Company incurred
$387.3
related to approved initiatives in the fiscal
year ended June 30, 2017
:
|
Cost of sales
(a)
|
Selling, general and administrative
(b)
|
Restructuring
|
Total
|
||||||||||||
|
Fiscal year ended June 30,
|
$
|
13.1
|
|
$
|
10.0
|
|
$
|
364.2
|
|
$
|
387.3
|
|
|||
(a)
Primarily related to inventory buyback associated with the conversion of P&G distributors and accelerated depreciation.
(b)
Primarily other business realignment costs, including legal and consulting costs.
Over the next two years, the Company expects to incur approximately
$160.0
of additional restructuring charges and
$90.0
of other related costs pertaining to the approved actions. Of the
$160.0
of additional restructuring charges, the Company
F-24
COTY INC. & SUBSIDIARIES
NOTES TO CONSOLIDATED FINANCIAL STATEMENTS
($ in millions, except per share data)
currently anticipates spending equal amounts related to employee termination benefits, fixed asset write-offs, contract terminations, and other costs to exit facilities and relocate employees.
The related liability balance and activity for the Global Integration Activities restructuring costs are presented below:
|
Severance and
Employee Benefits |
Third-Party
Contract Terminations |
Fixed Asset Write-offs
|
Other
Exit Costs (a) |
Total
Program Costs |
|||||||||||||||
|
Balance—July 1, 2016
|
$
|
—
|
|
$
|
—
|
|
$
|
—
|
|
$
|
—
|
|
$
|
—
|
|
||||
|
Restructuring charges
|
339.1
|
|
22.4
|
|
4.6
|
|
3.3
|
|
369.4
|
|
|||||||||
|
Payments
|
(26.0
|
)
|
(7.7
|
)
|
—
|
|
(1.3
|
)
|
(35.0
|
)
|
|||||||||
|
Change in estimates
|
(5.2
|
)
|
—
|
|
—
|
|
—
|
|
(5.2
|
)
|
|||||||||
|
Non-cash utilization
|
—
|
|
—
|
|
(4.6
|
)
|
0.8
|
|
(3.8
|
)
|
|||||||||
|
Effect of exchange rates
|
2.9
|
|
0.2
|
|
—
|
|
—
|
|
3.1
|
|
|||||||||
|
Balance—June 30, 2017
|
$
|
310.8
|
|
$
|
14.9
|
|
$
|
—
|
|
$
|
2.8
|
|
$
|
328.5
|
|
||||
(a)
Other costs primarily represent lease terminations and other exit costs, partially offset by pension curtailment and settlement gains recognized in connection with involuntary employee terminations as part of the Global Integration Activities. The gains resulted in a corresponding decrease to the net pension liability. Refer to Note
17
—Employee Benefit Plans for further information.
The Company currently estimates that the total remaining accrual of
$328.5
will result in cash expenditures of approximately
$252.4
,
$72.7
and
$3.4
in fiscal
2018
,
2019
and
2020
, respectively.
Acquisition Integration Program
In the first quarter of fiscal 2016, the Company’s Board of Directors (the “Board”) approved an expansion to a restructuring program in connection with the acquisition of the Bourjois brand (the “Acquisition Integration Program”). Actions associated with the program were initiated after the acquisition of Bourjois and were substantially completed during fiscal 2017 with cash payments continuing through fiscal 2018. The Company incurred
$59.9
of restructuring costs life-to-date as of
June 30, 2017
, which have been recorded in Corporate.
The related liability balance and activity for the Acquisition Integration Program costs are presented below:
|
Severance and
Employee Benefits |
Third-Party
Contract Terminations |
Other
Exit Costs (a) |
Total
Program Costs |
||||||||||||
|
Balance—July 1, 2016
|
$
|
35.7
|
|
$
|
7.6
|
|
$
|
0.1
|
|
$
|
43.4
|
|
|||
|
Restructuring charges
|
0.6
|
|
0.6
|
|
4.7
|
|
5.9
|
|
|||||||
|
Payments
|
(11.7
|
)
|
(3.7
|
)
|
(2.5
|
)
|
(17.9
|
)
|
|||||||
|
Changes in estimates
|
(0.8
|
)
|
(2.8
|
)
|
—
|
|
(3.6
|
)
|
|||||||
|
Non-cash utilization
(a)
|
—
|
|
—
|
|
1.8
|
|
1.8
|
|
|||||||
|
Effect of exchange rates
|
1.0
|
|
(0.2
|
)
|
—
|
|
0.8
|
|
|||||||
|
Balance—June 30, 2017
|
$
|
24.8
|
|
$
|
1.5
|
|
$
|
4.1
|
|
$
|
30.4
|
|
|||
(a)
Other costs primarily represent lease terminations partially offset by a pension curtailment gain recognized in connection with involuntary employee terminations as part of the Acquisition Integration Program. The gain resulted in a corresponding decrease to the net pension liability. Refer to Note
17
—Employee Benefit Plans for further information.
The Company currently estimates that the total remaining accrual of
$30.4
will result in cash expenditures of approximately
$29.6
and
$0.8
in fiscal
2018
and
2019
, respectively.
Organizational Redesign
During the fourth quarter of fiscal 2014, the Board approved a program associated with a new organizational structure (“Organizational Redesign”) that aims to reinforce the Company’s growth path and strengthen its position as a new global leader and challenger in the beauty industry. The Organizational Redesign was substantially completed during fiscal 2017. The Company incurred
$111.2
of restructuring costs life-to-date as of
June 30, 2017
, which have been recorded in Corporate. The Company incurred
$37.4
of other business realignment costs life-to-date as of
June 30, 2017
, which have been primarily reported in Selling, general and administrative expenses in the Consolidated Statements of Operations in Corporate.
F-25
COTY INC. & SUBSIDIARIES
NOTES TO CONSOLIDATED FINANCIAL STATEMENTS
($ in millions, except per share data)
The related liability balance and activity for the Organizational Redesign costs are presented below:
|
Severance and
Employee Benefits |
Third-Party Contract Terminations
|
Fixed Asset Write-offs
|
Other
Exit Costs |
Total
Program Costs |
|||||||||||||||
|
Balance—July 1, 2016
|
$
|
33.6
|
|
$
|
0.4
|
|
$
|
—
|
|
$
|
0.5
|
|
$
|
34.5
|
|
||||
|
Restructuring charges
|
6.1
|
|
—
|
|
2.2
|
|
—
|
|
8.3
|
|
|||||||||
|
Payments
|
(31.3
|
)
|
—
|
|
—
|
|
(0.2
|
)
|
(31.5
|
)
|
|||||||||
|
Changes in estimates
|
(3.0
|
)
|
(0.2
|
)
|
—
|
|
—
|
|
(3.2
|
)
|
|||||||||
|
Non-cash utilization
|
—
|
|
—
|
|
(2.2
|
)
|
—
|
|
(2.2
|
)
|
|||||||||
|
Effects of exchange rates
|
0.5
|
|
—
|
|
—
|
|
(0.2
|
)
|
0.3
|
|
|||||||||
|
Balance—June 30, 2017
|
$
|
5.9
|
|
$
|
0.2
|
|
$
|
—
|
|
$
|
0.1
|
|
$
|
6.2
|
|
||||
The Company currently estimates that the total remaining accrual of
$6.2
will result in cash expenditures of
$6.1
and
$0.1
in fiscal
2018
and
2019
, respectively.
Other Restructuring
Other restructuring primarily relates to the Company’s programs to integrate supply chain and selling activities, which were substantially completed during fiscal 2016 with cash payments expected to continue through fiscal 2018. The Company incurred
$0.6
,
$10.1
and
$1.5
in fiscal
2017
,
2016
and
2015
, respectively. The related liability balances were
$3.9
and
$6.2
at
June 30, 2017
and
June 30, 2016
, respectively. The Company currently estimates that the total remaining accrual of
$3.9
will result in cash expenditures in fiscal 2018.
In connection with the acquisition of the P&G Beauty Business, the Company assumed restructuring liabilities of approximately
$21.7
at October 1, 2016. The Company estimates that the remaining accrual of
$14.3
at
June 30, 2017
will result in cash expenditures of
$9.0
,
$3.3
and
$2.0
in fiscal
2018
,
2019
and 2020, respectively.
7
. TRADE RECEIVABLES—FACTORING
The Company factors a portion of its trade receivables with unrelated third-party factoring companies on a non-recourse basis. Trade receivables factored throughout the fiscal year amounted to
$344.9
and
$379.2
in fiscal
2017
and
2016
, respectively. Remaining balances due from factors amounted to
$16.8
and
$16.1
as of June 30,
2017
and
2016
, respectively, and are included in Trade receivables, net in the Consolidated Balance Sheets. Factoring fees paid under these arrangements were
$0.7
,
$0.8
and
$0.6
in fiscal
2017
,
2016
and
2015
, respectively, which were recorded in Selling, general and administrative expenses in the Consolidated Statements of Operations.
8
. INVENTORIES
Inventories as of
June 30, 2017
and
2016
are presented below:
|
June 30,
2017 |
June 30,
2016 |
||||||
|
Raw materials
|
$
|
256.4
|
|
$
|
159.8
|
|
|
|
Work-in-process
|
33.4
|
|
9.5
|
|
|||
|
Finished goods
|
762.8
|
|
396.5
|
|
|||
|
Total inventories
|
$
|
1,052.6
|
|
$
|
565.8
|
|
|
9
. PROPERTY AND EQUIPMENT, NET
Property and equipment, net as of June 30,
2017
and
2016
are presented below:
F-26
COTY INC. & SUBSIDIARIES
NOTES TO CONSOLIDATED FINANCIAL STATEMENTS
($ in millions, except per share data)
|
June 30,
2017 |
June 30,
2016 |
||||||
|
Land, buildings and leasehold improvements
|
$
|
646.1
|
|
$
|
284.8
|
|
|
|
Machinery and equipment
|
851.5
|
|
523.1
|
|
|||
|
Marketing furniture and fixtures
|
432.8
|
|
295.2
|
|
|||
|
Computer equipment and software
|
459.0
|
|
346.7
|
|
|||
|
Construction in progress
|
286.1
|
|
79.6
|
|
|||
|
Property and equipment, gross
|
2,675.5
|
|
1,529.4
|
|
|||
|
Accumulated depreciation and amortization
|
(1,043.4
|
)
|
(890.8
|
)
|
|||
|
Property and equipment, net
|
$
|
1,632.1
|
|
$
|
638.6
|
|
|
Depreciation and amortization expense of property and equipment totaled
$280.0
,
$152.4
and
$156.2
in fiscal
2017
,
2016
and
2015
, respectively, and is recorded in Cost of sales and Selling, general and administrative expenses in the Consolidated Statements of Operations.
In October 2014, the Company agreed to sell certain TJoy Holdings Co., Ltd. (“TJoy”) assets for cash of
86.0 million
RMB (
$14.1
) in conjunction with a reorganization of certain business operations in China. As a result, the Company recognized a gain of
$7.2
in Gain on sale of assets in the Consolidated Statements of Operations during fiscal 2015.
10
. GOODWILL AND OTHER INTANGIBLE ASSETS, NET
Goodwill
The Company tests goodwill and indefinite lived intangible assets for impairment at least annually as of May 1, or more frequently, if certain events or circumstances warrant. There were
no
impairments of goodwill at the Company’s reporting units in fiscal
2017
and
2016
.
Goodwill as of
June 30, 2017
,
2016
and
2015
is presented below:
F-27
COTY INC. & SUBSIDIARIES
NOTES TO CONSOLIDATED FINANCIAL STATEMENTS
($ in millions, except per share data)
|
Luxury
|
Consumer Beauty
|
Professional Beauty
|
Total
|
||||||||||||
|
Gross balance at June 30, 2015
|
$
|
1,092.7
|
|
$
|
848.1
|
|
$
|
230.7
|
|
$
|
2,171.5
|
|
|||
|
Accumulated impairments
|
(403.7
|
)
|
(237.1
|
)
|
—
|
|
(640.8
|
)
|
|||||||
|
Net balance at June 30, 2015
|
$
|
689.0
|
|
$
|
611.0
|
|
$
|
230.7
|
|
$
|
1,530.7
|
|
|||
|
Changes during the year ended June 30, 2016
|
|||||||||||||||
|
Acquisitions
(a)
|
167.6
|
|
306.7
|
|
36.2
|
|
510.5
|
|
|||||||
|
Measurement period adjustments
|
—
|
|
56.9
|
|
—
|
|
56.9
|
|
|||||||
|
Foreign currency translation
|
34.2
|
|
79.3
|
|
5.3
|
|
118.8
|
|
|||||||
|
Dispositions
|
—
|
|
(2.8
|
)
|
(1.4
|
)
|
(4.2
|
)
|
|||||||
|
Gross balance at June 30, 2016
|
$
|
1,294.5
|
|
$
|
1,288.2
|
|
$
|
270.8
|
|
$
|
2,853.5
|
|
|||
|
Accumulated impairments
|
(403.7
|
)
|
(237.1
|
)
|
—
|
|
(640.8
|
)
|
|||||||
|
Net balance at June 30, 2016
|
$
|
890.8
|
|
$
|
1,051.1
|
|
$
|
270.8
|
|
$
|
2,212.7
|
|
|||
|
Changes during the year ended June 30, 2017
|
|||||||||||||||
|
Acquisitions
(b)
|
1,866.1
|
|
3,285.2
|
|
665.5
|
|
5,816.8
|
|
|||||||
|
Measurement period adjustments
(c)
|
308.0
|
|
124.7
|
|
12.0
|
|
444.7
|
|
|||||||
|
Foreign currency translation
|
28.2
|
|
36.3
|
|
19.2
|
|
83.7
|
|
|||||||
|
Dispositions
|
—
|
|
(2.4
|
)
|
—
|
|
(2.4
|
)
|
|||||||
|
Gross balance at June 30, 2017
|
$
|
3,496.8
|
|
$
|
4,732.0
|
|
$
|
967.5
|
|
$
|
9,196.3
|
|
|||
|
Accumulated impairments
|
(403.7
|
)
|
(237.1
|
)
|
—
|
|
(640.8
|
)
|
|||||||
|
Net balance at June 30, 2017
|
$
|
3,093.1
|
|
$
|
4,494.9
|
|
$
|
967.5
|
|
$
|
8,555.5
|
|
|||
(a)
Includes goodwill resulting from the Hypermarcas Brands during the year ended
June 30, 2016
(Refer to Note
3
—Business Combinations). Additionally, the Company acquired
100%
of the issued share capital of Beamly Limited for a purchase price of
$17.9
in a transaction accounted for as a business combination, which resulted in the recognition of
$13.7
of goodwill.
(b)
Includes goodwill resulting from the P&G Beauty Business, ghd and Younique acquisitions during the
year ended June 30, 2017
(Refer to Note
3
—Business Combinations).
(c)
Includes measurement period adjustments in connection with the Hypermarcas Brands, P&G Beauty Business, ghd and Younique acquisitions (Refer to Note
3
—Business Combinations).
As described in Note
4
—Segment Reporting, the Company changed its segments during the second quarter ended December 31, 2016. As a result, the Company allocated goodwill to the new segments using a relative fair value approach. In addition, the Company completed an assessment of any potential goodwill impairment for all reporting units immediately prior to the reallocation and determined that no impairment existed. Further, the Company recasted the goodwill and indefinite-lived intangible asset tables for the new segments.
During fiscal
2017
, the Company sold assets related to one of its fragrance brands for a total disposal price of
$10.5
. The Company allocated
$2.4
of goodwill to the brand as part of the sale. During fiscal
2016
, the Company sold assets relating to the
Cutex
brand for a total disposal price of
$29.2
. The Company allocated
$4.2
of goodwill to the brand as part of the sale. The Company recorded gains of
$3.1
and
$24.8
, which are reflected in Gain on sale of assets in the Consolidated Statements of Operations for the fiscal
years ended June 30, 2017 and 2016
, respectively.
F-28
COTY INC. & SUBSIDIARIES
NOTES TO CONSOLIDATED FINANCIAL STATEMENTS
($ in millions, except per share data)
Other Intangible Assets, net
Other intangible assets, net as of
June 30, 2017
and
2016
are presented below:
|
June 30,
2017 |
June 30,
2016 |
||||||
|
Indefinite-lived other intangible assets
|
$
|
3,186.9
|
|
$
|
1,417.0
|
|
|
|
Finite-lived other intangible assets, net
|
5,238.3
|
|
633.1
|
|
|||
|
Total Other intangible assets, net
|
$
|
8,425.2
|
|
$
|
2,050.1
|
|
|
The changes in the carrying amount of indefinite-lived other intangible assets are presented below:
|
Luxury
|
Consumer Beauty
|
Professional Beauty
|
Total
|
||||||||||||
|
Gross balance at June 30, 2015
|
404.8
|
|
403.9
|
|
663.1
|
|
1,471.8
|
|
|||||||
|
Accumulated impairments
|
(118.8
|
)
|
(75.9
|
)
|
(3.1
|
)
|
(197.8
|
)
|
|||||||
|
Net balance at June 30, 2015
|
286.0
|
|
328.0
|
|
660.0
|
|
1,274.0
|
|
|||||||
|
Changes during the year ended June 30, 2016
|
|||||||||||||||
|
Acquisitions
|
—
|
|
157.1
|
|
—
|
|
157.1
|
|
|||||||
|
Measurement period adjustments
|
—
|
|
(10.0
|
)
|
—
|
|
(10.0
|
)
|
|||||||
|
Foreign currency translation
|
(3.6
|
)
|
0.5
|
|
(1.0
|
)
|
(4.1
|
)
|
|||||||
|
Gross balance at June 30, 2016
|
$
|
401.2
|
|
$
|
551.5
|
|
$
|
662.1
|
|
$
|
1,614.8
|
|
|||
|
Accumulated impairments
|
(118.8
|
)
|
(75.9
|
)
|
(3.1
|
)
|
(197.8
|
)
|
|||||||
|
Net balance at June 30, 2016
|
282.4
|
|
475.6
|
|
659.0
|
|
1,417.0
|
|
|||||||
|
Changes during the year ended June 30, 2017
|
|||||||||||||||
|
Acquisitions
(a)
|
—
|
|
1,390.0
|
|
663.8
|
|
2,053.8
|
|
|||||||
|
Measurement period adjustments
(b)
|
—
|
|
(255.0
|
)
|
(60.0
|
)
|
(315.0
|
)
|
|||||||
|
Foreign currency translation
|
8.6
|
|
9.9
|
|
12.6
|
|
31.1
|
|
|||||||
|
Gross balance at June 30, 2017
|
409.8
|
|
1,696.4
|
|
1,278.5
|
|
3,384.7
|
|
|||||||
|
Accumulated impairments
|
(118.8
|
)
|
(75.9
|
)
|
(3.1
|
)
|
(197.8
|
)
|
|||||||
|
Net balance at June 3
0, 2017
|
$
|
291.0
|
|
$
|
1,620.5
|
|
$
|
1,275.4
|
|
$
|
3,186.9
|
|
|||
(a)
Includes Indefinite-lived other intangible assets resulting from the P&G Beauty Business and ghd acquisitions during the
year ended June 30, 2017
(Refer to Note
3
—Business Combinations).
(b)
Includes measurement period adjustments in connection with the P&G Beauty Business acquisition (Refer to Note
3
—Business Combinations).
F-29
COTY INC. & SUBSIDIARIES
NOTES TO CONSOLIDATED FINANCIAL STATEMENTS
($ in millions, except per share data)
Intangible assets subject to amortization are presented below:
|
Cost
|
Accumulated Amortization
|
Accumulated Impairment
|
Net
|
||||||||||||
|
June 30, 2016
|
|||||||||||||||
|
License agreements
|
$
|
798.3
|
|
$
|
(532.2
|
)
|
$
|
—
|
|
$
|
266.1
|
|
|||
|
Customer relationships
|
611.7
|
|
(274.2
|
)
|
(5.5
|
)
|
332.0
|
|
|||||||
|
Trademarks
|
128.3
|
|
(108.6
|
)
|
—
|
|
19.7
|
|
|||||||
|
Product formulations
|
48.0
|
|
(32.7
|
)
|
—
|
|
15.3
|
|
|||||||
|
Total
|
$
|
1,586.3
|
|
$
|
(947.7
|
)
|
$
|
(5.5
|
)
|
$
|
633.1
|
|
|||
|
June 30, 2017
|
|||||||||||||||
|
License agreements
(a)
|
$
|
3,148.4
|
|
$
|
(653.3
|
)
|
$
|
—
|
|
$
|
2,495.1
|
|
|||
|
Customer relationships
(a)
|
1,937.3
|
|
(375.0
|
)
|
(5.5
|
)
|
1,556.8
|
|
|||||||
|
Trademarks
(a)
|
1,001.1
|
|
(141.0
|
)
|
—
|
|
860.1
|
|
|||||||
|
Product formulations and technology
(a)
|
389.3
|
|
(63.0
|
)
|
—
|
|
326.3
|
|
|||||||
|
Total
|
$
|
6,476.1
|
|
$
|
(1,232.3
|
)
|
$
|
(5.5
|
)
|
$
|
5,238.3
|
|
|||
(a)
Includes License agreements, Customer relationships, Trademarks, and Product formulations and technology of
$2,299.0
,
$1,307.8
,
$870.7
and
$331.0
, respectively resulting from the P&G Beauty Business, ghd and Younique acquisitions during the
year ended June 30, 2017
(see Note
3
—Business Combinations).
In conjunction with the Company’s analysis of its go-to-market strategy in Southeast Asia during the first quarter of fiscal 2016, the Company evaluated future cash flows for this asset group and determined that the carrying value exceeded the undiscounted cash flows. As a result, the Company evaluated the fair value of the long-lived assets in the asset group, through an analysis of discounted future cash flows, and determined that the customer relationships were fully impaired and thus recorded
$5.5
of Asset impairment charges in the Consolidated Statements of Operations for the fiscal year ended June 30, 2016.
Amortization expense totaled
$275.1
and
$79.5
for the
years ended June 30, 2017 and 2016
, respectively.
Intangible assets subject to amortization are amortized principally using the straight-line method and have the following weighted-average remaining lives:
|
Description
|
|
|
License agreements
|
24.7 years
|
|
Customer relationships
|
16.5 years
|
|
Trademarks
|
22.8 years
|
|
Product formulations and technology
|
10.7 years
|
As of
June 30, 2017
, the remaining weighted-average life of all intangible assets subject to amortization is
21.1 years
.
The estimated aggregate amortization expense for each of the following fiscal years ending June 30 is presented below:
|
2018
|
$
|
361.1
|
|
|
2019
|
353.0
|
|
|
|
2020
|
348.0
|
|
|
|
2021
|
346.6
|
|
|
|
2022
|
307.0
|
|
|
License Agreements
The Company records assets for license agreements (“licenses”) acquired in transactions accounted for as business combinations. These licenses provide the Company with the exclusive right to manufacture and market on a worldwide and/or regional basis, certain of the Company’s products which comprise a significant portion of the Company’s revenues. These
F-30
COTY INC. & SUBSIDIARIES
NOTES TO CONSOLIDATED FINANCIAL STATEMENTS
($ in millions, except per share data)
licenses have initial terms covering various periods. Certain licenses provide for automatic extensions ranging from
3
to
10
year terms, at the Company’s discretion.
11
. ACCRUED EXPENSES AND OTHER CURRENT LIABILITIES
Accrued expenses and other current liabilities as of June 30,
2017
and
2016
are presented below:
|
|
June 30,
2017 |
June 30,
2016 |
|||||
|
Advertising, marketing and licensing
|
$
|
445.1
|
|
$
|
180.2
|
|
|
|
Compensation and other compensation related benefits
|
328.2
|
|
157.5
|
|
|||
|
Customer returns, discounts, allowances and bonuses
|
307.3
|
|
164.8
|
|
|||
|
Restructuring costs
|
301.0
|
|
60.8
|
|
|||
|
VAT, sales and other non-income taxes
|
97.7
|
|
36.2
|
|
|||
|
Tax indemnification liability
|
38.0
|
|
—
|
|
|||
|
Acquisition-related costs
|
23.5
|
|
42.4
|
|
|||
|
Interest
|
17.8
|
|
9.4
|
|
|||
|
Deferred income
|
15.8
|
|
3.8
|
|
|||
|
Unfavorable contract liability
|
11.0
|
|
—
|
|
|||
|
Auditing and consulting
|
8.8
|
|
6.3
|
|
|||
|
Derivative liabilities
|
7.9
|
|
20.9
|
|
|||
|
Working capital payment related to acquisition
|
7.5
|
|
—
|
|
|||
|
Other
|
186.8
|
|
66.1
|
|
|||
|
Total accrued expenses and other current liabilities
|
$
|
1,796.4
|
|
$
|
748.4
|
|
|
12
. OTHER NONCURRENT LIABILITIES
Other noncurrent liabilities as of June 30,
2017
and
2016
are presented below:
|
|
June 30,
2017 |
June 30,
2016 |
|||||
|
Noncurrent income tax liabilities
|
$
|
154.2
|
|
$
|
131.9
|
|
|
|
Unfavorable contract liabilities
|
113.2
|
|
—
|
|
|||
|
Restructuring
|
82.3
|
|
23.5
|
|
|||
|
Deferred rent
|
49.0
|
|
47.2
|
|
|||
|
Mandatorily redeemable financial instrument liability (Note 19)
|
46.4
|
|
5.2
|
|
|||
|
Other
|
28.3
|
|
26.0
|
|
|||
|
Total other noncurrent liabilities
|
$
|
473.4
|
|
$
|
233.8
|
|
|
F-31
COTY INC. & SUBSIDIARIES
NOTES TO CONSOLIDATED FINANCIAL STATEMENTS
($ in millions, except per share data)
13
. DEBT
|
|
June 30,
2017 |
June 30,
2016 |
|||||
|
Short-term debt
|
$
|
3.7
|
|
$
|
19.8
|
|
|
|
Galleria Credit Agreement
|
|||||||
|
Galleria Revolving Credit Facility due September 2021
|
—
|
|
—
|
|
|||
|
Galleria Term Loan A Facility due September 2021
|
944.3
|
|
—
|
|
|||
|
Galleria Term Loan B Facility due September 2023
|
1,000.0
|
|
—
|
|
|||
|
Coty Credit Agreement
|
|||||||
|
Coty Revolving Credit Facility due October 2020
|
810.0
|
|
670.0
|
|
|||
|
Coty Term Loan A Facility due October 2020
|
1,792.8
|
|
1,883.6
|
|
|||
|
Coty Term Loan A Facility due October 2021
|
950.6
|
|
—
|
|
|||
|
Coty Term Loan B Facility due October 2022
|
1,712.5
|
|
1,596.0
|
|
|||
|
Other long-term debt and capital lease obligations
|
1.7
|
|
0.7
|
|
|||
|
Total debt
|
7,215.6
|
|
4,170.1
|
|
|||
|
Less: Short-term debt and current portion of long-term debt
|
(209.1
|
)
|
(161.8
|
)
|
|||
|
Total Long-term debt
|
7,006.5
|
|
4,008.3
|
|
|||
|
Less: Unamortized debt issuance costs
(a)
|
(67.6
|
)
|
(64.6
|
)
|
|||
|
Less: Discount on Long-term debt
|
(10.6
|
)
|
(7.3
|
)
|
|||
|
Total Long-term debt, net
|
$
|
6,928.3
|
|
$
|
3,936.4
|
|
|
(a)
Consists of unamortized debt issuance costs of
$17.5
and
$22.7
for the Coty Revolving Credit Facility,
$33.2
and
$30.3
for the Coty Term Loan A Facility and
$11.3
and
$11.6
for the Coty Term Loan B Facility as of
June 30, 2017
and
June 30, 2016
, respectively. Consists of unamortized debt issuance costs of
$2.7
and
$0.0
for the Galleria Term Loan A Facility and
$3.0
and
$0.0
for the Galleria Term Loan B Facility as of
June 30, 2017
and
June 30, 2016
, respectively. Unamortized debt issuance costs of
$4.2
for the Galleria Revolving Credit Facility were classified as Other noncurrent assets as of
June 30, 2017
.
Short-Term Debt
The Company maintains short-term lines of credit with financial institutions around the world. Total available lines of credit were
$132.4
and
$108.5
, of which
$3.2
and
$19.8
were outstanding at June 30,
2017
and
2016
, respectively. Interest rates on these short-term lines of credit vary depending on market rates for borrowings within the respective geographic locations plus applicable spreads. Interest rates plus applicable spreads on these lines ranged from
0.4%
to
11.2%
and from
0.5%
to
16.5%
as of June 30,
2017
and
2016
, respectively. The weighted-average interest rate on short-term debt outstanding was
3.0%
and
14.0%
as of June 30,
2017
and
2016
, respectively. In addition, the Company had undrawn letters of credit of
$5.5
and
$4.6
as of June 30,
2017
and
2016
, respectively.
F-32
COTY INC. & SUBSIDIARIES
NOTES TO CONSOLIDATED FINANCIAL STATEMENTS
($ in millions, except per share data)
Long Term Debt
The Company’s long term debt facilities consisted of the following as of
June 30, 2017
:
|
Facility
|
Maturity Date
|
Borrowing Capacity (in millions)
|
Interest Rate Terms
|
Applicable Interest Rate Spread as of
June 30, 2017 |
Debt Discount
|
Repayment Schedule
|
||||||
|
Galleria Revolving Credit Facility
(a)
|
September 2021
|
$1,500.0
|
LIBOR
(a)
plus a margin ranging from 1.00% to 2.00% per annum or a base rate plus a margin ranging from 0.00% to 1.00% per annum, based on the Company’s total net leverage ratio
(c) (d) (f)
|
1.75%
|
N/A
(b)
|
Payable in full at maturity date
|
||||||
|
Galleria Term Loan A Facility
(a)
|
September 2021
|
$2,000.0
(g)
|
LIBOR
(a)
plus a margin ranging from 1.00% to 2.00% per annum or a base rate plus a margin ranging from 0.00% to 1.00% per annum, based on the Company’s total net leverage ratio
(c) (f)
|
1.75%
|
N/A
(b)
|
Quarterly repayments beginning December 31, 2017 at 1.25% of original principal amount
|
||||||
|
Galleria Term Loan B Facility
(a)
|
September 2023
|
$1,000.0
|
LIBOR
(a)
plus a margin of 3.00% or a base rate, plus a margin of 2.00%
(f)
|
3.00%
|
0.50%
|
Quarterly repayments
beginning December 31, 2017 at 0.25% of original principal amount |
||||||
|
Coty Revolving Credit Facility
(a)
|
October 2020
|
$1,500.0
|
LIBOR
(a)
plus a margin ranging from 1.00% to 2.00% per annum or a base rate plus a margin ranging from 0.00% to 1.00% per annum, based on the Company’s total net leverage ratio
(c) (d)
(f)
|
1.75%
|
N/A
(b)
|
Payable in full at maturity date
|
||||||
|
Coty Term Loan A Facility
(a)
- USD Portion |
October 2020
|
$1,750.0
|
LIBOR
(a)
plus a margin ranging from 1.00% to 2.00% per annum or a base rate plus a margin ranging from 0.00% to 1.00% per annum, based on the Company’s total net leverage ratio
(c)
(f)
|
1.75%
|
N/A
(b)
|
Quarterly repayments beginning June 30, 2016 at 1.25% of original principal amount
|
||||||
|
Coty Term Loan A Facility
(a)
- Euro Portion |
October 2020
|
€140.0
|
EURIBOR
(a)
plus a margin of 1.00% to 2.00% per annum, based on the Company’s total net leverage ratio
(c)
(f)
|
1.75%
|
N/A
(b)
|
Quarterly repayments beginning September 30, 2016 at 1.25% of original principal amount
|
||||||
|
Incremental Term A Facility
(a)
|
October 2021
|
$975.0
|
LIBOR
(a)
plus a margin ranging from 1.00% to 2.00% per annum or a base rate plus a margin ranging from 0.00% to 1.00% per annum, based on the Company’s total net leverage ratio
(c)
(f)
|
1.75%
|
N/A
(b)
|
Quarterly repayments beginning March 31, 2017 at 1.25% of original principal amount
|
||||||
|
Coty Term Loan B Facility
(a)(h)
- USD Portion and Incremental Term B Facility (a) |
October 2022
|
$600.0
|
LIBOR
(a)
plus a margin of 2.50% or a base rate, plus a margin of 2.00%
(f)
|
2.50%
|
0.50%
|
Quarterly repayments beginning June 30, 2016 at 0.25% of original principal amount
|
||||||
|
Coty Term Loan B Facility
(a)
- Euro Portion |
October 2022
|
€990.0
(e)
|
EURIBOR
(a)
plus a margin of 2.75%
|
2.75%
|
0.50%
|
See below.
(e)
|
||||||
(a)
As defined below.
(b)
N/A - Not Applicable.
(c)
As defined per the respective loan agreement.
(d)
Additionally the Company will pay to the Revolving Credit Facility lenders an unused commitment fee calculated at a rate ranging from
0.25%
to
0.50%
per annum, based on the Company’s total net leverage ratio
(c)
. As of
June 30, 2017
, the applicable rate on the unused commitment fee was
0.50%
.
(e)
Includes
€665.0 million
of the Euro portion of Coty Term Loan B Facility originated on October 27, 2015, and the
€325.0 million
from the Incremental Term Loans, as defined below, originated on April 8, 2016. Repayments on the
€665.0 million
portion are payable quarterly beginning on June 30, 2016 at
0.25%
of the original principal amount. Repayments on the
€325.0 million
Incremental Term Loan B are payable quarterly beginning on September 30, 2016 at
0.25%
of the original principal amount.
(f)
The selection of the applicable interest rate for the period is at the discretion of the Company.
(g)
At the closing of the P&G Beauty Business acquisition,
$944.3
were assumed under the Galleria Credit Agreement. The remaining unused loan commitments for the Galleria Term Loan A Facility expired.
F-33
COTY INC. & SUBSIDIARIES
NOTES TO CONSOLIDATED FINANCIAL STATEMENTS
($ in millions, except per share data)
(h)
Refinanced as part of the Incremental Assumption Agreement
(a)
on October 28, 2016 and part of the Refinancing Facilities
(a)
.
The Company’s long term debt facilities consisted of the following as of June 30, 2016:
|
Facility
|
Maturity Date
|
Borrowing Capacity (in millions)
|
Interest Rate Terms
|
Applicable Interest Rate Spread as of
June 30, 2016
|
Debt Discount
|
Repayment Schedule
|
||||||
|
Coty Revolving Credit Facility
(a)
|
October 2020
|
$1,500.0
|
LIBOR
(a)
plus a margin ranging from 1.00% to 2.00% per annum or a base rate plus a margin ranging from 0.00% to 1.00% per annum, based on the Company’s total net leverage ratio
(c) (d)
(f)
|
1.75%
|
N/A
(b)
|
Payable in full at maturity date
|
||||||
|
Coty Term Loan A Facility
(a)
- USD Portion |
October 2020
|
$1,750.0
|
LIBOR
(a)
plus a margin ranging from 1.00% to 2.00% per annum or a base rate plus a margin ranging from 0.00% to 1.00% per annum, based on the Company’s total net leverage ratio
(c)
(f)
|
1.75%
|
N/A
(b)
|
Quarterly repayments beginning June 30, 2016 at 1.25% of original principal amount
|
||||||
|
Coty Term Loan A Facility
(a)
- Euro Portion |
October 2020
|
€140.0
|
EURIBOR
(a)
plus a margin of 1.00% to 2.00% per annum, based on the Company’s total net leverage ratio
(c)
(f)
|
1.75%
|
N/A
(b)
|
Quarterly repayments beginning September 30, 2016 at 1.25% of original principal amount
|
||||||
|
Coty Term Loan B Facility
(a)
- USD portion |
October 2022
|
$500.0
|
LIBOR
(a)
(subject to a 0.75% floor) plus a margin of 3.00% or a base rate (subject to a 1.75% floor), plus a margin of 2.00%
(f)
|
3.00%
|
0.50%
|
Quarterly repayments beginning June 30, 2016 at 0.25% of original principal amount
|
||||||
|
Coty Term Loan B Facility
(a)
- Euro portion |
October 2022
|
€990.0
(e)
|
EURIBOR
(a)
(subject to a 0.75% floor) plus a margin of 2.75%
|
2.75%
|
0.50%
|
Quarterly repayments beginning June 30, 2016 at 0.25% of original principal amount
(e)
|
||||||
(a)
As defined below.
(b)
N/A - Not Applicable.
(c)
As defined per the respective loan agreement.
(d)
Additionally the Company will pay to the Coty Revolving Credit Facility and Galleria Revolving Facility lenders an unused commitment fee calculated at a rate ranging from
0.25%
to
0.50%
per annum, based on the Company’s total net leverage ratio
(c)
. As of June 30, 2016, the applicable rate on the unused commitment fee was
0.50%
.
(e)
Includes
€665.0 million
of the Euro portion of Term Loan B originated on October 27, 2015, and the
€325.0 million
from the Incremental Term Loans, as defined below, originated on April 8, 2016. Repayments on the
€325.0 million
Incremental Term Loan B are payable quarterly beginning on September 30, 2016 at
0.25%
of the original principal amount.
(f)
The selection of the applicable interest rate for the period is at the discretion of the Company.
On October 27, 2015, the Company refinanced its long term debt facilities. The Company’s long term debt facilities that were outstanding prior to the Company’s refinancing consisted of the following as of June 30, 2015:
|
Facility
|
Maturity Date
|
Borrowing Capacity (in millions)
|
Interest Rate Terms
|
Applicable Interest Rate Spread as of
June 30, 2015 |
Debt Discount
|
Repayment Schedule
|
||||||
|
2013 Term Loan
(a)
|
March 2018
|
$1,250.0
|
LIBOR
(c)
plus a margin ranging from 0.0% to 1.75% based on the Company’s consolidated leverage ratio
(d)
|
1.50%
|
N/A
(b)
|
Quarterly repayments commence on October 1, 2016 and will total $175.0, and $875.0 in fiscal 2017, and 2018 respectively
|
||||||
|
Incremental Term Loan
(a)
|
April 2018
|
$625.0
|
LIBOR
(c)
plus a margin ranging from 0.0% to 1.75% based on the Company’s consolidated leverage ratio
(d)
|
1.50%
|
N/A
(b)
|
Payable in full on
April 2, 2018 |
||||||
|
2013 Revolving Loan Facility
(a)
|
April 2018
|
$1,250.0
|
LIBOR
(c)
plus a margin ranging from 0.15% to 0.25% based on the Company’s consolidated leverage ratio
(d)
|
1.28%
|
N/A
(b)
|
Payable in full at maturity date
|
||||||
|
2015 Credit Agreement
(a)
|
March 2018
|
$800.0
|
Applicable base rate
(c)
plus a margin ranging from 0.125% to 1.875% based on the Company’s consolidated leverage ratio
(d)
|
1.63%
|
N/A
(b)
|
Payable in full on
March 31, 2018 |
||||||
F-34
COTY INC. & SUBSIDIARIES
NOTES TO CONSOLIDATED FINANCIAL STATEMENTS
($ in millions, except per share data)
(a)
As defined below.
(b)
N/A - Not Applicable.
(c)
Applicable base rates of interest on amounts borrowed under the 2015 Credit Agreement were based on the London Interbank Offered Rate (“LIBOR”), a qualified Eurocurrency LIBOR, an alternative base rate, or a qualified local currency rate, as applicable to the borrowings.
(d)
As defined per the respective loan agreement.
Coty Credit Agreement
On October 27, 2015, the Company entered into a Credit Agreement (the “Coty Credit Agreement”) with JPMorgan Chase Bank, N.A., as administrative agent. The Coty Credit Agreement provides for senior secured credit facilities comprised of (i) a revolving credit facility in an aggregate principal amount up to
$1,500.0
(the “Coty Revolving Credit Facility”), which includes up to
$80.0
in swingline loans available for short term borrowings, (ii) a
$1,750.0
term loan A facility (“Coty Term Loan A Facility”) and (iii) a term loan B facility comprising of a
$500.0
tranche and a
€665.0
million tranche (“Coty Term Loan B Facility”). The Coty Term Loan B Facility was issued at a
0.50%
discount. The proceeds of the Coty Credit Agreement were primarily used to refinance the Company’s previously existing debt, which included the 2015 Credit Agreement due March 2018 and facilities under the Coty Inc. Credit Facility (together, the “Prior Coty Inc. Credit Facilities”).
On April 8, 2016, the Company entered into an Incremental Assumption Agreement and Amendment No. 1 (the “Incremental Credit Agreement”) to the Coty Credit Agreement. The Incremental Credit Agreement provides for an additional
€140.0 million
in commitments under the Coty Term Loan A Facility and an additional
€325.0 million
in commitments under the Coty Term Loan B Facility of the Coty Credit Agreement (the “Incremental Term Loans”). The proceeds of the Incremental Term Loans were used to partially repay outstanding balances under the Revolving Credit Facility. The terms of the
€140.0 million
and
€325.0 million
portions of the Incremental Term Loans are substantially the same as the respective existing Coty Term Loan A Facility and Euro denominated portion of the Coty Term Loan B Facility.
On October 28, 2016, the Company entered into an Incremental Assumption Agreement and Refinancing Amendment (the “Incremental and Refinancing Agreement”), which amended the Coty Credit Agreement. The Incremental and Refinancing Agreement provides for: (i) an additional Coty Term Loan A Facility in aggregate principal amount of
$975.0
in commitments (the “Incremental Term A Facility”), (ii) an additional Coty Term Loan B Facility in aggregate principal amount of
$100.0
in commitments (the “Incremental Term B Facility”) and (iii) a refinancing of the previously existing USD and Euro denominated Coty Term Loan B Facility loans (the “Refinancing Facilities”) under the Coty Credit Agreement.
The loans made under the Incremental Term A Facility have terms that are substantially identical to the existing Coty Term Loan A Facility except that the loans will mature on the date that is
five
years after October 28, 2016. The loans under the Incremental Term B Facility and the Refinancing Facilities have substantially identical terms as the term B loans existing under the Coty Credit Agreement prior to effectiveness of the Incremental and Refinancing Agreement, except that, among other things: (i) the interest rate with respect to the USD denominated tranche of the Refinancing Facilities and the Incremental Term B Facility will be, at the Company’s option, either the London Interbank Offered Rate (“LIBOR”) plus an applicable margin of
2.50%
or an alternate base rate (“ABR”) equal to the highest of (1) JPMorgan Chase Bank N.A.’s prime rate, (2) the federal funds rate plus
0.50%
and (3) one-month LIBOR plus
1.00%
, in each case plus an applicable margin of
1.50%
and (ii) the LIBOR floor with respect to the LIBOR loans under the Incremental Term B Facility and the Refinancing Facilities is
0.00%
.
The Company recognized
$13.0
of deferred debt issuance costs in connection with the Incremental and Refinancing Agreement.
The Coty Credit Agreement is guaranteed by Coty Inc.’s wholly-owned domestic subsidiaries and secured by a first priority lien on substantially all of Coty Inc. and its wholly-owned domestic subsidiaries’ assets, in each case subject to certain carve outs and exceptions.
Galleria Credit Agreement
On October 1, 2016, at the closing of the P&G Beauty Business acquisition, the Company assumed the debt facilities available under the Galleria Credit Agreement (the “Galleria Credit Agreement”), which was initially entered into by Galleria on January 26, 2016. The Galleria Credit Agreement provides for the senior secured credit facilities comprised of (i) a
$2,000.0
five
year term loan A facility (“Galleria Term Loan A Facility”), (ii) a
$1,000.0
seven
year term loan B facility (“Galleria Term Loan B Facility”) and (iii) a
$1,500.0
five
year revolving credit facility (“Galleria Revolving Facility”). The Galleria Term Loan B Facility was issued at a
0.5%
discount. In connection with the closing of the P&G Beauty Business acquisition, the Company assumed
$1,941.8
of aggregate debt outstanding consisting of
$944.3
Galleria Term Loan A Facility,
$995.0
Galleria Term Loan B Facility, net of a discount and
$0.0
outstanding under the Galleria Revolving Facility, as well as
$2.5
in assumed fees payable. At the closing of the P&G Beauty Business acquisition, the remaining unused loan commitments for the Galleria Term Loan A Facility expired.
F-35
COTY INC. & SUBSIDIARIES
NOTES TO CONSOLIDATED FINANCIAL STATEMENTS
($ in millions, except per share data)
The Company recognized
$11.4
of deferred debt issuance costs in connection with the Galleria Credit Agreement.
The Galleria Credit Agreement is guaranteed by Coty Inc. and its wholly-owned domestic subsidiaries (other than Galleria) and secured by a first priority lien on substantially all of Coty Inc. and its wholly-owned domestic subsidiaries’ assets, in each case subject to certain carve outs and exceptions.
Scheduled Amortization
Beginning in the second quarter of fiscal 2018 and ending at maturity, the Company will make quarterly repayments of
1.25%
and
0.25%
of the initial aggregate Galleria Term Loan A Facility and Galleria Term Loan B Facility, respectively. The remaining balance of the initial aggregate Galleria Term Loan A Facility and Galleria Term Loan B Facility amount will be payable on the maturity date for each facility, respectively.
Prior Coty Inc. Credit Facilities
2015 Credit Agreement
On March 24, 2015, the Company entered into a Credit Agreement (the “2015 Credit Agreement”) with JPMorgan Chase Bank, N.A., as administrative agent, and Bank of America, N.A., BNP Paribas, Crédit Agricole Corporate & Investment Bank, ING Bank, N.V., Morgan Stanley MUFG Loan Partners, LLC and Wells Fargo Bank, N.A., as syndication agents. The 2015 Credit Agreement provided for a term loan of
$800.0
(the “2015 Term Loan”) payable in full on March 31, 2018.
Coty Inc. Credit Facility
On June 25, 2014, the Company entered into an Incremental Term Loan Amendment (the “Incremental Amendment”) to the 2013 Credit Agreement. The 2014 Incremental Amendment provided for an incremental term loan of
$625.0
(the “Incremental Term Loan”), which had substantially the same terms and conditions as the 2013 Term Loan, except with respect to principal repayments.
On April 2, 2013, the Company refinanced its then-existing credit facility by entering into a Credit Agreement (the “2013 Credit Agreement”), with JP Morgan Chase Bank, N.A. as administrative agent and Bank of America, N.A., BNP Paribas, Crédit Agricole Corporate & Investment Bank, Deutsche Bank Securities Inc., ING Bank N.V., Morgan Stanley MUFG Loan Partners, LLC and Wells Fargo Bank, N.A., as syndication agents. The 2013 Credit Agreement provided a term loan of
$1,250.0
(the “2013 Term Loan”), which would have expired on March 31, 2018. The 2013 Credit Agreement additionally provided a revolving loan facility of
$1,250.0
(the “Revolving Loan Facility”), which would have expired on April 2, 2018, which provided for up to
$80.0
in swingline loans.
Deferred Financing Fees
For the fiscal years ended
June 30, 2017, 2016 and 2015
, the Company recognized deferred financing fees of
$24.4
,
$59.0
, and
$11.2
, respectively. For the fiscal years ended
June 30, 2017, 2016 and 2015
, the Company wrote-off deferred financing fees of
$0.0
,
$3.1
, and
$5.1
, respectively, of which
$3.1
and
$4.2
in fiscal 2016 and 2015, respectively, were recorded to Loss on early extinguishment of debt in the Consolidated Statement of Operations. The remaining
$0.9
of the fees written off in fiscal 2015 was recorded to Interest expense in the Consolidated Statement of Operations. As of
June 30, 2017
and
2016
, the Company had deferred financing fees of
$4.2
and
$0.0
recorded in Other noncurrent assets on the Company’s Consolidated Balance Sheet.
Interest
The Coty Credit Agreement and Galleria Credit Agreement facilities will bear interest at rates equal to, at the Company’s option, either:
|
•
|
the LIBOR of the applicable qualified currency plus the applicable margin; or
|
|
•
|
ABR plus the applicable margin.
|
In the case of the Coty Revolving Credit Facility, Coty Term Loan A Facilities, Galleria Revolving Facility and Galleria Term Loan A Facility, the applicable margin means a percentage per annum to be determined in accordance with a leverage-based pricing grid below:
F-36
COTY INC. & SUBSIDIARIES
NOTES TO CONSOLIDATED FINANCIAL STATEMENTS
($ in millions, except per share data)
|
Pricing Tier
|
Total Net Leverage Ratio:
|
LIBOR plus:
|
Alternative Base Rate Margin:
|
|||
|
1.0
|
Greater than or equal to 5.00:1
|
2.000%
|
1.000%
|
|||
|
2.0
|
Less than 5.00:1 but greater than or equal to 4.00:1
|
1.750%
|
0.750%
|
|||
|
3.0
|
Less than 4.00:1 but greater than or equal to 2.75:1
|
1.500%
|
0.500%
|
|||
|
4.0
|
Less than 2.75:1 but greater than or equal to 2.00:1
|
1.250%
|
0.250%
|
|||
|
5.0
|
Less than 2.00:1 but greater than or equal to 1.50:1
|
1.125%
|
0.125%
|
|||
|
6.0
|
Less than 1.50:1
|
1.000%
|
—%
|
|||
In the case of the USD portion of the Coty Term Loan B Facility, the applicable margin means
2.50%
per annum, in the case of LIBOR loans, and
2.00%
per annum, in the case of ABR loans. In the case of the Euro portion of the Coty Term Loan B Facility, the applicable margin means
2.75%
per annum, in the case of EURIBOR loans. In the case of the Galleria Term Loan B Facility, the applicable margin means
3.00%
per annum, in the case of LIBOR loans, and
2.00%
per annum, in the case of ABR loans. With respect to the Galleria Term Loan B Facility, in no event will (i) LIBOR be deemed to be less than
0.75%
per annum and (ii) ABR be deemed to be less than
1.75%
per annum.
Interest is payable quarterly or on the last day of the interest period applicable to borrowings under the Company’s long-term debt facilities. For fiscal
2017
, the weighted-average interest rates for the Revolving Credit Facility, Term Loan A Facility, and Term Loan B Facility under the Coty Credit Agreement collectively were
2.43%
,
2.45%
and
3.15%
, respectively. For fiscal
2017
, the weighted-average interest rates for the Revolving Credit Facility, Term Loan A Facility, and Term Loan B Facility under the Galleria Credit Agreement collectively were
2.06%
,
2.42%
and
3.86%
, respectively.
With respect to the Prior Coty Inc. Credit Facilities, the weighted-average interest rates on the Company’s 2015 Term Loan, Incremental Term Loan and the 2013 Term Loan collectively were
1.77%
and
1.70%
in fiscal
2016
, and
2015
, respectively. The weighted-average interest rates on the Company’s 2013 Revolving Loan Facility were
1.67%
and
1.40%
in fiscal
2016
, and
2015
.
Senior Notes
On September 29, 2014, the Company prepaid the Senior Notes as defined below. The prepayment included the principal amount of Senior Notes of
$500.0
, accrued interest of
$8.0
and a make-whole amount of
$84.6
. In connection with the prepayment, the Company incurred a loss on early extinguishment of debt of
$88.8
, which included the make-whole amount and the write-off of
$4.2
of deferred financing fees related to the Senior Notes.
On June 16, 2010, the Company issued
$500.0
of Senior Secured Notes (the “Senior Notes”) in
three
series in a private placement transaction: (i)
$100.0
in aggregate principal amount of
5.12%
Series A Senior Secured Notes due June 16, 2017, (ii)
$225.0
in aggregate principal amount of
5.67%
Series B Senior Secured Notes due June 16, 2020 and (iii)
$175.0
in aggregate principal amount of
5.82%
Series C Senior Secured Notes due June 16, 2022.
Fair Value of Debt
|
June 30, 2017
|
June 30, 2016
|
||||||||||||||
|
Carrying
Amount |
Fair
Value |
Carrying
Amount |
Fair
Value |
||||||||||||
|
Galleria Credit Agreement
|
$
|
1,944.3
|
|
$
|
1,944.0
|
|
$
|
—
|
|
$
|
—
|
|
|||
|
Coty Credit Agreement
|
5,265.9
|
|
5,275.4
|
|
4,149.6
|
|
4,106.9
|
|
|||||||
The Company uses the market approach to value the Coty Credit Agreement and the Galleria Credit Agreement. The Company obtains fair values from independent pricing services to determine the fair value of these debt instruments. Based on the assumptions used to value these liabilities at fair value, these debt instruments are categorized a Level 2 in the fair value hierarchy.
F-37
COTY INC. & SUBSIDIARIES
NOTES TO CONSOLIDATED FINANCIAL STATEMENTS
($ in millions, except per share data)
Debt Maturities Schedule
Aggregate maturities of all long-term debt, including current portion of long-term debt and excluding capital lease obligations as of June 30,
2017
, are presented below:
|
Fiscal Year Ending June 30,
|
|||
|
2018
|
$
|
204.4
|
|
|
2019
|
218.8
|
|
|
|
2020
|
218.8
|
|
|
|
2021
|
2,439.5
|
|
|
|
2022
|
1,550.2
|
|
|
|
Thereafter
|
2,578.5
|
|
|
|
Total
|
$
|
7,210.2
|
|
Debt Covenants
The Company is required to comply with certain affirmative and negative covenants contained within the Coty Credit Agreement and the Galleria Credit Agreement (collectively the “Debt Agreements”). With certain exceptions as described below, the Debt Agreements include a financial covenant that requires the Company to maintain a Total Net Leverage Ratio (as defined below), equal to or less than the ratios shown below for each respective test period.
|
Test Period Ending
|
Total Net Leverage Ratio
(a)
|
|
September 30, 2017
|
5.00 to 1.00
|
|
December 31, 2017
|
5.00 to 1.00
|
|
March 31, 2018
|
4.75 to 1.00
|
|
June 30, 2018
|
4.75 to 1.00
|
|
September 30, 2018
|
4.50 to 1.00
|
|
December 31, 2018
|
4.50 to 1.00
|
|
March 31, 2019
|
4.25 to 1.00
|
|
June 30, 2019
|
4.25 to 1.00
|
|
September 30, 2019
|
4.00 to 1.00
|
|
December 31, 2019
|
4.00 to 1.00
|
|
March 31, 2020
|
4.00 to 1.00
|
|
June 30, 2020
|
4.00 to 1.00
|
|
September 30, 2020
|
4.00 to 1.00
|
(a)
Total Net Leverage Ratio means, as of any date of determination, the ratio of: (a) (i) Total Indebtedness minus (ii) unrestricted cash and Cash Equivalents of the Parent Borrower and its Restricted Subsidiaries as determined in accordance with GAAP to (b) Adjusted EBITDA for the most recently ended Test Period (each of the defined terms used within the definition of Total Net Leverage Ratio have the meanings ascribed to them within the Debt Agreements).
In the four fiscal quarters following the closing of any Material Acquisition (as defined in the Debt Agreements), including the fiscal quarter in which such Material Acquisition occurs, the maximum Total Net Leverage Ratio shall be the lesser of (i)
5.95
to 1.00 and (ii)
1.00
higher than the otherwise applicable maximum Total Net Leverage Ratio for such quarter (as set forth in the table above). Immediately after any such four fiscal quarter period, there shall be at least two consecutive fiscal quarters during which the Company's Total Net Leverage Ratio is no greater than the maximum Total Net Leverage Ratio that would otherwise have been required in the absence of such Material Acquisition, regardless of whether any additional Material Acquisitions are consummated during such period. As of
June 30, 2017
, the Company was in compliance with all covenants contained within the Debt Agreements.
14
. LEASE COMMITMENTS
F-38
COTY INC. & SUBSIDIARIES
NOTES TO CONSOLIDATED FINANCIAL STATEMENTS
($ in millions, except per share data)
The Company has various buildings and equipment under leasing arrangements. The leases generally provide for payment of additional rent based upon increases in items such as real estate taxes and insurance. Certain lease agreements have renewal options for periods typically ranging between
one
and
nine years
. Certain lease agreements have escalation clauses for rent, which have been straight-lined over the life of the respective lease agreements. The minimum rental lease commitments for non-cancellable operating leases as of June 30,
2017
are presented below:
|
Fiscal Year Ending June 30,
|
|
||
|
2018
|
$
|
126.1
|
|
|
2019
|
114.3
|
|
|
|
2020
|
98.3
|
|
|
|
2021
|
82.2
|
|
|
|
2022
|
73.7
|
|
|
|
Thereafter
|
290.4
|
|
|
|
785.0
|
|
||
|
Less: sublease income
|
(30.2
|
)
|
|
|
Total minimum payments required
|
$
|
754.8
|
|
The Company incurred rent expense of
$166.1
,
$82.5
and
$87.1
relating to operating leases in fiscal
2017
,
2016
and
2015
, respectively. The Company collected payments from sub-lessors relating to facilities no longer in use by the Company of
$6.0
,
$5.4
and
$4.3
for fiscal
2017
,
2016
and
2015
, respectively. Included in rent expense are estimated net future minimum lease payments (recoveries) and related costs for facilities no longer used in operations of
$9.2
,
nil
and
$(0.7)
for fiscal
2017
,
2016
and
2015
, respectively.
15
. INCOME TAXES
(Loss) income from operations before income taxes in fiscal
2017
,
2016
and
2015
is presented below:
|
Year Ended June 30,
|
|||||||||||
|
|
2017
|
2016
|
2015
|
||||||||
|
United States
|
$
|
(524.8
|
)
|
$
|
(153.6
|
)
|
$
|
(173.7
|
)
|
||
|
Foreign
|
(133.2
|
)
|
292.4
|
|
407.0
|
|
|||||
|
Total
|
$
|
(658.0
|
)
|
$
|
138.8
|
|
$
|
233.3
|
|
||
The components of the Company’s total (benefit) provision for income taxes during fiscal
2017
,
2016
and
2015
are presented below:
|
Year Ended June 30,
|
|||||||||||
|
|
2017
|
2016
|
2015
|
||||||||
|
(Benefit) provision for income taxes:
|
|
|
|
||||||||
|
Current:
|
|
|
|
||||||||
|
Federal
|
$
|
0.4
|
|
$
|
(30.0
|
)
|
$
|
3.7
|
|
||
|
State and local
|
1.1
|
|
(2.7
|
)
|
3.3
|
|
|||||
|
Foreign
|
129.0
|
|
131.5
|
|
54.1
|
|
|||||
|
Total
|
130.5
|
|
98.8
|
|
61.1
|
|
|||||
|
Deferred:
|
|
|
|
||||||||
|
Federal
|
(256.9
|
)
|
(91.7
|
)
|
(71.0
|
)
|
|||||
|
State and local
|
(24.2
|
)
|
(9.9
|
)
|
(12.0
|
)
|
|||||
|
Foreign
|
(108.9
|
)
|
(37.6
|
)
|
(4.2
|
)
|
|||||
|
Total
|
(390.0
|
)
|
(139.2
|
)
|
(87.2
|
)
|
|||||
|
Benefit for income taxes
|
$
|
(259.5
|
)
|
$
|
(40.4
|
)
|
$
|
(26.1
|
)
|
||
During the second quarter of fiscal 2017, the Company released a valuation allowance in the U.S. as a result of the P&G Beauty Business acquisition of
$111.2
.
COTY INC. & SUBSIDIARIES
NOTES TO CONSOLIDATED FINANCIAL STATEMENTS
($ in millions, except per share data)
During the first quarter of fiscal 2016, the Company reached final settlement with the IRS in connection with the 2004–2012 examination periods. The settlement primarily relates to the acquisition of the Calvin Klein fragrance business. In connection with the settlement, the Company recognized a tax benefit of approximately
$194.4
of which
$164.7
was mainly due to the recognition of additional deferred tax assets related to the basis of the Calvin Klein trademark, and approximately
$29.7
resulted from the reduction of gross unrecognized tax benefits. Of the
$194.4
tax benefit,
$111.2
was offset by a valuation allowance due to on-going operating losses in the U.S.
During fiscal 2015, the Company transferred certain international intellectual property rights to its wholly-owned subsidiary in Switzerland in order to align the Company’s ownership of these international intellectual property rights with its global operations. Although the transfer of foreign intellectual property rights between consolidated entities did not result in any gain in the consolidated results of operations, the Company generated a taxable gain in the U.S. that was offset by net operating loss carryforwards. Income taxes incurred related to the intercompany transactions are treated as a prepaid income tax in the Company’s consolidated balance sheet and amortized to income tax expense over the life of the intellectual property. For the fiscal years ending June 30,
2017
and
2016
, the prepaid income taxes of
$7.6
and
$7.6
, respectively, are included in Prepaid expenses and other current assets and
$128.2
and
$135.8
, respectively, are included in Other noncurrent assets in the Consolidated Balance Sheets. The prepaid income taxes are amortized as a component of income tax expense over
twenty years
.
The reconciliation of the U.S. Federal statutory tax rate to the Company’s effective income tax rate during fiscal
2017
,
2016
and
2015
is presented below:
|
Year Ended June 30,
|
|||||||||||
|
|
2017
|
2016
|
2015
|
||||||||
|
Income (loss) before income taxes
|
$
|
(658.0
|
)
|
$
|
138.8
|
|
$
|
233.3
|
|
||
|
(Benefit) provision for income taxes at statutory rate
|
$
|
(230.3
|
)
|
$
|
48.5
|
|
$
|
81.7
|
|
||
|
State and local taxes—net of federal benefit
|
(15.0
|
)
|
(8.3
|
)
|
(5.6
|
)
|
|||||
|
Foreign tax differentials
|
53.3
|
|
(50.8
|
)
|
(74.4
|
)
|
|||||
|
Change in valuation allowances
|
(108.2
|
)
|
(7.6
|
)
|
(6.6
|
)
|
|||||
|
Change in unrecognized tax benefit
|
25.6
|
|
45.8
|
|
(16.0
|
)
|
|||||
|
U.S. audit settlement, net
|
—
|
|
(83.2
|
)
|
(19.2
|
)
|
|||||
|
Permanent differences—net
|
1.2
|
|
4.7
|
|
10.6
|
|
|||||
|
Amortization on intercompany sale
|
5.7
|
|
5.7
|
|
—
|
|
|||||
|
Other
|
8.2
|
|
4.8
|
|
3.4
|
|
|||||
|
(Benefit) provision for income taxes
|
$
|
(259.5
|
)
|
$
|
(40.4
|
)
|
$
|
(26.1
|
)
|
||
|
Effective income tax rate
|
39.4
|
%
|
(29.1
|
)%
|
(11.2
|
)%
|
|||||
Significant components of deferred income tax assets and liabilities as of June 30,
2017
and
2016
are presented below:
F-40
COTY INC. & SUBSIDIARIES
NOTES TO CONSOLIDATED FINANCIAL STATEMENTS
($ in millions, except per share data)
|
|
June 30,
2017 |
June 30,
2016 |
|||||
|
Deferred income tax assets:
|
|
|
|||||
|
Inventories
|
$
|
11.7
|
|
$
|
19.3
|
|
|
|
Accruals and allowances
|
108.8
|
|
53.0
|
|
|||
|
Sales returns
|
14.8
|
|
13.6
|
|
|||
|
Share-based compensation
|
14.2
|
|
14.6
|
|
|||
|
Employee benefits
|
141.2
|
|
64.8
|
|
|||
|
Net operating loss carry forwards and tax credits
|
436.9
|
|
237.7
|
|
|||
|
Other
|
40.7
|
|
23.8
|
|
|||
|
Less: valuation allowances
|
(60.3
|
)
|
(179.2
|
)
|
|||
|
Net deferred income tax assets
|
708.0
|
|
247.6
|
|
|||
|
Deferred income tax liabilities:
|
|
|
|||||
|
Intangible assets
|
1,420.9
|
|
367.3
|
|
|||
|
Property, plant and equipment
|
44.1
|
|
19.0
|
|
|||
|
Unrealized gain
|
44.0
|
|
49.1
|
|
|||
|
Licensing rights
|
30.4
|
|
26.6
|
|
|||
|
Other
|
20.9
|
|
3.5
|
|
|||
|
Deferred income tax liabilities
|
1,560.3
|
|
465.5
|
|
|||
|
Net deferred income tax liabilities
|
$
|
(852.3
|
)
|
$
|
(217.9
|
)
|
|
Deferred tax assets relating to tax benefits of stock-based compensation have been reduced to reflect exercises of stock options to the extent recognized for financial statement purposes. Some exercises resulted in tax deductions in excess of previously recorded benefits at the time of grant. These excess tax benefits are not recognized in the deferred tax balances until the deductions reduce taxes payable. Accordingly, there is an additional
$12.0
of net operating losses which are not reflected as part of the net deferred tax assets.
The expirations of tax loss carry forwards, amounting to
$1,327.6
as of June 30,
2017
, in each of the fiscal years ending June 30, are presented below:
|
Fiscal Year Ending June 30,
|
United States
|
|
Western Europe
|
|
Rest of World
|
|
Total
|
||||||||
|
2018
|
$
|
—
|
|
$
|
—
|
|
$
|
48.6
|
|
$
|
48.6
|
|
|||
|
2019
|
—
|
|
—
|
|
14.7
|
|
14.7
|
|
|||||||
|
2020
|
—
|
|
—
|
|
74.9
|
|
74.9
|
|
|||||||
|
2021
|
—
|
|
0.8
|
|
12.0
|
|
12.8
|
|
|||||||
|
2022 and thereafter
|
813.5
|
|
239.8
|
|
123.3
|
|
1,176.6
|
|
|||||||
|
Total
|
$
|
813.5
|
|
$
|
240.6
|
|
$
|
273.5
|
|
$
|
1,327.6
|
|
|||
The total valuation allowances recorded are
$60.3
and
$179.2
as of June 30,
2017
and
2016
, respectively. In fiscal
2017
, the change in the valuation allowance was due primarily to a release in the U.S.
F-41
COTY INC. & SUBSIDIARIES
NOTES TO CONSOLIDATED FINANCIAL STATEMENTS
($ in millions, except per share data)
A reconciliation of the beginning and ending amount of UTBs is presented below:
|
Year Ended June 30,
|
|||||||||||
|
2017
|
2016
|
2015
|
|||||||||
|
UTBs—July 1
|
$
|
228.9
|
|
$
|
342.6
|
|
$
|
400.5
|
|
||
|
Additions based on tax positions related to the current year
|
43.6
|
|
60.4
|
|
51.6
|
|
|||||
|
Additions for tax positions of prior years
|
0.4
|
|
—
|
|
6.4
|
|
|||||
|
Reductions for tax positions of prior years
|
—
|
|
(70.5
|
)
|
(60.3
|
)
|
|||||
|
Settlements
|
(1.5
|
)
|
(72.7
|
)
|
(29.7
|
)
|
|||||
|
Lapses in statutes of limitations
|
(13.2
|
)
|
(37.9
|
)
|
(14.2
|
)
|
|||||
|
Foreign currency translation
|
(0.3
|
)
|
7.0
|
|
(11.7
|
)
|
|||||
|
UTBs—June 30
|
$
|
257.9
|
|
$
|
228.9
|
|
$
|
342.6
|
|
||
As of June 30,
2017
, the Company had
$257.9
of UTBs of which
$243.1
represents the amount that, if recognized, would impact the effective income tax rate in future periods. As of June 30,
2017
and
2016
, the liability associated with UTBs, including accrued interest and penalties, is
$154.6
and
$131.9
, respectively, which is recorded in Income and other taxes payable and Other non-current liabilities in the Consolidated Balance Sheets.
During fiscal
2017
, the Company accrued interest of
$1.4
, while in fiscal
2016
and
2015
the Company accrued and released interest of
$1.2
and
$(4.4)
, respectively. During fiscal
2017
, the Company accrued penalty of
$0.1
, while in fiscal
2016
and
2015
the Company accrued and released penalty of
$0.1
and
$(1.0)
, respectively. The total gross accrued interest and penalties recorded in the Other noncurrent liabilities in the Consolidated Balance Sheets related to UTBs as of June 30,
2017
and
2016
is
$11.7
and
$9.9
, respectively.
The Company is present in approximately
55
tax jurisdictions, and at any point in time is subject to several audits at various stages of completion. As a result, the Company evaluates tax positions and establishes liabilities for UTBs that may be challenged by local authorities and may not be fully sustained, despite a belief that the underlying tax positions are fully supportable. UTBs are reviewed on an ongoing basis and are adjusted in light of changing facts and circumstances, including progress of tax audits, developments in case law, and closing of statute of limitations. Such adjustments are reflected in the provision for income taxes as appropriate. In fiscal
2017
and
2016
, the Company recognized a tax benefit of
$12.3
and
$51.4
respectively associated with the settlement of tax audits in multiple jurisdictions and the expiration of foreign and state statutes of limitation. The Company has open tax years ranging from 2009 and forward.
On the basis of information available at
June 30, 2017
, it is reasonably possible that a decrease of up to
$10.1
in UTBs related to U.S. and foreign exposures may be necessary within the coming year. It is also possible the ongoing audits by tax authorities may result in increases or decreases to the balance of UTBs. Since it is common practice to extend audits beyond the Statute of Limitations, the Company is unable to predict the timing or conclusion of these audits and, accordingly, the Company is unable to estimate the amount of changes to the balance of UTBs that are reasonably possible at this time. However, the Company believes it has adequately provided for its UTBs for all open tax years in each tax jurisdiction.
It is the Company’s intention to permanently reinvest undistributed earnings and income from the Company’s foreign operations that have been generated through
June 30, 2017
, except where we are able to repatriate these earnings to the U.S. without material incremental tax expenditures. Accordingly, no provision has been made for U.S. income taxes on the remaining undistributed earnings of foreign subsidiaries as of
June 30, 2017
. Cumulative undistributed earnings of non-U.S. subsidiaries was
$2,412.7
as of
June 30, 2017
. It is not practicable for the Company to determine the amount of additional income and withholding taxes that may be payable in the event the undistributed earnings are repatriated.
F-42
COTY INC. & SUBSIDIARIES
NOTES TO CONSOLIDATED FINANCIAL STATEMENTS
($ in millions, except per share data)
16
. INTEREST EXPENSE, NET
Interest expense, net for the years ended June 30,
2017
,
2016
and
2015
is presented below:
|
Year Ended June 30,
|
|||||||||||
|
2017
|
2016
|
2015
|
|||||||||
|
Interest expense
|
$
|
219.6
|
|
$
|
112.9
|
|
$
|
71.4
|
|
||
|
Foreign exchange (gain) losses, net of derivative contracts
(a)
|
3.4
|
|
(26.9
|
)
|
4.1
|
|
|||||
|
Deferred financing fees write-off
|
—
|
|
—
|
|
0.9
|
|
|||||
|
Interest income
|
(4.4
|
)
|
(4.1
|
)
|
(3.4
|
)
|
|||||
|
Total interest expense, net
|
$
|
218.6
|
|
$
|
81.9
|
|
$
|
73.0
|
|
||
(a)
During the second quarter of fiscal 2016, the Company recorded a gain of
$11.1
related to short-term forward contracts to exchange Euros for U.S. Dollars related to the Euro tranche of debt issued during the quarter. These short-term forward contracts were entered into to facilitate the repayment of the Company’s then existing U.S. Dollar denominated term loans as part of the debt refinancing discussed in Note
13
—
Debt. Fluctuations in exchange rates between the dates the short-term forward contracts were entered into and the settlement date resulted in a gain upon settlement of
$11.1
included within total Interest expense, net for the fiscal year end June 30, 2016 in the Company’s Consolidated Statements of Operations.
17
. EMPLOYEE BENEFIT PLANS
Savings and Retirement Plans
- The Company’s Savings and Retirement Plans include a U.S. defined contribution plan for employees primarily in the U.S. and international savings plans for employees in certain other countries. In the U.S., hourly and salary based employees are eligible to participate in the plan after
90
days of service and the Company matches
100%
of employee contributions up to
6.0%
of employee compensation. In addition, the Company makes contributions to the plan on behalf of employees determined by their age and compensation.
During fiscal
2017
,
2016
and
2015
, the defined contribution expense for the U.S. defined contribution plan was
$20.6
,
$12.7
and
$12.2
, respectively, and the defined contribution expense for the international savings plans was
$13.3
,
$5.7
and
$10.7
, respectively.
Pension Plans
- The Company sponsors contributory and noncontributory defined benefit pension plans covering certain U.S. and international employees primarily in Austria, France, Germany, the Netherlands, Spain and Switzerland. Participants in the U.S. defined benefit pension plan no longer accrue benefits. The Company measures defined benefit plan assets and obligations as of the date of the Company’s fiscal year-end. The Company’s defined benefit pension plans are funded primarily through contributions from the Company after consideration of recommendations from the pension plans’ independent actuaries and are funded at levels sufficient to comply with local requirements.
U.S. Del Laboratories, Inc. Pension Plan Settlement
The Company settled obligations to U.S. Del Laboratories, Inc. pension plan (the “Plan”) participants during the first and second quarters of fiscal year 2017 resulting in the recognition of pre-tax settlement losses of
$15.9
, included in Selling, general and administrative expenses in the Consolidated Statement of Operations for the
year ended June 30, 2017
. The settlement occurred in
two
phases as described below. In the first phase, lump sum payments were made to a group of plan participants and the Company recognized a pre-tax settlement loss of
$3.1
due to accelerated recognition of losses previously deferred within accumulated other comprehensive loss. In the second phase, the Company transferred the remainder of the Plan’s obligation to a third-party insurance company by purchasing annuity contracts. The settlement was facilitated by a cash contribution of
$8.8
followed by liquidation of the Plan’s assets totaling
$47.0
at the settlement date. As a result of this transaction the Company recognized a pre-tax settlement loss of
$12.8
, due to accelerated recognition of losses previously deferred within accumulated other comprehensive loss.
As of December 31, 2016, the Plan had been fully terminated as a result of these actions.
Additionally during fiscal year 2017, the Company recognized a curtailment gain of
$1.8
in connection with involuntary employee terminations as part of the Acquisition Integration Program, which significantly reduced the expected years of future service of employees within one of the Company’s international pension plans. The curtailment gain is included in Restructuring costs in the Company’s Consolidated Statements of Operations for the
year ended June 30, 2017
. Refer to Note
6
—Restructuring Costs for further information about the Acquisition Integration Program.
F-43
COTY INC. & SUBSIDIARIES
NOTES TO CONSOLIDATED FINANCIAL STATEMENTS
($ in millions, except per share data)
P&G Beauty Business Employee Benefit Plans
In connection with the P&G Beauty Business acquisition, the Company assumed certain international pension and other post-employment benefit plan obligations and assets. The assumed benefit plans resulted in liabilities of
$404.1
, representing the aggregate funded status of these plans as of the date of acquisition.
As part of Global Integration Activities initiated during fiscal 2017, we concluded that our restructuring actions resulted in a significant reduction of future services of active employees primarily in our Non-US pension plans. As a result, we recognized net settlement and curtailment gains of
$0.4
and
$0.4
, respectively, in restructuring costs during fiscal 2017. See Note
6
—Restructuring Costs for more information.
Other Post-Employment Benefit Plans
(“OPEB”)
- The Company provides certain post-employment health and life insurance benefits for certain employees and spouses principally in the U.S., France, and Canada if certain age and service requirements are met. Estimated benefits to be paid by the Company are expensed over the service period of each employee based on calculations performed by an independent actuary. In addition, the Company has a supplemental retirement plan and a termination benefit plan for selected salaried employees.
The aggregate reconciliation of the projected benefit obligations, plan assets, funded status and amounts recognized in the Company’s Consolidated Financial Statements related to the Company’s pension plans and other post-employment benefit plans is presented below:
|
Pension Plans
|
Other Post-Employment Benefits
|
Total
|
|||||||||||||||||||||||||||||
|
U.S.
|
International
|
||||||||||||||||||||||||||||||
|
2017
|
2016
|
2017
|
2016
|
2017
|
2016
|
2017
|
2016
|
||||||||||||||||||||||||
|
Change in benefit obligation
|
|||||||||||||||||||||||||||||||
|
Benefit obligation—July 1
|
$
|
82.1
|
|
$
|
77.7
|
|
$
|
203.6
|
|
$
|
177.2
|
|
$
|
47.7
|
|
$
|
48.2
|
|
$
|
333.4
|
|
$
|
303.1
|
|
|||||||
|
Service cost
|
—
|
|
—
|
|
34.8
|
|
6.5
|
|
1.9
|
|
1.1
|
|
36.7
|
|
7.6
|
|
|||||||||||||||
|
Interest cost
|
1.6
|
|
3.4
|
|
6.6
|
|
3.6
|
|
1.8
|
|
1.9
|
|
10.0
|
|
8.9
|
|
|||||||||||||||
|
Plan participants’ contributions
|
—
|
|
—
|
|
15.0
|
|
2.0
|
|
0.2
|
|
0.3
|
|
15.2
|
|
2.3
|
|
|||||||||||||||
|
Benefits paid
|
(2.5
|
)
|
(3.5
|
)
|
(9.6
|
)
|
(8.6
|
)
|
(2.0
|
)
|
(3.2
|
)
|
(14.1
|
)
|
(15.3
|
)
|
|||||||||||||||
|
Premiums paid
|
—
|
|
—
|
|
(2.9
|
)
|
(0.8
|
)
|
—
|
|
—
|
|
(2.9
|
)
|
(0.8
|
)
|
|||||||||||||||
|
Pension curtailment
|
—
|
|
—
|
|
(2.2
|
)
|
—
|
|
—
|
|
(1.8
|
)
|
(2.2
|
)
|
(1.8
|
)
|
|||||||||||||||
|
Pension settlements
|
(60.2
|
)
|
—
|
|
(23.0
|
)
|
(1.7
|
)
|
—
|
|
—
|
|
(83.2
|
)
|
(1.7
|
)
|
|||||||||||||||
|
Actuarial (gain) loss
|
(2.2
|
)
|
4.5
|
|
(80.9
|
)
|
22.9
|
|
(1.4
|
)
|
1.3
|
|
(84.5
|
)
|
28.7
|
|
|||||||||||||||
|
Acquired obligations
(a)
|
—
|
|
—
|
|
557.4
|
|
5.2
|
|
15.4
|
|
—
|
|
572.8
|
|
5.2
|
|
|||||||||||||||
|
Effect of exchange rates
|
—
|
|
—
|
|
10.1
|
|
(2.7
|
)
|
0.1
|
|
(0.2
|
)
|
10.2
|
|
(2.9
|
)
|
|||||||||||||||
|
Other
|
—
|
|
—
|
|
(0.1
|
)
|
—
|
|
0.1
|
|
0.1
|
|
—
|
|
0.1
|
|
|||||||||||||||
|
Benefit obligation—June 30
|
$
|
18.8
|
|
$
|
82.1
|
|
$
|
708.8
|
|
$
|
203.6
|
|
$
|
63.8
|
|
$
|
47.7
|
|
$
|
791.4
|
|
$
|
333.4
|
|
|||||||
|
Change in plan assets
|
|||||||||||||||||||||||||||||||
|
Fair value of plan assets—July 1
|
$
|
53.2
|
|
$
|
52.2
|
|
$
|
42.4
|
|
$
|
36.6
|
|
$
|
—
|
|
$
|
—
|
|
$
|
95.6
|
|
$
|
88.8
|
|
|||||||
|
Actual return on plan assets
|
(0.8
|
)
|
3.8
|
|
10.6
|
|
1.8
|
|
—
|
|
—
|
|
9.8
|
|
5.6
|
|
|||||||||||||||
|
Employer contributions
|
10.1
|
|
0.7
|
|
29.8
|
|
9.2
|
|
1.8
|
|
2.9
|
|
41.7
|
|
12.8
|
|
|||||||||||||||
|
Plan participants’ contributions
|
—
|
|
—
|
|
15.0
|
|
2.0
|
|
0.2
|
|
0.3
|
|
15.2
|
|
2.3
|
|
|||||||||||||||
|
Benefits paid
|
(2.5
|
)
|
(3.5
|
)
|
(9.6
|
)
|
(8.6
|
)
|
(2.0
|
)
|
(3.2
|
)
|
(14.1
|
)
|
(15.3
|
)
|
|||||||||||||||
|
Premiums paid
|
—
|
|
—
|
|
(2.9
|
)
|
(0.8
|
)
|
—
|
|
—
|
|
(2.9
|
)
|
(0.8
|
)
|
|||||||||||||||
|
Plan settlements
|
(60.2
|
)
|
—
|
|
(23.0
|
)
|
(1.7
|
)
|
—
|
|
—
|
|
(83.2
|
)
|
(1.7
|
)
|
|||||||||||||||
|
Acquired plan assets
(a)
|
—
|
|
—
|
|
168.3
|
|
5.2
|
|
0.4
|
|
—
|
|
168.7
|
|
5.2
|
|
|||||||||||||||
|
Effect of exchange rates
|
—
|
|
—
|
|
3.6
|
|
(1.3
|
)
|
—
|
|
—
|
|
3.6
|
|
(1.3
|
)
|
|||||||||||||||
|
Other
|
0.2
|
|
—
|
|
—
|
|
—
|
|
—
|
|
—
|
|
0.2
|
|
—
|
|
|||||||||||||||
|
Fair value of plan assets—June 30
|
—
|
|
53.2
|
|
234.2
|
|
42.4
|
|
0.4
|
|
—
|
|
234.6
|
|
95.6
|
|
|||||||||||||||
|
Funded status—June 30
|
$
|
(18.8
|
)
|
$
|
(28.9
|
)
|
$
|
(474.6
|
)
|
$
|
(161.2
|
)
|
$
|
(63.4
|
)
|
$
|
(47.7
|
)
|
$
|
(556.8
|
)
|
$
|
(237.8
|
)
|
|||||||
F-44
COTY INC. & SUBSIDIARIES
NOTES TO CONSOLIDATED FINANCIAL STATEMENTS
($ in millions, except per share data)
(a)
As a result of the acquisition of the P&G Beauty Business, the Company acquired certain international pension plans. See Note
3
—Business Combinations for additional information.
With respect to the Company’s pension plans and other post-employment benefit plans, amounts recognized in the Company’s Consolidated Balance Sheets as of
June 30, 2017
and
2016
, are presented below:
|
Pension Plans
|
Other Post-Employment Benefits
|
Total
|
|||||||||||||||||||||||||||||
|
U.S.
|
International
|
||||||||||||||||||||||||||||||
|
2017
|
2016
|
2017
|
2016
|
2017
|
2016
|
2017
|
2016
|
||||||||||||||||||||||||
|
Noncurrent assets
|
$
|
—
|
|
$
|
—
|
|
$
|
0.5
|
|
$
|
—
|
|
$
|
—
|
|
$
|
—
|
|
$
|
0.5
|
|
$
|
—
|
|
|||||||
|
Current liabilities
|
(1.3
|
)
|
(1.3
|
)
|
(4.9
|
)
|
(4.1
|
)
|
(1.9
|
)
|
(1.8
|
)
|
(8.1
|
)
|
(7.2
|
)
|
|||||||||||||||
|
Noncurrent liabilities
|
(17.5
|
)
|
(27.6
|
)
|
(470.2
|
)
|
(157.1
|
)
|
(61.5
|
)
|
(45.9
|
)
|
(549.2
|
)
|
(230.6
|
)
|
|||||||||||||||
|
Funded status
|
(18.8
|
)
|
(28.9
|
)
|
(474.6
|
)
|
(161.2
|
)
|
(63.4
|
)
|
(47.7
|
)
|
(556.8
|
)
|
(237.8
|
)
|
|||||||||||||||
|
AOC(L)/I
|
2.5
|
|
(15.5
|
)
|
25.1
|
|
(66.7
|
)
|
23.9
|
|
28.0
|
|
51.5
|
|
(54.2
|
)
|
|||||||||||||||
|
Net amount recognized
|
$
|
(16.3
|
)
|
$
|
(44.4
|
)
|
$
|
(449.5
|
)
|
$
|
(227.9
|
)
|
$
|
(39.5
|
)
|
$
|
(19.7
|
)
|
$
|
(505.3
|
)
|
$
|
(292.0
|
)
|
|||||||
The accumulated benefit obligation for the U.S. defined benefit pension plans was
$18.8
and
$82.1
as of
June 30, 2017
and
2016
, respectively. The accumulated benefit obligation for international defined benefit pension plans was
$640.6
and
$194.4
as of
June 30, 2017
and
2016
, respectively.
Pension plans with accumulated benefit obligations in excess of plan assets and projected benefit obligations in excess of plan assets are presented below:
|
Pension plans with accumulated benefit obligations in excess of plan assets
|
Pension plans with projected benefit obligations in excess of plan assets
|
||||||||||||||||||||||||||||||
|
U.S.
|
International
|
U.S.
|
International
|
||||||||||||||||||||||||||||
|
2017
|
2016
|
2017
|
2016
|
2017
|
2016
|
2017
|
2016
|
||||||||||||||||||||||||
|
Projected benefit obligation
|
$
|
18.8
|
|
$
|
82.1
|
|
$
|
695.0
|
|
$
|
203.4
|
|
$
|
18.8
|
|
$
|
82.1
|
|
$
|
705.6
|
|
$
|
203.4
|
|
|||||||
|
Accumulated benefit obligation
|
18.8
|
|
82.1
|
|
631.6
|
|
194.4
|
|
18.8
|
|
82.1
|
|
640.6
|
|
194.4
|
|
|||||||||||||||
|
Fair value of plan assets
|
—
|
|
53.5
|
|
223.9
|
|
42.2
|
|
—
|
|
53.5
|
|
230.4
|
|
42.4
|
|
|||||||||||||||
Net Periodic Benefit Cost
The components of net periodic benefit cost for pension plans and other post-employment benefit plans recognized in the Consolidated Statements of Operations are presented below:
|
Year Ended June 30,
|
|||||||||||||||||||||||||||||||||||||||||||||||
|
Pension Plans
|
Other Post-
Employment Benefits
|
||||||||||||||||||||||||||||||||||||||||||||||
|
U.S.
|
International
|
Total
|
|||||||||||||||||||||||||||||||||||||||||||||
|
2017
|
2016
|
2015
|
2017
|
2016
|
2015
|
2017
|
2016
|
2015
|
2017
|
2016
|
2015
|
||||||||||||||||||||||||||||||||||||
|
Service cost
|
$
|
—
|
|
$
|
—
|
|
$
|
—
|
|
$
|
34.8
|
|
$
|
6.5
|
|
$
|
5.5
|
|
$
|
1.9
|
|
$
|
1.1
|
|
$
|
1.9
|
|
$
|
36.7
|
|
$
|
7.6
|
|
$
|
7.4
|
|
|||||||||||
|
Interest cost
|
1.6
|
|
3.4
|
|
3.3
|
|
6.6
|
|
3.6
|
|
4.3
|
|
1.8
|
|
1.9
|
|
2.7
|
|
10.0
|
|
8.9
|
|
10.3
|
|
|||||||||||||||||||||||
|
Expected return on plan assets
|
(0.9
|
)
|
(2.6
|
)
|
(3.0
|
)
|
(6.3
|
)
|
(1.1
|
)
|
(1.2
|
)
|
—
|
|
—
|
|
—
|
|
(7.2
|
)
|
(3.7
|
)
|
(4.2
|
)
|
|||||||||||||||||||||||
|
Amortization of prior service (credit) cost
|
—
|
|
—
|
|
—
|
|
0.2
|
|
0.2
|
|
0.3
|
|
(5.9
|
)
|
(5.9
|
)
|
(3.1
|
)
|
(5.7
|
)
|
(5.7
|
)
|
(2.8
|
)
|
|||||||||||||||||||||||
|
Amortization of net loss (gain)
|
2.3
|
|
1.2
|
|
2.0
|
|
4.2
|
|
2.6
|
|
3.1
|
|
0.1
|
|
—
|
|
(0.1
|
)
|
6.6
|
|
3.8
|
|
5.0
|
|
|||||||||||||||||||||||
|
Settlements loss (gain) recognized
|
15.9
|
|
—
|
|
—
|
|
(0.5
|
)
|
0.1
|
|
1.2
|
|
—
|
|
—
|
|
(0.1
|
)
|
15.4
|
|
0.1
|
|
1.1
|
|
|||||||||||||||||||||||
|
Curtailment (gain) loss recognized
|
—
|
|
—
|
|
—
|
|
(2.2
|
)
|
—
|
|
(0.6
|
)
|
—
|
|
(1.8
|
)
|
—
|
|
(2.2
|
)
|
(1.8
|
)
|
(0.6
|
)
|
|||||||||||||||||||||||
|
Net periodic benefit cost
|
$
|
18.9
|
|
$
|
2.0
|
|
$
|
2.3
|
|
$
|
36.8
|
|
$
|
11.9
|
|
$
|
12.6
|
|
$
|
(2.1
|
)
|
$
|
(4.7
|
)
|
$
|
1.3
|
|
$
|
53.6
|
|
$
|
9.2
|
|
$
|
16.2
|
|
|||||||||||
Pre-tax amounts recognized in AOC(L)/I, which have not yet been recognized as a component of net periodic benefit cost are presented below:
F-45
COTY INC. & SUBSIDIARIES
NOTES TO CONSOLIDATED FINANCIAL STATEMENTS
($ in millions, except per share data)
|
Pension Plans
|
Other Post-Employment Benefits
|
||||||||||||||||||||||||||||||
|
U.S.
|
International
|
Total
|
|||||||||||||||||||||||||||||
|
2017
|
2016
|
2017
|
2016
|
2017
|
2016
|
2017
|
2016
|
||||||||||||||||||||||||
|
Net actuarial (loss) gain
|
$
|
2.5
|
|
$
|
(15.5
|
)
|
$
|
27.4
|
|
$
|
(64.3
|
)
|
$
|
1.7
|
|
$
|
(0.1
|
)
|
$
|
31.6
|
|
$
|
(79.9
|
)
|
|||||||
|
Prior service (cost) credit
|
—
|
|
—
|
|
(2.3
|
)
|
(2.4
|
)
|
22.2
|
|
28.1
|
|
19.9
|
|
25.7
|
|
|||||||||||||||
|
Total recognized in AOC(L)/I
|
$
|
2.5
|
|
$
|
(15.5
|
)
|
$
|
25.1
|
|
$
|
(66.7
|
)
|
$
|
23.9
|
|
$
|
28.0
|
|
$
|
51.5
|
|
$
|
(54.2
|
)
|
|||||||
Changes in plan assets and benefit obligations recognized in OCI/(L) during the fiscal year are presented below:
|
Pension Plans
|
Other Post-Employment Benefits
|
||||||||||||||||||||||||||||||
|
U.S.
|
International
|
Total
|
|||||||||||||||||||||||||||||
|
2017
|
2016
|
2017
|
2016
|
2017
|
2016
|
2017
|
2016
|
||||||||||||||||||||||||
|
Net actuarial (loss) gain
|
$
|
0.4
|
|
$
|
(3.1
|
)
|
$
|
85.2
|
|
$
|
(22.2
|
)
|
$
|
1.4
|
|
$
|
(1.3
|
)
|
$
|
87.0
|
|
$
|
(26.6
|
)
|
|||||||
|
Amortization of prior service cost (credit)
|
—
|
|
—
|
|
0.2
|
|
0.2
|
|
(5.9
|
)
|
(5.9
|
)
|
(5.7
|
)
|
(5.7
|
)
|
|||||||||||||||
|
Recognized net actuarial loss (gain)
|
17.6
|
|
1.2
|
|
3.7
|
|
2.8
|
|
0.1
|
|
—
|
|
21.4
|
|
4.0
|
|
|||||||||||||||
|
Prior service cost
|
—
|
|
—
|
|
—
|
|
—
|
|
—
|
|
—
|
|
—
|
|
—
|
|
|||||||||||||||
|
Effect of exchange rates
|
—
|
|
—
|
|
2.7
|
|
0.7
|
|
0.3
|
|
—
|
|
3.0
|
|
0.7
|
|
|||||||||||||||
|
Total recognized in OCI/(L)
|
$
|
18.0
|
|
$
|
(1.9
|
)
|
$
|
91.8
|
|
$
|
(18.5
|
)
|
$
|
(4.1
|
)
|
$
|
(7.2
|
)
|
$
|
105.7
|
|
$
|
(27.6
|
)
|
|||||||
Amounts in AOCI/(L) expected to be amortized as components of net periodic benefit cost during fiscal
2018
are presented below:
|
Pension Plans
|
Other Post-Employment Benefits
|
Total
|
|||||||||||||
|
U.S.
|
International
|
||||||||||||||
|
Prior service (cost) credit
|
$
|
—
|
|
$
|
(0.2
|
)
|
$
|
5.9
|
|
$
|
5.7
|
|
|||
|
Net loss
|
0.6
|
|
(1.3
|
)
|
0.2
|
|
(0.5
|
)
|
|||||||
|
Total
|
$
|
0.6
|
|
$
|
(1.5
|
)
|
$
|
6.1
|
|
$
|
5.2
|
|
|||
Pension and Other Post-Employment Benefit Assumptions
The weighted-average assumptions used to determine the Company’s projected benefit obligation above are presented below:
|
Pension Plans
|
Other Post-Employment Benefits
|
||||||||||
|
U.S.
|
International
|
||||||||||
|
2017
|
2016
|
2017
|
2016
|
2017
|
2016
|
||||||
|
Discount rates
|
3.6%
|
3.3%-3.8%
|
0.4%-7.5%
|
0.2%-1.9%
|
1.9%-7.6%
|
3.8%-4.0%
|
|||||
|
Future compensation growth rates
|
N/A
|
N/A
|
0%-6.0%
|
1.5%-2.5%
|
N/A
|
N/A
|
|||||
F-46
COTY INC. & SUBSIDIARIES
NOTES TO CONSOLIDATED FINANCIAL STATEMENTS
($ in millions, except per share data)
The weighted-average assumptions used to determine the Company’s net periodic benefit cost in fiscal
2017
,
2016
and
2015
are presented below:
|
Pension Plans
|
Other Post-
Employment Benefits |
||||||||||||||||
|
U.S.
|
International
|
||||||||||||||||
|
2017
|
2016
|
2015
|
2017
|
2016
|
2015
|
2017
|
2016
|
2015
|
|||||||||
|
Discount rates
|
3.3%-3.8%
|
4.1%-4.5%
|
3.1%-4.5%
|
0.2%-7.8%
|
1.0%-2.7%
|
1.8%-3.2%
|
1.4%-8.0%
|
4.1%-4.6%
|
4.2%-4.8%
|
||||||||
|
Future compensation growth rates
|
N/A
|
N/A
|
N/A
|
1.5%-5.8%
|
1.5%-2.5%
|
2.0%-2.5%
|
N/A
|
N/A
|
N/A
|
||||||||
|
Expected long-term rates of return on plan assets
|
N/A
|
5.1%
|
6.5%
|
1.6%-6.0%
|
2.3%-4.3%
|
2.8%-4.3%
|
N/A
|
N/A
|
N/A
|
||||||||
The health care cost trend rate assumptions have a significant effect on the amounts reported.
|
Year Ended June 30,
|
|||||
|
2017
|
2016
|
2015
|
|||
|
Health care cost trend rate assumed for next year
|
7.2%-7.4%
|
7.2%-7.4%
|
6.3%-6.7%
|
||
|
Rate to which the cost trend rate is assumed to decline (the ultimate trend rate)
|
5%
|
5%
|
5%
|
||
|
Year that the rate reaches the ultimate trend rate
|
2025
|
2024 - 2025
|
2022 - 2023
|
||
A one-percentage point change in assumed health care cost trend rates would have the following effects:
|
One Percentage Point Increase
|
One Percentage Point Decrease
|
||||||
|
Effect on total service cost and interest cost
|
$
|
6.7
|
|
$
|
(5.8
|
)
|
|
|
Effect on post-employment benefit obligation
|
0.4
|
|
(0.3
|
)
|
|||
Pension Plan Investment Policy
The Company’s investment policies and strategies for plan assets are to achieve the greatest return consistent with the fiduciary character of the plan and to maintain a level of liquidity that is sufficient to meet the need for timely payment of benefits. The goals of the investment managers include minimizing risk and achieving growth in principal value so that the purchasing power of such value is maintained with respect to the rate of inflation.
The pension plan’s return on assets is based on management’s expectations of long-term average rates of return to be achieved by the underlying investment portfolios. In establishing this assumption, management considers historical and expected returns for the assets in which the plan is invested, as well as current economic and market conditions.
The asset allocation decision includes consideration of future retirements, lump-sum elections, growth in the number of participants, the Company’s contributions and cash flow. These actual characteristics of the plan place certain demands upon the level, risk and required growth of trust assets. Actual asset allocation is regularly reviewed and periodically rebalanced to the strategic allocation when considered appropriate.
The target asset allocations for the Company’s pension plans as of
June 30, 2017
and
2016
, by asset category are presented below:
|
% of Plan Assets at Year Ended
|
||||||||
|
Target
|
2017
|
2016
|
||||||
|
Equity securities
|
50
|
%
|
41
|
%
|
25
|
%
|
||
|
Fixed income securities
|
40
|
%
|
39
|
%
|
35
|
%
|
||
|
Cash and other investments
|
10
|
%
|
20
|
%
|
40
|
%
|
||
F-47
COTY INC. & SUBSIDIARIES
NOTES TO CONSOLIDATED FINANCIAL STATEMENTS
($ in millions, except per share data)
Fair Value of Plan Assets
The U.S. and international pension plan assets that the Company measures at fair value on a recurring basis, based on the fair value hierarchy as described in Note
2
—Summary of Significant Accounting Policies, as of
June 30, 2017
and
2016
are presented below:
|
Level 1
|
Level 2
|
Level 3
|
Total
|
||||||||||||||||||||||||||||
|
2017
|
2016
|
2017
|
2016
|
2017
|
2016
|
2017
|
2016
|
||||||||||||||||||||||||
|
International equity securities
|
$
|
53.4
|
|
$
|
—
|
|
$
|
—
|
|
$
|
—
|
|
$
|
—
|
|
$
|
—
|
|
$
|
53.4
|
|
$
|
—
|
|
|||||||
|
Fixed income securities:
|
|||||||||||||||||||||||||||||||
|
U.S. Government and government agencies
|
—
|
|
5.8
|
|
—
|
|
13.1
|
|
—
|
|
—
|
|
—
|
|
18.9
|
|
|||||||||||||||
|
Corporate securities
|
50.5
|
|
—
|
|
—
|
|
6.8
|
|
—
|
|
—
|
|
50.5
|
|
6.8
|
|
|||||||||||||||
|
Commingled bond fund
|
—
|
|
—
|
|
—
|
|
23.3
|
|
—
|
|
—
|
|
—
|
|
23.3
|
|
|||||||||||||||
|
Other:
|
|||||||||||||||||||||||||||||||
|
Cash and cash equivalents
|
0.5
|
|
4.5
|
|
—
|
|
—
|
|
—
|
|
—
|
|
0.5
|
|
4.5
|
|
|||||||||||||||
|
Insurance contracts and Other
|
—
|
|
—
|
|
—
|
|
—
|
|
130.2
|
|
42.4
|
|
130.2
|
|
42.4
|
|
|||||||||||||||
|
Total pension plan assets at fair value-June 30
|
$
|
104.4
|
|
$
|
10.3
|
|
$
|
—
|
|
$
|
43.2
|
|
$
|
130.2
|
|
$
|
42.4
|
|
$
|
234.6
|
|
$
|
95.9
|
|
|||||||
The following is a description of the valuation methodologies used for plan assets measured at fair value:
Equity securities (domestic and international)
-The fair values reflect the closing price reported on a major market where the individual securities are traded. These investments are classified within Level 1 of the valuation hierarchy.
U.S. government and government agencies fixed income securities
-When quoted prices are available in an active market, the investments are classified as Level 1. When quoted market prices are not available in an active market, these investments are classified as Level 2.
Corporate securities and commingled bond fund
-The fair values are based on a compilation of primarily observable market information or a broker quote in a non-active market. These investments are primarily classified within Level 2 of the valuation hierarchy.
Cash and cash equivalents
-The carrying amount approximates fair value, primarily because of the short maturity of cash equivalent instruments. These investments are classified within Level 1 of the valuation hierarchy.
Insurance contracts and other
- Includes contracts issued by insurance companies and other investments that are not publicly traded. These investments are generally classified as Level 3 as there are neither quoted prices nor other observable inputs for pricing. Insurance contracts are valued at cash surrender value, which approximates the contract fair value. Other Level 3 plan assets include real estate and other alternative investment funds requiring inputs that cannot be readily derived from observable market data due to the infrequency with which the underlying assets trade.
The Company sponsors a qualified defined benefit pension plan for all eligible Swiss employees. Retirement benefits are provided based on employees’ years of service and earnings, or in accordance with applicable employee regulations. Consistent with typical Swiss practice, the pension plan is funded through a guaranteed insurance contract with an insurance company (“IC”). The IC is responsible for the investment strategy of the insurance premiums that the Company submits and does not hold individual assets per participating employer. Assets are invested in accordance with the IC’s own strategies and risk assessments. Under the terms of the contract, the interest rate as well as the capital value is guaranteed for each participant, with the IC assuming any risk to the value of the underlying assets. The IC is a member of a security fund, whose purpose is to cover any shortfall in the event they are not able to fulfill its contractual agreements. The plan assets of the Swiss plan are included in the Level 3 valuation.
The Company also sponsors qualified defined benefit pension plans for certain eligible German employees. The Company’s German pension plans are partially funded with plan assets held in a Contractual Trust Arrangement (CTA), under which Company assets have been irrevocably transferred to a registered association for the exclusive purpose of securing and funding pension obligations in Germany. The association invests primarily in publicly tradable equity and fixed income securities, using a funding strategy that is reviewed on a regular basis.
Plan assets are also held in the Company’s other Non-US defined benefit pension plans. The other Non-US defined benefit pension plans provide benefits primarily based on earnings and years of service and are funded in compliance with local laws
F-48
COTY INC. & SUBSIDIARIES
NOTES TO CONSOLIDATED FINANCIAL STATEMENTS
($ in millions, except per share data)
and practices. The plan assets are invested in various asset classes that are expected to produce a sufficient level of diversification and investment return over the long term at an acceptable level of risk.
The reconciliations of Level 3 plan assets measured at fair value in fiscal
2017
and
2016
are presented below:
|
June 30,
2017 |
June 30,
2016 |
||||||
|
Insurance contract:
|
|||||||
|
Fair value—July 1
|
$
|
42.4
|
|
$
|
36.6
|
|
|
|
Plan assets from acquisitions
|
75.7
|
|
—
|
|
|||
|
Return on plan assets
|
4.7
|
|
1.8
|
|
|||
|
Purchases, sales and settlements, net
|
5.3
|
|
5.3
|
|
|||
|
Effect of exchange rates
|
2.1
|
|
(1.3
|
)
|
|||
|
Fair value—June 30
|
$
|
130.2
|
|
$
|
42.4
|
|
|
Contributions
The Company plans to contribute approximately
$1.3
to its remaining U.S. pension plan and expects to contribute approximately
$35.6
and
$2.5
to its international pension and other post-employment benefit plans, respectively, during fiscal
2018
.
Estimated Future Benefit Payments
Expected benefit payments, which reflect expected future service, as appropriate, are presented below:
|
Pension Plans
|
Other Post-Employment Benefits
|
Total
|
|||||||||||||
|
Fiscal Year Ending June 30,
|
U.S
|
International
|
|||||||||||||
|
2018
|
$
|
1.3
|
|
$
|
25.9
|
|
$
|
2.5
|
|
$
|
29.7
|
|
|||
|
2019
|
1.3
|
|
24.9
|
|
2.8
|
|
29.0
|
|
|||||||
|
2020
|
1.3
|
|
25.5
|
|
3.0
|
|
29.8
|
|
|||||||
|
2021
|
1.3
|
|
25.0
|
|
3.2
|
|
29.5
|
|
|||||||
|
2022
|
1.3
|
|
27.0
|
|
3.4
|
|
31.7
|
|
|||||||
|
2023 - 2027
|
6.0
|
|
135.3
|
|
17.8
|
|
159.1
|
|
|||||||
18
. DERIVATIVE INSTRUMENTS
Foreign Exchange Risk
The Company is exposed to foreign currency exchange fluctuations through its global operations. The Company may reduce its exposure to fluctuations in the cash flows associated with changes in foreign exchange rates by creating offsetting positions through the use of derivative instruments and also by designating foreign currency denominated borrowings as hedges of net investments in foreign subsidiaries. The Company expects that through hedging, any gain or loss on the derivative instruments would generally offset the expected increase or decrease in the value of the underlying forecasted transactions. The Company entered into derivatives for which hedge accounting treatment has been applied which the Company anticipates realizing in the Consolidated Statements of Operations through fiscal
2018
.
The Company enters into foreign exchange forward contracts to hedge anticipated transactions for periods consistent with the Company’s identified exposures to minimize the effect of foreign exchange rate movements on revenues, costs and on the cash flows that the Company receives from foreign subsidiaries and third parties where there is a high probability that anticipated exposures will materialize. The foreign exchange forward contracts used to hedge anticipated transactions have been designated as foreign exchange cash-flow hedges. Hedge effectiveness of foreign exchange forward contracts is based on the forward-to-forward hypothetical derivative methodology and includes all changes in value.
The Company also continued to use certain derivatives as economic hedges of foreign currency exposure on firm commitments and forecasted transactions, which do not qualify for hedge accounting. Although these derivatives were not designated for hedge accounting, the overall objective of mitigating foreign currency exposure is the same for all derivative
F-49
COTY INC. & SUBSIDIARIES
NOTES TO CONSOLIDATED FINANCIAL STATEMENTS
($ in millions, except per share data)
instruments. The Company does not enter into derivative financial instruments for trading or speculative purposes, nor is the Company a party to leveraged derivatives. For derivatives not designated as hedging instruments, changes in fair value are recorded in the line item in the Consolidated Statements of Operations to which the derivative relates.
Interest Rate Risk
The Company is exposed to interest rate fluctuations related to its variable rate debt instruments. The Company may reduce its exposure to fluctuations in the cash flows associated with changes in the variable interest rates by entering into offsetting positions through the use of derivative instruments, such as interest rate swap contracts. The interest rate swap contracts result in recognizing a fixed interest rate for the portion of the Company’s variable rate debt that was hedged. This will reduce the negative impact of increases in the variable rates over the term of the contracts. During fiscal 2016, the Company entered into interest rate swap contracts that have been designated as cash-flow hedges. Hedge effectiveness of interest rate swap contracts is based on a long-haul hypothetical derivative methodology and includes all changes in value.
Hedge Accounting
Derivative financial instruments are recorded as either assets or liabilities on the Consolidated Balance Sheets and are measured at fair value.
For derivatives accounted for as hedging instruments, the Company formally designates and documents, at inception, the financial instrument as a hedge of specific underlying forecasted transactions, the risk management objective and the strategy for undertaking the hedge transaction. In addition, the Company formally assesses both at inception and at least quarterly thereafter, whether the financial instruments used in hedging transactions are effective at offsetting changes in either the fair values or cash flows of the related underlying exposures. Additionally, all of the master agreements governing the Company’s derivative contracts contain standard provisions that could trigger early termination of the contracts in certain circumstances which would require the Company to discontinue hedge accounting, including if the Company were to merge with another entity and the creditworthiness of the surviving entity were to be “materially weaker” than that of the Company prior to the merger.
For derivatives designated as cash flow hedges, changes in the fair value are recorded in AOCI/(L). Gains and losses deferred in AOCI/(L) are then recognized in Net income (loss) in a manner that matches the timing of the actual income or expense related to the hedging instruments with the hedged transaction. The gains and losses related to designated hedging instruments are also recorded in the line item in the Consolidated Statements of Operations to which the derivative relates. Cash flows from derivative instruments designated as cash flow hedges are recorded in the same category as the cash flows from the items being hedged in the Consolidated Statements of Cash Flows.
The ineffective portion of foreign exchange forward and interest rate swap contracts are recorded in current-period earnings. For hedge contracts that are no longer deemed highly effective, hedge accounting is discontinued and gains and losses accumulated in Other comprehensive income (loss) (“OCI”) are reclassified to earnings when the underlying forecasted transaction occurs. If it is no longer probable that the forecasted transaction will occur, then any gains or losses in AOCI/(L) are reclassified to current-period earnings. For fiscal
2017
, all of the Company’s foreign exchange forward and interest rate swap contracts designated as hedges were highly effective.
The Company also attempts to minimize credit exposure to counterparties by entering into derivative contracts with counterparties that are major financial institutions and utilizing master netting arrangements. Exposure to credit risk in the event of nonperformance by any of the counterparties with respect to the Company’s foreign exchange forward contracts is limited to the fair value of contracts in net asset positions under master netting arrangements. Exposure to credit risk in the event of nonperformance by any of the counterparties with respect to the Company’s interest rate swap contracts is limited to the fair value of contracts in net asset positions. Accordingly, management of the Company believes risk of material loss under these hedging contracts is remote.
Net Investment Hedge
Foreign currency gains and losses on borrowings designated as a net investment hedge, except ineffective portions, are reported in the cumulative translation adjustment (“CTA”) component of AOCI/(L), along with the foreign currency translation adjustments on those investments.
Net investment hedge effectiveness is assessed based on the change in the spot rate of the Euro-denominated loan payable. The critical terms (underlying notional and currency) of the loan payable match the portion of the net investment designated as being hedged. The net investment hedge was equal to the designated portion of the international subsidiary’s investment balance as of
June 30, 2017
. As such, the net investment hedge was considered to be effective, and, as a result, the changes in the fair value were recorded within CTA on the Company’s Consolidated Balance Sheets.
F-50
COTY INC. & SUBSIDIARIES
NOTES TO CONSOLIDATED FINANCIAL STATEMENTS
($ in millions, except per share data)
Derivative and non-derivative financial instruments which are designated as hedging instruments:
The accumulated loss on foreign currency borrowings classified as net investment hedges in the foreign currency translation adjustment component of AOCI/(L) was
$23.7
and
$2.5
as of
June 30, 2017
and
2016
, respectively.
The amount of gains and losses recognized in OCI in the Consolidated Balance Sheets related to the Company’s derivative and non-derivative financial instruments which are designated as hedging instruments is presented below:
|
Gain (Loss) Recognized in OCI
|
Fiscal Year Ended June 30,
|
||||||||||
|
2017
|
2016
|
2015
|
|||||||||
|
Foreign exchange forward contracts
|
$
|
(0.8
|
)
|
$
|
6.0
|
|
$
|
21.6
|
|
||
|
Interest rate swap contracts
|
40.8
|
|
(36.6
|
)
|
—
|
|
|||||
|
Net investment hedge
|
(21.2
|
)
|
(2.5
|
)
|
—
|
|
|||||
As of
June 30, 2017
, all of the Company’s remaining foreign currency forward contracts designated as hedges were highly effective in all material respects. The accumulated gain (loss) on derivative instruments classified as cash flow hedges in AOCI/(L), net of tax, was
$12.6
and
$(28.9)
as of
June 30, 2017
and
2016
, respectively. The estimated net gain related to these effective hedges that is expected to be reclassified from AOCI/(L) into earnings, net of tax, within the next
twelve months
is
$0.8
.
The amount of gains and losses reclassified from AOCI/(L) to the Consolidated Statements of Operations related to the Company’s derivative financial instruments which are designated as hedging instruments is presented below:
|
Consolidated Statements of Operations
Classification of Gain (Loss) Reclassified from AOCI/(L)
|
Fiscal Year Ended June 30,
|
||||||||||
|
2017
|
2016
|
2015
|
|||||||||
|
Foreign exchange forward contract:
|
|||||||||||
|
Net revenues
|
$
|
2.4
|
|
$
|
5.5
|
|
$
|
8.1
|
|
||
|
Cost of sales
|
(2.2
|
)
|
0.7
|
|
0.3
|
|
|||||
|
Interest rate swap contracts:
|
|||||||||||
|
Interest expense
|
(9.3
|
)
|
(7.7
|
)
|
—
|
|
|||||
Derivatives not designated as hedging instruments:
The amount of gains and losses related to the Company’s derivative financial instruments not designated as hedging instruments is presented below:
|
Consolidated Statements of Operations
Classification of Gain (Loss) Recognized in Operations |
Fiscal Year Ended June 30,
|
||||||||||
|
2017
|
2016
|
2015
|
|||||||||
|
Net revenues
|
$
|
—
|
|
$
|
—
|
|
$
|
(0.1
|
)
|
||
|
Cost of sales
|
—
|
|
—
|
|
(0.3
|
)
|
|||||
|
Selling, general and administrative
|
(0.1
|
)
|
1.8
|
|
(0.2
|
)
|
|||||
|
Interest expense, net
(a)
|
(6.5
|
)
|
(11.3
|
)
|
(37.2
|
)
|
|||||
|
Other expense, net
(b)
|
(1.1
|
)
|
(29.3
|
)
|
—
|
|
|||||
|
(a)
|
The impact on interest expense, net for fiscal 2015 related to derivative contracts entered into to offset fluctuations in the underlying non-functional currency cash balances and intercompany loans at June 30, 2015 is due to increased foreign exchange exposure and higher volatility in currencies during the year, which is more than offset by the revaluation of underlying non-functional currency cash balances.
|
|
(b)
|
During fiscal 2016, the Company recognized
$29.6
of realized losses on foreign currency forward contracts related to an advanced payment for the Hypermarcas Brands.
|
19
. MANDATORILY REDEEMABLE FINANCIAL INTEREST
United Arab Emirates subsidiary
The Company is required under a shareholders agreement to purchase all of the shares held by the noncontrolling interest holder equal to
25%
of the outstanding shares of a certain subsidiary in the United Arab Emirates (the “U.A.E. JV”) at the
F-51
termination of the agreement. The Company has determined such shares to be a mandatorily redeemable financial instrument that is recorded as a liability. The liability is calculated based upon a pre-determined formula in accordance with the U.A.E Shareholders Agreement. As of
June 30, 2017
and
2016
, the liability amounted to
$5.2
and
$5.6
, of which
$4.7
and
$5.2
, respectively, was recorded in Other noncurrent liabilities and
$0.5
and
$0.4
, respectively, was recorded in Accrued expenses and other current liabilities.
The assets of the U.A.E. JV are restricted in that they are not available for general business use outside the context of the U.A.E. JV and creditors (or beneficial interest holders) do not have recourse to the Company or to its other assets. The U.A.E. JV has total assets and total liabilities of
$22.8
and
$16.5
as of
June 30, 2017
, and
$18.2
and
$10.3
as of
June 30, 2016
, respectively.
South-east Asian subsidiary
On May 23, 2017, the Company entered into the Sale of Shares and Termination Deed (the “Termination Agreement”) to purchase the remaining
49%
noncontrolling interest from the noncontrolling interest holder of a certain South-east Asian subsidiary for a purchase price of
$45.0
. Additionally, all remaining retained earnings will be paid out as dividends prior to the purchase. The payment and termination will be effective on June 30, 2019. Before the Termination Agreement, the partner’s interest was classified as noncontrolling interest in the Company’s financial statements. As a result of the Termination Agreement, the previous noncontrolling interest balance of
$9.2
has been recorded as a Mandatorily Redeemable Financial Instrument (“MRFI”) along with the present value of the future purchase price for a total balance of
$49.9
with the difference of
$40.7
recorded in Additional Paid in Capital. The MRFI balance will be accreted to the redemption value until the effective date of the purchase with changes in the balance being reflected in Other income (expense) in the Consolidated Statements of Operations.
As of
June 30, 2017
, the MRFI liability amounted to
$49.3
, of which
$41.7
was recorded in Other noncurrent liabilities and
$7.6
was recorded in Accrued expenses and other current liabilities.
20
. NONCONTROLLING INTERESTS AND REDEEMABLE NONCONTROLLING INTERESTS
Noncontrolling Interests
Due to the Termination Agreement, effective June 30, 2019, the Company will buy the shares of the noncontrolling interest holder of a certain South-east Asian subsidiary. The noncontrolling interest balance was reclassified as MRFI (See Note
19
—Mandatorily Redeemable Financial Interest) during June 2017.
Redeemable Noncontrolling Interests
As of
June 30, 2017
, the redeemable noncontrolling interests (“RNCI”) consist of a
33.0%
interest in a consolidated subsidiary in the United Arab Emirates and a
40.0%
interest in the consolidated subsidiaries related to the Younique acquisition. See Note
3
—Business Combinations.
Younique
On February 1, 2017, the Company completed its acquisition of
60%
of the membership interest in Foundation which held the net assets of Younique, for cash consideration of
$600.0
, net of acquired cash and debt assumed. The existing Younique membership holders contributed their
100%
membership interest in Younique to Foundation in exchange for a
40%
membership interest in Foundation and
$600.0
of cash consideration. An estimated additional payment of
$7.5
for working capital adjustments is expected to be paid in the first half of fiscal 2018. The Company accounts for the noncontrolling interest portion of Foundation as RNCI due to the noncontrolling interest holder’s ability to put their shares to the Company in certain circumstances. While Foundation is a majority-owned consolidated subsidiary, the Company records income tax expense based on the Company’s
60%
membership interest in Foundation due to its treatment as a partnership for U.S. income tax purposes. Accordingly, Foundation’s net income attributable to RNCI is equal to the
40%
noncontrolling interest of Foundation’s net income excluding a provision for income taxes. The Company recognized
$415.9
and
$481.6
as the redeemable noncontrolling interest balances as of February 1, 2017 (acquisition date) and
June 30, 2017
, respectively.
The Company has the right to purchase the RNCI in Foundation from the RNCI holders (each such right, a “Foundation Call right”) upon the occurrence of certain events that are not in the Company’s control. In addition to the Foundation Call right features, the noncontrolling interest holders of Foundation have the right to sell the noncontrolling interests to the Company upon the occurrence of certain events (each such right, a “Foundation Put right”).
The amount at which the Foundation Put right and Foundation Call right can be exercised is based on a fair value at the exercise date, multiplied by the noncontrolling interest holder’s percentage interest in Foundation. In certain circumstances the Foundation Put right or the Foundation Call right may be exercised at a discount or a premium. Currently management views
F-52
COTY INC. & SUBSIDIARIES
NOTES TO CONSOLIDATED FINANCIAL STATEMENTS
($ in millions, except per share data)
the possibility of these circumstances occurring as remote. The noncontrolling interests are redeemable outside of the Company’s control and are recorded in the Consolidated Balance Sheets at the estimated fair value. The Company adjusts Foundation’s RNCI to the fair values at the end of each reporting period with changes recognized as adjustments to APIC.
The Company uses an income approach, a market approach or a combination of these approaches to estimate the fair value of the Foundation RNCI. The income approach is used to determine the fair value of the Foundation RNCI using a discounted cash flow method, projecting future cash flows of the business, as well as a terminal value, and discounting such cash flows at a rate of return that reflects the relative risk of the cash flows. For the market approach the Company uses a selected multiple based on comparable companies multiplied by the forecasted cash flows. The key estimates and factors used in this approach include, but are not limited to, revenue growth rates and profit margins based on our internal forecasts and the entity specific weighted-average cost of capital used to discount future cash flows.
Subsidiary in the United Arab Emirates
On May 31, 2017, the Company and the non-controlling interest holder in the Company’s subsidiary in the United Arab Emirates (“Middle East Subsidiary”) amended the shareholder agreement governing the Company’s Middle East Subsidiary. As of July 1, 2017, the amendment will reduce the percentage of the noncontrolling interest holders’ share to
25%
in exchange for Coty contributing the brands acquired as part of the P&G Beauty Business acquisition to the joint venture’s portfolio of brands. The Company also has the ability to exercise the Call right for the remaining noncontrolling interest of
25%
on July 1, 2028, with such transaction to close on July 1, 2029. In addition to the Call right feature, the noncontrolling interest holder has the right to sell the noncontrolling interest to the Company on July 1, 2028, with such transaction to close on July 1, 2029 (a “Put right”). The amount at which the Put right and Call right can be exercised is based on a formula prescribed by the stockholder agreement as summarized in the table below, multiplied by the noncontrolling interest holder’s percentage of stock-holding in the Company. Given the provision of the Put right, the entire noncontrolling interest is redeemable outside of the Company’s control and is recorded in the Consolidated Balance Sheets at the estimated redemption value. The Company adjusts the redeemable noncontrolling interest to the redemption values at the end of each reporting period with changes recognized as adjustments to APIC.
|
Middle East
|
|
|
Percentage of redeemable noncontrolling interest
|
33%
|
|
Earliest exercise date(s)
|
33.0% in July 2028
(a)
|
|
Formula of redemption value
|
3-year average of EBIT
(b)
* 6
|
(a)
Upon the effective date of the amendment (July 1, 2017), the parties will be entitled to call or put the remaining
25%
interest in July 2028.
(b)
EBIT is defined in the stockholder agreement as earnings before interest and income taxes.
Hong Kong Subsidiary
On February 12, 2016, the Company gave notice of intent to exercise its option to purchase as of
June 30, 2016
the noncontrolling interest in a certain Hong Kong subsidiary at the purchase price of
$9.8
for the remaining
45%
interest. The transaction was effective as of
June 30, 2016
and the payment was completed during the three months ended December 31, 2016.
21
. EQUITY
Common Stock
As of
June 30, 2017
, the Company’s common stock consisted of Class A Common Stock with a par value of
$0.01
per share. The holders of Class A Common Stock are entitled to
one
vote per share. Prior to September 30, 2016, the Company had Class B Common Stock outstanding. As of
June 30, 2017
, total authorized shares of Class A Common Stock was
1,000.0 million
and total outstanding shares of Class A Common Stock was
747.9 million
.
In the fiscal years ended
June 30, 2017
,
2016
, and
2015
, the Company issued
2.5 million
,
4.7 million
, and
5.8 million
shares of its Class A Common Stock, respectively, and received
$21.3
,
$40.9
, and
$48.5
, in cash, respectively, in connection with the exercise of employee stock options, settlement of RSUs and special incentive awards, and purchase of shares by employees under the employee stock ownership programs under the Omnibus Equity and Long-Term Incentive Plan (“Omnibus LTIP”).
On October 1, 2016 the Company issued
409.7 million
shares of Class A Common Stock in connection with the closing of the P&G Beauty Business acquisition as described in
Note
3
—Business Combinations.
F-53
COTY INC. & SUBSIDIARIES
NOTES TO CONSOLIDATED FINANCIAL STATEMENTS
($ in millions, except per share data)
On September 30, 2016, JABC converted all of its shares of Class B Common Stock of the Company into shares of Class A Common Stock of the Company. The Company issued approximately
262.0 million
shares of Class A Common Stock to JABC upon the conversion of JABC’s shares of Class B Common Stock.
Prior to October 1, 2016, the Company was a majority-owned subsidiary of JAB Cosmetics B.V. (“JABC”). Both JABC and the shares of the Company held by JABC are indirectly controlled by Lucresca SE, Agnaten SE and JAB Holdings B.V. (“JAB”). On August 1, 2016, JABC began to purchase the Company’s Class A Common Stock in open market purchases on the New York Stock Exchange. During the fiscal year ended June 30, 2017, JABC acquired
2.6 million
shares of Class A Common Stock in the open market. The Company did not receive any proceeds from these stock purchases conducted by JABC. As of
June 30, 2017
, the Company was no longer a majority-owned subsidiary of JAB.
On September 29, 2016, the Company filed with the Secretary of State of the State of Delaware a Certificate of Amendment to the Company’s Amended and Restated Certificate of Incorporation amending the Amended and Restated Certificate of Incorporation of the Company to increase the number of authorized shares of Class A Common Stock from
800.0 million
shares to
1,000.0 million
shares.
During the fiscal year ended June 30, 2015, the Company issued
1.4 million
shares of its Class A Common Stock and recorded APIC of
$12.5
in relation to the exercise of stock options by Mr. Michele Scannavini (“Mr. Scannavini”), its former Chief Executive Officer.
As noted in Note
22
—Share-Based Compensation Plans, in fiscal 2015 the Company recognized compensation expense of
$13.9
and a related liability for
1.4 million
shares which its parent JABC agreed to repurchase from an individual originally intended to become an executive of the Company. From June 30, 2015 until the date the liability was settled by JABC, the value of the obligation declined
$0.1
, which was recorded as a reduction of stock compensation expense. On July 8, 2015, JABC repurchased the shares. The settlement of the liability of
$13.8
is considered a non-cash capital contribution to the Company and therefore was recorded in Additional paid-in capital.
Between April 8, 2015 and June 12, 2015, JABC, the Company’s controlling stockholder at the time sold
1.7 million
shares of its Class B Common Stock to certain Coty executives and
two
individuals intended to become Coty executives. Upon the consummation of these sales of the Class B Common Stock, such shares converted into an equal number of Class A Common Stock and the Company reclassified
1.7 million
shares from Class B Common Stock to Class A Common Stock on the Consolidated Balance Sheets and Consolidated Statements of Equity and Redeemable Noncontrolling Interests as of June 30, 2015. The Company did not receive any shares or proceeds from the sale of shares by JABC.
Preferred Stock
As of
June 30, 2017
, the Company’s preferred stock consisted of Series A Preferred Stock with a par value of
$0.01
. The Series A Preferred Stock is not entitled to receive any dividends and has
no
voting rights except as required by law. On December 21, 2016, the Company filed with the Secretary of State of the State of Delaware (i) a Certificate of Retirement with respect to
5,493,894
shares of Series A Preferred Stock previously retired, cancelled and redeemed by the Company and (ii) filed a Certificate of Increase to increase the number of shares designated as Series A Preferred Stock from
3,506,106
to
6,506,106
.
The Series A Preferred Stock are issued
to executive officers and directors under subscription agreements. Generally, the subscription agreements entitle the holder of the vested Series A Preferred Stock to exchange the Series A Preferred Stock into either cash or shares of Class A Common Stock, at the election of the Company, at the exchange value. The exchange value is equal to the difference between the 10-day trailing average closing price of a share of Class A Common Stock on the date of exchange and a predetermined hurdle price. The Series A Preferred Stock generally vests on the fifth anniversary of issuance, subject to continued employment with the Company and investment by the holder in shares of Class A Common Stock throughout the vesting period. The Company considers its ability to control whether the settlement would occur in cash or shares in determining whether the shares are classified as liability or equity awards. Additionally, cash bonuses were awarded in conjunction with certain awards of Series A Preferred Stock, and are subject to the same vesting conditions. The cash bonuses have been classified as liabilities as described below.
The following table summarizes the key terms of each issuance of Series A Preferred Stock:
F-54
COTY INC. & SUBSIDIARIES
NOTES TO CONSOLIDATED FINANCIAL STATEMENTS
($ in millions, except per share data)
|
Issuance Date
|
Number of Shares Awarded at Grant Date (millions of shares)
|
Number of Shares Outstanding (millions of shares)
|
Hurdle Price per Share
|
||||||
|
April 2015
(a)(e)
|
7.4
|
|
1.7
|
|
$
|
27.97
|
|
||
|
November 25, 2016
(b)(f)
|
1.0
|
|
1.0
|
|
$
|
22.34
|
|
||
|
February 16, 2017
(c)(f)
|
0.5
|
|
0.5
|
|
$
|
22.66
|
|
||
|
March 27, 2017
(d)(f)
|
1.0
|
|
1.0
|
|
$
|
22.39
|
|
||
(a)
Two of the holders subsequently forfeited
5.7 million
shares, which was repurchased by the Company at
$0.01
per share. Additionally, one of the holders is entitled to a cash bonus of
$3.00
per share upon the vesting of
0.6 million
shares of Series A Preferred Stock if the market value of Class A Common Stock on the date of conversion exceeds the hurdle price on the vest date.
(b)
This grant was sold to Camillo Pane (“Mr. Pane”), the Company’s Chief Executive Officer. Mr. Pane is entitled to a cash bonus of
$2.60
per share upon exchanging shares of Series A Preferred stock if the market value of Class A Common Stock on the date of conversion exceeds the hurdle price.
(c)
Holder is entitled to a cash bonus of
$2.62
per share upon exchanging shares of Series A Preferred Stock if the market value of Class A Common Stock on the date of conversion exceeds the hurdle price.
(d)
This grant was sold to Lambertus J.H. Becht (“Mr. Becht”), the Company’s Chairman of the Board. Under the terms provided in the subscription agreement, the Series A Preferred Stock immediately vested on the grant date and the holder may exchange the vested shares after the fifth anniversary of the date of issuance. The Company requires shareholder approval in order to settle the exchange in shares of Class A Common Stock. Therefore, the award is classified as a liability as of
June 30, 2017
. An expense of
$3.8
was recorded during fiscal
2017
and has been included in Selling, general and administrative expense on the Consolidated Statements of Operations.
(e)
If the holder does not exchange the vested Series A Preferred Stock by a certain expiration date, the Company must automatically exchange the Series A Preferred Stock into cash for the pro-rata portion of the grants attributable to services rendered by the holder within the United States. The portion related to service outside the United States, may be settled in cash or shares, at election of the Company. Therefore, these grants were accounted for using the liability plan accounting at issuance. As a holder provides service outside the U.S., a pro-rata portion of the grants are converted to equity awards to the extent the Company is not required to settle the award in cash, which are measured and fixed at the quarter end date that such services are provided, based on the estimated fair value of the award and recognized on a straight-line basis, net of estimated forfeitures, over the employee’s requisite service period.
(f)
If the holder does not exchange the vested Series A Preferred Stock by a certain expiration date, the Company must automatically exchange the Series A Preferred Stock into cash or shares, at election of the Company.
As of
June 30, 2017
, total authorized shares of Series A Preferred Stock are
6.5 million
and total outstanding shares of Series A Preferred Stock are
4.2 million
. Of the
4.2 million
outstanding shares of Series A Preferred Stock,
1.0 million
shares vested on March 27, 2017,
1.7 million
shares vest on April 15, 2020,
1.0 million
shares vest on November 25, 2021 and
0.5 million
shares vest on February 16, 2022. As of
June 30, 2017
, the Company classified
$1.5
Series A Preferred Stock as equity and
$4.9
as a liability, inclusive of the cash bonuses described above, recorded in Other noncurrent liabilities in the Consolidated Balance Sheet.
Dividends
Prior to October 2016, the Company declared annual cash dividends in the first quarter of the fiscal year. Beginning after October 2016, the Company began declaring cash dividends on a quarterly basis.
The Transaction Agreement restricts the Company’s ability to declare, make or pay any dividends, other than in the ordinary course and for an amount not to exceed
$0.25
per share prior to the closing of the P&G Beauty Business transaction, without P&G consent. In July 2016, P&G provided consent to the Company’s dividend declared on August 1, 2016.
The following dividends were declared during fiscal years
2017
,
2016
and
2015
:
F-55
COTY INC. & SUBSIDIARIES
NOTES TO CONSOLIDATED FINANCIAL STATEMENTS
($ in millions, except per share data)
|
Declaration Date
|
Dividend Type
|
Dividend Per Share
|
Holders of Record Date
|
Dividend Value
|
Dividend Payment Date
|
Dividends Paid
|
Dividends Payable
(a)
|
|||||||||||||||
|
Fiscal 2017
|
||||||||||||||||||||||
|
August 1, 2016
|
Annual
|
$
|
0.275
|
|
August 11, 2016
|
$
|
93.4
|
|
August 19, 2016
|
$
|
92.4
|
|
$
|
1.0
|
|
|||||||
|
December 9, 2016
|
Quarterly
|
$
|
0.125
|
|
December 19, 2016
|
$
|
94.0
|
|
December 28, 2016
|
$
|
93.4
|
|
$
|
0.6
|
|
|||||||
|
February 9, 2017
|
Quarterly
|
$
|
0.125
|
|
February 28, 2017
|
$
|
94.0
|
|
March 10, 2017
|
$
|
93.4
|
|
$
|
0.6
|
|
|||||||
|
May 10, 2017
|
Quarterly
|
$
|
0.125
|
|
May 31, 2017
|
$
|
94.0
|
|
June 13, 2017
|
$
|
93.4
|
|
$
|
0.6
|
|
|||||||
|
Fiscal 2017
|
$
|
0.650
|
|
$
|
375.4
|
|
$
|
372.6
|
|
$
|
2.8
|
|
||||||||||
|
Fiscal 2016
|
||||||||||||||||||||||
|
September 11, 2015
|
Annual
|
$
|
0.250
|
|
October 1, 2015
|
$
|
90.1
|
|
October 15, 2015
|
$
|
89.0
|
|
$
|
1.1
|
|
|||||||
|
Fiscal 2015
|
||||||||||||||||||||||
|
September 16, 2014
|
Annual
|
$
|
0.200
|
|
October 1, 2014
|
$
|
71.9
|
|
October 15, 2014
|
$
|
71.0
|
|
$
|
0.9
|
|
|||||||
(a)
The dividend payable is the value of the remaining dividends payable upon settlement of the RSUs and phantom units outstanding as of the Holders of Record Date. Dividends payable are recorded as Accrued expense and other current liabilities and Other noncurrent liabilities in the Consolidated Balance Sheet.
The Company decreased the dividend accrual recorded in a prior period by
$0.4
,
$0.3
and
$0.3
to adjust for accrued dividends on RSUs no longer expected to vest, which was recorded as an increase to APIC in the Consolidated Balance Sheet as of
June 30, 2017
,
2016
and
2015
, respectively.
Total accrued dividends on unvested RSUs and phantom units of
$1.0
and
$3.2
,
nil
and
$1.8
and
nil
and
$1.4
are included in Accrued expense and other current liabilities and Other noncurrent liabilities, respectively, in the Condensed Consolidated Balance Sheet as of
June 30, 2017
,
2016
and
2015
, respectively.
Accumulated Other Comprehensive Income (Loss)
|
Foreign Currency Translation Adjustments
|
|||||||||||||||||||
|
(Losses) Gains on Cash Flow Hedges
|
Loss on Net Investment Hedge
|
Foreign Currency Translation Adjustments
|
Pension and Other Post-Employment Benefit Plans
|
Total
|
|||||||||||||||
|
Beginning balance at July 1, 2015
|
$
|
(0.1
|
)
|
$
|
—
|
|
$
|
(249.3
|
)
|
$
|
(24.6
|
)
|
$
|
(274.0
|
)
|
||||
|
Other comprehensive income before reclassifications
|
(31.2
|
)
|
(2.5
|
)
|
85.3
|
|
(19.1
|
)
|
32.5
|
|
|||||||||
|
Net amounts reclassified from AOCI/(L)
(a)
|
2.4
|
|
—
|
|
—
|
|
(0.6
|
)
|
1.8
|
|
|||||||||
|
Net current-period other comprehensive income
|
(28.8
|
)
|
(2.5
|
)
|
85.3
|
|
(19.7
|
)
|
34.3
|
|
|||||||||
|
Ending balance at June 30, 2016
|
$
|
(28.9
|
)
|
$
|
(2.5
|
)
|
$
|
(164.0
|
)
|
$
|
(44.3
|
)
|
$
|
(239.7
|
)
|
||||
|
Other comprehensive income before reclassifications
|
35.9
|
|
(21.2
|
)
|
143.2
|
|
80.5
|
|
238.4
|
|
|||||||||
|
Net amounts reclassified from AOCI/(L)
(a)
|
5.6
|
|
—
|
|
—
|
|
0.1
|
|
5.7
|
|
|||||||||
|
Net current-period other comprehensive income
|
41.5
|
|
(21.2
|
)
|
143.2
|
|
80.6
|
|
244.1
|
|
|||||||||
|
Ending balance at June 30, 2017
|
$
|
12.6
|
|
$
|
(23.7
|
)
|
$
|
(20.8
|
)
|
$
|
36.3
|
|
$
|
4.4
|
|
||||
(a)
Amortization of actuarial gains (losses) of
$0.4
and
$1.7
, net of taxes of
$0.3
and
$1.1
, were reclassified out of AOCI/(L) and included in the computation of net period pension costs for the fiscal years ended
June 30, 2017
and
2016
, respectively (see Note
17
—Employee Benefit Plans).
Treasury Stock - Share Repurchase Program
F-56
COTY INC. & SUBSIDIARIES
NOTES TO CONSOLIDATED FINANCIAL STATEMENTS
($ in millions, except per share data)
Since February 2014, the Board has authorized the Company to repurchase its Class A Common Stock under approved repurchase programs. On February 3, 2016, the Board authorized the Company to repurchase up to
$500.0
of its Class A Common Stock (the “Incremental Repurchase Program”). Subject to certain restrictions on repurchases of shares through September 30, 2018 imposed by the tax matters agreement, dated October 1, 2016, between the Company and P&G entered into in connection with the P&G Beauty Business acquisition, repurchases may be made from time to time at the Company’s discretion, based on ongoing assessments of the capital needs of the business, the market price of its Class A Common Stock, and general market conditions. As of June 30, 2017, the Company has
$396.8
remaining under the Incremental Repurchase Program. The following table summarizes the share repurchase activities during the years ended
June 30, 2017, 2016 and 2015
:
|
Period
|
Number of shares repurchased (in millions)
|
Cost of shares repurchased (in millions)
|
Lowest fair value of shares repurchased per share
|
Highest fair value of shares repurchased per share
|
||||||||||
|
Fiscal Year Ended June 30, 2017
|
1.4
|
|
$
|
36.3
|
|
$
|
25.35
|
|
$
|
27.40
|
|
|||
|
Fiscal Year Ended June 30, 2016
|
27.4
|
|
$
|
767.0
|
|
$
|
25.10
|
|
$
|
30.35
|
|
|||
|
Fiscal Year Ended June 30, 2015
|
13.4
|
|
263.1
|
|
18.64
|
|
21.99
|
|
||||||
Treasury Stock - Other Repurchases
In addition to the above mentioned repurchase activities, on December 3, 2015, the Company entered into a stock purchase agreement with a shareholder holding more than
5%
of the Company’s Class A Common Stock to repurchase
1.0 million
shares of its Class A Common Stock. On December 17, 2015, the Company remitted payment for the repurchased shares at a price of
$27.91
per share. The fair value of shares repurchased was approximately
$27.9
, which was recorded as an increase to Treasury stock in the Consolidated Balance Sheets and Consolidated Statements of Equity and Redeemable Noncontrolling Interests.
On April 1, 2015, the Company completed its purchase of
100%
of the net assets of the Bourjois cosmetics brand (“Bourjois”) from Chanel International B.V. (“CHANEL”) pursuant to the Stock Purchase Agreement, dated as of March 12, 2015, between the Company and CHANEL (the “Stock Purchase Agreement”). The Company issued to its foreign subsidiaries
15.5
million shares of its Class A Common Stock for
$376.8
in cash and subsequently exchanged these shares with CHANEL as consideration for Bourjois. The shares had an approximate value of
$376.8
based on the closing value of the Company’s Class A Common Stock on the New York Stock Exchange. As a result of the purchase, the Company reissued the total of
$269.9
Treasury Stock with a charge to APIC of
$106.9
.
On September 29, 2014, the Company entered into an agreement with Mr. Scannavini, the Company’s former Chief Executive Officer in connection with his resignation. The agreement required the Company to purchase on or before January 27, 2015 all Class A Common Stock Mr. Scannavini held directly or indirectly, including shares of Class A Common Stock obtained upon the exercise of certain stock options, for a share price of
$17.21
, which is the average closing value of the Class A Common Stock on the New York Stock Exchange over
five
business days immediately preceding September 29, 2014. As a result of the agreement, the Company purchased
2.4
million shares of its Class A Common Stock for
$42.0
, which is reflected as an increase to Treasury stock in the Company’s Consolidated Balance Sheets and Consolidated Statements of Equity and Redeemable Noncontrolling Interests during the year ended June 30, 2015. The Company made a net payment to Mr. Scannavini of
$29.5
, which is the purchase amount of
$42.0
net of the aggregate exercise price of his vested stock options of
$12.5
.
22
. SHARE-BASED COMPENSATION PLANS
The Company has various share-based compensation programs (the “the Compensation Plans”) under which awards, including non-qualified stock options, Series A Preferred Stock, RSUs and other share-based awards, may be granted or shares of Class A Common Stock may be purchased. As of
June 30, 2017
, approximately
62.9 million
shares of the Company's Class A Common Stock were available to be granted pursuant to these Plans.
The Company accounts for its share-based compensation plans for common stock as equity plans. The share-based compensation for equity plans is estimated and fixed at the grant date, based on the estimated fair value of the award. Series A Preferred Stock is accounted for partially as equity and partially using liability plan accounting to the extent the award is expected to be settled in cash. Accordingly, share-based compensation expense for the liability plan awards are measured at the end of each reporting period based on the fair value of the award on each reporting date and recognized as an expense to the extent earned.
Total share-based compensation expense for fiscal
2017
,
2016
and
2015
of
$29.0
,
$35.4
and
$35.9
, respectively, is included in Selling, general and administrative expenses in the Consolidated Statements of Operations. The related tax benefits for share-
F-57
COTY INC. & SUBSIDIARIES
NOTES TO CONSOLIDATED FINANCIAL STATEMENTS
($ in millions, except per share data)
based compensation are
$4.4
,
$6.7
, and
$10.9
for fiscal
2017
,
2016
and
2015
, respectively. As of
June 30, 2017
, the total unrecognized share-based compensation expense related to unvested stock options, Series A Preferred Stock and restricted stock units and other share awards is
$31.1
,
$4.3
and
$56.5
, respectively. The unrecognized share-based compensation expense related to unvested stock options, Series A Preferred Stock, restricted stock units and other share awards is expected to be recognized over a weighted-average period of
4.45
,
3.79
and
2.96
years, respectively.
Nonqualified Stock Options
During fiscal
2017
, the Company granted
9.3 million
nonqualified stock option awards. During fiscal
2015
, the Company granted
1.7 million
nonqualified stock option awards to a select group of key executives. These options are accounted for using equity accounting whereby the share-based compensation expense is estimated and fixed at the grant date based on the estimated value of the options using the Black-Scholes valuation model. There were no stock options accounted for under equity plans granted during fiscal 2016.
During fiscal
2017
,
2016
and
2015
, the share-based compensation expense recognized on nonqualified stock options is based upon the fair value on the grant date estimated using the Black-Scholes valuation model with the following weighted-average assumptions:
|
2017
|
2015
|
||
|
Expected life
|
7.50 years
|
7.50 years
|
|
|
Risk-free interest rate
|
1.60%
|
1.79%
|
|
|
Expected volatility
|
36.74%
|
31.73%
|
|
|
Expected dividend yield
|
1.62%
|
0.80%
|
|
Expected life
—The expected life represents the period of time (years) that options granted are expected to be outstanding, which the Company calculates using a formula based on the vesting term and the contractual life of the respective option.
Risk-free interest rate
—The Company bases the risk-free interest rate on the implied yield available on a U.S. Treasury note with a term equal to the expected term of the underlying options.
Expected volatility
—The Company calculates expected volatility based on median volatility for peer companies using expected life daily stock price history equal to the expected life.
Expected dividend yield
—The weighted-average expected dividend yield is based upon the Company’s expectation to pay dividends over the contractual term of the options.
Nonqualified stock options generally become exercisable
5 years
from the date of the grant and have a
5
-year exercise period from the date the grant becomes fully vested for a total contractual life of
10 years
.
The Company’s outstanding nonqualified stock options as of
June 30, 2017
and activity during the fiscal year then ended are presented below:
|
Shares
(in millions)
|
Weighted
Average
Exercise
Price
|
Aggregate
Intrinsic
Value
|
Weighted
Average
Remaining
Contractual
Term (in years)
|
|||||||||
|
Outstanding at July 1, 2016
|
7.3
|
|
$
|
11.25
|
|
|||||||
|
Granted
|
9.3
|
|
18.61
|
|
||||||||
|
Exercised
|
(2.2
|
)
|
9.71
|
|
||||||||
|
Forfeited
|
(2.4
|
)
|
19.31
|
|
||||||||
|
Outstanding at June 30, 2017
|
12.0
|
|
$
|
15.64
|
|
|||||||
|
Vested and expected to vest at June 30, 2017
|
9.4
|
|
$
|
14.98
|
|
$
|
35.5
|
|
6.83
|
|||
|
Exercisable at June 30, 2017
|
4.0
|
|
$
|
9.74
|
|
$
|
36.2
|
|
3.10
|
|||
The grant prices of the outstanding options as of
June 30, 2017
ranged from
$6.40
to
$24.13
. The grant prices for exercisable options ranged from
$6.40
to
$10.50
.
F-58
COTY INC. & SUBSIDIARIES
NOTES TO CONSOLIDATED FINANCIAL STATEMENTS
($ in millions, except per share data)
A summary of the aggregated weighted-average grant date fair value of stock options granted, total intrinsic value of stock options exercised and payment to settle nonqualified stock options for fiscal
2017
,
2016
and
2015
is presented below:
|
2017
|
2016
|
2015
|
|||||||||
|
Weighted-average grant date fair value of stock options
|
$
|
6.34
|
|
$
|
—
|
|
$
|
8.75
|
|
||
|
Intrinsic value of options exercised
|
26.30
|
|
87.60
|
|
77.20
|
|
|||||
|
Payment to settle nonqualified stock options of former CEOs
|
—
|
|
—
|
|
12.00
|
|
|||||
The Company’s non-vested nonqualified stock options as of
June 30, 2017
and activity during the fiscal year then ended are presented below:
|
Shares
(in millions)
|
Weighted
Average
Grant Date
Fair Value
|
|||||
|
Non-vested at July 1, 2016
|
4.4
|
|
$
|
4.81
|
|
|
|
Granted
|
9.3
|
|
18.61
|
|
||
|
Vested
|
(3.3
|
)
|
3.99
|
|
||
|
Forfeited
|
(2.4
|
)
|
6.87
|
|
||
|
Non-vested at June 30, 2017
|
8.0
|
|
$
|
6.33
|
|
|
The share-based compensation expense recognized on the nonqualified stock options is
$9.1
,
$14.7
and
$9.5
during fiscal
2017
,
2016
and
2015
, respectively.
Executive Ownership Programs
The Company encourages stock ownership through various programs. These programs govern shares of Class A Common Stock purchased by employees (“Purchased Shares”). Employees purchased
0.8 million
and
0.1 million
shares in fiscal
2017
and
2016
, respectively, and received matching nonqualified stock options or RSUs in accordance with the terms of the Compensation Plans under the Omnibus LTIP. Share-based compensation (income) expense recorded in connection with Purchased Shares for
fiscal year 2017
,
2016
and
2015
was
nil
,
nil
and
$(0.5)
, respectively. Additionally, share-based compensation expense recorded in connection with matching stock awards granted in accordance with the Compensation Plans are noted in their respective section of this footnote.
Series A Preferred Stock
In addition to the Executive Ownership Programs discussed above, the Series A Preferred Stock are accounted for partially as equity and partially as a liability as of
June 30, 2017
,
2016
and
2015
and the Company recognized an expense of
$4.4
,
$2.0
and
$0.4
in fiscal
2017
,
2016
and
2015
, respectively. See Note
21
—Equity for additional information.
The Series A Preferred Stock were accounted for using the Black-Scholes valuation model in prior fiscal years. In fiscal 2017, the Company granted Series A Preferred Stock that included cash bonus payments tied to the exercisability of the awards. Due to the addition of cash bonus payments in connection with the grant of Series A Preferred Stock to certain executives in fiscal 2017, the Company began estimating the fair value of the Series A Preferred Stock using a binomial lattice model to value the equity and cash bonus components of the combined instrument. The lattice structure the Company uses to value the awards consists of (i) a common stock lattice that models the possible stock price movements from the valuation date to the maturity date consistent with the stock price and estimated volatility on the valuation date; (ii) a share exchange lattice that calculates the value of the common stock received on conversion; (iii) a cash exchange lattice that calculates the value of the cash bonus; and (iv) a continuation value lattice that tracks the holding value of the combined instrument. As of
June 30, 2017
, the fair value of the Company’s outstanding Series A Preferred Stock that are liability accounted were estimated with the following weighted-average assumptions.
|
2017
|
|
|
Expected life, in years
|
5.86 years
|
|
Expected volatility
|
30.00%
|
|
Risk-free rate of return
|
1.99%
|
|
Dividend yield on Class A Common Stock
|
2.67%
|
|
Yield on cash
|
4.70%
|
F-59
COTY INC. & SUBSIDIARIES
NOTES TO CONSOLIDATED FINANCIAL STATEMENTS
($ in millions, except per share data)
Expected life, in years
- The expected life represents the period of time (years) that Series A Preferred Stock granted are expected to be outstanding, which the Company calculates using a formula based on the vesting term and the contractual life of the respective Series A Preferred Stock.
Expected volatility
- The Company calculates expected volatility based on the average of historical and implied volatilities.
Risk-free rate of return
- The Company bases the risk-free rate of return on the US Constant Maturity Treasury Rate.
Dividend yield on Class A Common Stock
- The Company calculated the weighted-average dividend yield on shares using the annualized dividend rate calculated on the per share cash dividend paid quarterly and the stock price as of the valuation date.
Yield on cash -
The Company calculated the weighted-average yield of comparable securities with a similar credit rating to the Company as of
June 30, 2017
.
The fair value of the Company’s outstanding Series A Preferred Stock liability on
June 30, 2016
and
2015
was estimated using the Black-Scholes valuation model with the following assumptions:
|
2016
|
2015
|
||
|
Expected life
|
4.79 years
|
5.79 years
|
|
|
Risk-free interest rate
|
1.01%
|
1.96%
|
|
|
Expected volatility
|
36.74%
|
26.14%
|
|
|
Expected dividend yield
|
0.96%
|
0.63%
|
|
Expected life
-The expected life represents the period of time (years) that Series A Preferred Stock granted are expected to be outstanding, which the Company calculates using a formula based on the vesting term and the contractual life of the respective Series A Preferred Stock.
Risk-free interest rate
-The Company bases the risk-free interest rate on the implied yield available on a U.S. Treasury note with a term equal to the expected term of the underlying Series A Preferred Stock.
Expected volatility
-The Company calculates expected volatility based on median volatility for peer companies using
4.79
years and
5.79
years of daily stock price history as of
June 30, 2016
and
2015
, respectively.
Expected dividend yield
-The Company used an expected dividend yield based upon the Company’s expectation to pay dividends over the contractual term of the shares of Series A Preferred Stock.
Shares of Series A Preferred Stock generally become exercisable
5
years from the date of the grant and have a
2
-year exercise period from the date the grant becomes fully vested for a total contractual life of
7
years. See Note
21
—Equity for additional information.
The Company’s outstanding Series A Preferred Shares as of
June 30, 2017
and activity during the fiscal year then ended are presented below:
|
Shares
(in millions) |
Weighted
Average Exercise Price |
Aggregate Intrinsic Value
|
Weighted Average Remaining Contractual Term (in years)
|
|||||||||
|
Outstanding at July 1, 2016
|
1.7
|
|
$
|
27.97
|
|
|||||||
|
Granted
|
2.5
|
|
22.42
|
|
||||||||
|
Outstanding at June 30, 2017
|
4.2
|
|
$
|
24.66
|
|
|||||||
|
Vested and expected to vest at June 30, 2017
|
3.7
|
|
$
|
24.57
|
|
$
|
—
|
|
5.90
|
|||
The Company’s non-vested shares of Series A Preferred Stock as of
June 30, 2017
and activity during the fiscal year then ended are presented below:
F-60
COTY INC. & SUBSIDIARIES
NOTES TO CONSOLIDATED FINANCIAL STATEMENTS
($ in millions, except per share data)
|
Shares
(in millions) |
Weighted
Average Grant Date Fair Value |
|||||
|
Non-vested at July 1, 2016
|
1.7
|
|
$
|
5.24
|
|
|
|
Granted
|
2.5
|
|
4.53
|
|
||
|
Vested
|
(1.0
|
)
|
3.63
|
|
||
|
Non-vested at June 30, 2017
|
3.2
|
|
$
|
5.19
|
|
|
Restricted Share Units
During fiscal
2017
,
2.7 million
RSUs were granted under the Omnibus LTIP and
0.1 million
RSUs were granted under the 2007 Stock Plan for Directors. During fiscal
2016
,
$1.2 million
RSUs were granted under the Omnibus LTIP and
$0.1 million
RSUs were granted under the 2007 Stock Plan for Directors.
The Company’s outstanding RSUs as of
June 30, 2017
and activity during the fiscal year then ended are presented below:
|
Shares
(in millions)
|
Aggregate
Intrinsic
Value
|
Weighted
Average
Remaining
Contractual
Term
|
||||||
|
Outstanding at July 1, 2016
|
4.2
|
|
||||||
|
Granted
|
2.8
|
|
||||||
|
Settled
|
(0.2
|
)
|
||||||
|
Cancelled
|
(1.2
|
)
|
||||||
|
Outstanding at June 30, 2017
|
5.6
|
|
||||||
|
Vested and expected to vest at June 30, 2017
|
4.6
|
|
$
|
85.9
|
|
2.75
|
||
The share-based compensation expense recorded in connection with the RSUs was
$15.4
,
$18.2
and
$9.7
during fiscal
2017
,
2016
and
2015
, respectively.
The Company’s outstanding and non-vested RSUs as of
June 30, 2017
and activity during the fiscal year then ended are presented below:
|
Shares
(in millions)
|
Weighted
Average
Grant Date
Fair Value
|
|||||
|
Outstanding and nonvested at July 1, 2016
|
3.9
|
|
$
|
19.75
|
|
|
|
Granted
|
2.8
|
|
24.56
|
|
||
|
Vested
|
(0.2
|
)
|
15.63
|
|
||
|
Cancelled
|
(1.2
|
)
|
19.45
|
|
||
|
Outstanding and nonvested at June 30, 2017
|
5.3
|
|
$
|
21.76
|
|
|
The total intrinsic value of RSUs vested and settled during fiscal
2017
,
2016
, and
2015
is
$3.5
,
$4.0
and
$6.2
, respectively.
Special Share Purchase Transaction
As noted in Note
21
—Equity, JABC sold
1.7 million
shares of its Class B shares to certain Coty executives and individuals intended to become Coty executives. One of these individuals purchased
1.4 million
shares on March 13, 2015 at a purchase price representing a discount of
$1.9
below the market price on the purchase date, which was determined to be share-based compensation expense to the Company. Subsequently, the individual that had purchased
1.4 million
shares on March 13, 2015 indicated a desire to sell the Class A Common Stock back to JABC. JABC entered into an agreement and repurchased these shares on July 8, 2015 at the market price on that date. At June 30, 2015, the Company determined that the individual was not expected to hold the shares for a period of at least
six
months and therefore, the shares should be deemed compensatory and accounted for under liability plan accounting. The Company recorded a total of
$15.8
share-based compensation expense to Selling, general and administrative expense which includes: (a)
$1.9
for the discount recorded to APIC and (b)
$13.9
for the difference between the market price of the shares as of June 30, 2015 and the original sale date of March 13, 2015 recorded to Accrued expenses and other current liabilities.
F-61
COTY INC. & SUBSIDIARIES
NOTES TO CONSOLIDATED FINANCIAL STATEMENTS
($ in millions, except per share data)
From June 30, 2015 until the date the liability was settled by JABC, the value of the obligation declined
$0.1
, which was recorded as a reduction of stock compensation expense. On July 8, 2015, JABC repurchased the shares. The settlement of the liability of
$13.8
is considered a non-cash capital contribution to the Company and therefore was recorded in Additional paid-in capital.
Phantom Units
On July 21, 2015, the Board granted Lambertus J.H. Becht (“Mr. Becht”), the Company’s Chairman of the Board and interim Chief Executive Officer (“CEO”), an award of
300,000
phantom units, in consideration of Mr. Becht’s increased and continuing responsibilities as interim CEO of the Company. At the time of grant, the phantom units had a value of
$8.1
based on the closing price of the Company’s Class A Common Stock on July 21, 2015. Each phantom unit has an economic value equivalent to
one
share of the Company’s Class A Common Stock settleable in cash or shares at the election of Mr. Becht. The award to Mr. Becht was made outside of the Company’s Omnibus LTIP. On July 24, 2015, Mr. Becht elected to receive payment of the phantom units in the form of shares of Class A Common Stock and the phantom units were valued at
$8.0
. The phantom units will be settled in shares of Class A Common Stock on the fifth anniversary of the grant date or, in the event of a change of control or Mr. Becht’s death or disability, immediately. The Company recognized
$8.0
of share-based compensation expense during the fiscal year ended June 30, 2016 as there are no service or performance conditions with respect to the phantom units.
23
. NET (LOSS) INCOME ATTRIBUTABLE TO COTY INC. PER COMMON SHARE
Net (loss) income attributable to Coty Inc. per common share (“basic EPS”) is computed by dividing net income (loss) attributable to Coty Inc. by the weighted-average number of common shares outstanding during the period. Net income (loss) attributable to Coty Inc. per common share assuming dilution (“diluted EPS”) is computed by using the basic EPS weighted-average number of common shares and the effect of potentially dilutive securities outstanding during the period. Potentially dilutive securities consist of nonqualified stock options, Series A Preferred Stock and RSUs as of
June 30, 2017 and 2016
. The dilutive effect of these outstanding instruments is reflected in diluted EPS by application of the treasury stock method.
Net (loss) income attributable to Coty Inc. is adjusted through the application of the two-class method of income per share to reflect a portion of the periodic adjustment of the redemption value in excess of fair value of the redeemable noncontrolling interests. There is no excess of redemption value over fair value of the redeemable noncontrolling interests in fiscal
2017
,
2016
and
2015
. In addition, there are no participating securities requiring the application of the two-class method of income per share.
Reconciliation between the numerators and denominators of the basic and diluted EPS computations is presented below:
|
Year Ended June 30,
|
|||||||||||
|
2017
|
2016
|
2015
|
|||||||||
|
Net (loss) income attributable to Coty Inc.
|
$
|
(422.2
|
)
|
$
|
156.9
|
|
$
|
232.5
|
|
||
|
Weighted-average common shares outstanding—Basic
|
642.8
|
|
345.5
|
|
353.3
|
|
|||||
|
Effect of dilutive stock options and Series A Preferred Stock
(a)
|
—
|
|
5.7
|
|
7.6
|
|
|||||
|
Effect of restricted stock and RSUs
(b)
|
—
|
|
3.0
|
|
2.0
|
|
|||||
|
Weighted-average common shares outstanding—Diluted
|
642.8
|
|
354.2
|
|
362.9
|
|
|||||
|
Net (loss) income attributable to Coty Inc. per common share:
|
|||||||||||
|
Basic
|
$
|
(0.66
|
)
|
$
|
0.45
|
|
$
|
0.66
|
|
||
|
Diluted
|
(0.66
|
)
|
0.44
|
|
0.64
|
|
|||||
|
(a)
|
As of
June 30, 2017
, outstanding stock options and Series A Preferred Stock with purchase or conversion rights to purchase shares of common stock were excluded in the computation of diluted loss per share due to the net loss incurred during the period. As of
June 30, 2016
and
2015
, outstanding stock options and Series A Preferred Stock to purchase
3.0 million
and
0.7 million
shares of Common Stock, respectively, are excluded from the computation of diluted EPS as their inclusion would be anti-dilutive.
|
|
(b)
|
As of
June 30, 2017
, RSUs were excluded in the computation of diluted loss per share due to the net loss incurred during the period. As of
June 30, 2016
and
2015
, there were
0.1 million
and
0.4 million
anti-dilutive RSUs excluded from the computation of diluted EPS as their inclusion would be anti-dilutive.
|
24
. COMMITMENTS AND CONTINGENCIES
Legal Matters
F-62
COTY INC. & SUBSIDIARIES
NOTES TO CONSOLIDATED FINANCIAL STATEMENTS
($ in millions, except per share data)
The Company is involved, from time to time, in various litigation and administrative and other legal proceedings including regulatory actions, incidental or related to its business, including consumer class or collective action, personal injury, intellectual property, competition, and advertising claims litigation, among others (“Legal Proceedings”). While the Company cannot predict any final outcomes relating thereto, management believes that the outcome of current Legal Proceedings will not have a material effect upon its business, prospects, financial condition, results of operations, cash flows, as well as the trading price of the Company’s securities. However, management’s assessment of the Company’s Legal Proceedings, especially those related to the P&G Beauty Business and its other recently completed acquisitions, is ongoing, and could change in light of the discovery of additional facts with respect to Legal Proceedings pending against the Company not presently known to the Company or determinations by judges, arbitrators, juries or other finders of fact or deciders of law which are not in accord with management’s evaluation of the probable liability or outcome of such Legal Proceedings. From time to time, the Company is in discussions with regulators, including discussions initiated by the Company, about actual or potential violations of law in order to remediate or mitigate associated legal or compliance risks. As the outcomes of such proceedings are unpredictable, the Company can give no assurance that the results of any such proceedings will not materially affect its reputation, its business, prospects, financial condition, results of operations, cash flows, as well as the trading price of its securities.
Burberry Beauty Business
On April 3, 2017, the Company entered into an agreement with Burberry Limited (“Burberry”) to acquire the exclusive long-term global license rights to develop, manufacture, advertise, promote and distribute Burberry Beauty luxury fragrances, cosmetics and skincare (the “Burberry License Agreement”). Upfront consideration for this license will total
£130.0 million
and is expected to be paid at the commencement of the licensing arrangement, in the second quarter of fiscal 2018. The Company will be required to make annual license fee payments, subject to license fee minimums, to Burberry over the term of the Burberry License Agreement. The Company is also expected to pay to Burberry approximately
£50.0 million
for inventory at the closing.
25
. SUBSEQUENT EVENTS
Quarterly Dividend
On August 22, 2017, the Company announced a quarterly cash dividend of
$0.125
per share on its Common Stock, restricted stock units (the “RSUs”) and phantom units. The dividend will be payable on September 14, 2017 to holders of record of Common Stock on September 1, 2017.
F-63
COTY INC. & SUBSIDIARIES
SCHEDULE II - VALUATION AND QUALIFYING ACCOUNTS
Years Ended June 30,
2017
,
2016
, and
2015
($ in millions, except per share data)
Valuation and Qualifying Accounts
|
Description
|
Three Years Ended June 30,
|
|||||||||||||||||||||
|
Balance at
Beginning of Period |
Balance Received through Acquisition
|
Charged to
Costs and Expenses |
Deductions
|
Balance at
End of Period |
||||||||||||||||||
|
Allowance for doubtful accounts:
|
||||||||||||||||||||||
|
2017
|
$
|
35.2
|
|
$
|
—
|
|
$
|
32.8
|
|
$
|
(9.5
|
)
|
(a)
|
$
|
58.5
|
|
||||||
|
2016
|
19.6
|
|
—
|
|
21.9
|
|
(6.3
|
)
|
(a)
|
35.2
|
|
|||||||||||
|
2015
|
16.7
|
|
—
|
|
4.5
|
|
(1.6
|
)
|
(a)
|
19.6
|
|
|||||||||||
|
Allowance for customer returns:
|
||||||||||||||||||||||
|
2017
|
$
|
57.3
|
|
$
|
11.4
|
|
$
|
165.7
|
|
$
|
(167.1
|
)
|
$
|
67.3
|
|
|||||||
|
2016
|
59.9
|
|
—
|
|
132.8
|
|
(135.4
|
)
|
57.3
|
|
||||||||||||
|
2015
|
87.3
|
|
—
|
|
153.9
|
|
(181.3
|
)
|
59.9
|
|
||||||||||||
|
Deferred tax valuation allowances:
|
||||||||||||||||||||||
|
2017
|
$
|
179.2
|
|
$
|
—
|
|
$
|
9.2
|
|
(b)
|
$
|
(128.1
|
)
|
$
|
60.3
|
|
||||||
|
2016
|
81.9
|
|
—
|
|
117.9
|
|
(b)
|
(20.6
|
)
|
179.2
|
|
|||||||||||
|
2015
|
98.6
|
|
—
|
|
7.9
|
|
(b)
|
(24.6
|
)
|
81.9
|
|
|||||||||||
|
(a)
|
Includes amounts written-off, net of recoveries and cash discounts.
|
|
(b)
|
Includes foreign currency translation adjustments unless otherwise noted.
|
S-1
TABLE OF CONTENTS
Part IItem 1. BusinessItem 1A. Risk FactorsItem 1B. Unresolved Staff CommentsItem 2. PropertiesItem 3. Legal ProceedingsPart IIItem 5. Market For Registrant S Common Equity, Related Stockholder Matters and Issuer Purchases Of Equity SecuritiesItem 6. Selected Financial DataItem 7. Management S Discussion and Analysis Of Financial Condition and Results Of OperationsItem 7A. Quantitative and Qualitative Disclosures About Market RiskItem 8. Financial Statements and Supplementary DataItem 9A. Controls and ProceduresPart IIIItem 10. Directors, Executive Officers and Corporate GovernanceItem 11. Executive CompensationItem 12. Security Ownership Of Certain Beneficial Owners and Management and Related Stockholder MattersItem 13. Certain Relationships and Related Transactions, and Director IndependenceItem 14. Principal Accounting Fees and ServicesPart IVItem 15. Exhibits, Financial Statement Schedules