UNITED STATES
SECURITIES AND EXCHANGE COMMISSION
Washington, D.C. 20549
FORM 10-K
(Mark one)
|
x
|
ANNUAL REPORT PURSUANT TO SECTION 13 OR 15(d) OF THE SECURITIES AND EXCHANGE ACT OF 1934
|
For fiscal year ended December 31,
2017
OR
|
o
|
TRANSITION REPORT PURSUANT TO SECTION 13 OR 15(d) OF THE SECURITIES EXCHANGE ACT OF 1934
|
For the transition period from to
Commission File Number 001-01342
Canadian Pacific Railway Limited
(Exact name of registrant as specified in its charter)
|
Canada
|
|
98-0355078
|
|
(State or Other Jurisdiction
of Incorporation or Organization)
|
|
(IRS Employer
Identification No.)
|
|
|
|
|
|
7550 Ogden Dale Road S.E.,
Calgary, Alberta, Canada
|
|
T2C 4X9
|
|
(Address of Principal Executive Offices)
|
|
(Zip Code)
|
Registrant’s Telephone Number, Including Area Code: (403) 319-7000
Securities registered pursuant to Section 12(b) of the Act:
|
|
Title of Each Class
|
|
|
|
Name of Each Exchange on which Registered
|
|
|
Common Shares, without par value
|
|
New York Stock Exchange
|
||||
Securities registered pursuant to Section 12(g) of the Act: None
Indicate by check mark if the registrant is a well-known seasoned issuer, as defined in Rule 405 of the Securities Act.
Yes
þ
No
o
Indicate by check mark if the registrant is not required to file reports pursuant to Section 13 or Section 15(d) of the Exchange Act.
Yes
o
No
þ
Indicate by check mark whether the registrant (1) has filed all reports required to be filed by Section 13 or 15(d) of the Securities Exchange Act of 1934 during the preceding 12 months (or for such shorter period that the registrant was required to file such reports), and (2) has been subject to such filing requirements for the past 90 days. Yes
þ
No
o
Indicate by check mark whether the registrant has submitted electronically and posted on its corporate Web site, if any, every Interactive Data File required to be submitted and posted pursuant to Rule 405 of Regulation S-T during the preceding 12 months (or for such shorter period that the registrant was required to submit and post such files). Yes
þ
No
o
Indicate by check mark if disclosure of delinquent filers pursuant to Item 405 of Regulation S-K is not contained herein, and will not be contained, to the best of registrant’s knowledge, in definitive proxy or information statements incorporated by reference in Part III of this Form 10-K or any amendment to this Form 10-K.
þ
Indicate by check mark whether the registrant is a large accelerated filer, an accelerated filer, a non-accelerated filer, or a smaller reporting company. See the definitions of “large accelerated filer,” “accelerated filer,” “smaller reporting company,” and "emerging growth company" in Rule 12b-2 of the Exchange Act.
|
Large accelerated filer
þ
|
Accelerated filer
o
|
Non-accelerated filer
o
|
Smaller reporting company
o
|
Emerging growth company
o
|
||||
If an emerging growth company, indicate by check mark if the registrant has elected not to use the extended transition period for complying with any new or revised financial accounting standards provided pursuant to Section 13(a) of the Exchange Act.
o
Indicate by check mark whether the registrant is a shell company (as defined in Rule 12b-2 of the Exchange Act). Yes
o
No
þ
As of June 30,
2017
the last business day of the registrant's most recently completed second fiscal quarter, the aggregate market value of the voting stock held by non-affiliates of the registrant, in U.S. dollars, was $23,490,374,139, based on the closing sales price per share as reported by the New York Stock Exchange on such date.
As of the close of business on
February 14, 2018
, there were 144,212,716 shares of the registrant's Common Stock outstanding.
DOCUMENTS INCORPORATED BY REFERENCE
Not applicable.
EXPLANATORY NOTE
Canadian Pacific Railway Limited ("CPRL"), a corporation incorporated under the
Canada Business Corporations Act
, qualifies as a foreign private issuer in the U.S. for purposes of
the Securities Exchange Act of 1934
, as amended (the “Exchange Act”). Although as a foreign private issuer the Company is no longer required to do so, the Company currently continues to file annual reports on Form 10-K, quarterly reports on Form 10-Q, and current reports on Form 8-K with the Securities and Exchange Commission (“SEC”) instead of filing the reporting forms available to foreign private issuers.
CPRL prepares and files a management proxy circular and related material under Canadian requirements. As the Company’s management proxy circular is not filed pursuant to Regulation 14A, the Company may not incorporate by reference information required by Part III of this Form 10-K from its management proxy circular. Accordingly, in reliance upon and as permitted by Instruction G(3) to Form 10-K, the Company will be filing an amendment to this Form 10-K containing the Part III information no later than 120 days after the end of the fiscal year covered by this Form 10-K. All references to our websites contained herein do not constitute incorporation by reference of information contained on such websites and such information should not be considered part of this document.
CANADIAN PACIFIC RAILWAY LIMITED
FORM 10-K
TABLE OF CONTENTS
|
|
PART I
|
|
|
Page
|
||
|
Item 1.
|
Business
|
|
|
Item 1A.
|
Risk Factors
|
|
|
Item 1B.
|
Unresolved Staff Comments
|
|
|
Item 2.
|
Properties
|
|
|
Item 3.
|
Legal Proceedings
|
|
|
Item 4.
|
Mine Safety Disclosures
|
|
|
Executive Officers of the Registrant
|
||
|
PART II
|
||
|
Item 5.
|
Market for Registrant's Common Equity, Related Shareholder Matters and Issuer Purchases of
|
|
|
Equity Securities
|
||
|
Item 6.
|
Selected Financial Data
|
|
|
Item 7.
|
Management's Discussion and Analysis of Financial Condition and Results of Operations
|
|
|
Item 7A.
|
Quantitative and Qualitative Disclosures About Market Risk
|
|
|
Item 8.
|
Financial Statements and Supplementary Data
|
|
|
Item 9.
|
Changes in and Disagreements With Accountants on Accounting and Financial Disclosure
|
|
|
Item 9A.
|
Controls and Procedures
|
|
|
Item 9B.
|
Other Information
|
|
|
PART III
|
||
|
Item 10.
|
Directors, Executive Officers and Corporate Governance
|
|
|
Item 11.
|
Executive Compensation
|
|
|
Item 12.
|
Security Ownership of Certain Beneficial Owners and Management and Related
|
|
|
Shareholder Matters
|
||
|
Item 13.
|
Certain Relationships and Related Transactions, and Director Independence
|
|
|
Item 14.
|
Principal Accounting Fees and Services
|
|
|
PART IV
|
||
|
Item 15.
|
Exhibits, Financial Statement Schedule
|
|
|
Signatures
|
||
3
Company Overview
Canadian Pacific Railway Limited (“CPRL”), together with its subsidiaries (“CP” or the “Company”), owns and operates a transcontinental freight railway in Canada and the United States (“U.S.”). CP's diverse business mix includes bulk commodities, merchandise freight and intermodal traffic over a network of approximately
12,500
miles, serving the principal business centres of Canada from Montreal, Quebec, to Vancouver, British Columbia ("B.C."), and the U.S. Northeast and Midwest regions. Agreements with other carriers extend the Company's market reach east of Montreal in Canada, through the U.S. and into Mexico. For additional information regarding CP's network and geographical locations, refer to Item 2. Properties.
CPRL was incorporated on June 22, 2001, under the Canada Business Corporations Act and controls and owns all of the Common Shares of Canadian Pacific Railway Company (“CPRC”), which was incorporated in 1881 by Letters Patent pursuant to an Act of the Parliament of Canada. The Company’s registered, executive and corporate head office is located at 7550 Ogden Dale Road S.E., Calgary, Alberta T2C 4X9. CP's Common Shares are listed on the Toronto Stock Exchange (“TSX”) and the New York Stock Exchange (“NYSE”) under the symbol “CP”.
For purposes of this report, all references herein to “CP,” “the Company,” “we,” “our” and “us” refer to CPRL, CPRL and its subsidiaries, CPRL and one or more of its subsidiaries, or one or more of CPRL's subsidiaries, as the context may require. All references to currency amounts included in this annual report, including the Consolidated Financial Statements, are in Canadian dollars unless specifically noted otherwise.
Strategy
In 2012, CP began a transformational journey to become the best railroad in North America, with a long-term strategy centred on five key foundations:
|
•
|
Provide Service:
Providing efficient and consistent transportation solutions for the Company’s customers. “Doing what we say we are going to do” is what drives CP in providing a reliable product with a lower cost operating model. Centralized planning aligned with local execution is bringing the Company closer to the customer and accelerating decision-making.
|
|
•
|
Control Costs
: Controlling and removing unnecessary costs from the organization, eliminating bureaucracy and continuing to identify productivity enhancements are the keys to success.
|
|
•
|
Optimize Assets
: Through faster train speeds, improved asset utilization and increased train lengths, the Company is moving increased volumes with fewer locomotives and cars while unlocking capacity for future growth potential.
|
|
•
|
Operate Safely
: Each year, CP safely moves millions of carloads of freight across North America while ensuring the safety of our people and the communities through which we operate. Safety is never to be compromised. CP strives for continuous implementation of state-of-the-art safety technology, safety management systems, and safety culture with our employees to ensure safe, efficient operations across our network.
|
|
•
|
Develop People
: CP recognizes that none of the other foundations can be achieved without its people. Every CP employee is a railroader and the Company is shaping a new culture focused on a passion for service with integrity in everything it does. Coaching and mentoring managers into becoming leaders will help drive CP forward.
|
During the turnaround, CP transformed its operations by investing in the network and executing a precision railroading model that lowers costs, optimizes assets, and provides better, more competitive service.
Today, the long-term strategy remains the same: leverage our lower cost base, network strengths and improved service to drive sustainable, profitable growth. While the accomplishments during the turnaround were tremendous, CP’s journey to become North America’s best-performing rail carrier is far from over. We continue to build on this strong foundation, focused on the next level of productivity, service, and innovation to generate value for our customers and deliver results for our shareholders.
Business Developments
As of June 30, 2017, CP qualified as a foreign private issuer in the U.S. for purposes of the Exchange Act as a result of changes to the Company's Board, as evaluated at June 30, 2017. Although as a foreign private issuer CP is no longer required to do so, the Company currently continues to file annual reports on the Form 10-K, quarterly reports on Form 10-Q, and current reports on Form 8-K with the SEC instead of filing the reporting forms available to foreign private issuers. The Company prepares and files a management proxy circular and related material under Canadian requirements.
4
Change in Executive Officers
On October 17, 2017, the Board of Directors appointed Mr. Nadeem Velani to the position of Executive Vice-President and Chief Financial Officer ("CFO") from the position of Vice-President and CFO, and Mr. Laird Pitz to the position of Senior Vice-President and Chief Risk Officer ("CRO") from the position of Vice-President and CRO.
On May 1, 2017, Peter J. Edwards retired from the Company from the position of Vice-President, People.
On February 14, 2017, the Company appointed Mr. John Brooks as Chief Marketing Officer ("CMO").
On January 27, 2017, Mr. Mark Wallace began a leave of absence from the Company and no longer served as Vice-President, Corporate Affairs and Chief of Staff of the Company. He subsequently resigned from CP.
On January 18, 2017, the Company announced Mr. Keith Creel as President and Chief Executive Officer ("CEO") of the Company, effective January 31, 2017, following the decision of Mr. E. Hunter Harrison to retire from CP.
Change in Board of Directors
On November 9, 2017, Mr. William R. Fatt resigned from the Company's Board of Directors.
On January 31, 2017, Mr. E. Hunter Harrison resigned as a member of the Company’s Board of Directors.
On January 1, 2017, Mr. Gordon Trafton II was appointed as a member of the Company's Board of Directors.
Operations
The Company operates in only one operating segment: rail transportation. Although the Company provides a breakdown of revenue by business line, the overall financial and operational performance of the Company is analyzed as one segment due to the integrated nature of the rail network. Additional information regarding the Company's business and operations, including revenue and financial information, and information by geographic location is presented in Item 7. Management’s Discussion and Analysis of Financial Condition and Results of Operations, and Item 8. Financial Statements and Supplementary Data, Note 25 Segmented and geographic information.
Lines of Business
The Company transports bulk commodities, merchandise freight and intermodal traffic. Bulk commodities, which typically move in large volumes across long distances, include Grain, Coal, Potash, and Fertilizers and sulphur. Merchandise freight consists of industrial and consumer products, such as energy, chemicals, Metals, minerals and consumer products, Automotive and Forest products. Intermodal traffic consists largely of retail goods in overseas containers that can be transported by train, ship and truck and in domestic containers and trailers that can be moved by train and truck.
The Company’s revenues are primarily derived from transporting freight. The following chart shows the Company's freight revenue by each line of business in
2017
:

5
In
2017
, the Company generated freight revenues totalling
$6,375 million
(
$6,060 million
in
2016
and
$6,552 million
in
2015
). The following charts compare the percentage of the Company’s total freight revenues derived from each of the three major business lines in
2017
,
2016
and
2015
:

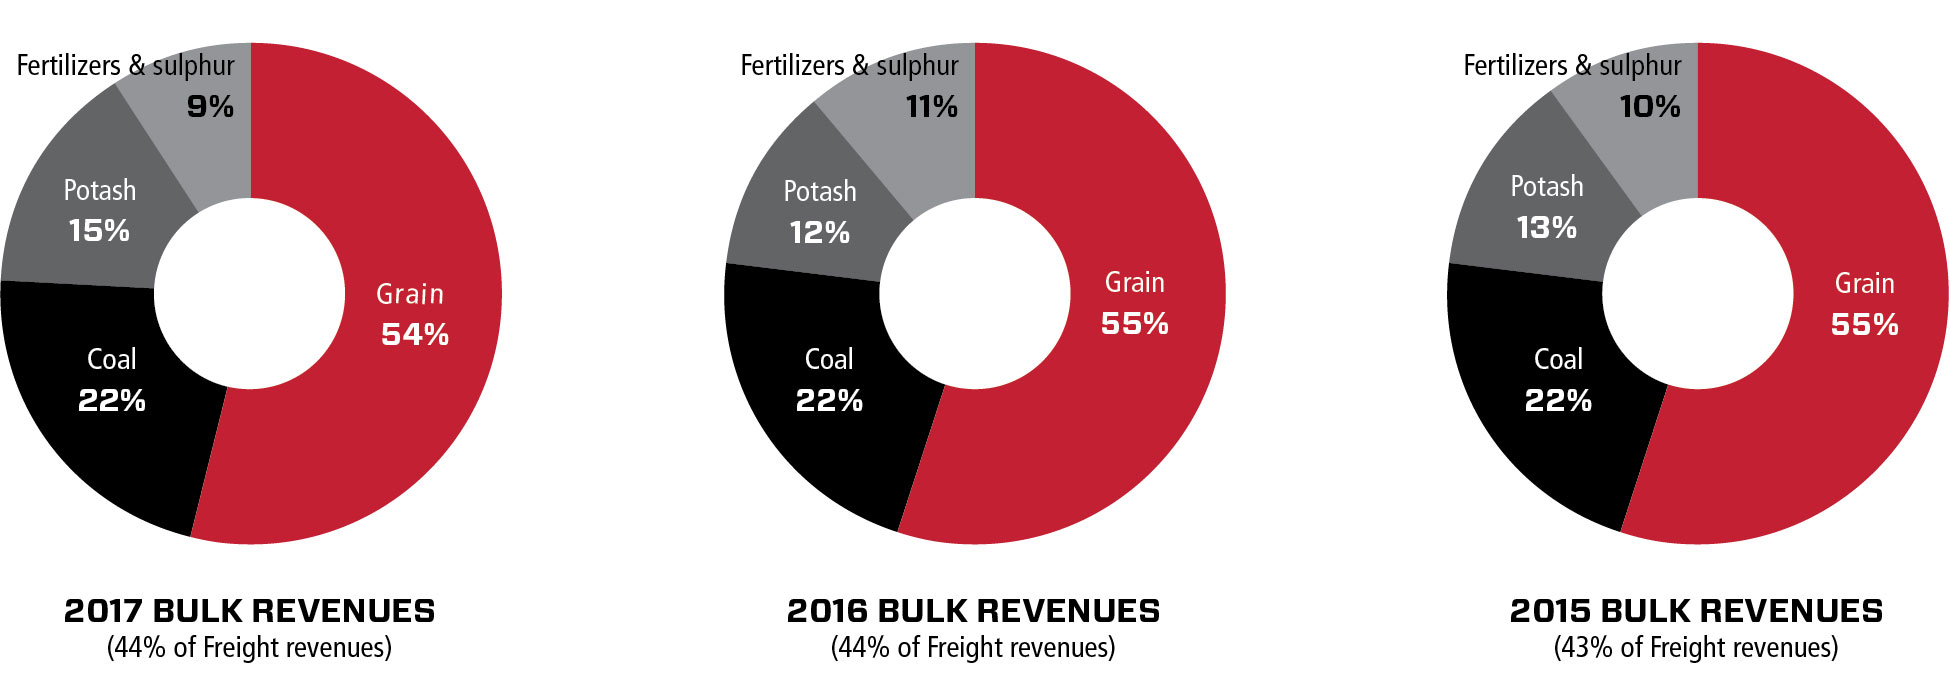
BULK
The Company’s Bulk business represented approximately
44%
of total freight revenues in
2017
.
The following charts compare the percentage of the Company's Bulk freight revenues by commodity business in
2017
,
2016
and
2015
:
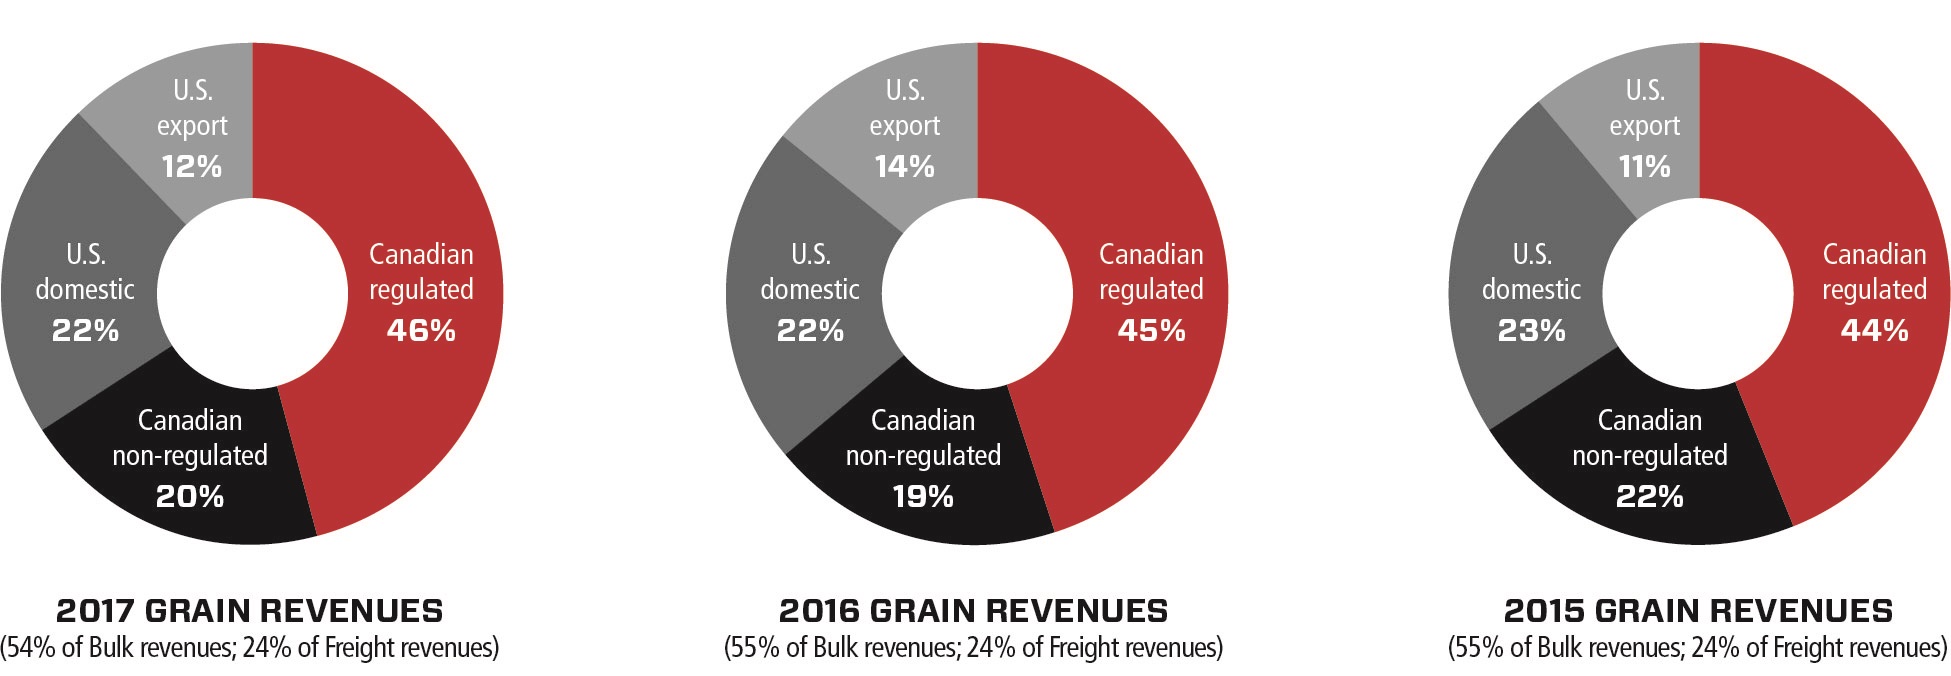
Grain
The Company’s grain business represented approximately
54%
of Bulk revenues, which is
24%
of total freight revenues in
2017
.
The following charts compare the percentage of the Company's Grain freight revenues generated from Canadian and U.S. shipments in
2017
,
2016
and
2015
:
6
CP's grain network is unique among railways in North America as it is strategically positioned in the heart of grain-producing regions of Western Canada and the Northern Plains of the U.S. Canadian grain transported by CP consists of both whole grains, such as wheat, canola, durum, soybeans and pulses, and processed products such as meals, oils and malt. This business is centred in the Canadian Prairies (Alberta, Saskatchewan and Manitoba), with grain shipped primarily west to the Port of Vancouver, and east to the Port of Thunder Bay for export. Grain is also shipped to the U.S., to eastern Canada, and to Mexico for domestic consumption.
Canadian grain includes a division of business that is regulated by the Canadian government through the Canada Transportation Act (“CTA”). This regulated business is subject to a maximum revenue entitlement (“MRE”). Under this regulation, railroads can set their own rates for individual movements. However, the MRE governs aggregate revenue earned by the railroad based on a formula that factors in the total volumes, length of haul, average revenue per ton and inflationary adjustments. The regulation applies to western Canadian export grain shipments to the ports of Vancouver and Thunder Bay.
U.S. grain transported by CP consists of both whole grains, such as wheat, durum, corn and soybeans, and processed products such as meals, oils and flour. This business is centred in the states of Minnesota, North Dakota, South Dakota, and Iowa. Grain destined for domestic consumption moves east via Chicago, to the U.S. Northeast or is interchanged with other carriers to the U.S. Pacific Northwest and U.S. Southeast. In partnership with other railroads, CP also moves grain to export terminals in the U.S. Pacific Northwest and the Gulf of Mexico. Export grain traffic is shipped to ports at Superior and Duluth.
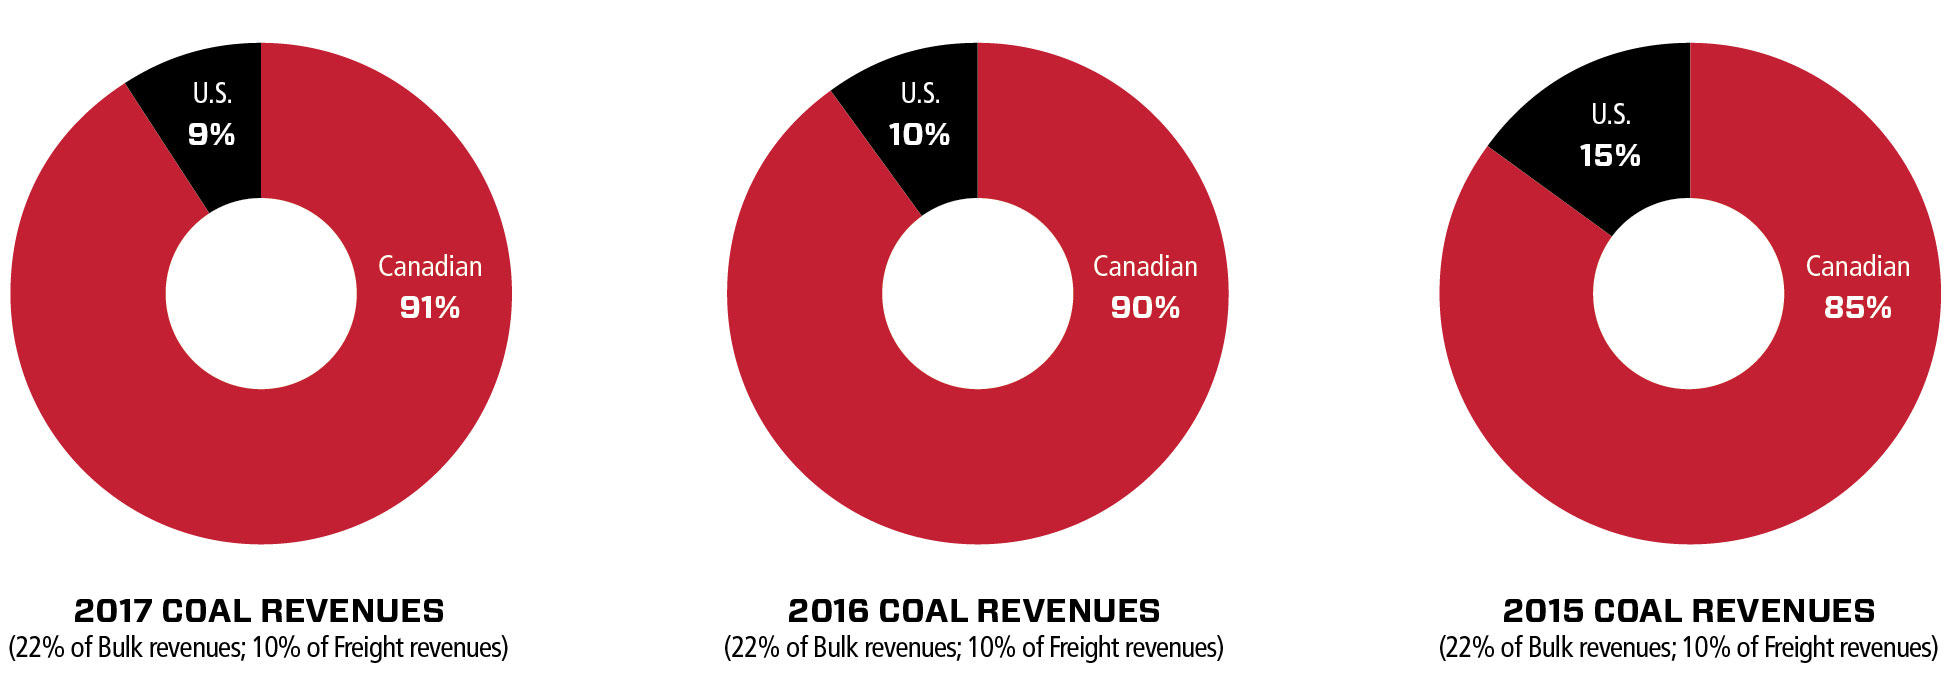
Coal
The Company’s Coal business represented approximately
22%
of Bulk revenues, which is
10%
of total freight revenues in
2017
.
The following charts compare the percentage of the Company's Coal freight revenues generated from Canadian and U.S. shipments in
2017
,
2016
and
2015
:
CP handles mostly metallurgical coal destined for export for use in the steelmaking process. CP’s Canadian coal traffic originates mainly from Teck Resources Limited’s mines in southeastern B.C. CP moves coal west from these mines to port terminals for export to world markets (Pacific Rim, Europe and South America), and east for the U.S. Midwest markets.
7
In the U.S., CP moves primarily thermal coal from connecting railways, serving the thermal coal fields in the Powder River Basin in Montana and Wyoming, which is delivered to power-generating facilities in the U.S. Midwest.
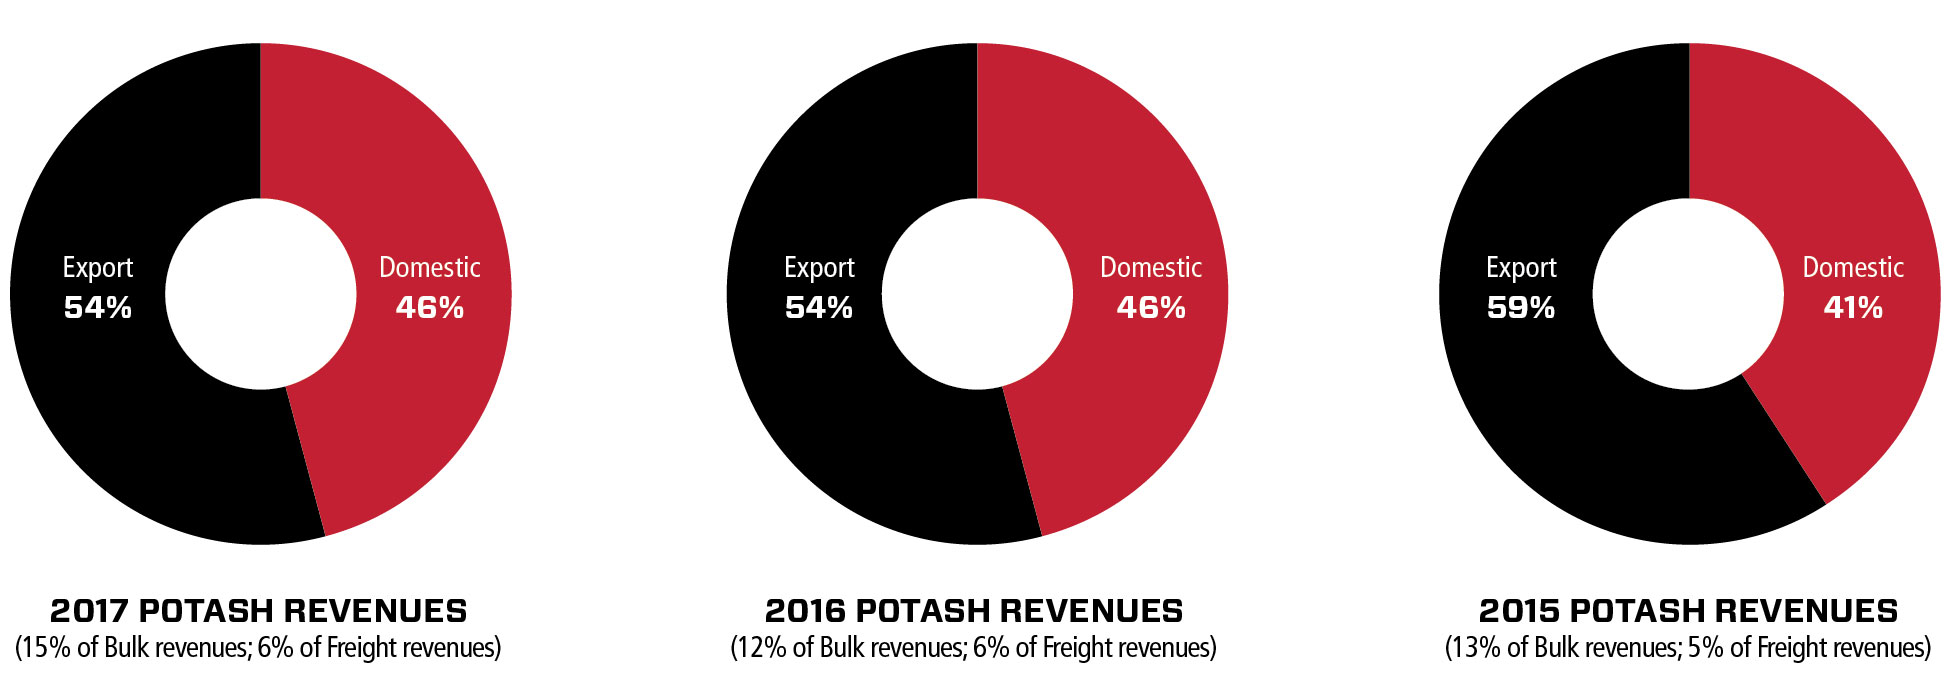
Potash
The Company's Potash business represented approximately
15%
of Bulk revenues, which is
6%
of total freight revenues in
2017
.
The following charts compare the percentage of the Company's Potash freight revenues generated from domestic and export potash shipments in
2017
,
2016
and
2015
:
The Company’s Potash traffic moves mainly from Saskatchewan to offshore markets through the ports of Vancouver, B.C., Portland and Thunder Bay, and to markets in the U.S. All potash shipments for export beyond Canada and the U.S. are marketed by Canpotex Limited, a joint venture among Saskatchewan’s potash producers, and K+S Potash Canada. Independently, these producers move domestic potash with CP primarily to the U.S. Midwest for local application.
Fertilizers and Sulphur
The Company's Fertilizers and sulphur business represented approximately
9%
of Bulk revenues, which is
4%
of total freight revenues in
2017
.
The following charts compare the percentage of the Company's Fertilizers and sulphur freight revenues generated from wet fertilizers, dry fertilizers, and sulphur transportation in
2017
,
2016
and
2015
:
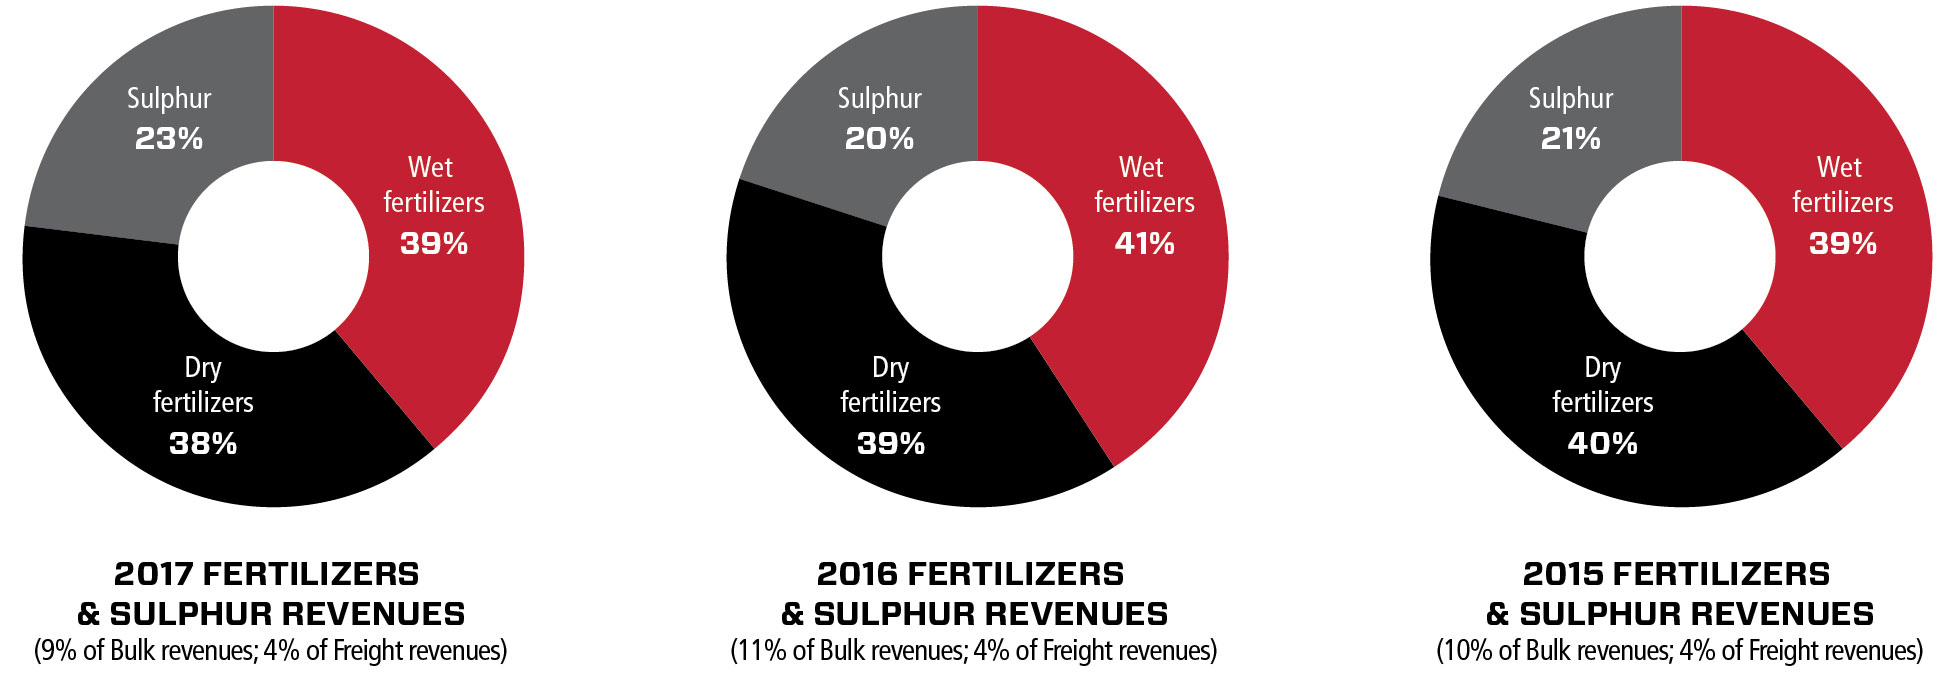
Dry fertilizers include: phosphate, urea, and ammonium sulphate and nitrate; wet fertilizers are primarily anhydrous ammonia. Roughly half of CP's fertilizer shipments originate from production facilities in Alberta, where abundant sources of natural gas and other chemicals provide feedstock for fertilizer production.
Most sulphur is produced in Alberta as a byproduct of processing sour natural gas, refining crude oil and upgrading bitumen produced in the Alberta oil sands. Sulphur is a raw material used primarily in the manufacturing of sulphuric acid, which is used most extensively
8
in the production of phosphate fertilizers. Sulphuric acid is also a key ingredient in industrial processes ranging from smelting and nickel leaching to paper production.
MERCHANDISE
The Company’s Merchandise business represented approximately
35%
of total freight revenues in
2017
.
The following charts compare the percentage of the Company's Merchandise freight revenue by commodity business in
2017
,
2016
and
2015
:
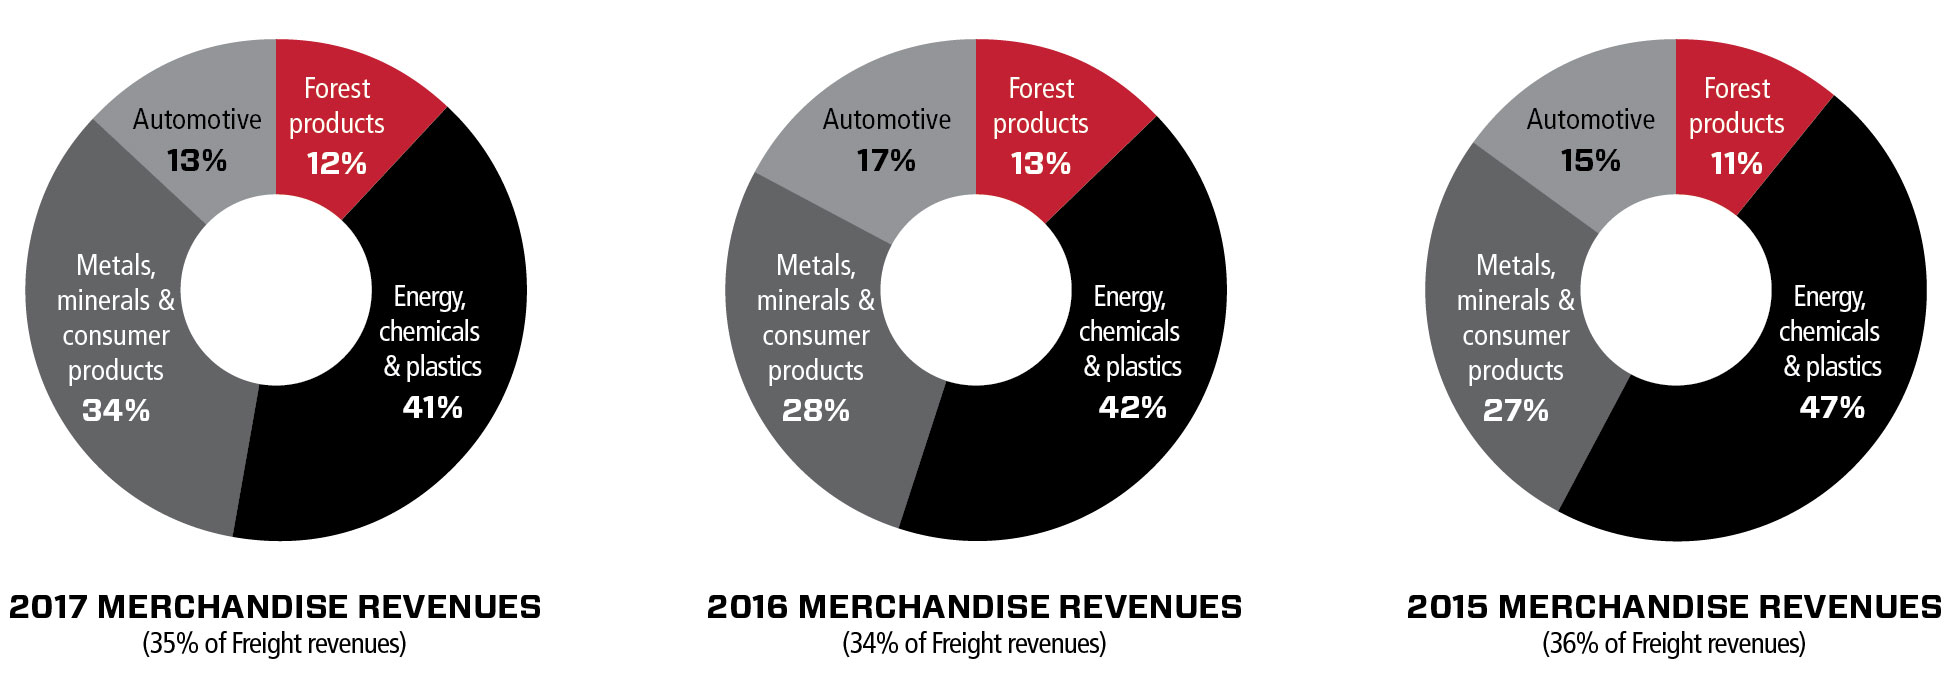
Merchandise products move in trains of mixed freight and in a variety of car types. Service involves delivering products to many different customers and destinations. In addition to traditional rail service, CP moves merchandise traffic through a network of truck-rail transload facilities, expanding the reach of CP's network to non-rail served facilities.
Forest Products
The Company’s Forest products business represented approximately
12%
of Merchandise revenues, which is
4%
of total freight revenues in
2017
.
The following charts compare the percentage of the Company's Forest products freight revenues generated from pulp and paper (wood pulp, paper, paperboard, newsprint), lumber and panel, and other shipments in
2017
,
2016
and
2015
:
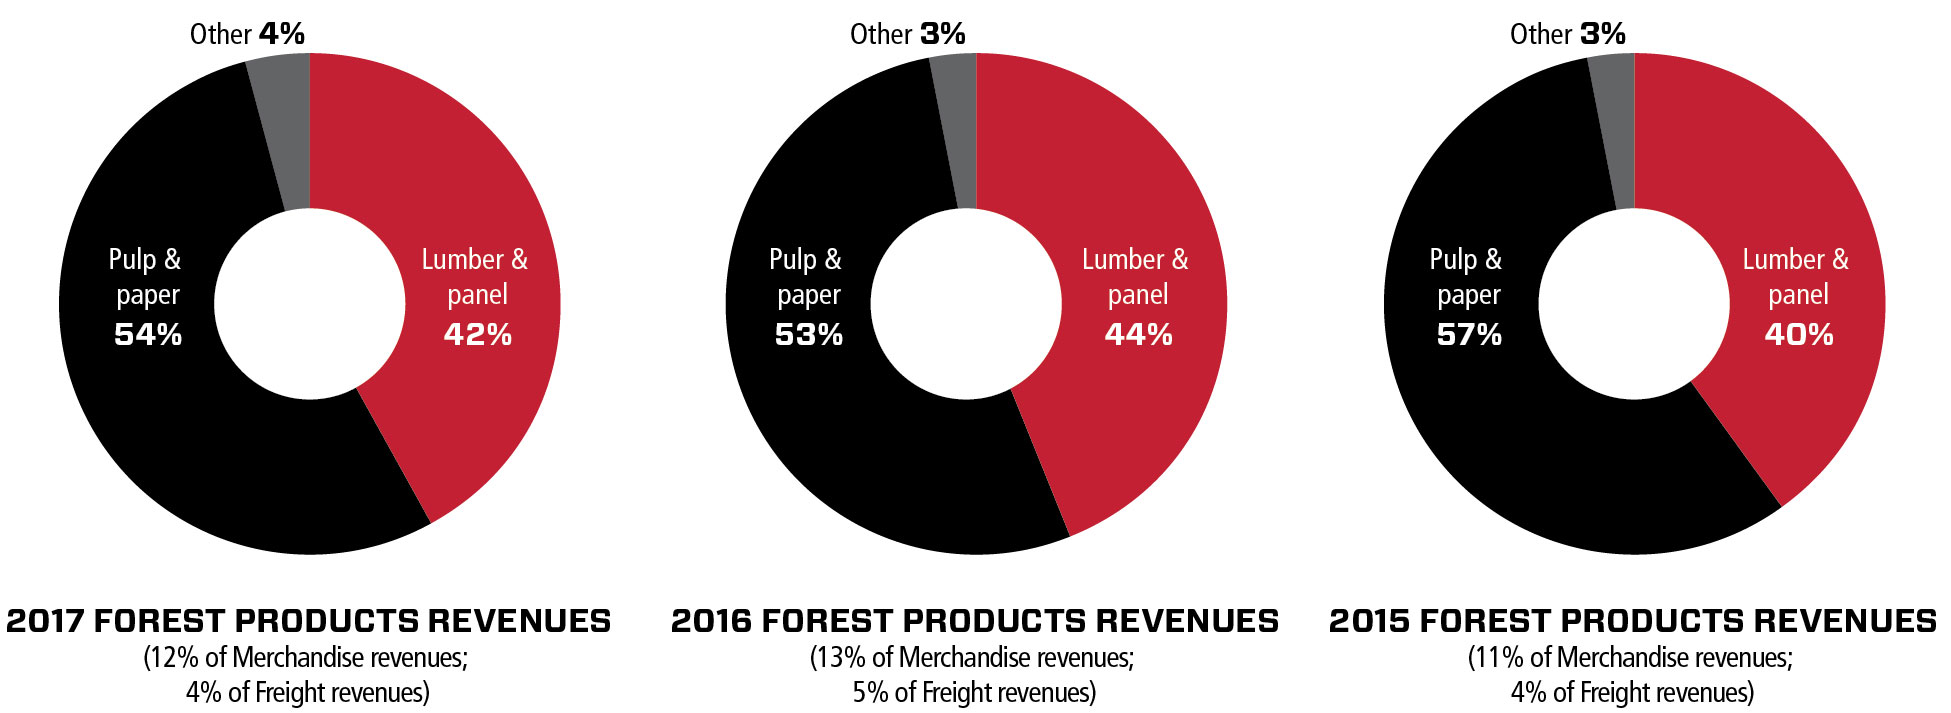
Forest products traffic includes pulp and paper, and lumber and panel shipped from key producing areas in B.C., northern Alberta, northern Saskatchewan, Ontario and Quebec to destinations throughout North America.
9
Energy, Chemicals and Plastics
The Company’s Energy, chemicals and plastics business represented approximately
41%
of Merchandise revenues, which is
14%
of total freight revenues in
2017
.
The following charts compare the percentage of the Company's Energy, chemicals and plastics freight revenues generated from petroleum products, biofuels, crude, chemicals and plastics shipments in
2017
,
2016
and
2015
:
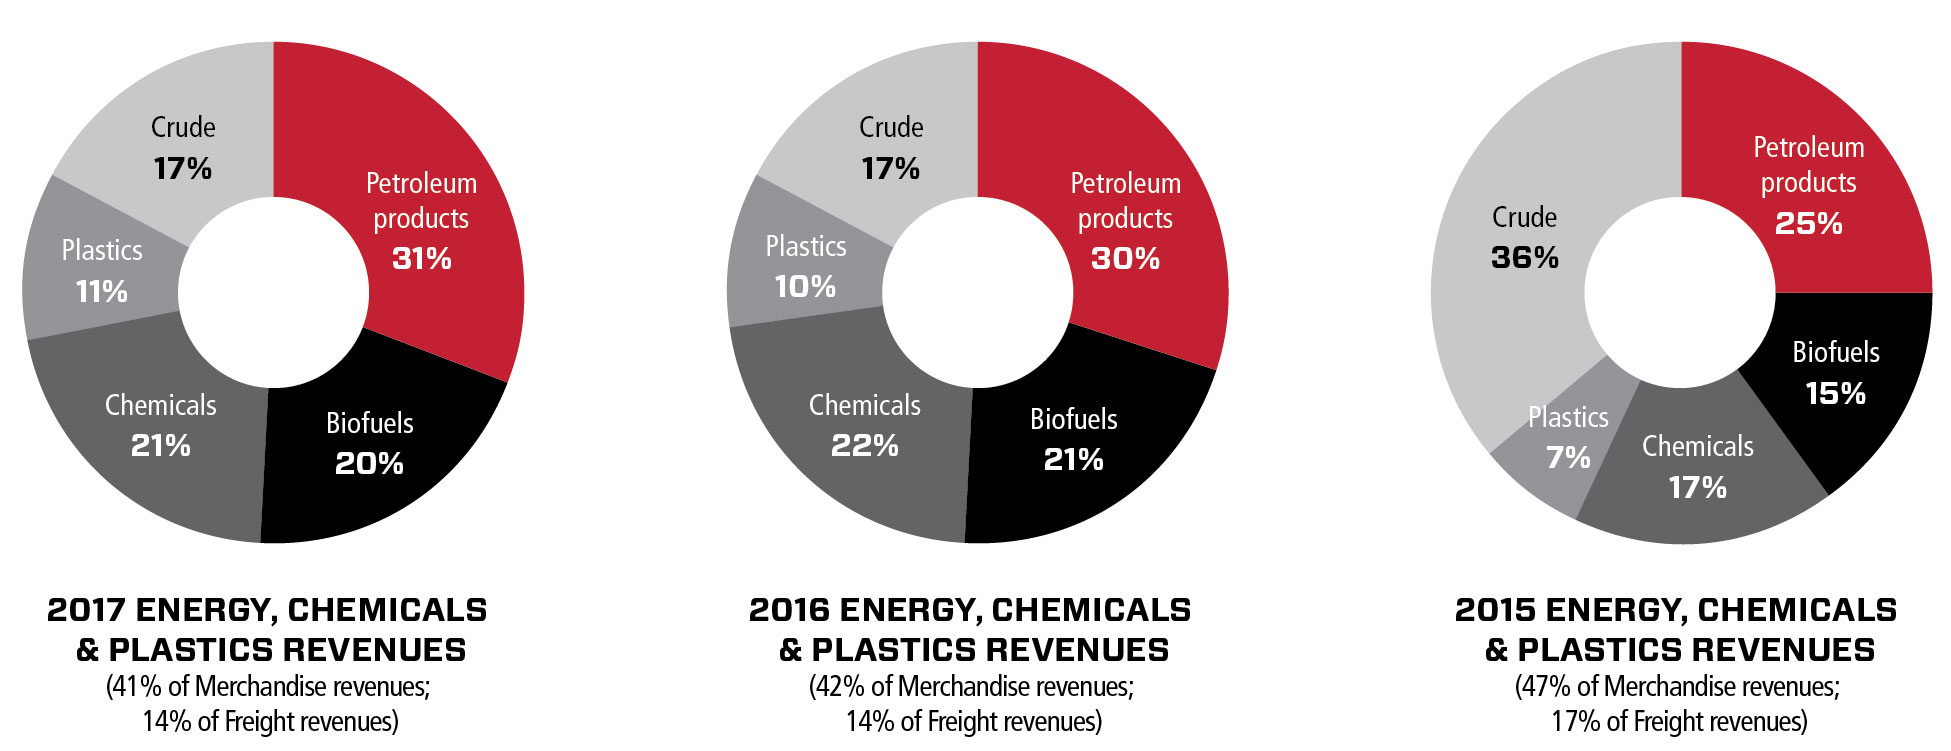
Petroleum products consist of commodities such as liquefied petroleum gas (“LPG”), fuel oil, asphalt, gasoline, condensate (diluent) and lubricant oils. The majority of the Company’s western Canadian energy traffic originates in the Alberta Industrial Heartland, Canada's largest hydrocarbon processing region, and Saskatchewan. The Bakken formation region in Saskatchewan and North Dakota is another source of condensate, LPG and other refined petroleum. Interchange with several rail interline partners gives the Company access to refineries and export facilities in the Pacific Northwest, Northeast U.S. and the Gulf Coast, as well as the Texas and Louisiana petrochemical corridor and port connections.
The Company’s chemical traffic includes products such as ethylene glycol, caustic soda, methanol, sulphuric acid, styrene and soda ash. These shipments originate from Alberta, the U.S. Midwest, the Gulf of Mexico and eastern Canada, and move to end markets in Canada, the U.S. and overseas.
CP's biofuels traffic originates mainly from facilities in the U.S. Midwest, shipping to destinations in the northeastern U.S.
Crude moves from production facilities throughout Alberta, Saskatchewan and North Dakota. We provide efficient routes to refining markets in the Northeast U.S., the Gulf Coast and the West Coast through connections with our railroad partners.
The most commonly shipped plastics products are polyethylene and polypropylene. Almost half of the Company’s plastics traffic originates in central and northern Alberta and moves to various North American destinations.
Metals, Minerals and Consumer Products
The Company’s Metals, minerals and consumer products business represented approximately
34%
of Merchandise revenues, which is
12%
of total freight revenues in
2017
.
The following charts compare the percentage of the Company's Metals, minerals and consumer products freight revenues generated from aggregates (excluding frac sand), frac sand, steel, food and consumer products and non-ferrous metals transportation in
2017
,
2016
and
2015
:
10

Aggregate products include coarse particulate and composite materials such as cement, clay, gravel, limestone and gypsum. Cement accounts for the majority of aggregate traffic and is shipped directly from production facilities in Alberta, Iowa and Ontario to energy and construction projects in North Dakota, Alberta, Manitoba and the U.S. Midwest.
The majority of frac sand originates at mines located along the Company’s network in Wisconsin and moves to Texas, the Bakken, Colorado, Ohio and other shale formations across North America.
CP transports steel in various forms from mills in Iowa, Ontario and Saskatchewan to a variety of industrial users. The Company carries base metals such as zinc, aluminum, copper and lead. CP also moves ores from mines to smelters and refineries for processing, and the processed metal to automobile and consumer products manufacturers.
Food and consumer products traffic consists of a diverse mix of goods, including food products, railway equipment, building materials and waste products.
Automotive
The Company’s Automotive business represented approximately
13%
of Merchandise revenues, which is
5%
of total freight revenues in
2017
.
The following charts compare the percentage of the Company's Automotive freight revenues generated by movements of finished vehicles from Canadian, U.S., Mexican, and overseas origins, machinery, and parts and other in
2017
,
2016
and
2015
:
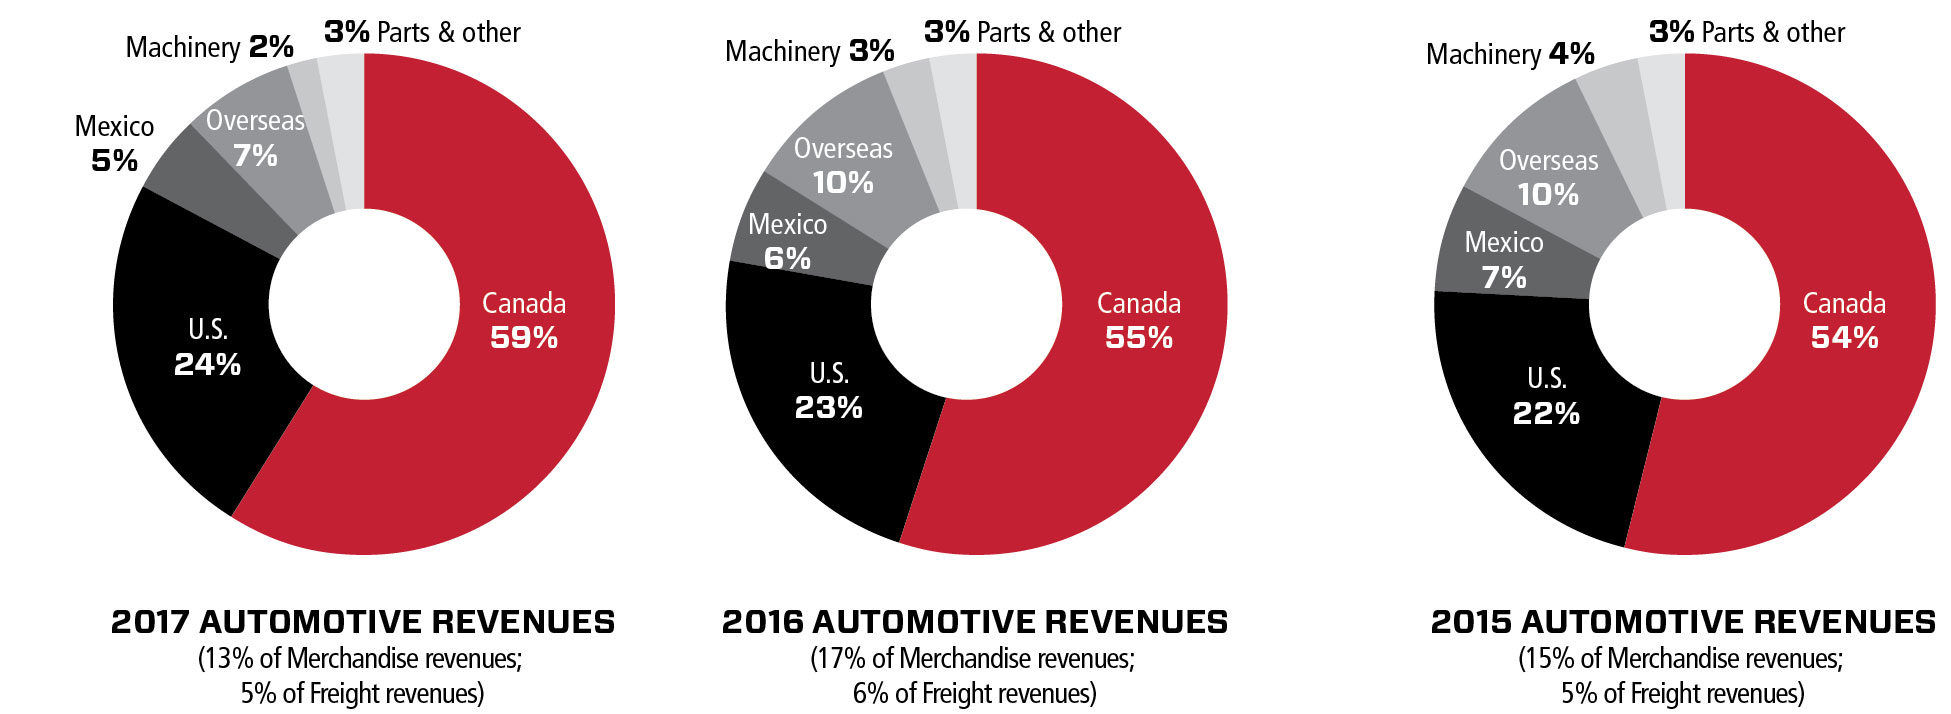
CP’s Automotive portfolio consists of four finished vehicle traffic components: Canadian-produced vehicles that ship to the U.S. from Ontario production facilities; U.S.-produced vehicles that ship within the U.S. as well as cross border shipments to Canadian markets; vehicles from overseas that move through the Port of Vancouver to eastern Canadian markets; and Mexican-produced vehicles that ship to the U.S. and Canada. In addition to finished vehicles, CP ships machinery, pre-owned vehicles, and automotive
11
parts. A comprehensive network of automotive compounds is utilized to facilitate final delivery of vehicles to dealers throughout Canada and in the U.S.
INTERMODAL
The Company’s Intermodal business represented approximately
21%
of total freight revenues in
2017
.
The following charts compare the percentage of the Company's Intermodal freight revenues generated from Canada, U.S., cross border transportation, ports and Other International in
2017
,
2016
and
2015
:
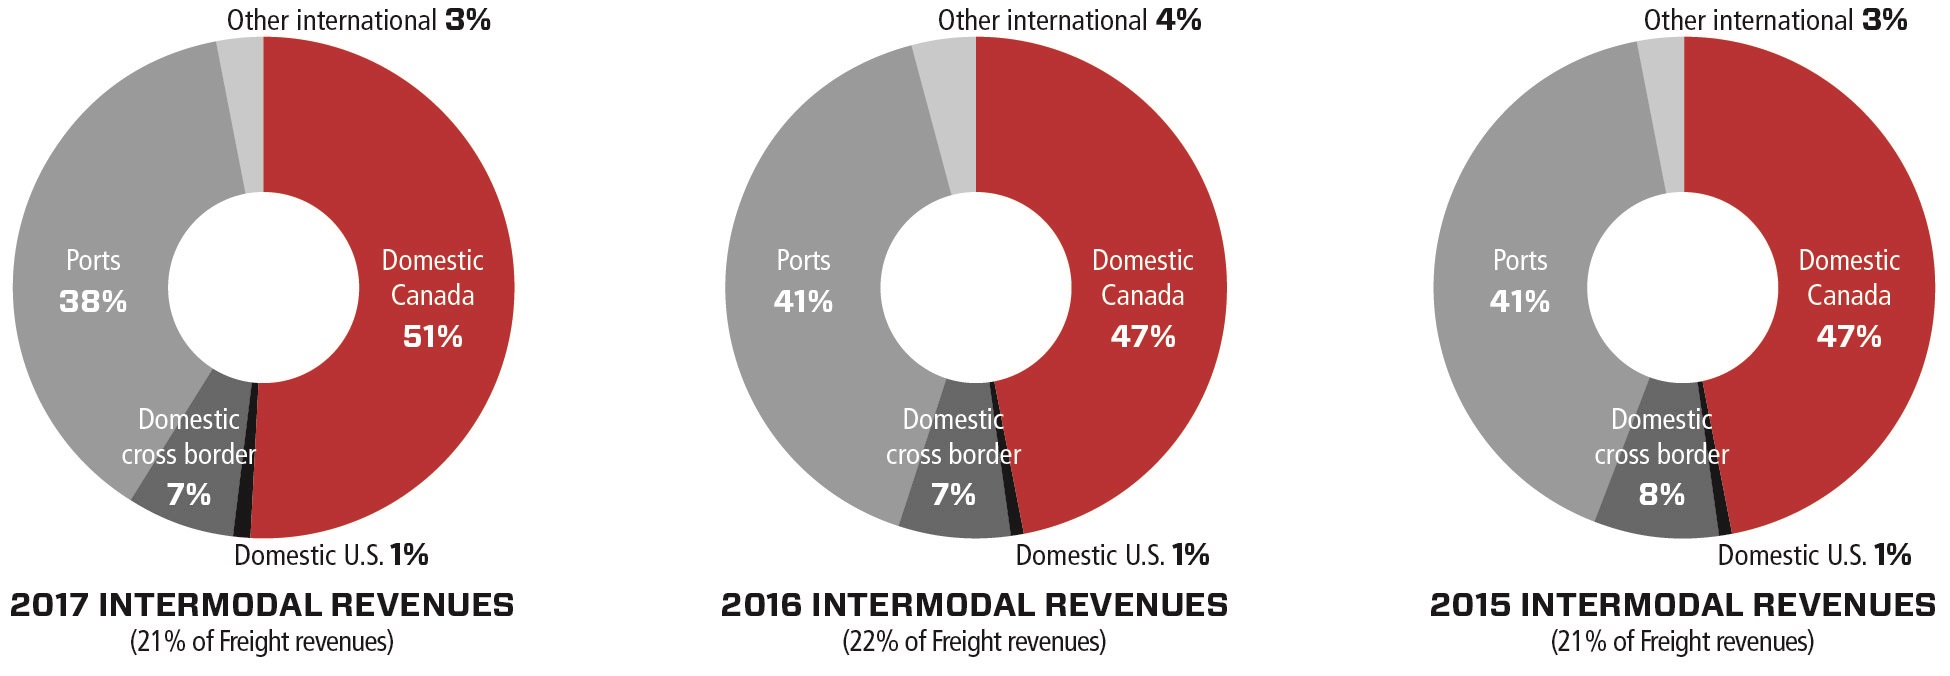
Domestic intermodal freight consists primarily of manufactured consumer products moved in 53-foot containers within North America. International intermodal freight moves in marine containers to and from ports and North American inland markets.
CP’s domestic intermodal business moves goods from a broad spectrum of industries including retail, wholesale, less-than truckload, full-truckload, food, forest products and various other commodities. Key service factors in domestic intermodal include consistent on-time delivery, the ability to provide door-to-door service and the availability of value-added services. The majority of the Company’s domestic intermodal business originates in Canada, where CP markets its services directly to retailers and manufacturers, providing complete door-to-door service and maintaining direct relationships with its customers. In the U.S., the Company’s service is delivered mainly through intermodal marketing companies ("IMC").
CP’s international intermodal business consists primarily of containerized traffic moving between the ports of Vancouver and Montreal and inland points across Canada and the U.S. Import traffic from the Port of Vancouver is mainly long-haul business destined for eastern Canada and the U.S. Midwest and Northeast. CP works closely with the Port of Montreal, a major year-round East Coast gateway to Europe, to serve markets primarily in the U.S. Midwest and Canada. The Company’s U.S. Northeast service connects eastern Canada with the Port of New York, offering a competitive alternative to trucks.
Fuel Cost Adjustment Program
The short-term volatility in fuel prices may adversely or positively impact revenues. CP employs a fuel cost adjustment program designed to respond to fluctuations in fuel prices and help reduce volatility to changing fuel prices. Fuel surcharge revenues are earned on individual shipments and are based primarily on the price of On Highway Diesel; as such, fuel surcharge revenue is a function of freight volumes and fuel prices. Fuel surcharge revenues accounted for approximately
4%
of the Company's total Freight revenues in
2017
. The Company is also subject to carbon taxation systems and levies in some jurisdictions in which it operates, the costs of which are passed on to the shipper. As such, fuel surcharge revenue includes carbon tax and levy recoveries.
Non-freight Revenues
Non-freight revenues accounted for approximately
3%
of the Company’s Total revenues in
2017
. Non-freight revenues are generated from leasing certain assets, switching fees, and other arrangements, including logistical services and contracts with passenger service operators.
Significant Customers
For each of the years ended December 31,
2017
,
2016
and
2015
, no customer comprised more than 10% of total revenues or accounts receivable.
12
Competition
The Company is subject to competition from other railways, motor carriers, ship and barge operators, and pipelines. Price is only one factor of importance as shippers and receivers choose a transportation service provider. Service is another factor and requirement, both in terms of transit time and reliability, which vary by shipper and commodity. As a result, the Company’s primary competition varies by commodity, geographic location and mode of available transportation. CP’s primary rail competitors are Canadian National Railway Company (“CN”), which operates throughout much of the Company’s territory in Canada, and Burlington Northern Santa Fe, LLC, including its primary subsidiary BNSF Railway Company (“BNSF”), which operates throughout much of the Company’s territory in the U.S. Midwest. Other railways also operate in parts of the Company’s territory. Depending on the specific market, competing railroads and deregulated motor carriers may exert pressure on price and service levels.
Seasonality
Volumes and revenues from certain goods are stronger during different periods of the year. First-quarter revenues are typically lower mainly due to winter weather conditions, closure of the Great Lakes ports and reduced transportation of retail goods. Second and third quarter revenues generally improve over the first quarter, as fertilizer volumes are typically highest during the second quarter and demand for construction-related goods is generally highest in the third quarter. Revenues are typically strongest in the fourth quarter, primarily as a result of the transportation of grain after the harvest, fall fertilizer programs and increased demand for retail goods moved by rail. Operating income is also affected by seasonal fluctuations. Operating income is typically lowest in the first quarter, due to lower freight revenue and higher operating costs associated with winter conditions.
Government Regulation
The Company’s railway operations are subject to extensive federal laws, regulations and rules in both Canada and the U.S., which directly affect how operations and business activities are managed.
Operations are subject to economic and safety regulation in Canada primarily by the Canadian Transportation Agency (“the Agency”), Transport Canada, the CTA and the Railway Safety Act (“RSA”). The CTA provides shipper rate and service remedies, including final offer arbitration, competitive line rates and compulsory inter-switching in Canada. The Agency regulates the MRE for the movement of export grain, commuter and passenger access, charges for ancillary services, and noise-related disputes. Transport Canada regulates safety-related aspects of railway operations in Canada.
The Company’s U.S. operations are subject to economic and safety regulation by the Surface Transportation Board (“STB”) and the Federal Railroad Administration (“FRA”). The STB is an economic regulatory body with jurisdiction over railroad rate and service issues and proposed railroad mergers and other transactions. The FRA regulates safety-related aspects of the Company’s railway operations in the U.S. under the Federal Railroad Safety Act, as well as rail portions of other safety statutes.
Various other regulators directly and indirectly affect the Company’s operations in areas such as health, safety, security, environmental and other matters.
Regulatory Change
After the tragic accident in Lac-Mégantic, Quebec, in July of 2013 involving a non-related short-line railroad, the Government of Canada implemented several measures pursuant to the RSA (Canada) and the Transportation of Dangerous Goods Act (Canada). These modifications implemented changes with respect to rules associated with securing unattended trains; the classification of crude being imported, handled, offered for transport or transported; and the provision of information to municipalities through which dangerous goods are transported by rail. The U.S. federal government has taken similar actions. These changes did not have a material impact on CP’s operating practices.
On February 20, 2015, the Government of Canada introduced Bill C-52 “An Act to amend the Canada Transportation Act and the Railway Safety Act”, which received Royal Assent on June 18, 2015, and is now in force. Bill C-52 sets out new minimum insurance requirements for federally regulated railways based on: amounts of crude and toxic inhalation hazards ("TIH")/poisonous inhalation hazards moved; imposes strict liability; limits railway liability to the minimum insurance level; mandates the creation of a fund of $250 million paid for by a levy on crude shipments, to be utilized for damages beyond $1 billion (in respect of CP); allows railways and insurers to have existing rights to pursue other parties (subrogation); and prevents shifting liability to shippers from railways except through written agreement. As the implementation by the Government of various aspects of the amendments is still being completed, the Company is not yet able to determine their full impact.
On May 1, 2015, the U.S. Transportation Secretary announced the final rule for a new rail tank car standard for flammable liquids and the retrofitting schedule for older tank cars used to transport flammable liquids. The development of the new tank car standard was done in coordination between Transport Canada, the U.S. Pipeline and Hazardous Materials Safety Administration (“PHMSA”) and the FRA. This announcement was followed by publishing the new tank car standard in Canada on May 20, 2015. The new tank car standards require new tanks used to move flammable liquids to have: top-fitting protection; thermal protection including a jacket; the use of 9/16 inch normalized steel for the tank car; full head shield; and improved bottom outlet valves. In the U.S., the new standards also included new operational protocols for trains transporting large volumes of flammable liquids such as the use of electronically controlled pneumatic (“ECP”) brakes for trains carrying 70 or more cars of flammable liquids, routing requirements, speed restrictions, and information for local government agencies. The U.S. rule also provides new sampling and testing requirements for the classification of energy products placed into transport. In Canada, operational protocols such as speed restrictions to 40 miles per hour in census metropolitan areas, crude sampling and testing requirements, and sharing information with municipal first responders, had previously been implemented. CP does not own any tank cars used for commercial transportation of hazardous commodities.
On May 16, 2017, the Government of Canada introduced Bill C-49, the Transportation Modernization Act, in Parliament. The bill proposes amendments to the CTA and the RSA, among other Acts, to (1) replace the existing 160 kilometre extended interswitching limit and the competitive line rate provisions with a new long-haul interswitching regime; (2) modify the existing Level of Service
13
remedy for shippers by instructing the Agency to determine, upon receipt of a complaint, if a railway company is fulfilling its common carrier obligation to provide “adequate and suitable accommodation” of traffic, if it is satisfied that the service provided is the “highest level of service that is reasonable in the circumstances”; (3) allow the existing Service Level Agreement arbitration remedy to include the consideration of reciprocal financial penalties; (4) increase the threshold for summary Final Offer Arbitrations from $750,000 to $2 million; (5) bifurcate the Volume-Related Composite Price Index component of the annual MRE determination for transportation of regulated grain, to encourage hopper car investment by CP and CN; and (6) mandate the installation of locomotive voice and video recorders ("LVVRs"), with statutory permission for random access by railway companies and Transport Canada to the LVVR data in order to proactively strengthen railway safety in Canada. The bill is currently being considered by the Parliament of Canada. It is unclear when the proposed legislative amendments will be enacted into law.
On October 29, 2015, the Surface Transportation Extension Act of 2015 was signed into law. The law extends, by three years, the deadline for the U.S. rail industry to implement Positive Train Control (“PTC”), a set of highly advanced technologies designed to prevent train-to-train collisions, speed-related derailments, and other accidents caused by human error by determining the precise location, direction and speed of trains, warning train operators of potential problems, and taking immediate action if an operator does not respond. Legislation passed by the U.S. Congress in 2008 mandated that PTC systems be put into service by the end of 2015 on rail lines used to transport passengers or toxic-by-inhalation materials. The Surface Transportation Extension Act of 2015 extended the deadline to install and activate PTC to December 31, 2018, or December 31, 2020 under certain circumstances, allowing the Company additional time to ensure safe and effective implementation of PTC on its rail network.
For further details on the capital expenditures associated with compliance with the PTC regulatory mandate, refer to Item 7. Management’s Discussion and Analysis of Financial Condition and Results of Operations, Liquidity and Capital Resources.
On December 4, 2015, the Fixing America’s Surface Transportation (“FAST”) Act was signed into law, representing the first long-term transportation legislation enacted in the U.S. in over a decade. The FAST Act contains key provisions on safety enhancements for tank cars moving flammable liquids in the U.S. and ECP train braking. Among those key provisions, the FAST Act requires new tank cars to be equipped with thermal blankets, requires all legacy DOT-111 tank cars moving flammable liquids to be upgraded to new retrofit standards (regardless of how many cars may be in a train), and sets minimum requirements for protection of certain valves. The FAST Act calls for the U.S. Secretary of Transportation to re-evaluate its ECP final rule within the next year using the results of this evaluation to determine whether ECP braking system requirements are justified. On December 4, 2017, the U.S. Department of Transportation (“DOT”) found the ECP brake rule costs outweigh the benefits. By statute, DOT is now required to repeal the ECP brake rule and has begun the necessary procedures to effectuate that repeal.
Finally, the STB Reauthorization Act of 2015 was signed into law on December 18, 2015. The law requires numerous changes to the structure and composition of the STB, removing it from under the Department of Transportation and establishing the STB as an independent U.S. agency, as well as increasing STB Board membership from three to five members. Notably, the law vests in the STB certain limited enforcement powers, by authorizing it to investigate rail carrier violations on the STB Board’s own initiative. The law also requires the STB to establish a voluntary binding arbitration process to resolve rail rate and practice disputes. It is too soon for the Company to anticipate the impact that these changes and new investigative authorities might have on CP, since no arbitrations or, to CP's knowledge, investigations have been initiated under recently adopted rules implementing these laws.
Environmental Laws and Regulations
The Company’s operations and real estate assets are subject to extensive federal, provincial, state and local environmental laws and regulations governing emissions to the air, discharges to waters and the handling, storage, transportation and disposal of waste and other materials. If the Company is found to have violated such laws or regulations, it could have a material adverse effect on the Company’s business or operating results. In addition, in operating a railway, it is possible that releases of hazardous materials during derailments or other accidents may occur that could cause harm to human health or to the environment. Costs of remediation, damages and changes in regulations could materially affect the Company’s operating results and reputation.
The Company has implemented an Environmental Management System to facilitate the reduction of environmental risk. Specific environmental programs are in place to address areas such as air emissions, wastewater, management of vegetation, chemicals and waste, storage tanks and fueling facilities. CP has also undertaken environmental impact assessments and risk assessments to identify, prevent and mitigate environmental risks. There is continued focus on preventing spills and other incidents that have a negative impact on the environment. There is an established Strategic Emergency Response Contractor network, and spill equipment kits are located across Canada and the U.S. to ensure a rapid and efficient response in the event of an environmental incident. In addition, emergency preparedness and response plans are regularly updated and tested.
The Company has developed an environmental audit program that comprehensively, systematically and regularly assesses the Company’s facilities for compliance with legal requirements and the Company’s policies for conformance to accepted industry standards. Included in this is a corrective action follow-up process and semi-annual review by senior management.
CP focuses on key strategies, identifying tactics and actions to support commitments to the community. The Company’s strategies include:
|
•
|
protecting the environment;
|
|
•
|
ensuring compliance with applicable environmental laws and regulations;
|
14
|
•
|
promoting awareness and training;
|
|
•
|
managing emergencies through preparedness; and
|
|
•
|
encouraging involvement, consultation and dialogue with communities along the Company’s lines.
|
Security
CP is subject to statutory and regulatory directives in Canada and the U.S. that address security concerns. CP plays a critical role in the North American transportation system. Rail lines, facilities and equipment, including railcars carrying hazardous materials, could be direct targets or indirect casualties of terrorist attacks. Regulations by the DOT and the Department of Homeland Security in the U.S. include speed restrictions, chain of custody and security measures, which can impact service and increase costs for the transportation of hazardous materials, especially TIH materials. Legislative changes in Canada to the Transportation of Dangerous Goods Act are expected to add new security regulatory requirements similar to those in the U.S. In addition, insurance premiums for some or all of the Company’s current coverage could increase significantly, or certain coverage may not be available to the Company in the future. While CP will continue to work closely with Canadian and U.S. government agencies, future decisions by these agencies on security matters or decisions by the industry in response to security threats to the North American rail network could have a material adverse effect on the Company's business or operating results.
CP takes the following security measures:
|
•
|
CP employs its own police service that works closely with communities and other law enforcement and government agencies to promote railway safety and infrastructure security. As a railway law enforcement agency, CP Police Services are headquartered in Calgary, with police officers assigned to over 25 field offices responsible for railway police operations in six Canadian provinces and 14 U.S. states. CP Police Services operate on the CP rail network as well as in areas where CP has non-railway operations.
|
|
•
|
CP’s Police Communication Centre (“PCC”) operates 24 hours a day. The PCC receives reports of emergencies, dangerous or potentially dangerous conditions, and other safety and security issues from our employees, the public, and law enforcement and other government officials, and ensures that proper emergency responders are notified as well as governing bodies.
|
|
•
|
CP’s Security Management Plan is a comprehensive, risk-based plan modeled on and developed in conjunction with the security plan prepared by the Association of American Railroads post-September 11, 2001. Under this plan, CP routinely examines and prioritizes railroad assets, physical and cyber vulnerabilities, and threats, as well as tests and revises measures to provide essential railroad security. To address cyber security risks, CP implements mitigation programs that evolve with the changing technology threat environment. The Company has also worked diligently to establish backup sites to ensure a seamless transition in the event that the Company's operating systems are the target of a cyber-attack. By doing so, CP is able to maintain network fluidity.
|
|
•
|
CP security efforts consist of a wide variety of measures including employee training, engagement with our customers and training of emergency responders.
|
Available Information
CP makes available on or through its website
www.cpr.ca
free of charge, its annual reports on Form 10-K, quarterly reports, current reports on Form 8-K and all amendments to those reports as soon as reasonably practicable after such reports are filed with or furnished to the Securities and Exchange Commission (“SEC”). Our website also contains charters for each of the committees of our Board of Directors, our corporate governance guidelines and our Code of Business Ethics. This Form 10-K and other SEC filings made by CP are also accessible through the SEC’s website at
www.sec.gov
.
The Company has included the CEO and CFO certifications regarding the Company's public disclosure required by Section 302 of the Sarbanes-Oxley Act of 2002 as an Exhibit to this report.
All references to our websites contained herein do not constitute incorporation by reference of information contained on such websites and such information should not be considered part of this document.
15
The risks set forth in the following risk factors could have a materially adverse effect on the Company's financial condition, results of operations, and liquidity, and could cause those results to differ materially from those expressed or implied in the Company's forward-looking statements.
The information set forth in this Item 1A. Risk Factors should be read in conjunction with the rest of the information included in this report, including Item 7. Management’s Discussion and Analysis of Financial Condition and Results of Operations and Item 8. Financial Statements and Supplementary Data.
As a common carrier, the Company is required by law to transport dangerous goods and hazardous materials, which could expose the Company to significant costs and claims.
Railways, including CP, are legally required to transport dangerous goods and hazardous materials as part of their common carrier obligations regardless of risk or potential exposure to loss. CP transports dangerous goods and hazardous materials, including but not limited to crude oil, ethanol and TIH materials such as chlorine gas and anhydrous ammonia. A train accident involving hazardous materials could result in significant claims against CP arising from personal injury and property or natural resource damage, environmental penalties and remediation obligations. Such claims, if insured, could exceed the existing insurance coverage commercially available to CP, which could have a material adverse effect on CP’s financial condition and liquidity. CP is also required to comply with rules and regulations regarding the handling of dangerous goods and hazardous materials in Canada and the U.S. Noncompliance with these rules and regulations can subject the Company to significant penalties and could factor in litigation arising out of a train accident. Changes to these rules and regulations could also increase operating costs, reduce operating efficiencies and impact service delivery.
The Company is subject to significant governmental legislation and regulation over commercial, operating and environmental matters.
The Company’s railway operations are subject to extensive federal laws, regulations and rules in both Canada and the U.S. Operations are subject to economic and safety regulations in Canada primarily by the Agency and Transport Canada. The Company’s U.S. operations are subject to economic and safety regulation by the STB and the FRA. Various other regulators directly and indirectly affect the Company’s operations in areas such as health, safety, security, environmental and other matters. Additional economic regulation of the rail industry by these regulators or the Canadian and U.S. legislatures, whether under new or existing laws, including Bill C-49, if passed, which is described under the heading "Regulatory Change" in Part I of this Annual Report on Form 10-K, could have a significant negative impact on the Company’s ability to determine prices for rail services and result in a material adverse effect in the future on the Company’s financial position, results of operations, and liquidity in a particular year or quarter. This potential material adverse effect could also result in reduced capital spending on the Company’s rail network or in abandonment of lines.
The Company’s compliance with safety and security regulations may result in increased capital expenditures and operating costs. For example, compliance with the Rail Safety Improvement Act of 2008 will result in additional capital expenditures associated with the statutorily mandated implementation of PTC. In addition to increased capital expenditures, implementation of such regulations may result in reduced operational efficiency and service levels, as well as increased operating expenses.
The Company’s operations are subject to extensive federal, state, provincial and local environmental laws concerning, among other matters, emissions to the air, land and water and the handling of hazardous materials and wastes. Violation of these laws and regulations can result in significant fines and penalties, as well as other potential impacts on CP’s operations. These laws can impose strict, and in some circumstances, joint and several liability on both current and former owners and on operators of facilities. Such environmental liabilities may also be raised by adjacent landowners or third parties. In addition, in operating a railway, it is possible that releases of hazardous materials during derailments or other accidents may occur that could cause harm to human health or to the environment. Costs of remediation, damages and changes in regulations could materially affect the Company’s operating results and reputation. The Company has been, and may in the future be, subject to allegations or findings to the effect that it has violated, or is strictly liable under, environmental laws or regulations. The Company currently has obligations at existing sites for investigation, remediation and monitoring, and will likely have obligations at other sites in the future. The actual costs associated with both current and long-term liabilities may vary from the Company’s estimates due to a number of factors including, but not limited to changes in: the content or interpretation of environmental laws and regulations; required remedial actions; technology associated with site investigation or remediation; and the involvement and financial viability of other parties that may be responsible for portions of those liabilities.
Global economic conditions could negatively affect demand for commodities and other freight transported by the Company.
A decline or disruption in domestic, cross border or global economic conditions that affect the supply or demand for the commodities that CP transports may decrease CP’s freight volumes and may result in a material adverse effect on CP’s financial or operating results and liquidity. Economic conditions resulting in bankruptcies of one or more large customers could have a significant impact on CP's financial position, results of operations, and liquidity in a particular year or quarter.
The Company faces competition from other transportation providers, and failure to compete effectively could adversely affect results of operations, financial condition and liquidity.
The Company faces significant competition for freight transportation in Canada and the U.S., including competition from other railways, pipelines, trucking and barge companies. Competition is based mainly on quality of service, freight rates and access to markets. Other transportation modes generally use public rights-of-way that are built and maintained by government entities, while CP and other railroads must use internal resources to build and maintain
16
their rail networks. Competition with the trucking industry is generally based on freight rates, flexibility of service and transit time performance. Any future improvements or expenditures materially increasing the quality or reducing the cost of alternative modes of transportation, or legislation that eliminates or significantly reduces the burden of the size or weight limitations currently applicable to trucking carriers, could have a material adverse effect on CP's results of operations, financial condition, and liquidity.
The operations of carriers with which the Company interchanges may adversely affect operations. The Company's ability to provide rail services to customers in Canada and the U.S. also depends upon its ability to maintain cooperative relationships with connecting carriers with respect to, among other matters, revenue division, car supply and locomotive availability, data exchange and communications, reciprocal switching, interchange, and trackage rights. Deterioration in the operations or services provided by connecting carriers, or in the Company's relationship with those connecting carriers, could result in CP's inability to meet customers' demands or require the Company to use alternate train routes, which could result in significant additional costs and network inefficiencies.
The availability of qualified personnel could adversely affect the Company's operations.
Changes in employee demographics, training requirements, and the availability of qualified personnel, particularly locomotive engineers and trainpersons, could negatively impact the Company’s ability to meet demand for rail services. Unpredictable increases in the demand for rail services may increase the risk of having insufficient numbers of trained personnel, which could have a material adverse effect on the Company’s results of operations, financial condition, and liquidity. In addition, changes in operations and other technology improvements may significantly impact the number of employees required to meet the demand for rail services.
Strikes or work stoppages could adversely affect the Company's operations.
Class I railroads are party to collective bargaining agreements with various labour unions. The majority of CP's employees belong to labour unions and are subject to these agreements. Disputes with regard to the terms of these agreements or the Company's potential inability to negotiate acceptable contracts with these unions could result in, among other things, strikes, work stoppages, slowdowns or lockouts, which could cause a significant disruption of the Company's operations and have a material adverse effect on the Company's results of operations, financial condition, and liquidity. Additionally, future national labour agreements, or provisions of labour agreements related to health care, could significantly increase the Company's costs for health and welfare benefits, which could have a material adverse impact on its financial condition and liquidity.
The Company may be subject to various claims and lawsuits that could result in significant expenditures.
The Company by the nature of its operation is exposed to the potential for a variety of litigation and other claims, including personal injury claims, labour and employment, commercial and contract disputes, environmental liability, freight claims and property damage claims. In respect of workers' claims in Canada related to occupational health and safety, the Workers' Compensation Act (Canada) covers those matters. In the U.S., the Federal Employers' Liability Act ("FELA") is applicable to railroad employees. A provision for a litigation matter or other claim will be accrued according to applicable accounting standards and any such accrual will be based on an ongoing assessment of the strengths and weaknesses of the litigation or claim, its likelihood of success together with an evaluation of the damages or other monetary relief sought. Any material changes to litigation trends, a catastrophic rail accident or series of accidents involving freight loss, property damage, personal injury, environmental liability or other significant matters could have a material adverse effect on the Company's results of operations, financial position, and liquidity, in each case, to the extent not covered by insurance.
The Company may be affected by acts of terrorism, war, or risk of war.
CP plays a critical role in the North American transportation system, and therefore could become the target for acts of terrorism or war. CP is also involved in the transportation of hazardous materials, which could result in CP's equipment or infrastructure being direct targets or indirect casualties of terrorist attacks. Acts of terrorism, or other similar events, any government response thereto, and war or risk of war could cause significant business interruption losses to CP and may adversely affect the Company’s results of operations, financial condition, and liquidity.
Severe weather or natural disasters could result in significant business interruptions and costs to the Company.
CP is exposed to severe weather conditions and natural disasters including earthquakes, floods, fires, avalanches, mudslides, extreme temperatures and significant precipitation that may cause business interruptions that can adversely affect the Company’s entire rail network. This could result in increased costs, increased liabilities and decreased revenues, which could have a material adverse effect on the Company’s results of operations, financial condition, and liquidity. Insurance maintained by the Company to protect against loss of business and other related consequences resulting from these natural occurrences is subject to coverage limitations, depending on the nature of the risk insured. This insurance may not be sufficient to cover all of the Company's damages or damages to others, and this insurance may not continue to be available at commercially reasonable rates. Even with insurance, if any natural occurrence leads to a catastrophic interruption of services, the Company may not be able to restore services without a significant interruption in operations.
The Company relies on technology and technological improvements to operate its business.
Information technology is critical to all aspects of CP’s business. If the Company were to experience a significant disruption or failure of one or more of its information technology or communications systems (either as a result of an intentional cyber or malicious act, or an unintentional error) it could result in service interruptions or other failures, misappropriation of confidential information and deficiencies, which could have a material adverse effect on the Company's results of operations, financial condition, and liquidity. If CP is unable to acquire or implement new technology, the Company may suffer a competitive disadvantage, which could also have an adverse effect on its results of operations, financial condition, and liquidity.
17
The state of capital markets could adversely affect the Company's liquidity.
Weakness in the capital and credit markets could negatively impact the Company’s access to capital. From time to time, the Company relies on the capital markets to provide some of its capital requirements, including the issuance of long-term debt instruments and commercial paper. Significant instability or disruptions of the capital markets and the credit markets, or deterioration of the Company's financial condition due to internal or external factors could restrict or eliminate the Company's access to, and/or significantly increase the cost of, various financing sources, including bank credit facilities and issuance of corporate bonds. Instability or disruptions of the capital markets and deterioration of the Company's financial condition, alone or in combination, could also result in a reduction in the Company's credit rating to below investment grade, which could also further prohibit or restrict the Company from accessing external sources of short-term and long-term debt financing, and/or significantly increase the associated costs.
Disruptions within the supply chain could negatively affect the Company's operational efficiencies and increase costs.
The North American transportation system is integrated. CP’s operations and service may be negatively impacted by service disruptions of other transportation links, such as ports, handling facilities, customer facilities, and other railways. A prolonged service disruption at one of these entities could have a material adverse effect on the Company's results of operations, financial condition, and liquidity.
The Company may be affected by fluctuating fuel prices.
Fuel expense constitutes a significant portion of the Company’s operating costs. Fuel prices can be subject to dramatic fluctuations, and significant price increases could have a material adverse effect on the Company's results of operations. The Company currently employs a fuel cost adjustment program to help reduce volatility in changing fuel prices, but the Company cannot be certain that it will always be able to mitigate rising or elevated fuel costs through this program. Factors affecting fuel prices include: worldwide oil demand, international politics, weather, refinery capacity, supplier and upstream outages, unplanned infrastructure failures, and labour and political instability.
The Company is dependent on certain key suppliers of core railway equipment and materials that could result in increased price volatility or significant shortages of materials, which could adversely affect results of operations, financial condition, and liquidity.
Due to the complexity and specialized nature of core railway equipment and infrastructure (including rolling stock equipment, locomotives, rail and ties), there can be a limited number of suppliers of rail equipment and materials available. Should these specialized suppliers cease production or experience capacity or supply shortages, this concentration of suppliers could result in CP experiencing cost increases or difficulty in obtaining rail equipment and materials, which could have a material adverse effect on the Company's results of operations, financial condition, and liquidity. Additionally, CP’s operations are dependent on the availability of diesel fuel. A significant fuel supply shortage arising from production decreases, increased demand in existing or emerging foreign markets, disruption of oil imports, disruption of domestic refinery production, damage to refinery or pipeline infrastructure, political unrest, war or other factors could have a material adverse effect on the Company's results of operations, financial position, and liquidity in a particular year or quarter.
The Company may be directly and indirectly affected by the impacts of global climate change.
There is potential for significant impacts to CP’s infrastructure due to changes in global weather patterns. Increasing frequency, intensity and duration of extreme weather events such as flooding, storms and forest fires may result in substantial costs to respond during the event, to recover from the event and possibly to modify existing or future infrastructure requirements to prevent recurrence. The Company is currently subject to emerging regulatory programs that place a price on carbon emissions associated with railway operations. Government bodies are imposing carbon taxation systems and cap and trade market mechanisms in several of the jurisdictions in which CP operates. As a significant consumer of diesel fuel, an escalating price on carbon emissions will lead to a corresponding increase of the Company’s business costs. It is expected that additional jurisdictions will implement some form of carbon taxation or pricing in the near future. Programs that place a price on carbon emissions or other government restrictions on certain market sectors can also impact current and potential customers including thermal coal and petroleum crude oil.
None.
18
Network Geography
The Company’s network extends from the Port of Vancouver on Canada’s Pacific Coast to the Port of Montreal in eastern Canada, and to the U.S. industrial centres of Chicago, Illinois; Detroit, Michigan; Buffalo and Albany, New York; Kansas City, Missouri; and Minneapolis, Minnesota.
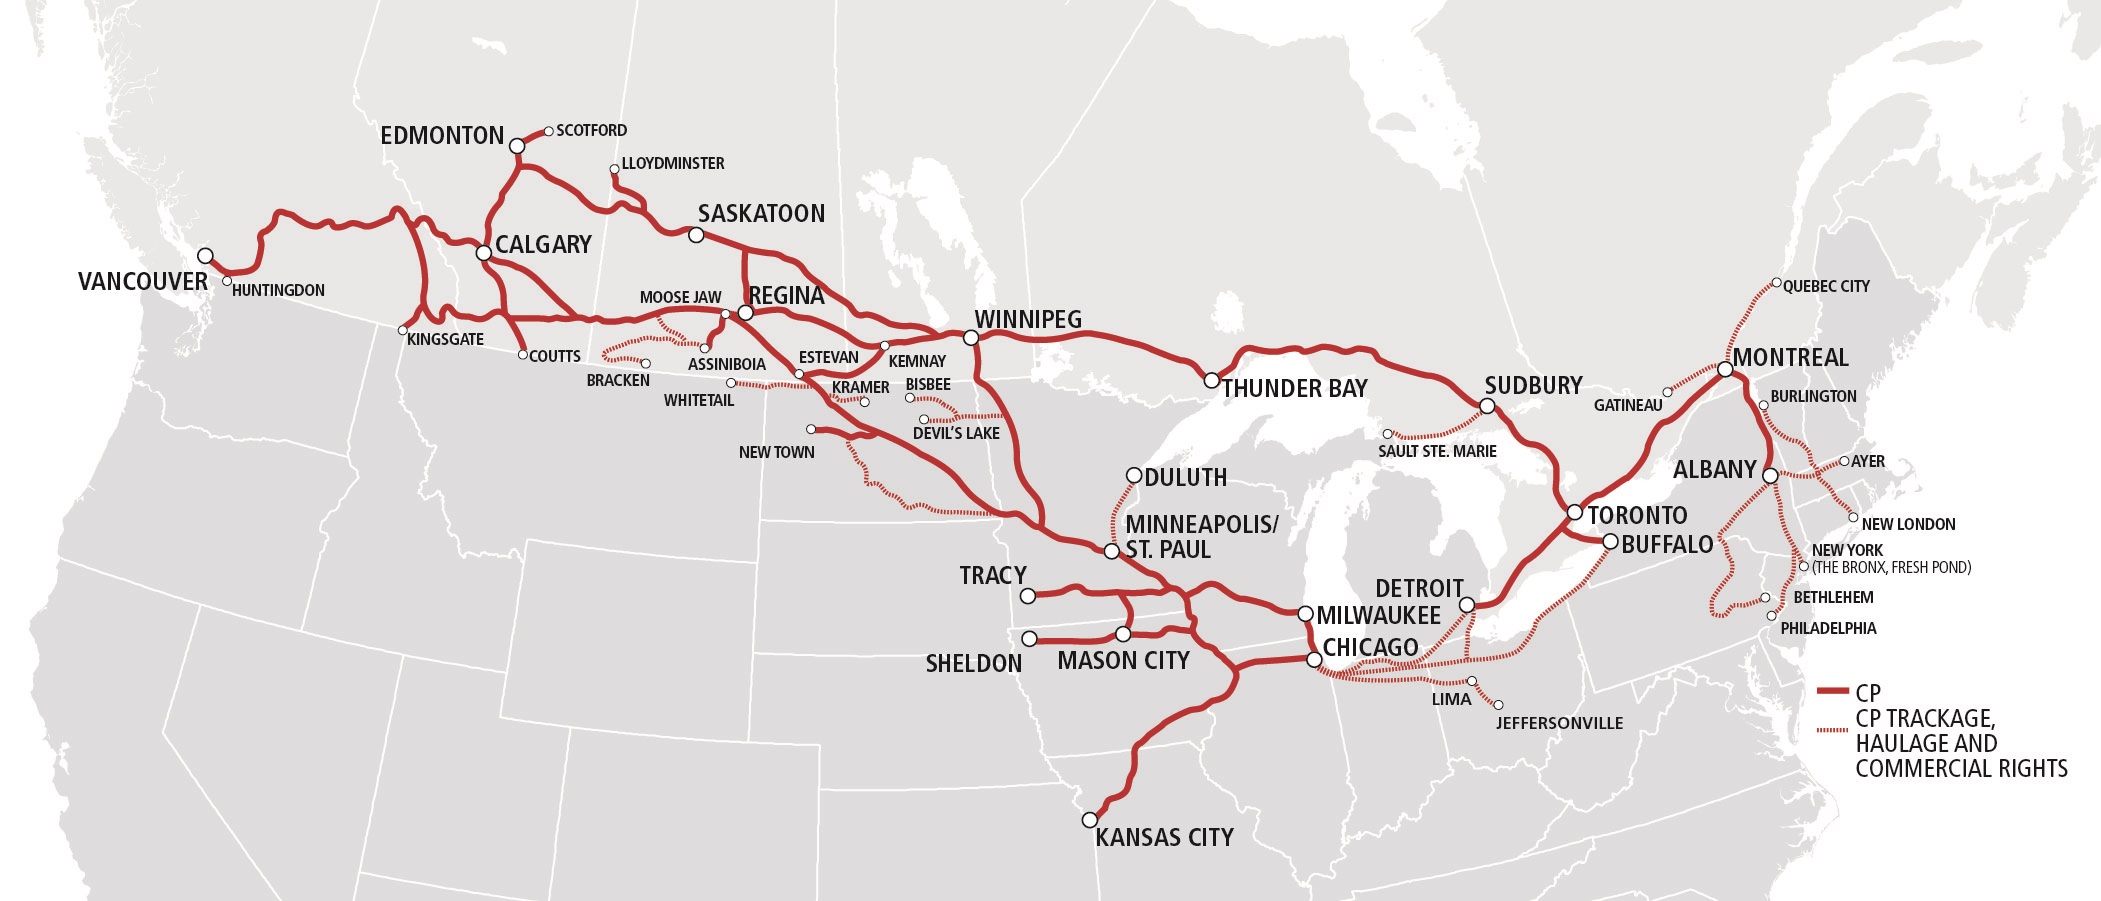
The Company’s network is composed of three primary corridors: Western, Central and Eastern.
The Western Corridor: Vancouver to Thunder Bay
Overview
–
The Western Corridor links Vancouver with Thunder Bay, which is the Western Canadian terminus of the Company’s Eastern Corridor. With service through Calgary, the Western Corridor is an important part of the Company’s routes between Vancouver and the U.S. Midwest, and between Vancouver and eastern Canada. The Western Corridor provides access to the Port of Thunder Bay, Canada’s primary Great Lakes bulk terminal.
Products
–
The Western Corridor is the Company’s primary route for bulk and resource products traffic from western Canada to the Port of Vancouver for export. CP also handles significant volumes of international intermodal containers and domestic general merchandise traffic.
Feeder Lines
–
CP supports its Western Corridor with four significant feeder lines: the “Coal Route”, which links southeastern B.C. coal deposits to the Western Corridor and to coal terminals at the Port of Vancouver; the “Edmonton-Calgary Route”, which provides rail access to Alberta’s Industrial Heartland (north of Edmonton, Alberta) in addition to the petrochemical facilities in central Alberta; the “Pacific CanAm Route”, which connects Calgary and Medicine Hat in Alberta with Pacific Northwest rail routes at Kingsgate, B.C. via the Crowsnest Pass in Alberta; and the “North Main Line Route” that provides rail service to customers between Portage la Prairie, Manitoba and Wetaskiwin, Alberta, including intermediate points Yorkton and Saskatoon in Saskatchewan. This line is an important collector of Canadian grain and fertilizer, serving the potash mines located east and west of Saskatoon and many high-throughput grain elevators and processing facilities. In addition, this line provides direct access to refining and upgrading facilities at Lloydminster, Alberta and western Canada’s largest pipeline terminal at Hardisty, Alberta.
Connections
–
The Company’s Western Corridor connects with the Union Pacific Railroad (“UP”) at Kingsgate and with BNSF at Coutts, Alberta, and at New Westminster and Huntingdon in B.C. This corridor also connects with CN at many locations including Thunder Bay, Winnipeg, Manitoba, Regina and Saskatoon in Saskatchewan, Red Deer, Camrose, Calgary and Edmonton in Alberta, Kamloops and several locations in the Greater Vancouver area in B.C.
Yards and Repair Facilities
–
CP supports rail operations on the Western Corridor with main rail yards at Vancouver, Calgary, Edmonton, Moose Jaw in Saskatchewan, Winnipeg and Thunder Bay. The Company has locomotive and railcar repair facilities at Golden, Vancouver, Calgary, Moose Jaw and Winnipeg. CP also has major intermodal terminals at Vancouver, Calgary, Edmonton, Regina and Winnipeg.
19
The Central Corridor: Moose Jaw and Winnipeg to Chicago and Kansas City
Overview
–
The Central Corridor connects with the Western Corridor at Moose Jaw and Winnipeg. By running south to Chicago and Kansas City, through the Twin Cities of Minneapolis and St. Paul, Minnesota, and through Milwaukee, Wisconsin, CP provides a direct, single-carrier route between western Canada and the U.S. Midwest, providing access to Great Lakes and Mississippi River ports. From La Crosse, Wisconsin, the Central Corridor continues south towards Kansas City via the Quad Cities (Davenport and Bettendorf in Iowa, and Rock Island and Moline in Illinois), providing an efficient route for traffic destined for southern U.S. and Mexican markets. CP’s Kansas City line also has a direct connection into Chicago and by extension to points east on CP’s network such as Toronto, Ontario and the Port of Montreal in Quebec.
Products
–
Traffic transported on the Central Corridor includes intermodal containers from the Port of Vancouver, fertilizers, chemicals, crude, frac sand, automotive, grain and other agricultural products.
Feeder Lines
–
The Company has operating rights over BNSF between Minneapolis and the twin ports of Duluth, Minnesota and Superior, Wisconsin. CP maintains its own yard facilities that provide an outlet for grain from the U.S. Midwest to the grain terminals at these ports; it is a strategic entry point for large dimensional shipments that can be routed via CP's network to locations such as Alberta's Industrial Heartland to serve the needs of the oil sands and energy industry. CP's route from Winona, Minnesota to Tracy, Minnesota provides access to key agricultural and industrial commodities. CP’s feeder line between Drake and New Town in North Dakota is geographically situated in a highly strategic region for Bakken oil production. CP also owns two significant feeder lines in North Dakota and western Minnesota operated by the Dakota Missouri Valley and Western Railroad and the Northern Plains Railroad, respectively. Both of these short lines are also active in providing service to agricultural and Bakken-oil-related customers.
Connections
–
The Company’s Central Corridor connects with all major railways at Chicago. Outside of Chicago, CP has major connections with BNSF at Minneapolis and at Minot, North Dakota, and with UP at St. Paul and Mankato, Minnesota. CP connects with CN at Milwaukee and Chicago. At Kansas City, CP connects with Kansas City Southern (“KCS”), BNSF, Norfolk Southern Railway ("NS") and UP. CP’s Central Corridor also links to several short-line railways that primarily serve grain and coal producing areas in the U.S., and extend CP’s market reach in the rich agricultural areas of the U.S. Midwest.
Yards and Repair Facilities
–
The Company supports rail operations on the Central Corridor with main rail yards in Chicago, Milwaukee, St. Paul and Glenwood in Minnesota, and Mason City and Davenport (Nahant yard) in Iowa. In addition, CP has a major locomotive repair facility at St. Paul and car repair facilities at St. Paul and Chicago. CP shares a yard with KCS in Kansas City. CP owns 49% of the Indiana Harbor Belt Railroad, a switching railway serving Greater Chicago and northwest Indiana. CP is also part owner of the Belt Railway Company of Chicago, which is the largest intermediate switching terminal railroad in the U.S. CP has major intermodal terminals in Minneapolis and Chicago as well as a dried distillers' grains transload facility that complements the service offering in Chicago.
The Eastern Corridor: Thunder Bay to Montreal, Detroit and Albany
Overview
–
The Eastern Corridor extends from Thunder Bay through to its eastern terminus at Montreal and from Toronto to Chicago via Windsor, Ontario and Detroit or Buffalo. The Company’s Eastern Corridor provides shippers direct rail service from Toronto and Montreal to Calgary and Vancouver via the Company’s Western Corridor and to the U.S. via the Central Corridor. This is a key element of the Company’s transcontinental intermodal service. Other services include truck trailers moving in drive-on/drive-off Expressway service between Montreal and Toronto. The corridor also supports the Company’s market position at the Port of Montreal by providing one of the shortest rail routes for European cargo destined to the U.S. Midwest, using the CP-owned route between Montreal and Detroit, coupled with a trackage rights arrangement on NS tracks between Detroit and Chicago.
Products
–
Major traffic categories transported in the Eastern Corridor include Forest products, chemicals and plastics, crude, ethanol, Metals, minerals and consumer products, intermodal containers, automotive products and general merchandise.
Feeder Lines
–
A major feeder line that serves the steel industry at Hamilton, Ontario provides connections with both CSX Corporation (“CSX”) and NS at Buffalo. The Delaware & Hudson Railway Company, Inc. ("D&H") feeder line extends from Montreal to Albany.
Connections
–
The Eastern Corridor connects with a number of short-line railways including routes from Montreal to Quebec City, Quebec and Montreal to St. John, New Brunswick and Searsport, Maine. Connections are also made with PanAm Southern at Mechanicville, New York for service to the Boston area and New England, and the Vermont Railway at Whitehall, New York. Through haulage arrangements, CP has service to Fresh Pond, New York to connect with New York & Atlantic Railway as well as direct access to the Bronx and Queens. CP can also access Philadelphia as well as a number of short-lines in Pennsylvania. Connections are also made with CN at a number of locations, including Sudbury, North Bay, Windsor, London, Hamilton and Toronto in Ontario, and Montreal in Quebec. CP connects in New York with NS and CSX at Buffalo, NS at Schenectady and CSX at Albany.
Yards and Repair Facilities
–
CP supports its rail operations in the Eastern Corridor with major rail yards at Sudbury, Toronto, London and Montreal. The Company has locomotive repair facilities at Montreal and Toronto and car repair facilities at Thunder Bay, Toronto and Montreal. The Company’s largest intermodal facility is located in the northern Toronto suburb of Vaughan and serves the Greater Toronto and southwestern Ontario areas. CP also operates intermodal terminals at Montreal and Detroit. Terminals for the Company’s
20
Expressway service are located in Montreal and at Milton, Ontario, in the Greater Toronto area. CP also has transload facilities in Agincourt and Hamilton, Ontario to meet a variety of commodity needs in the area.
Right-of-Way
The Company’s rail network is standard gauge, which is used by all major railways in Canada, the U.S. and Mexico. Continuous welded rail is used on the core main line network.
CP uses different train control systems on portions of the Company’s owned track, depending on the volume of rail traffic. Remotely controlled centralized traffic control signals are used in various corridors to authorize the movement of trains. CP is currently rolling out its PTC strategy for portions of its U.S. network.
In other corridors, train movements are directed by written instructions transmitted electronically and by radio from rail traffic controllers to train crews. In some specific areas of intermediate traffic density, CP uses an automatic block signalling system in conjunction with written instructions from rail traffic controllers.
Track and Infrastructure
CP operates on a network of approximately
12,500
miles of track, of which CP owns
10,600
miles and has access to
1,900
miles under trackage rights and haulage agreements. The Company's owned track miles includes leases with wholly owned subsidiaries where the term of the lease exceeds 99 years. CP's track network represents the size of the Company's operations that connects markets, customers and other railroads. Of the total mileage operated, approximately
5,400
miles are located in western Canada,
2,300
miles in eastern Canada,
4,400
miles in the U.S. Midwest and
400
miles in the U.S. Northeast. CP’s network accesses the U.S. markets directly through three wholly owned subsidiaries: Soo Line Railroad Company (“Soo Line”), a Class I railway operating in the U.S. Midwest; the Dakota, Minnesota and Eastern Railroad ("DM&E"), a wholly owned subsidiary of the Soo Line, which operates in the U.S. Midwest; and the D&H, which operates between eastern Canada and the U.S. Northeast.
At December 31,
2017
, the breakdown of CP operated track miles is as follows:
|
Total
|
|
|
|
First main track
|
12,489
|
|
|
Second and other main track
|
1,123
|
|
|
Passing sidings and yard track
|
4,278
|
|
|
Industrial and way track
|
785
|
|
|
Total track miles
|
18,675
|
|
Rail Facilities
CP operates numerous facilities including: terminals for intermodal, transload, automotive, and other freight; classification rail yards for train-building and switching, storage-in-transit and other activities; offices to administer and manage operations; dispatch centres to direct traffic on the rail network; crew quarters to house train crews along the rail line; shops and other facilities for fueling; maintenance and repairs of locomotives; and facilities for maintenance of freight cars and other equipment. Typically in all of our major yards, CP Police Services have offices to ensure the safety and security of the yards and operations.
The following table includes the major yards, terminals, and transload facilities on CP's network:
|
Major Classification Yards
|
Major Intermodal Terminals
|
Transload Facilities
|
|
Vancouver, British Columbia
|
Vancouver, British Columbia
|
Vancouver, British Columbia
|
|
Calgary, Alberta
|
Calgary, Alberta
|
Toronto, Ontario
|
|
Edmonton, Alberta
|
Edmonton, Alberta
|
Hamilton, Ontario
|
|
Moose Jaw, Saskatchewan
|
Regina, Saskatchewan
|
Lachine, Quebec
|
|
Winnipeg, Manitoba
|
Winnipeg, Manitoba
|
|
|
Toronto, Ontario
|
Vaughan, Ontario
|
|
|
Montreal, Quebec
|
Montreal, Quebec
|
|
|
Chicago, Illinois
|
Chicago, Illinois
|
|
|
St. Paul, Minnesota
|
St. Paul, Minnesota
|
|
21
Equipment
CP's equipment includes: owned and leased locomotives and railcars; heavy maintenance equipment and machinery; other equipment and tools in our shops, offices and facilities; and vehicles for maintenance, transportation of crews, and other activities.
The Company’s locomotive fleet is composed of largely high-adhesion alternating current locomotives that are more fuel-efficient and reliable and have superior hauling capacity, compared with standard direct current locomotives. As of December 31,
2017
, the Company had 400 locomotives in storage; as a result, the Company does not foresee the need to acquire new locomotives for the next several years. As of December 31,
2017
, CP owned or leased the following locomotive units:
|
Locomotives
|
Owned
|
|
Leased
|
|
Total
|
|
Average Age
(in years)
|
|
|
Road freight
|
||||||||
|
High-adhesion alternating current
|
784
|
|
34
|
|
818
|
|
6
|
|
|
Standard direct current
|
254
|
|
—
|
|
254
|
|
15
|
|
|
Road switcher
|
344
|
|
—
|
|
344
|
|
25
|
|
|
Yard switcher
|
14
|
|
—
|
|
14
|
|
37
|
|
|
Total locomotives
|
1,396
|
|
34
|
|
1,430
|
|
12
|
|
CP owns and leases a fleet of
35,952
freight cars. Owned freight cars include units acquired by CP, equipment leased to third parties, and held under capital leases. Leased freight cars include all units under a short-term or long-term operating lease or financed equipment. As of December 31,
2017
, CP owned and leased the following units of freight cars:
|
Freight cars
|
Owned
|
Leased
|
|
Total
|
Average Age
(in years)
|
|
|
Box car
|
2,787
|
104
|
|
2,891
|
32
|
|
|
Covered hopper
|
6,640
|
11,382
|
|
18,022
|
27
|
|
|
Flat car
|
1,528
|
691
|
|
2,219
|
24
|
|
|
Gondola
|
3,718
|
1,465
|
|
5,183
|
20
|
|
|
Intermodal
|
1,330
|
—
|
|
1,330
|
15
|
|
|
Multi-level autorack
|
2,843
|
566
|
|
3,409
|
30
|
|
|
Company service car
|
2,181
|
172
|
|
2,353
|
46
|
|
|
Open top hopper
|
314
|
6
|
|
320
|
31
|
|
|
Tank car
|
216
|
9
|
|
225
|
13
|
|
|
Total freight cars
|
21,557
|
14,395
|
|
35,952
|
28
|
|
As of December 31,
2017
, CP owned and leased the following units of intermodal equipment:
|
Intermodal equipment
|
Owned
|
Leased
|
Total
|
Average Age
(in years)
|
|
Containers
|
7,487
|
947
|
8,434
|
9
|
|
Chassis
|
5,547
|
605
|
6,152
|
13
|
|
Total intermodal equipment
|
13,034
|
1,552
|
14,586
|
11
|
Headquarters Office Building
CP owns and operates a multi-building campus in Calgary, encompassing the head office building, a data centre, training facility, and other office and operational buildings.
The Company's main dispatch centre is located in Calgary, and is the primary dispatching facility in Canada. Rail traffic controllers coordinate and dispatch crews, and manage the day-to-day locomotive management along the network, 24 hours a day, and seven days a week. The operations centre has a complete backup system in the event of any power disruption.
In addition to fully operational redundant systems, CP has a fully integrated Business Continuity Centre, should CP's operations centre be affected by any natural disaster, fire, cyber-attack, or hostile threat.
CP also maintains a secondary dispatch centre located in Minneapolis, where a facility similar to the one in Calgary exists. It services
22
the dispatching needs of locomotives and train crews working in the U.S.
Capital Expenditures
The Company incurs expenditures to expand and enhance its rail network, rolling stock and other infrastructure. These expenditures are aimed at improving efficiency and safety of our operations. Such investments are also an integral part of the Company's multi-year capital program and support growth initiatives. For further details, refer to Item 7. Management’s Discussion and Analysis of Financial Condition and Results of Operations, Liquidity and Capital Resources.
Encumbrances
Refer to Item 8. Financial Statements and Supplementary Data, Note 16 Debt, for information on the Company's capital lease obligations and assets held as collateral under these agreements.
For further details, refer to Item 8. Financial Statements and Supplementary Data, Note 23 Commitments and Contingencies.
Not applicable.
23
EXECUTIVE OFFICERS OF THE REGISTRANT
Our executive officers generally are elected and designated annually by the Board of Directors at its first meeting held after the annual meeting of shareholders, and they hold office until their successors are elected. Executive officers may also be elected and designated throughout the year as the Board of Directors consider appropriate. There are no family relationships among our officers, nor any arrangement or understanding between any officer and any other person pursuant to which the officer was selected. As of the date of this filing, the executive officers’ names, ages and business experience are:
|
Name, Age and Position
|
Business Experience
|
|
Keith Creel, 49
President and Chief Executive Officer
|
Mr. Creel became President and CEO of CP on January 31, 2017. Previously, he was President and Chief Operating Officer ("COO") from February 5, 2013 to January 30, 2017.
Prior to joining CP, Mr. Creel was Executive Vice-President and COO at CN from January 2010 to February 2013. During his time at CN, Mr. Creel held various positions including Executive Vice-President, Operations, Senior Vice-President Eastern Region, Senior Vice-President Western Region, and Vice-President of the Prairie Division.
Mr. Creel began his railroad career at Burlington Northern Railway in 1992 as an intermodal ramp manager in Birmingham, Alabama. He also spent part of his career at Grand Trunk Western Railroad as a superintendent and general manager, and at Illinois Central Railroad as a trainmaster and director of corridor operations, prior to its merger with CN in 1999.
|
|
Robert Johnson, 56
Executive Vice-President, Operations
|
Mr. Johnson has been Executive Vice-President, Operations of CP since April 20, 2016. Previous to this appointment, Mr. Johnson was CP's Senior Vice-President Operations, Southern Region from June 2013 to April 2016.
Prior to joining CP, Mr. Johnson's railroad career spanned 32 years with BNSF, where he held roles that progressively added to his responsibilities in operations, transportation, and service excellence. His most recent position at BNSF was General Manager, Northwest Division, overseeing day-to-day operations for that region.
|
|
Nadeem Velani, 45
Executive Vice-President and Chief Financial Officer
|
Mr. Velani has been Executive Vice-President and CFO of CP since October 17, 2017. Previous to this appointment, he was the Vice-President and CFO of CP from October 19, 2016 to October 16, 2017, Vice-President, Investor Relations from October 28, 2015 and Assistant Vice-President, Investor Relations from March 11, 2013.
Prior to joining CP, Mr. Velani spent 15 years at CN where he worked in a variety of positions in Strategic and Financial Planning, Investor Relations, Sales and Marketing, and the Office of the President and CEO.
Mr. Velani holds an undergraduate degree in Economics from Western University and a Masters of Business Administration degree ("MBA") in Finance/International Business from McGill University.
|
|
John Brooks, 47
Senior Vice-President and Chief Marketing Officer
|
Mr. Brooks has been CP’s Senior Vice-President and CMO since February 14, 2017. He has worked in senior marketing roles at CP since he joined the Company in 2007, most recently as Vice-President, Marketing - Bulk and Intermodal.
Mr. Brooks began his railroading career with UP and later helped start I&M Rail Link, LLC, which was purchased by DM&E in 2002. Mr. Brooks was Vice-President, Marketing at DM&E prior to it being acquired by CP in 2007.
With more than 20 years in the railroading business, Mr. Brooks brings a breadth of experience to the CMO role that will be pivotal to CP's continued and future success.
|
|
James Clements, 48
Vice-President, Strategic Planning and Transportation Services
|
Mr. Clements has been CP's Vice-President, Strategic Planning and Transportation Services since 2015. Mr. Clements has responsibilities that include strategic network issues and Network Service Centre operations. In addition, he has responsibility for all of CP’s facilities and Real Estate across North America.
Mr. Clements has been at CP for 23 years and his previous experience covers a wide range of areas of CP’s business, including car management, finance, joint facilities agreements, logistics, grain marketing and sales in both Canada and the U.S., as well as marketing and sales responsibility for various other lines of business at CP.
He has an MBA in Finance/International Business from McGill University and a B.Sc in Computer Science and Mathematics from McMaster University.
|
24
|
John Derry, 50
Vice-President, Human Resources
|
Mr. Derry has been Vice-President, Human Resources ("HR") of CP since October 2016, and was the Assistant Vice-President, HR from December 2014 to October 2016.
Prior to joining CP, Mr. Derry had a long history in the transportation industry, previously working with YRC Freight as Vice-President, Organizational Development and, prior to that, at KCS, where he served as Senior Vice-President, HR and Labour Relations.
Mr. Derry holds an undergraduate degree in Leadership Management from Judson University in Elgin, Illinois, a master's in Organizational Development from Bowling Green State University in Bowling Green, Ohio, and he completed the Negotiation and Dispute Resolution program at Creighton University in Omaha, Nebraska.
|
|
Jeffrey Ellis, 50
Chief Legal Officer and Corporate Secretary
|
Mr. Ellis was appointed Chief Legal Officer and Corporate Secretary effective November 23, 2015. Mr. Ellis is accountable for the overall strategic leadership, oversight and performance of the legal, corporate secretarial, government relations and public affairs functions of CP in Canada and the U.S.
Prior to joining CP in 2015, Mr. Ellis was the U.S. General Counsel at BMO Financial Group. Before joining BMO in 2006, Mr. Ellis was with the law firm of Borden Ladner Gervais LLP in Toronto, Canada.
Mr. Ellis has B.A. and M.A. degrees from the University of Toronto, J.D. and LL.M. degrees from Osgoode Hall Law School, and an MBA from the Richard Ivey School of Business, University of Western Ontario. Jeff is a member of the bars of New York, Illinois and Ontario.
|
|
Mike Foran, 44
Vice-President, Market Strategy and Asset Management
|
Mr. Foran has been CP’s Vice-President, Market Strategy and Asset Management since February 14, 2017. His prior roles with CP include Vice-President Network Transportation from 2014 to 2017, Assistant Vice-President Network Transportation from 2013 to 2014, and General Manager – Asset Management from 2012 to 2013. In over 20 years at CP, Mr. Foran has worked in operations, business development, marketing and general management.
Mr. Foran holds an executive MBA from the Ivey School of Business at Western University and a Bachelor of Commerce from the University of Calgary.
|
|
Michael Redeker, 57
Vice-President and Chief Information Officer
|
Mr. Redeker has been Vice-President and Chief Information Officer ("CIO") of CP since October 15, 2012.
Prior to joining CP, Mr. Redeker was Vice-President and CIO of Alberta Treasury Branch from May 2007 to September 2012. He also spent 11 years at IBM Canada, where he focused on delivering quality information technology services within the financial services industry.
|
|
Laird Pitz, 73
Senior Vice-President and Chief Risk Officer
|
Mr. Pitz has been Senior Vice-President and CRO of CP since October 17, 2017. Previously, he was the Vice-President and CRO of CP from October 29, 2014 to October 16, 2017 and the Vice-President, Security and Risk Management of CP from April 2014 to October 2014.
Prior to joining CP, Mr. Pitz was retired from March 2012 to April 2014, and Vice-President, Risk Mitigation of CN from September 2003 to March 2012.
Mr. Pitz, a Vietnam War veteran and former Federal Bureau of Investigation special agent, is a 40-year career professional who has directed strategic and operational risk mitigation, security and crisis management functions for companies operating in a wide range of fields, including defense, logistics and transportation.
|
25
Share Price and Dividend Information
CP's Common Shares are listed on the TSX and on the NYSE under the symbol "CP". The tables below present, for the quarters indicated, information on the dividends declared and the high and low share price of CP's Common Shares. The decision to declare any future cash dividend, including the amount of any such dividend and the establishment of record and payment dates, will be determined, in each quarter, by the Company's Board of Directors, in its sole discretion.
The following table indicates share data of CP's Common Shares listed on the TSX (in Canadian dollars):
|
Q1
|
Q2
|
Q3
|
Q4
|
Full year
|
||
|
2017
|
Dividends
|
$0.5000
|
$0.5625
|
$0.5625
|
$0.5625
|
$2.1875
|
|
Common Share Price
|
||||||
|
High
|
$205.00
|
$218.78
|
$212.64
|
$233.88
|
$233.88
|
|
|
Low
|
$188.36
|
$193.86
|
$189.57
|
$204.93
|
$188.36
|
|
|
2016
|
Dividends
|
$0.3500
|
$0.5000
|
$0.5000
|
$0.5000
|
$1.8500
|
|
Common Share Price
|
||||||
|
High
|
$178.83
|
$193.88
|
$203.29
|
$209.12
|
$209.12
|
|
|
Low
|
$140.02
|
$156.01
|
$165.65
|
$186.21
|
$140.02
|
|
The following table indicates share data of CP's Common Shares listed on the NYSE (in U.S. dollars):
|
Q1
|
Q2
|
Q3
|
Q4
|
Full year
|
||
|
2017
|
Dividends
|
$0.3740
|
$0.4260
|
$0.4510
|
$0.4460
|
$1.6970
|
|
Common Share Price
|
||||||
|
High
|
$156.30
|
$161.67
|
$169.58
|
$183.82
|
$183.82
|
|
|
Low
|
$141.32
|
$144.77
|
$150.91
|
$164.01
|
$141.32
|
|
|
2016
|
Dividends
|
$0.2670
|
$0.3900
|
$0.3790
|
$0.3680
|
$1.4040
|
|
Common Share Price
|
||||||
|
High
|
$135.77
|
$151.38
|
$157.34
|
$156.71
|
$157.34
|
|
|
Low
|
$97.09
|
$119.50
|
$127.02
|
$139.29
|
$97.09
|
|
Share Capital
At
February 14, 2018
,
the latest practicable date, there were 144,212,716 Common Shares and no preferred shares issued and outstanding, which consists of 14,576 holders of record of the Company's Common Shares. In addition, CP has a Management Stock Option Incentive Plan (“MSOIP”), under which key officers and employees are granted options to purchase CP Common Shares. Each option granted can be exercised for one Common Share.
At
February 14, 2018
, 1.6 million options were outstanding under the Company’s MSOIP and stand-alone option agreements entered into with Mr. Keith Creel. There are 1.4 million options available to be issued by the Company’s MSOIP in the future.
CP has a Director's Stock Option Plan (“DSOP”), under which directors are granted options to purchase CP Common Shares. There are no outstanding options under the DSOP, which has 0.3 million options available to be issued in the future.
Securities Authorized for Issuance Under Equity Compensation Plans
The following table shows, as of December 31, 2017, compensation plans under which equity securities of the Corporation are authorized for issuance upon the exercise of options outstanding under the MSOIP and the DSOP. The table also shows the number of Shares available for issuance, including 340,000 Shares under the DSOP. On July 21, 2003, the Board suspended all further grants of options under the DSOP.
26
|
Plan Category
|
Number of securities to be issued upon exercise of outstanding options, warrants and rights
|
Weighted-average exercise price of outstanding options, warrants and rights
|
Number of securities available for future issuance under equity compensation plans (excluding securities reflected in column (a))
|
||||
|
Equity compensation plans approved by security holders
|
1,481,275
|
|
$
|
150.54
|
|
1,895,922
|
|
|
Equity compensation plans not approved by security holders
|
—
|
|
—
|
|
—
|
|
|
|
Total
|
1,481,275
|
|
$
|
150.54
|
|
1,895,922
|
|
Stock Performance Graph
The following graph provides an indicator of cumulative total shareholder return on the Company’s Common Shares, of an assumed investment of $100, as compared to the TSX 60 Index (“TSX 60”), the Standard & Poor's 500 Stock Index (“S&P 500”), and the peer group index (comprising CN, KCS, UP, NS and CSX) on December 31 for each of the years indicated. The values for the assumed investments depicted on the graph and in the table have been calculated assuming that any dividends are reinvested.
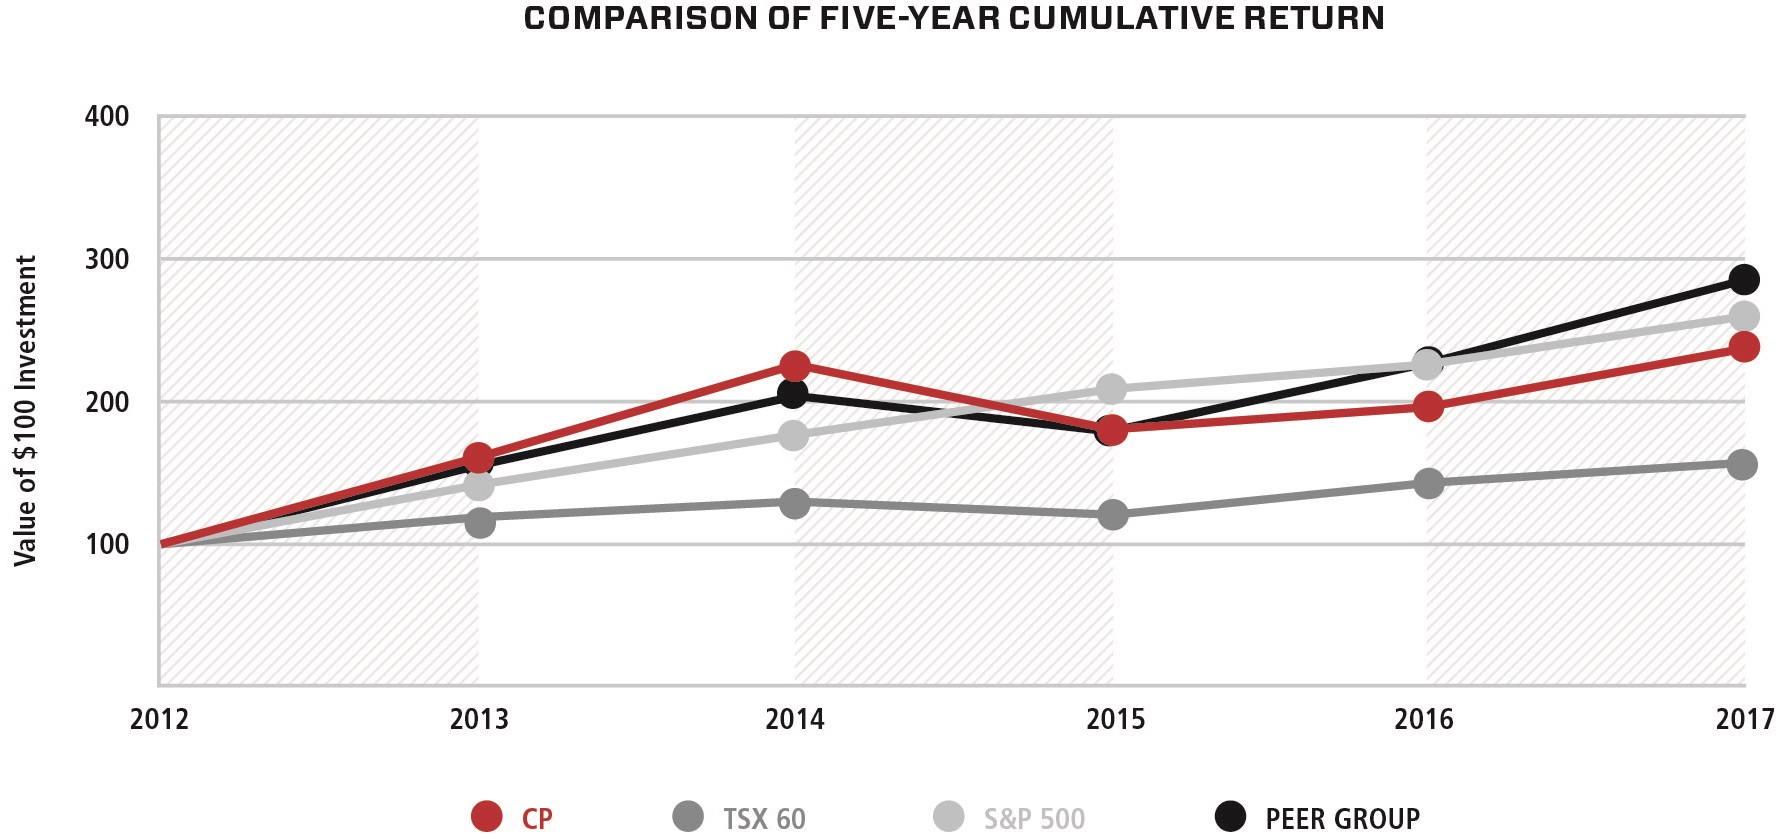
Issuer Purchase of Equity Securities
CP has established a share repurchase program, which is further described in the Share repurchase section in Item 8. Financial Statements and Supplementary Data, Note 19 Shareholders' Equity. During
2017
, CP repurchased
1.9 million
Common Shares for
$381 million
at an average price of
$201.53
. The following table presents Common Shares repurchased during each month for the fourth quarter of
2017
.
|
2017
|
Total number of shares purchased
|
Average price paid per share
(1)
|
Total number of shares purchased as part of publicly announced plans or programs
|
Maximum number of shares (or units) that may yet be purchased under the plans or programs
|
|||||
|
October 1 to October 31
|
—
|
|
$
|
—
|
|
—
|
|
2,555,762
|
|
|
November 1 to November 30
|
59,800
|
|
215.90
|
|
59,800
|
|
2,495,962
|
|
|
|
December 1 to December 31
|
—
|
|
—
|
|
—
|
|
2,495,962
|
|
|
|
Ending Balance
|
59,800
|
|
$
|
215.90
|
|
59,800
|
|
N/A
|
|
(1)
Includes brokerage fees.
27
The following table presents as of, and for the years ended, December 31, selected financial data related to the Company’s financial results for the last five fiscal years. The selected financial data should be read in conjunction with Item 7. Management’s Discussion and Analysis of Financial Condition and Results of Operations and Item 8. Financial Statements and Supplementary Data.
|
(in millions, except per share data, percentage and ratios)
|
2017
|
|
2016
|
|
2015
|
|
2014
|
|
2013
|
|
|||||
|
Financial Performance
|
|||||||||||||||
|
Total revenues
|
$
|
6,554
|
|
$
|
6,232
|
|
$
|
6,712
|
|
$
|
6,620
|
|
$
|
6,133
|
|
|
Operating income
|
2,793
|
|
2,578
|
|
2,688
|
|
2,339
|
|
1,420
|
|
|||||
|
Adjusted operating income
(1)
|
2,742
|
|
2,578
|
|
2,620
|
|
2,335
|
|
1,844
|
|
|||||
|
Net income
|
2,405
|
|
1,599
|
|
1,352
|
|
1,476
|
|
875
|
|
|||||
|
Adjusted income
(1)
|
1,666
|
|
1,549
|
|
1,625
|
|
1,482
|
|
1,132
|
|
|||||
|
Basic earnings per share ("EPS")
|
16.49
|
|
10.69
|
|
8.47
|
|
8.54
|
|
5.00
|
|
|||||
|
Diluted EPS
|
16.44
|
|
10.63
|
|
8.40
|
|
8.46
|
|
4.96
|
|
|||||
|
Adjusted diluted EPS
(1)
|
11.39
|
|
10.29
|
|
10.10
|
|
8.50
|
|
6.42
|
|
|||||
|
Dividends declared per share
|
2.1875
|
|
1.8500
|
|
1.4000
|
|
1.4000
|
|
1.4000
|
|
|||||
|
Financial Position
|
|||||||||||||||
|
Total assets
|
$
|
20,135
|
|
$
|
19,221
|
|
$
|
19,637
|
|
$
|
16,550
|
|
$
|
16,680
|
|
|
Total long-term debt, including current portion
|
8,159
|
|
8,684
|
|
8,957
|
|
5,793
|
|
4,876
|
|
|||||
|
Shareholders’ equity
|
6,437
|
|
4,626
|
|
4,796
|
|
5,610
|
|
7,097
|
|
|||||
|
Cash provided by operating activities
|
2,182
|
|
2,089
|
|
2,459
|
|
2,123
|
|
1,950
|
|
|||||
|
Free cash
(1)
|
874
|
|
1,007
|
|
1,381
|
|
969
|
|
774
|
|
|||||
|
Financial Ratios
|
|||||||||||||||
|
Return on invested capital ("ROIC")
(1)
|
20.5
|
%
|
14.4
|
%
|
12.9
|
%
|
14.4
|
%
|
10.1
|
%
|
|||||
|
Adjusted ROIC
(1)
|
14.7
|
%
|
14.0
|
%
|
15.2
|
%
|
14.5
|
%
|
12.2
|
%
|
|||||
|
Operating ratio
(2)
|
57.4
|
%
|
58.6
|
%
|
60.0
|
%
|
64.7
|
%
|
76.8
|
%
|
|||||
|
Adjusted operating ratio
(1)
|
58.2
|
%
|
58.6
|
%
|
61.0
|
%
|
64.7
|
%
|
69.9
|
%
|
|||||
|
(1)
|
These measures have no standardized meanings prescribed by accounting principles generally accepted in the United States of America ("GAAP") and, therefore, may not be comparable to similar measures presented by other companies. These measures are defined and reconciled in Non-GAAP Measures in Item 7. Management’s Discussion and Analysis of Financial Condition and Results of Operations.
|
|
(2)
|
Operating ratio is defined as operating expenses divided by revenues.
|
28
INDEX TO MANAGEMENT'S DISCUSSION AND ANALYSIS
|
Page
|
|
|
Executive Summary
|
|
|
2018 Outlook
|
|
|
Performance Indicators
|
|
|
Results of Operations
|
|
|
Impact of Foreign Exchange on Earnings
|
|
|
Impact of Fuel Price on Earnings
|
|
|
Impact of Share Price on Earnings
|
|
|
Operating Revenues
|
|
|
Operating Expenses
|
|
|
Other Income Statement Items
|
|
|
Liquidity and Capital Resources
|
|
|
Non-GAAP Measures
|
|
|
Off-Balance Sheet Arrangements
|
|
|
Critical Accounting Estimates
|
|
|
Forward-Looking Information
|
|
29
The following discussion and analysis should be read in conjunction with the Company’s Consolidated Financial Statements and the related notes in Item 8. Financial Statements and Supplementary Data, and other information in this report. Except where otherwise indicated, all financial information reflected herein is expressed in Canadian dollars.
Executive Summary
2017
Results
|
•
|
Financial performance –
In
2017
, CP reported Diluted EPS of
$16.44
while Adjusted diluted EPS climbed to a record
$11.39
, an
11%
improvement compared to Adjusted diluted EPS of
$10.29
in
2016
. CP’s commitment to service and operational efficiency produced best-ever full-year Operating ratio and Adjusted operating ratio of
57.4%
and
58.2%
, respectively, beating the previous record set in 2016. Adjusted diluted EPS and Adjusted operating ratio are defined and reconciled in Non-GAAP Measures and discussed further in Results of Operations of this Item 7. Management’s Discussion and Analysis of Financial Condition and Results of Operations.
|
|
•
|
Total revenues
– CP’s total revenues increased by
5%
to
$6,554 million
in 2017 from
$6,232 million
in 2016, driven primarily by a
5%
volume growth as measured in revenue ton-miles ("RTM").
|
|
•
|
Operating performance
– CP's average train weight increased by
2%
to
8,806
tons and terminal dwell time improved by
1%
to
6.6
hours. Average train speed decreased by
4%
to
22.6
miles per hour and average train length remained substantially unchanged at
7,214
feet, primarily as a result of CP moving proportionately more frac sand, Potash and domestic intermodal traffic, partially offset by decreases in international intermodal traffic compared to the same period in 2016. These metrics are discussed further in Performance Indicators of this Item 7. Management's Discussion and Analysis of Financial Condition and Results of Operations.
|
The following table compares 2017 outlook to actual results:
|
Adjusted diluted EPS
(1)
|
Capital expenditures
|
|
|
Outlook
|
Initially set as high single-digit EPS growth from full-year 2016 Adjusted diluted EPS of $10.29.
Revised at the end of the third quarter to double-digit EPS growth.
|
Approximately $1.25 billion
|
|
Actual outcomes
|
Adjusted diluted EPS growth of 11% to $11.39
|
$1.34 billion, 7% higher than outlook
|
(1)
Adjusted diluted EPS is defined and reconciled in Non-GAAP Measures of this Item 7. Management's Discussion and Analysis of Financial Condition and Results of Operations. Due to reasons similar to those described in the 2018 Outlook section below, CP had not calculated an outlook for Diluted EPS in 2017.
During 2017, CP exceeded its Diluted EPS outlook primarily due to volume growth and continued cost control. Capital expenditures were 7% higher than outlook, primarily due to CP performing track and roadway work in 2017 that was initially planned for 2018.
2018
Outlook
With a 2018 plan that balances strategic growth with continued productivity improvement, CP expects revenue growth to be in the mid-single digits and Adjusted diluted EPS growth to be in the low double-digits. CP’s expectations for Adjusted diluted EPS growth in 2018 are based on Adjusted diluted EPS of $11.39 in 2017. CP assumes the Canadian-to-U.S. dollar exchange rate will be in the range of $1.25 to $1.30 and expects an effective tax rate in the range of 24.5 to 25.0 percent. As CP continues to invest in service, productivity and safety, the Company plans to invest between $1.35 billion to $1.50 billion in capital programs in 2018. Capital programs are defined and discussed further in Liquidity and Capital Resources of this Item 7. Management’s Discussion and Analysis of Financial Condition and Results of Operations.
Adjusted diluted EPS is defined and discussed further in Non-GAAP Measures and in Forward-Looking Information of this Item 7. Management’s Discussion and Analysis of Financial Condition and Results of Operations. Although CP has provided a forward-looking non-GAAP measure, it is not practicable to provide a reconciliation to a forward-looking reported Diluted EPS, the most comparable GAAP measure, due to unknown variables and uncertainty related to future results. These unknown variables may include unpredictable transactions of significant value. In past years, CP has recognized significant asset impairment charges and management transition costs related to senior executives. These or other similar, large unforeseen transactions affect Diluted EPS but may be excluded from CP’s Adjusted diluted EPS. Additionally, the Canadian-to-U.S. dollar exchange rate is unpredictable and can have a significant impact on CP’s reported results but may be excluded from CP’s Adjusted diluted EPS. In particular, CP excludes the foreign exchange ("FX") impact of translating the Company’s U.S. dollar denominated long-term debt from Adjusted diluted EPS. Please see Forward-Looking Information of this Item 7. Management’s Discussion and Analysis of Financial Condition and Results of Operations for further discussion.
30
Performance Indicators
The following table lists the key measures of the Company’s operating performance:
|
|
|
|
% Change
|
|||||||
|
For the year ended December 31
|
2017
|
|
2016
(1)
|
|
2015
(1)
|
|
2017 vs. 2016
|
2016 vs. 2015
|
||
|
Operations Performance
|
||||||||||
|
Gross ton-miles (“GTMs”) (millions)
|
252,195
|
|
242,694
|
|
263,344
|
|
4
|
|
(8
|
)
|
|
Train miles (thousands)
|
30,632
|
|
30,373
|
|
34,064
|
|
1
|
|
(11
|
)
|
|
Average train weight – excluding local traffic (tons)
|
8,806
|
|
8,614
|
|
8,314
|
|
2
|
|
4
|
|
|
Average train length – excluding local traffic (feet)
|
7,214
|
|
7,217
|
|
6,935
|
|
—
|
|
4
|
|
|
Average terminal dwell (hours)
|
6.6
|
|
6.7
|
|
7.2
|
|
(1
|
)
|
(7
|
)
|
|
Average train speed (miles per hour, or "mph")
|
22.6
|
|
23.5
|
|
21.4
|
|
(4
|
)
|
10
|
|
|
Fuel efficiency (U.S. gallons of locomotive fuel consumed/1,000 GTMs)
|
0.980
|
|
0.980
|
|
0.999
|
|
—
|
|
(2
|
)
|
|
Total employees (average)
|
12,034
|
|
12,082
|
|
13,858
|
|
—
|
|
(13
|
)
|
|
Total employees (end of period)
|
12,163
|
|
11,653
|
|
12,817
|
|
4
|
|
(9
|
)
|
|
Workforce (end of period)
|
12,242
|
|
11,698
|
|
12,899
|
|
5
|
|
(9
|
)
|
|
Safety Indicators
|
|
|
|
|
|
|
||||
|
FRA personal injuries per 200,000 employee-hours
|
1.65
|
|
1.67
|
|
1.84
|
|
(1
|
)
|
(9
|
)
|
|
FRA train accidents per million train-miles
|
0.99
|
|
1.12
|
|
1.41
|
|
(12
|
)
|
(21
|
)
|
(1)
Certain figures have been updated to reflect new information or have been revised to conform with current presentation.
Operations Performance
These key measures of operating performance reflect how effective CP's management is at controlling costs and executing the Company's operating plan and strategy. Improving these measures ensures CP is continuing to leverage the Company's low cost base and improve service to absorb increased workload and drive sustainable, profitable growth.
A
GTM
is the movement of one ton of train weight over one mile. GTMs are calculated by multiplying total train weight by the distance the train moved. Total train weight comprises of the weight of the freight cars, their contents, and any inactive locomotives. An increase in GTMs indicates additional workload. GTMs for
2017
were
252,195 million
, a
4%
increase
compared with
242,694 million
in
2016
. This
increase
was primarily driven by increased volumes of Energy, chemicals and plastics, frac sand, and Potash. This increase was partially offset by decreased volumes of international intermodal and Automotive.
GTMs in
2016
decrease
d by
8%
compared with
263,344 million
in
2015
. This decrease was primarily driven by decreased volumes of crude, Potash, and Canadian grain.
Train miles
are defined as the sum of the distance moved by all trains operated on the network. Train miles for
2017
increase
d by
1%
compared with
2016
. This reflects the impact of higher volumes partially offset by continuous improvements in train weights as evident in the relative comparison to GTMs, which grew by 4% in 2017.
Train miles in
2016
decrease
d by
11%
compared with
2015
due to lower volumes and continuous improvements in operating efficiency from an increase in train weights.
The
average train weight
is defined as the average gross weight of CP trains, both loaded and empty. This excludes trains in short-haul service, work trains used to move CP’s track equipment and materials, and the haulage of other railways’ trains on CP’s network. Average train weight of
8,806
tons in
2017
increase
d by
192
tons, or
2%
, from
2016
. This increase was due to continuous improvements in operating plan efficiency, as well as higher frac sand, Potash and crude volumes compared to the same period in 2016.
The
average train length
is the sum of each car multiplied by the distance travelled, divided by train miles. Local trains are excluded from this measure. Average train length of
7,214
feet in
2017
decrease
d by
3
feet from
2016
. This is a result of moving proportionately more shorter but heavier frac sand and crude trains compared to the same period in 2016, offset by improvements in operating plan efficiency.
Average train weight
increase
d in
2016
by
300
tons, or
4%
, from
2015
. Average train length
increase
d in
2016
by
282
feet, or
4%
, from
2015
.
31
Both average train weight and length in
2016
benefited from improvements in operating plan efficiency and increased bulk traffic being conveyed in longer, heavier trains.
The
average terminal dwell
is defined as the average time a freight car resides within terminal boundaries expressed in hours. The timing starts with a train arriving at the terminal, a customer releasing the car to the Company, or a car arriving at interchange from another railway. The timing ends when the train leaves, a customer receives the car from CP, or the freight car is transferred to another railway. Freight cars are excluded if they are being stored at the terminal or used in track repairs. Average terminal dwell
decrease
d by
1%
in
2017
from
6.7
hours in
2016
to
6.6
hours in
2017
. Average terminal dwell also
decrease
d by
7%
in
2016
to
6.7
hours from
7.2
hours in
2015
. These favourable
decrease
s were primarily due to continued improvements in yard operating performance and the focus and visibility provided through improved trip planning.
The
average train speed
is defined as a measure of the line-haul movement from origin to destination including terminal dwell hours. It is calculated by dividing the total train miles travelled by the total train hours operated. This calculation does not include delay time related to customer or foreign railways and excludes the time and distance travelled by: i) trains used in or around CP’s yards; ii) passenger trains; and iii) trains used for repairing track. Average train speed was
22.6
mph in
2017
, a
decrease
of
4%
, from
23.5
mph in
2016
. Average train speed in
2016
increase
d by
10%
, from
21.4
mph in
2015
. In 2017, this unfavourable decrease was primarily due to:
|
•
|
increased volumes of heavier and slower frac sand and Potash trains;
|
|
•
|
decreased volumes of lighter and faster Intermodal trains; and
|
|
•
|
harsher weather conditions in the first quarter of 2017.
|
In 2016, this favourable
increase
was primarily due to improved train design and operating plan execution.
Fuel efficiency
is defined as U.S. gallons of locomotive fuel consumed per 1,000 GTMs – freight and yard. Fuel efficiency was flat in
2017
compared to
2016
and
improve
d by
2%
in
2016
compared to
2015
. Improvements in fuel efficiency in 2016 compared to 2015 were a result of increased locomotive productivity, operational fluidity, and execution of the Company's fuel conservation strategies.
Total Employees and Workforce
An
employee
is defined by the Company as an individual currently engaged in full-time, part-time or seasonal employment with CP. The average number of total employees for
2017
decrease
d by
48
compared with
2016
. The decrease was primarily due to strong operational performance, natural attrition and efficient resource management planning. The total number of employees as at December 31,
2017
was
12,163
, an
increase
of
510
, or
4%
, compared with
11,653
as at December 31,
2016
, which is in line with the current and expected growth in volumes.
The average number of total employees for
2016
decrease
d by
1,776
, or
13%
, compared with
2015
. The total number of employees as at December 31,
2016
was
11,653
, a decrease of
1,164
, or
9%
, compared with
12,817
as at December 31,
2015
. These improvements were primarily due to job reductions as a result of continuing strong operational performance and natural attrition.
The
workforce
is defined as total employees plus contractors and consultants. The workforce as at December 31,
2017
increase
d by
544
, or
5%
, compared with December 31,
2016
. This increase is in line with the current and expected growth in GTMs and RTMs. The workforce as at December 31,
2016
decreased by
1,201
, or
9%
, compared with December 31,
2015
. These improvements were primarily due to strong operational performance, natural attrition and efficient resource management planning.
Safety Indicators
Safety is a key priority and core strategy for CP’s management, employees and Board of Directors. The Company’s two main safety indicators – personal injuries and train accidents – follow strict U.S. FRA reporting guidelines.
The
FRA personal injuries per 200,000 employee-hours
frequency is the number of personal injuries, multiplied by 200,000 and divided by total employee hours. Personal injuries are defined as injuries that require employees to lose time away from work, modify their normal duties or obtain medical treatment beyond minor first aid. FRA employee-hours are the total hours worked, excluding vacation and sick time, by all employees, excluding contractors. The FRA personal injuries per 200,000 employee-hours frequency for CP was
1.65
in
2017
,
1.67
in
2016
and
1.84
in
2015
.
The
FRA train accidents per million train-miles
frequency is the number of train accidents, multiplied by 1,000,000 and divided by total train miles. Train accidents included in this metric meet or exceed the FRA damage reporting threshold of U.S. $10,700 in 2017 and U.S. $10,500 in damage for 2016 and 2015. The FRA train accidents per million train-miles frequency for CP in
2017
was
0.99
, compared with
1.12
in
2016
and
1.41
in
2015
.
32
Results of Operations
Income
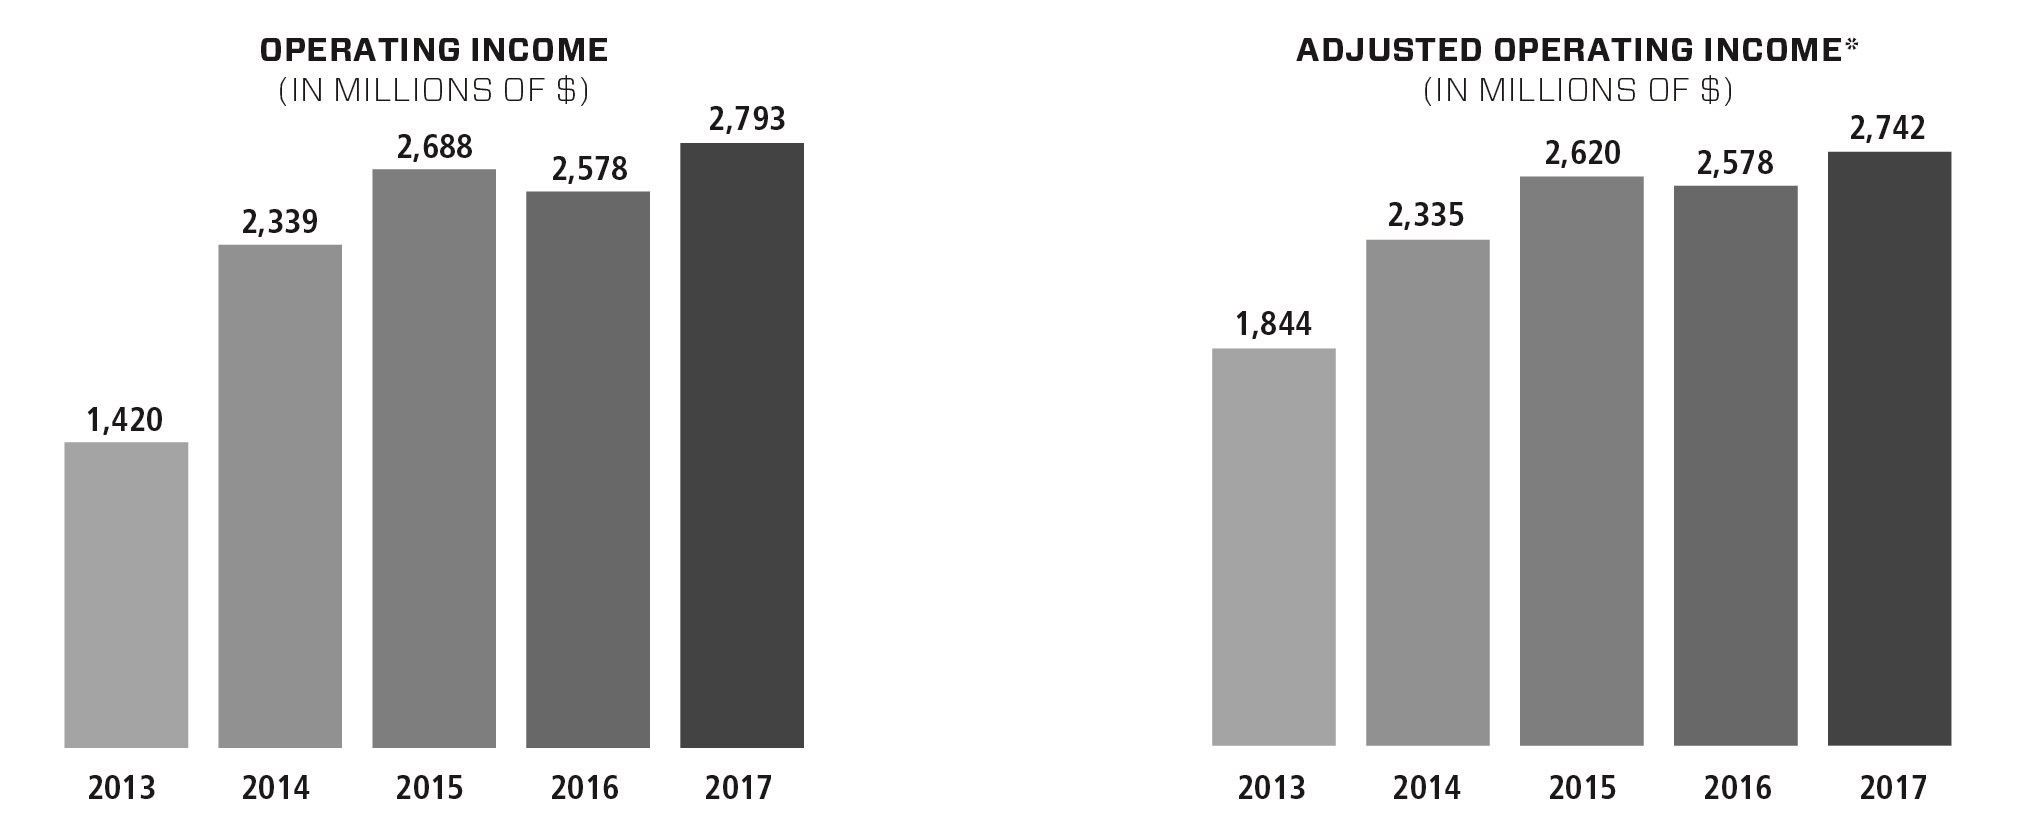
*Adjusted operating income is defined and reconciled in Non-GAAP Measures of this Item 7. Management’s Discussion and Analysis of Financial Condition and Results of Operations
Operating income was $
2,793 million
in
2017
, an
increase
of $
215 million
, or
8%
, from $
2,578 million
in
2016
. This
increase
was primarily due to:
|
•
|
higher volumes;
|
|
•
|
higher defined benefit pension plan income of $101 million
;
|
|
•
|
management transition recoveries of $51 million associated with Mr. E. Hunter Harrison's retirement as CEO of CP
; and
|
|
•
|
efficiencies generated from improved operating performance and asset utilization.
|
This
increase
was partially offset by:
|
•
|
lower gains on land sales of $91 million, following the sales of CP's Arbutus Corridor and Obico rail yard in 2016
;
|
|
•
|
the unfavourable impact of the change in FX of $32 million;
|
|
•
|
the impact of wage and benefit inflation of approximately 3%;
and
|
|
•
|
higher depreciation and amortization.
|
Operating income was $
2,578 million
in
2016
, a
decrease
of $
110 million
, or
4%
, from
$2,688 million
in
2015
. This
decrease
was primarily due to:
|
•
|
lower traffic volumes;
|
|
•
|
the unfavourable impacts of fluctuations in fuel price;
|
|
•
|
a $68 million gain on sale of D&H South in 2015;
|
|
•
|
higher depreciation and amortization; and
|
|
•
|
higher wage and benefit inflation.
|
This
decrease
was partially offset by:
|
•
|
efficiencies generated from improved operating performance and asset utilization;
|
|
•
|
a change of
$122 million
in defined benefit pension plan from an expense of $32 million in 2015 to $90 million in income in 2016;
|
|
•
|
the favourable impact of the change in FX of $69 million; and
|
|
•
|
higher land sales.
|
Adjusted operating income, defined and reconciled in Non-GAAP Measures of this Item 7. Management’s Discussion and Analysis of Financial Condition and Results of Operations, was
$2,742 million
in
2017
, an
increase
of $
164
million, or
6%
, from
$2,578 million
in
2016
. This
increase
was primarily due to the same factors discussed above for the
increase
in operating income, except that Adjusted operating income in 2017 excludes the management transition recovery of $51 million.
Adjusted operating income was
$2,578 million
in
2016
, a
decrease
of
$42 million
, or
2%
, from
$2,620 million
in
2015
. This
decrease
was primarily due to the same factors discussed above for the
decrease
in Operating income, except that Adjusted operating income excluded the $68 million gain on sale of D&H South in 2015.
33
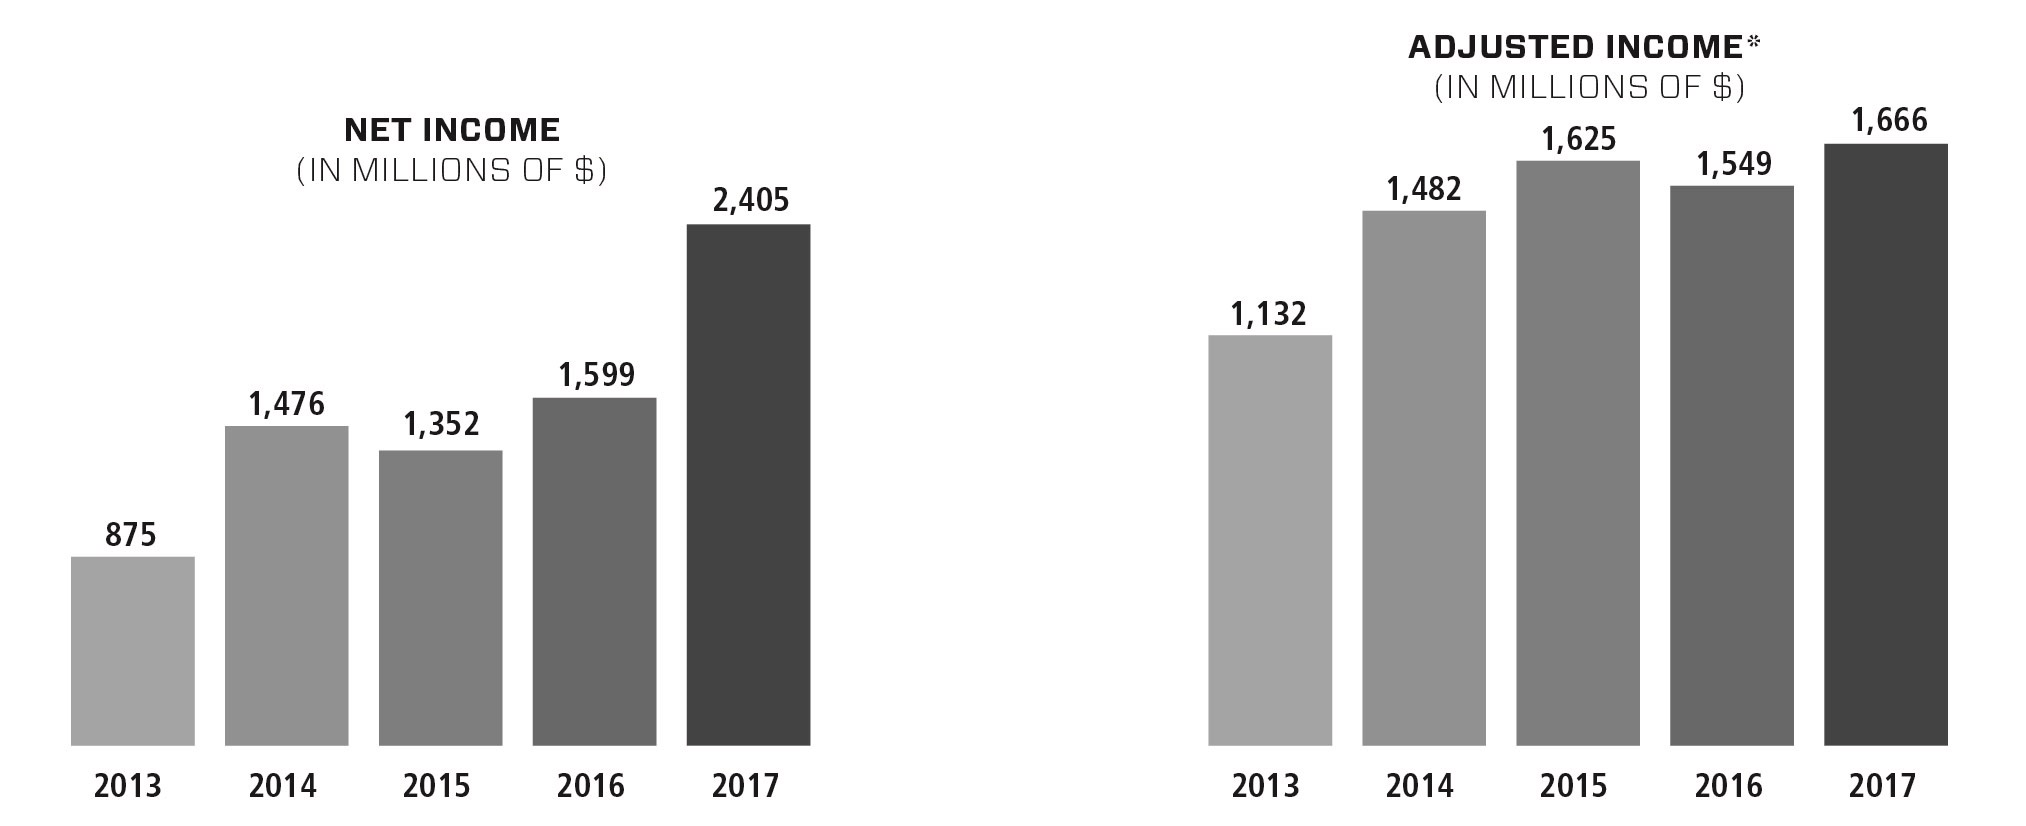
*Adjusted income is defined and reconciled in Non-GAAP Measures of this Item 7. Management’s Discussion and Analysis of Financial Condition and Results of Operations.
Net income was
$2,405 million
in
2017
, an
increase
of $
806 million
, or
50%
, from
$1,599 million
in
2016
. This
increase
was primarily due to income tax recoveries of $541 million from tax rate changes, higher Operating income, and the favourable impact of FX translation on U.S. dollar-denominated debt. This
increase
was partially offset by higher Income tax expense associated with higher pre-tax earnings.
Net income was
$1,599 million
in
2016
, an
increase
of
$247 million
, or
18%
, from
$1,352 million
in
2015
. This
increase
was primarily due to the favourable impact of FX translation on U.S. dollar-denominated debt and a decrease in Income tax expense due to the lower effective tax rate compared to 2015. This
increase
was partially offset by lower Operating income and higher Interest expense on new debt issued in 2015.
Adjusted income, defined and reconciled in Non-GAAP Measures of this Item 7. Management’s Discussion and Analysis of Financial Condition and Results of Operations, was
$1,666 million
in
2017
, an
increase
of
$117 million
, or
8%
, from
$1,549 million
in
2016
. This
increase
was primarily due to the increase in Adjusted operating income, partially offset by higher Income tax expense associated with higher pre-tax earnings.
Adjusted income was
$1,549 million
in
2016
, a
decrease
of $
76 million
, or
5%
, from
$1,625 million
in
2015
. This
decrease
was primarily due to the decrease in Adjusted operating income and higher Interest expense on new debt issued in 2015, partially offset by a decrease in income tax expense due to the lower effective tax rate excluding significant items compared to 2015.
Diluted Earnings per Share
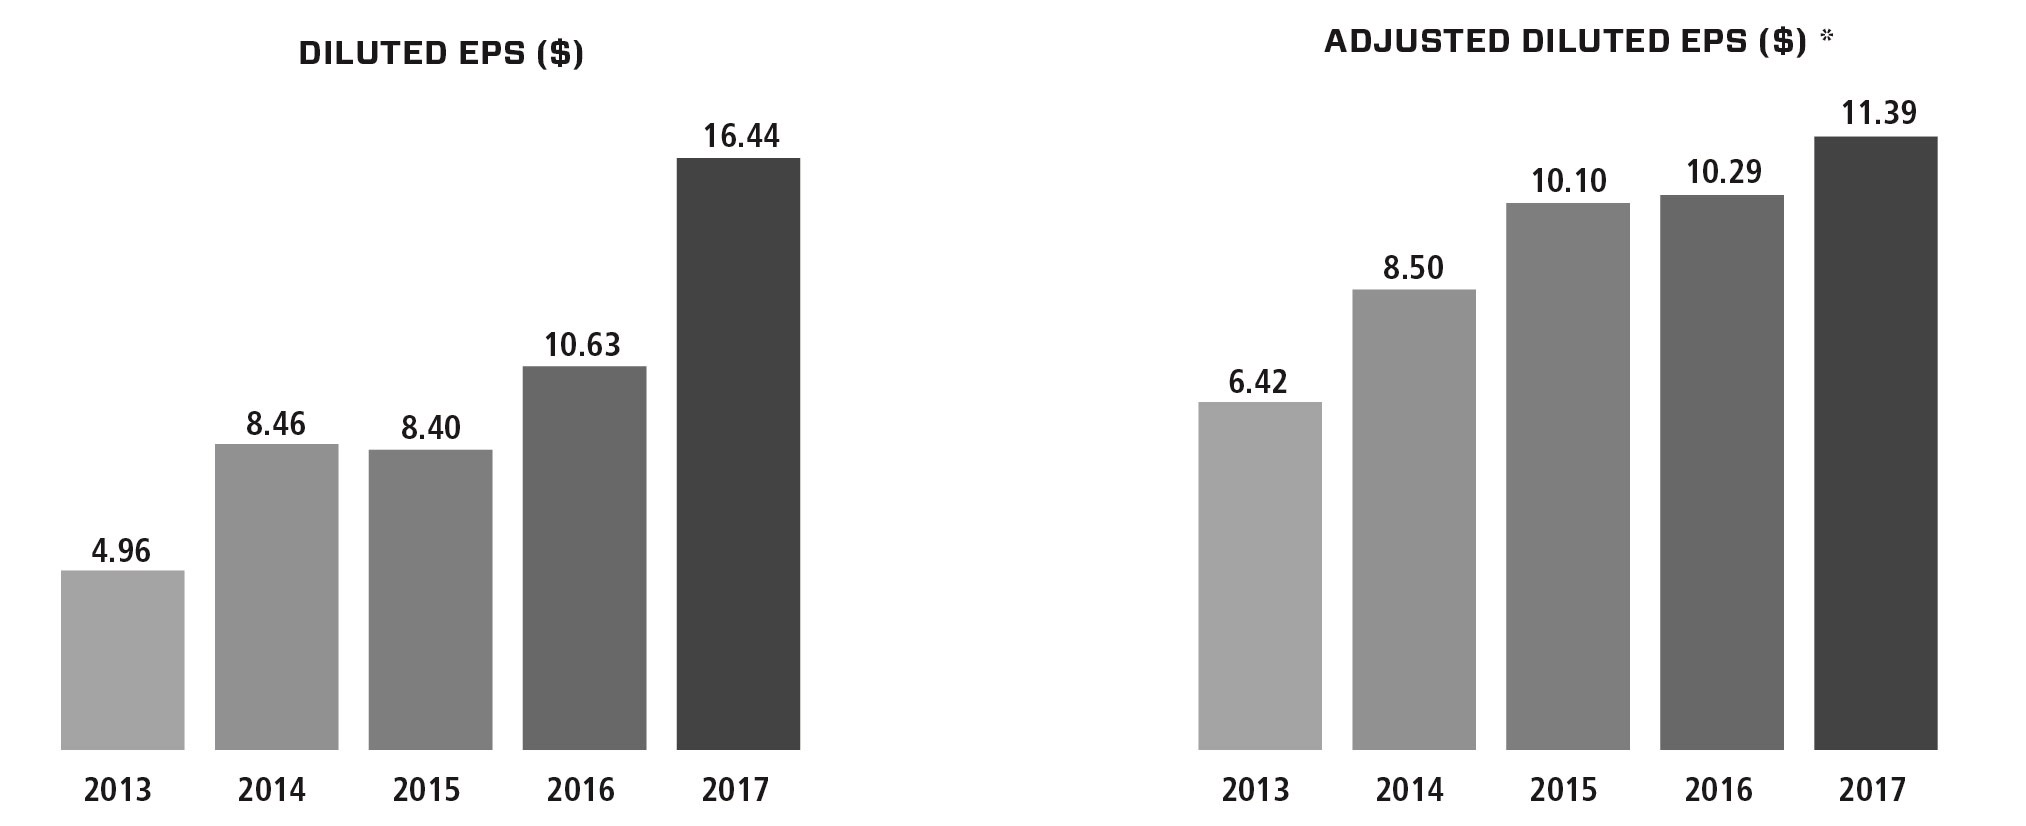
*Adjusted diluted EPS is defined and reconciled in Non-GAAP Measures of this Item 7. Management’s Discussion and Analysis of Financial Condition and Results of Operations.
34
Diluted EPS was
$16.44
in
2017
, an
increase
of $
5.81
, or
55%
, from
$10.63
in
2016
; in 2016 Diluted EPS had
increase
d by
$2.23
, or
27%
, from
$8.40
in
2015
. These
increase
s were primarily due to higher Net income and the lower average number of outstanding shares due to the Company's share repurchase program.
Adjusted diluted EPS, defined and reconciled in Non-GAAP Measures of this Item 7. Management’s Discussion and Analysis of Financial Condition and Results of Operations, was
$11.39
in
2017
, an
increase
of $
1.10
, or
11%
, from
$10.29
in
2016
. This
increase
was primarily due to higher Adjusted income and the lower average number of outstanding shares due to the Company's share repurchase program.
Adjusted diluted EPS was
$10.29
in
2016
, an
increase
of $
0.19
, or
2%
, from
$10.10
in
2015
. This
increase
was primarily due to the lower average number of outstanding shares due to the Company’s share repurchase program, partially offset by lower Adjusted income.
Operating Ratio
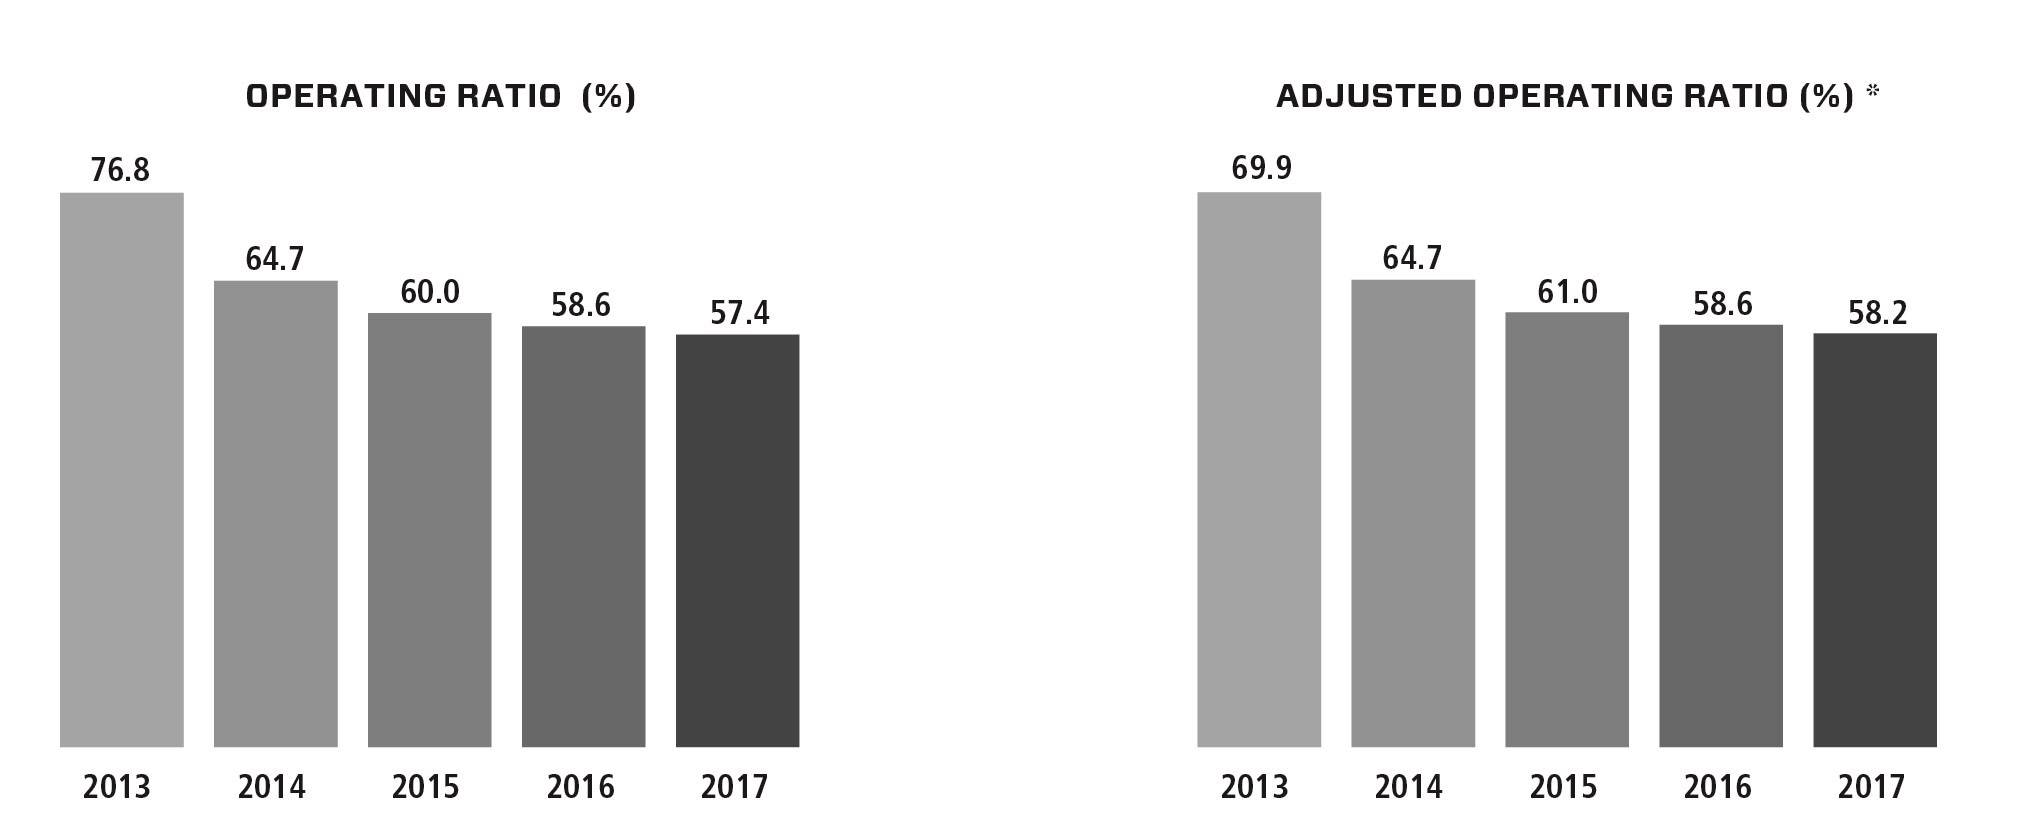
*Adjusted operating ratio is defined and reconciled in Non-GAAP Measures of this Item 7. Management’s Discussion and Analysis of Financial Condition and Results of Operations.
The Operating ratio provides the percentage of revenues used to operate the railway. A lower percentage normally indicates higher efficiency in the operation of the railway. The Company’s Operating ratio was
57.4%
in
2017
, a
120
basis point
improvement
from
58.6%
in
2016
. This
improvement
was primarily due to:
|
•
|
higher volumes;
|
|
•
|
higher defined benefit pension plan income of $101 million
;
|
|
•
|
management transition recoveries of $51 million associated with Mr. E. Hunter Harrison's retirement as CEO of CP
; and
|
|
•
|
efficiencies generated from improved operating performance and asset utilization.
|
This
improvement
was partially offset by
lower gains on land sales of $91 million, following the sales of CP's Arbutus Corridor and Obico rail yard in 2016
, and by the impact of higher fuel prices.
The Company’s Operating ratio was
58.6%
in
2016
, a
140
basis point
improvement
from
60.0%
in
2015
. This
improvement
was primarily due to:
|
•
|
efficiencies generated from improved operating performance and asset utilization;
|
|
•
|
a change of
$122 million
in defined benefit pension plan from an expense of $32 million in 2015 to $90 million in income in 2016;
|
|
•
|
higher land sales of
$32 million
; and
|
|
•
|
the favourable impact of the change in FX of $69 million.
|
This improvement was partially offset by:
|
•
|
lower traffic volumes;
|
|
•
|
a $68 million gain on the disposition of D&H South in 2015;
|
|
•
|
higher depreciation and amortization; and
|
|
•
|
higher wage and benefit inflation.
|
35
Adjusted operating ratio, defined and reconciled in Non-GAAP Measures of this Item 7. Management’s Discussion and Analysis of Financial Condition and Results of Operations, was
58.2%
in
2017
, a
40
basis point
improvement
from
58.6%
in
2016
. This
improvement
in Adjusted operating ratio reflects the same factors discussed above for the improvement in Operating ratio except that Adjusted operating ratio excludes the $51 million management transition recovery in 2017.
Adjusted operating ratio was
58.6%
in
2016
, a
240
basis point
improvement
from
61.0%
in
2015
. This
improvement
in Adjusted operating ratio reflects the same factors discussed above for the improvement in Operating ratio except that Adjusted operating ratio excludes the $68 million gain on sale of D&H South in 2015.
Return on Invested Capital
Return on Invested Capital ("ROIC") is a measure of how productively the Company uses its long-term capital investments, representing critical indicators of good operating and investment decisions made by management, and is an important performance criteria in determining certain elements of the Company's long-term incentive plan. ROIC was
20.5%
in
2017
, a
610
basis point
increase
compared to
14.4%
in
2016
, primarily due to higher Operating income and lower taxes due to income tax rate changes, partially offset by the increase in total Shareholders' equity primarily due to higher Net income. ROIC was
14.4%
in
2016
, a
150
basis point
increase
compared to
12.9%
in
2015
due to higher income and the reduction in total Shareholders’ equity, primarily due to the Company's share repurchase program, partially offset by the issuance of long-term debt in 2015.
Adjusted ROIC was
14.7%
at December 31,
2017
, a
70
basis point
increase
compared to
14.0%
in
2016
due to higher Adjusted operating income, partially offset by the increase in adjusted average Shareholders' equity primarily due to higher Net income. Adjusted ROIC was
14.0%
in
2016
, a
120
basis point
decrease
compared to
15.2%
in
2015
due to lower Adjusted income and the issuance of long-term debt in 2015, partially offset by the reduction in total Shareholders’ equity as discussed above. ROIC and Adjusted ROIC are defined and reconciled in Non-GAAP Measures of this Item 7. Management’s Discussion and Analysis of Financial Condition and Results of Operations.
Impact of Foreign Exchange on Earnings
Fluctuations in FX affect the Company’s results because U.S. dollar-denominated revenues and expenses are translated into Canadian dollars. U.S. dollar-denominated revenues and expenses increase (decrease) when the Canadian dollar weakens (strengthens) in relation to the U.S. dollar. In
2017
, the impact of a weaker U.S. dollar resulted in a decrease in total revenues of
$68 million
, a decrease in total operating expenses of
$36 million
and a decrease in interest expense of $
8 million
.
|
Average exchange rates (Canadian/U.S. dollar)
|
2017
|
|
2016
|
|
2015
|
|
|||
|
For the year ended – December 31
|
$
|
1.30
|
|
$
|
1.33
|
|
$
|
1.28
|
|
|
For the three months ended – December 31
|
$
|
1.27
|
|
$
|
1.33
|
|
$
|
1.34
|
|
|
Exchange rates (Canadian/U.S. dollar)
|
2017
|
|
2016
|
|
2015
|
|
|||
|
Beginning of year – January 1
|
$
|
1.34
|
|
$
|
1.38
|
|
$
|
1.16
|
|
|
Beginning of quarter – April 1
|
$
|
1.33
|
|
$
|
1.30
|
|
$
|
1.27
|
|
|
Beginning of quarter – July 1
|
$
|
1.30
|
|
$
|
1.29
|
|
$
|
1.25
|
|
|
Beginning of quarter – October 1
|
$
|
1.25
|
|
$
|
1.31
|
|
$
|
1.33
|
|
|
End of quarter – December 31
|
$
|
1.25
|
|
$
|
1.34
|
|
$
|
1.38
|
|
In
2018
, CP expects that for every $0.01 the U.S. dollar appreciates (depreciates) relative to the Canadian dollar, it will increase (decrease) revenues by
$27 million
, operating expenses by
$14 million
and interest expense by $3 million on an annualized basis.
Impact of Fuel Price on Earnings
Fluctuations in fuel prices affect the Company’s results because fuel expense constitutes a significant portion of CP's operating costs. As fuel prices fluctuate, there will be a timing impact on earnings, as discussed further in Item 1. Business, Operations, Fuel Cost Adjustment Program and Item 1A. Risk Factors, Fuel Cost Volatility.
|
Average Fuel Price (U.S. dollars per U.S. gallon)
|
2017
|
|
2016
|
|
2015
|
|
|||
|
For the year ended – December 31
|
$
|
2.16
|
|
$
|
1.80
|
|
$
|
2.13
|
|
|
For the three months ended – December 31
|
$
|
2.43
|
|
$
|
2.01
|
|
$
|
1.91
|
|
Average fuel prices for 2017 exclude the effects of an $8 million fuel tax recovery related to prior periods. The impact of fuel price on earnings includes the impacts of B.C. and Alberta carbon taxes and levies recovered and paid, on revenues and expenses, respectively.
36
In
2017
, the impact of
higher
fuel prices resulted in an
increase
in total revenues of
$105 million
and an increase in total operating expenses of
$104 million
.
Impact of Share Price on Earnings
Fluctuations in the Common Share price affect the Company's operating expenses because share-based liabilities are measured at fair value. The following tables indicate the opening and ending CP Common Share Price on the TSX and the NYSE for each quarter and change in Common Share price for the years ended December 31,
2017
,
2016
and
2015
:
|
Toronto Stock Exchange (in Canadian dollars)
|
2017
|
|
2016
|
|
2015
|
|
|||
|
Opening Common Share price, as at January 1
|
$
|
191.56
|
|
$
|
176.73
|
|
$
|
223.75
|
|
|
Ending Common Share price, as at March 31
|
$
|
195.35
|
|
$
|
172.55
|
|
$
|
231.90
|
|
|
Ending Common Share price, as at June 30
|
$
|
208.65
|
|
$
|
166.33
|
|
$
|
200.02
|
|
|
Ending Common Share price, as at September 30
|
$
|
209.58
|
|
$
|
200.19
|
|
$
|
191.54
|
|
|
Ending Common Share price, as at December 31
|
$
|
229.66
|
|
$
|
191.56
|
|
$
|
176.73
|
|
|
Change in Common Share price for the year ended December 31
|
$
|
38.10
|
|
$
|
14.83
|
|
$
|
(47.02
|
)
|
|
New York Stock Exchange (in U.S. dollars)
|
2017
|
|
2016
|
|
2015
|
|
|||
|
Opening Common Share price, as at January 1
|
$
|
142.77
|
|
$
|
127.60
|
|
$
|
192.69
|
|
|
Ending Common Share price, as at March 31
|
$
|
146.92
|
|
$
|
132.69
|
|
$
|
182.70
|
|
|
Ending Common Share price, as at June 30
|
$
|
160.81
|
|
$
|
128.79
|
|
$
|
160.23
|
|
|
Ending Common Share price, as at September 30
|
$
|
168.03
|
|
$
|
152.70
|
|
$
|
143.57
|
|
|
Ending Common Share price, as at December 31
|
$
|
182.76
|
|
$
|
142.77
|
|
$
|
127.60
|
|
|
Change in Common Share price for the year ended December 31
|
$
|
39.99
|
|
$
|
15.17
|
|
$
|
(65.09
|
)
|
In
2017
, the impact of the change in Common Share price resulted in an increase in stock-based compensation expense of $18 million compared to an increase of $9 million in
2016
, and a decrease of $36 million in
2015
.
The impact of share price on stock-based compensation is discussed further in Item 7A. Quantitative and Qualitative Disclosures About Market Risk, Share Price Impact on Stock-Based Compensation.
Operating Revenues
|
|
|
|
|
2017 vs. 2016
|
2016 vs. 2015
|
||||||||||||||||
|
For the year ended
December 31
|
2017
|
2016
|
2015
|
Total Change
|
% Change
|
FX Adjusted % Change
(2)
|
Total Change
|
% Change
|
FX Adjusted % Change
(2)
|
||||||||||||
|
Freight revenues (in millions)
(1)
|
$
|
6,375
|
|
$
|
6,060
|
|
$
|
6,552
|
|
$
|
315
|
|
5
|
6
|
$
|
(492
|
)
|
(8
|
)
|
(10
|
)
|
|
Non-freight revenues (in millions)
|
179
|
|
172
|
|
160
|
|
7
|
|
4
|
5
|
12
|
|
8
|
|
7
|
|
|||||
|
Total revenues (in millions)
|
$
|
6,554
|
|
$
|
6,232
|
|
$
|
6,712
|
|
$
|
322
|
|
5
|
6
|
$
|
(480
|
)
|
(7
|
)
|
(9
|
)
|
|
Carloads (in thousands)
|
2,634.2
|
|
2,524.9
|
|
2,627.6
|
|
109.3
|
|
4
|
N/A
|
(102.7
|
)
|
(4
|
)
|
N/A
|
|
|||||
|
Revenue ton-miles (in millions)
|
142,540
|
|
135,952
|
|
145,257
|
|
6,588
|
|
5
|
N/A
|
(9,305
|
)
|
(6
|
)
|
N/A
|
|
|||||
|
Freight revenue per carload (in dollars)
|
$
|
2,420
|
|
$
|
2,400
|
|
$
|
2,493
|
|
$
|
20
|
|
1
|
2
|
$
|
(93
|
)
|
(4
|
)
|
(6
|
)
|
|
Freight revenue per revenue ton-miles (in cents)
|
4.47
|
|
4.46
|
|
4.51
|
|
0.01
|
|
—
|
1
|
(0.05
|
)
|
(1
|
)
|
(3
|
)
|
|||||
(1)
Freight revenues include fuel surcharge revenues of
$242 million
in
2017
,
$133 million
in
2016
and
$308 million
in
2015
. 2017 and 2016 fuel surcharge revenue include B.C. and Alberta Carbon taxes and levies recovered.
(2)
FX Adjusted % Change does not have any standardized meaning prescribed by GAAP and, therefore, is unlikely to be comparable to similar measures presented by other companies. FX adjusted variance is defined and reconciled in Non-GAAP Measures of this Item 7. Management's Discussion and Analysis of Financial Condition and Results of Operations.
The Company’s revenues are primarily derived from transporting freight. Changes in freight volumes generally contribute to corresponding changes in freight revenues and certain variable expenses, such as fuel, equipment rents and crew costs. Non-freight revenue is generated from leasing of certain assets, switching fees, contracts with passenger service operators, and logistical management services.
37
Freight Revenues
Freight revenues were
$6,375 million
in
2017
,
an increase
of
$315 million
, or
5%
, from
$6,060 million
in
2016
. This
increase
was primarily due to higher volumes, as measured by RTMs, of frac sand, Energy, chemicals and plastics, domestic intermodal, Potash and Canadian grain, and the favourable impact of higher fuel surcharge revenue of
$242 million
. This increase was partially offset by lower volumes of Automotive, international intermodal, fertilizer and U.S. grain, and the unfavourable impact of the change in FX of
$67 million
.
Freight revenues were
$6,060 million
in
2016
,
a decrease
of
$492 million
, or
8%
, from
$6,552 million
in
2015
. This
decrease
was primarily due to lower volumes, as measured by RTMs, in crude, Canadian grain, Potash, and Metals, minerals, and consumer products and the impact of lower fuel prices on fuel surcharge revenue. This
decrease
was partially offset by higher volumes in international intermodal, chemicals and plastics, and Forest products and the favourable impact of the change in FX of $146 million.
RTMs
RTMs are defined as the movement of one revenue-producing ton of freight over a distance of one mile. RTMs measure the relative weight and distance of rail freight moved by the Company. RTMs for
2017
were
142,540 million
,
an increase
of
6,588 million
, or
5%
, compared with
135,952 million
in
2016
. This
increase
was mainly attributable to increased shipments of frac sand, Energy, chemicals and plastics, Potash, domestic intermodal and Canadian grain. This
increase
was partially offset by decreased shipments of international intermodal, U.S. grain, fertilizer and Automotive.
RTMs for
2016
were
135,952 million
,
a decrease
of
6%
compared with
145,257 million
in
2015
. This
decrease
was mainly attributable to decreased shipments of crude, Canadian grain, Potash, and Metals, minerals and consumer products. This
decrease
was partially offset by increased shipments of international intermodal, chemicals and plastics, Forest products and U.S. grain.
Non-freight Revenues
Non-freight revenues were
$179 million
in
2017
,
an increase
of
$7 million
, or
4%
, from
$172 million
in
2016
. This
increase
was primarily due to the recovery of prior costs following the expiration of a passenger service contract in 2017, partially offset by lower passenger revenues.
Non-freight revenues were
$172 million
in
2016
,
an increase
of
$12 million
, or
8%
, from
$160 million
in
2015
. This
increase
was primarily due to higher transload, leasing, and logistics services revenues.
Lines of Business
In the first quarter of 2017, CP revised the grouping of revenues and aggregated certain lines of business such that:
|
•
|
“Canadian Grain” and “U.S. Grain” were aggregated into the line of business "Grain";
|
|
•
|
“Chemicals and Plastics” and “Crude” were aggregated into the line of business "Energy, Chemicals and Plastics"; and
|
|
•
|
“Domestic Intermodal" and “International Intermodal” were aggregated into the line of business "Intermodal".
|
Prior period figures have been aggregated accordingly.
Grain
|
2017 vs. 2016
|
2016 vs. 2015
|
||||||||||||||||||||
|
For the year ended December 31
|
2017
|
2016
|
2015
|
Total Change
|
% Change
|
FX Adjusted % Change
|
Total Change
|
% Change
|
FX Adjusted
% Change |
||||||||||||
|
Freight revenues (in millions)
|
$
|
1,532
|
|
$
|
1,480
|
|
$
|
1,589
|
|
$
|
52
|
|
4
|
5
|
$
|
(109
|
)
|
(7
|
)
|
(9
|
)
|
|
Carloads (in thousands)
|
440.7
|
|
431.9
|
|
441.4
|
|
8.8
|
|
2
|
N/A
|
(9.5
|
)
|
(2
|
)
|
N/A
|
|
|||||
|
Revenue ton-miles (in millions)
|
37,377
|
|
36,892
|
|
38,067
|
|
485
|
|
1
|
N/A
|
(1,175
|
)
|
(3
|
)
|
N/A
|
|
|||||
|
Freight revenue per carload (in dollars)
|
$
|
3,477
|
|
$
|
3,426
|
|
$
|
3,600
|
|
$
|
51
|
|
1
|
3
|
$
|
(174
|
)
|
(5
|
)
|
(7
|
)
|
|
Freight revenue per revenue ton-mile (in cents)
|
4.10
|
|
4.01
|
|
4.17
|
|
0.09
|
|
2
|
4
|
(0.16
|
)
|
(4
|
)
|
(6
|
)
|
|||||
Grain revenue was
$1,532 million
in
2017
,
an increase
of
$52 million
, or
4%
, from
$1,480 million
in
2016
. This
increase
was primarily due to increased Canadian grain volumes and higher fuel surcharge revenue, partially offset by the unfavourable impact of the change in FX. Carloads increased more than RTMs due to the decreased proportion of U.S. grain to the Pacific North West, which has a longer length of haul. The
increase
in freight revenue per revenue ton-mile is primarily due to increased regulated Canadian grain rates.
38
Grain revenue was
$1,480 million
in
2016
,
a decrease
of
$109 million
, or
7%
, from
$1,589 million
in
2015
. This
decrease
was primarily due to a decline in volumes due to lower carryover from prior year and a weather delayed fall harvest, lower freight rates that reflect the change in the MRE for Canadian regulated grain in the crop year 2015/2016, and lower fuel surcharge revenue as a result of lower fuel prices. The
decrease
was partially offset by the favourable impact of the change in FX and increased volumes due to a larger 2016/2017 crop. The
decrease
in average freight revenue per revenue ton-mile was primarily due to a change in the mix of commodities being shipped.
39
Coal
|
|
2017 vs. 2016
|
2016 vs. 2015
|
|||||||||||||||||||
|
For the year ended December 31
|
2017
|
2016
|
2015
|
Total Change
|
% Change
|
FX Adjusted % Change
|
Total Change
|
% Change
|
FX Adjusted % Change
|
||||||||||||
|
Freight revenues (in millions)
|
$
|
631
|
|
$
|
606
|
|
$
|
639
|
|
$
|
25
|
|
4
|
4
|
$
|
(33
|
)
|
(5
|
)
|
(6
|
)
|
|
Carloads (in thousands)
|
306.0
|
|
305.3
|
|
323.2
|
|
0.7
|
|
—
|
N/A
|
(17.9
|
)
|
(6
|
)
|
N/A
|
|
|||||
|
Revenue ton-miles (in millions)
|
22,660
|
|
22,171
|
|
22,164
|
|
489
|
|
2
|
N/A
|
7
|
|
—
|
|
N/A
|
|
|||||
|
Freight revenue per carload (in dollars)
|
$
|
2,061
|
|
$
|
1,984
|
|
$
|
1,978
|
|
$
|
77
|
|
4
|
4
|
$
|
6
|
|
—
|
|
—
|
|
|
Freight revenue per revenue ton-mile (in cents)
|
2.78
|
|
2.73
|
|
2.88
|
|
0.05
|
|
2
|
2
|
(0.15
|
)
|
(5
|
)
|
(6
|
)
|
|||||
Coal revenue was
$631 million
in
2017
,
an increase
of
$25 million
, or
4%
, from
$606 million
in
2016
. This
increase
was primarily due to an increase in Canadian export volumes and higher fuel surcharge revenue, partially offset by the unfavourable impact of the change in FX. The
increase
in freight revenue per revenue ton-mile was primarily due to a freight rate increase. RTMs increased more than carloads due to proportionately more export Canadian coal moved.
Coal revenue was
$606 million
in
2016
,
a decrease
of
$33 million
, or
5%
, from
$639 million
in
2015
. This
decrease
was primarily due to the decline in U.S. thermal coal shipments, and lower fuel surcharge revenue as a result of lower fuel prices, partially offset by increased shipments of Canadian coal, and the favourable impact of the change in FX. The
decrease
in freight revenue per revenue ton-mile is primarily due to the decrease in U.S. thermal coal, which has a shorter length of haul versus export Canadian coal.
Potash
|
2017 vs. 2016
|
2016 vs. 2015
|
||||||||||||||||||||
|
For the year ended December 31
|
2017
|
2016
|
2015
|
Total Change
|
% Change
|
FX Adjusted % Change
|
Total Change
|
% Change
|
FX Adjusted % Change
|
||||||||||||
|
Freight revenues (in millions)
|
$
|
411
|
|
$
|
338
|
|
$
|
359
|
|
$
|
73
|
|
22
|
23
|
$
|
(21
|
)
|
(6
|
)
|
(8
|
)
|
|
Carloads (in thousands)
|
137.4
|
|
116.4
|
|
124.3
|
|
21.0
|
|
18
|
N/A
|
(7.9
|
)
|
(6
|
)
|
N/A
|
|
|||||
|
Revenue ton-miles (in millions)
|
15,751
|
|
14,175
|
|
15,117
|
|
1,576
|
|
11
|
N/A
|
(942
|
)
|
(6
|
)
|
N/A
|
|
|||||
|
Freight revenue per carload (in dollars)
|
$
|
2,988
|
|
$
|
2,904
|
|
$
|
2,887
|
|
$
|
84
|
|
3
|
4
|
$
|
17
|
|
1
|
|
(2
|
)
|
|
Freight revenue per revenue ton-mile (in cents)
|
2.61
|
|
2.38
|
|
2.37
|
|
0.23
|
|
10
|
11
|
0.01
|
|
—
|
|
(2
|
)
|
|||||
Potash revenue was
$411 million
in
2017
,
an increase
of
$73 million
, or
22%
, from
$338 million
in
2016
. This
increase
was primarily due to higher export and domestic potash volumes, as well as higher fuel surcharge revenue, partially offset by the unfavourable impact of the change in FX. The
increase
in freight revenue per revenue ton-mile was due to the increased proportion of export traffic to the U.S. Pacific Northwest, which has a shorter length of haul.
Potash revenue was
$338 million
in
2016
,
a decrease
of
$21 million
, or
6%
, from
$359 million
in
2015
. This
decrease
was primarily due to a decline in export potash volumes, and lower fuel surcharge revenue as a result of lower fuel prices. The favourable impact of the change in FX and an adjustment to freight rates for one customer for prior periods partially offset this decrease. The freight revenue per revenue ton-mile is essentially flat due to the adjustment to freight rates for one customer for prior periods, offset by decreases in export traffic RTMs.
40
Fertilizers and Sulphur
|
2017 vs. 2016
|
2016 vs. 2015
|
||||||||||||||||||||||
|
For the year ended December 31
|
2017
|
2016
|
2015
|
Total Change
|
% Change
|
FX Adjusted % Change
|
Total Change
|
% Change
|
FX Adjusted % Change
|
||||||||||||||
|
Freight revenues (in millions)
|
$
|
241
|
|
$
|
284
|
|
$
|
272
|
|
$
|
(43
|
)
|
(15
|
)
|
(14
|
)
|
$
|
12
|
|
4
|
|
2
|
|
|
Carloads (in thousands)
|
57.7
|
|
59.6
|
|
61.6
|
|
(1.9
|
)
|
(3
|
)
|
N/A
|
|
(2.0
|
)
|
(3
|
)
|
N/A
|
|
|||||
|
Revenue ton-miles (in millions)
|
3,849
|
|
4,140
|
|
4,044
|
|
(291
|
)
|
(7
|
)
|
N/A
|
|
96
|
|
2
|
|
N/A
|
|
|||||
|
Freight revenue per carload (in dollars)
|
$
|
4,178
|
|
$
|
4,769
|
|
$
|
4,410
|
|
$
|
(591
|
)
|
(12
|
)
|
(11
|
)
|
$
|
359
|
|
8
|
|
5
|
|
|
Freight revenue per revenue ton-mile (in cents)
|
6.27
|
|
6.87
|
|
6.71
|
|
(0.60
|
)
|
(9
|
)
|
(8
|
)
|
0.16
|
|
2
|
|
—
|
|
|||||
Fertilizers and sulphur revenue was
$241 million
in
2017
,
a decrease
of
$43 million
, or
15%
, from
$284 million
in
2016
. This
decrease
was primarily due to lower fertilizer volumes, which have a higher freight revenue per revenue ton-mile, and the unfavourable impact of the change in FX. This
decrease
was partially offset by higher fuel surcharge revenue. RTMs decreased more than carloads due to decreased traffic to the U.S. and increased shorter length of haul traffic.
Fertilizers and sulphur revenue was
$284 million
in
2016
,
an increase
of
$12 million
, or
4%
, from
$272 million
in
2015
. This
increase
was primarily due to increased freight revenue per carload and the favourable impact of the change in FX, partially offset by lower fuel surcharge revenue as a result of lower fuel prices, and lower carloads. The
increase
in freight revenue per carload is primarily due to the increase in average length of haul for fertilizers.
Forest Products
|
2017 vs. 2016
|
2016 vs. 2015
|
||||||||||||||||||||||
|
For the year ended December 31
|
2017
|
2016
|
2015
|
Total Change
|
% Change
|
FX Adjusted % Change
|
Total Change
|
% Change
|
FX Adjusted % Change
|
||||||||||||||
|
Freight revenues (in millions)
|
$
|
265
|
|
$
|
275
|
|
$
|
249
|
|
$
|
(10
|
)
|
(4
|
)
|
(2
|
)
|
$
|
26
|
|
10
|
|
7
|
|
|
Carloads (in thousands)
|
65.8
|
|
66.1
|
|
62.0
|
|
(0.3
|
)
|
—
|
|
N/A
|
|
4.1
|
|
7
|
|
N/A
|
|
|||||
|
Revenue ton-miles (in millions)
|
4,484
|
|
4,691
|
|
4,201
|
|
(207
|
)
|
(4
|
)
|
N/A
|
|
490
|
|
12
|
|
N/A
|
|
|||||
|
Freight revenue per carload (in dollars)
|
$
|
4,036
|
|
$
|
4,157
|
|
$
|
4,026
|
|
$
|
(121
|
)
|
(3
|
)
|
(1
|
)
|
$
|
131
|
|
3
|
|
—
|
|
|
Freight revenue per revenue ton-mile (in cents)
|
5.92
|
|
5.86
|
|
5.92
|
|
0.06
|
|
1
|
|
3
|
|
(0.06
|
)
|
(1
|
)
|
(4
|
)
|
|||||
Forest products revenue was
$265 million
in
2017
,
a decrease
of
$10 million
, or
4%
, from
$275 million
in
2016
. This
decrease
was primarily due to lower volumes of lumber and panel products, due to U.S. tariffs on Canadian softwood lumber in 2017, and the unfavourable impact of the change in FX, partially offset by higher fuel surcharge revenue. Carloads decreased less than RTMs due to a decrease in lumber and panel traffic with a longer length of haul.
Forest products revenue was
$275 million
in
2016
,
an increase
of
$26 million
, or
10%
, from
$249 million
in
2015
. This
increase
was primarily due to higher volumes, particularly of lumber and panel products, which have a longer length of haul than other forest products, and the favourable impact of the change in FX. Lower fuel surcharge revenue as a result of lower fuel prices partially offset this increase.
41
Energy, Chemicals and Plastics
|
2017 vs. 2016
|
2016 vs. 2015
|
||||||||||||||||||||||
|
For the year ended December 31
|
2017
|
2016
|
2015
|
Total Change
|
% Change
|
FX Adjusted % Change
|
Total Change
|
% Change
|
FX Adjusted % Change
|
||||||||||||||
|
Freight revenues (in millions)
|
$
|
898
|
|
$
|
852
|
|
$
|
1,102
|
|
$
|
46
|
|
5
|
|
7
|
|
$
|
(250
|
)
|
(23
|
)
|
(25
|
)
|
|
Carloads (in thousands)
|
269.5
|
|
250.0
|
|
294.3
|
|
19.5
|
|
8
|
|
N/A
|
|
(44.3
|
)
|
(15
|
)
|
N/A
|
|
|||||
|
Revenue ton-miles (in millions)
|
21,327
|
|
19,021
|
|
26,891
|
|
2,306
|
|
12
|
|
N/A
|
|
(7,870
|
)
|
(29
|
)
|
N/A
|
|
|||||
|
Freight revenue per carload (in dollars)
|
$
|
3,333
|
|
$
|
3,410
|
|
$
|
3,739
|
|
$
|
(77
|
)
|
(2
|
)
|
—
|
|
$
|
(329
|
)
|
(9
|
)
|
(12
|
)
|
|
Freight revenue per revenue ton-mile (in cents)
|
4.21
|
|
4.48
|
|
4.10
|
|
(0.27
|
)
|
(6
|
)
|
(4
|
)
|
0.38
|
|
9
|
|
6
|
|
|||||
Energy, chemicals and plastics revenue was
$898 million
in
2017
,
an increase
of
$46 million
, or
5%
, from
$852 million
in
2016
. This
increase
was primarily due to higher volumes of crude, plastics, fuel oil and liquefied petroleum gas ("LPG"), and higher fuel surcharge revenue, partially offset by the unfavourable impact of the change in FX. The
decrease
in freight revenue per revenue ton-mile is primarily due to volume gains in longer length of haul lanes for crude and LPG and higher plastics and fuel oil volumes, which have a lower freight revenue per revenue ton-mile.
Energy, chemicals and plastics revenue was
$852 million
in
2016
,
a decrease
of
$250 million
, or
23%
, from
$1,102 million
in
2015
. This
decrease
was primarily due to a decline in crude volumes as a result of the fall in crude oil prices and an increase in available pipeline capacity, lower fuel surcharge revenue as a result of lower fuel prices and lower average freight revenue per revenue ton-mile due to fewer LPG product shipments. This
decrease
was partially offset by higher chemical and plastic volumes and the favourable impact of the change in FX.
Metals, Minerals and Consumer Products
|
2017 vs. 2016
|
2016 vs. 2015
|
||||||||||||||||||||||
|
For the year ended December 31
|
2017
|
2016
|
2015
|
Total Change
|
% Change
|
FX Adjusted % Change
|
Total Change
|
% Change
|
FX Adjusted % Change
|
||||||||||||||
|
Freight revenues (in millions)
|
$
|
739
|
|
$
|
564
|
|
$
|
643
|
|
$
|
175
|
|
31
|
|
33
|
|
$
|
(79
|
)
|
(12
|
)
|
(15
|
)
|
|
Carloads (in thousands)
|
255.3
|
|
195.3
|
|
217.1
|
|
60.0
|
|
31
|
|
N/A
|
|
(21.8
|
)
|
(10
|
)
|
N/A
|
|
|||||
|
Revenue ton-miles (in millions)
|
11,468
|
|
8,338
|
|
9,020
|
|
3,130
|
|
38
|
|
N/A
|
|
(682
|
)
|
(8
|
)
|
N/A
|
|
|||||
|
Freight revenue per carload (in dollars)
|
$
|
2,894
|
|
$
|
2,888
|
|
$
|
2,963
|
|
$
|
6
|
|
—
|
|
2
|
|
$
|
(75
|
)
|
(3
|
)
|
(6
|
)
|
|
Freight revenue per revenue ton-mile (in cents)
|
6.44
|
|
6.77
|
|
7.13
|
|
(0.33
|
)
|
(5
|
)
|
(3
|
)
|
(0.36
|
)
|
(5
|
)
|
(8
|
)
|
|||||
Metals, minerals and consumer products revenue was
$739 million
in
2017
,
an increase
of
$175 million
, or
31%
, from
$564 million
in
2016
. This
increase
was primarily due to frac sand, aggregates and steel volumes, and higher fuel surcharge revenue, partially offset by the unfavourable impact of the change in FX. The
decrease
in freight revenue per revenue ton-mile is primarily due to the higher volumes of frac sand, which have a lower freight revenue per revenue ton-mile, and longer length of haul for cement and bentonite clay traffic.
Metals, minerals and consumer products revenue was
$564 million
in
2016
,
a decrease
of
$79 million
, or
12%
, from
$643 million
in
2015
. This
decrease
was primarily due to declines in the volume of aggregates, steel, and waste products, and lower fuel surcharge revenue as a result of lower fuel prices, partially offset by the favourable impact of the change in FX. The
decrease
in average freight revenue per revenue ton-mile is primarily due to a change in mix of commodities.
42
Automotive
|
2017 vs. 2016
|
2016 vs. 2015
|
||||||||||||||||||||||
|
For the year ended December 31
|
2017
|
2016
|
2015
|
Total Change
|
% Change
|
FX Adjusted % Change
|
Total Change
|
% Change
|
FX Adjusted % Change
|
||||||||||||||
|
Freight revenues (in millions)
|
$
|
293
|
|
$
|
350
|
|
$
|
349
|
|
$
|
(57
|
)
|
(16
|
)
|
(15
|
)
|
$
|
1
|
|
—
|
|
(3
|
)
|
|
Carloads (in thousands)
|
105.1
|
|
124.1
|
|
131.4
|
|
(19.0
|
)
|
(15
|
)
|
N/A
|
|
(7.3
|
)
|
(6
|
)
|
N/A
|
|
|||||
|
Revenue ton-miles (in millions)
|
1,321
|
|
1,667
|
|
1,750
|
|
(346
|
)
|
(21
|
)
|
N/A
|
|
(83
|
)
|
(5
|
)
|
N/A
|
|
|||||
|
Freight revenue per carload (in dollars)
|
$
|
2,785
|
|
$
|
2,825
|
|
$
|
2,659
|
|
$
|
(40
|
)
|
(1
|
)
|
—
|
|
$
|
166
|
|
6
|
|
3
|
|
|
Freight revenue per revenue ton-mile (in cents)
|
22.15
|
|
21.02
|
|
19.97
|
|
1.13
|
|
5
|
|
7
|
|
1.05
|
|
5
|
|
2
|
|
|||||
Automotive revenue was
$293 million
in
2017
,
a decrease
of
$57 million
, or
16%
, from
$350 million
in
2016
. This
decrease
was primarily due to a decline in volume and the unfavourable impact of the change in FX, partially offset by higher fuel surcharge revenue. The increase in freight revenue per revenue ton-mile was primarily due to a higher proportion of traffic with higher freight rates.
Automotive revenue was
$350 million
in
2016
, a slight
increase
of
$1 million
from
$349 million
in
2015
. This
increase
in average freight rates and the favourable impact of the change in FX were offset by declines in volume, and lower fuel surcharge revenue as a result of lower fuel prices.
Intermodal
|
2017 vs. 2016
|
2016 vs. 2015
|
|||||||||||||||||||||
|
For the year ended December 31
|
2017
|
2016
|
2015
|
Total Change
|
% Change
|
FX Adjusted % Change
|
Total Change
|
% Change
|
FX Adjusted % Change
|
|||||||||||||
|
Freight revenues (in millions)
|
$
|
1,365
|
|
$
|
1,311
|
|
$
|
1,350
|
|
$
|
54
|
|
4
|
|
5
|
$
|
(39
|
)
|
(3
|
)
|
(4
|
)
|
|
Carloads (in thousands)
|
996.7
|
|
976.2
|
|
972.3
|
|
20.5
|
|
2
|
|
N/A
|
3.9
|
|
—
|
|
N/A
|
|
|||||
|
Revenue ton-miles (in millions)
|
24,303
|
|
24,857
|
|
24,003
|
|
(554
|
)
|
(2
|
)
|
N/A
|
854
|
|
4
|
|
N/A
|
|
|||||
|
Freight revenue per carload (in dollars)
|
$
|
1,370
|
|
$
|
1,342
|
|
$
|
1,388
|
|
$
|
28
|
|
2
|
|
3
|
$
|
(46
|
)
|
(3
|
)
|
(4
|
)
|
|
Freight revenue per revenue ton-mile (in cents)
|
5.62
|
|
5.27
|
|
5.62
|
|
0.35
|
|
7
|
|
7
|
(0.35
|
)
|
(6
|
)
|
(7
|
)
|
|||||
Intermodal revenue was
$1,365 million
in
2017
,
an increase
of
$54 million
, or
4%
, from
$1,311 million
in
2016
. This
increase
was primarily due to higher domestic volumes and higher fuel surcharge revenue, partially offset by a decline in international volumes associated with the loss of a contract and the unfavourable impact of the change in FX. Freight revenue per revenue ton-mile increased due to more revenue-generating moves of empty customer containers.
Intermodal revenue was
$1,311 million
in
2016
,
a decrease
of
$39 million
, or
3%
, from
$1,350 million
in
2015
. This
decrease
was primarily due to lower fuel surcharge revenue as a result of lower fuel prices, lower average freight revenue per revenue ton-mile as a result of fewer shipments using temperature controlled equipment, and lower revenue-generating moves of empty customer containers. This
decrease
was partially offset by an increase in RTMs, as a result of longer haul shipments through the Port of Vancouver, and the favourable impact of the change in FX.
43
Operating Expenses
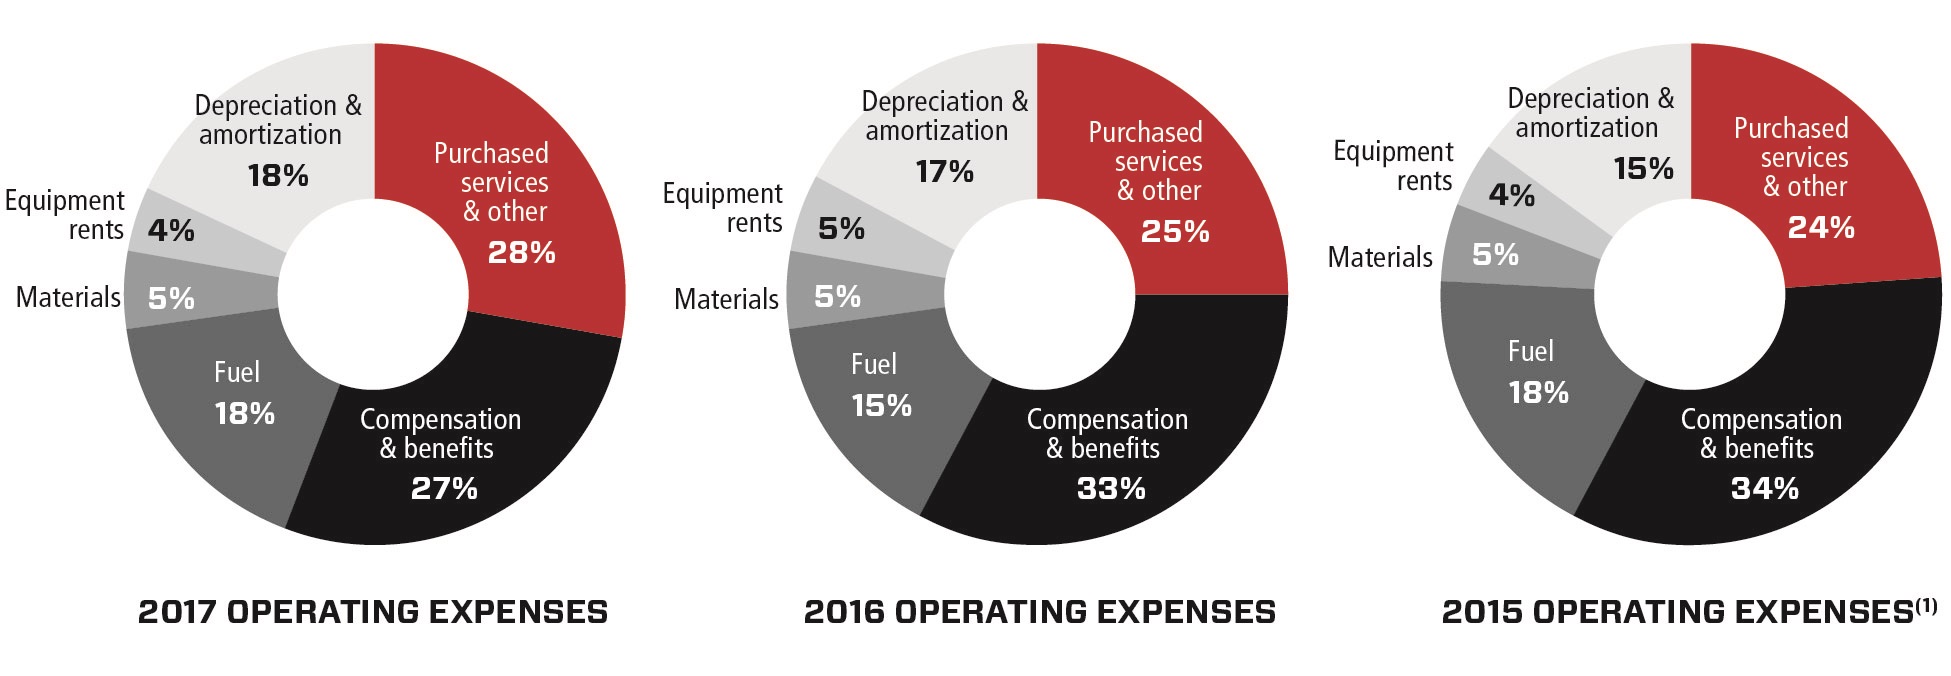
(1)
Purchased services and other includes a $68 million gain on sale of D&H South in 2015.
|
|
|
|
|
2017 vs. 2016
|
2016 vs. 2015
|
||||||||||||||||||
|
For the year ended December 31 (in millions)
|
2017
|
|
2016
|
|
2015
|
|
Total Change
|
% Change
|
FX Adjusted % Change
(1)
|
Total Change
|
% Change
|
FX Adjusted % Change
(1)
|
|||||||||||
|
Compensation and benefits
|
$
|
1,035
|
|
$
|
1,189
|
|
$
|
1,371
|
|
$
|
(154
|
)
|
(13
|
)
|
(12
|
)
|
$
|
(182
|
)
|
(13
|
)
|
(14
|
)
|
|
Fuel
|
677
|
|
567
|
|
708
|
|
110
|
|
19
|
|
22
|
|
(141
|
)
|
(20
|
)
|
(23
|
)
|
|||||
|
Materials
|
190
|
|
180
|
|
184
|
|
10
|
|
6
|
|
7
|
|
(4
|
)
|
(2
|
)
|
(3
|
)
|
|||||
|
Equipment rents
|
142
|
|
173
|
|
174
|
|
(31
|
)
|
(18
|
)
|
(17
|
)
|
(1
|
)
|
(1
|
)
|
(3
|
)
|
|||||
|
Depreciation and amortization
|
661
|
|
640
|
|
595
|
|
21
|
|
3
|
|
4
|
|
45
|
|
8
|
|
7
|
|
|||||
|
Purchased services and other
|
1,056
|
|
905
|
|
1,060
|
|
151
|
|
17
|
|
18
|
|
(155
|
)
|
(15
|
)
|
(16
|
)
|
|||||
|
Gain on sale of Delaware & Hudson South
|
—
|
|
—
|
|
(68
|
)
|
—
|
|
—
|
|
—
|
|
68
|
|
(100
|
)
|
(100
|
)
|
|||||
|
Total operating expenses
|
$
|
3,761
|
|
$
|
3,654
|
|
$
|
4,024
|
|
$
|
107
|
|
3
|
|
4
|
|
$
|
(370
|
)
|
(9
|
)
|
(11
|
)
|
(1)
FX Adjusted % Change does not have any standardized meaning prescribed by GAAP and, therefore, is unlikely to be comparable to similar measures presented by other companies. FX adjusted variance is defined and reconciled in Non-GAAP Measures of this Item 7. Management's Discussion and Analysis of Financial Condition and Results of Operations.
Operating expenses were
$3,761 million
in
2017
, an
increase
of
$107 million
, or
3%
, from
$3,654 million
in
2016
. This
increase
was primarily due to:
|
•
|
the unfavourable impact of $104 million from higher fuel prices;
|
|
•
|
lower gains on land sales of $91 million, following the sales of CP's Arbutus Corridor and Obico rail yard in 2016
;
|
|
•
|
higher volume variable expenses;
|
|
•
|
the impact of wage and benefit inflation of approximately 3%;
and
|
|
•
|
higher depreciation and amortization due to a higher asset base.
|
This
increase
was partially offset by:
|
•
|
higher defined benefit pension plan income of $101 million
;
|
|
•
|
management transition recoveries of $51 million associated with Mr. E. Hunter Harrison's retirement as CEO of CP
;
|
|
•
|
efficiencies generated from improved operating performance and asset utilization; and
|
|
•
|
the favourable impact of the change in FX of $
36 million
.
|
Operating expenses were
$3,654 million
in
2016
, a decrease of
$370 million
, or
9%
, from
$4,024 million
in
2015
. This decrease was primarily due to:
|
•
|
efficiencies generated from improved operating performance and asset utilization;
|
|
•
|
lower volume variable expenses;
|
|
•
|
a change of $122 million in defined benefit pension plan from an expense of $32 million in 2015 to $90 million in income in 2016;
|
|
•
|
the favourable impact of $100 million from lower fuel prices; and
|
|
•
|
a $32 million increase in land sales.
|
44
This decrease was partially offset by:
|
•
|
the unfavourable impact of the change in FX of $77 million;
|
|
•
|
the gain on sale of D&H South of $68 million in 2015;
|
|
•
|
higher depreciation and amortization due to a higher asset base; and
|
|
•
|
the impact of wage and benefit inflation of approximately 3%.
|
Compensation and Benefits
Compensation and benefits expense includes employee wages, salaries, fringe benefits and stock-based compensation. Compensation and benefits expense was
$1,035 million
in
2017
, a
decrease
of
$154 million
, or
13%
, from
$1,189 million
in
2016
. This
decrease
was primarily due to:
|
•
|
higher defined benefit pension plan income of $101 million
;
|
|
•
|
management transition recoveries of $51 million associated with Mr. E. Hunter Harrison's retirement as CEO of CP
;
|
|
•
|
lower labour expenses due to operational efficiencies; and
|
|
•
|
the favourable impact of the change in FX of $
9 million
.
|
This
decrease
was partially offset by:
|
•
|
the impact of wage and benefit inflation of approximately 3%;
|
|
•
|
higher volume variable expenses as a result of an increase in workload as measured by GTMs;
|
|
•
|
the unfavourable impact of stock-based compensation driven primarily by the change in stock price; and
|
|
•
|
higher incentive compensation.
|
Compensation and benefits expense was $1,189 million in 2016, a decrease of $182 million, or 13%, from $1,371 million in 2015. This decrease was primarily due to:
|
•
|
a change of $122 million in defined benefit pension plan from an expense of $32 million in 2015 to $90 million in income in 2016;
|
|
•
|
lower costs achieved through job reductions;
|
|
•
|
lower volume variable expenses as a result of a decrease in workload as measured by GTMs;
|
|
•
|
road and yard efficiencies as a result of continuing strong operational performance; and
|
|
•
|
the favourable impact of $20 million from lower stock-based compensation and incentive-based compensation.
|
This decrease was partially offset by the impact of wage and benefit inflation of approximately 3% and the unfavourable impact of the change in FX of $18 million.
Fuel
Fuel expense consists mainly of fuel used by locomotives and includes provincial, state and federal fuel taxes. Fuel expense was
$677 million
in
2017
, an
increase
of
$110 million
, or
19%
, from
$567 million
in
2016
. This
increase
was primarily due to the unfavourable impact of
$104 million
from higher fuel prices and an increase in workload, as measured by GTMs. This
increase
was partially offset by the favourable impact of the change in FX of $
10 million
and by an $8 million fuel tax recovery related to prior periods.
Fuel expense was $567 million in 2016, a decrease of $141 million, or 20%, from $708 million in 2015. This decrease was primarily due to:
|
•
|
lower fuel prices with a favourable impact of $100 million;
|
|
•
|
a reduction in workload, as measured by GTMs; and
|
|
•
|
improvements in fuel efficiency of approximately 2% as a result of increased locomotive productivity, operational fluidity and the advancement of the Company’s fuel conservation strategies.
|
This decrease was partially offset by the unfavourable impact of the change in FX of $25 million.
Materials
Materials expense includes the cost of material used for maintenance of track, locomotives, freight cars, and buildings as well as software sustainment. Materials expense was
$190 million
in
2017
, an
increase
of
$10 million
, or
6%
, from
$180 million
in
2016
. This increase was primarily due to higher locomotive maintenance and overhaul costs and higher right-of-way maintenance.
Materials expense was $180 million in 2016, a decrease of $4 million, or 2%, from $184 million in 2015. This decrease was primarily due to lower car repair and locomotive maintenance costs.
45
Equipment Rents
Equipment rents expense includes the cost associated with using other companies’ freight cars, intermodal equipment, and locomotives, net of rental income received from other railways for the use of CP’s equipment. Equipment rents expense was
$142 million
in
2017
, a
decrease
of
$31 million
, or
18%
, from
$173 million
in
2016
. This
decrease
was primarily due to the purchase or return of leased freight cars, locomotives and intermodal containers reducing rental expenses by $19 million, and a $12 million increase in receipts from other railroads' use of CP equipment.
Equipment rents expense was $173 million in 2016, a decrease of $1 million, or 1%, from $174 million in 2015. This decrease was primarily due to the purchase or return of leased freight cars reducing rental expenses by $12 million. This decrease was partially offset by the return of subleased locomotives and freight cars reducing rental income by $6 million and by the unfavourable impact of the change in FX of $5 million.
Depreciation and Amortization
Depreciation and amortization expense represents the charge associated with the use of track and roadway, buildings, rolling stock, information systems and other depreciable assets. Depreciation and amortization expense was
$661 million
for
2017
, an
increase
of
$21 million
, or
3%
, from
$640 million
in
2016
. This
increase
was primarily due to a higher depreciable asset base partially offset by the favourable impact of the change in FX of
$3 million
.
Depreciation and amortization expense was
$640 million
for
2016
, an
increase
of
$45 million
, or
8%
, from
$595 million
in
2015
. This increase was primarily due to a higher depreciable asset base and the unfavourable impact of the change in FX of
$5 million
.
Purchased Services and Other
|
2017 vs. 2016
|
2016 vs. 2015
|
||||||||||||||||||
|
For the year ended December 31 (in millions)
|
2017
|
2016
|
2015
|
Total Change
|
% Change
|
Total Change
|
% Change
|
||||||||||||
|
Support and facilities
|
$
|
266
|
|
$
|
271
|
|
$
|
298
|
|
$
|
(5
|
)
|
(2
|
)
|
$
|
(27
|
)
|
(9
|
)
|
|
Track and operations
|
251
|
|
238
|
|
266
|
|
13
|
|
5
|
|
(28
|
)
|
(11
|
)
|
|||||
|
Intermodal
|
197
|
|
180
|
|
184
|
|
17
|
|
9
|
|
(4
|
)
|
(2
|
)
|
|||||
|
Equipment
|
157
|
|
165
|
|
196
|
|
(8
|
)
|
(5
|
)
|
(31
|
)
|
(16
|
)
|
|||||
|
Casualty
|
72
|
|
68
|
|
74
|
|
4
|
|
6
|
|
(6
|
)
|
(8
|
)
|
|||||
|
Property taxes
|
121
|
|
116
|
|
103
|
|
5
|
|
4
|
|
13
|
|
13
|
|
|||||
|
Other
|
7
|
|
(27
|
)
|
13
|
|
34
|
|
(126
|
)
|
(40
|
)
|
(308
|
)
|
|||||
|
Land sales
|
(15
|
)
|
(106
|
)
|
(74
|
)
|
91
|
|
(86
|
)
|
(32
|
)
|
43
|
|
|||||
|
Total Purchased services and other
|
$
|
1,056
|
|
$
|
905
|
|
$
|
1,060
|
|
$
|
151
|
|
17
|
|
$
|
(155
|
)
|
(15
|
)
|
Purchased services and other expense encompasses a wide range of third-party costs, including contractor and consulting fees, locomotive and freight car repairs performed by third parties, property and other taxes, intermodal pickup and delivery services, casualty expense, expenses for joint facilities, and gains on land sales. Purchased services and other expense was
$1,056 million
in
2017
, an
increase
of
$151 million
, or
17%
, from
$905 million
in
2016
. This
increase
was primarily due to:
|
•
|
lower gains on land sales of $91 million, following the sales of CP's Arbutus Corridor and Obico rail yard in 2016
;
|
|
•
|
a $17 million gain on sale of surplus freight cars, and a reduction in accrued discontinuance costs for certain branch lines, both in 2016, reported in Other;
|
|
•
|
higher right-of-way and track dismantling costs, reported in Track and operations;
|
|
•
|
higher intermodal expenses related to pickup and delivery services, reported in Intermodal; and
|
|
•
|
higher property taxes due to tax rate increases.
|
This
increase
was partially offset by the favourable impact of the change in FX of
$10 million
.
Purchased services and other expense was $905 million in 2016, a decrease of $155 million, or 15%, from $1,060 million in 2015. This decrease was primarily due to:
|
•
|
lower third-party service costs, reported in Track and operations and Support and facilities;
|
|
•
|
a $17 million gain on sale of surplus freight cars, and a reduction in accrued discontinuance costs for certain branch lines, reported in Other;
|
|
•
|
higher land sales of $32 million resulting from optimization of the Company's assets, as discussed further below;
|
|
•
|
lower crew travel and accommodations costs, reported in Track and operations;
|
|
•
|
lower third-party freight car and locomotive maintenance costs, reported in Equipment; and
|
46
|
•
|
lower casualty expenses of $8 million (excluding FX) as a result of lower third-party claims and incident-related environmental costs due to effective incident response and case management. This is partially offset by higher personal injury costs.
|
This decrease was partially offset by the unfavourable impact of the change in FX of $21 million and higher property taxes of $12 million (excluding FX).
As part of optimizing its assets, the Company may identify and dispose of property used or formerly used in operating activities. The Company includes as part of operating expenses the gains and losses that arise on disposal of such long-lived assets. The following disposals have impacted Purchased services and other during the current and comparative periods:
|
•
|
in the fourth quarter of 2016, the Company completed the sale of CP's Obico rail yard for gross proceeds of $38 million and a gain on sale of $37 million;
|
|
•
|
in the second quarter of 2016, the Company disposed of 1,000 surplus freight cars that had reached or were nearing the end of their useful life in a non-monetary exchange for new freight cars. The Company recognized a gain on sale of $17 million from the transaction and the sale did not impact cash from investing activities;
|
|
•
|
in the first quarter of 2016, the Company completed the sale of CP’s Arbutus Corridor to the City of Vancouver for gross proceeds of $55 million and a gain on sale of $50 million. The agreement allows the Company to share in future proceeds on the eventual development and/or sale of certain parcels of the Arbutus Corridor; and
|
|
•
|
in the first quarter of 2015, the Company recorded gains on land sales totalling $60 million, including a gain of $31 million following the sale of a building after resolution of legal proceedings, and various sections of land in eastern Canada for transit purposes.
|
Gain on Sale of D&H South
On November 17, 2014, the Company announced a proposed agreement with NS for the sale of approximately 283 miles of the Delaware and Hudson Railway Company, Inc.’s line between Sunbury, Pennsylvania, and Schenectady, New York, ("D&H South"). During the first quarter of 2015, the Company finalized the sales agreement with NS for D&H South. The sale, which received approval by the STB on May 15, 2015, was completed on September 18, 2015 for proceeds of $281 million (U.S. $214 million). The Company recorded a gain on sale of $68 million ($42 million after tax) from the transaction during the third quarter of 2015.
Other Income and Charges
Other income and charges consists of gains and losses from the change in FX on long-term debt, working capital, various costs related to financing, shareholder costs, equity income and other non-operating expenditures. Other income and charges was a gain of
$178 million
in
2017
, compared to a gain of
$45 million
in
2016
, an increase of
$133 million
, or
296%
. This increase was primarily due to higher FX translation gains of $186 million on U.S. dollar-denominated debt, compared to $79 million in the same period of 2016, and a $10 million insurance recovery of legal costs in 2017, compared to a legal settlement charge of $25 million in 2016. These favourable changes were partially offset by a $13 million charge on the settlement and roll of the forward starting swaps in 2017.
Other income and charges was a gain of
$45 million
in
2016
, compared with an expense of
$335 million
in
2015
, a change of
$380 million
, or
113%
. This change was primarily due to the favourable impact of FX translation of $79 million on U.S. dollar-denominated debt in 2016 compared to the unfavourable impact of FX translation of $297 million in 2015 and a $47 million premium charged upon early redemption of notes. This was partially offset by a legal settlement charge of $25 million in 2016.
Net Interest Expense
Net interest expense includes interest on long-term debt and capital leases. Net interest expense was
$473 million
in
2017
, an
increase
of
$2 million
, from
$471 million
in
2016
. This
increase
was primarily due to lower capitalized interest, partially offset by the favourable impact from the change in FX of $8 million.
Net interest expense was
$471 million
in
2016
, an
increase
of
$77 million
, or
20%
, from
$394 million
in
2015
. This
increase
was primarily due to interest on new debt issued during the third quarter of 2015 and the unfavourable impact from the change in FX of $11 million, partially offset by higher capitalized interest.
Income Tax Expense
Income tax expense was
$93 million
in
2017
. This represents a
decrease
of
$460 million
, or
83%
, from
$553 million
in
2016
. The
decrease
is primarily due to net income tax recoveries of $541 million as a result of U.S. tax reform partially offset by other tax rate changes, and higher taxable earnings in
2017
.
Income tax expense was
$553 million
in
2016
. This represents a
decrease
of
$54 million
, or
9%
, from
$607 million
in
2015
. The
decrease
is due primarily to a lower effective income tax rate in
2016
, partially offset by higher taxable earnings.
47
The effective income tax rate for
2017
was 3.74% on reported income and 26.42% on Adjusted income. Adjusted income is a Non-GAAP measure, which is discussed further in Non-GAAP Measures of this Item 7. Management’s Discussion and Analysis of Financial Condition and Results of Operations.
The effective income tax rate for
2016
was 25.68% on reported income and 26.15% on Adjusted income, compared with 30.95% on reported income and 27.25% on Adjusted income for
2015
.
The Company expects a normalized
2018
income tax rate of approximately 24.50% to 25.00%. The Company’s
2018
outlook for its normalized income tax rate is based on certain assumptions about events and developments that may or may not materialize, or that may be offset entirely or partially by new events and developments. This is discussed further in Item 1A. Risk Factors.
Liquidity and Capital Resources
The Company believes adequate amounts of Cash and cash equivalents are available in the normal course of business to provide for ongoing operations, including the obligations identified in the tables in Contractual Commitments of this Item 7. Management’s Discussion and Analysis of Financial Condition and Results of Operations. The Company is not aware of any trends or expected fluctuations in the Company's liquidity that would create any deficiencies. The Company's primary sources of liquidity include its Cash and cash equivalents, its bilateral letter of credit facilities, and its revolving credit facility.
As at December 31,
2017
, the Company had
$338 million
of Cash and cash equivalents, U.S.
$2.0 billion
available under its revolving credit facility and up to
$281 million
available under its letters of credit (December 31,
2016
–
$164 million
of Cash and cash equivalents, U.S.
$2.0 billion
available under its revolving credit facility and up to
$280 million
available under its letters of credit).
As at December 31,
2017
, the Company's U.S. $2.0 billion revolving credit facility, which includes a U.S. $1.0 billion five-year portion and U.S. $1.0 billion one-year plus one-year term-out portion, was undrawn (December 31,
2016
– undrawn). Effective June 23, 2017, the maturity date on the U.S. $1.0 billion one-year plus one-year term-out portion was extended to June 27, 2019, and the maturity date on the U.S. $1.0 billion five-year portion was extended to June 28, 2022. The Company did not draw from its revolving credit facility during the year ended December 31,
2017
(December 31,
2016
– undrawn). The revolving credit facility agreement requires the Company not to exceed a maximum debt to earnings before interest, tax, depreciation, and amortization ratio. As at December 31,
2017
, the Company was in compliance with the threshold stipulated in this financial covenant.
The Company has a commercial paper program that enables it to issue commercial paper up to a maximum aggregate principal amount of U.S. $1.0 billion in the form of unsecured promissory notes. The commercial paper is backed by the U.S. $1.0 billion one-year plus one-year term-out portion of the revolving credit facility. As at December 31,
2017
, total commercial paper borrowings were $nil (December 31,
2016
– $nil).
As at December 31,
2017
, under its bilateral letters of credit facility, the Company had letters of credit drawn of
$319 million
from a total available amount of $600 million. This compares to letters of credit drawn of
$320 million
from a total available amount of $600 million as at December 31,
2016
. Under the bilateral letters of credit facility, the Company has the option to post collateral in the form of Cash or cash equivalents, equal at least to the face value of the letters of credit issued. As at December 31,
2017
, the Company had
$150 million
posted as collateral on its bilateral letters of credit facility (December 31,
2016
– $nil).
The following discussion of operating, investing and financing activities describes the Company’s indicators of liquidity and capital resources.
Operating Activities
Cash provided by operating activities was
$2,182 million
in
2017
, an
increase
of
$93 million
compared to
$2,089 million
in
2016
. This
increase
was primarily due to higher cash generating income, partially offset by an unfavourable change in working capital mainly as a result of increased receivables from higher revenues in 2017.
Cash provided by operating activities was
$2,089 million
in
2016
, a
decrease
of
$370 million
from
$2,459 million
in
2015
. The
decrease
was primarily due to lower cash generating income and an unfavourable change in working capital primarily as a result of higher income taxes paid in 2016 and an increase in interest payments resulting from debt issued in the third quarter of 2015.
Investing Activities
Cash used in investing activities was
$1,295 million
in
2017
, an
increase
of
$226 million
from
$1,069 million
in
2016
. This
increase
was primarily due to higher additions to properties ("capital programs") during 2017 as well as lower proceeds from the sale of properties and other assets compared to 2016.
48
Cash used in investing activities was
$1,069 million
in
2016
, a
decrease
of
$54 million
from
$1,123 million
in
2015
. The
decrease
was largely due to lower additions to properties during 2016 partially offset by the proceeds from the sale of D&H South that occurred in 2015.
Additions to properties were
$1,340 million
in
2017
, an
increase
of
$158 million
from
$1,182 million
in
2016
. The
increase
, primarily in track and roadway and rolling stock investments, reflects CP's continued investments in its network and locomotive fleet.
Additions to properties were
$1,182 million
in
2016
, a
decrease
of
$340 million
from
$1,522 million
in
2015
. The
decrease
, primarily in track and roadway investments, is reflective of the track upgrade programs completed in 2015.
Capital Programs
|
For the year ended December 31
(in millions, except for track miles and crossties)
|
2017
|
|
2016
|
|
2015
|
|
|||
|
Additions to capital
|
|||||||||
|
Track and roadway
|
$
|
958
|
|
$
|
904
|
|
$
|
1,119
|
|
|
Rolling stock
|
198
|
|
105
|
|
158
|
|
|||
|
Information systems
(1)
|
78
|
|
88
|
|
79
|
|
|||
|
Buildings and other
|
132
|
|
108
|
|
180
|
|
|||
|
Total – accrued additions to capital
|
1,366
|
|
1,205
|
|
1,536
|
|
|||
|
Less:
|
|
||||||||
|
Non-cash transactions
|
26
|
|
23
|
|
14
|
|
|||
|
Cash invested in additions to properties (per Consolidated Statements of Cash Flows)
|
$
|
1,340
|
|
$
|
1,182
|
|
$
|
1,522
|
|
|
Track installation capital programs
|
|
||||||||
|
Track miles of rail laid (miles)
|
313
|
|
252
|
|
468
|
|
|||
|
Track miles of rail capacity expansion (miles)
|
4
|
|
2
|
|
22
|
|
|||
|
Crossties installed (thousands)
|
1,138
|
|
1,008
|
|
1,009
|
|
|||
(1)
Information systems include hardware and software.
Track and roadway expenditures include the replacement and enhancement of the Company’s track infrastructure. Of the
$958 million
additions in
2017
, approximately $833 million was invested in the renewal of depleted assets, namely rail, ties, ballast, signals, and bridges. Approximately $40 million was spent on PTC compliance requirements and $85 million was invested in network improvements and growth initiatives.
Rolling stock investments encompass locomotives and freight cars. In
2017
, expenditures on locomotives were approximately $110 million and were focused on the continued re-investment in CP's exiting locomotive fleet. Freight car and container investments of approximately $88 million were largely focused on the acquisition of existing units previously held under operating leases and renewal of depleted assets.
In
2017
, CP invested approximately
$78 million
in information systems primarily focused on rationalizing and enhancing business systems, providing real-time data, and modernizing core hardware and applications. Investments in buildings and other items were
$132 million
, and include items such as facility upgrades and renovations, vehicles, and shop equipment.
For
2018
, CP expects to invest approximately $1.35 billion to $1.5 billion in its capital programs, which will be financed with cash generated from operations. This leverages the considerable network upgrade and improvement investments that have been made over the last several years. Approximately 50% to 60% of planned capital programs are for track and roadway, including approximately $56 million for PTC. Approximately 25% to 30% is expected to be allocated to rolling stock assets, including locomotive improvements and the continued acquisition of freight cars previously held under operating leases. Approximately 5% is expected to be allocated to information services, and 10% to 15% is expected to be allocated to buildings and other.
Free Cash
CP generated positive Free cash of
$874 million
in
2017
, a
decrease
of
$133 million
from
$1,007 million
in
2016
. This
decrease
is primarily due to an increase in cash used in investing activities as a result of higher additions to properties as well as lower proceeds from the sale of properties and other assets compared to 2016, partially offset by an increase in cash provided by operating activities due to higher Net income compared to the same period of 2016. Free cash is affected by seasonal fluctuations and by other factors including the size of the Company's capital programs. The
2017
capital programs are discussed further above in Investing Activities. Free cash is defined and reconciled in the Non-GAAP Measures of this Item 7. Management’s Discussion and Analysis of Financial Condition and Results of Operations.
49
Financing Activities
Cash used in financing activities was
$700 million
in
2017
, a
decrease
of
$793 million
from
$1,493 million
in
2016
. This
decrease
was primarily due to lower payments to buy back shares under the Company's share repurchase program in 2017, partially offset by higher dividends paid during the year.
Cash used in financing activities was
$1,493 million
in
2016
, an
increase
of
$536 million
from
$957 million
in
2015
. This
increase
was primarily due to the issuance of long-term debt in 2015, partially offset by higher payments to buy back shares under the Company's share repurchase program and the net repayment of commercial paper and long-term debt in 2015.
Credit Measures
Credit ratings provide information relating to the Company’s financing costs, liquidity and operations and affect the Company’s ability to obtain short-term and long-term financing and/or the cost of such financing.
A mid-investment grade credit rating is an important measure in assessing the Company’s ability to maintain access to public financing and to minimize the cost of capital. It also affects the ability of the Company to engage in certain collateralized business activities on a cost-effective basis.
Credit ratings and outlooks are based on the rating agencies’ methodologies and can change from time to time to reflect their views of CP. Their views are affected by numerous factors including, but not limited to, the Company’s financial position and liquidity along with external factors beyond the Company’s control.
As at December 31,
2017
, CP's credit ratings from Standard & Poor's Rating Services ("Standard & Poor's") and Moody's Investor Service ("Moody's") remain unchanged from December 31,
2016
. However, during the second quarter of 2017, Moody's upgraded the outlook on CP's Senior unsecured debt from negative to stable.
Credit ratings as at December 31,
2017
(1)
|
Long-term debt
|
|
Outlook
|
|
|
Standard & Poor's
|
|
|
|
|
|
Long-term corporate credit
|
BBB+
|
stable
|
|
|
Senior secured debt
|
A
|
stable
|
|
|
Senior unsecured debt
|
BBB+
|
stable
|
|
Moody's
|
|
|
|
|
|
Senior unsecured debt
|
Baa1
|
stable
|
|
|
|
|
|
|
$1 billion Commercial paper program
|
|
|
|
|
Standard & Poor's
|
A-2
|
N/A
|
|
|
Moody's
|
|
P-2
|
N/A
|
(1)
Credit ratings are not recommendations to purchase, hold or sell securities and do not address the market price or suitability of a specific security for a particular investor. Credit ratings are based on the rating agencies' methodologies and may be subject to revision or withdrawal at any time by the rating agencies.
The Adjusted net debt to Adjusted earnings before interest, tax, depreciation and amortization (“EBITDA”) ratio for the years ended December 31,
2017
,
2016
, and
2015
was
2.6
,
2.9
and
2.8
, respectively. The
decrease
between
2017
and
2016
was primarily due to a lower long-term debt and higher cash balance as at December 31, 2017 compared to December 31, 2016. The
increase
between
2016
and
2015
was due to a lower ending cash balance as at December 31, 2016 compared to December 31, 2015, as well as a decrease in Adjusted EBITDA for 2016. Adjusted net debt to Adjusted EBITDA ratio is defined and reconciled in Non-GAAP Measures of this Item 7. Management’s Discussion and Analysis of Financial Condition and Results of Operations. Over the long term, CP targets an Adjusted net debt to Adjusted EBITDA ratio of 2.0 to 2.5.
At
February 14, 2018
,
the latest practicable date, there were 144,212,716 Common Shares and no preferred shares issued and outstanding, which consists of 14,576 holders of record of the Company's Common Shares. In addition, CP has a Management Stock Option Incentive Plan (“MSOIP”), under which key officers and employees are granted options to purchase CP Common Shares. Each option granted can be exercised for one Common Share.
At
February 14, 2018
, 1.6 million options were outstanding
50
under the Company’s MSOIP and stand-alone option agreements entered into with Mr. Keith Creel. There are 1.4 million options available to be issued by the Company’s MSOIP in the future.
CP has a Director's Stock Option Plan (“DSOP”), under which directors are granted options to purchase CP Common Shares. There are no outstanding options under the DSOP, which has 0.3 million options available to be issued in the future.
Non-GAAP Measures
The Company presents non-GAAP measures and cash flow information to provide a basis for evaluating underlying earnings and liquidity trends in the Company’s business that can be compared with the results of operations in prior periods. In addition, these non-GAAP measures facilitate a multi-period assessment of long-term profitability, allowing management and other external users of the Company’s consolidated financial information to compare profitability on a long-term basis, including assessing future profitability, with that of the Company’s peers.
These non-GAAP measures have no standardized meaning and are not defined by GAAP and, therefore, may not be comparable to similar measures presented by other companies. The presentation of these non-GAAP measures is not intended to be considered in isolation from, as a substitute for, or as superior to the financial information presented in accordance with GAAP.
Adjusted Performance Measures
The Company uses Adjusted income, Adjusted diluted earnings per share, Adjusted operating income, and Adjusted operating ratio to evaluate the Company’s operating performance and for planning and forecasting future business operations and future profitability. These non-GAAP measures are presented in Item 6. Selected Financial Data and discussed further in other sections of this Item 7. Management’s Discussion and Analysis of Financial Condition and Results of Operations. These non-GAAP measures provide meaningful supplemental information regarding operating results because they exclude certain significant items that are not considered indicative of future financial trends either by nature or amount. As a result, these items are excluded for management assessment of operational performance, allocation of resources and preparation of annual budgets. These significant items may include, but are not limited to, restructuring and asset impairment charges, individually significant gains and losses from sales of assets, and certain items outside the control of management. These items may not be non-recurring. However, excluding these significant items from GAAP results allows for a consistent understanding of the Company's consolidated financial performance when performing a multi-period assessment including assessing the likelihood of future results. Accordingly, these non-GAAP financial measures may provide insight to investors and other external users of the Company's consolidated financial information.
In
2017
, there were five significant items included in Net income as follows:
|
•
|
in the second quarter, a charge on hedge roll and de-designation of $13 million ($10 million after deferred tax) that unfavourably impacted Diluted EPS by 7 cents;
|
|
•
|
in the second quarter, an insurance recovery of a legal settlement of $10 million ($7 million after current tax) that favourably impacted Diluted EPS by 5 cents;
|
|
•
|
in the first quarter, a management transition recovery of $51 million related to the retirement of Mr. E. Hunter Harrison as CEO of CP ($39 million after deferred tax) that favourably impacted Diluted EPS by 27 cents;
|
|
•
|
during the course of the year, a net deferred tax recovery of $541 million as a result of changes in income tax rates as follows:
|
|
•
|
in the fourth quarter, a deferred tax recovery of $527 million, primarily due to the U.S. tax reform, that favourably impacted Diluted EPS by $3.63;
|
|
•
|
in the third quarter, a deferred tax expense of $3 million as a result of the change in the Illinois state corporate income tax rate change that unfavourably impacted Diluted EPS by 2 cents;
|
|
•
|
in the second quarter, a deferred tax recovery of $17 million as a result of the change in the Saskatchewan provincial corporate income tax rate that favourably impacted Diluted EPS by 12 cents; and
|
|
•
|
during the course of the year, a net non-cash gain of $186 million ($162 million after deferred tax) due to FX translation of the Company’s U.S. dollar-denominated debt as follows:
|
|
•
|
in the fourth quarter, a $14 million loss ($12 million after deferred tax) that unfavourably impacted Diluted EPS by 8 cents;
|
|
•
|
in the third quarter, a $105 million gain ($91 million after deferred tax) that favourably impacted Diluted EPS by 62 cents;
|
|
•
|
in the second quarter, a $67 million gain ($59 million after deferred tax) that favourably impacted Diluted EPS by 40 cents; and
|
|
•
|
in the first quarter, a $28 million gain ($24 million after deferred tax) that favourably impacted Diluted EPS by 16 cents.
|
In 2016, there were two significant items included in Net income as follows:
|
•
|
in the third quarter, a $25 million expense ($18 million after current tax) related to a legal settlement that unfavourably impacted Diluted EPS by 12 cents; and
|
|
•
|
during the course of the year, a net non-cash gain of $79 million ($68 million after deferred tax) due to FX translation of the Company’s U.S. dollar-denominated debt as follows:
|
51
|
•
|
in the fourth quarter, a $74 million loss ($64 million after deferred tax) that unfavourably impacted Diluted EPS by 43 cents;
|
|
•
|
in the third quarter, a $46 million loss ($40 million after deferred tax) that unfavourably impacted Diluted EPS by 27 cents;
|
|
•
|
in the second quarter, an $18 million gain ($16 million after deferred tax) that favourably impacted Diluted EPS by 10 cents; and
|
|
•
|
in the first quarter, a $181 million gain ($156 million after deferred tax) that favourably impacted Diluted EPS by $1.01.
|
In 2015, there were four significant items included in Net income as follows:
|
•
|
in the third quarter, a $68 million gain ($42 million after current tax) related to the sale of D&H South that favourably impacted Diluted EPS by 26 cents;
|
|
•
|
in the third quarter, a $47 million charge ($35 million after deferred tax) related to the early redemption premium on notes that unfavourably impacted Diluted EPS by 22 cents;
|
|
•
|
in the second quarter, a deferred income tax expense of $23 million as a result of the change in the Alberta provincial corporate income tax rate that unfavourably impacted Diluted EPS by 14 cents; and
|
|
•
|
during the course of the year, a net non-cash loss of $297 million ($257 million after deferred tax) due to FX translation of the Company’s U.S. dollar-denominated debt as follows:
|
|
•
|
in the fourth quarter, a $115 million loss ($100 million after deferred tax) that unfavourably impacted Diluted EPS by 64 cents;
|
|
•
|
in the third quarter, a $128 million loss ($111 million after deferred tax) that unfavourably impacted Diluted EPS by 69 cents;
|
|
•
|
in the second quarter, a $10 million gain ($9 million after deferred tax) that favourably impacted Diluted EPS by 5 cents; and
|
|
•
|
in the first quarter, a $64 million loss ($55 million after deferred tax) that unfavourably impacted Diluted EPS by 34 cents.
|
In 2014, there were two significant items included in Net income as follows:
|
•
|
in the fourth quarter, a net non-cash loss of $12 million ($9 million after deferred tax) due to FX translation on the Company’s U.S. dollar-denominated debt that unfavourably impacted Diluted EPS by 5 cents; and
|
|
•
|
in the first quarter, a recovery of $4 million ($3 million after current tax) was recorded for the Company's 2012 labour restructuring initiative due to favourable experience gains, recorded in Compensation and benefits that favourably impacted Diluted EPS by 1 cent.
|
In 2013, there were five significant items included in Net income as follows:
|
•
|
in the fourth quarter, an asset impairment charge and accruals for future costs totalling $435 million ($257 million after deferred tax) relating to the sale of Dakota, Minnesota & Eastern Railroad – West, which closed in the second quarter of 2014 and unfavourably impacted Diluted EPS by $1.46;
|
|
•
|
in the fourth quarter, management transition costs related to the retirement of the Company’s CFO and the appointment of the new CFO of $5 million ($4 million after current tax) that unfavourably impacted Diluted EPS by 2 cents;
|
|
•
|
in the fourth quarter, a recovery of $7 million ($5 million after current tax) of the Company’s 2012 labour restructuring initiative due to favourable experience gains that favourably impacted Diluted EPS by 3 cents;
|
|
•
|
in the third quarter, a deferred income tax expense of $7 million as a result of the change in the province of British Columbia’s corporate income tax rate that unfavourably impacted Diluted EPS by 4 cents; and
|
|
•
|
in the first quarter, a recovery of U.S. $9 million (U.S. $6 million after current tax) related to settlement of certain management transition amounts, which had been subject to legal proceedings, that favourably impacted Diluted EPS by 3 cents.
|
Reconciliation of GAAP Performance Measures to Non-GAAP Performance Measures
The following tables reconcile the most directly comparable measures presented in accordance with GAAP to the non-GAAP measures presented in Item 6. Selected Financial Data and discussed further in other sections of this Item 7. Management’s Discussion and Analysis of Financial Condition and Results of Operations for the years ended December 31,
2017
,
2016
,
2015
,
2014
and
2013
:
Adjusted income is calculated as Net income reported on a GAAP basis less significant items.
52
|
|
For the year ended
December 31 |
||||||||||||||
|
(in millions)
|
2017
|
2016
|
2015
|
2014
|
2013
|
||||||||||
|
Net income as reported
|
$
|
2,405
|
|
$
|
1,599
|
|
$
|
1,352
|
|
$
|
1,476
|
|
$
|
875
|
|
|
Less significant items (pretax):
|
|
|
|
|
|
||||||||||
|
Legal settlement charge
|
—
|
|
(25
|
)
|
—
|
|
—
|
|
—
|
|
|||||
|
Insurance recovery of legal settlement
|
10
|
|
—
|
|
—
|
|
—
|
|
—
|
|
|||||
|
Charge on hedge roll and de-designation
|
(13
|
)
|
—
|
|
—
|
|
—
|
|
—
|
|
|||||
|
Gain on sale of D&H South
|
—
|
|
—
|
|
68
|
|
—
|
|
—
|
|
|||||
|
Labour restructuring
|
—
|
|
—
|
|
—
|
|
4
|
|
7
|
|
|||||
|
Asset impairments
|
—
|
|
—
|
|
—
|
|
—
|
|
(435
|
)
|
|||||
|
Management transition recovery
|
51
|
|
—
|
|
—
|
|
—
|
|
4
|
|
|||||
|
Impact of FX translation on U.S. dollar-denominated debt
|
186
|
|
79
|
|
(297
|
)
|
(12
|
)
|
—
|
|
|||||
|
Early redemption premium on notes
|
—
|
|
—
|
|
(47
|
)
|
—
|
|
—
|
|
|||||
|
Income tax rate changes
|
541
|
|
—
|
|
(23
|
)
|
—
|
|
(7
|
)
|
|||||
|
Add:
|
|||||||||||||||
|
Tax effect of adjustments
(1)
|
36
|
|
4
|
|
(26
|
)
|
(2
|
)
|
(174
|
)
|
|||||
|
Adjusted income
|
$
|
1,666
|
|
$
|
1,549
|
|
$
|
1,625
|
|
$
|
1,482
|
|
$
|
1,132
|
|
(1)
The tax effect of adjustments was calculated as the pretax effect of the adjustments multiplied by the effective tax rate for each of the above items for the periods presented.
Adjusted diluted earnings per share is calculated using Adjusted income, as defined above, divided by the weighted-average diluted shares outstanding during the period as determined in accordance with GAAP.
|
|
For the year ended
December 31 |
||||||||||||||
|
|
2017
|
2016
|
2015
|
2014
|
2013
|
||||||||||
|
Diluted earnings per share as reported
|
$
|
16.44
|
|
$
|
10.63
|
|
$
|
8.40
|
|
$
|
8.46
|
|
$
|
4.96
|
|
|
Less significant items (pretax):
|
|
|
|
|
|
||||||||||
|
Legal settlement charge
|
—
|
|
(0.17
|
)
|
—
|
|
—
|
|
—
|
|
|||||
|
Insurance recovery of legal settlement
|
0.07
|
|
—
|
|
—
|
|
—
|
|
—
|
|
|||||
|
Charge on hedge roll and de-designation
|
(0.09
|
)
|
—
|
|
—
|
|
—
|
|
—
|
|
|||||
|
Gain on sale of D&H South
|
—
|
|
—
|
|
0.42
|
|
—
|
|
—
|
|
|||||
|
Labour restructuring
|
—
|
|
—
|
|
—
|
|
0.02
|
|
0.04
|
|
|||||
|
Asset impairments
|
—
|
|
—
|
|
—
|
|
—
|
|
(2.47
|
)
|
|||||
|
Management transition recovery
|
0.35
|
|
—
|
|
—
|
|
—
|
|
0.02
|
|
|||||
|
Impact of FX translation on U.S. dollar-denominated debt
|
1.27
|
|
0.53
|
|
(1.84
|
)
|
(0.07
|
)
|
—
|
|
|||||
|
Early redemption premium on notes
|
—
|
|
—
|
|
(0.30
|
)
|
—
|
|
—
|
|
|||||
|
Income tax rate changes
|
3.70
|
|
—
|
|
(0.14
|
)
|
—
|
|
(0.04
|
)
|
|||||
|
Add:
|
|||||||||||||||
|
Tax effect of adjustments
(1)
|
0.25
|
|
0.02
|
|
(0.16
|
)
|
(0.01
|
)
|
(0.99
|
)
|
|||||
|
Adjusted diluted earnings per share
|
$
|
11.39
|
|
$
|
10.29
|
|
$
|
10.10
|
|
$
|
8.50
|
|
$
|
6.42
|
|
(1)
The tax effect of adjustments was calculated as the pretax effect of the adjustments multiplied by the effective tax rate for each of the above items for the periods presented.
Adjusted operating income is calculated as Operating income reported on a GAAP basis less significant items.
53
|
|
For the year ended
December 31 |
||||||||||||||
|
(in millions)
|
2017
|
2016
|
2015
|
2014
|
2013
|
||||||||||
|
Operating income as reported
|
$
|
2,793
|
|
$
|
2,578
|
|
$
|
2,688
|
|
$
|
2,339
|
|
$
|
1,420
|
|
|
Less significant items:
|
|
|
|
|
|
||||||||||
|
Gain on sale of D&H South
|
—
|
|
—
|
|
68
|
|
—
|
|
—
|
|
|||||
|
Labour restructuring
|
—
|
|
—
|
|
—
|
|
4
|
|
7
|
|
|||||
|
Asset impairments
|
—
|
|
—
|
|
—
|
|
—
|
|
(435
|
)
|
|||||
|
Management transition recovery
|
51
|
|
—
|
|
—
|
|
—
|
|
4
|
|
|||||
|
Adjusted operating income
|
$
|
2,742
|
|
$
|
2,578
|
|
$
|
2,620
|
|
$
|
2,335
|
|
$
|
1,844
|
|
Adjusted operating ratio excludes those significant items that are reported within Operating income.
|
|
For the year ended
December 31 |
|||||||||
|
|
2017
|
2016
|
2015
|
2014
|
2013
|
|||||
|
Operating ratio as reported
|
57.4
|
%
|
58.6
|
%
|
60.0
|
%
|
64.7
|
%
|
76.8
|
%
|
|
Less significant items:
|
|
|
|
|
|
|
|
|||
|
Gain on sale of D&H South
|
—
|
|
—
|
|
(1.0
|
)
|
—
|
|
—
|
|
|
Labour restructuring
|
—
|
|
—
|
|
—
|
|
—
|
|
(0.1
|
)
|
|
Asset impairments
|
—
|
|
—
|
|
—
|
|
—
|
|
7.1
|
|
|
Management transition recovery
|
(0.8
|
)
|
—
|
|
—
|
|
—
|
|
(0.1
|
)
|
|
Adjusted operating ratio
|
58.2
|
%
|
58.6
|
%
|
61.0
|
%
|
64.7
|
%
|
69.9
|
%
|
ROIC and Adjusted ROIC
ROIC is calculated as Operating income less Other income and charges, tax effected at the Company's annualized effective tax rate, on a rolling twelve-month basis, divided by the sum of total Shareholders' equity, Long-term debt, Long-term debt maturing within one year and Short-term borrowing, as presented in the Company's Consolidated Financial Statements, averaged between the beginning and ending balance over a rolling twelve-month period. Adjusted ROIC excludes significant items reported in Operating income and Other income and charges in the Company's Consolidated Financial Statements, as these significant items are not considered indicative of future financial trends either by nature or amount. Total Shareholders' equity, Long-term debt, Long-term debt maturing within one year and Short-term borrowing is similarly adjusted for the impact of these significant items, net of tax, on closing balances as part of this average. ROIC and Adjusted ROIC are all-encompassing performance measures that measure how productively the Company uses its long-term capital investments, representing critical indicators of good operating and investment decisions made by management and are important performance criteria in determining certain elements of the Company's long-term incentive plan. ROIC and Adjusted ROIC are presented in Item 6. Selected Financial Data and discussed further in Results of Operations of this Item 7. Management’s Discussion and Analysis of Financial Condition and Results of Operations.
Calculation of ROIC and Adjusted ROIC
|
(in millions, except for percentages)
|
2017
|
2016
|
2015
|
2014
|
2013
|
||||||||||
|
Operating income for the year ended December 31
|
$
|
2,793
|
|
$
|
2,578
|
|
$
|
2,688
|
|
$
|
2,339
|
|
$
|
1,420
|
|
|
Less:
|
|
|
|
|
|
|
|
|
|
|
|||||
|
Other income and charges
|
(178
|
)
|
(45
|
)
|
335
|
|
19
|
|
17
|
|
|||||
|
Tax
(1)
|
111
|
|
675
|
|
728
|
|
640
|
|
312
|
|
|||||
|
|
$
|
2,860
|
|
$
|
1,948
|
|
$
|
1,625
|
|
$
|
1,680
|
|
$
|
1,091
|
|
|
Average for the twelve months of total shareholders' equity, long-term debt, long-term debt maturing within one year and short-term borrowing
|
$
|
13,961
|
|
$
|
13,532
|
|
$
|
12,561
|
|
$
|
11,653
|
|
$
|
10,842
|
|
|
ROIC
|
20.5
|
%
|
14.4
|
%
|
12.9
|
%
|
14.4
|
%
|
10.1
|
%
|
|||||
(1)
Tax was calculated at the annualized effective tax rate of
3.74%
,
25.72%
,
30.95%
,
27.59%
,
22.21%
for each of the above items for the years presented, respectively.
54
|
(in millions, except for percentages)
|
2017
|
2016
|
2015
|
2014
|
2013
|
||||||||||
|
Adjusted operating income for the year ended December 31
|
$
|
2,742
|
|
$
|
2,578
|
|
$
|
2,620
|
|
$
|
2,335
|
|
$
|
1,844
|
|
|
Less:
|
|
|
|
|
|
|
|
|
|
|
|||||
|
Other income and charges
|
(178
|
)
|
(45
|
)
|
335
|
|
19
|
|
17
|
|
|||||
|
Add significant items (pretax):
|
|
|
|
|
|
|
|
|
|
|
|||||
|
Legal settlement charge
|
—
|
|
25
|
|
—
|
|
—
|
|
—
|
|
|||||
|
Insurance recovery of legal settlement
|
(10
|
)
|
—
|
|
—
|
|
—
|
|
—
|
|
|||||
|
Charge on hedge roll and de-designation
|
13
|
|
—
|
|
—
|
|
—
|
|
—
|
|
|||||
|
Impact of FX translation on U.S. dollar-denominated debt
|
(186
|
)
|
(79
|
)
|
297
|
|
12
|
|
—
|
|
|||||
|
Early redemption premium on notes
|
—
|
|
—
|
|
47
|
|
—
|
|
—
|
|
|||||
|
Less:
|
|
|
|
|
|
|
|
|
|
|
|||||
|
Tax
(1)
|
724
|
|
673
|
|
716
|
|
642
|
|
491
|
|
|||||
|
|
$
|
2,013
|
|
$
|
1,896
|
|
$
|
1,913
|
|
$
|
1,686
|
|
$
|
1,336
|
|
|
Average for the twelve months of total shareholders' equity, long-term debt, long-term debt maturing within one year and short-term borrowing
|
$
|
13,961
|
|
$
|
13,532
|
|
$
|
12,561
|
|
$
|
11,653
|
|
$
|
10,842
|
|
|
Add:
|
|||||||||||||||
|
Impact of periodic significant items net of tax on the above average
|
(289
|
)
|
9
|
|
8
|
|
(2
|
)
|
129
|
|
|||||
|
Adjusted average for the twelve months of total shareholders' equity, long-term debt, long-term debt maturing within one year and short-term borrowing
|
$
|
13,672
|
|
$
|
13,541
|
|
$
|
12,569
|
|
$
|
11,651
|
|
$
|
10,971
|
|
|
Adjusted ROIC
(2)
|
14.7
|
%
|
14.0
|
%
|
15.2
|
%
|
14.5
|
%
|
12.2
|
%
|
|||||
(1)
Tax was calculated at the adjusted annualized effective tax rate of
26.42%
,
26.20%
,
27.25%
,
27.58%
,
26.88%
for each of the above items for the years presented, respectively.
(2)
The definition of Adjusted ROIC has been revised to exclude the impact of periodic significant items net of tax on closing total Shareholders' equity, Long-term debt, Long-term debt maturing within one year and Short-term borrowing as part of the average calculation. As a result of this change, Adjusted ROIC decreased by 0.1% in 2013. The change did not have a significant impact on other comparative periods.
Free Cash
Free cash is calculated as Cash provided by operating activities, less Cash used in investing activities, adjusted for changes in cash and cash equivalents balances resulting from FX fluctuations. Free cash is a measure that management considers to be an indicator of liquidity. Free cash is useful to investors and other external users of the Consolidated Financial Statements as it assists with the evaluation of the Company's ability to generate cash from its operations without incurring additional external financing. Positive Free cash indicates the amount of cash available for reinvestment in the business, or cash that can be returned to investors through dividends, stock repurchase programs, debt retirements or a combination of these. Conversely, negative Free cash indicates the amount of cash that must be raised from investors through new debt or equity issues, reduction in available cash balances or a combination of these. Free cash should be considered in addition to, rather than as a substitute for, Cash provided by operating activities. Free cash is presented in Item 6. Selected Financial Data and discussed further in Liquidity and Capital Resources of this Item 7. Management’s Discussion and Analysis of Financial Condition and Results of Operations.
Reconciliation of Cash Provided by Operating Activities to Free Cash
|
|
For the year ended
December 31 |
||||||||||||||
|
(in millions)
|
2017
|
2016
|
2015
|
2014
|
2013
|
||||||||||
|
Cash provided by operating activities
|
$
|
2,182
|
|
$
|
2,089
|
|
$
|
2,459
|
|
$
|
2,123
|
|
$
|
1,950
|
|
|
Cash used in investing activities
|
(1,295
|
)
|
(1,069
|
)
|
(1,123
|
)
|
(1,161
|
)
|
(1,186
|
)
|
|||||
|
Effect of foreign currency fluctuations on U.S. dollar-denominated cash and cash equivalents
|
(13
|
)
|
(13
|
)
|
45
|
|
7
|
|
10
|
|
|||||
|
Free cash
|
$
|
874
|
|
$
|
1,007
|
|
$
|
1,381
|
|
$
|
969
|
|
$
|
774
|
|
Foreign Exchange Adjusted Variance
FX adjusted variance allows certain financial results to be viewed without the impact of fluctuations in foreign currency exchange rates, thereby facilitating period-to-period comparisons in the analysis of trends in business performance. Financial result variances at constant currency are obtained by translating the comparable period of the prior year results denominated in U.S. dollars at the foreign exchange rates of the current period. FX adjusted variances are discussed in Operating Revenues and Operating Expenses of this Item 7. Management’s Discussion and Analysis of Financial Condition and Results of Operations.
55
|
|
2017 vs. 2016
|
2016 vs. 2015
|
|||||||||||||||||||||||
|
(in millions)
|
Reported 2017
|
Reported 2016
|
Reported 2015
|
Variance
due to FX |
FX Adjusted 2016
|
FX Adj. % Change
|
Variance
due to FX |
FX Adjusted 2015
|
FX Adj. % Change
|
||||||||||||||||
|
Freight
|
$
|
6,375
|
|
$
|
6,060
|
|
$
|
6,552
|
|
$
|
(67
|
)
|
$
|
5,993
|
|
6
|
|
$
|
145
|
|
$
|
6,697
|
|
(10
|
)
|
|
Non-freight
|
179
|
|
172
|
|
160
|
|
(1
|
)
|
171
|
|
5
|
|
1
|
|
161
|
|
7
|
|
|||||||
|
Total revenues
|
6,554
|
|
6,232
|
|
6,712
|
|
(68
|
)
|
6,164
|
|
6
|
|
146
|
|
6,858
|
|
(9
|
)
|
|||||||
|
Compensation and benefits
|
1,035
|
|
1,189
|
|
1,371
|
|
(9
|
)
|
1,180
|
|
(12
|
)
|
18
|
|
1,389
|
|
(14
|
)
|
|||||||
|
Fuel
|
677
|
|
567
|
|
708
|
|
(10
|
)
|
557
|
|
22
|
|
25
|
|
733
|
|
(23
|
)
|
|||||||
|
Materials
|
190
|
|
180
|
|
184
|
|
(2
|
)
|
178
|
|
7
|
|
2
|
|
186
|
|
(3
|
)
|
|||||||
|
Equipment rents
|
142
|
|
173
|
|
174
|
|
(2
|
)
|
171
|
|
(17
|
)
|
5
|
|
179
|
|
(3
|
)
|
|||||||
|
Depreciation and amortization
|
661
|
|
640
|
|
595
|
|
(3
|
)
|
637
|
|
4
|
|
5
|
|
600
|
|
7
|
|
|||||||
|
Purchased services and other
|
1,056
|
|
905
|
|
1,060
|
|
(10
|
)
|
895
|
|
18
|
|
21
|
|
1,081
|
|
(16
|
)
|
|||||||
|
Gain on sale of D&H South
|
—
|
|
—
|
|
(68
|
)
|
—
|
|
—
|
|
—
|
|
1
|
|
(67
|
)
|
(100
|
)
|
|||||||
|
Total operating expenses
|
3,761
|
|
3,654
|
|
4,024
|
|
(36
|
)
|
3,618
|
|
4
|
|
77
|
|
4,101
|
|
(11
|
)
|
|||||||
|
Operating income
|
$
|
2,793
|
|
$
|
2,578
|
|
$
|
2,688
|
|
$
|
(32
|
)
|
$
|
2,546
|
|
10
|
|
$
|
69
|
|
$
|
2,757
|
|
(6
|
)
|
Reconciliation of Net Income to Earnings before interest and tax, Adjusted earnings before interest and tax and Adjusted earnings before interest, tax, depreciation and amortization
EBIT is calculated as Operating income, less Other income and charges. Adjusted EBIT excludes significant items reported in Operating income and Other income and charges. Adjusted EBITDA is calculated as Adjusted EBIT plus Depreciation and amortization, net periodic pension and other benefit cost other than current service costs, and operating lease expense.
|
For the year ended
December 31 |
|||||||||||||||
|
(in millions)
|
2017
|
2016
|
2015
|
2014
|
2013
|
||||||||||
|
Net income as reported
|
$
|
2,405
|
|
$
|
1,599
|
|
$
|
1,352
|
|
$
|
1,476
|
|
$
|
875
|
|
|
Add:
|
|
|
|
|
|
|
|
|
|
|
|||||
|
Net interest expense
|
473
|
|
471
|
|
394
|
|
282
|
|
278
|
|
|||||
|
Income tax expense
|
93
|
|
553
|
|
607
|
|
562
|
|
250
|
|
|||||
|
EBIT
|
2,971
|
|
2,623
|
|
2,353
|
|
2,320
|
|
1,403
|
|
|||||
|
Less significant items (pretax):
|
|
|
|
|
|
|
|
|
|
|
|||||
|
Legal settlement charge
|
—
|
|
(25
|
)
|
—
|
|
—
|
|
—
|
|
|||||
|
Insurance recovery of legal settlement
|
10
|
|
—
|
|
—
|
|
—
|
|
—
|
|
|||||
|
Charge on hedge roll and de-designation
|
(13
|
)
|
—
|
|
—
|
|
—
|
|
—
|
|
|||||
|
Gain on sale of D&H South
|
—
|
|
—
|
|
68
|
|
—
|
|
—
|
|
|||||
|
Labour restructuring
|
—
|
|
—
|
|
—
|
|
4
|
|
7
|
|
|||||
|
Asset impairments
|
—
|
|
—
|
|
—
|
|
—
|
|
(435
|
)
|
|||||
|
Management transition recovery
|
51
|
|
—
|
|
—
|
|
—
|
|
4
|
|
|||||
|
Impact of FX translation on U.S. dollar-denominated debt
|
186
|
|
79
|
|
(297
|
)
|
(12
|
)
|
—
|
|
|||||
|
Early redemption premium on notes
|
—
|
|
—
|
|
(47
|
)
|
—
|
|
—
|
|
|||||
|
Adjusted EBIT
|
2,737
|
|
2,569
|
|
2,629
|
|
2,328
|
|
1,827
|
|
|||||
|
Less:
|
|
|
|
|
|
|
|
|
|
|
|||||
|
Net periodic pension and other benefit cost other than current service costs
|
274
|
|
167
|
|
70
|
|
137
|
|
82
|
|
|||||
|
Operating lease expense
|
(104
|
)
|
(111
|
)
|
(127
|
)
|
(121
|
)
|
(154
|
)
|
|||||
|
Depreciation and amortization
|
(661
|
)
|
(640
|
)
|
(595
|
)
|
(552
|
)
|
(565
|
)
|
|||||
|
Adjusted EBITDA
|
$
|
3,228
|
|
$
|
3,153
|
|
$
|
3,281
|
|
$
|
2,864
|
|
$
|
2,464
|
|
56
Adjusted Net Debt to Adjusted EBITDA Ratio
Adjusted net debt is defined as Long-term debt, Long-term debt maturing within one year and Short-term borrowing as reported on the Company’s Consolidated Balance Sheets adjusted for pension plans deficit, the net present value of operating leases, which is discounted by the Company’s effective interest rate for each of the years presented, and Cash and cash equivalents. Adjusted net debt to Adjusted EBITDA ratio is calculated as Adjusted net debt divided by Adjusted EBITDA. The Adjusted net debt to Adjusted EBITDA ratio is a key credit measure used to assess the Company’s financial capacity. The ratio provides information on the Company’s ability to service its debt and other long-term obligations. Adjusted net debt to Adjusted EBITDA ratio is discussed further in Liquidity and Capital Resources of this Item 7. Management’s Discussion and Analysis of Financial Condition and Results of Operations.
Reconciliation of Long-term Debt to Adjusted Net Debt
|
(in millions)
|
2017
|
2016
|
2015
|
||||||
|
Long-term debt including long-term debt maturing within one year as at December 31
|
$
|
8,159
|
|
$
|
8,684
|
|
$
|
8,957
|
|
|
Less:
|
|
|
|
||||||
|
Pension plans deficit
|
(278
|
)
|
(273
|
)
|
(295
|
)
|
|||
|
Net present value of operating leases
(1)
|
(281
|
)
|
(361
|
)
|
(439
|
)
|
|||
|
Cash and cash equivalents
|
338
|
|
164
|
|
650
|
|
|||
|
Adjusted net debt as at December 31
|
$
|
8,380
|
|
$
|
9,154
|
|
$
|
9,041
|
|
(1)
Operating leases were discounted at the Company’s effective interest rate for each of the years presented.
Calculation of Adjusted Net Debt to Adjusted EBITDA Ratio
|
(in millions, except for ratios)
|
2017
|
2016
|
2015
|
||||||
|
Adjusted net debt as at December 31
|
$
|
8,380
|
|
$
|
9,154
|
|
$
|
9,041
|
|
|
Adjusted EBITDA for the year ended December 31
|
3,228
|
|
3,153
|
|
3,281
|
|
|||
|
Adjusted net debt to Adjusted EBITDA ratio
|
2.6
|
|
2.9
|
|
2.8
|
|
|||
Off-Balance Sheet Arrangements
Guarantees
Refer to Item 8. Financial Statements and Supplementary Data, Note 24 Guarantees for details.
Contractual Commitments
The accompanying table indicates the Company’s obligations and commitments to make future payments for contracts, such as debt, capital lease and commercial arrangements as at
December 31, 2017
.
|
Payments due by period (in millions)
|
Total
|
|
2018
|
|
2019 & 2020
|
|
2021 & 2022
|
|
2023 & beyond
|
|
|||||
|
Contractual commitments
|
|
|
|
|
|
|
|
|
|
|
|||||
|
Interest on long-term debt and capital lease
|
$
|
11,287
|
|
$
|
439
|
|
$
|
778
|
|
$
|
705
|
|
$
|
9,365
|
|
|
Long-term debt
|
8,097
|
|
742
|
|
525
|
|
819
|
|
6,011
|
|
|||||
|
Capital leases
|
151
|
|
4
|
|
10
|
|
107
|
|
30
|
|
|||||
|
Operating lease
(1)
|
351
|
|
71
|
|
102
|
|
69
|
|
109
|
|
|||||
|
Supplier purchase
|
1,736
|
|
684
|
|
613
|
|
123
|
|
316
|
|
|||||
|
Other long-term liabilities
(2)
|
508
|
|
68
|
|
102
|
|
101
|
|
237
|
|
|||||
|
Total contractual commitments
|
$
|
22,130
|
|
$
|
2,008
|
|
$
|
2,130
|
|
$
|
1,924
|
|
$
|
16,068
|
|
(1)
Residual value guarantees on certain leased equipment with a maximum exposure of $1 million are not included in the minimum payments shown above, as management believes that CP will not be required to make payments under these residual guarantees. Where management believes that CP will be required to make payments under residual value guarantees, the fair value of these guarantees as at
December 31, 2017
of $5 million has been recognized as a liability.
(2)
Includes expected cash payments for restructuring, environmental remediation, asset retirement obligations, post-retirement benefits, workers’ compensation benefits, long-term disability benefits, pension benefit payments for the Company’s non-registered supplemental pension plan and certain other long-term liabilities. Projected payments for post-retirement benefits, workers’ compensation benefits and long-term disability benefits include the anticipated payments for years
2018
to
2027
. Pension contributions for the Company’s registered pension plans are not included due to the volatility in calculating them. Pension payments are discussed further in Critical Accounting Estimates of this Item 7. Management’s Discussion and Analysis of Financial Condition and Results of Operations.
Certain Other Financial Commitments
In addition to the financial commitments mentioned previously in Off-Balance Sheet Arrangements and Contractual Commitments of this Item 7. Management’s Discussion and Analysis of Financial Condition and Results of Operations, the Company is party to certain other financial commitments discussed below.
Letters of Credit
Letters of credit are obtained mainly to provide security to third parties under the terms of various agreements, including the supplemental pension plan. CP is liable for these contractual amounts in the case of non-performance under these agreements. Letters of credit are accommodated through a revolving credit facility and the Company’s bilateral letter of credit facilities.
Capital Commitments
The Company remains committed to maintaining the current high level of quality of our capital assets in pursuing sustainable growth. As part of this commitment, CP has entered into contracts with suppliers to make various capital purchases related to track programs. Payments for these commitments are due in
2018
through 2032. These expenditures are expected to be financed by cash generated from operations or by issuing new debt.
The accompanying table indicates the Company’s commitments to make future payments for letters of credit and capital expenditures as at
December 31, 2017
.
|
Payments due by period (in millions)
|
Total
|
|
2018
|
|
2019 & 2020
|
|
2021 & 2022
|
|
2023 & beyond
|
|
|||||
|
Certain other financial commitments
|
|||||||||||||||
|
Letters of credit
|
$
|
319
|
|
$
|
319
|
|
$
|
—
|
|
$
|
—
|
|
$
|
—
|
|
|
Capital commitments
|
632
|
|
314
|
|
90
|
|
67
|
|
161
|
|
|||||
|
Total certain other financial commitments
|
$
|
951
|
|
$
|
633
|
|
$
|
90
|
|
$
|
67
|
|
$
|
161
|
|
Critical Accounting Estimates
To prepare the Consolidated Financial Statements that conform with GAAP, the Company is required to make estimates and assumptions that affect the reported amounts of assets and liabilities, the disclosure of contingent assets and liabilities at the date of the Consolidated Financial Statements and the reported amounts of revenues and expenses during the reported periods. Using the most current information available, the Company reviews estimates on an ongoing basis, including those related to environmental liabilities, pensions and other benefits, property, plant and equipment, deferred income taxes, and personal injury and other claims liabilities.
The development, selection and disclosure of these estimates, and this MD&A, have been reviewed by the Board of Directors’ Audit Committee, which is composed entirely of independent directors.
Environmental Liabilities
Environmental remediation accruals cover site-specific remediation programs. CP estimates of the probable costs to be incurred in the remediation of properties contaminated by past railway use reflect the nature of contamination at individual sites according to typical activities and scale of operations conducted. The Company screens and classifies sites according to typical activities and scale of operations conducted. CP has developed remediation strategies for each property based on the nature and extent of the contamination, as well as the location of the property and surrounding areas that may be adversely affected by the presence of contaminants. CP also considers available technologies, treatment and disposal facilities and the acceptability of site-specific plans based on the local regulatory environment. Site-specific plans range from containment and risk management of the contaminants through to the removal and treatment of the contaminants and affected soils and groundwater. The details of the estimates reflect the environmental liability at each property. The Company is committed to fully meeting regulatory and legal obligations with respect to environmental matters.
Some sites include remediation activities that are projected beyond the 10-year period, which CP is unable to reasonably estimate and determine. Therefore, CP's accruals of the environmental liabilities is based on an estimate of costs for a rolling 10-year period covered by the environmental program. Payments are expected to be made over
10
years to 2027. A limited portion of the environmental accruals, the stable Perpetual Care for the environmental program, are fixed and reliably determined. This portion of the environmental liabilities is discounted using a risk-free rate, adjusted by inflation and productivity improvements.
Provisions for environmental remediation costs are recorded in “Other long-term liabilities” (refer to Item 8. Financial Statements and Supplementary Data, Note 18 Other long-term liabilities), except for the current portion which is recorded in “Accounts payable and accrued liabilities” (refer to Item 8. Financial Statements and Supplementary Data, Note 15 Accounts payable and accrued liabilities). The accruals for environmental remediation represent CP’s best estimate of its probable future obligations and include
57
both asserted and unasserted claims, without reduction for anticipated recoveries from third parties. Although the recorded accruals include CP’s best estimate of all probable costs, CP’s total environmental remediation costs cannot be predicted with certainty. Accruals for environmental remediation may change from time to time as new information about previously untested sites becomes known, environmental laws and regulations evolve and advances are made in environmental remediation technology. The accruals may also vary as the courts decide legal proceedings against outside parties responsible for contamination. These potential charges, which cannot be quantified at this time, are not expected to be material to the Company’s financial position, but may materially affect income in the period in which a charge is recognized.
The environmental liabilities are also sensitive to the increase in cost of materials which would be reflected as increases to "Other long-term liabilities" and "Accounts payable and accrued liabilities" on the Company’s Consolidated Balance Sheets and to "Purchased services and other" within Operating expenses on the Company's Consolidated Statements of Income. CP's cash payments for environmental initiatives are estimated to be approximately $8 million in
2018
, $8 million in
2019
, $9 million in
2020
and a total of approximately $55 million over the remaining years through
2027
, which will be paid in decreasing amounts. All payments will be funded from general operations.
Pensions and Other Benefits
CP has defined benefit and defined contribution pension plans. Other benefits include post-retirement medical and life insurance for pensioners, and some post-employment workers’ compensation and long-term disability benefits in Canada. Workers’ compensation and long-term disability benefits are discussed in the Personal Injury and Other Claims Liabilities section below. Pension and post-retirement benefits liabilities are subject to various external influences and uncertainties.
Information concerning the measurement of costs for pensions and other benefits is discussed in Item 8. Financial Statements and Supplementary Data, Note 1 Summary of significant accounting policies.
Information on an Accounting Standards Update effective January 1, 2018 concerning the change in presentation of costs for pensions and other benefits is discussed in Item 8. Financial Statements and Supplementary Data, Note 2 Accounting changes. The amendments also restrict capitalization to the current service cost component when applicable.
Net Periodic Benefit Costs
Net periodic benefit costs for pensions and post-retirement benefits were included in "Compensation and benefits" on the Company's Consolidated Statements of Income. Combined net periodic benefit credits for pensions and post-retirement benefits (excluding self-insured workers' compensation and long-term disability benefits) were $160 million in
2017
, compared with net periodic benefit credits of $55 million in
2016
.
Net periodic benefit credits for pensions were $182 million in
2017
, compared with net periodic benefit credits of $81 million in
2016
. The benefit credit portion related to defined benefit pensions was $191 million in
2017
, compared with the benefit credit portion of $90 million in
2016
. The benefit cost portion related to defined contribution pensions (equal to contributions) was $9 million in
2017
, compared with $9 million for
2016
. Net periodic benefit costs for post-retirement benefits were $22 million in
2017
, compared with $26 million in
2016
.
Net periodic benefit costs for self-insured workers' compensation and long-term disability benefits were included in "Purchased services and other" on the Company's Consolidated Statements of Income. Combined net periodic benefit costs for self-insured workers' compensation and long-term disability benefits were $10 million in 2017, compared with net periodic benefit costs of $14 million in 2016.
CP estimates net periodic benefit credits for defined benefit pensions to be approximately $285 million in
2018
, and net periodic benefit costs for defined contribution pensions to be approximately $9 million in
2018
. Net periodic benefit costs for post-retirement benefits in
2018
are not expected to differ materially from the
2017
costs. The expected rate of return on the market-related asset value used to compute the 2018 net periodic benefit credit is 7.75%. Refer to Item 8. Financial Statements and Supplementary Data, Note 20 Pensions and other benefits for information, subsection "Additional plan asset information" for additional information on the expected rate of return.
Pension Plan Contributions
The Company made contributions of
$46 million
to the defined benefit pension plans in
2017
, compared with
$48 million
in
2016
. The Company’s main Canadian defined benefit pension plan accounts for 96% of CP’s pension obligation and can produce significant volatility in pension funding requirements, given the pension fund’s size, the many factors that drive the pension plan’s funded status, and Canadian statutory pension funding requirements. The Company made voluntary prepayments of $600 million in 2011, $650 million in 2010 and $500 million in 2009 to the Company’s main Canadian defined benefit pension plan. CP has applied $1,323 million of these voluntary prepayments to reduce its pension funding requirements in 2012–2017, leaving $427 million of the voluntary prepayments still available at December 31, 2017 to reduce CP’s pension funding requirements in 2018 and future years. CP continues to have significant flexibility with respect to the rate at which the remaining voluntary prepayments are applied to reduce
58
future years’ pension contribution requirements, which allows CP to manage the volatility of future pension funding requirements. At this time, CP estimates it will not apply any of the remaining voluntary prepayments against its 2018 pension funding requirements.
CP estimates its aggregate pension contributions, including its defined benefit and defined contribution plans, to be in the range of $50 million to $75 million in
2018
, and in the range of $30 million to $70 million per year from
2019
to
2021
. These estimates reflect the Company’s current intentions with respect to the rate at which CP will apply the remaining voluntary prepayments against contribution requirements in the next few years.
Future pension contributions will be highly dependent on the Company’s actual experience with such variables as investment returns, interest rate fluctuations and demographic changes, on the rate at which previous years’ voluntary prepayments are applied against pension contribution requirements, and on any changes in the regulatory environment. CP will continue to make contributions to the pension plans that, at a minimum, meet pension legislative requirements.
Pension Plan Risks
Fluctuations in the liability and net periodic benefit costs for pensions result from favourable or unfavourable investment returns and changes in long-term interest rates. The impact of favourable or unfavourable investment returns is moderated by the use of a market-related asset value for the main Canadian defined benefit pension plan’s public equity securities and absolute return strategies. The impact of changes in long-term interest rates on pension obligations is partially offset by their impact on the pension funds’ investments in fixed income assets.
The plans’ investment policy provides a target allocation of approximately
46%
of the plans’ assets to be invested in public equity securities. As a result, stock market performance is a key driver in determining the pension funds’ asset performance. If the rate of investment return on the plans’ public equity securities in
2017
had been 10 percentage points higher (or lower) than the actual
2017
rate of investment return on such securities,
2018
net periodic benefit costs for pensions would be lower (or higher) by approximately $25 million.
Changes in bond yields can result in changes to discount rates and to changes in the value of fixed income assets. If the discount rate as at December 31,
2017
had been higher (or lower) by 0.1% with no related changes in the value of the pension funds’ investment in fixed income assets,
2018
net periodic benefit costs for pensions would be lower (or higher) by approximately $13 million and 2018 current service costs for pensions would be lower (or higher) by approximately $4 million. However, a change in bond yields would also lead to a change in the value of the pension funds’ investment in fixed income assets, and this change would partially offset the impact on net periodic benefit costs noted above.
The Company estimates that an increase in the discount rate of 0.1% would decrease the defined benefit pension plans’ projected benefit obligations by approximately $157 million, and estimates that a decrease in the discount rate of 0.1% would increase the defined benefit pension plans’ projected benefit obligations by approximately $159 million. Similarly, for every 0.1% the actual return on assets varies above (or below) the estimated return for the year, the value of the defined benefit pension plans’ assets would increase (or decrease) by approximately $13 million.
Adverse experience with respect to these factors could eventually increase funding and pension expense significantly, while favourable experience with respect to these factors could eventually decrease funding and pension expense significantly.
Fluctuations in the post-retirement benefit obligation also can result from changes in the discount rate used. A 0.1% increase (decrease) in the discount rate would decrease (increase) the obligation by approximately $6 million.
CP reviews its pensioner mortality experience to ensure that the mortality assumption continues to be appropriate, or to determine what changes to the assumption is needed.
Property, Plant and Equipment
The Company follows the group depreciation method under which a single depreciation rate is applied to the total cost in a particular class of property, despite differences in the service life or salvage value of individual properties within the same class. CP performs depreciation studies of each property asset class approximately every three years to update depreciation rates. The studies are conducted with assistance from third-party specialists and analyzed and reviewed by the Company's management. Depreciation studies for U.S. assets are reviewed and approved by the Surface Transportation Board (“STB”). Depreciation studies for Canadian assets are provided to the Canadian Transportation Agency (the "Agency"), but the Agency does not approve depreciation rates. In determining appropriate depreciation rates, management is required to make judgements and assumptions about a variety of key factors that are subject to future variability due to inherent uncertainties. These include the following:
59
|
Key Assumptions
|
Assessments
|
|
•
Whole and remaining asset lives
|
•
Statistical analysis of historical retirement patterns;
•
Evaluation of management strategy and its impact on operations and the future use of specific property assets;
•
Assessment of technological advances;
•
Engineering estimates of changes in current operations and analysis of historic, current and projected future usage;
•
Additional factors considered for track assets: density of traffic and whether rail is new or has been relaid in a subsequent position;
•
Assessment of policies and practices for the management of assets including maintenance; and
•
Comparison with industry data.
|
|
•
Salvage values
|
•
Analysis of historical, current and estimated future salvage values.
|
CP depreciates the cost of properties, net of salvage, on a straight-line basis over the estimated useful life of the class of property. The estimates of economic lives are uncertain and can vary due to changes in any of the assessed factors noted in the table above for whole and remaining asset lives. Additionally, the depreciation rates are updated to reflect the change in residual values of the assets in the class.
It is anticipated that there will be changes in the estimates of weighted average useful lives and net salvage for each property asset class as assets are acquired, used and retired. Substantial changes in either the useful lives of properties or the salvage assumptions could result in significant changes to depreciation expense. For example, if the estimated average life of track assets, including rail, ties, ballast and other track material, increased (or decreased) by one year, annual depreciation expense would decrease (or increase) by approximately $13 million.
Due to the capital intensive nature of the railway industry, depreciation represents a significant part of operating expenses. The estimated useful lives of properties have a direct impact on the amount of depreciation recorded as a component of Properties on the Company’s Consolidated Balance Sheets. At December 31,
2017
and
2016
, accumulated depreciation was
$7,413 million
and
$7,125 million
, respectively.
Deferred Income Taxes
CP accounts for deferred income taxes based on the liability method. This method focuses on the Company’s balance sheet and the temporary differences otherwise calculated from the comparison of book versus tax values. The provision for deferred income taxes arises from temporary differences in the carrying values of assets and liabilities for financial statement and income tax purposes and the effect of loss carry forwards. It is assumed that such temporary differences will be settled in the deferred income tax assets and liabilities at the balance sheet date.
In determining deferred income taxes, the Company makes estimates and assumptions regarding deferred tax matters, including estimating the timing of the realization and settlement of deferred income tax assets (including the benefit of tax losses) and liabilities. Deferred income taxes are calculated using enacted federal, provincial, and state future income tax rates, which may differ in future periods.
The impact of the U.S. tax reform was estimated based on the Company's analysis of the Tax Cuts and Jobs Act. These estimates may be impacted as U.S. authorities issue additional regulations and interpretations in the future.
Deferred income tax expense is included in "Income tax expense" on the Company's Consolidated Statements of Income. Additional disclosures are provided in Item 8. Financial Statements and Supplementary Data, Note 5 Income taxes.
Personal Injury and Other Claims Liabilities
CP estimates the potential liability arising from incidents, claims and pending litigations relating to personal injury claims by employees, third-party claims, certain occupation-related claims and property damage claims.
Personal Injury
In Canada, employee occupational injuries are governed by provincial workers' compensation legislation. Occupational injury claims in the Canadian provinces of Quebec, Ontario, Manitoba and B.C. are self-insured and administered through each Worker's Compensation Board ("WCB"). The future costs related to occupation-related injuries are actuarially determined based on past experience and assumptions associated with the injury, compensation, income replacement, health care and administrative costs. In the four provinces where the Company is self-insured a discount rate is applied to the future estimated costs based on market rates for high quality corporate bonds to determine the liability. An actuarial study is performed on an annual basis. In the provinces of Saskatchewan and Alberta, the Company is assessed an annual WCB contribution on a premium basis and this amount is not subject to estimation by management. At December 31,
2017
and
2016
respectively, the WCB liability was $81 million and $82
60
million in "Pension and other benefit liabilities"; $11 million and $12 million in "Accounts payable and accrued liabilities", offset by deposits paid to WCB of $1 million and $2 million in "Other assets" on the Company's Consolidated Balance Sheets.
U.S. railway employees are covered by federal law under the FELA rather than workers' compensation programs. Accruals are set for individual cases based on facts, legal opinion and statistical analysis. U.S. accruals are also set and include alleged occupational exposure or injury.
Other Claims
A provision for a litigation matter or other claim will be accrued according to applicable accounting standards and any such accrual will be based on an ongoing assessment of the strengths and weaknesses of the litigation or claim and its likelihood of success, together with an evaluation of the damages or other monetary relief sought. CP accrues for probable claims when the facts of an incident become known and investigation results provide a reasonable basis for estimating the liability. The lower end of the range is accrued if the facts and circumstances permit only a range of reasonable estimates and no single amount in that range is a better estimate than any other. Additionally, for administrative expediency, a general provision for lesser value injury cases is maintained. Facts and circumstances related to asserted claims can change, and a process is in place to monitor accruals for changes in accounting estimates.
Forward-Looking Information
This MD&A and Annual Report on Form 10-K contains certain forward-looking statements within the meaning of the United States Private Securities Litigation Reform Act of 1995 and other relevant securities legislation. These forward-looking statements include, but are not limited to, statements concerning the Company’s defined benefit pension expectations for
2018
and through
2021
, our expectations for
2018
which includes: Adjusted diluted EPS growth to be in the low double-digit percentages from full-year
2017
Adjusted diluted EPS of
$11.39
, capital expenditures of $1.35 billion to $1.5 billion, an increase of 1% to 12% over the $1.34 billion spent in
2017
, assumptions regarding the Canadian-to-U.S. dollar exchange rate being in the range of $1.25 to $1.30, and an effective tax rate in the range of 24.5 to 25 percent, as well as statements concerning the Company’s operations, anticipated financial performance, business prospects and strategies, including statements concerning the anticipation that cash flow from operations and various sources of financing will be sufficient to meet debt repayments and obligations in the foreseeable future and concerning anticipated capital programs, statements regarding future payments including income taxes and pension contributions, and capital expenditures. Forward-looking information typically contains statements with words such as “financial expectations”, “key assumptions”, “anticipate”, “believe”, “expect”, “plan”, “will”, “outlook”, “should” or similar words suggesting future outcomes. To the extent that CP has provided guidance using non-GAAP financial measures, the Company may not be able to provide a reconciliation to a GAAP measure, due to unknown variables and uncertainty related to future results.
Readers are cautioned not to place undue reliance on forward-looking information because it is possible that CP will not achieve predictions, forecasts, projections and other forms of forward-looking information. Current economic conditions render assumptions, although reasonable when made, subject to greater uncertainty. In addition, except as required by law, CP undertakes no obligation to update publicly or otherwise revise any forward-looking information, whether as a result of new information, future events or otherwise.
By its nature, forward-looking information involves numerous assumptions, inherent risks and uncertainties, including but not limited to the following factors: changes in business strategies; general North American and global economic, credit and business conditions; risks in agricultural production such as weather conditions and insect populations; the availability and price of energy commodities; the effects of competition and pricing pressures; industry capacity; shifts in market demand; inflation; changes in laws and regulations, including regulation of rates; changes in taxes and tax rates; potential increases in maintenance and operating costs; uncertainties of investigations, proceedings or other types of claims and litigation; labour disputes; risks and liabilities arising from derailments; transportation of dangerous goods; timing of completion of capital and maintenance projects; currency and interest rate fluctuations; effects of changes in market conditions on the financial position of pension plans and investments; and various events that could disrupt operations, including severe weather, droughts, floods, avalanches and earthquakes as well as security threats and the governmental response to them, and technological changes.
There are more specific factors that could cause actual results to differ materially from those described in the forward-looking statements contained in this MD&A. These more specific factors are identified and discussed in Item 1A. Risk Factors. Other risks are detailed from time to time in reports filed by CP with securities regulators in Canada and the United States.
61
Foreign Exchange Risk
Although CP conducts business primarily in Canada, a significant portion of its revenues, expenses, assets and liabilities including debt are denominated in U.S. dollars. The value of the Canadian dollar is affected by a number of domestic and international factors, including, without limitation, economic performance, and Canadian, U.S. and international monetary policies. Consequently, the Company’s results are affected by fluctuations in the exchange rate between these currencies. On an annualized basis, a $0.01 weakening (or strengthening) of the Canadian dollar positively (or negatively) impacts freight revenues by approximately
$27 million
and negatively (or positively) impacts operating expenses by approximately
$14 million
.
CP uses U.S. dollar-denominated debt to hedge its net investment in U.S. operations. As at December 31, 2017, the net investment in U.S. operations is less than the total U.S. dollar-denominated debt. Consequently, FX translation on the Company’s undesignated U.S. dollar-denominated long-term debt causes additional impacts on earnings in Other income and charges.
To manage its exposure to fluctuations in exchange rates between Canadian and U.S. dollars, CP may sell or purchase U.S. dollar forwards at fixed rates in future periods. In addition, changes in the exchange rate between the Canadian dollar and other currencies (including the U.S. dollar) make the goods transported by the Company more or less competitive in the world marketplace and may in turn positively or negatively affect revenues.
Share Price Impact on Stock-Based Compensation
Based on information available at
December 31, 2017
and expectations for 2018 grants, for every $1.00 change in share price, stock-based compensation expense has a corresponding change of approximately $0.3 million to $0.5 million. This excludes the impact of changes in share price relative to the S&P/TSX 60 index, Class I railways, S&P/TSX Capped Industrial index and S&P 1500 Road and Rail index, which may trigger different performance share unit payouts. Share-based compensation may also be impacted by non-market performance conditions.
Additional information concerning stock-based compensation is included in Item 8. Financial Statements and Supplementary Data, Note 21 Stock-based compensation.
Interest Rate Risk
In order to meet the Company’s capital structure requirements, CP may enter into long-term debt agreements. These debt agreements expose CP to increased interest costs on future fixed debt instruments and existing variable rate debt instruments, should market rates increase. In addition, the present value of the Company’s assets and liabilities will also vary with interest rate changes. To manage interest rate exposure, CP may enter into forward rate agreements such as treasury rate locks or bond forwards that lock in rates for a future date, thereby protecting against interest rate increases. CP may also enter into swap agreements whereby one party agrees to pay a fixed rate of interest while the other party pays a floating rate. Contingent on the direction of interest rates, the Company may incur higher costs depending on the contracted rate.
As at
December 31, 2017
, the Company had forward starting floating-to-fixed interest rate swap agreements totalling a notional U.S.
$500 million
to fix the benchmark rate on cash flows associated with highly probable forecasted issuances of long-term notes (December 31,
2016
– U.S.
$700 million
).
Information concerning market risks is supplemented in Item 8. Financial Statements and Supplementary Data, Note 17 Financial Instruments.
62
INDEX TO CONSOLIDATED FINANCIAL STATEMENTS
|
Page
|
|
|
Report of Independent Registered Public Accounting Firm
|
|
|
Consolidated Statements of Income
|
|
|
For the Year Ended December 31, 2017, 2016, and 2015
|
|
|
Consolidated Statements of Comprehensive Income
|
|
|
For the Year Ended December 31, 2017, 2016, and 2015
|
|
|
Consolidated Balance Sheets
|
|
|
At December 31, 2017 and 2016
|
|
|
Consolidated Statements of Cash Flows
|
|
|
For the Year Ended December 31, 2017, 2016, and 2015
|
|
|
Consolidated Statements of Changes in Shareholders' Equity
|
|
|
For the Year Ended December 31, 2017, 2016, and 2015
|
|
|
Notes to Consolidated Financial Statements
|
|
63
Report of Independent Registered Public Accounting Firm
To the Shareholders and the Board of Directors of Canadian Pacific Railway Limited
Opinion on the Financial Statements
We have audited the accompanying consolidated statements of balance sheets of Canadian Pacific Railway Limited
and subsidiaries (the “Company”) as of December 31, 2017 and 2016, the related consolidated statements of income, comprehensive income, changes in shareholders’ equity, and cash flows, for each of the three years in the period ended December 31, 2017, and the related notes and the schedule listed in the Index at Item 15 (collectively referred to as the "financial statements"). In our opinion, the financial statements present fairly, in all material respects, the financial position of the Company as of December 31, 2017 and 2016, and the results of its operations and its cash flows for each of the three years in the period ended December 31, 2017, in conformity with accounting principles generally accepted in the United States of America.
We have also audited, in accordance with the standards of the Public Company Accounting Oversight Board (United States) (PCAOB), the Company’s internal control over financial reporting as of December 31, 2017, based on criteria established in
Internal Control - Integrated Framework (2013)
issued by the Committee of Sponsoring Organizations of the Treadway Commission and our report dated February 16, 2018 expressed an unqualified opinion on the Company’s internal control over financial reporting.
Basis for Opinion
These financial statements are the responsibility of the Company’s management. Our responsibility is to express an opinion on the Company’s financial statements based on our audits. We are a public accounting firm registered with the PCAOB and are required to be independent with respect to the Company in accordance with the U.S. federal securities laws and the applicable rules and regulations of the Securities and Exchange Commission and the PCAOB.
We conducted our audits in accordance with the standards of the PCAOB. Those standards require that we plan and perform the audit to obtain reasonable assurance about whether the financial statements are free of material misstatement, whether due to error or fraud. Our audits included performing procedures to assess the risks of material misstatement of the financial statements, whether due to error or fraud, and performing procedures that respond to those risks. Such procedures included examining, on a test basis, evidence regarding the amounts and disclosures in the financial statements. Our audits also included evaluating the accounting principles used and significant estimates made by management, as well as evaluating the overall presentation of the financial statements. We believe that our audits provide a reasonable basis for our opinion.
/s/ Deloitte LLP
Chartered Professional Accountants
Calgary, Canada
February 16, 2018
We have served as the Company's auditor since 2011.
64
CONSOLIDATED STATEMENTS OF INCOME
|
Year ended December 31 (in millions of Canadian dollars, except per share data)
|
2017
|
|
2016
|
|
2015
|
|
|||
|
Revenues
|
|||||||||
|
Freight
|
$
|
|
|
$
|
|
|
$
|
|
|
|
Non-freight
|
|
|
|
|
|
|
|||
|
Total revenues
|
|
|
|
|
|
|
|||
|
Operating expenses
|
|||||||||
|
Compensation and benefits
|
|
|
|
|
|
|
|||
|
Fuel
|
|
|
|
|
|
|
|||
|
Materials
|
|
|
|
|
|
|
|||
|
Equipment rents
|
|
|
|
|
|
|
|||
|
Depreciation and amortization
|
|
|
|
|
|
|
|||
|
Purchased services and other (Note 10)
|
|
|
|
|
|
|
|||
|
Gain on sale of Delaware & Hudson South (Note 10)
|
|
|
|
|
(
|
)
|
|||
|
Total operating expenses
|
|
|
|
|
|
|
|||
|
Operating income
|
|
|
|
|
|
|
|||
|
Less:
|
|||||||||
|
Other income and charges (Note 3)
|
(
|
)
|
(
|
)
|
|
|
|||
|
Net interest expense (Note 4)
|
|
|
|
|
|
|
|||
|
Income before income tax expense
|
|
|
|
|
|
|
|||
|
Income tax expense (Note 5)
|
|
|
|
|
|
|
|||
|
Net income
|
$
|
|
|
$
|
|
|
$
|
|
|
|
Earnings per share (Note 6)
|
|
||||||||
|
Basic earnings per share
|
$
|
|
|
$
|
|
|
$
|
|
|
|
Diluted earnings per share
|
$
|
|
|
$
|
|
|
$
|
|
|
|
Weighted average number of shares (millions) (Note 6)
|
|
||||||||
|
Basic
|
|
|
|
|
|
|
|||
|
Diluted
|
|
|
|
|
|
|
|||
See Notes to Consolidated Financial Statements.
65
CONSOLIDATED STATEMENTS OF COMPREHENSIVE INCOME
|
Year ended December 31 (in millions of Canadian dollars)
|
2017
|
|
2016
|
|
2015
|
|
|||
|
Net income
|
$
|
|
|
$
|
|
|
$
|
|
|
|
Net gain (loss) in foreign currency translation adjustments, net of hedging activities
|
|
|
|
|
(
|
)
|
|||
|
Change in derivatives designated as cash flow hedges
|
|
|
(
|
)
|
(
|
)
|
|||
|
Change in pension and post-retirement defined benefit plans
|
|
|
(
|
)
|
|
|
|||
|
Other comprehensive income (loss) before income taxes (Note 7)
|
|
|
(
|
)
|
|
|
|||
|
Income tax (expense) recovery on above items (Note 7)
|
(
|
)
|
|
|
(
|
)
|
|||
|
Other comprehensive income (loss) (Note 7)
|
|
|
(
|
)
|
|
|
|||
|
Comprehensive income
|
$
|
|
|
$
|
|
|
$
|
|
|
See Notes to Consolidated Financial Statements.
66
|
As at December 31 (in millions of Canadian dollars, except Common Shares)
|
2017
|
|
2016
|
|
||
|
Assets
|
||||||
|
Current assets
|
||||||
|
Cash and cash equivalents
|
$
|
|
|
$
|
|
|
|
Accounts receivable, net (Note 9)
|
|
|
|
|
||
|
Materials and supplies
|
|
|
|
|
||
|
Other current assets
|
|
|
|
|
||
|
|
|
|
|
|||
|
Investments (Note 11)
|
|
|
|
|
||
|
Properties (Note 12)
|
|
|
|
|
||
|
Goodwill and intangible assets (Note 13)
|
|
|
|
|
||
|
Pension asset (Note 20)
|
|
|
|
|
||
|
Other assets (Note 14)
|
|
|
|
|
||
|
Total assets
|
$
|
|
|
$
|
|
|
|
Liabilities and shareholders’ equity
|
||||||
|
Current liabilities
|
||||||
|
Accounts payable and accrued liabilities (Note 15)
|
$
|
|
|
$
|
|
|
|
Long-term debt maturing within one year (Note 16)
|
|
|
|
|
||
|
|
|
|
|
|||
|
Pension and other benefit liabilities (Note 20)
|
|
|
|
|
||
|
Other long-term liabilities (Note 18)
|
|
|
|
|
||
|
Long-term debt (Note 16)
|
|
|
|
|
||
|
Deferred income taxes (Note 5)
|
|
|
|
|
||
|
Total liabilities
|
|
|
|
|
||
|
Shareholders’ equity
|
||||||
|
Share capital (Note 19)
Authorized unlimited Common Shares without par value. Issued and outstanding are 144.9 million and 146.3 million at December 31, 2017 and 2016, respectively. |
|
|
|
|
||
|
Authorized unlimited number of first and second preferred shares; none outstanding.
|
||||||
|
Additional paid-in capital
|
|
|
|
|
||
|
Accumulated other comprehensive loss (Note 7)
|
(
|
)
|
(
|
)
|
||
|
Retained earnings
|
|
|
|
|
||
|
|
|
|
|
|||
|
Total liabilities and shareholders’ equity
|
$
|
|
|
$
|
|
|
Commitments and contingencies (Note 23).
See Notes to Consolidated Financial Statements.
|
Approved on behalf of the Board:
|
||||||||
|
|
/s/ Andrew F. Reardon
|
|
/s/ Jane L. Peverett
|
|||||
|
|
Andrew F. Reardon, Director,
|
|
Jane L. Peverett, Director,
|
|||||
|
|
Chair of the Board
|
|
Chair of the Audit Committee
|
|||||
67
|
Year ended December 31 (in millions of Canadian dollars)
|
2017
|
|
2016
|
|
2015
|
|
|||
|
Operating activities
|
|||||||||
|
Net income
|
$
|
|
|
$
|
|
|
$
|
|
|
|
Reconciliation of net income to cash provided by operating activities:
|
|||||||||
|
Depreciation and amortization
|
|
|
|
|
|
|
|||
|
Deferred income taxes (Note 5)
|
(
|
)
|
|
|
|
|
|||
|
Pension funding in excess of expense (Note 20)
|
(
|
)
|
(
|
)
|
(
|
)
|
|||
|
Foreign exchange (gain) loss on long-term debt (Note 3)
|
(
|
)
|
(
|
)
|
|
|
|||
|
Other operating activities, net
|
(
|
)
|
(
|
)
|
(
|
)
|
|||
|
Change in non-cash working capital balances related to operations (Note 8)
|
(
|
)
|
(
|
)
|
|
|
|||
|
Cash provided by operating activities
|
|
|
|
|
|
|
|||
|
Investing activities
|
|||||||||
|
Additions to properties
|
(
|
)
|
(
|
)
|
(
|
)
|
|||
|
Proceeds from the sale of Delaware & Hudson South (Note 10)
|
|
|
|
|
|
|
|||
|
Proceeds from sale of properties and other assets (Note 10)
|
|
|
|
|
|
|
|||
|
Other
|
|
|
(
|
)
|
|
|
|||
|
Cash used in investing activities
|
(
|
)
|
(
|
)
|
(
|
)
|
|||
|
Financing activities
|
|||||||||
|
Dividends paid
|
(
|
)
|
(
|
)
|
(
|
)
|
|||
|
Issuance of CP Common Shares (Note 19)
|
|
|
|
|
|
|
|||
|
Purchase of CP Common shares (Note 19)
|
(
|
)
|
(
|
)
|
(
|
)
|
|||
|
Issuance of long-term debt, excluding commercial paper (Note 16)
|
|
|
|
|
|
|
|||
|
Repayment of long-term debt, excluding commercial paper (Note 16)
|
(
|
)
|
(
|
)
|
(
|
)
|
|||
|
Net repayment of commercial paper (Note 16)
|
|
|
(
|
)
|
(
|
)
|
|||
|
Settlement of forward starting swaps (Note 17)
|
(
|
)
|
|
|
|
|
|||
|
Other
|
|
|
(
|
)
|
|
|
|||
|
Cash used in financing activities
|
(
|
)
|
(
|
)
|
(
|
)
|
|||
|
Effect of foreign currency fluctuations on U.S. dollar-denominated cash and cash equivalents
|
(
|
)
|
(
|
)
|
|
|
|||
|
Cash position
|
|||||||||
|
Increase (decrease) in cash and cash equivalents
|
|
|
(
|
)
|
|
|
|||
|
Cash and cash equivalents at beginning of year
|
|
|
|
|
|
|
|||
|
Cash and cash equivalents at end of year
|
$
|
|
|
$
|
|
|
$
|
|
|
|
Supplemental disclosures of cash flow information:
|
|||||||||
|
Income taxes paid
|
$
|
|
|
$
|
|
|
$
|
|
|
|
Interest paid
|
$
|
|
|
$
|
|
|
$
|
|
|
See Notes to Consolidated Financial Statements.
68
CONSOLIDATED STATEMENTS OF CHANGES IN SHAREHOLDERS’ EQUITY
|
(in millions of Canadian dollars except per share data)
|
Share
capital |
|
Additional
paid-in capital |
|
Accumulated
other comprehensive loss |
|
Retained
earnings |
|
Total
shareholders’ equity |
|
|||||
|
Balance at December 31, 2014
|
$
|
|
|
$
|
|
|
$
|
(
|
)
|
$
|
|
|
$
|
|
|
|
Net income
|
|
|
|
|
|
|
|
|
|
|
|||||
|
Other comprehensive income (Note 7)
|
|
|
|
|
|
|
|
|
|
|
|||||
|
Dividends declared ($1.4000 per share)
|
|
|
|
|
|
|
(
|
)
|
(
|
)
|
|||||
|
Effect of stock-based compensation expense
|
|
|
|
|
|
|
|
|
|
|
|||||
|
CP Common Shares repurchased (Note 19)
|
(
|
)
|
|
|
|
|
(
|
)
|
(
|
)
|
|||||
|
Shares issued under stock option plan (Note 19)
|
|
|
(
|
)
|
|
|
|
|
|
|
|||||
|
Balance at December 31, 2015
|
|
|
|
|
(
|
)
|
|
|
|
|
|||||
|
Net income
|
|
|
|
|
|
|
|
|
|
|
|||||
|
Other comprehensive loss (Note7)
|
|
|
|
|
(
|
)
|
|
|
(
|
)
|
|||||
|
Dividends declared ($1.8500 per share)
|
|
|
|
|
|
|
(
|
)
|
(
|
)
|
|||||
|
Effect of stock-based compensation expense
|
|
|
|
|
|
|
|
|
|
|
|||||
|
CP Common Shares repurchased (Note 19)
|
(
|
)
|
|
|
|
|
(
|
)
|
(
|
)
|
|||||
|
Shares issued under stock option plan (Note 19)
|
|
|
(
|
)
|
|
|
|
|
|
|
|||||
|
Balance at December 31, 2016
|
|
|
|
|
(
|
)
|
|
|
|
|
|||||
|
Net income
|
|
|
|
|
|
|
|
|
|
|
|||||
|
Other comprehensive income (Note 7)
|
|
|
|
|
|
|
|
|
|
|
|||||
|
Dividends declared ($2.1875 per share)
|
|
|
|
|
|
|
(
|
)
|
(
|
)
|
|||||
|
Effect of stock-based compensation expense
|
|
|
|
|
|
|
|
|
|
|
|||||
|
CP Common Shares repurchased (Note 19)
|
(
|
)
|
|
|
|
|
(
|
)
|
(
|
)
|
|||||
|
Shares issued under stock option plan (Note 19)
|
|
|
(
|
)
|
|
|
|
|
|
|
|||||
|
Balance at December 31, 2017
|
$
|
|
|
$
|
|
|
$
|
(
|
)
|
$
|
|
|
$
|
|
|
See Notes to Consolidated Financial Statements.
69
CANADIAN PACIFIC RAILWAY LIMITED
Notes to Consolidated Financial Statements
December 31, 2017
1
Summary of significant accounting policies
Accounting principles generally accepted in the United States of America (“GAAP”)
Principles of consolidation
Use of estimates
Principal subsidiaries
|
Principal subsidiary
|
Incorporated under
the laws of
|
|
Canadian Pacific Railway Company
|
Canada
|
|
Soo Line Railroad Company (“Soo Line”)
|
Minnesota
|
|
Delaware and Hudson Railway Company, Inc. (“D&H”)
|
Delaware
|
|
Dakota, Minnesota & Eastern Railroad Corporation (“DM&E”)
|
Delaware
|
|
Mount Stephen Properties Inc. (“MSP”)
|
Canada
|
Revenue recognition
Cash and cash equivalents
70
Restricted cash and cash equivalents
Foreign currency translation
The accounts of the Company’s foreign subsidiaries are translated into Canadian dollars using the year-end exchange rate for assets and liabilities and the average exchange rates during the year for revenues, expenses, gains and losses. FX gains and losses arising from the translation of the foreign subsidiaries’ assets and liabilities are included in “Other comprehensive income (loss)”. A portion of U.S. dollar-denominated long-term debt has been designated as a hedge of the net investment in foreign subsidiaries. As a result, unrealized FX gains and losses on U.S. dollar-denominated long-term debt, designated as a hedge, are offset against FX gains and losses arising from the translation of foreign subsidiaries’ accounts in “Other comprehensive income (loss)”.
Pensions and other benefits
Costs for post-retirement and post-employment benefits other than pensions, including post-retirement health care and life insurance and some workers’ compensation and long-term disability benefits in Canada, are actuarially determined on a basis similar to pension costs.
The over or under funded status of defined benefit pension and other post-retirement benefit plans are measured as the difference between the fair value of the plan assets and the benefit obligation, and are recognized on the balance sheets. In addition, any unrecognized actuarial gains and losses and prior service costs and credits that arise during the period are recognized as a component of “Other comprehensive income (loss)”, net of tax.
Materials and supplies
Properties
71
undiscounted cash flows. When such properties are determined to be impaired, recorded asset values are revised to their fair value and an impairment loss is recognized.
The Company recognizes expenditures as additions to properties or operating expenses based on whether the expenditures increase the output or service capacity, lower the associated operating costs or extend the useful life of the properties and whether the expenditures exceed minimum physical and financial thresholds.
Much of the additions to properties, both new and replacement properties, are self-constructed. These are initially recorded at cost, including direct costs and attributable indirect costs, overheads and carrying costs. Direct costs include, among other things, labour costs, purchased services, equipment costs and material costs. Attributable indirect costs and overheads include incremental long-term variable costs resulting from the execution of capital projects. Indirect costs mainly include work trains, material distribution, highway vehicles and work equipment. Overheads primarily include a portion of the engineering department’s costs, which plans, designs and administers these capital projects. These costs are allocated to projects by applying a measure consistent with the nature of the cost, based on cost studies. For replacement properties, the project costs are allocated to dismantling and installation based on cost studies. Dismantling work is performed concurrently with the installation.
Ballast programs including undercutting, shoulder ballasting and renewal programs that form part of the annual track program are capitalized as this work, and the related added ballast material, significantly improves drainage, which in turn extends the life of ties and other track materials. These costs are tracked separately from the underlying assets and depreciated over the period to the next estimated similar ballast program. Spot replacement of ballast is considered a repair which is expensed as incurred.
The costs of large refurbishments are capitalized and locomotive overhauls are expensed as incurred, except where overhauls represent a betterment of the locomotive in which case costs are capitalized.
The Company capitalizes development costs for major new computer systems.
The Company follows group depreciation, which groups assets which are similar in nature and have similar economic lives. The property groups are depreciated on a straight-line basis reflecting their expected economic lives determined by depreciation studies. Depreciation studies are regular reviews of asset service lives, salvage values, accumulated depreciation and other related factors. Depreciation rates are established through these studies. Actual use and retirement of assets may vary from current estimates, and would be identified in the next study. These changes in expected economic lives would impact the amount of depreciation expense recognized in future periods. All track assets are depreciated using a straight-line method which recognizes the value of the asset consumed as a percentage of the whole life of the asset.
When depreciable property is retired or otherwise disposed of in the normal course of business, the book value, less net salvage proceeds, is charged to accumulated depreciation and if different than the assumptions under the depreciation study could potentially result in adjusted depreciation expense over a period of years. However, when removal costs exceed the salvage value on assets and the Company has no legal obligation to remove the assets, the removal costs incurred are charged to income in the period in which the assets are removed and are not charged to accumulated depreciation.
For certain asset classes, the historical cost of the asset is separately recorded in the Company’s property records. This amount is retired from the property records upon retirement of the asset. For assets for which the historical cost cannot be separately identified the amount of the gross book value to be retired is estimated using either an indexation methodology, whereby the current replacement cost of the asset is indexed to the estimated year of installation for the asset, or a first-in, first-out approach, or statistical analysis is used to determine the age of the retired asset. CP uses indices that closely correlate to the principal costs of the assets.
There are a number of estimates inherent in the depreciation and retirement processes and as it is not possible to precisely estimate each of these variables until a group of property is completely retired, CP regularly monitors the estimated service lives of assets and the associated accumulated depreciation for each asset class to ensure depreciation rates are appropriate. If the recorded amounts of accumulated depreciation are greater or less than the amounts indicated by the depreciation studies then the excess or deficit is amortized as a component of depreciation expense over the remaining service lives of the applicable asset classes.
For the sale or retirement of larger groups of depreciable assets that are unusual and were not considered in the Company’s depreciation studies, CP records a gain or loss for the difference between net proceeds and net book value of the assets sold or retired. The accumulated depreciation to be retired includes asset-specific accumulated depreciation, when known, and an appropriate portion of the accumulated depreciation recorded for the relevant asset class as a whole, calculated using a cost-based allocation.
Revisions to the estimated useful lives and net salvage projections constitute a change in accounting estimate and are addressed prospectively by amending depreciation rates.
72
Assets held for sale
Goodwill and intangible assets
The carrying value of goodwill, which is not amortized, is assessed for impairment annually in the fourth quarter of each year as at October 1st, or more frequently as economic events dictate. The Company has the option of performing an assessment of certain qualitative factors (“Step 0”) to determine if it is more likely than not that the fair value of a reporting unit is less than its carrying value or proceeding directly to a quantitative impairment test (“Step 1”). Qualitative factors include but are not limited to, economic, market and industry conditions, cost factors and overall financial performance of the reporting unit. If Step 0 indicates that the carrying value is less than the fair value, then performing the two-step impairment test is unnecessary. Under Step 1, the fair value of the reporting unit is compared to its carrying value, including goodwill. If the fair value of the reporting unit is less than its carrying value, goodwill is potentially impaired. The impairment charge that would be recognized is the excess of the carrying value of the goodwill over the fair value of the goodwill, determined in the same manner as in a business combination.
Financial instruments
Financial instruments are recognized initially at fair value, which is the amount of consideration that would be agreed upon in an arm’s-length transaction between willing parties.
Derivative financial instruments
All derivative instruments are classified as held for trading and recorded at fair value. Any change in the fair value of derivatives not designated as hedges is recognized in the period in which the change occurs in the Consolidated Statements of Income in the line item to which the derivative instrument is related. On the Consolidated Balance Sheets they are classified in “Other assets”, “Other long-term liabilities”, “Other current assets” or “Accounts payable and accrued liabilities” as applicable. Gains and losses arising from derivative instruments may affect the following lines on the Consolidated Statements of Income: “Revenues”, “Compensation and benefits”, “Fuel”, “Other income and charges”, and “Net interest expense”.
For fair value hedges, the periodic changes in values are recognized in income, on the same line as the changes in values of the hedged items are also recorded. For a cash flow hedge, the change in value of the effective portion is recognized in “Other comprehensive income (loss)”. Any ineffectiveness within an effective cash flow hedge is recognized in income as it arises in the same income account as the hedged item. Should a cash flow hedging relationship become ineffective, previously unrealized gains and losses remain within “Accumulated other comprehensive loss” until the hedged item is settled and, prospectively, future changes in value of the derivative are recognized in income. The change in value of the effective portion of a cash flow hedge remains in “Accumulated other comprehensive loss” until the related hedged item settles, at which time amounts recognized in “Accumulated other comprehensive loss” are reclassified to the same income or balance sheet account that records the hedged item.
73
Environmental remediation
Income taxes
The effect of a change in income tax rates on deferred income tax assets and liabilities is recognized in income in the period during which the change occurs.
When appropriate, the Company records a valuation allowance against deferred tax assets to reflect that these tax assets may not be realized. In determining whether a valuation allowance is appropriate, CP considers whether it is more likely than not that all or some portion of CP’s deferred tax assets will not be realized, based on management’s judgment using available evidence about future events.
At times, tax benefit claims may be challenged by a tax authority. Tax benefits are recognized only for tax positions that are more likely than not sustainable upon examination by tax authorities. The amount recognized is measured as the largest amount of benefit that is greater than
50
%
likely to be realized upon settlement. A liability for “unrecognized tax benefits” is recorded for any tax benefits claimed in CP’s tax returns that do not meet these recognition and measurement standards.
Earnings per share
Stock-based compensation
Any consideration paid by employees on exercise of stock options is credited to “Share capital” when the option is exercised and the recorded fair value of the option is removed from “Additional paid-in capital" and credited to “Share capital”.
Compensation expense is also recognized for deferred share units (“DSUs”), performance share units (“PSUs”) and restricted share units (“RSUs”) using the fair value method. Compensation expense is recognized over the vesting period, or for PSUs and DSUs only, over the period from the grant date to the date employees become eligible to retire when this is shorter than the vesting period. Forfeitures of DSUs, PSUs and RSUs are estimated at issuance and subsequently at the balance sheet date.
2
Accounting changes
Compensation
–
Stock Compensation
In March 2016, the Financial Accounting Standards Board ("FASB") issued Accounting Standards Update (“ASU”) 2016-09, Improvements to Employee Share-based Payment Accounting, under FASB Accounting Standards Codification ("ASC") Topic 718. The amendments clarify the guidance relating to treatment of excess tax benefits and deficiencies, acceptable forfeiture rate policies, and treatment of cash paid by an employer when directly withholding shares for tax-withholding purposes and the requirement to treat such cash flows as a financing activity. As a result of this ASU, excess tax benefits are no longer recorded in additional paid-
74
in capital and instead are applied against taxes payable or recognized in the Consolidated Statement of Income. This ASU was effective for CP beginning on January 1, 2017. The Company has determined that there were no significant changes to disclosure, financial statement presentation, and no material changes to accounting as a result of adoption.
Simplifying the Measurement of Inventory
In July 2015, the FASB issued ASU 2015-11, Simplifying the Measurement of Inventory under FASB ASC Topic 330. The amendments require that reporting entities measure inventory at the lower of cost and net realizable value. Net realizable value is the estimated selling price in the ordinary course of business, less reasonably predictable costs of completion, disposal, and transportation. The amendments apply to inventory that is measured using the first-in, first-out or average cost basis. This ASU was effective for CP beginning on January 1, 2017 and was applied prospectively. The Company determined there were no changes to disclosure, financial statement presentation, or valuation of inventory as a result of adoption.
Future changes
Revenue from Contracts with Customers
In May 2014, the FASB issued ASU 2014-09, Revenue from Contracts with Customers under FASB ASC Topic 606. The FASB has also issued several updates to ASU 2014-09. The guidance in Topic 606, as amended, will be effective for CP for interim and annual periods commencing January 1, 2018. CP will adopt the new standard by using the modified retrospective approach.
CP has analyzed contracts and public tariffs for a significant proportion of the Company’s annual rail freight revenue, which represents greater than 95% of CP’s annual revenues, and has identified the distinct services provided to customers that represent performance obligations under contracts and public tariffs. CP has also assessed key contracts with customers that generate non-freight revenues. CP has concluded that recognizing rail freight revenues over time as performance obligations related to rail freight services are satisfied continues to be appropriate. Certain other services provided to customers are satisfied at a point in time and will continue to be recognized in this manner.
CP has substantially completed its assessment of its revenues earned from contracts with customers and does not expect any significant adjustment to be required upon adoption of the standard. Additional disclosures will be provided in CP's first quarter 2018 financial statements.
Compensation
–
Retirement Benefits
In March 2017, the FASB issued ASU 2017-07, Improving the Presentation of Net Periodic Pension Cost and Net Periodic Post-retirement Benefit Cost under FASB ASC Topic 715. The amendments clarify presentation requirements for net periodic pension cost and net periodic post-retirement benefit cost and require that an employer report the current service cost component in the same line item or items as other compensation costs arising from services rendered by the pertinent employees during the period. The other components of net periodic benefit cost are required to be presented in the Consolidated Statement of Income separately from the current service cost component and outside a subtotal of income from operations. The amendments also restrict capitalization to the current service cost component when applicable. The amendments are effective for CP beginning on January 1, 2018. The amendments related to presentation are required to be applied retrospectively and the restrictions on capitalization of the current service cost component are applicable prospectively on the date of adoption.
The impacts of the reclassification are detailed as follows:
|
Year ended December 31
|
|||||||||
|
(in millions of Canadian dollars)
|
2017
|
2016
|
2015
|
||||||
|
Decrease in operating income
|
$
|
|
|
$
|
|
|
$
|
|
|
There will be no change to Net income or earnings per share as a result of adoption of this new standard. The new guidance restricting capitalization of pensions to the current service cost component of net periodic benefit cost will have no impact to operating income or amounts capitalized because the Company currently only capitalizes an appropriate portion of current service cost for self-constructed properties. CP is currently assessing the disclosure requirements of this ASU.
Derivatives and Hedging
In August 2017, the FASB issued Accounting Standards Update ASU 2017-12, Targeted Improvements to Accounting for Hedging Activities, under FASB ASC Topic 815. This is intended to improve the financial reporting of hedging relationships to better portray the economic results of an entity's risk management activities in its financial statements. These amendments also make targeted improvements to simplify the application of the hedge accounting guidance in current GAAP. The amendments require the entire change in the fair value of the hedging instrument to be recorded in other comprehensive income for effective cash flow hedges. Consequently, any ineffective portion of the change in fair value will, therefore, no longer be recorded to the Consolidated Statement of Income as it arises. The amendments are effective for CP beginning on January 1, 2019, although early adoption is permitted.
75
Entities are required to apply the amendments in this update to hedging relationships existing on the date of adoption, reflected as a cumulative-effect adjustment as of the beginning of the fiscal year of adoption. Other amendments to presentation and disclosure are applied prospectively. The Company will early adopt this ASU effective January 1, 2018 and no significant cumulative-effect adjustment will be required.
Leases
In February 2016, the FASB issued ASU 2016-02, Leases under FASB ASC Topic 842. This new standard requires recognition of right-of-use assets and lease liabilities by lessees for those leases classified as finance and operating leases with a maximum term exceeding 12 months. For CP this new standard will be effective for interim and annual periods commencing January 1, 2019. Entities are required to use a modified retrospective approach to adopt this new standard. The Company has a detailed plan to implement the new standard and is assessing contractual arrangements, through a cross-functional team, that may qualify as leases under the new standard. CP is also working with a vendor to implement a lease management system which will assist in delivering the required accounting changes. CP's cross-functional team and the vendor finalized system requirements and developed work flows and testing scenarios that will permit system implementation and parallel testing in 2018 for CP's lease system solution. The impact of the new standard will be a material increase to right of use assets and lease liabilities on the Company's Consolidated Balance Sheets, primarily, as a result of operating leases currently not recognized on the balance sheet. The Company does not anticipate a material impact to Net income and is currently evaluating the impact adoption of this new standard will have on disclosure.
Intangibles
–
Goodwill and Other
3
Other income and charges
|
(in millions of Canadian dollars)
|
2017
|
|
2016
|
|
2015
|
|
|||
|
Foreign exchange (gain) loss on long-term debt
|
$
|
(
|
)
|
$
|
(
|
)
|
$
|
|
|
|
Other foreign exchange gains
|
(
|
)
|
(
|
)
|
(
|
)
|
|||
|
Early redemption premium on notes (Note 16)
|
|
|
|
|
|
|
|||
|
Insurance recovery of legal settlement
|
(
|
)
|
|
|
|
|
|||
|
Legal settlement
|
|
|
|
|
|
|
|||
|
Charge on hedge roll and de-designation
|
|
|
|
|
|
|
|||
|
Other
|
|
|
|
|
|
|
|||
|
Total other income and charges
|
$
|
(
|
)
|
$
|
(
|
)
|
$
|
|
|
4
Net interest expense
|
(in millions of Canadian dollars)
|
2017
|
|
2016
|
|
2015
|
|
|||
|
Interest cost
|
$
|
|
|
$
|
|
|
$
|
|
|
|
Interest capitalized to Properties
|
(
|
)
|
(
|
)
|
(
|
)
|
|||
|
Interest expense
|
|
|
|
|
|
|
|||
|
Interest income
|
(
|
)
|
(
|
)
|
(
|
)
|
|||
|
Net interest expense
|
$
|
|
|
$
|
|
|
$
|
|
|
76
5
Income taxes
|
(in millions of Canadian dollars)
|
2017
|
|
2016
|
|
2015
|
|
|||
|
Current income tax expense
|
$
|
|
|
$
|
|
|
$
|
|
|
|
Deferred income tax expense
|
|
|
|
||||||
|
Origination and reversal of temporary differences
|
|
|
|
|
|
|
|||
|
Effect of tax rate (decrease) increase
|
(
|
)
|
|
|
|
|
|||
|
Effect of hedge of net investment in foreign subsidiaries
|
(
|
)
|
(
|
)
|
|
|
|||
|
Other
|
|
|
|
|
|
|
|||
|
Total deferred income tax (recovery) expense
|
(
|
)
|
|
|
|
|
|||
|
Total income taxes
|
$
|
|
|
$
|
|
|
$
|
|
|
|
Income before income tax expense
|
|
|
|
||||||
|
Canada
|
$
|
|
|
$
|
|
|
$
|
|
|
|
Foreign
|
|
|
|
|
|
|
|||
|
Total income before income tax expense
|
$
|
|
|
$
|
|
|
$
|
|
|
|
Income tax expense
|
|
|
|
||||||
|
Current
|
|
|
|
||||||
|
Canada
|
$
|
|
|
$
|
|
|
$
|
|
|
|
Foreign
|
|
|
|
|
|
|
|||
|
Total current income tax expense
|
|
|
|
|
|
|
|||
|
Deferred
|
|
|
|
||||||
|
Canada
|
|
|
|
|
|
|
|||
|
Foreign
|
(
|
)
|
|
|
|
|
|||
|
Total deferred income tax (recovery) expense
|
(
|
)
|
|
|
|
|
|||
|
Total income taxes
|
$
|
|
|
$
|
|
|
$
|
|
|
The provision for deferred income taxes arises from temporary differences in the carrying values of assets and liabilities for financial statement and income tax purposes and the effect of loss carry forwards.
The items comprising the deferred income tax assets and liabilities are as follows:
|
(in millions of Canadian dollars)
|
2017
|
|
2016
|
|
||
|
Deferred income tax assets
|
||||||
|
Amount related to tax losses carried forward
|
$
|
|
|
$
|
|
|
|
Liabilities carrying value in excess of tax basis
|
|
|
|
|
||
|
Environmental remediation costs
|
|
|
|
|
||
|
Other
|
|
|
|
|
||
|
Total deferred income tax assets
|
|
|
|
|
||
|
Deferred income tax liabilities
|
||||||
|
Properties carrying value in excess of tax basis
|
|
|
|
|
||
|
Pensions carrying value in excess of tax basis
(1)
|
|
|
|
|
||
|
Other
|
|
|
|
|
||
|
Total deferred income tax liabilities
|
|
|
|
|
||
|
Total net deferred income tax liabilities
|
$
|
|
|
$
|
|
|
77
The Company’s consolidated effective income tax rate differs from the expected Canadian statutory tax rates.
Expected income tax expense at statutory rates is reconciled to income tax expense as follows:
|
(in millions of Canadian dollars, except percentage)
|
2017
|
|
2016
|
|
2015
|
|
|||
|
Statutory federal and provincial income tax rate (Canada)
|
|
%
|
|
%
|
|
%
|
|||
|
Expected income tax expense at Canadian enacted statutory tax rates
|
$
|
|
|
$
|
|
|
$
|
|
|
|
Increase (decrease) in taxes resulting from:
|
|
|
|
||||||
|
(Gains) losses not subject to tax
|
(
|
)
|
(
|
)
|
|
|
|||
|
Canadian tax rate differentials
|
|
|
|
|
|
|
|||
|
Foreign tax rate differentials
|
(
|
)
|
|
|
|
|
|||
|
Effect of tax rate (decrease) increase
|
(
|
)
|
|
|
|
|
|||
|
Other
|
|
|
|
|
(
|
)
|
|||
|
Income tax expense
|
$
|
|
|
$
|
|
|
$
|
|
|
The Company has
no
unrecognized tax benefits from capital losses at
December 31, 2017
and
2016
.
On December 22, 2017, the U.S. enacted the “Tax Cuts and Jobs Act” which has been commonly referred to as U.S. tax reform. A significant change under this reform is the reduction of U.S. federal statutory corporate income tax rate from 35% to 21% beginning in 2018. As a result of this and other tax rate increases in the province of British Columbia and the state of Illinois, the Company revalued its deferred income tax balances accordingly. For the full year 2017, revaluations of deferred tax balances associated with changes in rates total a net recovery of
$
541
million
(2016 – $
nil
).
These recoveries are estimated based on the Company's analysis of the Tax Cuts and Jobs Act. These estimates may be impacted as U.S. authorities issue additional regulations and interpretations in the future.
The Company has not provided a deferred liability for the income taxes, if any, which might become payable on any temporary difference associated with its foreign investments because the Company intends to indefinitely reinvest in its foreign investments and has no intention to realize this difference by a sale of its interest in foreign investments. It is not practical to calculate the amount of the deferred tax liability.
At
December 31, 2017
, the Company had income tax operating losses carried forward of
$
11
million
, which have been recognized as a deferred tax asset. Certain of these losses carried forward will begin to expire in 2027, with the majority expiring between 2029 and 2035. The Company did
no
t have any minimum tax credits or investment tax credits carried forward.
It is more likely than not that the Company will realize the majority of its deferred income tax assets from the generation of future taxable income, as the payments for provisions, reserves and accruals are made and losses and tax credits carried forward are utilized.
|
(in millions of Canadian dollars)
|
2017
|
|
2016
|
|
2015
|
|
|||
|
Unrecognized tax benefits at January 1
|
$
|
|
|
$
|
|
|
$
|
|
|
|
Increase in unrecognized:
|
|
|
|
||||||
|
Tax benefits related to the current year
|
|
|
|
|
|
|
|||
|
Dispositions:
|
|
|
|
||||||
|
Gross uncertain tax benefits related to prior years
|
|
|
(
|
)
|
(
|
)
|
|||
|
Unrecognized tax benefits at December 31
|
$
|
|
|
$
|
|
|
$
|
|
|
If these uncertain tax positions were recognized, all of the amount of unrecognized tax positions as at
December 31, 2017
would impact the Company’s effective tax rate.
The Company recognizes accrued interest and penalties related to unrecognized tax benefits as a component of income tax expense in the Company’s Consolidated Statements of Income. The total amount of accrued interest and penalties in
2017
was
$
1
million
(
2016
–
$
1
million
;
2015
–
$
4
million
). The total amount of accrued interest and penalties associated with the unrecognized tax benefit at
December 31, 2017
was
$
11
million
(
2016
–
$
10
million
;
2015
–
$
9
million
).
The Company and its subsidiaries are subject to either Canadian federal and provincial income tax, U.S. federal, state and local income tax, or the relevant income tax in other international jurisdictions. The Company has substantially concluded all Canadian federal and provincial income tax matters for the years through 2012. The federal and provincial income tax returns filed for 2013
78
and subsequent years remain subject to examination by the Canadian taxation authorities. The Internal Revenue Service ("IRS") of the United States has completed their examinations and issued notices of deficiency for the tax years 2012 and 2013. The Company disagrees with many of their proposed adjustments, and is at the IRS Appeals for those years. The income tax returns for 2014 and subsequent years continue to remain subject to examination by the IRS. Additionally, various U.S. state tax authorities are examining the Company's state income tax returns for the years 2011 through 2015. The Company believes that it has recorded sufficient income tax reserves at
December 31, 2017
with respect to these income tax examinations.
6
Earnings per share
Basic earnings per share have been calculated using Net income for the year divided by the weighted average number of shares outstanding during the year.
Diluted earnings per share have been calculated using the treasury stock method which assumes that any proceeds received from the exercise of in-the-money options would be used to purchase CP Common Shares at the average market price for the period. For purposes of this calculation, at
December 31, 2017
, there were
1.4
million
dilutive options outstanding (
2016
–
2.2
million
;
2015
–
2.5
million
).
|
(in millions of Canadian dollars, except per share data)
|
2017
|
|
2016
|
|
2015
|
|
|||
|
Net income
|
$
|
|
|
$
|
|
|
$
|
|
|
|
Weighted average basic shares outstanding (millions)
|
|
|
|
|
|
|
|||
|
Dilutive effect of weighted average number of stock options (millions)
|
|
|
|
|
|
|
|||
|
Weighted average diluted shares outstanding (millions)
|
|
|
|
|
|
|
|||
|
Earnings per share – basic
|
$
|
|
|
$
|
|
|
$
|
|
|
|
Earnings per share – diluted
|
$
|
|
|
$
|
|
|
$
|
|
|
79
7
Other comprehensive income (loss) and accumulated other comprehensive loss
|
(in millions of Canadian dollars)
|
Before
tax amount |
|
Income tax (expense) recovery
|
|
Net of tax
amount |
|
|||
|
For the year ended December 31, 2017
|
|||||||||
|
Unrealized foreign exchange (loss) gain on:
|
|||||||||
|
Translation of the net investment in U.S. subsidiaries
|
$
|
(
|
)
|
$
|
|
|
$
|
(
|
)
|
|
Translation of the U.S. dollar-denominated long-term debt designated as a hedge of the net investment in U.S. subsidiaries (Note 17)
|
|
|
(
|
)
|
|
|
|||
|
Change in derivatives designated as cash flow hedges:
|
|
|
|
||||||
|
Realized loss on cash flow hedges recognized in income
|
|
|
(
|
)
|
|
|
|||
|
Unrealized loss on cash flow hedges
|
(
|
)
|
|
|
(
|
)
|
|||
|
Change in pension and other benefits actuarial gains and losses
|
|
|
(
|
)
|
|
|
|||
|
Change in prior service pension and other benefit costs
|
(
|
)
|
|
|
(
|
)
|
|||
|
Other comprehensive income
|
$
|
|
|
$
|
(
|
)
|
$
|
|
|
|
For the year ended December 31, 2016
|
|||||||||
|
Unrealized foreign exchange (loss) gain on:
|
|||||||||
|
Translation of the net investment in U.S. subsidiaries
|
$
|
(
|
)
|
$
|
|
|
$
|
(
|
)
|
|
Translation of the U.S. dollar-denominated long-term debt designated as a hedge of the net investment in U.S. subsidiaries (Note 17)
|
|
|
(
|
)
|
|
|
|||
|
Change in derivatives designated as cash flow hedges:
|
|
|
|
||||||
|
Realized loss on cash flow hedges recognized in income
|
|
|
(
|
)
|
|
|
|||
|
Unrealized loss on cash flow hedges
|
(
|
)
|
|
|
(
|
)
|
|||
|
Change in pension and other benefits actuarial gains and losses
|
(
|
)
|
|
|
(
|
)
|
|||
|
Change in prior service pension and other benefit costs
|
(
|
)
|
|
|
(
|
)
|
|||
|
Other comprehensive loss
|
$
|
(
|
)
|
$
|
|
|
$
|
(
|
)
|
|
For the year ended December 31, 2015
|
|||||||||
|
Unrealized foreign exchange gain (loss) on:
|
|||||||||
|
Translation of the net investment in U.S. subsidiaries
|
$
|
|
|
$
|
|
|
$
|
|
|
|
Translation of the U.S. dollar-denominated long-term debt designated as a hedge of the net investment in U.S. subsidiaries (Note 17)
|
(
|
)
|
|
|
(
|
)
|
|||
|
Change in derivatives designated as cash flow hedges:
|
|||||||||
|
Realized loss on cash flow hedges recognized in income
|
|
|
(
|
)
|
|
|
|||
|
Unrealized loss on cash flow hedges
|
(
|
)
|
|
|
(
|
)
|
|||
|
Change in pension and other benefits actuarial gains and losses
|
|
|
(
|
)
|
|
|
|||
|
Change in prior service pension and other benefit costs
|
|
|
|
|
|
|
|||
|
Other comprehensive income
|
$
|
|
|
$
|
(
|
)
|
$
|
|
|
80
|
(in millions of Canadian dollars)
|
2017
|
|
2016
|
|
||
|
Unrealized foreign exchange gain on translation of the net investment in U.S. subsidiaries
|
$
|
|
|
$
|
|
|
|
Unrealized foreign exchange loss on translation of the U.S. dollar-denominated long-term debt designated as a hedge of the net investment in U.S. subsidiaries
|
(
|
)
|
(
|
)
|
||
|
Net deferred and unrealized losses on derivatives
|
(
|
)
|
(
|
)
|
||
|
Amounts for defined benefit pension and other post-retirement plans not recognized in income (Note 20)
|
(
|
)
|
(
|
)
|
||
|
Equity accounted investments
|
(
|
)
|
(
|
)
|
||
|
Accumulated other comprehensive loss
|
$
|
(
|
)
|
$
|
(
|
)
|
|
(in millions of Canadian dollars)
|
Foreign currency
net of hedging activities (1) |
|
Derivatives and
other (1) |
|
Pension and post-
retirement defined benefit plans (1) |
|
Total
(1)
|
|
||||
|
Opening balance, 2017
|
$
|
|
|
$
|
(
|
)
|
$
|
(
|
)
|
$
|
(
|
)
|
|
Other comprehensive loss before reclassifications
|
(
|
)
|
(
|
)
|
(
|
)
|
(
|
)
|
||||
|
Amounts reclassified from accumulated other comprehensive loss
|
(
|
)
|
|
|
|
|
|
|
||||
|
Net current-period other comprehensive (loss) income
|
(
|
)
|
|
|
|
|
|
|
||||
|
Closing balance, 2017
|
$
|
|
|
$
|
(
|
)
|
$
|
(
|
)
|
$
|
(
|
)
|
|
Opening balance, 2016
|
$
|
|
|
$
|
(
|
)
|
$
|
(
|
)
|
$
|
(
|
)
|
|
Other comprehensive loss before reclassifications
|
(
|
)
|
(
|
)
|
(
|
)
|
(
|
)
|
||||
|
Amounts reclassified from accumulated other comprehensive loss
|
|
|
|
|
|
|
|
|
||||
|
Net current-period other comprehensive loss
|
(
|
)
|
(
|
)
|
(
|
)
|
(
|
)
|
||||
|
Closing balance, 2016
|
$
|
|
|
$
|
(
|
)
|
$
|
(
|
)
|
$
|
(
|
)
|
|
2017
|
|
2016
|
|
|||
|
Amortization of prior service costs
(1)
|
$
|
(
|
)
|
$
|
(
|
)
|
|
Recognition of net actuarial loss
(1)
|
|
|
|
|
||
|
Total before income tax
|
$
|
|
|
$
|
|
|
|
Income tax recovery
|
(
|
)
|
(
|
)
|
||
|
Net of income tax
|
$
|
|
|
$
|
|
|
8
Change in non-cash working capital balances related to operations
|
(in millions of Canadian dollars)
|
2017
|
|
2016
|
|
2015
|
|
|||
|
(Use) source of cash:
|
|||||||||
|
Accounts receivable, net
|
$
|
(
|
)
|
$
|
|
|
$
|
|
|
|
Materials and supplies
|
|
|
|
|
|
|
|||
|
Other current assets
|
(
|
)
|
(
|
)
|
|
|
|||
|
Accounts payable and accrued liabilities
|
(
|
)
|
(
|
)
|
|
|
|||
|
Change in non-cash working capital
|
$
|
(
|
)
|
$
|
(
|
)
|
$
|
|
|
81
9
Accounts receivable, net
|
(in millions of Canadian dollars)
|
2017
|
|
2016
|
|
||
|
Freight
|
$
|
|
|
$
|
|
|
|
Non-freight
|
|
|
|
|
||
|
|
|
|
|
|
||
|
Allowance for doubtful accounts
|
(
|
)
|
(
|
)
|
||
|
Total accounts receivable, net
|
$
|
|
|
$
|
|
|
10
Dispositions of properties
Gain on sale of Obico
During the fourth quarter of 2016, the Company completed the sale of its Obico rail yard, for gross proceeds of
$
38
million
. The Company recorded a gain on sale of
$
37
million
(
$
33
million
after tax) within "Purchased services and other" from the transaction.
Gain on sale of Arbutus Corridor
In March 2016, the Company completed the sale of CP’s Arbutus Corridor (the “Arbutus Corridor”) to the City of Vancouver for gross proceeds of
$
55
million
. The agreement allows the Company to share in future proceeds on the eventual development and/or sale of certain parcels of the Arbutus Corridor. The Company recorded a gain on sale of
$
50
million
(
$
43
million
after tax) within "Purchased services and other" from the transaction during the first quarter of 2016.
Gain on sale of Delaware & Hudson South
During the first quarter of 2015, the Company finalized a sales agreement with Norfolk Southern Corporation ("NS") for approximately 283 miles of the Delaware and Hudson Railway Company, Inc.'s line between Sunbury, Pennsylvania, and Schenectady, New York ("D&H South"). The sale, which received approval by the U.S. Surface Transportation Board (“STB”) on May 15, 2015, was completed on September 18, 2015 for proceeds of
$
281
million
(U.S.
$
214
million
). The Company recorded a gain on sale of
$
68
million
(
$
42
million
after tax) from the transaction during the third quarter of 2015.
Gain on settlement of legal proceedings related to the purchase and sale of a building
In 2013, CP provided an interest-free loan pursuant to a court order to a corporation owned by a court appointed trustee (“the judicial trustee”) to facilitate the acquisition of a building. The building was held in trust during the legal proceedings with regard to CP’s entitlement to an exercised purchase option of the building (“purchase option”). As at December 31, 2014, the loan of
$
20
million
and the purchase option with a carrying value of
$
8
million
, were recorded as “Other assets” in the Company’s Consolidated Balance Sheets.
In the first quarter of 2015, CP reached a settlement with a third party that, following the sale of the building to an arm’s-length third party, resulted in resolution of legal proceedings. CP received
$
59
million
for the sale of the building which included repayment of the aforementioned loan to the judicial trustee. A gain of
$
31
million
(
$
27
million
after tax) was recorded as a credit within “Purchased services and other”.
11
Investments
|
(in millions of Canadian dollars)
|
2017
|
|
2016
|
|
||
|
Rail investments accounted for on an equity basis
|
$
|
|
|
$
|
|
|
|
Other investments
|
|
|
|
|
||
|
Total investments
|
$
|
|
|
$
|
|
|
82
12
Properties
|
(in millions of Canadian dollars except percentages)
|
2017
|
2017
|
2016
|
||||||||||||||||||||||||
|
Weighted average annual depreciation rate
|
|
Cost
|
|
Accumulated
depreciation |
|
Net book
value |
|
Cost
|
|
Accumulated
depreciation |
|
Net book
value |
|
||||||||||||||
|
Track and roadway
|
|
%
|
$
|
|
|
$
|
|
|
$
|
|
|
$
|
|
|
$
|
|
|
$
|
|
|
|||||||
|
Buildings
|
|
%
|
|
|
|
|
|
|
|
|
|
|
|
|
|||||||||||||
|
Rolling stock
|
|
%
|
|
|
|
|
|
|
|
|
|
|
|
|
|||||||||||||
|
Information systems
(1)
|
|
%
|
|
|
|
|
|
|
|
|
|
|
|
|
|||||||||||||
|
Other
|
|
%
|
|
|
|
|
|
|
|
|
|
|
|
|
|||||||||||||
|
Total
|
|
$
|
|
|
$
|
|
|
$
|
|
|
$
|
|
|
$
|
|
|
$
|
|
|
||||||||
Capital leases included in properties
|
(in millions of Canadian dollars)
|
2017
|
2016
|
||||||||||||||||
|
Cost
|
|
Accumulated
depreciation |
|
Net book
value |
|
Cost
|
|
Accumulated
depreciation |
|
Net book
value |
|
|||||||
|
Buildings
|
$
|
|
|
$
|
|
|
$
|
|
|
$
|
|
|
$
|
|
|
$
|
|
|
|
Rolling stock
|
|
|
|
|
|
|
|
|
|
|
|
|
||||||
|
Total assets held under capital lease
|
$
|
|
|
$
|
|
|
$
|
|
|
$
|
|
|
$
|
|
|
$
|
|
|
13
Goodwill and intangible assets
|
Goodwill
|
Intangible assets
|
|||||||||||||||
|
(in millions of Canadian dollars)
|
Net
carrying amount |
|
Cost
|
|
Accumulated
amortization |
|
Net
carrying amount |
|
Total goodwill and intangible assets
|
|
||||||
|
Balance at December 31, 2015
|
$
|
|
|
$
|
|
|
$
|
(
|
)
|
$
|
|
|
$
|
|
|
|
|
Amortization
|
|
|
—
|
|
(
|
)
|
(
|
)
|
(
|
)
|
||||||
|
Foreign exchange impact
|
(
|
)
|
—
|
|
(
|
)
|
(
|
)
|
(
|
)
|
||||||
|
Balance at December 31, 2016
|
$
|
|
|
$
|
|
|
$
|
(
|
)
|
$
|
|
|
$
|
|
|
|
|
Amortization
|
|
|
—
|
|
(
|
)
|
(
|
)
|
(
|
)
|
||||||
|
Foreign exchange impact
|
(
|
)
|
—
|
|
(
|
)
|
(
|
)
|
(
|
)
|
||||||
|
Balance at December 31, 2017
|
$
|
|
|
$
|
|
|
$
|
(
|
)
|
$
|
|
|
$
|
|
|
|
14
Other assets
|
(in millions of Canadian dollars)
|
2017
|
|
2016
|
|
||
|
Long-term materials
|
$
|
|
|
$
|
|
|
|
Prepaid leases
|
|
|
|
|
||
|
Unamortized fees on credit facility
|
|
|
|
|
||
|
Contracted customer incentives
|
|
|
|
|
||
|
Long-term receivables
|
|
|
|
|
||
|
Other
|
|
|
|
|
||
|
Total other assets
|
$
|
|
|
$
|
|
|
83
15
Accounts payable and accrued liabilities
|
(in millions of Canadian dollars)
|
2017
|
|
2016
|
|
||
|
Trade payables
|
$
|
|
|
$
|
|
|
|
Accrued charges
|
|
|
|
|
||
|
Income and other taxes payable
|
|
|
|
|
||
|
Accrued interest
|
|
|
|
|
||
|
Financial derivative liability (Note 17)
|
|
|
|
|
||
|
Payroll-related accruals
|
|
|
|
|
||
|
Accrued vacation
|
|
|
|
|
||
|
Dividends payable
|
|
|
|
|
||
|
Personal injury and other claims provision
|
|
|
|
|
||
|
Provision for environmental remediation (Note 18)
|
|
|
|
|
||
|
Stock-based compensation liabilities
|
|
|
|
|
||
|
Other
|
|
|
|
|
||
|
Total accounts payable and accrued liabilities
|
$
|
|
|
$
|
|
|
84
16
Debt
|
(in millions of Canadian dollars except percentages)
|
Maturity
|
Currency
in which payable |
2017
|
|
2016
|
|
||||
|
|
10-year Notes
|
(A)
|
May 2018
|
|
$
|
|
|
$
|
|
|
|
|
10-year Medium Term Notes
|
(A)
|
Jun 2018
|
|
|
|
|
|
||
|
|
10-year Notes
|
(A)
|
May 2019
|
|
|
|
|
|
||
|
|
30-year Debentures
|
(A)
|
Aug 2021
|
|
|
|
|
|
||
|
|
10-year Medium Term Notes
|
(A)
|
Jan 2022
|
|
|
|
|
|
||
|
|
10-year Notes
|
(A)
|
Jan 2022
|
|
|
|
|
|
||
|
|
12.5-year Notes
|
(A)
|
Mar 2023
|
|
|
|
|
|
||
|
|
10-year Notes
|
(A)
|
Feb 2025
|
|
|
|
|
|
||
|
|
10.5-year Notes
|
(A)
|
Feb 2026
|
|
|
|
|
|
||
|
|
30-year Debentures
|
(A)
|
Oct 2031
|
|
|
|
|
|
||
|
|
30-year Debentures
|
(A)
|
Mar 2033
|
|
|
|
|
|
||
|
|
20-year Notes
|
(A)
|
Sep 2035
|
|
|
|
|
|
||
|
|
30-year Notes
|
(A)
|
May 2037
|
|
|
|
|
|
||
|
|
30-year Notes
|
(A)
|
Nov 2039
|
|
|
|
|
|
||
|
|
30-year Notes
|
(A)
|
Jan 2042
|
|
|
|
|
|
||
|
|
30-year Notes
|
(A)
|
Aug 2045
|
|
|
|
|
|
||
|
|
100-year Notes
|
(A)
|
Sep 2115
|
|
|
|
|
|
||
|
|
Senior Secured Notes
|
(B)
|
Mar 2024
|
|
|
|
|
|
||
|
|
Secured Equipment Notes
|
(C)
|
Oct 2024
|
|
|
|
|
|
||
|
|
Equipment Trust Certificates
|
(D)
|
Jan 2021
|
|
|
|
|
|
||
|
Obligations under capital leases
|
|
|
|
|
||||||
|
6.57% – 6.99%
|
(E)
|
2022 – 2026
|
|
|
|
|
|
|||
|
12.77%
|
(E)
|
Jan 2031
|
|
|
|
|
|
|||
|
|
|
|
|
|
|
|
||||
|
Perpetual 4% Consolidated Debenture Stock
|
(F)
|
|
|
|
|
|
|
|||
|
Perpetual 4% Consolidated Debenture Stock
|
(F)
|
|
|
|
|
|
|
|||
|
|
|
|
|
|
|
|
||||
|
Less: Unamortized fees on long-term debt
|
|
|
|
|
|
|
||||
|
|
|
|
|
|
|
|
||||
|
Less: Long-term debt maturing within one year
|
|
|
|
|
|
|
||||
|
|
|
|
|
|
$
|
|
|
$
|
|
|
At
December 31, 2017
, the gross amount of long-term debt denominated in U.S. dollars was U.S.
$
5,755
million (
2016
– U.S.
$
5,763
million).
Annual maturities and principal repayment requirements, excluding those pertaining to capital leases, for each of the five years following
2017
are (in millions):
2018
–
$
742
;
2019
–
$
462
;
2020
–
$
63
;
2021
–
$
353
;
2022
–
$
466
.
Fees on long-term debt are amortized to income over the term of the related debt.
A. These debentures and notes pay interest semi-annually and are unsecured, but carry a negative pledge.
B. The
5.41
%
Senior Secured Notes are collateralized by specific locomotive units with a carrying value of
$
118
million
at December 31,
2017
. The Company pays equal blended semi-annual payments of principal and interest. Final repayment of the remaining principal of U.S.
$
44
million
is due in March 2024.
C. The
6.91
%
Secured Equipment Notes are full recourse obligations of the Company collateralized by a first charge on specific locomotive units with a carrying value of
$
107
million
at December 31,
2017
. The Company pays equal blended semi-annual payments of principal and interest. Final repayment of the remaining principal of
$
11
million
is due in October 2024.
85
D. The
7.49
%
Equipment Trust Certificates are secured by specific locomotive units with a carrying value of
$
104
million
at December 31,
2017
. The Company makes semi-annual payments that vary in amount and are interest-only payments or blended principal and interest payments. Final repayment of the remaining principal of U.S.
$
11
million
is due in January 2021.
E.
At
December 31, 2017
, capital lease obligations included in long-term debt were as follows:
|
(in millions of Canadian dollars)
|
Year
|
Capital leases
|
|
|
|
Minimum lease payments in:
|
|
|||
|
|
2018
|
$
|
|
|
|
|
2019
|
|
|
|
|
|
2020
|
|
|
|
|
|
2021
|
|
|
|
|
|
2022
|
|
|
|
|
|
Thereafter
|
|
|
|
|
Total minimum lease payments
|
|
|
||
|
Less: Imputed interest
|
(
|
)
|
||
|
Present value of minimum lease payments
|
|
|
||
|
Less: Current portion
|
(
|
)
|
||
|
Long-term portion of capital lease obligations
|
|
$
|
|
|
During the years ended
2017
,
2016
, and
2015
, the Company had
no
additions to property, plant and equipment under capital lease obligations.
The carrying value of the assets collateralizing the capital lease obligations was
$
196
million
at
December 31, 2017
.
F. The Consolidated Debenture Stock, authorized by an Act of Parliament of 1889, constitutes a first charge upon and over the whole of the undertaking, railways, works, rolling stock, plant, property and effects of the Company, with certain exceptions.
Credit facility
CP has a revolving credit facility (the “facility”) agreement with 16 highly rated financial institutions for a commitment amount of U.S.
$
2.0
billion
. The facility includes a U.S.
$
1.0
billion
one-year plus one-year term-out portion and a U.S.
$
1.0
billion
five-year portion. The facility can accommodate draws of cash and/or letters of credit at market competitive pricing. The agreement requires the Company not to exceed a maximum debt to earnings before interest, tax, depreciation, and amortization ratio. As at December 31,
2017
and
2016
, the Company was in compliance with all terms and conditions of the credit facility arrangements and satisfied the threshold stipulated in this financial covenant.
Effective June 23, 2017, the Company extended the maturity date by one year on its existing revolving U.S.
$
2.0
billion
credit facility, which includes a U.S.
$
1.0
billion
five-year portion and U.S.
$
1.0
billion
one-year plus one-year term-out portion. The maturity date on the first U.S.
$
1.0
billion
tranche was extended to
June 27, 2019
; the maturity date on the second U.S.
$
1.0
billion
tranche was extended to
June 28, 2022
.
As at December 31,
2017
and
2016
, the facility was undrawn. The amount available under the terms of the credit facility was U.S.
$
2.0
billion
at December 31,
2017
(December 31,
2016
– U.S.
$
2.0
billion
).
The Company also has a commercial paper program which enables it to issue commercial paper up to a maximum aggregate principal amount of U.S.
$
1.0
billion
in the form of unsecured promissory notes. The commercial paper program is backed by the U.S.
$
1.0
billion
one-year plus one-year term-out portion of the revolving credit facility. As at December 31,
2017
, the Company had
no
commercial paper borrowings outstanding (December 31,
2016
– $
nil
).
86
17
Financial instruments
A. Fair values of financial instruments
The Company categorizes its financial assets and liabilities measured at fair value into a three-level hierarchy established by GAAP that prioritizes those inputs to valuation techniques used to measure fair value based on the degree to which they are observable. The three levels of the fair value hierarchy are as follows: Level 1 inputs are quoted prices in active markets for identical assets and liabilities; Level 2 inputs, other than quoted prices included within Level 1, are observable for the asset or liability either directly or indirectly; and Level 3 inputs are not observable in the market.
When possible, the estimated fair value is based on quoted market prices and, if not available, it is based on estimates from third-party brokers. For non-exchange traded derivatives classified in Level 2, the Company uses standard valuation techniques to calculate fair value. Primary inputs to these techniques include observable market prices (interest, FX and commodity) and volatility, depending on the type of derivative and nature of the underlying risk. The Company uses inputs and data used by willing market participants when valuing derivatives and considers its own credit default swap spread as well as those of its counterparties in its determination of fair value. All derivatives and long-term debt are classified as Level 2.
|
(in millions of Canadian dollars)
|
December 31, 2017
|
|
December 31, 2016
|
|
||
|
Long-term debt (including current maturities):
|
||||||
|
Fair value
|
$
|
|
|
$
|
|
|
|
Carrying value
|
|
|
|
|
||
The estimated fair value of current and long-term borrowings has been determined based on market information where available, or by discounting future payments of principal and interest at estimated interest rates expected to be available to the Company at period end. As at
December 31, 2017
and
2016
, the Company did not have any deposits in the form of short-term investments with financial institutions.
B. Financial risk management
Derivative financial instruments
Derivative financial instruments may be used to selectively reduce volatility associated with fluctuations in interest rates, FX rates, the price of fuel and stock-based compensation expense. Where derivatives are designated as hedging instruments, the relationship between the hedging instruments and their associated hedged items is documented, as well as the risk management objective and strategy for the use of the hedging instruments. This documentation includes linking the derivatives that are designated as fair value or cash flow hedges to specific assets or liabilities on the Consolidated Balance Sheets, commitments or forecasted transactions. At the time a derivative contract is entered into and at least quarterly thereafter, an assessment is made as to whether the derivative item is effective in offsetting the changes in fair value or cash flows of the hedged items. The derivative qualifies for hedge accounting treatment if it is effective in substantially mitigating the risk it was designed to address.
It is not the Company’s intent to use financial derivatives or commodity instruments for trading or speculative purposes.
Credit risk management
Credit risk refers to the possibility that a customer or counterparty will fail to fulfill its obligations under a contract and as a result create a financial loss for the Company.
The railway industry predominantly serves financially established customers, and the Company has experienced limited financial losses with respect to credit risk. The credit worthiness of customers is assessed using credit scores supplied by a third party, and through direct monitoring of their financial well-being on a continual basis. The Company establishes guidelines for customer credit limits and should thresholds in these areas be reached, appropriate precautions are taken to improve collectability.
Counterparties to financial instruments expose the Company to credit losses in the event of non-performance. Counterparties for derivative and cash transactions are limited to high credit quality financial institutions, which are monitored on an ongoing basis. Counterparty credit assessments are based on the financial health of the institutions and their credit ratings from external agencies. The Company does not anticipate non-performance that would materially impact the Company’s financial statements. In addition, the Company believes there are no significant concentrations of credit risk.
87
FX management
The Company conducts business transactions and owns assets in both Canada and the United States. As a result, the Company is exposed to fluctuations in the value of financial commitments, assets, liabilities, income or cash flows due to changes in FX rates. The Company may enter into FX risk management transactions primarily to manage fluctuations in the exchange rate between Canadian and U.S. currencies. FX exposure is primarily mitigated through natural offsets created by revenues, expenditures and balance sheet positions incurred in the same currency. Where appropriate, the Company may negotiate with customers and suppliers to reduce the net exposure.
Occasionally the Company may enter into short-term FX forward contracts as part of its cash management strategy.
Net investment hedge
The FX gains and losses on long-term debt are mainly unrealized and can only be realized when U.S. dollar-denominated long-term debt matures or is settled. The Company also has long-term FX exposure on its investment in U.S. affiliates. The majority of the Company’s U.S. dollar-denominated long-term debt has been designated as a hedge of the net investment in foreign subsidiaries. This designation has the effect of mitigating volatility on Net income by offsetting long-term FX gains and losses on U.S. dollar-denominated long-term debt and gains and losses on its net investment. The effective portion recognized in “Other comprehensive income” in
2017
was an FX gain of
$
319
million
, the majority of which was unrealized (
2016
– unrealized gain of
$
150
million
;
2015
– unrealized loss of
$
757
million
) (see Note 7). There was
no
ineffectiveness during
2017
(
2016
– $
nil
;
2015
– $
nil
).
FX forward contracts
The Company may enter into FX forward contracts to lock-in the amount of Canadian dollars it has to pay on U.S. dollar-denominated debt maturities.
At
December 31, 2017
, the Company had a negligible amount of net unamortized gains related to FX forward contracts to fix the exchange rate on U.S. dollar-denominated debt maturities settled in previous years (
December 31, 2016
–
$
1
million
). During
2017
,
$
1
million
of pretax gain related to these previously settled derivatives has been amortized from "Accumulated other comprehensive loss" to “Other income and charges” (
December 31, 2016
–
$
1
million
). The Company expects that during the next 12 months, a negligible amount of pretax gain will be reclassified to “Other income and charges”.
At
December 31, 2017
and
2016
, the Company had no remaining FX forward contracts to fix the exchange rate on U.S. dollar-denominated debt maturities.
Interest rate management
The Company is exposed to interest rate risk, which is the risk that the fair value or future cash flows of a financial instrument will vary as a result of changes in market interest rates. In order to manage funding needs or capital structure goals, the Company enters into debt or capital lease agreements that are subject to either fixed market interest rates set at the time of issue or floating rates determined by ongoing market conditions. Debt subject to variable interest rates exposes the Company to variability in interest expense, while debt subject to fixed interest rates exposes the Company to variability in the fair value of debt.
To manage interest rate exposure, the Company accesses diverse sources of financing and manages borrowings in line with a targeted range of capital structure, debt ratings, liquidity needs, maturity schedule, and currency and interest rate profiles. In anticipation of future debt issuances, the Company may enter into forward rate agreements, that are designated as cash flow hedges, to substantially lock in all or a portion of the effective future interest expense. The Company may also enter into swap agreements, designated as fair value hedges, to manage the mix of fixed and floating rate debt.
Forward starting swaps
As at
December 31, 2017
, the Company had forward starting floating-to-fixed interest rate swap agreements (“forward starting swaps”) totalling a notional amount of U.S.
$
500
million
to fix the benchmark rate on cash flows associated with highly probable forecasted issuances of long-term notes (December 31,
2016
– U.S.
$
700
million
). The effective portion of changes in fair value on the forward starting swaps is recorded in “Accumulated other comprehensive loss”, net of tax, as cash flow hedges until the highly probable forecasted notes are issued. Subsequent to the notes issuance, amounts in “Accumulated other comprehensive loss” are reclassified to “Net interest expense”.
During the second quarter of 2016, the Company de-designated a notional amount of U.S.
$
700
million
of forward starting swaps. The Company did not cash settle these swaps, and there was no ineffectiveness to record upon de-designation. Concurrently, the Company re-designated and rolled the forward starting swaps totalling U.S.
$
700
million
to fix the benchmark rate on cash flows associated with a highly probable forecasted debt issuance of long-term notes.
During the second quarter of 2017, the Company de-designated the hedging relationship for U.S.
$
700
million
of forward starting swaps. The Company settled a notional amount of U.S.
$
200
million
of forward starting swaps for a cash payment of
88
U.S.
$
16
million
(
$
22
million
). The Company rolled the remaining notional amount of U.S.
$
500
million
of forward starting swaps and did not cash settle these swaps. The impact of the U.S.
$
200
million
settlement and U.S.
$
500
million
roll of the forward starting swaps was a charge of
$
13
million
to "Other income and charges" on the Company's Consolidated Statements of Income. Concurrently, the Company re-designated the forward starting swaps totalling U.S.
$
500
million
to fix the benchmark rate on cash flows associated with highly probable forecasted issuances of long-term notes.
As at
December 31, 2017
, the total fair value loss of
$
55
million
(
December 31, 2016
– fair value loss of
$
69
million
) derived from the forward starting swaps was included in “Accounts payable and accrued liabilities”. Changes in fair value from the forward starting swaps
for the year ended December 31, 2017
was a loss of
$
8
million
(
2016
– a loss of
$
9
million
). The effective portion
for the year ended December 31, 2017
was a loss of
$
7
million
(
2016
– loss of
$
12
million
) and was recorded in “Other comprehensive income”. In addition to the charge on hedge roll and de-designation, for the year ended
December 31, 2017
, an ineffectiveness loss of
$
1
million
(
2016
– gain of
$
3
million
) was recorded in “Net interest expense” on the Consolidated Statements of Income.
For the year ended December 31, 2017
, a loss of
$
11
million
related to previous forward starting swap hedges has been amortized to “Net interest expense” (
2016
– a loss of
$
11
million
). The Company expects that during the next 12 months,
$
12
million
of losses will be amortized to “Net interest expense”.
Treasury rate locks
At
December 31, 2017
, the Company had net unamortized losses related to interest rate locks, which are accounted for as cash flow hedges, settled in previous years totalling
$
20
million
(
December 31, 2016
–
$
21
million
). This amount is composed of various unamortized gains and losses related to specific debts which are reflected in “Accumulated other comprehensive loss” and are amortized to “Net interest expense” in the period that interest on the related debt is charged. The amortization of these gains and losses resulted in a
$
1
million
increase to “Net interest expense” and “Other comprehensive income” in
2017
(
2016
– negligible;
2015
– negligible). The Company expects that during the next 12 months, a net loss of
$
1
million
related to these previously settled derivatives will be reclassified to “Net interest expense”.
Fuel price management
The Company is exposed to commodity risk related to purchases of diesel fuel and the potential reduction in Net income due to increases in the price of diesel. Fuel expense constitutes a large portion of the Company’s operating costs and volatility in diesel fuel prices can have a significant impact on the Company’s income. Items affecting volatility in diesel prices include, but are not limited to, fluctuations in world markets for crude oil and distillate fuels, which can be affected by supply disruptions and geopolitical events.
18
Other long-term liabilities
|
(in millions of Canadian dollars)
|
2017
|
|
2016
|
|
||
|
Provision for environmental remediation, net of current portion
(1)
|
$
|
|
|
$
|
|
|
|
Stock-based compensation liabilities, net of current portion
|
|
|
|
|
||
|
Deferred revenue on rights-of-way license agreements, net of current portion
(2)
|
|
|
|
|
||
|
Deferred retirement compensation
|
|
|
|
|
||
|
Deferred gains on sale leaseback transactions
(2)
|
|
|
|
|
||
|
Other, net of current portion
|
|
|
|
|
||
|
Total other long-term liabilities
|
$
|
|
|
$
|
|
|
(1)
As at December 31, 2017
, the aggregate provision for environmental remediation, including the current portion was
$
78
million
(
2016
–
$
85
million
).
(2)
The deferred revenue on rights-of-way license agreements, and deferred gains on sale leaseback transactions are being amortized to income on a straight-line basis over the related lease terms.
Environmental remediation accruals
Environmental remediation accruals cover site-specific remediation programs. The estimate of the probable costs to be incurred in the remediation of properties contaminated by past railway use reflects the nature of contamination at individual sites according to typical activities and scale of operations conducted. CP has developed remediation strategies for each property based on the nature and extent of the contamination, as well as the location of the property and surrounding areas that may be adversely affected by the presence of contaminants, considering available technologies, treatment and disposal facilities and the acceptability of site-specific plans based on the local regulatory environment. Site-specific plans range from containment and risk management of the
89
contaminants through to the removal and treatment of the contaminants and affected soils and groundwater. The details of the estimates reflect the environmental liability at each property. Provisions for environmental remediation costs are recorded in “Other long-term liabilities”, except for the current portion which is recorded in “Accounts payable and accrued liabilities” (see Note 15). Payments are expected to be made over
10
years to 2027.
19
Shareholders’ equity
Authorized and issued share capital
The Company is authorized to issue an unlimited number of Common Shares, an unlimited number of First Preferred Shares and an unlimited number of Second Preferred Shares. At
December 31, 2017
,
no
First or Second Preferred Shares had been issued.
The following table summarizes information related to
Common Share balances as at December 31:
|
(number of shares in millions)
|
2017
|
|
2016
|
|
2015
|
|
|
Share capital, January 1
|
|
|
|
|
|
|
|
CP Common Shares repurchased
|
(
|
)
|
(
|
)
|
(
|
)
|
|
Shares issued under stock option plan
|
|
|
|
|
|
|
|
Share capital, December 31
|
|
|
|
|
|
|
The change in the “Share capital” balances includes $
nil
related to the cancellation of the tandem share appreciation rights liability on exercise of tandem stock options (
2016
–
$
1
million
;
2015
–
$
2
million
), and
$
12
million
of stock-based compensation transferred from “Additional paid-in capital” (
2016
–
$
5
million
;
2015
–
$
10
million
).
Share repurchase
On March 11, 2014, the Company announced a new share repurchase program to implement a normal course issuer bid (“NCIB”) to purchase, for cancellation, up to
5.3
million
Common Shares before
March 16, 2015
. On September 29, 2014, the Company announced the amendment of the bid to increase the maximum number of its Common Shares that may be purchased from
5.3
million
to
12.7
million
of its outstanding Common Shares. The Company completed the purchase of
10.5
million Common Shares in 2014. An additional
2.2
million
Common Shares were purchased for
$
490
million
in the first quarter of 2015 prior to the March 16, 2015 expiry date of the program.
On March 16, 2015, the Company announced the renewal of its NCIB, commencing March 18, 2015, to purchase up to
9.1
million of its outstanding Common Shares for cancellation before
March 17, 2016
. On August 31, 2015, the Company amended the NCIB to increase the maximum number of its Common Shares that may be purchased from
9.1
million
to
11.9
million
of its outstanding Common Shares. As at December 31, 2015, the Company had purchased
11.3
million
Common Shares for
$
2,258
million
under this NCIB program.
On April 20, 2016, the Company announced a new NCIB, commencing May 2, 2016 to
May 1, 2017
, to purchase up to
6.9
million
of its outstanding Common Shares for cancellation. The Company completed this NCIB on September 28, 2016.
On May 10, 2017, the Company announced a new NCIB, commencing May 15, 2017, to purchase up to
4.38
million
Common Shares for cancellation before
May 14, 2018
. As at December 31, 2017, the Company had purchased
1.9
million
Common Shares for
$
381
million
under this NCIB program.
All purchases are made in accordance with the respective NCIB at prevalent market prices plus brokerage fees, or such other prices that may be permitted by the Toronto Stock Exchange, with consideration allocated to share capital up to the average carrying amount of the shares, and any excess allocated to "Retained earnings".
90
|
|
2017
|
|
2016
|
|
2015
|
|
|||
|
Number of Common Shares repurchased
|
|
|
|
|
|
|
|||
|
Weighted-average price per share
(1)
|
$
|
|
|
$
|
|
|
$
|
|
|
|
Amount of repurchase (in millions)
(1)
|
$
|
|
|
$
|
|
|
$
|
|
|
20
Pensions and other benefits
The Company has both defined benefit (“DB”) and defined contribution (“DC”) pension plans. At
December 31, 2017
, the Canadian pension plans represent approximately
99
%
of total combined pension plan assets and approximately
98
%
of total combined pension plan obligations.
The DB plans provide for pensions based principally on years of service and compensation rates near retirement. Pensions for Canadian pensioners are partially indexed to inflation. Annual employer contributions to the DB plans, which are actuarially determined, are made on the basis of being not less than the minimum amounts required by federal pension supervisory authorities.
The Company has other benefit plans including post-retirement health and life insurance for pensioners, and post-employment long-term disability and workers’ compensation benefits, which are based on Company-specific claims. At
December 31, 2017
, the Canadian other benefits plans represent approximately
96
%
of total combined other plan obligations.
The Finance Committee of the Board of Directors has approved an investment policy that establishes long-term asset mix targets which take into account the Company’s expected risk tolerances. Pension plan assets are managed by a suite of independent investment managers, with the allocation by manager reflecting these asset mix targets. Most of the assets are actively managed with the objective of outperforming applicable benchmarks. In accordance with the investment policy, derivative instruments may be used to hedge or adjust existing or anticipated exposures.
To develop the expected long-term rate of return assumption used in the calculation of net periodic benefit cost applicable to the market-related value of assets, the Company considers the expected composition of the plans’ assets, past experience and future estimates of long-term investment returns. Future estimates of investment returns reflect the expected annual yield on applicable fixed income capital market indices, and the long-term return expectation for public equity, real estate, infrastructure and absolute return investments and the expected added value (relative to applicable benchmark indices) from active management of pension fund assets.
The Company has elected to use a market-related value of assets for the purpose of calculating net periodic benefit cost, developed from a
five years
average of market values for the plans’ public equity and absolute return investments (with each prior year’s market value adjusted to the current date for assumed investment income during the intervening period) plus the market value of the plans’ fixed income, real estate and infrastructure securities.
The benefit obligation is discounted using a discount rate that is a blended yield to maturity for a hypothetical portfolio of high-quality corporate debt instruments with cash flows matching projected benefit payments. The discount rate is determined by management.
Net periodic benefit cost
|
|
Pensions
|
Other benefits
|
|||||||||||||||||||||
|
(in millions of Canadian dollars)
|
2017
|
|
2016
|
|
2015
|
|
2017
|
|
2016
|
|
2015
|
|
|||||||||||
|
Current service cost (benefits earned by employees in the year)
|
$
|
|
|
$
|
|
|
$
|
|
|
$
|
|
|
$
|
|
|
$
|
|
|
|||||
|
Other components of net periodic benefit (recovery) cost:
|
|||||||||||||||||||||||
|
Interest cost on benefit obligation
|
|
|
|
|
|
|
|
|
|
|
|
|
|||||||||||
|
Expected return on fund assets
|
(
|
)
|
(
|
)
|
(
|
)
|
|
|
|
|
|
|
|||||||||||
|
Recognized net actuarial loss (gain)
|
|
|
|
|
|
|
(
|
)
|
|
|
|
|
|||||||||||
|
Amortization of prior service costs
|
(
|
)
|
(
|
)
|
(
|
)
|
|
|
|
|
|
|
|||||||||||
|
Total other components of net periodic benefit (recovery) cost
|
(
|
)
|
(
|
)
|
(
|
)
|
|
|
|
|
|
|
|||||||||||
|
Net periodic benefit (recovery) cost
|
$
|
(
|
)
|
$
|
(
|
)
|
$
|
|
|
$
|
|
|
$
|
|
|
$
|
|
|
|||||
91
Projected benefit obligation, fund assets, and funded status
|
|
Pensions
|
|
Other benefits
|
||||||||||
|
(in millions of Canadian dollars)
|
2017
|
|
2016
|
|
|
2017
|
|
2016
|
|
||||
|
Change in projected benefit obligation:
|
|||||||||||||
|
Benefit obligation at January 1
|
$
|
|
|
$
|
|
|
|
$
|
|
|
$
|
|
|
|
Current service cost
|
|
|
|
|
|
|
|
|
|
||||
|
Interest cost
|
|
|
|
|
|
|
|
|
|
||||
|
Employee contributions
|
|
|
|
|
|
|
|
|
|
||||
|
Benefits paid
|
(
|
)
|
(
|
)
|
|
(
|
)
|
(
|
)
|
||||
|
Foreign currency changes
|
(
|
)
|
(
|
)
|
|
(
|
)
|
|
|
||||
|
Plan amendments and other
|
|
|
|
|
|
|
|
|
|
||||
|
Actuarial loss (gain)
|
|
|
|
|
|
|
|
(
|
)
|
||||
|
Projected benefit obligation at December 31
|
$
|
|
|
$
|
|
|
|
$
|
|
|
$
|
|
|
|
|
Pensions
|
|
Other benefits
|
||||||||||
|
(in millions of Canadian dollars)
|
2017
|
|
2016
|
|
|
2017
|
|
2016
|
|
||||
|
Change in fund assets:
|
|||||||||||||
|
Fair value of fund assets at January 1
|
$
|
|
|
$
|
|
|
|
$
|
|
|
$
|
|
|
|
Actual return on fund assets
|
|
|
|
|
|
(
|
)
|
(
|
)
|
||||
|
Employer contributions
|
|
|
|
|
|
|
|
|
|
||||
|
Employee contributions
|
|
|
|
|
|
|
|
|
|
||||
|
Benefits paid
|
(
|
)
|
(
|
)
|
|
(
|
)
|
(
|
)
|
||||
|
Foreign currency changes
|
(
|
)
|
(
|
)
|
|
|
|
|
|
||||
|
Fair value of fund assets at December 31
|
$
|
|
|
$
|
|
|
|
$
|
|
|
$
|
|
|
|
Funded status – plan surplus (deficit)
|
$
|
|
|
$
|
|
|
|
$
|
(
|
)
|
$
|
(
|
)
|
|
|
2017
|
|
2016
|
||||||||||
|
(in millions of Canadian dollars)
|
Pension
plans in surplus |
|
Pension
plans in deficit |
|
|
Pension
plans in surplus |
|
Pension
plans in deficit |
|
||||
|
Projected benefit obligation at December 31
|
$
|
(
|
)
|
$
|
(
|
)
|
|
$
|
(
|
)
|
$
|
(
|
)
|
|
Fair value of fund assets at December 31
|
|
|
|
|
|
|
|
|
|
||||
|
Funded Status
|
$
|
|
|
$
|
(
|
)
|
|
$
|
|
|
$
|
(
|
)
|
All Other benefits plans were in a deficit position at
December 31, 2017
and
2016
.
Pension asset and liabilities in the Company’s Consolidated Balance Sheets
|
|
Pensions
|
|
Other benefits
|
||||||||||
|
(in millions of Canadian dollars)
|
2017
|
|
2016
|
|
|
2017
|
|
2016
|
|
||||
|
Pension asset
|
$
|
|
|
$
|
|
|
|
$
|
|
|
$
|
|
|
|
Accounts payable and accrued liabilities
|
(
|
)
|
(
|
)
|
|
(
|
)
|
(
|
)
|
||||
|
Pension and other benefit liabilities
|
(
|
)
|
(
|
)
|
|
(
|
)
|
(
|
)
|
||||
|
Total amount recognized
|
$
|
|
|
$
|
|
|
|
$
|
(
|
)
|
$
|
(
|
)
|
The defined benefit pension plans’ accumulated benefit obligation as at
December 31, 2017
was
$
11,273
million
(
2016
–
$
11,143
million
). The accumulated benefit obligation is calculated on a basis similar to the projected benefit obligation, except no future salary increases are assumed in the projection of future benefits.
92
The measurement date used to determine the plan assets and the accrued benefit obligation is
December 31
. The most recent actuarial valuation for pension funding purposes for the Company’s main Canadian pension plan was performed as at January 1, 2017. During
2018
, the Company expects to file a new valuation with the pension regulator.
Accumulated other comprehensive loss
|
|
Pensions
|
Other benefits
|
|||||||||||
|
(in millions of Canadian dollars)
|
2017
|
|
2016
|
|
2017
|
|
2016
|
|
|||||
|
Net actuarial loss:
|
|||||||||||||
|
Other than deferred investment gains
|
$
|
|
|
$
|
|
|
$
|
|
|
$
|
|
|
|
|
Deferred investment gains
|
(
|
)
|
(
|
)
|
|
|
|
|
|||||
|
Prior service cost
|
(
|
)
|
(
|
)
|
|
|
|
|
|||||
|
Deferred income tax
|
(
|
)
|
(
|
)
|
(
|
)
|
(
|
)
|
|||||
|
Total (Note 7)
|
$
|
|
|
$
|
|
|
$
|
|
|
$
|
|
|
|
The unamortized actuarial loss and the unamortized prior service cost included in “Accumulated other comprehensive loss” that are expected to be recognized in net periodic benefit cost during
2018
are
$
114
million
and a recovery of
$
3
million
, respectively, for pensions and
$
3
million
and $
nil
, respectively, for other post-retirement benefits.
Actuarial assumptions
|
(percentages)
|
2017
|
2016
|
2015
|
|||
|
Benefit obligation at December 31:
|
||||||
|
Discount rate
|
|
|
|
|||
|
Projected future salary increases
|
|
|
|
|||
|
Health care cost trend rate
|
|
(1)
|
|
(1)
|
|
(2)
|
|
Benefit cost for year ended December 31:
|
||||||
|
Discount rate
|
|
|
|
|||
|
Expected rate of return on fund assets
|
|
|
|
|||
|
Projected future salary increases
|
|
|
|
|||
|
Health care cost trend rate
|
|
(1)
|
|
(2)
|
|
(2)
|
(1)
The health care cost trend rate is assumed to be
7.00
%
in 2017 and 2018, and then decreasing by
0.50
%
per year to an ultimate rate of
5.00
%
per year in 2022 and thereafter.
(2)
The health care cost trend rate was previously assumed to be
6.50
%
in
2017
(
7.00
%
in
2016
and
2015
), and then decreasing by
0.50
%
per year to an ultimate rate of
5.00
%
per year in 2020 and thereafter.
Assumed health care cost trend rates affect the amounts reported for the health care plans. A one-percentage-point increase in the assumed health care cost trend rate would increase the post-retirement benefit obligation by
$
6
million
, and a one-percentage-point decrease in the assumed health care cost trend rate would decrease the post-retirement benefit obligation by
$
6
million
. A one-percentage-point increase or decrease in the assumed health care cost trend rate would have no material effect on the total of service and interest costs.
Plan assets
Plan assets are recorded at fair value. The major asset categories are public equity securities, fixed income securities, real estate, infrastructure and absolute return investments. The fair values of the public equity and fixed income securities are primarily based on quoted market prices. Real estate values are based on annual valuations performed by external parties, taking into account current market conditions and recent sales transactions where practical and appropriate. Infrastructure values are based on the fair value of each fund’s assets as calculated by the fund manager, generally using a discounted cash flow analysis that takes into account current market conditions and recent sales transactions where practical and appropriate. Absolute return investments are a portfolio of units of externally managed hedge funds and are valued by the fund administrators.
93
|
|
Current
asset allocation target |
Current
policy range |
Percentage of plan assets
at December 31 |
|
|
Asset allocation (percentage)
|
2017
|
2016
|
||
|
Cash and cash equivalents
|
|
0 – 5
|
|
|
|
Fixed income
|
|
20 – 40
|
|
|
|
Public equity
|
|
35 – 55
|
|
|
|
Real estate and infrastructure
|
|
4 – 20
|
|
|
|
Absolute return
|
|
0 – 18
|
|
|
|
Total
|
|
|
|
|
94
Summary of the assets of the Company’s DB pension plans at fair values
|
(in millions of Canadian dollars)
|
Quoted prices in
active markets for identical assets (Level 1) |
|
Significant other
observable inputs (Level 2) |
|
Significant
unobservable inputs (Level 3) |
|
Investments
measured at
NAV
(1)
|
|
Total
|
|
|||||
|
December 31, 2017
|
|||||||||||||||
|
Cash and cash equivalents
|
$
|
|
|
$
|
|
|
$
|
|
|
$
|
|
|
$
|
|
|
|
Fixed income
|
|||||||||||||||
|
• Government bonds
(2)
|
|
|
|
|
|
|
|
|
|
|
|||||
|
• Corporate bonds
(2)
|
|
|
|
|
|
|
|
|
|
|
|||||
|
• Mortgages
(3)
|
|
|
|
|
|
|
|
|
|
|
|||||
|
Public equities
|
|
||||||||||||||
|
• Canada
|
|
|
|
|
|
|
|
|
|
|
|||||
|
• U.S. and international
|
|
|
|
|
|
|
|
|
|
|
|||||
|
Real estate
(4)
|
|
|
|
|
|
|
|
|
|
|
|||||
|
Derivative assets
(5)
|
|
|
|
|
|
|
|
|
|
|
|||||
|
Absolute return
(6)
|
|
||||||||||||||
|
• Funds of hedge funds
|
|
|
|
|
|
|
|
|
|
|
|||||
|
• Multi-strategy funds
|
|
|
|
|
|
|
|
|
|
|
|||||
|
• Credit funds
|
|
|
|
|
|
|
|
|
|
|
|||||
|
• Equity funds
|
|
|
|
|
|
|
|
|
|
|
|||||
|
Infrastructure
(7)
|
|
|
|
|
|
|
|
|
|
|
|||||
|
$
|
|
|
$
|
|
|
$
|
|
|
$
|
|
|
$
|
|
|
|
|
December 31, 2016
|
|||||||||||||||
|
Cash and cash equivalents
|
$
|
|
|
$
|
|
|
$
|
|
|
$
|
|
|
$
|
|
|
|
Fixed income
|
|||||||||||||||
|
• Government bonds
(2)
|
|
|
|
|
|
|
|
|
|
|
|||||
|
• Corporate bonds
(2)
|
|
|
|
|
|
|
|
|
|
|
|||||
|
• Mortgages
(3)
|
|
|
|
|
|
|
|
|
|
|
|||||
|
Public equities
|
|
||||||||||||||
|
• Canada
|
|
|
|
|
|
|
|
|
|
|
|||||
|
• U.S. and international
|
|
|
|
|
|
|
|
|
|
|
|||||
|
Real estate
(4)
|
|
|
|
|
|
|
|
|
|
|
|||||
|
Derivative assets
(5)
|
|
|
|
|
|
|
|
|
|
|
|||||
|
Absolute return
(6)
|
|||||||||||||||
|
• Funds of hedge funds
|
|
|
|
|
|
|
|
|
|
|
|||||
|
• Multi-strategy funds
|
|
|
|
|
|
|
|
|
|
|
|||||
|
• Credit funds
|
|
|
|
|
|
|
|
|
|
|
|||||
|
• Equity funds
|
|
|
|
|
|
|
|
|
|
|
|||||
|
Infrastructure
(7)
|
|
|
|
|
|
|
|
|
|
|
|||||
|
$
|
|
|
$
|
|
|
$
|
|
|
$
|
|
|
$
|
|
|
|
(1)
Investments measured at net asset value ("NAV"):
Amounts are comprised of certain investments measured at fair value using NAV (or its equivalent) as a practical expedient. These investments have not been classified in the fair value hierarchy.
(2)
Government & Corporate Bonds:
Fair values for bonds are based on market prices supplied by independent sources as of the last trading day.
(3)
Mortgages:
The fair value of mortgages of
$
45
million
(
2016
–
$
71
million
) is based on current market yields of financial instruments of similar maturity, coupon and risk factors.
(4)
Real estate:
Real estate fund values of
$
622
million
(2016 –
$
188
million
) are based on the NAV of the funds that invest directly in real estate investments. The fair values of the investments have been estimated using the capital accounts representing the plan’s ownership interest in the funds. Of the total,
$
542
million
(2016 –
$
134
million
) is subject to redemption frequencies ranging from monthly to annually and a redemption notice period
95
of 90 days. The remaining
$
80
million
(2016 –
$
54
million
) is not subject to redemption and is normally returned through distributions as a result of the liquidation of the underlying real estate investments. There are
$
53
million
of unfunded commitments for real estate investments as at
December 31, 2017
(
2016
–
$
81
million
).
The fair value of real estate investments of $
nil
(
2016
–
$
437
million
) is based on property appraisals which use a number of approaches that typically include a discounted cash flow analysis, a direct capitalization income method and/or a direct comparison approach. Appraisals of real estate investments are generally performed semi-annually by qualified external accredited appraisers.
(5)
Derivatives:
The Company’s pension funds may utilize the following derivative instruments: equity futures to replicate equity index returns (Level 2); currency forwards to partially hedge foreign currency exposures (Level 2); bond forwards to reduce asset/liability interest rate risk exposures (Level 2); interest rate swaps to manage duration and interest rate risk (Level 2); credit default swaps to manage credit risk (Level 2); and options to manage interest rate risk and volatility (Level 2). There are currency forwards with a notional value of $
nil
(2016 –
$
937
million
) and a fair value of $
nil
(2016 –
$
7
million
) as at December 31, 2017.
(6)
Absolute return:
The fair value of absolute return fund investments of
$
1,662
million
(
2016
–
$
1,975
million
) is based on the NAV reported by the fund administrators. The funds have different redemption policies and periods.
|
-
|
Funds of hedge funds invest in a portfolio of hedge funds that allocate capital across a broad array of funds and/or investment managers, with monthly redemptions upon 95 days' notice.
|
|
-
|
Multi-strategy funds include funds that invest in broadly diversified portfolios of equity, fixed income and derivative instruments with quarterly redemptions upon 60 days' notice.
|
|
-
|
Credit funds invest in an array of fixed income securities with quarterly redemptions upon 60 days' notice.
|
|
-
|
Equity funds invest primarily in U.S. and global equity securities. Redemptions range from quarterly upon 60 days' notice to triennially upon 45 days' notice.
|
(7)
Infrastructure:
Portion of the assets of the Company’s DB pension plans measured at fair value using unobservable inputs (Level 3)
|
(in millions of Canadian dollars)
|
Real Estate
|
|
|
|
As at January 1, 2016
|
$
|
|
|
|
Disbursements
|
(
|
)
|
|
|
Net realized gains
|
|
|
|
|
Decrease in net unrealized gains
|
(
|
)
|
|
|
As at December 31, 2016
|
$
|
|
|
|
Disbursements
|
(
|
)
|
|
|
Net realized gains
|
|
|
|
|
Decrease in net unrealized gains
|
(
|
)
|
|
|
Net transfers (out of) Level 3
|
(
|
)
|
|
|
As at December 31, 2017
|
$
|
|
|
Additional plan assets information
The Company’s expected long-term target return is
7.75
%
, net of all fees and expenses. In identifying the asset allocation ranges, consideration was given to the long-term nature of the underlying plan liabilities, the solvency and going-concern financial position of the plan, long-term return expectations and the risks associated with key asset classes as well as the relationships of returns on key asset classes with each other, inflation and interest rates. When advantageous and with due consideration, derivative instruments may be utilized, provided the total value of the underlying assets represented by financial derivatives, excluding currency forwards, is limited to
30
%
of the market value of the fund.
When investing in foreign securities, the plans are exposed to foreign currency risk; the effect of which is included in the valuation of the foreign securities. At
December 31, 2017
the plans were
40
%
exposed to the U.S. dollar,
11
%
exposed to European currencies, and
7
%
exposed to various other currencies.
At
December 31, 2017
, fund assets consisted primarily of listed stocks and bonds, including
107,330
of the Company’s Common Shares (
2016
–
109,630
) at a market value of
$
25
million
(
2016
–
$
21
million
) and
Unsecured Notes issued by the Company at a par value of
$
1
million
(
2016
–
$
3
million
) and a market value of
$
1
million
(
2016
–
$
3
million
).
96
Cash flows
T
he Company contributed the following to its different pension plans:
|
(in millions of Canadian dollars)
|
2017
|
|
2016
|
|
2015
|
|
|||
|
Canadian registered and U.S. qualified DB pension plans
|
$
|
|
|
$
|
|
|
$
|
|
|
|
Canadian non-registered supplemental pension plan
|
|
|
|
|
|
|
|||
|
DC plans
|
|
|
|
|
|
|
|||
|
Total Company pension contribution
|
$
|
|
|
$
|
|
|
$
|
|
|
In addition, the Company made payments directly to employees, their beneficiaries or estates or to third-party benefit administrators of
$
34
million
in 2017 (2016 –
$
30
million
; 2015 –
$
33
million
) with respect to other benefits.
Estimated future benefit payments
|
(in millions of Canadian dollars)
|
Pensions
|
|
Other benefits
|
|
||
|
2018
|
$
|
|
|
$
|
|
|
|
2019
|
|
|
|
|
||
|
2020
|
|
|
|
|
||
|
2021
|
|
|
|
|
||
|
2022
|
|
|
|
|
||
|
2023 – 2027
|
|
|
|
|
||
The benefit payments from the Canadian registered and U.S. qualified DB pension plans are payable from their respective pension funds. Benefit payments from the supplemental pension plan and from the other benefits plans are payable directly from the Company.
Defined contribution plan
Canadian non-unionized employees hired prior to July 1, 2010 had the option to participate in the Canadian DC plan. All Canadian non-unionized employees hired after such date must participate in this plan. Employee contributions are based on a percentage of salary. The Company matches employee contributions to a maximum percentage each year.
Effective July 1, 2010, a new U.S. DC plan was established. All U.S. non-unionized employees hired after such date must participate in this plan. Employees do not contribute to the plan. The Company annually contributes a percentage of salary.
The DC plans provide a pension based on total employee and employer contributions plus investment income earned on those contributions.
In
2017
, the net cost of the DC plans, which generally equals the employer’s required contribution, was
$
9
million
(
2016
–
$
9
million
;
2015
–
$
9
million
).
Contributions to multi-employer plans
21
Stock-based compensation
At
December 31, 2017
, the Company had several stock-based compensation plans, including a stock option plan, various cash settled liability plans and an employee share purchase plan. These plans resulted in an expense in
2017
of
$
35
million
(
2016
–
$
51
million
;
2015
–
$
66
million
).
Effective January 31, 2017, Mr. E. Hunter Harrison resigned from all positions held by him at the Company, including as the Company’s Chief Executive Officer and as a member of the Board of Directors of the Company. In connection with Mr. Harrison’s resignation, the Company entered into a separation agreement with Mr. Harrison. Under the terms of the separation agreement, the Company agreed to a limited waiver of Mr. Harrison’s non-competition and non-solicitation obligations.
97
Effective January 31, 2017, pursuant to the separation agreement, Mr. Harrison forfeited certain pension and post-retirement benefits and agreed to the surrender for cancellation of
22,514
performance share units ("PSU"),
68,612
deferred share units ("DSU"), and
752,145
stock options.
As a result of this agreement, the Company recognized a recovery of
$
51
million
in "Compensation and benefits" in the first quarter of 2017. Of this amount,
$
27
million
related to a recovery from cancellation of certain pension benefits.
A. Stock Option Plan
|
Options outstanding
|
Nonvested options
|
||||||||||
|
Number of
options |
|
Weighted
average exercise price |
|
Number of
options |
|
Weighted
average grant date fair value |
|
||||
|
Outstanding, January 1, 2017
|
|
|
$
|
|
|
|
|
$
|
|
|
|
|
Granted
|
|
|
$
|
|
|
|
|
$
|
|
|
|
|
Exercised
|
(
|
)
|
$
|
|
|
N/A
|
|
N/A
|
|
||
|
Vested
|
N/A
|
|
N/A
|
|
(
|
)
|
$
|
|
|
||
|
Forfeited
|
(
|
)
|
$
|
|
|
(
|
)
|
$
|
|
|
|
|
Expired
|
(
|
)
|
$
|
|
|
N/A
|
|
N/A
|
|
||
|
Outstanding, December 31, 2017
|
|
|
$
|
|
|
|
|
$
|
|
|
|
|
Vested or expected to vest at December 31, 2017
(1)
|
|
|
$
|
|
|
N/A
|
|
N/A
|
|
||
|
Exercisable, December 31, 2017
|
|
|
$
|
|
|
N/A
|
|
N/A
|
|
||
(1)
As at December 31, 2017
, the weighted average remaining term of vested or expected to vest options was
7.0
years
with an aggregate intrinsic value of
$
114
million
.
|
Options outstanding
|
Options exercisable
|
|||||||||||||||||
|
Range of exercise prices
|
Number of
options |
|
Weighted
average years to expiration |
Weighted
average exercise price |
|
Aggregate
intrinsic value (millions) |
|
Number of
options |
|
Weighted
average exercise price |
|
Aggregate
intrinsic value (millions) |
|
|||||
|
$36.29 – $117.48
|
|
|
|
$
|
|
|
$
|
|
|
|
|
$
|
|
|
$
|
|
|
|
|
$117.49 – $165.95
|
|
|
|
$
|
|
|
$
|
|
|
|
|
$
|
|
|
$
|
|
|
|
|
$165.96 – $190.42
|
|
|
|
$
|
|
|
$
|
|
|
|
|
$
|
|
|
$
|
|
|
|
|
$190.43 – $222.88
|
|
|
|
$
|
|
|
$
|
|
|
|
|
$
|
|
|
$
|
|
|
|
|
Total
(1)
|
|
|
|
$
|
|
|
$
|
|
|
|
|
$
|
|
|
$
|
|
|
|
Pursuant to the employee plan, options may be exercised upon vesting, which is between 12 months and 60 months after the grant date, and will expire after seven years. Certain stock options granted in 2017 vest upon the achievement of specific performance criteria.
Under the fair value method, the fair value of options at the grant date was approximately
$
17
million
for options issued in
2017
(
2016
–
$
16
million
;
2015
–
$
18
million
).
The weighted average fair value assumptions were approximately:
|
2017
|
|
2016
|
|
2015
|
|
||||
|
Expected option life (years)
(1)
|
|
|
|
|
|
|
|||
|
Risk-free interest rate
(2)
|
|
%
|
|
%
|
|
%
|
|||
|
Expected stock price volatility
(3)
|
|
%
|
|
%
|
|
%
|
|||
|
Expected annual dividends per share
(4)
|
$
|
|
|
$
|
|
|
$
|
|
|
|
Estimated forfeiture rate
(5)
|
|
%
|
|
%
|
|
%
|
|||
|
Weighted average grant date fair value of options granted during the year
|
$
|
|
|
$
|
|
|
$
|
|
|
98
(1)
Represents the period of time that awards are expected to be outstanding. Historical data on exercise behaviour or, when available, specific expectations regarding future exercise behaviour were used to estimate the expected life of the option.
(2)
Based on the implied yield available on zero-coupon government issues with an equivalent remaining term at the time of the grant.
(3)
Based on the historical stock price volatility of the Company’s stock over a period commensurate with the expected term of the option.
(4)
Determined by the current annual dividend at the time of grant. The Company does not employ different dividend yields throughout the contractual term of the option. On May 10, 2017, the Company announced an increase in its quarterly dividend to
$
0.5625
per share, representing
$
2.2500
on an annual basis.
In
2017
, the expense for stock options (regular and performance) was
$
3
million
(
2016
–
$
14
million
;
2015
–
$
15
million
). At
December 31, 2017
, there was
$
9
million
of total unrecognized compensation related to stock options which is expected to be recognized over a weighted-average period of approximately
1.3
years.
The total fair value of shares vested for the stock option plan during
2017
was
$
14
million
(
2016
–
$
15
million
;
2015
–
$
17
million
).
|
(in millions of Canadian dollars)
|
2017
|
|
2016
|
|
2015
|
|
|||
|
Total intrinsic value
|
$
|
|
|
$
|
|
|
$
|
|
|
|
Cash received by the Company upon exercise of options
|
$
|
|
|
$
|
|
|
$
|
|
|
B. Other Share-based Plans
Performance share units plan
During
2017
, the Company issued
134,991
PSUs with a grant date fair value of approximately
$
27
million
. These units attract dividend equivalents in the form of additional units based on the dividends paid on the Company’s Common Shares. PSUs vest and are settled in cash or in CP Common Shares, approximately
3
years
after the grant date, contingent upon CP’s performance (performance factor). Grant recipients who are eligible to retire and have provided six months of service during the performance period are entitled to the full award. The fair value of PSUs is measured periodically until settlement, using a lattice-based valuation model.
The performance period for PSUs issued in 2017 is January 1, 2017 to December 31, 2019, and the performance factors for these PSUs are Return on Invested Capital ("ROIC"), Total Shareholder Return ("TSR") compared to the S&P/TSX Capped Industrial index, and TSR compared to S&P 1500 Road and Rail index.
The performance period for PSUs issued in 2016 is January 1, 2016 to December 31, 2018, and the performance factors for these PSUs are Operating Ratio, ROIC, TSR compared to the S&P/TSX60 index, and TSR compared to Class I railways.
The performance period for the PSUs issued in 2015 was January 1, 2015 to December 31, 2017. The performance factors for these PSUs were Operating Ratio, ROIC, TSR compared to the S&P/TSX60 index, and TSR compared to Class I railways. The resulting estimated payout was
160
%
on
82,673
total outstanding awards representing a total fair value of
$
30
million
at
December 31, 2017
, calculated using the Company's average share price using the last
30
trading days preceding
December 31, 2017
.
The performance period for the PSUs issued in 2014 was January 1, 2014 to December 31, 2016. The performance factors for these PSUs were Operating Ratio, Free cash flow, TSR compared to the S&P/TSX60 index, and TSR compared to Class I railways. The resulting payout was
118
%
of the Company's average share price that was calculated using the last
30
trading days preceding December 31, 2016. In the first quarter of 2017, payouts occurred on the total outstanding awards, including dividends reinvested, totalling
$
31
million
on
133,728
outstanding awards.
|
2017
|
|
2016
|
|
|
|
Outstanding, January 1
|
|
|
|
|
|
Granted
|
|
|
|
|
|
Units, in lieu of dividends
|
|
|
|
|
|
Settled
|
(
|
)
|
(
|
)
|
|
Forfeited
|
(
|
)
|
(
|
)
|
|
Outstanding, December 31
|
|
|
|
|
In
2017
, the expense for PSUs was
$
30
million
(
2016
–
$
29
million
;
2015
–
$
55
million
). At
December 31, 2017
, there was
$
20
million
of total unrecognized compensation related to PSUs which is expected to be recognized over a weighted-average period of approximately
1.5
years.
99
Deferred share units plan
The Company established the DSU plan as a means to compensate and assist in attaining share ownership targets set for certain key employees and Directors. A DSU entitles the holder to receive, upon redemption, a cash payment equivalent to the Company's average share price using the 10 trading days prior to redemption. DSUs vest over various periods of up to
48
months
and are only redeemable for a specified period after employment is terminated.
Senior managers may elect to receive DSUs in lieu of annual bonus cash payments in the bonus deferral program. In addition, senior managers will be granted a
25
%
company match of DSUs when deferring cash to DSUs to meet ownership targets. The election to receive eligible payments in DSUs is no longer available to a participant when the value of the participant’s DSUs is sufficient to meet the Company’s stock ownership guidelines. Senior managers have
5
years
to meet their ownership targets.
An expense for DSUs is recognized over the vesting period for both the initial subscription price and the change in value between reporting periods.
|
2017
|
|
2016
|
|
|
|
Outstanding, January 1
|
|
|
|
|
|
Granted
|
|
|
|
|
|
Units, in lieu of dividends
|
|
|
|
|
|
Settled
|
(
|
)
|
(
|
)
|
|
Forfeited
|
(
|
)
|
(
|
)
|
|
Outstanding, December 31
|
|
|
|
|
During
2017
, the Company granted
23,932
DSUs with a grant date fair value of approximately
$
5
million
. In
2017
, the recovery for DSUs was
$
3
million
(
2016
–
$
2
million
expense;
2015
–
$
10
million
recovery). At
December 31, 2017
, there was
$
1
million
of total unrecognized compensation related to DSUs which is expected to be recognized over a weighted-average period of approximately
1.4
years.
Summary of share based liabilities paid
|
(in millions of Canadian dollars)
|
2017
|
|
2016
|
|
2015
|
|
|||
|
Plan
|
|||||||||
|
DSUs
|
$
|
|
|
$
|
|
|
$
|
|
|
|
PSUs
|
|
|
|
|
|
|
|||
|
Other
|
|
|
|
|
|
|
|||
|
Total
|
$
|
|
|
$
|
|
|
$
|
|
|
C. Employee share purchase plan
The Company has an employee share purchase plan whereby both employee and the Company contributions are used to purchase shares on the open market for employees. The Company’s contributions are expensed over the
one year
vesting period. Under the plan, the Company matches
$1 for every $3 contributed by employees
up to a maximum employee contribution of
6
%
of annual salary.
22
Variable interest entities
The Company leases equipment from certain trusts, which have been determined to be variable interest entities financed by a combination of debt and equity provided by unrelated third parties. The lease agreements, which are classified as operating leases, have fixed price purchase options which create the Company’s variable interests and result in the trusts being considered variable interest entities.
100
Maintaining and operating the leased assets according to specific contractual obligations outlined in the terms of the lease agreements and industry standards is the Company’s responsibility. The rigor of the contractual terms of the lease agreements and industry standards are such that the Company has limited discretion over the maintenance activities associated with these assets. As such, the Company concluded these terms do not provide the Company with the power to direct the activities of the variable interest entities in a way that has a significant impact on the entities’ economic performance.
The financial exposure to the Company as a result of its involvement with the variable interest entities is equal to the fixed lease payments due to the trusts. In
2017
, lease payments after tax were
$
10
million
. Future minimum lease payments, before tax, of
$
177
million
will be payable over the next
13
years
.
The Company does not guarantee the residual value of the assets to the lessor; however, it must deliver to the lessor the assets in good operating condition, subject to normal wear and tear, at the end of the lease term.
23
Commitments and contingencies
In the normal course of its operations, the Company becomes involved in various legal actions, including claims relating to injuries and damage to property. The Company maintains provisions it considers to be adequate for such actions. While the final outcome with respect to actions outstanding or pending at
December 31, 2017
, cannot be predicted with certainty, it is the opinion of management that their resolution will not have a material adverse effect on the Company’s financial position or results of operations.
Commitments
At
December 31, 2017
, the Company had committed to total future capital expenditures amounting to
$
632
million
and operating expenditures relating to supplier purchase obligations, such as locomotive maintenance and overhaul agreements, as well as agreements to purchase other goods and services amounting to approximately
$
1.7
billion
for the years
2018
–
2032
, of which CP estimates approximately
$
1.4
billion
will be incurred in the next five years.
|
(in millions of Canadian dollars)
|
Operating
leases |
|
|
|
2018
|
$
|
|
|
|
2019
|
|
|
|
|
2020
|
|
|
|
|
2021
|
|
|
|
|
2022
|
|
|
|
|
Thereafter
|
|
|
|
|
Total minimum lease payments
|
$
|
|
|
Expenses for operating leases
for the year ended December 31, 2017
, were
$
104
million
(
2016
–
$
111
million
;
2015
–
$
127
million
).
Legal proceedings related to Lac-Mégantic rail accident
On July 6, 2013, a train carrying petroleum crude oil operated by Montreal Maine and Atlantic Railway (“MMAR”) or a subsidiary, Montreal Maine & Atlantic Canada Co. (“MMAC” and collectively the “MMA Group”), derailed in Lac-Mégantic, Québec. The derailment occurred on a section of railway owned and operated by the MMA Group. The previous day CP had interchanged the train to the MMA Group, and after the interchange, the MMA Group exclusively controlled the train.
In the wake of the derailment, MMAC sought court protection in Canada under the Companies’ Creditors Arrangement Act, R.S.C., 1985, c. C-36 and MMAR filed for bankruptcy in the United States. Plans of arrangement have been approved in both Canada and the U.S. (the “Plans”). These Plans provide for the distribution of a fund of approximately
$
440
million
amongst those claiming derailment damages.
A number of legal proceedings, set out below, were commenced after the derailment in Canada and/or in the U.S. against CP and others:
101
|
(1)
|
Québec's Minister of Sustainable Development, Environment, Wildlife and Parks (the "Minister") ordered various parties, including CP, to clean up the derailment site (the “Cleanup Order”). CP appealed the Cleanup Order to the Administrative Tribunal of Québec (the “TAQ”). The Minister subsequently served a Notice of Claim seeking
$
|
|
(2)
|
Québec’s Attorney General sued CP in the Québec Superior Court initially claiming
$
|
|
(3)
|
A class action in the Québec Superior Court on behalf of persons and entities residing in, owning or leasing property in, operating a business in or physically present in Lac-Mégantic at the time of the derailment (the “Class Action”) was certified against CP, MMAC and the train conductor, Mr. Thomas Harding. The Class Action seeks unquantified damages, including for wrongful death, personal injury, and property damage arising from the derailment. All known wrongful death claimants in the Class Action have opted out and, by court order, cannot re-join the Class Action.
|
|
(4)
|
|
The Province’s Action, the Class Action and the Promutuel Action have been consolidated and will proceed together through the litigation process in the Québec Superior Court. While each Action will remain a separate legal proceeding, there will be a trial to determine liability issues commencing mid-September 2019, and subsequently, if necessary, a trial to determine damages issues.
|
(5)
|
An adversary proceeding filed by the MMAR U.S. estate representative (“Estate Representative”) in Maine accuses CP of failing to abide by certain regulations (the “Adversary Proceeding”). The Estate Representative alleges that CP should not have moved the petroleum crude oil train because an inaccurate classification by the shipper was or should have been known. The Estate Representative seeks damages for MMAR’s business value (as yet unquantified) allegedly destroyed by the derailment.
|
|
(6)
|
A class action and mass tort action on behalf of Lac-Mégantic residents and wrongful death representatives commenced in Texas and wrongful death and personal injury actions commenced in Illinois and Maine against CP were all removed to and consolidated in Maine (the “Maine Actions”). The Maine Actions allege that CP negligently misclassified and mis-packaged the petroleum crude oil being shipped. On CP’s motion, the Maine Actions were dismissed by the Court on several grounds. The plaintiffs are appealing the dismissal decision.
|
|
(7)
|
The Trustee (the “WD Trustee”) for the wrongful death trust (the “WD Trust”), as defined and established by the Estate Representative under the Plans, asserts Carmack Amendment claims against CP in North Dakota federal court (the “Carmack Claims”). The WD Trustee seeks to recover approximately
$
|
24
Guarantees
In the normal course of operating the railway, the Company enters into contractual arrangements that involve providing certain guarantees, which extend over the term of the contracts. These guarantees include, but are not limited to:
|
•
|
residual value guarantees on operating lease commitments of
$
|
|
•
|
guarantees to pay other parties in the event of the occurrence of specified events, including damage to equipment, in relation to assets used in the operation of the railway through operating leases, rental agreements, easements, trackage, and interline agreements; and
|
|
•
|
indemnifications of certain tax-related payments incurred by lessors and lenders.
|
The maximum amount that could be payable under these guarantees, excluding residual value guarantees, cannot be reasonably estimated due to the nature of certain of these guarantees. All or a portion of amounts paid under guarantees to other parties in the event of the occurrence of specified events could be recoverable from other parties or through insurance. The Company has accrued for all guarantees that it expects to pay. At
December 31, 2017
, these accruals amounted to
$
9
million
(
2016
–
$
5
million
), and are recorded in “Accounts payable and accrued liabilities”.
Indemnifications
Pursuant to a trust and custodial services agreement with the trustee of the Canadian Pacific Railway Company Pension Plan, the Company has undertaken to indemnify and save harmless the trustee, to the extent not paid by the fund, from any and all taxes,
102
25
Segmented and geographic information
Operating segment
The Company operates in only
one
operating segment: rail transportation. Operating results by geographic areas, railway corridors or other lower-level components or units of operation are not reviewed by the Company’s chief operating decision-maker to make decisions about the allocation of resources to, or the assessment of performance of, such geographic areas, corridors, components or units of operation.
In the years ended
December 31, 2017
,
2016
, and
2015
,
no
one customer comprised more than 10% of total revenues and accounts receivable.
|
(in millions of Canadian dollars)
|
Canada
|
|
United States
|
|
Total
|
|
|||
|
2017
|
|
|
|
||||||
|
Revenues
|
$
|
|
|
$
|
|
|
$
|
|
|
|
Long-term assets excluding financial instruments and pension assets
|
$
|
|
|
$
|
|
|
$
|
|
|
|
2016
|
|
|
|
||||||
|
Revenues
|
$
|
|
|
$
|
|
|
$
|
|
|
|
Long-term assets excluding financial instruments and pension assets
|
$
|
|
|
$
|
|
|
$
|
|
|
|
2015
|
|
|
|
||||||
|
Revenues
|
$
|
|
|
$
|
|
|
$
|
|
|
|
Long-term assets excluding financial instruments and pension assets
|
$
|
|
|
$
|
|
|
$
|
|
|
26
Selected quarterly data (unaudited)
|
For the quarter ended
|
2017
|
2016
|
|||||||||||||||||||||||
|
(in millions of Canadian dollars, except per share data)
|
Dec. 31
|
|
Sep. 30
|
|
Jun. 30
|
|
Mar. 31
|
|
Dec. 31
|
|
Sep. 30
|
|
Jun. 30
|
|
Mar. 31
|
|
|||||||||
|
Total revenues
|
$
|
|
|
$
|
|
|
$
|
|
|
$
|
|
|
$
|
|
|
$
|
|
|
$
|
|
|
$
|
|
|
|
|
Operating income
|
|
|
|
|
|
|
|
|
|
|
|
|
|
|
|
|
|||||||||
|
Net income
|
|
|
|
|
|
|
|
|
|
|
|
|
|
|
|
|
|||||||||
|
Basic earnings per share
(1)
|
$
|
|
|
$
|
|
|
$
|
|
|
$
|
|
|
$
|
|
|
$
|
|
|
$
|
|
|
$
|
|
|
|
|
Diluted earnings per share
(1)
|
|
|
|
|
|
|
|
|
|
|
|
|
|
|
|
|
|||||||||
27
Condensed consolidating financial information
Canadian Pacific Railway Company, a 100%-owned subsidiary of Canadian Pacific Railway Limited (“CPRL”), is the issuer of certain debt securities, which are fully and unconditionally guaranteed by CPRL. The following tables present condensed consolidating financial information (“CCFI”) in accordance with Rule 3-10(c) of Regulation S-X.
Investments in subsidiaries are accounted for under the equity method when presenting the CCFI.
103
YEAR ENDED DECEMBER 31, 2017
|
(in millions of Canadian dollars)
|
CPRL (Parent Guarantor)
|
|
CPRC (Subsidiary Issuer)
|
|
Non-Guarantor Subsidiaries
|
|
Consolidating Adjustments and Eliminations
|
|
CPRL Consolidated
|
|
|||||
|
Revenues
|
|||||||||||||||
|
Freight
|
$
|
|
|
$
|
|
|
$
|
|
|
$
|
|
|
$
|
|
|
|
Non-freight
|
|
|
|
|
|
|
(
|
)
|
|
|
|||||
|
Total revenues
|
|
|
|
|
|
|
(
|
)
|
|
|
|||||
|
Operating expenses
|
|
|
|
|
|
|
|
|
|
|
|||||
|
Compensation and benefits
|
|
|
|
|
|
|
|
|
|
|
|||||
|
Fuel
|
|
|
|
|
|
|
|
|
|
|
|||||
|
Materials
|
|
|
|
|
|
|
|
|
|
|
|||||
|
Equipment rents
|
|
|
|
|
(
|
)
|
|
|
|
|
|||||
|
Depreciation and amortization
|
|
|
|
|
|
|
|
|
|
|
|||||
|
Purchased services and other
|
|
|
|
|
|
|
(
|
)
|
|
|
|||||
|
Total operating expenses
|
|
|
|
|
|
|
(
|
)
|
|
|
|||||
|
Operating income
|
|
|
|
|
|
|
|
|
|
|
|||||
|
Less:
|
|
|
|
|
|
|
|
|
|
|
|||||
|
Other income and charges
|
(
|
)
|
(
|
)
|
|
|
|
|
(
|
)
|
|||||
|
Net interest (income) expense
|
(
|
)
|
|
|
(
|
)
|
|
|
|
|
|||||
|
Income before income tax expense and equity in net earnings of subsidiaries
|
|
|
|
|
|
|
|
|
|
|
|||||
|
Less: Income tax expense (recovery)
|
|
|
|
|
(
|
)
|
|
|
|
|
|||||
|
Add: Equity in net earnings of subsidiaries
|
|
|
|
|
|
|
(
|
)
|
|
|
|||||
|
Net income
|
$
|
|
|
$
|
|
|
$
|
|
|
$
|
(
|
)
|
$
|
|
|
104
YEAR ENDED DECEMBER 31, 2016
|
(in millions of Canadian dollars)
|
CPRL (Parent Guarantor)
|
|
CPRC (Subsidiary Issuer)
|
|
Non-Guarantor Subsidiaries
|
|
Consolidating Adjustments and Eliminations
|
|
CPRL Consolidated
|
|
|||||
|
Revenues
|
|||||||||||||||
|
Freight
|
$
|
|
|
$
|
|
|
$
|
|
|
$
|
|
|
$
|
|
|
|
Non-freight
|
|
|
|
|
|
|
(
|
)
|
|
|
|||||
|
Total revenues
|
|
|
|
|
|
|
(
|
)
|
|
|
|||||
|
Operating expenses
|
|
|
|
|
|
|
|
|
|
|
|||||
|
Compensation and benefits
|
|
|
|
|
|
|
|
|
|
|
|||||
|
Fuel
|
|
|
|
|
|
|
|
|
|
|
|||||
|
Materials
|
|
|
|
|
|
|
|
|
|
|
|||||
|
Equipment rents
|
|
|
|
|
(
|
)
|
|
|
|
|
|||||
|
Depreciation and amortization
|
|
|
|
|
|
|
|
|
|
|
|||||
|
Purchased services and other
|
|
|
|
|
|
|
(
|
)
|
|
|
|||||
|
Total operating expenses
|
|
|
|
|
|
|
(
|
)
|
|
|
|||||
|
Operating income
|
|
|
|
|
|
|
|
|
|
|
|||||
|
Less:
|
|
|
|
|
|
|
|
|
|
|
|||||
|
Other income and charges
|
(
|
)
|
(
|
)
|
|
|
|
|
(
|
)
|
|||||
|
Net interest expense (income)
|
|
|
|
|
(
|
)
|
|
|
|
|
|||||
|
Income before income tax expense and equity in net earnings of subsidiaries
|
|
|
|
|
|
|
|
|
|
|
|||||
|
Less: Income tax expense
|
|
|
|
|
|
|
|
|
|
|
|||||
|
Add: Equity in net earnings of subsidiaries
|
|
|
|
|
|
|
(
|
)
|
|
|
|||||
|
Net income
|
$
|
|
|
$
|
|
|
$
|
|
|
$
|
(
|
)
|
$
|
|
|
105
YEAR ENDED DECEMBER 31, 2015
|
(in millions of Canadian dollars)
|
CPRL (Parent Guarantor)
|
|
CPRC (Subsidiary Issuer)
|
|
Non-Guarantor Subsidiaries
|
|
Consolidating Adjustments and Eliminations
|
|
CPRL Consolidated
|
|
|||||
|
Revenues
|
|||||||||||||||
|
Freight
|
$
|
|
|
$
|
|
|
$
|
|
|
$
|
|
|
$
|
|
|
|
Non-freight
|
|
|
|
|
|
|
(
|
)
|
|
|
|||||
|
Total revenues
|
|
|
|
|
|
|
(
|
)
|
|
|
|||||
|
Operating expenses
|
|
|
|
|
|
|
|
|
|
|
|||||
|
Compensation and benefits
|
|
|
|
|
|
|
|
|
|
|
|||||
|
Fuel
|
|
|
|
|
|
|
|
|
|
|
|||||
|
Materials
|
|
|
|
|
|
|
|
|
|
|
|||||
|
Equipment rents
|
|
|
|
|
(
|
)
|
|
|
|
|
|||||
|
Depreciation and amortization
|
|
|
|
|
|
|
|
|
|
|
|||||
|
Purchased services and other
|
|
|
|
|
|
|
(
|
)
|
|
|
|||||
|
Gain on sale of Delaware & Hudson South
|
|
|
|
|
(
|
)
|
|
|
(
|
)
|
|||||
|
Total operating expenses
|
|
|
|
|
|
|
(
|
)
|
|
|
|||||
|
Operating income
|
|
|
|
|
|
|
|
|
|
|
|||||
|
Less:
|
|
|
|
|
|
|
|
|
|
|
|||||
|
Other income and charges
|
|
|
|
|
(
|
)
|
|
|
|
|
|||||
|
Net interest (income) expense
|
(
|
)
|
|
|
(
|
)
|
|
|
|
|
|||||
|
(Loss) income before income tax expense and equity in net earnings of subsidiaries
|
(
|
)
|
|
|
|
|
|
|
|
|
|||||
|
Less: Income tax (recovery) expense
|
(
|
)
|
|
|
|
|
|
|
|
|
|||||
|
Add: Equity in net earnings of subsidiaries
|
$
|
|
|
$
|
|
|
$
|
|
|
$
|
(
|
)
|
$
|
|
|
|
Net income
|
$
|
|
|
$
|
|
|
$
|
|
|
$
|
(
|
)
|
$
|
|
|
106
YEAR ENDED DECEMBER 31, 2017
|
(in millions of Canadian dollars)
|
CPRL (Parent Guarantor)
|
|
CPRC (Subsidiary Issuer)
|
|
Non-Guarantor Subsidiaries
|
|
Consolidating Adjustments and Eliminations
|
|
CPRL Consolidated
|
|
|||||
|
Net income
|
$
|
|
|
$
|
|
|
$
|
|
|
$
|
(
|
)
|
$
|
|
|
|
Net gain (loss) in foreign currency translation adjustments, net of hedging activities
|
|
|
|
|
(
|
)
|
|
|
|
|
|||||
|
Change in derivatives designated as cash flow
hedges |
|
|
|
|
|
|
|
|
|
|
|||||
|
Change in pension and post-retirement defined
benefit plans |
|
|
|
|
(
|
)
|
|
|
|
|
|||||
|
Other comprehensive income (loss) before income taxes
|
|
|
|
|
(
|
)
|
|
|
|
|
|||||
|
Income tax (expense) recovery on above items
|
|
|
(
|
)
|
|
|
|
|
(
|
)
|
|||||
|
Equity accounted investments
|
|
|
(
|
)
|
|
|
|
|
|
|
|||||
|
Other comprehensive income (loss)
|
|
|
|
|
(
|
)
|
|
|
|
|
|||||
|
Comprehensive income
|
$
|
|
|
$
|
|
|
$
|
|
|
$
|
(
|
)
|
$
|
|
|
YEAR ENDED DECEMBER 31, 2016
|
(in millions of Canadian dollars)
|
CPRL (Parent Guarantor)
|
|
CPRC (Subsidiary Issuer)
|
|
Non-Guarantor Subsidiaries
|
|
Consolidating Adjustments and Eliminations
|
|
CPRL Consolidated
|
|
|||||
|
Net income
|
$
|
|
|
$
|
|
|
$
|
|
|
$
|
(
|
)
|
$
|
|
|
|
Net gain (loss) in foreign currency translation adjustments, net of hedging activities
|
|
|
|
|
(
|
)
|
|
|
|
|
|||||
|
Change in derivatives designated as cash flow
hedges |
|
|
(
|
)
|
|
|
|
|
(
|
)
|
|||||
|
Change in pension and post-retirement defined
benefit plans |
|
|
(
|
)
|
|
|
|
|
(
|
)
|
|||||
|
Other comprehensive loss before income taxes
|
|
|
(
|
)
|
(
|
)
|
|
|
(
|
)
|
|||||
|
Income tax recovery (expense) on above items
|
|
|
|
|
(
|
)
|
|
|
|
|
|||||
|
Equity accounted investments
|
(
|
)
|
(
|
)
|
|
|
|
|
|
|
|||||
|
Other comprehensive loss
|
(
|
)
|
(
|
)
|
(
|
)
|
|
|
(
|
)
|
|||||
|
Comprehensive income
|
$
|
|
|
$
|
|
|
$
|
|
|
$
|
(
|
)
|
$
|
|
|
YEAR ENDED DECEMBER 31, 2015
|
(in millions of Canadian dollars)
|
CPRL (Parent Guarantor)
|
|
CPRC (Subsidiary Issuer)
|
|
Non-Guarantor Subsidiaries
|
|
Consolidating Adjustments and Eliminations
|
|
CPRL Consolidated
|
|
|||||
|
Net income
|
$
|
|
|
$
|
|
|
$
|
|
|
$
|
(
|
)
|
$
|
|
|
|
Net (loss) gain in foreign currency translation adjustments, net of hedging activities
|
|
|
(
|
)
|
|
|
|
|
(
|
)
|
|||||
|
Change in derivatives designated as cash flow
hedges |
|
|
(
|
)
|
|
|
|
|
(
|
)
|
|||||
|
Change in pension and post-retirement defined
benefit plans |
|
|
|
|
(
|
)
|
|
|
|
|
|||||
|
Other comprehensive income before income taxes
|
|
|
|
|
|
|
|
|
|
|
|||||
|
Income tax (expense) recovery on above items
|
|
|
(
|
)
|
|
|
|
|
(
|
)
|
|||||
|
Equity accounted investments
|
|
|
|
|
|
|
(
|
)
|
|
|
|||||
|
Other comprehensive income
|
|
|
|
|
|
|
(
|
)
|
|
|
|||||
|
Comprehensive income
|
$
|
|
|
$
|
|
|
$
|
|
|
$
|
(
|
)
|
$
|
|
|
107
AS AT DECEMBER 31, 2017
|
(in millions of Canadian dollars)
|
CPRL (Parent Guarantor)
|
|
CPRC (Subsidiary Issuer)
|
|
Non-Guarantor Subsidiaries
|
|
Consolidating Adjustments and Eliminations
|
|
CPRL Consolidated
|
|
|||||
|
Assets
|
|||||||||||||||
|
Current assets
|
|||||||||||||||
|
Cash and cash equivalents
|
$
|
|
|
$
|
|
|
$
|
|
|
$
|
|
|
$
|
|
|
|
Accounts receivable, net
|
|
|
|
|
|
|
|
|
|
|
|||||
|
Accounts receivable, intercompany
|
|
|
|
|
|
|
(
|
)
|
|
|
|||||
|
Short-term advances to affiliates
|
|
|
|
|
|
|
(
|
)
|
|
|
|||||
|
Materials and supplies
|
|
|
|
|
|
|
|
|
|
|
|||||
|
Other current assets
|
|
|
|
|
|
|
|
|
|
|
|||||
|
|
|
|
|
|
|
(
|
)
|
|
|
||||||
|
Long-term advances to affiliates
|
|
|
|
|
|
|
(
|
)
|
|
|
|||||
|
Investments
|
|
|
|
|
|
|
|
|
|
|
|||||
|
Investments in subsidiaries
|
|
|
|
|
|
|
(
|
)
|
|
|
|||||
|
Properties
|
|
|
|
|
|
|
|
|
|
|
|||||
|
Goodwill and intangible assets
|
|
|
|
|
|
|
|
|
|
|
|||||
|
Pension asset
|
|
|
|
|
|
|
|
|
|
|
|||||
|
Other assets
|
|
|
|
|
|
|
|
|
|
|
|||||
|
Deferred income taxes
|
|
|
|
|
|
|
(
|
)
|
|
|
|||||
|
Total assets
|
$
|
|
|
$
|
|
|
$
|
|
|
$
|
(
|
)
|
$
|
|
|
|
Liabilities and shareholders’ equity
|
|||||||||||||||
|
Current liabilities
|
|||||||||||||||
|
Accounts payable and accrued liabilities
|
$
|
|
|
$
|
|
|
$
|
|
|
$
|
|
|
$
|
|
|
|
Accounts payable, intercompany
|
|
|
|
|
|
|
(
|
)
|
|
|
|||||
|
Short-term advances from affiliates
|
|
|
|
|
|
|
(
|
)
|
|
|
|||||
|
Long-term debt maturing within one year
|
|
|
|
|
|
|
|
|
|
|
|||||
|
|
|
|
|
|
|
(
|
)
|
|
|
||||||
|
Pension and other benefit liabilities
|
|
|
|
|
|
|
|
|
|
|
|||||
|
Long-term advances from affiliates
|
|
|
|
|
|
|
(
|
)
|
|
|
|||||
|
Other long-term liabilities
|
|
|
|
|
|
|
|
|
|
|
|||||
|
Long-term debt
|
|
|
|
|
|
|
|
|
|
|
|||||
|
Deferred income taxes
|
|
|
|
|
|
|
(
|
)
|
|
|
|||||
|
Total liabilities
|
|
|
|
|
|
|
(
|
)
|
|
|
|||||
|
Shareholders’ equity
|
|
|
|
|
|
|
|
|
|
|
|||||
|
Share capital
|
|
|
|
|
|
|
(
|
)
|
|
|
|||||
|
Additional paid-in capital
|
|
|
|
|
|
|
(
|
)
|
|
|
|||||
|
Accumulated other comprehensive (loss) income
|
(
|
)
|
(
|
)
|
|
|
|
|
(
|
)
|
|||||
|
Retained earnings
|
|
|
|
|
|
|
(
|
)
|
|
|
|||||
|
|
|
|
|
|
|
(
|
)
|
|
|
||||||
|
Total liabilities and shareholders’ equity
|
$
|
|
|
$
|
|
|
$
|
|
|
$
|
(
|
)
|
$
|
|
|
108
AS AT DECEMBER 31, 2016
|
(in millions of Canadian dollars)
|
CPRL (Parent Guarantor)
|
|
CPRC (Subsidiary Issuer)
|
|
Non-Guarantor Subsidiaries
|
|
Consolidating Adjustments and Eliminations
|
|
CPRL Consolidated
|
|
|||||
|
Assets
|
|||||||||||||||
|
Current assets
|
|||||||||||||||
|
Cash and cash equivalents
|
$
|
|
|
$
|
|
|
$
|
|
|
$
|
|
|
$
|
|
|
|
Accounts receivable, net
|
|
|
|
|
|
|
|
|
|
|
|||||
|
Accounts receivable, intercompany
|
|
|
|
|
|
|
(
|
)
|
|
|
|||||
|
Short-term advances to affiliates
|
|
|
|
|
|
|
(
|
)
|
|
|
|||||
|
Materials and supplies
|
|
|
|
|
|
|
|
|
|
|
|||||
|
Other current assets
|
|
|
|
|
|
|
|
|
|
|
|||||
|
|
|
|
|
|
|
|
(
|
)
|
|
|
|||||
|
Long-term advances to affiliates
|
|
|
|
|
|
|
(
|
)
|
|
|
|||||
|
Investments
|
|
|
|
|
|
|
|
|
|
|
|||||
|
Investments in subsidiaries
|
|
|
|
|
|
|
(
|
)
|
|
|
|||||
|
Properties
|
|
|
|
|
|
|
|
|
|
|
|||||
|
Goodwill and intangible assets
|
|
|
|
|
|
|
|
|
|
|
|||||
|
Pension asset
|
|
|
|
|
|
|
|
|
|
|
|||||
|
Other assets
|
|
|
|
|
|
|
|
|
|
|
|||||
|
Deferred income taxes
|
|
|
|
|
|
|
(
|
)
|
|
|
|||||
|
Total assets
|
$
|
|
|
$
|
|
|
$
|
|
|
$
|
(
|
)
|
$
|
|
|
|
Liabilities and shareholders’ equity
|
|
|
|
|
|
|
|
|
|
|
|||||
|
Current liabilities
|
|
|
|
|
|
|
|
|
|
|
|||||
|
Accounts payable and accrued liabilities
|
$
|
|
|
$
|
|
|
$
|
|
|
$
|
|
|
$
|
|
|
|
Accounts payable, intercompany
|
|
|
|
|
|
|
(
|
)
|
|
|
|||||
|
Short-term advances from affiliates
|
|
|
|
|
|
|
(
|
)
|
|
|
|||||
|
Long-term debt maturing within one year
|
|
|
|
|
|
|
|
|
|
|
|||||
|
|
|
|
|
|
|
|
(
|
)
|
|
|
|||||
|
Pension and other benefit liabilities
|
|
|
|
|
|
|
|
|
|
|
|||||
|
Long-term advances from affiliates
|
|
|
|
|
|
|
(
|
)
|
|
|
|||||
|
Other long-term liabilities
|
|
|
|
|
|
|
|
|
|
|
|||||
|
Long-term debt
|
|
|
|
|
|
|
|
|
|
|
|||||
|
Deferred income taxes
|
|
|
|
|
|
|
(
|
)
|
|
|
|||||
|
Total liabilities
|
|
|
|
|
|
|
(
|
)
|
|
|
|||||
|
Shareholders’ equity
|
|
|
|
|
|
|
|
|
|
|
|||||
|
Share capital
|
|
|
|
|
|
|
(
|
)
|
|
|
|||||
|
Additional paid-in capital
|
|
|
|
|
|
|
(
|
)
|
|
|
|||||
|
Accumulated other comprehensive (loss) income
|
(
|
)
|
(
|
)
|
|
|
|
|
(
|
)
|
|||||
|
Retained earnings
|
|
|
|
|
|
|
(
|
)
|
|
|
|||||
|
|
|
|
|
|
|
|
(
|
)
|
|
|
|||||
|
Total liabilities and shareholders’ equity
|
$
|
|
|
$
|
|
|
$
|
|
|
$
|
(
|
)
|
$
|
|
|
109
YEAR ENDED DECEMBER 31, 2017
|
(in millions of Canadian dollars)
|
CPRL (Parent Guarantor)
|
|
CPRC (Subsidiary Issuer)
|
|
Non-Guarantor Subsidiaries
|
|
Consolidating Adjustments and Eliminations
|
|
CPRL Consolidated
|
|
|||||
|
Cash provided by operating activities
|
$
|
|
|
$
|
|
|
$
|
|
|
$
|
(
|
)
|
$
|
|
|
|
Investing activities
|
|||||||||||||||
|
Additions to properties
|
|
|
(
|
)
|
(
|
)
|
|
|
(
|
)
|
|||||
|
Proceeds from sale of properties and other assets
|
|
|
|
|
|
|
|
|
|
|
|||||
|
Advances to affiliates
|
(
|
)
|
(
|
)
|
(
|
)
|
|
|
|
|
|||||
|
Repayment of advances to affiliates
|
|
|
|
|
|
|
(
|
)
|
|
|
|||||
|
Capital contributions to affiliates
|
|
|
(
|
)
|
|
|
|
|
|
|
|||||
|
Repurchase of share capital from affiliates
|
|
|
|
|
|
|
(
|
)
|
|
|
|||||
|
Other
|
|
|
|
|
(
|
)
|
|
|
|
|
|||||
|
Cash used in investing activities
|
(
|
)
|
(
|
)
|
(
|
)
|
|
|
(
|
)
|
|||||
|
Financing activities
|
|||||||||||||||
|
Dividends paid
|
(
|
)
|
(
|
)
|
(
|
)
|
|
|
(
|
)
|
|||||
|
Issuance of share capital
|
|
|
|
|
|
|
(
|
)
|
|
|
|||||
|
Return of share capital to affiliates
|
|
|
|
|
(
|
)
|
|
|
|
|
|||||
|
Issuance of CP Common Shares
|
|
|
|
|
|
|
|
|
|
|
|||||
|
Purchase of CP Common Shares
|
(
|
)
|
|
|
|
|
|
|
(
|
)
|
|||||
|
Repayment of long-term debt, excluding commercial paper
|
|
|
(
|
)
|
|
|
|
|
(
|
)
|
|||||
|
Advances from affiliates
|
|
|
|
|
|
|
(
|
)
|
|
|
|||||
|
Repayment of advances from affiliates
|
(
|
)
|
|
|
|
|
|
|
|
|
|||||
|
Settlement of forward starting swaps
|
|
|
(
|
)
|
|
|
|
|
(
|
)
|
|||||
|
Cash provided by (used in) financing activities
|
|
|
|
|
|
|
(
|
)
|
(
|
)
|
|||||
|
Effect of foreign currency fluctuations on U.S. dollar-denominated cash and cash equivalents
|
|
|
(
|
)
|
(
|
)
|
|
|
(
|
)
|
|||||
|
Cash position
|
|||||||||||||||
|
Increase in cash and cash equivalents
|
|
|
|
|
|
|
|
|
|
|
|||||
|
Cash and cash equivalents at beginning of year
|
|
|
|
|
|
|
|
|
|
|
|||||
|
Cash and cash equivalents at end of year
|
$
|
|
|
$
|
|
|
$
|
|
|
$
|
|
|
$
|
|
|
110
YEAR ENDED DECEMBER 31, 2016
|
(in millions of Canadian dollars)
|
CPRL (Parent Guarantor)
|
|
CPRC (Subsidiary Issuer)
|
|
Non-Guarantor Subsidiaries
|
|
Consolidating Adjustments and Eliminations
|
|
CPRL Consolidated
|
|
|||||
|
Cash provided by operating activities
|
$
|
|
|
$
|
|
|
$
|
|
|
$
|
(
|
)
|
$
|
|
|
|
Investing activities
|
|||||||||||||||
|
Additions to properties
|
|
|
(
|
)
|
(
|
)
|
|
|
(
|
)
|
|||||
|
Proceeds from sale of properties and other assets
|
|
|
|
|
|
|
|
|
|
|
|||||
|
Advances to affiliates
|
|
|
(
|
)
|
(
|
)
|
|
|
|
|
|||||
|
Repayment of advances to affiliates
|
|
|
|
|
|
|
(
|
)
|
|
|
|||||
|
Capital contributions to affiliates
|
|
|
(
|
)
|
|
|
|
|
|
|
|||||
|
Repurchase of share capital from affiliates
|
|
|
|
|
|
|
(
|
)
|
|
|
|||||
|
Other
|
|
|
|
|
(
|
)
|
|
|
(
|
)
|
|||||
|
Cash used in investing activities
|
|
|
(
|
)
|
(
|
)
|
|
|
(
|
)
|
|||||
|
Financing activities
|
|||||||||||||||
|
Dividends paid
|
(
|
)
|
(
|
)
|
(
|
)
|
|
|
(
|
)
|
|||||
|
Issuance of share capital
|
|
|
|
|
|
|
(
|
)
|
|
|
|||||
|
Return of share capital to affiliates
|
|
|
|
|
(
|
)
|
|
|
|
|
|||||
|
Issuance of CP Common Shares
|
|
|
|
|
|
|
|
|
|
|
|||||
|
Purchase of CP Common Shares
|
(
|
)
|
|
|
|
|
|
|
(
|
)
|
|||||
|
Repayment of long-term debt, excluding commercial paper
|
|
|
(
|
)
|
(
|
)
|
|
|
(
|
)
|
|||||
|
Net repayment of commercial paper
|
|
|
(
|
)
|
|
|
|
|
(
|
)
|
|||||
|
Advances from affiliates
|
|
|
|
|
|
|
(
|
)
|
|
|
|||||
|
Repayment of advances from affiliates
|
|
|
|
|
(
|
)
|
|
|
|
|
|||||
|
Other
|
|
|
(
|
)
|
|
|
|
|
(
|
)
|
|||||
|
Cash (used in) provided by financing activities
|
(
|
)
|
(
|
)
|
|
|
(
|
)
|
(
|
)
|
|||||
|
Effect of foreign currency fluctuations on U.S. dollar-denominated cash and cash equivalents
|
|
|
(
|
)
|
(
|
)
|
|
|
(
|
)
|
|||||
|
Cash position
|
|||||||||||||||
|
Decrease in cash and cash equivalents
|
|
|
(
|
)
|
(
|
)
|
|
|
(
|
)
|
|||||
|
Cash and cash equivalents at beginning of year
|
|
|
|
|
|
|
|
|
|
|
|||||
|
Cash and cash equivalents at end of year
|
$
|
|
|
$
|
|
|
$
|
|
|
$
|
|
|
$
|
|
|
111
YEAR ENDED DECEMBER 31, 2015
|
(in millions of Canadian dollars)
|
CPRL (Parent Guarantor)
|
|
CPRC (Subsidiary Issuer)
|
|
Non-Guarantor Subsidiaries
|
|
Consolidating Adjustments and Eliminations
|
|
CPRL Consolidated
|
|
|||||
|
Cash provided by operating activities
|
$
|
|
|
$
|
|
|
$
|
|
|
$
|
(
|
)
|
$
|
|
|
|
Investing activities
|
|||||||||||||||
|
Additions to properties
|
|
|
(
|
)
|
(
|
)
|
|
|
(
|
)
|
|||||
|
Proceeds from the sale of Delaware & Hudson South
|
|
|
|
|
|
|
|
|
|
|
|||||
|
Proceeds from sale of properties and other assets
|
|
|
|
|
|
|
|
|
|
|
|||||
|
Advances to affiliates
|
(
|
)
|
(
|
)
|
(
|
)
|
|
|
|
|
|||||
|
Repayment of advances to affiliates
|
|
|
|
|
|
|
(
|
)
|
|
|
|||||
|
Capital contributions to affiliates
|
|
|
(
|
)
|
|
|
|
|
|
|
|||||
|
Repurchase of share capital from affiliates
|
|
|
|
|
|
|
(
|
)
|
|
|
|||||
|
Other
|
|
|
|
|
(
|
)
|
|
|
|
|
|||||
|
Cash used in investing activities
|
(
|
)
|
(
|
)
|
(
|
)
|
|
|
(
|
)
|
|||||
|
Financing activities
|
|||||||||||||||
|
Dividends paid
|
(
|
)
|
(
|
)
|
(
|
)
|
|
|
(
|
)
|
|||||
|
Issuance of share capital
|
|
|
|
|
|
|
(
|
)
|
|
|
|||||
|
Return of share capital to affiliates
|
|
|
|
|
(
|
)
|
|
|
|
|
|||||
|
Issuance of CP Common Shares
|
|
|
|
|
|
|
|
|
|
|
|||||
|
Purchase of CP Common Shares
|
(
|
)
|
|
|
|
|
|
|
(
|
)
|
|||||
|
Issuance of long-term debt, excluding commercial paper
|
|
|
|
|
|
|
|
|
|
|
|||||
|
Repayment of long-term debt, excluding commercial paper
|
|
|
(
|
)
|
(
|
)
|
|
|
(
|
)
|
|||||
|
Net repayment of commercial paper
|
|
|
(
|
)
|
|
|
|
|
(
|
)
|
|||||
|
Advances from affiliates
|
|
|
|
|
|
|
(
|
)
|
|
|
|||||
|
Repayment of advances from affiliates
|
|
|
(
|
)
|
(
|
)
|
|
|
|
|
|||||
|
Cash (used in) provided by financing activities
|
(
|
)
|
(
|
)
|
|
|
|
|
(
|
)
|
|||||
|
Effect of foreign currency fluctuations on U.S. dollar-denominated cash and cash equivalents
|
|
|
|
|
|
|
|
|
|
|
|||||
|
Cash position
|
|||||||||||||||
|
Increase in cash and cash equivalents
|
|
|
|
|
|
|
|
|
|
|
|||||
|
Cash and cash equivalents at beginning of year
|
|
|
|
|
|
|
|
|
|
|
|||||
|
Cash and cash equivalents at end of year
|
$
|
|
|
$
|
|
|
$
|
|
|
$
|
|
|
$
|
|
|
112
None.
Evaluation of Disclosure Controls and Procedures
As of December 31,
2017
, an evaluation was carried out under the supervision of and with the participation of CP's management, including CEO and CFO, of the effectiveness of the design and operation of the Company's disclosure controls and procedures as defined in Rules 13a-15(e) and 15d-15(e) of the Exchange Act. Based on that evaluation, the CEO and CFO concluded that these disclosure controls and procedures were effective as of December 31,
2017
, to ensure that information required to be disclosed by the Company in reports that they file or submit under the Exchange Act is (i) recorded, processed, summarized and reported within the time periods specified by the SEC rules and forms and (ii) accumulated and communicated to the Company’s management, including the CEO and CFO, as appropriate, to allow timely decisions regarding required disclosure.
Management's Report on Internal Control over Financial Reporting
Management is responsible for the financial statements and for establishing and maintaining adequate internal control over financial reporting for the Company as defined in Rules 13a-15(f) and 15d-15(f) of the Exchange Act. The Corporation’s internal control system was designed to provide reasonable assurance to the Corporation’s management and Board of Directors regarding the preparation and fair presentation of published financial statements.
Due to its inherent limitations, internal control over financial reporting may not prevent or detect misstatements. Also, projections of any evaluation of effectiveness to future periods are subject to the risk that controls may become inadequate because of changes in conditions, or that the degree of compliance with the policies or procedures may deteriorate.
Management has assessed the effectiveness of the Company’s internal control over financial reporting in accordance with the criteria set forth by the Committee of Sponsoring Organizations of the Treadway Commission in
Internal Control – Integrated Framework
(2013). Based on this assessment, management concluded that the Company maintained effective internal control over financial reporting as of December 31,
2017
. All internal control systems, no matter how well designed, have inherent limitations. Therefore, even those systems determined to be effective can provide only reasonable assurance with respect to the reliability of financial reporting and preparation of financial statements in accordance with generally accepted accounting principles.
The effectiveness of the Company's internal control over financial reporting as of December 31,
2017
has been audited by Deloitte LLP, the Company's independent registered public accounting firm, as stated in their report, which is included herein.
Changes in Internal Control over Financial Reporting
During the three months ended December 31,
2017
, the Company has not identified any changes in internal control over financial reporting that have materially affected, or are reasonably likely to materially affect, our internal control over financial reporting.
113
Report of Independent Registered Public Accounting Firm
To the Shareholders and the Board of Directors of Canadian Pacific Railway Limited
Opinion on Internal Control over Financial Reporting
We have audited the internal control over financial reporting of Canadian Pacific Railway Limited and subsidiaries (the “Company”) as of December 31, 2017, based on criteria established in
Internal Control-Integrated Framework (2013)
issued by the Committee of Sponsoring Organizations of the Treadway Commission (COSO). In our opinion, the Company maintained, in all material respects, effective internal control over financial reporting as of December 31, 2017, based on criteria established in
Internal Control - Integrated Framework (2013)
issued by COSO.
We have also audited, in accordance with the standards of the Public Company Accounting Oversight Board (United States) (PCAOB), the consolidated financial statements as of and for the year ended December 31, 2017, of the Company and our report dated February 16, 2018, expressed an unqualified opinion on those financial statements.
Basis for Opinion
The Company’s management is responsible for maintaining effective internal control over financial reporting and for its assessment of the effectiveness of internal control over financial reporting, included in the accompanying Management's Report on Internal Control over Financial Reporting. Our responsibility is to express an opinion on the Company’s internal control over financial reporting based on our audit. We are a public accounting firm registered with the PCAOB and are required to be independent with respect to the Company in accordance with the U.S. federal securities laws and the applicable rules and regulations of the Securities and Exchange Commission and the PCAOB.
We conducted our audit in accordance with the standards of the PCAOB. Those standards require that we plan and perform the audit to obtain reasonable assurance about whether effective internal control over financial reporting was maintained in all material respects. Our audit included obtaining an understanding of internal control over financial reporting, assessing the risk that a material weakness exists, testing and evaluating the design and operating effectiveness of internal control based on the assessed risk, and performing such other procedures as we considered necessary in the circumstances. We believe that our audit provides a reasonable basis for our opinion.
Definition and Limitations of Internal Control over Financial Reporting
A company’s internal control over financial reporting is a process designed to provide reasonable assurance regarding the reliability of financial reporting and the preparation of financial statements for external purposes in accordance with accounting principles generally accepted in the United States of America. A company’s internal control over financial reporting includes those policies and procedures that (1) pertain to the maintenance of records that, in reasonable detail, accurately and fairly reflect the transactions and dispositions of the assets of the company; (2) provide reasonable assurance that transactions are recorded as necessary to permit preparation of financial statements in accordance with accounting principles generally accepted in the United States of America, and that receipts and expenditures of the company are being made only in accordance with authorizations of management and directors of the company; and (3) provide reasonable assurance regarding prevention or timely detection of unauthorized acquisition, use, or disposition of the company’s assets that could have a material effect on the financial statements.
Because of its inherent limitations, internal control over financial reporting may not prevent or detect misstatements. Also, projections of any evaluation of effectiveness to future periods are subject to the risk that controls may become inadequate because of changes in conditions, or that the degree of compliance with the policies or procedures may deteriorate.
/s/ Deloitte LLP
Chartered Professional Accountants
Calgary, Canada
February 16, 2018
114
None.
115
Directors of Registrant
The information required by this Item will be contained in the Company’s Form 10-K/A, which will be filed no later than 120 days after December 31, 2017. This information will also be contained in the management proxy circular that we prepare in accordance with Canadian corporate and securities law requirements.
Executive Officers of Registrant
The information regarding executive officers is included in Part I of this report under Executive Officers of the Registrant, following Item 4. Mine Safety Disclosures.
Compliance with Section 16(a) of the Exchange Act
The information required by this Item will be contained in the Company’s Form 10-K/A, which will be filed no later than 120 days after December 31, 2017.
Code of Ethics for Chief Executive Officer and Senior Financial Officers
The information required by this Item will be contained in the Company’s Form 10-K/A, which will be filed no later than 120 days after December 31, 2017.
The information required by this Item will be contained in the Company’s Form 10-K/A, which will be filed no later than 120 days after December 31, 2017. This information will also be contained in the management proxy circular that we prepare in accordance with Canadian corporate and securities law requirements.
The information required by this Item will be contained in the Company’s Form 10-K/A, which will be filed no later than 120 days after December 31, 2017. This information will also be contained in the management proxy circular that we prepare in accordance with Canadian corporate and securities law requirements.
116
The following documents are filed as part of this report:
|
(a)
|
Financial Statements
|
The financial statements filed as part of this filing are listed on the Index to Consolidated Financial Statements in Item 8. Financial Statements and Supplementary Data.
|
(b)
|
Financial Statement Schedule
|
|
(in millions of Canadian dollars)
|
Beginning balance at January 1
|
Additions charged to expenses
|
Payments and other reductions
|
Impact of FX
|
Ending
balance at December 31 |
||||||||||
|
Accruals for personal injury and other claims liabilities
(1)
|
|||||||||||||||
|
2015
|
$
|
|
|
$
|
|
|
$
|
(
|
)
|
$
|
|
|
$
|
|
|
|
2016
|
$
|
|
|
$
|
|
|
$
|
(
|
)
|
$
|
|
|
$
|
|
|
|
2017
|
$
|
|
|
$
|
|
|
$
|
(
|
)
|
$
|
(
|
)
|
$
|
|
|
|
Environmental liabilities
|
|||||||||||||||
|
2015
|
$
|
|
|
$
|
|
|
$
|
(
|
)
|
$
|
|
|
$
|
|
|
|
2016
|
$
|
|
|
$
|
|
|
$
|
(
|
)
|
$
|
(
|
)
|
$
|
|
|
|
2017
|
$
|
|
|
$
|
|
|
$
|
(
|
)
|
$
|
(
|
)
|
$
|
|
|
(1)
Includes WCB, FELA, occupational, foreign car damage and property & lading damage claims.
|
(c)
|
Exhibits
|
Exhibits are listed in the exhibit index below. The exhibits include management contracts, compensatory plans and arrangements required to be filed as exhibits to the Form 10-K by Item 601 (10) (iii) of Regulation S-K.
|
Exhibit
|
Description
|
|
3
|
Articles of Incorporation and Bylaws:
|
|
4
|
Instruments Defining the Rights of Security Holders, Including Indentures:
|
117
118
|
10
|
Material Contracts:
|
|
|
|
|
|
|
|
|
|
119
120
121
|
101.INS**
|
XBRL Instance Document
|
|
101.SCH**
|
XBRL Taxonomy Extension Schema Document
|
|
101.CAL**
|
XBRL Taxonomy Extension Calculation Linkbase Document
|
|
101.LAB**
|
XBRL Taxonomy Extension Label Linkbase Document
|
|
101.DEF**
|
XBRL Taxonomy Extension Definition Linkbase Document
|
|
101.PRE**
|
XBRL Taxonomy Extension Presentation Linkbase Document
|
|
The following financial information from Canadian Pacific Railway Limited’s Annual Report on Form 10-K for the year ended December 31, 2017, formatted in Extensible Business Reporting Language (XBRL) includes: (i) the Consolidated Statements of Income of each of the years ended December 31, 2017, 2016, and 2015; (ii) the Consolidated Statements of Comprehensive Income for each of the years ended December 31, 2017, 2016, and 2015; (iii) the Consolidated Balance Sheets at December 31, 2017 and 2016; (iv) the Consolidated Statements of Cash Flows for the years ended December 31, 2017, 2016, and 2015; (v) the Consolidated Statements of Changes in Shareholders’ Equity for each of the three years ended December 31, 2017, 2016, and 2015; and (vi) the Notes to Consolidated Financial Statements.
|
|
* Management contract or compensatory arrangement
**Filed with this Statement
122
SIGNATURES
Pursuant to the requirements of Section 13 or 15(d) of the Securities Exchange Act of 1934, the Company has duly caused this report to be signed on its behalf by the undersigned, thereunto duly authorized.
|
CANADIAN PACIFIC RAILWAY LIMITED
|
|
|
(Registrant)
|
|
|
By:
|
/s/ KEITH CREEL
|
|
Keith Creel
|
|
|
Chief Executive Officer
|
|
Dated:
February 16, 2018
POWER OF ATTORNEY
Each of the undersigned do hereby appoint each of Nadeem Velani and Jeffrey J. Ellis, his or her true and lawful attorney-in-fact and agent, to sign on his or her behalf the Company’s Annual Report on Form 10-K, for the year ended
December 31, 2017
, and any and all amendments thereto, and to file the same, with all exhibits thereto, with the Securities and Exchange Commission.
Pursuant to the requirements of the Securities Exchange Act of 1934, this report has been signed below by the following persons on behalf of the Company and in the capacities indicated on
February 16, 2018
.
|
Signature
|
Title
|
|
/s/ KEITH CREEL
|
Chief Executive Officer and Director
|
|
Keith Creel
|
(Principal Executive Officer)
|
|
/s/ NADEEM VELANI
|
Executive Vice-President and Chief Financial Officer
|
|
Nadeem Velani
|
(Principal Financial Officer)
|
|
/s/ ANDREW F. REARDON
|
Chairman of the Board of Directors
|
|
Andrew F. Reardon
|
|
|
/s/ JOHN R. BAIRD
|
Director
|
|
John R. Baird
|
|
|
/s/ ISABELLE COURVILLE
|
Director
|
|
Isabelle Courville
|
|
|
/s/ GILLIAN H. DENHAM
|
Director
|
|
Gillian H. Denham
|
|
|
/s/ REBECCA MACDONALD
|
Director
|
|
Rebecca MacDonald
|
|
|
/s/ MATTHEW H. PAULL
|
Director
|
|
Matthew H. Paull
|
|
|
/s/ JANE L. PEVERETT
|
Director
|
|
Jane L. Peverett
|
|
|
/s/ GORDON T. TRAFTON II
|
Director
|
|
Gordon T. Trafton II
|
|
123
TABLE OF CONTENTS
Part IItem 1. BusinessItem 1A. Risk FactorsItem 1B. Unresolved Staff CommentsItem 2. PropertiesItem 3. Legal ProceedingsItem 4. Mine Safety DisclosuresPart IIItem 5. Market For Registrant's Common Equity, Related Shareholder Matters and Issuer Purchases Of Equity SecuritiesItem 6. Selected Financial DataItem 7. Management's Discussion and Analysis Of Financial Condition and Results Of OperationsItem 7A. Quantitative and Qualitative Disclosures About Market RiskItem 8. Financial Statements and Supplementary DataItem 9. Changes in and Disagreements with Accountants on Accounting and Financial DisclosureItem 9A. Controls and ProceduresItem 9B. Other InformationPart IIIItem 10. Directors, Executive Officers and Corporate GovernanceItem 11. Executive CompensationItem 12. Security Ownership Of Certain Beneficial Owners and Management and Related Stockholder MattersItem 13. Certain Relationships and Related Transactions, and Director IndependenceItem 14. Principal Accounting Fees and ServicesPart IVItem 15. Exhibits, Financial Statement Schedule