CAMPBELL SOUP CO
10-Ks and 10-Qs
|
|
|
|
|
|
|
|
|
|
|
|
|
|
|
|
|
|
|
|
|
|
|
|
|
|
|
|
|
|
|
|
|
|
|
|
|
|
|
|
|
|
|
|
|
|
|
|
|
|
|
|
|
|
|
|
UNITED STATES
SECURITIES AND EXCHANGE COMMISSION
Washington, D.C. 20549
Form 10-K
_________________________________________________________________________________
ANNUAL REPORT PURSUANT TO SECTION 13 OR 15(d)
OF THE SECURITIES EXCHANGE ACT OF 1934
|
For the Fiscal Year Ended
|
Commission File Number
|
|||
|
July 29, 2018
|
1-3822
|
|||

CAMPBELL SOUP COMPANY
|
New Jersey
|
21-0419870
|
|
State of Incorporation
|
I.R.S. Employer Identification No.
|
1 Campbell Place
Camden, New Jersey 08103-1799
Principal Executive Offices
Telephone Number: (856) 342-4800
Securities registered pursuant to Section 12(b) of the Act:
|
Title of Each Class
|
|
Name of Each Exchange on Which Registered
|
|
Capital Stock, par value $.0375
|
|
New York Stock Exchange
|
Securities registered pursuant to Section 12(g) of the Act: None
Indicate by check mark if the registrant is a well-known seasoned issuer, as defined in Rule 405 of the Securities Act.
þ
Yes
☐
No
Indicate by check mark if the registrant is not required to file reports pursuant to Section 13 or 15(d) of the Act.
☐
Yes
þ
No
Indicate by check mark whether the registrant: (1) has filed all reports required to be filed by Section 13 or 15(d) of the Securities Exchange Act of 1934 during the preceding 12 months (or for such shorter period that the registrant was required to file such reports), and (2) has been subject to such filing requirements for the past 90 days.
þ
Yes
☐
No
Indicate by check mark whether the registrant has submitted electronically and posted on its corporate web site, if any, every Interactive Data File required to be submitted and posted pursuant to Rule 405 of Regulation S-T during the preceding 12 months (or for such shorter period that the registrant was required to submit and post such files).
þ
Yes
☐
No
Indicate by check mark if disclosure of delinquent filers pursuant to Item 405 of Regulation S-K is not contained herein, and will not be contained, to the best of registrant’s knowledge, in definitive proxy or information statements incorporated by reference in Part III of this Form 10-K or any amendment to this Form 10-K.
☐
Indicate by check mark whether the registrant is a large accelerated filer, an accelerated filer, a non-accelerated filer, a smaller reporting company or an emerging growth company. See the definitions of "large accelerated filer," "accelerated filer," "smaller reporting company," and "emerging growth company" in Rule 12b-2 of the Exchange Act.
|
Large accelerated filer
þ
|
Accelerated filer
☐
|
|
Non-accelerated filer ☐ (Do not check if a smaller reporting company)
|
Smaller reporting company ☐
|
|
Emerging growth company ☐
|
|
If an emerging growth company, indicate by check mark if the registrant has elected not to use the extended transition period for complying with any new or revised financial accounting standards provided pursuant to Section 13(a) of the Exchange Act.
☐
Indicate by check mark whether the registrant is a shell company (as defined in Rule 12b-2 of the Exchange Act).
☐
Yes
þ
No
As of
January 26, 2018
(the last business day of the registrant’s most recently completed second fiscal quarter), the aggregate market value of capital stock held by non-affiliates of the registrant was approximately $9,014,993,646. There were 300,656,129 shares of capital stock outstanding as of
September 17, 2018
.
Portions of the Registrant’s Proxy Statement for the 2018 Annual Meeting of Shareholders are incorporated by reference into Part III.
TABLE OF CONTENTS
2
This Report contains "forward-looking" statements within the meaning of the Private Securities Litigation Reform Act of 1995. These forward-looking statements reflect our current expectations regarding our future results of operations, economic performance, financial condition and achievements. These forward-looking statements can be identified by words such as "anticipate," "believe," "estimate," "expect," "will," "goal," "plan," "vision" and similar expressions. One can also identify forward-looking statements by the fact that they do not relate strictly to historical or current facts, and may reflect anticipated cost savings or implementation of our strategic plan. These statements reflect our current plans and expectations and are based on information currently available to us. They rely on several assumptions regarding future events and estimates which could be inaccurate and which are inherently subject to risks and uncertainties. Risks and uncertainties include, but are not limited to, those discussed in "Risk Factors" and in the "Cautionary Factors That May Affect Future Results" in "Management’s Discussion and Analysis of Financial Condition and Results of Operations" in this Report. Our consolidated financial statements and the accompanying notes to the consolidated financial statements are presented in "Financial Statements and Supplementary Data."
Item 1.
Business
The Company
Unless otherwise stated, the terms "we," "us," "our" and the "company" refer to Campbell Soup Company and its consolidated subsidiaries.
We are a manufacturer and marketer of high-quality, branded food and beverage products. We organized as a business corporation under the laws of New Jersey on November 23, 1922; however, through predecessor organizations, we trace our heritage in the food business back to 1869. Our principal executive offices are in Camden, New Jersey 08103-1799.
In 2013, we acquired BF Bolthouse Holdco LLC (Bolthouse Farms) and Plum, PBC (formerly Plum Inc.) (Plum). In 2014, we acquired Kelsen Group A/S (Kelsen) and divested our European simple meals business. In 2015, we acquired the assets of Garden Fresh Gourmet. On December 12, 2017, we acquired Pacific Foods of Oregon, LLC (Pacific Foods) and, on March 26, 2018, we acquired Snyder's-Lance, Inc. (Snyder's-Lance). See Note 3 to the Consolidated Financial Statements for additional information on our recent acquisitions.
On August 30, 2018, we announced our vision to be a leading snacks and simple meals company, with a portfolio of best-in-class products and brands in our core North American market. In support of this strategy, we will continue to focus on the integration of Snyder’s-Lance. We also announced plans to pursue the divestiture of businesses within two operating segments: our international biscuits and snacks operating segment, which includes Arnott’s, Kelsen and our operations in Indonesia, Malaysia, Hong Kong and Japan; and the Campbell Fresh operating segment, which includes Bolthouse Farms, Garden Fresh Gourmet and the U.S. refrigerated soup business. In 2018, the international biscuits and snacks operating segment and the Campbell Fresh operating segment combined represent approximately $2.1 billion in net sales. We expect to use the proceeds from these divestitures to reduce debt. As a result of a more focused portfolio, we are pursuing increased multi-year cost savings initiatives with targeted annualized cost savings of $945 million by the end of 2022, which includes $295 million in synergies and run-rate cost savings from our acquisition of Snyder's-Lance. See "Management's Discussion and Analysis of Financial Condition and Results of Operations" for additional information regarding our strategy and cost savings initiatives.
Reportable Segments
Commencing in the third quarter of 2018, we have four operating segments and three reportable segments. The segments are aggregated based on similar economic characteristics, products, production processes, types or classes of customers, distribution methods, and regulatory environment. The reportable segments are:
|
•
|
The Americas Simple Meals and Beverages segment, which includes the retail and food service businesses in the U.S. and Canada. The segment includes the following products:
Campbell’s
condensed and ready-to-serve soups;
Swanson
broth and stocks;
Prego
pasta sauces;
Pace
Mexican sauces;
Campbell’s
gravies, pasta, beans and dinner sauces;
Swanson
canned poultry;
Plum
food and snacks;
V8
juices and beverages;
Campbell’s
tomato juice; and
Pacific
broth, soups, non-dairy beverages and other simple meals;
|
|
•
|
The Global Biscuits and Snacks segment, which represents an aggregation of the following operating segments: the U.S. snacks operating segment, which includes Pepperidge Farm cookies, crackers, bakery and frozen products in U.S. retail, and Snyder’s-Lance pretzels, sandwich crackers, potato chips, tortilla chips and other snacking products in the U.S. and Europe; and the international biscuits and snacks operating segment, which includes Arnott’s biscuits in Australia and Asia Pacific, Kelsen cookies globally, the simple meals and shelf-stable beverages business in Australia and Asia Pacific, and the business in Latin America; and
|
|
•
|
The Campbell Fresh segment, which includes: Bolthouse Farms fresh carrots, carrot ingredients, refrigerated beverages and refrigerated salad dressings; Garden Fresh Gourmet salsa, hummus, dips and tortilla chips; and the U.S. refrigerated soup business.
|
3
See Note 6 to the Consolidated Financial Statements and "Management's Discussion and Analysis of Financial Condition and Results of Operations" for additional information regarding our reportable segments.
Ingredients and Packaging
The ingredients and packaging materials required for the manufacture of our food and beverage products are purchased from various suppliers. These items are subject to price fluctuations from a number of factors, including changes in crop size, cattle cycles, crop disease, crop pests, product scarcity, demand for raw materials, commodity market speculation, energy costs, currency fluctuations, government-sponsored agricultural programs, import and export requirements (including tariffs), drought, water scarcity, temperature extremes, scarcity of suitable agricultural land, scarcity of organic ingredients and other factors that may be beyond our control during the growing and harvesting seasons. To help reduce some of this price volatility, we use a combination of purchase orders, short- and long-term contracts, inventory management practices and various commodity risk management tools for most of our ingredients and packaging. Ingredient inventories are generally at a peak during the late fall and decline during the winter and spring. Since many ingredients of suitable quality are available in sufficient quantities only during certain seasons, we make commitments for the purchase of such ingredients in their respective seasons. In addition, certain of the materials required for the manufacture of our products, including steel, have been or may be impacted by new or recently proposed tariffs. At this time, we do not anticipate any material restrictions on the availability of ingredients or packaging that would have a significant impact on our businesses. For information on the impact of inflation, see "Management’s Discussion and Analysis of Financial Condition and Results of Operations."
Customers
In most of our markets, sales and merchandising activities are conducted through our own sales force and/or third-party brokers and distribution partners. In the U.S., Canada and Latin America, our products are generally resold to consumers through retail food chains, mass discounters, mass merchandisers, club stores, convenience stores, drug stores, dollar stores, e-commerce and other retail, commercial and non-commercial establishments. Each of Pepperidge Farm and Snyder's-Lance also has a direct-store-delivery distribution model that uses independent contractor distributors. In the Asia Pacific region and Europe, our products are generally resold to consumers through retail food chains, convenience stores, e-commerce and other retail, commercial and non-commercial establishments. We make shipments promptly after acceptance of orders.
Our five largest customers accounted for approximately
38%
of our consolidated net sales in 2018,
39%
in 2017 and
40%
in 2016. Our largest customer, Wal-Mart Stores, Inc. and its affiliates, accounted for approximately
18%
of our consolidated net sales in 2018, and
20%
of our consolidated net sales in 2017 and 2016. All of our reportable segments sold products to Wal-Mart Stores, Inc. or its affiliates. No other customer accounted for 10% or more of our consolidated net sales. For additional information on our customers, see "Management’s Discussion and Analysis of Financial Condition and Results of Operations."
Trademarks and Technology
As of September 17, 2018, we owned over 4,400 trademark registrations and applications in over 160 countries. We believe our trademarks are of material importance to our business. Although the laws vary by jurisdiction, trademarks generally are valid as long as they are in use and/or their registrations are properly maintained and have not been found to have become generic. Trademark registrations generally can be renewed indefinitely as long as the trademarks are in use. We believe that our principal brands, including
Arnott's
,
Bolthouse Farms
,
Campbell's
,
Cape Cod
,
Chunky
,
Emerald
,
Garden Fresh Gourmet
,
Goldfish
,
KETTLE
,
Kettle Brand
,
Kjeldsens
,
Lance
,
Late July
,
Milano
,
Pace
,
Pacific
,
Pepperidge Farm
,
Plum
,
Pop Secret
,
Prego
,
Royal Dansk
,
Snack Factory Pretzel Crisps
,
Snyder's of Hanover
,
Swanson
,
and
V8
,
are protected by trademark law in the major markets where they are used.
Although we own a number of valuable patents, we do not regard any segment of our business as being dependent upon any single patent or group of related patents. In addition, we own copyrights, both registered and unregistered, proprietary trade secrets, technology, know-how, processes and other intellectual property rights that are not registered.
Competition
We operate in a highly competitive industry and experience competition in all of our categories. This competition arises from numerous competitors of varying sizes across multiple food and beverage categories, and includes producers of private label products, as well as other branded food and beverage manufacturers. Private label products are generally sold at prices lower than prices for branded products. Competitors market and sell their products through traditional retailers and e-commerce. All of these competitors vie for trade merchandising support and consumer dollars. The number of competitors cannot be reliably estimated. The principal areas of competition are brand recognition, taste, nutritional value, price, promotion, innovation, shelf space and customer service.
Working Capital
For information relating to our cash flows from operations and working capital items, see "Management’s Discussion and Analysis of Financial Condition and Results of Operations."
4
Capital Expenditures
During 2018, our aggregate capital expenditures were
$407 million
. We expect to spend approximately $400 million for capital projects in 2019. Major capital projects based on planned spend in 2019 include a U.S. warehouse optimization project, transition of production of the Toronto manufacturing facility to our U.S. thermal plants and ongoing refrigeration system replacement projects.
Research and Development
During the last three fiscal years, our expenditures on research and development activities relating to new products and the improvement and maintenance of existing products were
$110 million
in 2018,
$111 million
in 2017, and
$105 million
in 2016. The decrease from 2017 to 2018 was primarily due to lower investments in long-term innovation and lower incentive compensation costs, partially offset by the impact of acquisitions, inflation and other factors. The increase from 2016 to 2017 was primarily due to inflation and other factors, and investments in long-term innovation, partially offset by increased benefits from cost savings initiatives and lower incentive compensation costs.
Regulation
The manufacture and sale of consumer food products is highly regulated. In the U.S., our activities are subject to regulation by various federal government agencies, including the Food and Drug Administration, Department of Agriculture, Federal Trade Commission, Department of Labor, Department of Commerce and Environmental Protection Agency, as well as various state and local agencies. Our business is also regulated by similar agencies outside of the U.S. In addition, the current U.S. administration has implemented and is considering tariffs on certain imported commodities, including steel tariffs. In response, other countries have adopted and/or considering countervailing tariffs on imported food and agriculture products.
Environmental Matters
We have requirements for the operation and design of our facilities that meet or exceed applicable environmental rules and regulations. Of our
$407 million
in capital expenditures made during 2018, approximately $12 million were for compliance with environmental laws and regulations in the U.S. We further estimate that approximately $28 million of the capital expenditures anticipated during 2019 will be for compliance with U.S. environmental laws and regulations. We believe that continued compliance with existing environmental laws and regulations (both within the U.S. and elsewhere) will not have a material effect on capital expenditures, earnings or our competitive position. In addition, we continue to monitor existing and pending environmental laws and regulations within the U.S. and elsewhere relating to climate change and greenhouse gas emissions. While the impact of these laws and regulations cannot be predicted with certainty, we do not believe that compliance with these laws and regulations will have a material effect on capital expenditures, earnings or our competitive position.
Seasonality
Demand for soup products is seasonal, with the fall and winter months usually accounting for the highest sales volume. Sales of Kelsen products are also highest in the fall and winter months due primarily to holiday gift giving, including the Chinese New Year. Demand for our other products is generally evenly distributed throughout the year.
Employees
On
July 29, 2018
, we had approximately 23,000 employees.
Financial Information
Financial information for our reportable segments and geographic areas is found in Note 6 to the Consolidated Financial Statements. For risks attendant to our foreign operations, see "Risk Factors."
Websites
Our primary corporate website can be found at
www.campbellsoupcompany.com
. We make available free of charge at this website (under the "Investor Center — Financial Information — SEC Filings" caption) all of our reports (including amendments) filed or furnished pursuant to Section 13(a) or 15(d) of the Securities Exchange Act of 1934, as amended, including our annual report on Form 10-K, our quarterly reports on Form 10-Q and our current reports on Form 8-K. These reports are made available on the website as soon as reasonably practicable after their filing with, or furnishing to, the Securities and Exchange Commission.
All websites appearing in this Annual Report on Form 10-K are inactive textual references only, and the information in, or accessible through, such websites is not incorporated into this Annual Report on Form 10-K, or into any of our other filings with the Securities and Exchange Commission.
Item 1A.
Risk Factors
In addition to the factors discussed elsewhere in this Report, the following risks and uncertainties could materially adversely affect our business, financial condition and results of operations. Additional risks and uncertainties not presently known to us or that we currently deem immaterial also may impair our business operations and financial condition.
5
Operational Risk Factors
Our strategy may not be successful and our business or financial results may be adversely impacted
On August 30, 2018, we announced our vision to be a leading snacks and simple meals company, with a portfolio of best-in-class products and brands in our core North American market. This strategy entails a refocused portfolio that includes brands concentrated in slower-growing center-store categories in traditional retail grocery channels. Factors that may impact our success include our ability to:
|
•
|
capture increased market share in certain snacking and simple meals categories, while maintaining our leading market share in other categories;
|
•
identify and capitalize on customer or consumer trends;
•
design and implement effective retail execution plans;
•
design and implement effective advertising and marketing programs, including digital programs; and
•
secure or maintain sufficient shelf space at retailers.
If we are not successful in addressing these factors, or if there are changes in the underlying growth rates of the categories in which we compete, our strategy may not be successful and our business or financial results may be adversely impacted.
Our results may be adversely affected by our inability to complete or realize the projected benefits of divestitures
On August 30, 2018, we announced plans to pursue the divestiture of businesses within two operating segments: our international biscuits and snacks operating segment, which includes Arnott’s, Kelsen and our operations in Indonesia, Malaysia, Hong Kong and Japan; and the Campbell Fresh operating segment, which includes Bolthouse Farms, Garden Fresh Gourmet and the U.S. refrigerated soup business. We expect to use the proceeds from these divestitures to reduce debt. Our ability to successfully divest these businesses and any other businesses we decide to divest may depend in part on our ability to identify suitable buyers, negotiate favorable financial and other contractual terms and obtain all necessary regulatory approvals on the terms expected. Potential risks of divestitures may also include diversion of management's attention from other business concerns, loss of key employees, suppliers and/or customers of divested businesses, the inability to separate divested businesses or business units effectively and efficiently from our existing business operations and the inability to reduce or eliminate associated overhead costs. If we are unable to complete or realize the projected benefits of planned and/or future divestitures, we may not be able to reduce our debt as planned and our business or financial results may be adversely impacted.
We incurred substantial indebtedness to finance the acquisition of Snyder's-Lance
In connection with the closing of the acquisition of Snyder's-Lance and the payoff of Snyder's-Lance indebtedness, we incurred approximately $6.2 billion of indebtedness through a combination of senior notes and a senior unsecured term loan facility. This substantial level of indebtedness increased our debt service obligations. It may also have other important consequences to our business, including but not limited to:
|
•
|
increasing our exposure to fluctuations in interest rates;
|
|
•
|
subjecting us to financial and other covenants, the non-compliance with which could result in an event of default;
|
|
•
|
increasing our vulnerability to, and reducing our flexibility to respond to, general adverse economic and industry conditions;
|
|
•
|
limiting our flexibility in planning for, or reacting to, changes in our business and the industry in which we operate, including undertaking significant capital projects;
|
|
•
|
placing us at a competitive disadvantage as compared to our competitors, to the extent that they are not as highly leveraged; and
|
|
•
|
restricting us from pursuing certain business opportunities, including other acquisitions.
|
In addition, we regularly access the commercial paper markets for working capital needs and other general corporate purposes. If our credit ratings are further downgraded, we may have difficulty selling additional debt securities or borrowing money in the amounts and on the terms that might be available if our credit ratings were maintained. See "Management's Discussion and Analysis of Financial Condition and Results of Operations - Liquidity and Capital Resources" for information regarding our credit ratings.
Disruptions in the commercial paper market or other effects of volatile economic conditions on the credit markets may also reduce the amount of commercial paper that we can issue and raise our borrowing costs for both short- and long-term debt offerings. There can be no assurance that we will have access to the capital markets on terms we find acceptable. Limitations on our ability to access the capital markets, a reduction in our liquidity or an increase in our borrowing costs may adversely affect our business and financial results.
6
We may not realize the anticipated benefits from our cost reduction initiatives
We are pursuing multi-year cost savings initiatives with targeted annualized cost savings of $945 million by the end of 2022, which includes $295 million in synergies and run-rate cost savings from our acquisition of Snyder's-Lance. These initiatives will require a substantial amount of management and operational resources. Our management team must successfully execute the administrative and operational changes necessary to achieve the anticipated benefits of these initiatives and, in some respects, our plans to achieve these cost savings continue to be in development. See "Management's Discussion and Analysis of Financial Condition and Results of Operation - Restructuring Charges and Cost Savings Initiatives" for additional information on these initiatives. These and related demands on our resources may divert the organization's attention from other business issues, have adverse effects on existing business relationships with suppliers and customers and impact employee morale. Our success is partly dependent upon properly executing, and realizing cost savings or other benefits from, these often complex initiatives. Any failure to implement our initiatives could adversely affect our business or financial results.
The anticipated benefits of acquiring Snyder's-Lance may not be fully realized or realized within the time frame that we expect
We expect that the acquisition of Snyder's-Lance will result in various benefits including, among other things, cost savings, cost synergies, a strengthened market position and revenue opportunities. Achieving these anticipated benefits is subject to uncertainties, including whether we integrate in an efficient and effective manner, and general competitive factors in the marketplace. Integrating Snyder's-Lance will be a complex and time-consuming process that requires investment. We may experience unanticipated difficulties, delays or expenses related to the integration, including but not limited to:
|
•
|
diversion of management's attention from ongoing business concerns;
|
|
•
|
managing a larger combined business;
|
|
•
|
finalizing the integration of Snyder's-Lance's past acquisitions to the extent not yet completed;
|
|
•
|
perceived adverse changes in product offerings to consumers, whether or not these changes actually occur;
|
|
•
|
assumption of unknown risks and liabilities;
|
|
•
|
the retention of key suppliers and customers of Snyder's-Lance;
|
|
•
|
attracting new business and operational relationships; and
|
|
•
|
retaining and integrating key employees and maintaining employee morale.
|
We plan to combine certain operations, functions, systems and processes, which we may be unsuccessful or delayed in implementing. In addition, costs for synergies and integration may be more than anticipated, and there are many factors beyond our control that could affect the total amount or timing of these expenses. Although we expect that the elimination of duplicative costs and realization of other efficiencies related to the integration of the businesses will offset incremental costs over time, any net benefit may not be achieved in the near term or at all. The failure to effectively address any of these risks, or any other risks related to the integration of the Snyder's-Lance acquisition, may adversely affect our business and financial results.
We may not be able to increase prices to fully offset increases in the cost of transportation and logistics and prices of raw and
packaging materials
The cost of distribution has increased due to a significant rise in transportation and logistics costs, driven by excess demand, reduced availability and higher fuel costs. In addition, certain of the materials required for the manufacture of our products, including steel, have been or may be impacted by new or recently proposed tariffs.
As a manufacturer of food and beverage products, the raw and packaging materials used in our business include tomato paste, grains, beef, poultry, dairy, vegetables, steel, glass, paper and resin. Many of these materials are subject to price fluctuations from a number of factors, including but not limited to changes in crop size, cattle cycles, crop disease, crop pests, product scarcity, demand for raw materials, commodity market speculation, energy costs, currency fluctuations, government-sponsored agricultural programs, import and export requirements (including tariffs), drought, water scarcity, temperature extremes, scarcity of suitable agricultural land, scarcity of organic ingredients and other factors that may be beyond our control. We may not be able to offset any price increases through productivity or price increases or through our commodity hedging activity.
We try to pass along to customers some or all cost increases through increases in the selling prices of, or decreases in the packaging sizes of, some of our products. Higher product prices or smaller packaging sizes may result in reductions in sales volume. To the extent that price increases or packaging size decreases are not sufficient to offset these increased costs, and/or if they result in significant decreases in sales volume, our business results and financial condition may be adversely affected.
7
We operate in a highly competitive industry
We operate in the highly competitive food and beverage industry and experience competition in all of our categories. The principal areas of competition are brand recognition, taste, nutritional value, price, promotion, innovation, shelf space and customer service. A number of our primary competitors are larger than us and have substantial financial, marketing and other resources. In addition, reduced barriers to entry and easier access to funding are creating new competition. A strong competitive response from one or more of these competitors to our marketplace efforts, or a continued shift towards private label offerings, could result in us reducing prices, increasing marketing or other expenditures, and/or losing market share.
We may be adversely impacted by a changing customer landscape and the increased significance of some of our customers
Our businesses are largely concentrated in the traditional retail grocery trade, which has experienced slower growth than other retail channels, such as dollar stores, drug stores, club stores and e-commerce retailers. This trend away from traditional retail grocery is expected to continue in the future. If we are not successful in expanding sales in growing retail channels, our business or financial results may be adversely impacted. In addition, retailers with increased buying power and negotiating strength are seeking more favorable terms, including increased promotional programs funded by their suppliers. In 2018, U.S. soup sales declined primarily due to a key customer's different promotional approach for soup. These customers may also use more of their shelf space for their private label products. If we are unable to use our scale, marketing expertise, product innovation and category leadership positions to respond to these customer dynamics, our business or financial results could be adversely impacted.
In 2018, our five largest customers accounted for approximately
38%
of our consolidated net sales, with the largest customer, Wal-Mart Stores, Inc. and its affiliates, accounting for approximately
18%
of our consolidated net sales. There can be no assurance that our largest customers will continue to purchase our products in the same mix or quantities or on the same terms as in the past. Disruption of sales to any of these customers, or to any of our other large customers, for an extended period of time could adversely affect our business or financial results.
Our results may be adversely impacted if consumers do not maintain their favorable perception of our brands
We have a number of iconic brands with significant value. Maintaining and continually enhancing the value of these brands is critical to the success of our business. Brand value is primarily based on consumer perceptions. Success in promoting and enhancing brand value depends in large part on our ability to provide high-quality products. Brand value could diminish significantly due to a number of factors, including consumer perception that we have acted in an irresponsible manner, adverse publicity about our products, packaging or ingredients (whether or not valid), our failure to maintain the quality of our products, the failure of our products to deliver consistently positive consumer experiences, or the products becoming unavailable to consumers. The growing use of social and digital media by consumers increases the speed and extent that information and opinions can be shared. Negative posts or comments about us, our brands, products or packaging on social or digital media could seriously damage our brands and reputation. If we do not maintain the favorable perception of our brands, our results could be adversely impacted.
Disruption to our supply chain could adversely affect our business
Our ability to manufacture and/or sell our products may be impaired by damage or disruption to our manufacturing, warehousing or distribution capabilities, or to the capabilities of our suppliers, contract manufacturers, logistics service providers or independent distributors. This damage or disruption could result from execution issues, as well as factors that are hard to predict or beyond our control, such as product or raw material scarcity, adverse weather conditions, natural disasters, fire, terrorism, pandemics, strikes or other events. Production of the agricultural commodities used in our business may also be adversely affected by drought, water scarcity, temperature extremes, scarcity of suitable agricultural land, scarcity of organic ingredients, crop size, cattle cycles, crop disease and crop pests. Failure to take adequate steps to mitigate the likelihood or potential impact of such events, or to effectively manage such events if they occur, may adversely affect our business or financial results, particularly in circumstances when a product is sourced from a single supplier or location. Disputes with significant suppliers, contract manufacturers, logistics service providers or independent distributors, including disputes regarding pricing or performance, may also adversely affect our ability to manufacture and/or sell our products, as well as our business or financial results.
If our food products become adulterated or are mislabeled, we might need to recall those items, and we may experience product liability claims and damage to our reputation
We have in the past and we may, in the future, need to recall some of our products if they become adulterated or if they are mislabeled, and we may also be liable if the consumption of any of our products causes injury to consumers. A widespread product recall could result in significant losses due to the costs of a recall, the destruction of product inventory, and lost sales due to the unavailability of product for a period of time. We could also suffer losses from a significant adverse product liability judgment. A significant product recall or product liability claim could also result in adverse publicity, damage to our reputation, and a loss of consumer confidence in the safety and/or quality of our products, ingredients or packaging. In addition, if another company recalls or experiences negative publicity related to a product in a category in which we compete, consumers might reduce their overall consumption of products in that category.
8
Our non-U.S. operations pose additional risks to our business
In 2018, approximately 19% of our consolidated net sales were generated outside of the U.S. Our business or financial condition may be adversely affected due to the risks of doing business in these markets, including but not limited to the following:
•
unfavorable changes in tariffs, quotas, trade barriers or other export and import restrictions;
|
•
|
the adverse impact of foreign tax treaties and policies;
|
|
•
|
the difficulty and/or costs of complying with a wide variety of laws, treaties and regulations, including anti-corruption laws and regulations such as the U.S. Foreign Corrupt Practices Act;
|
|
•
|
the difficulty and/or costs of designing and implementing an effective control environment across diverse regions and employee bases;
|
|
•
|
political or economic instability, including the possibility of civil unrest, public corruption, armed hostilities or terrorist acts;
|
|
•
|
the possible nationalization of operations;
|
|
•
|
the difficulty of enforcing remedies and protecting intellectual property in various jurisdictions; and
|
|
•
|
restrictions on the transfer of funds to and from countries outside of the U.S., including potential adverse tax consequences.
|
In addition, we hold assets and incur liabilities, generate revenue, and pay expenses in a variety of currencies other than the U.S. dollar, primarily the Australian dollar and the Canadian dollar. Our consolidated financial statements are presented in U.S. dollars, and we must translate our assets, liabilities, sales and expenses into U.S. dollars for external reporting purposes. As a result, changes in the value of the U.S. dollar due to fluctuations in currency exchange rates or currency exchange controls may materially and adversely affect the value of these items in our consolidated financial statements, even if their value has not changed in their local currency.
On August 30, 2018, we announced plans to pursue the divestiture of our international biscuits and snacks operating segment, which includes Arnott’s, Kelsen and our operations in Indonesia, Malaysia, Hong Kong and Japan. If and until this operating segment is divested, we expect to continue to conduct business as usual in markets outside of the U.S.
An impairment of the carrying value of goodwill or other indefinite-lived intangible assets could adversely affect our financial results and net worth
As of
July 29, 2018
, we had goodwill of
$4.580 billion
and other indefinite-lived intangible assets of
$3.123 billion
. Goodwill and indefinite-lived intangible assets are initially recorded at fair value and not amortized, but are tested for impairment at least annually or more frequently if impairment indicators arise. We test goodwill at the reporting unit level by comparing the carrying value of the net assets of the reporting unit, including goodwill, to the unit's fair value. Similarly, we test indefinite-lived intangible assets by comparing the fair value of the assets to their carrying values. Fair value for both goodwill and other indefinite-lived intangible assets is determined based on a discounted cash flow analysis. If the carrying values of the reporting unit or indefinite-lived intangible assets exceed their fair value, the goodwill or indefinite-lived intangible assets are considered impaired and reduced to fair value. Factors that could result in an impairment include a change in revenue growth rates, operating margins, weighted average cost of capital, future economic and market conditions or assumed royalty rates. We have, in the most recently completed and prior years, experienced impairment charges. See "Significant Accounting Estimates" and Note 5 to the Consolidated Financial Statements for additional information on past impairments. We may be required in the future to record additional impairment of the carrying value of goodwill or other indefinite-lived intangible assets, which could adversely affect our financial results and net worth.
Our intellectual property rights are valuable, and any inability to protect them could reduce the value of our products and brands
We consider our intellectual property rights, particularly our trademarks, to be a significant and valuable aspect of our business. We protect our intellectual property rights through a combination of trademark, patent, copyright and trade secret protection, contractual agreements and policing of third-party misuses of our intellectual property. Our failure to obtain or adequately protect our intellectual property or any change in law that lessens or removes the current legal protections of our intellectual property may diminish our competitiveness and adversely affect our business and financial results.
Competing intellectual property claims that impact our brands or products may arise unexpectedly. Any litigation or disputes regarding intellectual property may be costly and time-consuming and may divert the attention of our management and key personnel from our business operations. We also may be subject to significant damages or injunctions against development, launch and sale of certain products. Any of these occurrences may harm our business and financial results.
9
We may be adversely impacted by increased liabilities and costs related to
our defined benefit pension plans
We sponsor a number of defined benefit pension plans for certain employees in the U.S. and various non-U.S. locations. The major defined benefit pension plans are funded with trust assets invested in a globally diversified portfolio of securities and other investments. Changes in regulatory requirements or the market value of plan assets, investment returns, interest rates and mortality rates may affect the funded status of our defined benefit pension plans and cause volatility in the net periodic benefit cost, future funding requirements of the plans and the funded status as recorded on the balance sheet. A significant increase in our obligations or future funding requirements could have a material adverse effect on our financial results.
We may be adversely impacted by a failure or security breach of our information technology systems
Our information technology systems are critically important to our operations. We rely on our information technology systems (some of which are outsourced to third parties) to manage our data, communications and business processes, including our marketing, sales, manufacturing, procurement, logistics, customer service, accounting and administrative functions. If we do not allocate and effectively manage the resources necessary to build, sustain and protect appropriate information technology systems, our business or financial results could be adversely impacted. Furthermore, our information technology systems may be vulnerable to attack or other security breaches (including the access to or acquisition of customer, consumer or other confidential information), service disruptions or other system failures. If we are unable to prevent or adequately respond to and resolve these breaches, disruptions or failures, our operations may be impacted, and we may suffer other adverse consequences such as reputational damage, litigation, remediation costs and/or penalties under various data privacy laws and regulations.
To address the risks to our information technology systems and the associated costs, we maintain an information security program that includes updating technology and security policies, cyber insurance, employee training, and monitoring and routine testing of our information technology systems. Although we have not experienced a material incident to date, there can be no assurance that these measures will prevent or limit the impact of a future incident.
We may not be able to attract and retain the highly skilled people we need to support our business
We depend on the skills and continued service of key personnel, including our experienced management team. In addition, our ability to achieve our strategic and operating goals depends on our ability to identify, hire, train and retain qualified individuals. We compete with other companies both within and outside of our industry for talented personnel, and we may lose key personnel or fail to attract, train and retain other talented personnel. Any such loss or failure may adversely affect our business or financial results. In addition, activities related to identifying, recruiting, hiring and integrating qualified individuals may require significant time and expense. We may not be able to locate suitable replacements for any key employees who leave, or offer employment to potential replacements on reasonable terms, each of which may adversely affect our business and financial results.
On May 18, 2018, we announced the appointment of an Interim President and Chief Executive Officer. The search for and transition to a permanent President and Chief Executive Officer may result in disruptions to our business and uncertainty among investors, employees and others concerning our future direction and performance. Any such disruptions and uncertainty, as well as the failure to successfully identify, attract or retain a permanent President and Chief Executive Officer, could have an adverse effect on our business and financial results.
Our results may be adversely affected by our inability to complete or realize the projected benefits of acquisitions and other strategic transactions
We may undertake additional acquisitions or other strategic transactions. Our ability to meet our objectives with respect to acquisitions and other strategic transactions may depend in part on our ability to identify suitable counterparties, negotiate favorable financial and other contractual terms, obtain all necessary regulatory approvals on the terms expected and complete those transactions. Potential risks also include:
|
•
|
the inability to integrate acquired businesses into our existing operations in a timely and cost-efficient manner;
|
|
•
|
diversion of management's attention from other business concerns;
|
|
•
|
potential loss of key employees, suppliers and/or customers of acquired businesses;
|
|
•
|
assumption of unknown risks and liabilities;
|
|
•
|
the inability to achieve anticipated benefits, including revenues or other operating results;
|
|
•
|
operating costs of acquired businesses may be greater than expected;
|
|
•
|
the inability to promptly implement an effective control environment; and
|
|
•
|
the risks inherent in entering markets or lines of business with which we have limited or no prior experience.
|
Acquisitions outside the U.S. may present added unique challenges and increase our exposure to risks associated with foreign operations, including foreign currency risks and risks associated with local regulatory regimes.
10
Market Conditions and Other General Risk Factors
Actions of activist shareholders could cause us to incur substantial costs, divert management's attention and resources, and have an adverse effect on our business
We have become the target of activist shareholder activities. If these activities continue, our business could be adversely affected because responding to proxy contests and reacting to other actions by activist shareholders can be costly and time-consuming, disrupt our operations and divert the attention of management and our employees. In addition, perceived uncertainties as to our future direction, strategy or leadership created as a consequence of activist shareholder initiatives may result in the loss of potential business opportunities, harm our ability to attract new investors, customers, employees, suppliers and other strategic partners, and cause our share price to experience periods of volatility or stagnation.
We face risks related to recession, financial and credit market disruptions
and other economic conditions
Customer and consumer demand for our products may be impacted by weak economic conditions, recession, equity market volatility or other negative economic factors in the U.S. or other nations. Similarly, disruptions in financial and/or credit markets may impact our ability to manage normal commercial relationships with our customers, suppliers and creditors. In addition, changes in tax or interest rates in the U.S. or other nations, whether due to recession, financial and credit market disruptions or other reasons, may adversely impact us.
Adverse changes in the global climate or extreme weather conditions could adversely affect our business or operations
Our business or financial results could be adversely affected by changing global temperatures or weather patterns or by extreme or unusual weather conditions. Adverse changes in the global climate or extreme or unusual weather conditions could:
|
•
|
unfavorably impact the cost or availability of raw or packaging materials, especially if such events have an adverse impact on agricultural productivity or on the supply of water;
|
|
•
|
disrupt our ability, or the ability of our suppliers or contract manufacturers, to manufacture or distribute our products;
|
|
•
|
disrupt the retail operations of our customers; or
|
|
•
|
unfavorably impact the demand for, or the consumer's ability to purchase, our products.
|
In addition, there is growing concern that the release of carbon dioxide and other greenhouse gases into the atmosphere may be impacting global temperatures and weather patterns and contributing to extreme or unusual weather conditions. This growing concern may result in more regional, federal, and/or global legal and regulatory requirements to reduce or mitigate the effects of greenhouse gases. Adoption of such additional regulation may result in increased compliance costs, capital expenditures and other financial obligations that could adversely affect our business and financial results.
Legal and Regulatory Risk Factors
We may be adversely impacted by legal and regulatory proceedings or claims
We are party to a variety of legal and regulatory proceedings and claims arising out of the normal course of business. Since these actions are inherently uncertain, there is no guarantee that we will be successful in defending ourselves against such proceedings or claims, or that our assessment of the materiality or immateriality of these matters, including any reserves taken in connection with such matters, will be consistent with the ultimate outcome of such proceedings or claims. The marketing of food products has come under increased regulatory scrutiny in recent years, and the food industry has been subject to an increasing number of proceedings and claims relating to alleged false or deceptive marketing under federal, state and foreign laws or regulations. In addition, the independent contractor distribution model, which is used by Pepperidge Farm and Snyder’s-Lance, has come under increased regulatory scrutiny. Our independent contractor distribution model has also been the subject of various lawsuits in recent years. In the event we are unable to successfully defend ourselves against these proceedings or claims, or if our assessment of the materiality of these proceedings or claims proves inaccurate, our business or financial results may be adversely affected. In addition, our reputation could be damaged by allegations made in proceedings or claims (even if untrue).
Increased regulation or changes in law could adversely affect our business or financial results
The manufacture and marketing of food products is extensively regulated. Various laws and regulations govern the processing, packaging, storage, distribution, marketing, advertising, labeling, quality and safety of our food products, as well as the health and safety of our employees and the protection of the environment. In the U.S., we are subject to regulation by various federal government agencies, including but not limited to the Food and Drug Administration, the Department of Agriculture, the Federal Trade Commission, the Occupational Safety and Health Administration and the Environmental Protection Agency, as well as various state and local agencies. We are also regulated by similar agencies outside the U.S.
Governmental and administrative bodies within the U.S. are considering a variety of tax, trade and other regulatory reforms. Trade reforms include tariffs on certain materials used in the manufacture of our products and tariffs on certain finished products.
11
Changes in legal or regulatory requirements (such as new food safety requirements and revised regulatory requirements for the labeling of nutrition facts, serving sizes and genetically modified ingredients), or evolving interpretations of existing legal or regulatory requirements, may result in increased compliance cost, capital expenditures and other financial obligations that could adversely affect our business and financial results.
Item 1B.
Unresolved Staff Comments
None.
Item 2.
Properties
Our principal executive offices are company-owned and located in Camden, New Jersey. The following table sets forth our principal manufacturing facilities and the business segment that primarily uses each of the facilities:
Principal Manufacturing Facilities
|
Inside the U.S.
|
||||
|
Arizona
|
Massachusetts
|
Pennsylvania
|
||
|
Goodyear (GBS)
|
Hyannis (GBS)
|
Denver (GBS)
|
||
|
California
|
Michigan
|
Downingtown (GBS)
|
||
|
Bakersfield (CF)
|
Ferndale (CF)
|
Hanover (GBS)
|
||
|
Dixon (ASMB)
|
Grand Rapids (CF)
|
Texas
|
||
|
Stockton (ASMB)
|
New Jersey
|
Paris (ASMB)
|
||
|
Connecticut
|
East Brunswick (GBS)
|
Utah
|
||
|
Bloomfield (GBS)
|
North Carolina
|
Richmond (GBS)
|
||
|
Florida
|
Charlotte (GBS)
|
Washington
|
||
|
Lakeland (GBS)
|
Maxton (ASMB)
|
Everett (CF)
|
||
|
Georgia
|
Ohio
|
Prosser (CF)
|
||
|
Columbus (GBS)
|
Ashland (GBS)
|
Wisconsin
|
||
|
Illinois
|
Napoleon (ASMB)
|
Beloit (GBS)
|
||
|
Downers Grove (GBS)
|
Willard (GBS)
|
Franklin (GBS)
|
||
|
Indiana
|
Oregon
|
Milwaukee (ASMB)
|
||
|
Jeffersonville (GBS)
|
Salem (GBS)
|
|||
|
Tualatin (ASMB)
|
||||
|
Outside the U.S.
|
||||
|
Australia
|
Denmark
|
Indonesia
|
||
|
Huntingwood (GBS)
|
Nørre Snede (GBS)
|
Bekasi (GBS)
|
||
|
Marleston (GBS)
|
Ribe (GBS)
|
Malaysia
|
||
|
Shepparton (GBS)
|
England
|
Selangor Darul Ehsan (GBS)
|
||
|
Virginia (GBS)
|
Norwich (GBS)
|
|||
|
Canada
|
Wednesbury (GBS)
|
|||
|
Toronto (ASMB)
|
||||
ASMB - Americas Simple Meals and Beverages
GBS - Global Biscuits and Snacks
CF - Campbell Fresh
Each of the foregoing manufacturing facilities is company-owned, except the Selangor Darul Ehsan, Malaysia, and the East Brunswick, New Jersey, facilities, which are leased. We also maintain principal business unit offices in Charlotte, North Carolina; Hanover, Pennsylvania; Norwalk, Connecticut; Santa Monica, California; Tualatin, Oregon; Mexico City, Mexico; Nørre Snede, Denmark; North Strathfield, Australia; Norwich, England; and Toronto, Canada.
We believe that our manufacturing and processing plants are well maintained and, together with facilities operated by our contract manufacturers, are generally adequate to support the current operations of the businesses.
12
Item
3.
Legal Proceedings
None.
Item 4.
Mine Safety Disclosures
Not applicable.
Executive Officers of the Company
The following is a list of our executive officers as of September 17, 2018:
|
Name
|
Present Title & Business Experience
|
Age
|
Year First
Appointed
Executive
Officer
|
|
Xavier Boza
|
Senior Vice President and Chief Human Resources Officer. Vice President, Human Resources of Campbell Soup Company (2015 - 2018). Regional Vice President, Human Resources of Kellogg Company (2013 - 2015).
|
54
|
2018
|
|
Adam G. Ciongoli
|
Senior Vice President and General Counsel. Executive Vice President and General Counsel of Lincoln Financial Group (2012 - 2015).
|
50
|
2015
|
|
Anthony P. DiSilvestro
|
Senior Vice President and Chief Financial Officer. We have employed Mr. DiSilvestro in an executive or managerial capacity for at least five years.
|
59
|
2004
|
|
Robert J. Furbee
|
Senior Vice President. We have employed Mr. Furbee in an executive or managerial capacity for at least five years.
|
56
|
2017
|
|
Keith R. McLoughlin
|
Interim President and Chief Executive Officer. Director of Campbell Soup Company (2016 - present). President and Chief Executive Officer of AB Electrolux (2011 - 2016).
|
62
|
2018
|
|
Luca Mignini
|
Senior Vice President and Chief Operating Officer. We have employed Mr. Mignini in an executive or managerial capacity for at least five years.
|
56
|
2013
|
|
Emily Waldorf
|
Senior Vice President, Corporate Strategy. We have employed Ms. Waldorf in positions related to corporate strategy for at least five years.
|
40
|
2018
|
All of the executive officers were appointed at the November 2017 meeting of the Board of Directors, except (i) Mr. Boza was appointed at an August 2018 meeting with his appointment effective as of August 1, 2018, (ii) Mr. McLoughlin was appointed at a May 2018 meeting with his appointment effective as of May 18, 2018, and (iii) Ms. Waldorf was appointed by resolution with her appointment effective as of April 5, 2018.
|
Item 5.
|
Market for Registrant’s Capital Stock, Related Shareholder Matters and Issuer Purchases of Equity Securities
|
Market for Registrant’s Capital Stock
Our capital stock is listed and principally traded on the New York Stock Exchange. On September 17, 2018, there were 18,414 holders of record of our capital stock. Market price and dividend information with respect to our capital stock are set forth in Note 20 to the Consolidated Financial Statements. Future dividends will be dependent upon future earnings, financial requirements and other factors.
Return to Shareholders
*
Performance Graph
The information contained in this Return to Shareholders Performance Graph section shall not be deemed to be "soliciting material" or "filed" or incorporated by reference in future filings with the Securities and Exchange Commission, or subject to the liabilities of Section 18 of the Securities Exchange Act of 1934, as amended (the Exchange Act), except to the extent we specifically incorporate it by reference into a document filed under the Securities Exchange Act of 1933, as amended, or the Exchange Act.
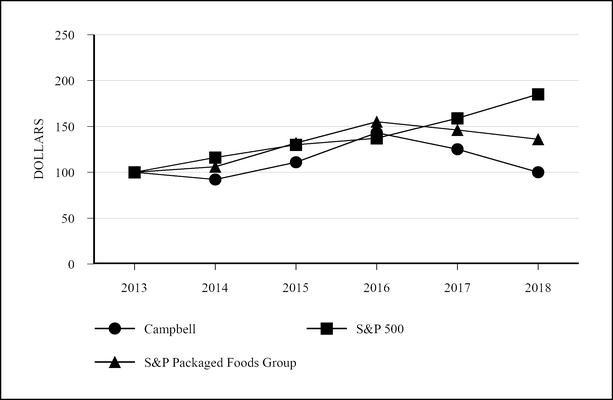
The following graph compares the cumulative total shareholder return (TSR) on our stock with the cumulative total return of the Standard & Poor’s 500 Stock Index (the S&P 500) and the Standard & Poor’s Packaged Foods Index (the S&P Packaged Foods Group). The graph assumes that $100 was invested on July 26, 2013, in each of our stock, the S&P 500 and the S&P Packaged Foods Group, and that all dividends were reinvested. The total cumulative dollar returns shown on the graph represent the value that such investments would have had on
July 29, 2018
.
13
*
Stock appreciation plus dividend reinvestment.
|
2013
|
2014
|
2015
|
2016
|
2017
|
2018
|
|||||||
|
Campbell
|
100
|
92
|
111
|
143
|
125
|
100
|
||||||
|
S&P 500
|
100
|
116
|
130
|
137
|
159
|
185
|
||||||
|
S&P Packaged Foods Group
|
100
|
106
|
132
|
155
|
146
|
136
|
||||||
14
Issuer Purchases of Equity Securities
None.
Item 6.
Selected Financial Data
|
Fiscal Year
|
2018
(1)
|
2017
(2)
|
2016
(3)
|
2015
(4)
|
2014
(5)
|
||||||||||||||
|
(Millions, except per share amounts)
|
|||||||||||||||||||
|
Summary of Operations
|
|||||||||||||||||||
|
Net sales
|
$
|
8,685
|
|
$
|
7,890
|
|
$
|
7,961
|
|
$
|
8,082
|
|
$
|
8,268
|
|
||||
|
Earnings before interest and taxes
|
469
|
|
1,400
|
|
960
|
|
1,054
|
|
1,267
|
|
|||||||||
|
Earnings before taxes
|
272
|
|
1,293
|
|
849
|
|
949
|
|
1,148
|
|
|||||||||
|
Earnings from continuing operations
|
261
|
|
887
|
|
563
|
|
666
|
|
774
|
|
|||||||||
|
Earnings from discontinued operations
|
—
|
|
—
|
|
—
|
|
—
|
|
81
|
|
|||||||||
|
Net earnings
|
261
|
|
887
|
|
563
|
|
666
|
|
855
|
|
|||||||||
|
Net earnings attributable to Campbell Soup Company
|
261
|
|
887
|
|
563
|
|
666
|
|
866
|
|
|||||||||
|
Financial Position
|
|||||||||||||||||||
|
Plant assets - net
|
$
|
3,233
|
|
$
|
2,454
|
|
$
|
2,407
|
|
$
|
2,347
|
|
$
|
2,318
|
|
||||
|
Total assets
|
14,529
|
|
7,726
|
|
7,837
|
|
8,077
|
|
8,100
|
|
|||||||||
|
Total debt
|
9,894
|
|
3,536
|
|
3,533
|
|
4,082
|
|
4,003
|
|
|||||||||
|
Total equity
|
1,373
|
|
1,645
|
|
1,533
|
|
1,377
|
|
1,602
|
|
|||||||||
|
Per Share Data
|
|||||||||||||||||||
|
Earnings from continuing operations attributable to Campbell Soup Company - basic
|
$
|
0.87
|
|
$
|
2.91
|
|
$
|
1.82
|
|
$
|
2.13
|
|
$
|
2.50
|
|
||||
|
Earnings from continuing operations attributable to Campbell Soup Company - assuming dilution
|
0.86
|
|
2.89
|
|
1.81
|
|
2.13
|
|
2.48
|
|
|||||||||
|
Net earnings attributable to Campbell Soup Company - basic
|
0.87
|
|
2.91
|
|
1.82
|
|
2.13
|
|
2.76
|
|
|||||||||
|
Net earnings attributable to Campbell Soup Company - assuming dilution
|
0.86
|
|
2.89
|
|
1.81
|
|
2.13
|
|
2.74
|
|
|||||||||
|
Dividends declared
|
1.40
|
|
1.40
|
|
1.248
|
|
1.248
|
|
1.248
|
|
|||||||||
|
Other Statistics
|
|||||||||||||||||||
|
Capital expenditures
|
$
|
407
|
|
$
|
338
|
|
$
|
341
|
|
$
|
380
|
|
$
|
347
|
|
||||
|
Weighted average shares outstanding - basic
|
301
|
|
305
|
|
309
|
|
312
|
|
314
|
|
|||||||||
|
Weighted average shares outstanding - assuming dilution
|
302
|
|
307
|
|
311
|
|
313
|
|
316
|
|
|||||||||
____________________________________
(All per share amounts below are on a diluted basis)
In March 2017, the Financial Accounting Standards Board (FASB) issued guidance that changes the presentation of net periodic pension cost and net periodic postretirement benefit cost. The guidance also allows only the service cost component to be eligible for capitalization when applicable (for example, as a cost of internally manufactured inventory). We adopted the guidance in the first quarter of 2018.
In March 2016, the FASB issued guidance that amends accounting for share-based payments, including the accounting for income taxes, forfeitures, and statutory withholding requirements, as well as classification in the statement of cash flows. We adopted the guidance in 2017.
In April 2015, the FASB issued guidance that requires debt issuance costs to be presented in the balance sheet as a reduction from the carrying value of the associated debt liability, consistent with the presentation of a debt discount. We adopted the guidance in 2016 and retrospectively adjusted all prior periods.
In November 2015, the FASB issued guidance that requires deferred tax liabilities and assets to be classified as noncurrent in the balance sheet. We adopted the guidance in 2016 on a prospective basis and modified the presentation of deferred taxes in the Consolidated Balance Sheet as of July 31, 2016.
The 2014 fiscal year consisted of 53 weeks. All other periods had 52 weeks.
|
(1)
|
The 2018 earnings from continuing operations attributable to Campbell Soup Company were impacted by the following: a restructuring charge, related costs and administrative and marketing and selling expenses of $136 million ($.45 per share)
|
15
associated with restructuring and cost savings initiatives; gains of $103 million ($.34 per share) associated with mark-to-market and curtailment adjustments for defined benefit pension and postretirement plans; impairment charges of $612 million ($2.03 per share) related to the Bolthouse Farms refrigerated beverages and salad dressings reporting unit, the deli reporting unit, the Bolthouse Farms carrot and carrot ingredients reporting unit and the
Plum
trademark; transaction and integration costs of $73 million ($.24 per share) associated with the acquisition of Snyder's-Lance; a net tax benefit of $126 million ($.42 per share) due to the enactment of the Tax Cuts and Jobs Act that was signed into law in December 2017; and a loss of $15 million ($.05 per share) related to the settlement of a legal claim.
|
(2)
|
The 2017 earnings from continuing operations attributable to Campbell Soup Company were impacted by the following: a restructuring charge, related costs and administrative expenses of $37 million ($.12 per share) associated with restructuring and cost savings initiatives; gains of $116 million ($.38 per share) associated with mark-to-market adjustments for defined benefit pension and postretirement plans; impairment charges of $180 million ($.59 per share) related to the intangible assets of the Bolthouse Farms carrot and carrot ingredients reporting unit and the Garden Fresh Gourmet reporting unit; and a tax benefit and reduction to interest expense of $56 million ($.18 per share) primarily associated with the sale of intercompany notes receivable to a financial institution.
|
|
(3)
|
The 2016 earnings from continuing operations attributable to Campbell Soup Company were impacted by the following: a restructuring charge and administrative expenses of $49 million ($.16 per share) associated with restructuring and cost savings initiatives; losses of $200 million ($.64 per share) associated with mark-to-market adjustments for defined benefit pension and postretirement plans; a gain of $25 million ($.08 per share) associated with a settlement of a claim related to the Kelsen acquisition; and an impairment charge of $127 million ($.41 per share) related to the intangible assets of the Bolthouse Farms carrot and carrot ingredients reporting unit.
|
|
(4)
|
The 2015 earnings from continuing operations attributable to Campbell Soup Company were impacted by the following: a restructuring charge and administrative expenses of $78 million ($.25 per share) associated with restructuring and cost savings initiatives and losses of $87 million ($.28 per share) associated with mark-to-market adjustments for defined benefit pension and postretirement plans.
|
|
(5)
|
The 2014 earnings from continuing operations attributable to Campbell Soup Company were impacted by the following: a restructuring charge and related costs of $36 million ($.11 per share) associated with restructuring initiatives; losses of $19 million ($.06 per share) associated with mark-to-market adjustments for defined benefit pension and postretirement plans; a loss of $6 million ($.02 per share) on foreign exchange forward contracts used to hedge the proceeds from the sale of the European simple meals business; $7 million ($.02 per share) tax expense associated with the sale of the European simple meals business; and the estimated impact of the additional week of $25 million ($.08 per share). Earnings from discontinued operations included a gain of $72 million ($.23 per share) on the sale of the European simple meals business.
|
Selected Financial Data should be read in conjunction with the Notes to Consolidated Financial Statements.
Item 7.
Management's Discussion and Analysis of Financial Condition and Results of Operations
OVERVIEW
This Management’s Discussion and Analysis of Financial Condition and Results of Operations is provided as a supplement to, and should be read in conjunction with, our consolidated financial statements and the accompanying notes to the consolidated financial statements presented in "Financial Statements and Supplementary Data," as well as the information contained in "Risk Factors."
Unless otherwise stated, the terms "we," "us," "our" and the "company" refer to Campbell Soup Company and its consolidated subsidiaries.
Executive Summary
We are a manufacturer and marketer of high-quality, branded food and beverage products. We operate in a highly competitive industry and experience competition in all of our categories. On December 12, 2017, we completed the acquisition of Pacific Foods of Oregon, LLC (Pacific Foods). The purchase price was
$688 million
. On March 26, 2018, we completed the acquisition of Snyder’s-Lance, Inc. (Snyder's-Lance) for total consideration of
$6.112 billion
. For additional information on our recent acquisitions, see Note 3 to the Consolidated Financial Statements.
Commencing in the third quarter of 2018, we formed a new U.S. snacking unit, which combines Snyder's-Lance and Pepperidge Farm, and is an operating segment. As of the third quarter of 2018, we have four operating segments based primarily on product type, and three reportable segments. The U.S. snacking operating segment is aggregated with the international biscuits and snacks operating segment to form the Global Biscuits and Snacks reportable segment. The reportable segments are: Americas Simple Meals and Beverages; Global Biscuits and Snacks; and Campbell Fresh. Through the fourth quarter of 2017, our business in Latin America was managed as part of the Americas Simple Meals and Beverages segment. Beginning in 2018, our business in Latin America is managed as part of the Global Biscuits and Snacks segment. See "Business - Reportable Segments" for a description of the products included in each segment.
16
Strategy
Based on a recent Board-led strategy and portfolio review, we announced our vision to be a leading snacks and simple meals company, with a portfolio of best-in-class products and brands in our core North American market that we believe will generate sustainable value for our shareholders, customers and consumers. Guided by our purpose -
Real food that matters for life’s moments
, each of our brands will be driven within a framework of two differentiated portfolio roles:
|
•
|
Drive Profitable Growth. These brands primarily include
Cape Cod
,
Goldfish
,
Kettle Brand
,
Lance
,
Late July
,
Pace
,
Pacific
,
Pepperidge Farm Farmhouse
and
Milano
cookies,
Prego
and
Snyder’s of Hanover
, and will be managed to grow disproportionately relative to the categories in which they compete. We believe investments in innovation and consumer engagement will enable these brands to leverage evolving consumer tastes and trends; and
|
|
•
|
Maximize Margin and Cash Flow. These brands primarily include
Campbell’s
soups,
Pepperidge Farm
fresh bakery,
SpaghettiOs
and
V8
, and will be managed with a disciplined focus and aligned investments to support their strong market positions and optimize operating margins and cash flow.
|
In support of this strategy, we will continue to focus on the integration of Snyder’s-Lance. We also announced plans to pursue the divestiture of businesses within two operating segments: our international biscuits and snacks operating segment, which includes Arnott’s, Kelsen and our operations in Indonesia, Malaysia, Hong Kong and Japan; and the Campbell Fresh operating segment, which includes Bolthouse Farms, Garden Fresh Gourmet and the U.S. refrigerated soup business. The international biscuits and snacks operating segment and the Campbell Fresh operating segment combined represent approximately $2.1 billion in net sales in 2018. We expect to use the proceeds from these divestitures to reduce debt.
As a result of a more focused portfolio, we are pursuing increased multi-year cost savings initiatives with targeted annualized cost savings of $945 million by the end of 2022, which includes $295 million in synergies and run-rate cost savings from our acquisition of Snyder's-Lance. We expect to achieve these additional savings by streamlining our organization, expanding our zero-based budgeting efforts and continuing to optimize our manufacturing network. See "Restructuring Charges and Cost Savings Initiatives" for additional information on these initiatives.
Business Trends
Our businesses are being influenced by a variety of trends that we anticipate will continue in the future, including: changing consumer preferences; a changing retail environment; and significant cost inflation.
Our strategy is designed, in part, to capture growing consumer preferences for snacking and convenience. For example, consumers are changing their eating habits by increasing the type and frequency of snacks they consume. We also expect consumers to continue to seek products that they associate with health and well-being, including naturally functional and organic foods.
Retailers continue to use their buying power and negotiating strength to seek increased promotional programs funded by their suppliers and more favorable terms. In 2018, U.S. soup sales declined primarily due to a key customer's different promotional approach for soup. We expect consolidations among retailers will continue to create large and sophisticated customers that may further this trend. At the same time, new and existing retailers continue to grow and promote store brands that compete with branded products. In addition, although e-commerce represents only a small percentage of total food sales, we anticipate it will continue to grow rapidly.
The cost of distribution has increased due to a significant rise in transportation and logistics costs, driven by excess demand, reduced availability and higher fuel costs. In addition, certain ingredients and packaging required for the manufacture of our products, including steel, have been or may be impacted by new or recently proposed tariffs. We expect these cost pressures to continue in 2019. In connection with our transition to our new U.S. warehouse optimization model, we are also experiencing significantly higher than expected cost increases and shipment delays associated with the startup of our Findlay, Ohio distribution facility. The Findlay facility, operated by a third-party logistics service provider, serves as the Midwest hub for distribution of
Campbell’s
soups,
Swanson
broth,
V8
beverages and
Pace
,
Prego
and
Plum
products. Additionally, in September, our Maxton, North Carolina manufacturing and distribution capabilities were negatively impacted by flooding associated with Hurricane Florence. We expect the collective impact of these cost increases, shipment delays and weather-related issues to have a negative impact on our results of operations for the first quarter ending October 28, 2018.
Summary of Results
In 2018, we adopted new accounting guidance that changes the presentation of net periodic pension cost and net periodic postretirement benefit cost. Certain amounts in the prior year were reclassified to conform to the current presentation. See Note 2 to the Consolidated Financial Statements for additional information.
This Summary of Results provides significant highlights from the discussion and analysis that follows.
|
•
|
Net sales
increased
10%
in
2018
to
$8.685 billion
, primarily due to an
11
-point benefit from the acquisitions of Snyder's-Lance and Pacific Foods.
|
17
|
•
|
Gross profit, as a percent of sales,
decreased
to
32.4%
from
37.1%
a year ago. The decrease was primarily due to cost inflation and higher supply chain costs, the dilutive impact of acquisitions, partially offset by productivity improvements.
|
|
•
|
Administrative expenses
increased
19%
to
$654 million
from
$550 million
a year ago. The increase was primarily due to higher expenses related to cost savings initiatives, the impact of acquisitions, including integration costs, partially offset by lower incentive compensation costs.
|
|
•
|
Other expenses / (income) increased to expense of
$619 million
in
2018
from income of
$9 million
in
2017
. The current year included non-cash impairment charges of
$737 million
on the intangible assets of Campbell Fresh and the
Plum
trademark, transaction costs of
$53 million
related to the Snyder's-Lance acquisition, expense of
$22 million
related to a settlement of a legal claim, and gains of $136 million on pension and postretirement benefit mark-to-market and curtailment adjustments. The prior year included non-cash impairment charges of
$212 million
on the intangible assets of the Bolthouse Farms carrot and carrot ingredients reporting unit and the Garden Fresh Gourmet reporting unit and gains of $178 million on pension and postretirement benefit mark-to-market adjustments. For additional information on the impairment charges, see "Significant Accounting Estimates."
|
|
•
|
Interest expense increased to $201 million from $112 million primarily due to higher levels of debt associated with funding the acquisitions.
|
|
•
|
The effective tax rate was
4.0%
in
2018
, compared to
31.4%
in
2017
. The current year included a $126 million net tax benefit related to the remeasurement of deferred tax assets and liabilities and a transition tax on unremitted foreign earnings as a result of the enactment of the Tax Cuts and Jobs Act of 2017 (the Act). See Note 11 to the Consolidated Financial Statements for additional information. In 2017, the effective rate reflected a tax benefit of $52 million primarily related to the sale of intercompany notes receivable to a financial institution, which resulted in the recognition of foreign exchange losses on the notes for tax purposes. After adjusting for these items, the remaining decrease in the effective tax rate was primarily due to the ongoing lower U.S. federal tax rate as a result of the Act.
|
|
•
|
Earnings per share were
$.86
in
2018
, compared to
$2.89
a year ago. The current and prior year included expenses of
$2.01
and
$.15
per share, respectively, from items impacting comparability as discussed below.
|
|
•
|
Cash flows from operations were
$1.305 billion
in
2018
, compared to
$1.291 billion
in
2017
. The
increase
was primarily due to lower working capital requirements, partially offset by lower cash earnings.
|
Net Earnings attributable to Campbell Soup Company -
2018
Compared with
2017
The following items impacted the comparability of earnings and earnings per share:
|
•
|
In 2018, we recognized gains of $136 million in Other expenses / (income) ($103 million after tax, or $.34 per share) associated with mark-to-market and curtailment adjustments for defined benefit pension and postretirement plans. In 2017, we recognized gains of
$178 million
in Other expenses / (income) ($116 million after tax, or $.38 per share) associated with mark-to-market adjustments for defined benefit pension and postretirement plans;
|
|
•
|
In 2015, we implemented initiatives to reduce costs and to streamline our organizational structure. In 2017, we expanded these cost savings initiatives by further optimizing our supply chain network, primarily in North America, continuing to evolve our operating model to drive efficiencies, and more fully integrating our recent acquisitions. In January 2018, as part of the expanded initiatives, we authorized additional costs to improve the operational efficiency of our thermal supply chain network in North America by closing our manufacturing facility in Toronto, Ontario, and to optimize our information technology infrastructure by migrating certain applications to the latest cloud technology platform. In 2018, we recorded a pre-tax restructuring charge of $49 million and implementation costs and other related costs of $88 million in Administrative expenses, $45 million in Cost of products sold, and $3 million in Marketing and selling expenses (aggregate impact of $136 million after tax, or $.45 per share) related to these initiatives. In 2017, we recorded a pre-tax restructuring charge of $18 million and implementation costs and other related costs of $36 million in Administrative expenses and $4 million in Cost of products sold (aggregate impact of $37 million after tax, or $.12 per share) related to these initiatives. See Note 7 to the Consolidated Financial Statements and "Restructuring Charges and Cost Savings Initiatives" for additional information;
|
|
•
|
In the second quarter of 2018, we announced our intent to acquire Snyder's-Lance and on March 26, 2018, the acquisition closed. In 2018, we incurred $120 million of transaction and integration costs, of which $13 million was recorded in Restructuring charges, $12 million in Administrative expenses, $53 million in Other expenses / (income), and $42 million in Cost of products sold associated with an acquisition date fair value adjustment for inventory. We also recorded a gain in Interest expense of $18 million on treasury rate lock contracts used to hedge the planned financing of the acquisition. The aggregate impact was $102 million, $73 million after tax, or $.24 per share;
|
|
•
|
In the fourth quarter of 2018, we performed an impairment assessment on the
Plum
trademark. In 2018, sales and operating performance were well below expectations due in part to competitive pressure and reduced margins. In the fourth quarter of 2018, as part of a strategic review initiated by a new leadership team and based on recent performance, we lowered
|
18
our long-term outlook for future sales. We recorded a non-cash impairment charge of $54 million ($41 million after tax, or $.14 per share) in Other expenses / (income).
In the third quarter of 2018, we performed interim impairment assessments within Campbell Fresh on the deli reporting unit, which includes Garden Fresh Gourmet and the U.S. refrigerated soup business, and the Bolthouse Farms refrigerated beverages and salad dressings reporting unit. Within the deli unit, we revised our long-term outlook due to the anticipated loss of refrigerated soup business with certain private label customers, as well as the recent performance of the business. In addition, the operating performance of the Bolthouse Farms refrigerated beverages and salad dressings reporting unit was below expectations. We revised our long-term outlook for future earnings and cash flows for each of these reporting units. We recorded a non-cash impairment charge of $11 million on the tangible assets and $94 million on the intangible assets ($80 million after tax, or $.27 per share) of the deli reporting unit, and a non-cash impairment charge of $514 million ($417 million after tax, or $1.39 per share) related to the intangible assets of the Bolthouse Farms refrigerated beverages and salad dressings reporting unit. The aggregate impact of the impairment charges was $619 million, of which $11 million was recorded in Cost of products sold and $608 million in Other expenses / (income), ($497 million after tax, or $1.65 per share).
In the second quarter of 2018, we performed an interim impairment assessment on the intangible assets of the Bolthouse Farms carrot and carrot ingredients reporting unit as operating performance was below expectations. We revised our outlook for future earnings and cash flows and recorded a non-cash impairment charge of $75 million in Other expenses / (income) ($74 million after tax, or $.25 per share).
In 2018, the total non-cash impairment charges recorded were $748 million, of which $11 million was recorded in Cost of products sold and $737 million in Other expenses / (income), ($612 million after tax, or $2.03 per share).
In the second quarter of 2017, we performed an interim impairment assessment on the intangible assets of the Bolthouse Farms carrot and carrot ingredients reporting unit and the Garden Fresh Gourmet reporting unit as operating performance was well below expectations and a new leadership team of the Campbell Fresh division initiated a strategic review which led to a revised outlook for future sales, earnings, and cash flow. We recorded a non-cash impairment charge of $147 million ($139 million after tax, or $.45 per share) related to intangible assets of the Bolthouse Farms carrot and carrot ingredients reporting unit and a non-cash impairment charge of $65 million ($41 million after tax, or $.13 per share) related to the intangible assets of the Garden Fresh Gourmet reporting unit (aggregate pre-tax impact of $212 million, $180 million after tax, or $.59 per share). The charges were included in Other expenses / (income). See Note 5 to the Consolidated Financial Statements for additional information;
|
•
|
In 2018, we recorded expense of $22 million in Other expenses / (income) ($15 million after tax, or $.05 per share) from a settlement of a legal claim;
|
|
•
|
In 2018, we reflected the impact on taxes of the enactment of the Act that was signed into law in December 2017. We recorded a tax benefit of $179 million due to the remeasurement of deferred tax assets and liabilities, and a tax charge of $53 million related to a transition tax on unremitted foreign earnings. The net impact was a tax benefit of $126 million ($.42 per share). See Note 11 to the Consolidated Financial Statements and "Taxes on Earnings" for additional information; and
|
|
•
|
In 2017, we recorded a tax benefit of $52 million in Taxes on earnings primarily related to the sale of intercompany notes receivable to a financial institution, which resulted in the recognition of foreign exchange losses on the notes for tax purposes. In addition, we recorded a $6 million reduction to interest expense ($4 million after tax) related to premiums and fees received on the sale of the notes. The aggregate impact was $56 million after tax, or $.18 per share. See Note 11 to the Consolidated Financial Statements for additional information.
|
19
The items impacting comparability are summarized below:
|
2018
|
2017
|
||||||||||||||
|
(Millions, except per share amounts)
|
Earnings
Impact
|
EPS
Impact
|
Earnings
Impact
|
EPS
Impact
|
|||||||||||
|
Net earnings attributable to Campbell Soup Company
|
$
|
261
|
|
$
|
.86
|
|
$
|
887
|
|
$
|
2.89
|
|
|||
|
Pension and postretirement benefit mark-to-market and curtailment adjustments
|
$
|
103
|
|
$
|
.34
|
|
$
|
116
|
|
$
|
.38
|
|
|||
|
Restructuring charges, implementation costs and other related costs
|
(136
|
)
|
(.45
|
)
|
(37
|
)
|
(.12
|
)
|
|||||||
|
Transaction and integration costs
|
(73
|
)
|
(.24
|
)
|
—
|
|
—
|
|
|||||||
|
Impairment charges
|
(612
|
)
|
(2.03
|
)
|
(180
|
)
|
(.59
|
)
|
|||||||
|
Claim settlement
|
(15
|
)
|
(.05
|
)
|
—
|
|
—
|
|
|||||||
|
Tax reform
|
126
|
|
.42
|
|
—
|
|
—
|
|
|||||||
|
Sale of notes
|
—
|
|
—
|
|
56
|
|
.18
|
|
|||||||
|
Impact of items on Net earnings
|
$
|
(607
|
)
|
$
|
(2.01
|
)
|
$
|
(45
|
)
|
$
|
(.15
|
)
|
|||
Net earnings attributable to Campbell Soup Company were
$261 million
(
$0.86
per share) in
2018
, compared to
$887 million
(
$2.89
per share) in
2017
. After adjusting for items impacting comparability, earnings decreased primarily due to declines on the base business reflecting a lower gross profit performance, and the dilutive impact of acquisitions, partially offset by a lower effective tax rate. Earnings per share benefited from a reduction in the weighted average diluted shares outstanding, reflecting share repurchases. We suspended our share repurchases as of the second quarter of 2018.
Net Earnings attributable to Campbell Soup Company -
2017
Compared with
2016
In addition to the
2017
items that impacted comparability of Net earnings discussed above, the following items impacted the comparability of earnings and earnings per share:
|
•
|
In 2016, we recognized losses of
$313 million
in Other expenses / (income) ($200 million after tax, or $.64 per share) associated with mark-to-market adjustments for defined benefit pension and postretirement plans;
|
|
•
|
In 2016, we recorded a pre-tax restructuring charge of $35 million and implementation costs and other related costs of $47 million in Administrative expenses related to the 2015 initiatives. In 2016, we also recorded a reduction to pre-tax restructuring charges of $4 million related to the 2014 initiatives. The aggregate after-tax impact in 2016 of restructuring charges, implementation costs and other related costs was $49 million, or $.16 per share. See Note 7 to the Consolidated Financial Statements and "Restructuring Charges and Cost Savings Initiatives" for additional information;
|
|
•
|
In the fourth quarter of 2016, as part of the annual review of intangible assets, we recorded a non-cash impairment charge of $141 million ($127 million after tax, or $.41 per share) related to the intangible assets of the Bolthouse Farms carrot and carrot ingredients reporting unit. The charges are included in Other expenses / (income); and
|
|
•
|
In 2016, we recorded a gain of $25 million ($.08 per share) in Other expenses / (income) from a settlement of a claim related to the Kelsen acquisition. The claim was for a warranty breach and has no meaningful ongoing impact on Kelsen.
|
The items impacting comparability are summarized below:
|
2017
|
2016
|
||||||||||||||
|
(Millions, except per share amounts)
|
Earnings
Impact
|
EPS
Impact
|
Earnings
Impact
|
EPS
Impact
|
|||||||||||
|
Net earnings attributable to Campbell Soup Company
|
$
|
887
|
|
$
|
2.89
|
|
$
|
563
|
|
$
|
1.81
|
|
|||
|
Pension and postretirement benefit mark-to-market adjustments
|
$
|
116
|
|
$
|
.38
|
|
$
|
(200
|
)
|
$
|
(.64
|
)
|
|||
|
Restructuring charges, implementation costs and other related costs
|
(37
|
)
|
(.12
|
)
|
(49
|
)
|
(.16
|
)
|
|||||||
|
Impairment charges
|
(180
|
)
|
(.59
|
)
|
(127
|
)
|
(.41
|
)
|
|||||||
|
Sale of notes
|
56
|
|
.18
|
|
—
|
|
—
|
|
|||||||
|
Claim settlement
|
—
|
|
—
|
|
25
|
|
.08
|
|
|||||||
|
Impact of items on Net earnings
|
$
|
(45
|
)
|
$
|
(.15
|
)
|
$
|
(351
|
)
|
$
|
(1.13
|
)
|
|||
Net earnings were
$887 million
(
$2.89
per share) in
2017
, compared to
$563 million
(
$1.81
per share) in
2016
. After adjusting for items impacting comparability, earnings increased primarily due to an improved gross profit performance and lower
20
administrative expenses, partially offset by lower sales. Earnings per share benefited from a reduction in the weighted average diluted shares outstanding, primarily due to share repurchases under our strategic share repurchase program.
DISCUSSION AND ANALYSIS
Sales
An analysis of net sales by reportable segment follows:
|
% Change
|
|||||||||||||||
|
(Millions)
|
2018
|
2017
|
2016
|
2018/2017
(1)
|
2017/2016
|
||||||||||
|
Americas Simple Meals and Beverages
|
$
|
4,213
|
|
$
|
4,256
|
|
$
|
4,313
|
|
(1)%
|
(1)%
|
||||
|
Global Biscuits and Snacks
|
3,499
|
|
2,667
|
|
2,631
|
|
31
|
1
|
|||||||
|
Campbell Fresh
|
970
|
|
967
|
|
1,017
|
|
—
|
(5)
|
|||||||
|
Corporate
|
3
|
|
—
|
|
—
|
|
n/m
|
—
|
|||||||
|
$
|
8,685
|
|
$
|
7,890
|
|
$
|
7,961
|
|
10%
|
(1)%
|
|||||
__________________________________________
|
(1)
|
n/m - Not meaningful.
|
An analysis of percent change of net sales by reportable segment follows:
|
2018 versus 2017
|
Americas Simple Meals and Beverages
|
Global Biscuits and Snacks
(2)
|
Campbell Fresh
(2)
|
Total
|
|||
|
Volume and Mix
|
(3)%
|
1%
|
1%
|
(1)%
|
|||
|
Price and Sales Allowances
|
(1)
|
1
|
—
|
—
|
|||
|
(Increased)/Decreased Promotional Spending
(1)
|
—
|
—
|
—
|
—
|
|||
|
Currency
|
—
|
1
|
—
|
—
|
|||
|
Acquisitions
|
3
|
29
|
—
|
11
|
|||
|
(1)%
|
31%
|
—%
|
10%
|
||||
|
2017 versus 2016
|
Americas Simple Meals and Beverages
(2)
|
Global Biscuits and Snacks
(2)
|
Campbell Fresh
(2)
|
Total
(2)
|
|||
|
Volume and Mix
|
(1)%
|
1%
|
(5)%
|
(1)%
|
|||
|
(Increased)/Decreased Promotional Spending
(1)
|
(1)
|
—
|
1
|
(1)
|
|||
|
Currency
|
—
|
1
|
—
|
—
|
|||
|
(1)%
|
1%
|
(5)%
|
(1)%
|
||||
__________________________________________
|
(1)
|
Represents revenue reductions from trade promotion and consumer coupon redemption programs.
|
|
(2)
|
Sum of the individual amounts does not add due to rounding.
|
In
2018
, Americas Simple Meals and Beverages sales
decreased
1%
primarily due to declines in U.S. soup and
V8
beverages, partially offset by the benefit of the acquisition of Pacific Foods, and an increase in the retail business in Canada driven by the favorable impact of currency translation. Excluding Pacific Foods, sales of U.S. soup declined 8%, driven by declines in condensed soups, ready-to-serve soups and broth. The decline in U.S. soup was primarily due to a key customer’s different promotional approach for soup in 2018.
In
2017
, Americas Simple Meals and Beverages sales
decreased
1%
primarily due to declines in
V8
beverages and soup, partly offset by gains in
Prego
pasta sauces and
SpaghettiOs
pasta. U.S. soup sales decreased 1% due to declines in condensed soups and broth, partly offset by gains in ready-to-serve soups. Gains in ready-to-serve soups were primarily driven by
Chunky
soups due to improved execution, including merchandising and dedicated advertising, as well as new items, and the launch of
Well Yes!
soups. Promotional spending had a negative impact of 1% on sales, with increases on broth, in Canada and on
V8
beverages. We increased promotional spending on broth and
V8
beverages to remain competitive, and in Canada to hold certain promoted prices following list price increases.
21
In
2018
, Global Biscuits and Snacks sales
increased
31%
primarily due to the 29-point benefit of the acquisition of Snyder’s-Lance. Excluding Snyder’s-Lance and the favorable impact of currency translation, sales increased primarily due to gains in Pepperidge Farm, reflecting growth in
Goldfish
crackers and in cookies, as well as gains of Kelsen cookies in China, partially offset by declines in Arnott’s biscuits, primarily in Indonesia.
In
2017
, Global Biscuits and Snacks sales
increased
1%
reflecting a 1% favorable impact from currency translation. Excluding the favorable impact of currency translation, segment sales were comparable to the prior year as gains in Pepperidge Farm were offset by declines in Kelsen, mostly in the U.S., and in Arnott's in Indonesia. Pepperidge Farm sales increased due to gains in
Goldfish
crackers and in cookies, benefiting from new items, partly offset by declines in fresh bakery and frozen products.
In
2018
, Campbell Fresh sales were comparable to the prior year as gains in carrot ingredients and Garden Fresh Gourmet were offset by declines in
Bolthouse Farms
refrigerated beverages
.
In
2017
, Campbell Fresh sales
decreased
5%
primarily due to lower sales of refrigerated beverages and carrots, partly offset by gains in refrigerated soup. The decrease in refrigerated beverages reflects the adverse impact of supply constraints related to enhanced quality processes following the voluntary recall of
Bolthouse Farms Protein PLUS
drinks in June 2016. The carrot sales performance reflects the market share impact of quality and execution issues experienced in 2016, as well as the adverse impact of weather conditions in the second quarter of 2017.
Gross Profit
Gross profit, defined as Net sales less Cost of products sold,
decreased
by
$109 million
in
2018
from
2017
and
decreased
by
$3 million
in
2017
from
2016
. As a percent of sales, gross profit was
32.4%
in
2018
,
37.1%
in
2017
and
36.8%
in
2016
.
The
4.7
percentage-point decrease in gross profit percentage in
2018
and
0.3
percentage-point increase in gross profit percentage in
2017
were due to the following factors:
|
Margin Impact
|
|||
|
|
2018
|
2017
|
|
|
Cost inflation, supply chain costs and other factors
(1)
|
(3.0)
|
(1.0)
|
|
|
Impact of acquisitions
(2)
|
(1.8)
|
—
|
|
|
Restructuring-related costs
|
(0.5)
|
—
|
|
|
Mix
|
(0.3)
|
(0.2)
|
|
|
Higher level of promotional spending
|
(0.2)
|
(0.4)
|
|
|
Impairment charge on plant assets
|
(0.2)
|
—
|
|
|
Price and sales allowances
|
(0.1)
|
0.1
|
|
|
Productivity improvements
|
1.4
|
1.8
|
|
|
(4.7)%
|
0.3%
|
||
__________________________________________
|
(1)
|
2018
includes a positive margin impact of 0.9 from cost savings initiatives, which was more than offset by cost inflation and other factors, including higher transportation and logistics costs and higher costs in Campbell Fresh.
2017
includes a positive margin impact of 1 from cost savings initiatives.
|
|
(2)
|
2018 includes a negative margin impact of 0.5 from a Snyder's-Lance acquisition date fair value adjustment for inventory.
|
Marketing and Selling Expenses
Marketing and selling expenses as a percent of sales were
10.4%
in
2018
,
10.8%
in
2017
and
10.7%
in
2016
. Marketing and selling expenses
increased
5%
in
2018
from
2017
. The increase was primarily due to the impact of acquisitions (approximately 9 percentage points) and investments in e-commerce (approximately 1 percentage point), partially offset by increased benefits from cost savings initiatives (approximately 2 percentage points); lower marketing overhead expenses (approximately 1 percentage point); lower advertising and consumer promotion expenses (approximately 1 percentage point) and lower incentive compensation costs (approximately 1 percentage point).
Marketing and selling expenses were comparable in
2017
and
2016
as increased benefits from cost savings initiatives (approximately 2 percentage points); and lower incentive compensation costs (approximately 1 percentage point) were offset by higher selling expenses (approximately 1 percentage point) and inflation (approximately 1 percentage point).
Administrative Expenses
Administrative expenses as a percent of sales were
7.5%
in
2018
,
7.0%
in
2017
and
7.2%
in
2016
. Administrative expenses
increased
19%
in
2018
from
2017
. The increase was primarily due to higher costs related to cost savings initiatives (approximately 9 percentage points); the impact of acquisitions (approximately 7 percentage points); acquisition integration costs (approximately 2 percentage points); consulting costs incurred in connection with the strategic review (approximately 1 percentage point);
22
investments in long-term innovation (approximately 1 percentage point); the impact of currency translation (approximately 1 percentage point) and inflation and other factors (approximately 4 percentage points), partially offset by lower incentive compensation (approximately 5 percentage points) and increased benefits from cost savings initiatives (approximately 1 percentage point).
Administrative expenses
decreased
4%
in
2017
from
2016
. The decrease was primarily due to increased benefits from cost savings initiatives (approximately 3 percentage points); lower incentive compensation costs (approximately 3 percentage points); and lower costs related to cost savings initiatives (approximately 2 percentage points), partially offset by inflation (approximately 2 percentage points) and investments in long-term innovation (approximately 1 percentage point).
Research and Development Expenses
Research and development expenses
decreased
$1 million
, or
1%
, in
2018
from
2017
. The decrease was primarily due to lower investments in long-term innovation (approximately 3 percentage points); and lower incentive compensation costs (approximately 2 percentage points), partially offset by the impact of acquisitions (approximately 3 percentage points) and inflation and other factors (approximately 1 percentage point).
Research and development expenses
increased
$6 million
, or
6%
, in
2017
from
2016
. The increase was primarily due to inflation and other factors (approximately 8 percentage points) and investments in long-term innovation (approximately 1 percentage point), partially offset by increased benefits from cost savings initiatives (approximately 2 percentage points) and lower incentive compensation costs (approximately 2 percentage points).
Other Expenses / (Income)
Other expenses in
2018
included the following:
|
•
|
non-cash impairment charges of
$737 million
related to the intangible assets of the Bolthouse Farms refrigerated beverages and salad dressings reporting unit, the deli reporting unit, the Bolthouse Farms carrot and carrots ingredients reporting unit and the
Plum
trademark;
|
|
•
|
$53 million
of transaction costs associated with the acquisition of Snyder's-Lance;
|
|
•
|
$34 million
of amortization of intangible assets;
|
|
•
|
$22 million
of expense related to the settlement of a legal claim; and
|
|
•
|
$231 million of net periodic benefit income, including gains of $136 million on pension and postretirement benefit mark-to-market and curtailment adjustments.
|
Other expenses in
2017
included the following:
|
•
|
non-cash impairment charges of
$212 million
on the intangible assets of the Bolthouse Farms carrot and carrot ingredients reporting unit and the Garden Fresh Gourmet reporting unit;
|
|
•
|
$19 million
of amortization of intangible assets; and
|
|
•
|
$247 million of net periodic benefit income, including gains of $178 million on pension and postretirement benefit mark-to-market adjustments.
|
Other expenses in
2016
included the following:
|
•
|
net periodic benefit expense of $274 million, including losses of $313 million on pension and postretirement benefit mark-to-market adjustments;
|
|
•
|
a non-cash impairment charge of
$141 million
on the intangible assets of the Bolthouse Farms carrot and carrot ingredients reporting unit;
|
|
•
|
$20 million
of amortization of intangible assets; and
|
|
•
|
a
$25 million
gain from a settlement of a claim related to the Kelsen acquisition.
|
For additional information on the impairment charges, see "Significant Accounting Estimates."
Operating Earnings
Segment operating earnings decreased
5%
in
2018
from
2017
and increased
1%
in
2017
from
2016
.
23
An analysis of operating earnings by segment follows:
|
% Change
(2)
|
|||||||||||||||||
|
(Millions)
|
2018
|
2017
|
2016
|
2018/2017
|
2017/2016
|
||||||||||||
|
Americas Simple Meals and Beverages
|
$
|
982
|
|
$
|
1,111
|
|
$
|
1,060
|
|
(12)%
|
5
|
%
|
|||||
|
Global Biscuits and Snacks
|
540
|
|
463
|
|
431
|
|
17
|
7
|
|
||||||||
|
Campbell Fresh
|
(43
|
)
|
(9
|
)
|
60
|
|
n/m
|
n/m
|
|||||||||
|
1,479
|
|
1,565
|
|
1,551
|
|
(5)%
|
1
|
%
|
|||||||||
|
Corporate
|
(948
|
)
|
(147
|
)
|
(560
|
)
|
|||||||||||
|
Restructuring charges
(1)
|
(62
|
)
|
(18
|
)
|
(31
|
)
|
|||||||||||
|
Earnings before interest and taxes
|
$
|
469
|
|
$
|
1,400
|
|
$
|
960
|
|
||||||||
__________________________________________
|
(1)
|
See Note 7 to the Consolidated Financial Statements for additional information on restructuring charges.
|
|
(2)
|
n/m - Not meaningful.
|
Operating earnings from Americas Simple Meals and Beverages
decreased
12%
in
2018
versus
2017
. The decrease was primarily due to a lower gross profit percentage and lower sales volume, partly offset by lower marketing and selling expenses. Gross profit performance was impacted by cost inflation, including higher transportation and logistics costs, and the dilutive impact from the acquisition of Pacific Foods.
Operating earnings from Americas Simple Meals and Beverages
increased
5%
in
2017
versus
2016
. The increase was primarily due to a higher gross profit percentage, benefiting from productivity improvements, and lower administrative expenses, partly offset by volume declines.
Operating earnings from Global Biscuits and Snacks
increased
17%
in
2018
versus
2017
. The increase was primarily due to the benefit of the acquisition of Snyder’s-Lance, higher organic sales volume and lower marketing and selling expenses, partly offset by a lower gross profit percentage. Gross profit performance was impacted by higher levels of cost inflation, particularly on butter, higher transportation and logistics costs and costs associated with the voluntary product recall of flavor-blasted
Goldfish
crackers in July 2018.
Operating earnings from Global Biscuits and Snacks
increased
7%
in
2017
versus
2016
. The increase was primarily due to lower administrative expenses, lower marketing and selling expenses and higher sales voume.
Operating earnings from Campbell Fresh decreased from a loss of $9 million in
2017
to a loss of $43 million in
2018
. The decrease was primarily due to a lower gross profit percentage, reflecting higher supply chain costs including lower manufacturing efficiencies and cost inflation, as well as higher carrot costs attributable to the adverse impact of weather conditions on crop yields.
Operating earnings from Campbell Fresh
decreased
from
$60 million
in
2016
to a loss of
$9 million
in 2017. The decrease was primarily due to lower volume and unfavorable mix; higher carrot costs, which were partly associated with the adverse impact on crop yields of heavy rains in December and January of fiscal 2017, as well as excess organic carrots; the cost impact of both lower beverage operating efficiencies and enhanced quality processes; and higher administrative expenses.
Corporate in
2018
included the following:
|
•
|
non-cash impairment charges of $748 million related to the assets of the Bolthouse Farms refrigerated beverages and salad dressings reporting unit, the deli reporting unit, the Bolthouse Farms carrot and carrots ingredients reporting unit and the
Plum
trademark;
|
|
•
|
transaction and integration costs of $107 million associated with the acquisition of Snyder's-Lance;
|
|
•
|
costs of $136 million related to the cost savings initiatives;
|
|
•
|
$22 million of expense related to the settlement of a legal claim; and
|
|
•
|
$136 million of gains on pension and postretirement benefit mark-to-market and curtailment adjustments.
|
Corporate in
2017
included non-cash impairment charges of $212 million on the intangible assets of the Bolthouse Farms carrot and carrot ingredients reporting unit and the Garden Fresh Gourmet reporting unit, costs of $40 million related to cost savings initiatives and a
$178 million
gain associated with pension and postretirement benefit mark-to-market adjustments. Excluding these amounts, the remaining decrease in costs was primarily due to higher pension and postretirement benefit income in 2018, and lower incentive compensation costs, partially offset by higher administrative expenses and losses on open commodity contracts in the current year.
Corporate in
2016
included a
$313 million
loss associated with pension and postretirement benefit mark-to-market adjustments, a non-cash impairment charge of
$141 million
on the intangible assets of the Bolthouse Farms carrot and carrot ingredients reporting
24
unit, costs of
$47 million
related to cost savings initiatives, and a $25 million gain from a settlement of a claim related to the Kelsen acquisition. The remaining decrease in 2017 was primarily due to lower postretirement benefit costs as a result of amortization of prior service credit, partially offset by investments in long-term innovation.
Interest Expense
Interest expense
increased
to
$201 million
in
2018
from
$112 million
in
2017
. The increase in interest expense was due to higher levels of debt associated with funding the acquisitions and higher average interest rates on the debt portfolio, partially offset by a gain of $18 million on treasury rate lock contracts used to hedge the planned financing of the Snyder's-Lance acquisition.
Interest expense
decreased
to
$112 million
in
2017
from
$115 million
in
2016
. In
2017
, we recorded a $6 million reduction to interest expense related to premiums and fees received from the sale of intercompany notes receivable to a financial institution. Excluding the premium and fees, interest expense increased reflecting higher average interest rates on the debt portfolio, partially offset by lower average levels of debt.
Taxes on Earnings
The effective tax rate was
4.0%
in
2018
,
31.4%
in
2017
and
33.7%
in
2016
.
On December 22, 2017, the Act was enacted into law and made significant changes to corporate taxation. As a result, the following items are reflected in 2018:
|
•
|
The corporate rate reduction as of January 1, 2018, resulted in a blended U.S. statutory tax rate of approximately 27%;
|
|
•
|
Remeasurement of deferred tax assets and liabilities resulted in a tax benefit of $179 million; and
|
|
•
|
Imposition of a transition tax on unremitted foreign earnings resulted in a tax charge of $53 million.
|
The amounts recorded represent provisional amounts based on our best estimates and current interpretation of the provisions of the Act and may change as additional guidance is issued. See Note 11 to the Consolidated Financial Statements for additional information.
Tax expense decreased from $406 million in 2017 to $11 million in 2018.
The following items impacted 2018 and 2017:
|
•
|
In 2018, we recognized tax expense of $33 million on $136 million of pension and postretirement benefit mark-to-market and curtailment gains. In 2017, we recognized a tax expense of $62 million on $178 million of pension and postretirement benefit mark-to-market gains;
|
|
•
|
In 2018, we recognized a $49 million tax benefit on $185 million of restructuring charges, implementation costs and other related costs. In 2017, we recognized a $21 million tax benefit on $58 million of restructuring charges, implementation costs and other related costs;
|
|
•
|
In 2018, we recognized a $29 million tax benefit on $102 million of transaction and integration costs associated with the acquisition of Snyder's-Lance;
|
|
•
|
In 2018, we recognized a $136 million tax benefit on the $748 million impairment charges on the assets of the deli reporting unit, the Bolthouse Farms refrigerated beverages and salad dressings reporting unit, the Bolthouse Farms carrot and carrot ingredients reporting unit and the
Plum
trademark. In 2017, we recognized a $32 million tax benefit on the $212 million impairment charges on the intangible assets of the Bolthouse Farms carrot and carrot ingredients reporting unit and the Garden Fresh Gourmet reporting unit;
|
|
•
|
In 2018, we recognized a $7 million tax benefit on the $22 million of expense related to the settlement of a legal claim;
|
|
•
|
In 2018, we recognized a net tax benefit of $126 million related to the enactment of the Act on the remeasurement of deferred tax assets and liabilities and transition tax on unremitted foreign earnings described above; and
|
|
•
|
In 2017, we recognized a tax benefit of $52 million primarily related to the sale of intercompany notes receivable to a financial institution, which resulted in the recognition of foreign exchange losses on the notes for tax purposes.
|
After adjusting for the items above, the remaining decrease in the effective tax rate was primarily due to the ongoing benefit of the lower U.S. federal tax rate as a result of the Act.
The following items impacted the tax rate in 2016:
|
•
|
In 2016, we recognized a tax benefit of $113 million on $313 million of pension and postretirement benefit mark-to-market losses;
|
|
•
|
In 2016, we recognized a $14 million tax benefit on the $141 million impairment charge on the intangible assets associated with the Bolthouse Farms carrot and carrot ingredients reporting unit;
|
25
|
•
|
In 2016, we recognized a $29 million tax benefit on $78 million of restructuring charges, implementation costs and other related costs; and
|
|
•
|
In 2016, the $25 million gain from a settlement of a claim related to the Kelsen acquisition was not subject to tax.
|
In addition, in 2017 the effective rate was favorably impacted by the recognition of $6 million of excess tax benefits in connection with the adoption of new accounting guidance on stock-based compensation in the first quarter of 2017.
Restructuring Charges and Cost Savings Initiatives
2015 Initiatives
In fiscal 2015, we implemented initiatives to reduce costs and to streamline our organizational structure. As part of these initiatives, we commenced a voluntary employee separation program available to certain U.S.-based salaried employees nearing retirement who met age, length-of-service and business unit/function criteria.
In February 2017, we announced that we were expanding these initiatives by further optimizing our supply chain network, primarily in North America, continuing to evolve our operating model to drive efficiencies, and more fully integrating our recent acquisitions. In January 2018, as part of the expanded initiatives, we authorized additional pre-tax costs to improve the operational efficiency of our thermal supply chain network in North America by closing our manufacturing facility in Toronto, Ontario, and to optimize our information technology infrastructure by migrating certain applications to the latest cloud technology platform. In August 2018, we announced that we will continue to streamline our organization, expand our zero-based budgeting efforts and optimize our manufacturing network. We extended the time horizon for the initiatives to 2022. Cost estimates for these expanded initiatives, as well as timing for certain activities, are continuing to be developed.
A summary of the restructuring charges and charges recorded in Administrative expenses, Cost of products sold, and Marketing and selling expenses related to the initiatives is as follows:
|
(Millions, except per share amounts)
|
2018
|
2017
|
2016
|
2015
|
|||||||||||
|
Restructuring charges
|
$
|
49
|
|
$
|
18
|
|
$
|
35
|
|
$
|
102
|
|
|||
|
Administrative expenses
|
88
|
|
36
|
|
47
|
|
22
|
|
|||||||
|
Cost of products sold
|
45
|
|
4
|
|
—
|
|
—
|
|
|||||||
|
Marketing and selling expenses
|
3
|
|
—
|
|
—
|
|
—
|
|
|||||||
|
Total pre-tax charges
|
$
|
185
|
|
$
|
58
|
|
$
|
82
|
|
$
|
124
|
|
|||
|
Aggregate after-tax impact
|
$
|
136
|
|
$
|
37
|
|
$
|
52
|
|
$
|
78
|
|
|||
|
Per share impact
|
$
|
.45
|
|
$
|
.12
|
|
$
|
.17
|
|
$
|
.25
|
|
|||
A summary of the pre-tax costs associated with the initiatives is as follows:
|
(Millions)
|
Recognized as of July 29, 2018
|
||
|
Severance pay and benefits
|
$
|
180
|
|
|
Asset impairment/accelerated depreciation
|
45
|
|
|
|
Implementation costs and other related costs
|
224
|
|
|
|
Total
|
$
|
449
|
|
The total estimated pre-tax costs for actions that have been identified are approximately
$570 million
to
$605 million
. This estimate will be updated as costs for the expanded initiatives are developed.
We expect the costs for actions that have been identified to date to consist of the following: approximately
$195 million
in severance pay and benefits; approximately
$95 million
in asset impairment and accelerated depreciation; and approximately
$280 million
to
$315 million
in implementation costs and other related costs.We expect these pre-tax costs to be associated with our segments as follows: Americas Simple Meals and Beverages - approximately
45%
; Global Biscuits and Snacks - approximately
30%
; Campbell Fresh - approximately
3%
; and Corporate - approximately
22%
.
Of the aggregate
$570 million
to
$605 million
of pre-tax costs identified to date, we expect approximately
$465 million
to
$500 million
will be cash expenditures. In addition, we expect to invest approximately
$250 million
in capital expenditures through 2020 primarily related to the U.S. warehouse optimization project, transition of production of the Toronto manufacturing facility to our U.S. thermal plants, insourcing of manufacturing for certain simple meal products and optimization of information technology infrastructure and applications, of which we invested approximately
$114 million
as of
July 29, 2018
.
26
We expect to incur the costs for the actions that have been identified to date through 2020 and to fund the costs through cash flows from operations and short-term borrowings.
We expect the initiatives for actions that have been identified to date to generate pre-tax savings of $470 million in 2019, and once all phases are implemented, to generate annual ongoing savings of approximately $650 million by the end of 2022. The annual pre-tax savings generated by the initiatives were as follows:
|
(Millions)
|
2018
|
2017
|
2016
|
2015
|
|||||||||||
|
Total pre-tax savings
|
$
|
420
|
|
$
|
325
|
|
$
|
215
|
|
$
|
85
|
|
|||
Segment operating results do not include restructuring charges, implementation costs and other related costs because we evaluate segment performance excluding such charges. A summary of the pre-tax costs incurred to date associated with segments is as follows:
|
(Millions)
|
2018
|
Costs Incurred to Date
|
|||||
|
Americas Simple Meals and Beverages
|
$
|
86
|
|
$
|
178
|
|
|
|
Global Biscuits and Snacks
|
73
|
|
151
|
|
|||
|
Campbell Fresh
|
5
|
|
11
|
|
|||
|
Corporate
|
21
|
|
109
|
|
|||
|
Total
|
$
|
185
|
|
$
|
449
|
|
|
Snyder's-Lance Cost Transformation Program and Integration
On March 26, 2018, we completed the acquisition of Snyder's-Lance. Prior to the acquisition, in April 2017, Snyder's-Lance launched a cost transformation program following a comprehensive review of its operations with the goal of significantly improving its financial performance. We expect to continue to implement this program and to achieve a majority of the program's targeted savings. In addition, we have identified opportunities for additional cost synergies as we integrate Snyder's-Lance.
We are developing the detailed plans to implement the Snyder's-Lance cost transformation program and to achieve the cost synergies and therefore we cannot reasonably estimate the total expected pre-tax costs and timing of when we expect to incur those costs, as well as the expected future cash expenditures. We expect the pre-tax costs to be associated primarily with Global Biscuits and Snacks.
In
2018
, we recorded a restructuring charge of
$13 million
and incurred
$12 million
in Administrative expenses related to the integration of Snyder's-Lance.
We expect the Snyder's-Lance cost transformation program and integration to generate pre-tax annual savings of $105 million in 2019, and once all phases are implemented, to generate annual ongoing savings of approximately $295 million beginning in 2022. In 2018, pre-tax savings were $35 million.
Segment operating results do not include restructuring charges, nor implementation and integration costs because we evaluate segment performance excluding such charges. The pre-tax costs of
$25 million
incurred in
2018
were associated with the Global Biscuits and Snacks segment.
2015 Initiatives and Snyder's-Lance Cost Transformation Program and Integration
We generated annual pre-tax savings of $455 million in 2018 for both programs and expect once all phases of these programs are implemented, to generate annual ongoing savings of approximately $945 million by the end of 2022.
2014 Initiatives
In 2014, we implemented initiatives to reduce overhead across the organization, restructure manufacturing and streamline operations for our soup and broth business in China and improve supply chain efficiency in Australia.
In 2016, we recorded a reduction to restructuring charges of
$4 million
(
$3 million
after tax, or
$.01
per share) related to the 2014 initiatives. As of July 31, 2016, we incurred substantially all of the costs related to the 2014 initiatives.
27
A summary of the pre-tax costs associated with the 2014 initiatives is as follows:
|
(Millions)
|
Total Program
(1)
|
Change in Estimate
|
Recognized as of July 31, 2016
|
||||||||
|
Severance pay and benefits
|
$
|
41
|
|
$
|
(4
|
)
|
$
|
37
|
|
||
|
Asset impairment
|
12
|
|
—
|
|
12
|
|
|||||
|
Other exit costs
|
1
|
|
—
|
|
1
|
|
|||||
|
Total
|
$
|
54
|
|
$
|
(4
|
)
|
$
|
50
|
|
||
|
(1)
|
Recognized as of August 2, 2015.
|
See Note 7 to the Consolidated Financial Statements for additional information.
LIQUIDITY AND CAPITAL RESOURCES
We expect foreseeable liquidity and capital resource requirements to be met through anticipated cash flows from operations; long-term borrowings; short-term borrowings, including commercial paper; credit facilities; and cash and cash equivalents. We believe that our sources of financing will be adequate to meet our future requirements.
We generated cash flows from operations of
$1.305 billion
in
2018
, compared to
$1.291 billion
in
2017
. The
increase
in
2018
was primarily due to lower working capital requirements, partially offset by lower cash earnings.
We generated cash flows from operations of
$1.291 billion
in
2017
, compared to
$1.491 billion
in
2016
. The
decline
in
2017
was primarily due to lapping significant reductions in working capital in 2016, as well as lower cash earnings and lower receipts from hedging activities in 2017.
Current assets are less than current liabilities as a result of our level of current maturities of long-term debt and short-term borrowings and our focus to lower core working capital requirements by reducing trade receivables and inventories while extending payment terms for accounts payables. We had negative working capital of
$1.298 billion
as of
July 29, 2018
, and
$495 million
as of
July 30, 2017
. Debt maturing within one year was
$1.896 billion
as of
July 29, 2018
, and
$1.037 billion
as of
July 30, 2017
.
Capital expenditures were
$407 million
in
2018
,
$338 million
in
2017
and
$341 million
in
2016
. Capital expenditures are expected to total approximately
$400 million
in
2019
. Capital expenditures in
2018
included a U.S. warehouse optimization project (approximately $50 million); transition of production of the Toronto manufacturing facility to our U.S. thermal plants (approximately $23 million); insourcing manufacturing for certain simple meal products (approximately $18 million); replacement of a Pepperidge Farm refrigeration system (approximately $9 million); and an Australian multi-pack biscuit capacity expansion project (approximately $2 million). Capital expenditures in
2017
included projects to expand: Australian multi-pack biscuit capacity (approximately $15 million); beverage and salad dressing capacity at Bolthouse Farms (approximately $8 million); and capacity at Garden Fresh (approximately $3 million); as well as the continued enhancement of our corporate headquarters (approximately $11 million); replacement of a Pepperidge Farm refrigeration system (approximately $12 million); and a U.S. warehouse optimization project (approximately $10 million). Capital expenditures in
2016
included projects to expand: beverage and salad dressing capacity at Bolthouse Farms (approximately $22 million); biscuit capacity in Indonesia (approximately $11 million); warehouse capacity in North America (approximately $11 million); cracker capacity at Pepperidge Farm (approximately $9 million); and capacity in Malaysia (approximately $6 million); as well as the continued enhancement of our corporate headquarters (approximately $15 million) and the ongoing initiative to simplify the soup-making process in North America (approximately $5 million).
On December 12, 2017, we completed the acquisition of Pacific Foods. The purchase price was
$688 million
and was funded through the issuance of commercial paper.
On March 26, 2018, we completed the acquisition of Snyder’s-Lance. Total consideration was
$6.112 billion
, which included the payoff of approximately $1.1 billion of Snyder's-Lance indebtedness. We borrowed
$900 million
under a single draw 3-year senior unsecured term loan facility on March 26, 2018, and issued
$5.3 billion
senior notes on March 16, 2018, to finance the acquisition. The interest rate on the senior unsecured term loan facility resets in one, two, three, or six-month periods dependent upon our election. Interest on the senior unsecured term loan facility is due upon the earlier of an interest reset or quarterly and the first interest payment is due in June 2018. The senior unsecured term loan facility may be prepaid at par at any time. The senior unsecured term loan facility contains customary covenants and events of default for credit facilities of this type.
The
$5.3 billion
senior notes were issued in various tenors in both fixed and floating rate formats. We issued 2 and 3-year floating rate senior notes in the amount of
$500 million
and
$400 million
, respectively. We issued 3, 5, 7, 10, and 30-year fixed rate senior notes in the amount of
$650 million
,
$1.2 billion
,
$850 million
,
$1 billion
, and
$700 million
, respectively. Interest on the 2-year floating rate senior notes is due quarterly on March 16, June 16, September 16, and December 16, commencing on
28
June 16, 2018. Interest on the 3-year floating rate senior notes is due quarterly on March 15, June 15, September 15, and December 15, commencing on June 15, 2018. Interest on the fixed rate senior notes is due semi-annually on March 15 and September 15, commencing on September 15, 2018. The fixed rate senior notes may be redeemed, in whole or in part, at our option at any time at the applicable redemption price. If change of control triggering events occur, we will be required to offer to purchase the senior notes at a purchase price equal to 101% of the principal amount plus accrued and unpaid interest, if any, to the purchase date. The senior notes were issued under a shelf registration statement that we filed with the Securities and Exchange Commission in July 2017. We registered an indeterminate amount of debt securities. Under the registration statement, we may issue debt securities from time to time, depending on market conditions.
In June 2017, we sold intercompany notes to a financial institution, including an AUD
$280 million
, or
$224 million
, note with an interest rate of
4.88%
that matures on
September 18, 2018
, and an AUD
$190 million
, or
$152 million
, note with an interest rate of
6.98%
that matures on
March 29, 2021
, but is payable upon demand. Interest on both notes is due semi-annually on January 23 and July 23. The net proceeds were used for general corporate purposes. On September 18, 2018, we repaid a portion of both Australian notes and refinanced the remainder with a new AUD $400 million, or $296 million, single-draw syndicated facility that matures on September 11, 2019. The interest rate on the new facility is floating based on an Australian dollar rate for the applicable interest period plus a margin. The interest period resets in one, two, three or six-month periods, based on our election. The facility contains customary covenants and events of default for credit facilities of this type.
Dividend payments were
$426 million
in
2018
,
$420 million
in
2017
and
$390 million
in
2016
. Annual dividends declared were $1.40 per share in
2018
and
2017
, and $1.248 per share in
2016
. The
2018
fourth quarter dividend was $.35 per share.
We repurchased approximately
2 million
shares at a cost of
$86 million
in
2018
, approximately
8 million
shares at a cost of
$437 million
in
2017
, and approximately
3 million
shares at a cost of
$143 million
in
2016
. As a result of the acquisition of Snyder's-Lance, we suspended our share repurchases as of the second quarter of 2018. See Note 16 to the Consolidated Financial Statements for additional information.
As of
July 29, 2018
, we had
$1.896 billion
of short-term borrowings due within one year, of which
$1.14 billion
was comprised of commercial paper borrowings, $348 million of Australian notes and $300 million of 4.5% notes. On September 18, 2018, we repaid a portion of the Australian notes and refinanced the remainder with a new AUD $400 million single-draw syndicated facility that matures on September 18, 2019. As of
July 29, 2018
, we issued
$59 million
of standby letters of credit. We have a committed revolving credit facility totaling
$1.85 billion
that matures in December 2021. This U.S. facility remained unused at
July 29, 2018
, except for
$1 million
of standby letters of credit that we issued under it. The U.S. facility supports our commercial paper programs and other general corporate purposes. As of
July 29, 2018
, the total commitment under a Canadian committed revolving credit facility was CAD
$125 million
, or
$96
million, and we had borrowings of CAD
$117 million
, or
$90 million
, at a rate of
3.17%
under this facility. The Canadian facility supports general corporate purposes. We expect to continue to access the commercial paper markets, bank credit lines and utilize cash flows from operations to support our short-term liquidity requirements.
Our credit ratings were recently downgraded by Standard & Poor's and reaffirmed with a negative outlook by Moody's Investors Service, Inc. If our credit ratings are further downgraded, we may have difficulty selling additional debt securities or borrowing money in the amounts and on the terms that might be available if our credit ratings were maintained.
We are in compliance with the covenants contained in our revolving credit facilities and debt securities.
CONTRACTUAL OBLIGATIONS AND OTHER COMMITMENTS
Contractual Obligations
The following table summarizes our obligations and commitments to make future payments under certain contractual obligations as of
July 29, 2018
. For additional information on debt, see Note 12 to the Consolidated Financial Statements. Operating leases are primarily entered into for warehouse and office facilities and certain equipment. Purchase commitments represent purchase orders and long-term purchase arrangements related to the procurement of ingredients, supplies, machinery, equipment and services. These commitments are not expected to have a material impact on liquidity. Other long-term liabilities primarily represent payments related to deferred compensation obligations. For additional information on other long-term liabilities, see Note 19 to the Consolidated Financial Statements.
29
|
|
Contractual Payments Due by Fiscal Year
|
||||||||||||||||||
|
(Millions)
|
Total
|
2019
|
2020-2021
|
2022-2023
|
Thereafter
|
||||||||||||||
|
Debt obligations
(1)
|
$
|
9,958
|
|
$
|
1,901
|
|
$
|
3,151
|
|
$
|
1,652
|
|
$
|
3,254
|
|
||||
|
Interest payments
(2)
|
2,607
|
|
318
|
|
558
|
|
351
|
|
1,380
|
|
|||||||||
|
Derivative payments
(3)
|
6
|
|
5
|
|
1
|
|
—
|
|
—
|
|
|||||||||
|
Purchase commitments
|
1,238
|
|
1,032
|
|
163
|
|
37
|
|
6
|
|
|||||||||
|
Operating leases
|
360
|
|
75
|
|
109
|
|
67
|
|
109
|
|
|||||||||
|
Other long-term payments
(4)
|
178
|
|
—
|
|
81
|
|
30
|
|
67
|
|
|||||||||
|
Total long-term cash obligations
|
$
|
14,347
|
|
$
|
3,331
|
|
$
|
4,063
|
|
$
|
2,137
|
|
$
|
4,816
|
|
||||
_______________________________________
|
(1)
|
Excludes unamortized net discount/premium on debt issuances and debt issuance costs. For additional information on debt obligations, see Note 12 to the Consolidated Financial Statements.
|
|
(2)
|
Interest payments for short- and long-term borrowings are based on principal amounts and coupons or contractual rates at fiscal year end.
|
|
(3)
|
Represents payments of foreign exchange forward contracts and commodity contracts.
|
|
(4)
|
Represents other long-term liabilities, excluding unrecognized tax benefits, postretirement benefits and payments related to pension plans. For additional information on pension and postretirement benefits, see Note 10 to the Consolidated Financial Statements. For additional information on unrecognized tax benefits, see Note 11 to the Consolidated Financial Statements.
|
Off-Balance Sheet Arrangements and Other Commitments
We guarantee approximately
2,000
bank loans made to Pepperidge Farm independent contractor distributors by third-party financial institutions for the purchase of distribution routes. The maximum potential amount of the future payments under existing guarantees we could be required to make is
$210 million
. Our guarantees are indirectly secured by the distribution routes. We do not expect that we will be required to make material guarantee payments as a result of defaults on the bank loans guaranteed.
With the acquisition of Snyder's-Lance, we guarantee approximately
2,400
bank loans made to independent business owners by third-party financial institutions for the purchase of distribution routes. The outstanding aggregate balance on these loans was
$187 million
as of
July 29, 2018
. Our guarantees are indirectly secured by the distribution routes. We do not expect that we will be required to make material guarantee payments as a result of defaults on the bank loans guaranteed.
See also Note 18 to the Consolidated Financial Statements for information on off-balance sheet arrangements.
INFLATION
We are exposed to the impact of inflation on our cost of products sold. We use a number of strategies to mitigate the effects of cost inflation including increasing prices, commodity hedging and pursuing cost productivity initiatives such as global procurement strategies and capital investments that improve the efficiency of operations.
MARKET RISK SENSITIVITY
The principal market risks to which we are exposed are changes in foreign currency exchange rates, interest rates and commodity prices. In addition, we are exposed to equity price changes related to certain deferred compensation obligations. We manage our exposure to changes in interest rates by optimizing the use of variable-rate and fixed-rate debt and by utilizing interest rate swaps in order to maintain our variable-to-total debt ratio within targeted guidelines. International operations, which accounted for 19% of
2018
net sales, are concentrated principally in Australia and Canada. We manage our foreign currency exposures by borrowing in various foreign currencies and utilizing cross-currency swaps and foreign exchange forward contracts. We enter into cross-currency swaps and foreign exchange forward contracts for periods consistent with related underlying exposures, and the contracts do not constitute positions independent of those exposures. We do not enter into derivative contracts for speculative purposes and do not use leveraged instruments.
We principally use a combination of purchase orders and various short- and long-term supply arrangements in connection with the purchase of raw materials, including certain commodities and agricultural products. We also enter into commodity futures, options and swap contracts to reduce the volatility of price fluctuations of soybean oil, wheat, diesel fuel, aluminum, natural gas, soybean meal, corn, cocoa, butter, and cheese, which impact the cost of raw materials.
The information below summarizes our market risks associated with debt obligations and other significant financial instruments as of
July 29, 2018
. Fair values included herein have been determined based on quoted market prices or pricing models using current market rates. The information presented below should be read in conjunction with Notes 12, 13 and 15 to the Consolidated Financial Statements.
30
The following table presents principal cash flows and related interest rates by fiscal year of maturity for debt obligations. Interest rates disclosed on variable-rate debt represent the weighted-average rates at
July 29, 2018
.
|
|
Expected Fiscal Year of Maturity
|
Fair Value of Liabilities
|
|||||||||||||||||||||||||||||
|
(Millions)
|
2019
|
2020
|
2021
|
2022
|
2023
|
Thereafter
|
Total
|
||||||||||||||||||||||||
|
Debt
(1)
|
|||||||||||||||||||||||||||||||
|
Fixed rate
(2)
|
$
|
649
|
|
$
|
—
|
|
$
|
1,351
|
|
$
|
1
|
|
$
|
1,651
|
|
$
|
3,254
|
|
$
|
6,906
|
|
$
|
6,658
|
|
|||||||
|
Weighted-average interest rate
|
5.16
|
%
|
—
|
%
|
4.48
|
%
|
9.82
|
%
|
3.34
|
%
|
4.12
|
%
|
4.10
|
%
|
|||||||||||||||||
|
Variable rate
(3)
|
$
|
1,252
|
|
$
|
500
|
|
$
|
1,300
|
|
$
|
—
|
|
$
|
—
|
|
$
|
—
|
|
$
|
3,052
|
|
$
|
3,052
|
|
|||||||
|
Weighted-average interest rate
|
2.59
|
%
|
2.83
|
%
|
3.13
|
%
|
—
|
%
|
—
|
%
|
—
|
%
|
2.86
|
%
|
|||||||||||||||||
_______________________________________
|
(1)
|
Expected maturities exclude unamortized net discount/premium on debt issuances and debt issuance costs.
|
|
(2)
|
Represents $6.552 billion of USD borrowings and
$348 million
equivalent of AUD borrowings and $7 million equivalent of borrowings in other currencies.
|
|
(3)
|
Represents
$2.941 billion
of USD borrowings,
$90 million
equivalent of CAD borrowings and $20 million equivalent of borrowings in other currencies.
|
As of
July 30, 2017
, fixed-rate debt of approximately $2.534 billion with an average interest rate of 4.37% and variable-rate debt of approximately $1.014 billion with an average interest rate of 1.44% were outstanding. As of
July 30, 2017
, forward starting interest rate swaps with a notional amount of $300 million were outstanding. The average rate to be received on these swaps was 2.27%, and the average rate to be paid was estimated to be 3.09% over the remaining life of the swaps. For the swaps, variable rates are the weighted-average forward rates for the term of each contract.
We are exposed to foreign exchange risk as a result of transactions in currencies other than the functional currency of certain subsidiaries, including subsidiary debt. We utilize foreign exchange forward purchase and sale contracts to hedge these exposures. The following table summarizes the foreign exchange forward contracts outstanding and the related weighted-average contract exchange rates as of
July 29, 2018
.
|
(Millions)
|
Notional Value
|
Average Contractual Exchange Rate (currency paid/ currency received)
|
|||
|
Foreign Exchange Forward Contracts
|
|||||
|
Receive USD/Pay CAD
|
$
|
149
|
|
1.2726
|
|
|
Receive AUD/Pay NZD
|
$
|
41
|
|
1.0817
|
|
|
Receive DKK/Pay USD
|
$
|
40
|
|
0.1649
|
|
We had an additional number of smaller contracts to purchase or sell various other currencies with a notional value of
$14 million
as of
July 29, 2018
. The aggregate fair value of all contracts was a
gain
of
$2 million
as of
July 29, 2018
. The total notional value of foreign exchange forward contracts outstanding was $420 million, and the aggregate fair value was a loss of $18 million as of
July 30, 2017
.
We enter into commodity futures, options and swap contracts to reduce the volatility of price fluctuations for commodities. As of
July 29, 2018
, the notional value of these contracts was
$118 million
, and the aggregate fair value of these contracts was a gain of $1 million. As of
July 30, 2017
, the notional value of these contracts was
$90 million
, and the aggregate fair value of these contracts was a gain of $5 million.
We enter into swap contracts which hedge a portion of exposures relating to certain deferred compensation obligations linked to the total return of our capital stock, the total return of the Vanguard Institutional Index, and the total return of the Vanguard Total International Stock Index. Under these contracts, we pay variable interest rates and receive from the counterparty either: the total return on our capital stock; the total return of the Standard & Poor's 500 Index, which is expected to approximate the total return of the Vanguard Institutional Index; or the total return of the iShares MSCI EAFE Index, which is expected to approximate the total return of the Vanguard Total International Stock Index. The notional value of the contract that is linked to the total return on our capital stock was
$8 million
at
July 29, 2018
, and
$9 million
at
July 30, 2017
. The average forward interest rate applicable to this contract, which expires in
April 2019
, was
2.97%
at
July 29, 2018
. The notional value of the contract that is linked to the return on the Standard & Poor's 500 Index was
$23 million
at
July 29, 2018
, and
$26 million
at
July 30, 2017
. The average forward interest rate applicable to this contract, which expires in
March 2019
, was
2.97%
at
July 29, 2018
. The notional value of the contract that is linked to the total return of the iShares MSCI EAFE Index was
$10 million
at
July 29, 2018
, and
$8 million
at
July 30, 2017
. The average forward interest rate applicable to this contract, which expires in
March 2019
, was
2.60%
at
July 29, 2018
. As of
July 29, 2018
and
July 30, 2017
, the fair value of these contracts was a gain of $1 million.
31
Our utilization of financial instruments in managing market risk exposures described above is consistent with the prior year. Changes in the portfolio of financial instruments are a function of the results of operations, debt repayment and debt issuances, market effects on debt and foreign currency, and our acquisition and divestiture activities.
SIGNIFICANT ACCOUNTING ESTIMATES
We prepare our consolidated financial statements in conformity with accounting principles generally accepted in the United States. The preparation of these financial statements requires the use of estimates, judgments and assumptions that affect the reported amounts of assets and liabilities at the date of the financial statements and reported amounts of revenues and expenses during the periods presented. Actual results could differ from those estimates and assumptions. See Note 1 to the Consolidated Financial Statements for a discussion of significant accounting policies. The following areas all require the use of subjective or complex judgments, estimates and assumptions:
Trade and consumer promotion programs —
We offer various sales incentive programs to customers and consumers, such as feature price discounts, in-store display incentives, cooperative advertising programs, new product introduction fees, and coupons. The mix between promotion programs, which are classified as reductions in revenue, and advertising or other marketing activities, which are classified as marketing and selling expenses, fluctuates between periods based on our overall marketing plans, and such fluctuations have an impact on revenues. The measurement and recognition of the costs for trade and consumer promotion programs involves the use of judgment related to performance and redemption estimates. Estimates are made based on historical experience and other factors. Typically, programs that are offered have a very short duration. Historically, the difference between actual experience compared to estimated redemptions and performance has not been significant to the quarterly or annual financial statements. However, actual expenses may differ if the level of redemption rates and performance were to vary from estimates.
Valuation of long-lived assets —
Fixed assets and amortizable intangible assets are reviewed for impairment as events or changes in circumstances occur indicating that the carrying value of the asset may not be recoverable. Undiscounted cash flow analyses are used to determine if impairment exists. If impairment is determined to exist, the loss is calculated based on estimated fair value.
Goodwill and intangible assets deemed to have indefinite lives are not amortized but rather are tested at least annually for impairment, or more often if events or changes in circumstances indicate that more likely than not the carrying amount of the asset may not be recoverable. Goodwill is tested for impairment at the reporting unit level. A reporting unit represents an operating segment or a component of an operating segment. Goodwill is tested for impairment by either performing a qualitative evaluation or a quantitative test. The qualitative evaluation is an assessment of factors to determine whether it is more likely than not that the fair value of a reporting unit is less than its carrying amount, including goodwill. We may elect not to perform the qualitative assessment for some or all reporting units and perform a quantitative impairment test. Fair value is determined based on discounted cash flow analyses. The discounted estimates of future cash flows include significant management assumptions such as revenue growth rates, operating margins, weighted average cost of capital, and future economic and market conditions. If the carrying value of the reporting unit exceeds fair value, goodwill is considered impaired. In January 2017, the FASB issued revised guidance that simplifies the test for goodwill impairment, effective for fiscal years beginning after December 15, 2019, with early adoption permitted. We elected to early adopt the guidance in the fourth quarter of 2017. Under the revised guidance, if a reporting unit’s carrying value exceeds its fair value, an impairment charge will be recorded to reduce the reporting unit to fair value. Prior to the revised guidance, the amount of the impairment was the difference between the carrying value of the goodwill and the "implied" fair value, which was calculated as if the reporting unit had just been acquired and accounted for as a business combination.
Indefinite-lived intangible assets are tested for impairment by comparing the fair value of the asset to the carrying value. Fair value is determined based on discounted cash flow analyses that include significant management assumptions such as revenue growth rates, weighted average cost of capital, and assumed royalty rates. If the carrying value exceeds fair value, an impairment charge will be recorded to reduce the asset to fair value.
2016 Assessments
In the fourth quarter of 2016, as part of our annual review of intangible assets, we recognized an impairment charge of
$106 million
on goodwill and
$35 million
on a trademark within the Bolthouse Farms carrot and carrot ingredients reporting unit, which is included in the Campbell Fresh segment. In 2016, carrot performance primarily reflected the adverse impact of weather conditions on crop yields, and execution issues in response to those conditions, which led to customer dissatisfaction, a loss of business, and higher carrot costs in the second half of the year. The impairment was attributable to a decline in profitability in the second half of 2016 and a revised outlook for the business, with reduced expectations for sales, operating margins, and discounted cash flows.
2017 Assessments
During the second quarter of 2017, sales and operating profit performance for Bolthouse Farms carrot and carrot ingredients were well below our expectations due to difficulty with regaining market share lost during 2016 and higher carrot costs from the adverse impact of heavy rains on crop yields. During the quarter, we also lowered our forecast for sales and earnings for the reporting unit for the second half of 2017 based on revised market share recovery expectations and the continuing effect of unusual
32
weather conditions on carrot costs. In addition, as part of a strategic review initiated by a new leadership team of Campbell Fresh during the second quarter, we decided to reduce emphasis on growing sales of carrot ingredients, which are a by-product of the manufacturing process, and to manage carrots sold at retail for modest sales growth consistent with the category while improving profitability. Accordingly, we reduced our expectations for recovery of retail carrot market share. As a consequence of the business performance and the strategic review, we lowered our sales outlook for future fiscal years.We also lowered our average margin expectations due in part to cost volatility, which has been higher than expected. Based upon the business performance in the second quarter of 2017, our reduced near-term outlook, and reduced expectations for sales, operating margins and discounted cash flows, we performed an interim impairment assessment in the second quarter, which resulted in a
$127 million
impairment charge on goodwill and
$20 million
on a trademark in the reporting unit.
We acquired Garden Fresh Gourmet on June 29, 2015. During 2017, sales and operating profit performance for Garden Fresh Gourmet, a reporting unit within the Campbell Fresh segment, were well below expectations, and we lowered our outlook for the second half of 2017 due to customer losses and failure to meet product distribution goals. We expected to expand distribution of salsa beyond our concentration in the Midwest region, however this proved to be challenging as differentiated recipes are required to meet taste profiles in other parts of the country. In addition, as part of a strategic review initiated by a new leadership team of Campbell Fresh during the second quarter, we lowered our distribution and category growth expectations and, therefore, future sales outlook. Based upon the business performance in 2017, our reduced near-term outlook, and reduced expectations for sales, operating margins and discounted cash flows, we performed an interim impairment assessment in the second quarter, which resulted in a
$64 million
impairment charge on goodwill and
$1 million
on a trademark in the reporting unit.
2018 Assessments
During the second quarter of 2018, we performed an interim impairment assessment on the intangible assets of the Bolthouse Farms carrot and carrot ingredients reporting unit as operating performance was below expectations. The business was impacted by adverse weather conditions and the implementation of enhanced quality protocols, which impacted crop yields and resulted in higher costs. This cost volatility continued to be higher than expected and caused us to reassess our short- and long-term margin expectations for this business. Based on this performance, we reduced our outlook for future operating margins and discounted cash flows, which resulted in a
$75 million
impairment charge, representing a write-down of the remaining goodwill in the reporting unit. The fair value of the trademark exceeded the carrying value, which was
$48 million
.
During the third quarter of 2018, we performed an interim impairment assessment on the intangible assets of the deli reporting unit, which includes Garden Fresh Gourmet and the U.S. refrigerated soup business within Campbell Fresh. During the third quarter of 2018, certain of our private label refrigerated soup customers, which represent a majority of the business, informed us of their intention to in-source production beginning in 2019, and the sales and operating profit outlook of the Garden Fresh Gourmet business was reduced. Due to the anticipated loss of refrigerated soup business with these customers, as well as the recent performance of the Garden Fresh Gourmet business, we revised the long-term outlook for future sales, operating margins and discounted cash flows for this reporting unit, which resulted in an
$81 million
impairment charge on goodwill, representing a write-down of the remaining goodwill in the reporting unit,
$13 million
on a trademark, and
$11 million
on plant assets in the reporting unit.
In addition, we performed an interim impairment assessment on the intangible assets of the Bolthouse Farms refrigerated beverages and salad dressings reporting unit within the Campbell Fresh segment as the operating performance in the third quarter was below expectations. We assessed sales performance of refrigerated beverages and key drivers impacting gross profit for the unit. We revised our long-term outlook for future earnings and discounted cash flows to reflect reduced sales expectations to modest growth and decreased our gross profit outlook to reflect the inflation and manufacturing efficiency pressures that remain with the unit. This revised outlook resulted in a
$384 million
impairment charge on goodwill, representing a write-down of the remaining goodwill in the reporting unit, and
$130 million
on a trademark in the reporting unit.
In the fourth quarter of 2018, as part of our annual review of intangible assets, we recognized an impairment charge of
$54 million
on the
Plum
trademark. In 2018, sales and operating performance were well below expectations due in part to competitive pressure and reduced margins. In the fourth quarter of 2018, as part of a strategic review initiated by a new leadership team and based on recent performance, we lowered our long-term outlook for future sales.
As of
July 29, 2018
, the carrying value of goodwill was
$4.58 billion
. Holding all other assumptions used in the 2018 fair value measurement constant, a 1% increase in the weighted-average cost of capital assumption would not reduce fair value of any of the reporting units below carrying value and would not result any impairment charges.
As of
July 29, 2018
, the carrying value of indefinite-lived trademarks was
$3.123 billion
, of which
$48 million
related to the Bolthouse Farms carrot and carrot ingredients reporting unit,
$150 million
related to the Bolthouse Farms refrigerated beverages and salad dressings reporting unit,
$23 million
related to the
Garden Fresh Gourmet
trademark, and $61 million related to the
Plum
trademark. Holding all other assumptions used in the 2018 fair value measurement constant, changes in the assumptions below would reduce fair value of these trademarks and result in impairment charges of approximately:
33
|
(Millions)
|
Bolthouse Farms Carrot and Carrot Ingredients
|
Bolthouse Farms Refrigerated Beverages and Salad Dressings
|
Garden Fresh Gourmet
|
Plum
|
||||||||||||
|
1% increase in the weighted-average cost of capital
|
$
|
—
|
|
$
|
(30
|
)
|
$
|
(5
|
)
|
$
|
(10
|
)
|
||||
|
1% reduction in revenue growth
|
$
|
—
|
|
$
|
(20
|
)
|
$
|
—
|
|
$
|
(5
|
)
|
||||
The carrying value of the
Pace
trademark was $292 million as of
July 29, 2018
, and the estimated fair value exceeded the carrying value by less than 10%. Holding all other assumptions used in the 2018 fair value measurement of the
Pace
trademark constant, a 1% increase in the weighted-average cost of capital assumption would result in an impairment charge of approximately $30 million, and a 1% reduction in the revenue growth assumption would result in an impairment charge of approximately $10 million.
The carrying value of trademarks of
$280 million
associated with the Pacific Foods acquisition and
$2.131 billion
associated with the Snyder's-Lance acquisition represents fair value. Holding all other assumptions used in the acquisition valuation measurement constant, changes in the assumptions below would reduce fair value of the these trademarks and result in impairment charges of approximately:
|
(Millions)
|
Pacific Foods
|
Various Snyder's-Lance
|
||||||
|
1% increase in the weighted-average cost of capital
|
$
|
(40
|
)
|
$
|
(270
|
)
|
||
|
1% reduction in revenue growth
|
$
|
(20
|
)
|
$
|
(135
|
)
|
||
For the remaining balance of our other trademarks, holding all other assumptions used in the 2018 fair value measurement constant, neither a 1% increase in the weighted-average cost of capital assumption nor a 1% reduction in the revenue growth assumption would result in any material impairment.
The estimates of future cash flows involve considerable management judgment and are based upon assumptions about expected future operating performance, economic conditions, market conditions, and cost of capital. Inherent in estimating the future cash flows are uncertainties beyond our control, such as changes in capital markets. The actual cash flows could differ materially from management’s estimates due to changes in business conditions, operating performance, and economic conditions.
If assumptions are not achieved or market conditions decline, potential additional impairment charges could result. We will continue to monitor the valuation of our long-lived assets.
See also Note 5 to the Consolidated Financial Statements for additional information on goodwill and intangible assets.
Pension and postretirement benefits —
We provide certain pension and postretirement benefits to employees and retirees. Determining the cost associated with such benefits is dependent on various actuarial assumptions, including discount rates, expected return on plan assets, compensation increases, turnover rates and health care trend rates. Independent actuaries, in accordance with accounting principles generally accepted in the United States, perform the required calculations to determine expense.
The discount rate is established as of our fiscal year-end measurement date. In establishing the discount rate, we review published market indices of high-quality debt securities, adjusted as appropriate for duration. In addition, independent actuaries apply high-quality bond yield curves to the expected benefit payments of the plans. Beginning in 2018, we changed the method we used to estimate the service and interest cost components of the net periodic benefit expense (income). We elected to use a full yield curve approach to estimate service cost and interest cost by applying the specific spot rates along the yield curve used to determine the benefit obligation of the relevant projected cash flows. Previously, we estimated service cost and interest cost using a single weighted-average discount rate derived from the yield curve used to measure the benefit obligation at the beginning of the period. We made this change to provide a more precise measurement of service cost and interest cost by improving the correlation between projected benefit cash flows and the corresponding spot yield curve rates. This change did not affect the measurement of our benefit obligations. We accounted for this change prospectively in 2018 as a change in accounting estimate
.
As a result of this change, net periodic benefit income increased by approximately
$17 million
in 2018, compared to what the net periodic benefit income would have been under the previous method.
The expected return on plan assets is a long-term assumption based upon historical experience and expected future performance, considering our current and projected investment mix. This estimate is based on an estimate of future inflation, long-term projected real returns for each asset class, and a premium for active management. Within any given fiscal period, significant differences may arise between the actual return and the expected return on plan assets. Gains and losses resulting from differences between actual experience and the assumptions are determined at each measurement date.
34
Net periodic pension and postretirement expense (income) was
$(185) million
in
2018
,
$(258) million
in
2017
and
$317 million
in
2016
.
Significant weighted-average assumptions as of the end of the year were as follows:
|
2018
|
2017
|
2016
|
|||
|
Pension
|
|||||
|
Discount rate for benefit obligations
|
4.15%
|
3.74%
|
3.39%
|
||
|
Expected return on plan assets
|
6.86%
|
6.84%
|
7.09%
|
||
|
Postretirement
|
|||||
|
Discount rate for obligations
|
4.06%
|
3.45%
|
3.20%
|
||
|
Initial health care trend rate
|
6.75%
|
7.25%
|
7.25%
|
||
|
Ultimate health care trend rate
|
4.50%
|
4.50%
|
4.50%
|
||
Estimated sensitivities to annual net periodic pension cost are as follows: a 50-basis-point decline in the discount rate would decrease expense by approximately $6 million and would result in an immediate loss recognition of approximately $122 million. A 50-basis-point reduction in the estimated return on assets assumption would increase expense by approximately $10 million. A one-percentage-point increase in assumed health care costs would have no impact on postretirement service and interest cost and would not result in an immediate loss.
No contributions were made to U.S. pension plans in
2018
,
2017
and
2016
. Contributions to non-U.S. plans were
$5 million
in
2018
and
2017
, and
$2 million
in
2016
. We do not expect to contribute to the U.S. pension plans in 2019. Contributions to non-U.S. plans are expected to be approximately
$4 million
in 2019.
See also Note 10 to the Consolidated Financial Statements for additional information on pension and postretirement benefits.
Income taxes —
The effective tax rate reflects statutory tax rates, tax planning opportunities available in the various jurisdictions in which we operate and management’s estimate of the ultimate outcome of various tax audits and issues. Significant judgment is required in determining the effective tax rate and in evaluating tax positions. Income taxes are recorded based on amounts refundable or payable in the current year and include the effect of deferred taxes. Deferred tax assets and liabilities are recognized for the future impact of differences between the financial statement carrying amounts of assets and liabilities and their respective tax bases, as well as for operating loss and tax credit carryforwards. Deferred tax assets and liabilities are measured using enacted tax rates expected to apply to taxable income in the years in which those differences are expected to be recovered or settled. Valuation allowances are established for deferred tax assets when it is more likely than not that a tax benefit will not be realized.
On December 22, 2017, the Act was enacted into law and made significant changes to corporate taxation, including reducing the corporate tax rate from 35% to 21% effective January 1, 2018, and transitioning to a territorial system for taxation on foreign earnings along with the imposition of a transition tax in 2018 on the deemed repatriation of unremitted foreign earnings.
See also Notes 1 and 11 to the Consolidated Financial Statements for further discussion on income taxes.
RECENT ACCOUNTING PRONOUNCEMENTS
See Note 2 to the Consolidated Financial Statements for information on recent accounting pronouncements.
CAUTIONARY FACTORS THAT MAY AFFECT FUTURE RESULTS
This Report contains "forward-looking" statements within the meaning of the Private Securities Litigation Reform Act of 1995. These forward-looking statements reflect our current expectations regarding our future results of operations, economic performance, financial condition and achievements. These forward-looking statements can be identified by words such as "anticipate," "believe," "estimate," "expect," "will," "goal," "plan," "vision" and similar expressions. One can also identify forward-looking statements by the fact that they do not relate strictly to historical or current facts, and may reflect anticipated cost savings or implementation of our strategic plan. These statements reflect our current plans and expectations and are based on information currently available to us. They rely on several assumptions regarding future events and estimates which could be inaccurate and which are inherently subject to risks and uncertainties.
We wish to caution the reader that the following important factors and those important factors described in Part 1, Item 1A and elsewhere in this Report, or in our other Securities and Exchange Commission filings, could affect our actual results and could cause such results to vary materially from those expressed in any forward-looking statements made by, or on behalf of, us:
|
•
|
our ability to execute on and realize the expected benefits from the actions we intend to take as a result of our recent strategy and portfolio review;
|
|
•
|
our ability to differentiate our products and protect our category leading positions, especially in soup;
|
|
•
|
our ability to complete and to realize the projected benefits of planned divestitures and other business portfolio changes;
|
35
|
•
|
our ability to realize the projected benefits, including cost synergies, from the recent acquisitions of Snyder's-Lance and Pacific Foods;
|
|
•
|
our ability to realize projected cost savings and benefits from efficiency and/or restructuring initiatives;
|
|
•
|
our indebtedness and ability to pay such indebtedness;
|
|
•
|
disruptions to our supply chain, including fluctuations in the supply of and inflation in energy and raw and packaging materials cost;
|
|
•
|
our ability to manage changes to our organizational structure and/or business processes, including selling, distribution, manufacturing and information management systems or processes;
|
|
•
|
the impact of strong competitive responses to our efforts to leverage brand power with product innovation, promotional programs and new advertising;
|
|
•
|
the risks associated with trade and consumer acceptance of product improvements, shelving initiatives, new products and pricing and promotional strategies;
|
|
•
|
changes in consumer demand for our products and favorable perception of our brands;
|
|
•
|
changing inventory management practices by certain of our key customers;
|
|
•
|
a changing customer landscape, with value and e-commerce retailers expanding their market presence, while certain of our key customers maintain significance to our business;
|
|
•
|
product quality and safety issues, including recalls and product liabilities;
|
|
•
|
the costs, disruption and diversion of management’s attention associated with campaigns commenced by activist investors;
|
|
•
|
the uncertainties of litigation and regulatory actions against us;
|
|
•
|
the possible disruption to the independent contractor distribution models used by certain of our businesses, including as a result of litigation or regulatory actions affecting their independent contractor classification;
|
|
•
|
the impact of non-U.S. operations, including trade restrictions, public corruption and compliance with foreign laws and regulations;
|
|
•
|
impairment to goodwill or other intangible assets;
|
|
•
|
our ability to protect our intellectual property rights;
|
|
•
|
increased liabilities and costs related to our defined benefit pension plans;
|
|
•
|
a material failure in or breach of our information technology systems;
|
|
•
|
our ability to attract and retain key talent;
|
|
•
|
changes in currency exchange rates, tax rates, interest rates, debt and equity markets, inflation rates, economic conditions, law, regulation and other external factors; and
|
|
•
|
unforeseen business disruptions in one or more of our markets due to political instability, civil disobedience, terrorism, armed hostilities, extreme weather conditions, natural disasters or other calamities.
|
This discussion of uncertainties is by no means exhaustive but is designed to highlight important factors that may impact our outlook. We disclaim any obligation or intent to update forward-looking statements made by us in order to reflect new information, events or circumstances after the date they are made.
Item 7A.
Quantitative and Qualitative Disclosure About Market Risk
The information presented in the section entitled "Management’s Discussion and Analysis of Financial Condition and Results of Operations — Market Risk Sensitivity" is incorporated herein by reference.
36
Item 8.
Financial Statements and Supplementary Data
CAMPBELL SOUP COMPANY
Consolidated Statements of Earnings
(millions, except per share amounts)
|
|
2018
|
2017
|
2016
|
||||||||
|
Net sales
|
$
|
8,685
|
|
$
|
7,890
|
|
$
|
7,961
|
|
||
|
Costs and expenses
|
|||||||||||
|
Cost of products sold
|
5,869
|
|
4,965
|
|
5,033
|
|
|||||
|
Marketing and selling expenses
|
902
|
|
855
|
|
852
|
|
|||||
|
Administrative expenses
|
654
|
|
550
|
|
575
|
|
|||||
|
Research and development expenses
|
110
|
|
111
|
|
105
|
|
|||||
|
Other expenses / (income)
|
619
|
|
(9
|
)
|
405
|
|
|||||
|
Restructuring charges
|
62
|
|
18
|
|
31
|
|
|||||
|
Total costs and expenses
|
8,216
|
|
6,490
|
|
7,001
|
|
|||||
|
Earnings before interest and taxes
|
469
|
|
1,400
|
|
960
|
|
|||||
|
Interest expense
|
201
|
|
112
|
|
115
|
|
|||||
|
Interest income
|
4
|
|
5
|
|
4
|
|
|||||
|
Earnings before taxes
|
272
|
|
1,293
|
|
849
|
|
|||||
|
Taxes on earnings
|
11
|
|
406
|
|
286
|
|
|||||
|
Net earnings
|
261
|
|
887
|
|
563
|
|
|||||
|
Less: Net earnings (loss) attributable to noncontrolling interests
|
—
|
|
—
|
|
—
|
|
|||||
|
Net earnings attributable to Campbell Soup Company
|
$
|
261
|
|
$
|
887
|
|
$
|
563
|
|
||
|
Per Share — Basic
|
|||||||||||
|
Net earnings attributable to Campbell Soup Company
|
$
|
.87
|
|
$
|
2.91
|
|
$
|
1.82
|
|
||
|
Weighted average shares outstanding — basic
|
301
|
|
305
|
|
309
|
|
|||||
|
Per Share — Assuming Dilution
|
|||||||||||
|
Net earnings attributable to Campbell Soup Company
|
$
|
.86
|
|
$
|
2.89
|
|
$
|
1.81
|
|
||
|
Weighted average shares outstanding — assuming dilution
|
302
|
|
307
|
|
311
|
|
|||||
See accompanying Notes to Consolidated Financial Statements.
37
CAMPBELL SOUP COMPANY
(millions)
|
2018
|
2017
|
2016
|
|||||||||||||||||||||||||||||||||
|
Pre-tax amount
|
Tax (expense) benefit
|
After-tax amount
|
Pre-tax amount
|
Tax (expense) benefit
|
After-tax amount
|
Pre-tax amount
|
Tax (expense) benefit
|
After-tax amount
|
|||||||||||||||||||||||||||
|
Net earnings
|
$
|
261
|
|
$
|
887
|
|
$
|
563
|
|
||||||||||||||||||||||||||
|
Other comprehensive income (loss):
|
|||||||||||||||||||||||||||||||||||
|
Foreign currency translation:
|
|||||||||||||||||||||||||||||||||||
|
Foreign currency translation adjustments
|
$
|
(69
|
)
|
$
|
—
|
|
(69
|
)
|
$
|
40
|
|
$
|
—
|
|
40
|
|
$
|
45
|
|
$
|
—
|
|
45
|
|
|||||||||||
|
Cash-flow hedges:
|
|||||||||||||||||||||||||||||||||||
|
Unrealized gains (losses) arising during period
|
23
|
|
(7
|
)
|
16
|
|
19
|
|
(7
|
)
|
12
|
|
(45
|
)
|
16
|
|
(29
|
)
|
|||||||||||||||||
|
Reclassification adjustment for (gains) losses included in net earnings
|
3
|
|
(1
|
)
|
2
|
|
11
|
|
(4
|
)
|
7
|
|
(9
|
)
|
2
|
|
(7
|
)
|
|||||||||||||||||
|
Pension and other postretirement benefits:
|
|||||||||||||||||||||||||||||||||||
|
Prior service credit arising during the period
|
9
|
|
(2
|
)
|
7
|
|
12
|
|
(4
|
)
|
8
|
|
93
|
|
(34
|
)
|
59
|
|
|||||||||||||||||
|
Reclassification of prior service credit included in net earnings
|
(27
|
)
|
7
|
|
(20
|
)
|
(25
|
)
|
9
|
|
(16
|
)
|
(1
|
)
|
—
|
|
(1
|
)
|
|||||||||||||||||
|
Other comprehensive income (loss)
|
$
|
(61
|
)
|
$
|
(3
|
)
|
(64
|
)
|
$
|
57
|
|
$
|
(6
|
)
|
51
|
|
$
|
83
|
|
$
|
(16
|
)
|
67
|
|
|||||||||||
|
Total comprehensive income (loss)
|
$
|
197
|
|
$
|
938
|
|
$
|
630
|
|
||||||||||||||||||||||||||
|
Total comprehensive income (loss) attributable to noncontrolling interests
|
1
|
|
—
|
|
3
|
|
|||||||||||||||||||||||||||||
|
Total comprehensive income (loss) attributable to Campbell Soup Company
|
$
|
196
|
|
$
|
938
|
|
$
|
627
|
|
||||||||||||||||||||||||||
See accompanying Notes to Consolidated Financial Statements.
38
CAMPBELL SOUP COMPANY
(millions, except per share amounts)
|
July 29,
2018 |
July 30,
2017 |
||||||
|
Current assets
|
|||||||
|
Cash and cash equivalents
|
$
|
226
|
|
$
|
319
|
|
|
|
Accounts receivable, net
|
785
|
|
605
|
|
|||
|
Inventories
|
1,199
|
|
902
|
|
|||
|
Other current assets
|
86
|
|
74
|
|
|||
|
Total current assets
|
2,296
|
|
1,900
|
|
|||
|
Plant assets, net of depreciation
|
3,233
|
|
2,454
|
|
|||
|
Goodwill
|
4,580
|
|
2,115
|
|
|||
|
Other intangible assets, net of amortization
|
4,196
|
|
1,118
|
|
|||
|
Other assets ($77 as of 2018 and $51 as of 2017 attributable to variable interest entity)
|
224
|
|
139
|
|
|||
|
Total assets
|
$
|
14,529
|
|
$
|
7,726
|
|
|
|
Current liabilities
|
|||||||
|
Short-term borrowings
|
$
|
1,896
|
|
$
|
1,037
|
|
|
|
Payable to suppliers and others
|
893
|
|
666
|
|
|||
|
Accrued liabilities
|
676
|
|
561
|
|
|||
|
Dividends payable
|
107
|
|
111
|
|
|||
|
Accrued income taxes
|
22
|
|
20
|
|
|||
|
Total current liabilities
|
3,594
|
|
2,395
|
|
|||
|
Long-term debt
|
7,998
|
|
2,499
|
|
|||
|
Deferred taxes
|
995
|
|
490
|
|
|||
|
Other liabilities
|
569
|
|
697
|
|
|||
|
Total liabilities
|
13,156
|
|
6,081
|
|
|||
|
Commitments and contingencies
|
|
|
|||||
|
Campbell Soup Company shareholders' equity
|
|||||||
|
Preferred stock; authorized 40 shares; none issued
|
—
|
|
—
|
|
|||
|
Capital stock, $.0375 par value; authorized 560 shares; issued 323 shares
|
12
|
|
12
|
|
|||
|
Additional paid-in capital
|
349
|
|
359
|
|
|||
|
Earnings retained in the business
|
2,224
|
|
2,385
|
|
|||
|
Capital stock in treasury, at cost
|
(1,103
|
)
|
(1,066
|
)
|
|||
|
Accumulated other comprehensive loss
|
(118
|
)
|
(53
|
)
|
|||
|
Total Campbell Soup Company shareholders' equity
|
1,364
|
|
1,637
|
|
|||
|
Noncontrolling interests
|
9
|
|
8
|
|
|||
|
Total equity
|
1,373
|
|
1,645
|
|
|||
|
Total liabilities and equity
|
$
|
14,529
|
|
$
|
7,726
|
|
|
See accompanying Notes to Consolidated Financial Statements.
39
CAMPBELL SOUP COMPANY
(millions)
|
|
|||||||||||
|
|
2018
|
2017
|
2016
|
||||||||
|
Cash flows from operating activities:
|
|||||||||||
|
Net earnings
|
$
|
261
|
|
$
|
887
|
|
$
|
563
|
|
||
|
Adjustments to reconcile net earnings to operating cash flow
|
|||||||||||
|
Impairment charges
|
748
|
|
212
|
|
141
|
|
|||||
|
Restructuring charges
|
62
|
|
18
|
|
31
|
|
|||||
|
Stock-based compensation
|
61
|
|
60
|
|
64
|
|
|||||
|
Amortization of inventory fair value adjustment from acquisition
|
42
|
|
—
|
|
—
|
|
|||||
|
Pension and postretirement benefit expense (income)
|
(187
|
)
|
(258
|
)
|
317
|
|
|||||
|
Depreciation and amortization
|
394
|
|
318
|
|
308
|
|
|||||
|
Deferred income taxes
|
(133
|
)
|
93
|
|
(30
|
)
|
|||||
|
Other, net
|
34
|
|
18
|
|
6
|
|
|||||
|
Changes in working capital, net of acquisitions
|
|||||||||||
|
Accounts receivable
|
56
|
|
28
|
|
24
|
|
|||||
|
Inventories
|
(84
|
)
|
46
|
|
59
|
|
|||||
|
Prepaid assets
|
27
|
|
(27
|
)
|
9
|
|
|||||
|
Accounts payable and accrued liabilities
|
78
|
|
(48
|
)
|
15
|
|
|||||
|
Net receipts from hedging activities
|
6
|
|
2
|
|
44
|
|
|||||
|
Other
|
(60
|
)
|
(58
|
)
|
(60
|
)
|
|||||
|
Net cash provided by operating activities
|
1,305
|
|
1,291
|
|
1,491
|
|
|||||
|
Cash flows from investing activities:
|
|||||||||||
|
Purchases of plant assets
|
(407
|
)
|
(338
|
)
|
(341
|
)
|
|||||
|
Sales of plant assets
|
1
|
|
—
|
|
5
|
|
|||||
|
Purchases of route businesses
|
(9
|
)
|
—
|
|
—
|
|
|||||
|
Sales of route businesses
|
10
|
|
—
|
|
—
|
|
|||||
|
Businesses acquired, net of cash acquired
|
(6,772
|
)
|
—
|
|
—
|
|
|||||
|
Other, net
|
(20
|
)
|
(30
|
)
|
(18
|
)
|
|||||
|
Net cash used in investing activities
|
(7,197
|
)
|
(368
|
)
|
(354
|
)
|
|||||
|
Cash flows from financing activities:
|
|||||||||||
|
Short-term borrowings
|
10,222
|
|
8,247
|
|
8,161
|
|
|||||
|
Short-term repayments
|
(9,944
|
)
|
(8,002
|
)
|
(8,923
|
)
|
|||||
|
Long-term borrowings
|
6,224
|
|
211
|
|
215
|
|
|||||
|
Long-term repayments
|
(63
|
)
|
(90
|
)
|
—
|
|
|||||
|
Repayments of notes payable
|
—
|
|
(400
|
)
|
—
|
|
|||||
|
Dividends paid
|
(426
|
)
|
(420
|
)
|
(390
|
)
|
|||||
|
Treasury stock purchases
|
(86
|
)
|
(437
|
)
|
(143
|
)
|
|||||
|
Treasury stock issuances
|
—
|
|
2
|
|
2
|
|
|||||
|
Payments related to tax withholding for stock-based compensation
|
(23
|
)
|
(22
|
)
|
(21
|
)
|
|||||
|
Repurchase of noncontrolling interest
|
(47
|
)
|
—
|
|
—
|
|
|||||
|
Payments of debt issuance costs
|
(50
|
)
|
—
|
|
—
|
|
|||||
|
Net cash provided by (used in) financing activities
|
5,807
|
|
(911
|
)
|
(1,099
|
)
|
|||||
|
Effect of exchange rate changes on cash
|
(8
|
)
|
11
|
|
5
|
|
|||||
|
Net change in cash and cash equivalents
|
(93
|
)
|
23
|
|
43
|
|
|||||
|
Cash and cash equivalents — beginning of period
|
319
|
|
296
|
|
253
|
|
|||||
|
Cash and cash equivalents — end of period
|
$
|
226
|
|
$
|
319
|
|
$
|
296
|
|
||
See accompanying Notes to Consolidated Financial Statements.
40
CAMPBELL SOUP COMPANY
Consolidated Statements of Equity
(millions, except per share amounts)
|
|
Campbell Soup Company Shareholders’ Equity
|
|
|
||||||||||||||||||||||||||||||
|
|
Capital Stock
|
Additional Paid-in
Capital |
Earnings Retained in the
Business |
Accumulated Other Comprehensive
Income (Loss) |
Noncontrolling
Interests
|
|
|||||||||||||||||||||||||||
|
|
Issued
|
In Treasury
|
Total
Equity
|
||||||||||||||||||||||||||||||
|
|
Shares
|
Amount
|
Shares
|
Amount
|
|||||||||||||||||||||||||||||
|
Balance at August 2, 2015
|
323
|
|
$
|
12
|
|
(13
|
)
|
$
|
(556
|
)
|
$
|
339
|
|
$
|
1,754
|
|
$
|
(168
|
)
|
$
|
(4
|
)
|
$
|
1,377
|
|
||||||||
|
Contribution from noncontrolling interest
|
9
|
|
9
|
|
|||||||||||||||||||||||||||||
|
Net earnings (loss)
|
563
|
|
—
|
|
563
|
|
|||||||||||||||||||||||||||
|
Other comprehensive income (loss)
|
64
|
|
3
|
|
67
|
|
|||||||||||||||||||||||||||
|
Dividends ($1.248 per share)
|
(390
|
)
|
(390
|
)
|
|||||||||||||||||||||||||||||
|
Treasury stock purchased
|
(3
|
)
|
(143
|
)
|
(143
|
)
|
|||||||||||||||||||||||||||
|
Treasury stock issued under management incentive and stock option plans
|
|
|
|
|
1
|
|
35
|
|
15
|
|
50
|
|
|||||||||||||||||||||
|
Balance at July 31, 2016
|
323
|
|
12
|
|
(15
|
)
|
(664
|
)
|
354
|
|
1,927
|
|
(104
|
)
|
8
|
|
1,533
|
|
|||||||||||||||
|
Net earnings (loss)
|
|
|
|
|
|
887
|
|
|
—
|
|
887
|
|
|||||||||||||||||||||
|
Other comprehensive income (loss)
|
|
|
|
|
|
|
51
|
|
—
|
|
51
|
|
|||||||||||||||||||||
|
Dividends ($1.40 per share)
|
|
|
|
|
|
(429
|
)
|
|
|
(429
|
)
|
||||||||||||||||||||||
|
Treasury stock purchased
|
|
|
(8
|
)
|
(437
|
)
|
|
|
|
|
(437
|
)
|
|||||||||||||||||||||
|
Treasury stock issued under management incentive and stock option plans
|
|
|
1
|
|
35
|
|
5
|
|
|
|
|
40
|
|
||||||||||||||||||||
|
Balance at July 30, 2017
|
323
|
|
12
|
|
(22
|
)
|
(1,066
|
)
|
359
|
|
2,385
|
|
(53
|
)
|
8
|
|
1,645
|
|
|||||||||||||||
|
Noncontrolling interest acquired
|
47
|
|
47
|
|
|||||||||||||||||||||||||||||
|
Repurchase of noncontrolling interest
|
(47
|
)
|
(47
|
)
|
|||||||||||||||||||||||||||||
|
Net earnings (loss)
|
|
|
|
|
|
261
|
|
|
—
|
|
261
|
|
|||||||||||||||||||||
|
Other comprehensive income (loss)
|
|
|
|
|
|
|
(65
|
)
|
1
|
|
(64
|
)
|
|||||||||||||||||||||
|
Dividends ($1.40 per share)
|
|
|
|
|
|
(422
|
)
|
|
|
(422
|
)
|
||||||||||||||||||||||
|
Treasury stock purchased
|
|
|
(2
|
)
|
(86
|
)
|
|
|
|
|
(86
|
)
|
|||||||||||||||||||||
|
Treasury stock issued under management incentive and stock option plans
|
|
|
|
|
2
|
|
49
|
|
(10
|
)
|
|
|
|
|
|
39
|
|
||||||||||||||||
|
Balance at July 29, 2018
|
323
|
|
$
|
12
|
|
(22
|
)
|
$
|
(1,103
|
)
|
$
|
349
|
|
$
|
2,224
|
|
$
|
(118
|
)
|
$
|
9
|
|
$
|
1,373
|
|
||||||||
See accompanying Notes to Consolidated Financial Statements.
41
Notes to Consolidated Financial Statements
(currency in millions, except per share amounts)
|
1.
|
Summary of Significant Accounting Policies
|
In this Report, unless otherwise stated, the terms "we," "us," "our" and the "company" refer to Campbell Soup Company and its consolidated subsidiaries.
We are a manufacturer and marketer of high-quality, branded food and beverage products.
Basis of Presentation
— The consolidated financial statements include our accounts and entities in which we maintain a controlling financial interest and a variable interest entity (VIE) for which we are the primary beneficiary. Intercompany transactions are eliminated in consolidation. Certain amounts in prior-year financial statements were reclassified to conform to the current-year presentation. See Note 2 for additional information. Our fiscal year ends on the Sunday nearest July 31. There were
52
weeks in 2018, 2017, and 2016.
Use of Estimates
— Generally accepted accounting principles require management to make estimates and assumptions that affect assets, liabilities, revenues and expenses. Actual results could differ from those estimates.
Revenue Recognition
— Revenues are recognized when the earnings process is complete. This occurs when products are shipped in accordance with terms of agreements, title and risk of loss transfer to customers, collection is probable and pricing is fixed or determinable. Revenues are recognized net of provisions for returns, discounts and allowances. Certain sales promotion expenses, such as feature price discounts, in-store display incentives, cooperative advertising programs, new product introduction fees and coupon redemption costs, are classified as a reduction of sales. The recognition of costs for promotion programs involves the use of judgment related to performance and redemption estimates. Estimates are made based on historical experience and other factors. Costs are recognized either upon sale or when the incentive is offered, based on the program. Revenues are presented on a net basis for arrangements under which suppliers perform certain additional services. In 2019, we will adopt revised accounting guidance on the recognition of revenue. See Note 2 for additional information.
Cash and Cash Equivalents
— All highly liquid debt instruments purchased with a maturity of three months or less are classified as cash equivalents.
Inventories
— All inventories are valued at the lower of average cost or net realizable value.
Property, Plant and Equipment
— Property, plant and equipment are recorded at historical cost and are depreciated over estimated useful lives using the straight-line method. Buildings and machinery and equipment are depreciated over periods not exceeding
45
years and
20
years, respectively. Assets are evaluated for impairment when conditions indicate that the carrying value may not be recoverable. Such conditions include significant adverse changes in business climate or a plan of disposal. Repairs and maintenance are charged to expense as incurred.
Goodwill and Intangible Assets
— Goodwill and intangible assets deemed to have indefinite lives are not amortized but rather are tested at least annually for impairment, or when circumstances indicate that the carrying amount of the asset may not be recoverable. Goodwill is tested for impairment at the reporting unit level. A reporting unit is an operating segment or a component of an operating segment. Goodwill is tested for impairment by either performing a qualitative evaluation or a quantitative test. The qualitative evaluation is an assessment of factors to determine whether it is more likely than not that the fair value of a reporting unit is less than its carrying amount, including goodwill. We may elect not to perform the qualitative assessment for some or all reporting units and perform a quantitative impairment test. Fair value is determined based on discounted cash flow analyses. The discounted estimates of future cash flows include significant management assumptions such as revenue growth rates, operating margins, weighted average cost of capital, and future economic and market conditions. If the carrying value of the reporting unit exceeds fair value, goodwill is considered impaired. In January 2017, the Financial Accounting Standards Board (FASB) issued revised guidance that simplifies the test for goodwill impairment, effective for fiscal years beginning after December 15, 2019, with early adoption permitted. Under the revised guidance, if a reporting unit’s carrying value exceeds its fair value, an impairment charge will be recorded to reduce the reporting unit to fair value. Prior to the revised guidance, the amount of the impairment was the difference between the carrying value of the goodwill and the "implied" fair value, which was calculated as if the reporting unit had just been acquired and accounted for as a business combination.
Indefinite-lived intangible assets are tested for impairment by comparing the fair value of the asset to the carrying value. Fair value is determined based on discounted cash flow analyses that include significant management assumptions such as revenue growth rates, weighted average cost of capital, and assumed royalty rates. If the carrying value exceeds fair value, an impairment charge will be recorded to reduce the asset to fair value.
See Note 5 for information on intangible assets and impairment charges.
Derivative Financial Instruments
— We use derivative financial instruments primarily for purposes of hedging exposures to fluctuations in foreign currency exchange rates, interest rates, commodities and equity-linked employee benefit obligations. We enter into these derivative contracts for periods consistent with the related underlying exposures, and the contracts do not constitute
42
positions independent of those exposures. We do not enter into derivative contracts for speculative purposes and do not use leveraged instruments. Our derivative programs include strategies that qualify and strategies that do not qualify for hedge accounting treatment. To qualify for hedge accounting, the hedging relationship, both at inception of the hedge and on an ongoing basis, is expected to be highly effective in achieving offsetting changes in the fair value of the hedged risk during the period that the hedge is designated.
All derivatives are recognized on the balance sheet at fair value. For derivatives that qualify for hedge accounting, on the date the derivative contract is entered into, we designate the derivative as a hedge of the fair value of a recognized asset or liability or a firm commitment (fair-value hedge), a hedge of a forecasted transaction or of the variability of cash flows to be received or paid related to a recognized asset or liability (cash-flow hedge), or a hedge of a net investment in a foreign operation. Some derivatives may also be considered natural hedging instruments (changes in fair value act as economic offsets to changes in fair value of the underlying hedged item) and are not designated for hedge accounting.
Changes in the fair value of a fair-value hedge, along with the gain or loss on the underlying hedged asset or liability (including losses or gains on firm commitments), are recorded in current-period earnings. The effective portion of gains and losses on cash-flow hedges are recorded in other comprehensive income (loss), until earnings are affected by the variability of cash flows. If the hedge is no longer effective, all changes in the fair value of the derivative are included in earnings each period until the instrument matures. If a derivative is used as a hedge of a net investment in a foreign operation, its changes in fair value, to the extent effective as a hedge, are recorded in other comprehensive income (loss). Any ineffective portion of designated hedges is recognized in current-period earnings. Changes in the fair value of derivatives that are not designated for hedge accounting are recognized in current-period earnings.
Cash flows from derivative contracts are included in Net cash provided by operating activities.
Advertising Production Costs
— Advertising production costs are expensed in the period that the advertisement first takes place or when a decision is made not to use an advertisement.
Research and Development Costs
— The costs of research and development are expensed as incurred. Costs include expenditures for new product and manufacturing process innovation, and improvements to existing products and processes. Costs primarily consist of salaries, wages, consulting, and depreciation and maintenance of research facilities and equipment.
Income Taxes
— Deferred tax assets and liabilities are recognized for the future impact of differences between the financial statement carrying amounts of assets and liabilities and their respective tax bases, as well as for operating loss and tax credit carryforwards. Deferred tax assets and liabilities are measured using enacted tax rates expected to apply to taxable income in the years in which those temporary differences are expected to be recovered or settled. The effect on deferred tax assets and liabilities of a change in tax rates is recognized in income in the period that includes the enactment date. Valuation allowances are recorded to reduce deferred tax assets when it is more likely than not that a tax benefit will not be realized.
|
2.
|
Recent Accounting Pronouncements
|
Recently Adopted
In April 2015, the FASB issued guidance to clarify the accounting for fees paid by a customer in a cloud computing arrangement. The guidance is effective for fiscal years beginning after December 15, 2015, and interim periods within those years. Early adoption is permitted. The new guidance should be applied either prospectively to all arrangements entered into or materially modified after the effective date or retrospectively. In 2017, we prospectively adopted the guidance. The adoption did not have a material impact on our consolidated financial statements.
In March 2016, the FASB issued guidance that amends accounting for share-based payments, including the accounting for income taxes, forfeitures, and statutory withholding requirements, as well as classification in the statement of cash flows. The guidance is effective for fiscal years beginning after December 15, 2016, and interim periods within those years. Early adoption is permitted. We adopted the guidance in 2017. We elected to continue to estimate forfeitures expected to occur. In addition, we elected to adopt retrospectively the amendment to present excess tax benefits on share-based compensation as an operating activity, which resulted in a reclassification of
$7
from Net cash used in financing activities to Net cash provided by operating activities in the Consolidated Statement of Cash Flows for
2016
. We also adopted retrospectively the amendment to present cash payments to tax authorities in connection with shares withheld to meet statutory tax withholding requirements as a financing activity. As a result, there was a reclassification of
$21
from Net cash provided by operating activities to Net cash used in financing activities in the Consolidated Statement of Cash Flows for
2016
.
In January 2017, the FASB issued guidance that simplifies the test for goodwill impairment. Under the revised guidance, if a reporting unit’s carrying amount exceeds its fair value, an entity will record an impairment charge to reduce the reporting unit to fair value. The impairment charge will be limited to the amount of goodwill allocated to that reporting unit. The revised guidance eliminates the current requirement to determine the fair value of individual assets and liabilities of a reporting unit to measure the goodwill impairment. The guidance is effective for fiscal years beginning after December 15, 2019, and interim periods within
43
those years. Early adoption is permitted. We elected to early adopt the guidance in the fourth quarter 2017. The adoption did not have an impact on our consolidated financial statements.
In March 2017, the FASB issued guidance that changes the presentation of net periodic pension cost and net periodic postretirement benefit cost. Under the revised guidance, the service cost component of benefit cost is classified in the same line item or items as other compensation costs arising from services rendered by the pertinent employees during the period. The other components of net benefit cost (such as interest expense, return on assets, amortization of prior service credit, actuarial gains and losses, settlements and curtailments) are required to be presented in the income statement separately from the service cost component. The guidance also allows only the service cost component to be eligible for capitalization when applicable (for example, as a cost of internally manufactured inventory). The guidance should be applied retrospectively for the presentation of the service cost component and the other components of benefit cost in the income statement, and applied prospectively on and after the effective date for the capitalization of the service cost component. The guidance is effective for fiscal years beginning after December 15, 2017, and interim periods within those years. Early adoption is permitted. We elected to early adopt the guidance in the first quarter of 2018. The retrospective impact of presenting net periodic benefit cost in accordance with the new guidance is as follows:
|
Increase / (decrease) in expense
|
2017
|
2016
|
||||||
|
Cost of products sold
|
$
|
134
|
|
$
|
(148
|
)
|
||
|
Marketing and selling expenses
|
$
|
38
|
|
$
|
(41
|
)
|
||
|
Administrative expenses
|
$
|
62
|
|
$
|
(66
|
)
|
||
|
Research and development expenses
|
$
|
13
|
|
$
|
(19
|
)
|
||
|
Other expenses / (income)
|
$
|
(247
|
)
|
$
|
274
|
|
||
Accounting Pronouncements Not Yet Adopted
In May 2014, the FASB issued revised guidance on the recognition of revenue from contracts with customers. The guidance is designed to create greater comparability for financial statement users across industries and jurisdictions. The guidance also requires enhanced disclosures. The guidance was originally effective for fiscal years, and interim periods within those years, beginning after December 15, 2016. In July 2015, the FASB decided to delay the effective date of the new revenue guidance by one year to fiscal years, and interim periods within those years, beginning after December 15, 2017. Entities will be permitted to adopt the new revenue standard early, but not before the original effective date. The guidance permits the use of either a full retrospective or modified retrospective transition method. We completed the review of our arrangements with customers across our businesses, including our practices of offering rebates, refunds, discounts and other price allowances, and trade and consumer promotion programs. As we evaluated our methods of estimating the amount and timing of these various forms of variable consideration, we determined we will accelerate the expense recognition of certain trade and consumer promotion programs under the new guidance. Based on our assessment, the impact is not expected to be material on an annual basis, but will impact quarterly results. We will use the modified retrospective method when we adopt the new guidance in 2019, and the cumulative-effect adjustment is not expected to be material.
In January 2016, the FASB issued guidance that amends the recognition and measurement of financial instruments. The changes primarily affect the accounting for equity investments, financial liabilities under the fair value option, and the presentation and disclosure requirements for financial instruments. Under the new guidance, equity investments in unconsolidated entities that are not accounted for under the equity method will generally be measured at fair value through earnings. When the fair value option has been elected for financial liabilities, changes in fair value due to instrument-specific credit risk will be recognized separately in other comprehensive income. The guidance is effective for fiscal years beginning after December 15, 2017, and interim periods within those years. We do not expect that the adoption will have an impact on our consolidated financial statements.
In February 2016, the FASB issued guidance that amends accounting for leases. Under the new guidance, a lessee will recognize assets and liabilities for most leases but will recognize expenses similar to current lease accounting. The guidance is effective for fiscal years, and interim periods within those years, beginning after December 15, 2018. Early adoption is permitted. In July 2018, the FASB issued an adoption approach that allows entities to apply the new guidance at the adoption date and recognize a cumulative-effect adjustment to the opening balance of retained earnings in the period of adoption without restating prior periods. We are currently compiling an inventory of our lease arrangements in order to determine the impact that the new guidance will have on our consolidated financial statements.
In August 2016, the FASB issued guidance on the classification of certain cash receipts and payments in the statement of cash flows. The guidance is effective for fiscal years beginning after December 15, 2017, and interim periods within those years. Early adoption is permitted. The guidance must be applied retrospectively to all periods presented but may be applied prospectively if retrospective application would be impracticable. We do not expect that the adoption will have an impact on our consolidated financial statements.
44
In October 2016, the FASB issued guidance on tax accounting for intra-entity asset transfers. Under current guidance, the tax effects of intra-entity asset transfers (intercompany sales) are deferred until the transferred asset is sold to a third party or otherwise recognized. The new guidance requires companies to account for the income tax effects on intercompany transfers of assets other than inventory when the transfer occurs. The new guidance is effective for fiscal years beginning after December 15, 2017, and interim periods within those years. Early adoption is permitted in the first interim period of a fiscal year. The modified retrospective approach is required upon adoption, with a cumulative-effect adjustment recorded in retained earnings as of the beginning of the period of adoption. We do not expect that the adoption will have an impact on our consolidated financial statements.
In January 2017, the FASB issued guidance that revises the definition of a business to assist entities with evaluating when a set of transferred assets and activities is a business. The guidance requires an entity to evaluate if substantially all of the fair value of the gross assets acquired is concentrated in a single identifiable asset or a group of similar identifiable assets. If this threshold is met, the set of transferred assets and activities is not a business. If it is not met, the entity then evaluates whether the set meets the requirement that a business include, at a minimum, an input and a substantive process that together significantly contribute to the ability to create outputs. The guidance is effective for fiscal years beginning after December 15, 2017, and interim periods within those years. Early adoption is permitted. Beginning in 2019, we will prospectively apply the guidance to applicable transactions.
In May 2017, the FASB issued guidance that clarifies when changes to the terms or conditions of a share-based payment award must be accounted for as modifications. Under the new guidance, modification accounting is required only if the value, the vesting conditions, or the classification of the award (as equity or liability) changes as a result of the change in terms or conditions. The guidance is effective prospectively for fiscal years beginning after December 15, 2017. Early adoption is permitted. We will apply the guidance in evaluating future changes to terms or conditions of share-based payment awards.
In August 2017, the FASB issued guidance that amends hedge accounting. Under the new guidance, more hedging strategies will be eligible for hedge accounting and the application of hedge accounting is simplified. The new guidance amends presentation and disclosure requirements, and how effectiveness is assessed. The guidance is effective for fiscal years beginning after December 15, 2018, and interim periods within those years. Early adoption is permitted. We are currently evaluating the impact that the new guidance will have on our consolidated financial statements.
In February 2018, the FASB issued guidance that provides entities an option to reclassify the tax effects of the Tax Cuts and Jobs Act of 2017 on items within accumulated other comprehensive income to retained earnings. The guidance is effective for fiscal years beginning after December 15, 2018, and interim periods within those years. Entities are able to early adopt the guidance in any interim or annual period for which financial statements have not yet been issued and apply it either in the period of adoption or retrospectively to each period in which the tax effects of the Tax Cuts and Jobs Act of 2017 related to items in accumulated other comprehensive income are recognized. New disclosures are required regardless of whether an entity elects to reclassify the tax effects. We are currently evaluating the impact that the new guidance will have on our consolidated financial statements.
In August 2018, the FASB issued guidance that changes the disclosure requirements related to defined benefit pension and postretirement plans. The guidance is effective for fiscal years beginning after December 15, 2020. The guidance is to be applied on a retrospective basis. Early adoption is permitted. We are currently evaluating the impact that the new guidance will have on our disclosures.
|
3.
|
Acquisitions
|
On March 26, 2018, we completed the acquisition of Snyder's-Lance, Inc. (Snyder's-Lance) for
$50.00
per share. Total consideration was
$6,112
, which included the payoff of approximately
$1,100
of Snyder's-Lance indebtedness. The acquisition was financed through a single draw 3-year senior unsecured term loan facility and the issuance of senior notes. See Note 12 for additional information. Snyder's-Lance is a snack food company that manufactures, distributes, markets and sells snack food products in North America and Europe. Its primary brands include
Snyder’s of Hanover
and
Lance
, as well as
Kettle Brand
,
KETTLE, Cape Cod
,
Snack Factory
Pretzel Crisps
,
Pop Secret, Emerald
and
Late July
.
The excess of the purchase price over the estimated fair values of identifiable net assets was recorded as
$2,866
of goodwill. The goodwill is not deductible for tax purposes. The goodwill was primarily attributable to future growth opportunities, anticipated synergies, and intangible assets that did not qualify for separate recognition. The goodwill is included in the Global Biscuits and Snacks segment.
On December 12, 2017, we completed the acquisition of Pacific Foods of Oregon, LLC (Pacific Foods). The purchase price was
$688
. Pacific Foods produces broth, soups, non-dairy beverages and other simple meals. The excess of the purchase price over the estimated fair values of identifiable net assets was recorded as
$202
of goodwill. The goodwill is deductible for tax purposes. The goodwill was primarily attributable to future growth opportunities, anticipated synergies, and intangible assets that did not qualify for separate recognition. The goodwill is included in the Americas Simple Meals and Beverages segment.
45
The acquired assets and assumed liabilities include the following:
|
Snyder's-Lance
|
Pacific Foods
|
|||||||
|
Cash
|
$
|
21
|
|
$
|
7
|
|
||
|
Accounts receivable
|
221
|
|
16
|
|
||||
|
Inventories
|
219
|
|
48
|
|
||||
|
Other current assets
|
32
|
|
1
|
|
||||
|
Plant assets
|
696
|
|
78
|
|
||||
|
Goodwill
|
2,866
|
|
202
|
|
||||
|
Other intangible assets
|
2,947
|
|
366
|
|
||||
|
Other assets
|
65
|
|
—
|
|
||||
|
Short-term debt
|
(1
|
)
|
—
|
|
||||
|
Accounts payable
|
(124
|
)
|
(24
|
)
|
||||
|
Accrued liabilities
|
(115
|
)
|
(6
|
)
|
||||
|
Deferred income taxes
|
(640
|
)
|
—
|
|
||||
|
Other liabilities
|
(28
|
)
|
—
|
|
||||
|
Noncontrolling interest
|
(47
|
)
|
—
|
|
||||
|
Total assets acquired and liabilities assumed
|
$
|
6,112
|
|
$
|
688
|
|
||
The purchase price allocation of Snyder's-Lance is preliminary and is subject to the finalization of certain items, including tax balances, which will be completed within the allowable measurement period.
The identifiable intangible assets of Snyder's-Lance consist of:
|
Type
|
Life in Years
|
Value
|
||||||||
|
Trademarks
|
Non-amortizable
|
Indefinite
|
$
|
2,131
|
|
|||||
|
Customer relationships
|
Amortizable
|
15
|
to
|
22
|
808
|
|
||||
|
Other
|
Amortizable
|
1.5
|
8
|
|
||||||
|
Total identifiable intangible assets
|
$
|
2,947
|
|
|||||||
The identifiable intangible assets of Pacific Foods consist of
$280
in non-amortizable trademarks, and
$86
in customer relationships to be amortized over
20
years.
In 2018, we recognized transaction costs and integration costs of
$102
, associated with the Snyder's-Lance acquisition. Approximately
$53
represented transactions costs, including bridge financing costs and outside advisory costs, and were recorded in Other expenses / (income). Integration costs included the following:
|
•
|
amortization of the acquisition date fair value adjustment to inventories of
$42
that was recorded in Cost of products sold;
|
|
•
|
$13
of Restructuring charges;
|
|
•
|
$12
of Administrative expenses; and
|
|
•
|
$18
gain in Interest expense on treasury rate lock contracts used to hedge the planned financing of the acquisition.
|
The acquisition of Snyder's-Lance contributed
$772
to Net sales from March 26, 2018, through July 29, 2018. The contribution to Net earnings was a loss of
$84
from March 26, 2018, through July 29, 2018, including the effect of the transaction and integration costs, and interest expense on the debt to finance the acquisition.
The acquisition of Pacific Foods contributed
$123
to Net sales from December 12, 2017, through July 29, 2018. The contribution to Net earnings was a loss of
$13
from December 12, 2017, through July 29, 2018.
46
The following unaudited summary information is presented on a consolidated pro forma basis as if the Snyder's-Lance and Pacific Foods acquisitions had occurred on August 1, 2016:
|
2018
|
2017
|
|||||||
|
Net sales
|
$
|
10,222
|
|
$
|
10,324
|
|
||
|
Net earnings attributable to Campbell Soup Company
|
$
|
371
|
|
$
|
773
|
|
||
|
Net earnings per share attributable to Campbell Soup Company - basic
|
$
|
1.23
|
|
$
|
2.53
|
|
||
|
Net earnings per share attributable to Campbell Soup Company - assuming dilution
|
$
|
1.23
|
|
$
|
2.52
|
|
||
The pro forma amounts include additional interest expense on the debt issued to finance the purchases, amortization and depreciation expense based on the estimated fair value and useful lives of intangible assets and plant assets, and related tax effects. The pro forma results are not necessarily indicative of the combined results had the Snyder's-Lance and Pacific Foods acquisitions been completed on August 1, 2016, nor are they indicative of future combined results. The pro forma results for 2017 include pre-tax transaction costs of
$53
, pre-tax amortization of the acquisition date fair value adjustment to inventories of
$42
, and a pre-tax gain of
$18
on treasury rate lock contracts. Therefore, the pro forma results for 2018 exclude these items, as they are reflected in 2017.
|
4.
|
Accumulated Other Comprehensive Income (Loss)
|
The components of Accumulated other comprehensive income (loss) consisted of the following:
|
Foreign Currency Translation Adjustments
(1)
|
Gains (Losses) on Cash Flow Hedges
(2)
|
Pension and Postretirement Benefit Plan Adjustments
(3)
|
Total Accumulated Comprehensive Income (Loss)
|
|||||||||||||
|
Balance at August 2, 2015
|
$
|
(166
|
)
|
$
|
(5
|
)
|
$
|
3
|
|
$
|
(168
|
)
|
||||
|
Other comprehensive income (loss) before reclassifications
|
42
|
|
(29
|
)
|
59
|
|
72
|
|
||||||||
|
Amounts reclassified from accumulated other comprehensive income (loss)
|
—
|
|
(7
|
)
|
(1
|
)
|
(8
|
)
|
||||||||
|
Net current-period other comprehensive income (loss)
|
42
|
|
(36
|
)
|
58
|
|
64
|
|
||||||||
|
Balance at July 31, 2016
|
$
|
(124
|
)
|
$
|
(41
|
)
|
$
|
61
|
|
$
|
(104
|
)
|
||||
|
Other comprehensive income (loss) before reclassifications
|
40
|
|
12
|
|
8
|
|
60
|
|
||||||||
|
Amounts reclassified from accumulated other comprehensive income (loss)
|
—
|
|
7
|
|
(16
|
)
|
(9
|
)
|
||||||||
|
Net current-period other comprehensive income (loss)
|
40
|
|
19
|
|
(8
|
)
|
51
|
|
||||||||
|
Balance at July 30, 2017
|
$
|
(84
|
)
|
$
|
(22
|
)
|
$
|
53
|
|
$
|
(53
|
)
|
||||
|
Other comprehensive income (loss) before reclassifications
|
(70
|
)
|
16
|
|
7
|
|
(47
|
)
|
||||||||
|
Amounts reclassified from accumulated other comprehensive income (loss)
|
—
|
|
2
|
|
(20
|
)
|
(18
|
)
|
||||||||
|
Net current-period other comprehensive income (loss)
|
(70
|
)
|
18
|
|
(13
|
)
|
(65
|
)
|
||||||||
|
Balance at July 29, 2018
|
$
|
(154
|
)
|
$
|
(4
|
)
|
$
|
40
|
|
$
|
(118
|
)
|
||||
_____________________________________
|
(1)
|
Included a tax expense of
$6
as of
July 29, 2018
,
July 30, 2017
,
July 31, 2016
, and
August 2, 2015
.
|
|
(2)
|
Included a tax benefit of
$4
as of
July 29, 2018
,
$12
as of
July 30, 2017
,
$23
as of
July 31, 2016
, and
$5
as of
August 2, 2015
.
|
|
(3)
|
Included a tax expense of
$25
as of
July 29, 2018
,
$30
as of
July 30, 2017
,
$35
as of
July 31, 2016
, and
$1
as of
August 2, 2015
.
|
Amounts related to noncontrolling interests were not material.
47
The amounts reclassified from Accumulated other comprehensive income (loss) consisted of the following:
|
Details about Accumulated Other Comprehensive Income (Loss) Components
|
2018
|
2017
|
2016
|
Location of (Gain) Loss Recognized in Earnings
|
||||||||||
|
(Gains) losses on cash flow hedges:
|
||||||||||||||
|
Foreign exchange forward contracts
|
$
|
1
|
|
$
|
6
|
|
$
|
(11
|
)
|
Cost of products sold
|
||||
|
Foreign exchange forward contracts
|
—
|
|
1
|
|
(2
|
)
|
Other expenses / (income)
|
|||||||
|
Forward starting interest rate swaps
|
2
|
|
4
|
|
4
|
|
Interest expense
|
|||||||
|
Total before tax
|
3
|
|
11
|
|
(9
|
)
|
||||||||
|
Tax expense (benefit)
|
(1
|
)
|
(4
|
)
|
2
|
|
||||||||
|
(Gain) loss, net of tax
|
$
|
2
|
|
$
|
7
|
|
$
|
(7
|
)
|
|||||
|
Pension and postretirement benefit adjustments:
|
||||||||||||||
|
Prior service credit
|
$
|
(27
|
)
|
$
|
(25
|
)
|
$
|
(1
|
)
|
Other expenses / (income)
|
||||
|
Tax expense (benefit)
|
7
|
|
9
|
|
—
|
|
||||||||
|
(Gain) loss, net of tax
|
$
|
(20
|
)
|
$
|
(16
|
)
|
$
|
(1
|
)
|
|||||
|
5.
|
Goodwill and Intangible Assets
|
Goodwill
The following table shows the changes in the carrying amount of goodwill by business segment:
|
Americas
Simple Meals and Beverages |
Global
Biscuits and Snacks |
Campbell Fresh
(1)
|
Total
|
||||||||||||
|
Net balance at July 31, 2016
|
$
|
775
|
|
$
|
757
|
|
$
|
731
|
|
$
|
2,263
|
|
|||
|
Impairment charges
|
—
|
|
—
|
|
(191
|
)
|
(191
|
)
|
|||||||
|
Foreign currency translation adjustment
|
5
|
|
38
|
|
—
|
|
43
|
|
|||||||
|
Net balance at July 30, 2017
|
$
|
780
|
|
$
|
795
|
|
$
|
540
|
|
$
|
2,115
|
|
|||
|
Acquisitions
|
202
|
|
2,866
|
|
—
|
|
3,068
|
|
|||||||
|
Impairment charges
|
—
|
|
—
|
|
(540
|
)
|
(540
|
)
|
|||||||
|
Foreign currency translation adjustment
|
(4
|
)
|
(59
|
)
|
—
|
|
(63
|
)
|
|||||||
|
Net balance at July 29, 2018
|
$
|
978
|
|
$
|
3,602
|
|
$
|
—
|
|
$
|
4,580
|
|
|||
_____________________________________
|
(1)
|
The balance of goodwill is reflected net of accumulated impairment charges of
$837
as of July 29, 2018,
$297
as of July 30, 2017 and
$106
as of July 31, 2016, respectively, related to the Bolthouse Farms carrot and carrot ingredients reporting unit, the deli reporting unit, and the Bolthouse Farms refrigerated beverages and salad dressings reporting unit.
|
In March 2018, we acquired Snyder's-Lance for
$6,112
. Goodwill related to the acquisition was
$2,866
. In addition, we acquired Pacific Foods in December 2017 for
$688
and goodwill related to the acquisition was
$202
. See Note 3 for additional information.
2016 Assessments
In the fourth quarter of 2016, as part of our annual review of intangible assets, an impairment charge of
$106
was recorded on goodwill for the Bolthouse Farms carrot and carrot ingredients reporting unit within the Campbell Fresh segment. In 2016, carrot performance primarily reflected the adverse impact of weather conditions on crop yields, and execution issues in response to those conditions, which led to customer dissatisfaction, a loss of business, and higher carrot costs in the second half of the year. The impairment was attributable to a decline in profitability in the second half of 2016 and a revised outlook for the business, with reduced expectations for sales, operating margins, and discounted cash flows.
2017 Assessments
During the second quarter of 2017, sales and operating profit performance for the Bolthouse Farms carrot and carrot ingredients reporting unit were well below our expectations due to difficulty with regaining market share lost during 2016 and higher carrot costs from the adverse impact of heavy rains on crop yields. During the quarter, we also lowered our forecast for sales and earnings for the reporting unit for the second half of 2017 based on revised market share recovery expectations and the continuing effect of unusual weather conditions on carrot costs. In addition, as part of a strategic review initiated by a new leadership team of
48
Campbell Fresh during the second quarter, we decided to reduce emphasis on growing sales of carrot ingredients, which are a by-product of the manufacturing process, and to manage carrots sold at retail for modest sales growth consistent with the category while improving profitability. Accordingly, we reduced our expectations for recovery of retail carrot market share. As a consequence of the business performance and the strategic review, we lowered our sales outlook for future fiscal years.
We also lowered our average margin expectations due in part to cost volatility, which has been higher than expected. Based upon the business performance in the second quarter of 2017, our reduced near-term outlook, and reduced expectations for sales, operating margins and discounted cash flows, we performed an interim goodwill impairment assessment in the second quarter, which resulted in a
$127
impairment charge to reduce the carrying amount to
$75
.
We acquired Garden Fresh Gourmet on June 29, 2015. During 2017, sales and operating profit performance for Garden Fresh Gourmet, a reporting unit within the Campbell Fresh segment, were well below expectations, and we lowered our outlook for the second half of 2017 due to customer losses and failure to meet product distribution goals. We expected to expand distribution of salsa beyond our concentration in the Midwest region, however this proved to be challenging as differentiated recipes are required to meet taste profiles in other parts of the country. In addition, as part of a strategic review initiated by a new leadership team of Campbell Fresh during the second quarter, we lowered our distribution and category growth expectations and, therefore, future sales outlook. Based upon the business performance in 2017, our reduced near-term outlook, and reduced expectations for sales, operating margins and discounted cash flows, we performed an interim goodwill impairment assessment on this reporting unit in the second quarter, which resulted in a
$64
impairment charge to reduce the carrying amount to
$52
.
2018 Assessments
During the second quarter of 2018, we performed an interim impairment assessment on the intangible assets of the Bolthouse Farms carrot and carrot ingredients reporting unit as operating performance was below expectations. The business was impacted by adverse weather conditions and the implementation of enhanced quality protocols, which impacted crop yields and resulted in higher costs. This cost volatility continued to be higher than expected and caused us to reassess our short- and long-term margin expectations for this business. Based on this performance, we reduced our outlook for future operating margins and discounted cash flows, which resulted in a
$75
impairment charge, representing a write-down of the remaining goodwill in the reporting unit.
During the third quarter of 2018, we performed an interim impairment assessment on the intangible assets of the deli reporting unit, which includes Garden Fresh Gourmet and the U.S. refrigerated soup business, within Campbell Fresh. During the third quarter of 2018, certain of our private label refrigerated soup customers, which represent a majority of the business, informed us of their intention to in-source production beginning in 2019, and the sales and operating profit outlook of the Garden Fresh Gourmet business was reduced. Due to the anticipated loss of refrigerated soup business with these customers, as well as the recent performance of the Garden Fresh Gourmet business, we revised the long-term outlook for future sales, operating margins and discounted cash flows for this reporting unit, which resulted in an
$81
impairment charge, representing a write-down of the remaining goodwill in the reporting unit.
In addition, we performed an interim impairment assessment on the intangible assets of the Bolthouse Farms refrigerated beverages and salad dressings reporting unit within Campbell Fresh as the operating performance in the third quarter was below expectations. We assessed sales performance of refrigerated beverages and key drivers impacting gross profit for the unit. We revised our long-term outlook for future earnings and discounted cash flows to reflect reduced sales expectations to modest growth and decreased our gross profit outlook to reflect the inflation and manufacturing efficiency pressures that remain with the unit. This revised outlook resulted in a
$384
impairment charge, representing a write-down of the remaining goodwill in the reporting unit.
The impairment charges were recorded in Other expenses / (income) in the Consolidated Statements of Earnings.
49
Intangible Assets
The following table sets forth balance sheet information for intangible assets, excluding goodwill, subject to amortization and intangible assets not subject to amortization:
|
Intangible Assets
|
2018
|
2017
|
||||||
|
Amortizable intangible assets
|
||||||||
|
Customer relationships
|
$
|
1,116
|
|
$
|
223
|
|
||
|
Technology
|
40
|
|
40
|
|
||||
|
Other
|
43
|
|
35
|
|
||||
|
Total gross amortizable intangible assets
|
$
|
1,199
|
|
$
|
298
|
|
||
|
Accumulated amortization
|
(126
|
)
|
(92
|
)
|
||||
|
Total net amortizable intangible assets
|
$
|
1,073
|
|
$
|
206
|
|
||
|
Non-amortizable intangible assets
|
||||||||
|
Trademarks
|
3,123
|
|
912
|
|
||||
|
Total net intangible assets
|
$
|
4,196
|
|
$
|
1,118
|
|
||
Non-amortizable intangible assets consist of trademarks, which include
Snyder's of Hanover, Lance, Kettle Brand, Pace, Pacific Foods, Snack Factory, Cape Cod, Bolthouse Farms
,
Plum, Kjeldsens,
and
Garden Fresh Gourmet
. Other amortizable intangible assets consist of recipes, non-compete agreements, trademarks, patents and distributor relationships.
Amortization of intangible assets was
$34
for
2018
,
$19
for
2017
and
$20
for
2016
. Amortization expense for the next 5 years is estimated to be
$65
in 2019,
$60
in 2020, and
$59
in 2021 through 2023. Asset useful lives range from
2
to
22
years.
Due to the factors previously described, we recognized impairment charges on the Bolthouse Farms carrot and carrot ingredients reporting unit trademark as follows:
$35
in 2016 and
$20
in 2017. The carrying value of the trademark was
$48
as of July 29, 2018.
In the second quarter of 2017, due to the factors previously described, we performed an interim impairment assessment on the trademark in the Garden Fresh Gourmet reporting unit, which resulted in a
$1
impairment charge.
In the third quarter of 2018, due to the factors described above, we performed an interim impairment assessment on the trademarks in the deli reporting unit and the Bolthouse Farms refrigerated beverages and salad dressings reporting unit. We recorded impairment charges of
$13
related to the
Garden Fresh Gourmet
trademark within the deli reporting unit and
$130
related to the
Bolthouse Farms
refrigerated beverages and salad dressings trademark. This reduced the carrying value of the trademarks to
$23
in the deli reporting unit and to
$150
in the Bolthouse Farms refrigerated beverages and salad dressings reporting unit.
In the fourth quarter of 2018, as part of our annual review of intangible assets, we recognized an impairment charge of
$54
on the
Plum
trademark, which reduced the carrying value to
$61
. In 2018, sales and operating performance were well below expectations due in part to competitive pressure and reduced margins. In the fourth quarter, as part of a strategic review initiated by a new leadership team and based on recent performance, we lowered our long-term outlook for future sales.
The impairment charges were recorded in Other expenses / (income) in the Consolidated Statements of Earnings.
The estimates of future cash flows used in determining the fair value of goodwill and intangible assets involve significant management judgment and are based upon assumptions about expected future operating performance, economic conditions, market conditions and cost of capital. Inherent in estimating the future cash flows are uncertainties beyond our control, such as changes in capital markets. The actual cash flows could differ materially from management’s estimates due to changes in business conditions, operating performance and economic conditions.
|
6.
|
Business and Geographic Segment Information
|
Commencing in the third quarter of 2018 with the acquisition of Snyder's-Lance, we formed a new U.S. snacking unit, which combines Snyder's-Lance and Pepperidge Farm, and is an operating segment. As of the third quarter of 2018, we have four operating segments based primarily on product type, and three reportable segments. The U.S. snacking operating segment is aggregated with the international biscuits and snacks operating segment to form the Global Biscuits and Snacks reportable segment. The operating segments are aggregated based on similar economic characteristics, products, production processes, types or classes of customers, distribution methods, and regulatory environment. Our reportable segments are as follows:
|
•
|
Americas Simple Meals and Beverages segment includes the retail and food service businesses in the U.S. and Canada. The segment includes the following products:
Campbell’s
condensed and ready-to-serve soups;
Swanson
broth and stocks;
Prego
pasta sauces;
Pace
Mexican sauces;
Campbell’s
gravies, pasta, beans and dinner sauces;
Swanson
canned poultry;
|
50
Plum
food and snacks;
V8
juices and beverages;
Campbell’s
tomato juice; and as of December 12, 2017,
Pacific
broth, soups, non-dairy beverages and other simple meals;
|
•
|
Global Biscuits and Snacks segment represents an aggregation of the following operating segments: U.S. snacks operating segment, which includes Pepperidge Farm cookies, crackers, bakery and frozen products in U.S. retail, and Snyder’s-Lance pretzels, sandwich crackers, potato chips, tortilla chips and other snacking products in the U.S. and Europe; and the international biscuits and snacks operating segment, which includes Arnott’s biscuits in Australia and Asia Pacific, Kelsen cookies globally, the simple meals and shelf-stable beverages business in Australia and Asia Pacific, and beginning in 2018, the business in Latin America; and
|
|
•
|
Campbell Fresh segment includes Bolthouse Farms fresh carrots, carrot ingredients, refrigerated beverages and refrigerated salad dressings; Garden Fresh Gourmet salsa, hummus, dips and tortilla chips; and the U.S. refrigerated soup business.
|
Prior to 2018, the business in Latin America was managed as part of the Americas Simple Meals and Beverages segment. Segment results have been adjusted retrospectively to reflect this change.
On August 30, 2018, we announced plans to pursue the divestiture of our international biscuits and snacks operating segment, and the Campbell Fresh segment. The international biscuits and snacks operating segment and the Campbell Fresh segment combined represent approximately
$2,100
in net sales in 2018.
We evaluate segment performance before interest, taxes and costs associated with restructuring activities and impairment charges. Unrealized gains and losses on commodity hedging activities are excluded from segment operating earnings and are recorded in Corporate as these open positions represent hedges of future purchases. Upon closing of the contracts, the realized gain or loss is transferred to segment operating earnings, which allows the segments to reflect the economic effects of the hedge without exposure to quarterly volatility of unrealized gains and losses. Only the service cost component of pension and postretirement expense is allocated to segments. All other components of expense, including interest cost, expected return on assets, amortization of prior service credits and recognized actuarial gains and losses are reflected in Corporate and not included in segment operating results. Asset information by segment is not discretely maintained for internal reporting or used in evaluating performance. Therefore, only geographic segment asset information is provided.
Our largest customer, Wal-Mart Stores, Inc. and its affiliates, accounted for approximately
18%
of consolidated net sales in
2018
, and
20%
of consolidated net sales in
2017
and
2016
. All of our reportable segments sold products to Wal-Mart Stores, Inc. or its affiliates.
|
2018
|
2017
|
2016
|
||||||||||
|
Net sales
|
||||||||||||
|
Americas Simple Meals and Beverages
|
$
|
4,213
|
|
$
|
4,256
|
|
$
|
4,313
|
|
|||
|
Global Biscuits and Snacks
|
3,499
|
|
2,667
|
|
2,631
|
|
||||||
|
Campbell Fresh
|
970
|
|
967
|
|
1,017
|
|
||||||
|
Corporate
|
3
|
|
—
|
|
—
|
|
||||||
|
Total
|
$
|
8,685
|
|
$
|
7,890
|
|
$
|
7,961
|
|
|||
|
2018
|
2017
|
2016
|
||||||||||
|
Earnings before interest and taxes
|
||||||||||||
|
Americas Simple Meals and Beverages
|
$
|
982
|
|
$
|
1,111
|
|
$
|
1,060
|
|
|||
|
Global Biscuits and Snacks
|
540
|
|
463
|
|
431
|
|
||||||
|
Campbell Fresh
|
(43
|
)
|
(9
|
)
|
60
|
|
||||||
|
Corporate
(1)
|
(948
|
)
|
(147
|
)
|
(560
|
)
|
||||||
|
Restructuring charges
(2)
|
(62
|
)
|
(18
|
)
|
(31
|
)
|
||||||
|
Total
|
$
|
469
|
|
$
|
1,400
|
|
$
|
960
|
|
|||
51
|
2018
|
2017
|
2016
|
||||||||||
|
Depreciation and amortization
|
||||||||||||
|
Americas Simple Meals and Beverages
|
$
|
158
|
|
$
|
118
|
|
$
|
117
|
|
|||
|
Global Biscuits and Snacks
|
144
|
|
98
|
|
96
|
|
||||||
|
Campbell Fresh
|
73
|
|
83
|
|
77
|
|
||||||
|
Corporate
(3)
|
19
|
|
19
|
|
18
|
|
||||||
|
Total
|
$
|
394
|
|
$
|
318
|
|
$
|
308
|
|
|||
|
2018
|
2017
|
2016
|
||||||||||
|
Capital expenditures
|
||||||||||||
|
Americas Simple Meals and Beverages
|
$
|
187
|
|
$
|
117
|
|
$
|
105
|
|
|||
|
Global Biscuits and Snacks
|
133
|
|
127
|
|
122
|
|
||||||
|
Campbell Fresh
|
46
|
|
47
|
|
74
|
|
||||||
|
Corporate
(3)
|
41
|
|
47
|
|
40
|
|
||||||
|
Total
|
$
|
407
|
|
$
|
338
|
|
$
|
341
|
|
|||
_______________________________________
|
(1)
|
Represents unallocated items. Pension and postretirement benefit mark-to-market adjustments and curtailments are included in Corporate. There were gains of
$136
and
$178
in
2018
and
2017
, respectively, and losses of
$313
in
2016
. Costs related to the cost savings initiatives were
$136
,
$40
and
$47
in
2018
,
2017
and
2016
, respectively. Transaction and integration costs associated with the acquisition of Snyder's-Lance were
$107
in 2018. Intangible asset impairment charges were
$737
,
$212
and
$141
in 2018,
2017
and 2016, respectively. See Note 5 for information on the intangible asset impairment charges. Plant asset impairment charges were
$11
in 2018. A charge of
$22
related to the settlement of a legal claim was included in 2018, and a gain of
$25
from a settlement of a claim related to the Kelsen acquisition was included in 2016.
|
|
(2)
|
See Note 7 for additional information.
|
|
(3)
|
Represents primarily corporate offices.
|
Our global net sales based on product categories are as follows:
|
2018
|
2017
|
2016
|
||||||||||
|
Net sales
|
||||||||||||
|
Soup
|
$
|
2,615
|
|
$
|
2,673
|
|
$
|
2,690
|
|
|||
|
Snacks
|
3,344
|
|
2,511
|
|
2,479
|
|
||||||
|
Other simple meals
|
1,699
|
|
1,698
|
|
1,702
|
|
||||||
|
Beverages
|
1,024
|
|
1,008
|
|
1,090
|
|
||||||
|
Other
|
3
|
|
—
|
|
—
|
|
||||||
|
Total
|
$
|
8,685
|
|
$
|
7,890
|
|
$
|
7,961
|
|
|||
Soup includes various soup, broths and stock products. Snacks include cookies, pretzels, crackers, biscuits, popcorn, nuts, potato chips, tortilla chips and other salty snacks and baked products. Other simple meals include sauces, carrot products, refrigerated salad dressings, refrigerated salsa, hummus, dips and Plum foods and snacks.
Geographic Area Information
Information about operations in different geographic areas is as follows:
|
2018
|
2017
|
2016
|
||||||||||
|
Net sales
|
||||||||||||
|
United States
|
$
|
7,032
|
|
$
|
6,357
|
|
$
|
6,437
|
|
|||
|
Australia
|
622
|
|
610
|
|
590
|
|
||||||
|
Other countries
|
1,031
|
|
923
|
|
934
|
|
||||||
|
Total
|
$
|
8,685
|
|
$
|
7,890
|
|
$
|
7,961
|
|
|||
52
|
2018
|
2017
|
2016
|
||||||||||
|
Long-lived assets
|
||||||||||||
|
United States
|
$
|
2,778
|
|
$
|
1,987
|
|
$
|
1,967
|
|
|||
|
Australia
|
248
|
|
265
|
|
242
|
|
||||||
|
Other countries
|
207
|
|
202
|
|
198
|
|
||||||
|
Total
|
$
|
3,233
|
|
$
|
2,454
|
|
$
|
2,407
|
|
|||
|
7.
|
Restructuring Charges and Cost Savings Initiatives
|
2015 Initiatives
In fiscal 2015, we implemented initiatives to reduce costs and to streamline our organizational structure. As part of these initiatives, we commenced a voluntary employee separation program available to certain U.S.-based salaried employees nearing retirement who met age, length-of-service and business unit/function criteria.
In February 2017, we announced that we were expanding these initiatives by further optimizing our supply chain network, primarily in North America, continuing to evolve our operating model to drive efficiencies, and more fully integrating our recent acquisitions. In January 2018, as part of the expanded initiatives, we authorized additional pre-tax costs to improve the operational efficiency of our thermal supply chain network in North America by closing our manufacturing facility in Toronto, Ontario, and to optimize our information technology infrastructure by migrating certain applications to the latest cloud technology platform. In August 2018, we announced that we will continue to streamline our organization, expand our zero-based budgeting efforts and optimize our manufacturing network. We extended the time horizon for the initiatives to 2022. Cost estimates for these expanded initiatives, as well as timing for certain activities, are continuing to be developed.
A summary of the restructuring charges and charges recorded in Administrative expenses, Cost of products sold, and Marketing and selling expenses related to the initiatives is as follows:
|
|
2018
|
2017
|
2016
|
2015
|
|||||||||||
|
Restructuring charges
|
$
|
49
|
|
$
|
18
|
|
$
|
35
|
|
$
|
102
|
|
|||
|
Administrative expenses
|
88
|
|
36
|
|
47
|
|
22
|
|
|||||||
|
Cost of products sold
|
45
|
|
4
|
|
—
|
|
—
|
|
|||||||
|
Marketing and selling expenses
|
3
|
|
—
|
|
—
|
|
—
|
|
|||||||
|
Total pre-tax charges
|
$
|
185
|
|
$
|
58
|
|
$
|
82
|
|
$
|
124
|
|
|||
A summary of the pre-tax costs associated with the initiatives is as follows:
|
Recognized as of
July 29, 2018 |
|||
|
Severance pay and benefits
|
$
|
180
|
|
|
Asset impairment/accelerated depreciation
|
45
|
|
|
|
Implementation costs and other related costs
|
224
|
|
|
|
Total
|
$
|
449
|
|
The total estimated pre-tax costs for actions that have been identified are approximately
$570
to
$605
and we expect to incur the remaining costs through 2020. This estimate will be updated as costs for the expanded initiatives are developed.
We expect the costs for actions that have been identified to date to consist of the following: approximately
$195
in severance pay and benefits; approximately
$95
in asset impairment and accelerated depreciation; and approximately
$280
to
$315
in implementation costs and other related costs.We expect these pre-tax costs to be associated with our segments as follows: Americas Simple Meals and Beverages - approximately
45%
; Global Biscuits and Snacks - approximately
30%
; Campbell Fresh - approximately
3%
; and Corporate - approximately
22%
.
Of the aggregate
$570
to
$605
of pre-tax costs identified to date, we expect approximately
$465
to
$500
will be cash expenditures. In addition, we expect to invest approximately
$250
in capital expenditures through 2020 primarily related to the U.S. warehouse optimization project, transition of production of the Toronto manufacturing facility to our U.S. thermal plants, insourcing of manufacturing for certain simple meal products and optimization of information technology infrastructure and applications, of which we invested approximately
$114
as of
July 29, 2018
.
53
A summary of the restructuring activity and related reserves associated with the initiatives at
July 29, 2018
, is as follows:
|
Severance Pay and Benefits
|
Other Restructuring Costs
|
Non-Cash Benefits
(5)
|
Implementation Costs and Other Related Costs
(6)
|
Asset Impairment/Accelerated Depreciation
|
Other Non-Cash Exit Costs
(7)
|
Total Charges
|
||||||||||||||||||
|
Accrued balance at August 3, 2014
|
$
|
—
|
|
$
|
—
|
|
||||||||||||||||||
|
2015 charges
|
87
|
|
8
|
|
7
|
|
22
|
|
—
|
|
—
|
|
$
|
124
|
|
|||||||||
|
2015 cash payments
|
(1
|
)
|
—
|
|
||||||||||||||||||||
|
Foreign currency translation adjustment
|
(1
|
)
|
—
|
|
||||||||||||||||||||
|
Accrued balance at August 2, 2015
(1)
|
$
|
85
|
|
$
|
8
|
|
||||||||||||||||||
|
2016 charges
|
34
|
|
1
|
|
—
|
|
47
|
|
—
|
|
—
|
|
$
|
82
|
|
|||||||||
|
2016 cash payments
|
(46
|
)
|
(9
|
)
|
||||||||||||||||||||
|
Accrued balance at July 31, 2016
(2)
|
$
|
73
|
|
$
|
—
|
|
||||||||||||||||||
|
2017 charges
|
7
|
|
—
|
|
—
|
|
39
|
|
12
|
|
—
|
|
$
|
58
|
|
|||||||||
|
2017 cash payments
|
(54
|
)
|
—
|
|
||||||||||||||||||||
|
Accrued balance at July 30, 2017
(3)
|
$
|
26
|
|
$
|
—
|
|
||||||||||||||||||
|
2018 charges
|
43
|
|
—
|
|
2
|
|
104
|
|
33
|
|
3
|
|
$
|
185
|
|
|||||||||
|
2018 cash payments
|
(31
|
)
|
—
|
|
||||||||||||||||||||
|
Foreign currency translation adjustment
|
(1
|
)
|
—
|
|
||||||||||||||||||||
|
Accrued balance at July 29, 2018
(4)
|
$
|
37
|
|
$
|
—
|
|
||||||||||||||||||
_______________________________________
|
(1)
|
Includes
$45
of severance pay and benefits recorded in Other liabilities in the Consolidated Balance Sheet.
|
|
(2)
|
Includes
$17
of severance pay and benefits recorded in Other liabilities in the Consolidated Balance Sheet.
|
|
(3)
|
Includes
$2
of severance pay and benefits recorded in Other liabilities in the Consolidated Balance Sheet.
|
|
(4)
|
Includes
$23
of severance pay and benefits recorded in Other liabilities in the Consolidated Balance Sheet.
|
|
(5)
|
Represents postretirement and pension curtailment costs and pension special termination benefits. See Note 10 for additional information.
|
|
(6)
|
Includes other costs recognized as incurred that are not reflected in the restructuring reserve in the Consolidated Balance Sheet. The costs are included in Administrative expenses, Cost of products sold, and Marketing and selling expenses in the Consolidated Statements of Earnings.
|
|
(7)
|
Includes non-cash costs that are not reflected in the restructuring reserve in the Consolidated Balance Sheet.
|
Segment operating results do not include restructuring charges, implementation costs and other related costs because we evaluate segment performance excluding such charges. A summary of the pre-tax costs associated with segments is as follows:
|
2018
|
Costs Incurred to Date
|
||||||
|
Americas Simple Meals and Beverages
|
$
|
86
|
|
$
|
178
|
|
|
|
Global Biscuits and Snacks
|
73
|
|
151
|
|
|||
|
Campbell Fresh
|
5
|
|
11
|
|
|||
|
Corporate
|
21
|
|
109
|
|
|||
|
Total
|
$
|
185
|
|
$
|
449
|
|
|
Snyder's-Lance Cost Transformation Program and Integration
On March 26, 2018, we completed the acquisition of Snyder's-Lance. Prior to the acquisition, in April 2017, Snyder's-Lance launched a cost transformation program following a comprehensive review of its operations with the goal of significantly improving its financial performance. We expect to continue to implement this program and to achieve a majority of the program's targeted savings. In addition, we have identified opportunities for additional cost synergies as we integrate Snyder's-Lance.
54
We are developing the detailed plans to implement the Snyder's-Lance cost transformation program and to achieve the cost synergies and therefore we cannot reasonably estimate the total expected pre-tax costs and timing of when we expect to incur those costs, as well as the expected future cash expenditures. We expect the pre-tax costs to be associated primarily with Global Biscuits and Snacks.
In
2018
, we recorded a restructuring charge of
$13
and incurred
$12
in Administrative expenses related to the integration of Snyder's-Lance.
A summary of the restructuring activity and related reserves associated with the Snyder's-Lance integration at
July 29, 2018
, is as follows:
|
Severance Pay and Benefits
|
Implementation and Integration Costs
(1)
|
Total Charges
|
|||||||||
|
2018 charges
|
$
|
13
|
|
12
|
|
$
|
25
|
|
|||
|
2018 cash payments
|
(4
|
)
|
|||||||||
|
Accrued balance at July 29, 2018
(2)
|
$
|
9
|
|
||||||||
|
(1)
|
Includes other costs recognized as incurred that are not reflected in the restructuring reserve in the Consolidated Balance Sheet. The costs are included in Administrative expenses in the Consolidated Statements of Earnings.
|
|
(2)
|
Includes
$1
of severance pay and benefits recorded in Other liabilities in the Consolidated Balance Sheet.
|
Segment operating results do not include restructuring charges, nor implementation and integration costs because we evaluate segment performance excluding such charges. The pre-tax costs of
$25
incurred in
2018
were associated with the Global Biscuits and Snacks segment.
2014 Initiatives
In 2014, we implemented initiatives to reduce overhead across the organization, restructure manufacturing and streamline operations for our soup and broth business in China and improve supply chain efficiency in Australia.
In 2016, we recorded a reduction to restructuring charges of
$4
related to the 2014 initiatives. As of July 31, 2016, we incurred substantially all of the costs related to the 2014 initiatives. A summary of the pre-tax costs associated with the 2014 initiatives is as follows:
|
Total Program
(1)
|
Change in Estimate
|
Recognized as of July 31, 2016
|
|||||||||
|
Severance pay and benefits
|
$
|
41
|
|
$
|
(4
|
)
|
$
|
37
|
|
||
|
Asset impairment
|
12
|
|
—
|
|
12
|
|
|||||
|
Other exit costs
|
1
|
|
—
|
|
1
|
|
|||||
|
Total
|
$
|
54
|
|
$
|
(4
|
)
|
$
|
50
|
|
||
|
(1)
|
Recognized as of August 2, 2015.
|
|
8.
|
Earnings per Share (EPS)
|
For the periods presented in the Consolidated Statements of Earnings, the calculations of basic EPS and EPS assuming dilution vary in that the weighted average shares outstanding assuming dilution include the incremental effect of stock options and other share-based payment awards, except when such effect would be antidilutive. The earnings per share calculation for
2018
excludes approximately
1 million
stock options that would have been antidilutive. The earnings per share calculation for
2017
and
2016
excludes less than
1 million
stock options that would have been antidilutive.
|
9.
|
Noncontrolling Interests
|
We own a
60%
controlling interest in a joint venture formed with Swire Pacific Limited to support our soup and broth business in China and a
70%
controlling interest in a Malaysian food products manufacturing company. We also own a
99.8%
interest in Acre Venture Partners, L.P. (Acre), a limited partnership formed to make venture capital investments in innovative new companies in food and food-related industries. See Note 14 for additional information.
On March 26, 2018, we acquired Snyder's-Lance, including an
80%
interest in one of its subsidiaries. In April 2018, we purchased the remaining
20%
interest for
$47
.
55
The noncontrolling interests' share in the net earnings (loss) was included in Net earnings (loss) attributable to noncontrolling interests in the Consolidated Statements of Earnings. The noncontrolling interests in these entities were included in Total equity in the Consolidated Balance Sheets and Consolidated Statements of Equity.
|
10.
|
Pension and Postretirement Benefits
|
Pension Benefits —
We sponsor a number of noncontributory defined benefit pension plans to provide retirement benefits to all eligible U.S. and non-U.S. employees. The benefits provided under these plans are based primarily on years of service and compensation levels. Benefits are paid from funds previously provided to trustees and insurance companies or are paid directly by us from general funds. In 1999, we implemented significant amendments to certain U.S. pension plans. Under a new formula, retirement benefits are determined based on percentages of annual pay and age. To minimize the impact of converting to the new formula, service and earnings credit continued to accrue through the year 2014 for certain active employees participating in the plans under the old formula prior to the amendments. Employees will receive the benefit from either the new or old formula, whichever is higher. Benefits become vested upon the completion of three years of service. Effective as of January 1, 2011, our U.S. pension plans were amended so that employees hired or rehired on or after that date and who are not covered by collective bargaining agreements will not be eligible to participate in the plans.
Postretirement Benefits —
We provide postretirement benefits, including health care and life insurance, to substantially all retired U.S. employees and their dependents. We established retiree medical account benefits for eligible U.S. retirees. The accounts were intended to provide reimbursement for eligible health care expenses on a tax-favored basis. Effective as of January 1, 2011, the retirement medical program was amended to eliminate the retiree medical account benefit for employees not covered by collective bargaining agreements. To preserve the benefit for employees close to retirement age, the retiree medical account will be available to employees who were at least age 50 with at least 10 years of service as of December 31, 2010, and who satisfy the other eligibility requirements for the retiree medical program. In July 2016, the retirement medical program was amended and effective as of January 1, 2017, we no longer sponsor our own medical coverage for certain Medicare-eligible retirees. In July 2017, the retirement medical program was once again amended and beginning on January 1, 2018, we no longer sponsor our own medical coverage for certain Medicare-eligible retirees covered by one of our collective bargaining agreements. In July 2018, the retirement medical program was once again amended and beginning on January 1, 2019, we no longer sponsor our own medical coverage for certain Medicare-eligible retirees covered by one of our collective bargaining agreements. Instead, in connection with these amendments, we offer these Medicare-eligible retirees access to health care coverage through a private exchange and offer a health reimbursement account to subsidize benefits for a select group of such retirees.
We use the fiscal year end as the measurement date for the benefit plans.
Components of net benefit expense (income) were as follows:
|
Pension
|
|||||||||||
|
|
2018
|
2017
|
2016
|
||||||||
|
Service cost
|
$
|
24
|
|
$
|
26
|
|
$
|
26
|
|
||
|
Interest cost
|
74
|
|
86
|
|
98
|
|
|||||
|
Expected return on plan assets
|
(144
|
)
|
(144
|
)
|
(147
|
)
|
|||||
|
Recognized net actuarial (gain) loss
|
(104
|
)
|
(198
|
)
|
302
|
|
|||||
|
Special termination benefits
|
2
|
|
—
|
|
—
|
|
|||||
|
Curtailment gains
|
(2
|
)
|
—
|
|
—
|
|
|||||
|
Net periodic benefit expense (income)
|
$
|
(150
|
)
|
$
|
(230
|
)
|
$
|
279
|
|
||
The special termination benefits of
$2
related to the planned closure of the manufacturing facility in Toronto, Ontario, and were included in Restructuring charges. See Note 7 for additional information.
The components of net periodic benefit expense (income) other than the service cost component are included in Other expenses / (income) in the Consolidated Statements of Earnings. Beginning in 2018, under the revised FASB guidance adopted in the first quarter, only the service cost component of net periodic benefit expense (income) is eligible for capitalization.
Beginning in 2018, we changed the method we use to estimate the service and interest cost components of net periodic benefit expense (income). We elected to use a full yield curve approach to estimate service cost and interest cost by applying the specific spot rates along the yield curve used to determine the benefit obligation of the relevant projected cash flows. Previously, we estimated service cost and interest cost using a single weighted-average discount rate derived from the yield curve used to measure the benefit obligation at the beginning of the period. We made this change to provide a more precise measurement of service cost and interest cost by improving the correlation between projected benefit cash flows and the corresponding spot yield curve rates. This change will not affect the measurement of our benefit obligations. We accounted for this change prospectively in 2018 as a
56
change in accounting estimate. As a result of this change, net periodic benefit income increased by approximately
$17
in 2018, compared to what the net periodic benefit income would have been under the previous method.
|
|
Postretirement
|
||||||||||
|
|
2018
|
2017
|
2016
|
||||||||
|
Service cost
|
$
|
1
|
|
$
|
1
|
|
$
|
1
|
|
||
|
Interest cost
|
7
|
|
10
|
|
15
|
|
|||||
|
Amortization of prior service credit
|
(27
|
)
|
(25
|
)
|
(1
|
)
|
|||||
|
Recognized net actuarial (gain) loss
|
(16
|
)
|
(14
|
)
|
23
|
|
|||||
|
Net periodic benefit expense (income)
|
$
|
(35
|
)
|
$
|
(28
|
)
|
$
|
38
|
|
||
The estimated prior service credit that will be amortized from Accumulated other comprehensive loss into net periodic postretirement expense during 2019 is
$29
. The prior service credit is primarily related to the amendments in July 2016, July 2017, and July 2018.
Change in benefit obligation:
|
Pension
|
Postretirement
|
|||||||||||||||
|
2018
|
2017
|
2018
|
2017
|
|||||||||||||
|
Obligation at beginning of year
|
$
|
2,450
|
|
$
|
2,626
|
|
$
|
276
|
|
$
|
313
|
|
||||
|
Service cost
|
24
|
|
26
|
|
1
|
|
1
|
|
||||||||
|
Interest cost
|
74
|
|
86
|
|
7
|
|
10
|
|
||||||||
|
Actuarial gain
|
(110
|
)
|
(134
|
)
|
(16
|
)
|
(14
|
)
|
||||||||
|
Participant contributions
|
—
|
|
—
|
|
1
|
|
1
|
|
||||||||
|
Plan amendments
|
2
|
|
—
|
|
(11
|
)
|
(12
|
)
|
||||||||
|
Benefits paid
|
(165
|
)
|
(164
|
)
|
(26
|
)
|
(26
|
)
|
||||||||
|
Medicare subsidies
|
—
|
|
—
|
|
3
|
|
3
|
|
||||||||
|
Other
|
(2
|
)
|
(3
|
)
|
—
|
|
—
|
|
||||||||
|
Special termination benefits
|
2
|
|
—
|
|
—
|
|
—
|
|
||||||||
|
Curtailment
|
(2
|
)
|
—
|
|
—
|
|
—
|
|
||||||||
|
Foreign currency adjustment
|
(16
|
)
|
13
|
|
—
|
|
—
|
|
||||||||
|
Benefit obligation at end of year
|
$
|
2,257
|
|
$
|
2,450
|
|
$
|
235
|
|
$
|
276
|
|
||||
Change in the fair value of pension plan assets:
|
|
2018
|
2017
|
||||||
|
Fair value at beginning of year
|
$
|
2,183
|
|
$
|
2,111
|
|
||
|
Actual return on plan assets
|
137
|
|
208
|
|
||||
|
Employer contributions
|
5
|
|
5
|
|
||||
|
Benefits paid
|
(155
|
)
|
(154
|
)
|
||||
|
Foreign currency adjustment
|
(16
|
)
|
13
|
|
||||
|
Fair value at end of year
|
$
|
2,154
|
|
$
|
2,183
|
|
||
Net amounts recognized in the Consolidated Balance Sheets:
|
|
Pension
|
Postretirement
|
||||||||||||||
|
|
2018
|
2017
|
2018
|
2017
|
||||||||||||
|
Other assets
|
$
|
61
|
|
$
|
8
|
|
$
|
—
|
|
$
|
—
|
|
||||
|
Accrued liabilities
|
14
|
|
14
|
|
29
|
|
29
|
|
||||||||
|
Other liabilities
|
150
|
|
261
|
|
206
|
|
247
|
|
||||||||
|
Net amounts recognized
|
$
|
103
|
|
$
|
267
|
|
$
|
235
|
|
$
|
276
|
|
||||
57
|
Amounts recognized in accumulated other comprehensive income (loss) consist of:
|
Pension
|
Postretirement
|
||||||||||||||
|
2018
|
2017
|
2018
|
2017
|
|||||||||||||
|
Prior service (cost) credit
|
$
|
(2
|
)
|
$
|
—
|
|
$
|
67
|
|
$
|
83
|
|
||||
The change in amounts recognized in accumulated other comprehensive income (loss) associated with postretirement benefits was due to the plan amendments in July 2017 and July 2018, net of amortization.
The following table provides information for pension plans with accumulated benefit obligations in excess of plan assets:
|
2018
|
2017
|
|||||||
|
Projected benefit obligation
|
$
|
249
|
|
$
|
2,270
|
|
||
|
Accumulated benefit obligation
|
$
|
241
|
|
$
|
2,232
|
|
||
|
Fair value of plan assets
|
$
|
85
|
|
$
|
1,995
|
|
||
The accumulated benefit obligation for all pension plans was
$2,227
at
July 29, 2018
, and
$2,399
at
July 30, 2017
.
Weighted-average assumptions used to determine benefit obligations at the end of the year:
|
|
Pension
|
Postretirement
|
||||||
|
|
2018
|
2017
|
2018
|
2017
|
||||
|
Discount rate
|
4.15%
|
3.74%
|
4.06%
|
3.45%
|
||||
|
Rate of compensation increase
|
3.21%
|
3.24%
|
3.25%
|
3.25%
|
||||
Weighted-average assumptions used to determine net periodic benefit cost for the years ended:
|
|
Pension
|
|||||
|
|
2018
|
2017
|
2016
|
|||
|
Discount rate
|
3.74%
|
3.39%
|
4.19%
|
|||
|
Expected return on plan assets
|
6.84%
|
7.09%
|
7.35%
|
|||
|
Rate of compensation increase
|
3.24%
|
3.25%
|
3.29%
|
|||
The discount rate is established as of our fiscal year-end measurement date. In establishing the discount rate, we review published market indices of high-quality debt securities, adjusted as appropriate for duration. In addition, independent actuaries apply high-quality bond yield curves to the expected benefit payments of the plans. The expected return on plan assets is a long-term assumption based upon historical experience and expected future performance, considering our current and projected investment mix. This estimate is based on an estimate of future inflation, long-term projected real returns for each asset class, and a premium for active management.
The discount rate used to determine net periodic postretirement expense was
3.45%
in
2018
,
3.20%
in
2017
, and
4.00%
in
2016
.
Assumed health care cost trend rates at the end of the year:
|
|
2018
|
2017
|
||
|
Health care cost trend rate assumed for next year
|
6.75%
|
7.25%
|
||
|
Rate to which the cost trend rate is assumed to decline (ultimate trend rate)
|
4.50%
|
4.50%
|
||
|
Year that the rate reaches the ultimate trend rate
|
2023
|
2023
|
||
A one-percentage-point increase or decrease in assumed health care costs would not significantly impact 2018 reported service and interest cost nor the 2018 accumulated benefit obligation.
Pension Plan Assets
The fundamental goal underlying the investment policy is to ensure that the assets of the plans are invested in a prudent manner to meet the obligations of the plans as these obligations come due. The primary investment objectives include providing a total return which will promote the goal of benefit security by attaining an appropriate ratio of plan assets to plan obligations, to provide for real asset growth while also tracking plan obligations, to diversify investments across and within asset classes, to reduce the impact of losses in single investments, and to follow investment practices that comply with applicable laws and regulations.
58
The primary policy objectives will be met by investing assets to achieve a reasonable tradeoff between return and risk relative to plan obligations. This includes investing a portion of the assets in funds selected in part to hedge the interest rate sensitivity to plan obligations.
The portfolio includes investments in the following asset classes: fixed income, equity, real estate and alternatives. Fixed income will provide a moderate expected return and partially hedge the exposure to interest rate risk of the plans’ obligations. Equities are used for their high expected return. Additional asset classes are used to provide diversification.
Asset allocation is monitored on an ongoing basis relative to the established asset class targets. The interaction between plan assets and benefit obligations is periodically studied to assist in the establishment of strategic asset allocation targets. The investment policy permits variances from the targets within certain parameters. Asset rebalancing occurs when the underlying asset class allocations move outside these parameters, at which time the asset allocation is rebalanced back to the policy target weight.
Our year-end pension plan weighted-average asset allocations by category were:
|
|
Strategic Target
|
2018
|
2017
|
||
|
Equity securities
|
42%
|
42%
|
48%
|
||
|
Debt securities
|
46%
|
46%
|
40%
|
||
|
Real estate and other
|
12%
|
12%
|
12%
|
||
|
Total
|
100%
|
100%
|
100%
|
||
Pension plan assets are categorized based on the following fair value hierarchy:
|
•
|
Level 1: Observable inputs that reflect quoted prices (unadjusted) for identical assets or liabilities in active markets.
|
|
•
|
Level 2: Inputs other than quoted prices included in Level 1 that are observable for the asset or liability through corroboration with observable market data.
|
|
•
|
Level 3: Unobservable inputs, which are valued based on our estimates of assumptions that market participants would use in pricing the asset or liability.
|
59
The following table presents our pension plan assets by asset category at
July 29, 2018
, and
July 30, 2017
:
|
|
Fair Value
as of July 29, 2018 |
Fair Value Measurements at
July 29, 2018 Using Fair Value Hierarchy |
Fair Value
as of July 30, 2017 |
Fair Value Measurements at
July 30, 2017 Using Fair Value Hierarchy |
|||||||||||||||||||||||||||
|
|
Level 1
|
Level 2
|
Level 3
|
Level 1
|
Level 2
|
Level 3
|
|||||||||||||||||||||||||
|
Short-term investments
|
$
|
61
|
|
$
|
29
|
|
$
|
32
|
|
$
|
—
|
|
$
|
46
|
|
$
|
35
|
|
$
|
11
|
|
$
|
—
|
|
|||||||
|
Equities:
|
|||||||||||||||||||||||||||||||
|
U.S.
|
284
|
|
284
|
|
—
|
|
—
|
|
338
|
|
338
|
|
—
|
|
—
|
|
|||||||||||||||
|
Non-U.S.
|
230
|
|
230
|
|
—
|
|
—
|
|
290
|
|
290
|
|
—
|
|
—
|
|
|||||||||||||||
|
Corporate bonds:
|
|||||||||||||||||||||||||||||||
|
U.S.
|
597
|
|
—
|
|
597
|
|
—
|
|
537
|
|
—
|
|
537
|
|
—
|
|
|||||||||||||||
|
Non-U.S.
|
138
|
|
—
|
|
138
|
|
—
|
|
123
|
|
—
|
|
123
|
|
—
|
|
|||||||||||||||
|
Government and agency bonds:
|
|||||||||||||||||||||||||||||||
|
U.S.
|
70
|
|
—
|
|
70
|
|
—
|
|
60
|
|
—
|
|
60
|
|
—
|
|
|||||||||||||||
|
Non-U.S.
|
33
|
|
—
|
|
33
|
|
—
|
|
31
|
|
—
|
|
31
|
|
—
|
|
|||||||||||||||
|
Municipal bonds
|
61
|
|
—
|
|
61
|
|
—
|
|
58
|
|
—
|
|
58
|
|
—
|
|
|||||||||||||||
|
Mortgage and asset backed securities
|
15
|
|
—
|
|
15
|
|
—
|
|
8
|
|
—
|
|
8
|
|
—
|
|
|||||||||||||||
|
Real estate
|
10
|
|
4
|
|
—
|
|
6
|
|
17
|
|
10
|
|
—
|
|
7
|
|
|||||||||||||||
|
Hedge funds
|
34
|
|
—
|
|
—
|
|
34
|
|
38
|
|
—
|
|
—
|
|
38
|
|
|||||||||||||||
|
Derivative assets
|
8
|
|
—
|
|
8
|
|
—
|
|
9
|
|
—
|
|
9
|
|
—
|
|
|||||||||||||||
|
Derivative liabilities
|
(4
|
)
|
—
|
|
(4
|
)
|
—
|
|
(10
|
)
|
—
|
|
(10
|
)
|
—
|
|
|||||||||||||||
|
Total assets at fair value
|
$
|
1,537
|
|
$
|
547
|
|
$
|
950
|
|
$
|
40
|
|
$
|
1,545
|
|
$
|
673
|
|
$
|
827
|
|
$
|
45
|
|
|||||||
|
Investments measured at net asset value:
|
|||||||||||||||||||||||||||||||
|
Short-term investments
|
21
|
|
31
|
|
|||||||||||||||||||||||||||
|
Commingled funds:
|
|||||||||||||||||||||||||||||||
|
Equities
|
310
|
|
332
|
|
|||||||||||||||||||||||||||
|
Fixed income
|
31
|
|
30
|
|
|||||||||||||||||||||||||||
|
Blended
|
85
|
|
86
|
|
|||||||||||||||||||||||||||
|
Real estate
|
89
|
|
84
|
|
|||||||||||||||||||||||||||
|
Hedge funds
|
95
|
|
103
|
|
|||||||||||||||||||||||||||
|
Total investments measured at net asset value:
|
631
|
|
666
|
|
|||||||||||||||||||||||||||
|
Other items to reconcile to fair value of plan assets
|
(14
|
)
|
(28
|
)
|
|||||||||||||||||||||||||||
|
Total pension plan assets at fair value
|
$
|
2,154
|
|
$
|
2,183
|
|
|||||||||||||||||||||||||
Short-term investments —
Investments include cash and cash equivalents, and various short-term debt instruments and short-term investment funds. Institutional short-term investment vehicles valued daily are classified as Level 1 at cost which approximates market value. Short-term debt instruments are classified at Level 2 and are valued based on bid quotations and recent trade data for identical or similar obligations. Other investments valued based upon net asset value are included as a reconciling item to the fair value table.
Equities —
Common stocks and preferred stocks are classified as Level 1 and are valued using quoted market prices in active markets.
Corporate bonds —
These investments are valued based on quoted market prices, yield curves and pricing models using current market rates.
Government and agency bonds —
These investments are generally valued based on bid quotations and recent trade data for identical or similar obligations.
60
Municipal bonds —
These investments are valued based on quoted market prices, yield curves and pricing models using current market rates.
Mortgage and asset backed securities —
These investments are valued based on prices obtained from third party pricing sources. The prices from third party pricing sources may be based on bid quotes from dealers and recent trade data. Mortgage backed securities are traded in the over-the-counter market.
Real estate —
Real estate investments consist of real estate investment trusts, property funds and limited partnerships. Real estate investment trusts are classified as Level 1 and are valued based on quoted market prices. Property funds are classified as either Level 2 or Level 3 depending upon whether liquidity is limited or there are few observable market participant transactions. Property funds are valued based on third party appraisals. Limited partnerships are valued based upon valuations provided by the general partners of the funds. The values of limited partnerships are based upon an assessment of each underlying investment, incorporating valuations that consider the evaluation of financing and sales transactions with third parties, expected cash flows, and market-based information, including comparable transactions and performance multiples among other factors. The investments are classified as Level 3 since the valuation is determined using unobservable inputs. Real estate investments valued at net asset value are included as a reconciling item to the fair value table.
Hedge funds —
Hedge fund investments include hedge funds valued based upon a net asset value derived from the fair value of underlying securities. Hedge fund investments that are subject to liquidity restrictions or that are based on unobservable inputs are classified as Level 3. Hedge fund investments may include long and short positions in equity and fixed income securities, derivative instruments such as futures and options, commodities and other types of securities. Hedge fund investments valued at net asset value are included as a reconciling item to the fair value table.
Derivatives —
Derivative financial instruments include forward currency contracts, futures contracts, options contracts, interest rate swaps and credit default swaps. Derivative financial instruments are classified as Level 2 and are valued based on observable market transactions or prices.
Commingled funds —
Investments in commingled funds are not traded in active markets. Blended commingled funds are invested in both equities and fixed income securities. Commingled funds are valued based on the net asset values of such funds and are included as a reconciling item to the fair value table.
Other items to reconcile to fair value of plan assets included amounts due for securities sold, amounts payable for securities purchased, and other payables.
The following table summarizes the changes in fair value of Level 3 investments for the years ended
July 29, 2018
, and
July 30, 2017
:
|
|
Real Estate
|
Hedge Funds
|
Total
|
|||||||||
|
Fair value at July 30, 2017
|
$
|
7
|
|
$
|
38
|
|
$
|
45
|
|
|||
|
Actual return on plan assets
|
2
|
|
2
|
|
4
|
|
||||||
|
Purchases
|
—
|
|
—
|
|
—
|
|
||||||
|
Sales
|
(3
|
)
|
(6
|
)
|
(9
|
)
|
||||||
|
Settlements
|
—
|
|
—
|
|
—
|
|
||||||
|
Transfers out of Level 3
|
—
|
|
—
|
|
—
|
|
||||||
|
Fair value at July 29, 2018
|
$
|
6
|
|
$
|
34
|
|
$
|
40
|
|
|||
|
|
Real Estate
|
Hedge Funds
|
Total
|
|||||||||
|
Fair value at July 31, 2016
|
$
|
6
|
|
$
|
45
|
|
$
|
51
|
|
|||
|
Actual return on plan assets
|
1
|
|
2
|
|
3
|
|
||||||
|
Purchases
|
1
|
|
1
|
|
2
|
|
||||||
|
Sales
|
(1
|
)
|
(10
|
)
|
(11
|
)
|
||||||
|
Settlements
|
—
|
|
—
|
|
—
|
|
||||||
|
Transfers out of Level 3
|
—
|
|
—
|
|
—
|
|
||||||
|
Fair value at July 30, 2017
|
$
|
7
|
|
$
|
38
|
|
$
|
45
|
|
|||
61
The following tables present additional information about the pension plan assets valued using net asset value as a practical expedient within the fair value hierarchy table:
|
2018
|
2017
|
||||||||||||||
|
Fair Value
|
Fair Value
|
Redemption Frequency
|
Redemption Notice Period Range
|
||||||||||||
|
Short-term investments
|
$
|
21
|
|
$
|
31
|
|
Daily
|
1 Day
|
|||||||
|
Commingled funds:
|
|||||||||||||||
|
Equities
|
310
|
|
332
|
|
Daily,
|
Monthly
|
2
|
to
|
60 Days
|
||||||
|
Fixed income
|
31
|
|
30
|
|
Daily
|
1 Day
|
|||||||||
|
Blended
|
85
|
|
86
|
|
Primarily Daily
|
1
|
to
|
20 Days
|
|||||||
|
Real estate funds
|
89
|
|
84
|
|
Quarterly
|
45
|
to
|
90 Days
|
|||||||
|
Hedge funds
(1)
|
95
|
|
103
|
|
Monthly
|
5
|
to
|
30 Days
|
|||||||
|
Total
|
$
|
631
|
|
$
|
666
|
|
|||||||||
___________________________________
|
(1)
|
Includes a fund valued at
$2
in 2017 which was substantially liquidated in 2018.
|
There were no unfunded commitments in 2018 or 2017.
No
contributions are expected to be made to U.S. pension plans in 2019. We expect contributions to non-U.S. pension plans to be approximately
$4
in 2019.
Estimated future benefit payments are as follows:
|
|
Pension
|
Postretirement
|
||||||
|
2019
|
$
|
173
|
|
$
|
29
|
|
||
|
2020
|
$
|
167
|
|
$
|
28
|
|
||
|
2021
|
$
|
168
|
|
$
|
26
|
|
||
|
2022
|
$
|
163
|
|
$
|
25
|
|
||
|
2023
|
$
|
159
|
|
$
|
24
|
|
||
|
2024-2028
|
$
|
777
|
|
$
|
97
|
|
||
The estimated future benefit payments include payments from funded and unfunded plans.
Defined Contribution Plans —
All Snyder’s-Lance U.S. employees are eligible to participate in a 401(k) Retirement Plan that provides participants with matching contributions equal to
100%
of the first
4%
of qualified wages and
50%
of the next
1%
of qualified wages. For substantially all U.S. employees except Snyder's-Lance employees, effective January 1, 2011, we provide a matching contribution of
100%
of employee contributions up to
4%
of compensation for employees who are not covered by collective bargaining agreements. Employees hired or rehired on or after January 1, 2011, who will not be eligible to participate in the defined benefit plans and who are not covered by collective bargaining agreements receive a contribution equal to
3%
of compensation regardless of their participation in the 401(k) Retirement Plan. Amounts charged to Costs and expenses were
$45
in
2018
,
$34
in
2017
and
$33
in
2016
.
62
|
11.
|
Taxes on Earnings
|
The provision for income taxes on earnings consists of the following:
|
|
2018
|
2017
|
2016
|
||||||||
|
Income taxes:
|
|||||||||||
|
Currently payable:
|
|||||||||||
|
Federal
|
$
|
84
|
|
$
|
238
|
|
$
|
235
|
|
||
|
State
|
13
|
|
39
|
|
34
|
|
|||||
|
Non-U.S.
|
47
|
|
36
|
|
47
|
|
|||||
|
144
|
|
313
|
|
316
|
|
||||||
|
Deferred:
|
|||||||||||
|
Federal
|
(122
|
)
|
77
|
|
(17
|
)
|
|||||
|
State
|
(2
|
)
|
2
|
|
—
|
|
|||||
|
Non-U.S.
|
(9
|
)
|
14
|
|
(13
|
)
|
|||||
|
(133
|
)
|
93
|
|
(30
|
)
|
||||||
|
$
|
11
|
|
$
|
406
|
|
$
|
286
|
|
|||
|
2018
|
2017
|
2016
|
||||||||||
|
Earnings before income taxes:
|
||||||||||||
|
United States
|
$
|
143
|
|
$
|
1,103
|
|
$
|
705
|
|
|||
|
Non-U.S.
|
129
|
|
190
|
|
144
|
|
||||||
|
$
|
272
|
|
$
|
1,293
|
|
$
|
849
|
|
||||
The following is a reconciliation of the effective income tax rate to the U.S. federal statutory income tax rate:
|
|
2018
|
2017
|
2016
|
|||||
|
Federal statutory income tax rate
|
21.0
|
%
|
35.0
|
%
|
35.0
|
%
|
||
|
State income taxes (net of federal tax benefit)
|
4.3
|
|
2.1
|
|
2.7
|
|
||
|
Tax effect of international items
|
2.6
|
|
(2.1
|
)
|
(3.0
|
)
|
||
|
Settlement of tax contingencies
|
(6.2
|
)
|
—
|
|
—
|
|
||
|
Federal manufacturing deduction
|
(4.0
|
)
|
(2.1
|
)
|
(3.2
|
)
|
||
|
Goodwill impairment
|
18.7
|
|
3.4
|
|
4.3
|
|
||
|
Claim settlement
|
—
|
|
—
|
|
(0.8
|
)
|
||
|
Tax Reform - impact on U.S. deferred tax assets and liabilities
(1)
|
(66.3
|
)
|
—
|
|
—
|
|
||
|
Tax Reform - transition tax
(1)
|
19.6
|
|
—
|
|
—
|
|
||
|
Effect of higher U.S. federal statutory tax rate
(1)
|
13.2
|
|
—
|
|
—
|
|
||
|
Foreign exchange losses
(2)
|
—
|
|
(3.9
|
)
|
—
|
|
||
|
Other
|
1.1
|
|
(1.0
|
)
|
(1.3
|
)
|
||
|
Effective income tax rate
|
4.0
|
%
|
31.4
|
%
|
33.7
|
%
|
||
_______________________________________
|
(1)
|
The Tax Cuts and Jobs Act of 2017 (the Act) was enacted into law on December 22, 2017, and made significant changes to corporate taxation. Changes under the Act include:
|
|
•
|
Reducing the federal corporate tax rate from
35%
to
21%
effective January 1, 2018. A blended rate will apply for fiscal 2018 non-calendar year end companies for the fiscal periods that include the effective date of the rate change. The impact of this is shown as "Effect of higher U.S. federal statutory tax rate";
|
|
•
|
Repealing the exception for deductibility of performance-based compensation to covered employees, which impacts us beginning in 2019, along with expanding the number of covered employees;
|
|
•
|
Transitioning to a territorial system for taxation on foreign earnings along with the imposition of a transition tax in 2018 on the deemed repatriation of unremitted foreign earnings;
|
|
•
|
Immediate expensing of machinery and equipment placed into service after September 27, 2017;
|
63
|
•
|
Eliminating the deduction for domestic manufacturing activities, which impacts us beginning in 2019;
|
|
•
|
Changes to the taxation of multinational companies, including a new minimum tax on Global Intangible Low-Taxed Income, a new Base Erosion Anti-Abuse Tax, and a new U.S. corporate deduction for Foreign-Derived Intangible Income, all of which are effective for us beginning in 2019; and
|
|
•
|
Limiting the deductibility of interest expense to
30%
of adjusted taxable income, which is effective for us beginning in 2019.
|
|
(2)
|
The 2017 rate was favorably impacted by a
$52
benefit primarily related to the sale of intercompany notes receivable to a financial institution, which resulted in the recognition of foreign exchange losses.
|
The U.S. Securities and Exchange Commission recently released Staff Accounting Bulletin (SAB) 118, which allows for a measurement period while a company obtains, prepares, and analyzes the information necessary to finalize its accounting for the effects of the Act. As a result of the Act, we recognized a benefit of
$179
on the remeasurement of deferred tax assets and liabilities and expense of
$53
on the transition tax on unremitted foreign earnings. Based on SAB 118, the amounts recorded represent provisional amounts based on our best estimates and current interpretation of the provisions of the Act and may change as estimates are revised or additional guidance is issued.
Deferred tax liabilities and assets are comprised of the following:
|
|
2018
|
2017
|
|||||
|
Depreciation
|
$
|
342
|
|
$
|
355
|
|
|
|
Amortization
|
868
|
|
521
|
|
|||
|
Other
|
35
|
|
20
|
|
|||
|
Deferred tax liabilities
|
1,245
|
|
896
|
|
|||
|
Benefits and compensation
|
144
|
|
241
|
|
|||
|
Pension benefits
|
24
|
|
98
|
|
|||
|
Tax loss carryforwards
|
65
|
|
36
|
|
|||
|
Capital loss carryforwards
|
88
|
|
92
|
|
|||
|
Other
|
92
|
|
95
|
|
|||
|
Gross deferred tax assets
|
413
|
|
562
|
|
|||
|
Deferred tax asset valuation allowance
|
(133
|
)
|
(120
|
)
|
|||
|
Deferred tax assets, net of valuation allowance
|
280
|
|
442
|
|
|||
|
Net deferred tax liability
|
$
|
965
|
|
$
|
454
|
|
|
At
July 29, 2018
, our U.S. and non-U.S. subsidiaries had tax loss carryforwards of approximately
$671
. Of these carryforwards,
$634
expire between
2019
and
2037
, and
$37
may be carried forward indefinitely. At
July 29, 2018
, deferred tax asset valuation allowances have been established to offset
$213
of these tax loss carryforwards. Additionally, at
July 29, 2018
, our U.S. and non-U.S. subsidiaries had capital loss carryforwards of approximately
$318
, of which
$300
were offset by valuation allowances.
The net change in the deferred tax asset valuation allowance in 2018 was an increase of
$13
. The increase was primarily due to the acquisition of Snyder's-Lance and the impact of currency. The net change in the deferred tax asset valuation allowance in 2017 was an increase of
$2
. The increase was primarily due to the impact of currency and the recognition of additional valuation allowances on tax loss carryforwards, partially offset by the expiration of tax losses. The net change in the deferred tax asset valuation allowance in 2016 was a decrease of
$4
. The decrease was primarily due to the expiration of tax losses, partially offset by the recognition of additional valuation allowance on tax loss carryforwards.
As of
July 29, 2018
, other deferred tax assets included
$23
of state tax credit carryforwards related to various states that expire between
2021
and
2031
. As of
July 29, 2018
, deferred tax asset valuation allowances have been established to offset
$15
of the state credit carryforwards. The increase in state tax credit carryforwards was primarily due to the acquisition of Snyder's-Lance and settlement of tax audits. As of
July 30, 2017
, other deferred tax assets included
$1
of state tax credit carryforwards related to various states that expire between
2021
and
2029
. No valuation allowances have been established related to these deferred tax assets.
As of
July 29, 2018
, we had approximately
$956
of undistributed earnings of subsidiaries. Of this amount,
$897
was subject to U.S. tax under the transition tax on foreign earnings discussed above. Consistent with prior years, these unremitted earnings and the investment in our foreign subsidiaries are deemed to be permanently reinvested and no additional tax has been provided. It is not practical to estimate the tax liability that might be incurred if such earnings were remitted to the U.S.
64
A reconciliation of the activity related to unrecognized tax benefits follows:
|
|
2018
|
2017
|
2016
|
||||||||
|
Balance at beginning of year
|
$
|
64
|
|
$
|
63
|
|
$
|
58
|
|
||
|
Increases related to prior-year tax positions
|
—
|
|
4
|
|
2
|
|
|||||
|
Decreases related to prior-year tax positions
|
(37
|
)
|
—
|
|
—
|
|
|||||
|
Increases related to current-year tax positions
|
2
|
|
4
|
|
3
|
|
|||||
|
Settlements
|
(1
|
)
|
(7
|
)
|
—
|
|
|||||
|
Increase due to acquisitions
|
4
|
|
—
|
|
—
|
|
|||||
|
Balance at end of year
|
$
|
32
|
|
$
|
64
|
|
$
|
63
|
|
||
The amount of unrecognized tax benefits that, if recognized, would impact the annual effective tax rate was
$26
as of
July 29, 2018
,
$43
as of
July 30, 2017
, and
$42
as of
July 31, 2016
. The total amount of unrecognized tax benefits can change due to audit settlements, tax examination activities, statute expirations and the recognition and measurement criteria under accounting for uncertainty in income taxes. We reasonably expect reductions in the liability for unrecognized tax benefits of approximately
$7
within the next 12 months due to settlement of state tax examinations. Approximately
$5
of unrecognized tax benefits, including interest and penalties, were reported in Accounts receivable in the Consolidated Balance Sheets as of
July 30, 2017
.
Our accounting policy with respect to interest and penalties attributable to income taxes is to reflect any expense or benefit as a component of our income tax provision. The total amount of interest and penalties recognized in the Consolidated Statements of Earnings was insignificant in
2018
,
$4
in
2017
and
$3
in
2016
. The total amount of interest and penalties recognized in the Consolidated Balance Sheets in Other liabilities was
$5
as of
July 29, 2018
, and
July 30, 2017
.
We do business internationally and, as a result, file income tax returns in the U.S. federal jurisdiction and various state and non-U.S. jurisdictions. In the normal course of business, we are subject to examination by taxing authorities throughout the world, including such major jurisdictions as the U.S., Australia, Canada and Denmark. The 2018 tax year is currently under audit by the Internal Revenue Service. In addition, several state income tax examinations are in progress for the years 1999 to 2017.
With limited exceptions, we have been audited for income tax purposes in Australia through 2010, Denmark through 2013, and in Canada through 2014.
|
12.
|
|
Short-term borrowings consist of the following:
|
2018
|
2017
|
||||||
|
Commercial paper
|
$
|
1,140
|
|
$
|
874
|
|
|
|
Australian notes
|
348
|
|
152
|
|
|||
|
Notes
|
300
|
|
—
|
|
|||
|
Current portion of Canadian credit facility
|
90
|
|
—
|
|
|||
|
Variable-rate bank borrowings
|
22
|
|
10
|
|
|||
|
Capital leases
|
1
|
|
1
|
|
|||
|
Other
(1)
|
(5
|
)
|
—
|
|
|||
|
Total short-term borrowings
|
$
|
1,896
|
|
$
|
1,037
|
|
|
_______________________________________
|
(1)
|
Includes unamortized net discount/premium on debt issuances and debt issuance costs.
|
As of
July 29, 2018
, the weighted-average interest rate of commercial paper, which consisted of U.S. borrowings, was
2.54%
. As of
July 30, 2017
, the weighted-average interest rate of commercial paper, which consisted of U.S. borrowings, was
1.31%
.
As of
July 29, 2018
, we had
$1,896
of short-term borrowings due within one year, of which
$1,140
was comprised of commercial paper borrowings. As of
July 29, 2018
, we issued
$59
of standby letters of credit. We have a committed revolving credit facility totaling
$1,850
that matures in
December 2021
. This U.S. facility remained unused at
July 29, 2018
, except for
$1
of standby letters of credit that we issued under it. The U.S. facility supports our commercial paper programs and other general corporate purposes.
In June 2017, we sold an intercompany note to a financial institution of AUD
$190
, or
$152
with an interest rate of
6.98%
that matures on
March 29, 2021
, but is payable upon demand. In June 2017, we sold an intercompany note to a financial institution of AUD
$280
, or
$224
, with an interest rate of
4.88%
that matures on
September 18, 2018
. Interest on the notes is due semi-annually on January 23 and July 23. The net proceeds were used for general corporate purposes.
65
In July 2016, we entered into a Canadian committed revolving credit facility that matures in July 2019. As of
July 29, 2018
, the total commitment under the Canadian facility was CAD
$125
, or
$96
, and we had borrowings of CAD
$117
, or
$90
, at a rate of
3.17%
under this facility. The Canadian facility supports general corporate purposes.
Long-term debt consists of the following:
|
Type
|
Fiscal Year of Maturity
|
Rate
|
2018
|
2017
|
||||||||
|
Canadian credit facility
|
2019
|
Variable
|
$
|
90
|
|
$
|
130
|
|
||||
|
Australian note
|
2019
|
4.88%
|
207
|
|
224
|
|
||||||
|
Notes
|
2019
|
4.50%
|
300
|
|
300
|
|
||||||
|
Notes
|
2020
|
Variable
|
500
|
|
—
|
|
||||||
|
Notes
|
2021
|
Variable
|
400
|
|
—
|
|
||||||
|
Senior Term Loan
|
2021
|
Variable
|
900
|
|
—
|
|
||||||
|
Notes
|
2021
|
3.30%
|
650
|
|
—
|
|
||||||
|
Notes
|
2021
|
4.25%
|
500
|
|
500
|
|
||||||
|
Debentures
|
2021
|
8.88%
|
200
|
|
200
|
|
||||||
|
Notes
|
2023
|
2.50%
|
450
|
|
450
|
|
||||||
|
Notes
|
2023
|
3.65%
|
1,200
|
|
—
|
|
||||||
|
Notes
|
2025
|
3.95%
|
850
|
|
—
|
|
||||||
|
Notes
|
2025
|
3.30%
|
300
|
|
300
|
|
||||||
|
Notes
|
2028
|
4.15%
|
1,000
|
|
—
|
|
||||||
|
Notes
|
2043
|
3.80%
|
400
|
|
400
|
|
||||||
|
Notes
|
2048
|
4.80%
|
700
|
|
—
|
|
||||||
|
Capital leases
|
7
|
|
7
|
|
||||||||
|
Other
(1)
|
(59
|
)
|
(12
|
)
|
||||||||
|
Total
|
$
|
8,595
|
|
$
|
2,499
|
|
||||||
|
Less current portion
|
597
|
|
—
|
|
||||||||
|
Total long-term debt
|
$
|
7,998
|
|
$
|
2,499
|
|
||||||
_______________________________________
|
(1)
|
Includes unamortized net discount/premium on debt issuances and debt issuance costs.
|
We issued
$5,300
senior notes on March 16, 2018, and borrowed
$900
under a single draw 3-year senior unsecured term loan facility on March 26, 2018 to finance the acquisition of Snyder's-Lance. The interest rate on the
$900
senior unsecured term loan facility resets in one, two, three, or six-month periods dependent upon our election. Interest on the senior unsecured term loan facility is due upon the earlier of an interest reset or quarterly and the first interest payment is due in June 2018. The senior unsecured term loan facility may be prepaid at par at any time. The senior unsecured term loan facility contains a financial covenant based on our maximum leverage ratio. Pursuant to this covenant, if our credit rating is less than BBB+ from Standard & Poor's and Baa1 from Moody's Investors Service, Inc and the amount borrowed under the facility is in excess of $500, we must maintain a leverage ratio below (i) for the last day of each quarter ending on or prior to April 30, 2020, 5.75:1.00, and (ii) thereafter, 5.25:1.00. Our leverage ratio is calculated based on the ratio of consolidated net debt to consolidated adjusted EBITDA, each as defined in the credit agreement for the senior unsecured term loan facility. The maximum leverage ratio covenant is incorporated into our U.S. and Canadian facilities for so long as that covenant is in effect under the senior unsecured term loan facility. In addition, the senior unsecured term loan facility contains other customary covenants and events of default for credit facilities of this type. Interest on the 2-year floating rate senior notes is due quarterly on March 16, June 16, September 16, and December 16, commencing on June 16, 2018. Interest on the 3-year floating rate senior notes is due quarterly on March 15, June 15, September 15, and December 15, commencing on June 15, 2018. Interest on the fixed rate senior notes is due semi-annually on March 15 and September 15, commencing on September 15, 2018. The fixed rate senior notes may be redeemed, in whole or in part, at our option at any time at the applicable redemption price. If change of control triggering events occur, we will be required to offer to purchase the senior notes at a purchase price equal to
101%
of the principal amount plus accrued and unpaid interest, if any, to the purchase date.
Principal amounts of long-term debt mature as follows:
$500
in
2020
;
$2,651
in
2021
;
$1
in
2022
;
$1,651
in
2023
; and a total of
$3,254
in period beyond
2023
.
66
|
13.
|
Financial Instruments
|
The principal market risks to which we are exposed are changes in foreign currency exchange rates, interest rates, and commodity prices. In addition, we are exposed to equity price changes related to certain deferred compensation obligations. In order to manage these exposures, we follow established risk management policies and procedures, including the use of derivative contracts such as swaps, rate locks, options, forwards and commodity futures. We enter into these derivative contracts for periods consistent with the related underlying exposures, and the contracts do not constitute positions independent of those exposures. We do not enter into derivative contracts for speculative purposes and do not use leveraged instruments. Our derivative programs include instruments that qualify and others that do not qualify for hedge accounting treatment.
Concentration of Credit Risk
We are exposed to the risk that counterparties to derivative contracts will fail to meet their contractual obligations. To mitigate counterparty credit risk, we enter into contracts only with carefully selected, leading, credit-worthy financial institutions, and distribute contracts among several financial institutions to reduce the concentration of credit risk. We did not have credit-risk-related contingent features in our derivative instruments as of
July 29, 2018
, or
July 30, 2017
.
We are also exposed to credit risk from our customers. During 2018, our largest customer accounted for approximately
18%
of consolidated net sales. Our five largest customers accounted for approximately
38%
of our consolidated net sales in 2018.
We closely monitor credit risk associated with counterparties and customers.
Foreign Currency Exchange Risk
We are exposed to foreign currency exchange risk related to our international operations, including non-functional currency intercompany debt and net investments in subsidiaries. We are also exposed to foreign exchange risk as a result of transactions in currencies other than the functional currency of certain subsidiaries. Principal currencies hedged include the Canadian dollar, Australian dollar and U.S. dollar. We utilize foreign exchange forward purchase and sale contracts, as well as cross-currency swaps, to hedge these exposures. The contracts are either designated as cash-flow hedging instruments or are undesignated. We hedge portions of our forecasted foreign currency transaction exposure with foreign exchange forward contracts for periods typically up to
18
months. To hedge currency exposures related to intercompany debt, we enter into foreign exchange forward purchase and sale contracts, as well as cross-currency swap contracts, for periods consistent with the underlying debt. The notional amount of foreign exchange forward contracts accounted for as cash-flow hedges was
$104
at
July 29, 2018
, and
$84
at
July 30, 2017
. The effective portion of the changes in fair value on these instruments is recorded in other comprehensive income (loss) and is reclassified into the Consolidated Statements of Earnings on the same line item and the same period in which the underlying hedged transaction affects earnings. The notional amount of foreign exchange forward contracts that are not designated as accounting hedges was
$140
and
$336
at
July 29, 2018
, and
July 30, 2017
, respectively. There were no cross-currency swap contracts outstanding as of
July 29, 2018
or
July 30, 2017
.
Interest Rate Risk
We manage our exposure to changes in interest rates by optimizing the use of variable-rate and fixed-rate debt and by utilizing interest rate swaps in order to maintain our variable-to-total debt ratio within targeted guidelines. Receive fixed rate/pay variable rate interest rate swaps are accounted for as fair-value hedges. We manage our exposure to interest rate volatility on future debt issuances by entering into forward starting interest rate swaps or treasury rate lock contracts to lock in the rate on the interest payments related to the anticipated debt issuances. The contracts are either designated as cash-flow hedging instruments or are undesignated. The effective portion of the changes in fair value on designated instruments is recorded in other comprehensive income (loss) and reclassified into the Consolidated Statements of Earnings over the life of the debt. The change in fair value on undesignated instruments is recorded in interest expense. At
July 30, 2017
, we had forward starting interest rate swaps accounted for as cash flow hedges with a notional amount of
$300
, which related to the debt issuance in 2018. We settled forward starting interest rate swaps with a notional of
$300
in October 2017 at a loss of
$22
. We settled forward starting interest rate swaps with a notional of
$300
in March 2018 at a gain of
$15
. The
$7
net loss on these instruments was recorded in other comprehensive income (loss) and will be recognized as additional interest expense over the 10-year life of the debt issued in March 2018. We entered into treasury rate lock contracts with a notional value of
$2,400
in 2018. The contacts were settled in March 2018 at a gain of
$18
, which was recognized in Interest expense in our Consolidated Statements of Earnings. These contracts, which were undesignated, hedged the planned financing of the acquisition of Snyder's-Lance. There were no forward starting interest rate swaps outstanding as of
July 29, 2018
.
67
Commodity Price Risk
We principally use a combination of purchase orders and various short- and long-term supply arrangements in connection with the purchase of raw materials, including certain commodities and agricultural products. We also enter into commodity futures, options and swap contracts to reduce the volatility of price fluctuations of soybean oil, wheat, diesel fuel, aluminum, natural gas, soybean meal, corn, cocoa, butter, and cheese, which impact the cost of raw materials. Commodity futures, options, and swap contracts are either designated as cash-flow hedging instruments or are undesignated. We hedge a portion of commodity requirements for periods typically up to
18
months. There were
no
commodity contracts accounted for as cash-flow hedges as of
July 29, 2018
, or
July 30, 2017
. The notional amount of commodity contracts not designated as accounting hedges was
$118
at
July 29, 2018
, and
$90
at
July 30, 2017
.
In 2017, we entered into a supply contract under which prices for certain raw materials are established based on anticipated volume requirements over a twelve-month period. Certain prices under the contract are based in part on certain component parts of the raw materials that are in excess of our needs or not required for our operations, thereby creating an embedded derivative requiring bifurcation. We net settle amounts due under the contract with our counterparty. The notional value was approximately
$33
as of
July 29, 2018
, and
$35
as of
July 30, 2017
. The fair value was not material as of
July 29, 2018
, and
July 30, 2017
. Unrealized gains (losses) and settlements are included in Cost of products sold in our Consolidated Statements of Earnings.
Equity Price Risk
We enter into swap contracts which hedge a portion of exposures relating to certain deferred compensation obligations linked to the total return of our capital stock, the total return of the Vanguard Institutional Index, and the total return of the Vanguard Total International Stock Index. Under these contracts, we pay variable interest rates and receive from the counterparty either: the total return on our capital stock; the total return of the Standard & Poor's 500 Index, which is expected to approximate the total return of the Vanguard Institutional Index; or the total return of the iShares MSCI EAFE Index, which is expected to approximate the total return of the Vanguard Total International Stock Index. These contracts were not designated as hedges for accounting purposes. We enter into these contracts for periods typically not exceeding
12
months. The notional amounts of the contracts as of
July 29, 2018
, and
July 30, 2017
, were
$41
and
$43
, respectively.
68
The following table summarizes the fair value of derivative instruments on a gross basis as recorded in the Consolidated Balance Sheets as of
July 29, 2018
, and
July 30, 2017
:
|
Balance Sheet Classification
|
2018
|
2017
|
|||||||
|
Asset Derivatives
|
|||||||||
|
Derivatives designated as hedges:
|
|||||||||
|
Foreign exchange forward contracts
|
Other current assets
|
$
|
1
|
|
$
|
3
|
|
||
|
Total derivatives designated as hedges
|
$
|
1
|
|
$
|
3
|
|
|||
|
Derivatives not designated as hedges:
|
|||||||||
|
Commodity derivative contracts
|
Other current assets
|
$
|
5
|
|
$
|
5
|
|
||
|
Deferred compensation derivative contracts
|
Other current assets
|
1
|
|
1
|
|
||||
|
Foreign exchange forward contracts
|
Other current assets
|
3
|
|
—
|
|
||||
|
Commodity derivative contracts
|
Other assets
|
—
|
|
1
|
|
||||
|
Total derivatives not designated as hedges
|
$
|
9
|
|
$
|
7
|
|
|||
|
Total asset derivatives
|
$
|
10
|
|
$
|
10
|
|
|||
|
|
Balance Sheet Classification
|
2018
|
2017
|
||||||
|
Liability Derivatives
|
|||||||||
|
Derivatives designated as hedges:
|
|||||||||
|
Foreign exchange forward contracts
|
Accrued liabilities
|
$
|
2
|
|
$
|
1
|
|
||
|
Forward starting interest rate swaps
|
Accrued liabilities
|
—
|
|
22
|
|
||||
|
Total derivatives designated as hedges
|
$
|
2
|
|
$
|
23
|
|
|||
|
Derivatives not designated as hedges:
|
|||||||||
|
Commodity derivative contracts
|
Accrued liabilities
|
$
|
3
|
|
$
|
1
|
|
||
|
Foreign exchange forward contracts
|
Accrued liabilities
|
—
|
|
19
|
|
||||
|
Foreign exchange forward contracts
|
Other liabilities
|
—
|
|
1
|
|
||||
|
Commodity derivative contracts
|
Other liabilities
|
1
|
|
—
|
|
||||
|
Total derivatives not designated as hedges
|
$
|
4
|
|
$
|
21
|
|
|||
|
Total liability derivatives
|
$
|
6
|
|
$
|
44
|
|
|||
We do not offset the fair values of derivative assets and liabilities executed with the same counterparty that are generally subject to enforceable netting agreements. However, if we were to offset and record the asset and liability balances of derivatives on a net basis, the amounts presented in the Consolidated Balance Sheets as of
July 29, 2018
, and
July 30, 2017
, would be adjusted as detailed in the following table:
|
2018
|
2017
|
|||||||||||||||||||||||
|
Derivative Instrument
|
Gross Amounts Presented in the Consolidated Balance Sheet
|
Gross Amounts Not Offset in the Consolidated Balance Sheet Subject to Netting Agreements
|
Net Amount
|
Gross Amounts Presented in the Consolidated Balance Sheet
|
Gross Amounts Not Offset in the Consolidated Balance Sheet Subject to Netting Agreements
|
Net Amount
|
||||||||||||||||||
|
Total asset derivatives
|
$
|
10
|
|
$
|
(3
|
)
|
$
|
7
|
|
$
|
10
|
|
$
|
(3
|
)
|
$
|
7
|
|
||||||
|
Total liability derivatives
|
$
|
6
|
|
$
|
(3
|
)
|
$
|
3
|
|
$
|
44
|
|
$
|
(3
|
)
|
$
|
41
|
|
||||||
We are required to maintain cash margin accounts in connection with funding the settlement of open positions for exchange-traded commodity derivative instruments. At
July 29, 2018
, and
July 30, 2017
, a cash margin account balance of
$2
and
$1
, respectively, was included in Other current assets in the Consolidated Balance Sheets.
69
The following tables show the effect of our derivative instruments designated as cash-flow hedges for the years ended
July 29, 2018
,
July 30, 2017
, and
July 31, 2016
in other comprehensive income (loss) (OCI) and the Consolidated Statements of Earnings:
|
|
|
Total Cash-Flow Hedge
OCI Activity
|
|||||||||||
|
Derivatives Designated as Cash-Flow Hedges
|
|
2018
|
2017
|
2016
|
|||||||||
|
OCI derivative gain (loss) at beginning of year
|
$
|
(34
|
)
|
$
|
(64
|
)
|
$
|
(10
|
)
|
||||
|
Effective portion of changes in fair value recognized in OCI:
|
|||||||||||||
|
Foreign exchange forward contracts
|
8
|
|
(4
|
)
|
(9
|
)
|
|||||||
|
Forward starting interest rate swaps
|
15
|
|
23
|
|
(36
|
)
|
|||||||
|
Amount of (gain) loss reclassified from OCI to earnings:
|
Location in Earnings
|
||||||||||||
|
Foreign exchange forward contracts
|
Cost of products sold
|
1
|
|
6
|
|
(11
|
)
|
||||||
|
Foreign exchange forward contracts
|
Other expenses / (income)
|
—
|
|
1
|
|
(2
|
)
|
||||||
|
Forward starting interest rate swaps
|
Interest expense
|
2
|
|
4
|
|
4
|
|
||||||
|
OCI derivative gain (loss) at end of year
|
$
|
(8
|
)
|
$
|
(34
|
)
|
$
|
(64
|
)
|
||||
Based on current valuations, the amount expected to be reclassified from OCI into earnings within the next
12
months is a
gain
of
$1
.
The ineffective portion and amount excluded from effectiveness testing were not material.
The following table shows the effects of our derivative instruments not designated as hedges in the Consolidated Statements of Earnings:
|
Amount of (Gain) Loss Recognized in Earnings on Derivatives
|
||||||||||||||
|
Derivatives not Designated as Hedges
|
Location of (Gain) Loss
Recognized in Earnings |
2018
|
2017
|
2016
|
||||||||||
|
Foreign exchange forward contracts
|
Cost of products sold
|
$
|
(1
|
)
|
$
|
—
|
|
$
|
—
|
|
||||
|
Foreign exchange forward contracts
|
Other expenses / (income)
|
(1
|
)
|
14
|
|
(1
|
)
|
|||||||
|
Cross-currency swap contracts
|
Other expenses / (income)
|
—
|
|
—
|
|
2
|
|
|||||||
|
Commodity derivative contracts
|
Cost of products sold
|
(2
|
)
|
(11
|
)
|
6
|
|
|||||||
|
Deferred compensation derivative contracts
|
Administrative expenses
|
(2
|
)
|
(3
|
)
|
(6
|
)
|
|||||||
|
Treasury rate lock contracts
|
Interest expense
|
(18
|
)
|
—
|
|
—
|
|
|||||||
|
Total
|
$
|
(24
|
)
|
$
|
—
|
|
$
|
1
|
|
|||||
|
14.
|
Variable Interest Entity
|
In February 2016, we agreed to make a capital commitment subject to certain qualifications of up to
$125
to Acre, a limited partnership formed to make venture capital investments in innovative new companies in food and food-related industries. Acre is managed by its general partner, Acre Ventures GP, LLC, which is independent of us. We are the sole limited partner of Acre and own a
99.8%
interest. Our share of earnings (loss) is calculated according to the terms of the partnership agreement. Acre is a VIE. We have determined that we are the primary beneficiary. Therefore, we consolidate Acre and account for the third party ownership as a noncontrolling interest. Through
July 29, 2018
, we funded
$81
of the capital commitment. On August 29, 2018, we provided notice of termination of the investment period and have
no
obligation to make any further capital contributions to Acre for new investments, but are required to pay obligations made prior to the notice of termination, the management fee and permitted partnership expenses.
Acre elected the fair value option to account for qualifying investments to more appropriately reflect the value of the investments in the financial statements. The investments were
$77
and
$51
as of
July 29, 2018
, and
July 30, 2017
, respectively, and are included in Other assets on the Consolidated Balance Sheets. Changes in the fair values of investments for which the fair value option was elected are included in Other expenses / (income) on the Consolidated Statements of Earnings. Current assets and liabilities of Acre were not material as of
July 29, 2018
, or
July 30, 2017
.
|
15.
|
Fair Value Measurements
|
We categorize financial assets and liabilities based on the following fair value hierarchy:
|
•
|
Level 1: Observable inputs that reflect quoted prices (unadjusted) for identical assets or liabilities in active markets.
|
|
•
|
Level 2: Inputs other than quoted prices included in Level 1 that are observable for the asset or liability through corroboration with observable market data.
|
70
|
•
|
Level 3: Unobservable inputs, which are valued based on our estimates of assumptions that market participants would use in pricing the asset or liability.
|
Fair value is defined as the exit price, or the amount that would be received to sell an asset or paid to transfer a liability in an orderly transaction between market participants as of the measurement date. When available, we use unadjusted quoted market prices to measure the fair value and classify such items as Level 1. If quoted market prices are not available, we base fair value upon internally developed models that use current market-based or independently sourced market parameters such as interest rates and currency rates. Included in the fair value of derivative instruments is an adjustment for credit and nonperformance risk.
Assets and Liabilities Measured at Fair Value on a Recurring Basis
The following table presents our financial assets and liabilities that are measured at fair value on a recurring basis as of
July 29, 2018
, and
July 30, 2017
, consistent with the fair value hierarchy:
|
|
Fair Value
as of July 29, 2018 |
Fair Value Measurements at
July 29, 2018 Using Fair Value Hierarchy |
Fair Value
as of July 30, 2017 |
Fair Value Measurements at
July 30, 2017 Using Fair Value Hierarchy |
|||||||||||||||||||||||||||
|
|
Level 1
|
Level 2
|
Level 3
|
Level 1
|
Level 2
|
Level 3
|
|||||||||||||||||||||||||
|
Assets
|
|||||||||||||||||||||||||||||||
|
Foreign exchange forward contracts
(1)
|
$
|
4
|
|
$
|
—
|
|
$
|
4
|
|
$
|
—
|
|
$
|
3
|
|
$
|
—
|
|
$
|
3
|
|
$
|
—
|
|
|||||||
|
Commodity derivative contracts
(2)
|
5
|
|
5
|
|
—
|
|
—
|
|
6
|
|
6
|
|
—
|
|
—
|
|
|||||||||||||||
|
Deferred compensation derivative contracts
(3)
|
1
|
|
—
|
|
1
|
|
—
|
|
1
|
|
—
|
|
1
|
|
—
|
|
|||||||||||||||
|
Deferred compensation investments
(4)
|
6
|
|
6
|
|
—
|
|
—
|
|
—
|
|
—
|
|
—
|
|
—
|
|
|||||||||||||||
|
Fair value option investments
(5)
|
77
|
|
—
|
|
—
|
|
77
|
|
50
|
|
—
|
|
1
|
|
49
|
|
|||||||||||||||
|
Total assets at fair value
|
$
|
93
|
|
$
|
11
|
|
$
|
5
|
|
$
|
77
|
|
$
|
60
|
|
$
|
6
|
|
$
|
5
|
|
$
|
49
|
|
|||||||
|
|
Fair Value
as of July 29, 2018 |
Fair Value Measurements at
July 29, 2018 Using Fair Value Hierarchy |
Fair Value
as of July 30, 2017 |
Fair Value Measurements at
July 30, 2017 Using Fair Value Hierarchy |
|||||||||||||||||||||||||||
|
|
Level 1
|
Level 2
|
Level 3
|
Level 1
|
Level 2
|
Level 3
|
|||||||||||||||||||||||||
|
Liabilities
|
|||||||||||||||||||||||||||||||
|
Forward starting interest rate swaps
(6)
|
$
|
—
|
|
$
|
—
|
|
$
|
—
|
|
$
|
—
|
|
$
|
22
|
|
$
|
—
|
|
$
|
22
|
|
$
|
—
|
|
|||||||
|
Foreign exchange forward contracts
(1)
|
2
|
|
—
|
|
2
|
|
—
|
|
21
|
|
—
|
|
21
|
|
—
|
|
|||||||||||||||
|
Commodity derivative contracts
(2)
|
4
|
|
3
|
|
1
|
|
—
|
|
1
|
|
1
|
|
—
|
|
—
|
|
|||||||||||||||
|
Deferred compensation obligation
(4)
|
108
|
|
108
|
|
—
|
|
—
|
|
112
|
|
112
|
|
—
|
|
—
|
|
|||||||||||||||
|
Total liabilities at fair value
|
$
|
114
|
|
$
|
111
|
|
$
|
3
|
|
$
|
—
|
|
$
|
156
|
|
$
|
113
|
|
$
|
43
|
|
$
|
—
|
|
|||||||
___________________________________
|
(1)
|
Based on observable market transactions of spot currency rates and forward rates.
|
|
(2)
|
Based on quoted futures exchanges and on observable prices of futures and options transactions in the marketplace.
|
|
(3)
|
Based on LIBOR and equity index swap rates.
|
|
(4)
|
Based on the fair value of the participants’ investments.
|
71
|
(5)
|
Primarily represents investments in equity securities that are not readily marketable and are accounted for under the fair value option. The investments were funded by Acre. See Note 14 for additional information. Fair value is based on analyzing recent transactions and transactions of comparable companies, and the discounted cash flow method. In addition, allocation methods, including the option pricing method, are used in distributing fair value among various equity holders according to rights and preferences. Changes in the fair value of investments were not material in 2018 or 2017.
|
|
(6)
|
Based on LIBOR swap rates.
|
The following table summarizes the changes in fair value of Level 3 investments for the years ended
July 29, 2018
, and
July 30, 2017
:
|
|
2018
|
2017
|
||||||
|
Fair value at beginning of year
|
$
|
49
|
|
$
|
25
|
|
||
|
Gains
|
9
|
|
2
|
|
||||
|
Purchases
|
19
|
|
22
|
|
||||
|
Fair value at end of year
|
$
|
77
|
|
$
|
49
|
|
||
Items Measured at Fair Value on a Nonrecurring Basis
In addition to assets and liabilities that are measured at fair value on a recurring basis, we are also required to measure certain items at fair value on a nonrecurring basis.
We recognized impairment charges on goodwill, trademarks and plant assets in connection with interim and annual assessments of intangible assets. See also Note 5 for additional information on the impairment charges.
In the fourth quarter of 2017, we recognized
$12
of charges, primarily asset impairment, on plant assets associated with the 2015 restructuring initiatives described in Note 7. The carrying value was reduced to estimated fair value based on expected proceeds. The carrying value was not material.
Fair value was determined based on unobservable Level 3 inputs. The fair value of plant assets was determined based on cash flows associated with the asset group that include significant management assumptions, including expected proceeds. The fair value of trademarks was determined based on discounted cash flow analyses that include significant management assumptions such as revenue growth rates, weighted average cost of capital and assumed royalty rates. The fair value of goodwill was determined based on discounted cash flow analyses that include significant management assumptions such as revenue growth rates, operating margins, weighted average cost of capital, and future economic and market conditions.
The following table presents fair value measurements:
|
Impairment Charges
|
Fair Value
|
|||||||||||||||||||||||
|
July 29, 2018
|
Plant Assets
|
Trademark
|
Goodwill
|
Plant Assets
|
Trademark
|
Goodwill
|
||||||||||||||||||
|
Plum
|
$
|
54
|
|
$
|
61
|
|
||||||||||||||||||
|
April 29, 2018
|
||||||||||||||||||||||||
|
Deli
|
$
|
11
|
|
$
|
13
|
|
$
|
81
|
|
$
|
53
|
|
$
|
23
|
|
$
|
—
|
|
||||||
|
Bolthouse Farms refrigerated beverages and salad dressings
|
$
|
130
|
|
$
|
384
|
|
$
|
150
|
|
$
|
—
|
|
||||||||||||
|
January 28, 2018
|
||||||||||||||||||||||||
|
Bolthouse Farms carrot and carrot ingredients
|
$
|
75
|
|
$
|
—
|
|
||||||||||||||||||
|
January 29, 2017
|
||||||||||||||||||||||||
|
Bolthouse Farms carrot and carrot ingredients
|
$
|
20
|
|
$
|
127
|
|
$
|
48
|
|
$
|
75
|
|
||||||||||||
|
Garden Fresh Gourmet
|
$
|
1
|
|
$
|
64
|
|
$
|
37
|
|
$
|
52
|
|
||||||||||||
|
July 31, 2016
|
||||||||||||||||||||||||
|
Bolthouse Farms carrot and carrot ingredients
|
$
|
35
|
|
$
|
106
|
|
$
|
68
|
|
$
|
202
|
|
||||||||||||
72
Fair Value of Financial Instruments
The carrying values of cash and cash equivalents, accounts receivable, accounts payable and short-term borrowings, excluding the current portion of long-term debt, approximate fair value.
Cash equivalents of
$14
at
July 29, 2018
, and
$8
at
July 30, 2017
, represent fair value as these highly liquid investments have an original maturity of three months or less. Fair value of cash equivalents is based on Level 2 inputs.
The fair value of long-term debt, including the current portion of long-term debt in Short-term borrowings, was
$8,347
at
July 29, 2018
, and
$2,582
at
July 30, 2017
. The carrying value was
$8,595
at
July 29, 2018
, and
$2,499
at
July 30, 2017
. The fair value of long-term debt is principally estimated using Level 2 inputs based on quoted market prices or pricing models using current market rates.
|
16.
|
Shareholders' Equity
|
We have authorized
560 million
shares of Capital stock with
$.0375
par value and
40 million
shares of Preferred stock, issuable in one or more classes, with or without par as may be authorized by the Board of Directors. No Preferred stock has been issued.
Share Repurchase Programs
In March 2017, the Board authorized a share repurchase program to purchase up to
$1,500
. The program has no expiration date, but it may be suspended or discontinued at any time. In addition to this publicly announced program, we have a separate Board authorization to purchase shares to offset the impact of dilution from shares issued under our stock compensation plans. We suspended our share repurchases as of the second quarter of 2018.
In 2018, we repurchased
2 million
shares at a cost of
$86
. Of this amount,
$75
was used to repurchase shares pursuant to our March 2017 publicly announced share repurchase program. Approximately
$1,296
remained available under the March 2017 program as of
July 29, 2018
. In 2017, we repurchased
8 million
shares at a cost of
$437
, and in 2016, we repurchased
3 million
shares at a cost of
$143
.
|
17.
|
Stock-based Compensation
|
In 2003, shareholders approved the 2003 Long-Term Incentive Plan, which authorized the issuance of an aggregate of
31.2 million
shares to satisfy awards of stock options, stock appreciation rights, unrestricted stock, restricted stock/units (including performance restricted stock) and performance units. In 2005, shareholders approved the 2005 Long-Term Incentive Plan, which authorized the issuance of an additional
6 million
shares to satisfy the same types of awards. In 2008, shareholders approved an amendment to the 2005 Long-Term Incentive Plan to increase the number of authorized shares to
10.5 million
and in 2010, shareholders approved another amendment to the 2005 Long-Term Incentive Plan to increase the number of authorized shares to
17.5 million
. In 2015, shareholders approved the 2015 Long-Term Incentive Plan, which authorized the issuance of
13 million
shares. Approximately
6 million
of these shares were shares that were currently available under the 2005 plan and were incorporated into the 2015 Plan upon approval by shareholders.
Awards under Long-Term Incentive Plans may be granted to employees and directors. Pursuant to the Long-Term Incentive Plan, we adopted a long-term incentive compensation program which provides for grants of total shareholder return (TSR) performance restricted stock/units, EPS performance restricted stock/units, strategic performance restricted stock/units, time-lapse restricted stock/units, special performance restricted stock/units and unrestricted stock. Under the program, awards of TSR performance restricted stock/units will be earned by comparing our total shareholder return during a
three
-year period to the respective total shareholder returns of companies in a performance peer group. Based upon our ranking in the performance peer group, a recipient of TSR performance restricted stock/units may earn a total award ranging from
0%
to
200%
of the initial grant. Awards of EPS performance restricted stock/units will be earned based upon our achievement of annual earnings per share goals. During the
three
-year vesting period, a recipient of EPS performance restricted stock/units may earn a total award of either
0%
or
100%
of the initial grant. Awards of the strategic performance restricted stock units were earned based upon the achievement of two key metrics, net sales and EPS growth, compared to strategic plan objectives during a
three
-year period. A recipient of strategic performance restricted stock units earned a total award ranging from
0%
to
200%
of the initial grant. Awards of time-lapse restricted stock/units will vest ratably over the
three
-year period. In addition, we may issue special grants of restricted stock/units to attract and retain executives which vest over various periods. Awards are generally granted annually in October.
Annual stock option grants were granted in 2018, 2017, and 2016, and were not part of the long-term incentive compensation program for 2015. Stock options are granted on a selective basis under the Long-Term Incentive Plans. The term of a stock option granted under these plans may not exceed
ten
years from the date of grant. Options granted in 2018, 2017, and 2016 under these plans vest ratably over a
three
-year period. The option price may not be less than the fair market value of a share of common stock on the date of the grant.
73
In 2018, we issued stock options, time-lapse restricted stock units, unrestricted stock, EPS performance restricted stock units and TSR performance restricted stock units. We did not issue strategic performance restricted stock units or special performance restricted units in 2018.
Total pre-tax stock-based compensation expense and tax-related benefits recognized in the Consolidated Statements of Earnings were as follows:
|
|
2018
|
2017
|
2016
|
||||||||
|
Total pre-tax stock-based compensation expense
|
$
|
61
|
|
$
|
60
|
|
$
|
64
|
|
||
|
Tax-related benefits
|
$
|
11
|
|
$
|
22
|
|
$
|
24
|
|
||
The following table summarizes stock option activity as of
July 29, 2018
:
|
Options
|
Weighted-
Average
Exercise
Price
|
Weighted-
Average
Remaining
Contractual
Life
|
Aggregate
Intrinsic
Value
|
|||||||||
|
(Options in
thousands)
|
|
(In years)
|
|
|||||||||
|
Outstanding at July 30, 2017
|
1,042
|
|
$
|
52.08
|
|
|||||||
|
Granted
|
575
|
|
$
|
47.19
|
|
|||||||
|
Exercised
|
—
|
|
$
|
—
|
|
|||||||
|
Terminated
|
(80
|
)
|
$
|
50.05
|
|
|||||||
|
Outstanding at July 29, 2018
|
1,537
|
|
$
|
50.36
|
|
8.2
|
$
|
—
|
|
|||
|
Exercisable at July 29, 2018
|
519
|
|
$
|
51.40
|
|
7.5
|
$
|
—
|
|
|||
The total intrinsic value of options exercised during 2017 was not material. During 2016, the total intrinsic value of options exercised was
$2
. We measure the fair value of stock options using the Black-Scholes option pricing model. The expected term of options granted was based on the weighted average time of vesting and the end of the contractual term. We utilized this simplified method as we do not have sufficient historical exercise data to provide a reasonable basis upon which to estimate the expected term.
The assumptions and grant-date fair values for grants in 2018 and 2017 were as follows:
|
|
2018
|
2017
|
2016
|
||
|
Risk-free interest rate
|
2.06%
|
1.28%
|
1.68%
|
||
|
Expected dividend yield
|
2.95%
|
2.26%
|
2.46%
|
||
|
Expected volatility
|
19.60%
|
18.64%
|
18.35%
|
||
|
Expected term
|
6 years
|
6 years
|
6 years
|
||
|
Grant-date fair value
|
$6.67
|
$7.51
|
$6.86
|
||
We expense stock options on a straight-line basis over the vesting period, except for awards issued to retirement eligible participants, which we expense on an accelerated basis. As of
July 29, 2018
, total remaining unearned compensation related to nonvested stock options was
$1
, which will be amortized over the weighted-average remaining service period of
1.3 years
.
The following table summarizes time-lapse restricted stock units and EPS performance restricted stock units as of
July 29, 2018
:
|
Units
|
Weighted-
Average
Grant-Date
Fair Value
|
|||||
|
|
(Restricted stock
units in thousands)
|
|
||||
|
Nonvested at July 30, 2017
|
1,221
|
|
$
|
50.86
|
|
|
|
Granted
|
1,220
|
|
$
|
44.18
|
|
|
|
Vested
|
(643
|
)
|
$
|
48.67
|
|
|
|
Forfeited
|
(146
|
)
|
$
|
48.27
|
|
|
|
Nonvested at July 29, 2018
|
1,652
|
|
$
|
47.01
|
|
|
74
We determine the fair value of time-lapse restricted stock units, EPS performance restricted stock units, strategic performance restricted stock units and special performance restricted stock units based on the quoted price of our stock at the date of grant. We expense time-lapse restricted stock units on a straight-line basis over the vesting period, except for awards issued to retirement-eligible participants, which we expense on an accelerated basis. We expense EPS performance restricted stock units on a graded-vesting basis, except for awards issued to retirement-eligible participants, which we expense on an accelerated basis. There were
142 thousand
EPS performance target grants outstanding at
July 29, 2018
, with a weighted-average grant-date fair value of
$49.60
. The actual number of EPS performance restricted stock units and strategic performance restricted stock units that vest will depend on actual performance achieved. We estimate expense based on the number of awards expected to vest. In the first quarter of 2017, recipients of strategic performance restricted stock units earned
35%
of the initial grants based on actual performance achieved during a three-year period ended July 31, 2016. There were no strategic performance restricted stock units outstanding at July 29, 2018.
In 2015, we issued special performance restricted stock units for which vesting was contingent upon meeting various financial goals and performance milestones to support innovation and growth initiatives. These awards vested in the first quarter of 2017. Recipients of special performance restricted stock units earned
0%
of the initial grants based upon financial goals and
100%
of the initial grants based upon performance milestones to support innovation and growth initiatives.
As of
July 29, 2018
, total remaining unearned compensation related to nonvested time-lapse restricted stock units and EPS performance restricted stock units was
$37
, which will be amortized over the weighted-average remaining service period of
1.7 years
. The fair value of restricted stock units vested during 2018, 2017 and 2016 was
$30
,
$55
and
$44
, respectively. The weighted-average grant-date fair value of the restricted stock units granted during 2017 and 2016 was
$54.79
and
$50.44
, respectively.
The following table summarizes TSR performance restricted stock units as of
July 29, 2018
:
|
Units
|
Weighted-
Average
Grant-Date
Fair Value
|
|||||
|
|
(Restricted stock
units in thousands)
|
|
||||
|
Nonvested at July 30, 2017
|
1,774
|
|
$
|
48.24
|
|
|
|
Granted
|
943
|
|
$
|
39.39
|
|
|
|
Vested
|
(815
|
)
|
$
|
43.39
|
|
|
|
Forfeited
|
(238
|
)
|
$
|
43.53
|
|
|
|
Nonvested at July 29, 2018
|
1,664
|
|
$
|
46.66
|
|
|
We estimated the fair value of TSR performance restricted stock units at the grant date using a Monte Carlo simulation. Assumptions used in the Monte Carlo simulation were as follows:
|
|
2018
|
2017
|
2016
|
||
|
Risk-free interest rate
|
1.58%
|
0.85%
|
0.92%
|
||
|
Expected dividend yield
|
2.95%
|
2.26%
|
2.46%
|
||
|
Expected volatility
|
19.07%
|
17.78%
|
17.25%
|
||
|
Expected term
|
3 years
|
3 years
|
3 years
|
||
We recognize compensation expense on a straight-line basis over the service period. As of
July 29, 2018
, total remaining unearned compensation related to TSR performance restricted stock units was
$23
, which will be amortized over the weighted-average remaining service period of
1.8
years. In the first quarter of 2018, recipients of TSR performance restricted stock units earned
125%
of the initial grants based upon our TSR ranking in a performance peer group during a three-year period ended July 28, 2017. As a result, approximately
160 thousand
additional shares were awarded. In the first quarter of 2017, recipients of TSR performance restricted stock units earned
75%
of the initial grants based upon our TSR ranking in a performance peer group during a three-year period ended July 29, 2016. In the first quarter of 2016, recipients of TSR performance restricted stock units earned
100%
of the initial grants based upon our TSR ranking in a performance peer group during a three-year period ended July 31, 2015. The fair value of TSR performance restricted stock units vested during 2018, 2017, and 2016 was
$38
,
$14
, and
$22
, respectively. The grant-date fair value of the TSR performance restricted stock units granted during 2017 and 2016 was
$39.53
and
$62.44
, respectively. In the first quarter of 2019, recipients of TSR performance restricted stock units will receive a
0%
payout based upon our TSR ranking in a performance peer group during a three-year period ended July 27, 2018.
The excess tax deficiencies of
$3
in 2018, and the excess tax benefits of
$6
in 2017 and
$7
in 2016, on the exercise of stock options and vested restricted stock were presented as cash flows from operating activities. Cash received from the exercise of
75
stock options was
$2
for 2017 and 2016, and are reflected in cash flows from financing activities in the Consolidated Statements of Cash Flows.
|
18.
|
Commitments and Contingencies
|
Regulatory and Litigation Matters
We are involved in various pending or threatened legal or regulatory proceedings, including purported class actions, arising from the conduct of business both in the ordinary course and otherwise. Modern pleading practice in the U.S. permits considerable variation in the assertion of monetary damages or other relief. Jurisdictions may permit claimants not to specify the monetary damages sought or may permit claimants to state only that the amount sought is sufficient to invoke the jurisdiction of the trial court. In addition, jurisdictions may permit plaintiffs to allege monetary damages in amounts well exceeding reasonably possible verdicts in the jurisdiction for similar matters. This variability in pleadings, together with our actual experiences in litigating or resolving through settlement numerous claims over an extended period of time, demonstrates to us that the monetary relief which may be specified in a lawsuit or claim bears little relevance to its merits or disposition value.
Due to the unpredictable nature of litigation, the outcome of a litigation matter and the amount or range of potential loss at particular points in time is normally difficult to ascertain. Uncertainties can include how fact finders will evaluate documentary evidence and the credibility and effectiveness of witness testimony, and how trial and appellate courts will apply the law in the context of the pleadings or evidence presented, whether by motion practice, or at trial or on appeal. Disposition valuations are also subject to the uncertainty of how opposing parties and their counsel will themselves view the relevant evidence and applicable law.
We establish liabilities for litigation and regulatory loss contingencies when information related to the loss contingencies shows both that it is probable that a loss has been incurred and the amount of the loss can be reasonably estimated. It is possible that some matters could require us to pay damages or make other expenditures or establish accruals in amounts that could not be reasonably estimated as of
July 29, 2018
. While the potential future charges could be material in a particular quarter or annual period, based on information currently known by us, we do not believe any such charges are likely to have a material adverse effect on our consolidated results of operations or financial condition. In the third quarter of 2018, we recorded expense of
$22
from a settlement of a claim.
Operating Leases
We have certain operating lease commitments, primarily related to warehouse and office facilities, and certain equipment. Rent expense under operating lease commitments was
$74
in 2018,
$53
in 2017 and
$45
in 2016. Future minimum annual rental payments under these operating leases as of
July 29, 2018
, are as follows:
|
2019
|
2020
|
2021
|
2022
|
2023
|
Thereafter
|
|
$75
|
$61
|
$48
|
$39
|
$28
|
$109
|
Other Contingencies
We guarantee approximately
2,000
bank loans made to Pepperidge Farm independent contractor distributors by third-party financial institutions for the purchase of distribution routes. The maximum potential amount of future payments under existing guarantees we could be required to make is
$210
. Our guarantees are indirectly secured by the distribution routes. We do not expect that we will be required to make material guarantee payments as a result of defaults on the bank loans guaranteed. The amounts recognized as of
July 29, 2018
, and
July 30, 2017
, were not material.
With the acquisition of Snyder's-Lance, we guarantee approximately
2,400
bank loans made to independent business owners by third-party financial institutions for the purchase of distribution routes. The outstanding aggregate balance on these loans was
$187
as of
July 29, 2018
. Our guarantees are indirectly secured by the distribution routes. We do not expect that we will be required to make material guarantee payments as a result of defaults on the bank loans guaranteed.
We have provided certain standard indemnifications in connection with divestitures, contracts and other transactions. Certain indemnifications have finite expiration dates. Liabilities recognized based on known exposures related to such matters were not material at
July 29, 2018
, and
July 30, 2017
.
76
|
19.
|
Supplemental Financial Statement Data
|
Balance Sheets
|
2018
|
2017
|
||||||
|
Accounts receivable
|
|||||||
|
Customer accounts receivable
|
$
|
734
|
|
$
|
561
|
|
|
|
Allowances
|
(20
|
)
|
(11
|
)
|
|||
|
Subtotal
|
$
|
714
|
|
$
|
550
|
|
|
|
Other
|
71
|
|
55
|
|
|||
|
$
|
785
|
|
$
|
605
|
|
||
|
Inventories
|
|||||||
|
Raw materials, containers and supplies
|
$
|
478
|
|
$
|
377
|
|
|
|
Finished products
|
721
|
|
525
|
|
|||
|
$
|
1,199
|
|
$
|
902
|
|
||
|
Other current assets
|
|||||||
|
Fair value of derivatives
|
$
|
10
|
|
$
|
9
|
|
|
|
Other
|
76
|
|
65
|
|
|||
|
$
|
86
|
|
$
|
74
|
|
||
|
Plant assets
|
|||||||
|
Land
|
$
|
122
|
|
$
|
64
|
|
|
|
Buildings
|
1,870
|
|
1,557
|
|
|||
|
Machinery and equipment
|
4,751
|
|
4,243
|
|
|||
|
Projects in progress
|
211
|
|
179
|
|
|||
|
Total cost
|
$
|
6,954
|
|
$
|
6,043
|
|
|
|
Accumulated depreciation
(1)
|
(3,721
|
)
|
(3,589
|
)
|
|||
|
$
|
3,233
|
|
$
|
2,454
|
|
||
|
Other assets
|
|||||||
|
Investments
|
$
|
92
|
|
$
|
69
|
|
|
|
Deferred taxes
|
30
|
|
36
|
|
|||
|
Pensions
|
61
|
|
8
|
|
|||
|
Other
|
41
|
|
26
|
|
|||
|
$
|
224
|
|
$
|
139
|
|
||
77
|
2018
|
2017
|
||||||
|
Accrued liabilities
|
|||||||
|
Accrued compensation and benefits
|
$
|
220
|
|
$
|
241
|
|
|
|
Fair value of derivatives
|
5
|
|
43
|
|
|||
|
Accrued trade and consumer promotion programs
|
189
|
|
131
|
|
|||
|
Accrued interest
|
103
|
|
34
|
|
|||
|
Restructuring
|
22
|
|
24
|
|
|||
|
Other
|
137
|
|
88
|
|
|||
|
$
|
676
|
|
$
|
561
|
|
||
|
Other liabilities
|
|||||||
|
Pension benefits
|
$
|
150
|
|
$
|
261
|
|
|
|
Deferred compensation
|
90
|
|
96
|
|
|||
|
Postretirement benefits
|
206
|
|
247
|
|
|||
|
Transition tax on unremitted foreign earnings
|
7
|
|
—
|
|
|||
|
Unrecognized tax benefits
|
22
|
|
34
|
|
|||
|
Restructuring
|
24
|
|
2
|
|
|||
|
Other
|
70
|
|
57
|
|
|||
|
$
|
569
|
|
$
|
697
|
|
||
|
(1)
|
Depreciation expense was
$360
in
2018
,
$299
in
2017
and
$288
in
2016
. Buildings are depreciated over periods ranging from
7
to
45
years. Machinery and equipment are depreciated over periods generally ranging from
2
to
20
years.
|
Statements of Earnings
____________________________________
|
2018
|
2017
|
2016
|
|||||||||
|
Other expenses / (income)
|
|||||||||||
|
Amortization of intangible assets
|
$
|
34
|
|
$
|
19
|
|
$
|
20
|
|
||
|
Impairment of intangible assets
(1)
|
737
|
|
212
|
|
141
|
|
|||||
|
Net periodic benefit expense (income) other than the service cost
|
(231
|
)
|
(247
|
)
|
274
|
|
|||||
|
Investment (gains) / losses
|
10
|
|
9
|
|
(3
|
)
|
|||||
|
Transaction costs
(2)
|
53
|
|
—
|
|
—
|
|
|||||
|
Legal settlements
(3)
|
22
|
|
—
|
|
(25
|
)
|
|||||
|
Other
|
(6
|
)
|
(2
|
)
|
(2
|
)
|
|||||
|
$
|
619
|
|
$
|
(9
|
)
|
$
|
405
|
|
|||
|
Advertising and consumer promotion expense
(4)
|
$
|
394
|
|
$
|
389
|
|
$
|
397
|
|
||
|
Interest expense
|
|||||||||||
|
Interest expense
|
$
|
204
|
|
$
|
114
|
|
$
|
118
|
|
||
|
Less: Interest capitalized
|
3
|
|
2
|
|
3
|
|
|||||
|
$
|
201
|
|
$
|
112
|
|
$
|
115
|
|
|||
|
(1)
|
See Note 5 for additional information.
|
|
(2)
|
In 2018, we recognized transaction costs of
$53
related to the acquisition of Snyder's-Lance. See Note 3 for additional information.
|
|
(3)
|
In 2018, we recognized a charge of
$22
related to the settlement of a legal claim. In 2016, we recorded a gain of
$25
from a settlement of a claim related to the Kelsen acquisition.
|
|
(4)
|
Included in Marketing and selling expenses.
|
78
Statements of Cash Flows
|
2018
|
2017
|
2016
|
|||||||||
|
Cash Flows from Operating Activities
|
|||||||||||
|
Other
|
|||||||||||
|
Benefit related payments
|
$
|
(59
|
)
|
$
|
(58
|
)
|
$
|
(57
|
)
|
||
|
Other
|
(1
|
)
|
—
|
|
(3
|
)
|
|||||
|
$
|
(60
|
)
|
$
|
(58
|
)
|
$
|
(60
|
)
|
|||
|
Other Cash Flow Information
|
|||||||||||
|
Interest paid
|
$
|
152
|
|
$
|
110
|
|
$
|
113
|
|
||
|
Interest received
|
$
|
4
|
|
$
|
5
|
|
$
|
4
|
|
||
|
Income taxes paid
|
$
|
128
|
|
$
|
320
|
|
$
|
325
|
|
||
|
20.
|
Quarterly Data (unaudited)
|
|
|
2018
|
||||||||||||||
|
|
First
|
Second
|
Third
|
Fourth
|
|||||||||||
|
Net sales
|
$
|
2,161
|
|
$
|
2,180
|
|
$
|
2,125
|
|
$
|
2,219
|
|
|||
|
Gross profit
|
783
|
|
766
|
|
618
|
|
649
|
|
|||||||
|
Net earnings (loss) attributable to Campbell Soup Company
|
275
|
|
285
|
|
(393
|
)
|
94
|
|
|||||||
|
Per share - basic
|
|||||||||||||||
|
Net earnings (loss) attributable to Campbell Soup Company
|
.91
|
|
.95
|
|
(1.31
|
)
|
.31
|
|
|||||||
|
Dividends
|
.35
|
|
.35
|
|
.35
|
|
.35
|
|
|||||||
|
Per share - assuming dilution
|
|||||||||||||||
|
Net earnings attributable to Campbell Soup Company
|
.91
|
|
.95
|
|
(1.31
|
)
|
.31
|
|
|||||||
|
Market price
|
|||||||||||||||
|
High
|
$
|
54.37
|
|
$
|
51.07
|
|
$
|
48.10
|
|
$
|
42.88
|
|
|||
|
Low
|
$
|
45.00
|
|
$
|
45.07
|
|
$
|
39.79
|
|
$
|
32.63
|
|
|||
|
2018
|
|||||||||||||||
|
First
|
Second
|
Third
|
Fourth
|
||||||||||||
|
In 2018, the following charges (gains) were recorded in Net earnings attributable to Campbell Soup Company:
|
|||||||||||||||
|
Impairment charges
|
$
|
—
|
|
$
|
74
|
|
$
|
497
|
|
$
|
41
|
|
|||
|
Restructuring charges, implementation costs and other related costs
|
12
|
|
46
|
|
45
|
|
33
|
|
|||||||
|
Pension and postretirement benefit mark-to-market and curtailment adjustments
|
(9
|
)
|
—
|
|
—
|
|
(93
|
)
|
|||||||
|
Transaction and integration costs
|
—
|
|
19
|
|
46
|
|
8
|
|
|||||||
|
Claim settlement
|
—
|
|
—
|
|
15
|
|
—
|
|
|||||||
|
Tax reform
|
—
|
|
(124
|
)
|
—
|
|
(6
|
)
|
|||||||
|
Per share - assuming dilution
|
|||||||||||||||
|
Impairment charges
|
—
|
|
.25
|
|
1.65
|
|
.14
|
|
|||||||
|
Restructuring charges, implementation costs and other related costs
|
.04
|
|
.15
|
|
.15
|
|
.11
|
|
|||||||
|
Pension and postretirement benefit mark-to-market and curtailment adjustments
|
(.03
|
)
|
—
|
|
—
|
|
(.31
|
)
|
|||||||
|
Transaction and integration costs
|
—
|
|
.06
|
|
.15
|
|
.03
|
|
|||||||
|
Claim settlement
|
—
|
|
—
|
|
.05
|
|
—
|
|
|||||||
|
Tax reform
|
—
|
|
(.41
|
)
|
—
|
|
(.02
|
)
|
|||||||
79
|
|
2017
|
||||||||||||||
|
|
First
|
Second
|
Third
|
Fourth
|
|||||||||||
|
Net sales
|
$
|
2,202
|
|
$
|
2,171
|
|
$
|
1,853
|
|
$
|
1,664
|
|
|||
|
Gross profit
|
851
|
|
811
|
|
665
|
|
598
|
|
|||||||
|
Net earnings attributable to Campbell Soup Company
|
292
|
|
101
|
|
176
|
|
318
|
|
|||||||
|
Per share - basic
|
|||||||||||||||
|
Net earnings attributable to Campbell Soup Company
|
.95
|
|
.33
|
|
.58
|
|
1.05
|
|
|||||||
|
Dividends
|
.35
|
|
.35
|
|
.35
|
|
.35
|
|
|||||||
|
Per share - assuming dilution
|
|||||||||||||||
|
Net earnings attributable to Campbell Soup Company
|
.94
|
|
.33
|
|
.58
|
|
1.04
|
|
|||||||
|
Market price
|
|||||||||||||||
|
High
|
$
|
62.30
|
|
$
|
63.50
|
|
$
|
64.23
|
|
$
|
59.14
|
|
|||
|
Low
|
$
|
52.74
|
|
$
|
52.59
|
|
$
|
56.05
|
|
$
|
50.62
|
|
|||
|
2017
|
|||||||||||||||
|
First
|
Second
|
Third
|
Fourth
|
||||||||||||
|
In 2017, the following charges (gains) were recorded in Net earnings attributable to Campbell Soup Company:
|
|||||||||||||||
|
Impairment charges
|
$
|
—
|
|
$
|
180
|
|
$
|
—
|
|
$
|
—
|
|
|||
|
Restructuring charges, implementation costs and other related costs
|
6
|
|
—
|
|
4
|
|
26
|
|
|||||||
|
Pension and postretirement benefit mark-to-market adjustments
|
13
|
|
—
|
|
—
|
|
(129
|
)
|
|||||||
|
Sale of notes
|
—
|
|
—
|
|
—
|
|
(56
|
)
|
|||||||
|
Per share - assuming dilution
|
|||||||||||||||
|
Impairment charges
|
—
|
|
.58
|
|
—
|
|
—
|
|
|||||||
|
Restructuring charges, implementation costs and other related costs
|
.02
|
|
—
|
|
.01
|
|
.09
|
|
|||||||
|
Pension and postretirement benefit mark-to-market adjustments
|
.04
|
|
—
|
|
—
|
|
(.42
|
)
|
|||||||
|
Sale of notes
|
—
|
|
—
|
|
—
|
|
(.18
|
)
|
|||||||
80
Management’s Report on Internal Control Over Financial Reporting
The management of Campbell Soup Company (the Company) is responsible for establishing and maintaining adequate internal control over financial reporting (as such term is defined in Rule 13a-15(e) under the Securities Exchange Act of 1934, as amended). Internal control over financial reporting is a process designed to provide reasonable assurance regarding the reliability of financial reporting and the preparation of financial statements for external purposes in accordance with generally accepted accounting principles in the United States of America.
The Company's internal control over financial reporting includes those policies and procedures that:
|
•
|
pertain to the maintenance of records that, in reasonable detail, accurately and fairly reflect the transactions and dispositions of the assets of the Company;
|
|
•
|
provide reasonable assurance that transactions are recorded as necessary to permit preparation of financial statements in accordance with generally accepted accounting principles, and that receipts and expenditures of the Company are being made only in accordance with authorizations of management and Directors of the Company; and
|
|
•
|
provide reasonable assurance regarding prevention or timely detection of unauthorized acquisition, use, or disposition of the Company's assets that could have a material effect on the financial statements.
|
Because of its inherent limitations, any system of internal control over financial reporting, no matter how well defined, may not prevent or detect misstatements. Also, projections of any evaluation of effectiveness to future periods are subject to the risk that controls may become inadequate because of changes in conditions, or that the degree of compliance with the policies or procedures may deteriorate.
Under guidelines established by the Securities and Exchange Commission, the Company's management has excluded Snyder's-Lance, Inc. (Snyder's-Lance) and Pacific Foods of Oregon, LLC (Pacific Foods) from its annual report on internal control over financial reporting as of July 29, 2018. Snyder's-Lance and Pacific Foods are wholly-owned subsidiaries whose total assets and net sales excluded from management's assessment represent approximately 9% and 1% of total assets, respectively, and approximately 9% and 1% of net sales, respectively, of the related consolidated financial statement amounts of the Company as of and for the year ended July 29, 2018.
Except as noted above, the Company’s management assessed the effectiveness of the Company’s internal control over financial reporting as of
July 29, 2018
. In making this assessment, management used the criteria set forth by the Committee of Sponsoring Organizations of the Treadway Commission (COSO) in
Internal Control — Integrated Framework (2013)
. Based on this assessment using those criteria, management concluded that the Company’s internal control over financial reporting was effective as of
July 29, 2018
.
The effectiveness of the Company’s internal control over financial reporting as of
July 29, 2018
has been audited by PricewaterhouseCoopers LLP, an independent registered public accounting firm, as stated in their report, which appears on the next page.
|
/s/ Keith R. McLoughlin
|
|||
|
Keith R. McLoughlin
|
|||
|
Interim President and Chief Executive Officer
|
|||
|
/s/ Anthony P. DiSilvestro
|
|||
|
Anthony P. DiSilvestro
|
|||
|
Senior Vice President and Chief Financial Officer
|
|||
|
/s/ Stanley Polomski
|
|||
|
Stanley Polomski
|
|||
|
Vice President and Controller
|
|||
|
(Principal Accounting Officer)
|
|||
September 27, 2018
81
Report of Independent Registered Public Accounting Firm
To the Board of Directors and Shareholders of Campbell Soup Company
Opinions on the Financial Statements and Internal Control over Financial Reporting
We have audited the accompanying consolidated balance sheets of Campbell Soup Company and its subsidiaries as of July 29, 2018 and July 30, 2017, and the related consolidated statements of earnings, comprehensive income, equity, and cash flows for each of the three years in the period ended July 29, 2018, including the related notes and schedule of valuation and qualifying accounts for each of the three years in the period ended July 29, 2018 appearing on page 91 (collectively referred to as the "consolidated financial statements"). We also have audited the Company's internal control over financial reporting as of July 29, 2018, based on criteria established in
Internal Control - Integrated Framework
(2013) issued by the Committee of Sponsoring Organizations of the Treadway Commission (COSO).
In our opinion, the consolidated financial statements referred to above present fairly, in all material respects, the financial position of the Company as of July 29, 2018 and July 30, 2017, and the results of their operations and their cash flows for each of the three years in the period ended July 29, 2018 in conformity with accounting principles generally accepted in the United States of America. Also in our opinion, the Company maintained, in all material respects, effective internal control over financial reporting as of July 29, 2018, based on criteria established in
Internal Control - Integrated Framework
(2013) issued by the COSO.
Basis for Opinions
The Company's management is responsible for these consolidated financial statements, for maintaining effective internal control over financial reporting, and for its assessment of the effectiveness of internal control over financial reporting, included in the accompanying Management's Report on Internal Control Over Financial Reporting. Our responsibility is to express opinions on the Company’s consolidated financial statements and on the Company's internal control over financial reporting based on our audits. We are a public accounting firm registered with the Public Company Accounting Oversight Board (United States) ("PCAOB") and are required to be independent with respect to the Company in accordance with the U.S. federal securities laws and the applicable rules and regulations of the Securities and Exchange Commission and the PCAOB.
We conducted our audits in accordance with the standards of the PCAOB. Those standards require that we plan and perform the audits to obtain reasonable assurance about whether the consolidated financial statements are free of material misstatement, whether due to error or fraud, and whether effective internal control over financial reporting was maintained in all material respects.
Our audits of the consolidated financial statements included performing procedures to assess the risks of material misstatement of the consolidated financial statements, whether due to error or fraud, and performing procedures that respond to those risks. Such procedures included examining, on a test basis, evidence regarding the amounts and disclosures in the consolidated financial statements. Our audits also included evaluating the accounting principles used and significant estimates made by management, as well as evaluating the overall presentation of the consolidated financial statements. Our audit of internal control over financial reporting included obtaining an understanding of internal control over financial reporting, assessing the risk that a material weakness exists, and testing and evaluating the design and operating effectiveness of internal control based on the assessed risk. Our audits also included performing such other procedures as we considered necessary in the circumstances. We believe that our audits provide a reasonable basis for our opinions.
As described in Management’s Report on Internal Control Over Financial Reporting, management has excluded Snyder’s-Lance, Inc. and Pacific Foods of Oregon, LLC from its assessment of internal control over financial reporting as of July 29, 2018 because they were acquired by the Company in purchase business combinations during the fiscal year ended July 29, 2018. We have also excluded Snyder’s-Lance, Inc. and Pacific Foods of Oregon, LLC from our audit of internal control over financial reporting. Snyder’s-Lance, Inc. and Pacific Foods of Oregon, LLC are wholly-owned subsidiaries whose total assets and total net sales excluded from management’s assessment and our audit of internal control over financial reporting represent approximately 9% and 1% of total assets, respectively, and 9% and 1% of total net sales, respectively, of the related consolidated financial statement amounts as of and for the year ended July 29, 2018.
Definition and Limitations of Internal Control over Financial Reporting
A company’s internal control over financial reporting is a process designed to provide reasonable assurance regarding the reliability of financial reporting and the preparation of financial statements for external purposes in accordance with generally accepted accounting principles. A company’s internal control over financial reporting includes those policies and procedures that (i) pertain to the maintenance of records that, in reasonable detail, accurately and fairly reflect the transactions and dispositions
82
of the assets of the company; (ii) provide reasonable assurance that transactions are recorded as necessary to permit preparation of financial statements in accordance with generally accepted accounting principles, and that receipts and expenditures of the company are being made only in accordance with authorizations of management and directors of the company; and (iii) provide reasonable assurance regarding prevention or timely detection of unauthorized acquisition, use, or disposition of the company’s assets that could have a material effect on the financial statements.
Because of its inherent limitations, internal control over financial reporting may not prevent or detect misstatements. Also, projections of any evaluation of effectiveness to future periods are subject to the risk that controls may become inadequate because of changes in conditions, or that the degree of compliance with the policies or procedures may deteriorate.
|
/s/ PricewaterhouseCoopers LLP
|
|||||
|
PricewaterhouseCoopers LLP
|
|||||
|
Philadelphia, Pennsylvania
|
|||||
|
September 27, 2018
|
|||||
We have served as the Company’s auditor since 1954.
83
Item 9.
Changes in and Disagreements with Accountants on Accounting and Financial Disclosure
None.
Item 9A.
Controls and Procedures
We, under the supervision and with the participation of our management, including the Interim President and Chief Executive Officer and the Senior Vice President and Chief Financial Officer, have evaluated the effectiveness of our disclosure controls and procedures (as such term is defined in Rule 13a-15(e) under the Exchange Act) as of
July 29, 2018
(the Evaluation Date). Based on such evaluation, the Interim President and Chief Executive Officer and the Senior Vice President and Chief Financial Officer have concluded that, as of the Evaluation Date, our disclosure controls and procedures are effective.
The annual report of management on our internal control over financial reporting is provided under "Financial Statements and Supplementary Data" on page 81. The attestation report of PricewaterhouseCoopers LLP, our independent registered public accounting firm, regarding our internal control over financial reporting is provided under "Financial Statements and Supplementary Data" on pages 82-83.
There were no changes in our internal control over financial reporting that materially affected, or were likely to materially affect, such control over financial reporting during the quarter ended
July 29, 2018
.
Item 9B.
Other Information
None.
Item 10.
Directors, Executive Officers and Corporate Governance
The sections entitled "Item 1 — Election of Directors," "Voting Securities and Principal Shareholders — Ownership of Directors and Executive Officers" and "Voting Securities and Principal Shareholders — Section 16(a) Beneficial Ownership Reporting Compliance" in our Proxy Statement for the 2018 Annual Meeting of Shareholders (the
2018
Proxy) are incorporated herein by reference. The information presented in the section entitled "Corporate Governance Policies and Practices — Board Meetings and Committees — Board Committee Structure" in the
2018
Proxy relating to the members of our Audit Committee and the Audit Committee’s financial experts is incorporated herein by reference.
Certain of the information required by this Item relating to our executive officers is set forth under the heading "Executive Officers of the Company" in this Report.
We have adopted a Code of Ethics for the Chief Executive Officer and Senior Financial Officers that applies to our Interim Chief Executive Officer, Chief Financial Officer, Controller and members of the Chief Financial Officer’s financial leadership team. The Code of Ethics for the Interim Chief Executive Officer and Senior Financial Officers is posted on our website,
www.campbellsoupcompany.com
(under the "About Us — Corporate Governance" caption). We intend to satisfy the disclosure requirement regarding any amendment to, or a waiver of, a provision of the Code of Ethics for the Interim Chief Executive Officer and Senior Financial Officers by posting such information on our website.
We have also adopted a separate Code of Business Conduct and Ethics applicable to the Board of Directors, our officers and all of our employees. The Code of Business Conduct and Ethics is posted on our website,
www.campbellsoupcompany.com
(under the "About Us — Corporate Governance" caption). Our Corporate Governance Standards and the charters of our four standing committees of the Board of Directors can also be found at this website. Printed copies of the foregoing are available to any shareholder requesting a copy by:
|
•
|
writing to Investor Relations, Campbell Soup Company, 1 Campbell Place, Camden, NJ 08103-1799;
|
|
•
|
calling 1-800-840-2865; or
|
|
•
|
e-mailing our Investor Relations Department at investorrelations@campbellsoup.com.
|
Item 11.
Executive Compensation
The information presented in the sections entitled "Compensation Discussion and Analysis," "Executive Compensation Tables," "Corporate Governance Policies and Practices — Compensation of Directors," "Corporate Governance Policies and Practices — Board Meetings and Committees — Board Committee Structure — Compensation and Organization Committee Interlocks and Insider Participation" and "Compensation Discussion and Analysis — Compensation and Organization Committee Report" in the
2018
Proxy is incorporated herein by reference.
Item 12.
Security Ownership of Certain Beneficial Owners and Management and Related Shareholder Matters
The information presented in the sections entitled "Voting Securities and Principal Shareholders — Ownership of Directors and Executive Officers" and "Voting Securities and Principal Shareholders — Principal Shareholders" in the
2018
Proxy is incorporated herein by reference.
84
Securities Authorized for Issuance Under Equity Compensation Plans
The following table provides information about the stock that could have been issued under our equity compensation plans as of
July 29, 2018
:
|
Plan Category
|
Number of
Securities to be
Issued Upon
Exercise of
Outstanding
Options, Warrants and Rights (a)
|
Weighted-
Average
Exercise Price of
Outstanding
Options,
Warrants and Rights (b)
|
Number of Securities
Remaining Available
For
Future Issuance Under
Equity Compensation
Plans
(Excluding Securities
Reflected in the First Column) (c)
|
|||||||
|
Equity Compensation Plans Approved by Security Holders
(1)
|
6,517,140
|
|
$
|
50.36
|
|
7,338,357
|
|
|||
|
Equity Compensation Plans Not Approved by Security Holders
|
N/A
|
|
N/A
|
|
N/A
|
|
||||
|
Total
|
6,517,140
|
|
$
|
50.36
|
|
7,338,357
|
|
|||
____________________________________
|
(1)
|
Column (a) represents stock options and restricted stock units outstanding under the 2015 Long-Term Incentive Plan and the 2005 Long-Term Incentive Plan. Column (a) includes 3,328,622 TSR performance restricted stock units based on the maximum number of shares potentially issuable under the awards, and the number of shares, if any, to be issued pursuant to such awards will be determined based upon performance during the applicable three-year performance period. No additional awards can be made under the 2005 Long-Term Incentive Plan. Future equity awards under the 2015 Long-Term Incentive Plan may take the form of stock options, SARs, performance unit awards, restricted stock, restricted performance stock, restricted stock units, or stock awards. Column (b) represents the weighted-average exercise price of the outstanding stock options only; the outstanding restricted stock units are not included in this calculation. Column (c) represents the maximum number of future equity awards that can be made under the 2015 Long-Term Incentive Plan as of
July 29, 2018
.
|
Item 13.
Certain Relationships and Related Transactions, and Director Independence
The information presented in the section entitled "Corporate Governance Policies and Practices — Transactions with Related Persons," "Item 1 — Election of Directors," "Corporate Governance Policies and Practices — Director Independence" and "Corporate Governance Policies and Practices — Board Meetings and Committees — Board Committee Structure" in the
2018
Proxy is incorporated herein by reference.
Item 14.
Principal Accounting Fees and Services
The information presented in the sections entitled "Item 2 — Ratification of Appointment of Independent Registered Public Accounting Firm — Audit Firm Fees and Services" and "Item 2 — Ratification of Appointment of Independent Registered Public Accounting Firm — Audit Committee Pre-Approval Policy" in the
2018
Proxy is incorporated herein by reference.
|
Item 15.
|
Exhibits and Financial Statement Schedules
|
(a) The following documents are filed as part of this Report:
1. Financial Statements
Consolidated Statements of Earnings for 2018, 2017 and 2016
Consolidated Statements of Comprehensive Income for 2018, 2017 and 2016
Consolidated Balance Sheets as of July 29, 2018 and July 30, 2017
Consolidated Statements of Cash Flows for 2018, 2017 and 2016
Consolidated Statements of Equity for 2018, 2017 and 2016
Notes to Consolidated Financial Statements
Management's Report on Internal Control Over Financial Reporting
Report of Independent Registered Public Accounting Firm
2. Financial Statement Schedule
II - Valuation and Qualifying Accounts for 2018, 2017 and 2016
85
3. Exhibits
Reference is made to Item 15(b) below.
(b)
Exhibits
. The Exhibit Index, which immediately precedes the signature page, is incorporated by reference into this Report.
(c)
Financial Statement Schedules
. Reference is made to Item 15(a)(2) above.
Item 16.
Form 10-K Summary
None.
86
INDEX TO EXHIBITS
|
3(a)
|
|
|
3(b)
|
|
|
4(a)
|
|
|
4(b)
|
|
|
4(c)
|
|
|
4(d)
|
|
|
4(e)
|
|
|
4(f)
|
|
|
4(g)
|
|
|
4(h)
|
|
|
4(i)
|
|
|
4(j)
|
|
|
4(k)
|
|
|
4(l)
|
|
|
4(m)
|
|
|
4(n)
|
|
|
4(o)
|
|
|
9
|
Major Stockholders’ Voting Trust Agreement dated June 2, 1990, as amended, is incorporated by reference to (i) Exhibit 99.C to Campbell’s Schedule 13E-4 (SEC file number 5-7735) filed on September 12, 1996
, (ii)
Exhibit 99.G to Amendment No. 7 to Schedule 13D (SEC file number 5-7735) dated March 3, 2000
, (iii)
Exhibit 99.M to Amendment No. 8 to Schedule 13D (SEC file number 5-7735) dated January 26, 2001
, (iv)
Exhibit 99.P to Amendment No. 9 to Schedule 13D (SEC file number 5-7735) dated September 30, 2002
, and (v)
Exhibits 9(b)
,
9(c)
,
9(d)
and
9(e)
to Campbell's Form 10-K (SEC file number 1-3822) for the fiscal year ended August 3, 2014, each as filed with the SEC.
|
|
10(a)+
|
|
87
|
10(b)+
|
|
|
10(c)+
|
|
|
10(d)+
|
|
|
10(e)+
|
|
|
10(f)+
|
|
|
10(g)+
|
|
|
10(h)+
|
|
|
10(i)+
|
|
|
10(j)+
|
|
|
10(k)+
|
|
|
10(l)+
|
|
|
10(m)+
|
|
|
10(n)+
|
|
|
10(o)+
|
|
|
10(p)+
|
|
|
10(q)+
|
|
|
10(r)+
|
|
|
10(s)+
|
|
|
10(t)+
|
|
|
10(u)+
|
|
|
10(v)+
|
|
88
|
10(w)+
|
|
|
10(x)+
|
|
|
10(y)+
|
|
|
10(z)+
|
|
|
10(aa)+
|
|
|
10(bb)
|
|
|
10(cc)
|
|
|
10(dd)
|
|
|
21
|
|
|
23
|
|
|
31(a)
|
|
|
31(b)
|
|
|
32(a)
|
|
|
32(b)
|
|
|
101.INS
|
XBRL Instance Document
|
|
101.SCH
|
XBRL Schema Document
|
|
101.CAL
|
XBRL Calculation Linkbase Document
|
|
101.DEF
|
XBRL Definition Linkbase Document
|
|
101.LAB
|
XBRL Label Linkbase Document
|
|
101.PRE
|
XBRL Presentation Linkbase Document
|
+This exhibit is a management contract or compensatory plan or arrangement.
89
SIGNATURES
Pursuant to the requirements of Section 13 or 15(d) of the Securities Exchange Act of 1934, as amended, Campbell has duly caused this Report to be signed on its behalf by the undersigned, thereunto duly authorized.
September 27, 2018
|
CAMPBELL SOUP COMPANY
|
|||
|
By:
|
/s/ Anthony P. DiSilvestro
|
||
|
Anthony P. DiSilvestro
|
|||
|
Senior Vice President and Chief Financial Officer (Principal Financial Officer)
|
|||
Pursuant to the requirements of the Securities Exchange Act of 1934, as amended, this Report has been signed below by the following persons on behalf of Campbell and in the capacities indicated on
September 27, 2018
.
|
Signatures
|
||
|
/s/ Keith R. McLoughlin
|
/s/ Maria Teresa Hilado
|
|
|
Keith R. McLoughlin
|
Maria Teresa Hilado
|
|
|
Interim President and Chief Executive Officer and
|
Director
|
|
|
Director
|
||
|
(Principal Executive Officer)
|
||
|
/s/ Anthony P. DiSilvestro
|
/s/ Randall W. Larrimore
|
|
|
Anthony P. DiSilvestro
|
Randall W. Larrimore
|
|
|
Senior Vice President and Chief Financial Officer
|
Director
|
|
|
(Principal Financial Officer)
|
||
|
/s/ Stanley Polomski
|
/s/ Marc B. Lautenbach
|
|
|
Stanley Polomski
|
Marc B. Lautenbach
|
|
|
Vice President and Controller
|
Director
|
|
|
(Principal Accounting Officer)
|
||
|
/s/ Les C. Vinney
|
/s/ Mary Alice D. Malone
|
|
|
Les C. Vinney
|
Mary Alice D. Malone
|
|
|
Chairman and Director
|
Director
|
|
|
/s/ Fabiola R. Arredondo
|
/s/ Sara Mathew
|
|
|
Fabiola R. Arredondo
|
Sara Mathew
|
|
|
Director
|
Director
|
|
|
/s/ Howard M. Averill
|
/s/ Nick Shreiber
|
|
|
Howard M. Averill
|
Nick Shreiber
|
|
|
Director
|
Director
|
|
|
/s/ Bennett Dorrance
|
/s/ Archbold D. van Beuren
|
|
|
Bennett Dorrance
|
Archbold D. van Beuren
|
|
|
Director
|
Director
|
|
90
Schedule II
CAMPBELL SOUP COMPANY
Valuation and Qualifying Accounts
For the Fiscal Years ended July 29, 2018, July 30, 2017, and July 31, 2016
(Millions)
|
Balance at Beginning of Period
|
Charged to/
(Reduction in) Costs
and
Expenses
|
Deductions
|
Acquisitions
|
Balance at
End of
Period
|
|||||||||||||||
|
Fiscal year ended July 29, 2018
|
|||||||||||||||||||
|
Cash discount
|
$
|
4
|
|
$
|
117
|
|
$
|
(117
|
)
|
$
|
2
|
|
$
|
6
|
|
||||
|
Bad debt reserve
|
2
|
|
1
|
|
(2
|
)
|
2
|
|
3
|
|
|||||||||
|
Returns reserve
(1)
|
5
|
|
5
|
|
(1
|
)
|
2
|
|
11
|
|
|||||||||
|
Total Accounts receivable allowances
|
$
|
11
|
|
$
|
123
|
|
$
|
(120
|
)
|
$
|
6
|
|
$
|
20
|
|
||||
|
Fiscal year ended July 30, 2017
|
|||||||||||||||||||
|
Cash discount
|
$
|
4
|
|
$
|
109
|
|
$
|
(109
|
)
|
$
|
—
|
|
$
|
4
|
|
||||
|
Bad debt reserve
|
3
|
|
—
|
|
(1
|
)
|
—
|
|
2
|
|
|||||||||
|
Returns reserve
(1)
|
5
|
|
—
|
|
—
|
|
—
|
|
5
|
|
|||||||||
|
Total Accounts receivable allowances
|
$
|
12
|
|
$
|
109
|
|
$
|
(110
|
)
|
$
|
—
|
|
$
|
11
|
|
||||
|
Fiscal year ended July 31, 2016
|
|||||||||||||||||||
|
Cash discount
|
$
|
5
|
|
$
|
116
|
|
$
|
(117
|
)
|
$
|
—
|
|
$
|
4
|
|
||||
|
Bad debt reserve
|
4
|
|
(1
|
)
|
—
|
|
—
|
|
3
|
|
|||||||||
|
Returns reserve
(1)
|
4
|
|
2
|
|
(1
|
)
|
—
|
|
5
|
|
|||||||||
|
Total Accounts receivable allowances
|
$
|
13
|
|
$
|
117
|
|
$
|
(118
|
)
|
$
|
—
|
|
$
|
12
|
|
||||
_______________________________________
|
(1)
|
The returns reserve is evaluated quarterly and adjusted accordingly. During each period, returns are charged to net sales in the Consolidated Statements of Earnings as incurred. Actual returns were approximately
$106
in 2018,
$103
in 2017, and
$95
in 2016, or less than
2%
of net sales.
|
91
TABLE OF CONTENTS
Part IItem 1. BusinessItem 1A. Risk FactorsItem 1B. Unresolved Staff CommentsItem 2. PropertiesItem 3. Legal ProceedingsItem 4. Mine Safety DisclosuresPart IIItem 5. Market For Registrant S Capital Stock, Related Shareholder Matters and Issuer Purchases Of Equity SecuritiesItem 6. Selected Financial DataItem 7. Management's Discussion and Analysis Of Financial Condition and Results Of OperationsItem 7A. Quantitative and Qualitative Disclosure About Market RiskItem 8. Financial Statements and Supplementary DataItem 9. Changes in and Disagreements with Accountants on Accounting and Financial DisclosureItem 9A. Controls and ProceduresItem 9B. Other InformationPart IIIItem 10. Directors, Executive Officers and Corporate GovernanceItem 11. Executive CompensationItem 12. Security Ownership Of Certain Beneficial Owners and Management and Related Shareholder MattersItem 13. Certain Relationships and Related Transactions, and Director IndependenceItem 14. Principal Accounting Fees and ServicesPart IVItem 15. Exhibits and Financial Statement SchedulesItem 16. Form 10-k Summary