CENTRAL PACIFIC FINANCIAL CORP
10-Ks and 10-Qs
|
|
|
|
|
|
|
|
|
|
|
|
|
|
|
|
|
|
|
|
|
|
|
|
|
|
|
|
|
|
|
|
|
|
|
|
|
|
|
|
|
|
|
|
|
|
|
|
|
|
|
|
|
|
|
|
UNITED STATES
SECURITIES AND EXCHANGE COMMISSION
Washington, D.C. 20549
FORM 10-K
(Mark One)
|
T
|
Annual Report Pursuant to Section 13 or 15(d) of the Securities Exchange Act of 1934
|
For the Fiscal year ended December 31, 2013
or
|
£
|
Transition Report Pursuant to Section 13 or 15(d) of the Securities Exchange Act of 1934
|
Commission file number: 001-31567
Central Pacific Financial Corp.
(Exact name of registrant as specified in its charter)
|
Hawaii
|
99-0212597
|
|
|
(State or other jurisdiction of incorporation or organization)
|
(I.R.S. Employer Identification No.)
|
|
220 South King Street, Honolulu, Hawaii
|
96813
|
|
|
(Address of principal executive offices)
|
(Zip Code)
|
Registrant’s telephone number, including area code:
(808) 544-0500
Securities registered pursuant to Section 12(b) of the Act:
|
Title of each class
|
Name of each exchange on which registered
|
|||||
|
Common Stock, No Par Value
Preferred Share Purchase Rights
|
New York Stock Exchange
New York Stock Exchange
|
|||||
Securities registered pursuant to Section 12(g) of the Act:
None
Indicate by check mark if the registrant is a well-known seasoned issuer, as defined in Rule 405 of the Securities Act. Yes
o
No
x
Indicate by check mark if the registrant is not required to file reports pursuant to Section 13 or Section 15(d) of the Act. Yes
o
No
x
Indicate by check mark whether the registrant (1) has filed all reports required to be filed by Section 13 or 15(d) of the Securities Exchange Act of 1934 during the preceding 12 months (or for such shorter period that the registrant was required to file such reports) and (2) has been subject to such filing requirements for the past 90 days. Yes
x
No
o
Indicate by check mark whether the registrant has submitted electronically and posted on its corporate Web site, if any, every Interactive Data File required to be submitted and posted pursuant to Rule 405 of Regulation S-T during the preceding 12 months (or for such shorter period that the registrant was required to submit and post such files). Yes
x
No
o
Indicate by check mark if disclosure of delinquent filers pursuant to Item 405 of Regulation S-K is not contained herein, and will not be contained, to the best of registrant’s knowledge, in definitive proxy or information statements incorporated by reference in Part III of this Form 10-K or any amendment to this Form 10-K.
x
Indicate by check mark whether the registrant is a large accelerated filer, an accelerated filer, a non-accelerated filer, or a smaller reporting company. See definitions of “large accelerated filer,” “accelerated filer” and “smaller reporting company” in Rule 12b-2 of the Exchange Act.
Large Accelerated Filer
o
Accelerated Filer
x
Non-Accelerated Filer
o
Smaller Reporting Company
o
Indicate by check mark whether the registrant is a shell company (as defined in Rule 12b-2 of the Exchange Act). Yes
o
No
x
As of June 30, 2013, the aggregate market value of the common stock held by non-affiliates of the registrant was approximately $403,903,000. As of February 14, 2014, the number of shares of common stock of the registrant outstanding was 42,108,496 shares.
Portions of the registrant’s proxy statement for the 2014 annual meeting of shareholders are incorporated by reference into Part III of this annual report on Form 10-K to the extent stated herein. The proxy statement will be filed within 120 days after the end of the fiscal year covered by this annual report on Form 10-K.
Forward-Looking Statements and Factors that Could Affect Future Results
Certain statements contained in this annual report on Form 10-K that are not statements of historical fact constitute forward-looking statements within the meaning of the Private Securities Litigation Reform Act of 1995 (the “Act”), notwithstanding that such statements are not specifically identified. In addition, certain statements may be contained in our future filings with the U.S. Securities and Exchange Commission (“SEC”), in press releases and in oral and written statements made by us or with our approval that are not statements of historical fact and constitute forward-looking statements within the meaning of the Act. Examples of forward-looking statements include but are not limited to: (i) projections of revenues, expenses, income or loss, earnings or loss per share, the payment or nonpayment of dividends, capital position and other financial items; (ii) statements of plans, objectives and expectations of Central Pacific Financial Corp. or its management or Board of Directors, including those relating to business plans, use of capital resources, products or services and regulatory developments and regulatory actions; (iii) statements of future economic performance; and (iv) statements of assumptions underlying such statements. Words such as “believes,” “plans,” “anticipates,” “expects,” “intends,” “forecasts,” “hopes,” “targeted,” “continue,” “remain,” “will,” “should,” “may” and other similar expressions are intended to identify forward-looking statements but are not the exclusive means of identifying such statements.
Forward-looking statements involve risks and uncertainties that may cause actual results to differ materially from those in such statements. Factors that could cause actual results to differ from those discussed in the forward-looking statements include but are not limited to:
|
·
|
increase in inventory or adverse conditions in the Hawaii and California real estate markets and deterioration in the construction industry;
|
|
·
|
adverse changes in the financial performance and/or condition of our borrowers and, as a result, increased loan delinquency rates, further deterioration in asset quality and further losses in our loan portfolio;
|
|
·
|
the impact of local, national, and international economies and events (including natural disasters such as wildfires, tsunamis, storms and earthquakes) on the Company’s business and operations and on tourism, the military and other major industries operating within the Hawaii market and any other markets in which the Company does business;
|
|
·
|
deterioration or malaise in domestic economic conditions, including any further destabilization in the financial industry and deterioration of the real estate market, as well as the impact of declining levels of consumer and business confidence in the state of the economy in general and in financial institutions in particular;
|
|
·
|
changes in estimates of future reserve requirements based upon the periodic review thereof under relevant regulatory and accounting requirements;
|
|
·
|
the impact of the Dodd-Frank Wall Street Reform and Consumer Protection Act (the “Dodd-Frank Act”), changes in capital standards, other regulatory reform, including but not limited to regulations promulgated by the Consumer Financial Protection Bureau (the “CFPB”), government-sponsored enterprise reform, and any related rules and regulations which affect our business operations and competitiveness;
|
|
·
|
the costs and effects of legal and regulatory developments, including the resolution of legal proceedings or regulatory or other governmental inquiries and the results of regulatory examinations or reviews;
|
|
·
|
the effects of and changes in trade, monetary and fiscal policies and laws, including the interest rate policies of the Board of Governors of the Federal Reserve System (the “FRB” of the “Federal Reserve”);
|
|
·
|
inflation, interest rate, securities market and monetary fluctuations;
|
|
·
|
negative trends in our market capitalization and adverse changes in the price of the Company’s common shares;
|
|
·
|
political instability;
|
|
·
|
acts of war or terrorism;
|
|
·
|
changes in consumer spending, borrowings and savings habits;
|
2
|
·
|
failure to maintain effective internal control over financial reporting or disclosure controls and procedures;
|
|
·
|
technological changes;
|
|
·
|
changes in the competitive environment among financial holding companies and other financial service providers;
|
|
·
|
the results of the tender offer and share repurchase agreements we announced on February 21, 2014;
|
|
·
|
the effect of changes in accounting policies and practices, as may be adopted by the regulatory agencies, as well as the Public Company Accounting Oversight Board, the Financial Accounting Standards Board and other accounting standard setters;
|
|
·
|
our ability to attract and retain skilled employees;
|
|
·
|
changes in our organization, compensation and benefit plans; and
|
|
·
|
our success at managing the risks involved in the foregoing items.
|
For information with respect to factors that could cause actual results to differ from the expectations stated in the forward-looking statements, see also “Risk Factors” under Part I, Item 1A of this report. We urge investors to consider all of these factors carefully in evaluating the forward-looking statements contained in this Form 10-K. Forward-looking statements speak only as of the date on which such statements are made. We undertake no obligation to update any forward-looking statement to reflect events or circumstances after the date on which such statement is made, or to reflect the occurrence of unanticipated events except as required by law.
|
ITEM 1.
|
BUSINESS |
Recent Developments
On February 21, 2014, we announced a tender offer to purchase for cash up to $68.8 million in value of shares of our common stock at a price not greater than $21.00 nor less than $18.50 per share (the “Tender Offer”.)
Upon the terms and subject to the conditions of the Tender Offer, promptly after the expiration date of the Tender Offer, we will determine a single price per share (the “Purchase Price”), which will be not greater than $21.00 nor less than $18.50 per share, that we will pay, subject to “odd lot” priority, proration and conditional tender provisions described in the tender and not properly withdrawn, and accepted for payment, taking into account the number of shares tendered pursuant to the Tender Offer and the prices specified by the tendering shareholders. The Purchase Price will be the lowest price per share (in increments of $0.10) of not greater than $21.00 nor less than $18.50 per share, at which shares have been properly tendered in the Tender Offer and not properly withdrawn, that will enable us to purchase the maximum number of shares properly tendered in the Tender Offer and not properly withdrawn having an aggregate purchase price not exceeding $68.8 million. All shares purchased in the Tender Offer will be purchased at the same Purchase Price regardless of whether the shareholder tendered at a lower price. However, because of the “odd lot” priority, proration and conditional tender provisions described in the Tender Offer materials, all of the shares tendered at or below the Purchase Price may not be purchased if shares having an aggregate value in excess of $68.8 million are properly tendered and not properly withdrawn. As of February 14, 2014, there were 42,108,496 shares of our common stock issued and outstanding. The maximum of 3,718,918 shares that we are offering to purchase pursuant to the Tender Offer represents approximately 8.8% of the total number of shares issued and outstanding as of February 14, 2014. Assuming the Tender Offer is fully subscribed, the minimum of 3,276,190 shares that we are offering to purchase pursuant to the Tender Offer represents approximately 7.8% of the total number of shares issued and outstanding as of February 14, 2014.
On February 20, 2014, we also entered into repurchase agreements (the “Repurchase Agreements”) with each of Carlyle Financial Services Harbor, L.P. (“Carlyle”) and ACMO-CPF, L.L.C. (“Anchorage” and together with Carlyle, the “Lead Investors”), each of whom is the owner of 9,463,095 shares (representing 22.5% of the outstanding shares or 44.9% in the aggregate) of our common stock, pursuant to which we have agreed to purchase up to $28.1 million of shares of common stock from each of the Lead Investors at the Purchase Price (the “Share Repurchases”) (or an aggregate of $56.2 million of shares.) The Share Repurchases are scheduled to close on the eleventh business day following the expiration of the Tender Offer. The aggregate value of shares to be repurchased under the Repurchase Agreements will be proportionately reduced in the event that the Company purchases less than the maximum number of shares that it is able to purchase at the Purchase Price pursuant to the terms of the Tender Offer. In addition, each Lead Investor may tender in the Tender Offer, although neither Lead Investor has indicated to what extent such Lead Investor intends to do so. The Share Repurchases contemplated by the Repurchase Agreements are conditioned upon, among other matters, the Company purchasing shares in the Tender Offer in accordance with this its terms.
3
If the Tender Offer is fully subscribed, the completion of the Tender Offer and the Share Repurchases will result in the repurchase by us of $125 million of shares in the aggregate. If the Tender Offer is fully subscribed at a Purchase Price of $21.00, the maximum Purchase Price pursuant to the Tender Offer, the completion of the Tender Offer and the Share Repurchases will result in the repurchase by us 5,952,380 shares of common stock, which would represent approximately 14.1% of our issued and outstanding shares. If the Tender Offer is fully subscribed at a Purchase Price of $18.50, the minimum Purchase Price pursuant to the Tender Offer, the completion of the Tender Offer and the Share Repurchases will result in the repurchase by the Company of 6,756,755 shares in the aggregate, which would represent approximately 16.0% of our issued and outstanding shares.
General
Central Pacific Financial Corp., a Hawaii corporation and bank holding company registered under the Bank Holding Company Act of 1956, as amended (the “BHC Act”), was organized on February 1, 1982. Our principal business is to serve as a holding company for our bank subsidiary, Central Pacific Bank, which was incorporated in its present form in the state of Hawaii on March 16, 1982 in connection with the holding company reorganization. Its predecessor entity was incorporated in the state of Hawaii on January 15, 1954.
When we refer to “the Company,” “we,” “us” or “our,” we mean Central Pacific Financial Corp. and its subsidiaries on a consolidated basis. When we refer to “Central Pacific Financial Corp.,” “CPF” or to the holding company, we are referring to the parent company on a standalone basis. We refer to Central Pacific Bank herein as “our bank” or “the bank.”
Through our bank and its subsidiaries, we offer full-service commercial banking with 35 bank branches and 112 ATMs located throughout the state of Hawaii. Our administrative and main offices are located in Honolulu and we have 28 branches on the island of Oahu. We operate four branches on the island of Maui, two branches on the island of Hawaii and one branch on the island of Kauai. In January 2014, we opened our 36
th
branch in Kapaa, Kauai, increasing our footprint to two branches on the island of Kauai. Our bank’s deposits are insured by the Federal Deposit Insurance Corporation (“FDIC”) up to applicable limits. The bank is not a member of the Federal Reserve System.
Central Pacific Bank is a full-service commercial bank offering a broad range of banking products and services, including accepting time and demand deposits and originating loans. Our loans include commercial loans, construction loans, commercial and residential mortgage loans and consumer loans.
We derive our income primarily from interest and fees on loans, interest on investment securities and fees received in connection with deposit and other services. Our major operating expenses are the interest paid by our bank on deposits and borrowings, salaries and employee benefits and general operating expenses. Our bank relies substantially on a foundation of locally generated deposits. For financial reporting purposes, we have the following three reportable segments: (1) Banking Operations, (2) Treasury and (3) All Others. For further information about our reporting segments, including information about the assets and operating results of each, see “Note 25 – Segment Information” in the accompanying consolidated financial statements.
Our operations, like those of other financial institutions that operate in our market, are significantly influenced by economic conditions in Hawaii, including the strength of the real estate market, as well as the fiscal and regulatory policies of the federal and state government and the regulatory authorities that govern financial institutions. See “—Supervision and Regulation” below for other information about the regulation of our holding company and bank.
With respect to our capital raising efforts, we completed a number of key milestones since 2011. We completed our previously announced capital raise of $325 million through a private placement offering (the “Private Placement”) in February 2011.
Concurrently with the Private Placement, in February 2011, the U.S. Treasury (the “Treasury”) agreed to exchange our Fixed Rate Cumulative Perpetual Preferred Stock (the “TARP Preferred Stock”) purchased by the Treasury under the Troubled Assets Relief Program (“TARP”) and accrued and unpaid dividends thereon for approximately $56.2 million in our common stock (the “TARP Exchange”). The Company and Treasury also agreed to amend the ten-year warrant to purchase shares of common stock (the “TARP Warrant”) issued to the Treasury in connection with the Treasury’s investment in the TARP Preferred Stock to, among other things, reduce the exercise price to the same per share purchase price in the Private Placement.
As part of the recapitalization, we also completed a rights offering ( the “Rights Offering”) whereby shareholders of record as of the close of business on February 17, 2011 received transferable rights to purchase newly issued shares of our common stock at a purchase price of $10 per share. The rights provided for the purchase of up to $20.0 million of the Company’s common stock by holders of such rights. The Rights Offering was fully subscribed and completed in May 2011.
4
On June 22, 2011, the Treasury completed a public underwritten offering of 2,850,000 shares of our common stock it received in the TARP Exchange. On April 4, 2012, the Treasury completed another public underwritten offering of its remaining 2,770,117 shares of our common stock it received in the TARP Exchange. The Company did not receive any proceeds from either of these offerings. In June 2013, the Treasury held a private auction to sell its warrant positions in several financial institutions which included the Company’s warrant to purchase up to 79,288 shares of our common shares at a purchase price of $10 per share. On June 6, 2013, we were notified that we were the winning bidder of the warrant at our bid of $752 thousand. After the completion of these transactions, the Treasury no longer holds any outstanding shares of our common stock, or any warrants to purchase our common stock they received in connection with our participation in the TARP.
Following our successful capital raises in 2011, we have accomplished a number of key performance objectives through December 31, 2013:
|
·
|
We have continued to maintain a strong capital position with tier 1 risk-based capital, total risk-based capital and leverage capital ratios as of December 31, 2013 of 20.30%, 21.57%, and 13.68%, respectively, compared to 22.54%, 23.83%, and 14.32%, respectively, as of December 31, 2012, and 22.94%, 24.24%, and 13.78%, respectively, as of December 31, 2011. Our capital ratios continue to exceed the levels required for a “well-capitalized” regulatory designation.
|
|
·
|
We reported twelve consecutive profitable quarters with net income totaling $172.1 million, $47.4 million, and $36.6 million for the years ended December 31, 2013, 2012 and 2011, respectively.
|
|
·
|
We reduced our nonperforming assets by $43.2 million to $46.8 million at December 31, 2013 from $90.0 million at December 31, 2012. Our nonperforming assets at December 31, 2012 were reduced by $105.6 million from $195.6 million at December 31, 2011.
|
|
·
|
We significantly reduced our construction and development loan portfolio as of December 31, 2013 to $75.6 million, or 2.9% of our total loan portfolio. At December 31, 2012 and 2011, this portfolio totaled $96.2 million and $161.1 million, or 4.4% and 7.8% of our total loan portfolio, respectively.
|
|
·
|
We maintained an allowance for loan and lease losses as a percentage of total loans and leases of 3.19% at December 31, 2013, compared to 4.37% and 5.91% at December 31, 2012 and 2011, respectively. In addition, we maintained an allowance for loan and lease losses as a percentage of nonperforming assets of 179.29% at December 31, 2013, compared to 107.10% and 62.42% at December 31, 2012 and 2011, respectively.
|
In addition, on February 12, 2013, the Written Agreement that we entered into with the Federal Reserve Bank of San Francisco (“FRBSF”) and the Hawaii Division of Financial Institutions (“DFI”) in July 2010 was terminated.
We also remain focused on lowering our efficiency ratio and growing market share within our core Hawaii market. In connection with improving our efficiency ratio, we have begun several initiatives, including (i) outsourcing the data center and hardware for our core information technology system to Fiserv, which is our existing core software application provider; (ii) designing, developing, and implementing our data warehouse and customer relationship management programs; and (iii) implementing a staff right-sizing plan.
Our Services
We offer a full range of banking services and products to businesses, professionals and individuals. We provide our customers with an array of loan products, including residential mortgage loans, commercial and consumer loans and lines of credit, commercial real estate loans and construction loans.
Through our bank, we concentrate our lending activities in five principal areas:
|
(1)
|
Residential Mortgage Lending.
Residential mortgage loans include fixed- and adjustable-rate loans primarily secured by single-family, owner-occupied residences in Hawaii, fixed-rate loans secured by multi-family residential properties, and home equity lines of credit and loans. We typically require loan-to-value ratios of not more than 80%, although higher levels are permitted with accompanying mortgage insurance. First mortgage loans secured by residential properties generally carry a moderate level of credit risk, with an average loan size of approximately $0.4 million and marketable collateral. Changes in interest rates, the economic recession and other market factors have impacted, and future changes will likely continue to impact, the marketability and value of collateral and the financial condition of our borrowers and thus the level of credit risk inherent in the portfolio.
|
5
|
|
Since our August 2005 acquisition of Hawaii HomeLoans, Inc., now known as Central Pacific HomeLoans, a division of the bank, (“CPHL”), we have grown our market position in the residential mortgage origination arena in Hawaii with dedicated mortgage lending specialists on all major islands in Hawaii. The majority of our residential mortgage loan originations are sold in the secondary market.
|
|
(2)
|
Commercial Lending and Leasing.
Loans in this category consist primarily of term loans, lines of credit and equipment leases to small and middle-market businesses and professionals in the state of Hawaii. The borrower’s business is typically regarded as the principal source of repayment, although our underwriting policies and practices generally require additional sources of collateral, including real estate and other business assets, as well as personal guarantees where possible to mitigate risk and help to reduce credit losses.
|
|
(3)
|
Commercial Real Estate Lending.
Loans in this category consist of loans secured by commercial real estate, including but not limited to, structures and facilities to support activities designated as industrial, warehouse, general office, retail, health care, and religious dwellings. Our underwriting policy generally requires net cash flow from the property to cover the debt service while maintaining an appropriate amount of reserve and permits consideration of liquidation of the collateral as a secondary source of repayment. Financing of commercial real estate projects is subject to a high degree of credit risk. The limited supply of land at a given commercially attractive location, the long economic life of the assets, the long delivery time frames required for the development and construction of major projects and high interest rate sensitivity have given commercial real estate markets a long history of significant cyclical fluctuations and volatility.
|
|
(4)
|
Construction Lending.
Construction lending encompasses the financing of residential and commercial construction projects. Similar to commercial real estate lending, construction projects are subject to a high degree of credit risk given the long delivery time frames for projects.
|
|
(5)
|
Consumer Lending.
Loans in this category are generally either unsecured or secured by personal assets such as automobiles. The average loan size is generally small and risk is diversified amount many borrowers.
|
Beyond the lending function described above, we also offer a full range of deposit products and services including checking, savings and time deposits, cash management and electronic banking services, trust services and retail brokerage services.
Our Market Area and Competition
Based on deposit market share among FDIC-insured financial institutions in Hawaii, Central Pacific Bank was the fourth-largest depository institution in the state at December 31, 2013.
The banking and financial services industry in the state of Hawaii generally, and particularly in our target market areas, is highly competitive. We compete for loans, deposits and customers with other commercial banks, savings banks, securities and brokerage companies, mortgage companies, insurance companies, finance companies, credit unions and other nonbank financial service providers. Some of these competitors are much larger by total assets and capitalization, have greater access to capital markets and have achieved better results than we have during the recent economic downturn.
In order to compete with the other financial services providers in the state of Hawaii, we principally rely upon local promotional activities, personal relationships between customers and our officers, directors and employees, and specialized services tailored to meet the needs of our customers and the communities we serve. We remain competitive by offering flexibility and superior service levels, coupled with competitive interest rates and pricing.
For further discussion of factors affecting our operations see, “Part II, Item 7. Management’s Discussion and Analysis of Financial Condition and Results of Operations.”
Business Concentrations
No individual or single group of related accounts is considered material in relation to the assets or deposits of our bank, or in relation to the overall business of the Company. However, approximately 73% of our loan portfolio held for investment at December 31, 2013 consisted of real estate-related loans, including construction loans, residential mortgage loans and commercial mortgage loans. See “Part II, Item 7. Management’s Discussion and Analysis of Financial Condition and Results of Operations—Financial Condition—Loan Portfolio.”
6
Our business activities are focused primarily in Hawaii. Consequently, our results of operations and financial condition are impacted by the general economic trends in Hawaii, particularly in the commercial and residential real estate markets. During periods of economic strength, the real estate market and the real estate industry typically perform well; during periods of economic weakness, they typically are adversely affected.
Our Subsidiaries
Central Pacific Bank is the wholly-owned principal subsidiary of Central Pacific Financial Corp. Other wholly-owned subsidiaries include: CPB Capital Trust I; CPB Capital Trust II; CPB Statutory Trust III; CPB Capital Trust IV; and CPB Statutory Trust V.
Central Pacific Bank has two wholly-owned subsidiaries: CPB Real Estate, Inc. and Citibank Properties, Inc. Both are real estate investment trusts, that are in the process of dissolution. Central Pacific Bank had another wholly-owned subsidiary, CB Technology, Inc. that was dissolved in February 2013. Central Pacific Bank also owns 50% of Pacific Access Mortgage, LLC, Gentry HomeLoans, LLC, Haseko HomeLoans, LLC and Island Pacific HomeLoans, LLC.
Our former subsidiary Central Pacific HomeLoans, Inc. was merged into the bank in February 2012.
Supervision and Regulation
General
The Company and the bank are subject to significant regulation and restrictions by federal and state laws and regulatory agencies for the protection of depositors and the FDIC deposit insurance fund, borrowers, and the stability of the U.S. banking system. The following discussion of statutes and regulations is a summary and does not purport to be complete nor does it address all applicable statutes and regulations. This discussion is qualified in its entirety by reference to the statutes and regulations referred to in this discussion. We cannot predict whether or when new legislation may be enacted or new regulations or guidance may be promulgated nor the effect new laws and supervisory policies may have on our financial condition and results of operations. Such developments may further alter the structure, regulation, and competitive relationship among financial institutions, and may subject us to increased compliance, disclosure, and reporting requirements.
Regulatory Agencies
Central Pacific Financial Corp. is a legal entity separate and distinct from its subsidiaries. As a bank holding company, Central Pacific Financial Corp. is regulated under the BHC Act and is subject to inspection, examination and supervision by the FRB. It is also subject to Hawaii’s Code of Financial Institutions and is subject to inspection, examination and supervision by the DFI.
The Company is also subject to the disclosure and regulatory requirements of the Securities Act of 1933, as amended, and the Securities Exchange Act of 1934, as amended (the “Exchange Act”), as administered by the SEC. Our common stock is listed on the New York Stock Exchange (“NYSE”) under the trading symbol “CPF,” and we are subject to the rules of the NYSE for companies listed there.
Central Pacific Bank, as a Hawaii-chartered bank, is subject to primary supervision, periodic examination and regulation by the DFI and FDIC. Central Pacific Financial Corp., as a bank holding company, is also subject to certain regulations promulgated by the FRB. In its periodic examinations, each of these regulatory bodies assesses our financial condition, capital resources, asset quality, earnings prospects, management, liquidity and other aspects of our operations. These bodies also determine whether our management is violating or has violated any law or regulation. The DFI and FRB, and separately the FDIC as insurer of the bank’s deposits, have various remedies available to them. Such remedies include the power to enjoin “unsafe or unsound” practices, to require affirmative action to correct any conditions resulting from any violation or practice, to issue an administrative order that can be judicially enforced, to direct an increase in capital or establish specific minimum capital ratios, to restrict the bank’s growth, to assess civil monetary penalties, to remove officers and directors, to institute a receivership, and ultimately to terminate the bank’s deposit insurance, which for a Hawaii-chartered bank would result in a revocation of its charter.
7
Regulatory Matters
On October 9, 2012, the bank entered into a Memorandum of Understanding (the “Compliance MOU”) with the FDIC to improve the bank’s compliance management system (“CMS”). Under the Compliance MOU, we are required to, among other things, (i) improve the Board of Directors’ oversight of the bank’s CMS; (ii) ensure the establishment and implementation of the bank’s CMS is commensurate with the complexity of the bank’s operations; (iii) perform a full review of all compliance policy and procedures, then revise and adopt policy and procedures to ensure compliance with all consumer protection regulations; (iv) enhance the bank’s training program relating to consumer protection and fair lending regulations; (v) develop and implement an effective internal monitoring program to ensure compliance with all applicable laws and regulations; (vi) strengthen the compliance audit function to ensure that the compliance audits are appropriately and comprehensively scoped; (vii) develop and implement internal controls for the bank’s third-party payment processing activity; (viii) strengthen the Board of Directors and senior management’s oversight of third-party relationships and (ix) enhance the bank’s overdraft payment program. The bank believes it has already taken substantial steps to comply with the Compliance MOU. In addition to the steps taken to comply with the Compliance MOU, the bank received an “Outstanding” rating in its most recent Community Reinvestment performance evaluation that measures how financial institutions support their communities in the areas of lending, investment and service.
We cannot provide any assurance on whether or when the bank will be in full compliance with the Compliance MOU or whether or when the Compliance MOU will be terminated. Even if terminated, we may still be subject to other agreements with regulators which restrict our activities or may also continue to impose capital ratios or other requirements on our business. The requirements and restrictions of the Compliance MOU are judicially enforceable and the Company or the bank's failure to comply with such requirements and restrictions may subject the Company and the bank to additional regulatory restrictions including: the imposition of additional regulatory requirements or orders; limitations on our activities; the imposition of civil monetary penalties; and further directives which affect our business, including, in the most severe circumstances, termination of the bank’s deposit insurance or appointment of a conservator or receiver for the bank.
As further described in Note 2 to the Consolidated Financial Statements under “Part II, Item 8. Financial Statements and Supplementary Data,” the bank and CPF were previously subject to regulatory orders with the FDIC and the FRB which were terminated on October 26, 2012 and February 12, 2013, respectively. These regulatory orders required us, among other things, to improve our capital position and reduce our level of problem assets.
Current Capital Adequacy Requirements
Bank holding companies and banks are currently subject to various regulatory capital requirements administered by state and federal banking agencies which apply until the increased capital requirements of the new capital rules are effective and fully phased-in. Capital adequacy guidelines and, additionally for banks, prompt corrective action regulations, involve quantitative measures of assets, liabilities, and certain off-balance sheet items calculated under regulatory accounting practices. Capital amounts and classifications are also subject to qualitative judgments by regulators about components, risk weighting, and other factors. The current risk-based capital guidelines for bank holding companies and banks require capital ratios that vary based on the perceived degree of risk associated with a banking organization’s operations for both transactions reported on the balance sheet as assets, such as loans, and those recorded as off-balance sheet items, such as commitments, letters of credit and recourse arrangements. The risk-based capital ratio is determined by classifying assets and certain off-balance sheet financial instruments into weighted categories, with higher levels of capital being required for those categories perceived as representing greater risks and dividing its qualifying capital by its total risk-adjusted assets and off-balance sheet items. Bank holding companies and banks engaged in significant trading activity may also be subject to the market risk capital guidelines and be required to incorporate additional market and interest rate risk components into their risk-based capital standards.
The currently effective risk-based capital guidelines of the regulatory agencies were based upon the 1988 capital accord ("Basel I") of the Basel Committee on Bank Supervision ("Basel Committee"), a committee of central banks and bank supervisors/regulators from the major industrialized countries that develops broad policy guidelines, which each country's supervisors can use to determine the supervisory policies they apply to their home jurisdiction. In 2004, the Basel Committee proposed a new capital accord ("Basel II") to replace Basel I that provided approaches for setting capital standards for credit risk and capital requirements for operational risk and refining the existing capital requirements for market risk exposures. U.S. banking regulators published a final rule for Basel II implementation requiring banks with over $250 billion in consolidated total assets. However, a definitive rule was not issued and instead the new capital rules to implement Basel III were first proposed in 2010.
8
Under the current capital requirements, there are three fundamental capital ratios: a total risk-based capital ratio, a Tier 1 risk-based capital ratio and a Tier 1 leverage ratio. To be deemed “well capitalized” a bank must have a total risk-based capital ratio, a Tier 1 risk-based capital ratio and a Tier 1 leverage ratio of at least ten percent, six percent and five percent, respectively. There is currently no Tier 1 leverage requirement for a holding company to be deemed well-capitalized. At December 31, 2013, the respective capital ratios of the Company and the bank exceeded the minimum percentage requirements to be deemed “well-capitalized” for regulatory purposes. — See “Management’s Discussion and Analysis of Financial Condition and Results of Operations — Capital Resources.” The federal banking agencies may require banks and bank holding companies subject to enforcement actions to maintain capital ratios in excess of the minimum ratios otherwise required to be deemed well capitalized, in which case institutions may no longer be deemed to be well capitalized and may therefore be subject to restrictions on taking brokered deposits.
Prompt Corrective Action Provisions
The Federal Deposit Insurance Act requires the federal bank regulatory agencies to take “prompt corrective action” with respect to a depository institution if that institution does not meet certain capital adequacy standards, including requiring the prompt submission of an acceptable capital restoration plan. Depending on the bank’s capital ratios, the agencies’ regulations define five categories in which an insured depository institution will be placed: well-capitalized, adequately capitalized, undercapitalized, significantly undercapitalized, and critically undercapitalized. At each successive lower capital category, an insured bank is subject to more restrictions, including restrictions on the bank's activities, operational practices or the ability to pay dividends or executive bonuses. Based upon its capital levels, a bank that is classified as well-capitalized, adequately capitalized, or undercapitalized may be treated as though it were in the next lower capital category if the appropriate federal banking agency, after notice and opportunity for hearing, determines that an unsafe or unsound condition, or an unsafe or unsound practice, warrants such treatment.
Legislative and Regulatory Developments
The implementation and impact of legislation and regulations enacted since 2008 in response to the U.S. economic downturn and financial industry instability continued in 2013 as modest recovery returned to many institutions in the banking sector. Many institutions, including CPF, have exited Treasury investments under the TARP and certain provisions of the Dodd-Frank Act are effective and have been fully implemented, including the revisions in the deposit insurance assessment base for FDIC insurance and the permanent increase in coverage to $250,000; the permissibility of paying interest on business checking accounts; the removal of barriers to interstate branching and required disclosure and shareholder advisory votes on executive compensation. Action in 2013 to implement the final Dodd-Frank provisions included (i) final new capital rules, (ii) a final rule to implement the so called Volcker Rule restrictions on certain proprietary trading and investment activities and (iii) final rules and increased enforcement action by the CFPB.
The New Capital Rule and Minimum Capital Ratios
In July 2013, the federal bank regulatory agencies adopted final regulations which revised their risk-based and leverage capital requirements for banking organizations to meet requirements of the Dodd–Frank Act and to implement international agreements reached by the Basel Committee on Banking Supervision intended to improve both the quality and quantity of banking organizations’ capital (“Basel III”). Although many of the rules contained in these final regulations are applicable only to large, internationally active banks, some of them will apply on a phased-in basis to all banking organizations, including the Company and the bank.
The following are among the new requirements that will be phased-in beginning January 1, 2015:
|
·
|
an increase in the minimum Tier 1 capital ratio from 4.00% to 6.00% of risk-weighted assets;
|
|
·
|
a new category and a required 4.50% of risk-weighted assets ratio is established for “common equity Tier 1” as a subset of Tier 1 capital limited to common equity;
|
|
·
|
a minimum non-risk-based leverage ratio is set at 4.00% eliminating a 3.00% exception for higher rated banks;
|
|
·
|
changes in the permitted composition of Tier 1 capital to exclude trust preferred securities, mortgage servicing rights and certain deferred tax assets and include unrealized gains and losses on available for sale debt and equity securities;
|
|
·
|
the risk-weights of certain assets for purposes of calculating the risk-based capital ratios are changed for high volatility commercial real estate acquisition, development and construction loans, certain past due non-residential mortgage loans and certain mortgage-backed and other securities exposures; and
|
|
·
|
an additional “countercyclical capital buffer” is required for larger and more complex institutions.
|
9
|
·
|
The prompt corrective action standards will change when the new capital rule ratios become effective. Under the new standards, in order to be considered well-capitalized, the bank would be required to meet the new common equity Tier 1 ratio of 6.5%, an increased Tier 1 ratio of 8% (increased from 6%), a total capital ratio of 10% (unchanged) and a leverage ratio of 5% (unchanged).
|
Management believes that, as of December 31, 2013, the Company and the bank would meet all applicable capital requirements under the new capital rules on a fully phased-in basis if such requirements were currently in effect (see “
Legislative and Regulatory Developments
”).
An additional capital conservation buffer of 2.5% of risk weighted assets above the regulatory minimum capital ratios established under the new final capital rule will be phased-in from 2016 to 2019 and must be met to avoid limitations on the ability of the bank to pay dividends, repurchase shares or pay discretionary bonuses. Including the capital conservation buffer of 2.5%, the new final capital rule would result in the following minimum ratios: (i) a Tier 1 capital ratio of 8.5%, (ii) a common equity Tier 1 capital ratio of 7.0%, and (iii) a total capital ratio of 10.5%. The new capital conservation buffer requirement would be phased-in beginning in January 2016 at 0.625% of risk-weighted assets and would increase each year until fully implemented in January 2019. While the new final capital rule sets higher regulatory capital standards for the Company and the bank, bank regulators may also continue their past policies of expecting banks to maintain additional capital beyond the new minimum requirements. The implementation of the new capital rules or more stringent requirements to maintain higher levels of capital or to maintain higher levels of liquid assets could adversely impact the Company's net income and return on equity, restrict the ability to pay dividends or executive bonuses and require the raising of additional capital.
Final Volcker Rule
In December 2013, the federal bank regulatory agencies adopted final rules that implement a part of the Dodd-Frank Act commonly referred to as the “Volcker Rule.” Under these rules and subject to certain exceptions, banking entities, including the Company and the bank, will be restricted from engaging in activities that are considered proprietary trading and from sponsoring or investing in certain entities, including hedge or private equity funds that are considered “covered funds.” These rules will become effective on April 1, 2014. Certain collateralized debt obligations (“CDO”) securities backed by trust preferred securities were initially defined as covered funds subject to the investment prohibitions of the final rule. Action taken by the Federal Reserve in January 2014 exempted many such securities to address the concern that many community banks holding such CDO securities may have been required to recognize losses on those securities.
The Company and the bank held no investment positions at December 31, 2013 which were subject to the final rule. Therefore, while these new rules may require us to conduct certain internal analysis and reporting, we believe that they will not require any material changes in our operations or business.
CFPB Actions
The Dodd-Frank Act provided for the creation of the CFPB as an independent entity within the Federal Reserve with broad rulemaking, supervisory and enforcement authority over consumer financial products and services, including deposit products, residential mortgages, home-equity loans, credit cards, and other consumer loans. The CFPB’s functions include investigating consumer complaints, conducting market research, rulemaking, supervising and examining bank consumer transactions, and enforcing rules related to consumer financial products and services. CFPB regulations and guidance apply to all financial institutions and banks with $10 billion or more in assets and are subject to examination by the CFPB. Banks with less than $10 billion in assets, including the bank, will continue to be examined for compliance by their primary federal banking agency. Significant recent CFPB developments that may affect the bank's operations and compliance costs include:
|
·
|
the issuance of final rules for residential mortgage lending, which became effective January 10, 2014, including definitions for “qualified mortgages” and detailed standards by which lenders must satisfy themselves of the borrower’s ability to repay the loan and revised forms of disclosure under the Truth in Lending Act and the Real Estate Settlement Procedures Act;
|
|
·
|
the issuance of a policy report on arbitration clauses which could result in the restriction or prohibition of lenders including arbitration clauses in consumer financial services contracts;
|
|
·
|
actions taken to regulate and supervise credit bureaus and debt collections; and
|
|
·
|
positions taken by the CFPB on fair lending, including applying the disparate impact theory in auto financing, which could make it harder for lenders to charge different rates or apply different terms to loans to different customers.
|
10
Bank Holding Company Regulation
As contained in both federal and state banking laws and regulations, a wide range of requirements and restrictions apply to bank holding companies and their subsidiaries which:
|
·
|
require periodic reports and such additional information as the Federal Reserve may require bank holding companies to meet or exceed minimum capital requirements (see “
Legislative and Regulatory Developments”
and
“Current Capital Adequacy Requirements”
);
|
|
·
|
require that bank holding companies serve as a source of financial and managerial strength to subsidiary banks and commit resources as necessary to support each subsidiary bank. The source-of-strength doctrine most directly affects bank holding companies where a bank holding company’s subsidiary bank fails to maintain adequate capital levels. In such a situation, the subsidiary bank will be required by the bank’s federal regulator to take “prompt corrective action” (see “
Prompt Corrective Action Provisions
”);
|
|
·
|
limit dividends payable to shareholders and restrict the ability of bank holding companies to obtain dividends or other distributions from their subsidiary banks;
|
|
·
|
require a bank holding company to terminate an activity or terminate control of or liquidate or divest certain subsidiaries, affiliates or investments if the Federal Reserve believes the activity or the control of the subsidiary or affiliate constitutes a significant risk to the financial safety, soundness or stability of any bank subsidiary;
|
|
·
|
require the prior approval for changes in senior executive officer or directors and prohibit golden parachute payments, including change in control agreements, or new employment agreements with such payment terms, which are contingent upon termination when a bank holding company is deemed to be in troubled condition;
|
|
·
|
regulate provisions of certain bank holding company debt, including the authority to impose interest ceilings and reserve requirements on such debt and require prior approval to purchase or redeem securities in certain situations; and
|
|
·
|
require prior approval of acquisitions and mergers with other banks or bank holding companies and consider certain competitive, management, financial, and anti-money laundering compliance impact on the U.S.
|
Other Restrictions on the Company’s Activities
Subject to prior notice or Federal Reserve approval, bank holding companies may generally engage in, or acquire shares of companies engaged in, activities determined by the Federal Reserve to be so closely related to banking or managing or controlling banks as to be a proper incident thereto. Bank holding companies that elect and retain “financial holding company” status pursuant to the Gramm-Leach-Bliley Act of 1999 (“GLBA”) may engage in these nonbanking activities and broader securities, insurance, merchant banking and other activities that are determined to be “financial in nature” or are incidental or complementary to activities that are financial in nature without prior Federal Reserve approval. Pursuant to the GLBA and the Dodd-Frank Act, in order to elect and retain financial holding company status, a bank holding company and all depository institution subsidiaries of that bank holding company must be well capitalized and well managed, and, except in limited circumstances, depository subsidiaries must be in satisfactory compliance with the Community Reinvestment Act (“CRA”), which requires banks to help meet the credit needs of the communities in which they operate. Failure to sustain compliance with these requirements or correct any non-compliance within a fixed time period could lead to the required divestiture of subsidiary banks or the termination of all activities that do not conform to those permissible for a bank holding company. The Company has not elected financial holding company status and neither Company nor the bank has engaged in any activities determined by the Federal Reserve to be financial in nature or incidental or complementary to activities that are financial in nature.
Sarbanes-Oxley Act
The Company is subject to the accounting oversight and corporate governance requirements of the Sarbanes-Oxley Act of 2002, including, among other things, required executive certification of financial presentations, requirements for board audit committees and their members, and disclosure of controls and procedures and internal control over financial reporting.
11
Regulation of the Bank
As a Hawaii-chartered commercial bank whose deposits are insured by the FDIC, the bank is subject to regulation, supervision, and regular examination by the DFI and by the FDIC as a nonmember state bank, as the bank’s primary Federal regulator. Specific federal and state laws and regulations which are applicable to banks regulate, among other things, the scope of their business, their investments, their reserves against deposits, the timing of the availability of deposited funds, their activities relating to dividends, investments, loans, the nature and amount of and collateral for certain loans, servicing and foreclosing on loans, borrowings, capital requirements, certain check-clearing activities, branching, and mergers and acquisitions.
Enforcement Authority
The federal and Hawaii regulatory structure gives the bank regulatory agencies extensive discretion in connection with their supervisory and enforcement activities and examination policies, including policies with respect to the classification of assets and the establishment of adequate loan loss reserves for regulatory purposes. The regulatory agencies have adopted guidelines to assist in identifying and addressing potential safety and soundness concerns before an institution’s capital becomes impaired. The guidelines establish operational and managerial standards generally relating to: (1) internal controls, information systems, and internal audit systems; (2) loan documentation; (3) credit underwriting; (4) interest-rate exposure; (5) asset growth and asset quality; and (6) compensation, fees, and benefits. Further, the regulatory agencies have adopted safety and soundness guidelines for asset quality and for evaluating and monitoring earnings to ensure that earnings are sufficient for the maintenance of adequate capital and reserves. If, as a result of an examination, the DFI or the FDIC should determine that the financial condition, capital resources, asset quality, earnings prospects, management, liquidity, or other aspects of the bank’s operations are unsatisfactory or that the bank or its management is violating or has violated any law or regulation, the DFI and the FDIC
,
and separately the FDIC as insurer of the bank’s deposits, have residual authority to:
|
·
|
require affirmative action to correct any conditions resulting from any violation or practice;
|
|
·
|
direct an increase in capital and the maintenance of higher specific minimum capital ratios, which may preclude the bank from being deemed well capitalized and restrict its ability to accept certain brokered deposits;
|
|
·
|
restrict the bank’s growth geographically, by products and services, or by mergers and acquisitions, including bidding in FDIC receiverships for failed banks;
|
|
·
|
enter into or issue informal or formal enforcement actions, including required Board resolutions, memoranda of understanding, written agreements and consent or cease and desist orders or prompt corrective action orders to take corrective action and cease unsafe and unsound practices;
|
|
·
|
require prior approval of senior executive officer or director changes; remove officers and directors and assess civil monetary penalties; and
|
|
·
|
terminate FDIC insurance, revoke the charter and/or take possession of and close and liquidate the bank or appoint the FDIC as receiver.
|
Deposit Insurance
The FDIC is an independent federal agency that insures deposits through the Deposit Insurance Fund (the “DIF”) up to prescribed statutory limits of federally insured banks and savings institutions and safeguards the safety and soundness of the banking and savings industries. The amount of FDIC assessments paid by each DIF member institution is based on its relative risk of default as measured by regulatory capital ratios and other supervisory factors. The FDIC may terminate a depository institution’s deposit insurance upon a finding that the institution’s financial condition is unsafe or unsound or that the institution has engaged in unsafe or unsound practices that pose a risk to the DIF or that may prejudice the interest of the bank’s depositors. The termination of deposit insurance for a bank would also result in the revocation of the bank’s charter by the DFI. The bank’s FDIC insurance expense totaled $2.7 million for 2013. We are generally unable to control the amount of premiums that we are required to pay for FDIC insurance. If there are additional bank or financial institution failures or if the FDIC otherwise determines, we may be required to pay even higher FDIC premiums. Any future increases in FDIC insurance premiums may have a material and adverse effect on our earnings and could have a material adverse effect on the value of, or market for, our common stock.
12
Dividends
It is the Federal Reserve’s policy that bank holding companies should generally pay dividends on common stock only out of income available over the past year, and only if prospective earnings retention is consistent with the organization’s expected future needs and financial condition. It is also the Federal Reserve’s policy that bank holding companies should not maintain dividend levels that undermine their ability to be a source of strength to its banking subsidiaries. The Federal Reserve has also discouraged payment ratios that are at maximum allowable levels unless both asset quality and capital are very strong.
The bank is a legal entity that is separate and distinct from its holding company. CPF is dependent on the performance of the bank for funds which may be received as dividends from the bank for use in the operation of CPF and the ability of CPF to pay dividends to shareholders. Subject to the regulatory restrictions which currently further restrict the ability of the bank to declare and pay dividends under applicable Hawaii law, future cash dividends by the bank will depend upon management’s assessment of future capital requirements, contractual restrictions and other factors. When effective, the new minimum capital rule may restrict dividends by the bank if the additional capital conservation buffer is not achieved.
Operations and Consumer Compliance Laws
The bank must comply with numerous federal and state anti-money laundering and consumer protection and privacy statutes and implementing regulations, including the USA Patriot Act of 2001, GLBA, the Bank Secrecy Act, the Foreign Account Tax Compliance Act (effective 2013), the CRA, the Fair Credit Reporting Act, as amended by the Fair and Accurate Credit Transactions Act, the Equal Credit Opportunity Act, the Truth in Lending Act, the Fair Housing Act, the Home Mortgage Disclosure Act, the Real Estate Settlement Procedures Act, the National Flood Insurance Act, the California Homeowner Bill of Rights and various federal and state privacy protection laws. Noncompliance with these laws could subject the bank to lawsuits and could also result in administrative penalties, including, fines and reimbursements. The bank and CPF are also subject to federal and state laws prohibiting unfair or fraudulent business practices, untrue or misleading advertising and unfair competition.
These laws and regulations mandate certain disclosure and reporting requirements and regulate the manner in which financial institutions must deal with customers when taking deposits, making loans, servicing, collecting, and foreclosure of loans, and providing other services. Failure to comply with these laws and regulations can subject the bank to various penalties, including but not limited to enforcement actions, injunctions, fines or criminal penalties, punitive damages to consumers, and the loss of certain contractual rights.
The Dodd-Frank Act provided for the creation of the CFPB as an independent entity within the Federal Reserve. The CFPB is a new regulatory agency for United States banks. The CFPB has broad rulemaking, supervisory, and enforcement authority over consumer financial products and services, including deposit products, residential mortgages, home-equity loans, credit cards, and other consumer loans. The CFPB ’s functions include investigating consumer complaints, conducting market research, rulemaking, supervising and examining banks consumer transactions, and enforcing rules related to consumer financial products and services. Pursuant to the Dodd-Frank Act, banks (such as our bank) with less than $10 billion in assets will continue to be examined for compliance with the consumer laws and the regulations of the CFPB by their primary federal banking agency.
The CFPB has adopted revisions to Regulation Z, which implements the Truth in Lending Act (“TILA”), pursuant to the Dodd-Frank Act. The revisions took effect on January 10, 2014 and apply to all consumer mortgages (except home equity lines of credit, timeshare plans, reverse mortgages, or temporary loans). The revisions mandate specific underwriting criteria for home loans in order for creditors to make a reasonable, good faith determination of a consumer's ability to repay and establish certain protections from liability under this requirement for “qualified mortgages” meeting certain standards. In particular, it will prevent banks from making “no doc” and “low doc” home loans, as the rules require that banks determine a consumer’s ability to pay based in part on verified and documented information. Because we do not originate “no doc” or “low doc” loans, we do not believe this regulation will have a significant impact on our operations.
Legislative Initiatives
From time to time, various legislative and regulatory initiatives are introduced in Congress and state legislatures, as well as by regulatory agencies. Such initiatives may include proposals to expand or contract the powers of bank holding companies and depository institutions or proposals to substantially change the financial institution regulatory system. Such legislation could change banking statutes and our operating environment in substantial and unpredictable ways. If enacted, such legislation could increase or decrease the cost of doing business, limit or expand permissible activities or affect the competitive balance among banks, savings associations, credit unions and other financial institutions. We cannot predict whether any such legislation will be enacted, and if enacted, the effect that it or any implementing regulations would have on our financial condition or results of operations. A change in statutes, regulations or regulatory policies applicable to us or any of our subsidiaries could have a material adverse effect on our business.
13
Employees
At December 31, 2013, we employed 903 persons, 815 on a full-time basis and 88 on a part-time basis. We are not a party to any collective bargaining agreement.
Protection of Net Operating Losses
We have generated considerable tax benefits, including net operating loss carry-forwards and federal and state tax credits. Our use of the tax benefits in the future would be significantly limited if we experience an “ownership change” for U.S. federal income tax purposes. In general, an “ownership change” will occur if there is a cumulative increase in the Company’s ownership by “5-percent shareholders” (as defined under U.S. income tax laws) that exceeds 50 percentage points over a rolling three-year period.
On November 23, 2010, our board declared a dividend of preferred share purchase rights (“Rights”) in respect of our common stock which were issued pursuant to a Tax Benefits Preservation Plan, dated as of November 23, 2010 (the “Tax Benefits Preservation Plan”), between the Company and Wells Fargo Bank, National Association, as rights agent. Each Right represents the right to purchase, upon the terms and subject to the conditions in the Tax Benefits Preservation Plan, 1/10,000th of a share of our Junior Participating Preferred Stock, Series C, no par value, for $6.00, subject to adjustment. The Tax Benefits Preservation Plan is designed to reduce the likelihood that the Company will experience an ownership change by discouraging any person from becoming a beneficial owner of 4.99% or more of our common stock (a “Threshold Holder”). There is no guarantee, however, that the Tax Benefits Preservation Plan will prevent the Company from experiencing an ownership change. Adoption of the Tax Benefits Preservation Plan was required by our agreements with The Carlyle Group (“Carlyle”) and Anchorage Capital Group, L.L.C. (“Anchorage”). On January 29, 2014, our Board of Directors approved an amendment to the Tax Benefits Preservation Plan to extend it for up to an additional two years.
To further protect our tax benefits, on January 26, 2011, our board approved a proposed amendment to our restated articles of incorporation to restrict transfers of our stock if the effect of an attempted transfer would cause the transferee to become a Threshold Holder or to cause the beneficial ownership of a Threshold Holder to increase (the “Protective Charter Amendment”). At our annual meeting of shareholders on April 27, 2011, our shareholders approved the Protective Charter Amendment. The Protective Charter Amendment also does not guarantee that we will not experience an ownership change. On January 29, 2014, our Board of Directors approved an amendment to the Protective Charter Amendment to extend it for up to an additional two years, subject to approval by our shareholders.
Iran Sanctions Related Disclosure
Under the Iran Threat Reduction and Syrian Human Rights Act of 2012, which added Section 13(r) to the Securities Exchange Act of 1934, as amended, we are required to include certain disclosures in our periodic reports if we or any of our “affiliates” knowingly engaged in certain specified activities during the period covered by this Annual Report on Form 10-K. Because the SEC defines the term “affiliate” broadly, it includes any entity controlled by us as well as any person or entity that controls us or is under common control with us. We do not believe we and our consolidated subsidiaries have knowingly engaged in any transaction or dealing reportable under Section 13(r) of the Exchange Act during fiscal year 2013.
The Carlyle Group L.P., which may be considered one of our affiliates, included the disclosure reproduced below (the “Applus Disclosure”) in its Annual Report on Form 10-K for the fiscal year ended December 31, 2013, which was filed with the Securities and Exchange Commission on February 27, 2014. We have no involvement in or control over the activities of Applus Servicios Technologicos S.L.U., any of its predecessor companies or any of its subsidiaries, and we have not independently verified or participated in the preparation of the following Applus Disclosure:
“As we disclosed in our Quarterly Report on Form 10-Q for the quarter ended March 31, 2013, we have been advised by Applus Servicios Technologicos S.L.U. (“Applus”), a European company in which our private equity funds have invested and which may be considered our affiliate, that during the first quarter of the year ended December 31, 2013, a subsidiary of Applus provided certain services to customers that could be affiliated with the Industrial Development and Renovation Organization (“IDRO”), which has been designated as an agency of the Government of Iran. For the year ended December 31, 2013, gross revenue attributable to such sales was €86,633, with estimated net profits to Applus of approximately €15,593. At this time, we are unable to determine whether the IDRO, directly or indirectly, controls these customers. Although these activities were not prohibited by U.S. law at the time they were conducted, Applus has advised us that its subsidiary has discontinued its dealings with such customers, and that it does not otherwise intend to continue or enter into any Iran-related activity. All such dealings (including limited wind-down activities) were discontinued prior to March 8, 2013, in accordance with the requirements of Section 218 of the Iran Threat Reduction and Syria Human Rights Act of 2012, as amended.”
14
Available Information
Our internet website can be found at
www.centralpacificbank.com
. Our annual reports on Form 10-K, quarterly reports on Form 10-Q, current reports on Form 8-K and all amendments to those reports can be found on our internet website as soon as reasonably practicable after such materials are electronically filed with or furnished to the SEC. Copies of the Company’s filings with the SEC may also be obtained directly from the SEC’s website at www.sec.gov. These documents may also be obtained in print upon request by our shareholders to our Investor Relations Department.
Also posted on our website and available in print upon request of any shareholder to our Investor Relations Department, are the charters for our Audit Committee, Compensation Committee and Corporate Governance Committee, as well as our Corporate Governance Guidelines and Code of Business Conduct and Ethics. Within the time period required by the SEC and NYSE, we will post on our website any amendment to the Code of Business Conduct and Ethics and any waiver applicable to our senior financial officers, as defined by the SEC, and our executive officers or directors. In addition, our website includes information concerning purchases and sales of our equity securities by our executive officers and directors, as well as disclosure relating to certain non-GAAP financial measures (as defined in the SEC’s Regulation G) that we may make public orally, telephonically, by webcast, by broadcast or by similar means from time to time.
|
ITEM 1A.
|
RISK FACTORS |
Our business faces significant risks, including credit, market/liquidity, operational, legal/regulatory and strategic/reputation risks. The factors described below may not be the only risks we face and are not intended to serve as a comprehensive listing or be applicable only to the category of risk under which they are disclosed. The risks described below are generally applicable to more than one of the following categories of risks. Additional risks that we do not yet know of or that we currently think are immaterial may also impair our business operations. If any of the events or circumstances described in the following factors actually occurs, our business, financial condition and/or results of operations could be materially and adversely affected.
Risk Factors Related to our Business
Despite signs of stabilization, uncertainty about the global and U.S. economies could have an adverse effect on us.
Although general economic trends and market conditions have stabilized, concerns about the ability to maintain a sustained economic recovery still remain, including concerns over unemployment levels, growing U.S. government and foreign indebtedness, a large budget deficit, and the federal debt ceiling. Downgrades in U.S. and foreign debt instruments could raise borrowing costs and adversely impact the mortgage and housing markets. In general, adverse economic conditions could have one or more of the following negative impacts on us, any one of which could have a material adverse effect on our financial condition or results of operations: (i) loan delinquencies may increase; (ii) problem assets and foreclosures may increase leading to higher loan charge-offs; (iii) demand for our products and services may decline; (iv) low cost or non-interest bearing deposits may decrease; and (v) collateral for loans made by us, especially involving real estate, may decline in value, in turn reducing customers’ borrowing power and reducing the value of assets and collateral associated with our existing loans.
Difficult economic and market conditions have adversely affected our industry and renewed economic slowdown in Hawaii or a worsening of current market conditions in general would result in additional adverse effects on us.
The U.S. economy entered into one of the longest economic recessions to have occurred since the Great Depression of the 1930’s in December 2007. Although general economic trends and market conditions have since stabilized, a renewed economic slowdown in Hawaii or a worsening of current market conditions in general would likely result in additional adverse effects on us, including: (i) loan delinquencies may increase; (ii) problem assets and foreclosures may increase leading to more loan charge-offs; (iii) demand for our products and services may decline; (iv) low cost or non-interest bearing deposits may decrease; and (v) collateral for loans made by us, especially involving real estate, may decline in value, in turn reducing customers’ borrowing power and reducing the value of assets and collateral associated with our existing loans.
Furthermore, unlike larger national or other regional banks that are more geographically diversified, our business and operations are closely tied to the Hawaii market. The Hawaii economy relies on tourism, real estate, government and other service-based industries. Declines in tourism, increases in energy costs, the availability of affordable air transportation, adverse weather and natural disasters, and local budget issues impact consumer and corporate spending. As a result, such events may contribute to the deterioration in Hawaii’s general economic condition, which could adversely impact us and our borrowers.
15
The high concentration of commercial real estate and construction loans in our portfolio, combined with the deterioration in these sectors caused by the economic downturn, had and may continue to have a significantly more adverse impact on our operating results than many other banks across the nation. Although we have taken a number of steps to reduce our credit risk exposure, and as a result have experienced declining credit costs since 2011, we still had $46.8 million in nonperforming assets at December 31, 2013. If our borrowers continue to experience financial difficulty, or if property values securing our real estate loans decline further, we will incur elevated credit costs due to the composition of our loan portfolio even if market conditions improve.
Our Hawaii and, to a lesser extent, California commercial real estate and construction loan operations have a considerable effect on our results of operations.
The performance of our Hawaii and California commercial real estate and construction loans depends on a number of factors, including the continued stabilization and eventual improvement of the real estate markets in which we operate. As we have seen in the Hawaii and California construction and commercial real estate markets since the latter part of 2007, the strength of the real estate market and the results of our operations could be negatively affected by an economic downturn.
In addition, declines in the market for commercial property could cause some of our borrowers to suffer losses on their project, which would negatively affect our financial condition, results of operations and prospects. Declines in housing prices and the supply of existing houses for sale could cause residential developers who are our borrowers to suffer losses on their projects and encounter difficulty in repaying their loans. As of December 31, 2013, our percentage of nonperforming assets to total loans and leases, loans held for sale and other real estate was 1.77%, compared to 4.00% as of December 31, 2012 and 8.99% as of December 31, 2011. We cannot assure you that we will have an adequate allowance for loan and lease losses to cover future losses. If we suffer greater losses than we are projecting, our financial condition and results of operations would be adversely affected.
Our net income has been favorably impacted by credits to our provision for loan and lease losses, which may not continue.
For twelve consecutive quarters from the first quarter of 2011 though the fourth quarter of 2013, we recorded a credit to the provision for loan and lease losses which has favorably impacted our net income. Although other factors of our overall risk profile have improved in recent years and general economic trends and market conditions have stabilized, concerns over the global and U.S. economies still remain. Accordingly, it is possible that the Hawaii or California real estate markets could deteriorate as it did from the latter part of 2007 through 2010. If this occurs, it may result in an increase in loan delinquencies, loan charge-offs, and our allowance for loan and lease losses. Even if economic conditions improve or stay the same, it is possible that we may experience material credit losses and in turn, increases to our allowance for loan and lease losses, due to any number of factors, including but not limited to, the elevated risk still inherent in our existing loan portfolio resulting from our high concentration of commercial real estate and construction loans. If that were to occur, or if we continue to have strong growth in our loan portfolio, we may have to record a provision for loan and lease losses which would have an adverse impact on our net income.
A large percentage of our loans are collateralized by real estate and continued deterioration in the real estate market may result in additional losses and adversely affect our financial results.
Our results of operations have been, and in future periods, will continue to be significantly impacted by the economy in Hawaii, and to a lesser extent, other markets we are exposed to including California. Approximately 73% of our loan portfolio as of December 31, 2013 was comprised of loans primarily collateralized by real estate, with the significant majority of these loans concentrated in Hawaii.
Deterioration of the economic environment in Hawaii, California or other markets we are exposed to, including a decline in the real estate market and single-family home resales or a material external shock, may significantly impair the value of our collateral and our ability to sell the collateral upon foreclosure. In the event of a default with respect to any of these loans, amounts received upon sale of the collateral may be insufficient to recover outstanding principal and interest on the loan. As we have seen in the past, material declines in the value of the real estate assets securing many of our commercial real estate loans may lead to significant credit losses in this portfolio. As a result of our particularly high concentration of real estate loans, our portfolio had been and remains particularly susceptible to significant credit losses during economic downturns and adverse changes in the real estate market.
Our allowance for loan and lease losses may not be sufficient to cover actual loan losses, which could adversely affect our results of operations. Additional loan losses may occur in the future and may occur at a rate greater than we have experienced to date.
As a lender, we are exposed to the risk that our loan customers may not repay their loans according to their terms and that the collateral or guarantees securing these loans may be insufficient to assure repayment. Our current allowance for loan and lease losses may not be sufficient to cover future loan losses. We may experience significant loan losses that could have a material adverse effect on our operating results. Management makes various assumptions and judgments about the collectibility of our loan portfolio, which are regularly reevaluated and are based in part on:
16
|
·
|
current economic conditions and their estimated effects on specific borrowers;
|
|
·
|
an evaluation of the existing relationships among loans, potential loan losses and the present level of the allowance for loan and lease losses;
|
|
·
|
results of examinations of our loan portfolios by regulatory agencies; and
|
|
·
|
management’s internal review of the loan portfolio.
|
In determining the size of the allowance for loan and lease losses, we rely on an analysis of our loan portfolio, our experience and our evaluation of general economic conditions, as well as the requirements of any supervisory action taken by the bank’s regulators and other regulatory input. If our assumptions prove to be incorrect, our current allowance for loan and lease losses may not be sufficient to cover the losses. Because of the uncertainty in the economy, volatility in the credit and real estate markets, including specifically, the deterioration in the Hawaii and California real estate markets and our high concentration of commercial real estate and construction loans, we made significant enhancements to our allowance for loan and lease losses over the past several years and may need to make additional enhancements in the future. In addition, third parties, including our federal and state regulators, periodically evaluate the adequacy of our allowance for loan and lease losses and may communicate with us concerning the methodology or judgments that we have raised in determining the allowance for loan and lease losses. As a result of this input, we may be required to assign different grades to specific credits, increase our provision for loan and lease losses, and/or recognize further loan charge offs.
Our ability to use net operating loss carry forwards to reduce future tax payments may be limited or restricted.
We have generated significant net operating losses (“NOLs”) as a result of our recent losses. We generally are able to carry NOLs forward to reduce taxable income in future years. However, our ability to utilize the NOLs is subject to the rules of Section 382 of the Internal Revenue Code. Section 382 generally restricts the use of NOLs after an “ownership change.” An ownership change occurs if, among other things, the shareholders (or specified groups of shareholders) who own or have owned, directly or indirectly, 5% or more of a corporation’s common stock or are otherwise treated as 5% shareholders under Section 382 and Treasury regulations promulgated thereunder increase their aggregate percentage ownership of that corporation’s stock by more than 50 percentage points over the lowest percentage of the stock owned by these shareholders over a three-year rolling period. In the event of an ownership change, Section 382 imposes an annual limitation on the amount of taxable income a corporation may offset with NOL carry forwards. This annual limitation is generally equal to the product of the value of the corporation’s stock on the date of the ownership change, multiplied by the long-term tax-exempt rate published monthly by the Internal Revenue Service. Any unused annual limitation may be carried over to later years until the applicable expiration date for the respective NOL carry forwards.
In order to reduce the likelihood that transactions in our common stock will result in an ownership change, on November 23, 2010, we adopted a Tax Benefits Preservation Plan, which provides an economic disincentive for any person or group to become an owner, for relevant tax purposes, of 4.99% or more of our common stock. On January 29, 2014, our Board of Directors approved an amendment to the Tax Benefits Preservation Plan to extend it for up to an additional two years. To further protect our NOL carryforwards, on May 2, 2011, we filed the Protective Charter Amendment to restrict transfers of our common stock if the effect of the transfer would be to cause the transferee to become an owner, for relevant tax purposes, of 4.99% or more of our common stock (a “Threshold Holder”) or cause the beneficial ownership of our common stock by any Threshold Holder to increase. On January 29, 2014, our Board of Directors approved an amendment to the Protective Charter Amendment to extend it for up to an additional two years, subject to approval by our shareholders. However, we cannot ensure that our ability to use our NOLs to offset income will not become limited in the future. As a result, we could pay taxes earlier and in larger amounts than would be the case if our NOLs were available to reduce our federal income taxes without restriction.
Our ability to maintain adequate sources of funding and liquidity and required capital levels may be negatively impacted by uncertainty in the economic environment which may, among other things, impact our ability to satisfy our obligations.
Liquidity is essential to our business. An inability to raise funds through deposits, borrowings, the sale of investments or loans, and other sources would have a substantial negative effect on our liquidity. Our access to funding sources in amounts adequate to finance our activities on terms which are acceptable to us could be impaired by factors that affect us specifically or the financial services industry or economy in general. Factors that could detrimentally impact our access to liquidity sources include concerns regarding the continued deterioration in our financial condition, increased regulatory actions against us and a decrease in the level of our business activity as a result of a downturn in the markets in which our loans or deposits are concentrated. Our ability to borrow could also be impaired by factors that are not specific to us, such as a disruption in the financial markets or negative views and expectations about the prospects for the financial industry in light of the recent turmoil faced by banking organizations and the credit markets.
17
The management of liquidity risk is critical to the management of our business and our ability to service our customer base. In managing our balance sheet, our primary source of funding is customer deposits. Our ability to continue to attract these deposits and other funding sources is subject to variability based upon a number of factors including volume and volatility in the securities’ markets, our financial condition, our credit rating and the relative interest rates that we are prepared to pay for these liabilities. The availability and level of deposits and other funding sources is highly dependent upon the perception of the liquidity and creditworthiness of the financial institution, which perception can change quickly in response to market conditions or circumstances unique to a particular company. Concerns about our past and future financial condition or concerns about our credit exposure to other persons could adversely impact our sources of liquidity, financial position, including regulatory capital ratios, results of operations and our business prospects.
If the level of deposits were to materially decrease, we would need to raise additional funds by increasing the interest that we pay on certificates of deposits or other depository accounts, seek other debt or equity financing or draw upon our available lines of credit. We rely on commercial and retail deposits, and to a lesser extent, advances from the FHLB and the Federal Reserve discount window, to fund our operations. Although we have historically been able to replace maturing deposits and advances as necessary, we might not be able to replace such funds in the future if, among other things, our results of operations or financial condition or the results of operations or financial condition of the FHLB or market conditions were to change.
Our line of credit with the FHLB serves as our primary outside source of liquidity. The Federal Reserve discount window also serves as an additional outside source of liquidity. Borrowings under this arrangement are through the Federal Reserve’s primary facility under the borrower-in-custody program. The duration of borrowings from the Federal Reserve discount window are generally for a very short period, usually overnight. In the event that these outside sources of liquidity become unavailable to us, we will need to seek additional sources of liquidity, including selling assets. We cannot assure you that we will be able to sell assets at a level to allow us to repay borrowings or meet our liquidity needs.
We constantly monitor our activities with respect to liquidity and evaluate closely our utilization of our cash assets; however, there can be no assurance that our liquidity or the cost of funds to us may not be materially and adversely impacted as a result of economic, market, or operational considerations that we may not be able to control.
Our business is subject to interest rate risk and fluctuations in interest rates may adversely affect our earnings.
The majority of our assets and liabilities are monetary in nature and subject to risk from changes in interest rates. Like most financial institutions, our earnings and profitability depend significantly on our net interest income, which is the difference between interest income on interest-earning assets, such as loans and investment securities, and interest expense on interest-bearing liabilities, such as deposits and borrowings. We expect that we will periodically experience “gaps” in the interest rate sensitivities of our assets and liabilities, meaning that either our interest-bearing liabilities will be more sensitive to changes in market interest rates than our interest-earning assets, or vice versa. If market interest rates should move contrary to our position, this “gap” will work against us and our earnings may be negatively affected. In light of our current volume and mix of interest-earning assets and interest-bearing liabilities, our net interest margin could be expected to remain relatively constant during periods of rising interest rates, and to decline during periods of falling interest rates. We are unable to predict or control fluctuations of market interest rates, which are affected by many factors, including the following:
|
·
|
inflation;
|
|
·
|
recession;
|
|
·
|
changes in unemployment;
|
|
·
|
the money supply;
|
|
·
|
international disorder and instability in domestic and foreign financial markets; and
|
|
·
|
governmental actions.
|
Our asset/liability management strategy may not be able to control our risk from changes in market interest rates and it may not be able to prevent changes in interest rates from having a material adverse effect on our results of operations and financial condition. From time to time, we may reposition our assets and liabilities to reduce our net interest income volatility. Failure to perform in any of these areas could significantly weaken our competitive position, which could adversely affect our growth and profitability, which, in turn, could have a material adverse effect on our financial condition and results of operations.
18
Governmental regulation and regulatory actions against us may further impair our operations or restrict our growth.
Under the Compliance MOU, we are required to, among other things, (i) improve the Board of Directors’ oversight of the bank’s CMS; (ii) ensure the establishment and implementation of the bank’s CMS is commensurate with the complexity of the bank’s operations; (iii) perform a full review of all compliance policy and procedures, then revise and adopt policy and procedures to ensure compliance with all consumer protection regulations; (iv) enhance the bank’s training program relating to consumer protection and fair lending regulations; (v) develop and implement an effective internal monitoring program to ensure compliance with all applicable laws and regulations; (vi) strengthen the compliance audit function to ensure that the compliance audits are appropriately and comprehensively scoped; (vii) develop and implement internal controls for the bank’s third-party payment processing activity; (viii) strengthen the Board of Directors and senior management’s oversight of third-party relationships and (ix) enhance the bank’s overdraft payment program.
We cannot assure you whether or when the Company and the bank will be in full compliance with the Compliance MOU or whether or when the Compliance MOU will be terminated. Even if terminated, we may still be subject to other agreements with regulators that restrict our activities or may also continue to impose capital ratios or other requirements on our business. The requirements and restrictions of the Compliance MOU are judicially enforceable and the Company or the bank’s failure to comply with such requirements and restrictions may subject the Company and the bank to additional regulatory restrictions including: the imposition of additional regulatory requirements or orders; limitations on our activities; the imposition of civil monetary penalties; and further directives which affect our business, including, in the most severe circumstances, termination of the bank’s deposit insurance or appointment of a conservator or receiver for the bank.
In addition to the requirements of the Compliance MOU, we are subject to significant governmental supervision and regulation. These regulations are intended primarily for the protection of depositors’ funds, federal deposit insurance funds and the banking system as a whole, not security holders. These regulations affect our lending practices, capital structure, investment practices, dividend policy and growth, among other things. Congress and federal regulatory agencies continually review banking laws, regulations and policies for possible changes. Statutes and regulations affecting our business may be changed at any time and the interpretation of these statutes and regulations by examining authorities may also change. In addition, regulations may be adopted which increase our deposit insurance premiums and enact special assessments which could increase expenses associated with running our business and adversely affect our earnings.
There can be no assurance that such changes to the statutes and regulations or to their interpretation will not adversely affect our business. Such changes could subject us to additional costs, limit the types of financial services and products we may offer and/or increase the ability of non-banks to offer competing financial services and products, among other things. In addition to governmental supervision and regulation, we are subject to changes in other federal and state laws, including changes in tax laws, which could materially affect the banking industry. We are subject to the rules and regulations of the FRBSF, FDIC and DFI and may be subject to the rules and regulations promulgated by the CFPB which was recently created pursuant to the Dodd-Frank Act. If we fail to comply with federal and state bank regulations, the regulators may limit our activities or growth, impose fines on us or ultimately cease our operations. Banking laws and regulations change from time to time. Bank regulations can hinder our ability to compete with financial services companies that are not regulated in the same manner or are less regulated. Federal and state bank regulatory agencies regulate many aspects of our operations. These areas include:
|
·
|
the capital that must be maintained;
|
|
·
|
the kinds of activities that can be engaged in;
|
|
·
|
the kinds and amounts of investments that can be made;
|
|
·
|
the locations of offices;
|
|
·
|
insurance of deposits and the premiums that we must pay for this insurance; and
|
|
·
|
how much cash we must set aside as reserves for deposits.
|
The Dodd-Frank Act provides for a comprehensive overhaul of the financial services industry within the U.S. While the full effects of the legislation on us cannot yet be determined, it could result in higher compliance and other costs as a result of new regulations and new regulatory initiatives, which could adversely affect our business.
19
In addition, bank regulatory authorities have the authority to bring enforcement actions against banks and bank holding companies, including the bank and CPF, for unsafe or unsound practices in the conduct of their businesses or for violations of any law, rule or regulation, any condition imposed in writing by the appropriate bank regulatory agency or any written agreement with the authority. Enforcement actions against us could include a federal conservatorship or receivership for the bank, the issuance of additional orders that could be judicially enforced, the imposition of civil monetary penalties, the issuance of directives to enter into a strategic transaction, whether by merger or otherwise, with a third party, the termination of insurance of deposits, the issuance of removal and prohibition orders against institution-affiliated parties, and the enforcement of such actions through injunctions or restraining orders.
We face a risk of noncompliance and enforcement action with the Bank Secrecy Act and other anti-money laundering statutes and regulations.
The Bank Secrecy Act, the USA PATRIOT Act of 2001, and other laws and regulations require financial institutions, among other duties, to institute and maintain an effective anti-money laundering program and file suspicious activity and currency transaction reports as appropriate. The federal Financial Crimes Enforcement Network is authorized to impose significant civil money penalties for violations of those requirements and has recently engaged in coordinated enforcement efforts with the individual federal banking regulators, as well as the U.S. Department of Justice, Drug Enforcement Administration, and Internal Revenue Service. We are also subject to increased scrutiny of compliance with the rules enforced by the Office of Foreign Assets Control and compliance with the Foreign Corrupt Practices Act. If our policies, procedures and systems are deemed deficient, we would be subject to liability, including fines and regulatory actions, which may include restrictions on our ability to pay dividends and the necessity to obtain regulatory approvals to proceed with certain aspects of our business plan. Failure to maintain and implement adequate programs to combat money laundering and terrorist financing could also have serious reputational consequences for us. Any of these results could materially and adversely affect our business, financial condition and results of operations.
New regulatory capital standards impose enhanced capital adequacy requirements on us.
Increased regulatory capital requirements (and the associated compliance costs) which have been adopted by federal banking regulators impose additional capital requirements on our business. The administration of existing capital adequacy laws as well as adoption of new laws and regulations relating to capital adequacy, or more expansive or aggressive interpretations of existing laws and regulations, could have a material adverse effect on our business, liquidity, financial condition and results of operations and could substantially restrict our ability to pay dividends, repurchase any of our capital stock, or pay executive bonuses. In addition, increased regulatory capital requirements could require us to raise additional capital which would dilute our existing shareholders at the time of such capital issuance.
If we are unable to effectively manage the composition of our investment securities portfolio, which we expect will continue to comprise a significant portion of our earning assets, our net interest income and net interest margin could be adversely affected.
Our primary sources of interest income include interest on loans and leases, as well as interest earned on investment securities. Interest earned on investment securities represented 25.4% of our interest income in the year ended December 31, 2013 as compared to 24.2% of our interest income in the year ended December 31, 2012. Accordingly, effectively managing our investment securities portfolio to generate interest income while managing the composition and risks associated with that portfolio, including the mix of government agency and non-agency securities, has become increasingly important. If we are unable to effectively manage our investment securities portfolio or if the interest income generated by our investment securities portfolio declines, our net interest income and net interest margin could be adversely affected.
The soundness of other financial institutions could adversely affect us.
Our ability to engage in routine funding transactions could be adversely affected by the actions and commercial soundness of other financial institutions. Defaults by, or even rumors or questions about, one or more financial services institutions, or the financial services industry generally, have led to market-wide liquidity problems and could lead to losses or defaults by us or by other institutions. There is no assurance that any such losses would not materially and adversely affect our results of operations.
20
Our deposit customers may pursue alternatives to deposits at our bank or seek higher yielding deposits causing us to incur increased funding costs.
We are facing increasing deposit-pricing pressures. Checking and savings account balances and other forms of deposits can decrease when our deposit customers perceive alternative investments, such as the stock market or other non-depository investments as providing superior expected returns or seek to spread their deposits over several banks to maximize FDIC insurance coverage. Furthermore, technology and other changes have made it more convenient for the bank’s customers to transfer funds into alternative investments including products offered by other financial institutions or non-bank service providers. Additional increases in short-term interest rates could increase transfers of deposits to higher yielding deposits. Efforts and initiatives we undertake to retain and increase deposits, including deposit pricing, can increase our costs. When the bank’s customers move money out of bank deposits in favor of alternative investments or into higher yielding deposits, or spread their accounts over several banks, we can lose a relatively inexpensive source of funds, thus increasing our funding costs.
The fiscal, monetary and regulatory policies of the federal government and its agencies could have a material adverse effect on our results of operations.
The FRB regulates the supply of money and credit in the U.S. Its policies determine in large part the cost of funds for lending and investing and the return earned on those loans and investments, both of which affect the net interest margin. It also can materially decrease the value of financial assets we hold, such as debt securities.
In an effort to stimulate the economy, the federal government and its agencies have taken various steps to keep interest rates at extremely low levels. Our net interest income and net interest margin may be negatively impacted by a prolonged low interest rate environment like we are currently experiencing as it may result in us holding lower yielding loans and securities on our balance sheet, particularly if we are unable to replace the maturing higher yielding assets with similar higher yielding assets. Changes in the slope of the yield curve, which represents the spread between short-term and long-term interest rates, could also reduce our net interest income and net interest margin. Historically, the yield curve is upward sloping, meaning short-term rates are lower than long-term rates. When the yield curve flattens, as is the case in the current interest rate environment, our net interest income and net interest margin could decrease as our cost of funds increases relative to the yield we can earn on our assets.
If we continue to see an improvement in national economic conditions or other changes occur, there is a potential that the FRB will increase interest rates. Should the FRB raise interest rates significantly and rapidly, there is potential for decreased demand for our loan products, an increase in our cost of funds, and curtailment of the current economic recovery.
Changes in FRB policies and our regulatory environment generally are beyond our control, and we are unable to predict what changes may occur or the manner in which any future changes may affect our business, financial condition and results of operation.
The repeal of federal prohibitions on payment of interest on demand deposits could increase our interest expense.
All federal prohibitions on the ability of financial institutions to pay interest on demand deposit accounts were repealed as part of the Dodd-Frank Act. As a result, financial institutions can offer interest on demand deposits to compete for clients. Our interest expense will increase and our net interest margin will decrease if we have to offer higher rates of interest then we currently offer on demand deposits to attract additional customers or maintain current customers, which could have a material adverse effect on our business, financial condition and results of operations.
We rely on dividends from our subsidiaries for most of our revenue.
Because we are a holding company with no significant operations other than our bank, we depend upon dividends from our bank for a substantial portion of our revenues.
Hawaii law only permits the bank to pay dividends out of retained earnings as defined under Hawaii banking law (“Statutory Retained Earnings”), which differs from GAAP retained earnings. At December 31, 2013, the bank had Statutory Retained Earnings of $240.4 million.
Our ability to pay cash dividends to our shareholders is subject to restrictions under federal and Hawaii law, including restrictions imposed by the FRB and covenants set forth in various agreements we are a party to, including covenants set forth in our subordinated debentures.
21
Our information systems may experience an interruption or breach in security.
We rely heavily on communications and information systems to conduct our business. Any failure, interruption or breach in security of these systems could result in failures or disruptions in our customer relationship management, general ledger, deposit, loan and other systems. While we have policies and procedures designed and implemented to prevent or limit the effect of the failure, interruption or security breach of our information systems, there can be no assurance that any such failures, interruptions or security breaches will not occur or, if they do occur, that they will be adequately addressed. The occurrence of any failures, interruptions or security breaches of our information systems could damage our reputation, result in a loss of customer business, subject us to additional regulatory scrutiny or expose us to civil litigation and possible financial liability, any of which could have a material adverse effect on our financial condition and results of operations.
We continually encounter technological change.
The financial services industry is continually undergoing rapid technological change with frequent introductions of new technology-driven products and services. The effective use of technology increases efficiency and enables financial institutions to better serve customers and to reduce costs. Our future success depends, in part, upon our ability to address the needs of our customers by using technology to provide products and services that will satisfy customer demands, as well as to create additional efficiencies in our operations. Many of our competitors have substantially greater resources to invest in technological improvements. We may not be able to effectively implement new technology-driven products and services or be successful in marketing these products and services to our customers. In addition, there are a limited number of qualified persons in our local marketplace with the knowledge and experience required to effectively maintain our information technology systems and implement our technology initiatives. Failure to successfully attract and retain qualified personnel, or keep pace with technological change affecting the financial services industry could have a material adverse impact on our business and, in turn, our financial condition and results of operations.
We are implementing changes to our operations to improve our efficiency ratio that may adversely impact our results of operations.
We have begun several initiatives to improve our efficiency ratio. Several key initiatives involve changes to our technology and information systems including outsourcing the data centers and hardware for our core information technology system to Fiserv, Inc., which is our existing core software application provider, and designing, developing, and implementing our data warehouse and customer relationship management programs. Additionally, during the third quarter of 2013, we began to implement a staff right-sizing plan. These initiatives are currently in progress and will continue into 2014. With the assistance of third-party consultants, we have completed comprehensive assessments and plans and are effectively managing and monitoring the execution of these initiatives. However, as a result of the significance of the changes, we could experience adverse effects on our operations. These adverse effects may include system transactional or reporting errors and delays, short-term reduced productivity, undesired personnel turnover, and loss of key customer relationships. If any of these effects were to occur it could have a material adverse impact on our results of operations. Additionally, these changes could require us to change our internal and management control environment.
Financial services companies depend on the accuracy and completeness of information about customers and counterparties.
In deciding whether to extend credit or enter into other transactions, we may rely on information furnished by or on behalf of customers and counterparties, including financial statements, credit reports and other financial information. We may also rely on representations of those customers, counterparties or other third parties, such as independent auditors, as to the accuracy and completeness of that information. Reliance on inaccurate or misleading financial statements, credit reports or other financial information could have a material adverse impact on our business and, in turn, our financial condition and results of operations.
We are subject to various legal claims and litigation.
From time to time, customers, employees and others that we do business with make claims and take legal action against us for various business occurrences, including the performance of our fiduciary responsibilities. Regardless of whether these claims and legal actions are founded or unfounded, if such claims and legal actions are not resolved in a manner favorable to us, they may result in significant financial liability and/or adversely affect the market perception of us and our products and services, as well as impact customer demand for our products and services. Any financial liability or reputational damage could have a material adverse effect on our business, which, in turn, could have a material adverse effect on our financial condition and results of operations. Even if these claims and legal actions do not result in a financial liability or reputational damage, defending these claims and actions have resulted in, and will continue to result in, increased legal and professional services costs, which adds to our noninterest expense and negatively impacts our operating results.
22
We operate in a highly competitive industry and market area.
We face substantial competition in all areas of our operations from a variety of different competitors, many of which are larger and may have more financial resources. Such competitors primarily include national, regional and community banks within the various markets we operate. Additionally, various out of state banks conduct significant business in the market areas in which we currently operate. We also face competition from many other types of financial institutions, including, without limitation, savings banks, credit unions, finance companies, brokerage firms, insurance companies, factoring companies and other financial intermediaries.
The financial services industry could become even more competitive as a result of legislative, regulatory and technological changes and continued consolidation. Banks, securities firms and insurance companies can merge under the umbrella of a financial holding company, which can offer virtually any type of financial service, including banking, securities underwriting, insurance (both agency and underwriting) and merchant banking. Also, technology has lowered barriers to entry and made it possible for non-banks to offer products and services traditionally provided by banks, such as automatic transfer and automatic payment systems. Many of our competitors have fewer regulatory constraints and may have lower cost structures. Additionally, due to their size, many competitors may be able to achieve economies of scale and, as a result, may offer a broader range of products and services as well as better pricing for those products and services than we can.
Our ability to compete successfully depends on a number of factors, including, among other things:
|
·
|
the ability to develop, maintain and build upon long-term customer relationships based on top quality service, high ethical standards and safe, sound assets;
|
|
·
|
the ability to expand our market position;
|
|
·
|
the scope, relevance and pricing of products and services offered to meet customer needs and demands;
|
|
·
|
the rate at which we introduce new products and services relative to our competitors;
|
|
·
|
customer satisfaction with our level of service; and
|
|
·
|
industry and general economic trends.
|
Failure to perform in any of these areas could significantly weaken our competitive position, which could adversely affect our growth and profitability, which, in turn, could have a material adverse effect on our financial condition and results of operations.
The soundness of our financial condition may also affect our competitiveness. Customers may decide not to do business with the bank due to its financial condition. We have and continue to face additional regulatory restrictions that our competitors may not be subject to, including reducing our commercial real estate loan portfolio and improving the overall risk profile of the Company, which could adversely impact our ability to compete and attract and retain customers.
We are dependent on key personnel and the loss of one or more of those key personnel may materially and adversely affect our prospects.
Competition for qualified employees and personnel in the banking industry is intense and there is a limited number of qualified persons with knowledge of, and experience in, the regional banking industry, especially in the Hawaii market. The process of recruiting personnel with the combination of skills and attributes required to carry out our strategies is often lengthy. Our success depends to a significant degree upon our ability to attract and retain qualified management, loan origination, finance, administrative, marketing, and technical personnel, and upon the continued contributions of our management and personnel. In particular, our success has been and continues to be highly dependent upon the abilities of key executives, including our Chief Executive Officer, our Chief Financial Officer, our Chief Banking Officer, and certain other employees.
Our business could be adversely affected by unfavorable actions from rating agencies.
Ratings assigned by ratings agencies to us, our affiliates or our securities may impact the decision of certain customers, in particular, institutions, to do business with us. A rating downgrade or a negative rating could adversely affect our deposits and our business relationships. On May 16, 2012, Fitch Ratings upgraded the long-term Issuer Default Rating of the Company and the bank to BB- from B+ and assigned a Stable Rating Outlook. On September 23, 2013, Fitch Ratings upgraded the long-term Issuer Default Rating of the Company and the bank to BB+ from BB- and affirmed a Stable Rating Outlook. However, our ratings may not improve further and may be downgraded in the future if there are adverse developments concerning our business.
23
We may suffer substantial losses due to our agreements to indemnify investors in the Private Placement against a broad range of potential claims.
In our agreements with the investors in the Private Placement, we agreed to indemnify the investors for a broad range of claims, including losses resulting from the inaccuracy or breach of representations or warranties made by us in such agreements and the breach by us to perform our covenants contained in such agreements. While these indemnities are subject to various limitations, if claims were successfully brought against us, it could potentially result in significant losses for the Company.
As a result of the recapitalization, Carlyle and Anchorage are substantial holders of our common stock.
Following the closing of the recapitalization, Anchorage and Carlyle each became beneficial owners of our outstanding common stock, with their respective ownership percentages each equating to approximately 22% as of December 31, 2013. Each has a representative on our Board of Directors. Accordingly, Anchorage and Carlyle have influence over the election of directors to our board and over corporate policy, including decisions to enter into mergers or other extraordinary transactions. In addition, Carlyle and Anchorage have certain preemptive rights to maintain their respective fully diluted percentage ownership of our common stock in the event of certain issuances of securities by us. In pursuing their economic interests, Anchorage and Carlyle may make decisions with respect to fundamental corporate transactions that may not be aligned with the interests of other shareholders.
Failure to maintain effective internal control over financial reporting or disclosure controls and procedures could adversely affect our ability to report our financial condition and results of operations accurately and on a timely basis.
A failure to maintain effective internal control over financial reporting or disclosure controls and procedures could adversely affect our ability to report our financial results accurately and on a timely basis, which could result in a loss of investor confidence in our financial reporting or adversely affect our access to sources of liquidity. Furthermore, because of the inherent limitations of any system of internal control over financial reporting, including the possibility of human error, the circumvention or overriding of controls and fraud, even effective internal controls may not prevent or detect all misstatements.
We have identified a material weakness in our internal control over financial reporting as of December 31, 2013 related to our allowance for loan and lease losses calculation as described in Item 9A, “Controls and Procedures” in this Form 10-K.
The market price of our common stock could decline.
The trading price of our common stock may fluctuate widely as a result of a number of factors, many of which are outside our control. In addition, the stock market is subject to fluctuations in the share prices and trading volumes that affect the market prices of the shares of many companies. These broad market fluctuations could adversely affect the market price of our common stock. Among the factors that could affect our stock price are:
|
|
·
|
failure to comply with all of the requirements of any governmental orders or agreements we are or may become subject to and the possibility of resulting action by the regulators;
|
|
|
·
|
deterioration of asset quality;
|
|
|
·
|
the incurrence of losses;
|
|
|
·
|
actual or anticipated quarterly fluctuations in our operating results and financial condition;
|
|
|
·
|
changes in revenue or earnings/losses estimates or publication of research reports and recommendations by financial analysts;
|
|
|
·
|
failure to meet analysts’ revenue or earnings/losses estimates;
|
|
|
·
|
speculation in the press or investment community;
|
|
|
·
|
strategic actions by us or our competitors, such as acquisitions or restructurings;
|
|
|
·
|
additions or departures of key personnel;
|
24
|
|
·
|
actions by institutional shareholders;
|
|
|
·
|
fluctuations in the stock price and operating results of our competitors;
|
|
|
·
|
future sales of our common stock, including sales of our common stock in short sale transactions;
|
|
|
·
|
general market conditions and, in particular, developments related to market conditions for the financial services industry;
|
|
|
·
|
proposed or adopted regulatory changes or developments;
|
|
|
·
|
breaches in our security systems and loss of customer data;
|
|
|
·
|
anticipated or pending investigations, proceedings or litigation that involve or affect us; or
|
|
|
·
|
domestic and international economic factors unrelated to our performance.
|
The stock market and, in particular, the market for financial institution stocks, have experienced significant volatility over the past few years. In addition, the trading volume in our common stock may fluctuate more than usual and cause significant price variations to occur. In addition, sales of shares by investors in the Private Placement may cause our share price to decrease. Accordingly, the common stock that you purchase may trade at a price lower than that at which they were purchased. Volatility in the market price of our common stock may prevent individual shareholders from being able to sell their shares when they want or at prices they find attractive.
A significant decline in our stock price could result in substantial losses for shareholders and could lead to costly and disruptive securities litigation.
The transferability of our common stock is limited as a result of the Tax Benefits Preservation Plan and the Protective Charter Amendment.
As described under “—Risk Factors Related to our Business—Our ability to use net operating loss carryforwards to reduce future tax payments may be limited or restricted,” we have generated significant NOLs as a result of our recent losses. In order to reduce the likelihood that transactions in our common stock would result in an ownership change, on November 23, 2010, we adopted a Tax Benefits Preservation Plan, which provides an economic disincentive for any person or group to become an owner, for relevant tax purposes, of 4.99% or more of our common stock. On January 29, 2014, our Board of Directors approved an extension of the Tax Benefits Preservation Plan by up to an additional two years. To further protect our NOLs, we filed the Protective Charter Amendment on May 2, 2011 to restrict transfers of our stock if the effect of an attempted transfer would cause the transferee to become a Threshold Holder or cause the beneficial ownership of a Threshold Holder to increase. The Protective Charter Amendment expires on the earliest of (i) May 2, 2014, (ii) such time as the Board of Directors determines the Protective Charter Amendment is no longer necessary for the preservation of our tax benefits and (iii) the date the Board of Directors determines that the Protective Charter Amendment is no longer in our and our shareholders’ best interest, provided, however, our Board of Directors has approved an amendment to the Protective Charter Amendment to extend the May 2, 2014 date to May 2, 2016, subject to approval by our shareholders.
The Tax Benefits Preservation Plan and the Protective Charter Amendment have the effect of limiting transferability of our common stock because they may make it more difficult and more expensive to acquire our common stock under the circumstances described above and, in the case of the Protective Charter Amendment, prohibit certain acquisitions of our common stock as described above. These transfer restrictions may discourage, delay or prevent a change in control of the Company and make it more difficult for a potential acquirer to consummate an acquisition of the Company. In addition, these provisions could limit the price that investors would be willing to pay in the future for our common shares and may limit a shareholder’s ability to dispose of our common shares by reducing the class of potential acquirers for our common shares.
25
Anti-takeover provisions in our restated articles of incorporation and bylaws and applicable federal and state law may limit the ability of another party to acquire us, which could cause our stock price to decline.
Various provisions of our restated articles of incorporation and bylaws and certain other actions we have taken could delay or prevent a third-party from acquiring us, even if doing so might be beneficial to our shareholders. These include, among other things, the Tax Benefits Preservation Plan, the Protective Charter Amendment and the authorization to issue “blank check” preferred stock by action of the board of directors acting alone, thus without obtaining shareholder approval. In addition, applicable provisions of federal and state law require regulatory approval in connection with certain acquisitions of our common stock and supermajority voting provisions in connection with certain transactions. These provisions of our restated articles of incorporation and by-laws and federal and state law may prevent a merger or acquisition that would be attractive to shareholders and could limit the price investors would be willing to pay in the future for our common stock.
Resales of our common stock in the public market may cause the market price of our common stock to fall.
We issued a large number of common stock to the investors in the Private Placement. Carlyle and Anchorage (the “Lead Investors”) have certain registration rights with respect to the common stock held by them. The registration rights for the Lead Investors will allow them to sell their common stock without compliance with the volume and manner of sale limitations under Rule 144 promulgated under the Securities Act. The market value of our common stock could decline as a result of sales by the Lead Investors from time to time of a substantial amount of the common stock held by them.
Our common stock is equity and therefore is subordinate to our subsidiaries’ indebtedness and preferred stock.
Our common stock constitutes equity interests and does not constitute indebtedness. As such, common stock will rank junior to all current and future indebtedness and other non-equity claims on us with respect to assets available to satisfy claims against us, including in the event of our liquidation. We may, and the bank and our other subsidiaries may also, incur additional indebtedness from time to time and may increase our aggregate level of outstanding indebtedness. As of December 31, 2013, we had $90.0 million in face amount of trust preferred securities outstanding and accrued and unpaid dividends thereon of $0.2 million. Additionally, holders of common stock are subject to the prior dividend and liquidation rights of any holders of our preferred stock that may be outstanding from time to time. The Board of Directors is authorized to cause us to issue additional classes or series of preferred stock without any action on the part of our stockholders. If we issue preferred shares in the future that have a preference over our common stock with respect to the payment of dividends or upon liquidation, or if we issue preferred shares with voting rights that dilute the voting power of the common stock, then the rights of holders of our common stock or the market price of our common stock could be adversely affected.
There is a limited trading market for our common stock and as a result, you may not be able to resell your shares at or above the price you pay for them.
Although our common stock is listed for trading on the NYSE, the volume of trading in our common shares is lower than many other companies listed on the NYSE. A public trading market with depth, liquidity and orderliness depends on the presence in the market of willing buyers and sellers of our common shares at any given time. This presence depends on the individual decisions of investors and general economic and market conditions over which we have no control.
Our common stock is not insured and you could lose the value of your entire investment.
An investment in our common stock is not a deposit and is not insured against loss by the government.
Completion of our Tender Offer and the transactions contemplated by the Repurchase Agreements we have entered into with our two largest shareholders may reduce the liquidity of our common stock.
Depending on how many shares of our common stock we repurchase in the Tender Offer and pursuant to the Repurchase Agreements, our “public float” (the number of shares owned by non-affiliate shareholders and available for trading in the securities markets) may be substantially reduced. This reduction in our public float may result in lower stock prices and/or reduced liquidity in the trading market for our common stock.
26
|
ITEM 1B.
|
UNRESOLVED STAFF COMMENTS |
None.
Certifications
We have filed the required certifications under Section 302 of the Sarbanes-Oxley Act of 2002 as Exhibits 31.1 and 31.2 to this annual report on Form 10-K for the fiscal year ended December 31, 2013. Last year, we submitted to the NYSE on May 14, 2013 our annual CEO certification regarding the Company’s compliance with the NYSE’s corporate governance listing standards. This year, we intend to submit to the NYSE our annual CEO certification within 30 days of the Company’s annual meeting of shareholders, which is scheduled for April 25, 2014.
|
ITEM 2.
|
PROPERTIES |
We hold title to the land and building in which our Main branch office and headquarters, Hilo branch office, Kailua-Kona branch office, Pearl City branch office and certain operations offices are located. We also hold title to portions of the land our Moiliili branch office and operations center are located. The remaining lands on which the Moiliili branch office and operations center are located are leased, as are all remaining branch and support office facilities. We also own four floors of a commercial office condominium in downtown Honolulu where certain administrative and support operations are located.
We occupy or hold leases for approximately 40 other properties including office space for our remaining branches and residential mortgage lending subsidiary. These leases expire on various dates through 2038 and generally contain renewal options for periods ranging from five to 15 years. For additional information relating to lease rental expense and commitments as of December 31, 2013, see Note 18 to the Consolidated Financial Statements under “Part II, Item 8. Financial Statements and Supplementary Data.”
|
ITEM 3.
|
LEGAL PROCEEDINGS |
Certain claims and lawsuits have been filed or are pending against us arising in the ordinary course of business. In the opinion of management, all such matters are of a nature that, if disposed of unfavorably, would not have a material adverse effect on our consolidated results of operations or financial position.
|
ITEM 4.
|
MINE SAFETY DISCLOSURES |
Not applicable
27
|
ITEM 5.
|
MARKET FOR REGISTRANT’S COMMON EQUITY, RELATED SHAREHOLDER MATTERS AND ISSUER PURCHASES OF EQUITY SECURITIES
|
Our common stock is traded on the NYSE under the ticker symbol “CPF.” Set forth below is a line graph comparing the cumulative total stockholder return on the Company’s common stock, based on the market price of the common stock and assuming reinvestment of dividends, with the Russell 2000 Index and the S&P SmallCap 600 Commercial Bank Index for the five year period commencing December 31, 2008 and ending December 31, 2013. The graph assumes the investment of $100 on December 31, 2008.
Indexed Total Annual Return
(as of December 31, 2013)
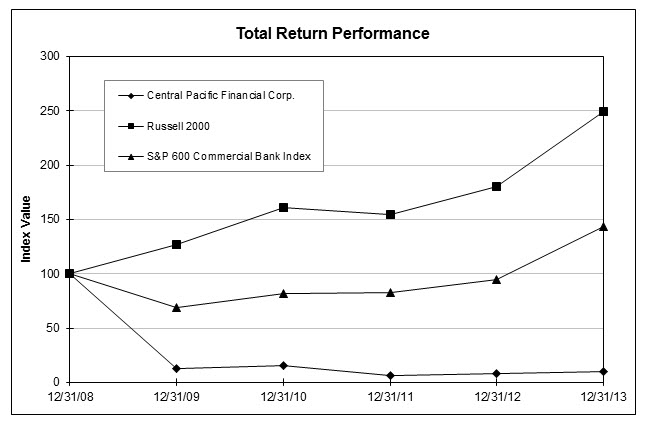
The following table sets forth information on the range of high and low sales prices of our common stock as reported by the NYSE, for each full quarterly period within 2013 and 2012:
|
Year Ended December 31,
|
||||||||||||||
|
2013
|
2012
|
|||||||||||||
|
High
|
Low
|
High
|
Low
|
|||||||||||
|
First quarter
|
$ | 16.65 | $ | 15.20 | $ | 14.40 | $ | 12.54 | ||||||
|
Second quarter
|
18.84 | 14.71 | 14.49 | 12.02 | ||||||||||
|
Third quarter
|
19.21 | 16.75 | 15.00 | 12.80 | ||||||||||
|
Fourth quarter
|
20.26 | 17.14 | 15.60 | 13.72 | ||||||||||
As of February 14, 2014, there were 2,739 shareholders of record, excluding individuals and institutions for which shares were held in the names of nominees and brokerage firms.
28
Dividends
The following table sets forth information on dividends declared per share of common stock for each quarterly period within 2013 and 2012:
|
Year Ended December 31,
|
||||||
|
2013
|
2012
|
|||||
|
First quarter
|
$ | - | $ | - | ||
|
Second quarter
|
- | - | ||||
|
Third quarter
|
0.08 | - | ||||
|
Fourth quarter
|
0.08 | - | ||||
The holders of our common stock share proportionately, on a per share basis, in all dividends and other distributions declared by our Board of Directors.
Under the terms of our trust preferred securities, our ability to pay dividends with respect to common stock was restricted until our obligations under our trust preferred securities were brought current. Our obligations on our outstanding trust preferred securities were brought current in the first quarter of 2013.
Additionally, our ability to pay dividends depends on our ability to obtain dividends from our bank. As a Hawaii state-chartered bank, the bank may only pay dividends to the extent it has retained earnings as defined under Hawaii banking law (“Statutory Retained Earnings”), which differs from GAAP retained earnings. As of December 31, 2013, the bank had Statutory Retained Earnings of $240.4 million. In 2013, in light of the Company's improved capital position and financial condition, our Board of Directors in consultation with our regulators, reinstated and declared quarterly cash dividends of $0.08 per share on the Company’s outstanding common shares, payable to shareholders of record at the close of business on August 30, 2013 and November 29, 2013. These dividends were paid on September 16, 2013 and December 16, 2013, respectively. In January 2014, the Company’s Board of Directors declared a third consecutive quarterly cash dividend of $0.08 per share on the Company’s outstanding common shares, payable on March 17, 2014 to shareholders of record at the close of business on February 28, 2014.
Dividends are payable at the discretion of the Board of Directors and there can be no assurance that the Board of Directors will continue to pay dividends at the same rate, or at all, in the future. Our ability to pay cash dividends to our shareholders is subject to restrictions under federal and Hawaii law, including restrictions imposed by the FRB and covenants set forth in various agreements we are a party to, including covenants set forth in our subordinated debentures.
See “Part I, Item 1. Business – Supervision and Regulation – Regulatory Actions” for a discussion on regulatory restrictions. For additional information regarding our previous election to defer payments on our trust preferred securities, see Note 14 to the Consolidated Financial Statements under “Part II, Item 8. Financial Statements and Supplementary Data.”
Issuer Purchases of Equity Securities
There were no repurchases of the Company’s common stock during the fourth quarter of 2013.
As disclosed previously in this report, on February 21, 2014, we publicly announced a tender offer and the entry into repurchase agreements with our two largest investors to repurchase in the aggregate up to $125 million of our common stock.
Information relating to compensation plans under which equity securities of the Registrant are authorized for issuance is set forth under “Part III, Item 12—Security Ownership of Certain Beneficial Owners and Management and Related Stockholder Matters.”
29
|
ITEM 6.
|
SELECTED CONSOLIDATED FINANCIAL DATA |
The following table sets forth selected financial information for each of the years in the five-year period ended December 31, 2013. This information is not necessarily indicative of results of future operations and should be read in conjunction with “Part II, Item 7. Management’s Discussion and Analysis of Financial Condition and Results of Operations” and the Consolidated Financial Statements and related Notes contained in “Part II, Item 8. Financial Statements and Supplementary Data.”
|
Year Ended December 31,
|
||||||||||||||||||||
|
Selected Financial Data
|
2013
|
2012
|
2011
|
2010
|
2009
|
|||||||||||||||
|
(Dollars in thousands, except per share data)
|
||||||||||||||||||||
|
Statement of Operation Data:
|
||||||||||||||||||||
|
Total interest
income
|
$ | 140,278 | $ | 128,445 | $ | 136,450 | $ | 160,754 | $ | 242,237 | ||||||||||
|
Total interest expense
|
7,169 | 8,734 | 18,629 | 42,101 | 67,715 | |||||||||||||||
|
Net interest income
|
133,109 | 119,711 | 117,821 | 118,653 | 174,522 | |||||||||||||||
|
Provision (credit) for loan and lease losses
|
(11,310 | ) | (18,885 | ) | (40,690 | ) | 159,548 | 348,801 | ||||||||||||
|
Net interest income (loss) after provision for loan and lease losses
|
144,419 | 138,596 | 158,511 | (40,895 | ) | (174,279 | ) | |||||||||||||
|
Other operating income
|
54,945 | 60,743 | 57,002 | 57,700 | 57,723 | |||||||||||||||
|
Goodwill impairment
|
- | - | - | 102,689 | 50,000 | |||||||||||||||
|
Other operating expense (excluding goodwill impairment)
|
139,536 | 151,918 | 178,942 | 165,069 | 167,186 | |||||||||||||||
|
Income (loss) before income taxes
|
59,828 | 47,421 | 36,571 | (250,953 | ) | (333,742 | ) | |||||||||||||
|
Income tax benefit
|
(112,247 | ) | - | - | - | (19,995 | ) | |||||||||||||
|
Net income (loss)
|
172,075 | 47,421 | 36,571 | (250,953 | ) | (313,747 | ) | |||||||||||||
|
Balance Sheet Data (Year-End):
|
||||||||||||||||||||
|
Interest-bearing deposits in other banks
|
$ | 4,256 | $ | 120,902 | $ | 180,839 | $ | 729,014 | $ | 400,470 | ||||||||||
|
Investment securities (1)
|
1,660,046 | 1,698,593 | 1,493,925 | 705,345 | 924,359 | |||||||||||||||
|
Loans and leases
|
2,630,601 | 2,203,944 | 2,064,447 | 2,169,444 | 3,041,980 | |||||||||||||||
|
Allowance for loan and lease losses
|
83,820 | 96,413 | 122,093 | 192,854 | 205,279 | |||||||||||||||
|
Goodwill
|
- | - | - | - | 102,689 | |||||||||||||||
|
Other intangible assets
|
32,783 | 37,499 | 41,986 | 44,639 | 45,390 | |||||||||||||||
|
Total assets
|
4,741,198 | 4,370,368 | 4,132,865 | 3,938,051 | 4,869,522 | |||||||||||||||
|
Core deposits (2)
|
3,093,279 | 3,006,657 | 2,786,215 | 2,796,144 | 2,951,119 | |||||||||||||||
|
Total deposits
|
3,936,173 | 3,680,772 | 3,443,528 | 3,132,947 | 3,568,916 | |||||||||||||||
|
Long-term debt
|
92,799 | 108,281 | 158,298 | 459,803 | 657,874 | |||||||||||||||
|
Total shareholders' equity
|
660,113 | 504,822 | 456,440 | 66,052 | 335,963 | |||||||||||||||
|
Per Share Data:
|
||||||||||||||||||||
|
Basic earnings (loss) per share
|
$ | 4.10 | $ | 1.14 | $ | 3.36 | $ | (171.13 | ) | $ | (220.56 | ) | ||||||||
|
Diluted earnings (loss) per share
|
4.07 | 1.13 | 3.31 | (171.13 | ) | (220.56 | ) | |||||||||||||
|
Cash dividends declared
|
0.16 | - | - | - | - | |||||||||||||||
|
Book value
|
15.68 | 12.06 | 10.93 | (42.18 | ) | 136.50 | ||||||||||||||
|
Diluted weighted average shares outstanding (in thousands)
|
42,317 | 42,084 | 36,342 | 1,516 | 1,459 | |||||||||||||||
|
Financial Ratios:
|
||||||||||||||||||||
|
Return (loss) on average assets
|
3.73 | % | 1.13 | % | 0.90 | % | (5.74 | ) % | (5.87 | ) % | ||||||||||
|
Return (loss) on average shareholders' equity
|
27.70 | 9.81 | 9.83 | (140.73 | ) | (54.99 | ) | |||||||||||||
|
Net income (loss) to average tangible shareholders' equity
|
28.34 | 10.17 | 10.41 | (193.24 | ) | (77.60 | ) | |||||||||||||
|
Average shareholders' equity to average assets
|
13.47 | 11.49 | 9.17 | 4.08 | 10.67 | |||||||||||||||
|
Efficiency ratio (3)
|
74.97 | 78.89 | 92.06 | 82.88 | 63.52 | |||||||||||||||
|
Net interest margin (4)
|
3.19 | 3.10 | 3.09 | 2.91 | 3.62 | |||||||||||||||
|
Net loan charge-offs to average loans and leases
|
0.05 | 0.32 | 1.42 | 6.33 | 7.03 | |||||||||||||||
|
Nonaccrual loans to total loans and leases and loans held for sale (5)
|
1.57 | 3.54 | 6.33 | 10.96 | 15.13 | |||||||||||||||
|
Allowance for loan and lease losses to total loans and leases
|
3.19 | 4.37 | 5.91 | 8.89 | 6.75 | |||||||||||||||
|
Allowance for loan and lease losses to nonaccrual loans (5)
|
201.55 | 121.53 | 91.17 | 78.62 | 43.41 | |||||||||||||||
|
Dividend payout ratio
|
3.93 | N/A | N/A | N/A | N/A | |||||||||||||||
|
(1) Held-to-maturity securities at amortized cost, available-for-sale securities at fair value.
|
||||||||||||||||||||
|
(2) Noninterest-bearing demand, interest-bearing demand and savings deposits, and time deposits under $100,000.
|
||||||||||||||||||||
|
(3) The efficiency ratio is a non-GAAP financial measure which should be read and used in conjunction with the Company’s GAAP financial information.
|
||||||||||||||||||||
|
Comparison of our efficiency ratio with those of other companies may not be possible because other companies may calculate the efficiency ratio
|
||||||||||||||||||||
|
differently. Our efficiency ratio is derived by dividing other operating expense (excluding amortization, impairment and write-down of intangible
|
||||||||||||||||||||
|
assets, goodwill, loans held for sale and foreclosed property, loss on early extinguishment of debt, loss on investment transaction, loss on sale of
|
||||||||||||||||||||
|
commercial real estate loans, and foreclosed asset expense) by net operating revenue (net interest income on a taxable equivalent basis plus other
|
||||||||||||||||||||
|
operating income before securities and foreclosed assets transactions). See Item 7 – Management’s Discussion and Analysis of Financial Condition
|
||||||||||||||||||||
|
and Results of Operations –Table 7. Reconciliation to Efficiency Ratio.
|
||||||||||||||||||||
|
(4) Computed on a taxable equivalent basis using an assumed income tax rate of 35%.
|
||||||||||||||||||||
|
(5) Nonaccrual loans include loans held for sale.
|
||||||||||||||||||||
30
Five Year Performance Comparison
The significant items affecting the comparability of the five years’ performance include:
|
·
|
Credit to the provision for loan and lease losses of $11.3 million , $18.9 million and $40.7 million in 2013, 2012 and 2011, respectively, compared to a charge of $159.5 million and $348.8 million in 2010 and 2009, respectively;
|
|
·
|
Valuation allowance against net deferred tax assets (“DTAs”) of $6.7 million, $147.5 million, $162.3 million, $178.8 million and $104.6 million in 2013, 2012, 2011, 2010 and 2009, respectively;
|
|
·
|
Net gains on sales of residential mortgage loans of $10.0 million, $17.1 million, $8.1 million, $8.5 million, and $13.6 million in 2013, 2012, 2011, 2010, and 2009, respectively;
|
|
·
|
Net gains on sales of foreclosed assets of $8.6 million, $5.0 million, $6.8 million, $0.7 million, and $0.3 million in 2013, 2012, 2011, 2010, and 2009, respectively;
|
|
·
|
Gain on early extinguishment of debt of $1.0 million in 2013, compared to a loss on early extinguishment of debt of $6.2 million and $5.7 million in 2011 and 2010, respectively;
|
|
·
|
Gain on ineffective portion of derivative of $0.1 million, $1.0 million, and $3.4 million in 2013, 2011, and 2009, respectively, compared to a loss on ineffective portion of derivative of $0.1 million in 2012;
|
|
·
|
Share-based compensation expense of $6.4 million, $4.6 million, $2.6 million, $0.4 million, and $0.4 million recognized in 2013, 2012, 2011, 2010, and 2009, respectively;
|
|
·
|
Foreclosed asset expense of $1.0 million, $6.9 million, $11.4 million, $9.6 million, and $9.0 million in 2013, 2012, 2011, 2010, and 2009, respectively;
|
|
·
|
Write down of assets of $2.6 million, $4.6 million, $1.5 million, and $5.0 million in 2012, 2011, 2010, and 2009, respectively;
|
|
·
|
Contributions to the Central Pacific Bank Foundation of $0.7 million, $0.8 million and $8.5 million in 2013, 2012, and 2011, respectively;
|
|
·
|
FDIC insurance premiums of $2.7 million, $4.9 million, $6.8 million, $12.6 million, and $12.2 million in 2013, 2012, 2011, 2010, and 2009, respectively;
|
|
·
|
Credit to the reserve for unfunded loan commitments of $3.5 million, $1.7 million, and $1.1 million in 2013, 2012, and 2010, respectively, compared to a charge of $1.6 million and $1.6 million in 2011 and 2009, respectively;
|
|
·
|
Credit to the provision for repurchased residential mortgage loans of $0.1 million and $2.0 million in 2013 and 2012, respectively, compared to a charge of $5.0 million and $6.1 million in 2011 and 2010, respectively;
|
|
·
|
Goodwill impairment charges of $102.7 million and $50.0 million in 2010 and 2009, respectively;
|
|
·
|
Gain on sale of property of $7.7 million and $3.6 million in 2010 and 2009, respectively; and
|
|
·
|
Tax contingency settlement benefits of $2.3 million in 2009.
|
31
|
ITEM 7.
|
MANAGEMENT'S DISCUSSION AND ANALYSIS OF FINANCIAL CONDITION AND RESULTS OF OPERATIONS
|
Introduction
We are a bank holding company that, through our banking subsidiary, Central Pacific Bank, offers full service commercial banking in the state of Hawaii.
Our products and services consist primarily
of the following:
|
|
·
|
Loans
: Our loans consist of commercial, commercial mortgage, construction loans, and leases to small and medium-sized companies, business professionals, and real estate developers, as well and residential mortgage and consumer loans to local homebuyers and individuals. Our lending activities contribute to a key component of our revenues—interest income.
|
|
|
·
|
Deposits
: We strive to provide exceptional customer service and products that meet our customers’ needs, like our Value Plus Checking, as well as our Exceptional Checking & Savings and Super Savings accounts. We also maintain a broad branch and ATM network in the state of Hawaii. The interest paid on such deposits has a significant impact on our interest expense, an important factor in determining our earnings. In addition, fees and service charges on deposit accounts contribute to our revenues.
|
Additionally, we offer wealth management products and services, such as non-deposit investment products, annuities, insurance, investment management, asset custody and general consultation and planning services.
In this discussion, we have included statements that may constitute “forward-looking statements” within the meaning of the safe harbor provisions of The Private Securities Litigation Reform Act of 1995. These forward-looking statements are not historical facts but instead represent only our beliefs regarding future events, many of which, by their nature, are inherently uncertain and beyond our control. These statements relate to our future plans and objectives, among other things. By identifying these statements for you in this manner, we are alerting you to the possibility that our actual results may differ, possibly materially, from the results indicated in the forward-looking statements. Important factors that could, among others, cause our results to differ, possibly materially, from those indicated in the forward-looking statements are discussed above under “Part 1. Forward-Looking Statements and Factors that Could Affect Future Results” and “Part I, Item 1A. Risk Factors—Factors that May Affect our Business.”
Executive Overview
We continued to make significant progress toward a full recovery of our Company in 2013. After three years of net losses in 2008 to 2010, we recorded our twelfth consecutive profitable quarter in the fourth quarter of 2013. During fiscal 2013, we reported net income of $172.1 million, compared to net income of $47.4 million and $36.6 million in fiscal 2012 and 2011, respectively. Net income in 2013 included a non-cash income tax benefit of $119.8 million recorded in the first quarter of 2013 related to the reversal of a significant portion of a valuation allowance that was established against the Company’s net DTA during the third quarter of 2009. We also saw continued improvement in our asset quality as we reduced our nonperforming assets by $43.2 million to $46.8 million at December 31, 2013 from $90.0 million at December 31, 2012.
As a result of the continued improvement in our credit risk profile, we were able to reduce our allowance for loan and lease losses (the “Allowance”), which resulted in a positive impact to earnings. Our total credit costs during fiscal 2013, which include the provision for loan and lease losses (the “Provision”), write-downs of loans classified as held for sale, foreclosed asset expense, gains on sales of foreclosed assets, and the change in the reserve for unfunded loan commitments, totaled a credit of $22.4 million, compared to a credit of $16.1 million in 2012.
With the improving market conditions in Hawaii, together with our efforts to increase market share, we realized strong loan growth of $426.7 million, or 19.4%, as well as an increase of $86.6 million, or 2.9% in our core deposit base in 2013. Our capital position remained strong, supported by three years of profitability and the improvements in our asset quality. As a result of our stable financial performance, two of the regulatory enforcement actions the bank and CPF were previously subject to were terminated in 2012 and 2013.
Basis of Presentation
Management’s discussion and analysis of financial condition and results of operations should be read in conjunction with the accompanying consolidated financial statements under “Part II, Item 8. Financial Statements and Supplementary Data.”
32
Business Environment
While there remains continued uncertainty in the global macroeconomic environment, the U.S. economy has continued to stabilize following the economic downturn caused by disruptions in the financial system beginning in 2007.
Despite this stabilization, growing U.S. government indebtedness, elevated unemployment rates, a large budget deficit and periodic concerns over the federal debt ceiling continue to add to the uncertainty surrounding a sustained economic recovery. In addition, downgrades of ratings in U.S. and foreign debt instruments could raise borrowing costs and adversely impact the mortgage and housing markets.
The majority of our operations are concentrated in the state of Hawaii. As a result, our performance is significantly influenced by conditions in the banking industry, macroeconomic conditions and the real estate markets in Hawaii. A favorable business environment is generally characterized by expanding gross state product, low unemployment and rising personal income; while an unfavorable business environment is characterized by the reverse.
Hawaii’s general economic conditions continued to improve in 2013. Tourism continues to be Hawaii’s center of strength and its most significant economic driver. Hawaii’s strong visitor industry broke records for arrivals and visitor spending for the second consecutive year in 2013. According to the Hawaii Tourism Authority (“HTA”), 8.2 million total visitors arrived in the state in 2013. This was an increase of 2.6% from the previous high of 8.0 million visitor arrivals in 2012. The HTA also reported that total spending by visitors increased to $14.5 billion in 2013, an increase of $286.2 million, or 2.0%, from the previous high of $14.3 billion in 2012. According to the Hawaii Department of Business Economic Development & Tourism (“DBEDT”), total visitor arrivals and visitor spending are expected to gain 2.7% and 4.2% in 2014, respectively.
The Department of Labor and Industrial Relations reported that Hawaii’s seasonally adjusted annual unemployment rate improved to 4.5% in December 2013, compared to 5.1% in December 2012. In addition, Hawaii’s unemployment rate in December 2013 of 4.5% remained below the national seasonally adjusted unemployment rate of 6.7%. DBEDT projects Hawaii’s seasonally adjusted annual unemployment rate to continue to improve to 4.2% in 2014.
Real personal income and real gross state product grew by approximately 2.3% and 2.4%, respectively, in 2013. DBEDT projects real personal income and real gross state product to grow by 3.3% and 2.8%, respectively, in 2014. Based on the recent developments in the national and global economy, the performance of Hawaii’s tourism industry, the labor market conditions in the state and growth of personal income and tax revenues, DBEDT expects Hawaii’s economy will continue positive growth in 2014.
Historically, real estate lending has been a primary focus for us, including construction, residential mortgage and commercial mortgage loans. As a result, we are dependent on the strength of Hawaii’s real estate market. According to the Honolulu Board of Realtors, Oahu unit sales volume increased 4.6% for single-family homes and increased 11.8% for condominiums in 2013 from 2012. The median resale price in 2013 for single-family homes on Oahu was $650,000, representing an increase of 4.8% from the median resale price of $620,000 in 2012. The median resale price for condominiums on Oahu was $332,000, representing an increase of 4.6% from the median resale price of $317,500 in 2012. We believe the Hawaii real estate market will continue to show improvements in 2014, however, there can be no assurance that this will occur.
As we have seen in the past, our operating results are significantly impacted by: (i) the economy in Hawaii, and to a significantly lesser extent, California, and (ii) the composition of our loan portfolio. Loan demand, deposit growth, Provision, asset quality, noninterest income and noninterest expense are all affected by changes in economic conditions. If the residential and commercial real estate markets we have exposure to deteriorate as they did in 2008 through 2010, our results of operations would be negatively impacted. See “—Overview of Results of Operations—Concentrations of Credit Risk” for a further discussion on how a deteriorating real estate market, combined with the elevated concentration risk within our portfolio, could have a significant negative impact on our asset quality and credit losses.
Critical Accounting Policies and Use of Estimates
The preparation of financial statements in accordance with accounting principles generally accepted in the United States of America (“GAAP”) requires that management make certain judgments and use certain estimates and assumptions that affect amounts reported and disclosures made. Accounting estimates are deemed critical when a different estimate could have reasonably been used or where changes in the estimate are reasonably likely to occur from period to period and would materially impact our consolidated financial statements as of or for the periods presented. Management has discussed the development and selection of the critical accounting estimates noted below with the Audit Committee of the Board of Directors, and the Audit Committee has reviewed the accompanying disclosures.
33
Allowance for Loan and Lease Losses
The Allowance is management’s estimate of credit losses inherent in our loan and lease portfolio at the balance sheet date. We maintain our Allowance at an amount we expect to be sufficient to absorb probable losses inherent in our loan and lease portfolio based on a projection of probable net loan charge-offs.
For loans classified as impaired, an estimated impairment loss is calculated. To estimate loan charge-offs on other loans, we evaluate the level and trend of nonperforming and potential problem loans and historical loss experience. We also consider other relevant economic conditions and borrower-specific risk characteristics, including current repayment patterns of our borrowers, the fair value of collateral securing specific loans, changes in our lending and underwriting standards and general economic factors, nationally and in the markets we serve, including the real estate market generally and the residential and commercial construction markets in particular. Estimated loss rates are determined by loan category and risk profile, and an overall required Allowance is calculated, which includes amounts for imprecision and uncertainty. Based on our estimate of the level of Allowance required, a corresponding charge or credit to the Provision is recorded to maintain the Allowance at an appropriate level.
Our policy is to charge a loan off in the period in which the loan is deemed to be uncollectible. We consider a loan to be uncollectible when it is probable that a loss has been incurred and the Company can make a reasonable estimate of the loss. In these instances, the likelihood of and/or timeframe for recovery of the amount due is uncertain, weak, or protracted.
Our process for determining the reserve for unfunded loan commitments is consistent with our process for determining the Allowance and is adjusted for estimated loan funding probabilities. The reserve for unfunded loan commitments is recorded separately through a valuation allowance included in other liabilities. Credit losses for off-balance sheet credit exposures are deducted from the allowance for credit losses on off-balance sheet credit exposures in the period in which the liability is settled. The allowance for credit losses on off-balance sheet credit losses is established by a charge to other operating expense.
Since we cannot predict with certainty the amount of loan and lease charge-offs that will be incurred and because the eventual level of loan and lease charge-offs are impacted by numerous conditions beyond our control, we use our historical loss experience adjusted for current conditions to determine the Allowance and Provision. In addition, various regulatory agencies, as an integral part of their examination processes, periodically review our Allowance. The determination of the Allowance requires us to make estimates of losses that are highly uncertain and involves a high degree of judgment. Accordingly, actual results could differ from those estimates. Changes in the estimate of the Allowance and related Provision could materially affect our operating results.
Loans Held for Sale
Loans held for sale consists of the following two types: (1) Hawaii residential mortgage loans that are originated with the intent to sell them in the secondary market and (2) non-residential mortgage loans in both Hawaii and the U.S. Mainland that were originated with the intent to be held in our portfolio but were subsequently transferred to the held for sale category. Hawaii residential mortgage loans classified as held for sale are carried at the lower of cost or fair value on an aggregate basis while the non-residential Hawaii and U.S. Mainland loans are recorded at the lower of cost or fair value on an individual basis.
When a non-residential mortgage loan is transferred to the held for sale category, the loan is recorded at the lower of cost or fair value. Any reduction in the loan’s value is reflected as a write-down of the recorded investment resulting in a new cost basis, with a corresponding reduction in the Allowance. In subsequent periods, if the fair value of a loan classified as held for sale is less than its cost basis, a valuation adjustment is recognized in our consolidated statement of income in other operating expense and the carrying value of the loan is adjusted accordingly. The valuation adjustment may be recovered in the event that the fair value increases, which is also recognized in our consolidated statement of income in other operating expense.
The fair value of loans classified as held for sale are generally based upon quoted prices for similar assets in active markets, acceptance of firm offer letters with agreed upon purchase prices, discounted cash flow models that take into account market observable assumptions, or independent appraisals of the underlying collateral securing the loans. We report the fair values of the non-residential mortgage loans classified as held for sale net of applicable selling costs on our consolidated balance sheets.
34
Reserve for Residential Mortgage Loan Repurchase Losses
We sell residential mortgage loans on a “whole-loan” basis to government-sponsored entities (“GSEs” or “Agencies”) Fannie Mae and Freddie Mac and also to non-agency investors. These loan sales occur under industry standard contractual provisions that include various representations and warranties, which typically cover ownership of the loan, compliance with loan criteria set forth in the applicable agreement, validity of the lien securing the loan and other similar matters. We may be required to repurchase certain loans sold with identified defects, indemnify the investor, or reimburse the investor for any credit losses incurred. We establish mortgage repurchase reserves related to various representations and warranties that reflect management’s estimate for which we have a repurchase obligation. The reserves are established by a charge to other operating expense in our consolidated statements of income. At December 31, 2013 and 2012, this reserve totaled $2.9 million and $3.6 million, respectively, and is included in other liabilities on our consolidated balance sheets.
The repurchase reserve is applicable to loans we originated and sold with representations and warranties, which is representative of the entire sold portfolio. Originations for agency and non-agency investors for vintages 2005 through 2013 were approximately $4.4 billion and $3.8 billion, respectively. Representations and warranties relating to borrower fraud generally are enforceable for the life of the loan, whereas early payment default clauses generally expire after 90 days, depending on the sales contract. We estimate that outstanding loans sold that have early payment default clauses as of December 31, 2013 total approximately $83.1 million.
The repurchase loss liability is estimated by origination year to capture certain characteristics of each vintage. To the extent that repurchase demands are made by investors, we may be able to successfully appeal such repurchase demands. However, our appeals success may be affected by the reasons for repurchase demands, the quality of the demands, and our appeals strategies. Repurchase and loss estimates are stratified by vintage, based on actual experience and certain assumptions relative to potential investor demand volume, appeals success rates, and losses recognized on successful repurchase demands.
Loans repurchased during the year ended December 31, 2013 totaled approximately $4.7 million. In 2012, additional reserves were established as an unallocated component in recognition of the emergence of make-whole demands. The establishment of an unallocated component considers anticipated future losses and our lack of historical experience with the make-whole demands. Repurchase activity by vintage and investor type are depicted in Table 1 below.
Table 1.
Repurchase Demands, Appeals, Repurchased and Pending Resolution
|
Government Sponsored Entities
|
Non-GSE Investors
|
||||||||||||||||||||||
|
Vintage
|
Repurchase Demands
|
Appeals Granted
|
Repurchased
|
Pending Resolution
|
Repurchase Demands
|
Appeals Granted
|
Repurchased
|
Pending Resolution
|
|||||||||||||||
|
Year ended December 31, 2013 [1]
|
|||||||||||||||||||||||
|
2005 and prior
|
2 | 1 | - | 1 | - | - | - | - | |||||||||||||||
|
2006
|
3 | 2 | - | 1 | - | - | - | - | |||||||||||||||
|
2007
|
6 | 1 | 5 | - | - | - | - | - | |||||||||||||||
|
2008
|
15 | 6 | 6 | 3 | - | - | - | - | |||||||||||||||
|
2009
|
2 | 1 | 1 | - | - | - | - | - | |||||||||||||||
|
2010
|
1 | 1 | - | - | - | - | - | - | |||||||||||||||
|
2011
|
5 | 5 | - | - | - | - | - | - | |||||||||||||||
|
2012
|
3 | 2 | 1 | - | 2 | - | 1 | 1 | |||||||||||||||
|
2013
|
- | - | - | - | - | - | - | - | |||||||||||||||
|
Total
|
37 | 19 | 13 | 5 | 2 | - | 1 | 1 | |||||||||||||||
|
Year ended December 31, 2012 [2]
|
|||||||||||||||||||||||
|
2005 and prior
|
- | - | - | - | - | - | - | - | |||||||||||||||
|
2006
|
3 | 1 | 1 | 1 | 2 | 2 | - | - | |||||||||||||||
|
2007
|
7 | 1 | 4 | 2 | 4 | 1 | 3 | - | |||||||||||||||
|
2008
|
7 | 3 | 4 | - | 2 | 1 | 1 | - | |||||||||||||||
|
2009
|
- | - | - | - | - | - | - | - | |||||||||||||||
|
2010
|
1 | - | 1 | - | - | - | - | - | |||||||||||||||
|
2011
|
5 | 3 | 2 | - | - | - | - | - | |||||||||||||||
|
2012
|
5 | 3 | 1 | 1 | 1 | - | 1 | - | |||||||||||||||
|
Total
|
28 | 11 | 13 | 4 | 9 | 4 | 5 | - | |||||||||||||||
|
[1] Based on repurchase requests received between January 1, 2013 and December 31, 2013.
|
|||||||||||||||||||||||
|
[2] Based on repurchase requests received between January 1, 2012 and December 31, 2012.
|
|||||||||||||||||||||||
35
The reserve for residential mortgage loan repurchase losses of $2.9 million at December 31, 2013 represents our best estimate of the probable loss that we may incur due to the representations and warranties in our loan sales contracts with investors. This represents a decrease of $0.6 million from December 31, 2012. The table below shows changes in the repurchase losses liability.
Table 2.
Changes in the Reserve for Residential Mortgage Loan Repurchase Losses
|
Year Ended December 31,
|
||||||||
|
2013
|
2012
|
|||||||
|
(Dollars in thousands)
|
||||||||
|
Balance, beginning of period
|
$ | 3,552 | $ | 6,802 | ||||
|
Change in estimate
|
(130 | ) | (2,022 | ) | ||||
|
Utilizations
|
(473 | ) | (1,228 | ) | ||||
|
Balance, end of period
|
$ | 2,949 | $ | 3,552 | ||||
Our capacity to estimate repurchase losses is improving as we record additional experience. Repurchase losses depend upon economic factors and other external conditions that may change over the life of the underlying loans. Additionally, lack of access to the servicing records of loans sold on a service released basis adds difficulty to the estimation process, thus requiring considerable management judgment. To the extent that future investor repurchase demand and appeals success differ from past experience, we could have increased demands and increased loss severities on repurchases, causing future additions to the repurchase reserve.
Goodwill and Other Intangible Assets
During the first quarter of 2010, we determined than an impairment test on our remaining goodwill was required because of the uncertainty regarding our ability to continue as a going concern at that time combined with the fact that our market capitalization remained depressed. As a result of that impairment test, we determined that the remaining goodwill associated with our Banking Operations reporting unit was impaired and we recorded a non-cash impairment charge of $102.7 million. Since that time, no goodwill remains on our consolidated balance sheet.
Prior to the first quarter of 2010, we reviewed the carrying amount of goodwill for impairment on an annual basis and performed additional assessments on a quarterly basis whenever indicators of impairment were evident. Goodwill attributable to each of our reporting units was tested for impairment by comparing their respective fair values to their carrying values. When determining fair value, we utilized a discounted cash flow methodology for our Banking Operations reporting unit. Absent any impairment indicators, we performed our annual goodwill impairment tests during the fourth quarter of each fiscal year.
Other intangible assets include a core deposit premium and mortgage servicing rights.
Our core deposit premium is being amortized over 14 years which approximates the estimated life of the purchased deposits. The carrying value of our core deposit premium is periodically evaluated to estimate the remaining periods of benefit. If these periods of benefit are determined to be less than the remaining amortizable life, an adjustment to reflect such shorter life will be made.
We utilize the amortization method to measure our mortgage servicing rights. Under the amortization method, we amortize our mortgage servicing rights in proportion to and over the period of net servicing income. Income generated as the result of new mortgage servicing rights is reported as gains on sales of loans. Amortization of the servicing rights is reported as amortization of other intangible assets in our consolidated statements of income. Ancillary income is recorded in other income. Mortgage servicing rights are recorded when loans are sold to third-parties with servicing of those loans retained and we classify our entire mortgage servicing rights into one class.
Initial fair value of the servicing right is calculated by a discounted cash flow model prepared by a third party service provider based on market value assumptions at the time of origination and we assess the servicing right for impairment using current market value assumptions at each reporting period. Critical assumptions used in the discounted cash flow model include mortgage prepayment speeds, discount rates, costs to service and ancillary income. Variations in our assumptions could materially affect the estimated fair values. Changes to our assumptions are made when current trends and market data indicate that new trends have developed. Current market value assumptions based on loan product types (fixed rate, adjustable rate and balloon loans) include average discount rates and national prepayment speeds. Many of these assumptions are subjective and require a high level of management judgment. Our mortgage servicing rights portfolio and valuation assumptions are periodically reviewed by management.
36
Prepayment speeds may be affected by economic factors such as home price appreciation, market interest rates, the availability of other credit products to our borrowers and customer payment patterns. Prepayment speeds include the impact of all borrower prepayments, including full payoffs, additional principal payments and the impact of loans paid off due to foreclosure liquidations. As market interest rates decline, prepayment speeds will generally increase as customers refinance existing mortgages under more favorable interest rate terms. As prepayment speeds increase, anticipated cash flows will generally decline resulting in a potential reduction, or impairment, to the fair value of the capitalized mortgage servicing rights. Alternatively, an increase in market interest rates may cause a decrease in prepayment speeds and therefore an increase in fair value of mortgage servicing rights.
We perform an impairment assessment of our other intangible assets whenever events or changes in circumstance indicate that the carrying value of those assets may not be recoverable. Our impairment assessments involve, among other valuation methods, the estimation of future cash flows and other methods of determining fair value. Estimating future cash flows and determining fair values is subject to judgments and often involves the use of significant estimates and assumptions. The variability of the factors we use to perform our impairment tests depend on a number of conditions, including uncertainty about future events and cash flows. All such factors were interdependent and, therefore, do not change in isolation. Accordingly, our accounting estimates may materially change from period to period due to changing market factors.
During the second quarter of 2012, we evaluated the recoverability of the intangible assets related to our customer relationships and non-compete agreements. Upon completion of this review, we determined that the intangible assets related to our customer relationships and non-compete agreements were both fully impaired, and thus, we recorded impairment charges to other operating expense totaling $0.9 million during the second quarter of 2012.
Deferred Tax Assets and Tax Contingencies
Deferred tax assets and liabilities are recognized for the estimated future tax effects attributable to temporary differences and carryforwards. A valuation allowance may be required if, based on the weight of available evidence, it is more likely than not that some portion or all of the DTAs will not be realized. In determining whether a valuation allowance is necessary, we consider the level of taxable income in prior years, to the extent that carrybacks are permitted under current tax laws, as well as estimates of future taxable income and tax planning strategies that could be implemented to accelerate taxable income, if necessary. If our estimates of future taxable income were materially overstated or if our assumptions regarding the tax consequences of tax planning strategies were inaccurate, some or all of our DTAs may not be realized, which would result in a charge to earnings. In 2009, we established a full valuation allowance against our net DTAs. See “—
Overview of Results of Operations — Income Taxes” below. The quarter ended March 31, 2013 marked our ninth consecutive quarter of profitability. Based on this earnings performance trend, improvements in our financial condition, asset quality and capital ratios and the expectation of continued profitability, the Company determined that it was more likely than not that our net DTA would be realized. As a result, in the first quarter of 2013, the Company reversed a significant portion of the valuation allowance.
We have established income tax contingency reserves for potential tax liabilities related to uncertain tax positions. Tax benefits are recognized when we determine that it is more likely than not that such benefits will be realized. Where uncertainty exists due to the complexity of income tax statutes and where the potential tax amounts are significant, we generally seek independent tax opinions to support our positions. If our evaluation of the likelihood of the realization of benefits is inaccurate, we could incur additional income tax and interest expense that would adversely impact earnings, or we could receive tax benefits greater than anticipated which would positively impact earnings.
Defined Benefit Retirement Plan
Defined benefit plan obligations and related assets of our defined benefit retirement plan are presented in Note 16 to the Consolidated Financial Statements under “Part II, Item 8. Financial Statements and Supplementary Data.” In 2002, the defined benefit retirement plan was curtailed and all plan benefits were fixed as of that date. Plan assets, which consist primarily of marketable equity and debt securities, are typically valued using market quotations. Plan obligations and the annual pension expense are determined by independent actuaries through the use of a number of assumptions. Key assumptions in measuring the plan obligations include the discount rate and the expected long-term rate of return on plan assets. In determining the discount rate, we utilize a yield that reflects the top 50% of the universe of bonds, ranked in the order of the highest yield. Asset returns are based upon the anticipated average rate of earnings expected on the invested funds of the plans.
37
At December 31, 2013, we used a weighted-average discount rate of 4.7% and an expected long-term rate of return on plan assets of 7.5%, which affected the amount of pension liability recorded as of year-end 2013 and the amount of pension expense to be recorded in 2014. At December 31, 2012, we used a weighted-average discount rate of 4.0% and an expected long-term rate of return on plan assets of 8.0% in determining the pension liability recorded as of year-end 2012 and the amount of pension expense recorded in 2013. For both the discount rate and the asset return rate, a range of estimates could reasonably have been used which would affect the amount of pension expense and pension liability recorded.
An increase in the discount rate or asset return rate would reduce pension expense in 2013, while a decrease in the discount rate or asset return rate would have had the opposite effect. A 0.25% change in the discount rate assumption would impact 2014 pension expense by less than $0.1 million and year-end 2013 pension liability by $0.8 million, while a 0.25% change in the asset return rate would impact 2014 pension expense by less than $0.1 million.
Overview of Results of Operations
2013 vs. 2012 Comparison
In 2013, we recognized net income of $172.1 million, or $4.07 per diluted common share, compared to net income of $47.4 million, or $1.13 per diluted common share, in 2012. Net income in 2013 included a non-cash income tax benefit of $119.8 million recorded in the first quarter of 2013 related to the reversal of a significant portion of a valuation allowance that was established against the Company’s net DTA during the third quarter of 2009. Excluding this income tax benefit, net income for 2013 was $52.3 million, or $1.24 per diluted common share.
Total credit costs, which include the Provision, write-downs of loans classified as held for sale, foreclosed asset expense, gains on sales of foreclosed assets, and the change in the reserve for unfunded loan commitments, amounted to a credit of $22.4 million in 2013, compared to a credit of $16.1 million in 2012. Our operating results in 2013 were positively impacted by an income tax benefit for 2013 of $112.2 million, an increase in net interest income of $13.4 million, and a decrease in other operating expense of $12.4 million, offset by a lower credit to the provision for loan and lease losses of $7.6 million and lower other operating income of $5.8 million. Our net income on average assets and average shareholders’ equity for 2013 was 3.73% and 27.70%, respectively, compared to 1.13% and 9.81%, respectively, in 2012.
2012 vs. 2011 Comparison
In 2012, we recognized net income of $47.4 million, or $1.13 per diluted common share, compared to net income of $36.6 million, or $3.31 per diluted common share, in 2011. Our net income per diluted share for 2011 included the impact of a one-time accounting adjustment totaling $85.1 million related to the previously disclosed TARP Exchange. Total credit costs, which include the Provision, write-downs of loans classified as held for sale, foreclosed asset expense, gains on sales of foreclosed assets, and the change in the reserve for unfunded loan commitments, amounted to a credit of $16.1 million in 2012 compared to a credit of $29.9 million in 2011. Our operating results in 2012 were positively impacted by increases in net interest income and other operating income of $1.9 million and $3.7 million, respectively, and a decrease in other operating expense of $27.0 million. Our net income on average assets and average shareholders’ equity for 2012 was 1.13% and 9.81%, respectively, compared to 0.90% and 9.83%, respectively, in 2011.
38
Net Interest Income
The following table sets forth information concerning average interest earning assets and interest-bearing liabilities and the yields and rates thereon. Net interest income, when expressed as a percentage of average interest earning assets, is referred to as “net interest margin.” Interest income, which includes loan fees and resultant yield information, is expressed on a taxable equivalent basis using an assumed income tax rate of 35%. Table 4 presents an analysis of changes in components of net interest income between years. For each category of interest earning assets and interest-bearing liabilities, information is provided on changes attributable to: (i) changes in volume (change in volume of the asset multiplied by the prior year’s rate) and (ii) changes in rates (change in rate multiplied by the current year’s volume).
Table 3.
Average Balances, Interest Income and Expense, Yields and Rates (Taxable Equivalent)
|
2013
|
2012
|
2011
|
||||||||||||||||||||||||
|
Average
|
Average
|
Amount
|
Average
|
Average
|
Amount
|
Average
|
Average
|
Amount
|
||||||||||||||||||
|
Balance
|
Yield/Rate
|
of Interest
|
Balance
|
Yield/Rate
|
of Interest
|
Balance
|
Yield/Rate
|
of Interest
|
||||||||||||||||||
|
(Dollars in thousands)
|
||||||||||||||||||||||||||
|
Assets
|
||||||||||||||||||||||||||
|
Interest earning assets:
|
||||||||||||||||||||||||||
|
Interest-bearing deposits in other banks
|
$ | 81,249 | 0.25 | % | $ | 203 | $ | 114,438 | 0.25 | % | $ | 285 | $ | 412,351 | 0.26 | % | $ | 1,052 | ||||||||
|
Taxable investment securities (1)
|
1,534,136 | 2.05 | 31,521 | 1,521,164 | 1.89 | 28,819 | 1,227,181 | 2.25 | 27,571 | |||||||||||||||||
|
Tax-exempt investment securities (1)
|
177,510 | 3.51 | 6,232 | 83,663 | 4.25 | 3,557 | 12,537 | 9.05 | 1,135 | |||||||||||||||||
|
Loans and leases, including loans held for sale (2)
|
2,394,955 | 4.36 | 104,479 | 2,130,758 | 4.55 | 97,029 | 2,121,544 | 5.05 | 107,089 | |||||||||||||||||
|
Federal Home Loan Bank stock
|
47,202 | 0.05 | 24 | 48,654 | - | - | 48,797 | - | - | |||||||||||||||||
|
Total interest earning assets
|
4,235,052 | 3.36 | 142,459 | 3,898,677 | 3.33 | 129,690 | 3,822,410 | 3.58 | 136,847 | |||||||||||||||||
|
Nonearning assets
|
375,770 | 308,978 | 232,218 | |||||||||||||||||||||||
|
Total assets
|
$ | 4,610,822 | $ | 4,207,655 | $ | 4,054,628 | ||||||||||||||||||||
|
Liabilities and Equity
|
||||||||||||||||||||||||||
|
Interest-bearing liabilities:
|
||||||||||||||||||||||||||
|
Interest-bearing demand deposits
|
$ | 708,658 | 0.05 | % | $ | 349 | $ | 615,960 | 0.05 | % | $ | 339 | $ | 539,519 | 0.09 | % | $ | 500 | ||||||||
|
Savings and money market deposits
|
1,191,919 | 0.07 | 894 | 1,163,963 | 0.09 | 1,006 | 1,117,183 | 0.18 | 2,044 | |||||||||||||||||
|
Time deposits under $100,000
|
285,042 | 0.46 | 1,301 | 326,288 | 0.59 | 1,937 | 395,500 | 0.99 | 3,900 | |||||||||||||||||
|
Time deposits $100,000 and over
|
769,672 | 0.19 | 1,500 | 652,339 | 0.27 | 1,751 | 484,734 | 0.65 | 3,166 | |||||||||||||||||
|
Short-term borrowings
|
1,988 | 0.32 | 6 | 11 | 0.67 | - | 35,810 | 0.57 | 204 | |||||||||||||||||
|
Long-term debt
|
104,373 | 2.99 | 3,119 | 109,791 | 3.37 | 3,701 | 352,677 | 2.50 | 8,815 | |||||||||||||||||
|
Total interest-bearing liabilities
|
3,061,652 | 0.23 | 7,169 | 2,868,352 | 0.30 | 8,734 | 2,925,423 | 0.64 | 18,629 | |||||||||||||||||
|
Noninterest-bearing deposits
|
849,371 | 773,768 | 675,604 | |||||||||||||||||||||||
|
Other liabilities
|
73,040 | 72,131 | 71,687 | |||||||||||||||||||||||
|
Total liabilities
|
3,984,063 | 3,714,251 | 3,672,714 | |||||||||||||||||||||||
|
Shareholders' equity
|
621,282 | 483,435 | 371,922 | |||||||||||||||||||||||
|
Non-controlling interests
|
5,477 | 9,969 | 9,992 | |||||||||||||||||||||||
|
Total equity
|
626,759 | 493,404 | 381,914 | |||||||||||||||||||||||
|
Total liabilities and equity
|
$ | 4,610,822 | $ | 4,207,655 | $ | 4,054,628 | ||||||||||||||||||||
|
Net interest income
|
$ | 135,290 | $ | 120,956 | $ | 118,218 | ||||||||||||||||||||
|
Net interest margin
|
3.19 | % | 3.10 | % | 3.09 | % | ||||||||||||||||||||
|
(1) At amortized cost.
|
||||||||||||||||||||||||||
|
(2) Includes nonaccrual loans.
|
||||||||||||||||||||||||||
39
Table 4.
Analysis of Changes in Net Interest Income (Taxable Equivalent)
|
2013 Compared to 2012
|
2012 Compared to 2011
|
||||||||||||||||||||||
|
Increase (Decrease)
|
Increase (Decrease)
|
||||||||||||||||||||||
|
Due to Change In:
|
Net
|
Due to Change In:
|
Net
|
||||||||||||||||||||
|
Volume
|
Rate
|
Change
|
Volume
|
Rate
|
Change
|
||||||||||||||||||
|
(Dollars in thousands)
|
|||||||||||||||||||||||
|
Interest earning assets
|
|||||||||||||||||||||||
|
Interest-bearing deposits in other banks
|
$ | (82 | ) | $ | - | $ | (82 | ) | $ | (760 | ) | $ | (7 | ) | $ | (767 | ) | ||||||
|
Taxable investment securities
|
245 | 2,457 | 2,702 | 6,615 | (5,367 | ) | 1,248 | ||||||||||||||||
|
Tax-exempt investment securities
|
3,988 | (1,313 | ) | 2,675 | 6,437 | (4,015 | ) | 2,422 | |||||||||||||||
|
Loans and leases, including loans held for sale
|
12,031 | (4,581 | ) | 7,450 | 465 | (10,525 | ) | (10,060 | ) | ||||||||||||||
|
Federal Home Loan Bank stock
|
- | 24 | 24 | - | - | - | |||||||||||||||||
|
Total interest earning assets
|
16,182 | (3,413 | ) | 12,769 | 12,757 | (19,914 | ) | (7,157 | ) | ||||||||||||||
|
Interest-bearing liabilities
|
|||||||||||||||||||||||
|
Interest-bearing demand deposits
|
46 | (36 | ) | 10 | 69 | (230 | ) | (161 | ) | ||||||||||||||
|
Savings and money market deposits
|
25 | (137 | ) | (112 | ) | 84 | (1,122 | ) | (1,038 | ) | |||||||||||||
|
Time deposits under $100,000
|
(243 | ) | (393 | ) | (636 | ) | (685 | ) | (1,278 | ) | (1,963 | ) | |||||||||||
|
Time deposits $100,000 and over
|
317 | (568 | ) | (251 | ) | 1,089 | (2,504 | ) | (1,415 | ) | |||||||||||||
|
Short-term borrowings
|
13 | (7 | ) | 6 | (204 | ) | - | (204 | ) | ||||||||||||||
|
Long-term debt
|
(183 | ) | (399 | ) | (582 | ) | (6,072 | ) | 958 | (5,114 | ) | ||||||||||||
|
Total interest-bearing liabilities
|
(25 | ) | (1,540 | ) | (1,565 | ) | (5,719 | ) | (4,176 | ) | (9,895 | ) | |||||||||||
|
Net interest income
|
$ | 16,207 | $ | (1,873 | ) | $ | 14,334 | $ | 18,476 | $ | (15,738 | ) | $ | 2,738 | |||||||||
Net interest income is our primary source of earnings and is derived primarily from the difference between the interest we earn on loans and investments versus the interest we pay on deposits and borrowings. Net interest income (expressed on a taxable-equivalent basis) totaled $135.3 million in 2013, increasing by $14.3 million, or 11.9%, from $121.0 million in 2012, which increased by $2.7 million, or 2.3%, from net interest income of $118.2 million recognized in 2011. The increase in net interest income for 2013 was primarily the result of a significant increase in average loans and leases and investment securities as we continued to redeploy our excess liquidity into higher yielding assets. Also contributing to the increase was the 16 basis points (“bp”) increase in average yields earned on our taxable investment securities. Offsetting these increases were declines in average yields earned on our loans and leases and tax-exempt investment securities portfolios of 19 bp and 74 bp, respectively.
Average rates earned on our interest-earning assets increased by 3 bp in the year ended December 31, 2013, from the year ended December 31, 2012. Average rates paid on our interest-bearing liabilities in the year ended December 31, 2013 decline by 7 bp, compared to the same period in 2012. The improvement in average yields earned on our interest earning assets in 2013 was directly attributable to the 16 bp increase in average yields earned on our taxable investment securities, increases in our higher yielding loans and leases and investment securities portfolios, and the corresponding decrease in our lower yielding interest-bearing deposits in other banks.
In the fourth quarter of 2013, we executed a bond swap where we sold $271.5 million in lower-yielding available-for-sale agency debentures and agency mortgage-backed securities with an average net yield of 1.87% and a weighted average life of 2.9 years and reinvested the majority of the proceeds in $242.5 million of higher-yielding agency mortgage-backed securities, non-agency commercial mortgage-backed securities, and corporate bond securities with an average yield of 3.21% and a weighted average life of 7.4 years. The new securities were classified in the available-for-sale portfolio and a net gain of $0.5 million was realized on the transaction.
In the third quarter of 2012, we completed an investment securities portfolio repositioning to reduce net interest income volatility and enhance the potential for prospective earnings and an improved net interest margin. In connection with the repositioning, we sold $124.7 million in available-for-sale mortgage-backed securities with an average net yield of 0.60% and a weighted average life of 1.3 years and reinvested the proceeds in $133.2 million of similarly typed investment securities with an average yield of 1.88% and a weighted average life of 5.3 years. The new securities were classified in the held-to-maturity portfolio and a net gain of $0.7 million was realized on the transaction.
40
Interest Income
Our primary sources of interest income include interest on loans and leases, which represented 73.3%, 74.8%, and 78.3% of interest income in 2013, 2012 and 2011, respectively, as well as interest earned on investment securities, which represented 26.5%, 25.0%, and 21.0% of interest income, respectively. Interest income expressed on a taxable-equivalent basis of $142.5 million in 2013 increased by $12.8 million, or 9.8%, from the $129.7 million earned in 2012, which decreased by $7.2 million, or 5.2%, from the $136.8 million earned in 2011.
As depicted in Table 4, the increase in interest income in 2013 from the prior year was primarily due to a significant increase in average loans and leases and investment securities balances and the increase in average taxable investment securities yields, partially offset by a decrease in average loan yields and the significant decrease in average tax-exempt investment securities yields. The $264.2 million increase in average loans and leases contributed to an increase of $12.0 million in current year interest income and the $93.8 million increase in average tax-exempt investment securities contributed to an increase of $4.0 million in current year interest income. In addition, the 16 bp increase in average taxable investment securities yields in 2013 contributed to $2.5 million in higher interest income for the current year. These increases were partially offset by the 19 bp decrease in average loan yields in 2013 which contributed to $4.6 million in lower interest income for 2013. The 74 bp decrease in average tax-exempt investment securities yields in 2013 contributed to $1.3 million in lower interest income for the current year.
The decrease in interest income in 2012 from 2011 was primarily due to a significant decrease in average loan and taxable investment securities yields, partially offset by a significant increase in average investment securities balances. The 50 bp decrease in average loan yields in 2012 contributed to $10.5 million of the reduction in interest income. The 36 bp decrease in average taxable investment securities yields in 2012 contributed to $5.4 million of the reduction in interest income. These decreases were partially offset by the $294.0 million increase in average taxable investment securities which contributed to an increase of $6.6 million of interest income and the $71.1 million increase in average tax-exempt investment securities which contributed to an increase of $6.4 million of interest income.
Interest Expense
In 2013, interest expense was $7.2 million which represented a decrease of $1.6 million, or 17.9%, compared to interest expense of $8.7 million in 2012, which decreased by $9.9 million, or 53.1%, compared to $18.6 million in 2011.
Declines in average rates paid on interest-bearing liabilities were reflective of the FRB’s notably low interest rate policy that existed throughout 2013, 2012 and 2011 and contributed to the overall reduction in interest expense during the periods. In 2013, the average rate paid on interest-bearing liabilities decreased by 7 bp to 0.23%, compared to 0.30% in 2012. Decreases in the average rates paid on time deposits $100,000 and over of 8 bp, long-term borrowings of 38 bp, time deposits under $100,000 of 13 bp, and savings and money market deposits of 2 bp, were the primary drivers of the overall decrease in interest expense. Decreases in the average balances of time deposits under $100,000 of $41.2 million and long-term borrowings of $5.4 million also contributed to the reduction of interest expense in 2013.
In 2012, the average rate paid on interest-bearing liabilities decreased by 34 bp to 0.30%, compared to 0.64% in 2011. Decreases in the average balances of long-term borrowings of $242.9 million, time deposits under $100,000 of $69.2 million and short-term borrowings of $35.8 million were the primary drivers of the overall decrease in interest expense. Decreases in the average rates paid on savings and money market deposits of 9 bp, time deposits under $100,000 of 40 bp and time deposits $100,000 and over of 38 bp also contributed to the reduction of interest expense in 2012.
Net Interest Margin
Our net interest margin was 3.19%, 3.10%, and 3.09% in 2013, 2012 and 2011, respectively. The improvement in our net interest margin in 2013 was driven by the continued slowing of premium amortization on our mortgage backed securities and, as described above, reflected our continued reinvestment of cash flow into higher yielding loans and leases and investment securities.
The improvement in our net interest margin in 2012 reflected our deployment of excess liquidity into higher yielding investment securities and an overall reduction in our funding costs, which included the prepayment of long-term borrowings at the FHLB in the third quarter of 2011, partially offset by lower yields earned on our interest earning assets due to the depressed interest rate environment.
41
The historically low interest rate environment that we continue to operate in is the result of the target Fed Funds rate of 0% to 0.25% initially set by the Federal Reserve in the fourth quarter of 2008 and other economic policies implemented by the FRB, which continued through year end 2013. While we expect the target Fed Funds rate to remain low, the yield curve has begun to steepen in 2013 and is expected to continue in 2014. Thus we expect our net interest margin to expand modestly over the near term as we are able to invest in higher yielding assets.
Other Operating Income
The following table sets forth components of other operating income and the total as a percentage of average assets for the periods indicated.
Table 5.
Components of Other Operating Income
|
Year Ended December 31,
|
||||||||||||
|
2013
|
2012
|
2011
|
||||||||||
|
(Dollars in thousands)
|
||||||||||||
|
Other service charges and fees
|
$ | 18,547 | $ | 17,569 | $ | 17,239 | ||||||
|
Net gain on sales of residential loans
|
9,986 | 17,095 | 8,050 | |||||||||
|
Net gain on sales of foreclosed assets
|
8,584 | 4,999 | 6,821 | |||||||||
|
Service charges on deposit accounts
|
7,041 | 8,367 | 10,024 | |||||||||
|
Income from fiduciary activities
|
2,855 | 2,599 | 2,794 | |||||||||
|
Income from bank-owned life insurance
|
2,333 | 2,899 | 4,139 | |||||||||
|
Equity in earnings of unconsolidated subsidiaries
|
790 | 574 | 458 | |||||||||
|
Loan placement fees
|
570 | 690 | 541 | |||||||||
|
Fees on foreign exchange
|
508 | 551 | 664 | |||||||||
|
Investment securities gains
|
482 | 789 | 1,306 | |||||||||
|
Other
|
3,249 | 4,611 | 4,966 | |||||||||
|
Total other operating income
|
$ | 54,945 | $ | 60,743 | $ | 57,002 | ||||||
|
Total other operating income as a percentage of average assets
|
1.19% | 1.44% | 1.41% | |||||||||
Total other operating income of $54.9 million in 2013 decreased by $5.8 million, or 9.5%, from the $60.7 million earned in 2012, which increased by $3.7 million, or 6.6%, from the $57.0 million earned in 2011.
In 2013, we recorded lower net gains on sales of residential mortgage loans, rental income on foreclosed properties, and service charges on deposit accounts of $7.1 million, $3.7 million, and $1.3 million, respectively. Offsetting these decreases in 2013 were higher net gains on sales of foreclosed assets of $3.6 million, a gain on the early extinguishment of trust preferred debt of $1.0 million, and higher other service charges and fees of $1.0 million.
In 2012, we recorded higher net gains on sales of residential mortgage loans of $9.0 million. Offsetting this increase in 2012 were lower net gains on sales of foreclosed assets of $1.8 million, lower service charges on deposit accounts of $1.7 million and lower income from bank-owned life insurance of $1.2 million.
42
Other Operating Expense
The following table sets forth components of other operating expense and the total as a percentage of average assets for the periods indicated.
Table 6.
Components of Other Operating Expense
|
Year Ended December 31,
|
||||||||||||
|
2013
|
2012
|
2011
|
||||||||||
|
(Dollars in thousands)
|
||||||||||||
|
Salaries and employee benefits
|
$ | 76,294 | $ | 69,344 | $ | 63,675 | ||||||
|
Net occupancy
|
14,323 | 13,920 | 13,793 | |||||||||
|
Legal and professional services
|
8,094 | 13,824 | 13,506 | |||||||||
|
Amortization and impairment of other intangible assets
|
7,418 | 10,179 | 7,033 | |||||||||
|
Computer software expense
|
4,579 | 3,961 | 3,629 | |||||||||
|
Equipment
|
3,676 | 3,966 | 4,702 | |||||||||
|
Communication expense
|
3,523 | 3,428 | 3,517 | |||||||||
|
Advertising expense
|
2,666 | 3,516 | 2,961 | |||||||||
|
Foreclosed asset expense
|
1,036 | 6,887 | 11,378 | |||||||||
|
Write down of assets
|
- | 2,586 | 4,624 | |||||||||
|
Loss on early extinguishment of debt
|
- | - | 6,234 | |||||||||
|
Other
|
17,927 | 20,307 | 43,890 | |||||||||
|
Total other operating expense
|
$ | 139,536 | $ | 151,918 | $ | 178,942 | ||||||
|
Total other operating expense as a percentage of average assets
|
3.03% | 3.61% | 4.41% | |||||||||
Total other operating expense of $139.5 million in 2013 decreased by $12.4 million, or 8.2%, from total operating expense of $151.9 million in 2012, which decreased by $27.0 million, or 15.1%, compared to 2011.
The decrease in total other operating expense in 2013, compared to 2012, was the result of lower credit-related charges (which include write-downs of loans held for sale, foreclosed asset expense, and reserves on unfunded commitments) of $10.2 million, lower legal and professional services of $5.7 million, lower amortization and impairment of other intangible assets of $2.8 million, lower FDIC insurance expense of $2.1 million, and lower accruals for the settlement of legal proceedings against the Company of $1.8 million, partially offset by higher salaries and employee benefits of $7.0 million, a premium paid on the repurchase of preferred stock of two subsidiaries of $1.9 million, and lower credit to the reserve for repurchased residential mortgage loan losses of $1.9 million.
The decrease in total other operating expense in 2012, compared to 2011, was the result of lower credit-related charges of $9.8 million, lower contributions to the Central Pacific Bank Foundation of $7.8 million, lower reserve for repurchased residential mortgage loans of $7.0 million, lower loss on early extinguishment of debt of $6.2 million, and lower FDIC insurance expense of $2.0 million, partially offset by higher salaries and employee benefits of $5.7 million and higher amortization and impairment of other intangible assets of $3.1 million.
A key measure of operating efficiency tracked by management is the efficiency ratio, which is calculated by dividing adjusted other operating expense by adjusted other operating income. The efficiency ratio, as used by management, differs from comparable measures calculated and presented in accordance with GAAP in that it excludes unusual or non-recurring charges, losses, credits or gains. Management believes that the efficiency ratio provides useful supplemental information that is important to a proper understanding of the company’s core business results by investors. Our efficiency ratio should not be viewed as a substitute for results determined in accordance with GAAP, nor is it necessarily comparable to the efficiency ratio presented by other companies. Our efficiency ratio decreased to 74.97% in 2013, compared to 78.89% in 2012 and 92.06% in 2011. The decrease in our efficiency ratio was primarily driven by the aforementioned decrease in other operating expenses and increase in net interest income.
43
The following table sets forth a reconciliation to our efficiency ratio for each of the dates indicated:
Table 7.
Reconciliation to Efficiency Ratio
|
Year Ended December 31,
|
||||||||||||||||||||
|
2013
|
2012
|
2011
|
2010
|
2009
|
||||||||||||||||
|
(Dollars in thousands, except per share data)
|
||||||||||||||||||||
|
Efficiency Ratio
|
||||||||||||||||||||
|
Total other operating expenses
|
$ | 139,536 | $ | 151,918 | $ | 178,942 | $ | 267,758 | $ | 217,186 | ||||||||||
|
Less:
|
||||||||||||||||||||
|
Amortization of other intangible assets
|
2,674 | 3,675 | 2,874 | 2,874 | 2,875 | |||||||||||||||
|
Foreclosed asset expense
|
1,036 | 6,887 | 11,378 | 9,646 | 8,961 | |||||||||||||||
|
Write down of assets
|
- | 2,586 | 4,624 | 1,460 | 4,963 | |||||||||||||||
|
Loss on early extinguishment of debt
|
- | - | 6,234 | 5,685 | - | |||||||||||||||
|
Goodwill impairment
|
- | - | - | 102,689 | 50,000 | |||||||||||||||
|
Adjusted other operating expenses
|
$ | 135,826 | $ | 138,770 | $ | 153,832 | $ | 145,404 | $ | 150,387 | ||||||||||
|
Net interest income (tax equivalent)
|
$ | 135,290 | $ | 120,956 | $ | 118,218 | $ | 119,228 | $ | 176,686 | ||||||||||
|
Total other operating income
|
54,945 | 60,743 | 57,002 | 57,700 | 57,723 | |||||||||||||||
|
Less:
|
||||||||||||||||||||
|
Net gains on sales of foreclosed assets
|
8,584 | 4,999 | 6,821 | 664 | 310 | |||||||||||||||
|
Net gains on sales of investment securities
|
482 | 789 | 1,306 | 831 | (74 | ) | ||||||||||||||
|
OTTI on investment securities
|
- | - | - | - | (2,565 | ) | ||||||||||||||
|
Adjusted other operating income
|
$ | 181,169 | $ | 175,911 | $ | 167,093 | $ | 175,433 | $ | 236,738 | ||||||||||
|
Efficiency ratio
|
74.97% | 78.89% | 92.06% | 82.88% | 63.52% | |||||||||||||||
Income Taxes
In the first quarter of 2013, the Company reversed a significant portion of the valuation allowance that was established against our net DTA during the third quarter of 2009. The valuation allowance was established during 2009 due to uncertainty at the time regarding our ability to generate sufficient future taxable income to fully realize the benefit of our net DTA. The quarter ended March 31, 2013 marked our ninth consecutive quarter of profitability. Based on this earnings performance trend, improvements in our financial condition, asset quality and capital ratios, and the expectation of continued profitability, the Company determined that it was more likely than not that a significant portion of our net DTA would be realized. The net impact of reversing the valuation allowance and recording the provision for income tax expense was a net income tax benefit of $119.8 million in the first quarter of 2013.
In the second, third and fourth quarters of 2013, the Company recorded income tax expense of $1.9 million, $2.2 million, and $3.4 million, respectively.
As of December 31, 2013, the remaining valuation allowance on our net DTA totaled $6.7 million. Net of this valuation allowance, the Company’s net DTA totaled $137.2 million as of December 31, 2013, compared to a fully reserved net DTA of $147.5 million as of December 31, 2012.
In 2013, we decreased our valuation allowance against our net DTAs by $140.8 million, or 95.5%, to $6.7 million at December 31, 2013 from $147.5 million at December 31, 2012. Of the total decrease to the valuation allowance, $132.1 million was recognized as a non-cash credit to income tax expense, while $8.7 million was charged against accumulated other comprehensive income (loss) (“AOCI”).
In 2012, we decreased our valuation allowance against our net DTAs by $14.8 million, or 9.1%, to $147.5 million at December 31, 2012 from $162.3 million at December 31, 2011. Of the total decrease to the valuation allowance, $15.9 million was recognized as a non-cash credit to income tax expense, while $1.1 million was charged against AOCI.
Our effective tax rate was -187.6% in 2013 compared to 0% in 2012 and 2011. Because we recognized a full valuation allowance against our net DTAs in 2011 and 2012, we did not record any income tax expense or benefit in those periods.
44
Financial Condition
Total assets of $4.7 billion at December 31, 2013 increased by $370.8 million, or 8.5%, from the $4.4 billion at year-end 2012, and total liabilities of $4.1 billion at December 31, 2013 increased by $225.4 million, or 5.8%, from the prior year. The increase in total assets in 2013 was due primarily to our deposit growth and subsequent deployment of these proceeds into higher yielding assets.
Loan Portfolio
Our lending activities are focused on commercial loans, commercial mortgages, construction loans, and leases to small and medium-sized companies, business professionals, and real estate developers, as well as residential mortgages and consumer loans to local homebuyers and individuals. Our strategy for generating commercial loans has traditionally relied upon teams of commercial real estate and commercial banking officers organized by geographical and industry lines who are responsible for client prospecting and business development.
To manage credit risk (i.e., the ability of borrowers to repay their loan obligations), management analyzes the borrower’s financial condition, repayment source, collateral and other factors that could impact credit quality, such as national and local economic conditions and industry conditions related to respective borrowers.
Loans and leases totaled $2.6 billion at December 31, 2013, increasing by $426.7 million, or 19.4%, from the $2.2 billion at year-end 2012, which increased by $139.5 million, or 6.8%, from the $2.1 billion held at year-end 2011. The increase in our loan portfolio in 2013 was representative of our continued effort to deploy excess liquidity into higher yielding assets. The increase in loans and leases was primarily due to net increases in the residential mortgage, consumer, and commercial, financial and agricultural loan portfolios totaling $203.9 million, or 19.7%, $167.3 million, or 116.7% and $152.5 million, or 61.9%, respectively, partially offset by a net reduction in the commercial mortgage loan, construction and development loan, and lease portfolios totaling $72.2 million, or 10.7%, $20.6 million, or 21.4% and $4.3 million, or 40.6%, respectively. In addition, we transferred 12 portfolio loans to other real estate totaling $4.4 million, and recorded charge-offs of loans and leases of $12.6 million.
The following table sets forth information regarding outstanding loans by category as of the dates indicated.
Table 8.
Loans by Categories
|
December 31,
|
||||||||||||||||||||
|
2013
|
2012
|
2011
|
2010
|
2009
|
||||||||||||||||
|
(Dollars in thousands)
|
||||||||||||||||||||
|
Commercial, financial and agricultural
|
$ | 398,716 | $ | 246,218 | $ | 180,704 | $ | 207,980 | $ | 260,924 | ||||||||||
|
Real estate:
|
||||||||||||||||||||
|
Construction
|
75,616 | 96,194 | 161,063 | 313,785 | 811,895 | |||||||||||||||
|
Mortgage:
|
||||||||||||||||||||
|
- residential
|
1,239,259 | 1,035,397 | 896,099 | 746,261 | 820,983 | |||||||||||||||
|
- commercial
|
600,081 | 672,248 | 700,069 | 760,306 | 970,285 | |||||||||||||||
|
Consumer
|
310,688 | 143,383 | 108,810 | 112,949 | 136,090 | |||||||||||||||
|
Leases
|
6,241 | 10,504 | 17,702 | 28,163 | 41,803 | |||||||||||||||
|
Total loans and leases
|
2,630,601 | 2,203,944 | 2,064,447 | 2,169,444 | 3,041,980 | |||||||||||||||
|
Allowance for loan and lease losses
|
(83,820 | ) | (96,413 | ) | (122,093 | ) | (192,854 | ) | (205,279 | ) | ||||||||||
|
Net loans
|
$ | 2,546,781 | $ | 2,107,531 | $ | 1,942,354 | $ | 1,976,590 | $ | 2,836,701 | ||||||||||
45
The following table sets forth the geographic distribution of our loan portfolio and related Allowance as of December 31, 2013.
Table 9.
Geographic Distribution
|
Hawaii
|
U.S. Mainland
|
Total
|
||||||||||
|
(Dollars in thousands)
|
||||||||||||
|
Commercial, financial and agricultural
|
$ | 255,987 | $ | 142,729 | $ | 398,716 | ||||||
|
Real estate:
|
||||||||||||
|
Construction
|
71,585 | 4,031 | 75,616 | |||||||||
|
Mortgage:
|
||||||||||||
|
- residential
|
1,238,530 | 729 | 1,239,259 | |||||||||
|
- commercial
|
453,313 | 146,768 | 600,081 | |||||||||
|
Consumer
|
230,664 | 80,024 | 310,688 | |||||||||
|
Leases
|
6,241 | - | 6,241 | |||||||||
|
Total loans and leases
|
2,256,320 | 374,281 | 2,630,601 | |||||||||
|
Allowance for loan and lease losses
|
(66,639 | ) | (17,181 | ) | (83,820 | ) | ||||||
|
Net loans and leases
|
$ | 2,189,681 | $ | 357,100 | $ | 2,546,781 | ||||||
Commercial, Financial and Agricultural
Loans in this category consist primarily of term loans and lines of credit to small and middle-market businesses and professionals. The borrower’s business is typically regarded as the principal source of repayment, although our underwriting policy and practice generally requires additional sources of collateral, including real estate and other business assets, as well as personal guarantees where possible to mitigate risk. Risks of credit losses could be greater in this loan category relative to secured loans where a greater percentage of the loan amount is usually covered by collateral. Nonetheless, any collateral or personal guarantees obtained on commercial loans can mitigate the increased risk and help to reduce credit losses.
Our historical approach to commercial lending involves teams of lending and cash management personnel who focus on relationship development including loans, deposits and other bank services to new and existing commercial clients.
Real Estate—Construction
Construction loans include both residential and commercial development projects. Each construction project is evaluated for economic viability. Construction loans pose higher credit risks than typical secured loans. In addition to the financial strength of the borrower, construction loans have the added element of completion risk, which is the risk that the project will not be completed on time and within budget, resulting in additional costs that could affect the economic viability of the project and market risk at the time construction is complete.
The increase in our construction loan portfolio from 2005 through 2007 was representative of our historical focus on this segment and a real estate market that had been strong with increased development activity in all of our markets. However, beginning in the second half of 2007, some of our residential construction loans in California began exhibiting heightened levels of risk with some borrowers abandoning their construction plans and defaulting on their loans due to a range of factors, including declining real estate values. New construction lending was therefore substantially curtailed. In 2008 through 2010, real estate values continued to deteriorate in Hawaii and California, adding considerable pressure on our construction loan portfolio. Beginning in 2011 and continuing through 2013, real estate values have shown stability. However, as required by our regulators, we further reduced our exposure to this sector and decreased our construction loan portfolio by $152.7 million in 2011, $64.9 million in 2012, and an additional $20.6 million in 2013.
46
Real Estate—Mortgage
The following table sets forth information with respect to the composition of the Real Estate—Mortgage loan portfolio as of the dates indicated.
Table 10.
Mortgage Loan Portfolio Composition
|
December 31,
|
|||||||||||||||||||||||||||||
|
2013
|
2012
|
2011
|
2010
|
2009
|
|||||||||||||||||||||||||
|
Amount
|
Percent
|
Amount
|
Percent
|
Amount
|
Percent
|
Amount
|
Percent
|
Amount
|
Percent
|
||||||||||||||||||||
|
(Dollars in thousands)
|
|||||||||||||||||||||||||||||
|
Residential:
|
|||||||||||||||||||||||||||||
|
1-4 units
|
$ | 1,138,533 | 61.9 | % | $ | 968,194 | 56.7 | % | $ | 846,953 | 53.1 | % | $ | 692,515 | 46.0 | % | $ | 716,753 | 40.0 | % | |||||||||
|
5 or more units
|
100,726 | 5.5 | 67,203 | 3.9 | 49,146 | 3.1 | 53,746 | 3.6 | 104,230 | 5.8 | |||||||||||||||||||
|
Commercial,
|
|||||||||||||||||||||||||||||
|
industrial and
|
|||||||||||||||||||||||||||||
|
other
|
600,081 | 32.6 | 672,248 | 39.4 | 700,069 | 43.8 | 760,306 | 50.4 | 970,285 | 54.2 | |||||||||||||||||||
|
Total
|
$ | 1,839,340 | 100.0 | % | $ | 1,707,645 | 100.0 | % | $ | 1,596,168 | 100.0 | % | $ | 1,506,567 | 100.0 | % | $ | 1,791,268 | 100.0 | % | |||||||||
Residential
Residential mortgage loans include fixed- and adjustable-rate loans primarily secured by single-family owner-occupied residences in Hawaii, fixed rate loans secured by multi-family residential properties, and home equity lines of credit and loans. Our home equity lines of credit, which typically carry floating interest rates, accounted for approximately 14% of our residential mortgage portfolio. Maximum loan-to-value ratios of 80% are typically required for fixed- and adjustable-rate loans secured by single-family owner-occupied residences, although higher levels are permitted with accompanying mortgage insurance. We emphasize residential mortgage loans for owner-occupied primary residences. First mortgage loans secured by residential properties generally carry a moderate level of credit risk. With an average loan size of approximately $0.4 million, marketable collateral and a Hawaii residential real estate market that has been relatively stable, credit losses on residential mortgages had been minimal during the past several years. However, economic conditions including unemployment levels, future changes in interest rates and other market factors can impact the marketability and value of collateral and thus the level of credit risk inherent in the portfolio.
Residential mortgage loan balances as of December 31, 2013 totaled $1.2 billion, increasing by $203.9 million, or 19.7%, from the $1.0 billion held at year-end 2012, which increased by $139.3 million, or 15.5%, from the $896.1 million held at year-end 2011. As previously mentioned, residential mortgage originations remained strong throughout most of 2013 fueled by the historically low interest rate environment driving strong refinancing activity.
Residential mortgage loans held for sale at December 31, 2013 totaled $12.4 million, a decrease of $25.9 million, or 67.7%, from the December 31, 2012 balance of $38.3 million, which increased by $0.4 million, or 1.1%, from the December 31, 2011 balance of $37.9 million. In 2013, 2012 and 2011, we did not securitize any residential mortgage loans.
Commercial
Real estate mortgage loans secured by commercial properties continue to represent a sizable portion of our loan portfolio. Our historical policy with respect to commercial mortgages is that loans be made for sound purposes, have a definite source and/or plan of repayment established at inception, and be backed up by reliable secondary sources of repayment and satisfactory collateral with good marketability. Loans secured by commercial property carry a greater risk than loans secured by residential property due to operating income risk. Operating income risk is the risk that the borrower will be unable to generate sufficient cash flow from the operation of the property. The commercial real estate market and interest rate conditions through economic cycles will impact risk levels.
47
Consumer Loans
The following table sets forth the major components of our consumer loan portfolio as of the dates indicated.
Table 11.
Consumer Loan Portfolio Composition
|
December 31,
|
|||||||||||||||||||||||||||||
|
2013
|
2012
|
2011
|
2010
|
2009
|
|||||||||||||||||||||||||
|
Amount
|
Percent
|
Amount
|
Percent
|
Amount
|
Percent
|
Amount
|
Percent
|
Amount
|
Percent
|
||||||||||||||||||||
|
(Dollars in thousands)
|
|||||||||||||||||||||||||||||
|
Automobile
|
$ | 149,780 | 48.2 | % | $ | 70,219 | 48.9 | % | $ | 64,343 | 59.1 | % | $ | 66,955 | 59.2 | % | $ | 87,721 | 64.5 | % | |||||||||
|
Other revolving credit plans
|
61,835 | 19.9 | 35,074 | 24.5 | 34,505 | 31.7 | 34,396 | 30.5 | 36,665 | 26.9 | |||||||||||||||||||
|
Other
|
99,073 | 31.9 | 38,090 | 26.6 | 9,962 | 9.2 | 11,598 | 10.3 | 11,704 | 8.6 | |||||||||||||||||||
|
Total
|
$ | 310,688 | 100.0 | % | $ | 143,383 | 100.0 | % | $ | 108,810 | 100.0 | % | $ | 112,949 | 100.0 | % | $ | 136,090 | 100.0 | % | |||||||||
For consumer loans, credit risk is managed on a pooled basis. Considerations include an evaluation of the quality, character and inherent risks in the loan portfolio, current and projected economic conditions and past loan loss experience. Consumer loans represent a moderate credit risk. Loans in this category are generally either unsecured or secured by personal assets such as automobiles. The average loan size is generally small and risk is diversified among many borrowers. Our policy is to utilize credit-scoring systems for most of our consumer loans, which offer the ability to modify credit exposure based on our risk tolerance and loss experience.
Consumer loans totaled $310.7 million at December 31, 2013, increasing by $167.3 million, or 116.7%, from 2012’s year-end balance of $143.4 million, which increased by $34.6 million, or 31.8%, compared to the $108.8 million held at year-end 2011. At December 31, 2013, automobile loans, primarily indirect dealer loans, comprised 48.2% of consumer loans outstanding.
Total automobile loans of $149.8 million at year-end 2013 increased by $79.6 million, or 113.3%, from 2012’s year-end balance of $70.2 million, which increased by $5.9 million, or 9.1%, from $64.3 million at year-end 2011. The current year increase is primarily due to the purchases of auto loan portfolios for $67.7 million, which includes a $2.8 million premium over the $64.9 million outstanding balance.
In 2013, we purchased participation interests in student loans, which had an outstanding balance of $16.0 million at December 31, 2013. We did not have any participation interests in student loans at December 31, 2012. In addition, we issued solar photovoltaic loans which totaled $17.9 million at December 31, 2013, compared to $25 thousand at December 31, 2012.
Interest Reserves
Our policies require interest reserves for construction loans, including loans to build commercial buildings, residential developments (both large tract projects and individual houses), and multi-family projects.
The outstanding principal balance of loans with interest reserves was $27.4 million at December 31, 2013, compared to $59.4 million in the prior year, while remaining interest reserves was $2.4 million, or 8.7% of the outstanding principal balance of loans with interest reserves at December 31, 2013, compared to $0.1 million, or 0.2% of the outstanding principal balance of loans with interest reserves at December 31, 2012.
Interest reserves allow the Company to advance funds to borrowers to make scheduled payments during the construction period. These advances typically are capitalized and added to the borrower’s outstanding loan balance, although we have the right to demand payment under certain circumstances. Our policy is to determine if interest reserve amounts are appropriately included in each project’s construction budget and are adequate to cover the expected duration of the construction period.
The amount, terms, and conditions of the interest reserve are established when a loan is originated, although we generally have the option to demand payment if the credit profile of the borrower changes. We evaluate the viability and appropriateness of the construction project based on the project’s complexity and feasibility, the timeline, as well as the creditworthiness of the borrowers, sponsors and/or guarantors, and the value of the collateral.
In the event that unfavorable circumstances alter the original project schedule (e.g., cost overruns, project delays, etc.), our policy is to evaluate whether or not it is appropriate to maintain interest capitalization or demand payment of interest in cash and will work with the borrower to explore various restructuring options, which may include obtaining additional equity and/or requiring additional collateral. We may also require borrowers to directly pay scheduled interest payments.
48
Our process for determining that construction projects are moving as planned are detailed in our lending policies and guidelines. Prior to approving a loan, the Company and borrower generally agree on a construction budget, a pro forma monthly disbursement schedule, and sales/leaseback assumptions. As each project progresses, the projections are measured against actual disbursements and sales/lease results to determine if the project is on schedule and performing as planned.
The specific monitoring requirements for each loan vary depending on the size and complexity of the project and the experience and financial strength of the borrower, sponsor and/or guarantor. At a minimum, to ensure that loan proceeds are properly disbursed and to assess whether it is appropriate to capitalize interest or demand cash payment of interest, our monitoring process generally includes:
|
·
|
Physical inspection of the project to ensure work has progressed to the stage for which payment is being requested;
|
|
·
|
Verification that the work completed is in conformance with plans and specifications and items for which disbursement is requested are within budget; and
|
|
·
|
Determination that there continues to be satisfactory project progress.
|
In certain rare circumstances, we may decide to extend, renew, and/or restructure the terms of a construction loan. Reasons for the restructure can range from cost overruns to project delays and the restructuring can result in additional funds being advanced or an extension of the maturity date of the loan. Prior to the loan being restructured, our policy is to perform a detailed analysis to ensure that the economics of the project remain feasible and that the risks to the Company are within acceptable lending guidelines.
Concentrations of Credit Risk
As of December 31, 2013, approximately $1.9 billion, or 72.8% of loans outstanding were real estate related, including construction loans, residential mortgage loans and commercial mortgage loans.
Substantially all of our loans are made to companies and individuals with headquarters in, or residing in, the states of Hawaii and California. Consistent with our focus of being a Hawaii-based bank, 86% of our loan portfolio was concentrated in the Hawaii market while 14% was concentrated in the U.S. Mainland as of December 31, 2013.
Our foreign credit exposure as of December 31, 2013 was minimal and did not exceed 1% of total assets.
Maturities and Sensitivities of Loans to Changes in Interest Rates
Table 12 sets forth the maturity distribution of the loan portfolio at December 31, 2013. Table 13 sets forth the sensitivity of amounts due after one year to changes in interest rates at December 31, 2013. Both tables exclude real estate loans (other than construction loans) and consumer loans.
Table 12.
Maturity Distribution of Commercial and Construction Loans
|
Maturing
|
||||||||||||||
|
Over one
|
||||||||||||||
|
One year
|
through
|
Over five
|
||||||||||||
|
or less
|
five years
|
years
|
Total
|
|||||||||||
|
(Dollars in thousands)
|
||||||||||||||
|
Commercial, financial and agricultural
|
$ | 36,361 | $ | 226,069 | $ | 136,286 | $ | 398,716 | ||||||
|
Real estate - construction
|
19,612 | 42,803 | 13,201 | 75,616 | ||||||||||
|
Total
|
$ | 55,973 | $ | 268,872 | $ | 149,487 | $ | 474,332 | ||||||
At year-end 2013, 11.8% of our commercial and construction loans had maturities of one year or less, decreasing from the prior year’s proportion of 29.7%. Meanwhile, loans in the one-through-five-years category increased to 56.7% in 2013 from 40.3% at year-end 2012 and loans in the greater-than-five-years category increased to 31.5% from 30.0% due to the aforementioned decrease in the one year or less maturity category.
49
Table 13.
Maturity Distribution of Fixed and Variable Rate Loans
|
Maturing
|
||||||||||
|
Over one
|
||||||||||
|
through
|
Over five
|
|||||||||
|
five years
|
years
|
Total
|
||||||||
|
(Dollars in thousands)
|
||||||||||
|
With fixed interest rates
|
$ | 62,858 | $ | 38,246 | $ | 101,104 | ||||
|
With variable interest rates
|
206,014 | 111,241 | 317,255 | |||||||
|
Total
|
$ | 268,872 | $ | 149,487 | $ | 418,359 | ||||
Of the loans with maturities in excess of one year at year-end 2013, 24.2% had fixed interest rates, while 75.8% had variable rates, which compares to 32.6% and 67.4%, respectively, at year-end 2012.
Provision and Allowance for Loan and Lease Losses
As described above under “—Critical Accounting Policies and Use of Estimates,” the Provision is determined by management’s ongoing evaluation of the loan portfolio and our assessment of the ability of the Allowance to cover inherent losses. Our methodology for determining the adequacy of the Allowance and Provision takes into account many factors, including the level and trend of nonperforming and potential problem loans, net charge-off experience, current repayment by borrowers, fair value of collateral securing specific loans, changes in lending and underwriting standards and general economic factors, nationally and in the markets we serve.
The Allowance consists of two components: allocated and unallocated. To calculate the allocated component, we combine specific reserves required for individual loans (including impaired loans), reserves required for pooled graded loans and loan concentrations, and reserves required for homogeneous loans (e.g., consumer loans and residential mortgage loans). We use a loan grading system whereby loans are segregated by risk. Certain graded commercial and commercial real estate loans are analyzed on an individual basis. Other graded loans are analyzed on an aggregate basis based on loss experience for the specific loan type; risks inherent in concentrations by geographic location, collateral or property type; and recent changes in loan grade and delinquencies. The determination of an allocated Allowance for homogeneous loans is done on an aggregate level based upon various factors including historical loss experience, delinquency trends, and economic conditions and are adjusted for qualitative factors including migration and volatility risks. We also use third party inputs for certain segments of loans for which we do not have sufficient historical loss data. The unallocated component of the Allowance incorporates our judgment of the determination of the risks inherent in the loan portfolio, economic uncertainties and imprecision in the estimation process.
50
The following table sets forth certain information with respect to the Allowance as of the dates or for the periods indicated.
|
Year Ended December 31,
|
||||||||||||||||||
|
2013
|
2012
|
2011
|
2010
|
2009
|
||||||||||||||
|
(Dollars in thousands)
|
||||||||||||||||||
|
Average amount of loans outstanding
|
$ | 2,394,955 | $ | 2,130,758 | $ | 2,121,544 | $ | 2,716,090 | $ | 3,745,964 | ||||||||
|
Allowance for loan and lease losses:
|
||||||||||||||||||
|
Balance at beginning of year
|
$ | 96,413 | $ | 122,093 | $ | 192,854 | $ | 205,279 | $ | 119,878 | ||||||||
|
Charge-offs:
|
||||||||||||||||||
|
Commercial, financial and agricultural
|
2,812 | 3,779 | 2,401 | 7,550 | 20,168 | |||||||||||||
|
Real estate:
|
||||||||||||||||||
|
Construction
|
358 | 8,435 | 31,371 | 126,829 | 188,581 | |||||||||||||
|
Mortgage - residential
|
1,083 | 1,664 | 4,347 | 21,042 | 16,563 | |||||||||||||
|
Mortgage - commercial
|
6,768 | 2,033 | 1,298 | 41,280 | 34,156 | |||||||||||||
|
Consumer
|
1,595 | 1,490 | 2,116 | 3,242 | 4,058 | |||||||||||||
|
Leases
|
- | 28 | 10 | 19 | 2,182 | |||||||||||||
|
Total
|
12,616 | 17,429 | 41,543 | 199,962 | 265,708 | |||||||||||||
|
Recoveries:
|
||||||||||||||||||
|
Commercial, financial and agricultural
|
1,387 | 1,614 | 1,805 | 2,421 | 453 | |||||||||||||
|
Real estate:
|
||||||||||||||||||
|
Construction
|
3,596 | 6,622 | 6,518 | 13,902 | 450 | |||||||||||||
|
Mortgage - residential
|
1,107 | 876 | 1,684 | 1,016 | 85 | |||||||||||||
|
Mortgage - commercial
|
4,240 | 488 | 383 | 9,303 | 26 | |||||||||||||
|
Consumer
|
657 | 1,029 | 1,082 | 1,259 | 1,294 | |||||||||||||
|
Leases
|
346 | 5 | - | 88 | - | |||||||||||||
|
Total
|
11,333 | 10,634 | 11,472 | 27,989 | 2,308 | |||||||||||||
|
Net loans charged off
|
1,283 | 6,795 | 30,071 | 171,973 | 263,400 | |||||||||||||
|
Provision (credit) charged to operations
|
(11,310 | ) | (18,885 | ) | (40,690 | ) | 159,548 | 348,801 | ||||||||||
|
Balance at end of year
|
$ | 83,820 | $ | 96,413 | $ | 122,093 | $ | 192,854 | $ | 205,279 | ||||||||
|
Ratios:
|
||||||||||||||||||
|
Allowance for loan and lease losses to loans
|
||||||||||||||||||
|
and leases outstanding at end of year
|
3.19% | 4.37% | 5.91% | 8.89% | 6.75% | |||||||||||||
|
Net loans charged off during year to average
|
||||||||||||||||||
|
loans and leases outstanding during year
|
0.05% | 0.32% | 1.42% | 6.33% | 7.03% | |||||||||||||
Our Allowance at December 31, 2013 totaled $83.8 million, which represented a decrease of $12.6 million, or 13.1%, from year-end 2012. When expressed as a percentage of total loans, our Allowance decreased to 3.19% at December 31, 2013, from 4.37% at year-end 2012. The decrease in our Allowance during 2013 was a result of a credit to the Provision of $11.3 million recognized during the year and $1.3 million in net loan charge-offs during the year. The decrease in our Allowance as a percentage of total loans and leases from year-end 2012 to year-end 2013 is consistent with our improved credit risk profile as evidenced by a decrease in our nonperforming assets, lower net loan charge-off activity, and is consistent with our belief that we have begun to see signs of stabilization in our loan portfolio, the overall economy and the commercial real estate markets both in Hawaii and on the U.S. Mainland.
Our Allowance as a percentage of our nonperforming assets increased from 107.10% at December 31, 2012 to 179.29% at December 31, 2013. Our Allowance as a percentage of our nonaccrual loans, including loans held for sale, increased from 121.53% at December 31, 2012 to 201.55% at December 31, 2013.
51
During 2010, we adjusted the general reserve factors used to calculate the Allowance for our commercial mortgage portfolios both in Hawaii and on the U.S. Mainland, as well our residential mortgage loan portfolio, including the owner occupied, investor, and home equity segments. Our decision to increase the general reserves established for these loan categories were made after considering various quantitative and qualitative factors. These considerations included, but were not limited to, our recent loss history, a revised assessment of projected national and local economic and market conditions, the potential negative impact that the weak commercial and residential real estate markets may have on these portfolios, and input from our regulators. We did not implement any material enhancements to our reserve factors in 2011 through 2013.
Depending on the overall performance of the local and national economies, the strength of the Hawaii commercial real estate market and the accuracy of our assumptions and judgments concerning our loan portfolio, further adverse credit migration may continue due to the upcoming maturity of additional loans, the possibility of further declines in collateral values and the potential impact of continued financial stress on our borrowers, sponsors and guarantors as they attempt to endure the challenges of the current economic environment. While we have seen signs of stabilization, we cannot determine if market conditions will continue to improve and whether or not the recent signs of an economic recovery will continue.
In accordance with GAAP, loans held for sale and other real estate assets are not included in our assessment of the Allowance.
The following table sets forth the allocation of the Allowance by loan category as of the dates indicated. Our practice is to make specific allocations on impaired loans and general allocations to each loan category based on management’s risk assessment and estimated loss rate.
During fiscal 2010, we enhanced our existing methodology for computing general reserves to include a more granular segmentation of our loan categories with the recognition of specific risk characteristics by loan type, risk migration history and geography. While our overall Allowance methodology did not change from previous periods, we believe the application of our existing methodology to a more detailed segmentation of our loan portfolio improves the quality of our Allowance calculation to better reflect the risks inherent in each of our loan categories. When segmenting the Company’s loan portfolio, management considers the guidance contained in Accounting Standards Codification (“ASC”) 310-10-55-16 through 310-10-55-18 by grouping loans that contain similar risk characteristics into various loan categories. The loan categories used are consistent with the internal reports evaluated by the Company’s management and Board of Directors to monitor risk and performance within the various segments of its loan portfolio. The factors considered when establishing the Company’s various loan segments include, but are not limited to, the category of the borrower, loan type, geographic location and collateral type.
The unallocated portion of the Allowance is maintained to provide for additional credit risk which may exist but may not be adequately accounted for in the specific and unspecified allocations due to the amount of judgment involved in the determination of the Allowance, the absence of perfect knowledge of all credit risks and the amount of uncertainty in predicting the strength of the economy and the sustainability of that strength.
Table 15.
Allocation of Allowance for Loan and Lease Losses
|
December 31,
|
|||||||||||||||||||||||||||||
|
2013
|
2012
|
2011
|
2010
|
2009
|
|||||||||||||||||||||||||
|
Percent
|
Percent
|
Percent
|
Percent
|
Percent
|
|||||||||||||||||||||||||
|
of loans
|
of loans
|
of loans
|
of loans
|
of loans
|
|||||||||||||||||||||||||
|
Allowance
|
in each
|
Allowance
|
in each
|
Allowance
|
in each
|
Allowance
|
in each
|
Allowance
|
in each
|
||||||||||||||||||||
|
for loan
|
category
|
for loan
|
category
|
for loan
|
category
|
for loan
|
category
|
for loan
|
category
|
||||||||||||||||||||
|
and lease
|
to total
|
and lease
|
to total
|
and lease
|
to total
|
and lease
|
to total
|
and lease
|
to total
|
||||||||||||||||||||
|
losses
|
loans
|
losses
|
loans
|
losses
|
loans
|
losses
|
loans
|
losses
|
loans
|
||||||||||||||||||||
|
(Dollars in thousands)
|
|||||||||||||||||||||||||||||
| Commercial, financial | |||||||||||||||||||||||||||||
|
and agricultural
|
$ | 13,196 | 15.2 | % | $ | 4,987 | 11.2 | % | $ | 6,110 | 8.7 | % | $ | 13,426 | 9.6 | % | $ | 11,026 | 8.6 | % | |||||||||
|
Real estate:
|
|||||||||||||||||||||||||||||
|
Construction
|
2,774 | 2.9 | 4,510 | 4.3 | 28,630 | 7.8 | 76,556 | 14.5 | 114,256 | 26.7 | |||||||||||||||||||
|
Mortgage:
|
|||||||||||||||||||||||||||||
|
Residential
|
28,441 | 47.1 | 29,910 | 47.0 | 32,736 | 43.4 | 31,830 | 34.4 | 23,930 | 27.0 | |||||||||||||||||||
|
Commercial
|
26,778 | 22.8 | 48,500 | 30.5 | 47,729 | 33.9 | 64,308 | 35.0 | 44,308 | 31.9 | |||||||||||||||||||
|
Consumer
|
6,576 | 11.8 | 2,421 | 6.5 | 2,335 | 5.3 | 3,155 | 5.2 | 4,555 | 4.4 | |||||||||||||||||||
|
Leases
|
55 | 0.2 | 85 | 0.5 | 553 | 0.9 | 1,579 | 1.3 | 1,079 | 1.4 | |||||||||||||||||||
|
Unallocated
|
6,000 | - | 6,000 | - | 4,000 | - | 2,000 | - | 6,125 | - | |||||||||||||||||||
|
Total
|
$ | 83,820 | 100.0 | % | $ | 96,413 | 100.0 | % | $ | 122,093 | 100.0 | % | $ | 192,854 | 100.0 | % | $ | 205,279 | 100.0 | % | |||||||||
52
The methodology applied in determining the level of Allowance and the allocation among loan categories in 2013 was consistent with that applied in 2012.
The Allowance allocated to commercial loans at year-end 2013 totaled $13.2 million, compared to $5.0 million at year-end 2012, representing 3.3% and 2.0% of total commercial loans, respectively. The increase in the ending Allowance amount was primarily due to an increase in the commercial loan portfolio as of year-end 2013.
The Allowance allocated to construction loans totaled $2.8 million, or 3.7%, of construction loans at year-end 2013, compared to $4.5 million, or 4.7%, of construction loans outstanding at year-end 2012. The decreases in the ending Allowance amount and the Allowance as a percentage of construction loans were primarily due to the decreases in the construction loan portfolio and nonaccrual construction loans as of year-end 2013.
The Allowance allocated to our residential mortgage loans decreased to $28.4 million, or 2.3%, of total residential mortgage loans at December 31, 2013, compared to $29.9 million, or 2.9%, of related loans at year-end 2012. The decrease in the ending Allowance amount was primarily due to the decrease in nonaccrual residential mortgage loans as of year-end 2013.
Commercial mortgage loans were allocated an Allowance of $26.8 million, or 4.5%, of those loans at December 31, 2013, compared to $48.5 million, or 7.2%, of commercial mortgage loans at year-end 2012. The decreases in the ending Allowance amount and the Allowance as a percentage of commercial mortgage loans was primarily due to the significant decrease in the commercial mortgage loan portfolio as of year-end 2013.
The allocated Allowance for consumer loans at December 31, 2013 increased to $6.6 million from $2.4 million in the prior year, representing 2.1% of total consumer loans in 2013, compared to 1.7% in 2012. The increase in the ending Allowance amount was primarily due to an increase in the consumer loan portfolio as of year-end 2013.
We also allocated an Allowance for leases of $55 thousand, or 0.9%, of total leases, compared to $85 thousand, or 0.8%, of total leases as of year-end 2012.
The unallocated portion of the Allowance of $6 million remained unchanged at December 31, 2013 and 2012.
53
Nonperforming Assets, Accruing Loans Delinquent for 90 Days or More, Restructured Loans Still Accruing Interest
The following table sets forth nonperforming assets, accruing loans delinquent for 90 days or more and restructured loans still accruing interest at the dates indicated.
Table 16.
Nonperforming Assets, Past Due and Restructured Loans
|
December 31,
|
||||||||||||||||||
|
2013
|
2012
|
2011
|
2010
|
2009
|
||||||||||||||
|
(Dollars in thousands)
|
||||||||||||||||||
|
Nonaccrual loans
|
||||||||||||||||||
|
Commercial, financial & agricultural
|
$ | 3,533 | $ | 3,510 | $ | 1,367 | $ | 982 | $ | 8,377 | ||||||||
|
Real estate:
|
||||||||||||||||||
|
Construction
|
4,015 | 38,742 | 69,765 | 182,073 | 362,557 | |||||||||||||
|
Mortgage - residential
|
20,271 | 27,499 | 47,128 | 47,560 | 55,603 | |||||||||||||
|
Mortgage - commercial
|
13,769 | 9,487 | 15,653 | 14,464 | 45,847 | |||||||||||||
|
Consumer
|
- | - | - | 225 | - | |||||||||||||
|
Leases
|
- | 94 | - | - | 466 | |||||||||||||
|
Total nonaccrual loans
|
41,588 | 79,332 | 133,913 | 245,304 | 472,850 | |||||||||||||
|
Other real estate
|
||||||||||||||||||
|
Real estate:
|
||||||||||||||||||
|
Construction
|
3,770 | 8,105 | 56,429 | 54,507 | 26,899 | |||||||||||||
|
Mortgage - residential
|
1,184 | 2,372 | 5,252 | 3,000 | 55 | |||||||||||||
|
Mortgage - commercial
|
209 | 209 | - | - | - | |||||||||||||
|
Other real estate
|
5,163 | 10,686 | 61,681 | 57,507 | 26,954 | |||||||||||||
|
Total nonperforming assets
|
46,751 | 90,018 | 195,594 | 302,811 | 499,804 | |||||||||||||
|
Accruing loans delinquent for 90 days or more
|
||||||||||||||||||
|
Real estate:
|
||||||||||||||||||
|
Construction
|
- | - | - | 6,550 | 228 | |||||||||||||
|
Mortgage - residential
|
- | 387 | - | 1,800 | 2,680 | |||||||||||||
|
Consumer
|
- | 116 | 28 | 181 | 232 | |||||||||||||
|
Leases
|
15 | - | - | - | 152 | |||||||||||||
|
Total accruing loans delinquent for 90 days or more
|
15 | 503 | 28 | 8,531 | 3,292 | |||||||||||||
|
Restructured loans still accruing interest
|
||||||||||||||||||
|
Commercial, financial & agricultural
|
406 | 447 | - | - | - | |||||||||||||
|
Real estate:
|
||||||||||||||||||
|
Construction
|
3,857 | 9,522 | 5,170 | - | 2,745 | |||||||||||||
|
Mortgage - residential
|
16,508 | 15,366 | 3,093 | 13,401 | 3,565 | |||||||||||||
|
Mortgage - commercial
|
2,502 | 6,425 | - | - | - | |||||||||||||
|
Total restructured loans still accruing interest
|
23,273 | 31,760 | 8,263 | 13,401 | 6,310 | |||||||||||||
|
Total nonperforming assets, accruing loans delinquent
|
||||||||||||||||||
|
for 90 days or more and restructured loans still
|
||||||||||||||||||
|
accruing interest
|
$ | 70,039 | $ | 122,281 | $ | 203,885 | $ | 324,743 | $ | 509,406 | ||||||||
|
Total nonperforming assets as a percentage of loans
|
||||||||||||||||||
|
and leases, loans held for sale and other real estate
|
1.77% | 4.00% | 8.99% | 13.18% | 15.85% | |||||||||||||
|
Total nonperforming assets and accruing loans delinquent
|
||||||||||||||||||
|
for 90 days or more as a percentage of loans and
|
||||||||||||||||||
|
leases, loans held for sale and other real estate
|
1.77% | 4.02% | 8.99% | 13.56% | 15.96% | |||||||||||||
|
Total nonperforming assets, accruing loans delinquent for
|
||||||||||||||||||
|
90 days or more and restructured loans still accruing
|
||||||||||||||||||
|
interest as a percentage of loans and leases, loans held
|
||||||||||||||||||
|
for sale and other real estate
|
2.64% | 5.43% | 9.37% | 14.14% | 16.16% | |||||||||||||
54
Nonperforming assets, which includes nonaccrual loans and leases, nonperforming loans classified as held for sale and other real estate, totaled $46.8 million at December 31, 2013, compared to $90.0 million at year-end 2012. Nonperforming assets at December 31, 2013 were comprised of $41.6 million in nonaccrual loans, none of which were loans classified as held for sale, and $5.2 million in other real estate.
The decrease in 2013 was attributable to $45.1 million in repayments, $17.2 million in loans restored to accrual status, the sale of $6.3 million in other real estate, charge-offs of $1.9 million and net write-downs of other real estate totaling $0.4 million. All of these decreases were partially offset by $27.7 million in gross additions.
Net changes to nonperforming assets by category during 2013 included net decreases in U.S. Mainland construction and development assets totaling $36.3 million, Hawaii residential mortgage assets totaling $8.4 million, Hawaii construction and development assets totaling $2.8 million, and Hawaii leasing assets totaling $0.1 million. Partially offsetting these decreases were net increases in Hawaii commercial mortgage assets totaling $2.9 million, U.S. Mainland commercial mortgage assets totaling $1.4 million and Hawaii commercial assets of $23 thousand.
Loans delinquent for 90 days or more still accruing interest totaled $15 thousand at December 31, 2013, compared to $0.5 million at December 31, 2012.
55
Investment Portfolio
The following table sets forth the amounts and distribution of investment securities held as of the dates indicated.
Table 17.
Distribution of Investment Securities
|
December 31,
|
||||||||||||||||||||||
|
2013
|
2012
|
2011
|
||||||||||||||||||||
|
Held to
|
Available
|
Held to
|
Available
|
Held to
|
Available
|
|||||||||||||||||
|
maturity (at
|
for sale (at
|
maturity (at
|
for sale (at
|
maturity (at
|
for sale (at
|
|||||||||||||||||
|
amortized cost)
|
fair value)
|
amortized cost)
|
fair value)
|
amortized cost)
|
fair value)
|
|||||||||||||||||
|
(Dollars in thousands)
|
||||||||||||||||||||||
|
Debt securities:
|
||||||||||||||||||||||
|
U.S. Government sponsored entities
|
$ | - | $ | - | $ | - | $ | 280,939 | $ | - | $ | 373,177 | ||||||||||
|
States and political subdivisions
|
- | 179,357 | - | 185,911 | - | 12,994 | ||||||||||||||||
|
Corporate securities
|
- | 158,095 | - | 127,946 | - | 8,551 | ||||||||||||||||
|
Mortgage-backed securities:
|
||||||||||||||||||||||
|
U.S. Government sponsored entities
|
252,047 | 927,626 | 161,848 | 941,043 | 931 | 1,097,302 | ||||||||||||||||
|
Non-agency collateralized mortgage
|
||||||||||||||||||||||
|
obligations
|
- | 142,046 | - | - | - | - | ||||||||||||||||
|
Other
|
- | 875 | - | 906 | - | 970 | ||||||||||||||||
|
Total
|
$ | 252,047 | $ | 1,407,999 | $ | 161,848 | $ | 1,536,745 | $ | 931 | $ | 1,492,994 | ||||||||||
Investment securities totaled $1.7 billion at December 31, 2013, decreasing by $38.5 million, or 2.3%, from the $1.7 billion held at December 31, 2012, which increased by $204.7 million, or 13.7%, from the $1.5 billion at year-end 2011.
During the year ended December 31, 2013, we sold certain available for sale investment securities and received gross proceeds of $271.9 million. Gross realized gains and losses on the sales of the available for sale investment securities were $3.9 million and $3.4 million, respectively. The specific identification method was used as the basis for determining the cost of all securities sold.
In the fourth quarter of 2013, we executed a bond swap where we sold $271.5 million in lower-yielding available-for-sale agency debentures and agency mortgage-backed securities with an average net yield of 1.87% and a weighted average life of 2.9 years and reinvested the majority of the proceeds in $242.5 million of higher-yielding agency mortgage-backed securities, non-agency commercial mortgage-backed securities, and corporate bond securities with an average yield of 3.21% and a weighted average life of 7.4 years. The new securities were classified in the available-for-sale portfolio and a net gain of $0.5 million was realized on the transaction.
During the year ended December 31, 2012, we sold certain available for sale investment securities and received gross proceeds of $130.1 million. Gross realized gains and losses on the sales of the available for sale investment securities were $1.7 million and $0.9 million, respectively. The specific identification method was used as the basis for determining the cost of all securities sold.
In the third quarter of 2012, we completed an investment securities portfolio repositioning to reduce net interest income volatility and enhance the potential for prospective earnings and an improved net interest margin. In connection with the repositioning, we sold $124.7 million in available-for-sale mortgage-backed securities with an average net yield of 0.60% and a weighted average life of 1.3 years and reinvested the proceeds in $133.2 million of investment securities with an average yield of 1.88% and a weighted average life of 5.3 years. The new securities were classified in the held-to-maturity portfolio and a net gain of $0.7 million was realized on the transaction.
56
Maturity Distribution of Investment Portfolio
The following table sets forth the maturity distribution of the investment portfolio and weighted average yields by investment type and maturity grouping at December 31, 2013.
Table 18.
Maturity Distribution of Investment Portfolio
|
Carrying
|
Weighted
|
||||||
|
Portfolio Type and Maturity Grouping
|
value
|
average yield (1)
|
|||||
|
(Dollars in thousands)
|
|||||||
|
Held-to-maturity portfolio:
|
|||||||
|
U.S. Government sponsored entities mortgage-backed securities:
|
|||||||
|
Within one year
|
$ | - | - | % | |||
|
After one but within five years
|
- | - | |||||
|
After five but within ten years
|
99,071 | 2.04 | |||||
|
After ten
years
|
152,976 | 2.04 | |||||
|
Total U.S. Government sponsored entities mortgage-backed securities
|
252,047 | 2.04 | |||||
|
Total held-to-maturity portfolio
|
$ | 252,047 | 2.04 | % | |||
|
Available-for-sale portfolio:
|
|||||||
|
States and political subdivisions:
|
|||||||
|
Within one year
|
$ | - | - | % | |||
|
After one but within five years
|
7,610 | 5.28 | |||||
|
After five but within ten years
|
54,337 | 2.57 | |||||
|
After ten years
|
117,410 | 3.58 | |||||
|
Total States and political subdivisions
|
179,357 | 3.34 | |||||
|
Corporate securities:
|
|||||||
|
Within one year
|
- | - | |||||
|
After one but within five years
|
81,209 | 2.31 | |||||
|
After five but within ten years
|
76,886 | 2.83 | |||||
|
After ten years
|
- | - | |||||
|
Total Corporate securities
|
158,095 | 2.56 | |||||
|
U.S. Government sponsored entities mortgage-backed securities:
|
|||||||
|
Within one year
|
- | - | |||||
|
After one but within five years
|
600 | 4.71 | |||||
|
After five but within ten years
|
29,736 | 2.76 | |||||
|
After ten years
|
897,290 | 2.47 | |||||
|
Total U.S. Government sponsored entities mortgage-backed securities
|
927,626 | 2.48 | |||||
|
Non-agency collaterized mortgage obligations:
|
|||||||
|
Within one year
|
- | - | |||||
|
After one but within five years
|
- | - | |||||
|
After five but within ten years
|
111,734 | 3.06 | |||||
|
After ten years
|
30,312 | 3.94 | |||||
|
Total Non-agency collaterized mortgage obligations
|
142,046 | 3.24 | |||||
|
Other:
|
|||||||
|
Within one year
|
- | - | |||||
|
After one but within five years
|
- | - | |||||
|
After five but within ten years
|
- | - | |||||
|
After ten years
|
875 | - | |||||
|
Total Other
|
875 | - | |||||
|
Total available-for-sale portfolio
|
$ | 1,407,999 | 2.68 | % | |||
|
Total investment securities
|
$ | 1,660,046 | 2.58 | % | |||
|
(1) Weighted average yields are computed on an annual basis, and yields on tax-exempt
|
|||||||
|
obligations are computed on a taxable-equivalent basis using an assumed tax rate of 35%.
|
|||||||
57
During 2013, the weighted average yield of the investment portfolio increased by 61 bp to 2.58% from the prior year. The increase in yield reflects the steepening interest rate yield curve and slowing of premium amortization in 2013, along with investments in non-agency collateralized mortgage obligations which carry higher yields.
Deposits
The primary source of our funding comes from deposits in the state of Hawaii. In this competitive market, we strive to distinguish ourselves by providing quality customer service in our branch offices and establishing long-term relationships with businesses and their principals. Our focus has been to develop a large, stable base of core deposits, which are comprised of non-interest bearing and interest-bearing demand deposits, savings and money market deposits, and time deposits less than $100,000. Time deposits in amounts of $100,000 and greater are generally considered to be more price-sensitive than relationship-based and are thus given less focus in our marketing and sales efforts.
Total deposits of $3.9 billion at December 31, 2013 reflected an increase of $255.4 million, or 6.9%, from total deposits of $3.7 billion at December 31, 2012. Total deposits at December 31, 2012 increased by $237.2 million, or 6.9%, over the year-end 2011 balance of $3.4 billion. The increase in deposits in 2013 reflects increases in government-owned time deposits, interest-bearing demand deposits, noninterest-bearing demand deposits, and savings and money market deposits of $178.0 million, $55.8 million, $47.7 million and $21.0 million, respectively, offset by decreases in other time deposits of $47.1 million.
Core deposits totaled $3.1 billion at December 31, 2013 and increased by $86.6 million, or 2.9%, from December 31, 2012, which increased by $220.4 million or 7.9% from December 31, 2011. Core deposits as a percentage of total deposits was 78.6% at December 31, 2013, compared to 81.7% at December 31, 2012, and 80.9% at December 31, 2011.
The table below sets forth information regarding the average balances and average rates paid for certain deposit categories for each of the years indicated. Average balances are computed using daily average balances. The average rate on time deposits, which are most sensitive to changes in market rates, decreased by 11 bp in 2013, while savings and money market deposit rates decreased by 2 bp and interest-bearing demand deposit rates remained unchanged. The average rate paid on all deposits in 2013 decreased to 0.11% from 0.14% in 2012 and 0.30% in 2011. The drop in average rates paid in 2013 was attributable to the depressed interest rate environment in which we, as well as other financial institutions throughout the country, continued to operate in during 2013.
Table 19.
Average Balances and Average Rates on Deposits
|
Year Ended December 31,
|
|||||||||||||||||
|
2013
|
2012
|
2011
|
|||||||||||||||
|
Average
|
Average
|
Average
|
Average
|
Average
|
Average
|
||||||||||||
|
balance
|
rate paid
|
balance
|
rate paid
|
balance
|
rate paid
|
||||||||||||
|
(Dollars in thousands)
|
|||||||||||||||||
|
Noninterest-bearing demand deposits
|
$ | 849,371 | - | % | $ | 773,768 | - | % | $ | 675,604 | - | % | |||||
|
Interest-bearing demand deposits
|
708,658 | 0.05 | 615,960 | 0.05 | 539,519 | 0.09 | |||||||||||
|
Savings and money market deposits
|
1,191,919 | 0.07 | 1,163,963 | 0.09 | 1,117,183 | 0.18 | |||||||||||
|
Time deposits
|
1,054,714 | 0.27 | 978,627 | 0.38 | 880,234 | 0.80 | |||||||||||
|
Total
|
$ | 3,804,662 | 0.11 | % | $ | 3,532,318 | 0.14 | % | $ | 3,212,540 | 0.30 | % | |||||
We expect overall deposit rates to remain suppressed in 2014 in response to the FRB’s current monetary policy of keeping interest rates at low levels. In addition to the external interest rate environment, the overall direction of rate movements in our deposit base will largely depend on the level of deposit growth we need to maintain adequate liquidity and competitive pricing considerations, which may be impacted by the repeal of federal prohibitions on the ability of financial institutions to pay interest on demand deposit accounts as part of the Dodd-Frank Act as further described in “Item 1A. Risk Factors.”
58
Contractual Obligations
The following table sets forth contractual obligations (excluding deposit liabilities) as of December 31, 2013.
Table 20.
Contractual Obligations
|
Payments Due By Period
|
||||||||||||||||||
|
Less Than
|
More Than
|
|||||||||||||||||
|
One Year
|
1-3 Years
|
3-5 Years
|
5 Years
|
Total
|
||||||||||||||
|
(Dollars in thousands)
|
||||||||||||||||||
|
Short-term borrowings
|
$ | 8,015 | $ | - | $ | - | $ | - | $ | 8,015 | ||||||||
|
Long-term debt
|
14 | - | - | 92,785 | 92,799 | |||||||||||||
|
Pension plan and SERP obligations
|
2,642 | 5,281 | 5,638 | 27,729 | 41,290 | |||||||||||||
|
Operating leases
|
7,847 | 12,527 | 8,564 | 23,664 | 52,602 | |||||||||||||
|
Purchase obligations
|
13,430 | 13,341 | 10,224 | 6,937 | 43,932 | |||||||||||||
|
Total
|
$ | 31,948 | $ | 31,149 | $ | 24,426 | $ | 151,115 | $ | 238,638 | ||||||||
Components of short-term borrowings and long-term debt are discussed in Notes 12 and 13, respectively, to the Consolidated Financial Statements under “Part II, Item 8. Financial Statements and Supplementary Data.” Operating leases represent leases on bank premises as discussed in Note 18 to the Consolidated Financial Statements under “Part II, Item 8. Financial Statements and Supplementary Data.” Purchase obligations represent other contractual obligations to purchase goods or services at specified terms including, but not limited to, software licensing agreements, equipment maintenance contracts and professional service contracts. Pension plan obligations include obligations under our defined benefit retirement plan and Supplemental Executive Retirement Plans, which are discussed in Note 16 to the Consolidated Financial Statements under “Part II, Item 8. Financial Statements and Supplementary Data.”
Capital Resources
In order to ensure adequate levels of capital, we conduct an ongoing assessment of projected sources and uses of capital in conjunction with an analysis of the size and quality of our assets and the level of risk. As part of this ongoing assessment, the Board of Directors reviews our capital position on an ongoing basis to ensure it is adequate, including, but not limited to, need for raising additional capital or returning capital to our shareholders, including the ability to declare cash dividends or repurchase our securities.
Common and Preferred Equity
Shareholders’ equity totaled $660.1 million at December 31, 2013, an increase of $155.3 million, or 30.8%, from the $504.8 million at December 31, 2012, which increased by $48.4 million, or 10.6%, from 2011. When expressed as a percentage of total assets, shareholders’ equity increased to 13.9% at December 31, 2013, from 11.6% at December 31, 2012 and 11.0% at December 31, 2011.
The significant increase in shareholders’ equity from 2012 was primarily attributable to the $172.1 million in net income recognized in 2013. As previously mentioned, net income in 2013 included a non-cash income tax benefit of $119.8 million recorded in the first quarter of 2013 related to the reversal of a significant portion of a valuation allowance that was established against the Company’s net DTA during the third quarter of 2009.
In June 2013, the Treasury held a private auction to sell its warrant positions in several financial institutions which included the Company’s warrant to purchase up to 79,288 shares of our common stock at a purchase price of $10 per share. On June 6, 2013, we were notified that we were the winning bidder of the warrant at our bid of $752 thousand. The warrant was being carried as a derivative liability on our balance sheet at $828 thousand at March 31, 2013. Accordingly, we recorded a credit to other noninterest expense of $76 thousand during the quarter related to the gain on the purchase of the warrant. After the completion of this transaction, the Treasury no longer holds any outstanding shares of our common stock, or any warrants to purchase our common stock they received in connection with our participation in the Troubled Assets Relief Program.
59
Our tangible common equity ratio was 13.69% at December 31, 2013, compared to 11.24% at December 31, 2012 and 10.63% at December 31, 2011. Our book value per share was $15.68, $12.06, and $10.93 at year-end 2013, 2012 and 2011, respectively. As mentioned above, the significant increases in our tangible common equity ratio and book value per share from 2012 were primarily attributable to net income of $172.1 million recorded in 2013. The tangible common equity ratio is a non-GAAP financial measure which should be read and used in conjunction with the Company’s GAAP financial information. Comparison of our tangible common equity ratio with those of other companies may not be possible because other companies may calculate the tangible common equity ratio differently. Our tangible common equity ratio is derived by dividing common shareholders' equity, less intangible assets (excluding mortgage servicing rights), by total assets, less intangible assets (excluding mortgage servicing rights).
The following table sets forth a reconciliation of our tangible common equity ratio for each of the dates indicated:
Table 21.
Reconciliation to Tangible Common Equity Ratio
|
December 31,
|
|||||||||||
|
2013
|
2012
|
2011
|
|||||||||
|
(Dollars in thousands)
|
|||||||||||
|
Total shareholders' equity
|
$ | 660,113 | $ | 504,822 | $ | 456,440 | |||||
|
Less:
|
|||||||||||
|
Preferred stock
|
- | - | - | ||||||||
|
Other intangible assets (excluding mortgage servicing rights)
|
(12,704 | ) | (15,378 | ) | (19,053 | ) | |||||
|
Tangible common equity
|
647,409 | 489,444 | 437,387 | ||||||||
|
Total assets
|
4,741,198 | 4,370,368 | 4,132,865 | ||||||||
|
Less: Other intangible assets (excluding mortgage servicing rights)
|
(12,704 | ) | (15,378 | ) | (19,053 | ) | |||||
|
Tangible assets
|
4,728,494 | 4,354,990 | 4,113,812 | ||||||||
|
Tangible common equity / Tangible assets
|
13.69% | 11.24% | 10.63% | ||||||||
Trust Preferred Securities
We have five statutory trusts, CPB Capital Trust I, CPB Capital Trust II, CPB Statutory Trust III, CPB Capital Trust IV and CPB Statutory Trust V, which issued a total of $105.0 million in trust preferred securities. Our obligations with respect to the issuance of the trust preferred securities constitute a full and unconditional guarantee by the Company of the each trust’s obligations with respect to its trust preferred securities. Subject to certain exceptions and limitations, we may elect from time to time to defer subordinated debenture interest payments, which would result in a deferral of dividend payments on the related trust preferred securities, for up to 20 consecutive quarterly periods without default or penalty.
We began deferring interest and dividend payments on the subordinated debentures and the trust preferred securities in the third quarter of 2009. In March 2013, the Company elected to pay all deferred interest on its subordinated debentures and related dividend payments on its trust preferred securities and resume quarterly payments for each outstanding trust. As a result, the deferred accrued interest in the amount of $13.0 million was paid in full in March 2013 and the Company resumed quarterly payments on all five statutory trusts.
In June 2013, the Company was notified that $10.0 million of the $15.0 million in trust preferred securities of CPB Capital Trust I (“Trust I”) would be auctioned off as part of a larger pooled collateralized debt obligation liquidation. The Company placed a bid of $9.0 million for the securities which was accepted by the trustee and the transaction closed on June 18, 2013. Because our accepted bid of $9.0 million was less than the $10.0 million carrying value, we recognized a gain of $1.0 million related to this transaction on October 7, 2013, when these securities were called. The Company determined that its investment in Trust I did not represent a variable interest and therefore the Company was not the primary beneficiary of Trust I. As a result, consolidation of Trust I by the Company was not required. In October 2013, the Company purchased the remaining $5.0 million in trust preferred securities and these securities were also called by the Company on October 7, 2013. As of December 31, 2013, $0.5 million in common stock of Trust I is still outstanding.
Capital Requirements
In order to ensure adequate levels of capital, we conduct an ongoing assessment of projected sources and uses of capital in conjunction with an analysis of the size and quality of our assets and the level of risk. As part of this ongoing assessment, the Board of Directors reviews our capital position on an ongoing basis to ensure it is adequate.
60
Holding Company Capital Resources
CPF is required to act as a source of strength to the bank under the Dodd-Frank Act. All of the funds CPF received from the sale of the TARP preferred stock were contributed by CPF to the bank as capital. CPF is obligated to pay its expenses and payments on its junior subordinated debentures which fund payments on the outstanding trust preferred securities. CPF deferred the payment of dividends on our TARP preferred stock and trust preferred securities (along with interest on the related junior subordinated debentures) beginning in the third quarter of 2009. As mentioned in the previous section, in March 2013, the Company elected to resume quarterly payments for each outstanding trust and all deferred interest on its subordinated debentures and related dividend payments on its trust preferred securities were paid in full.
In the past, CPF has primarily relied upon dividends from the bank for its cash flow needs. CPF has not received dividends from the bank since September 2008. As a Hawaii state-chartered bank, the bank may only pay dividends to the extent it has retained earnings as defined under Hawaii banking law (“Statutory Retained Earnings”), which differs from GAAP retained earnings. As of December 31, 2013, the bank had Statutory Retained Earnings of $240.4 million. In 2013, in light of the Company's improved capital position and financial condition, our Board of Directors and management, in consultation with our regulators, reinstated and declared quarterly cash dividends of $0.08 per share on the Company’s outstanding common shares to shareholders of record at the close of business on August 30, 2013 and November 29, 2013. These dividends were paid on September 16, 2013 and December 16, 2013, respectively. CPF had sufficient cash on hand to fund these dividends, thus the bank did not pay a dividend to CPF. In January 2014, the Company’s Board of Directors declared a third consecutive quarterly cash dividend of $0.08 per share on the Company’s outstanding common shares, payable on March 17, 2014 to shareholders of record at the close of business on February 28, 2014.
Dividends are payable at the discretion of the Board of Directors and there can be no assurance that the Board of Directors will continue to pay dividends at the same rate, or at all, in the future. Our ability to pay cash dividends to our shareholders is subject to restrictions under federal and Hawaii law, including restrictions imposed by the FRB and covenants set forth in various agreements we are a party to, including covenants set forth in our subordinated debentures. For further information, see “Dividends – Market for Registrant’s Common Equity, Related Shareholder Matters and Issuer Purchases of Equity Securities.”
As of December 31, 2013, on a stand-alone basis, CPF had an available cash balance of approximately $19.6 million in order to meet its ongoing obligations.
On February 21, 2014, we announced a tender offer to purchase for cash up to $68.8 million in value of shares of our common stock at a price not greater than $21.00 nor less than $18.50 per share. On February 20, 2014, we also entered into Repurchase Agreements with each of Carlyle and Anchorage pursuant to which we have agreed to purchase up to $28.1 million of shares of common stock from each of the Lead Investors at the Purchase Price (or an aggregate of $56.2 million of shares.) The Share Repurchases are scheduled to close on the eleventh business day following the expiration of the Tender Offer. The aggregate value of shares to be repurchased under the Repurchase Agreements will be proportionately reduced in the event that the Company purchases less than the maximum number of shares that it is able to purchase at the Purchase Price pursuant to the terms of the Tender Offer. In addition, each Lead Investor may tender in the Tender Offer, although neither Lead Investor has indicated to what extent such Lead Investor intends to do so. The Share Repurchases contemplated by the Repurchase Agreements are conditioned upon, among other matters, the Company purchasing shares in the Tender Offer in accordance with this its terms. If the Tender Offer is fully subscribed, the completion of the Tender Offer and the Share Repurchases will result in the repurchase by us of $125 million of shares in the aggregate. If the Tender Offer is fully subscribed at a Purchase Price of $21.00, the maximum Purchase Price pursuant to the Tender Offer, the completion of the Tender Offer and the Share Repurchases will result in the repurchase by us 5,952,380 shares of common stock, which would represent approximately 14.1% of our issued and outstanding shares. If the Tender Offer is fully subscribed at a Purchase Price of $18.50, the minimum Purchase Price pursuant to the Tender Offer, the completion of the Tender Offer and the Share Repurchases will result in the repurchase by the Company of 6,756,755 shares in the aggregate, which would represent approximately 16.0% of our issued and outstanding shares. We can provide no assurance as to how many shares of our common stock may be repurchased in the Tender Offer or pursuant to the Repurchase Agreements.
Asset/Liability Management and Interest Rate Risk
Our earnings and capital are sensitive to risk of interest rate fluctuations. Interest rate risk arises when rate-sensitive assets and rate-sensitive liabilities mature or reprice during different periods or in differing amounts. In the normal course of business, we are subjected to interest rate risk through the activities of making loans and taking deposits, as well as from our investment securities portfolio and other interest-bearing funding sources. Asset/liability management attempts to coordinate our rate-sensitive assets and rate-sensitive liabilities to meet our financial objectives.
61
Our Asset/Liability Management Policy seeks to maximize the risk-adjusted return to shareholders while maintaining consistently acceptable levels of liquidity, interest rate risk and capitalization. Our Asset/Liability Management Committee, or ALCO, monitors interest rate risk through the use of interest rate sensitivity gap, net interest income and market value of portfolio equity simulation and rate shock analyses. This process is designed to measure the impact of future changes in interest rates on net interest income and market value of portfolio equity. Adverse interest rate risk exposures are managed through the shortening or lengthening of the duration of assets and liabilities.
Interest rate risk can be analyzed by monitoring an institution’s interest rate sensitivity gap and changes in the gap over time. An asset or liability is said to be interest rate sensitive within a specific time period if it will mature or reprice within that time period. The interest rate sensitivity gap is defined as the difference between the amount of interest-earning assets and the amount of interest-bearing liabilities maturing or repricing within a specified time period. A gap is considered positive when the amount of interest rate sensitive assets exceeds the amount of interest rate sensitive liabilities. A gap is considered negative when the amount of interest rate sensitive liabilities exceeds the amount of interest rate sensitive assets. During a period of rising interest rates, the earnings of an institution with a positive gap theoretically may be positively affected due to its interest-earning assets repricing to a greater extent than its interest-bearing liabilities. An adverse impact would be expected for an institution with a negative gap.
The following table sets forth information regarding our interest rate sensitivity gap at December 31, 2013. The assumptions used in determining interest rate sensitivity of various asset and liability products had a significant impact on the resulting table. For purposes of this presentation, assets and liabilities are classified by the earliest repricing date or maturity. All interest-bearing demand and savings balances are included in the three-months-or-less category, even though repricing of these accounts is not contractually required and may not actually occur during that period. Since all interest rates and yields do not adjust at the same velocity or magnitude, and since volatility is subject to change, the interest rate sensitivity gap is only a general indicator of interest rate risk.
Table 22.
Rate Sensitivity of Assets, Liabilities and Equity
|
Over
|
Over Six
|
Over One
|
||||||||||||||||||||||||
|
Three
|
Three
|
Through
|
Through
|
Over
|
||||||||||||||||||||||
|
Months
|
Through
|
Twelve
|
Three
|
Three
|
Nonrate
|
|||||||||||||||||||||
|
or Less
|
Six Months
|
Months
|
Years
|
Years
|
Sensitive
|
Total
|
||||||||||||||||||||
|
(Dollars in thousands)
|
||||||||||||||||||||||||||
|
Assets
|
||||||||||||||||||||||||||
|
Interest-bearing deposits in other banks
|
$ | 4,256 | $ | - | $ | - | $ | - | $ | - | $ | - | $ | 4,256 | ||||||||||||
|
Investment securities
|
44,195 | 44,867 | 79,579 | 284,350 | 1,232,352 | (25,297 | ) | 1,660,046 | ||||||||||||||||||
|
Loans held for sale
|
12,370 | - | - | - | - | - | 12,370 | |||||||||||||||||||
|
Loans and leases
|
690,858 | 164,765 | 298,345 | 627,146 | 804,467 | 45,020 | 2,630,601 | |||||||||||||||||||
|
Federal Home Loan Bank stock
|
- | - | - | - | - | 46,193 | 46,193 | |||||||||||||||||||
|
Other assets
|
- | - | - | - | - | 387,732 | 387,732 | |||||||||||||||||||
|
Total assets
|
$ | 751,679 | $ | 209,632 | $ | 377,924 | $ | 911,496 | $ | 2,036,819 | $ | 453,648 | $ | 4,741,198 | ||||||||||||
|
Liabilities and Equity
|
||||||||||||||||||||||||||
|
Noninterest-bearing deposits
|
$ | - | $ | - | $ | - | $ | - | $ | - | $ | 891,017 | $ | 891,017 | ||||||||||||
|
Interest-bearing deposits
|
2,392,168 | 329,885 | 203,200 | 95,692 | 24,211 | - | 3,045,156 | |||||||||||||||||||
|
Short-term borrowings
|
8,015 | - | - | - | - | - | 8,015 | |||||||||||||||||||
|
Long-term debt
|
92,789 | 4 | 6 | - | - | - | 92,799 | |||||||||||||||||||
|
Other liabilities
|
- | - | - | - | - | 44,037 | 44,037 | |||||||||||||||||||
|
Equity
|
- | - | - | - | - | 660,174 | 660,174 | |||||||||||||||||||
|
Total liabilities and equity
|
$ | 2,492,972 | $ | 329,889 | $ | 203,206 | $ | 95,692 | $ | 24,211 | $ | 1,595,228 | $ | 4,741,198 | ||||||||||||
|
Interest rate sensitivity gap
|
$ | (1,741,293 | ) | $ | (120,257 | ) | $ | 174,718 | $ | 815,804 | $ | 2,012,608 | $ | (1,141,580 | ) | $ | - | |||||||||
|
Cumulative interest rate sensitivity gap
|
$ | (1,741,293 | ) | $ | (1,861,550 | ) | $ | (1,686,832 | ) | $ | (871,028 | ) | $ | 1,141,580 | $ | - | $ | - | ||||||||
62
ALCO also utilizes a detailed and dynamic simulation model to measure and manage interest rate risk exposures. The monthly simulation process is designed to measure the impact of future changes in interest rates on net interest income and market value of portfolio equity and to allow ALCO to model alternative balance sheet strategies. The following reflects our net interest income sensitivity analysis as of December 31, 2013, over a one-year horizon, assuming no balance sheet growth and given both a 200 bp upward and 100 bp downward parallel shift in interest rates.
|
Estimated Net Interest
|
||
|
Rate Change
|
Income Sensitivity
|
|
|
+200bp
|
(0.15)%
|
|
|
-100bp
|
(2.51)%
|
Table 23.
Interest Rate Sensitivity
|
Expected Maturity Within
|
||||||||||||||||||||||||||||||
|
One Year
|
Two Years
|
Three Years
|
Four Years
|
Five Years
|
Thereafter
|
Book Value
|
Total Fair Value
|
|||||||||||||||||||||||
|
(Dollars in thousands)
|
||||||||||||||||||||||||||||||
|
Interest-sensitive assets
|
||||||||||||||||||||||||||||||
|
Interest-bearing deposits in other banks
|
$ | 4,256 | $ | - | $ | - | $ | - | $ | - | $ | - | $ | 4,256 | $ | 4,256 | ||||||||||||||
|
Weighted average interest rates
|
0.25% | 0.00% | 0.00% | 0.00% | 0.00% | 0.00% | 0.25% | |||||||||||||||||||||||
|
Fixed rate investments
|
$ | 165,910 | $ | 141,539 | $ | 142,810 | $ | 147,146 | $ | 117,892 | $ | 966,561 | $ | 1,681,858 | $ | 1,643,016 | ||||||||||||||
|
Weighted average interest rates
|
2.32% | 2.32% | 2.43% | 2.26% | 2.35% | 2.52% | 2.44% | |||||||||||||||||||||||
|
Variable rate investments
|
$ | 356 | $ | 317 | $ | 282 | $ | 251 | $ | 223 | $ | 1,301 | $ | 2,730 | $ | 2,813 | ||||||||||||||
|
Weighted average interest rates
|
2.12% | 2.24% | 2.24% | 2.24% | 2.24% | 2.24% | 2.23% | |||||||||||||||||||||||
|
Equity investments
|
$ | - | $ | - | $ | - | $ | - | $ | - | $ | 755 | $ | 755 | $ | 875 | ||||||||||||||
|
Weighted average interest rates
|
0.00% | 0.00% | 0.00% | 0.00% | 0.00% | 0.00% | 0.00% | |||||||||||||||||||||||
|
Fixed rate loans
|
$ | 346,703 | $ | 238,610 | $ | 175,927 | $ | 125,784 | $ | 93,613 | $ | 476,593 | $ | 1,457,230 | $ | 1,352,866 | ||||||||||||||
|
Weighted average interest rates
|
4.69% | 4.60% | 4.53% | 4.45% | 4.38% | 4.26% | 4.48% | |||||||||||||||||||||||
|
Variable rate loans
|
$ | 441,983 | $ | 217,754 | $ | 142,600 | $ | 115,560 | $ | 77,320 | $ | 145,504 | $ | 1,140,721 | $ | 1,058,754 | ||||||||||||||
|
Weighted average interest rates
|
4.09% | 3.94% | 3.97% | 3.95% | 3.98% | 4.24% | 4.04% | |||||||||||||||||||||||
|
Total - December 31, 2013
|
$ | 959,208 | $ | 598,220 | $ | 461,619 | $ | 388,741 | $ | 289,048 | $ | 1,590,714 | $ | 4,287,550 | $ | 4,062,580 | ||||||||||||||
|
Total - December 31, 2012
|
1,427,535 | 643,071 | 395,364 | 350,510 | 250,786 | 893,628 | 3,960,894 | 3,863,884 | ||||||||||||||||||||||
|
Interest-sensitive liabilities
|
||||||||||||||||||||||||||||||
|
Interest-bearing demand and savings deposits
|
$ | 1,935,635 | $ | - | $ | - | $ | - | $ | - | $ | - | $ | 1,935,635 | $ | 1,935,635 | ||||||||||||||
|
Weighted average interest rates
|
0.07% | 0.00% | 0.00% | 0.00% | 0.00% | 0.00% | 0.07% | |||||||||||||||||||||||
|
Time deposits
|
$ | 988,960 | $ | 66,874 | $ | 29,443 | $ | 12,518 | $ | 9,539 | $ | 2,187 | $ | 1,109,521 | $ | 1,111,319 | ||||||||||||||
|
Weighted average
interest
rates
|
0.17% | 0.74% | 0.56% | 1.16% | 0.91% | 0.60% | 0.23% | |||||||||||||||||||||||
|
Short-term borrowings
|
$ | 8,015 | $ | - | $ | - | $ | - | $ | - | $ | - | $ | 8,015 | $ | 8,015 | ||||||||||||||
|
Weighted average interest rates
|
0.23% | 0.00% | 0.00% | 0.00% | 0.00% | 0.00% | 0.23% | |||||||||||||||||||||||
|
Long-term debt
|
$ | 14 | $ | - | $ | - | $ | - | $ | - | $ | 92,785 | $ | 92,799 | $ | 39,446 | ||||||||||||||
|
Weighted average interest rates
|
8.22% | 0.00% | 0.00% | 0.00% | 0.00% | 2.74% | 2.74% | |||||||||||||||||||||||
|
Total - December 31, 2013
|
$ | 2,932,624 | $ | 66,874 | $ | 29,443 | $ | 12,518 | $ | 9,539 | $ | 94,972 | $ | 3,145,970 | $ | 3,094,415 | ||||||||||||||
|
Total - December 31, 2012
|
2,714,614 | 60,816 | 44,552 | 4,991 | 12,484 | 108,304 | 2,945,761 | 2,883,064 | ||||||||||||||||||||||
The preceding sensitivity analysis does not represent our forecast and should not be relied upon as being indicative of expected operating results. These estimates are based upon numerous assumptions including: the magnitude and timing of interest rate changes, prepayments on loans and investment securities, deposit decay rates, pricing decisions on loans and deposits, reinvestment of asset and liability cashflows and others.
63
The table above presents information on financial instruments held that are sensitive to changes in interest rates. For purposes of this presentation, expected maturities of interest-sensitive assets and liabilities are contractual maturities. Interest-bearing demand and savings deposits, which have indeterminate maturities, are included in the earliest maturity category. The resulting table is based on numerous assumptions including prepayment rates on mortgage-related assets and forecasted market interest rates. See Note 24 to the Consolidated Financial Statements under “Part II, Item 8. Financial Statements and Supplementary Data” for a discussion of the calculation of fair values.
Maturities and fair values of interest-sensitive assets and liabilities may vary from expectation if actual experience differs from the assumptions used.
Liquidity
Our objective in managing liquidity is to maintain a balance between sources and uses of funds in order to economically meet the cash requirements of customers for loans and deposit withdrawals and participate in lending and investment opportunities as they arise. We monitor our liquidity position in relation to changes in loan and deposit balances on a daily basis to assure maximum utilization, maintenance of an adequate level of readily marketable assets and access to short-term funding sources. Our loan-to-deposit ratio at December 31, 2013 was 66.8% compared to 59.9% at December 31, 2012. Our liquidity may be negatively impacted by unforeseen demands on cash or if our deposit customers withdraw funds due to uncertainties surrounding our financial condition or prospects.
The consolidated statements of cash flows identify the three major categories of sources and uses of cash as operating, investing and financing activities. As presented in the consolidated statements of cash flows, cash provided by operating activities has provided a significant source of funds during the past three years. Cash provided by operating activities totaled $84.5 million in 2013, $39.4 million in 2012, and $23.1 million in 2011. The primary source of cash provided by operating activities continues to be our net operating income, exclusive of non-cash items such as the Provision and asset impairments.
Net cash used in investing activities amounted to $442.1 million, $306.3 million and $687.2 million in 2013, 2012 and 2011, respectively. Investment securities and lending activities generally comprise the largest components of investing activities, although the level of investment securities activities are impacted by the relationship of loan and deposit growth during the period. In 2013 and 2012, net loan originations accounted for $357.9 million and $152.4 million, respectively, of cash used in investing activities, compared to net loan principal repayments of $19.4 million in 2011, of cash provided by investing activities. Net purchases of investment securities totaled $24.2 million, $220.8 million and $775.7 million in 2013, 2012 and 2011, respectively. Investing activities included proceeds from sales of loans originated for investment of $10.7 million, $10.3 million, and $26.7 million in 2013, 2012, and 2011, respectively, and other real estate of $17.9 million, $56.9 million, and $42.4 million in 2013, 2012, and 2011, respectively.
Cash provided by financing activities totaled $229.5 million, $187.2 million, and $130.5 million in 2013, 2012, and 2011, respectively. Deposit activities, borrowings and capital transactions represent the major components of financing activities. In 2013, 2012 and 2011, we increased net deposits by $255.4 million, $237.2 million, and $310.6 million, respectively. Net cash inflow from short-term debt totaled $8.0 million, compared to net cash outflows of $34 thousand in 2012 and $202.4 million in 2011. Net cash outflows from long-term debt totaled $15.5 million in 2013, $50.0 million in 2012, and $301.2 million in 2011. As with investment securities, the level of net borrowings is impacted by the levels of loan and deposit growth/contraction during the period. Capital transactions, primarily the issuance of preferred and common stock, dividends and stock repurchases totaled $323.5 million in cash flows in 2011, resulting mainly from our successful capital raises in 2011.
For the holding company on a stand-alone basis, the primary source of funds in 2011 was the $302.8 million of net proceeds from our 2011 private placement, of which we subsequently advanced $283.0 million to the bank, and the $18.9 million of net proceeds from the subsequent common stock offering.
Core deposits have historically provided us with a sizeable source of relatively stable and low cost funds but are subject to competitive pressure in our market. In addition to core deposit funding, we also have access to a variety of other short-term and long-term funding sources, which include proceeds from maturities of our investment securities, as well as secondary funding sources such as the FHLB, secured repurchase agreements and the Federal Reserve discount window, available to meet our liquidity needs. While we historically have had access to these other funding sources, continued access to these sources may not be guaranteed due to the current volatile market conditions and the Company’s and bank’s financial positions.
The bank is a member of and maintained a $942.2 million line of credit with the FHLB as of December 31, 2013. Short-term and long-term borrowings under this arrangement totaled $8.0 million and $14 thousand at December 31, 2013, respectively, compared to $32 thousand of long-term borrowings at December 31, 2012. There were no short-term borrowings under this arrangement at December 31, 2012. FHLB advances outstanding at December 31, 2013 were secured by unencumbered investment securities with a fair value of $50.8 million and certain real estate loans with a carrying value of $1.3 billion in accordance with the collateral provisions of the Advances, Security and Deposit Agreement with the FHLB. At December 31, 2013, $934.2 million was undrawn under this arrangement.
64
As previously mentioned, during the third quarter of 2011, the bank paid down long-term borrowings at the FHLB totaling $120.5 million with a weighted average interest rate of 4.36%. Prepaying these long-term borrowings resulted in the recognition of charges on the early extinguishment of debt totaling $6.2 million in the third quarter of 2011. See Note 13 to the Consolidated Financial Statements under “Part II, Item 8. Financial Statements and Supplementary Data” for additional information regarding our long-term borrowings.
The bank also maintained a line of credit with the Federal Reserve discount window of $46.5 million and $24.9 million as of December 31, 2013 and 2012, respectively. There were no advances outstanding under this arrangement at December 31, 2013 and 2012. Advances under this arrangement would have been secured by certain commercial and commercial real estate loans with a carrying value totaling $79.7 million. The Federal Reserve does not have the right to sell or repledge these loans. See Note 12 to the Consolidated Financial Statements under “Part II, Item 8. Financial Statements and Supplementary Data” for additional information regarding our short-term borrowings.
Our ability to maintain adequate levels of liquidity is dependent on our ability to continue to improve our risk profile and maintain our capital base. Beyond the challenges specific to our situation, our liquidity may also be negatively impacted by weakness in the financial markets and industry-wide reductions in liquidity.
Off-Balance Sheet Arrangements
In the normal course of business, we enter into off-balance sheet arrangements to meet the financing needs of our banking customers. These financial instruments include commitments to extend credit, standby letters of credit and financial guarantees written, forward foreign exchange contracts, forward interest rate contracts and interest rate swaps and options. These instruments and the related off-balance sheet exposures are discussed in detail in Note 23 to the Consolidated Financial Statements under “Part II, Item 8. Financial Statements and Supplementary Data.” In the unlikely event that we must satisfy a significant amount of outstanding commitments to extend credit, liquidity will be adversely impacted, as will credit risk. The remaining components of off-balance sheet arrangements, primarily interest rate options and forward interest rate contracts related to our mortgage banking activities, are not expected to have a material impact on our consolidated financial position or results of operations.
Impact of New Accounting Standards
In July 2013, the Financial Accounting Standards Board (“FASB”) issued Accounting Standards Update (“ASU”) 2013-11,
"Presentation of an Unrecognized Tax Benefit When a Net Operating Loss Carryforward, a Similar Tax Loss, or a Tax Credit Carryforward Exists."
The provisions of ASU 2013-11 provide guidance for financial statement presentation of an unrecognized tax benefit when a net operating loss carryforward, a similar loss or a tax credit carryforward exists. ASU 2013-11 is effective for the Company’s reporting period beginning on January 1, 2014. We do not expect the adoption of this guidance to have a material impact on our consolidated financial statements.
In January 2014, the FASB issued ASU 2014-01,
"Investments – Equity Method and Joint Ventures: Accounting for Investments in Qualified Affordable Housing Projects."
The provisions of ASU 2014-01 provide guidance on accounting for investments by a reporting entity in flow-through limited liability entities that manage or invest in affordable housing projects that qualify for the low-income housing tax credit. The ASU permits entities to make an accounting policy election to account for their investments in qualified affordable housing projects using the proportional amortization method if certain conditions are met. ASU 2014-01 is effective for the Company’s reporting period beginning on January 1, 2015. We do not expect the adoption of this guidance to have a material impact on our consolidated financial statements.
In January 2014, the FASB issued ASU 2014-04,
"Receivables – Troubled Debt Restructurings by Creditors – Reclassification of Residential Real Estate Collateralized Consumer Mortgage Loans upon Foreclosure."
The provisions of ASU 2014-04 provide guidance on when an in substance repossession or foreclosure occurs, which is, when a creditor should be considered to have received physical possession of residential real estate property collateralizing a consumer mortgage loan such that the loan should be derecognized and the real estate property recognized. ASU 2014-04 is effective for the Company’s reporting period beginning on January 1, 2015. We do not expect the adoption of this guidance to have a material impact on our consolidated financial statements.
|
ITEM 7A.
|
QUANTITATIVE AND QUALITATIVE DISCLOSURES ABOUT MARKET RISK
|
Quantitative and qualitative disclosures about market risk is set forth under “Part II, Item 7. Management’s Discussion and Analysis of Financial Condition and Results of Operations—Asset/Liability Management and Interest Rate Risk” and in Note 24 to the Consolidated Financial Statements under “Part II, Item 8. Financial Statements and Supplementary Data.”
65
|
ITEM 8.
|
FINANCIAL STATEMENTS AND SUPPLEMENTARY DATA
|
Report of Independent Registered Public Accounting Firm
The Board of Directors and Shareholders
Central Pacific Financial Corp.:
We have audited the accompanying consolidated balance sheets of Central Pacific Financial Corp. and subsidiaries as of December 31, 2013 and 2012, and the related consolidated statements of income, comprehensive income, changes in equity, and cash flows for each of the years in the three-year period ended December 31, 2013. These consolidated financial statements are the responsibility of the Company’s management. Our responsibility is to express an opinion on these consolidated financial statements based on our audits.
We conducted our audits in accordance with the standards of the Public Company Accounting Oversight Board (United States). Those standards require that we plan and perform the audit to obtain reasonable assurance about whether the financial statements are free of material misstatement. An audit includes examining, on a test basis, evidence supporting the amounts and disclosures in the financial statements. An audit also includes assessing the accounting principles used and significant estimates made by management, as well as evaluating the overall financial statement presentation. We believe that our audits provide a reasonable basis for our opinion.
In our opinion, the consolidated financial statements referred to above present fairly, in all material respects, the financial position of Central Pacific Financial Corp. and subsidiaries as of December 31, 2013 and 2012, and the results of their operations and their cash flows for each of the years in the three-year period ended December 31, 2013, in conformity with U.S. generally accepted accounting principles.
We also have audited, in accordance with the standards of the Public Company Accounting Oversight Board (United States), Central Pacific Financial Corp.’s internal control over financial reporting as of December 31, 2013, based on criteria established in
Internal Control – Integrated Framework (1992)
issued by the Committee of Sponsoring Organizations of the Treadway Commission (COSO), and our report dated February 28, 2014 expressed an adverse opinion on the effectiveness of the Company’s internal control over financial reporting.
/s/ KPMG LLP
Honolulu, Hawaii
February 28, 2014
66
Report of Independent Registered Public Accounting Firm
The Board of Directors and Shareholders
Central Pacific Financial Corp.:
We have audited Central Pacific Financial Corp.’s (the Company’s) internal control over financial reporting as of December 31, 2013, based on criteria established in
Internal Control - Integrated Framework (1992)
issued by the Committee of Sponsoring Organizations of the Treadway Commission (COSO). The Company's management is responsible for maintaining effective internal control over financial reporting and for its assessment of the effectiveness of internal control over financial reporting, included in the accompanying Management’s Report on Internal Control Over Financial Reporting. Our responsibility is to express an opinion on the Company's internal control over financial reporting based on our audit.
We conducted our audit in accordance with the standards of the Public Company Accounting Oversight Board (United States). Those standards require that we plan and perform the audit to obtain reasonable assurance about whether effective internal control over financial reporting was maintained in all material respects. Our audit included obtaining an understanding of internal control over financial reporting, assessing the risk that a material weakness exists, and testing and evaluating the design and operating effectiveness of internal control based on the assessed risk. Our audit also included performing such other procedures as we considered necessary in the circumstances. We believe that our audit provides a reasonable basis for our opinion.
A company's internal control over financial reporting is a process designed to provide reasonable assurance regarding the reliability of financial reporting and the preparation of financial statements for external purposes in accordance with generally accepted accounting principles. A company’s internal control over financial reporting includes those policies and procedures that (1) pertain to the maintenance of records that, in reasonable detail, accurately and fairly reflect the transactions and dispositions of the assets of the company; (2) provide reasonable assurance that transactions are recorded as necessary to permit preparation of financial statements in accordance with generally accepted accounting principles, and that receipts and expenditures of the company are being made only in accordance with authorizations of management and directors of the company; and (3) provide reasonable assurance regarding prevention or timely detection of unauthorized acquisition, use, or disposition of the company’s assets that could have a material effect on the financial statements.
Because of its inherent limitations, internal control over financial reporting may not prevent or detect misstatements. Also, projections of any evaluation of effectiveness to future periods are subject to the risk that controls may become inadequate because of changes in conditions, or that the degree of compliance with the policies or procedures may deteriorate.
A material weakness is a deficiency, or a combination of deficiencies, in internal control over financial reporting, such that there is a reasonable possibility that a material misstatement of the company’s annual or interim financial statements will not be prevented or detected on a timely basis.
A material weakness related to the Company’s allowance for loan and lease losses has been identified and included in Management’s Report on Internal Control Over Financial Reporting
. We also have audited, in accordance with the standards of the Public Company Accounting Oversight Board (United States), the consolidated balance sheets of Central Pacific Financial Corp. and subsidiaries as of December 31, 2013 and 2012, and the related consolidated statements of income, comprehensive income, changes in equity, and cash flows for each of the years in the three-year period ended December 31, 2013. This material weakness was considered in determining the nature, timing, and extent of audit tests applied in our audit of the 2013 consolidated financial statements, and this report does not affect our report dated February 28, 2014, which expressed an unqualified opinion on those consolidated financial statements.
In our opinion, because of the effect of the aforementioned material weakness on the achievement of the objectives of the control criteria, the Company has not maintained effective internal control over financial reporting as of December 31, 2013, based on criteria established in
Internal Control - Integrated Framework (1992)
issued by the Committee of Sponsoring Organizations of the Treadway Commission (COSO).
/s/ KPMG LLP
Honolulu, Hawaii
February 28, 2014
67
CENTRAL PACIFIC FINANCIAL CORP. & SUBSIDIARIES
|
December 31,
|
||||||||
|
2013
|
2012
|
|||||||
|
(Dollars in thousands)
|
||||||||
|
Assets
|
||||||||
|
Cash and due from
banks
|
$ | 45,092 | $ | 56,473 | ||||
|
Interest-bearing deposits in other banks
|
4,256 | 120,902 | ||||||
|
Investment securities:
|
||||||||
|
Available for sale, at fair value
|
1,407,999 | 1,536,745 | ||||||
|
Held to maturity, at amortized cost (fair value of $238,705 at
|
||||||||
|
December 31, 2013 and $162,528 at December 31, 2012)
|
252,047 | 161,848 | ||||||
|
Total investment securities
|
1,660,046 | 1,698,593 | ||||||
|
Loans held for sale
|
12,370 | 38,283 | ||||||
|
Loans and leases
|
2,630,601 | 2,203,944 | ||||||
|
Allowance for loan and lease losses
|
(83,820 | ) | (96,413 | ) | ||||
|
Net loans and leases
|
2,546,781 | 2,107,531 | ||||||
|
Premises and equipment, net
|
49,039 | 48,759 | ||||||
|
Accrued interest receivable
|
14,072 | 13,896 | ||||||
|
Investment in unconsolidated subsidiaries
|
9,127 | 10,975 | ||||||
|
Other real estate
|
5,163 | 10,686 | ||||||
|
Other intangible assets
|
32,783 | 37,499 | ||||||
|
Bank-owned life insurance
|
149,604 | 147,411 | ||||||
|
Federal Home Loan Bank stock
|
46,193 | 47,928 | ||||||
|
Other assets
|
166,672 | 31,432 | ||||||
|
Total assets
|
$ | 4,741,198 | $ | 4,370,368 | ||||
|
Liabilities and Equity
|
||||||||
|
Deposits:
|
||||||||
|
Noninterest-bearing demand
|
$ | 891,017 | $ | 843,292 | ||||
|
Interest-bearing demand
|
728,619 | 672,838 | ||||||
|
Savings and money market
|
1,207,016 | 1,186,011 | ||||||
|
Time
|
1,109,521 | 978,631 | ||||||
|
Total deposits
|
3,936,173 | 3,680,772 | ||||||
|
Short-term borrowings
|
8,015 | - | ||||||
|
Long-term debt
|
92,799 | 108,281 | ||||||
|
Other liabilities
|
44,037 | 66,536 | ||||||
|
Total liabilities
|
4,081,024 | 3,855,589 | ||||||
|
Equity:
|
||||||||
|
Preferred stock, no par value, authorized 1,100,000 shares, issued
|
||||||||
|
and outstanding none at December 31, 2013 and 2012
|
- | - | ||||||
|
Common stock, no par value, authorized 185,000,000 shares, issued and
|
||||||||
|
outstanding 42,107,633 and 41,
867
,046 shares at December 31, 2013
|
||||||||
|
and 2012, respectively
|
784,547 | 784,512 | ||||||
|
Surplus
|
75,498 | 70,567 | ||||||
|
Accumulated deficit
|
(184,087 | ) | (349,427 | ) | ||||
|
Accumulated other comprehensive loss
|
(15,845 | ) | (830 | ) | ||||
|
Total shareholders' equity
|
660,113 | 504,822 | ||||||
|
Non-controlling interest
|
61 | 9,957 | ||||||
|
Total equity
|
660,174 | 514,779 | ||||||
|
Total liabilities and equity
|
$ | 4,741,198 | $ | 4,370,368 | ||||
See accompanying notes to consolidated financial statements.
68
CENTRAL PACIFIC FINANCIAL CORP. & SUBSIDIARIES
|
Year Ended December 31,
|
||||||||||||
|
2013
|
2012
|
2011
|
||||||||||
|
(Dollars in thousands, except per share data)
|
||||||||||||
|
Interest income:
|
||||||||||||
|
Interest and fees on loans and leases
|
$ | 104,479 | $ | 97,029 | $ | 107,089 | ||||||
|
Interest and dividends on investment securities:
|
||||||||||||
|
Taxable interest
|
31,498 | 28,803 | 27,559 | |||||||||
|
Tax-exempt interest
|
4,051 | 2,312 | 738 | |||||||||
|
Dividends
|
23 | 16 | 12 | |||||||||
|
Interest on deposits in other banks
|
203 | 285 | 1,052 | |||||||||
|
Dividends on Federal Home Loan Bank stock
|
24 | - | - | |||||||||
|
Total interest income
|
140,278 | 128,445 | 136,450 | |||||||||
|
Interest expense:
|
||||||||||||
|
Interest on deposits:
|
||||||||||||
|
Demand
|
349 | 339 | 500 | |||||||||
|
Savings and money market
|
894 | 1,006 | 2,044 | |||||||||
|
Time
|
2,801 | 3,688 | 7,066 | |||||||||
|
Interest on short-term borrowings
|
6 | - | 204 | |||||||||
|
Interest on long-term debt
|
3,119 | 3,701 | 8,815 | |||||||||
|
Total interest expense
|
7,169 | 8,734 | 18,629 | |||||||||
|
Net interest income
|
133,109 | 119,711 | 117,821 | |||||||||
|
Provision (credit) for loan and lease losses
|
(11,310 | ) | (18,885 | ) | (40,690 | ) | ||||||
|
Net interest income after provision for loan and lease losses
|
144,419 | 138,596 | 158,511 | |||||||||
|
Other operating income:
|
||||||||||||
|
Other service charges and fees
|
18,547 | 17,569 | 17,239 | |||||||||
|
Net gain on sales of residential loans
|
9,986 | 17,095 | 8,050 | |||||||||
|
Net gain on sales of foreclosed assets
|
8,584 | 4,999 | 6,821 | |||||||||
|
Service charges on deposit accounts
|
7,041 | 8,367 | 10,024 | |||||||||
|
Income from fiduciary activities
|
2,855 | 2,599 | 2,794 | |||||||||
|
Income from bank-owned life insurance
|
2,333 | 2,899 | 4,139 | |||||||||
|
Equity in earnings of unconsolidated subsidiaries
|
790 | 574 | 458 | |||||||||
|
Loan placement fees
|
570 | 690 | 541 | |||||||||
|
Fees on foreign exchange
|
508 | 551 | 664 | |||||||||
|
Investment securities gains
|
482 | 789 | 1,306 | |||||||||
|
Other
|
3,249 | 4,611 | 4,966 | |||||||||
|
Total other operating income
|
54,945 | 60,743 | 57,002 | |||||||||
|
Other operating expense:
|
||||||||||||
|
Salaries and employee benefits
|
76,294 | 69,344 | 63,675 | |||||||||
|
Net occupancy
|
14,323 | 13,920 | 13,793 | |||||||||
|
Legal and professional services
|
8,094 | 13,824 | 13,506 | |||||||||
|
Amortization and impairment of other intangible assets
|
7,418 | 10,179 | 7,033 | |||||||||
|
Computer software expense
|
4,579 | 3,961 | 3,629 | |||||||||
|
Equipment
|
3,676 | 3,966 | 4,702 | |||||||||
|
Communication expense
|
3,523 | 3,428 | 3,517 | |||||||||
|
Advertising expense
|
2,666 | 3,516 | 2,961 | |||||||||
|
Foreclosed asset expense
|
1,036 | 6,887 | 11,378 | |||||||||
|
Write down of assets
|
- | 2,586 | 4,624 | |||||||||
|
Loss on early extinguishment of debt
|
- | - | 6,234 | |||||||||
|
Other
|
17,927 | 20,307 | 43,890 | |||||||||
|
Total other operating expense
|
139,536 | 151,918 | 178,942 | |||||||||
|
Income before income taxes
|
59,828 | 47,421 | 36,571 | |||||||||
|
Income tax benefit
|
(112,247 | ) | - | - | ||||||||
|
Net income
|
172,075 | 47,421 | 36,571 | |||||||||
|
Preferred stock dividends, accretion of discount and
|
||||||||||||
|
conversion of preferred stock to common stock
|
- | - | (83,897 | ) | ||||||||
|
Net income available to common shareholders
|
$ | 172,075 | $ | 47,421 | $ | 120,468 | ||||||
|
Per common share data:
|
||||||||||||
|
Basic earnings per share
|
$ | 4.10 | $ | 1.14 | $ | 3.36 | ||||||
|
Diluted earnings per share
|
4.07 | 1.13 | 3.31 | |||||||||
|
Cash dividends declared
|
0.16 | - | - | |||||||||
See accompanying notes to consolidated financial statements.
69
CENTRAL PACIFIC FINANCIAL CORP. & SUBSIDIARIES
CONSOLIDATED STATEMENTS OF COMPREHENSIVE INCOME
|
Year Ended December 31,
|
||||||||||||
|
2013
|
2012
|
2011
|
||||||||||
|
(Dollars in thousands)
|
||||||||||||
|
Net income
|
$ | 172,075 | $ | 47,421 | $ | 36,571 | ||||||
|
Other comprehensive income (loss), net of tax
|
||||||||||||
|
Net change in unrealized gain (loss) on investment securities
|
(31,865 | ) | (1,271 | ) | 21,026 | |||||||
|
Net change in unrealized loss on derivatives
|
10,993 | (434 | ) | (3,235 | ) | |||||||
|
Minimum pension liability adjustment
|
5,857 | (1,289 | ) | (1,062 | ) | |||||||
|
Other comprehensive income (loss), net of tax
|
(15,015 | ) | (2,994 | ) | 16,729 | |||||||
|
Comprehensive income
|
$ | 157,060 | $ | 44,427 | $ | 53,300 | ||||||
|
See accompanying notes to consolidated financial statements.
|
||||||||||||
70
CENTRAL PACIFIC FINANCIAL CORP. & SUBSIDIARIES
CONSOLIDATED STATEMENTS OF CHANGES IN EQUITY
|
Accumulated
|
|||||||||||||||||||||||||||
|
Other
|
Non
|
||||||||||||||||||||||||||
|
Preferred
|
Common
|
Accumulated
|
Comprehensive
|
Controlling
|
|||||||||||||||||||||||
|
Stock
|
Stock
|
Surplus
|
Deficit
|
Income (Loss)
|
Interests
|
Total
|
|||||||||||||||||||||
|
(Dollars in thousands, except per share data)
|
|||||||||||||||||||||||||||
|
Balance at December 31, 2010
|
$ | 130,458 | $ | 404,167 | $ | 63,308 | $ | (517,316 | ) | $ | (14,565 | ) | $ | 10,003 | $ | 76,055 | |||||||||||
|
Net income
|
- | - | - | 36,571 | - | - | 36,571 | ||||||||||||||||||||
|
Other comprehensive income
|
- | - | - | - | 16,729 | - | 16,729 | ||||||||||||||||||||
|
Preferred stock dividends and accretion
|
204 | - | - | (1,173 | ) | - | - | (969 | ) | ||||||||||||||||||
|
5,620,117 shares of common stock
|
|||||||||||||||||||||||||||
|
issued in exchange for preferred stock
|
|||||||||||||||||||||||||||
|
and accrued unpaid dividends
|
(130,662 | ) | 56,201 | - | 85,070 | - | - | 10,609 | |||||||||||||||||||
|
34,599,585 shares of common stock
|
|||||||||||||||||||||||||||
|
issued under common stock offerings
|
|||||||||||||||||||||||||||
|
and stock plans, net of costs
|
- | 324,155 | - | - | - | - | 324,155 | ||||||||||||||||||||
|
193 net shares of common stock sold by
|
|||||||||||||||||||||||||||
|
directors' deferred compensation plan
|
- | 16 | - | - | - | - | 16 | ||||||||||||||||||||
|
Share-based compensation
|
- | - | 3,277 | - | - | - | 3,277 | ||||||||||||||||||||
|
Non-controlling interests
|
- | - | - | - | - | (23 | ) | (23 | ) | ||||||||||||||||||
|
Balance at December 31, 2011
|
$ | - | $ | 784,539 | $ | 66,585 | $ | (396,848 | ) | $ | 2,164 | $ | 9,980 | $ | 466,420 | ||||||||||||
|
Net income
|
- | - | - | 47,421 | - | - | 47,421 | ||||||||||||||||||||
|
Other comprehensive loss
|
- | - | - | - | (2,994 | ) | - | (2,994 | ) | ||||||||||||||||||
|
4,291 net shares of common stock
|
|||||||||||||||||||||||||||
| purchased by directors' deferred | |||||||||||||||||||||||||||
|
compensation plan
|
- | (27 | ) | - | - | - | - | (27 | ) | ||||||||||||||||||
|
Share-based compensation
|
- | - | 3,982 | - | - | - | 3,982 | ||||||||||||||||||||
|
Non-controlling interests
|
- | - | - | - | - | (23 | ) | (23 | ) | ||||||||||||||||||
|
Balance at December 31, 2012
|
$ | - | $ | 784,512 | $ | 70,567 | $ | (349,427 | ) | $ | (830 | ) | $ | 9,957 | $ | 514,779 | |||||||||||
|
Net income
|
- | - | - | 172,075 | - | - | 172,075 | ||||||||||||||||||||
|
Other comprehensive loss
|
- | - | - | - | (15,015 | ) | - | (15,015 | ) | ||||||||||||||||||
|
Cash dividends ($0.16 per share)
|
- | - | - | (6,735 | ) | - | - | (6,735 | ) | ||||||||||||||||||
|
1,782 net shares of common stock
|
|||||||||||||||||||||||||||
| purchased by directors' deferred | |||||||||||||||||||||||||||
|
compensation plan
|
- | (39 | ) | - | - | - | - | (39 | ) | ||||||||||||||||||
|
Share-based compensation
|
- | 74 | 4,931 | - | - | - | 5,005 | ||||||||||||||||||||
|
Non-controlling interests
|
- | - | - | - | - | (9,896 | ) | (9,896 | ) | ||||||||||||||||||
|
Balance at December 31, 2013
|
$ | - | $ | 784,547 | $ | 75,498 | $ | (184,087 | ) | $ | (15,845 | ) | $ | 61 | $ | 660,174 | |||||||||||
See accompanying notes to consolidated financial statements.
71
CENTRAL PACIFIC FINANCIAL CORP. & SUBSIDIARIES
|
Year Ended December 31,
|
||||||||||||
|
2013
|
2012
|
2011
|
||||||||||
|
(Dollars in thousands)
|
||||||||||||
|
Cash flows from operating activities:
|
||||||||||||
|
Net income
|
$ | 172,075 | $ | 47,421 | $ | 36,571 | ||||||
|
Adjustments to reconcile net income to net cash provided by operating activities:
|
||||||||||||
|
Provision (credit) for loan and lease losses
|
(11,310 | ) | (18,885 | ) | (40,690 | ) | ||||||
|
Depreciation and amortization
|
6,007 | 6,351 | 6,724 | |||||||||
|
Amortization and impairment of other intangible assets
|
7,418 | 10,179 | 7,033 | |||||||||
|
Write down of assets
|
- | 2,586 | 4,624 | |||||||||
|
Write down of other real estate, net of gain on sale
|
(8,011 | ) | (358 | ) | 528 | |||||||
|
Net amortization of investment securities
|
13,283 | 15,670 | 9,447 | |||||||||
|
Share-based compensation
|
4,931 | 3,982 | 3,277 | |||||||||
|
Net gain on sale of investment securities
|
(482 | ) | (789 | ) | (1,306 | ) | ||||||
|
Net gain on sales of residential loans
|
(9,986 | ) | (17,095 | ) | (8,050 | ) | ||||||
|
Proceeds from sales of loans held for sale
|
654,005 | 969,089 | 667,052 | |||||||||
|
Originations of loans held for sale
|
(618,106 | ) | (952,402 | ) | (662,429 | ) | ||||||
|
Equity in earnings of unconsolidated subsidiaries
|
(790 | ) | (574 | ) | (458 | ) | ||||||
|
Increase in cash surrender value of bank-owned life insurance
|
(2,729 | ) | (4,934 | ) | (2,337 | ) | ||||||
|
Deferred income taxes
|
(112,356 | ) | - | - | ||||||||
|
Premium paid on repurchases of preferred stock of subsidiaries
|
1,895 | - | - | |||||||||
|
Net change in other assets and liabilities
|
(11,313 | ) | (20,853 | ) | 3,137 | |||||||
|
Net cash provided by operating activities
|
84,531 | 39,388 | 23,123 | |||||||||
|
Cash flows from investing activities:
|
||||||||||||
|
Proceeds from maturities of and calls on investment securities available for sale
|
448,453 | 437,471 | 401,556 | |||||||||
|
Proceeds from sales of investment securities available for sale
|
271,931 | 130,076 | 137,980 | |||||||||
|
Purchases of investment securities available for sale
|
(753,496 | ) | (627,356 | ) | (1,317,112 | ) | ||||||
|
Proceeds from maturities of and calls on investment securities held to maturity
|
13,500 | 2,487 | 1,881 | |||||||||
|
Purchases of investment securities held to maturity
|
(4,595 | ) | (163,498 | ) | - | |||||||
|
Net loan principal repayments (loan originations)
|
(357,853 | ) | (152,350 | ) | 19,435 | |||||||
|
Purchases of loan portfolios
|
(85,110 | ) | - | - | ||||||||
|
Proceeds from sales of loans originated for investment
|
10,679 | 10,340 | 26,721 | |||||||||
|
Proceeds from sales of other real estate
|
17,892 | 56,915 | 42,362 | |||||||||
|
Proceeds from bank-owned life insurance
|
536 | 1,997 | 158 | |||||||||
|
Purchases of premises and equipment
|
(6,287 | ) | (3,696 | ) | (747 | ) | ||||||
|
Distributions from unconsolidated subsidiaries
|
9,615 | 467 | 522 | |||||||||
|
Contributions to unconsolidated subsidiaries
|
(9,050 | ) | - | - | ||||||||
|
Proceeds from redemptiom of FHLB stock
|
1,735 | 869 | - | |||||||||
|
Net cash used in investing activities
|
(442,050 | ) | (306,278 | ) | (687,244 | ) | ||||||
|
Cash flows from financing activities:
|
||||||||||||
|
Net increase in deposits
|
255,401 | 237,244 | 310,581 | |||||||||
|
Repayments of long-term debt
|
(15,482 | ) | (50,017 | ) | (301,219 | ) | ||||||
|
Net increase (decrease) in short-term borrowings
|
8,015 | (34 | ) | (202,446 | ) | |||||||
|
Cash dividends paid on common stock
|
(6,735 | ) | - | - | ||||||||
|
Net proceeds from issuance of common stock and stock option exercises
|
74 | - | 323,538 | |||||||||
|
Repurchases of preferred stock of subsidiaries
|
(11,781 | ) | - | - | ||||||||
|
Net cash provided by financing activities
|
229,492 | 187,193 | 130,454 | |||||||||
|
Net decrease in cash and cash equivalents
|
(128,027 | ) | (79,697 | ) | (533,667 | ) | ||||||
|
Cash and cash equivalents:
|
||||||||||||
|
At beginning of year
|
177,375 | 257,072 | 790,739 | |||||||||
|
At end of year
|
$ | 49,348 | $ | 177,375 | $ | 257,072 | ||||||
|
Supplemental disclosure of cash flow information:
|
||||||||||||
|
Cash paid during the year for:
|
||||||||||||
|
Interest
|
$ | 19,260 | $ | 5,622 | $ | 18,138 | ||||||
|
Income taxes
|
5 | 5 | 86 | |||||||||
|
Cash received during the year for:
|
||||||||||||
|
Income taxes
|
- | 430 | 55 | |||||||||
|
Supplemental disclosure of noncash
investing
and financing activities:
|
||||||||||||
|
Net change in common stock held by directors' deferred compensation plan
|
$ | 39 | $ | 27 | $ | (16 | ) | |||||
|
Net reclassification of loans to other real estate
|
4,358 | 4,846 | 47,064 | |||||||||
|
Net reclassification of loans held for sale to other real estate
|
- | 716 | - | |||||||||
|
Net transfer of loans to loans held for sale
|
- | 1,487 | 13,639 | |||||||||
|
Net transfer of investment securities available for sale to held to maturity
|
101,669 | - | - | |||||||||
|
Dividends accrued on preferred stock
|
- | - | 969 | |||||||||
|
Accretion of preferred stock discount
|
- | - | 204 | |||||||||
|
Preferred stock and accrued unpaid dividends converted to common stock
|
- | - | 142,988 | |||||||||
|
Common stock issued in exchange for preferred stock and accrued unpaid dividends
|
- | - | 56,201 | |||||||||
See accompanying
notes
to consolidated financial statements.
72
CENTRAL PACIFIC FINANCIAL CORP. & SUBSIDIARIES
NOTES TO CONSOLIDATED FINANCIAL STATEMENTS
Years Ended December 31, 2013, 2012, and 2011
|
1.
|
SUMMARY OF SIGNIFICANT ACCOUNTING POLICIES
|
Description of Business
Central Pacific Financial Corp. is a bank holding company. Our principal operating subsidiary, Central Pacific Bank, is a full-service commercial bank with 35 branches and 112 ATMs located throughout the state of Hawaii. The bank engages in a broad range of lending activities including originating commercial loans, commercial and residential mortgage loans and consumer loans. The bank also offers a variety of deposit products and services. These include personal and business checking and savings accounts, money market accounts and time certificates of deposit. Other products and services include debit cards, internet banking, cash management services, traveler’s checks, safe deposit boxes, international banking services, night depository facilities and wire transfers. Wealth management products and services include non-deposit investment products, annuities, insurance, investment management, asset custody and general consultation and planning services.
When we refer to “the Company,” “we,” “us” or “our,” we mean Central Pacific Financial Corp. & Subsidiaries (consolidated). When we refer to “Central Pacific Financial Corp.” or to the holding company, we are referring to the parent company on a standalone basis. When we refer to “our bank” or “the bank,” we mean “Central Pacific Bank.”
The banking business depends on rate differentials, the difference between the interest rates paid on deposits and other borrowings and the interest rates received on loans extended to customers and investment securities held in our portfolio. These rates are highly sensitive to many factors that are beyond our control. Accordingly, the earnings and growth of the Company are subject to the influence of domestic and foreign economic conditions, including inflation, recession and unemployment.
We have the following three reportable segments: (1) Banking Operations, (2) Treasury and (3) All Others. The Banking Operations segment includes construction and commercial real estate lending, commercial lending, residential mortgage lending and servicing, consumer lending, trust services, retail brokerage services, and our retail branch offices, which provide a full range of deposit and loan products, as well as various other banking services. The Treasury segment is responsible for managing the Company’s investment securities portfolio and wholesale funding activities. The All Others segment consists of all activities not captured by the Banking Operations and Treasury segments described above and includes activities such as electronic banking, data processing and management of bank owned properties. For further information, see Note 25.
With respect to our capital raising efforts, we completed a number of key milestones since 2011. We completed our previously announced capital raise of $325 million through a private placement offering (the “Private Placement”) in February 2011.
Concurrently with the Private Placement, in February 2011, the U.S. Treasury (the “Treasury”) agreed to exchange our Fixed Rate Cumulative Perpetual Preferred Stock (the “TARP Preferred Stock”) purchased by the Treasury under the Troubled Assets Relief Program (“TARP”) and accrued and unpaid dividends thereon for approximately $56.2 million in our common stock (the “TARP Exchange”). The Company and Treasury also agreed to amend the ten-year warrant to purchase shares of common stock (the “TARP Warrant”) issued to the Treasury in connection with the Treasury’s investment in the TARP Preferred Stock to, among other things, reduce the exercise price to the same per share purchase price in the Private Placement.
In anticipation of the completion of the Private Placement and the TARP Exchange, we effected a 1-for-20 reverse split on February 2, 2011 (the “Reverse Stock Split”). The Reverse Stock Split was previously approved by our shareholders at the shareholder meeting on May 24, 2010. No fractional shares of common stock were issued as a result of the Reverse Stock Split. For each holder of common stock, the number of shares held prior to the effectiveness of the Reverse Stock Split were divided by twenty and, if the resulting number was not a whole number, then such number was rounded up to the next nearest whole number. Except as otherwise specified herein, share and per share amounts for historical periods have been restated to give the effect to the Reverse Stock Split.
As part of the recapitalization, we also completed a rights offering ( the “Rights Offering”) whereby shareholders of record as of the close of business on February 17, 2011 received transferable rights to purchase newly issued shares of our common stock at a purchase price of $10 per share. The rights provided for the purchase of up to $20.0 million of the Company’s common stock by holders of such rights. The Rights Offering was fully subscribed and completed in May 2011.
73
On June 22, 2011, the Treasury completed a public underwritten offering of 2,850,000 shares of our common stock it received in the TARP Exchange. On April 4, 2012, the Treasury completed another public underwritten offering of its remaining 2,770,117 shares of our common stock it received in the TARP Exchange. The Company did not receive any proceeds from either of these offerings. In June 2013, the Treasury held a private auction to sell its warrant positions in several financial institutions which included the Company’s warrant to purchase up to 79,288 shares of our common shares at a purchase price of $10 per share. On June 6, 2013, we were notified that we were the winning bidder of the warrant at our bid of $752 thousand. After the completion of these transactions, the Treasury no longer holds any outstanding shares of our common stock, or any warrants to purchase our common stock they received in connection with our participation in the TARP.
Principles of Consolidation
The consolidated financial statements include the accounts of the Company and its majority-owned subsidiaries. All significant intercompany accounts and transactions have been eliminated in consolidation.
The bank acquired Hawaii HomeLoans (“HHL”), which is now known as Central Pacific HomeLoans (“CPHL”), on August 17, 2005. Our former subsidiary CPHL was merged into the bank in February 2012. The results of operations of CPHL are included in the consolidated financial statements from the acquisition date.
On July 1, 2008, we acquired the assets of Pacific Islands Financial Management LLC (“PIFM”). The assets of PIFM were included in the consolidated financial statements from the acquisition date, however, in 2012, we determined that the intangible assets of PIFM were fully impaired, and accordingly, impairment charges were recorded.
Central Pacific Bank has two wholly-owned subsidiaries: CPB Real Estate, Inc. and Citibank Properties, Inc. Both are real estate investment trusts that are in the process of dissolution. Central Pacific Bank had another wholly-owned subsidiary, CB Technology, Inc. that was dissolved in February 2013.
We have a 50% ownership interest in the following mortgage brokerage companies: Pacific Access Mortgage, LLC, Gentry HomeLoans, LLC, Haseko HomeLoans, LLC and Island Pacific HomeLoans, LLC. These investments are accounted for using the equity method and are included in investment in unconsolidated subsidiaries. We also have non-controlling equity investments in affiliates that are accounted for under the cost method and are included in investment in unconsolidated subsidiaries.
Our investments in unconsolidated subsidiaries accounted for under the equity and cost methods were $0.6 million and $8.5 million, respectively, at December 31, 2013 and $0.7 million and $10.2 million, respectively, at December 31, 2012. Our policy for determining impairment of these investments includes an evaluation of whether a loss in value of an investment is other than temporary. Evidence of a loss in value includes absence of an ability to recover the carrying amount of the investment or the inability of the investee to sustain an earnings capacity which would justify the carrying amount of the investment. We perform impairment tests whenever indicators of impairment are present. If the value of an investment declines and it is considered other than temporary, the investment is written down to its respective fair value in the period in which this determination is made.
The Company sponsors the Central Pacific Bank Foundation which is not consolidated in the Company's financial statements.
Use of Estimates
The preparation of the consolidated financial statements in conformity with generally accepted accounting principles in the United States (“GAAP”) requires management to make estimates and assumptions that reflect the reported amounts of assets and liabilities and disclosures of contingent assets and contingent liabilities at the date of the consolidated financial statements and the reported amounts of revenues and expenses during the reporting period. Actual results could differ from those estimates. Material estimates that are particularly susceptible to significant change in the near term relate to the determination of the allowance and provision for loan and lease losses, reserves for unfunded loan commitments, residential mortgage repurchase reserves and deferred income tax assets and income tax expense, as well as the valuation of investment securities, other intangible assets and the related amortization thereon, pension liability and the fair value of certain financial instruments.
Cash and Cash Equivalents
For purposes of the consolidated statements of cash flows, we consider cash and cash equivalents to include cash and due from banks, interest-bearing deposits in other banks, federal funds sold and all highly liquid investments with maturities of three months or less at the time of purchase.
74
Investment Securities
Investments in debt securities and marketable equity securities are designated as trading, available for sale, or held to maturity. Securities are designated as held to maturity only if we have the positive intent and ability to hold these securities to maturity. Held to maturity debt securities are reported at amortized cost. Trading securities are reported at fair value, with changes in fair value included in earnings. Available-for-sale securities are reported at fair value with net unrealized gains and losses, net of taxes, included in accumulated other comprehensive income (loss) (“AOCI”).
We use current quotations, where available, to estimate the fair value of investment securities. Where current quotations are not available, we estimate fair value based on the present value of expected future cash flows. We consider the facts of each security including the nature of the security, the amount and duration of the loss, credit quality of the issuer, the expectations for that security’s performance and our intent and ability to hold the security until recovery. Declines in the value of debt securities and marketable equity securities that are considered other than temporary are recorded in other operating income. Realized gains and losses on the sale of investment securities are recorded in other operating income using the specific identification method.
We amortize premiums and accrete discounts associated with investment securities using the interest method over the life of the respective security instrument.
As a member of the Federal Home Loan Bank of Seattle (“FHLB”), the bank is required to obtain and hold a specific number of shares of capital stock of the FHLB based on the amount of outstanding FHLB advances. The securities are reported at cost and are presented separately in the consolidated balance sheets.
Loans Held for Sale
Loans held for sale consists of the following two types: (1) Hawaii residential mortgage loans that are originated with the intent to sell them in the secondary market and (2) non-residential mortgage loans in both Hawaii and the U.S. Mainland that were originated with the intent to be held in our portfolio but were subsequently transferred to the held for sale category. Hawaii residential mortgage loans classified as held for sale are carried at the lower of cost or fair value on an aggregate basis, while the non-residential Hawaii and U.S. Mainland loans are recorded at the lower of cost or fair value on an individual basis. Net fees and costs associated with originating and acquiring the Hawaii residential mortgage loans held for sale are deferred and included in the basis for determining the gain or loss on sales of loans held for sale. We report the fair values of the non-residential mortgage loans classified as held for sale net of applicable selling costs on our consolidated balance sheets.
Loans originated with the intent to be held in our portfolio are subsequently transferred to held for sale when our intent to hold for the foreseeable future has changed. At the time of a loan’s transfer to the held for sale account, the loan is recorded at the lower of cost or fair value. Any reduction in the loan’s value is reflected as a write-down of the recorded investment resulting in a new cost basis, with a corresponding reduction in the allowance for loan and lease losses.
In subsequent periods, if the fair value of a loan classified as held for sale is less than its cost basis, a valuation adjustment is recognized in our consolidated statement of income in other operating expense and the carrying value of the loan is adjusted accordingly. The valuation adjustment may be recovered in the event that the fair value increases, which is also recognized in our consolidated statement of income in other operating expense.
The fair value of loans classified as held for sale are generally based upon quoted prices for similar assets in active markets, acceptance of firm offer letters with agreed upon purchase prices, discounted cash flow models that take into account market observable assumptions, or independent appraisals of the underlying collateral securing the loans. Collateral values are determined based on appraisals received from qualified valuation professionals and are obtained periodically or when indicators that property values may be impaired are present.
We sell residential mortgage loans under industry standard contractual provisions that include various representations and warranties, which typically cover ownership of the loan, compliance with loan criteria set forth in the applicable agreement, validity of the lien securing the loan, and other similar matters. We may be required to repurchase certain loans sold with identified defects, indemnify the investor, or reimburse the investor for any credit losses incurred. Our repurchase risk generally relates to early payment defaults and borrower fraud. We establish residential mortgage repurchase reserves to reflect this risk based on our estimate of losses after considering a combination of factors, including our estimate of future repurchase activity and our projection of expected credit losses resulting from repurchased loans. At December 31, 2013 and 2012, this reserve totaled $2.9 million and $3.6 million, respectively, and is included in other liabilities on our consolidated balance sheets.
75
Loans
Loans are stated at the principal amount outstanding, net of unearned income. Unearned income represents net deferred loan fees that are recognized over the life of the related loan as an adjustment to yield. Net deferred loan fees are amortized using the interest method over the contractual term of the loan, adjusted for actual prepayments. Unamortized fees on loans paid in full are recognized as a component of interest income.
Interest income on loans is recognized on an accrual basis. For all loan types, the Company determines delinquency status by considering the number of days full payments required by the contractual terms of the loan are past due. Loans are placed on nonaccrual status when interest payments are 90 days past due, or earlier should management determine that the borrowers will be unable to meet contractual principal and/or interest obligations, unless the loans are well-secured and in the process of collection. When a loan is placed on nonaccrual status, all interest previously accrued but not collected is reversed against current period interest income should management determine that the collectibility of such accrued interest is doubtful. All subsequent receipts are applied to principal outstanding and no interest income is recognized unless the financial condition and payment record of the borrowers warrant such recognition. A nonaccrual loan may be restored to an accrual basis when principal and interest payments are current and full payment of principal and interest is expected.
Leases
We provide equipment financing to our customers through a variety of lease arrangements. Direct financing leases are carried at the aggregate of lease payments receivable plus estimated residual value of the leased property, less unearned income. Unearned income on direct financing leases is amortized over the lease terms by methods that approximate the interest method. Our lease portfolio has declined over the last four years and had an outstanding balance of $6.2 million and $10.5 million at December 31, 2013 and 2012, respectively.
Allowance for Loan and Lease Losses
The allowance for loan and lease losses (the “Allowance”) is established through provisions for loan and lease losses (the “Provision”) charged against income. Our policy is to charge a loan off in the period in which the loan is deemed to be uncollectible and all interest previously accrued but not collected is reversed against current period interest income. We consider a loan to be uncollectible when it is probable that a loss has been incurred and the Company can make a reasonable estimate of the loss. In these instances, the likelihood of and/or timeframe for recovery of the amount due is uncertain, weak, or protracted. Subsequent receipts, if any, are credited first to the remaining principal, then to the Allowance as recoveries, and finally to unaccrued interest.
The Allowance is maintained at a level that management deems sufficient to absorb probable losses inherent in the loan portfolio. Our methodology for determining the adequacy of the Allowance takes into account many factors, including the level and trend of nonperforming and potential problem loans, net charge-off experience, current repayment by borrowers, fair value of collateral securing specific loans, changes in lending and underwriting standards and general economic factors, nationally and in the markets in which we operate. In addition, various regulatory agencies, as an integral part of their examination processes, periodically review our Allowance. Such agencies may require that we recognize additions to the Allowance based on their judgments about information available to them at the time of their examination.
We consider current information and events regarding our borrowers’ ability to repay their obligations and treat a loan as impaired when it is probable that we will be unable to collect all amounts due according to the contractual terms of the loan agreement. When a loan is considered to be impaired, the amount of the impairment is measured based on the present value of expected future cash flows discounted at the loan’s effective interest rate or, if the loan is considered to be collateral dependent, based on the fair value of the collateral. Impairment losses are included in the Allowance through a charge to the Provision.
For smaller-balance homogeneous loans (primarily residential real estate and consumer loans), the Allowance is based upon management’s evaluation of the quality, character and inherent risks in the loan portfolio, current and projected economic conditions, and past loan loss experience.
Delinquent consumer loans and residential mortgage loans are charged off or written down within 90 days, unless determined to be adequately collateralized or in imminent process of collection. Delinquent commercial loans and commercial mortgage loans are charged off or written down when management determines that collectibility is doubtful and the principal amount of the loans cannot be repaid from proceeds of collateral liquidation.
76
Our process for determining the reserve for unfunded loan commitments is consistent with our process for determining the Allowance and is adjusted for estimated loan funding probabilities. The reserve for unfunded loan commitments is recorded separately through a valuation allowance included in other liabilities. Credit losses for off-balance sheet credit exposures are deducted from the allowance for credit losses on off-balance sheet credit exposures in the period in which the liability is settled. The allowance for credit losses on off-balance sheet credit losses is established by a charge to other operating expense. The reserve for unfunded loan commitments totaled $2.1 million and $5.6 million at December 31, 2013 and 2012, respectively.
Premises and Equipment
Premises and equipment are stated at cost, net of accumulated depreciation and amortization. Depreciation and amortization are included in other operating expense and are computed using the straight-line method over the shorter of the estimated useful lives of the assets or the applicable leases. Useful lives generally range from five to thirty-nine years for premises and improvements, and one to seven years for equipment. Major improvements and betterments are capitalized, while recurring maintenance and repairs are charged to operating expense. Net gains or losses on dispositions of premises and equipment are included in other operating expense.
Other Intangible Assets
Other intangible assets include a core deposit premium and mortgage servicing rights.
Our core deposit premium is being amortized over 14 years which approximates the estimated life of the purchased deposits. The carrying value of our core deposit premium is periodically evaluated to estimate the remaining periods of benefit. If these periods of benefit are determined to be less than the remaining amortizable life, an adjustment to reflect such shorter life will be made.
We utilize the amortization method to measure our mortgage servicing rights. Under the amortization method, we amortize our mortgage servicing rights in proportion to and over the period of net servicing income. Income generated as the result of new mortgage servicing rights is reported as gains on sales of loans. Amortization of the servicing rights is reported as amortization of other intangible assets in our consolidated statements of income. Ancillary income is recorded in other income. Mortgage servicing rights are recorded when loans are sold to third-parties with servicing of those loans retained and we classify our entire mortgage servicing rights into one class.
Initial fair value of the servicing right is calculated by a discounted cash flow model prepared by a third party service provider based on market value assumptions at the time of origination and we assess the servicing right for impairment using current market value assumptions at each reporting period. Critical assumptions used in the discounted cash flow model include mortgage prepayment speeds, discount rates, costs to service and ancillary income. Variations in our assumptions could materially affect the estimated fair values. Changes to our assumptions are made when current trends and market data indicate that new trends have developed. Current market value assumptions based on loan product types (fixed rate, adjustable rate and balloon loans) include average discount rates and national prepayment speeds. Many of these assumptions are subjective and require a high level of management judgment. Our mortgage servicing rights portfolio and valuation assumptions are periodically reviewed by management.
Prepayment speeds may be affected by economic factors such as home price appreciation, market interest rates, the availability of other credit products to our borrowers and customer payment patterns. Prepayment speeds include the impact of all borrower prepayments, including full payoffs, additional principal payments and the impact of loans paid off due to foreclosure liquidations.
We perform an impairment assessment of our other intangible assets whenever events or changes in circumstance indicate that the carrying value of those assets may not be recoverable. Our impairment assessments involve, among other valuation methods, the estimation of future cash flows and other methods of determining fair value. Estimating future cash flows and determining fair values is subject to judgments and often involves the use of significant estimates and assumptions. The variability of the factors we use to perform our impairment tests depend on a number of conditions, including uncertainty about future events and cash flows. All such factors were interdependent and, therefore, do not change in isolation. Accordingly, our accounting estimates may materially change from period to period due to changing market factors.
During the second quarter of 2012, we evaluated the recoverability of the intangible assets related to our customer relationships and non-compete agreements. Upon completion of this review, we determined that the intangible assets related to our customer relationships and non-compete agreements were both fully impaired, and thus, we recorded impairment charges to other operating expense totaling $0.9 million during the second quarter of 2012.
77
Other Real Estate
Other real estate is composed of properties acquired through foreclosure proceedings and is initially recorded at fair value less estimated costs to sell the property, thereby establishing the new cost basis of other real estate. Losses arising at the time of acquisition of such properties are charged against the Allowance. Subsequent to acquisition, such properties are carried at the lower of cost or fair value less estimated selling expenses, determined on an individual asset basis. Any deficiency resulting from the excess of cost over fair value less estimated selling expenses is recognized as a valuation allowance. Any subsequent increase in fair value up to its cost basis is recorded as a reduction of the valuation allowance. Increases or decreases in the valuation allowance are included in other operating expense. Net gains or losses recognized on the sale of these properties are included in other operating income.
Non-Controlling Interest
Non-controlling interest at December 31, 2013 is comprised of preferred stock issued to third parties by the Company’s subsidiary, CPB Real Estate, Inc. In the third quarter of 2013, CPB Real Estate, Inc. and Citibank Properties, Inc. repurchased $7.6 million and $2.1 million, respectively, of its preferred stock issued to third parties at a premium of $1.8 million and $0.2 million, respectively. The premiums on the repurchase of the preferred stock were recorded in other operating expense.
Share Based Compensation
Share-based compensation cost is measured at the grant date, based on the estimated fair value of the award, and is recognized as expense over the employee’s requisite service period. We use the Black-Scholes option-pricing model to determine the fair-value of stock-based awards and we recognize compensation expense for all share-based payment awards on a straight-line basis over their respective vesting period. See Note 15 for further discussion of our stock-based compensation.
Income Taxes
Deferred tax assets and liabilities are recognized for the estimated future tax effects attributable to temporary differences and carryforwards. A valuation allowance may be required if, based on the weight of available evidence, it is more likely than not that some portion or all of the deferred tax assets will not be realized. In determining whether a valuation allowance is necessary, we consider the level of taxable income in prior years, to the extent that carrybacks are permitted under current tax laws, as well as estimates of future taxable income and tax planning strategies that could be implemented to accelerate taxable income, if necessary. If our estimates of future taxable income were materially overstated or if our assumptions regarding the tax consequences of tax planning strategies were inaccurate, some or all of our deferred tax assets may not be realized, which would result in a charge to earnings. Our continuing practice is to recognize interest and penalties related to income tax matters in interest expense and other expense, respectively.
We establish income tax contingency reserves for potential tax liabilities related to uncertain tax positions. Tax benefits are recognized when we determine that it is more likely than not that such benefits will be realized. Where uncertainty exists due to the complexity of income tax statutes, and where the potential tax amounts are significant, we generally seek independent tax opinions to support our positions. If our evaluation of the likelihood of the realization of benefits is inaccurate, we could incur additional income tax and interest expense that would adversely impact earnings, or we could receive tax benefits greater than anticipated which would positively impact earnings.
Earnings per Share
Basic earnings per share is computed by dividing net income available to common shareholders by the weighted average number of common shares outstanding during the period, excluding unvested restricted stock. Diluted earnings per share is computed by dividing net income available to common shareholders by the weighted average number of common shares outstanding during the period, increased by the dilutive effect of stock options and stock awards, less shares held in a Rabbi trust pursuant to a deferred compensation plan for directors.
Forward Foreign Exchange Contracts
We are periodically a party to a limited amount of forward foreign exchange contracts to satisfy customer requirements for foreign currencies. These contracts are not utilized for trading purposes and are carried at market value, with realized gains and losses included in fees on foreign exchange.
78
Derivatives and Hedging Activities
We recognize all derivatives on the balance sheet at fair value. On the date that we enter into a derivative contract, we designate the derivative as (1) a hedge of the fair value of an identified asset or liability (“fair value hedge”), (2) a hedge of a forecasted transaction or of the variability of cash flows to be received or paid related to an identified asset or liability (“cash flow hedge”) or (3) a transaction not qualifying for hedge accounting (“free standing derivative”). For a fair value hedge, changes in the fair value of the derivative and, to the extent that it is effective, changes in the fair value of the hedged asset or liability, attributable to the hedged risk, are recorded in current period net income in the same financial statement category as the hedged item. For a cash flow hedge, changes in the fair value of the derivative, to the extent that it is effective, is recorded in other comprehensive income (loss) (“OCI”). These changes in fair value are subsequently reclassified to net income in the same period(s) that the hedged transaction affects net income in the same financial statement category as the hedged item. For free standing derivatives, changes in fair values are reported in current period other operating income.
Recent Accounting Pronouncements
In December 2011, the Financial Accounting Standards Board (“FASB”) issued Accounting Standards Update (“ASU”) 2011-11,
“Disclosures about Offsetting Assets and Liabilities.”
ASU 2011-11 expands the disclosure requirements for certain financial instruments and derivatives that are subject to enforceable master netting agreements or similar arrangements. The disclosures are required regardless of whether the instruments have been offset (or netted) in the balance sheet. Under ASU 2011-11, companies must describe the nature of offsetting arrangements and provide quantitative information about those agreements, including the gross and net amounts of financial instruments that are recognized in the balance sheet. In January 2013, the FASB issued ASU 2013-01,
“Clarifying the Scope of Disclosures about Offsetting Assets and Liabilities,”
which clarifies the scope of ASU 2011-11 by limiting the disclosures to derivatives, repurchase agreements, and securities lending transactions to the extent they are subject to an enforceable master netting or similar arrangement. The provisions of ASU 2011-11 and ASU 2013-01 were effective for the Company’s reporting period beginning on January 1, 2013, with retrospective application required. We adopted ASU 2011-11 and ASU 2013-01 effective January 1, 2013 and the adoption did not have a material impact on our consolidated financial statements.
In July 2012, the FASB issued ASU 2012-02,
“Testing Indefinite-Lived Intangible Assets for Impairment.”
The provisions of ASU 2012-02 permit an entity to first assess qualitative factors to determine whether it is more likely than not that an indefinite-lived intangible asset is impaired as a basis for determining whether it is necessary to perform a quantitative impairment test, as is currently required by GAAP. ASU 2012-02 is effective for annual and interim impairment tests performed for the Company’s reporting period beginning on January 1, 2013. We adopted this ASU effective January 1, 2013. As the Company does not have any indefinite-lived assets, the adoption of this guidance did not have a material impact on our consolidated financial statements.
In February 2013, the FASB issued ASU 2013-02,
“Amendments to Topic 220, Other Comprehensive Income.”
The amendments in ASU 2013-02 supersede and replace the presentation requirements for reclassifications out of accumulated other comprehensive income in ASUs 2011-05 (issued in June 2011) and 2011-12 (issued in December 2011) for all public and private organizations. The amendments would require an entity to provide additional information about reclassifications out of accumulated other comprehensive income. ASU 2013-02 is effective for the Company’s reporting period beginning on January 1, 2013. We adopted this ASU effective January 1, 2013. As the Company provided these required disclosures in the notes to the consolidated financial statements, the adoption of this guidance had no impact on the Company's consolidated balance sheets and statements of income. See Note 20 for the disclosures required by ASU 2013-02.
In May 2011, the regulatory Consent Order (the “Consent Order”) that the bank entered into with the Federal Deposit Insurance Corporation (“FDIC”) and the State of Hawaii Division of Financial Institutions (“DFI”) on December 9, 2009 was lifted. In place of the Consent Order, the Board of Directors of the bank entered into a Memorandum of Understanding (the “Bank MOU”) with the FDIC and DFI effective May 5, 2011. Since this time, we have worked closely with both the FDIC and DFI to satisfactorily resolve all outstanding issues contained in the Bank MOU, including but not limited to, maintaining an adequate allowance for loan and lease losses, improving our asset quality, reducing our classified assets, and ensuring that our capital levels exceeded the levels required by the Bank MOU. The bank received a letter from the FDIC and DFI dated October 26, 2012 advising the bank that the Bank MOU was lifted.
79
The Company entered into a Written Agreement (the “Written Agreement”) with the Federal Reserve Bank of San Francisco (“FRBSF”) and DFI on July 2, 2010, which superseded in its entirety the Memorandum of Understanding that the Company entered into on April 1, 2009 with the FRBSF and DFI. Among other matters, the Written Agreement provided that unless we received the consent of the FRBSF and DFI, we could not: (i) pay dividends; (ii) receive dividends or payments representing a reduction in capital from Central Pacific Bank; (iii) directly or through any non-bank subsidiaries make any payments on subordinated debentures or trust preferred securities; (iv) directly or through any non-bank subsidiaries incur, increase or guarantee any debt; or (v) purchase or redeem any shares of our stock. The Written Agreement also required that our Board of Directors fully utilize the Company’s financial and managerial resources to ensure that the bank complies with any supervisory action taken by the bank’s regulators. We were also required to submit to the FRBSF an acceptable capital plan cash flow projection. On February 12, 2013, the Written Agreement was terminated.
On October 9, 2012, the bank entered into a separate Memorandum of Understanding (the “Compliance MOU”) with the FDIC to improve the bank’s compliance management system (“CMS”). Under the Compliance MOU, we are required to, among other things, (i) improve the Board of Directors’ oversight of the bank’s CMS; (ii) ensure the establishment and implementation of the bank’s CMS is commensurate with the complexity of the bank’s operations; (iii) perform a full review of all compliance policy and procedures, then revise and adopt policy and procedures to ensure compliance with all consumer protection regulations; (iv) enhance the bank’s training program relating to consumer protection and fair lending regulations; (v) develop and implement an effective internal monitoring program to ensure compliance with all applicable laws and regulations; (vi) strengthen the compliance audit function to ensure that the compliance audits are appropriately and comprehensively scoped; (vii) develop and implement internal controls for the bank’s third-party payment processing activity; (viii) strengthen the Board of Directors and senior management’s oversight of third-party relationships and (ix) enhance the bank’s overdraft payment program. The bank believes it has already taken substantial steps to comply with the Compliance MOU. In addition to the steps taken to comply with the Compliance MOU, the bank received an “Outstanding” rating in a recently completed Community Reinvestment performance evaluation that measures how financial institutions support their communities in the areas of lending, investment and service.
We cannot assure you whether or when the Company and the bank will be in full compliance with the Compliance MOU or whether or when the Compliance MOU will be terminated. Even if terminated, we may still become subject to other agreements with regulators which restrict our activities or may also continue to impose capital ratios or other requirements on our business. The requirements and restrictions of the Compliance MOU are judicially enforceable and the Company or the bank's failure to comply with such requirements and restrictions may subject the Company and the bank to additional regulatory restrictions including: the imposition of additional regulatory requirements or orders; limitations on our activities; the imposition of civil monetary penalties; and further directives which affect our business, including, in the most severe circumstances, termination of the bank’s deposit insurance or appointment of a conservator or receiver for the bank.
|
3.
|
RESERVE REQUIREMENTS
|
The bank is required by the FRBSF to maintain reserves based on the amount of deposits held. The amount held as a reserve by our bank at December 31, 2013 and 2012 was $48.5 million and $57.4 million, respectively.
80
|
4.
|
INVESTMENT SECURITIES
|
A summary of our investment securities portfolio as of December 31, 2013 and 2012 is as follows:
|
Gross
|
Gross
|
|
|||||||||||||
|
Amortized
|
unrealized
|
unrealized
|
Estimated
|
||||||||||||
|
cost
|
gains
|
losses
|
fair value
|
||||||||||||
|
(Dollars in thousands)
|
|||||||||||||||
|
2013
|
|||||||||||||||
|
Held to Maturity:
|
|||||||||||||||
|
Mortgage-backed securities - U.S. Government sponsored entities
|
$ | 252,047 | $ | - | $ | (13,342 | ) | $ | 238,705 | ||||||
|
Available for Sale:
|
|||||||||||||||
|
Debt securities:
|
|||||||||||||||
|
States and political subdivisions
|
$ | 191,158 | $ | 305 | $ | (12,106 | ) | $ | 179,357 | ||||||
|
Corporate securities
|
157,337 | 1,878 | (1,120 | ) | 158,095 | ||||||||||
|
Mortgage-backed securities:
|
|||||||||||||||
|
U.S. Government sponsored entities
|
936,144 | 7,085 | (15,603 | ) | 927,626 | ||||||||||
|
Non-agency collateralized mortgage obligations
|
147,902 | 81 | (5,937 | ) | 142,046 | ||||||||||
|
Other
|
755 | 120 | - | 875 | |||||||||||
|
Total
|
$ | 1,433,296 | $ | 9,469 | $ | (34,766 | ) | $ | 1,407,999 | ||||||
|
2012
|
|||||||||||||||
|
Held to Maturity:
|
|||||||||||||||
|
Mortgage-backed securities - U.S. Government sponsored entities
|
$ | 161,848 | $ | 695 | $ | (15 | ) | $ | 162,528 | ||||||
|
Available for Sale:
|
|||||||||||||||
|
Debt securities:
|
|||||||||||||||
|
U.S. Government sponsored entities
|
$ | 278,198 | $ | 2,741 | $ | - | $ | 280,939 | |||||||
|
States and political subdivisions
|
184,274 | 2,831 | (1,194 | ) | 185,911 | ||||||||||
|
Corporate securities
|
125,649 | 2,360 | (63 | ) | 127,946 | ||||||||||
|
Mortgage-backed securities - U.S. Government sponsored entities
|
925,018 | 17,548 | (1,523 | ) | 941,043 | ||||||||||
|
Other
|
866 | 40 | - | 906 | |||||||||||
|
Total
|
$ | 1,514,005 | $ | 25,520 | $ | (2,780 | ) | $ | 1,536,745 | ||||||
The amortized cost and estimated fair value of our investment securities at December 31, 2013 by contractual maturity are shown below. Actual maturities will differ from contractual maturities because issuers may have the right to call or prepay obligations with or without call or prepayment penalties.
|
December 31, 2013
|
||||||
|
Amortized
Cost
|
Estimated Fair Value
|
|||||
|
(Dollars in thousands)
|
||||||
|
Held to Maturity
|
||||||
|
Mortgage-backed securities
|
$ | 252,047 | $ | 238,705 | ||
|
Available for Sale
|
||||||
|
Due in one year or less
|
$ | - | $ | - | ||
|
Due after one year through five years
|
87,349 | 88,819 | ||||
|
Due after five years through ten years
|
134,337 | 131,223 | ||||
|
Due after ten years
|
126,809 | 117,410 | ||||
|
Mortgage-backed securities
|
1,084,046 | 1,069,672 | ||||
|
Other
|
755 | 875 | ||||
|
Total
|
$ | 1,433,296 | $ | 1,407,999 | ||
81
Proceeds from sales of investment securities available for sale were $271.9 million, $130.1 million, and $138.0 million in 2013, 2012 and 2011, respectively, resulting in gross realized gains of $3.9 million, $1.7 million, and $1.4 million in 2013, 2012 and 2011, respectively, and gross realized losses of $3.4 million, $0.9 million, and $0.1 million in 2013, 2012 and 2011, respectively. The specific identification method was used as the basis for determining the cost of all securities sold.
In the fourth quarter of 2013, we executed a bond swap where we sold $271.5 million in lower-yielding available-for-sale agency debentures and agency mortgage-backed securities and agency debentures with an average net yield of 1.87% and a weighted average life of 2.9 years and reallocated the proceeds in $242.5 million of higher-yielding agency mortgage-backed securities, non-agency commercial mortgage-backed securities and corporate bond securities with an average yield of 3.21% and a weighted average life of 7.4 years. The new securities were classified in the available-for-sale portfolio and a net gain of $0.5 million was realized on the transaction.
In the third quarter of 2012, we completed an investment securities portfolio repositioning to reduce net interest income volatility and enhance the potential for prospective earnings and an improved net interest margin. In connection with the repositioning, we sold $124.7 million in available for sale mortgage-backed securities with an average net yield of 0.60% and a weighted average life of 1.3 years and reinvested the proceeds in $133.2 million of investment securities with an average yield of 1.88% and a weighted average life of 5.3 years. The new securities were classified in the held to maturity portfolio and a net gain of $0.7 million was realized on the transaction.
Investment securities of $914.1 million and $905.5 million at December 31, 2013 and 2012, respectively, were pledged to secure public funds on deposit, securities sold under agreements to repurchase and other long-term and short-term borrowings.
There were a total of 321 and 118 securities in an unrealized loss position at December 31, 2013 and 2012, respectively. Provided below is a summary of investment securities which were in an unrealized loss position at December 31, 2013 and 2012:
|
Less than 12 months
|
12 months or longer
|
Total
|
||||||||||||||||||||||
| Fair |
Unrealized
|
Fair |
Unrealized
|
Fair |
Unrealized
|
|||||||||||||||||||
|
Description of Securities
|
Value
|
Losses
|
Value
|
Losses
|
Value
|
Losses
|
||||||||||||||||||
|
(Dollars in thousands)
|
||||||||||||||||||||||||
|
At December 31, 2013:
|
||||||||||||||||||||||||
|
Debt securities:
|
||||||||||||||||||||||||
|
States and political subdivisions
|
$ | 137,176 | $ | (8,985 | ) | $ | 32,747 | $ | (3,121 | ) | $ | 169,923 | $ | (12,106 | ) | |||||||||
|
Corporate securities
|
75,368 | (1,120 | ) | - | - | 75,368 | (1,120 | ) | ||||||||||||||||
|
Mortgage-backed securities:
|
||||||||||||||||||||||||
|
U.S. Government sponsored entities
|
909,585 | (28,386 | ) | 4,848 | (559 | ) | 914,433 | (28,945 | ) | |||||||||||||||
|
Non-agency collateralized mortgage obligations
|
129,991 | (5,937 | ) | - | - | 129,991 | (5,937 | ) | ||||||||||||||||
|
Total temporarily impaired securities
|
$ | 1,252,120 | $ | (44,428 | ) | $ | 37,595 | $ | (3,680 | ) | $ | 1,289,715 | $ | (48,108 | ) | |||||||||
|
At December 31, 2012:
|
||||||||||||||||||||||||
|
Debt securities:
|
||||||||||||||||||||||||
|
States and political subdivisions
|
$ | 73,128 | $ | (1,194 | ) | $ | - | $ | - | $ | 73,128 | $ | (1,194 | ) | ||||||||||
|
Corporate securities
|
23,205 | (63 | ) | - | - | 23,205 | (63 | ) | ||||||||||||||||
|
Mortgage-backed securities:
|
||||||||||||||||||||||||
|
U.S. Government sponsored entities
|
206,981 | (1,538 | ) | - | - | 206,981 | (1,538 | ) | ||||||||||||||||
|
Total temporarily impaired securities
|
$ | 303,314 | $ | (2,795 | ) | $ | - | $ | - | $ | 303,314 | $ | (2,795 | ) | ||||||||||
The unrealized losses on the Company’s investment securities were caused by market conditions. Investment securities are evaluated on a quarterly basis, and include evaluating the changes in the investment securities’ ratings issued by rating agencies and changes in the financial condition of the issuer, and for mortgage related securities, delinquency and loss information with respect to the underlying collateral, changes in levels of subordination for the Company’s particular position within the repayment structure, and remaining credit enhancement as compared to expected credit losses of the security. Substantially all of these investment securities continue to be investment grade rated by one or more major rating agencies.
82
Other-than-temporary impairment (“OTTI”)
Unrealized losses for all investment securities are reviewed to determine whether the losses are “other-than-temporary.” Investment securities are evaluated for OTTI on at least a quarterly basis and more frequently when economic or market conditions warrant such an evaluation to determine whether a decline in their value below amortized cost is other-than-temporary. In conducting this assessment, we evaluate a number of factors including, but not limited to:
|
·
|
The length of time and the extent to which fair value has been less than the amortized cost basis;
|
|
·
|
Adverse conditions specifically related to the security, an industry, or a geographic area;
|
|
·
|
The historical and implied volatility of the fair value of the security;
|
|
·
|
The payment structure of the debt security and the likelihood of the issuer being able to make payments;
|
|
·
|
Failure of the issuer to make scheduled interest or principal payments;
|
|
·
|
Any rating changes by a rating agency; and
|
|
·
|
Recoveries or additional decline in fair value subsequent to the balance sheet date.
|
The term “other-than-temporary” is not intended to indicate that the decline is permanent, but indicates that the prospects for a near-term recovery of value are not necessarily favorable, or that there is a general lack of evidence to support a realizable value equal to or greater than the carrying value of the investment. Once a decline in value is determined to be other-than-temporary, the value of the security is reduced and a corresponding charge to earnings is recognized for anticipated credit losses.
The declines in market value were primarily attributable to changes in interest rates and disruptions in the credit and financial markets. Because we have no intent to sell securities in an unrealized loss position and it is not more likely than not that we will be required to sell such securities before recovery of its amortized cost basis, we do not consider our investments to be other-than-temporarily impaired.
|
5.
|
LOANS AND LEASES |
Loans and leases, excluding loans held for sale, consisted of the following:
|
December 31,
|
||||||||
|
2013
|
2012
|
|||||||
|
(Dollars in thousands)
|
||||||||
|
Commercial, financial & agricultural
|
$ | 398,365 | $ | 246,278 | ||||
|
Real estate:
|
||||||||
|
Construction
|
75,927 | 96,240 | ||||||
|
Mortgage - residential
|
1,237,841 | 1,035,273 | ||||||
|
Mortgage - commercial
|
601,114 | 673,506 | ||||||
|
Consumer
|
311,670 | 143,387 | ||||||
|
Leases
|
6,241 | 10,504 | ||||||
| 2,631,158 | 2,205,188 | |||||||
|
Unearned income
|
(557 | ) | (1,244 | ) | ||||
|
Total loans and leases
|
$ | 2,630,601 | $ | 2,203,944 | ||||
During the year ended December 31, 2013, we transferred the collateral in 12 portfolio loans with a carrying value of $4.4 million to other real estate. We did not transfer any portfolio loans to the held-for-sale category and we did not sell any portfolio loans in 2013. In 2013, we purchased auto loan portfolios for $67.7 million, which included a $2.8 million premium over the $64.9 million outstanding balance. At the time of purchase, the auto loan portfolios had a weighted average remaining term of 72 months. In 2013, we also purchased participation interests in student loans totaling $17.4 million, which represented the outstanding balance at the time of purchases. At the time of purchases, the student loans had a weighted average remaining term of 122 months.
During the year ended December 31, 2012, we transferred three portfolio loans, two of which were non-performing, with a carrying value of $1.5 million, to the held-for-sale category. In addition, we transferred 20 portfolio loans with a carrying value of $4.8 million to other real estate. No portfolio loans were sold or purchased during the year ended December 31, 2012.
83
In the normal course of business, our bank makes loans to certain directors, executive officers and their affiliates under terms that management believes are consistent with its general lending policies. An analysis of the activity of such loans follows:
|
December 31,
|
||||||||
|
2013
|
2012
|
|||||||
|
(Dollars in thousands)
|
||||||||
|
Balance, beginning of year
|
$ | 1,501 | $ | 4,579 | ||||
|
Additions
|
17,487 | 2,348 | ||||||
|
Repayments
|
(6,046 | ) | (5,426 | ) | ||||
|
Balance, end of year
|
$ | 12,942 | $ | 1,501 | ||||
Impaired Loans
The following table presents by class, the balance in the Allowance and the recorded investment in loans and leases based on the Company’s impairment method as of December 31, 2013 and 2012:
|
Commercial,
|
Real estate
|
||||||||||||||||||||||||||
|
financial & agricultural
|
Construction
|
Mortgage - residential
|
Mortgage - commercial
|
Consumer
|
Leases
|
Total
|
|||||||||||||||||||||
|
(Dollars in thousands)
|
|||||||||||||||||||||||||||
|
December 31, 2013
|
|||||||||||||||||||||||||||
|
Allowance for loan and lease losses:
|
|||||||||||||||||||||||||||
|
Ending balance attributable to loans:
|
|||||||||||||||||||||||||||
|
Individually evaluated for impairment
|
$ | 349 | $ | - | $ | - | $ | - | $ | - | $ | - | $ | 349 | |||||||||||||
|
Collectively evaluated for impairment
|
12,847 | 2,774 | 28,441 | 26,778 | 6,576 | 55 | 77,471 | ||||||||||||||||||||
| 13,196 | 2,774 | 28,441 | 26,778 | 6,576 | 55 | 77,820 | |||||||||||||||||||||
|
Unallocated
|
6,000 | ||||||||||||||||||||||||||
|
Total ending balance
|
$ | 13,196 | $ | 2,774 | $ | 28,441 | $ | 26,778 | $ | 6,576 | $ | 55 | $ | 83,820 | |||||||||||||
|
Loans and leases:
|
|||||||||||||||||||||||||||
|
Individually evaluated for impairment
|
$ | 3,939 | $ | 8,065 | $ | 36,779 | $ | 16,271 | $ | - | $ | - | $ | 65,054 | |||||||||||||
|
Collectively evaluated for impairment
|
394,426 | 67,862 | 1,201,062 | 584,843 | 311,670 | 6,241 | 2,566,104 | ||||||||||||||||||||
| 398,365 | 75,927 | 1,237,841 | 601,114 | 311,670 | 6,241 | 2,631,158 | |||||||||||||||||||||
|
Unearned income
|
351 | (311 | ) | 1,418 | (1,033 | ) | (982 | ) | - | (557 | ) | ||||||||||||||||
|
Total ending balance
|
$ | 398,716 | $ | 75,616 | $ | 1,239,259 | $ | 600,081 | $ | 310,688 | $ | 6,241 | $ | 2,630,601 | |||||||||||||
|
December 31, 2012
|
|||||||||||||||||||||||||||
|
Allowance for loan and lease losses:
|
|||||||||||||||||||||||||||
|
Ending balance attributable to loans:
|
|||||||||||||||||||||||||||
|
Individually evaluated for impairment
|
$ | 882 | $ | 1,582 | $ | 272 | $ | 270 | $ | - | $ | 5 | $ | 3,011 | |||||||||||||
|
Collectively evaluated for impairment
|
4,105 | 2,928 | 29,638 | 48,230 | 2,421 | 80 | 87,402 | ||||||||||||||||||||
| 4,987 | 4,510 | 29,910 | 48,500 | 2,421 | 85 | 90,413 | |||||||||||||||||||||
|
Unallocated
|
6,000 | ||||||||||||||||||||||||||
|
Total ending balance
|
$ | 4,987 | $ | 4,510 | $ | 29,910 | $ | 48,500 | $ | 2,421 | $ | 85 | $ | 96,413 | |||||||||||||
|
Loans and leases:
|
|||||||||||||||||||||||||||
|
Individually evaluated for impairment
|
$ | 3,957 | $ | 48,264 | $ | 42,865 | $ | 15,911 | $ | - | $ | 95 | $ | 111,092 | |||||||||||||
|
Collectively evaluated for impairment
|
242,321 | 47,976 | 992,408 | 657,595 | 143,387 | 10,409 | 2,094,096 | ||||||||||||||||||||
| 246,278 | 96,240 | 1,035,273 | 673,506 | 143,387 | 10,504 | 2,205,188 | |||||||||||||||||||||
|
Unearned income
|
(60 | ) | (46 | ) | 124 | (1,258 | ) | (4 | ) | - | (1,244 | ) | |||||||||||||||
|
Total ending balance
|
$ | 246,218 | $ | 96,194 | $ | 1,035,397 | $ | 672,248 | $ | 143,383 | $ | 10,504 | $ | 2,203,944 | |||||||||||||
84
The following table presents by class, impaired loans as of December 31, 2013 and 2012:
|
Unpaid Principal Balance
|
Recorded
Investment
|
Allowance
Allocated
|
||||||||
|
(Dollars in thousands)
|
||||||||||
|
December 31, 2013
|
||||||||||
|
Impaired loans with no related allowance recorded:
|
||||||||||
|
Commercial, financial & agricultural
|
$ | 1,069 | $ | 1,040 | $ | - | ||||
|
Real estate:
|
||||||||||
|
Construction
|
14,451 | 8,065 | - | |||||||
|
Mortgage - residential
|
41,117 | 36,779 | - | |||||||
|
Mortgage - commercial
|
22,353 | 16,271 | - | |||||||
|
Total impaired loans with no related allowance recorded
|
78,990 | 62,155 | - | |||||||
|
Impaired loans with an allowance recorded:
|
||||||||||
|
Commercial, financial & agricultural
|
4,367 | 2,899 | 349 | |||||||
|
Total impaired loans with an allowance recorded
|
4,367 | 2,899 | 349 | |||||||
|
Total
|
$ | 83,357 | $ | 65,054 | $ | 349 | ||||
|
December 31, 2012
|
||||||||||
|
Impaired loans with no related allowance recorded:
|
||||||||||
|
Commercial, financial & agricultural
|
$ | 1,225 | $ | 526 | $ | - | ||||
|
Real estate:
|
||||||||||
|
Construction
|
52,352 | 36,664 | - | |||||||
|
Mortgage - residential
|
47,364 | 41,894 | - | |||||||
|
Mortgage - commercial
|
13,616 | 13,211 | - | |||||||
|
Total impaired loans with no related allowance recorded
|
114,557 | 92,295 | - | |||||||
|
Impaired loans with an allowance recorded:
|
||||||||||
|
Commercial, financial & agricultural
|
4,807 | 3,431 | 882 | |||||||
|
Real estate:
|
||||||||||
|
Construction
|
13,678 | 11,600 | 1,582 | |||||||
|
Mortgage - residential
|
1,935 | 971 | 272 | |||||||
|
Mortgage - commercial
|
3,939 | 2,700 | 270 | |||||||
|
Leases
|
95 | 95 | 5 | |||||||
|
Total impaired loans with an allowance recorded
|
24,454 | 18,797 | 3,011 | |||||||
|
Total
|
$ | 139,011 | $ | 111,092 | $ | 3,011 | ||||
85
The following table presents by class, the average recorded investment and interest income recognized on impaired loans as of December 31, 2013, 2012 and 2011:
|
Average Recorded Investment
|
Interest Income Recognized
|
||||||
|
(Dollars in thousands)
|
|||||||
|
December 31, 2013
|
|||||||
|
Commercial, financial & agricultural
|
$ | 4,138 | $ | 24 | |||
|
Real estate:
|
|||||||
|
Construction
|
24,545 | 1,442 | |||||
|
Mortgage - residential
|
38,378 | 586 | |||||
|
Mortgage - commercial
|
21,107 | 833 | |||||
|
Leases
|
33 | - | |||||
|
Total
|
$ | 88,201 | $ | 2,885 | |||
|
December 31, 2012
|
|||||||
|
Commercial, financial & agricultural
|
$ | 3,486 | $ | 39 | |||
|
Real estate:
|
|||||||
|
Construction
|
56,762 | 771 | |||||
|
Mortgage - residential
|
47,240 | 308 | |||||
|
Mortgage - commercial
|
18,852 | 506 | |||||
|
Leases
|
133 | - | |||||
|
Total
|
$ | 126,473 | $ | 1,624 | |||
|
December 31, 2011
|
|||||||
|
Commercial, financial & agricultural
|
$ | 549 | $ | - | |||
|
Real estate:
|
|||||||
|
Construction
|
115,612 | 772 | |||||
|
Mortgage - residential
|
58,262 | 616 | |||||
|
Mortgage - commercial
|
19,116 | 469 | |||||
|
Total
|
$ | 193,539 | $ | 1,857 | |||
86
Aging Analysis of Accruing and Non-Accruing Loans and Leases
For all loan types, the Company determines delinquency status by considering the number of days full payments required by the contractual terms of the loan are past due. The following table presents by class, the aging of the recorded investment in past due loans and leases as of December 31, 2013 and 2012:
|
30 - 59 Days Past Due
|
60 - 89 Days Past Due
|
Accruing Loans Greater than 90 Days Past Due
|
Nonaccrual Loans
|
Total Past Due
|
Loans and Leases Not Past Due
|
Total
|
|||||||||||||||||||||
|
(Dollars in thousands)
|
|||||||||||||||||||||||||||
|
December 31, 2013
|
|||||||||||||||||||||||||||
|
Commercial, financial & agricultural
|
$ | 50 | $ | - | $ | - | $ | 3,533 | $ | 3,583 | $ | 395,133 | $ | 398,716 | |||||||||||||
|
Real estate:
|
|||||||||||||||||||||||||||
|
Construction
|
- | 120 | - | 4,015 | 4,135 | 71,481 | 75,616 | ||||||||||||||||||||
|
Mortgage - residential
|
3,898 | 1,885 | - | 20,271 | 26,054 | 1,213,205 | 1,239,259 | ||||||||||||||||||||
|
Mortgage - commercial
|
544 | - | - | 13,769 | 14,313 | 585,768 | 600,081 | ||||||||||||||||||||
|
Consumer
|
577 | 92 | - | - | 669 | 310,019 | 310,688 | ||||||||||||||||||||
|
Leases
|
- | - | 15 | - | 15 | 6,226 | 6,241 | ||||||||||||||||||||
|
Total
|
$ | 5,069 | $ | 2,097 | $ | 15 | $ | 41,588 | $ | 48,769 | $ | 2,581,832 | $ | 2,630,601 | |||||||||||||
|
December 31, 2012
|
|||||||||||||||||||||||||||
|
Commercial, financial & agricultural
|
$ | 123 | $ | 139 | $ | - | $ | 3,510 | $ | 3,772 | $ | 242,446 | $ | 246,218 | |||||||||||||
|
Real estate:
|
|||||||||||||||||||||||||||
|
Construction
|
124 | - | - | 38,742 | 38,866 | 57,328 | 96,194 | ||||||||||||||||||||
|
Mortgage - residential
|
8,330 | 590 | 387 | 27,499 | 36,806 | 998,591 | 1,035,397 | ||||||||||||||||||||
|
Mortgage - commercial
|
219 | - | - | 9,487 | 9,706 | 662,542 | 672,248 | ||||||||||||||||||||
|
Consumer
|
249 | 169 | 116 | - | 534 | 142,849 | 143,383 | ||||||||||||||||||||
|
Leases
|
- | - | - | 94 | 94 | 10,410 | 10,504 | ||||||||||||||||||||
|
Total
|
$ | 9,045 | $ | 898 | $ | 503 | $ | 79,332 | $ | 89,778 | $ | 2,114,166 | $ | 2,203,944 | |||||||||||||
Interest income totaling $0.4 million, $0.7 million, and $0.8 million was recognized on nonaccrual loans, including loans held for sale, in 2013, 2012 and 2011, respectively. Additional interest income of $4.9 million, $10.1 million, and $14.2 million would have been recognized in 2013, 2012 and 2011, respectively, had these loans been accruing interest throughout those periods. Additionally, interest income of $2.5 million, $0.8 million, and $0.7 million was collected and recognized on charged-off loans in 2013, 2012 and 2011, respectively.
Modifications
TDRs included in nonperforming assets at December 31, 2013 consisted of 42 Hawaii residential mortgage loans with a combined principal balance of $12.5 million, one U.S. Mainland commercial mortgage loan with a principal balance of $9.0 million, three Hawaii construction and development loans with a combined principal balance of $1.3 million, and one Hawaii commercial loan with a principal balance of $0.5 million. Concessions made to the original contractual terms of these loans consisted primarily of the deferral of interest and/or principal payments due to deterioration in the borrowers’ financial condition. The principal balances on these TDRs had matured and/or were in default at the time of restructure and we have no commitments to lend additional funds to any of these borrowers. There were $23.3 million of TDRs still accruing interest at December 31, 2013, none of which were more than 90 days delinquent. At December 31, 2012, there were $31.8 million of TDRs still accruing interest, none of which were more than 90 days delinquent.
Some loans modified in a TDR may already be on nonaccrual status and partial charge-offs may have already been taken against the outstanding loan balance. Thus, these loans have already been identified as impaired and have already been evaluated under the Company’s Allowance methodology. As a result, some loans modified in a TDR may have the financial effect of increasing the specific allowance associated with the loan. The loans modified in a TDR did not have a material effect on our Provision and Allowance during the years ended December 31, 2013 and 2012.
87
The following table presents by class, information related to loans modified in a TDR during the years ended December 31, 2013 and 2012:
|
Number of Contracts
|
Recorded
Investment
(as of period end)
|
Increase
in the
Allowance
|
||||||||
|
(Dollars in thousands)
|
||||||||||
|
Year ended December 31, 2013
|
||||||||||
|
Commercial, financial & agricultural
|
1 | $ | 517 | $ | - | |||||
|
Real estate:
|
||||||||||
|
Construction
|
1 | 178 | - | |||||||
|
Mortgage - residential
|
7 | 2,566 | - | |||||||
|
Mortgage - commercial
|
1 | 8,952 | - | |||||||
|
Total
|
10 | $ | 12,213 | $ | - | |||||
|
Year ended December 31, 2012
|
||||||||||
|
Commercial, financial & agricultural
|
4 | $ | 447 | $ | - | |||||
|
Real estate:
|
||||||||||
|
Construction
|
8 | 11,120 | - | |||||||
|
Mortgage - residential
|
10 | 3,782 | 427 | |||||||
|
Mortgage - commercial
|
6 | 9,124 | - | |||||||
|
Total
|
28 | $ | 24,473 | $ | 427 | |||||
The following table presents by class, loans modified as a TDR within the previous twelve months that subsequently defaulted during the years ended December 31, 2013 and 2012:
|
Year Ended December 31,
|
|||||||||||||
|
2013
|
2012
|
||||||||||||
|
Number of Contracts
|
Recorded
Investment
(as of period end)
|
Number of Contracts
|
Recorded
Investment
(as of period end)
|
||||||||||
|
(Dollars in thousands)
|
|||||||||||||
|
Commercial, financial & agricultural
|
1 | $ | 517 | - | $ | - | |||||||
|
Real estate:
|
|||||||||||||
|
Construction
|
- | - | 7 | 5,949 | |||||||||
|
Mortgage - residential
|
- | - | 4 | 893 | |||||||||
|
Mortgage - commercial
|
- | - | 2 | 5,890 | |||||||||
|
Total
|
1 | $ | 517 | 13 | $ | 12,732 | |||||||
Credit Quality Indicators
The Company categorizes loans and leases into risk categories based on relevant information about the ability of borrowers to service their debt such as: current financial information, historical payment experience, credit documentation, public information, and current economic trends, among other factors. The Company analyzes loans and leases individually by classifying the loans and leases as to credit risk. This analysis includes non-homogeneous loans and leases, such as commercial and commercial real estate loans. This analysis is performed on a quarterly basis. The Company uses the following definitions for risk ratings:
Special Mention.
Loans and leases classified as special mention, while still adequately protected by the borrower’s capital adequacy and payment capability, exhibit distinct weakening trends and/or elevated levels of exposure to external conditions. If left unchecked or uncorrected, these potential weaknesses may result in deteriorated prospects of repayment. These exposures require management’s close attention so as to avoid becoming undue or unwarranted credit exposures.
88
Substandard.
Loans and leases classified as substandard are inadequately protected by the borrower’s current financial condition and payment capability or of the collateral pledged, if any. Loans and leases so classified have a well-defined weakness or weaknesses that jeopardize the orderly repayment of debt. They are characterized by the distinct possibility that the bank will sustain some loss if the deficiencies are not corrected.
Doubtful.
Loans and leases classified as doubtful have all the weaknesses inherent in those classified as substandard, with the added characteristic that the weaknesses make collection or orderly repayment in full, on the basis of current existing facts, conditions and values, highly questionable and improbable. Possibility of loss is extremely high, but because of certain important and reasonably specific factors that may work to the advantage and strengthening of the exposure, its classification as an estimate loss is deferred until its more exact status may be determined.
Loss.
Loans and leases classified as loss are considered to be non-collectible and of such little value that their continuance as bankable assets is not warranted. This does not mean the loan has absolutely no recovery value, but rather it is neither practical nor desirable to defer writing off the loan, even though partial recovery may be obtained in the future. Losses are taken in the period in which they surface as uncollectible.
Loans and leases not meeting the criteria above are considered to be pass rated loans and leases. The following table presents by class and credit indicator, the recorded investment in the Company’s loans and leases as of December 31, 2013 and 2012:
|
Pass
|
Special Mention
|
Substandard
|
Doubtful
|
Loss
|
Less: Unearned Income
|
Total
|
||||||||||||||||||||
|
(Dollars in thousands)
|
||||||||||||||||||||||||||
|
December 31, 2013
|
||||||||||||||||||||||||||
|
Commercial, financial
& agricultural
|
$ | 371,285 | $ | 21,511 | $ | 5,569 | $ | - | $ | - | $ | (351 | ) | $ | 398,716 | |||||||||||
|
Real estate:
|
||||||||||||||||||||||||||
|
Construction
|
67,435 | 4,477 | 4,015 | - | - | 311 | 75,616 | |||||||||||||||||||
|
Mortgage - residential
|
1,213,636 | 845 | 23,360 | - | - | (1,418 | ) | 1,239,259 | ||||||||||||||||||
|
Mortgage - commercial
|
551,488 | 20,206 | 29,420 | - | - | 1,033 | 600,081 | |||||||||||||||||||
|
Consumer
|
311,670 | - | - | - | - | 982 | 310,688 | |||||||||||||||||||
|
Leases
|
6,241 | - | - | - | - | - | 6,241 | |||||||||||||||||||
|
Total
|
$ | 2,521,755 | $ | 47,039 | $ | 62,364 | $ | - | $ | - | $ | 557 | $ | 2,630,601 | ||||||||||||
|
December 31, 2012
|
||||||||||||||||||||||||||
|
Commercial, financial
& agricultural
|
$ | 232,062 | $ | 6,609 | $ | 7,607 | $ | - | $ | - | $ | 60 | $ | 246,218 | ||||||||||||
|
Real estate:
|
||||||||||||||||||||||||||
|
Construction
|
42,619 | 9,635 | 43,986 | - | - | 46 | 96,194 | |||||||||||||||||||
|
Mortgage - residential
|
1,003,268 | 1,109 | 30,896 | - | - | (124 | ) | 1,035,397 | ||||||||||||||||||
|
Mortgage - commercial
|
577,638 | 65,114 | 30,754 | - | - | 1,258 | 672,248 | |||||||||||||||||||
|
Consumer
|
143,258 | - | 129 | - | - | 4 | 143,383 | |||||||||||||||||||
|
Leases
|
9,860 | 274 | 370 | - | - | - | 10,504 | |||||||||||||||||||
|
Total
|
$ | 2,008,705 | $ | 82,741 | $ | 113,742 | $ | - | $ | - | $ | 1,244 | $ | 2,203,944 | ||||||||||||
In accordance with applicable Interagency Guidance issued by our primary bank regulators, we define subprime borrowers as typically having weakened credit histories that include payment delinquencies and possibly more severe problems such as charge-offs, judgments, and bankruptcies. They may also display reduced repayment capacity as measured by credit scores, debt-to-income ratios, or other criteria that may encompass borrowers with incomplete credit histories. Subprime loans are loans to borrowers displaying one or more of these characteristics at the time of origination or purchase. Such loans have a higher risk of default than loans to prime borrowers. At December 31, 2013 and 2012, we did not have any loans that we considered to be subprime.
89
|
6.
|
ALLOWANCE FOR LOAN AND LEASE LOSSES
|
The following table presents by class, the activity in the Allowance for the periods indicated:
|
Commercial,
|
Real estate
|
||||||||||||||||||||||||||||||
|
financial &
|
Mortgage -
|
Mortgage -
|
|||||||||||||||||||||||||||||
|
agricultural
|
Construction
|
residential
|
commercial
|
Consumer
|
Leases
|
Unallocated
|
Total
|
||||||||||||||||||||||||
|
(Dollars in thousands)
|
|||||||||||||||||||||||||||||||
|
Year Ended December 31, 2013
|
|||||||||||||||||||||||||||||||
|
Beginning balance
|
$ | 4,987 | $ | 4,510 | $ | 29,910 | $ | 48,500 | $ | 2,421 | $ | 85 | $ | 6,000 | $ | 96,413 | |||||||||||||||
| Provision (credit) for loan | |||||||||||||||||||||||||||||||
|
and lease losses
|
9,634 | (4,974 | ) | (1,493 | ) | (19,194 | ) | 5,093 | (376 | ) | - | (11,310 | ) | ||||||||||||||||||
| 14,621 | (464 | ) | 28,417 | 29,306 | 7,514 | (291 | ) | 6,000 | 85,103 | ||||||||||||||||||||||
|
Charge-offs
|
2,812 | 358 | 1,083 | 6,768 | 1,595 | - | - | 12,616 | |||||||||||||||||||||||
|
Recoveries
|
1,387 | 3,596 | 1,107 | 4,240 | 657 | 346 | - | 11,333 | |||||||||||||||||||||||
|
Net charge-offs (recoveries)
|
1,425 | (3,238 | ) | (24 | ) | 2,528 | 938 | (346 | ) | - | 1,283 | ||||||||||||||||||||
|
Ending balance
|
$ | 13,196 | $ | 2,774 | $ | 28,441 | $ | 26,778 | $ | 6,576 | $ | 55 | $ | 6,000 | $ | 83,820 | |||||||||||||||
|
Year Ended December 31, 2012
|
|||||||||||||||||||||||||||||||
|
Beginning balance
|
$ | 6,110 | $ | 28,630 | $ | 32,736 | $ | 47,729 | $ | 2,335 | $ | 553 | $ | 4,000 | $ | 122,093 | |||||||||||||||
| Provision (credit) for loan | |||||||||||||||||||||||||||||||
|
and lease losses
|
1,042 | (22,307 | ) | (2,038 | ) | 2,316 | 547 | (445 | ) | 2,000 | (18,885 | ) | |||||||||||||||||||
| 7,152 | 6,323 | 30,698 | 50,045 | 2,882 | 108 | 6,000 | 103,208 | ||||||||||||||||||||||||
|
Charge-offs
|
3,779 | 8,435 | 1,664 | 2,033 | 1,490 | 28 | - | 17,429 | |||||||||||||||||||||||
|
Recoveries
|
1,614 | 6,622 | 876 | 488 | 1,029 | 5 | - | 10,634 | |||||||||||||||||||||||
|
Net charge-offs
|
2,165 | 1,813 | 788 | 1,545 | 461 | 23 | - | 6,795 | |||||||||||||||||||||||
|
Ending balance
|
$ | 4,987 | $ | 4,510 | $ | 29,910 | $ | 48,500 | $ | 2,421 | $ | 85 | $ | 6,000 | $ | 96,413 | |||||||||||||||
|
Year Ended December 31, 2011
|
|||||||||||||||||||||||||||||||
|
Beginning balance
|
$ | 13,426 | $ | 76,556 | $ | 31,830 | $ | 64,308 | $ | 3,155 | $ | 1,579 | $ | 2,000 | $ | 192,854 | |||||||||||||||
| Provision (credit) for loan | |||||||||||||||||||||||||||||||
|
and lease losses
|
(6,720 | ) | (23,073 | ) | 3,569 | (15,664 | ) | 214 | (1,016 | ) | 2,000 | (40,690 | ) | ||||||||||||||||||
| 6,706 | 53,483 | 35,399 | 48,644 | 3,369 | 563 | 4,000 | 152,164 | ||||||||||||||||||||||||
|
Charge-offs
|
2,401 | 31,371 | 4,347 | 1,298 | 2,116 | 10 | - | 41,543 | |||||||||||||||||||||||
|
Recoveries
|
1,805 | 6,518 | 1,684 | 383 | 1,082 | - | - | 11,472 | |||||||||||||||||||||||
|
Net charge-offs
|
596 | 24,853 | 2,663 | 915 | 1,034 | 10 | - | 30,071 | |||||||||||||||||||||||
|
Ending balance
|
$ | 6,110 | $ | 28,630 | $ | 32,736 | $ | 47,729 | $ | 2,335 | $ | 553 | $ | 4,000 | $ | 122,093 | |||||||||||||||
In accordance with GAAP, loans held for sale and other real estate assets are not included in our assessment of the Allowance.
Changes in the allowance for loan and lease losses for impaired loans (included in the above amounts) were as follows:
|
Year Ended December 31,
|
|||||||||||
|
2013
|
2012
|
2011
|
|||||||||
|
(Dollars in thousands)
|
|||||||||||
|
Balance, beginning of year
|
$ | 3,011 | $ | 772 | $ | 19,525 | |||||
|
Provision for loan and lease losses
|
- | 2,520 | 333 | ||||||||
|
Other changes
|
(2,662 | ) | (281 | ) | (19,086 | ) | |||||
|
Balance, end of year
|
$ | 349 | $ | 3,011 | $ | 772 | |||||
The amounts included in other changes above represent net charge-offs and net transfers of allocated allowances for loans and leases that were not classified as impaired for the entire year. At December 31, 2013 and 2012, all impaired loans were measured based on the fair value of the underlying collateral for collateral-dependent loans or at the loan’s observable market price.
In determining the amount of our Allowance, we rely on an analysis of our loan portfolio, our experience and our evaluation of general economic conditions, as well as regulatory requirements and input. If our assumptions prove to be incorrect, our current Allowance may not be sufficient to cover future loan losses and we may experience significant increases to our Provision.
90
|
7.
|
SECURITIZATIONS |
In prior years, we securitized certain residential mortgage loans with a U.S. Government sponsored entity and continue to service the residential mortgage loans. The servicing assets were recorded at their respective fair values which equaled par value at the time of securitization.
All unsold mortgage-backed securities from prior securitizations were categorized as available for sale securities and were therefore recorded at their fair value of $3.8 million and $6.3 million at December 31, 2013 and 2012, respectively. The fair values of these mortgage-backed securities were based on quoted prices of similar instruments in active markets. Unrealized gains of $0.2 million and $0.4 million on unsold mortgage-backed securities were recorded in AOCI at December 31, 2013 and 2012, respectively.
|
8.
|
PREMISES AND EQUIPMENT
|
Premises and equipment consisted of the following as of December 31, 2013 and 2012:
|
December 31,
|
||||||||
|
2013
|
2012
|
|||||||
|
(Dollars in thousands)
|
||||||||
|
Land
|
$ | 9,006 | $ | 9,006 | ||||
|
Office buildings and improvements
|
94,888 | 91,512 | ||||||
|
Furniture, fixtures and equipment
|
36,677 | 34,980 | ||||||
| 140,571 | 135,498 | |||||||
|
Accumulated depreciation and amortization
|
(91,532 | ) | (86,739 | ) | ||||
|
Net premises and equipment
|
$ | 49,039 | $ | 48,759 | ||||
Depreciation and amortization of premises and equipment were charged to the following operating expenses:
|
Year Ended December 31,
|
|||||||||||
|
2013
|
2012
|
2011
|
|||||||||
|
(Dollars in thousands)
|
|||||||||||
|
Net occupancy
|
$ | 3,702 | $ | 3,723 | $ | 3,641 | |||||
|
Equipment
|
2,305 | 2,628 | 3,083 | ||||||||
|
Total
|
$ | 6,007 | $ | 6,351 | $ | 6,724 | |||||
|
9.
|
OTHER INTANGIBLE ASSETS
|
Other intangible assets include a core deposit premium and mortgage servicing rights. The following table presents changes in other intangible assets for the periods presented:
.
|
Core
|
Mortgage
|
|||||||||||||||||||
|
Deposit
|
Servicing
|
Customer
|
Non-compete
|
|||||||||||||||||
|
Premium
|
Rights
|
Relationships
|
Agreements
|
Total
|
||||||||||||||||
|
(Dollars in thousands)
|
||||||||||||||||||||
|
Balance as of December 31, 2011
|
$ | 18,053 | $ | 22,933 | $ | 910 | $ | 90 | $ | 41,986 | ||||||||||
|
Additions
|
- | 5,692 | - | - | 5,692 | |||||||||||||||
|
Amortization
|
(2,675 | ) | (6,504 | ) | (58 | ) | (25 | ) | (9,262 | ) | ||||||||||
|
Impairment charges
|
- | - | (852 | ) | (65 | ) | (917 | ) | ||||||||||||
|
Balance as of December 31, 2012
|
$ | 15,378 | $ | 22,121 | $ | - | $ | - | $ | 37,499 | ||||||||||
|
Additions
|
- | 2,702 | - | - | 2,702 | |||||||||||||||
|
Amortization
|
(2,674 | ) | (4,744 | ) | - | - | (7,418 | ) | ||||||||||||
|
Balance as of December 31, 2013
|
$ | 12,704 | $ | 20,079 | $ | - | $ | - | $ | 32,783 | ||||||||||
91
During the second quarter of 2012, we evaluated the recoverability of the intangible assets related to our customer relationships and non-compete agreements, both of which related to the 2008 asset acquisition of Pacific Islands Financial Management. Upon completion of this review, we determined that the intangible assets related to our customer relationships and non-compete agreements, both of which are associated with our Banking Operations reporting unit, were both fully impaired, and thus, we recorded impairment charges to other operating expense of $852 thousand and $65 thousand, respectively.
The gross carrying value, accumulated amortization and net carrying value related to our other intangible assets are presented below:
|
December 31, 2013
|
December 31, 2012
|
|||||||||||||||||||||
|
Gross
|
Net
|
Gross
|
Net
|
|||||||||||||||||||
|
Carrying
|
Accumulated
|
Carrying
|
Carrying
|
Accumulated
|
Carrying
|
|||||||||||||||||
|
Value
|
Amortization
|
Value
|
Value
|
Amortization
|
Value
|
|||||||||||||||||
|
(Dollars in thousands)
|
||||||||||||||||||||||
|
Core deposit premium
|
$ | 44,642 | $ | (31,938 | ) | $ | 12,704 | $ | 44,642 | $ | (29,264 | ) | $ | 15,378 | ||||||||
|
Mortgage servicing rights
|
54,441 | (34,362 | ) | 20,079 | 51,739 | (29,618 | ) | 22,121 | ||||||||||||||
|
Customer relationships
|
- | - | - | 1,400 | (1,400 | ) | - | |||||||||||||||
|
Non-compete agreements
|
- | - | - | 300 | (300 | ) | - | |||||||||||||||
|
Total
|
$ | 99,083 | $ | (66,300 | ) | $ | 32,783 | $ | 98,081 | $ | (60,582 | ) | $ | 37,499 | ||||||||
Based on our other intangible assets held as of December 31, 2013, estimated amortization expense for the next five succeeding fiscal years and all years thereafter are as follows:
|
Estimated Amortization Expense
|
|||||||||||
| Core |
Mortgage
|
||||||||||
|
Deposit
|
Servicing
|
||||||||||
|
Premium
|
Rights
|
Total
|
|||||||||
|
(Dollars in thousands)
|
|||||||||||
|
2014
|
$ | 2,674 | $ | 2,452 | $ | 5,126 | |||||
|
2015
|
2,674 | 1,669 | 4,343 | ||||||||
|
2016
|
2,674 | 1,099 | 3,773 | ||||||||
|
2017
|
2,674 | 669 | 3,343 | ||||||||
|
2018
|
2,008 | 296 | 2,304 | ||||||||
|
Thereafter
|
- | 13,894 | 13,894 | ||||||||
|
Total
|
$ | 12,704 | $ | 20,079 | $ | 32,783 | |||||
At December 31, 2013, there were no events or changes in circumstances that would indicate that the assets assigned to our Banking Operations reporting unit, which includes the entire core deposit premium, were not recoverable.
We utilize the amortization method to measure our mortgage servicing rights. Under the amortization method, we amortize our mortgage servicing rights in proportion to and over the period of net servicing income. Income generated as the result of new mortgage servicing rights is reported as gains on sales of loans and totaled $2.7 million, $5.7 million, and $4.4 million in 2013, 2012 and 2011, respectively. Amortization of the servicing rights is reported as amortization of other intangible assets in our consolidated statements of income. Ancillary income is recorded in other income. Mortgage servicing rights are recorded when loans are sold to third-parties with servicing of those loans retained and we classify our entire mortgage servicing rights into one class.
Initial fair value of the servicing right is calculated by a discounted cash flow model prepared by a third party service provider based on market value assumptions at the time of origination and we assess the servicing right for impairment using current market value assumptions at each reporting period. Critical assumptions used in the discounted cash flow model include mortgage prepayment speeds, discount rates, costs to service and ancillary income. Variations in our assumptions could materially affect the estimated fair values. Changes to our assumptions are made when current trends and market data indicate that new trends have developed. Current market value assumptions based on loan product types (fixed rate, adjustable rate and balloon loans) include average discount rates and national prepayment speeds. Many of these assumptions are subjective and require a high level of management judgment. Our mortgage servicing rights portfolio and valuation assumptions are periodically reviewed by management.
92
Prepayment speeds may be affected by economic factors such as home price appreciation, market interest rates, the availability of other credit products to our borrowers and customer payment patterns. Prepayment speeds include the impact of all borrower prepayments, including full payoffs, additional principal payments and the impact of loans paid off due to foreclosure liquidations. As market interest rates decline, prepayment speeds will generally increase as customers refinance existing mortgages under more favorable interest rate terms. As prepayment speeds increase, anticipated cash flows will generally decline resulting in a potential reduction, or impairment, to the fair value of the capitalized mortgage servicing rights. Alternatively, an increase in market interest rates may cause a decrease in prepayment speeds and therefore an increase in fair value of mortgage servicing rights.
The following table presents the fair market value and key assumptions used in determining the fair market value of our mortgage servicing rights:
|
Year Ended December 31,
|
|||||||||
|
2013
|
2012
|
||||||||
|
(Dollars in thousands)
|
|||||||||
|
Fair market value, beginning of period
|
$ | 22,356 | $ | 23,149 | |||||
|
Fair market value, end of period
|
21,399 | 22,356 | |||||||
|
Weighted average discount rate
|
8.0 | % | 8.0 | % | |||||
|
Weighted average prepayment speed assumption
|
13.6 | 14.0 | |||||||
Fair values at December 31, 2013 and 2012 reflected approximately $2.4 billion and $2.7 billion in loans serviced for others, respectively.
|
10.
|
DERIVATIVES |
We utilize various designated and undesignated derivative financial instruments to reduce our exposure to movements in interest rates including interest rate swaps, interest rate lock commitments and forward sale commitments. We measure all derivatives at fair value on our consolidated balance sheet. At each reporting period, we record the derivative instruments in other assets or other liabilities depending on whether the derivatives are in an asset or liability position. For derivative instruments that are designated as hedging instruments, we record the effective portion of the changes in the fair value of the derivative in AOCI, net of tax, until earnings are affected by the variability of cash flows of the hedged transaction. We immediately recognize the portion of the gain or loss in the fair value of the derivative that represents hedge ineffectiveness in current period earnings. For derivative instruments that are not designated as hedging instruments, changes in the fair value of the derivative are included in current period earnings.
Interest Rate Lock and Forward Sale Commitments
We enter into interest rate lock commitments on certain mortgage loans that are intended to be sold. To manage interest rate risk on interest rate lock commitments, we also enter into forward loan sale commitments. The interest rate lock and forward loan sale commitments are accounted for as undesignated derivatives and are recorded at their respective fair values in other assets or other liabilities, with changes in fair value recorded in current period earnings. These instruments serve to reduce our exposure to movements in interest rates. At December 31, 2013, we were a party to interest rate lock and forward sale commitments on $37.1 million and $24.2 million of mortgage loans, respectively. At December 31, 2012, we were a party to interest rate lock and forward sale commitments on $67.1 million and $49.2 million of mortgage loans, respectively.
The following table presents the location of all assets and liabilities associated with our derivative instruments within the consolidated balance sheet:
|
Asset Derivatives
|
Liability Derivatives
|
|||||||||||||
|
Derivatives not designated
as hedging instruments
|
Balance Sheet
Location
|
Fair Value at
December 31, 2013
|
Fair Value at
December 31, 2012
|
Fair Value at
December 31, 2013
|
Fair Value at
December 31, 2012
|
|||||||||
|
(Dollars in thousands)
|
||||||||||||||
|
Interest rate contracts
|
Other assets /
|
|||||||||||||
|
other liabilities
|
$ | 425 | $ | 303 | $ | 146 | $ | 551 | ||||||
93
The following tables present the impact of derivative instruments and their location within the consolidated statements of income:
|
Derivatives in Cash Flow
Hedging Relationship
|
Amount of Gain (Loss) Reclassified
from
AOCI
into Earnings
(Effective Portion)
|
||
|
(Dollars in thousands)
|
|||
|
Year Ended December 31, 2013
|
|||
|
Interest rate contracts
|
$ | (394) | |
|
Year Ended December 31, 2012
|
|||
|
Interest rate contracts
|
$ | 434 | |
Amounts reclassified from AOCI into income are included in interest income in the consolidated statements of income. The ineffective portion has been recognized as other operating income in the consolidated statements of income.
|
Derivatives not in Cash Flow
Hedging Relationship
|
Location of Gain (Loss) Recognized
in Earnings on Derivatives
|
Amount of Gain (Loss) Recognized
in Earnings on Derivatives
|
|||
|
(Dollars in thousands)
|
|||||
|
Year Ended December 31, 2013
|
|||||
|
Interest rate contracts
|
Other operating income
|
$ | 336 | ||
|
Year Ended December 31, 2012
|
|||||
|
Interest rate contracts
|
Other operating income
|
$ | (350) | ||
|
11.
|
DEPOSITS |
Time deposits of $100,000 or more totaled $842.9 million and $674.1 million at December 31, 2013 and 2012, respectively.
Interest expense on certificates of deposits of $100,000 or more totaled $1.5 million, $1.8 million, and $3.2 million for the years ended December 31, 2013, 2012 and 2011, respectively.
Maturities of time deposits of $100,000 or more as of December 31, 2013 were as follows (in thousands):
|
Three months or less
|
$ | 399,818 | |
|
Over three through six months
|
268,780 | ||
|
Over six through twelve months
|
113,260 | ||
|
2015
|
34,795 | ||
|
2016
|
12,323 | ||
|
2017
|
7,405 | ||
|
2018
|
4,403 | ||
|
Thereafter
|
2,110 | ||
|
Total
|
$ | 842,894 |
At December 31, 2013 and 2012, overdrawn deposit accounts totaling $0.7 million and $0.8 million, respectively, have been reclassified as loans on the consolidated balance sheets.
|
12.
|
SHORT-TERM BORROWINGS
|
At December 31, 2013, short-term borrowings consist of short-term FHLB advances of $8.0 million and overdraft balances in due from bank accounts. At December 31, 2012, we had no short-term borrowings.
At December 31, 2013 and 2012, our bank had additional unused borrowings available at the Federal Reserve discount window of $46.5 million and $24.9 million, respectively. As of December 31, 2013 and 2012, certain commercial real estate and commercial loans with a carrying value totaling $79.7 million and $41.7 million, respectively, were pledged as collateral on our line of credit with the Federal Reserve discount window. The Federal Reserve does not have the right to sell or repledge these loans.
Interest expense on short-term borrowings were $6 thousand, nil, and $0.2 million in 2013, 2012 and 2011, respectively.
94
A summary of our short-term borrowings as of December 31, 2013, 2012 and 2011 is as follows:
|
Year Ended December 31,
|
|||||||||||
|
2013
|
2012
|
2011
|
|||||||||
|
(Dollars in thousands)
|
|||||||||||
|
Amount outstanding at December 31
|
$ | 8,015 | $ | - | $ | 34 | |||||
|
Average amount outstanding during year
|
1,988 | 11 | 35,809 | ||||||||
|
Highest month-end balance during year
|
28,000 | - | 201,962 | ||||||||
|
Weighted average interest rate on balances
|
|||||||||||
|
outstanding at December 31
|
0.23 | % | 0.00 | % | 0.00 | % | |||||
|
Weighted average interest rate during year
|
0.32 | 0.70 | 0.57 | ||||||||
|
13.
|
|
Long-term debt, which is based on original maturity, consisted of the following at December 31, 2013 and 2012:
|
December 31,
|
|||||||
|
2013
|
2012
|
||||||
|
(Dollars in thousands)
|
|||||||
|
FHLB advances
|
$ | 14 | $ | 32 | |||
|
Subordinated debentures
|
92,785 | 108,249 | |||||
| $ | 92,799 | $ | 108,281 | ||||
FHLB Advances
FHLB advances outstanding at December 31, 2013 and 2012 carried weighted average interest rates of 8.22%. The FHLB advance outstanding at December 31, 2013 was secured by unencumbered investment securities with a fair value of $50.8 million and certain real estate loans with a carrying value of $1.3 billion in accordance with the collateral provisions of the Advances, Security and Deposit Agreement with the FHLB. At December 31, 2013, our bank had additional unused FHLB advances available of approximately $934.2 million. Interest expense on FHLB advances were $2 thousand, $14 thousand, and $5.7 million in 2013, 2012 and 2011, respectively.
At December 31, 2013, there were no putable FHLB advances outstanding.
Subordinated Debentures
In March 2003, we created a wholly-owned statutory trust, CPB Capital Trust I (“Trust I”). Trust I issued $15.0 million in trust preferred securities. The Trust I trust preferred securities carried an interest rate of three-month LIBOR plus 3.25%, and matured on April 7, 2033. The principal assets of Trust I were $15.5 million of the Company’s subordinated debentures with an identical interest rate and maturity as the Trust I trust preferred securities. Trust I issued $0.5 million of common securities to the Company.
In June 2013, the Company was notified that $10.0 million of the $15.0 million in trust preferred securities of Trust I would be auctioned off as part of a larger pooled collateralized debt obligation liquidation. The Company placed a bid of $9.0 million for the securities which was accepted by the trustee and the transaction closed on June 18, 2013. Because our accepted bid of $9.0 million was less than the $10.0 million carrying value, we recognized a gain of $1.0 million related to this transaction on October 7, 2013, when these securities were called. The Company determined that its investment in Trust I did not represent a variable interest and therefore the Company was not the primary beneficiary of Trust I. As a result, consolidation of Trust I by the Company was not required. In October 2013, the Company purchased the remaining $5.0 million in trust preferred securities and these securities were also called by the Company on October 7, 2013. As of December 31, 2013, $0.5 million in common stock of Trust I is still outstanding.
In October 2003, we created two wholly-owned statutory trusts, CPB Capital Trust II (“Trust II”) and CPB Statutory Trust III (“Trust III”). Trust II issued $20.0 million in trust preferred securities bearing an interest rate of three-month LIBOR plus 2.85% and maturing on October 7, 2033. The principal assets of Trust II are $20.6 million of the Company’s subordinated debentures with an identical interest rate and maturity as the Trust II trust preferred securities. Trust II issued $0.6 million of common securities to the Company.
95
Trust III issued $20.0 million in trust preferred securities bearing an interest rate of three-month LIBOR plus 2.85% and maturing on December 17, 2033. The principal assets of Trust III are $20.6 million of the Company’s subordinated debentures with an identical interest rate and maturity as the Trust III trust preferred securities. Trust III issued $0.6 million of common securities to the Company.
In September 2004, we created a wholly-owned statutory trust, CPB Capital Trust IV (“Trust IV”). Trust IV issued $30.0 million in trust preferred securities bearing an interest rate of three-month LIBOR plus 2.45% and maturing on December 15, 2034. The principal assets of Trust IV are $30.9 million of the Company’s subordinated debentures with an identical interest rate and maturity as the Trust IV trust preferred securities. Trust IV issued $0.9 million of common securities to the Company.
In December 2004, we created a wholly-owned statutory trust, CPB Statutory Trust V (“Trust V”). Trust V issued $20.0 million in trust preferred securities bearing an interest rate of three-month LIBOR plus 1.87% and maturing on December 15, 2034. The principal assets of Trust V are $20.6 million of the Company’s subordinated debentures with an identical interest rate and maturity as the Trust V trust preferred securities. Trust V issued $0.6 million of common securities to the Company.
The trust preferred securities, the subordinated debentures that are the assets of Trusts I, II, III, IV and V and the common securities issued by Trusts I, II, III, IV and V are redeemable in whole or in part on any interest payment date on or after April 7, 2008 for Trust I, on or after October 7, 2008 for Trusts II and III, and on or after December 15, 2009 for Trust IV and V, or at any time in whole but not in part within 90 days following the occurrence of certain events. Our obligations with respect to the issuance of the trust preferred securities constitute a full and unconditional guarantee by the Company of each trust’s obligations with respect to its trust preferred securities. Subject to certain exceptions and limitations, we may elect from time to time to defer interest payments on the subordinated debentures, which would result in a deferral of distribution payments on the related trust preferred securities, for up to 20 consecutive quarterly periods without default or penalty.
On August 20, 2009, we began deferring regularly scheduled interest payments on our outstanding junior subordinated debentures relating to our trust preferred securities. The terms of the junior subordinated debentures and the trust documents allow us to defer payments of interest for up to 20 consecutive quarterly periods without default or penalty. In March 2013, the Company paid all deferred interest on its subordinated debentures and related dividend payments on its trust preferred securities and resumed quarterly payments for each outstanding trust. As a result, deferred accrued interest totaling $13.0 million was paid in full.
At December 31, 2013, future principal payments on long-term debt based on final maturity are as follows (in thousands):
|
Year ending December 31:
|
|||
|
2014
|
$ | 14 | |
|
2015
|
- | ||
|
2016
|
- | ||
|
2017
|
- | ||
|
2018
|
- | ||
|
Thereafter
|
92,785 | ||
|
Total
|
$ | 92,799 | |
|
14.
|
EQUITY
|
As further discussed in Note 1, we completed a number of significant transactions as part of our recapitalization, including:
|
·
|
On February 2, 2011, we effected the Reverse Stock Split.
|
|
·
|
On February 18, 2011, we
completed the Private Placement with investments from (1) affiliates of each of The Carlyle Group (“Carlyle”) and Anchorage Capital Group, L.L.C. (together with Carlyle, the “Lead Investors”) pursuant to investment agreements with each of the Lead Investors and (2) various other investors, including certain of our directors and officers, pursuant to subscription agreements with each of such investors.
|
|
·
|
Concurrently with the closing of the Private Placement, we completed the TARP Exchange whereby 135,000 shares of our TARP Preferred Stock, no par value per share and liquidation preference $1,000 per share, held by the Treasury, and accrued and unpaid dividends thereon were exchanged for 5,620,117 common shares. We also amended the warrant held by the Treasury (the “Amended TARP Warrant”) to, among other things, reduce the exercise price from $255.40 per share to $10 per share. The warrant grants the Treasury the right to purchase up to 79,288 common shares, subject to adjustment.
|
|
·
|
On May 6, 2011, we completed the Rights Offering which allowed shareholders of record as of the close of business on February 17, 2011 or their transferees to purchase newly issued common shares at $10 per share.
|
96
The TARP Exchange resulted in a non-cash increase in net income available to common shareholders of $85.1 million as the book value of the preferred stock plus accrued and unpaid dividends was greater than the estimated fair value of the common stock issued to the Treasury of $56.2 million and the fair value of the Amended TARP Warrant at the time of the TARP Exchange. This accounting treatment had no effect on our total shareholders’ equity or our regulatory capital position.
In addition to adjusting the exercise price of the Amended TARP Warrant, its terms were revised to include a “down-round” provision allowing for the future adjustment to the exercise price for any subsequent issuances of common stock by the Company. Subject to certain exceptions, if the Company subsequently issues common stock, or rights or shares convertible into common stock, at a per share price lower than the $10 exercise price of the warrant, the exercise price of the warrant will be reduced to the per share common stock amount received in connection with the issuance and the number of shares of common stock subject to the warrant will be increased. This provision resulted in the warrant being carried as a derivative liability as compared to a common stock equivalent for balance sheet purposes as it possesses the characteristics of a freestanding derivative financial instrument as defined by Accounting Standards Codification ("ASC") 815-10-15-83,
Accounting for Derivatives and Hedging,
and similar to the example illustrated in ASC 815-40-55-33 and -34. As a derivative liability, the warrant was carried at fair value, with subsequent remeasurements recorded through the current period's earnings. The initial value attributed to the warrant was $1.7 million, with the fair value estimated using the Black-Scholes options pricing model, with the following assumptions: 67% volatility, a risk-free rate of 3.59%, a yield of 1.45% and an estimated life of 10 years. From February 18, 2011 through December 31, 2012, this instrument’s estimated fair value decreased, which resulted in the recognition of $1.0 million recorded in other noninterest income during the year ended December 31, 2011, and a $0.1 million charge to other noninterest expense in 2012.
In June 2013, the Treasury held a private auction to sell its warrant positions in several financial institutions which included the Company’s warrant to purchase up to 79,288 shares of our common shares at a purchase price of $10 per share. On June 6, 2013, we were notified that we were the winning bidder of the warrant at our bid of $752 thousand. The warrant was being carried as a derivative liability on our balance sheet at $819 thousand at December 31, 2012. Accordingly, we recorded a credit to other noninterest expense of $67 thousand in 2013 related to the gain on the purchase of the warrant.
On June 22, 2011, the Treasury completed a public underwritten offering of 2,850,000 shares of our common stock it received in the TARP Exchange. On April 4, 2012, the Treasury completed another public underwritten offering of its remaining 2,770,117 shares of our common stock it received in the TARP Exchange. The Company did not receive any proceeds from either of these offerings. After the completion of these transactions and the aforementioned repurchase of our warrant, the Treasury no longer holds any outstanding shares of our common stock, or any warrants to purchase our common stock they received in connection with our participation in the TARP.
We have generated considerable tax benefits, including net operating loss carry-forwards and federal and state tax credits. Our use of the tax benefits in the future would be significantly limited if we experience an “ownership change” for U.S. federal income tax purposes. In general, an “ownership change” will occur if there is a cumulative increase in the Company’s ownership by “5-percent shareholders” (as defined under U.S. income tax laws) that exceeds 50 percentage points over a rolling three-year period.
On November 23, 2010, our board declared a dividend of preferred share purchase rights (“Rights”) in respect to our common stock which were issued pursuant to a Tax Benefits Preservation Plan, dated as of November 23, 2010 (the “Tax Benefits Preservation Plan”), between the Company and Wells Fargo Bank, National Association, as rights agent. Each Right represents the right to purchase, upon the terms and subject to the conditions in the Plan, 1/10,000th of a share of our Junior Participating Preferred Stock, Series C, no par value, for $6.00, subject to adjustment. The Tax Benefits Preservation Plan is designed to reduce the likelihood that the Company will experience an ownership change by discouraging any person from becoming a beneficial owner of 4.99% or more of our common stock (a “Threshold Holder”). Adoption of the Tax Benefits Preservation Plan was required by our agreements with the Lead Investors. On January 29, 2014, our Board of Directors approved an amendment to the Tax Benefits Preservation Plan to extend it for up to an additional two years.
To further protect our tax benefits, on January 26, 2011, our Board approved an amendment to our restated articles of incorporation to restrict transfers of our stock if the effect of an attempted transfer would cause the transferee to become a Threshold Holder or to cause the beneficial ownership of a Threshold Holder to increase (the “Protective Charter Amendment”). At our annual meeting of shareholders on April 27, 2011, we proposed the amendment which shareholders approved. On January 29, 2014, our Board of Directors approved an amendment to the Protective Charter Amendment to extend it for up to an additional two years subject to approval by our shareholders. There is no guarantee, however, that the Tax Benefits Preservation Plan or the Protective Charter Amendment will prevent the Company from experiencing an ownership change.
97
In 2009, our Board of Directors suspended the payment of all cash dividends on our common stock. Our ability to pay dividends with respect to common stock was restricted until our obligations under our trust preferred securities were brought current. Additionally, our ability to pay dividends depends on our ability to obtain dividends from our bank. As a Hawaii state-chartered bank, Central Pacific Bank may only pay dividends to the extent it has retained earnings as defined under Hawaii banking law (“Statutory Retained Earnings”), which differs from GAAP retained earnings. As of December 31, 2013, the bank had Statutory Retained Earnings of $240.4 million. In 2013, in light of the Company's improved capital position and financial condition, our Board of Directors and management, in consultation with our regulators, reinstated and declared quarterly cash dividends of $0.08 per share on the Company’s outstanding common shares, payable to shareholders of record at the close of business on August 30, 2013 and November 29, 2013. These dividends were paid on September 16, 2013 and December 16, 2013, respectively. CPF had sufficient cash on hand to fund these dividends, thus the bank did not pay a dividend to CPF. In January 2014, the Company’s Board of Directors declared a third consecutive quarterly cash dividend of $0.08 per share on the Company’s outstanding common shares, payable on March 17, 2014 to shareholders of record at the close of business on February 28, 2014.
Dividends are payable at the discretion of the Board of Directors and there can be no assurance that the Board of Directors will continue to pay dividends at the same rate, or at all, in the future. Our ability to pay cash dividends to our shareholders is subject to restrictions under federal and Hawaii law, including restrictions imposed by the FRB and covenants set forth in various agreements we are a party to, including covenants set forth in our subordinated debentures.
In January 2008, our Board of Directors authorized the repurchase and retirement of up to 60,000 shares of the Company’s common stock (the “2008 Repurchase Plan”). Repurchases under the 2008 Repurchase Plan may be made from time to time on the open market or in privately negotiated transactions. There were no repurchases of common stock during 2013. A total of 55,000 shares remained available for repurchase under the 2008 Repurchase Plan at December 31, 2013. In January 2014, the 2008 Repurchase Plan and the remaining 55,000 shares were superseded by a tender offer and repurchase agreements with our Lead Investors. See Note 28 for details of these transactions.
|
15.
|
SHARE-BASED COMPENSATION
|
In accordance with ASC 718, compensation expense is recognized only for those shares expected to vest, based on the Company’s historical experience and future expectations. The following table summarizes the effects of share-based compensation to options and awards granted under the Company’s equity incentive plans for each of the periods presented:
|
Year Ended December 31,
|
|||||||||||
|
2013
|
2012
|
2011
|
|||||||||
|
(Dollars in thousands)
|
|||||||||||
|
Salaries and employee benefits
|
$ | 6,367 | $ | 4,432 | $ | 2,409 | |||||
|
Directors stock awards
|
45 | 90 | 153 | ||||||||
|
Legal and professional services
|
- | 59 | 55 | ||||||||
|
Income tax benefit
|
(2,570 | ) | - | - | |||||||
|
Net share-based compensation effect
|
$ | 3,842 | $ | 4,581 | $ | 2,617 | |||||
Equity Incentive Plans
We have adopted equity incentive plans for the purpose of granting options, restricted stock and other equity based awards for the Company’s common stock to directors, officers and other key individuals. Option awards are generally granted with an exercise price equal to the market price of the Company’s common stock at the date of grant; those option awards generally vest based on three or five years of continuous service and have 10-year contractual terms. Certain option and share awards provide for accelerated vesting if there is a change in control (as defined in the stock option plans below). We have historically issued new shares of common stock upon exercises of stock options and purchases of restricted awards.
In February 1997, we adopted the 1997 Stock Option Plan (“1997 Plan”) basically as a continuance of the 1986 Stock Option Plan. In April 1997, our shareholders approved the 1997 Plan, which provided 2,000,000 shares of the Company’s common stock for grants to employees as qualified incentive stock options and to directors as nonqualified stock options. On January 1, 2013, the last options issued under the 1997 Plan expired.
98
In September 2004, we adopted and our shareholders approved the 2004 Stock Compensation Plan (“2004 Plan”) making available 1,500,000 shares for grants to employees and directors. Upon adoption of the 2004 Plan, all unissued shares from the 1997 Plan were frozen and no new options were granted under the 1997 Plan. In May 2007, the 2004 Plan was amended to increase the number of shares available for grant by an additional 1,000,000 shares. In April 2011, the 2004 Plan was amended to increase the number of shares authorized from 1,402,589 to 4,944,831.
In April 2013, we adopted and our shareholders approved the 2013 Stock Compensation Plan (“2013 Plan”) making available 2,200,000 shares for grants to employees and directors. Upon adoption of the 2013 Plan, all unissued shares from the 2004 Plan were frozen and no new grants will be granted under the 2004 Plan. Shares may continue to be settled under the 1997 and 2004 Plans pursuant to previously outstanding awards. To satisfy share issuances pursuant to the equity incentive plans, we issue new shares from the 2013 Plan.
At December 31, 2013, 2012 and 2011, a total of 2,185,454, 1,604,198, and 2,539,341 shares, respectively, were available for future grants.
The fair value of each option award is estimated on the date of grant based on the following:
Valuation and amortization method—
We estimate the fair value of stock options granted using the Black-Scholes option pricing formula and a single option award approach. We use historical data to estimate option exercise and employee termination activity within the valuation model; separate groups of employees that have similar historical exercise behavior are considered separately for valuation purposes. This fair value is then amortized on a straight-line basis over the requisite service periods of the awards, which is generally the vesting period.
Expected life—
The expected life of options represents the period of time that options granted are expected to be outstanding.
Expected volatility—
Expected volatilities are based on the historical volatility of the Company’s common stock.
Risk-free interest rate—
The risk-free interest rate for periods within the contractual life of the option is based on the Treasury yield curve in effect at the time of grant.
Expected dividend—
The
expected dividend assumption is based on our current expectations about its anticipated dividend policy.
Stock Option Activity
The fair value of the Company’s stock options granted to employees was estimated using the following weighted-average assumptions:
|
Year Ended
December 31, 2012
|
|||
|
Expected volatility
|
77.2 | % | |
|
Risk free interest rate
|
1.8 | ||
|
Expected dividends
|
1.0 | ||
|
Expected life (in years)
|
8.0 | ||
|
Weighted average fair value
|
$ | 9.65 | |
No stock options were granted during 2013 and 2011.
99
The following is a summary of option activity for our stock option plans for the year ended December 31, 2013:
|
Weighted Average
|
Aggregate
|
|||||||||||
|
Weighted
|
Remaining
|
Intrinsic
|
||||||||||
|
Average
|
Contractual Term
|
Value
|
||||||||||
|
Shares
|
Exercise Price
|
(in years)
|
(in thousands)
|
|||||||||
|
Outstanding at January 1, 2013
|
315,369 | $ | 62.77 | |||||||||
|
Changes during the year:
|
||||||||||||
|
Exercised
|
(5,186 | ) | 14.31 | |||||||||
|
Expired
|
(7,024 | ) | 539.38 | |||||||||
|
Forfeited
|
(511 | ) | 508.11 | |||||||||
|
Outstanding at December 31, 2013
|
302,648 | 51.79 | 7.9 | $ | 1,598 | |||||||
|
Vested and expected to vest at
|
||||||||||||
|
December 31, 2013
|
302,648 | 51.79 | 7.9 | 1,598 | ||||||||
|
Exercisable at December 31, 2013
|
91,241 | 138.56 | 6.8 | 384 | ||||||||
The aggregate intrinsic value is calculated as the difference between the exercise price of the underlying option awards and the quoted price of the Company’s common stock for the options that were in-the-money at December 31, 2013. During the year ended December 31, 2013, the aggregate intrinsic value of options exercised under our stock option plan was $22 thousand, determined as of the date of exercise. During the years ended December 31, 2012 and 2011, no stock options were exercised.
As of December 31, 2013, the total compensation cost that was not yet recognized related to stock options granted to employees under our stock option plans was approximately $1.6 million, net of estimated forfeitures. This cost will be amortized on a straight-line basis over a weighted-average period of 3.2 years and will be adjusted for subsequent changes in estimated forfeitures. The total fair value of shares vested during the years ended December 31, 2013, 2012 and 2011 was $0.7 million, $14 thousand, and $17 thousand, respectively.
Restricted Stock Awards and Units
Under the 1997, 2004 and 2013 Plans, we awarded restricted stock awards and units to our non-officer directors and certain senior management personnel. The awards typically vest over a three or five year period. Compensation expense is measured as the market price of the stock awards on the grant date, and is recognized over the specified vesting periods.
The table below presents the activity of restricted stock awards and units for the year ended December 31, 2013:
|
Weighted Average
|
|||||
|
Grant Date
|
|||||
|
Shares
|
Fair Value
|
||||
|
Nonvested at January 1, 2013
|
1,098,806 | $ | 14.61 | ||
|
Changes during the year:
|
|||||
|
Granted
|
142,347 | 15.56 | |||
|
Forfeited
|
(103,329 | ) | 14.68 | ||
|
Vested
|
(301,920 | ) | 14.65 | ||
|
Nonvested at December 31, 2013
|
835,904 | 14.75 | |||
|
Vested and expected to vest at December 31, 2013
|
835,904 | 14.75 | |||
As of December 31, 2013, there was $8.4 million of total unrecognized compensation cost related to restricted stock awards and units that is expected to be recognized over a weighted-average period of 2.5 years.
100
|
16.
|
PENSION PLANS
|
Defined Benefit Retirement Plan
The bank has a defined benefit retirement plan that covered substantially all of its employees who were employed during the period that the plan was in effect. The plan was initially curtailed in 1986, and accordingly, plan benefits were fixed as of that date. Effective January 1, 1991, the bank reactivated its defined benefit retirement plan. As a result of the reactivation, employees for whom benefits were fixed in 1986 began to accrue additional benefits under a new formula that became effective January 1, 1991. Employees who were not participants at curtailment, but who were subsequently eligible to join, became participants effective January 1, 1991. Under the reactivated plan, benefits are based upon the employees’ years of service and their highest average annual salaries in a 60-consecutive-month period of service, reduced by benefits provided from the bank’s terminated money purchase pension plan. The reactivation of the defined benefit retirement plan resulted in an increase of $5.9 million in the unrecognized prior service cost, which was amortized over a period of 13 years. Effective December 31, 2002, the bank curtailed its defined benefit retirement plan, and accordingly, plan benefits were fixed as of that date.
The following tables set forth information pertaining to the defined benefit retirement plan:
|
2013
|
2012
|
||||||
|
(Dollars in thousands)
|
|||||||
|
Change in benefit obligation
|
|||||||
|
Benefit obligation at beginning of year
|
$ | 36,139 | $ | 34,091 | |||
|
Interest cost
|
1,370 | 1,585 | |||||
|
Actuarial (gains) losses
|
(2,969 | ) | 2,923 | ||||
|
Benefits paid
|
(2,357 | ) | (2,460 | ) | |||
|
Benefit obligation at end of the year
|
32,183 | 36,139 | |||||
|
Change in plan assets
|
|||||||
|
Fair value of plan assets at beginning of year
|
23,780 | 22,559 | |||||
|
Actual return on plan assets
|
4,712 | 2,235 | |||||
|
Employer contributions
|
1,647 | 1,446 | |||||
|
Benefits paid
|
(2,357 | ) | (2,460 | ) | |||
|
Fair value of plan assets at end of year
|
27,782 | 23,780 | |||||
|
Funded status at end of year
|
$ | (4,401 | ) | $ | (12,359 | ) | |
|
Amounts recognized in AOCI
|
|||||||
|
Net actuarial losses
|
$ | (10,895 | ) | $ | (19,205 | ) | |
|
Benefit obligation actuarial assumptions
|
|||||||
|
Weighted average discount rate
|
4.7% | 4.0% | |||||
|
2013
|
2012
|
2011
|
|||||||||
|
(Dollars in thousands)
|
|||||||||||
|
Components of net periodic benefit cost
|
|||||||||||
|
Interest cost
|
$ | 1,370 | $ | 1,585 | $ | 1,668 | |||||
|
Expected return on plan assets
|
(1,762 | ) | (1,791 | ) | (1,821 | ) | |||||
|
Amortization of net actuarial losses
|
2,390 | 2,385 | 2,263 | ||||||||
|
Net periodic benefit cost
|
$ | 1,998 | $ | 2,179 | $ | 2,110 | |||||
|
Net periodic cost actuarial assumptions
|
|||||||||||
|
Weighted average discount rate
|
4.0% | 4.8% | 5.1% | ||||||||
|
Expected long-term rate of return on plan assets
|
7.5% | 8.0% | 8.0% | ||||||||
The unrecognized net actuarial losses included in AOCI expected to be recognized in net periodic benefit cost during 2014 is approximately $1.2 million.
The long-term rate of return on plan assets reflects the weighted-average long-term rates of return for the various categories of investments held in the plan. The expected long-term rate of return is adjusted when there are fundamental changes in expected returns on the plan investments.
101
The defined benefit retirement plan assets consist primarily of equity and debt securities. Our asset allocations by asset category were as follows:
|
December 31,
|
|||||
|
2013
|
2012
|
||||
|
Equity securities
|
59.9 | % | 64.7 | % | |
|
Debt securities
|
34.6 | 32.6 | |||
|
Other
|
5.5 | 2.7 | |||
|
Total
|
100.0 | % | 100.0 | % | |
Equity securities included the Company’s common stock in the amounts of $76 thousand and $59 thousand at December 31, 2013 and 2012, respectively.
Our investment strategy for the defined benefit retirement plan is to maximize the long-term rate of return on plan assets while maintaining an acceptable level of risk. The investment policy establishes a target allocation for each asset class that is reviewed periodically and rebalanced when considered appropriate.
The fair values of the defined benefit retirement plan as of December 31, 2013 and 2012 by asset category were as follows:
|
Level 1
|
Level 2
|
Level 3
|
Total
|
|||||||||||
|
(Dollars in thousands)
|
||||||||||||||
|
December 31, 2013
|
||||||||||||||
|
Money market accounts
|
$ | 1,841 | $ | - | $ | - | $ | 1,841 | ||||||
|
Mutual funds
|
9,795 | - | - | 9,795 | ||||||||||
|
Government obligations
|
- | 3,450 | - | 3,450 | ||||||||||
|
Common stocks
|
8,744 | - | - | 8,744 | ||||||||||
|
Preferred stocks
|
255 | - | - | 255 | ||||||||||
|
Corporate bonds and debentures
|
- | 3,697 | - | 3,697 | ||||||||||
| $ | 20,635 | $ | 7,147 | $ | - | $ | 27,782 | |||||||
|
December 31, 2012
|
||||||||||||||
|
Money market accounts
|
$ | 1,022 | $ | - | $ | - | $ | 1,022 | ||||||
|
Mutual funds
|
9,524 | - | - | 9,524 | ||||||||||
|
Government obligations
|
- | 3,317 | - | 3,317 | ||||||||||
|
Common stocks
|
6,213 | - | - | 6,213 | ||||||||||
|
Preferred stocks
|
279 | - | - | 279 | ||||||||||
|
Corporate bonds and debentures
|
- | 3,425 | - | 3,425 | ||||||||||
| $ | 17,038 | $ | 6,742 | $ | - | $ | 23,780 | |||||||
We expect to contribute approximately $1.8 million to our defined benefit retirement plan in 2014.
Estimated future benefit payments are as follows (in thousands):
|
Year ending December 31:
|
||
|
2014
|
$ | 2,427 |
|
2015
|
2,413 | |
|
2016
|
2,432 | |
|
2017
|
2,411 | |
|
2018
|
2,401 | |
| 2019-2023 | 11,393 | |
|
Total
|
$ | 23,477 |
102
Supplemental Executive Retirement Plans
In 1995, 2001, 2004 and 2006, our bank established Supplemental Executive Retirement Plans (“SERP”) that provide certain officers of the Company with supplemental retirement benefits. On December 31, 2002, the 1995 and 2001 SERP were curtailed. In conjunction with the merger with CB Bancshares, Inc. (“CBBI”), we assumed CBBI’s SERP obligation.
The following tables set forth information pertaining to the SERP:
|
2013
|
2012
|
|||||||
|
(Dollars in thousands)
|
||||||||
|
Change in benefit obligation
|
||||||||
|
Benefit obligation at beginning of year
|
$ | 9,944 | $ | 8,558 | ||||
|
Interest cost
|
411 | 426 | ||||||
|
Actuarial (gains) losses
|
(1,033 | ) | 1,175 | |||||
|
Benefits paid
|
(215 | ) | (215 | ) | ||||
|
Benefit obligation at end of year
|
9,107 | 9,944 | ||||||
|
Change in plan assets
|
||||||||
|
Fair value of plan assets at beginning of year
|
- | - | ||||||
|
Employer contributions
|
215 | 215 | ||||||
|
Benefits paid
|
(215 | ) | (215 | ) | ||||
|
Fair value of plan assets at end of year
|
- | - | ||||||
|
Funded status at end of year
|
$ | (9,107 | ) | $ | (9,944 | ) | ||
|
Amounts recognized in AOCI
|
||||||||
|
Net transition obligation
|
$ | (164 | ) | $ | (181 | ) | ||
|
Prior service cost
|
(119 | ) | (137 | ) | ||||
|
Net actuarial losses
|
(379 | ) | (1,482 | ) | ||||
|
Total amounts recognized in AOCI
|
$ | (662 | ) | $ | (1,800 | ) | ||
|
Benefit obligation actuarial assumptions
|
||||||||
|
Weighted average discount rate
|
5.0% | 4.2% | ||||||
|
2013
|
2012
|
2011
|
||||||||||
|
(Dollars in thousands)
|
||||||||||||
|
Components of net periodic benefit cost
|
||||||||||||
|
Interest cost
|
$ | 411 | $ | 426 | $ | 412 | ||||||
|
Amortization of net transition obligation
|
17 | 17 | 17 | |||||||||
|
Amortization of prior service cost
|
18 | 18 | 18 | |||||||||
|
Amortization of net actuarial (gains) losses
|
71 | (4 | ) | (17 | ) | |||||||
|
Net periodic benefit cost
|
$ | 517 | $ | 457 | $ | 430 | ||||||
|
Net periodic cost actuarial assumptions
|
||||||||||||
|
Weighted average discount rate
|
4.2% | 5.0% | 5.0% | |||||||||
The estimated amortization of components included in AOCI that will be recognized into net periodic cost for 2014 is as follows (in thousands):
|
Amortization of net transition obligation
|
$ | 17 | |
|
Amortization of prior service cost
|
18 | ||
|
Amortization of net actuarial losses
|
2 |
The SERP holds no plan assets other than employer contributions that are paid as benefits during the year. We expect to contribute $0.2 million to the SERP in 2014.
103
Estimated future benefit payments reflecting expected future service for the SERP are as follows (in thousands):
|
Year ending December 31:
|
||
|
2014
|
$ | 215 |
|
2015
|
211 | |
|
2016
|
225 | |
|
2017
|
415 | |
|
2018
|
411 | |
| 2019-2023 | 2,425 | |
|
Total
|
$ | 3,902 |
|
17.
|
401(K) RETIREMENT SAVINGS PLAN
|
We maintain a 401(k) Retirement Savings Plan (“Retirement Savings Plan”) that covers substantially all employees of the Company. The Retirement Savings Plan allows employees to direct their own investments among a selection of investment alternatives and is funded by employee elective deferrals, employer matching contributions and employer profit sharing contributions.
We match 100% of an employee’s elective deferrals, up to 4% of the employee’s pay each pay period. Our employer matching contributions to the Retirement Savings Plan totaled $1.7 million, $1.6 million, and $1.4 million in 2013, 2012 and 2011, respectively.
We also have the option of making discretionary profit sharing contributions into the Retirement Savings Plan. Our Board of Directors has sole discretion in determining the annual profit sharing contribution, subject to limitations of the Internal Revenue Code. We did not make any profit sharing contributions in 2013, 2012 and 2011.
|
18.
|
OPERATING LEASES
|
We lease certain properties and equipment with lease terms expiring through 2038. In most instances, the property leases provide for the renegotiation of rental terms at fixed intervals, and generally contain renewal options for periods ranging from five to 15 years.
Net rent expense for all operating leases for the years ended December 31, 2013, 2012 and 2011 is summarized as follows:
|
Year Ended December 31,
|
|||||||||||
|
2013
|
2012
|
2011
|
|||||||||
|
(Dollars in thousands)
|
|||||||||||
|
Rent expense charged to net occupancy
|
$ | 9,840 | $ | 10,053 | $ | 10,286 | |||||
|
Less sublease income
|
(52 | ) | (25 | ) | (74 | ) | |||||
|
Net rent expense charged to net occupancy
|
9,788 | 10,028 | 10,212 | ||||||||
|
Rent expense charged to equipment expense
|
93 | 104 | 162 | ||||||||
|
Total net rent expense
|
$ | 9,881 | $ | 10,132 | $ | 10,374 | |||||
The following is a schedule of future minimum rental commitments for all noncancellable operating leases that had initial lease terms in excess of one year at December 31, 2013 (in thousands):
|
Year ending December 31:
|
|||
|
2014
|
$ | 7,847 | |
|
2015
|
6,626 | ||
|
2016
|
5,901 | ||
|
2017
|
4,943 | ||
|
2018
|
3,621 | ||
|
Thereafter
|
23,664 | ||
|
Total
|
$ | 52,602 | |
104
In addition, the Company, as lessor, leases certain properties that it owns. The following is a schedule of future minimum rental income for those noncancellable operating leases that had initial lease terms in excess of one year at December 31, 2013 (in thousands):
|
Year ending December 31:
|
|||
|
2014
|
$ | 3,045 | |
|
2015
|
2,331 | ||
|
2016
|
1,340 | ||
|
2017
|
795 | ||
|
2018
|
225 | ||
|
Thereafter
|
50 | ||
|
Total
|
$ | 7,786 | |
In instances where the lease calls for a renegotiation of rental payments, the lease rental payment in effect prior to renegotiation was used throughout the remaining lease term.
|
19.
|
INCOME AND FRANCHISE TAXES
|
Components of income tax benefit for the years ended December 31, 2013, 2012 and 2011 were as follows:
|
Current
|
Deferred
|
Total
|
|||||||||
|
(Dollars in thousands)
|
|||||||||||
|
Year ended December 31, 2013
|
|||||||||||
|
Federal
|
$ | - | $ | (81,613 | ) | $ | (81,613 | ) | |||
|
State
|
109 | (30,743 | ) | (30,634 | ) | ||||||
|
Total
|
$ | 109 | $ | (112,356 | ) | $ | (112,247 | ) | |||
|
Year ended December 31, 2012
|
|||||||||||
|
Federal
|
$ | - | $ | - | $ | - | |||||
|
State
|
- | - | - | ||||||||
|
Total
|
$ | - | $ | - | $ | - | |||||
|
Year ended December 31, 2011
|
|||||||||||
|
Federal
|
$ | - | $ | - | $ | - | |||||
|
State
|
- | - | - | ||||||||
|
Total
|
$ | - | $ | - | $ | - | |||||
Income tax expense for the periods presented differed from the “expected” tax expense (computed by applying the U.S. Federal corporate tax rate of 35% to income (loss) before income taxes) for the following reasons:
|
Year Ended December 31,
|
|||||||||||
|
2013
|
2012
|
2011
|
|||||||||
|
(Dollars in thousands)
|
|||||||||||
|
Computed "expected" tax expense (benefit)
|
$ | 20,940 | $ | 16,598 | $ | 12,802 | |||||
|
Increase (decrease) in taxes resulting from:
|
|||||||||||
|
Tax-exempt interest
|
(1,431 | ) | (820 | ) | (273 | ) | |||||
|
Other tax-exempt income
|
(810 | ) | (976 | ) | (1,441 | ) | |||||
|
Low-income housing and energy tax credits
|
(1,557 | ) | (1,607 | ) | (1,678 | ) | |||||
|
State income taxes, net of Federal income tax effect,
|
|||||||||||
|
excluding impact of deferred tax valuation allowance
|
2,389 | 2,540 | 546 | ||||||||
|
Change in the beginning-of-the-year balance of the
|
|||||||||||
|
valuation allowance for deferred tax assets
|
|||||||||||
|
allocated to income tax expense
|
(132,061 | ) | (15,862 | ) | (9,870 | ) | |||||
|
Other
|
283 | 127 | (86 | ) | |||||||
|
Total
|
$ | (112,247 | ) | $ | - | $ | - | ||||
At December 31, 2013, current Federal income taxes receivable was $0.1 million, compared to a $9 thousand payable at December 31, 2012. Current state income taxes receivable was $1.8 million at December 31, 2013 and 2012.
105
The tax effects of temporary differences that gave rise to significant portions of the deferred tax assets and deferred tax liabilities were as follows:
|
December 31,
|
||||||
|
2013
|
2012
|
|||||
|
(Dollars in thousands)
|
||||||
|
Deferred tax assets
|
||||||
|
Allowance for loan and lease losses
|
$ | 28,926 | $ | 33,418 | ||
|
Accrued expenses
|
2,950 | 2,744 | ||||
|
Employee retirement benefits
|
8,762 | 15,773 | ||||
|
Federal and state tax credit carryforwards
|
37,449 | 35,305 | ||||
|
Investment write-downs and write-offs
|
3,051 | 3,051 | ||||
|
Interest on nonaccrual loans
|
1,962 | 4,047 | ||||
|
Federal and state net operating loss carryforwards
|
87,757 | 86,339 | ||||
|
Other
|
15,486 | 26,289 | ||||
|
Total deferred tax assets
|
$ | 186,343 | $ | 206,966 | ||
|
Deferred tax liabilities
|
||||||
|
Intangible assets
|
$ | 13,117 | $ | 14,962 | ||
|
FHLB stock dividends received
|
11,848 | 12,345 | ||||
|
Net unrealized gain on derivatives recognized through AOCI
|
- | 1,786 | ||||
|
Leases
|
2,755 | 3,599 | ||||
|
Deferred gain on curtailed retirement plan
|
3,339 | 3,339 | ||||
|
Liability on utilization of state tax credits
|
7,722 | 7,475 | ||||
|
Other
|
3,614 | 15,961 | ||||
|
Total deferred tax liabilities
|
$ | 42,395 | $ | 59,467 | ||
|
Deferred tax valuation allowance
|
$ | 6,700 | $ | 147,499 | ||
|
Net deferred tax assets
|
$ | 137,248 | $ | - | ||
The valuation allowance for deferred tax assets as of December 31, 2013 and 2012 was $6.7 million and $147.5 million, respectively. The net change in the total valuation allowance was a decrease of $140.8 million and $14.8 million in 2013 and 2012, respectively. Of the total decrease in the valuation allowance in 2013, $132.1 million was recognized as income tax benefit and $8.7 million was
a benefit to
AOCI, compared to $15.9 million recognized as income tax benefit and a $1.1 million charged against AOCI in 2012.
In assessing the realizability of deferred tax assets, management considers whether it is more likely than not that some portion or all of the deferred tax assets will not be realized. The ultimate realization of deferred tax assets is dependent upon the generation of future taxable income during the periods in which those temporary differences become deductible. Management considers the reversal of deferred tax liabilities (including the impact of available carryback and carryforward periods), projected future taxable income and tax-planning strategies in making this assessment.
In the first quarter of 2013, the Company reversed a significant portion of the valuation allowance that was established against our net DTA during the third quarter of 2009. The valuation allowance was established during 2009 due to uncertainty at the time regarding our ability to generate sufficient future taxable income to fully realize the benefit of our net DTA. The quarter ended March 31, 2013 marked our ninth consecutive quarter of profitability. Based on this earnings performance trend, improvements in our financial condition, asset quality and capital ratios, and the expectation of continued profitability, the Company determined that it was more likely than not that a significant portion of our net DTA would be realized. The net impact of reversing the valuation allowance and recording the provision for income tax expense was a net income tax benefit of $119.8 million in the first quarter of 2013.
At December 31, 2013, the Company had net operating loss carryforwards for Federal income tax purposes of $206.5 million, which are available to offset future Federal taxable income, if any, through 2030. At December 31, 2013, the Company had net operating loss carryforwards for Hawaii and California state income tax purposes of $189.3 million and $40.6 million, respectively, which are available to offset future state taxable income through 2030 for Hawaii and 2031 for California. In addition, we have state tax credit carryforwards of $23.8 million that do not expire, and federal tax credit carryforwards of $13.6 million, of which $11.1 million expire in 20 years, and $2.5 million do not expire.
As further described in Note 14, to help protect the Company’s tax benefits, the Company implemented the Tax Benefits Preservation Plan on November 23, 2011 and the Protective Charter Amendment on January 26, 2011.
106
At December 31, 2013, we have no unrecognized tax benefits that, if recognized would favorably affect the effective income tax rate in future periods. We do not expect our unrecognized tax benefits to change significantly over the next 12 months.
We are subject to U.S. Federal income tax as well as income tax of multiple state jurisdictions. Taxable years through 2009 are closed.
|
20.
|
ACCUMULATED OTHER COMPREHENSIVE INCOME (LOSS) |
The following table presents the components of other comprehensive income (loss) for the years ended December 31, 2013, 2012 and 2011, by component:
|
Before Tax
|
Tax Effect
|
Net of Tax
|
||||||||||
|
(Dollars in thousands)
|
||||||||||||
|
Year Ended December 31, 2013
|
||||||||||||
|
Net unrealized losses on investment securities:
|
||||||||||||
|
Net unrealized losses arising during the period
|
$ | (43,687 | ) | $ | (15,577 | ) | $ | (28,110 | ) | |||
|
Less: Reclassification adjustment for gains realized in net income
|
(6,266 | ) | (2,511 | ) | (3,755 | ) | ||||||
|
Net unrealized losses on investment securities
|
(49,953 | ) | (18,088 | ) | (31,865 | ) | ||||||
|
Net unrealized gains on derivatives:
|
||||||||||||
|
Reclassification adjustment for losses realized in net income
|
394 | (10,599 | ) | 10,993 | ||||||||
|
Net unrealized gains on derivatives
|
394 | (10,599 | ) | 10,993 | ||||||||
|
Defined benefit plans:
|
||||||||||||
|
Net actuarial gains arising during the period
|
6,952 | 2,591 | 4,361 | |||||||||
|
Amortization of net actuarial losses
|
2,461 | 986 | 1,475 | |||||||||
|
Amortization of net transition obligation
|
17 | 7 | 10 | |||||||||
|
Amortization of prior service cost
|
18 | 7 | 11 | |||||||||
|
Defined benefit plans, net
|
9,448 | 3,591 | 5,857 | |||||||||
|
Other comprehensive loss
|
$ | (40,111 | ) | $ | (25,096 | ) | $ | (15,015 | ) | |||
|
Year Ended December 31, 2012
|
||||||||||||
|
Net unrealized losses on investment securities:
|
||||||||||||
|
Net unrealized losses arising during the period
|
$ | (2,653 | ) | $ | - | $ | (2,653 | ) | ||||
|
Less: Reclassification adjustment for losses realized in net income
|
1,382 | - | 1,382 | |||||||||
|
Net unrealized losses on investment securities
|
(1,271 | ) | - | (1,271 | ) | |||||||
|
Net unrealized losses on derivatives:
|
||||||||||||
|
Reclassification adjustment for gains realized in net income
|
(434 | ) | - | (434 | ) | |||||||
|
Net unrealized losses on derivatives
|
(434 | ) | - | (434 | ) | |||||||
|
Defined benefit plans:
|
||||||||||||
|
Net actuarial losses arising during the period
|
(3,653 | ) | - | (3,653 | ) | |||||||
|
Amortization of net actuarial losses
|
2,381 | 51 | 2,330 | |||||||||
|
Amortization of net transition obligation
|
17 | - | 17 | |||||||||
|
Amortization of prior service cost
|
17 | - | 17 | |||||||||
|
Defined benefit plans, net
|
(1,238 | ) | 51 | (1,289 | ) | |||||||
|
Other comprehensive loss
|
$ | (2,943 | ) | $ | 51 | $ | (2,994 | ) | ||||
107
|
Before Tax
|
Tax Effect
|
Net of Tax
|
||||||||||
|
(Dollars in thousands)
|
||||||||||||
|
Year Ended December 31, 2011
|
||||||||||||
|
Net unrealized gains on investment securities:
|
||||||||||||
|
Net unrealized gains arising during the period
|
$ | 22,190 | $ | - | $ | 22,190 | ||||||
|
Less: Reclassification adjustment for gains realized in net income
|
(1,164 | ) | - | (1,164 | ) | |||||||
|
Net unrealized gains on investment securities
|
21,026 | - | 21,026 | |||||||||
|
Net unrealized losses on derivatives:
|
||||||||||||
|
Reclassification adjustment for gains realized in net income
|
(3,235 | ) | - | (3,235 | ) | |||||||
|
Net unrealized losses on derivatives
|
(3,235 | ) | - | (3,235 | ) | |||||||
|
Defined benefit plans:
|
||||||||||||
|
Net actuarial losses arising during the period
|
(3,274 | ) | - | (3,274 | ) | |||||||
|
Amortization of net actuarial losses
|
2,246 | 70 | 2,176 | |||||||||
|
Amortization of net transition obligation
|
18 | - | 18 | |||||||||
|
Amortization of prior service cost
|
18 | - | 18 | |||||||||
|
Defined benefit plans, net
|
(992 | ) | 70 | (1,062 | ) | |||||||
|
Other comprehensive income
|
$ | 16,799 | $ | 70 | $ | 16,729 | ||||||
The following table presents the changes in each component of AOCI, net of tax, for the years ended December 31, 2013, 2012 and 2011:
|
Defined
|
Accumulated Other
|
|||||||||||||||
|
Investment
|
Benefit
|
Comprehensive
|
||||||||||||||
|
Securities
|
Derivatives
|
Plans
|
Income (Loss)
|
|||||||||||||
|
(Dollars in thousands)
|
||||||||||||||||
|
Year Ended December 31, 2013
|
||||||||||||||||
|
Balance at beginning of period
|
$ | 22,740 | $ | (10,993 | ) | $ | (12,577 | ) | $ | (830 | ) | |||||
|
Other comprehensive income (loss) before reclassifications
|
(28,110 | ) | - | 4,361 | (23,749 | ) | ||||||||||
|
Amounts reclassified from AOCI
|
(3,755 | ) | 10,993 | 1,496 | 8,734 | |||||||||||
|
Total other comprehensive income (loss)
|
(31,865 | ) | 10,993 | 5,857 | (15,015 | ) | ||||||||||
|
Balance at end of period
|
$ | (9,125 | ) | $ | - | $ | (6,720 | ) | $ | (15,845 | ) | |||||
|
Year Ended December 31, 2012
|
||||||||||||||||
|
Balance at beginning of period
|
$ | 24,011 | $ | (10,559 | ) | $ | (11,288 | ) | $ | 2,164 | ||||||
|
Other comprehensive loss before reclassifications
|
(2,653 | ) | - | (3,653 | ) | (6,306 | ) | |||||||||
|
Amounts reclassified from AOCI
|
1,382 | (434 | ) | 2,364 | 3,312 | |||||||||||
|
Total other comprehensive loss
|
(1,271 | ) | (434 | ) | (1,289 | ) | (2,994 | ) | ||||||||
|
Balance at end of period
|
$ | 22,740 | $ | (10,993 | ) | $ | (12,577 | ) | $ | (830 | ) | |||||
|
Year Ended December 31, 2011
|
||||||||||||||||
|
Balance at beginning of period
|
$ | 2,985 | $ | (7,324 | ) | $ | (10,226 | ) | $ | (14,565 | ) | |||||
|
Other comprehensive income (loss) before reclassifications
|
22,190 | - | (3,274 | ) | 18,916 | |||||||||||
|
Amounts reclassified from AOCI
|
(1,164 | ) | (3,235 | ) | 2,212 | (2,187 | ) | |||||||||
|
Total other comprehensive income (loss)
|
21,026 | (3,235 | ) | (1,062 | ) | 16,729 | ||||||||||
|
Balance at end of period
|
$ | 24,011 | $ | (10,559 | ) | $ | (11,288 | ) | $ | 2,164 | ||||||
108
The following table presents the amounts reclassified out of each component of AOCI for the years ended December 31, 2013, 2012 and 2011:
|
Details about AOCI Components
(Dollars in thousands)
|
Amount Reclassified from AOCI
|
Affected Line Item in
the
Statement Where
Net
Income is Presented
|
||||||||||||
|
Year ended December 31,
|
||||||||||||||
|
2013
|
2012
|
2011
|
||||||||||||
|
Sale of investment securities available for sale
|
$ | 6,266 | $ | (1,382 | ) | $ | 1,164 |
Investment securities gain (loss)
|
||||||
| (2,511 | ) | - | - |
Tax expense
|
||||||||||
| $ | 3,755 | $ | (1,382 | ) | $ | 1,164 |
Net of tax
|
|||||||
|
Unrealized gains (losses) on derivatives
|
$ | (394 | ) | $ | 434 | $ | 3,235 |
Interest income
|
||||||
| (10,599 | ) | - | - |
Tax expense
|
||||||||||
| $ | (10,993 | ) | $ | 434 | $ | 3,235 |
Net of tax
|
|||||||
|
Amortization of defined benefit plan items
|
||||||||||||||
|
Net actuarial losses
|
$ | (2,461 | ) | $ | (2,381 | ) | $ | (2,246 | ) | (1) | ||||
|
Net transition obligation
|
(17 | ) | (17 | ) | (18 | ) | (1) | |||||||
|
Prior service cost
|
(18 | ) | (17 | ) | (18 | ) | (1) | |||||||
| (2,496 | ) | (2,415 | ) | (2,282 | ) |
Total before tax
|
||||||||
| 1,000 | 51 | 70 |
Tax benefit
|
|||||||||||
| $ | (1,496 | ) | $ | (2,364 | ) | $ | (2,212 | ) |
Net of tax
|
|||||
|
Total reclassifications for the period
|
$ | (8,734 | ) | $ | (3,312 | ) | $ | 2,187 |
Net of tax
|
|||||
|
(1) These accumulated other comprehensive income components are included in the computation of net periodic
pension cost (see Note 14 for additional details).
|
||||||||||||||
109
|
21.
|
EARNINGS PER SHARE
|
The table below presents the information used to compute basic and diluted earnings per share for the years ended December 31, 2013, 2012 and 2011:
|
Year Ended December 31,
|
||||||||||||
|
2013
|
2012
|
2011
|
||||||||||
|
(In thousands, except per share data)
|
||||||||||||
|
Net income
|
$ | 172,075 | $ | 47,421 | $ | 36,571 | ||||||
|
Preferred stock dividends, accretion of discount and
|
||||||||||||
|
conversion of preferred stock to common stock
|
- | - | (83,897 | ) | ||||||||
|
Net income available to common shareholders
|
$ | 172,075 | $ | 47,421 | $ | 120,468 | ||||||
|
Weighted average shares outstanding - basic
|
41,961 | 41,720 | 35,891 | |||||||||
|
Dilutive effect of employee stock options and awards
|
341 | 278 | 415 | |||||||||
|
Dilutive effect of deferred salary restricted stock units
|
1 | 64 | 16 | |||||||||
|
Dilutive effect of Treasury warrants
|
14 | 22 | 20 | |||||||||
|
Weighted average shares outstanding - diluted
|
42,317 | 42,084 | 36,342 | |||||||||
|
Basic earnings per share
|
$ | 4.10 | $ | 1.14 | $ | 3.36 | ||||||
|
Diluted earnings per share
|
$ | 4.07 | $ | 1.13 | $ | 3.31 | ||||||
A total of 24,526, 316,188, and 40,166 potentially dilutive securities have been excluded from the dilutive share calculation for the year ended December 31, 2013, 2012 and 2011, respectively, as their effect was antidilutive.
|
22.
|
CONTINGENT LIABILITIES AND OTHER COMMITMENTS
|
The Company and its subsidiaries are involved in legal actions arising in the ordinary course of business. Management, after consultation with legal counsel, believes the ultimate disposition of those matters will not have a material adverse effect on our consolidated financial statements.
In the normal course of business there are outstanding contingent liabilities and other commitments such as unused letters of credit, items held for collections and unsold traveler’s checks, which are not reflected in the accompanying consolidated financial statements. Management does not anticipate any material losses as a result of these transactions.
|
23.
|
FINANCIAL INSTRUMENTS WITH OFF-BALANCE SHEET RISK
|
We are a party to financial instruments with off-balance sheet risk in the normal course of business to meet the financing needs of our customers. These financial instruments include commitments to extend credit, standby letters of credit and financial guarantees written, forward foreign exchange contracts, and interest rate contracts. Those instruments involve, to varying degrees, elements of credit, interest rate and foreign exchange risk in excess of the amounts recognized in the consolidated balance sheets. The contract or notional amounts of those instruments reflect the extent of involvement we have in particular classes of financial instruments.
Our exposure to credit loss in the event of nonperformance by the counterparty to the financial instrument for commitments to extend credit and standby letters of credit and financial guarantees written is represented by the contractual amount of those instruments. For forward foreign exchange contracts and interest rate contracts, the contract amounts do not represent exposure to credit loss. We control the credit risk of these contracts through credit approvals, limits and monitoring procedures. We use the same credit policies in making commitments and conditional obligations as we do for on-balance sheet instruments.
Commitments to extend credit are agreements to lend to a customer as long as there is no violation of any condition established in the contract. Commitments generally have fixed expiration dates or other termination clauses and may require payment of a fee. Since many of the commitments are expected to expire without being drawn upon, the total commitment amounts do not necessarily represent future cash requirements. We evaluate each customer’s creditworthiness on a case-by-case basis. The amount of collateral obtained, if deemed necessary, is based on management’s credit evaluation of the counterparty. Collateral held varies but may include accounts receivable, inventory, property, plant and equipment, and income-producing commercial properties.
110
Standby letters of credit and financial guarantees written are conditional commitments issued by us to guarantee the performance of a customer to a third party. The credit risk involved in issuing letters of credit is essentially the same as that involved in extending loan facilities to customers. We hold collateral supporting those commitments for which collateral is deemed necessary.
Interest rate options issued on residential mortgage loans expose us to interest rate risk, which is economically hedged with forward interest rate contracts. These derivatives are carried at fair value with changes in fair value recorded as a component of other operating income in the consolidated statements of income.
Forward interest rate contracts represent commitments to purchase or sell loans at a future date at a specified price. Risks arise from the possible inability of counter-parties to meet the terms of their contracts and from movements in market rates. Management reviews and approves the creditworthiness of the counterparties to its forward interest rate contracts.
Forward foreign exchange contracts represent commitments to purchase or sell foreign currencies at a future date at a specified price. Risks arise from the possible inability of counterparties to meet the terms of their contracts and from movements in foreign currency exchange rates. Management reviews and approves the creditworthiness of its forward foreign exchange counterparties. At December 31, 2013 and 2012, we did not have any forward foreign exchange contracts.
At December 31, 2013 and 2012, financial instruments with off-balance sheet risk were as follows:
|
December 31,
|
||||||
|
2013
|
2012
|
|||||
|
(Dollars in thousands)
|
||||||
|
Financial instruments whose contract amounts represent credit risk:
|
||||||
|
Commitments to extend credit
|
$ | 652,717 | $ | 554,477 | ||
|
Standby letters of credit and financial guarantees written
|
1,023 | 13,813 | ||||
|
Financial instruments whose contract amounts exceed the amount of credit risk:
|
||||||
|
Interest rate options
|
37,093 | 67,072 | ||||
|
Forward interest rate contracts
|
24,244 | 49,222 | ||||
|
24.
|
FAIR VALUE OF ASSETS AND LIABILITIES
|
Disclosures about Fair Value of Financial Instruments
Fair value estimates, methods and assumptions are set forth below for our financial instruments.
Short-Term Financial Instruments
The carrying values of short-term financial instruments are deemed to approximate fair values. Such instruments are considered readily convertible to cash and include cash and due from banks, interest-bearing deposits in other banks, accrued interest receivable, the majority of short-term borrowings and accrued interest payable.
Investment Securities
The fair value of investment securities is based on market price quotations received from securities dealers. Where quoted market prices are not available, fair values are based on quoted market prices of comparable securities.
Loans
Fair values of loans are estimated based on discounted cash flows of portfolios of loans with similar financial characteristics including the type of loan, interest terms and repayment history. Fair values are calculated by discounting scheduled cash flows through estimated maturities using estimated market discount rates. Estimated market discount rates are reflective of credit and interest rate risks inherent in the Company’s various loan types and are derived from available market information, as well as specific borrower information. The fair value of loans are not based on the notion of exit price.
111
Loans Held for Sale
The fair value of loans classified as held for sale are generally based upon quoted prices for similar assets in active markets, acceptance of firm offer letters with agreed upon purchase prices, discounted cash flow models that take into account market observable assumptions, or independent appraisals of the underlying collateral securing the loans. We report the fair values of Hawaii and U.S. Mainland construction and commercial real estate loans net of applicable selling costs on our consolidated balance sheets.
Other Interest Earning Assets
The equity investment in common stock of the FHLB, which is redeemable for cash at par value, is reported at its par value.
Deposit Liabilities
The fair values of deposits with no stated maturity, such as noninterest-bearing demand deposits and interest-bearing demand and savings accounts, are equal to the amount payable on demand. The fair value of time deposits is estimated using discounted cash flow analyses. The discount rate is estimated using the rates currently offered for deposits of similar remaining maturities.
Long-Term Debt
The fair value of our long-term debt is estimated by discounting scheduled cash flows over the contractual borrowing period at the estimated market rate for similar borrowing arrangements.
Off-Balance Sheet Financial Instruments
The fair values of off-balance sheet financial instruments are estimated based on the fees currently charged to enter into similar agreements, taking into account the remaining terms of the agreements and the present creditworthiness of the counterparties, current settlement values or quoted market prices of comparable instruments.
For derivative financial instruments, the fair values are based upon current settlement values, if available. If there are no relevant comparables, fair values are based on pricing models using current assumptions for interest rate swaps and options.
Limitations
Fair value estimates are made at a specific point in time based on relevant market information and information about the financial instrument. These estimates do not reflect any premium or discount that could result from offering for sale at one time our entire holdings of a particular financial instrument. Because no market exists for a significant portion of our financial instruments, fair value estimates are based on judgments regarding future expected loss experience, current economic conditions, risk characteristics of various financial instruments and other factors. These estimates are subjective in nature and involve uncertainties and matters of significant judgment and therefore cannot be determined with precision. Changes in assumptions could significantly affect the estimates.
Fair value estimates are based on existing on- and off-balance sheet financial instruments without attempting to estimate the value of future business and the value of assets and liabilities that are not considered financial instruments. For example, significant assets and liabilities that are not considered financial assets or liabilities include deferred tax assets, premises and equipment and intangible assets. In addition, the tax ramifications related to the realization of the unrealized gains and losses can have a significant effect on fair value estimates and have not been considered in many of the estimates.
112
|
Fair Value Measurement Using
|
||||||||||||||||||
| Quoted Prices | Significant | |||||||||||||||||
|
in Active
|
Other |
Significant
|
||||||||||||||||
|
Markets for
|
Observable
|
Unobservable
|
||||||||||||||||
|
Carrying
|
Estimated
|
Identical Assets
|
Inputs
|
Inputs
|
||||||||||||||
|
amount
|
fair value
|
(Level 1)
|
(Level 2)
|
(Level 3)
|
||||||||||||||
|
(Dollars in thousands)
|
||||||||||||||||||
|
December 31, 2013
|
||||||||||||||||||
|
Financial assets
|
||||||||||||||||||
|
Cash and due from banks
|
$ | 45,092 | $ | 45,092 | $ | 45,092 | $ | - | $ | - | ||||||||
|
Interest-bearing deposits in other banks
|
4,256 | 4,256 | 4,256 | - | - | |||||||||||||
|
Investment securities
|
1,660,046 | 1,646,704 | 875 | 1,635,311 | 10,518 | |||||||||||||
|
Loans held for sale
|
12,370 | 12,370 | - | - | 12,370 | |||||||||||||
|
Net loans and leases
|
2,546,781 | 2,430,282 | - | 64,705 | 2,365,577 | |||||||||||||
|
Accrued interest receivable
|
14,072 | 14,072 | 14,072 | - | - | |||||||||||||
|
Financial liabilities
|
||||||||||||||||||
|
Deposits:
|
||||||||||||||||||
|
Noninterest-bearing deposits
|
891,017 | 891,017 | 891,017 | - | - | |||||||||||||
|
Interest-bearing demand and savings deposits
|
1,935,635 | 1,935,635 | 1,935,635 | - | - | |||||||||||||
|
Time deposits
|
1,109,521 | 1,111,319 | - | - | 1,111,319 | |||||||||||||
|
Short-term debt
|
8,015 | 8,015 | - | 8,015 | - | |||||||||||||
|
Long-term debt
|
92,799 | 39,446 | - | 39,446 | - | |||||||||||||
|
Accrued interest payable (included in other liabilities)
|
1,040 | 1,040 | 1,040 | - | - | |||||||||||||
|
Off-balance sheet financial instruments
|
||||||||||||||||||
|
Commitments to extend credit
|
652,717 | 3,264 | - | 3,264 | - | |||||||||||||
|
Standby letters of credit and financial guarantees written
|
1,023 | 8 | - | 8 | - | |||||||||||||
|
Interest rate options
|
37,093 | 70 | - | 70 | - | |||||||||||||
|
Forward interest rate contracts
|
24,244 | 210 | - | 210 | - | |||||||||||||
|
December 31, 2012
|
||||||||||||||||||
|
Financial assets
|
||||||||||||||||||
|
Cash and due from banks
|
$ | 56,473 | $ | 56,473 | $ | 56,473 | $ | - | $ | - | ||||||||
|
Interest-bearing deposits in other banks
|
120,902 | 120,902 | 120,902 | - | - | |||||||||||||
|
Investment securities
|
1,698,593 | 1,699,273 | 906 | 1,685,541 | 12,826 | |||||||||||||
|
Loans held for sale
|
38,283 | 38,283 | - | - | 38,283 | |||||||||||||
|
Net loans and leases
|
2,107,531 | 2,083,514 | - | 108,081 | 1,975,433 | |||||||||||||
|
Accrued interest receivable
|
13,896 | 13,896 | 13,896 | - | - | |||||||||||||
|
Financial liabilities
|
||||||||||||||||||
|
Deposits:
|
||||||||||||||||||
|
Noninterest-bearing deposits
|
843,292 | 843,292 | 843,292 | - | - | |||||||||||||
|
Interest-bearing demand and savings deposits
|
1,858,849 | 1,858,849 | 1,858,849 | - | - | |||||||||||||
|
Time deposits
|
978,631 | 981,059 | - | - | 981,059 | |||||||||||||
|
Long-term debt
|
108,281 | 43,156 | - | 43,156 | - | |||||||||||||
|
Accrued interest payable (included in other liabilities)
|
13,131 | 13,131 | 13,131 | - | - | |||||||||||||
|
Off-balance sheet financial instruments
|
||||||||||||||||||
|
Commitments to extend credit
|
554,477 | 2,772 | - | 2,772 | - | |||||||||||||
|
Standby letters of credit and financial guarantees written
|
13,813 | 104 | - | 104 | - | |||||||||||||
|
Interest rate options
|
67,072 | 106 | - | 106 | - | |||||||||||||
|
Forward interest rate contracts
|
49,222 | (353 | ) | - | (353 | ) | - | |||||||||||
113
Fair Value Measurements
We group our financial assets and liabilities at fair value into three levels based on the markets in which the financial assets and liabilities are traded and the reliability of the assumptions used to determine fair value as follows:
|
·
|
Level 1 – Valuation is based upon quoted prices (unadjusted) for identical assets or liabilities traded in active markets. A quoted price in an active market provides the most reliable evidence of fair value and shall be used to measure fair value whenever available.
|
|
·
|
Level 2 – Valuation is based upon quoted prices for similar instruments in active markets, quoted prices for identical or similar instruments in markets that are not active, and model-based valuation techniques for which all significant assumptions are observable in the market.
|
|
·
|
Level 3 – Valuation is generated from model-based techniques that use significant assumptions not observable in the market. These unobservable assumptions reflect our own estimates of assumptions that market participants would use in pricing the asset or liability. Valuation techniques include use of discounted cash flow models and similar techniques that requires the use of significant judgment or estimation.
|
We base our fair values on the price that we would expect to receive if an asset were sold or pay to transfer a liability in an orderly transaction between market participants at the measurement date. We also maximize the use of observable inputs and minimize the use of unobservable inputs when developing fair value measurements.
We use fair value measurements to record adjustments to certain financial assets and liabilities and to determine fair value disclosures. Available for sale securities and derivatives are recorded at fair value on a recurring basis. From time to time, we may be required to record other financial assets at fair value on a nonrecurring basis such as loans held for sale, impaired loans and mortgage servicing rights. These nonrecurring fair value adjustments typically involve application of the lower of cost or fair value accounting or write-downs of individual assets.
There were no transfers of financial assets and liabilities between Level 1 and Level 2 of the fair value hierarchy during the year ended December 31, 2013.
114
The following table below presents the balances of assets and liabilities measured at fair value on a recurring basis:
|
Fair Value at Reporting Date Using
|
||||||||||||||
|
Fair
|
Quoted Prices
in Active
Markets for
Identical Assets
|
Significant Other Observable Inputs
|
Significant Unobservable Inputs
|
|||||||||||
|
Value
|
(Level 1)
|
(Level 2)
|
(Level 3)
|
|||||||||||
|
(Dollars in thousands)
|
||||||||||||||
|
December 31, 2013
|
||||||||||||||
|
Available for sale securities:
|
||||||||||||||
|
Debt securities:
|
||||||||||||||
|
States and political subdivisions
|
$ | 179,357 | $ | - | $ | 168,839 | $ | 10,518 | ||||||
|
Corporate securities
|
158,095 | - | 158,095 | - | ||||||||||
|
Mortgage-backed securities:
|
||||||||||||||
|
U.S. Government sponsored entities
|
927,626 | - | 927,626 | - | ||||||||||
|
Non-agency collateralized mortgage obligations
|
142,046 | - | 142,046 | - | ||||||||||
|
Other
|
875 | 875 | - | - | ||||||||||
|
Derivatives:
|
||||||||||||||
|
Interest rate contracts
|
279 | - | 279 | - | ||||||||||
|
Total
|
$ | 1,408,278 | $ | 875 | $ | 1,396,885 | $ | 10,518 | ||||||
|
December 31, 2012
|
||||||||||||||
|
Available for sale securities:
|
||||||||||||||
|
Debt securities:
|
||||||||||||||
|
U.S. Government sponsored entities
|
$ | 280,939 | $ | - | $ | 280,939 | $ | - | ||||||
|
States and political subdivisions
|
185,911 | - | 173,085 | 12,826 | ||||||||||
|
Corporate securities
|
127,946 | - | 127,946 | - | ||||||||||
|
Mortgage-backed securities:
|
||||||||||||||
|
U.S. Government sponsored entities
|
941,043 | - | 941,043 | - | ||||||||||
|
Other
|
906 | 906 | - | - | ||||||||||
|
Derivatives:
|
||||||||||||||
|
Interest rate contracts
|
(248 | ) | - | (248 | ) | - | ||||||||
|
Amended TARP warrant
|
(819 | ) | - | (819 | ) | - | ||||||||
|
Total
|
$ | 1,535,678 | $ | 906 | $ | 1,521,946 | $ | 12,826 | ||||||
The changes in Level 3 assets and liabilities measured at fair value on a recurring basis are summarized as follows:
|
Available for sale debt securities - States and political subdivisions
|
|||
|
(Dollars in thousands)
|
|||
|
Balance at December 31, 2011
|
$ | 12,994 | |
|
Principal payments received
|
(377 | ) | |
|
Unrealized net gain included in other comprehensive income
|
209 | ||
|
Balance at December 31, 2012
|
$ | 12,826 | |
|
Principal payments received
|
(2,797 | ) | |
|
Purchases, sales, issuances and settlements, net
|
1,146 | ||
|
Unrealized net loss included in other comprehensive income
|
(657 | ) | |
|
Balance at December 31, 2013
|
$ | 10,518 | |
Within the state and political subdivisions debt securities category, the Company holds four mortgage revenue bonds issued by the City & County of Honolulu with an aggregate fair value of $10.5 million. The Company estimates the fair value of its mortgage revenue bonds by using a discounted cash flow model to calculate the present value of estimated future principal and interest payments.
115
The significant unobservable input used in the fair value measurement of the Company’s mortgage revenue bonds is the weighted average discount rate. As of December 31, 2013, the weighted average discount rate utilized was 4.63%, which was derived by incorporating a credit spread over the FHLB Fixed-Rate Advance curve. Significant increases (decreases) in the weighted average discount rate could result in a significantly lower (higher) fair value measurement.
For assets measured at fair value on a nonrecurring basis that were recorded at fair value on our balance sheet, the following table provides the level of valuation assumptions used to determine the respective fair values:
|
Fair Value Measurements Using
|
|||||||||||||||||||
| Fair |
Quoted Prices in Active Markets for Identical Assets
|
Significant Other Observable Inputs
|
Significant Unobservable Inputs
|
Total
|
|||||||||||||||
|
Value
|
(Level 1)
|
(Level 2)
|
(Level 3)
|
Losses
|
|||||||||||||||
|
(Dollars in thousands)
|
|||||||||||||||||||
|
December 31, 2013
|
|||||||||||||||||||
|
Impaired loans (1)
|
$ | 64,705 | $ | - | $ | 64,705 | $ | - | $ | 3,298 | |||||||||
|
Other real estate (2)
|
5,163 | - | 5,163 | - | 362 | ||||||||||||||
| $ | 3,660 | ||||||||||||||||||
|
December 31, 2012
|
|||||||||||||||||||
|
Impaired loans (1)
|
$ | 108,081 | $ | - | $ | 108,081 | $ | - | $ | 11,852 | |||||||||
|
Other real estate (2)
|
10,686 | - | 10,686 | - | 3,529 | ||||||||||||||
| $ | 15,381 | ||||||||||||||||||
|
(1) Represents carrying value and related write-downs of loans for which adjustments are based on agreed
|
|||||||||||||||||||
|
upon purchase prices for the loans or the appraised value of the collateral.
|
|||||||||||||||||||
|
(2) Represents other real estate that is carried at the lower of carrying value or fair value less costs to sell.
|
|||||||||||||||||||
|
Fair value is generally based upon independent market prices or appraised values of the collateral.
|
|||||||||||||||||||
|
25.
|
SEGMENT INFORMATION
|
We have the following three reportable segments: Banking Operations, Treasury and All Others. The segments are consistent with our internal functional reporting lines and are managed separately because each unit has different target markets, technological requirements, marketing strategies and specialized skills.
The Banking Operations segment includes construction and real estate development lending, commercial lending, residential mortgage lending and servicing, indirect auto lending, trust services, retail brokerage services and our retail branch offices, which provide a full range of deposit and loan products, as well as various other banking services. The Treasury segment is responsible for managing the Company’s investment securities portfolio and wholesale funding activities. The All Others segment includes activities not captured by the Banking Operations or Treasury segments described above and includes activities such as electronic banking, data processing and management of bank owned properties.
The accounting policies of the segments are consistent with those described in Note 1. The majority of the Company’s net income is derived from net interest income. Accordingly, management focuses primarily on net interest income, rather than gross interest income and expense amounts, in evaluating segment profitability.
Intersegment net interest income (expense) was allocated to each segment based upon a funds transfer pricing process that assigns costs of funds to assets and earnings credits to liabilities based on market interest rates that reflect interest rate sensitivity and maturity characteristics. All administrative and overhead expenses are allocated to the segments at cost. Cash, investment securities, loans and leases and their related balances are allocated to the segment responsible for acquisition and maintenance of those assets. Segment assets also include all premises and equipment used directly in segment operations.
116
Segment profits (losses) and assets are provided in the following table for the periods indicated:
|
Banking
|
||||||||||||||||
|
Operations
|
Treasury
|
All Others
|
Total
|
|||||||||||||
|
(Dollars in thousands)
|
||||||||||||||||
|
Year ended December 31, 2013:
|
||||||||||||||||
|
Net interest income
|
$ | 101,822 | $ | 31,287 | $ | - | $ | 133,109 | ||||||||
|
Intersegment net interest income (expense)
|
14,761 | (27,807 | ) | 13,046 | - | |||||||||||
|
Credit (provision) for loan and lease losses
|
11,310 | - | - | 11,310 | ||||||||||||
|
Other operating income
|
49,294 | 4,185 | 1,466 | 54,945 | ||||||||||||
|
Other operating expense
|
(79,552 | ) | (3,938 | ) | (56,046 | ) | (139,536 | ) | ||||||||
|
Administrative and overhead expense allocation
|
(55,052 | ) | (937 | ) | 55,989 | - | ||||||||||
|
Income taxes
|
117,088 | 218 | (5,059 | ) | 112,247 | |||||||||||
|
Net income
|
$ | 159,671 | $ | 3,008 | $ | 9,396 | $ | 172,075 | ||||||||
|
At December 31, 2013:
|
||||||||||||||||
|
Investment securities
|
$ | - | $ | 1,660,046 | $ | - | $ | 1,660,046 | ||||||||
|
Loans and leases (including loans held for sale)
|
2,642,971 | - | - | 2,642,971 | ||||||||||||
|
Other
|
108,639 | 257,032 | 72,510 | 438,181 | ||||||||||||
|
Total assets
|
$ | 2,751,610 | $ | 1,917,078 | $ | 72,510 | $ | 4,741,198 | ||||||||
|
Year ended December 31, 2012:
|
||||||||||||||||
|
Net interest income
|
$ | 92,545 | $ | 27,166 | $ | - | $ | 119,711 | ||||||||
|
Intersegment net interest income (expense)
|
32,954 | (22,228 | ) | (10,726 | ) | - | ||||||||||
|
Credit (provision) for loan and lease losses
|
18,885 | - | - | 18,885 | ||||||||||||
|
Other operating income
|
55,838 | 5,209 | (304 | ) | 60,743 | |||||||||||
|
Other operating expense
|
(91,266 | ) | (1,868 | ) | (58,784 | ) | (151,918 | ) | ||||||||
|
Administrative and overhead expense allocation
|
(57,640 | ) | (939 | ) | 58,579 | - | ||||||||||
|
Net income (loss)
|
$ | 51,316 | $ | 7,340 | $ | (11,235 | ) | $ | 47,421 | |||||||
|
At December 31, 2012:
|
||||||||||||||||
|
Investment securities
|
$ | - | $ | 1,698,593 | $ | - | $ | 1,698,593 | ||||||||
|
Loans and leases (including loans held for sale)
|
2,242,227 | - | - | 2,242,227 | ||||||||||||
|
Other
|
(7,267 | ) | 363,815 | 73,000 | 429,548 | |||||||||||
|
Total assets
|
$ | 2,234,960 | $ | 2,062,408 | $ | 73,000 | $ | 4,370,368 | ||||||||
|
Year ended December 31, 2011:
|
||||||||||||||||
|
Net interest income
|
$ | 95,182 | $ | 22,639 | $ | - | $ | 117,821 | ||||||||
|
Intersegment net interest income (expense)
|
45,564 | (18,609 | ) | (26,955 | ) | - | ||||||||||
|
Credit (provision) for loan and lease losses
|
40,690 | - | - | 40,690 | ||||||||||||
|
Other operating income
|
48,686 | 7,312 | 1,004 | 57,002 | ||||||||||||
|
Other operating expense
|
(115,910 | ) | (7,163 | ) | (55,869 | ) | (178,942 | ) | ||||||||
|
Administrative and overhead expense allocation
|
(54,408 | ) | (627 | ) | 55,035 | - | ||||||||||
|
Net income (loss)
|
$ | 59,804 | $ | 3,552 | $ | (26,785 | ) | $ | 36,571 | |||||||
|
At December 31, 2011:
|
||||||||||||||||
|
Investment securities
|
$ | - | $ | 1,493,925 | $ | - | $ | 1,493,925 | ||||||||
|
Loans and leases (including loans held for sale)
|
2,114,737 | - | - | 2,114,737 | ||||||||||||
|
Other
|
23,858 | 429,141 | 71,204 | 524,203 | ||||||||||||
|
Total assets
|
$ | 2,138,595 | $ | 1,923,066 | $ | 71,204 | $ | 4,132,865 | ||||||||
117
|
26.
|
PARENT COMPANY AND REGULATORY RESTRICTIONS
|
At December 31, 2013, the accumulated deficit of the parent company, Central Pacific Financial Corp., included $241.1 million of equity in undistributed losses of Central Pacific Bank.
Central Pacific Bank, as a Hawaii state-chartered bank, may only pay dividends to the extent it has retained earnings as defined under Hawaii banking law (“Statutory Retained Earnings”), which differs from GAAP retained earnings. As of December 31, 2013, the bank had Statutory Retained Earnings of $240.4 million. For further information, see Note 14.
In December 2009, the Board of Directors of Central Pacific Bank agreed to the Consent Order with the FDIC and DFI. In May 2011, the Consent Order was lifted and replaced with the Bank MOU. On October 26, 2012, the Bank MOU was terminated, as described in Note 2.
In July 2010, Central Pacific Financial Corp. entered into the Written Agreement with the FRBSF, as described in Note 2, which was terminated on February 12, 2013.
Section 131 of the Federal Deposit Insurance Corporation Improvement Act (“FDICIA”) required the Board of Governors of the Federal Reserve System, FDIC, and the Comptroller of the Currency (collectively, the “Agencies”) to develop a mechanism to take prompt corrective action to resolve the problems of insured depository institutions. The final rules to implement FDICIA’s Prompt Corrective Action provisions established minimum regulatory capital standards to determine an insured depository institution’s capital category. However, the Agencies may impose higher minimum standards on individual institutions or may downgrade an institution from one capital category to a lower capital category because of safety and soundness concerns.
The Prompt Corrective Action provisions impose certain restrictions on institutions that are undercapitalized. The restrictions become increasingly more severe as an institution’s capital category declines from undercapitalized to critically undercapitalized.
The following table sets forth actual and required capital and capital ratios for the Company and the bank, as well as the minimum capital adequacy requirements applicable generally to all financial institutions as of the dates indicated. The Company’s and the bank’s leverage capital, Tier 1 and total risk-based capital ratios as of December 31, 2013 were above the levels required for a “well-capitalized” regulatory designation.
| Minimum required | ||||||||||||||||||||||
|
for capital
|
Minimum required to
|
|||||||||||||||||||||
|
Actual
|
adequacy purposes
|
be well-capitalized
|
||||||||||||||||||||
|
Amount
|
Ratio
|
Amount
|
Ratio
|
Amount
|
Ratio
|
|||||||||||||||||
|
(Dollars in thousands)
|
||||||||||||||||||||||
|
Company
|
||||||||||||||||||||||
|
As of December 31, 2013:
|
||||||||||||||||||||||
|
Leverage capital
|
$ | 632,724 | 13.7 | % | $ | 184,995 | 4.0 | % | $ | 231,244 | 5.0 | % | ||||||||||
|
Tier 1 risk-based capital
|
632,724 | 20.3 | 124,671 | 4.0 | 187,007 | 6.0 | ||||||||||||||||
|
Total risk-based capital
|
672,317 | 21.6 | 249,343 | 8.0 | 311,678 | 10.0 | ||||||||||||||||
|
As of December 31, 2012:
|
||||||||||||||||||||||
|
Leverage capital
|
$ | 609,394 | 14.3 | % | $ | 170,176 | 4.0 | % | $ | 212,720 | 5.0 | % | ||||||||||
|
Tier 1 risk-based capital
|
609,394 | 22.5 | 108,128 | 4.0 | 162,192 | 6.0 | ||||||||||||||||
|
Total risk-based capital
|
644,044 | 23.8 | 216,256 | 8.0 | 270,320 | 10.0 | ||||||||||||||||
|
Central Pacific Bank
|
||||||||||||||||||||||
|
As of December 31, 2013:
|
||||||||||||||||||||||
|
Leverage capital
|
$ | 610,753 | 13.2 | % | $ | 184,736 | 4.0 | % | $ | 230,920 | 5.0 | % | ||||||||||
|
Tier 1 risk-based capital
|
610,753 | 19.6 | 124,425 | 4.0 | 186,637 | 6.0 | ||||||||||||||||
|
Total risk-based capital
|
650,216 | 20.9 | 248,850 | 8.0 | 311,062 | 10.0 | ||||||||||||||||
|
As of December 31, 2012:
|
||||||||||||||||||||||
|
Leverage capital
|
$ | 580,860 | 13.6 | % | $ | 170,274 | 4.0 | % | $ | 212,843 | 5.0 | % | ||||||||||
|
Tier 1 risk-based capital
|
580,860 | 21.5 | 108,229 | 4.0 | 162,343 | 6.0 | ||||||||||||||||
|
Total risk-based capital
|
615,523 | 22.7 | 216,457 | 8.0 | 270,572 | 10.0 | ||||||||||||||||
118
Condensed financial statements, solely of the parent company, Central Pacific Financial Corp., follow:
Central Pacific Financial Corp.
Condensed Balance Sheets
|
December 31,
|
||||||||
|
2013
|
2012
|
|||||||
|
(Dollars in thousands)
|
||||||||
|
Assets
|
||||||||
|
Cash and cash equivalents
|
$ | 19,629 | $ | 46,686 | ||||
|
Investment securities available for sale
|
875 | 906 | ||||||
|
Investment in subsidiary bank, at equity in underlying net assets
|
710,122 | 581,248 | ||||||
|
Investment in other subsidiaries, at equity in underlying assets
|
554 | 549 | ||||||
|
Accrued interest receivable and other assets
|
23,202 | 6,845 | ||||||
|
Total assets
|
$ | 754,382 | $ | 636,234 | ||||
|
Liabilities and Shareholders' Equity
|
||||||||
|
Long-term debt
|
$ | 92,785 | $ | 108,249 | ||||
|
Other liabilities
|
1,484 | 23,163 | ||||||
|
Total liabilities
|
94,269 | 131,412 | ||||||
|
Shareholders' equity:
|
||||||||
|
Preferred stock, no par value, authorized 1,000,000 shares; issued
|
||||||||
|
and outstanding none at December 31, 2013 and 2012
|
- | - | ||||||
|
Common stock, no par value, authorized 185,000,000 shares; issued
|
||||||||
|
and outstanding 42,112,633 and 41,867,046 shares at December 31,
|
||||||||
|
2013 and 2012, respectively
|
784,547 | 784,512 | ||||||
|
Surplus
|
75,498 | 70,567 | ||||||
|
Accumulated deficit
|
(184,087 | ) | (349,427 | ) | ||||
|
Accumulated other comprehensive loss
|
(15,845 | ) | (830 | ) | ||||
|
Total shareholders' equity
|
660,113 | 504,822 | ||||||
|
Total liabilities and shareholders' equity
|
$ | 754,382 | $ | 636,234 | ||||
119
Central Pacific Financial Corp.
Condensed Statements of Income
|
Year Ended December 31,
|
||||||||||||
|
2013
|
2012
|
2011
|
||||||||||
|
(Dollars in thousands)
|
||||||||||||
|
Income:
|
||||||||||||
|
Interest income:
|
||||||||||||
|
Interest from subsidiary banks
|
$ | 30 | $ | 48 | $ | 109 | ||||||
|
Other income
|
2,001 | 9 | 1,047 | |||||||||
|
Total income
|
2,031 | 57 | 1,156 | |||||||||
|
Expense:
|
||||||||||||
|
Interest on long-term debt
|
3,118 | 3,687 | 3,392 | |||||||||
|
Other expenses
|
2,679 | 3,081 | 3,584 | |||||||||
|
Total expenses
|
5,797 | 6,768 | 6,976 | |||||||||
|
Loss before income taxes and equity in undistributed income
|
||||||||||||
|
of subsidiaries
|
(3,766 | ) | (6,711 | ) | (5,820 | ) | ||||||
|
Income tax benefit
|
(31,891 | ) | - | - | ||||||||
|
Income (loss) before equity in undistributed income of subsidiaries
|
28,125 | (6,711 | ) | (5,820 | ) | |||||||
|
Equity in undistributed income of subsidiary bank
|
143,945 | 54,124 | 42,377 | |||||||||
|
Equity in undistributed income of other subsidiaries
|
5 | 8 | 14 | |||||||||
|
Net income
|
$ | 172,075 | $ | 47,421 | $ | 36,571 | ||||||
120
Central Pacific Financial Corp.
Condensed Statements of Cash Flows
|
Year Ended December 31,
|
||||||||||||
|
2013
|
2012
|
2011
|
||||||||||
|
(Dollars in thousands)
|
||||||||||||
|
Cash flows from operating activities
|
||||||||||||
|
Net income
|
$ | 172,075 | $ | 47,421 | $ | 36,571 | ||||||
|
Adjustments to reconcile net income to net cash provided by
|
||||||||||||
|
(used in) operating activities:
|
||||||||||||
|
Deferred income tax benefit
|
(19,440 | ) | - | - | ||||||||
|
Equity in income of subsidiary bank
|
(143,945 | ) | (54,124 | ) | (42,377 | ) | ||||||
|
Equity in undistributed income of other subsidiaries
|
(5 | ) | (8 | ) | (14 | ) | ||||||
|
Share-based compensation
|
4,931 | 90 | 153 | |||||||||
|
Other, net
|
(18,548 | ) | 7,681 | 4,755 | ||||||||
|
Net cash provided by (used in) operating activities
|
(4,932 | ) | 1,060 | (912 | ) | |||||||
|
Cash flows from investing activities
|
||||||||||||
|
Investment in subsidiary bank
|
- | - | (283,000 | ) | ||||||||
|
Distribution from unconsolidated subsidiaries
|
9,000 | - | - | |||||||||
|
Contributions to unconsolidated subsidiaries
|
(9,000 | ) | - | - | ||||||||
|
Net cash used in investing activities
|
- | - | (283,000 | ) | ||||||||
|
Cash flows from financing activities
|
||||||||||||
|
Net proceeds from issuance of common stock and stock option exercises
|
74 | - | 323,538 | |||||||||
|
Repayments of long-term debt
|
(15,464 | ) | - | - | ||||||||
|
Dividends paid
|
(6,735 | ) | - | - | ||||||||
|
Net cash provided by (used in) financing activities
|
(22,125 | ) | - | 323,538 | ||||||||
|
|
||||||||||||
|
Net increase (decrease) in cash and cash equivalents
|
(27,057 | ) | 1,060 | 39,626 | ||||||||
|
Cash and cash equivalents
|
||||||||||||
|
At beginning of year
|
46,686 | 45,626 | 6,000 | |||||||||
|
At end of year
|
$ | 19,629 | $ | 46,686 | $ | 45,626 | ||||||
121
|
27.
|
UNAUDITED QUARTERLY FINANCIAL INFORMATION
|
|
First
|
Second
|
Third
|
Fourth
|
|||||||||||||||||
|
Quarter
|
Quarter
|
Quarter
|
Quarter
|
Full Year
|
||||||||||||||||
|
(Dollars in thousands, except per share data)
|
||||||||||||||||||||
|
2013:
|
||||||||||||||||||||
|
Total interest income
|
$ | 32,595 | $ | 34,992 | $ | 35,558 | $ | 37,133 | $ | 140,278 | ||||||||||
|
Total interest expense
|
1,926 | 1,819 | 1,787 | 1,637 | 7,169 | |||||||||||||||
|
Net interest income
|
30,669 | 33,173 | 33,771 | 35,496 | 133,109 | |||||||||||||||
|
Provision (credit) for loan and lease losses
|
(6,561 | ) | (227 | ) | (3,189 | ) | (1,333 | ) | (11,310 | ) | ||||||||||
|
Net interest income after provision for
|
||||||||||||||||||||
|
loan and lease losses
|
37,230 | 33,400 | 36,960 | 36,829 | 144,419 | |||||||||||||||
|
Investment securities gains
|
- | - | - | 482 | 482 | |||||||||||||||
|
Income before income taxes
|
17,507 | 16,212 | 12,378 | 13,731 | 59,828 | |||||||||||||||
|
Net income
|
137,309 | 14,267 | 10,204 | 10,295 | 172,075 | |||||||||||||||
|
Basic earnings per share
|
3.28 | 0.34 | 0.24 | 0.24 | 4.10 | |||||||||||||||
|
Diluted earnings per share
|
3.25 | 0.34 | 0.24 | 0.24 | 4.07 | |||||||||||||||
|
2012:
|
||||||||||||||||||||
|
Total interest income
|
$ | 32,903 | $ | 32,479 | $ | 31,674 | $ | 31,389 | $ | 128,445 | ||||||||||
|
Total interest expense
|
2,401 | 2,220 | 2,114 | 1,999 | 8,734 | |||||||||||||||
|
Net interest income
|
30,502 | 30,259 | 29,560 | 29,390 | 119,711 | |||||||||||||||
|
Provision (credit) for loan and lease losses
|
(4,990 | ) | (6,630 | ) | (4,982 | ) | (2,283 | ) | (18,885 | ) | ||||||||||
|
Net interest income after provision for
|
||||||||||||||||||||
|
loan and lease losses
|
35,492 | 36,889 | 34,542 | 31,673 | 138,596 | |||||||||||||||
|
Investment securities gains
|
- | - | 789 | - | 789 | |||||||||||||||
|
Income before income taxes
|
13,478 | 10,812 | 10,721 | 12,410 | 47,421 | |||||||||||||||
|
Net income
|
13,478 | 10,812 | 10,721 | 12,410 | 47,421 | |||||||||||||||
|
Basic earnings per share
|
0.32 | 0.26 | 0.26 | 0.30 | 1.14 | |||||||||||||||
|
Diluted earnings per share
|
0.32 | 0.26 | 0.26 | 0.29 | 1.13 | |||||||||||||||
|
28.
|
SUBSEQUENT EVENTS
|
On February 21, 2014, we announced a tender offer to purchase for cash up to $68.8 million in value of shares of our common stock at a price not greater than $21.00 nor less than $18.50 per share (the “Tender Offer”.)
Upon the terms and subject to the conditions of the Tender Offer, promptly after the expiration date of the Tender Offer, we will determine a single price per share (the “Purchase Price”), which will be not greater than $21.00 nor less than $18.50 per share, that we will pay, subject to “odd lot” priority, proration and conditional tender provisions described in the tender and not properly withdrawn, and accepted for payment, taking into account the number of shares tendered pursuant to the Tender Offer and the prices specified by the tendering shareholders. The Purchase Price will be the lowest price per share (in increments of $0.10) of not greater than $21.00 nor less than $18.50 per share, at which shares have been properly tendered in the Tender Offer and not properly withdrawn, that will enable us to purchase the maximum number of shares properly tendered in the Tender Offer and not properly withdrawn having an aggregate purchase price not exceeding $68.8 million. All shares purchased in the Tender Offer will be purchased at the same Purchase Price regardless of whether the shareholder tendered at a lower price. However, because of the “odd lot” priority, proration and conditional tender provisions described in the Tender Offer materials, all of the shares tendered at or below the Purchase Price may not be purchased if shares having an aggregate value in excess of $68.8 million are properly tendered and not properly withdrawn. As of February 14, 2014, there were 42,108,496 shares of our common stock issued and outstanding. The maximum of 3,718,918 shares that we are offering to purchase pursuant to the Tender Offer represents approximately 8.8% of the total number of shares issued and outstanding as of February 14, 2014. Assuming the Tender Offer is fully subscribed, the minimum of 3,276,190 shares that we are offering to purchase pursuant to the Tender Offer represents approximately 7.8% of the total number of shares issued and outstanding as of February 14, 2014.
122
On February 20, 2014, we also entered into repurchase agreements (the “Repurchase Agreements”) with each of Carlyle Financial Services Harbor, L.P. (“Carlyle”) and ACMO-CPF, L.L.C. (“Anchorage” and together with Carlyle, the “Lead Investors”), each of whom is the owner of 9,463,095 shares (representing 22.5% of the outstanding shares or 44.9% in the aggregate) of our common stock, pursuant to which we have agreed to purchase up to $28.1 million of shares of common stock from each of the Lead Investors at the Purchase Price (the “Share Repurchases”) (or an aggregate of $56.2 million of shares.) The Share Repurchases are scheduled to close on the eleventh business day following the expiration of the Tender Offer. The aggregate value of shares to be repurchased under the Repurchase Agreements will be proportionately reduced in the event that the Company purchases less than the maximum number of shares that it is able to purchase at the Purchase Price pursuant to the terms of the Tender Offer. In addition, each Lead Investor may tender in the Tender Offer, although neither Lead Investor has indicated to what extent such Lead Investor intends to do so. The Share Repurchases contemplated by the Repurchase Agreements are conditioned upon, among other matters, the Company purchasing shares in the Tender Offer in accordance with this its terms.
If the Tender Offer is fully subscribed, the completion of the Tender Offer and the Share Repurchases will result in the repurchase by us of $125 million of shares in the aggregate. If the Tender Offer is fully subscribed at a Purchase Price of $21.00, the maximum Purchase Price pursuant to the Tender Offer, the completion of the Tender Offer and the Share Repurchases will result in the repurchase by us 5,952,380 shares of common stock, which would represent approximately 14.1% of our issued and outstanding shares. If the Tender Offer is fully subscribed at a Purchase Price of $18.50, the minimum Purchase Price pursuant to the Tender Offer, the completion of the Tender Offer and the Share Repurchases will result in the repurchase by the Company of 6,756,755 shares in the aggregate, which would represent approximately 16.0% of our issued and outstanding shares.
123
|
ITEM 9.
|
CHANGES IN AND DISAGREEMENTS WITH ACCOUNTANTS ON ACCOUNTING AND FINANCIAL DISCLOSURE
|
None.
|
ITEM 9A.
|
CONTROLS AND PROCEDURES
|
|
(a)
|
Evaluation of Disclosure Controls and Procedures.
Under the supervision and with the participation of the Company’s management, including the principal executive officer and principal financial officer, the Company conducted an evaluation of the effectiveness of its disclosure controls and procedures (as defined in Rule 13a-15(e) promulgated under the Exchange Act) as of December 31, 2013. Based on that evaluation, because of the material weakness in internal control over financial reporting described below, the principal executive officer and principal financial officer concluded that, as of December 31, 2013, the Company’s disclosure controls and procedures were not effective. Notwithstanding the material weakness discussed below, the Company’s management, including the principal executive officer and principal financial officer, has concluded that the Company’s financial statements included in this Form 10-K present fairly, in all material respects, the Company’s financial position, results of operations, and cash flows for the periods presented in conformity with U.S. generally accepted accounting principles.
|
|
(b)
|
Management’s Report on Internal Control Over Financial Reporting.
The Company’s management is responsible for establishing and maintaining adequate internal control over financial reporting (as such term is defined in Rule 13a-15(f) under the Exchange Act). The Company’s internal control over financial reporting is a process designed under the supervision of the Company’s principal executive and principal financial officers to provide reasonable assurance regarding the reliability of financial reporting and the preparation of the Company’s financial statements for external reporting purposes in accordance with U.S. generally accepted accounting principles.
|
The Company’s internal control over financial reporting includes policies and procedures that pertain to the maintenance of records that, in reasonable detail, accurately and fairly reflect transactions and dispositions of assets; provide reasonable assurances that transactions are recorded as necessary to permit preparation of financial statements in accordance with U.S. generally accepted accounting principles, and that receipts and expenditures are being made only in accordance with authorizations of management and the directors of the Company; and provide reasonable assurance regarding prevention or timely detection of unauthorized acquisition, use or disposition of the Company’s assets that could have a material effect on its financial statements.
Because of its inherent limitations, internal control over financial reporting may not prevent or detect misstatements. Also, projections of any evaluation of effectiveness to future periods are subject to the risk that controls may become inadequate because of changes in conditions, or that the degree of compliance with the policies or procedures may deteriorate.
As of December 31, 2013, management conducted an assessment of the effectiveness of the Company’s internal control over financial reporting based on the framework established in
Internal Control-Integrated Framework
issued by the Committee of Sponsoring Organizations of the Treadway Commission (1992). Based on this assessment, management has determined that the Company’s internal control over financial reporting as of December 31, 2013 was not effective because of the material weakness described below. A material weakness is a deficiency, or a combination of deficiencies, in internal control over financial reporting, such that there is a reasonable possibility that a material misstatement of the Company’s annual or interim financial statements will not be prevented or detected on a timely basis.
Based on the assessment described above, management identified a control deficiency in the Company’s internal controls associated with the accounting for allowance for loan and lease losses. Specifically, the Company’s input level review of the allowance for loan and lease losses was not operating effectively to detect the failure to update certain third party data used in estimating the allowance for loan and lease losses. As a result of this control deficiency, a material misstatement related to the allowance for loan and lease losses existed in the Company’s preliminary consolidated financial statements at December 31, 2013 and was corrected prior to the issuance of those consolidated financial statements.
The Company’s internal control over financial reporting as of December 31, 2013 has been audited by KPMG LLP, an independent registered public accounting firm, as stated in their report appearing herein under the heading “Report of Independent Registered Public Accounting Firm.”
124
|
(c)
|
Remediation Plan for Material Weakness in Internal Control Over Financial Reporting
|
In response to the identified material weakness above, the Company engaged an independent third-party consultant familiar with the Company’s allowance for loan and lease losses methodology to revalidate all significant external and internal inputs, including queries used to extract data from its core banking system. The consultant completed its work in early February 2014 and concluded that all other external and internal inputs were accurate.
The Company’s management is committed to remediating any material weaknesses in a timely fashion and, with oversight from the Company’s Audit Committee, has been actively developing remediation plans to address the control deficiencies described above. The remediation efforts expected to be implemented include the following:
|
·
|
Create a step-by-step checklist of the key elements of the allowance for loan and lease losses methodology with references to appropriate data sources to ensure the completeness and accuracy of all inputs;
|
|
·
|
Establish a more comprehensive review and approval procedure for the allowance for loan and lease losses calculation, including a detailed review of the completeness and accuracy of all inputs and the resulting calculation; and
|
|
·
|
No less than annually, continue to engage an independent third-party to review the allowance for loan and lease losses methodology and calculation for conformity with U.S. generally accepted accounting principles and regulatory compliance and to validate the accuracy of the information used in the analysis.
|
Management believes the foregoing efforts will effectively remediate the material weakness. Management will continue to assess the effectiveness of the remediation efforts in connection with future evaluations of internal control over financial reporting and may determine to take additional measures to address control deficiencies or modify the remediation plan described above.
|
(d)
|
Changes in Internal Control Over Financial Reporting.
There have not been any changes in the Company’s internal control over financial reporting, during the fiscal quarter ended December 31, 2013 that have materially affected, or are reasonably likely to materially affect, its internal control over financial reporting, other than the identification of the material weakness described above.
|
|
ITEM 9B.
|
OTHER INFORMATION
|
None.
125
|
ITEM 10.
|
DIRECTORS, EXECUTIVE OFFICERS AND CORPORATE GOVERNANCE
|
Except as hereinafter noted, the information concerning directors and executive officers of the Company is incorporated by reference from the section entitled “Directors’ and Executive Officers’ Information” of the Company’s definitive Proxy Statement for the 2014 Annual Meeting of Shareholders (the “2014 Proxy Statement”) to be filed with the SEC within 120 days of the fiscal year ended December 31, 2013. Information concerning the Company’s Code of Conduct and Ethics is set forth above under “Available Information” and incorporated by reference from the section entitled “Corporate Governance and Board Matters—Code of Conduct & Ethics” of the Company’s 2014 Proxy Statement.
|
ITEM 11.
|
EXECUTIVE COMPENSATION
|
Information concerning executive compensation is incorporated by reference from the section entitled “Compensation of Directors and Executive Officers” of the Company’s 2014 Proxy Statement.
Information concerning the members of the Compensation Committee of the Company is incorporated by reference from the section entitled “Compensation Committee Interlocks and Insider Participation” of the Company’s 2014 Proxy Statement.
Information concerning the report of the Compensation Committee of the Company is incorporated by reference from the section entitled “Compensation Committee Report” of the Company’s 2014 Proxy Statement.
|
ITEM 12.
|
SECURITY OWNERSHIP OF CERTAIN BENEFICIAL OWNERS AND MANAGEMENT AND RELATED STOCKHOLDER MATTERS
|
Information concerning security ownership of certain beneficial owners and management is incorporated by reference from the sections entitled “Introduction—Principal Shareholders,” and “Introduction—Security Ownership of Directors, Nominees and Executive Officers” of the Company’s 2014 Proxy Statement.
The following table provides information as of December 31, 2013 regarding securities issued under our equity compensation plans that were in effect during fiscal 2013.
|
(c)
|
|||||||
|
Number of securities
|
|||||||
|
remaining available for
|
|||||||
|
(a)
|
(b)
|
future
issuance
under
|
|||||
|
Number of securities to
|
Weighted-average
|
equity compensation
|
|||||
|
be issued upon exercise
|
exercise price of
|
plans (excluding
|
|||||
|
of outstanding options,
|
outstanding options,
|
securities reflected in
|
|||||
|
Plan Category
|
warrants and rights
|
warrants and rights
|
column (a))
|
||||
|
Equity compensation plans approved by security holders
|
302,648
|
$ |
51.79
|
2,185,454
|
|||
|
Equity compensation plans not approved by security holders
|
-
|
-
|
-
|
||||
|
Total
|
302,648
|
$ |
51.79
|
2,185,454
|
|||
|
ITEM 13.
|
CERTAIN RELATIONSHIPS AND RELATED TRANSACTIONS, AND DIRECTOR INDEPENDENCE
|
Information concerning certain relationships and related transactions is incorporated by reference from the section entitled “Election of Directors” and “Corporate Governance and Board Matters—Director Independence and Relationships, and Loans to Related Persons” of the Company’s 2014 Proxy Statement.
Information concerning director independence is incorporated by reference from the section entitled “Corporate Governance and Board Matters—Director Independence and Relationships” of the Company’s 2014 Proxy Statement.
|
ITEM 14.
|
PRINCIPAL ACCOUNTANT FEES AND SERVICES
|
Information concerning principal accountant fees and services is incorporated by reference from the section entitled “Discussion of Proposals Recommended by the Board of Directors—Proposal 2—Ratification of the Appointment of Independent Registered Public Accounting Firm—Services Rendered By and Fees Paid To Independent Registered Public Accounting Firm” of the Company’s 2014 Proxy Statement.
126
|
ITEM 15.
|
EXHIBITS AND FINANCIAL STATEMENT SCHEDULES
|
(a) 1. Financial Statements
The following consolidated financial statements are included in Item 8 of this report:
Central Pacific Financial Corp. and Subsidiaries:
Report of Independent Registered Public Accounting Firm
Consolidated Balance Sheets at December 31, 2013 and 2012
Consolidated Statements of Income for the Years ended December 31, 2013, 2012 and 2011
Consolidated Statements of Comprehensive Income for the Years ended December 31, 2013, 2012 and 2011
Consolidated Statements of Changes in Equity for the Years ended December 31, 2013, 2012 and 2011
Consolidated Statements of Cash Flows for the Years ended December 31, 2013, 2012 and 2011
Notes to Consolidated Financial Statements
|
(a) 2.
|
All schedules required by this Item 15(a) 2 are omitted because they are not applicable, not material or because the information is included in the consolidated financial statements or the notes thereto.
|
|
(a) 3.
|
Exhibits
|
|
Exhibit No.
|
Document
|
|
|
3.1
|
Restated Articles of Incorporation of the Registrant (1)
|
|
|
3.2
|
Bylaws of the Registrant, as amended (2)
|
|
|
4.1
|
Tax Benefits Preservation Plan, dated as of November 23, 2010, between the Registrant and Wells Fargo Bank, National Association, which includes the Form of Certificate of Designation for the Junior Participating Preferred Stock, Series C, as Exhibit A, Form of Right Certificate as Exhibit B and Form of Summary of Terms as Exhibit C (3)
|
|
|
10.1
|
License and Service Agreement dated December 23, 2004 by and between the Registrant and Fiserv Solutions, Inc. (4)
|
|
|
10.2
|
Split Dollar Life Insurance Plan (5) (6)
|
|
|
10.3
|
Central Pacific Bank Supplemental Executive Retirement Plan (6) (7)
|
|
|
10.4
|
The Registrant’s 1997 Stock Option Plan, as amended (6) (7)
|
|
|
10.5
|
The Registrant’s Directors’ Deferred Compensation Plan (6) (8)
|
|
|
10.6
|
The Registrant’s 2004 Stock Compensation Plan, as amended (1) (6)
|
|
|
10.7
|
Form of Restricted Stock Award Agreement (6) (9)
|
|
|
10.8
|
Compensation Agreement, effective as of September 14, 2004, by and between the Registrant and Clinton L. Arnoldus (6) (10)
|
|
10.9
|
Supplemental Executive Retirement Agreement for Blenn A. Fujimoto, effective July 1, 2005 (6) (11)
|
|
| 10.10 |
Amendment No. 1 to the Supplemental Executive Retirement Agreement for Blenn A. Fujimoto, effective December 31, 2008 (4) (6)
|
127
|
Exhibit No.
|
Document
|
|
|
10.11
|
Supplemental Executive Retirement Agreement for Dean K. Hirata, effective July 1, 2005 (6) (11)
|
|
|
10.12
|
Amendment No. 1 to the Supplemental Executive Retirement Agreement for Dean K. Hirata, effective December 31, 2008 (4) (6)
|
|
|
10.13
|
The Registrant’s Long-Term Executive Incentive Plan, effective January 1, 2005 (6) (12)
|
|
|
10.14
|
Amendment No. 2008-1 to the Registrant’s Long-Term Executive Incentive Plan (4) (6)
|
|
|
10.15
|
The Registrant’s 2004 Annual Executive Incentive Plan (6) (9)
|
|
|
10.16
|
Amendment No. 2008-1 to the Registrant’s 2004 Annual Executive Incentive Plan dated December 31, 2008 (4) (6)
|
|
|
|
||
|
10.17
|
Retirement Agreement of Clint Arnoldus dated March 10, 2008 (6) (13)
|
|
|
10.18
|
Advances, Security and Deposit Agreement with Federal Home Loan Bank Seattle dated June 23, 2004 (14)
|
|
|
10.19
|
Lending Agreement with Federal Reserve Banks effective October 15, 2006 (16)
|
|
|
10.20
|
Compensation Agreement with John C. Dean dated May 24, 2010 (6) (17)
|
|
|
10.21
|
Restricted Stock Unit Agreement with John C. Dean dated May 24, 2010 (6) (17)
|
|
|
10.22
|
Compensation Agreement with Lawrence D. Rodriguez dated August 27, 2010 (6) (18)
|
|
|
10.23
|
Restricted Stock Unit Agreement with Lawrence D. Rodriguez dated August 27, 2010 (6) (18)
|
|
|
10.24
|
Investment Agreement, dated November 4, 2010, between the Registrant and Carlyle Financial Services Harbor, L.P. (15)
|
|
|
10.25
|
Investment Agreement, dated November 4, 2010, between the Registrant and ACMO-CPF, L.L.C. (15)
|
|
|
10.26
|
Employment Agreement with A. Catherine Ngo dated November 23, 2010 (6) (19)
|
|
|
10.27
|
Amendment No. 1 dated December 20, 2010 to Investment Agreement between the Registrant and Carlyle Financial Services Harbor, L.P. (20)
|
|
|
10.28
|
Amendment No. 1 dated December 20, 2010 to Investment Agreement between the Registrant and ACMO-CPF, L.L.C. (20)
|
|
|
10.29
|
Form of Subscription Agreement by and between the Registrant and the Additional Investors (21)
|
|
|
10.30
|
Amendment No. 2 dated February 10, 2011 to Investment Agreement between the Registrant and Carlyle Financial Services Harbor, L.P. (22)
|
|
|
10.31
|
Amendment No. 2 dated February 10, 2011 to Investment Agreement between the Registrant and ACMO-CPF, L.L.C. (22)
|
|
|
10.32
|
Amendment No. 2011-1 to the Registrant’s 2004 Annual Executive Incentive Plan (6) (23)
|
|
|
10.33
|
Consulting Agreement with Trinity M& A Group, L.L.C. dated September 5, 2012 (6) (24)
|
|
|
10.34
|
Amendment No. 2012 to 2004 Stock Compensation Plan (25)
|
|
|
10.35
|
Form of Stock Option Agreement for 2004 Stock Compensation Plan (25)
|
|
|
10.36
|
Form of Restricted Stock Unit Grant Agreement for 2004 Stock Compensation Plan (25)
|
|
|
|
||
|
10.37
|
The Registrant’s 2013 Stock Compensation Plan (26)
|
128
|
Exhibit No.
|
Document
|
|
|
10.38
|
Form of Stock Option Grant Agreement for 2013 Stock Compensation Plan (26)
|
|
|
10.39
|
Form of Restricted Stock Grant Agreement for 2013 Stock Compensation Plan (26)
|
|
|
10.40
|
Form of Restricted Stock Unit Agreement for 2013 Stock Compensation Plan (26)
|
|
|
10.41
|
Form of Stock Appreciation Rights Grant Agreement for 2013 Stock Compensation Plan (26)
|
|
|
10.42
|
Form of Key Employee Restricted Stock Unit Grant Agreement for 2013 Stock Compensation Plan (26)
|
|
|
12.1
|
Statements re. Computation of Ratios *
|
|
|
14.1
|
The Registrant’s Code of Conduct and Ethics (12)
|
|
|
14.2
|
The Registrant’s Code of Conduct and Ethics for Senior Financial Officers (12)
|
|
|
21
|
Subsidiaries of the Registrant *
|
|
|
23
|
Consent of Independent Registered Public Accounting Firm *
|
|
|
31.1
|
Rule 13a-14(a) Certification of Chief Executive Officer in accordance with Section 302 of the Sarbanes-Oxley Act of 2002 *
|
|
|
31.2
|
Rule 13a-14(a) Certification of Chief Financial Officer in accordance with Section 302 of the Sarbanes-Oxley Act of 2002 *
|
|
|
32.1
|
Section 1350 Certification of Chief Executive Officer in accordance with Section 906 of the Sarbanes-Oxley Act of 2002 **
|
|
|
32.2
|
Section 1350 Certification of Chief Financial Officer in accordance with Section 906 of the Sarbanes-Oxley Act of 2002 **
|
|
|
101.INS
|
XBRL Instance Document*
|
|
|
101.SCH
|
XBRL Taxonomy Extension Schema Document*
|
|
|
101.CAL
|
XBRL Taxonomy Extension Calculation Linkbase Document*
|
|
|
101.DEF
|
XBRL Taxonomy Extension Definition Linkbase Document*
|
|
|
101.LAB
|
XBRL Taxonomy Extension Label Linkbase Document*
|
|
|
101.PRE
|
XBRL Taxonomy Extension Presentation Linkbase Document*
|
|
*
|
Filed herewith.
|
|
**
|
Furnished herewith.
|
|
|
All of the references to Form 8-K, Form 10-K, Form 10-Q, Form DEF 14A and Form S-1/A identified in the exhibit index have SEC file number
001-31567
.
|
|
|
Upon request of the Securities and Exchange Commission, we will furnish any agreements relating to our long-term debt not otherwise contained herein.
|
|
(1)
|
Filed as Exhibits 3.1 and 10.6 to the Registrant’s Annual Report on Form 10-K for the year ended December 31, 2011, filed with the Securities and Exchange Commission on February 29, 2012.
|
129
|
(2)
|
Filed as Exhibit 3.1 to the Registrant’s Current Report on Form 8-K, filed with the Securities and Exchange Commission on January 27, 2012.
|
|
(3)
|
Filed as Exhibit 4.1 to the Registrant’s Current Report on Form 8-K, filed with the Securities and Exchange Commission on November 24, 2010.
|
|
(4)
|
Filed as Exhibits 10.1, 10.15, 10.17, 10.19 and 10.21 to the Registrant’s Annual Report on Form 10-K/A for the year ended December 31, 2008, filed with the Securities and Exchange Commission on March 2, 2009.
|
|
(5)
|
Filed as Exhibit 10.16 to the Registrant’s Annual Report on Form 10-K for the fiscal year ended December 31, 1991, filed with the Securities and Exchange Commission on March 27, 1992.
|
|
(6)
|
Denotes management contract or compensation plan or arrangement.
|
|
(7)
|
Filed as Exhibits 10.8 and 10.9 to the Registrant’s Annual Report on Form 10-K for the fiscal year ended December 31, 1996, filed with the Securities and Exchange Commission on March 28, 1997.
|
|
(8)
|
Filed as Exhibit 10.12 to the Registrant’s Annual Report on Form 10-K for the fiscal year ended December 31, 2000, filed with the Securities and Exchange Commission on March 30, 2001.
|
|
(9)
|
Filed as Exhibits 10.9 and 10.20 to the Registrant’s Annual Report on Form 10-K for the fiscal year ended December 31, 2004, filed with the Securities and Exchange Commission on March 16, 2005.
|
|
(10)
|
Filed as Exhibit 10.3 to the Registrant’s Quarterly Report on Form 10-Q for the quarter ended September 30, 2004, filed with the Securities and Exchange Commission on November 9, 2004.
|
|
(11)
|
Filed as Exhibits 99.1 and 99.2 to the Registrant’s Current Report on Form 8-K, filed with the Securities and Exchange Commission on January 31, 2006.
|
|
(12)
|
Filed as Exhibits 10.19, 14.1 and 14.2 to the Registrant’s Annual Report on Form 10-K for the fiscal year ended December 31, 2005, filed with the Securities and Exchange Commission on March 15, 2006.
|
|
(13)
|
Filed as Exhibit 10.1 to the Registrant’s Current Report on Form 8-K, filed with the Securities and Exchange Commission on March 11, 2008.
|
|
(14)
|
Filed as Exhibit 10.1 to the Registrant’s Quarterly Report on Form 10-Q for the quarter ended September 30, 2008, filed with the Securities and Exchange Commission on November 7, 2008.
|
|
(15)
|
Filed as Exhibits 10.20, 10.32 and 10.33 to the Registrant’s Registration Statement on Form S-1/A, filed with the Securities and Exchange Commission on April 1, 2011.
|
|
(16)
|
Filed as Exhibit 10.32 to the Registrant’s Annual Report on Form 10-K for the year ended December 31, 2009, filed with the Securities and Exchange Commission on March 16, 2010.
|
|
(17)
|
Filed as Exhibits 10.1 and 10.2 to the Registrant’s Current Report on Form 8-K, filed with the Securities and Exchange Commission on May 25, 2010.
|
|
(18)
|
Filed as Exhibits 10.1 and 10.2 to the Registrant’s Current Report on Form 8-K, filed with the Securities and Exchange Commission on August 27, 2010.
|
|
(19)
|
Filed as Exhibit 10.1 to the Registrant’s Current Report on Form 8-K, filed with the Securities and Exchange Commission on November 24, 2010.
|
|
(20)
|
Filed as Exhibits 10.1 and 10.2 to the Registrant’s Current Report on Form 8-K, filed with the Securities and Exchange Commission on December 21, 2010.
|
130
|
(21)
|
Filed as Exhibit 10.1 to the Registrant’s Current Report on Form 8-K, filed with the Securities and Exchange Commission on December 27, 2010.
|
|
(22)
|
Filed as Exhibits 10.1 and 10.2 to the Registrant’s Current Report on Form 8-K, filed with the Securities and Exchange Commission on February 11, 2011.
|
|
(23)
|
Filed as Appendix B to the Registrant’s Definitive Proxy Statement on Form DEF 14A filed with the Securities and Exchange Commission on March 4, 2011.
|
|
(24)
|
Filed as Exhibit 10.1 to the Registrant’s Quarterly Report on Form 10-Q for the quarter ended September 30, 2012, filed with the Securities and Exchange Commission on November 6, 2012.
|
|
(25)
|
Filed as Exhibits 10.1, 10.2 and 10.3 to the Registrant’s Current Report on Form 8-K, filed with the Securities and Exchange Commission on April 30, 2012.
|
|
(26)
|
Filed as Exhibits 10.1, 10.2, 10.3, 10.4, 10.5 and 10.6 to the Registrant’s Current Report on Form 8-K, filed with the Securities and Exchange Commission on May 1, 2013.
|
131
SIGNATURES
Pursuant to the requirements of Section 13 or 15(d) of the Exchange Act, the registrant has duly caused this report to be signed on its behalf by the undersigned, thereunto duly authorized.
|
Dated: February 28, 2014
|
|
|
CENTRAL PACIFIC FINANCIAL CORP.
(Registrant)
|
|
|
/s/ John C. Dean
|
|
|
John C. Dean
President and Chief Executive Officer
|
Pursuant to the requirements of the Exchange Act, this report has been signed below by the following persons on behalf of the registrant in the capacities and on the dates indicated.
|
Signature
|
Title
|
Date
|
||
|
/s/ John C. Dean
|
President and Chief Executive Officer
|
February 28, 2014
|
||
|
John C. Dean
|
(Principal Executive Officer)
|
|||
|
/s/ Denis K. Isono
|
Executive Vice President and Chief Financial
|
February 28, 2014
|
||
|
Denis K. Isono
|
Officer (Principal Financial and Accounting Officer)
|
|||
|
/s/ Alvaro J. Aguirre
|
Director
|
February 28, 2014
|
||
|
Alvaro J. Aguirre
|
||||
|
/s/ James F. Burr
|
Director
|
February 28, 2014
|
||
|
James F. Burr
|
||||
|
/s/ Christine H. H. Camp
|
Director
|
February 28, 2014
|
||
|
Christine H. H. Camp
|
||||
|
/s/ Earl E. Fry
|
Director
|
February 28, 2014
|
||
|
Earl E. Fry
|
||||
|
/s/ Paul J. Kosasa
|
Director
|
February 28, 2014
|
||
|
Paul J. Kosasa
|
||||
|
/s/ Duane K. Kurisu
|
Director
|
February 28, 2014
|
||
|
Duane K. Kurisu
|
||||
|
/s/ Colbert M. Matsumoto
|
Director
|
February 28, 2014
|
||
|
Colbert M. Matsumoto
|
||||
|
/s/ Crystal K. Rose
|
Director
|
February 28, 2014
|
||
|
Crystal K. Rose
|
132
TABLE OF CONTENTS
Part 1Item 1. BusinessItem 1A. Risk FactorsItem 1B. Unresolved Staff Comments NoneItem 1B. Unresolved Staff CommentsItem 2. PropertiesItem 3. Legal ProceedingsItem 4. Mine Safety DisclosuresPart IIItem 5. Market For Registrant S Common Equity, Related Shareholder Matters and Issuer Purchases Of Equity SecuritiesItem 6. Selected Consolidated Financial DataItem 7. Management's Discussion and Analysis Of Financial Condition and Results Of OperationsItem 7A. Quantitative and Qualitative Disclosures About Market RiskItem 8. Financial Statements and Supplementary DataItem 9. Changes in and Disagreements with Accountants on Accounting and Financial DisclosureItem 9A. Controls and ProceduresItem 9B. Other Information NoneItem 9B. Other InformationPart IIIItem 10. Directors, Executive Officers and Corporate GovernanceItem 11. Executive CompensationItem 12. Security Ownership Of Certain Beneficial Owners and Management and Related Stockholder MattersItem 13. Certain Relationships and Related Transactions, and Director IndependenceItem 14. Principal Accountant Fees and ServicesPart IVItem 15. Exhibits and Financial Statement Schedules