CHINA PHARMA HOLDINGS, INC.
10-Ks and 10-Qs
|
|
|
|
|
|
|
|
|
|
|
|
|
|
|
|
|
|
|
|
|
|
|
|
|
|
|
|
|
|
|
|
|
|
|
|
|
|
|
|
|
|
|
|
|
|
|
|
|
|
|
|
|
|
|
|
UNITED STATES
SECURITIES AND EXCHANGE COMMISSION
Washington, DC 20549
FORM 10-K
x
ANNUAL REPORT PURSUANT TO SECTION 13 OR 15(d)
OF THE SECURITIES EXCHANGE ACT OF 1934
For the fiscal year ended December 31, 2011
or
¨
TRANSITION REPORT UNDER SECTION 13 OR 15(d) OF
THE SECURITIES EXCHANGE ACT OF 1934
For the transition period from _________ to _____________
Commission file number:
001-34471
China Pharma Holdings, Inc.
(Exact name of registrant as specified in its charter)
|
Delaware
|
73-1564807
|
|
(State or other jurisdiction of
incorporation or organization)
|
(IRS Employer Identification No.)
|
Second Floor, No. 17, Jinpan Road
Haikou, Hainan Province, China 570216
(Address of Principal Executive Offices) (Zip Code)
Registrant’s telephone number:
(011) 86 898-6681-1730
Securities registered pursuant to Section 12(b) of the Act:
Common Stock, par value $0.001 per share
Securities registered pursuant to Section 12(g) of the Act:
None.
Indicate by check mark if the registrant is a well-known seasoned issuer, as defined in Rule 405 of the Securities Act.
Yes
¨
No
x
Indicate by check mark if the registrant is not required to file reports pursuant to Section 13 or Section 15(d) of the Exchange Act. Yes
¨
No
x
Indicate by check mark whether the registrant (1) has filed all reports required to be filed by Section 13 or 15(d) of the Securities Exchange Act of 1934 during the preceding 12 months (or for such shorter period that the registrant was required to file such report(s)), and (2) has been subject to such filing requirements for the past 90 days. Yes
x
No
¨
Indicate by check mark whether the registrant has submitted electronically and posted on its corporate Web site, if any, every Interactive Data File required to be submitted and posted pursuant to Rule 405 of Regulation S-T (§ 232.405 of this chapter) during the preceding 12 months (or for such shorter period that the registrant was required to submit and post such files). Yes
x
No
¨
Indicate by check mark if disclosure of delinquent filers pursuant to Item 405 of Regulation S-K is not contained herein, and will not be contained, to the best of Registrant’s knowledge, in definitive proxy or information statements incorporated by reference in Part III of this Form 10-K or any amendment to this Form 10-K.
x
Indicate by check mark whether the registrant is a large accelerated filer, an accelerated filer, a non-accelerated filer or a smaller reporting company. See definitions of “large accelerated filer,” “accelerated filer,” and “smaller reporting company” in Rule 12b-2 of the Exchange Act.
|
Large accelerated filer
o
|
Accelerated filer
o
|
|
Non-accelerated filer
o
Do not check if a smaller reporting company
|
Smaller reporting company
x
|
Indicate by check mark whether the registrant is a shell company (as defined in Rule 12b-2 of the Exchange Act). Yes
¨
No
x
The aggregate market value of the voting and non-voting common equity held by non-affiliates computed by reference to the price at which the common equity was last sold, or the average bid and ask price of such common equity, as of the last business day of the registrant’s most recently completed second fiscal quarter: $43,652,399 as of June 30, 2011, based on the closing price of $2.25 of the Company’s common stock on such date.
The number of outstanding shares of the registrant’s common stock on March 12, 2012 was 43,529,557.
Documents Incorporated by Reference: None.
FORM 10-K ANNUAL REPORT
FISCAL YEAR ENDED DECEMBER 31, 2011
TABLE OF CONTENTS
|
PAGE
|
||||
|
PART I
|
||||
|
Item 1.
|
Business.
|
2 | ||
|
Item 1A.
|
Risk Factors.
|
18 | ||
|
Item 1B.
|
Unresolved Staff Comments.
|
40 | ||
|
Item 2.
|
Properties.
|
40 | ||
|
Item 3.
|
Legal Proceedings.
|
|||
|
Item 4.
|
Mine Safety Disclosures.
|
41 | ||
|
PART II
|
||||
|
Item 5.
|
Market for the Registrant’s Common Equity, Related Stockholder Matters and Issuer Purchases of Equity Securities.
|
41 | ||
|
Item 6.
|
Selected Financial Data
|
42 | ||
|
Item 7.
|
Management’s Discussion and Analysis of Financial Condition and Results of Operations.
|
43 | ||
|
Item 7A.
|
Quantitative and Qualitative Disclosures about Market Risk.
|
54 | ||
|
Item 8.
|
Financial Statements and Supplementary Data.
|
54 | ||
|
Item 9.
|
Changes in and Disagreements with Accountants on Accounting and Financial Disclosure.
|
54 | ||
|
Item 9A.
|
Controls and Procedures.
|
54 | ||
|
Item 9B.
|
Other Information.
|
56 | ||
|
PART III
|
||||
|
Item 10.
|
Directors, Executive Officers and Corporate Governance.
|
56 | ||
|
Item 11.
|
Executive Compensation.
|
58 | ||
|
Item 12.
|
Security Ownership of Certain Beneficial Owners and Management and Related Stockholders Matters.
|
62 | ||
|
Item 13.
|
Certain Relationships and Related Transactions, and Director Independence.
|
64 | ||
|
Item 14.
|
Principal Accountant Fees and Services.
|
64 | ||
|
PART IV
|
||||
|
Item 15.
|
Exhibits, Financial Statement Schedules.
|
65 | ||
|
SIGNATURES
|
66 | |||
|
EXHIBIT INDEX
|
||||
|
FINANCIAL STATEMENTS
|
F-1 - F-20
|
|||
FORWARD-LOOKING STATEMENTS
The statements contained in this report with respect to our financial condition, results of operations and business that are not historical facts are “forward-looking statements”. Forward-looking statements can be identified by the use of forward-looking terminology, such as "anticipate", "believe", "expect", "plan", "intend", "seek", "estimate", "project", "could", "may" or the negative thereof or other variations thereon, or by discussions of strategy that involve risks and uncertainties. Management wishes to caution the reader of the forward-looking statements that any such statements that are contained in this report reflect our current beliefs with respect to future events and involve known and unknown risks, uncertainties and other factors, including, but not limited to, economic, competitive, regulatory, technological, key employees, and general business factors affecting our operations, markets, growth, services, products, licenses and other factors, some of which are described in this report including in “Risk Factors” in Item 1A and some of which are discussed in our other filings with the SEC. These forward-looking statements are only estimates or predictions. No assurances can be given regarding the achievement of future results, as actual results may differ materially as a result of risks facing our company, and actual events may differ from the assumptions underlying the statements that have been made regarding anticipated events.
These risk factors should be considered in connection with any subsequent written or oral forward-looking statements that we or persons acting on our behalf may issue. All written and oral forward looking statements made in connection with this report that are attributable to our company or persons acting on our behalf are expressly qualified in their entirety by these cautionary statements. Given these uncertainties, we caution investors not to unduly rely on our forward-looking statements. We do not undertake any obligation to review or confirm analysts’ expectations or estimates or to release publicly any revisions to any forward-looking statements to reflect events or circumstances after the date of this report or to reflect the occurrence of unanticipated events, except as required by applicable law or regulation.
Notwithstanding the above, Section 27A of the Securities Act of 1933, as amended (the “Securities Act”) and Section 21E of the Securities Exchange Act of 1934, as amended (the “Exchange Act”) expressly state that the safe harbor for forward-looking statements does not apply to companies that issue penny stock. If we are ever considered to be an issuer of penny stock, the safe harbor for forward-looking statements may not apply to us at certain times.
1
Overview
We are principally engaged in the development, manufacture and marketing of pharmaceutical products for human use in connection with a variety of high-incidence and high-mortality diseases and medical conditions in the People’s Republic of China (the “PRC”). All of our operations are conducted in the PRC, where our manufacturing facilities are located. We manufacture pharmaceutical products in the form of dry powder injectibles, liquid injectibles, tablets, capsules, oral solutions and granules. All of our pharmaceutical products are sold on a prescription basis and have been approved for at least one or more therapeutic indications by the Chinese State Food and Drug Administration (the “SFDA”) based upon demonstrated safety and efficacy.
At December 31, 2011, we manufactured 20 pharmaceutical products for a wide variety of diseases and medical indications,
each of which may be classified into one of three general categories:
|
·
|
a basic generic drug, which is a common drug in the PRC marketplace for which there is a very large market;
|
|
·
|
a first-to-market generic drug, which is a generic Western drug that is new to the PRC marketplace; or
|
|
·
|
a modern Traditional Chinese Medicine, which generally is a non-synthetic, plant-based medicinal compound of the type that has been widely used in the PRC for thousands of years, to which we apply modern production techniques to produce a pharmaceutical product in different formulations, such as tablets, capsules or powders.
|
In selecting generic drugs to develop and manufacture, we consider several factors, including the number of other manufacturers currently producing the particular drug, the size of the market, the proposed or required method of distribution, the existing and expected pricing for the particular drug in the marketplace, the costs of manufacturing that drug, and the costs of acquiring or developing the formula for that drug. We believe we have historically selected generic drugs to manufacture that have large addressable markets and higher profit margins relative to other drugs being manufactured and distributed in the PRC.
In 2002, we built, and we currently own and operate an approximately 8,000-square-meter manufacturing facility in Haikou, Hainan Province that supports eight modern, scalable production lines. We implement quality control procedures in compliance with China’s Good Manufacturing Practice, or GMP standards, and applicable SFDA regulations to ensure consistent quality in our products.
We market and sell our products through 16 sales offices covering all major cities and provinces in the PRC. To comply with applicable Chinese law relating to sales of prescription drugs to certain hospitals and clinics, we also use a distribution system comprised of approximately 1875 independent regional distributors. We have grown significantly in recent years, with our net revenues increasing from $21.8 million in 2006 to $81.2 million in 2011, representing a compound annual growth rate(“CAGR”)of 30% during that period. Our net income increased from $8.6 million in 2006 to $19.3 million in 2011, representing a CAGR of 18% during that period.
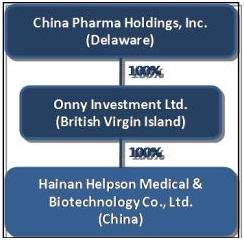
Corporate History
We are a holding company and conduct substantially all of our production, marketing, finance, development and administrative activities through our wholly-owned subsidiary located in the PRC. We were incorporated in the state of Delaware under the name “Softstone, Inc.” on January 28, 1999. From mid-2003 to October 19, 2005, we did not generate any significant revenue and we accumulated no significant assets as we explored business opportunities as a publicly-held “shell” corporation.
We entered into our current line of business on October 19, 2005 by acquiring Onny Investment Limited, a holding company formed in the British Virgin Islands (“Onny”), and its operating subsidiary located in the PRC, Hainan Helpson Medical & Biotechnology Co., Ltd. (“Helpson”). On March 16, 2006, we changed our corporate name to China Pharma Holdings, Inc.
Helpson was established in Haikou, Hainan Province, PRC as a foreign-invested enterprise on February 25, 1993. The company was originally an “equity joint venture,” as defined by China’s laws on foreign invested enterprises, between Haikou Biomedical Engineering Co., Ltd., a PRC company, and Hong Kong Fudao Development Co., Ltd., a Hong Kong company (“Fudao”).
On June 16, 2001, Fudao entered into an Equity Interest Transfer Agreement with Hainan Kaidi Science and Technology Co., Ltd., a PRC company (“Kaidi”), pursuant to which Fudao transferred all of its ownership interest in Helpson to Kaidi. As a result of such transfer, Helpson became a PRC domestic company, rather than a foreign-invested company.
Onny was incorporated on January 12, 2005 under the laws of the British Virgin Islands. On May 25, 2005, the then-existing three shareholders of Helpson entered into an equity interest transfer agreement with Onny, as a result of which, effective as of June 21, 2005, Helpson became a wholly foreign-owned enterprise (WFOE) and Onny became the sole stockholder of Helpson.
2
On October 19, 2005, we acquired all of the issued and outstanding shares of Onny in exchange for 27,499,940 shares of our common stock and became Onny’s sole stockholder. In connection with such share exchange, all of our officers and directors at that time resigned as officers and directors of our company, and new directors and executive officers were appointed. In addition, as a result of such share exchange, which is commonly referred to as a “reverse acquisition,” Helpson became our indirect wholly-owned subsidiary.
Our corporate organizational chart is set forth below.
Industry Background and Market Opportunities
The Chinese pharmaceutical industry has been a key contributor to the PRC’s impressive economic growth. According to the State Food and Drug Administration (SFDA) information center, the Chinese pharmaceutical market size has grown from RMB157.2 billion in 2000 to RMB619.4 billion in 2009.Furthermore, according toa report from IMS Health, a leading consulting firm focusing on healthcare and pharmaceutical areas,
Asian, Australian and Chinese Pharmaceutical Market 2010-2014 Forecast
released on September 2010, the pharmaceutical market in China was expected to grow by a CAGR of 23.2%, and to reach US$ 90 billion in 2014. According to the report, this projected growth is supported by the strong growth in the Chinese economy, the aging population, increasing rate of chronicdisease in the PRC,the recent health care reform, and improvements in intellectualproperty right protection in the PRC.
3
The Chinese pharmaceutical market is highly fragmented with over 4,900 pharmaceutical manufacturers (including Active Pharmaceutical Ingredient(API) manufacturers) comprised of a number of larger state-owned enterprises and a large number of small enterprises. We believe this fragmentation provides opportunities for better managed and more financially sound companies to gain market share by using comparatively strong technical, manufacturing and marketing abilities. In addition, regulatory agencies in the PRC have introduced a series of new regulations to control the standards and quality of manufacturing and distribution in the pharmaceutical industry. These new regulations require companies to obtain government-recognized manufacturing and distribution licenses, and good manufacturing practice (GMP) and good sales practice certificates, and have resulted in the elimination of many small or poorly-managed companies. We believe this new regulation will precipitate consolidation opportunities in the pharmaceutical industry and a generally more favorable competitive environment for our company.
According to the State Food and Drug Administration (SFDA) information center, the total sales from hospital pharmacies reached RMB 442.8 billion in 2010, which represented an increase of 20% compared to the previous year. Due to the impact of health care reform in China, the medicine prices overall in hospital pharmacies havefallen, and the growth rate of the sales in hospital pharmacies has slowed. Instead, the rural area has become a fast growing segment for pharmaceutical products as the healthcare reform continues to expand government subsidies for the rural population.
We expect China’s healthcare spending to rise significantly in relation to its rapidly-growing GDP and to become more aligned with international standards. Growth drivers, such as the rapidly growing economy, increased income levels and rising living standards, increasing health consciousness, an aging population and life style-related diseases are expected to positively affect China’s healthcare spending. We believe the increased healthcare spending by the Chinese government to reform the healthcare system has already greatly improved the accessibility of and desire for medical care. We also believe the Chinese government’s increased spending on the rural market will be another driving force for our future growth.
National Medical Insurance Program
. The National Medical Insurance Program (the “NMIP”), introduced in 1999, is the largest medical insurance program in the PRC. According to the data released at a working conference of the National Health Care Reform Office, the number of participants enrolled in this program increased significantly to 1.3billion, or 95% of the Chinese population, in 2011. The subsidy under the NMIP increased from RMB120 per capitaper year in 2010to RMB200 per capitaper year in 2011, and the reimbursement rate increased from 60% to 70% over that period.
The NMIP is funded primarily by central and provincial governments and, to a lesser degree, by program participants and their employers. The program has two types of accounts: individual accounts and social pool accounts. Each participant has an individual account that holds all contributions from the participant and 30% of the contributions from his or her employer. The amounts of the employer’s and the participant’s contributions are determined as fixed percentages of the participant’s salary. An increase in the participant’s salary will increase the size of both contributions to the participant’s individual account, subject to a fixed monthly cap that varies from city to city and may be adjusted from year to year. A participant may claim reimbursement from his or her individual account for prescription medicines, OTC medicines and other out-patient and in-patient medical expenses. The maximum amount available for reimbursement for an individual program participant is capped at a level equal to the balance in that individual’s account. In addition to individual accounts, the NMIP in each province also includes a social pool account, which holds the contributions from the provincial government as well as the remaining 70% of employer contributions. The social medical expense pool is used to pay for hospitalization costs and in-patient related charges incurred by the participants, subject to certain co-payments, exclusions and limitations. Other than in the relatively more affluent eastern provinces in China, many provincial governments have not fully funded the provincial social medical expense pools, which results in delay or failure in reimbursing the hospitalization costs and other in-patient related expenses of the NMIP participants.
4
The SFDA promulgated
Good Manufacturing Practices for Pharmaceutical Products (2010 revised version)
(the “new GMP”)on February 12, 2011, which became effectiveon March 1, 2011. The new GMP standards outline the basic principles and standards for the manufacturing of pharmaceutical products andthe management of quality controls in the manufacturing processin the PRC. Since it was first enacted in 1988, GMP has over two decades of history in China, and went through two revisions in 1992 and 1998. As of June 30, 2004, manufacturing of all active pharmaceutical ingredients (API) and finished dosage must be in compliance withthe GMP standards. The new GMP standardsthatbecame effective on March 1, 2011 include improvements based upon foreign manufacturing advancements, and has taken into consideration of localconditions in China. Based on the principle of “equal importance between hardware and software”,strictly implementingthe idea ofrisk control during the manufacturing process of pharmaceutical products, and more focus onscientificguidanceand operability, the new GMP standardsareconsistent with theWorld Health Organization (WHO) standards.
The four main characteristics of the new GMP standards are: (1) strengthening the establishment of the quality control system during the manufacturingprocess of pharmaceutical products by significantly increasingthe requirements on quality control software; (2) improving the requirements on the quality of practioners; (3) refining operation procedures, rules on document management, includingmanufacturing records, improvingguidanceand operability; (4) furtherimprovement related to measuresto ensure the safety of pharmaceutical products.
The new GMP standardsbecame effectiveon March 1, 2011and existingpharmaceutical manufacturers (except manufacturers of injectables, blood products, or vaccines, which havea three-year grace period) have a five-year grace period to upgrade existing facilities to comply with the revisions.
Healthcare Reform
. In September 2008, the State Council of China published a draft plan to ease the difficulties and minimize the costs for Chinese citizens to obtain proper healthcare treatment. On March 17, 2009, the PRC government issued an Opinion on “Deepening the Healthcare System Reform”. The State Council subsequently released the Notice on Important Implementing Plans for the Healthcare System Reform 2009-2011. The goal of the healthcare reform plan is to establish a basic, universal healthcare framework to provide safe, efficient, convenient and affordable healthcare to urban and rural residents.
The five major goals in the RMB 850 billion healthcare reform plan for 2009 -2011 (which will be increased to RMB 1.13 trillion according to a statement made by the Vice Minister of Finance in March 2011, ) include: i) expanding basic medical insurance coverage, ii) establishing a national essential drug list (EDL) system, iii) improving grassroots medical infrastructure, iv) providing more equitable access to basic healthcare services, and v) carrying out public hospital pilot reforms.Approximately 45% of the government’sRMB850 billionhas beenspent on expanding the public medical insurance system (especially to cover the previously uncovered rural population), while about a quarter of the amount has been spent on upgrading and constructing medical institutions– especially country-level hospitals and rural clinics.Although the timeframe for implementing the three-year healthcare reform has been concluded, the government’s commitment to invest heavily in healthcare is expected toremain in place during the 12
th
Five-Year Plan and beyond. Over time, the PRC government is committed to bringing down the amount of out-of-pocket expensesfor individuals to less than 30% of the total cost during the 12
th
Five-Year Plan period and aims to provide universal access to a range of a healthcare services by 2020.
Our Strategy
We believe we are well positioned in a rapidly-growing industry in one of the fastest-growing economies in the world. We have grown rapidly in recent years and currently manufacture a number of off-patent branded generic drugs that were among the first to market in the PRC. We expect to continue to gain additional competitive advantages through the growing pipeline of new pharmaceutical products we are developing for specific target patient groups. Our diverse portfolio of products and our new product pipeline include products for high-incidence and high-mortality conditions in China, including cardiovascular, central nervous system (CNS), infectious and digestive diseases. Furthermore, the Healthcare Reforminitiated by the State Councilin 2008 in China hassignificantlyexpanded the landscape of healthcare industry in China.For example, 627 new hospitals were built in 2010, bringing the total number of hosiptals in China to 20,918. The increase in demand from these sources should allow us to continue to grow organically. In addition, new products from our pipeline of products under development (such as the generic version of Crestor and novel anti-drug-resistant combination antibiotics) wouldoffer us significant growth opportunities if these products wereapproved for manufacture and sale in the PRC. Finally, the Healthcare Reform has started to change the landscape of the Chinese pharmaceutical industry, which we believe will create many attractive acquisition opportunities. We plan to explore these opportunities in an effort to add synergistic products that can help us continue to grow at rates that are commensurate with our historical rate of growth.
Our objective is to become a market leader in the PRC for the development, manufacture and commercialization of pharmaceutical products. We intend to achieve this objective by:
|
·
|
Promoting Our Existing Brands to Increase Our National Recognition
. We intend to support and grow the existing recognition and reputation of our brands and to maintain our branded pricing strategy through continued sales and marketing efforts. To achieve this goal, we plan to promote the efficacy and safety profile of our established prescription pharmaceutical products to physicians at hospitals and clinics in all provinces in the PRC through the efforts of our sales force and our independent distributors and through educational physician conferences and seminars.
|
5
|
·
|
Developing and Introducing Additional Products to Expand or Strengthen Our Existing Product Portfolio
. We plan to focus our development capabilities towards expanding our existing portfolio of approved products. We have a number ofproducts in various stages of the SFDA approval process. In addition, we intend to conduct clinical trials for new generic or modernized products and product line extensions for our existing products. We plan to introduce new generic or modernized products to leverage our branded market leadership position, particularly in the therapeutic areas in which we already have a strong presence.
|
|
·
|
Expanding Our Distribution Network For Further Market Penetration
. We intend to expand our reach beyond our current 16 offices in the PRC to drive additional growth of our existing and future products. We currently contract with over 1,875distributors in the PRC and plan to expand upon these relationships to target new markets. In addition, we plan to continue to broaden our marketing efforts outside of major cities in the PRC and increase our market penetration in cities and rural areas in which we already have a presence. Over the long term, we also intend to expand our presence beyond the PRC to international markets by working with international pharmaceutical companies in cross selling our products.
|
|
·
|
Acquiring Complementary Products Lines, Technologies, Distribution Networks and Companies
. We intend to selectively pursue strategic acquisition opportunities that we believe will grow our customer base, expand our product lines and distribution network, enhance our manufacturing and technical expertise or otherwise complement our business or further our strategic goals. Pursuing strategic acquisitions is a significant component of our growth strategy.
|
Products
We currently have a product portfolio of 20 pharmaceutical productsthat address a wide variety of diseases and medical indications. All of our pharmaceutical products have demonstrated safety and efficacy in clinical trials sufficient to obtain approval by the SFDA and are sold on a prescription basis. The following table summarizes the approved indications for our marketed pharmaceutical products and the year in which each of such products was first marketed to our customers.
6
|
Product
|
Indication
|
Year of
Commercial
Launch
|
||
|
Central Nervous System (CNS)
and Cerebral-Cardiovascular Diseases
|
||||
|
Cerebroprotein Hydroloysate Injection
|
Memory decline and attention deficit disorder caused by the sequela of craniocerebral trauma and cerebrovascular diseases.
|
1996
|
||
|
Buflomedil Hydrochloride
|
Peripheral blood vessel diseases, including intermission claudication, Renaud syndrome and blood vessel convulsion.
|
2002
|
||
|
Gastrodin Injection
|
Tiredness, loss of concentration, poor sleep (the “declined spirit” syndrome), and for traumatic syndromes of the brain, including vertigo, neuralgia and headaches.
|
2005
|
||
|
Propylgallate for Injection
|
Cerebral thrombosis, coronary heart disease and complication after surgery-thrombus deep phlebitis.
|
2006
|
||
|
Ozagrel Sodium for Injection
|
Cerebral thrombosis, coronary heart disease and complication after the surgery-thrombus deep phlebitis.
|
2006
|
||
|
Alginic Sodium Diester Injection
|
Ischemic heart disease, cerebrovascular diseases (cerebral thrombosis, cerebral embolism and coronary heart disease) and high lipoprotein blood disease.
|
2006
|
||
|
Bumetanide for Injection
|
Various edema diseases (including those associated with heart failure, hepatic cirrhosis, nephropathy, and pulmonary edema), hypertension, acute renal failure, hyperkalemia, hypercalcemia and for the rescue of acute drug poisoning.
|
2007
|
||
|
Anti-infection and Respiratory Diseases
|
||||
|
Roxithromycin Dispersible Tablets
|
Pharyngitis and tonsillitis caused by Streptococcus pyogenes; sinusitis, tympanitis, acute and chronic bronchitis caused by acute bacteria, Mycoplasma pneumonia and Chlamydia pneumoniae; urethritis and cervical infection caused by chlamydia trachomatis; skin soft tissue infection caused by sensitive bacteria.
|
1995
|
||
|
Cefaclor Dispersible Tablets
|
Tympanitis, lower respiratory tract infection, urinary tract infections and skin/skin tissue infection.
|
2002
|
||
7
|
Product
|
Indication
|
Year of
Commercial
Launch
|
|
|
Cefalexin Capsules
|
Acute tonsillitis caused by sensitive fungi, airway infections, such as pharyngitis, otitis media, nasal sinusitis and bronchitis; pneumonia, respiratory tract infection, urinary tract infections and skin soft tissue infections.
|
2002
|
|
|
Anhydroandrographolide
|
Ischemic heart disease, cerebrovascular diseases (cerebral thrombosis, cerebral embolism and coronary heart disease) and high lipoprotein blood disease.
|
2003
|
|
|
Clarithromycin Granules and Capsules
|
Nasopharynx infection, lower respiratory tract infection, skin tissue infection, acute tympanitis and mycoplasma pneumonia caused by clarithromycin susceptible organisms; urethritis and cervical infection caused by chlamydia trachomatis; and the treatment of legionella infection, mycobacterium avium complex (MAC) infection and helicobacter pylori infection.
|
2004
|
|
|
Naproxen Sodium and Pseudophedrine Hydrochlorida Sustained Release Tablets
|
Relieve cold, sinus and flu symptoms, blocked nose caused by anaphylaxis rhinitis, runny nose, fever, sore throat, symptoms of myalgia in the limbs and pain around the joints.
|
2005
|
|
|
Gull Wood Extract Syrup
|
Detoxicating, anti-inflammatory, quickly reducing swelling, for the indication of acute tonsillitis, acute pharyngitis, acute conjunctivitis, and upper respiratory tract infection.
|
2010
|
|
|
Digestive Diseases
|
|||
|
Hepatocyte Growth-promoting Factor for Injection
|
Serious viral hepatitis symptoms caused by various viral hepatitis types (acute, subnormal temperature, chronic serious disease early or middle period of hepatitis).
|
2005
|
|
|
Tiopronin
|
Acute and chronic Hepatitis B, and for the relief of drug-induced liver injury.
|
2009
|
|
|
Compound Ammonium Glycyrrhetate S for Injection
|
Liver dysfunction caused by acute and chronic hepatitis; supplemental treatment to toxic/trauma hepatitis, liver cancer; also for the indication of food/drug poisoning, and drug allergy.
|
2009
|
|
|
Omeparzole
|
Gastroesophageal reflux disease, and other conditions caused by excess acidic formulations in the stomach, including gastric ulcers, recurrent duodenal ulcers and Zollinger-Ellison Syndrome.
|
2009
|
|
|
Others
|
|||
|
Vitamin B6 for Injection
|
Vitamin supplement.
|
2005
|
|
|
Granisetron Hydrochloride Injection
|
Nausea and vomiting caused by radiotherapy and chemotherapy during the treatment of malignant tumors.
|
2006
|
|
8
In addition to our pharmaceutical products, we also manufacture Recombined Human Fibroblast Growth Factor (rhaFGF), which is used by other companies in the manufacture of products for the repair of wounded skin cells. We sell this product only to distributors for resale to other manufacturers as an active pharmaceutical ingredient, for the production of cosmetics.
None of our products accounted for more than 12% of our net revenues in the year ended December 31, 2011.
The following table sets forth the aggregate amount and percentage of our revenues attributed to our product portfolio by indication group in the years ended December 31, 2010and 2011.
|
Product Category
|
Twelve Months Ended December 31
|
Net Change
Amount
(in millions)
|
% Change
|
|
|
2011
Amount
(in millions)
|
2010
Amount
(in millions)
|
|||
|
CNS Cerebral & Cardio Vascular
|
$ 25.8
|
$ 23.9
|
$ 1.9
|
8%
|
|
Anti-Viro/ Infection & Respiratory
|
$ 32.0
|
$ 27.1
|
$ 4.9
|
18%
|
|
Digestive Diseases
|
$ 12.4
|
$ 9.3
|
$ 3.1
|
33%
|
|
Other
|
$ 11.0
|
$ 14.1
|
-$ 3.1
|
-22%
|
Due to the nature of the pharmaceutical industry, we continually strive to change our product portfolio to respond to changes in market demand. Based on the foundation established by a number of our widely-recognized prescription products, such as Cefaclor, Roxithromycin and Buflomedil, we have launched and will continue to launch a variety of medicines. The core criteria for our selection of potential pipeline products are strong market demand, proven efficacy and safety. In an effort to gain an advantage in the marketplace, we often seek to improve the production process of the new generic products we elect to manufacture or to strengthen the quality of a proposed product to increase its efficacy.
We also adjust the delivery system and marketing for each of our products based on the product’s target patient group. We believe that maintaining a variety of delivery systems (e.g. tablet, capsule, granule, injectable and dry powder ) for certain of our products targeted at different groups enhances our competitive position in the marketplace. As a result, our sales and marketing personnel work closely with management and our research and development personnel to determine which of our products can successfully be marketed in more than one delivery system and which generics in the marketplace may be a good candidate for us to try to manufacture and distribute in the marketplace using a different delivery system.
9
Product Development
Our product portfolio includes both branded and generic drugs that we either developed or were developed by us in joint research efforts with our academic institutional partners or, to a lesser extent, acquired from third parties. We develop new products in-house as well as through relationships with several research institutes, including the Chinese Academy of Sciences, China University of Pharmaceuticals, Sichuan University, Chongqing Medical Industry Institute and the Military Medical Academy Basic Medical Science Institute. We only pay these institutes for their research efforts and expenses if the research goals are accomplished, including certification of an applicable drug candidate and approval of drug production by the SFDA. Following our receipt of such certification and approval, the rights to the applicable drug candidate are transferred to us. Following any such payment and transfer, we are the sole owner the drug certifications and/or approvals and any related research and we have no further payment or other obligations to the research institute from which we acquired such assets. For example, we obtained certificates and approvals of drug production for our Naproxen Sodium and Pseudophedrine Hydroclorida sustained release tablets through our cooperative relationship with the Chongqing Medical Industry Institute, and obtained certificates and approvals of drug production for our Cefalcor dispersible tablets through our cooperative relationship with the China University of Pharmaceuticals, both of which drugs we are now manufacturing and selling. We expect to continue to develop additional new drugs under this method. We also intend to continue purchase or license drug products from third parties on a limited basis, as we regard this as an important and effective means for us to develop our business.
As of December 31, 2011, the product candidates that we are developing at different stages include the following:
|
Indication of Product Candidate
|
SFDA Status
|
|
|
Anti Infection
|
In Phase II Clinical Study
|
|
|
Cholesterol Control Drug
|
Clinical Trial Completed. Waiting for Production Approval
|
|
|
Alzheimer's disease drug
|
In SFDA Technical Review
|
|
|
High Blood Pressure Drug
|
Clinical Trial Completed. Waiting for Production Approval
|
|
|
Coronary Heart Disease Drug
|
In Phase III Clinical Study
|
|
|
New medicine delivery technology
|
In Technical Transfer; may or may not need clinical trial
|
|
|
Hepatitis Drug
|
Received Clinical Approval, preparing for Clinical
|
|
|
Central nervous system drug
|
Received Clinical Approval, preparing for Clinical
|
|
|
Cerebral vascular drug
|
In Technical Transfer; may or may not need clinical trial
|
Our drug formula development and acquisition expenditures were $5.3 million and $10.4 million in the years ended December 31, 2011 and 2010, respectively, which represented 7% and 14% of our revenues for such years, respectively.
We believe the first products to market from our product candidates will be Candesartan, which is prescribed for the treatment for high blood pressure, and Rosuvastatin, which is a generic form of Crestor® used in the treatment of hyperlipidemia, or high cholesterol.
Anti-Drug-Resistant Cephalosporin(anti-infection drug)
. Cephalosporin continues to be the most widely prescribed class of antibiotics in China. According to the SFDA, approximately 50% of antibiotic sales are derived from cephalosporin. According to Chinese industry publications, sales of cephalosporin antibiotics in China were estimated by the SFDA to be over $11 billion in 2012 and $17.4 billion in 2015. Due to broad usage of antibiotics, including cephalosporin, drug resistance has become a significant issue in China. We believe our new combination antibiotic possesses substantial competitive advantages in this environment. The SFDA will designate our combination antibiotic as a Class 1 drug, which carries a five-year exclusivity when the SFDA approval is obtained. The clinical trials for our cephalosporin product candidate commenced in November 2008, and we are currently in phase II of clinical trials. We anticipate the launch of this product sometime in 2013.
10
Distribution and Customers
We believe we have a well-developed sales network. As our current pharmaceutical product portfolio is comprised only of prescription drugs, our major sales targets are hospitals. To comply with applicable Chinese law relating to sales of prescription drugs to certain hospitals and clinics, we use a distribution system comprised of approximately 1,875independent regional distributors. At December 31, 2011, we also had 16 sales offices covering all major provinces of China, and 140sales representatives who assist in managing many of our relationships with hospitals, doctors and local drug distributors. Overall, our distribution model is rather flat, with relatively few intermediaries compared to many other pharmaceutical companies in China
.
Due to this advantage, we believe we are able to keep our selling cost down and our net profit margin higher than the industry average.
Due to the nature of our products and current governmental regulations, all of our customers are located in the PRC. We have established long-standing relationships with most of our key customers as our operating subsidiary, Helpson, was formed in 1993. For the year ended December 31, 2011, one customer accounted for 20.4%of our revenues and one customer accounted for 10.2%of our accounts receivable.
Production Facilities
We manufacture and package our products at our manufacturing facility in the Haikou Free Trade Zone in Haikou, Hainan Province. Our manufacturing facility, which was built in 2002, is approximately 8,000 square meters and has eight production lines for different forms including: tablets, capsule, granule, dried power, liquid injectable, Cephalosporins (specifically designated), chemical API, and biological API. This facility is in compliance with GMP standards in China and has five GMP certificates that remain valid until May 7, 2013, August 10, 2013, September 20, 2014, February 9, 2015 andDecember31, 2015,respectively.In order to meet the new GMP standardsthat became effective in March 2011, we are preparing to upgrade our production facilities and bring them in line with the new GMP standards before the end of the three-year grace period for injectables and five-year grace period for all other products.
Each of our eight production lines meets GMP guidelines promulgated in 1998. Two of our production lines are used only for the production of active pharmaceutical ingredients, or API, that are used in the production of certain of our products. The following table sets forth the capacity utilization rates for our eight pharmaceutical production lines for the years ended December 31, 2010and 2011.
|
Capacity Utilization Rate
|
||
|
Production Line
|
2010
|
2011
|
|
Tablet
|
75%
|
75%
|
|
Capsule
|
65
|
55
|
|
Granule
|
82
|
89
|
|
Injectable
|
88
|
84
|
|
Dry Powder
|
75
|
82
|
|
Cephalosporins
|
85
|
90
|
|
Chemical API
|
62
|
65
|
|
Biological API
|
71
|
53
|
11
Raw Materials
We require a supply of a wide variety of raw materials to manufacture our products. We employ purchasing staff with extensive knowledge of our products who work with our product development, and formulations and quality control personnel to source raw materials for our products. Currently, we rely on numerous suppliers in the PRC and overseas to deliver our required raw materials and believe we have at least three principal suppliers for each of our most critical raw materials. In certain cases, we enter into arrangements with suppliers to hedge against the risk of shortages of supply, and have the capability and warehouse capacity to store such materials if we anticipate a shortage of such materials. Historically, we have not had difficulty obtaining raw materials from suppliers.For the year ended December 31, 2011, purchases from one supplier accounted for approximately 20.8%of raw material purchases. For the year ended December 31, 2010, purchases from three suppliers accounted for 40%, 12% and 11% of our raw material purchases, respectively.
Competition
We believe we have established a commercially competitive position in the highly-fragmented pharmaceutical industry in China through our core competitive advantages, as described below:
|
·
|
We have a highly-efficient commercialization process for new products, including significant experience with the SFDA registration process.
|
We have over 17 years of product-development experience during which time we have implemented processes to efficiently introduce and market new and existing products to the Chinese market. We have successfully obtained the final production approval from the SFDA for many pharmaceutical products, including eight new products in the past fiveyears.
|
·
|
We have a market-oriented product portfolio and product lines.
|
Our product focus is on developing and manufacturing medicines that help large patient groups, such as the infectious disease and cardio vascular disease patient groups. Our diversified GMP-certified manufacturing facility includes eight production lines targeting a variety of delivery mechanisms, such as tablets, capsules, granules, liquid-injectables and dried-powder-injectables, and enables us to effectively manufacture a broad range of new drugs.
|
·
|
We have product diversification to target specific sub-markets.
|
We attempt to differentiate our products from those of our competitors by changing, and, in many cases, improving, and certain physical aspects of our products to address different market segments. For example, to make our Cefaclor product more patient friendly to children and patients with swallowing problems, we added an enteric coating to make our tablets easier to swallow.
|
·
|
We have a national sales network and a highly-trained marketing team.
|
Our experienced sales team has the industry knowledge and know-how to synergistically combine our strong market insight with a successful commercialization platform.
|
·
|
We have developed high-quality relationships with leading hospital and clinic administrators and physicians.
|
While sales of our pharmaceutical products to hospitals are made through our distributors, we believe our long-term relationships with leading hospitals and healthcare clinics throughout China resulting from our long-term promotional efforts and periodic physician seminars improve the perception of our products in the marketplace and help us identify and select high-volume drugs to develop into new generic products relatively early in the process.
12
|
·
|
We cooperate effectively with a number of leading academic research institutions.
|
Through our cooperative efforts with our research partners we are able to develop new product candidates in a cost-effective manner and currently have a number of significant projects in active development in our pipeline.
Notwithstanding such favorable positioning, we are subject to intense competition. There are both local and overseas pharmaceutical enterprises that are engaged in the manufacture and sale of potential substitute or similar pharmaceutical products for sale in the PRC. These competitors may have more capital and better research and development resources, and manufacturing and marketing capability and experience than we do.
Our profitability may be adversely affected if
|
·
|
the number of our competitors increases;
|
|
·
|
competitors engage in increased price competition; or
|
|
·
|
competitors develop new products or product substitutes having comparable medicinal applications or therapeutic effects that are more effective, less costly and/or have more perceived benefits than those produced by us.
|
In addition, competition from imported products and China's admission as a member of the World Trade Organization (“WTO”) creates increased competition. The PRC became a member of the WTO in December 2001. As a result of the admission of the PRC into the WTO, competition in the pharmaceutical industry in the PRC intensify generally in two respects. With lower import tariffs, imported pharmaceutical products manufactured overseas may become increasingly competitive with domestically produced products in terms of pricing. We also believe that well-established foreign pharmaceutical manufacturers may set up production facilities in the PRC and compete with domestic manufacturers directly. With the expected increased supply of competitively-priced pharmaceutical products in the PRC, we may face increased competition from foreign pharmaceutical products, especially in terms of high-end pharmaceutical products, including certain types of products manufactured by U.S. manufacturers.
Intellectual Property
We regard our packaging designs, trademarks, trade secrets, patent and similar intellectual property as part of our core competence that is critical to our success. We rely on patent, trademark and trade secret law, as well as confidentiality agreements with certain of our employees, distributors and others to protect our intellectual property rights.
In November 2008, we purchased the patented medical formula for a cerebral/cardio-vascular indication and the manufacturing processes for that product candidate from a third party laboratory. In connection with that acquisition, we obtained the title of the patent. This patent expires in 2025.
At December 31, 2011, we owned 17 registered trademarks, including marks for nine of the 20 pharmaceutical products we manufacture, including the tradenames Funalin, Fukexing, Beisha, Shiduotai, Xinuo, Pusenlitai, Pusenouke, Shuchang and Shenkaineng, as well as marks for our AFGF logo, our HPS logo, our two HELPSON logos and four other logos. The registration numbers of the 17 registered trademarks are as follows: No.1280259, No.1500459, No.1511770, No.1535416, No.1537828, No.1535420, No.1272792, No.1272759, No.1272760, No.1330294, No.1327731, No.1330295, No.1476339 and No.3993785, No. 4074317, No.4074321 and No. 4315247.
Environmental Matters
We comply with the Environmental Protection Law of China as well as applicable local regulations. In addition to statutory and regulatory compliance, we actively ensure the environmental sustainability of our operations. Penalties may be levied upon us if we fail to adhere to and maintain certain standards. Such failure has not occurred in the past, and we generally do not anticipate that it will occur in the future, but no assurance can be given in this regard.
13
Regulations
Regulations Relating to Pharmaceutical Industry
. The pharmaceutical industry in China is highly regulated. The primary regulatory authority is the SFDA, including its provincial and local branches. As a developer and producer of medicinal products, we are subject to regulation and oversight by the SFDA and its provincial and local branches. The Law of the PRC on the Administration of Pharmaceuticals provides the basic legal framework for the administration of the production and sale of pharmaceuticals in China and covers the manufacturing, distribution, packaging, pricing and advertising of pharmaceutical products. Its implementing regulations set forth detailed rules with respect to the administration of pharmaceuticals in China. We are also subject to other PRC laws and regulations that are applicable to business operators, manufacturers and distributors in general.
Registration and Approval of Medicine
. Pursuant to the PRC Provisions for Drug Registration, a medicine must be registered and approved by the SFDA before it can be manufactured and sold. The registration and approval process requires the manufacturer to submit to the SFDA a registration application containing detailed information concerning the efficacy and quality of the medicine and the manufacturing process and the production facilities the manufacturer expects to use. This process generally takes two to five years and could be longer, depending on the nature of the medicine under review, the quality of the data provided and the workload of the SFDA. If a manufacturer chooses to manufacture a pre-clinical medicine, it is also required to conduct pre-clinical trials, apply to the SFDA for permission to conduct clinical trials and go through the clinical trials. If a manufacturer chooses to manufacture a post-clinical medicine, it only needs to go through the clinical trials. In both cases, a manufacturer needs to file clinical data with the SFDA for approval for manufacturing after clinical trials are completed.
New Medicine
. If a medicine is approved by the SFDA as a new medicine, the SFDA will issue a new medicine certificate to the manufacturer and impose a monitoring period of one to five years. During the monitoring period, the SFDA will monitor the safety of the new medicine, and will neither accept new medicine certificate applications for an identical medicine by another pharmaceutical company, nor approve the production or import of an identical medicine by other pharmaceutical companies. As a result of these regulations, the holder of a new medicine certificate effectively has the exclusive right to manufacture the new medicine during the monitoring period. We currently have new medicine certificates for our Buflomedil Hydrochloride (API, tablet, liquid injectable, dried power injectable), Pusenouke, Cefaclor dispersible tablets, Roxithromycin dispersible tablets and Bumetanide for injection products.
National Production Standardand Provisional Standard
. In connection with the SFDA’s approval of a new medicine, the SFDA will normally direct the manufacturer to produce the medicine according to a provisional national production standard, or a provisional standard. A provisional standard is valid for two years, during which time the SFDA closely monitors the production process and quality consistency of the medicine to develop a national final production standard for the medicine, or a final standard. Three months before the expiration of the two-year period, the manufacturer is required to apply to the SFDA to convert the provisional standard to a final standard. Upon approval, the SFDA will publish the final standard for the production of this medicine. There is no statutory timeline for the SFDA to complete its review and grant approval for the conversion. In practice, the approval for conversion to a final standard is time-consuming and could take a number of years. However, during the SFDA’s review period, the manufacturer may continue to produce the medicine according to the provisional standard.
Transitional Period
. Prior to the latter of (1) the expiration of a new medicine’s monitoring period or (2) the date when the SFDA grants a final standard for a new medicine after the expiration of the provisional standard, the SFDA will not accept applications for an identical medicine nor will it approve the production of an identical medicine by other pharmaceutical companies. Accordingly, the manufacturer will continue to have an exclusive production right for the new medicine during this transitional period.
14
Continuing SFDA Regulation
Pharmaceutical manufacturers in China are subject to continuing regulation by the SFDA. If an approved medicine, its labeling or its manufacturing process is significantly modified, a new pre-market approval or pre-market approval supplement will be required by the SFDA. A pharmaceutical manufacturer is subject to periodic inspection and safety monitoring by the SFDA to determine compliance with regulatory requirements.
The SFDA has a variety of enforcement actions available to enforce its regulations and rules, including fines and injunctions, recall or seizure of products, the imposition of operating restrictions, partial suspension or complete shutdown of production and criminal prosecution.
Pharmaceutical Product Manufacturing
Permits and Licenses for Pharmaceutical Manufacturers
. A pharmaceutical manufacturer must obtain a pharmaceutical manufacturing permit from the SFDA’s relevant provincial branch. This permit is valid for five years and is renewable for an additional five-year period upon its expiration. Our current pharmaceutical manufacturing permit, issued by the SFDA, will expire on December 31, 2015.
Good Manufacturing Practice.
A pharmaceutical manufacturer must meet the Good Manufacturing Practice standards, or GMP standards, for each of its production facilities in China in respect of each form of pharmaceutical product it produces. GMP standards include staff qualifications, production premises and facilities, equipment, raw materials, environmental hygiene, production management, quality control and customer complaint administration. If a manufacturer meets the GMP standards, the SFDA will issue to the manufacturer a Good Manufacturing Practice certificate, or a GMP certificate, with a five-year validity period. However, for a newly-established pharmaceutical manufacturer that meets the GMP standards, the SFDA will issue a GMP certificate with only a one-year validity period.The new GMP standards became effective on March 1, 2011and pharmaceutical manufacturers(except manufacturers of injectables, blood products orvaccines, which havea three-year grace period) havea five-year grace period to upgrade existing facilities to comply with the revisions.
We obtained GMP certificates for our manufacturing facility in respect of every form of pharmaceutical product we produce, one on May 8, 2008 (tablets), one on August 11, 2008 (small volume parenteral solutions), one on September 21, 2009 (capsules, granules), one on February 10, 2010 (lyophilized powder for injection) and one on February 18, 2011 (tables, capsule - cephalosprins). All of our GMP certificates are valid for five years. While we are required to implement certain upgrades to our manufacturing facilities to comply with the new GMP standards, we do not currently anticipate any difficulty in renewing these certificates when they expire. We will be required to obtain a GMP certificate for each new production line we construct for the production of our new product candidates, including our planned production line for our new cholesterol-lowering statin product that we expect to begin manufacturing and to launch into the marketplace in the near future.
Product Liability and Consumers Protection
Product liability claims may arise if any pharmaceuticalproducts sold have a harmful effect on the consumers. The injured party may claim for damages or compensation. The General Principles of the Civil Law of the PRC, which became effective in January 1987, state that manufacturers and sellers of defective products causing property damage or injury shall incur civil liabilities for such damage or injuries.
The Product Quality Law of the PRC was enacted in 1993 and amended in 2000 to strengthen the quality control of products and protect consumers’ rights and interests. Under this law, manufacturers and distributors who produce or sell defective products may be subject to confiscation of earnings from such sales, revocation of business licenses and imposition of fines, and in severe circumstances, may be subject to criminal liability.
The Law of the PRC on the Protection of the Rights and Interests of Consumers was promulgated on October 31, 1993 and became effective on January 1, 1994 to protect consumers when they purchase or use goods or services. All business operators must comply with this law when they manufacture or sell goods and/or provide services to customers. In extreme situations, pharmaceutical product manufacturers and distributors may be subject to criminal liability if their goods or services lead to the death or injuries of customers or other third parties.
15
Price Controls
The retail prices of some pharmaceutical products sold in China, primarily those included in the Essential Drug and Reimbursement Lists and those pharmaceutical products for which production or distribution are deemed to constitute monopolies, are subject to price controls in the form of retail price ceilings. In particular, manufacturers or distributors cannot freely set or change the retail price for any price-controlled product above the applicable price ceiling or deviate from the applicable fixed price imposed by the PRC government. The prices of medicines that are not subject to price controls are determined freely at the discretion of the respective pharmaceutical companies, subject to notification to the provincial pricing authorities. The National Development and Reform Commission, or the National Department and Reform Commission (NDRC), may grant premium pricing status to certain pharmaceutical products that are subject to price controls, and may set the price-ceiling of pharmaceutical products that have obtained such status.
Only the manufacturer of a medicine may apply for an increase in the retail price of the medicine, and it must either apply to the provincial price control authorities in the province in which it is incorporated, if the medicine is provincially regulated, or to the NDRC, if the medicine is regulated by the NDRC. For a provincially regulated medicine, in cases where provincial price control authorities approve an application, manufacturers must file the newly-approved price with the NDRC for record and thereafter the newly-approved price will become binding and enforceable across China.
We currently have two products listed in the National Essential Drug List (EDL). Periodic reductions in the consumer prices of those products due to price changes implemented by the PRC government have had only a minimal impact on our revenues. The government announced two rounds of retail drug price cuts in 2011, first in March when the NDRC cut the maximum prices of certain antibiotics and circulatory system drugs by an average of 21%, and in August when prices for 32 types of endocrine and neurological drugs were cut by an average of 14%.
Reimbursement under the National Medical Insurance Program
By the end of 2011, approximately 1.3billion people had been enrolled into the NMIP. The Ministry of Labor and Social Security, together with other government authorities, determines which medicines are to be included in or removed from the national medicine catalog for the National Medical Insurance Program, and under which tier a medicine should fall, both of which affect the amounts reimbursable to program participants for their purchases of those medicines. These determinations are based on a number of factors, including price and efficacy. A National Medical Insurance Program participant can be reimbursed for the full cost of a Tier 1 medicine and 80-90% of the cost of a Tier 2 medicine.
Although it is designated as a national program, the implementation of the NMIP is delegated to various provincial governments, each of which has established its own medicine catalog. A provincial government must include all Tier 1 medicines listed in the national medicine catalog in its provincial medicine catalog, but may use its discretion based on its own selection criteria to add other medicines to, or exclude Tier 2 medicines listed in the national medicine catalog from, its provincial medicine catalog, so long as the combined numbers of the medicines added and excluded do not exceed 15% of the number of the Tier 2 medicines listed in the national catalog. In addition, provincial governments may use their discretion to upgrade a nationally classified Tier 2 medicine to Tier 1 in their provincial medicine catalogs, but may not downgrade a nationally classified Tier 1 medicine to Tier 2.
The total amount of reimbursement for the cost of prescription and OTC medicines, in addition to other medical expenses, for an individual program participant in a calendar year is capped at the amount in that participant’s individual account. The amount in a participant’s account varies, depending upon the amount of contributions from the participant and his or her employer. Generally, on average, program participants who are from relatively wealthier eastern parts of China and relatively wealthier metropolitan centers have greater amounts in their individual accounts than those from less developed provinces.
16
Currently, all of our pharmaceutical products are listed on the National Insurance Catalogue (NIC), and only two of our products -Vitamin B6 and Cefalexin - are listed on the EDL. However, some of our non-EDL drugs have been selected to enter the provincial EDL, which varies from province to province. We believe these drugs will experience an increase in sales volume due to the government-initiated promotion of those drugs, while remaining free from the pricing pressures often experienced by drugs listed on the EDL.
Other Regulations
In addition to the regulations relating to pharmaceutical industry in China, we are also subject to the regulations applicable to a foreign invested enterprise in China.
Foreign Currency Exchange.
Pursuant to the Foreign Currency Administration Rules promulgated in 1996 and amended in 1997 and various regulations issued by State Administration of Foreign Exchange, or the SAFE, and other relevant PRC government authorities, the Renminbi is freely convertible only to the extent of current account items, such as trade-related receipts and payments, interests and dividends. Capital account items, such as direct equity investments, loans and repatriation of investment, require the prior approval from the SAFE or its local counterpart for conversion of Renminbi into a foreign currency, such as U.S. dollars, and remittance of the foreign currency outside the PRC.
Payments for transactions that take place within the PRC must be made in Renminbi. Unless otherwise approved, PRC companies other than foreign investment enterprises (FIEs) must convert foreign currency payments they receive from abroad into Renminbi. On the other hand, FIEs may retain foreign exchange in accounts with designated foreign exchange banks, subject to a cap set by the SAFE or its local counterpart.
Dividend Distribution.
Under the PRC regulations governing dividend distributions by wholly foreign-owned enterprises and Sino-foreign equity joint ventures, wholly foreign-owned enterprises and Sino-foreign equity joint ventures in the PRC may pay dividends only out of their accumulated profits, if any, determined in accordance with PRC accounting standards and regulations. Additionally, these foreign-invested enterprises are required to set aside certain amounts of their accumulated profits each year, if any, to fund certain reserve funds. These reserves are not distributable as cash dividends.
Employees
As of December 31, 2011, we had 435employees, among which 393employees were full-time employees and 42employees were temporary employees. Among the total 435employees, approximately 243of these employees were principally engaged in manufacturing and research and development activities, 140 in sales and marketing, and 52in management and administration. We continue to monitor our headcount and may add additional employees for sales and marketing, customer service and manufacturing and assembly as our business grows. None of our employees is represented by a labor union and, in general, we consider our relationship with our employees to be good.
As required by applicable Chinese law, we have entered into employment contracts with substantially all of our officers, managers and employees. We are working towards entering into employment contracts with those employees who do not currently have employment contracts with us. The PRC enacted a new Labor Contract Law, which became effective on January 1, 2008. We have updated our employment contracts and employee handbook and are in compliance with the new law. We will work with our employees to insure that our employees obtain the full benefit of the law. We do not anticipate that changes in the law will materially impact our balance sheet and cash flows.
17
Risks Related to our Business and our Industry
The commercial success of our products depends upon the degree of their market acceptance among the medical community. If our products do not attain market acceptance among the medical community, our operations and profitability would be adversely affected.
The commercial success of our products depends upon the degree of market acceptance they achieve among the medical community, particularly among physicians and hospital administrators. Physicians may not prescribe or recommend our products to patients and procurement departments of hospitals may not purchase our products if physicians or hospital pharmacists do not find our products attractive. The acceptance and use of our products among the medical community will depend upon a number of factors, including:
|
·
|
perceptions by physicians, patients and others in the medical community about the safety and effectiveness of our products;
|
|
·
|
the prevalence and severity of any side effects;
|
|
·
|
the pharmacological benefit of our products relative to competing products and products under development;
|
|
·
|
the efficacy and potential advantages of our products relative to competing products and products under development;
|
|
·
|
the relative convenience and ease of administration of our products;
|
|
·
|
the methods by which our pharmaceutical products may be delivered to patients;
|
|
·
|
the effectiveness of our education, marketing and distribution efforts and those of our distributors;
|
|
·
|
publicity concerning our products or competing products and treatments;
|
|
·
|
the price of our products and competing products; and
|
|
·
|
the continued inclusion of our products in the National Medical Insurance Program and competitive products being added to the National Medical Insurance Program.
|
If our products fail to achieve or maintain market acceptance, or if new products are introduced by others that are more favorably received than our products, are more cost effective or otherwise render our products obsolete, we may experience a decline in the demand for our products. If we are unable to market and sell our products successfully, our business, financial condition, results of operation and future growth would be adversely affected.
Our success is highly dependent on our continually developing new and advanced products, technologies and processes and our failure to do so may cause us to lose our competitiveness in the pharmaceutical industry and may cause our profits to decline.
To remain competitive in the pharmaceutical industry, it is important to continually develop new and advanced products, technologies and processes. There is no assurance that our competitors’ new products, technologies and processes will not render our existing products obsolete or non-competitive. Our competitiveness in the pharmaceutical market therefore relies upon our ability to enhance our current products, introduce new products, and develop and implement new technologies and processes. Our failure to technologically evolve and/or develop new or enhanced products may cause us to lose our competitiveness in the pharmaceutical industry and may cause our profits to decline.
18
We may not be able to obtain manufacturing or marketing approvals or pass on-site inspections for our current and future products, including re-registration certification and re-evaluation process of our products, or for our production facilities and failure to obtain the necessary approvals or pass as referenced above could materially harm our business prospects.
All medicines must be approved by the SFDA before they can be manufactured, marketed or sold in the PRC. The SFDA requires a pharmaceutical manufacturer to successfully complete clinical trials of a new medicine and demonstrate its manufacturing capability before approval to manufacture that new medicine is granted. Clinical trials are expensive and their results are uncertain. It usually takes two to five years for a manufacturer to obtain a typical application for an SFDA production approval. However, the SFDA may not strictly addict to such general time line due to its alteration of review procedure that is out of the applicant’s expectation and therefore delayed our launch of new products. Furthermore, the SFDA and other regulatory authorities may apply new standards for safety, manufacturing, labeling, marketing and distribution of future products. Complying with these standards may be time-consuming and expensive. In addition, our future products may not be efficacious or may have undesirable or unintended side effects, toxicities or other characteristics that may preclude us from obtaining approval or may prevent or limit their commercial use. As a result, we may not be able to obtain SFDA or other governmental approvals for our future products on a timely basis or at all.
In particular, we expect to receive the SFDA production approval for Candesatran, our proposed hypertension product, in the near future, which will allow us to commence our marketing and sale of this product in the marketplace. Due to the uncertainty set forth above, we cannot assure you that we will be able to obtain this approval within that timeframe, or at all. Even if we do obtain these approvals, we cannot assure you that such approvals will not be modified or revoked. We will not be able to manufacture and market this new product as planned or at all if we do not obtain this governmental approval.
Furthermore, even after we obtain such approvals for a proposed product, we may not be able to pass the on-site inspections required prior to the launch of such proposed product. If we fail to pass the on-site inspection in connection with a production permit application, we will not be able to obtain the production permit and commence production. Failure to obtain or renew approvals or pass on-site inspections for our existing or future products could materially harm our business prospects. In addition, in connection with our manufacture of any new products that will require us to add to or expand our existing production lines or to construct new production lines, we will be required to obtain production permits. Failure to obtain such permits could render us unable to produce any new products.
Failure to comply with applicable GMP standards could have a material adverse effect on our business, financial conditionand results of operations.
We are required to comply with applicable GMP regulations, which include requirements relating topersonnel, premises and equipment, raw materials and products, qualification and validation, documentsmanagement, production management, quality control and quality assurance, and products distribution and recall. Manufacturing facilities must be approved by governmental authorities before we can use them tocommercially manufacture our products and are subject to inspection by regulatory agencies. The SFDA haveimplemented the more stringent new GMP standards which are aimed at improving drug production management and controlling risks in the production process and introduce internationally-recognizedquality control mechanisms. The latest update to the GMP standards have greatly raised the bar for quality control, documentation, andoverall manufacturing processes, thus causing an increase of cost in manufacturing and decrease of profit margins.
A pharmaceutical manufacturer must meet the new GMP standards, which became effective onMarch 1, 2011for each of its production facilities in China with respect to each form ofpharmaceutical products it produces within a five-years grace period.Manufacturers of injectables, blood products, orvaccineshavea three-years grace periodto bring existing facilities in line with the revisions.
19
Although each of our eight production lines meets GMP guidelines promulgated in 1998 and we are in the process of upgrading our production facilities tobring them in line with the new GMP standards, we may not obtain clearance from the SFDA in the event that we are inspected. Any failure to comply with the new GMP standards may subject us to fines or other penalties, which may have a material and adverse impact onour business, financial condition and results of operations.
If we fail to develop new products with high profit margins and our high-profit-margin products are replaced by competitor’s products, then our gross and net profits margins will be adversely affected.
In each of the years ended December 31, 2011and 2010, our gross profit margin exceeded 35%. However, there can be no assurance that we will be able to sustain such profit margins in the future. The pharmaceutical market in the PRC is very competitive, and there may be pressure to reduce sale prices of products without a corresponding decrease in the price of raw materials. To the extent that we fail to develop new products with high profit margins and our high-profit-margin products are substituted by competitors’ products, our gross profit margins and net profit margins will be adversely affected. In addition, in the event that our products are included in the EDL, which is subject to high level of governmental price control, our gross profit margin and net profit margins could be adversely affected notwithstanding any increase in our revenues that may result from the listing of such products on EDL.
Our products face substantial competition. Other companies may discover, develop, acquire or commercialize products earlier or more successfully than we do.
We operate in a highly competitive environment. Our products compete with other products or treatments for diseases for which our products may be indicated. Many of our products may compete against products that have lower prices, superior performance, greater ease of administration or other advantages compared to our products. We would face enhanced competition if competitive products were added to the National Medical Insurance Program. Our inability to compete effectively could reduce sales or margins, which could have a material adverse effect on our results of our operations.
Certain of our competitors market products or are actively engaged in research and development in areas in which we have products or in which we are developing product candidates or new indications for existing products. In the future, we expect that our products will compete with new drugs currently in development, drugs approved for other indications that may be approved for the same indications as those of our products and drugs approved for other indications that are used off-label. If alternatives to our products are dispensed or prescribed to patients, the volume of our competing products may decline or we may be required to lower the price of our competing products to remain competitive, either of which could negatively impact our sales. In addition, an increasing number of foreign pharmaceutical companies have introduced their pharmaceutical products into the Chinese market. Competitive products introduced by these companies can also negatively impact our sales and results of operations.
Large Chinese state-owned and privately owned pharmaceutical companies and foreign-invested or foreign pharmaceutical companies may have greater clinical, research, regulatory, manufacturing, marketing, financial and human resources than we do. In addition, some of our competitors may have technical or competitive advantages over us with respect to the development of technologies and processes. These resources may make it difficult for us to compete with them to successfully discover, develop and market new products and for our current products to compete with new products or new product indications that these competitors may bring to market. There may also be significant consolidation in the pharmaceutical industry among our competitors. Alliances may develop among competitors, and these alliances may rapidly acquire significant market share.
Furthermore, in order to gain market share in China, competitors may significantly increase their advertising expenditures and promotional activities or engage in irrational or predatory pricing behavior. In addition, our competitors may engage in inappropriate competition or illegal acts, such as bribery. Third parties may actively engage in activities designed to undermine our brand name and product quality or to influence customer confidence in our products. Increased competition may result in price reductions, reduced margins and loss of market share, any of which could materially adversely affect our profit margins. We may not be able to compete effectively against current and future competitors.
20
Most of our products are off-patent branded generics that can be manufactured and sold by other pharmaceutical manufacturers in the PRC once the relevant protection or monitoring periods, if any, elapse.
Most of our products are off-patent branded generic pharmaceuticals and are not protected by intellectual property rights. As a result, other pharmaceutical companies may sell equivalent products at a lower cost, and this might result in a commensurate loss in sales of our branded generic products or require us to lower our prices to compete. Certain of our generic products are subject to protection during the SFDA’s monitoring period. During such period, the SFDA will not accept applications for new medicine certificates for the same product by other pharmaceutical companies or approve the production or import of the same product by other pharmaceutical companies. Once such monitoring period expires, other manufacturers may obtain relevant production approvals and will be entitled to sell generic pharmaceutical products with similar formulae or production methods in China. The maximum monitoring period currently granted by the SFDA is five years. As a result, we expect to face increased competition for our products following the expirations of their respective monitoring periods. If other pharmaceutical companies sell pharmaceutical products that are similar to our unprotected products or our protected products for which the relevant protection or monitoring period has expired, we may face additional competition and our business and profitability may be adversely affected.
Our business depends in part on our well-known Helpson brand name, and if we are not able to maintain and enhance our brand recognition to maintain our competitive advantage, our reputation, business and operating results may be harmed.
We believe that market awareness of our Helpson brand has contributed significantly to the success of our business. We also believe that maintaining and enhancing the Helpson brand is critical to maintaining our competitive advantage. Although our sales and marketing staff will continue to further promote our brand to remain competitive, we may not be successful. If we are unable to further enhance our brand recognition and increase awareness of our products, or if we are compelled to incur excessive marketing and promotion expenses in order to maintain our brand awareness, our business and results of operations may be materially and adversely affected. Furthermore, our sales and results of operations could be adversely affected if the Helpson brand or our reputation is impaired by recalls or negative publicity for one of our branded products, and certain actions taken by our distributors, competitors, third-party marketing firms or relevant regulatory authorities.
Pricing of our principal products is subject to government approval. Changes in government control on prices of our products may limit our profitability or cause us to stop manufacturing certain products.
The prices of pharmaceutical products listed in the national medical insurance catalog and other medicines, the production or trading of which may constitute monopolies, are subject to the control of the NDRC of the PRC and the relevant provincial or local price control authorities, either in the form of fixed prices or price ceilings. From time to time, the NDRC publishes a list of medicines subject to price controls. The NDRC directly regulates retail prices of certain medicines on the list and authorizes provincial price control authorities to regulate retail prices of the remaining products on that list. Because of these price controls, which are in the form of price ceilings, it would be difficult for us to raise the wholesale prices of any products subject to such controls if their price ceilings are not raised by the NDRC. The limitation on our ability to raise the wholesale prices of our products may prevent us from absorbing or offsetting the effect resulting from any increase in the cost of raw materials or other costs, which would lower our margins. We are required to file the prices of our products with the provincial price control authorities. The prices of our products may be adjusted downward by the relevant governmental authorities in the future. Separately, the government announced two rounds of retail drug price cuts in 2011, first in March when the NDRC cut the maximum prices of certain antibiotics and circulatory system drugs by an average of 21%, and in August when prices for 32 types of endocrine and neurological drugs were cut by an average of 14%. In addition, since the prices of all medicines are set by NDRC or relevant governmental authorities, if we are required to lower the wholesale prices to distributors of our principal products in the future as a result of any government-mandated reduction in the price ceilings of our products, our future revenue and profitability would be adversely affected.
21
Reimbursement may not be available for our products, which could diminish our sales or affect our ability to sell our products profitably.
Market acceptance and sales of our products also depend to a large extent on the reimbursement policies of the PRC government. The Ministry of Labor and Social Security of the PRC or provincial or local labor and social security authorities, together with other government authorities, review the inclusion or removal of drugs from the national medical insurance catalog or provincial or local medical insurance catalogs for the National Medical Insurance Program every other year, and catalogs under which a drug will be classified affects the amounts reimbursable to program participants for their purchases of those medicines. These determinations are made based on a number of factors, including price and efficacy. Generally, there are two catalogs, the NIC and the EDL on which a product can be included. The products selected for the EDL generally are selected from the NIC. A consumer can be reimbursed for the full cost of a medicine on the EDL and can be reimbursed for 80% to 90% of the cost of a medicine listed on the NIC. Our Vitamin B6 and Cefalexin products are currently included in the EDL. If the relevant government authorities decide to remove our products from the medicine catalogs, such removal may reduce the affordability of our products and change the public perception regarding our products, which, in turn, would adversely affect the sales of these products and reduce our net revenue. Furthermore, if we are unable to obtain approval from the relevant government authorities to include our new products in the national, provincial or local medicine catalogs, sales of our new products maybe materially and adversely affected.
The growth and success of our business depends on our ability to successfully market our principal products to hospitals and their selection in tender processes used by hospitals for medicine purchases.
Our future growth and success significantly depend on our ability to successfully market our products to hospitals as prescription medicines. In 2010and 2011, approximately 90% of the end-customers of our products were hospitals. Hospitals may make bulk purchases of a medicine included in the national and provincial medicine catalogs only if that medicine is selected under a government-administered tender process. The interest of a hospital in a medicine is evidenced by:
|
·
|
the inclusion of this medicine on the hospital’s formulary, which establishes the scope of medicines physicians at this hospital may prescribe to their patients, and
|
|
·
|
the willingness of physicians at the hospital to prescribe this medicine to their patients.
|
We believe effective marketing efforts are critical in making and keeping hospitals and physicians interested in purchasing our products. If our marketing efforts are not effective, hospital administrators may not want to include our products in their formularies or may remove them from their formularies, or physicians may not be interested in prescribing our products to their patients. As a result, we may find it difficult to maintain the existing level of sales of our products, and our revenues and profitability may decline.
Our future research and development projects may not be successful.
The successful development of pharmaceutical products can be affected by many factors. Products that appear to be promising at their early phases of research and development may fail to be commercialized for various reasons, including the failure to obtain the necessary regulatory approvals. In addition, the research and development cycle for new products for which we may obtain an approval certificate is long. The process of conducting basic research and various stages of tests and trials of a new product before obtaining an approval certificate and commercializing the product may require ten years or longer. A fewof our product candidates are in the early stages of pre-clinical study and clinical trial and we must conduct significant additional clinical trials before we can seek the regulatory approvals necessary to begin commercial production and sales of these products. There is no assurance that our future research and development projects will be successful or completed within the anticipated time frame or budget or that we will receive the necessary approvals from relevant authorities for the production of these newly developed products, or that these newly-developed products will achieve commercial success.
22
Others may obtain approval for a competitive product before the product we are developing is approved. In that case, we may be precluded from getting approval until the competitor’s monitoring period expires and realize little or no benefit from our research and development investment.
Even if such products can be successfully commercialized, they may not achieve the level of market acceptance that we expect. In addition, the pharmaceutical industry is characterized by rapid changes in technology, constant enhancement of industrial knowhow and frequent emergence of new products. Future technological improvements and continual product developments in the pharmaceutical market may render our existing products obsolete or affect their viability and competitiveness. Therefore, our future success will largely depend on our development capability, including our ability to improve our existing products, diversify our product range and develop new and competitively-priced products that can meet the requirements of the changing market. Should we fail to respond to these frequent technological advances by improving our existing products or developing new products in a timely manner or these products do not achieve a desirable level of market acceptance, our business and profitability will be materially and adversely affected.
We rely on research institutions and universities in the PRC for the research and development of new products and any failure of such research institutions to meet our timing and quality standards or our failure to continue such collaborative arrangement or enter into such new arrangements could adversely affect our ability to develop new pharmaceuticals and our overall business prospects
.
Our business strategy includes collaborating with third parties for research and development of new products. We rely on long-term cooperative relationships with a number of research institutions and universities in the PRC, including Chinese Academy of Sciences, China University of Pharmaceuticals, the Military Medical Academy Basic Medical Science Institute, Chongqing Pharmaceutical Research Institute and Sichuan University. These research institutions and universities have collaborated with us in a number of research projects and certain of our products that have obtained approval certificates were developed by such research institutions. At present, several research institutions and universities are working with us on various research and development projects. Any failure of suchresearch institutionsto meet the required quality standards and timetables set in their research agreements with us, or our inability to enter into additional research agreements with these research institutionson terms acceptable to us in the future, may have an adverse effect on our ability to develop new medicines and on our business prospects. In addition, the growth of our business and development of new products may require that we seek additional research institutions. We cannot assure you that we will be able to enter into agreements with new parties on terms acceptable to us. Our inability to enter into such agreements or our failure to maintain such arrangements could limit the number of new products that we develop and ultimately decrease our sources of future revenue.
We may not be able to obtain regulatory approval for any of the new products and failure to obtain these approvals could materially harm our business.
All new medicines must be approved by the SFDA before they can be marketed and sold in the PRC. The SFDA requires successful completion of clinical trials and demonstrated manufacturing capability before it grants approval. It often takes a number of years before a medicine can be ultimately approved by the SFDA. In addition, the SFDA and other regulatory authorities may apply new standards for safety, manufacturing, packaging, and distribution of future product candidates. Complying with such standards may be time-consuming and expensive and could result in delays in obtaining SFDA approval for our future product candidates, or possibly preclude us from obtaining SFDA approval altogether. Furthermore, our future products may not be effective or may prove to have undesirable or unintended side effects, toxicities or other characteristics that may preclude us from obtaining regulatory approval or prevent or limit commercial use. The SFDA and other regulatory authorities may not approve the products that we develop and even if we do obtain regulatory approvals, such regulatory approvals may be subject to limitations on the indicated uses for which we may market a product, which may limit the size of the market for such product.
23
New product development in the pharmaceutical industry is time-consuming and costly and has a low rate of successful commercialization
.
Our success will depend in part on our ability to enhance our existing products and to develop new products. The development process for pharmaceutical products is complex and uncertain, as well as time-consuming and costly. Relatively few research and development programs produce a commercial product. A product candidate that appears promising in the early phases of development may fail to reach the market for a number of reasons, such as:
|
·
|
the failure to demonstrate safety and efficacy in preclinical and clinical trials;
|
|
·
|
the failure to obtain approvals for intended use from relevant regulatory bodies, such as the SFDA;
|
|
·
|
our inability to manufacture and commercialize sufficient quantities of the product economically; and
|
|
·
|
proprietary rights, such as patent rights, held by others to our product candidates and their refusal to sell or license such rights to us on reasonable terms, or at all.
|
Delays in any part of the development process or our inability to obtain regulatory approval of our products could adversely affect our operating results by restricting or delaying our introduction of new products. Even if we successfully commercialize new products, these products may address markets that are currently being served by our mature products and may result in a reduction in the sales volume of our mature product or vice versa. Failure to develop, obtain necessary regulatory clearances or approvals for or successfully commercialize or market potential new products or technologies could have a material adverse effect on our financial condition and results of operations.
We may not be able to successfully identify and acquire new products or businesses
.
In addition to our own product development efforts, our growth strategy also relies on our acquisitions of new product candidates, products or businesses from third parties. Any future growth through acquisitions will be dependent upon the continued availability of suitable acquisition candidates at favorable prices and upon advantageous terms and conditions. Even if such opportunities are present, we may not be able to successfully identify them. Moreover, other companies, many of which may have substantially greater financial, marketing and sales resources, are competing with us for the right to acquire such product candidates, products or businesses.
We depend on distributors for all of our revenues and failure to maintain relationships with our distributors or to otherwise expand our distribution network would materially and adversely affect our business
.
We sell our products exclusively to pharmaceutical distributors in the PRC and depend on distributors for all of our revenues. We have business relationships with approximately 1,875distributors in the PRC. For the years ended December 31, 2011 and 2010, one distributor accounted for 20.4% and 30% of our revenues, respectively. In line with industry practices in the PRC, we enter into written sales agreements with our distributors. However, such sales agreements are not in substance equivalent to a typical distribution agreement in the United States. Each sales agreement is more in the form of a sales order and specifies one or several purchases of one or more products without any continuing obligation to purchase any additional amount of products. In the event certain distributors choose not to continue their relationship with us after completing their existing sales agreements, they can do so without breaching any contract or agreement and our financial results could be adversely affected if we cannot find the equivalent distributors in time under such circumstances. In addition, some of our distributors may sell products that compete with our products. We compete for desired distributors with other pharmaceutical manufacturers, many of which may have higher visibility, greater name recognition and financial resources, and broader product selection than we do. Consequently, maintaining relationships with existing distributors and replacing distributors may be difficult and time consuming. Any disruption of our distribution network, including our failure to renew our existing distribution agreements with our desired distributors, could negatively affect our ability to effectively sell our products and would materially and adversely affect our business, financial condition and results of operations.
24
We rely on a limited number of distributors for the majority of sales of our products
.
We rely on a limited number of distributors for most of our net revenue. Our top five distributors in the aggregate accounted for 55% and 46% of our net revenues in 2010 and 2011, respectively. We expect that a relatively small number of our distributors will continue to account for a major portion of our net revenue in the near future. Our dependence on a few distributors could expose us to the risk of substantial losses if a single large distributor stops purchasing our products, purchases fewer of our products or goes out of business and we cannot find substitute distributors on equivalent terms. If any of our significant distributors reduces the quantity of the products they purchase from us or stops purchasing from us, our net revenue would be materially and adversely affected.
Our operation may be affected if we could not obtain raw materials from our current key suppliers on acceptable terms.
We require a supply of a wide variety of raw materials to manufacture our products. Currently, we rely on numerous suppliers in the PRC and overseas to deliver our required raw materials and believe we have at least three principal suppliers for each of our most critical raw materials. For the year ended December 31, 2011, purchases from one supplier accounted for 20.8% of our raw material purchases. For the year ended December 31, 2010, purchases from three suppliers accounted for 40%, 12% and 11% of our raw material purchases, respectively.
Historically, we have not had difficulty obtaining raw materials from suppliers. However, we cannot predict the impact on our suppliers of the current economic environment and other developments in their respective businesses. Insolvency, financial difficulties or other factors may result in our suppliers not being able to fulfill the terms of their agreements with us. Furthermore, such factors may render suppliers unwilling to extend contracts that provide favorable terms to us or may force them to seek to renegotiate existing contracts. Although we believe we have alternative sources of supply for the raw materials used in our business, termination of our relationship with any of our key suppliers could have a material adverse effect on our business, financial condition or results of operations in the unlikely event that we are unable to obtain adequate raw materials from other sources in a timely manner or at all.
We may not be able to effectively manage our employees and distribution network, and our reputation, business, prospects and brand may be materially and adversely affected by actions taken by our distributors and third party marketing firms.
We have limited ability to manage the activities of our distributors and third-party marketing firms that we contract to promote our products and brand name, both of which are independent from us. Our distributors and third-party marketing firms could take one or more of the following actions, any of which could have a material adverse effect on our business, prospects and brand:
|
·
|
sell our products outside their designated territory, possibly in violation of the exclusive distribution rights of other distributors;
|
|
·
|
fail to adequately promote our products;
|
|
·
|
promote competing products in lieu of our products; or
|
|
·
|
violate the anti-corruption laws of China, the United States or other countries.
|
In addition, although our company policies prohibit our employees from making improper payments to hospitals or otherwise engaging in improper activities to influence the procurement decisions of hospitals, we may not be able to effectively manage our employees, as the compensation of our sales and marketing personnel is partially linked to their sales performance. As a result, we cannot assure you that our employees will not violate the anticorruption laws of the PRC, the United States and other countries. Such violations could have a material adverse effect on our reputation, business, prospects and brand.
25
Failure to adequately manage our employees, distribution network or third-party marketing firms, or their non-compliance with employment, distribution or marketing agreements could harm our corporate image among hospitals and end users of our products and disrupt our sales, resulting in a failure to meet our sales goals. Furthermore, we could be liable for actions taken by our employees, distributors or third-party marketing firms, including any violations of applicable law in connection with the marketing or sale of our products, including China’s anticorruption laws and the Foreign Corrupt Practices Act of the United States, or the FCPA. In particular, if our employees, distributors or third-party marketing firms make any payments that are forbidden under the FCPA, we could be subject to civil and criminal penalties imposed by the U.S. government.
Recently, the PRC government has increased its anti-corruption measures. In the pharmaceutical industry, corrupt practices include, among others, acceptance of kickbacks, bribes or other illegal gains or benefits by the hospitals and medical practitioners from pharmaceutical manufacturers and distributors in connection with the prescription of certain pharmaceuticals. Our employees, affiliates, distributors or third-party marketing firms may violate these laws or otherwise engage in illegal practices with respect to their sales or marking of our products or other activities involving our products. If our employees, affiliates, distributors or third-party marketing firms violate these laws, we could be required to pay damages or fines, which could materially and adversely affect our financial condition and results of operations. In addition, PRC laws regarding what types of payments to promote or sell our products are impermissible are not always clear. As a result, we, our employees, affiliates, our distributors or third-party marketing firms could make certain payments in connection with the promotion or sale of our products or other activities involving our products which at the time are considered by us or them to be legal but are later deemed impermissible by the PRC government. Furthermore, our brand and reputation, our sales activities or the price of our common stock could be adversely affected if we become the target of any negative publicity as a result of actions taken by our employees, affiliates, distributors or third-party marketing firms.
We have limited insurance coverage and may incur losses resulting from product liability claims, business interruptions or claims that could be covered by D&O Insurance.
The nature of our business exposes us to the risk of product liability claims that is inherent in the research and development, manufacturing and marketing of pharmaceutical products. Using product candidates in clinical trials also exposes us to product liability claims. These risks are greater for our products that receive regulatory approval for commercial sale. Even if a product were approved for commercial use by an appropriate governmental agency, there can be no assurance that users will not claim effects other than those intended resulted from the use of our products. While to date no material claim for personal injury resulting from allegedly defective products has been brought against us, a substantial claim or a substantial number of claims, if successful, could have a material adverse impact on our business, financial condition and results of operations. Such lawsuits may divert the attention of our management from our business strategies, may be costly to defend and may negatively impact our reputation and our Helpson brand’s reputation, and harm the sales of our other branded products. In addition, product liability insurance for pharmaceutical products is not available in the PRC. In the event of allegations that any of our products are harmful, we may experience reduced consumer demand for our products or our products may be recalled from the market. We may also be forced to defend lawsuits and, if unsuccessful, to pay a substantial amount in damages. In addition, business interruption insurance available in the PRC offers limited coverage compared to that offered in many other countries. We do not have any business interruption insurance. Any business disruption or natural disaster could result in substantial costs and diversion of resources. Lastly, we currently do not have directors and officers insurance. In the event we or any of our directors or officers are sued under any proceedings or actions that could be covered by a standard D&O insurance, we may incur substantial costs and expenses to defend such case.
26
Our future liquidity needs are uncertain and we may need to raise additional funds in the future.
Based on our current operating plans, we expect our existing resources to be sufficient to fund our existing operations for at least 12 months. However, we may be required to raise additional funds to expand our operations, including the construction of a production line dedicated to the production of cephalosporin combination drug. In addition, we may, need to raise additional funds if our expenditures exceed our current expectations. This could occur for a number of reasons, including:
|
·
|
we determine to devote significant amount of financial resources to the development of products that we believe to have significant commercialization potential;
|
|
·
|
we determine to acquire or license rights to additional product candidates or new technologies;
|
|
·
|
some or all of our product candidates fail in clinical trials or pre-clinical studies or prove to be not as commercially promising as we expect and we are forced to develop or acquire additional product candidates;
|
|
·
|
our product candidates require more extensive clinical or pre-clinical testing or clinical trials of these product candidates take longer to complete than we currently expect; or
|
|
·
|
we determine or are required to conduct more high-throughput screening than expected against current or additional disease targets to develop additional product candidates.
|
Our ability to raise additional funds in the future is subject to a variety of uncertainties, including:
|
·
|
our future financial condition, results of operations and cash flows;
|
|
·
|
general market conditions for capital-raising activities by pharmaceutical companies; and
|
|
·
|
economic, political and other conditions in China and elsewhere.
|
We cannot assure you that our revenues will be sufficient to meet our operational needs and capital requirements. If we need to obtain external financing, we cannot assure you that financing will be available in amounts or on terms acceptable to us, if at all. Our future liquidity needs and other business reasons could require us to sell additional equity or debt securities or obtain a credit facility. The sale of additional equity or equity-linked securities could result in additional dilution to our stockholders. The incurrence of additional indebtedness would result in increased debt service obligations and could result in operating and financing covenants that would restrict our operations.
We may undertake acquisitions in the future, and any difficulties in integrating these acquisitions may damage our profitability.
In the future, we may acquire additional businesses or products that complement our existing business and expand our business scale. The integration of new businesses and products may prove to be an expensive and time consuming procedure. We can offer no assurance that we will be able to successfully integrate the newly acquired businesses and products or operate the acquired business in a profitable manner. Failure to locate an appropriate acquisition target, failure to successfully integrate and operate acquired businesses and products, and failure to identify substantial liabilities associated with acquired businesses, may materially adversely impact our operations and profits.
27
The failure to manage growth effectively could have an adverse effect on our business, financial condition and results of our operations.
The rapid market growth of our pharmaceutical products may require us to expand our employee base for managerial, operational, financial and other purposes. As of December 31, 2011, we had 435employees. Our continued future growth will impose significant responsibilities upon the members of management to identify, recruit, maintain, integrate and motivate new employees. Aside from increased difficulties in the management of human resources, we may also encounter working capital issues, as we need increased liquidity to finance the purchases of raw materials and supplies, research and development and purchase of drug formulas for new products, acquisition of new businesses and technologies, and the hiring of additional employees. For effective growth management, we will be required to continue improving our operations, management, and financial systems and control. Our failure to manage growth effectively may lead to operational and financial inefficiencies that will have a negative effect on our profitability.
We depend upon key employees and consultants in a competitive market for skilled personnel. If we are unable to attract and retain key personnel, it could adversely affect our ability to develop and market our products.
We are highly dependent upon the principal members of our management team, especially Ms. Zhilin Li, our Chairman, President and Chief Executive Officer. The loss of the services of any of these persons would adversely affect our ability to develop and market our products. We also depend in part on the continued services of our key scientific personnel and our ability to identify, hire and retain additional personnel, including marketing and sales staff. We face intense competition for qualified personnel, and the existence of noncompetition agreements between prospective employees and their former employers may prevent us from hiring those individuals or subject us to suit from their former employers. While we attempt to provide competitive compensation packages to attract and retain key personnel, many of our competitors are likely to have greater resources and more experience than we have, making it difficult for us to compete successfully for key personnel.
Certain of our employees and consultants were previously employed at other biotechnology or pharmaceutical companies, including our competitors or potential competitors, or at universities or other research institutions. Although no claims against us are currently pending, we may be subject to claims that these employees or consultants have, inadvertently or otherwise, used or disclosed trade secrets or other proprietary information of their former employers. Litigation may be necessary to defend against these claims. Even if we are successful in defending against these claims, litigation could result in substantial costs and be a distraction to our management. If we fail in defending such claims, in addition to paying monetary damages, we may lose valuable intellectual property rights or personnel.
We are subject to environmental regulations and may be exposed to liability and potential costs for environmental compliance.
We are subject to PRC laws and regulations concerning the discharge of waste water, gaseous waste and solid waste during our manufacturing processes. We are required to establish and maintain facilities to dispose of waste and report the volume of waste to the relevant government authorities, which conduct scheduled or unscheduled inspections of our facilities and treatment of such discharge. We may not at all times comply fully with environmental regulations. Any violation of these regulations may result in substantial fines, criminal sanctions, revocations of operating permits, shutdown of our facilities and obligation to take corrective measures. Our cost of complying with current and future environmental protection laws and regulations and our liabilities which may potentially arise from the discharge of effluent water and solid waste may materially adversely affect our business, financial condition and results of operations. The government may take steps towards the adoption of more stringent environmental regulations. Due to the possibility of unanticipated regulatory or other developments, the amount and timing of future environmental expenditures may vary substantially from those currently anticipated. If there is any unanticipated change in the environmental regulations, we may need to incur substantial capital expenditures to install, replace, upgrade or supplement our pollution control equipment or make operational changes to limit any adverse impact or potential adverse impact on the environment in order to comply with new environmental protection laws and regulations. If such costs become prohibitively expensive, we may be forced to cease certain aspects of our business operations.
28
Power shortages, natural disasters, terrorist acts or other calamities could disrupt our production and have a material adverse effect on our business, financial position and results of operations.
All of our products are produced at our manufacturing facility in Hainan, China. A significant disruption at that facility, even on a short-term basis, could impair our ability to timely produce and ship products, which could have a material adverse effect on our business, financial position and results of operations. Our manufacturing operations are vulnerable to interruption and damage from natural and other types of disasters, including earthquake, fire, floods, environmental accidents, power loss, communications failures and similar events. If any disaster were to occur, our ability to operate our business at our facilities would be seriously impaired. In addition, the nature of our production and research activities could cause significant delays in our programs and make it difficult for us to recover from a disaster. We do not maintain any insurance other than property insurance for some of our buildings and equipments. Accordingly, unexpected business interruptions resulting from disasters could disrupt our operations and thereby result in substantial costs and diversion of resources. In addition, our production process requires a continuous supply of electricity. We have encountered power shortages historically due to restricted power supply to industrial users during summers when the usage of electricity is high and supply is limited or as a result of damage to the electricity supply network. Because the duration of those power shortages was brief, they had no material impact on our operations. Interruptions of electricity supply could result in lengthy production shutdowns, increased costs associated with restarting production and the loss of production in progress. Any major suspension or termination of electricity or other unexpected business interruptions could have a material adverse impact on our business, financial condition and results of operations.
The discontinuation of any preferential tax treatments or other incentives currently available to us in the PRC could materially and adversely affect our business, financial condition and results of operations.
Prior to January 1, 2008, pursuant to the original Income Tax Law of the PRC for Enterprises with Foreign Investment and Foreign Enterprises and its implementation rules, a foreign invested enterprise as defined under PRC laws was required to pay a 30% corporate income tax and a 3% local income tax; an enterprise with foreign investment of a production nature scheduled to operate for a period of not less than ten years was, from the year of making profits, exempt from enterprise income tax in the first and second years and allowed a fifty percent reduction in the third to fifth years. Pursuant to the State Council’s Regulations on Encouraging Investment in and Development of Hainan Island promulgated in May 1988, the corporate income tax for all companies incorporated in Hainan Province is reduced to 15%. Pursuant to the Regulations on Foreign Investment in Hainan Special Economic Zone promulgated by Hainan Province in March 1991 (the “Regulation on Foreign Investment”), all foreign-invested enterprises incorporated in Hainan Province are exempt from the local income tax.
However, on March 16, 2007, China’s national congress approved the Enterprise Income Tax Law of the PRC (“New Income Tax Law”), which took effect on January 1, 2008. The New Income Tax Law unified the enterprise income tax rate, cost deduction and tax incentive policies for both domestic and foreign invested enterprises. Under the New Income Tax Law, enterprises that were established and already enjoyed preferential tax rates or tax holidays before March 16, 2007 will (i) in the case of preferential tax rates, gradually increase to a 25% rate over a period of five years, (ii) in the case of tax holidays, continue to receive the benefit of such holidays until the expiration of such term.
As a result, we enjoyed a preferential tax rate of 9%, 10% and 11% in the years of 2008, 2009 and 2010. We obtained the High Tech Enterprise status from the government in 2010 and we enjoy a 15% income tax rate for a three-year period from 2011 to 2013. We expect to be subject to a standard income tax rate of 25% starting from 2014 unless we continue to receive preferential tax treatment as a High Tech Enterprise or we qualify for any other preferential tax treatment according to any regulations or policies applicable at that time. The discontinuation of any of our existing special or preferential tax treatment or other incentives could have an adverse affect on our business, financial condition and results of operations.
29
We cannot guarantee the protection of our intellectual property rights, and if infringement or counterfeiting of our intellectual property rights occurs, then our reputation and business may be adversely affected.
To protect the brand names of our products, we have registered and applied for registration of certain of our trademarks in the PRC. Currently nine of the 20 pharmaceutical products we manufacture are marketed under a brand is registered as a trademark in China. We also purchased from a third party for a pharmaceutical compound that we are seeking to develop into a further product. To date, we have not experienced any infringements of our trademarks for sales of pharmaceutical products or our exclusive patent license, and we are not aware of any infringement of our intellectual property rights. However, there is no assurance that there will not be any infringement of our brand name or other registered trademarks or counterfeiting of our products in the future. There is no assurance that there will not be any third-party infringement of our patent. Should any such infringement or counterfeiting occur, our reputation and business may be adversely affected. We may also incur significant expenses and substantial amounts of time and effort to protect our intellectual property rights in the future. Such diversion of our resources may adversely affect our existing business and future expansion plans.
Risks Related to Doing Business in China
Adverse changes in political and economic policies of the PRC government could have a material and adverse effect on the overall economic growth of China, which could reduce the demand for our services and materially and adversely affect our competitive position.
We conduct substantially all of our business and have historically derived all of our revenues in China. Accordingly, our business, financial condition, results of operations and prospects are affected significantly by economic, political and legal developments in China. The Chinese economy differs from the economies of most developed countries in many respects, including:
|
·
|
the degree of government involvement;
|
|
·
|
the level of development;
|
|
·
|
the growth rate;
|
|
·
|
the control of foreign exchange;
|
|
·
|
access to financing; and
|
|
·
|
the allocation of resources.
|
While the Chinese economy has experienced significant growth in the past 30 years, growth has been uneven, both geographically and among various sectors of the economy. The Chinese economy has also experienced certain adverse effects due to the recent global financial crisis. The Chinese government has implemented various measures to encourage economic growth and guide the allocation of resources. Some of these measures benefit the overall Chinese economy, but may also have a negative effect on us. For example, our operating results and financial condition may be adversely affected by government control over capital investments or changes in tax regulations that are applicable to us, and by government policies or guidance aimed at curtailing the perceived over-capacity of certain industry sectors, such as pharmaceutical companies. The Chinese government has implemented certain measures, including interest rate increases, to control the pace of economic growth. These measures may cause decreased economic activity in China, which could in turn reduce the demand for our products and materially and adversely affect our operating results and financial condition.
The Chinese economy has been transitioning from a planned economy to a more market-oriented economy. Although in recent years the Chinese government has implemented measures emphasizing the utilization of market forces for economic reform, the reduction of state ownership of productive assets and the establishment of sound corporate governance in business enterprises, a substantial portion of the productive assets in China is still owned by the Chinese government. The continued control of these assets and other aspects of the national economy by the Chinese government could materially and adversely affect our business.
The Chinese government also exercises significant control over Chinese economic growth through the allocation of resources, controlling payment of foreign currency-denominated obligations, setting monetary policy and providing preferential treatment to particular industries or companies.
30
Any adverse change in the economic conditions or government policies in China could have a material and adverse effect on overall economic growth and the level of investments in health industries in China, which in turn could lead to a reduction in demand for our products and consequently have a material and adverse effect on our business.
The PRC legal system has inherent uncertainties that could limit the legal protections available to us.
The PRC legal system is a civil law system based on written statutes. Unlike common law systems, it is a system in which decided legal cases have little precedential value. In the late 1970s, the PRC government began to promulgate a comprehensive system of laws and regulations governing commercial matters. The overall effect of legislation enacted over the past 20 years has significantly enhanced the protections afforded to foreign-invested enterprises in China. However, these laws, regulations and legal requirements are relatively recent and are evolving rapidly, and their interpretation and enforcement involve uncertainties. These uncertainties could limit the legal protections available to foreign investors.
The practical effect of the PRC legal system on our business operations in China can be viewed from two separate but intertwined considerations. First, as a matter of substantive law, the Foreign Invested Enterprise laws provide significant protection from government interference. In addition, these laws guarantee the full benefit of corporate articles and contracts to Foreign Invested Enterprise participants. These laws, however, do impose standards concerning corporate formation and governance that are not qualitatively different from the corporation laws found in the United States. Similarly, PRC accounting laws mandate accounting practices that may not be consistent with the U.S. generally accepted accounting principles. PRC accounting laws require that an annual “statutory audit” be performed in accordance with PRC accounting standards and that the account books of a foreign invested enterprise be maintained in accordance with PRC accounting laws. Article 14 of the PRC Wholly Foreign-Owned Enterprise Law requires a wholly foreign-owned enterprise to submit certain periodic fiscal reports and statements to designated financial and tax authorities. If a foreign-invested enterprise refuses to keep account books in China, the financial and tax authorities may impose a fine on it, and the industry and commerce administration authority may order it to suspend operations or may revoke its business license.
Second, while the enforcement of substantive rights may be less clear than United States procedures, foreign invested enterprises and wholly foreign-owned enterprises are PRC registered companies that enjoy the same status as other PRC registered companies in business-to-business dispute resolutions. The PRC legal infrastructure, however, is significantly different in operation from its United States counterpart, and may present a significant impediment to the operation of a foreign invested enterprise.
PRC economic reform policies or nationalization could result in a total investment loss in our common stock.
Since 1979, the PRC government has reformed its economic policies. Because many reforms are unprecedented or experimental, they are expected to be refined and improved. Other political, economic and social factors, such as political changes, changes in the economic growth rates, unemployment or inflation, or in the disparities in per capita wealth between regions within China, could lead to further readjustment of the reform measures. This refining and readjustment process may negatively affect our operations.
Although the PRC government owns the majority of productive assets in China, in the past several years the government has implemented economic reform measures that emphasize decentralization and encourage private economic activity. Because these economic reform measures may be inconsistent or ineffectual, there are no assurances that:
|
·
|
We will be able to capitalize on economic reforms;
|
|
·
|
The Chinese government will continue its pursuit of economic reform policies;
|
|
·
|
The economic policies, even if pursued, will be successful;
|
31
|
·
|
Economic policies will not be significantly altered from time to time; or
|
|
·
|
Business operations in China will not become subject to the risk of nationalization.
|
Over the last few years, China’s economy has registered high growth rates. Recently, there have been indications that rates of inflation have increased. In response, the Chinese government recently has taken measures to curb this excessively expansive economy. These measures have included restrictions on the availability of domestic credit, reducing the purchasing capability of some of its customers, and limited recentralization of the approval process for purchases of certain foreign products. These austere measures alone may not succeed in slowing down the economy’s excessive expansion or control inflation, and may result in severe dislocations in the Chinese economy. The PRC government may adopt additional measures to further combat inflation, including the establishment of freezes or restraints on certain projects or markets. These measures may adversely affect our operations.
There can be no assurance that the reforms to China’s economic system will continue or that we will not be adversely affected by changes in China’s political, economic, and social conditions and by changes in policies of the PRC government, such as changes in laws and regulations, measures which may be introduced to control inflation, changes in the rate or method of taxation, imposition of additional restrictions on currency conversion and remittance abroad, and reduction in tariff protection and other import restrictions.
You may experience difficulties in effecting service of legal process, enforcing foreign judgments or bringing original actions in the PRC against our company or our management based on U.S. or other foreign laws.
Our operating subsidiary, Helpson, is incorporated under the laws of the PRC and substantially all of our assets are located in the PRC. In addition, substantially all of our directors, executive officers and managers reside within the PRC, and substantially all of the assets of these persons are located within the PRC. As a result, it may not be possible to effect service of process within the United States or elsewhere outside the PRC upon certain of our directors, executive officers or managers, including with respect to matters arising under U.S. federal securities laws or applicable state securities laws. Moreover, the PRC does not have treaties providing for the reciprocal recognition and enforcement of judgments of courts with the United States, the United Kingdom, Japan or many other countries. As a result, recognition and enforcement in the PRC of judgments of a court in the United States and any of the other jurisdictions mentioned above in relation to any matter may be difficult or impossible. Furthermore, an original action may be brought in the PRC against us, our directors, executive officers or managers only if the actions are not required to be arbitrated by PRC law and Helpson’s articles of association, and only if the facts alleged in the complaint give rise to a cause of action under PRC law. In connection with any such original action, a PRC court may impose civil liability, including monetary damages.
Because we receive substantially all of our revenue in Renminbi, which currently is not a freely convertible currency, and the PRC government controls the currency conversion and the fluctuation of the Remninbi, we are subject to changes in the PRC’s political and economic decisions.
We receive substantially all of our revenues in Renminbi, which currently is not a freely-convertible currency. The PRC government may, at its discretion, restrict access in the future to foreign currencies for current account transactions. Any future restrictions on currency exchanges may limit our ability to use revenue generated in Renminbi to fund any future business activities outside China or to make dividend or other payments in U.S. dollars. Although the Chinese government introduced regulations in 1996 to allow greater convertibility of the Renminbi for current account transactions, significant restrictions still remain, including primarily the restriction that foreign-invested enterprises may only buy, sell or remit foreign currencies, after providing valid commercial documents, at those banks authorized to conduct foreign exchange business. In addition, conversion of Renminbi for capital account items, including direct investment and loans, is subject to governmental approval in China, and companies are required to open and maintain separate foreign exchange accounts for capital account items.
32
We cannot be certain that the Chinese regulatory authorities will not impose more stringent restrictions on the convertibility of the Renminbi, especially with respect to foreign exchange transactions.
Fluctuation in the value of the Renminbi may have a material and adverse effect on your investment. The change in value of the Renminbi against the U.S. dollar is affected by, among other things, changes in PRC’s political and economic conditions. From 1995 until July 2005, the People’s Bank of China intervened in the foreign exchange market to maintain an exchange rate of approximately RMB8.3 per U.S. dollar. On July 21, 2005, the PRC government changed this policy and began allowing modest appreciation of the Renminbi versus the U.S. dollar. Under the new policy, the Renminbi was permitted to fluctuate within a narrow and managed band against a basket of certain foreign currencies. This change in policy caused the Renminbi to appreciate approximately 21.5% against the U.S. dollar over the following three years. As a consequence, the Renminbi has fluctuated sharply since July 2008 against other freely traded currencies, in tandem with the U.S. dollar. It is difficult to predict how long the current situation may last and when and how it may change again. There remains significant international pressure on the PRC government to adopt a substantial liberalization of its currency policy, which could result in a further and more significant appreciation in the value of the Renminbi against the U.S. dollar. Significant revaluation of the Renminbi may have a material and adverse effect on your investment. For example, to the extent that we need to convert U.S. dollars we receive from securities offering into Renminbi for our operations, appreciation of the Renminbi against the U.S. dollar would have an adverse effect on the Renminbi amount we would receive from the conversion. Conversely, if we decide to convert our Renminbi into U.S. dollars for the purpose of making payments for dividends on our common stock or for other business purposes, appreciation of the U.S. dollar against the Renminbi would have a negative effect on the U.S. dollar amount available to us.
In addition, appreciation or depreciation in the value of the Renminbi relative to the U.S. dollar would affect our financial results reported in U.S. dollar terms without giving effect to any underlying change in our business or results of operations. The income statements of our operations are translated into U.S. dollars at the average exchange rates in each applicable period. To the extent the U.S. dollar strengthens against foreign currencies, the translation of these foreign currencies denominated transactions results in reduced revenue, operating expenses and net income for our international operations. Similarly, to the extent the U.S. dollar weakens against foreign currencies, the translation of these foreign currency denominated transactions results in increased revenue, operating expenses and net income for our international operations. We are also exposed to foreign exchange rate fluctuations as we convert the financial statements of our foreign subsidiaries into U.S. dollars in consolidation. If there is a change in foreign currency exchange rates, the conversion of the foreign subsidiaries’ financial statements into U.S. dollars will lead to a translation gain or loss, which is recorded as a component of other comprehensive income. Very limited hedging transactions are available in China to reduce our exposure to exchange rate fluctuations. To date, we have not entered into any hedging transactions. While we may enter into hedging transactions in the future, the availability and effectiveness of these transactions may be limited, and we may not be able to successfully hedge our exposure at all.
We are subject to the environmental protection laws of the PRC that may be costly to comply with and may adversely affect our manufacturing operations.
Our manufacturing process may produce by-products, such as effluent, gases and noise, that are harmful to the environment. We are subject to multiple laws governing environmental protection, such as “The Law on Environmental Protection in the PRC” and “The Law on Prevention of Effluent Pollution in the PRC,” as well as standards set by the relevant governmental bodies determining the classification of different wastes and proper disposal. We have properly attained a waste disposal permit for our manufacturing facility, which details the types and concentration of effluents and gases allowed for disposal. We are responsible for the renewal of the waste disposal permit. There is no assurance that we will obtain the renewal of the waste disposal permit when the current permit expires.
China is experiencing substantial problems with environmental pollution. Accordingly, it is likely that the national, provincial and local governmental agencies will adopt stricter pollution controls. There can be no assurance that future changes in environmental laws and regulations will not impose costly compliance requirements on us or otherwise subject us to future liabilities. Our business’s profitability may be adversely affected if additional or modified environmental control regulations are imposed upon us.
33
We rely on dividends paid by our subsidiaries for our cash needs, and any limitation on the ability of our subsidiaries to make payments to us could have a material and adverse effect on our ability to conduct our business.
We conduct all of our business through Helpson, our subsidiary established in China. We rely on dividends paid by this subsidiary for our cash needs, including the funds necessary to pay dividends and other cash distributions, if any, to our stockholders, to service any debt we may incur and to pay our operating expenses. The payment of dividends by entities established in China is subject to limitations. Regulations in China currently permit payment of dividends only out of accumulated profits as determined in accordance with accounting standards and regulations in China. Our PRC subsidiary is also required to set aside at least 10.0% of its after-tax profit based on PRC accounting standards each year to its general reserves or statutory capital reserve fund until the accumulative amount of such reserves reach 50.0% of its respective registered capital. Our restricted reserves are not distributable as cash dividends. In addition, if any of our PRC subsidiaries incurs debt on its own behalf in the future, the instruments governing the debt may restrict its ability to pay dividends or make other distributions to us.
Failure to comply with PRC regulations regarding the registration requirements for employee equity incentive plans may subject our PRC citizen employees or us to fines and other legal or administrative sanctions.
On March 28, 2007, the SAFE promulgated the Application Procedure of Foreign Exchange Administration for Domestic Individuals Participating in Employee Stock Holding Plan or Share Option Plan of Overseas-Listed Company, or the Share Option Rule. Under the Share Option Rule, PRC citizens who are granted share options or other employee equity incentive awards by an overseas publicly-listed company are required, through a PRC agent who may be a PRC subsidiary of such overseas publicly-listed company, to register with the SAFE and complete certain other procedures related to the share options or other employee equity incentive plans. We and our PRC citizen employees who are granted share options or other equity incentive awards under our 2009 Stock Option Plan and our 2010 Long-Term Incentive Plan, or PRC optionees, are subject to the Share Option Rule. If we or our PRC optionees fail to comply with these regulations, we or our PRC optionees may be subject to fines and legal sanctions.
The enforcement of new labor contract law and its implementation rules and increase in labor costs in the PRC may adversely affect our business and our profitability.
China adopted the PRC Employment Contract Law, or the new Labor Contract Law, effective January 1, 2008 and the implementation rules effective September 18, 2008. The new Labor Contract Law and its implementation rules impose more stringent obligations on employers for, among others, entering into written employment contracts, hiring temporary employees, dismissing employees, setting compensations for dismissal and protecting certain sick or disabled employees from dismissal and setting forth detailed requirements relating to the contents of the employment contracts. The implementation of the new Labor Contract Law may increase our operating expenses, in particular our personnel expenses, as the continued success of our business depends significantly on our ability to attract and retain qualified personnel. In the event that we decide to terminate some of our employees or otherwise change our employment or labor practices, the new Labor Contract Law may also limit our ability to effect those changes in a manner that we believe to be cost-effective or desirable, which could adversely affect our business and results of operations.
PRC regulation of loans and direct investment by offshore holding companies to PRC entities may delay or prevent us from using the proceeds we receive from a securities offering to make loans or additional capital contributions to our PRC operating subsidiary.
In utilizing the proceeds we receive from a securities offering, as an offshore holding company with a PRC subsidiary, we may make loans to our PRC subsidiary, or we may make additional capital contributions to our PRC subsidiary. Any loans to our PRC subsidiary are subject to PRC regulations and approvals. For example, loans to our PRC subsidiary Helpson, which is a foreign-invested enterprise, to finance its activities cannot exceed statutory limits and must be registered with the State Administration of Foreign Exchange in China, or SAFE, or its local counterpart. Loans by us to domestic PRC enterprises must be approved by the relevant government authorities and must also be registered with the SAFE or its local counterpart. Any capital contributions to our PRC subsidiary must be approved by the Ministry of Commerce in China or its local counterpart. On August 29, 2008, SAFE promulgated Circular 142, a notice regulating the conversion by a foreign-
34
invested company of foreign currency into Renminbi by restricting how the converted Renminbi may be used. The notice requires that Renminbi converted from the foreign currency denominated capital of a foreign-invested company may only be used for purposes within the business scope approved by the applicable governmental authority and may not be used for equity investments within the PRC unless specifically provided for otherwise. In addition, SAFE strengthened its oversight over the flow and use of Renminbi funds converted from the foreign currency-denominated capital of a foreign-invested company. The use of such Renminbi may not be changed without approval from SAFE, and may not be used to repay Renminbi loans if the proceeds of such loans have not yet been used. Violations of Circular 142 may result in severe penalties, including substantial fines as set forth in the Foreign Exchange Administration Rules. We cannot assure you that we will be able to obtain these government registrations or approvals on a timely basis, if at all, with respect to our future loans or capital contributions to our direct or indirect subsidiaries. If we fail to receive such registrations or approvals, our ability to use the proceeds from a securities offering and to capitalize our PRC operations may be negatively affected, which could materially and adversely affect our liquidity and ability to fund and expand our business.
The 2006 M&A Rule establishes more complex procedures for some acquisitions of Chinese companies by foreign investors, which could make it more difficult for us to pursue growth through acquisitions in China.
On August 8, 2006, six PRC regulatory agencies, namely, the Ministry of Commerce, the State Assets Supervision and Administration Commission, or SASAC, the State Administration for Taxation, the State Administration for Industry and Commerce, the CSRC and SAFE, jointly adopted the Regulations on Mergers and Acquisitions of Domestic Enterprises by Foreign Investors, or the 2006 M&A Rule, which became effective on September 8, 2006. The 2006 M&A Rule establishes additional procedures and requirements that could make some acquisitions of PRC companies by foreign entities, such as our company, more time-consuming and complex, including requirements in some instances that the approval of the Ministry of Commerce shall be required for transactions involving the shares of an offshore listed company being used as the acquisition consideration by foreign entities, including Sino-foreign joint ventures. In the future, we may grow our business in part by acquiring complementary businesses. Complying with the requirements of the 2006 M&A Rule to complete such transactions could be time-consuming, and any required approval processes, including obtaining approval from the Ministry of Commerce, may delay or inhibit our ability to complete such transactions, which could affect our ability to expand our business or maintain our market share.
Our China-sourced income is subject to PRC withholding tax under the new Enterprise Income Tax Law of the PRC, and we may be subject to PRC enterprise income tax at the rate of 25% when more detailed rules or precedents are promulgated.
We are a Delaware holding company with substantially all of our operations conducted through our operating subsidiary in China. Under the new PRC Enterprise Income Tax Law, or the new EIT Law, and its implementation rules, both of which became effective on January 1, 2008, China-sourced income of foreign enterprises, such as dividends paid by a PRC subsidiary to its overseas parent, is generally subject to a 10% withholding tax. The new EIT Law, however, also provides that enterprises established outside China whose “de facto management bodies” are located in China are considered “tax resident enterprises” and will generally be subject to the uniform 25% enterprise income tax rate as to their global income. Under the implementation rules, “de facto management bodies” are defined as the bodies that have, in substance, overall management control over such aspects as the production and business, personnel, accounts and properties of an enterprise. In April 2009, the PRC tax authority promulgated the Notice on Determination of Tax Resident Enterprises of Chinese-controlled Offshore Incorporated Enterprises in accordance with Their De Facto Management Bodies, or Circular 82, to clarify the criteria for determining whether the “de facto management bodies” are located within the PRC for enterprises incorporated overseas with controlling shareholders being PRC enterprises. As all of the our operational management is currently based in the PRC,
35
and we expect them to continue to be located in China, our company may be deemed a PRC resident enterprise and therefore subject to the PRC enterprise income tax at a rate of 25% on our worldwide income, which excludes the dividends received directly from another PRC resident enterprise. Due to the lack of clear guidance on the criteria pursuant to which the PRC tax authorities will determine our tax residency under the new EIT Law, it remains unclear whether the PRC tax authorities will treat us as a PRC resident enterprise. Therefore, we are unable to confirm whether we are subject to the tax applicable to resident enterprises or non-resident enterprises under the new EIT Law. Furthermore, in connection with the new EIT Law and Tax Implementation Regulations, the Ministry of Finance and State Administration of Taxation jointly issued, on April 30, 2009, the Notice on Issues Concerning Process of Enterprise Income Tax in Enterprise Restructuring Business, or Circular 59, which became effective retrospectively on January 1, 2008. As Circular 59 has only recently been promulgated, it is uncertain to us as to how it will be implemented and the respective tax base and the tax exposure cannot be determined reliably at this stage. In case we are required to pay the income tax on capital gains by the relevant PRC tax authorities, our financial conditions and results of operations could be adversely affected.
Dividends payable by us to our foreign investors and gain on the sale of our shares may become subject to taxes under PRC tax laws.
Under the new EIT law and its implementation rules, to the extent that we are considered a “resident enterprise” which is “domiciled” in China, PRC income tax at the rate of 10% is applicable to dividends payable by us to investors that are “non-resident enterprises” so long as such “non-resident enterprise” investors do not have an establishment or place of business in China or, despite the existence of such establishment or place of business in China, the relevant income is not effectively connected with such establishment or place of business in China. Similarly, any gain realized on the transfer of our shares by such investors is also subject to a 10% PRC income tax if such gain is regarded as income derived from sources within China and we are considered a “resident enterprise” which is domiciled in China for tax purposes. Additionally, there is a possibility that the relevant PRC tax authorities may take the view that our purpose is that of a holding company, and the capital gain derived by our overseas stockholders would be deemed China-sourced income, in which case such capital gain may be subject to PRC withholding tax at the rate of up to 10%. If we are required under the new EIT law to withhold PRC income tax on our dividends payable to our foreign stockholders who are “non-resident enterprises”, or if you are required to pay PRC income tax on the transfer of our shares under the circumstances mentioned above, the value of your investment in our shares may be materially and adversely affected. It is unclear whether, if we are considered a PRC “resident enterprise,” holders of our shares would be able to claim the benefit of income tax treaties or agreements entered into between China and other countries or areas.
The strengthened scrutiny over acquisition transactions by the PRC tax authorities may have a negative impact on our acquisition strategy.
In connection with the new EIT Law, the Ministry of Finance and State Administration of Taxation jointly issued, on April 30, 2009, the Notice on Issues Concerning Process of Enterprise Income Tax in Enterprise Restructuring Business, or Circular 59. On December 10, 2009, the State Administration of Taxation issued the Notice on Strengthening the Management on Enterprise Income Tax for Non-resident Enterprises Equity Transfer, or Circular 698. Both Circular 59 and Circular 698 became effective retrospectively on January 1, 2008. By promulgating and implementing these circulars, the PRC tax authorities have strengthened their scrutiny over the direct or indirect transfer of equity interest in a PRC resident enterprise by a non-resident enterprise. For example, Circular 698 specifies that the PRC State Administration of Taxation is entitled to redefine the nature of an equity transfer where offshore vehicles are interposed by abusing corporate structures for tax-avoidance purposes and without reasonable commercial intention. We may pursue acquisitions as one of our growth strategies, and may conduct acquisitions involving complex corporate structures. We cannot be assured that the PRC tax authorities will not, at their discretion, adjust the capital gains thus causing us to incur additional acquisition costs.
36
Any future outbreak of H1N1 influenza, also known as swine flu, avian influenza or severe acute respiratory syndrome in China, or similar adverse public health developments, may severely disrupt our business and operations.
In May and June 2009, occurrences of H1N1 influenza were reported in Hong Kong and other parts of China. Since 2005, there have been reports on the occurrences of avian influenza in various parts of China, including a few confirmed human cases that resulted in fatalities. In addition, from December 2002 to June 2003, China and other countries experienced an outbreak of a new and highly contagious form of atypical pneumonia now known as severe acute respiratory syndrome, or SARS. On July 5, 2003, the World Health Organization declared that the SARS outbreak had been contained. Since September 2003, however, a number of isolated new cases of SARS have been reported, most recently in central China in April 2004. During May and June of 2003, many businesses in China were temporarily closed by the PRC government to prevent transmission of SARS. Any prolonged recurrence of H1N1 or avian influenza, SARS or other adverse public health developments in China could require the temporary closure of our facilities. Such closures could severely disrupt our production and business operations and materially and adversely affect our results of operations. We have not adopted any written preventive measures or contingency plans to combat any future outbreak of H1N1 influenza, avian influenza, SARS or any other epidemic.
Risks Related to our Common Stock
The market price for our common stock may be volatile which could results in a complete loss of your investment.
The market price for our common stock is likely to be highly volatile and subject to wide fluctuations in response to factors including the following:
|
·
|
actual or anticipated fluctuations in our quarterly operating results;
|
|
·
|
announcements of new products by us or our competitors;
|
|
·
|
changes in financial estimates by securities analysts;
|
|
·
|
conditions in the pharmaceutical market;
|
|
·
|
changes in the economic performance or market valuations of other companies involved in pharmaceutical production;
|
|
·
|
announcements by our competitors of significant acquisitions, strategic partnerships, joint ventures or capital commitments;
|
|
·
|
economic, regulatory and political developments;
|
|
·
|
additions or departures of key personnel, or
|
|
·
|
potential litigation.
|
In addition, the securities markets have from time to time experienced significant price and volume fluctuations that are not related to the operating performance of particular companies. These market fluctuations may also materially and adversely affect the market price of our common stock.
We may issue additional shares of our capital stock to raise additional cash for working capital; if we issue additional shares of our capital stock, our stockholders will experience dilution in their respective percentage ownership in us the company.
We may issue additional shares of our capital stock to raise additional cash for working capital. There is no anti-dilution protection or preemptive rights in connection with our common stock. Thus, the percentage ownership of existing holders of common stock may be diluted in their respective percentage ownership in us if we issue additional shares of our capital stock.
37
A large portion of our common stock is controlled by a small number of stockholders and as a result, these stockholders are able to influence and ultimately control the outcome of stockholder votes on various matters.
A large portion of our common stock is held by a small number of stockholders. For instance, Heung Mei Tsui holds 21.5% and Zhilin Li holds 23.1% of our common stock, respectively, as of the date hereof. As a result, these two stockholders are able to significantly influence the outcome of stockholder votes on various matters, including the election of directors and other corporate transactions including business combinations. In addition, the occurrence of sales of a large number of shares of our common stock, or the perception that these sales could occur, may affect our stock price and could impair our ability to obtain capital through an offering of equity securities. Furthermore, the current ratios of ownership of our common stock reduce the public float and liquidity of our common stock which can in turn affect the market price of our common stock.
We are likely to remain subject to “penny stock” regulations and as a consequence there are additional sales practice requirements and additional warnings issued by the SEC.
If at any time we have net tangible assets of $5,000,000 or less and the trading price of our common stock is below $5.00 per share, the open-market trading of our common stock will be subject to the “penny stock” rules of the SEC. The “penny stock” rules impose additional sales practice requirements on broker-dealers who sell securities to persons other than established customers and accredited investors (generally those with assets in excess of $1,000,000 or annual income exceeding $200,000 or $300,000 together with their spouse). For transactions covered by these rules, the broker-dealer must make a special suitability determination for the purchase of securities and have received the purchaser’s written consent to the transaction before the purchase. Additionally, for any transaction involving a penny stock, unless exempt, the broker-dealer must deliver, before the transaction, a disclosure schedule prescribed by the SEC relating to the penny stock market. The broker-dealer also must disclose the commissions payable to both the broker-dealer and the registered representative and current quotations for the securities. Finally, monthly statements must be sent disclosing recent price information on the limited market in penny stocks. These additional burdens imposed on broker-dealers may restrict the ability of broker-dealers to sell the common stock and may affect a stockholder’s ability to resell the common stock.
There can be no assurance that our common stock will qualify for exemption from the “penny stock” rules. In any event, even if our common stock is exempt from such rules, we would remain subject to Section 15(b)(6) of the Exchange Act, which gives the SEC the authority to restrict any person from participating in a distribution of a “penny stock” if the SEC finds that such a restriction would be in the public interest.
Stockholders should be aware that, according to SEC Release No. 34-29093, the market for penny stocks has suffered in recent years from patterns of fraud and abuse. Such patterns include (i) control of the market for the security by one or a few broker-dealers that are often related to the promoter or issuer; (ii) manipulation of prices through prearranged matching of purchases and sales and false and misleading press releases; (iii) boiler room practices involving high-pressure sales tactics and unrealistic price projections by inexperienced sales persons; (iv) excessive and undisclosed bid-ask differential and markups by selling broker-dealers; and (v) the wholesale dumping of the same securities by promoters and broker-dealers after prices have been manipulated to a desired level, along with the resulting inevitable collapse of those prices and with consequent investor losses. Our management is aware of the abuses that have occurred historically in the penny stock market.
We are responsible for the indemnification of our officers and directors under certain circumstances which could result in substantial expenditures, which we may be unable to recoup.
Our bylaws provide for the indemnification of our directors, officers, employees, and agents, under certain circumstances, against attorney’s fees and other expenses incurred by them in any litigation to which they become a party arising from their association with or activities on behalf of us. This indemnification policy could result in substantial expenditures, which we may be unable to recoup.
We have identified material weaknesses in our disclosure controls and procedures and our internal control over financial reporting, which could affect our ability to ensure timely and reliable financial reports, affect the ability of our auditors to attest to the effectiveness of our internal controls should we become an accelerated filer in the future, and weaken investor confidence in our financial reporting.
38
As directed by Section 404 of the Sarbanes-Oxley Act of 2002, the SEC adopted rules requiring public companies in their annual reports to include a report of management on the reporting company's disclosure controls and procedures and internal controls over financial reporting. We became subject to this requirement commencing with our fiscal year ended December 31, 2007 and a report of our management is included under Item 9A. “Controls and Procedures” of this Annual Report on Form 10-K. As set forth in such report, our management has concluded that our disclosure controls and procedures werenot effectiveas of December 31, and there existed a material weakness in our internal control over financial reporting as of December 31, 2011.
Although the material weakness identified in Item 9A of this Annual Report was the result of our classification of advances for purchases of intangible assets and the amortization of intangible assets and we believe we have taken appropriate actions to remediate such material weakness, such measures may not be sufficient to address the material weaknesses identified or ensure that our controls and procedures are effective. We may also discover other material weaknesses in the future. Any failure to maintain or implement required new or improved controls, or any difficulties we encounter in the implementation of such controls, could cause us to fail to meet our periodic reporting obligations or result in material misstatements in our financial statements and affect the ability of our auditors to attest to the effectiveness of our internal control over financing reporting to the extent we become an accelerated filer in the future. In addition, substantial costs and resources may be required to rectify any internal control deficiencies. If we cannot produce reliable financial reports, investors could lose confidence in our reported financial information, the market price of our common stock could decline significantly, and our business and financial condition could be adversely affected.
We do not anticipate paying cash dividends on our common stock.
You should not rely on an investment our common stock to provide dividend income, as we have not paid any cash dividends on our common stock and do not plan to pay any in the foreseeable future. Accordingly, investors must rely on sales of their common stock after price appreciation, which may never occur, as the only way to realize any return on their investment.
Restrictions on the Use of Rule 144 by Shell Companies or Former Shell Companies.
Historically, the SEC has taken the position that Rule 144 under the Securities Act, as amended, is not available for the resale of securities initially issued by companies that are, or previously were, blank check companies like us, to their promoters or affiliates despite technical compliance with the requirements of Rule 144. The SEC has codified and expanded this position in its amendments effective on February 15, 2008 and apply to securities acquired both before and after that date by prohibiting the use of Rule 144 for resale of securities issued by shell companies (other than business transaction related shell companies) or issuers that have been at any time previously a shell company. The SEC has provided an important exception to this prohibition, however, if the following conditions are met: the issuer of the securities that was formerly a shell company has ceased to be a shell company; the issuer of the securities is subject to the reporting requirements of Section 13 or 15(d) of the Exchange Act; the issuer of the securities has filed all Exchange Act reports and material required to be filed, as applicable, during the preceding 12 months (or such shorter period that the issuer was required to file such reports and materials), other than Form 8-K reports; and at least one year has elapsed from the time that the issuer filed current Form 10 type information with the SEC reflecting its status as an entity that is not a shell company. As such, due to the fact that we had been a shell company prior to October 2005, holders of "restricted securities" within the meaning of Rule 144, when reselling their shares pursuant to Rule 144, shall be subject to the conditions set forth herein.
39
Smaller reporting companies are not required to provide the information required by this item.
There is no private ownership of land in China. All land is owned by the government of the PRC on behalf of all Chinese citizens or collectively owned by farmers. Land use rights can be allocated by the PRC State Land Administration Bureau or its authorized branches. Helpson was granted land use rights from the PRC government for approximately 22,936 square meters of land located on Plot C09-2 at Haikou Bonded Zone, Hainan Province, PRC in 2003. The land use rights will expire on September 10, 2063.
Helpson owns two production facilities in Haikou, Hainan Province, PRC, one of which has a construction area of 663.94 square meters located at the 6th floor of Standard Plant Building B, Jinpan Industrial Development Zone, and another factory, which is located on Plot C09-2 at Haikou Bonded Zone, has a production area of 6,593.20 square meters.
In addition, Helpson rented the offices located at the second floor, Jiahai Building owned by Hainan Zhongfu Going-abroad Personnel Service Center (the “Center”) as its principal executive offices. The monthly rent was RMB5,580 (approximately $843). The term of the lease was 3 years, from December 1, 2010 to November 30, 2013. On December 31, 2011, the lease was superseded by the new lease Helpson entered into with the Center. The new lease is for a term of nine years for the office spaces on the second floor and the entire third floor at a monthly rent of RMB20,000 (approximately $2,941) with a 5% increment every two years from the fourth year until the end of the term. The aggregate spaces Helpson rented are 1,686 square meters, which is 16,812 square feet.
We believe that all our properties have been adequately maintained, are generally in good condition, and are suitable and adequate for our business. However, our expansion plans contemplate the need for additional space as we increase production.
Mortgaged Property
Helpson entered into two loan agreements with China Everbright Bank in October and November 2011. In order to secure the two loans, Helpson mortgaged its land use rights and owned buildings as set forth in the table below:
|
Loan Amount
|
Lending Institution
|
Contract Period
|
Interest Rate
|
Properties under
Mortgage
|
|
RMB 20 million (approximately $3.1 million)
|
China Everbright Bank
|
October 26, 2011 to October 25, 2012
|
The interest rate is a variable rate equal to 110% of the floating base interest for loans of the same term promulgated by the PRC’s central bank.
|
Helpson’s land : 22,936 square meters (Certificate #: Guo Yong [2003] No. 005572)
Helpson’s buildings: 663.94 square meters (Certificate #: HK008109) and 6593.2 square meters (Certificate #: HK122889)
|
|
RMB 5 million (approximately $0.8 million)
|
November 8, 2011 to November 7, 2012
|
From time to time, we may become involved in various lawsuits and legal proceedings which arise in the ordinary course of business. Litigation is subject to inherent uncertainties, and an adverse result in these or other matters may arise from time to time that may harm our business. However, we are currently not aware of any such legal proceedings or claims that we believe will have, individually or in the aggregate, a material adverse affect on our business, financial condition or operating results.
40
Not applicable.
Market Information
Our shares began trading on the NYSE Amex on September 30, 2009 under the symbol “CPHI.” Prior to September 30, 2009, our shares traded on the OTC Bulletin Board under the symbol “CPHI.OB.”
The following table, based upon reports of transactions on the NYSE Amex, contains information about the range of high and low sales prices for our common stock for each full quarterly period during the period from January 1, 2010 to December 31, 2011.
|
High
|
Low
|
|||||||
|
Fiscal 2010
|
||||||||
|
First Quarter
|
$
|
4.32
|
$
|
3.02
|
||||
|
Second Quarter
|
3.70
|
2.50
|
||||||
|
Third Quarter
|
3.23
|
2.09
|
||||||
|
Fourth Quarter
|
3.27
|
2.42
|
||||||
|
Fiscal 2011
|
||||||||
|
First Quarter
|
$
|
3.19
|
$
|
2.25
|
||||
|
Second Quarter
|
2.75
|
1.59
|
||||||
|
Third Quarter
|
2.52
|
0.96
|
||||||
|
Fourth Quarter
|
1.05
|
0.62
|
||||||
Holders
As of March 2, 2011, there were approximately 147 shareholders of record of our common stock and an indeterminate number of beneficial holders who held our common stock in street name.
Transfer Agent and Registrar
The transfer agent and registrar for our common stock is Securities Transfer Corporation, 2591 Dallas Parkway, Suite 102, Frisco, Texas 75034. Their telephone number is (469) 633-0101.
Dividend Policy
We have never paid or declared any dividend on our common stock and we do not anticipate paying cash dividends in the foreseeable future. As a result of our holding company structure, we would rely entirely on dividend payments from our subsidiaries, Onny Investment Ltd. and Hainan Helpson Medial & Biotechnology Co., Ltd., for our cash flow to pay dividends on our common stock. The PRC government imposes controls on the conversion of Renminbi into foreign currencies and the remittance of currencies out of the PRC, which also may affect our ability to pay cash dividends in the future.
Recent Sales of Unregistered Securities
On May 25, 2011, we granted (1) 75,000 shares of common stock and options to purchase 50,000 shares of common stock at an exercise price of $2.54 per share to our Chairman and Chief Executive Officer – Zhilin Li; and (2) 50,000 shares of common stock and options to purchase 50,000 shares of common stock at an exercise price of $2.54 per share to our Chief Financial Officer – Frank Waung, under the 2010 Long-Term Incentive Plan of the Company (the “2010 Incentive Plan”). These transactions were exempt from registration pursuant to Section 4(2) of the Securities Act.
41
On April 28, 2010, we granted options to purchase 200,000 shares of common stock to an executive officer under our 2009 Stock Option Plan. This transaction was exempt from registration pursuant to Section 4(2) of the Securities Act.
On May 17, 2010, we issued three-year warrants to purchase 150,000 shares of common stock to a consultant for services rendered. The exercise price is $3.00 per share for 75,000 shares and $3.80 per share for the remaining 75,000 shares. This transaction was exempt from registration pursuant to Section 4(2) of the Securities Act.
On November 16, 2010, we issued 4,052 shares of our common stock to an executive officer upon the cashless exercise of 40,000 outstanding stock options with an exercise price of $2.75 per share. This transaction was exempt from registration pursuant to Section 3(9) of the Securities Act.
On December 13, 2010, we issued 6,863 shares of common stock under our 2009 Stock Option Plan to an executive officer. This transaction was exempt from registration pursuant to Section 4(2) of the Securities Act.
Securities Authorized for Issuance Under Equity Compensation Plans
The disclosure contained in “Item 11. Executive Compensation – Discussion of Summary Compensation and Grants of Plan-based Awards Tables” is incorporated herein by reference. The following table summarizes the number of shares of our common stock authorized for issuance under our equity compensation plans as of December 31, 2011.
|
Plan Category
|
(a)
Number of
Securities to be
Issued Upon
Exercise of Outstanding
Options
|
(b)
Weighted-
Average
Exercise Price
of Outstanding
Options
|
(c)
Number of
Securities
Remaining
Available
for Future
Issuance Under
Equity
Compensation
Plans (excluding
securities reflected
in column(a))
|
|||||||||
|
Equity compensation plans approved by security holders
|
|
|||||||||||
|
The 2009 Stock Option Plan
|
210,000 | $ | 3.26 | 700,000 | ||||||||
|
The 2010 Long-Term Incentive Plan
|
100,000 | $ | 2.54 | 3,775,000 (1) | ||||||||
|
Equity compensation plans not approved by security holders
|
- | - | - | |||||||||
|
Total
|
310,000 | - | 4,475,000 | |||||||||
__________________
(1) Does not include the 125,000 shares of restricted stock granted under the 2010 Long-Term Incentive Plan.
As a "smaller" reporting company as defined in Item 10 of Regulation S-K, we are not required to provide the information required by this item.
42
The statements contained in this report with respect to our financial condition, results of operations and business that are not historical facts are forward-looking statements. Forward-looking statements can be identified by the use of forward-looking terminology, such as "anticipate", "believe", "expect", "plan", "intend", "seek", "estimate", "project", "could", "may" or the negative thereof or other variations thereon, or by discussions of strategy that involve risks and uncertainties. Management wishes to caution the reader of the forward-looking statements that any such statements that are contained in this report reflect our current beliefs with respect to future events and involve known and unknown risks, uncertainties and other factors, including, but not limited to, economic, competitive, regulatory, technological, key employees, and general business factors affecting our operations, markets, growth, services, products, licenses and other factors, some of which are described in this report including in “Risk Factors” in Item 1A and some of which are discussed in our other filings with the Securities and Exchange Commission. These forward-looking statements are only estimates or predictions. No assurances can be given regarding the achievement of future results, as actual results may differ materially as a result of risks facing our company, and actual events may differ from the assumptions underlying the statements that have been made regarding anticipated events.
These risk factors should be considered in connection with any subsequent written or oral forward-looking statements that we or persons acting on our behalf may issue. All written and oral forward looking statements made in connection with this report that are attributable to our company or persons acting on our behalf are expressly qualified in their entirety by these cautionary statements. Given these uncertainties, we caution investors not to unduly rely on our forward-looking statements. We do not undertake any obligation to review or confirm analysts’ expectations or estimates or to release publicly any revisions to any forward-looking statements to reflect events or circumstances after the date of this report or to reflect the occurrence of unanticipated events, except as required by applicable law or regulation.
Summary of Twelve Months Ended December 31, 2011
For the year ended December 31, 2011, we registered moderate growth and financial performance. Revenue increased by 9%, reaching $81.2 million, as compared to $74.4 million in the year ended December 31, 2010. This growth was primarily from our digestive disease and anti-viro/infection and respiratory product categories.
Net income for the year ended December 31, 2011 was $19.3 million, a decrease of 18%, from $23.4 million in the year ended December 31,2010. Our net income figures for both years ended December 31, 2011 and 2010 include gains resulting from changes in derivative warrant liability. Without the effect of the changes in derivative warrant liability, management estimates that net income would have been approximately $18 million and $22 million in 2011 and 2010. The decrease in net income was mainly due to the decrease in gross profit margin, increase in income tax rate, and increase in operating expenses.
From a profitability perspective, our gross profit margin for the year ended December 31, 2011 was 36% compared to 41% in 2010. The decrease in gross profit margin was mainly due to margin compression as a result of the Healthcare Reform. Pricing pressure is now quite a prominent feature in the overall pharmaceutical market in China.
43
Cash flow from operations for the year ended December 31, 2011 was $5.24 million, a decrease of 32.73%, as compared to $7.79 million in 2010. The decrease in cash flow from operations in 2011 was the result of lower net income and also higher working capital usage from higher inventory, and lower account payables in 2011 as compared to 2010.
Earnings per common share (basic and diluted) for the year ended December 31, 2011 was $0.44 per share compared to $0.54 per share for the 12 months ended December 31, 2010.
Business Overview & Recent Developments
In the year ended December 31, 2011, we continued to execute our business strategy of expanding revenues from our core portfolio of products while continuing the development process of new products. However the year was a challenging one as the implementation of the healthcare reform has resulted in high pricing pressure and lower gross profit margins across the board for almost all pharmaceutical products.
For our existing products, during the year we saw our “Digestive Diseases” product category take a lead in sales growth by increasing 33% compared to the prior year period. Our “Anti-Viro/infection and Respiratory” product category also saw healthy growth of 18%. CNS Cerebral Cardio & Vascular category saw trend growth of 8% while sales of Other category fell as those products encountered stiffer competition.
The products in our pipe-line progressed slowly but steadily along the development process are getting closer to product launch. The SFDA is also revamping its production approval criteria and processes, resulting in longer approval time for new production applications across all types of products. In some cases they are adding additional requirements for product already under review. In early 2010 we completed the clinical trials for Candesartan, a front-line drug therapy we developed for the treatment of hypertension. We submitted a production approval application to the SFDA for Candesartan but the application moved very slowly through the SFDA process. We finally resumed communication with the SFDA in the fourth quarter of 2011 and received a request for some additional procedure to be performed. Since then we have completed and submitted the requested material and we now have reason to believe that we will receive final production approval by mid-year. The clinical trial for Rosuvastatin, or the generic version of Crestor, was completed in December 2010 and we are in the process of applying for the production approval for this product. In September 2010, we also completed Phase I of our clinical trial for our new antibiotic combination drug. We are currently moving ahead and are in Phase II of the trial for this drug.
Below we list the current status of some of our pipeline products:
|
·
|
Antibiotic Combination. We completed the Phase I clinical trials of our novel cephalosporin-based combination antibiotic in the third quarter of 2010. We are currently in Phase II of the clinical trial progressing well.
|
44
|
·
|
Rosuvastatin. Fourth Quarter of 2010: Clinical trial for Rosuvastatin is a generic form of Crestor, a drug for indication of high blood cholesterol level. Clinical trials for this generic drug was completed in fourth quarter of 2010 and we have submitted an application for production approval.
|
|
·
|
Cadesartan. We originally submitted application for production approval of Candesartan, a front-line drug therapy we developed for the treatment of hypertension, in 2010. We received request for additional procedures in the fourth quarter of 2011 and we have since completed all newly requested procedures and are currently waiting for the final production approval from the SFDA. We expect to hear from the SFDA before the mid-year mark.
|
|
·
|
Heart Disease Drug. We are developing a medicine for the treatment of coronary heart disease. This product comes with a patented TCM formula and we are currently conducting Phase III clinical trials for this drug. We anticipate the completion of the clinical work for this product by year end 2012.
|
Market Trends
The growth of China’s pharmaceutical market is driven by China’s rapid economic growth. Increased healthcare spending by the Chinese government to reform the healthcare system has already greatly improved the accessibility of, and desire for, medical care. Important additional factors include: the aging of the population and the resulting increase in age-related disorders; the urban migration of the population; and improved awareness of personal health care.
The Healthcare Reform program announced by the Chinese government in late 2009 is having a significant impact on all healthcare related industries in China, including the pharmaceutical industry. Over all, the government plans to provide a basic, universal healthcare system to all citizens of China. In 2010, the government began to broadly implement the policies from the Healthcare Reform. In this respect, products on the Essential Drug List (EDL) are expected to experience an increase in volume but a reduction in their prices, which will have an adverse affect on their net margins. We believe volume expansion will continue as government subsidy to rural communities expands further. During the past 24 months, we have seen first-hand the increase in demand for EDL products, but along with the increase in demand, we also experienced some degradation in the pricing in 2011 compared to 2010. Furthermore, we observed that there are significant variations in timing and market reaction to the new environment, causing sales volume to gyrate in some of the affected products. While pricing is generally set at the central government level, provincial government intervention has added complexity to the pricing-volume interaction. In addition to EDL products, we have also seen pricing pressure on most of the drugs we sell. While these changes have more impact on pharmaceutical distribution companies, manufacturers of pharmaceutical products are also affected. We believe the general implication is that gross margins for pharmaceutical products will continue to be under pressure for some time. That being said, a pharmaceutical manufacturer with experienced management and the ability to react quickly to changes will not only survive but thrive in this environment.
45
Results of Operations for the Year Ended December 31, 2011
The following table presents our results of operations for the years ended December 31, 2011 and 2010.
|
Twelve Months Ended December 31
|
|||||||||||||||
|
2011
|
2010
|
Change
|
% Change
|
||||||||||||
|
Revenue
|
$ | 81,166,739 | $ | 74,388,180 | $ | 6,778,559 | 9 | % | |||||||
|
Cost of Revenue
|
52,178,680 | 44,105,447 | 8,073,233 | 18 | % | ||||||||||
|
Gross Profit
|
28,988,059 | 30,282,733 | (1,294,674 | ) | -4 | % | |||||||||
|
Selling Expenses
|
3,439,522 | 2,542,826 | 896,696 | 35 | % | ||||||||||
|
General and Administrative Expenses
|
3,716,397 | 3,039,450 | 676,947 | 22 | % | ||||||||||
|
Bad Debt Expense
|
108,085 | 505,224 | (397,139 | ) | |||||||||||
|
Government Subsidy Income
|
301,672 | 469,509 | (167,837 | ) | |||||||||||
|
Income from Operations
|
22,025,727 | 24,664,742 | (2,639,015 | ) | -11 | % | |||||||||
|
Net Interest Income (Expense)
|
(247,990 | ) | (152,845 | ) | (95,145 | ) | |||||||||
|
Derivative Gain
|
934,260 | 1,588,888 | (654,628 | ) | |||||||||||
|
Income Tax Expense
|
3,442,355 | 2,686,438 | 755,917 | 28 | % | ||||||||||
|
Net Income
|
$ | 19,269,642 | $ | 23,414,347 | $ | (4,144,705 | ) | -18 | % | ||||||
|
Basic Net Income per Share
|
$ | 0.44 | $ | 0.54 | $ | (0.10 | ) | -18 | % | ||||||
|
Basic Weighted Average Shares Outstanding
|
43,479,899 | 43,329,554 | |||||||||||||
|
Diluted Net Income per Share
|
$ | 0.44 | $ | 0.54 | $ | (0.10 | ) | -18 | % | ||||||
|
Diluted Weighted Average Shares Outstanding
|
43,479,899 | 43,532,435 | |||||||||||||
Revenu e
For the year ended December 31, 2011, our sales revenue was $81.2 million, an increase of 9%, compared to $74.4 million in 2010.
Set forth below are our revenues by product category in millions USD for the years ended December 31, 2011 and 2010.
|
Product Category
|
Twelve Months Ended December 31
|
Net Change
|
% Change
|
|||||||||||||
|
2011
|
2010
|
|||||||||||||||
|
CNS Cerebral & Cardio Vascular
|
$ | 25.8 | $ | 23.9 | $ | 1.9 | 8 | % | ||||||||
|
Anti-Viro/ Infection & Respiratory
|
$ | 32.0 | $ | 27.1 | $ | 4.9 | 18 | % | ||||||||
|
Digestive Diseases
|
$ | 12.4 | $ | 9.3 | $ | 3.1 | 33 | % | ||||||||
|
Other
|
$ | 11.0 | $ | 14.1 | $ | - 3.1 | -22 | % | ||||||||
The most significant revenue growth was in our “Digestive Diseases” product category, which generated $12.4 million in sales revenue compared to $9.3 million a year ago, an increase of $3.1 million, or 33%. This increase was driven mainly by sales of Tiopronin, a drug prescribed for treatments of acute Hepatitis B and drug-induced liver damage, and Compound Ammonium Glycyrrhetate, also a drug prescribed for treatments of liver dysfunctions. Sales of the “Anti-Viro/Infection & Respiratory” category increased by 18% to $32.0 million in 2011 compared to $27.1 million in 2010, driven by increase in sales of our Cefaclor Dispersible Tablets. Our “CNS, Cardio & Cerebral Vascular” category experienced some additional growth in sales in 2011. This category generated $25.8 million of sales, compared to $23.9 million in the previous year, or an increase of 8%. Our “Other” product category sales fell to $11.0 million from $14.1 million, a decrease of $3.1 million, or 22%, as all products in this category encountered stronger competition this year compared to the last year.
46
In the year ended December 31, 2011, revenue breakdown by product category showed small changes. Sales of the “Anti-Viro & Respiratory” products category represented 39% of total sales in the year ended on December 31, 2011, compared to 36% in 2010. The “CNS, Cerebral & Cardio Vascular” category was steady, representing 32% of total revenue in both 2011 and 2010. The “Digestive Diseases” category represented 15% of total revenue in 2011 compared to 13% in 2010. The “Other” category represented 14% and 19% of revenues in 2011 and 2010, respectively. We continue to have a diversified portfolio of products with no single product representing more than 12% of total revenue.
Cost of Revenue
For the year ended December 31, 2011, our cost of revenue was $52.2 million, or 64% of total revenue, which represented an increase of $8.1 million from $44.1 million, or 59% of total revenue, in 2010. The increase in the cost of revenue during 2011 was primarily attributable to the increasing in volume of products sold.
Gross Profit and Gross Margin
Gross profit for the year ended December 31, 2011 was $29.0 million, a decrease of $1.3 million, or 4%, from $30.3 million in 2010. Our gross profit margin in 2011 was 36%, compared to 41% in 2010. The Healthcare Reform instituted by the Chinese government since 2009 has resulted in margin compression in most pharmaceutical products on the markets today, especially in the generic space that many of our products are in. While some of our higher margin products are still selling very well, most of our products experienced gross margins degradation compared to a year ago. Going forward we expect to see continued pricing pressure in most products, but new products such as Candesartan and Rosuvastatin could help to support overall gross margin once they are launched.
Selling Expenses
Our selling expenses for the year ended December 31, 2011 were $3.44 million, an increase of approximately $0.9 million, compared to $2.54 million in 2010. Selling expenses accounted for 4.24% of the total revenue in 2011 compared to 3.41% in 2010. Our overall selling expense to revenue ratio is still stable at between 3.5% to 4.5% level.
General and Administrative Expenses
Our general and administrative expenses for the year ended December 31, 2011 were $3.7 million, an increase of approximately $ 0.7 million, or 23.3%, compared to $3.0 million in 2010. General and administrative expenses accounting for 4.6% and 4.0% of our total revenues in 2011 and 2010, respectively. The increase was in part due to higher professional fees in 2011 compared to 2010 and a number of one time charges.
47
Due to the peculiarity of the Chinese pharmaceutical market environment, deferred payments to pharmaceutical companies by state-owned hospitals and local medicine distributors are a normal phenomenon. Over 90% of our drugs are sold to state-owned hospitals and local medicine distributors, which creates slow collections of our trade receivables. Since the majority of hospitals in China are backed by the government, management believes that the deferred payments from state-owned hospitals are secure and will eventually be collected. So far, we have not written-off any receivables in our 17-year history of doing business with hospitals.
In general, our normal credit or payments terms extended to customers is 90 days. This has not changed in recent years. Our customers are pharmaceutical distributors who sell to mostly government-backed hospitals. Since hospital pharmacies in China typically take a very long time to pay for their pharmaceutical products, the age of our receivables from our customers tends to be long as well. Although these customers typically pay after the due date of the receivables, we have always been able to collect our receivables and have never had an uncollectible receivable from these customers.
The amount of accounts receivable that were past due (or the amount of accounts receivable that were more than 90 days old) was $51.4 million and $41.8 million as of December 31, 2011 and 2010, respectively. The following table illustrates our accounts receivable aging distribution in terms of percentage of total accounts receivable as of December 30, 2011 and 2010:
|
December 31,
|
December 31,
|
|||||||
|
2011
|
2010
|
|||||||
|
1 - 90 Days
|
29.9 | % | 36.0 | % | ||||
|
90 - 180 Days
|
21.8 | % | 23.5 | % | ||||
|
180 - 360 Days
|
27.9 | % | 16.3 | % | ||||
|
360 - 720 Days
|
20.4 | % | 24.2 | % | ||||
|
Total
|
100 | % | 100 | % | ||||
Although we have not had to write off any receivables thus far in our company’s history, we do set aside an allowance for doubtful accounts. Our bad debt allowance estimate is currently the sum of 3.5% of accounts receivable that are less than 365 days old, 10% of accounts receivable that are between 365 days and 720 days old and 100% of accounts receivable that are greater than 720 days old (although there were no accounts receivable over 720 days old at December 31, 2011 or 2010).
To the extent that our current allowance for doubtful accounts is higher than that of the previous period, we recognize a bad debt expense for the difference during the current period, and when the current allowance is lower than that of the previous period, we recognize a bad debt benefit for the difference. The changes in the allowance for doubtful accounts during the years ended December 31, 2011 and 2010 were as follows (there were no write-offs or recoveries):
48
|
For the Twelve Months Ended
|
||||||||
|
December 31,
|
||||||||
|
2011
|
2010
|
|||||||
|
Balance, Beginning of Year
|
$ | 3,317,017 | $ | 2,718,358 | ||||
|
Bad debt expense (benefit)
|
108,085 | 505,224 | ||||||
|
Foreign currency translation adjustment
|
111,303 | 93,435 | ||||||
|
Balance, End of Year
|
$ | 3,536,405 | $ | 3,317,017 | ||||
Income from Operations
Our operating income for the year ended December 31, 2011 was $22.0 million, compared to $24.7 million in 2010, a decrease of $2.7 million. The main reasons for the decrease were lower gross profits and higher selling expenses in 2011.
Net Interest Income (Expense)
Net Interest expense for the year ended December 31, 2011 was $247,990, compared to $152,845 in 2010, an increase of $95,145.
Derivative Gains (Losses)
Changes to derivative warrant liability are recognized in the results of operations and resulted in a derivative gain of $934,260 during the year ended December 31, 2011 and $1,588,888 during the year ended December 31, 2010. (Please see Note 9 to our consolidated financial statements contained in this report.)
Income Tax Expense
In the year ended December 31, 2011, we paid income tax at the rate of 15%. Income tax expense for the year ended December 31, 2011 was $3.44 million. In the year ended December 31, 2010, we paid income tax at the rate of 11% and we paid $2.68 million in taxes for the year ended December 31, 2010. We obtained the "National High-Tech Enterprise" status ("National HT Status") from the PRC government in the fourth quarter of 2010. With this designation, we are entitled to a preferential tax rate of 15% for the years ending December 31, 2011, 2012 and 2013, which is notably lower than the statutory income tax rate of 25%.
Net Income
Net income for year ended December 31, 2011 was $19.3 million, a decrease of 18%, from $23.4 million in the year ended December 31, 2010. The decrease in net income was mainly due to the decrease in gross profit margin, increase in income tax rate, and increase in selling expenses.
For the year ended December 31, 2011, earnings per basic common share was $0.44 per share, compared to $0.54 in the year ended December 31, 2010.
49
The number of basic weighted average outstanding shares used to calculate earnings per share were 43,479,899 for 2011 and 43,329,554 for 2010.
For the year ended December 31, 2011, diluted earnings per common share was $0.44 per share, compared to $0.54 in in the year ended December 31, 2010.
The number of diluted weighted average outstanding shares used to calculate earnings per share were43,479,899 for 2011 and 43,532,435 for 2010.
Liquidity and Capital Resources
Our principal sources of liquidity are cash generated from operations and short-term bank loans. As of December 31, 2011, our cash and cash equivalents outstanding was $4.05 million, which represents 2.59% of our total assets, an increase of approximately $0.36 million from $3.69 million as of December 31, 2010. Of the $4.13 million of cash and cash equivalents and banker's acceptances at December 31, 2011, a total of $4.03 million is considered to be reinvested indefinitely in Helpson and is not expected to be available for payment of dividends, for other payments to our parent company or to its shareholders. As of December 31, 2011, we had a principal balance of $3.93 million in short-term bank loans. The cash flow generated from operating activities funded the new purchases of our intangible assets (drug formulas).
During 2011, we continued our vigorous collection efforts from our customers and achieved good results. While we have made progress, improving our accounts receivable collection continues to be a focus of our management team and we expect to make further progress in the quarters to come.
At December 31, 2011, the Company was obligated to pay laboratories $8.64 million upon their completion of the various phases of contracts to provide SFDA production approval of more than 10 medical formulas. Those payments are expected to be made out of the Company’s cash flow from operations ratably over approximately the following 48 months, depending on the progress of the various contracts. A typical contract requires an upfront deposit and then two to three additional milestone payments plus a final payment when the SFDA approval is obtained. Since the payments are progress driven, it is difficult to calculate the timing of the payments with any precision; however, management expects that the payments will be somewhat even over the payment period given the number of contracts in progress. The funding obligation is not expected to have an undue negative impact on the liquidity of the Company given the Company’s historical cash flows and estimated future cash flows from operating activities.
Based on our current operating plan, management believes that our cash provided by operations plus the proceeds from our existing bank loans will be sufficient to meet our working capital needs and our anticipated capital expenditures, including expenditures for new formula acquisitions, for the next twelve months. However, if events or circumstances occur and we do not meet our operating plan as expected, we may be required to seek additional capital and/or to reduce certain discretionary spending, which could have a material adverse effect on our ability to achieve our business objectives. Notwithstanding the foregoing, we may seek additional financing as necessary for expansion purposes and when we believe market conditions are most advantageous, which may include debt and/or equity financing. There can be no assurance that any additional financing will be available on acceptable terms, if at all.
50
|
Selected Cashflows for Twelve Months ended December 31, 2011 and 2010
|
|
Twelve Months Ended December 31
|
||||||||
|
2011
|
2010
|
|||||||
|
Cashflow from Operations
|
||||||||
|
Net Income
|
19,269,642 | 23,414,347 | ||||||
|
Depreciation & Amortization
|
1,174,822 | 1,505,195 | ||||||
|
Changes in Assets & Liabilities
|
||||||||
|
Account Receivables
|
(11,392,154 | ) | (9,231,358 | ) | ||||
|
Advances to Suppliers
|
(251,171 | ) | (3,367,119 | ) | ||||
|
Inventory
|
(2,925,143 | ) | (5,530,989 | ) | ||||
|
Accounts Payable
|
(1,928,259 | ) | 895,001 | |||||
|
Net Cash Provided by Operations
|
5,237,324 | 7,785,487 | ||||||
|
Cashflow from Investing Activties
|
||||||||
|
Advances for purchases of property &
equipment and intangible assets
|
(5,191,385 | ) | (10,454,529 | ) | ||||
|
Net Cash Used by Investing Activities
|
(5,625,896 | ) | (10,518,381 | ) | ||||
|
Net Cash Provided by Financing Activities
|
595,670 | 2,663,384 | ||||||
|
Effect of Exchange Rate change on Cash
|
151,670 | 126,842 | ||||||
|
Total Change in Cash
|
358,768 | 57,333 | ||||||
|
Cash & Equivalent Beginning Balance
|
3,692,086 | 3,634,753 | ||||||
|
Cash & Equivalent Ending Balance
|
$ | 4,050,854 | $ | 3,692,086 | ||||
Operating Activities
Net cash provided by operating activities was $5.24 million in the twelve months period ended December 31, 2011 compared to $7.79 million for the same period in 2010. The decrease in cash provided by operating activities was mainly due to lower net income, higher inventory and higher account receivables in the period ended December 31, 2011 compared to the corresponding period in 2010.
At December 31, 2011, our accounts receivable was $69.7 million, an increase of $7.8 million from $61.9 million at December 31, 2010. Our receivables increased because our sales revenue for the period grew by 9% and our collection was not enough to offset account receivable increases as a result of new sales. For fiscal 2011, $11.4 million was used to fund increases in Account Receivables, compared to $9.2 million for this category in the comparable period a year ago. As a common business practice in China, Banker's Acceptances (BAs) are often used to settle receivables and to make purchases instead of checks. During the twelve months period ended December 31, 2011, the Company received payment with BAs with a maturity of more than 90 days, and such BAs are not treated as cash and cash equivalent under U.S. GAAP. If cash equivalent treatment were to be applied to BAs with more than 90 days maturity, $5.29 million would have been used to fund increases in Account Receivables. Please see the discussion of the reconciliation with GAAP figures in a table below.
51
At December 31, 2011, total inventory was $30.4 million, an increase of $10.0 million from $20.4 million at December 31, 2010. Most of the inventory increase in 2011 was due to increased purchase of raw material inventory while the inventory increase in 2010 was due to a temporary rise in finished goods. Cash usage on Inventories for the twelve months period ended December 31, 2011 was $2.9 million as compared to $5.5 million in the comparable period for 2010. As mentioned in the above, we often use BAs to settle receivables and to make purchases. During the year ended December 31, 2011, the Company used BAs with a maturity of more than 90 days to pay for raw materials, and such BAs are not treated as cash and cash equivalent under U.S. GAAP. If cash equivalent treatment were to be applied to BAs with more than 90 days maturity, $9.0 million would have been used to fund increases in Inventory. Please see the discussion of reconciliation with GAAP figures below.
For the period ending December 31, 2011, the decrease in our accounts payable was responsible for a cash usage of $1.93 million in the first half of 2011 while in the same period in 2010 an increase in accounts payable resulted in cash addition of $0.9 million.
|
China Pharma Holdings, Inc.
|
||||||||||||||||
|
Reconciliation of Non-GAAP Adjusted Cash Usage for Accounts Receivables and Inventory
|
||||||||||||||||
|
For the 12 Months Ended December 31
|
||||||||||||||||
|
2011
|
2010
|
|||||||||||||||
|
Cashflow from
Changes in
Accounts
Receivables
|
Cashflow from
Changes in
Inventory
|
Cashflow from
Changes in
Accounts
Receivables
|
Cashflow from
Changes in
Inventory
|
|||||||||||||
|
Adjusted cash usage from changes in Account
Receivables (Non‐GAAP)
|
$ | (5,289,584 | ) | $ | (9,027,713 | ) | $ | (9,231,358 | ) | $ | (5,530,989 | ) | ||||
|
Amount received/paid with Banker's Acceptances of
greater than 90 days maturity
|
$ | 6,102,570 | $ | (6,102,570 | ) | $ | - | $ | - | |||||||
|
Cash usage from changes in Account
Receivables as reported (GAAP)
|
$ | (11,392,154 | ) | $ | (2,925,143 | ) | $ | (9,231,358 | ) | $ | (5,530,989 | ) | ||||
Investing Activities
In the year ended December 31, 2011, net cash used in investment activities was $5.63 million, a decrease of $4.89 million, compared to the $10.52 million in 2010. The decrease in investment spending in 2011 was mainly due to the fact that we had lower cash outlays for performance milestone payments for the purchase of medicine formulas in 2011 compared to 2010.
Financing Activities
In the year ended December 31, 2011, net cash flow generated from financing activities was approximately $0.6 million compared to $2.7 million in the same period of 2010. The main source of the 2011 financing came from borrowing from related party while in 2010 we received $2.6 million from proceeds of warrant exercise.
52
According to relevant PRC laws, companies registered in the PRC, including our PRC subsidiary, Helpson, are required to allocate at least ten percent (10%) of their after-tax net income, as determined under accounting standards and regulations in the PRC, to statutory surplus reserve accounts until the reserve account balances reach fifty percent (50%) of the companies’ registered capital prior to their remittance of funds out of the PRC. Allocations to these reserves and funds can only be used for specific purposes and are not transferrable to the parent company in the form of loans, advances or cash dividends. As of December 31, 2011 and 2010, the net assets of Helpson were $135,748,004 and $110,804,607, respectively. Due to the restriction on dividend distribution to overseas shareholders, the amount of Helpson’s net assets that were designated for general and statutory capital reserves, and thus could not be transferred to our parent company as cash dividends, were $7,863,490 and $7,562,237 (50% of registered capital) for the fiscal years ended December 31, 2011 and 2010. Since the amount that Helpson must set aside for the statutory surplus fund only accounts for 5.8% and 6.8%, respectively, of its total net assets, this reserve does not have a major impact on our liquidity.
The PRC government also imposes controls on the conversion of RMB into foreign currencies and the remittance of currencies out of the PRC. Our businesses and assets are primarily denominated in RMB. All foreign exchange transactions take place either through the People’s Bank of China or other banks authorized to buy and sell foreign currencies at the exchange rates quoted by the People’s Bank of China. Approval of foreign currency payments by the People’s Bank of China or other regulatory institutions requires submitting a payment application form together with applicable invoices and signed contracts. These currency exchange control procedures imposed by the PRC government authorities may restrict the ability of Helpson, our PRC subsidiary, to transfer its net assets to our parent company through loans, advances or cash dividends.
Off Balance Sheet Arrangements
As of December 31, 2011, we did not have any off-balance sheet arrangements.
Commitments
As of December 31, 2011, we had no material commitments except for those expenditures incurred in the ordinary course of business.
Critical Accounting Policies
Management's discussion and analysis of its financial condition and results of operations are based upon our consolidated financial statements, which have been prepared in accordance with United States generally accepted accounting principles. Our financial statements reflect the selection and application of accounting policies which require management to make significant estimates and judgments. The discussion of our critical accounting policies contained in Note 1 to our consolidated financial statements, “Organization and Significant Accounting Policies”, is incorporated herein by reference.
53
Smaller reporting companies are not required to provide the information required by this item.
Our consolidated balance sheets, as of December 31, 2011 and 2010, and the related consolidated statements of operations and comprehensive income, stockholders’ equity and cash flows for each of the two years in the period ended December 31, 2011 and 2010, together with the related notes and the reports of our independent registered public accounting firm, are set forth on the “F” pages of this report.
None.
Management's Report on Internal Control over Financial Reporting
Our management is responsible for establishing and maintaining adequate internal control over our financial reporting. Internal control over financial reporting is defined in Rule 13a-15(f) or 15d-15(f) under the Exchange Act as a process designed by, or under the supervision of, a company’s principal executive and principal financial officers, or persons performing similar functions, and effected by a company’s board of directors, management and other personnel to provide reasonable assurance regarding the reliability of financial reporting and the preparation of financial statements for external purposes in accordance with U.S. generally accepted accounting principles and includes those policies and procedures that (i) pertain to the maintenance of records that, in reasonable detail, accurately and fairly reflect the transactions and dispositions of the assets of a company; (ii) provide reasonable assurance that transactions are recorded as necessary to permit preparation of financial statements in accordance with U.S. generally accepted accounting principles and that receipts and expenditures of a company are being made only in accordance with authorizations of management and directors of a company; and (iii) provide reasonable assurance regarding prevention or timely detection of unauthorized acquisition, use or disposition of a company’s assets that could have a material effect on the financial statements.
Any system of internal control, no matter how well designed, has inherent limitations, including the possibility that a control can be circumvented or overridden and misstatements due to error or fraud may occur and not be detected in a timely manner. Also, because of changes in conditions, internal control effectiveness may vary over time. Accordingly, even an effective system of internal control will provide only reasonable assurance with respect to financial statement preparation. In addition, the design of any system of controls is based in part on certain assumptions about the likelihood of future events, and there can be no assurance that any design will succeed in achieving its stated goals under all potential future conditions. Over time, controls may become inadequate because of changes in conditions or deterioration in the degree of compliance with policies or procedures. Therefore, any current evaluation of controls cannot and should not be projected to future periods.
54
Management assessed our internal control over financial reporting as of the year ended December 31, 2011. In making this assessment, management used the criteria set forth by the Committee of Sponsoring Organizations of the Treadway Commission (COSO) in the report entitled "Internal Control-Integrated Framework." The COSO framework summarizes each of the components of a company’s internal control system, including (i) the control environment, (ii) risk assessment, (iii) control activities, (iv) information and communication, and (v) monitoring.
Based on management's assessment using the COSO criteria, management has concluded that our internal control over financial reporting was not effective as of December 31, 2011 to allow our management, employees and consultants, in the normal course of performing their assigned functions, to prevent or detect misstatements on a timely and reasonable basis and to provide reasonable assurance regarding the reliability of financial reporting and the preparation of financial statements for external reporting purposes in accordance with U.S. generally accepted accounting principles.
A material weakness is a control deficiency, or combination of control deficiencies, that results in more than a remote likelihood that a material misstatement of the annual or interim financial statements will not be prevented or detected. Our Chief Executive Officer and Chief Financial Officer have determined that there existed a material weakness in our internal control over financial reporting as of December 31, 2011with respect to our reporting amortization of intangible assets. The material weakness occurred as a result of lack of technical training and education of our personnel. As of the date of this report, we are undertaking steps to correct the aforementioned material weakness by obtaining education and training for our personnel regarding the proper accounting for and amortization of intangible assets. Notwithstanding this material weakness, Management has concluded that our consolidated financial statements included in this annual report are fairly stated in all material respects in accordance with U.S. generally accepted accounting principles for each period presented herein.
Because we are a smaller reporting company, this Annual Report on Form 10-K does not include an attestation report of our independent registered public accounting firm regarding internal control over financial reporting.
Changes in Internal Controls over Financial Reporting
Since becoming aware of the material weakness described above, we have undertaken the aforementioned steps to remediate the weakness in our internal control over financial reporting. Except for such efforts, there were no changes in our internal control over financial reporting identified in connection with the evaluation required by paragraph (d) of Exchange Act Rules 13a-15 or 15d-15 that occurred during the fourth quarter of our last fiscal year that have materially affected, or are reasonably likely to materially affect, our internal control over financial reporting.
55
None.
General
Listed below are the names and ages of all our directors and executive officers at March 12, 2012, for the fiscal year ended December 31, 2011 along with their positions, offices and term:
|
Name
|
Age
|
Position
|
|
Zhilin Li
|
58
|
Chairman, President and Chief Executive Officer
|
|
Frank Waung
|
46
|
Chief Financial Officer
|
|
Heung Mei Tsui
|
54
|
Director
|
|
Gene Michael Bennett
|
64
|
Independent Director
|
|
Yingwen Zhang
|
66
|
Independent Director
|
|
Baowen Dong
|
70
|
Independent Director
|
All of our directors hold offices until our next annual meeting of the stockholders, at which a successor will be duly elected and qualified or until his or her earlier resignation, removal from office, death or incapacity. Officers serve at the discretion of the board of directors.
The following sets forth biographical information regarding the above directors and executive officers.
Zhilin Li
, is the Chairman, President and Chief Executive Officer of our company. She has served as a director since 2006 and as the President and Chief Executive Officer since 2005. She was a founder of Helpson, and served as hairman and Chief Executive Officer of Helpson from 1993 to 2005. Ms. Li was formerly the president of Haikou Bio-Engineering Institute as well as the vice president of Sichuan Institute of Biology. She graduated from Sichuan University with a degree in biology. Her role as a one of the founders of our company and her extensive experience in bio-engineering make her well suited to serve as our Chairman.
Frank Waung
,
has served as our Chief Financial Officer since April 28, 2009. Mr. Waung currently also serves as a director of China Natural Gas (Nasdaq: CHNG). Mr. Waung worked for Hickey Freihofner Capital as an investment banker with a focus in China from 2008 until April 2009. Mr. Waung worked for Dellacamera Capital Management as a special situation analyst in 2007. Additionally, Mr. Waung acted as a convertible security trader from 2003 to 2006 and as a senior market economist at Cowen & Co. from 2000 to 2003. He worked for Credit Suisse First Boston as a quantitative marketer from 1994 to 1998. Mr. Waung received his master’s degree in business administration from University of Pennsylvania in 1994, and received his bachelor’s degree from University of California in 1988.
Heung Mei Tsui
,
has served as a director since April 28, 2009. Previously, Ms. Tsui served as a member of our board from October 2005 to February 2008. Ms. Tsui has been a self-employed businesswoman engaged in strategic investments and was previously engaged in the pharmaceutical chemical raw material import/export business. Ms. Tsui graduated from Hunan Financial & Economic College in 1982. Her experience in the trading side of the business affords her unique insights into the pharmaceutical industry, and her presence on our board of directors benefits the company greatly in the areas of strategic planning and execution.
G. Michael Bennett
, has served as our independent director since February 2008. In addition, he is on the Board of Directors for China Agritech, Inc. (CAGC) and Audit Committee Chair for Global Pharm Holding Group (GPHG). Mr. Bennett also presently serves as Chief Executive Officer of the American General Business Association in Beijing, China, since 2009. Mr. Bennett was a partner of Nexis Investment Consulting Corporation based in Beijing from 2004-2009. He acted as a partner of ProCFO Company based in California which provided contract chief financial officer service for firms during 2000-2004. During 1998-2000, he was a basic law, accounting and tax professor at University of Hawaii, and an accounting, tax and audit professor at Chaminade of Honolulu. He also previously served as the chief financial officer and member of the board of directors of Argonaut Computers in Southern California. Mr. Bennett worked as an accounting and audit professor at Chapman University. Mr. Bennett also worked as an accounting, tax, and audit professor at California State University at Fullerton, and he acted as chief financial officer and a board member of the National Automobile Club. Mr. Bennett graduated from Michigan State University with an MBA in Finance and BA in Accounting. He currently is a DBA candidate in Corporate Governance at City University of Hong Kong. Mr. Bennett obtained his CPA license from the State of Colorado, but is currently inactive. Mr. Bennett’s extensive background in accounting, financial management and reporting, including SEC related reporting qualifies Mr. Bennett to serve as an independent director of our company and the chairman of our audit committee.
56
Yingwen Zhang
,
has served as an independent director since February 2008. He also currently serves as the Vice-Chairman of the Board of Shanghai Reseat Medical Tech Co. Ltd., a medical device producer. Mr. Zhang is also a director and a member of the compensation committee of Chongqing Wanli Battery Holdings (Group) LLC (SHA:600847). He acted as Senior Consultant and Chairman of Safety Production Committee of Sinofert Holdings Limited (HKG: 0297) of Sinochem Group from October 2005 to June 2009. Additionally, Mr. Zhang was the representative of the 9th Nation People’s Congress of China. He was also appointed as the Commercial Counselor of the China Embassy in Malaysia from March 2000 through October 2005. Prior to that, Mr. Zhang was appointed as the Director-General to Sichuan Provincial Foreign Trade and Economic Cooperation Bureau (the Commercial Bureau of Sichuan Province, China) from 1988 to 2000. In his early career he was a chemical-engineer, and then became a senior manager for several chemical corporations in China. From 1983 to 1988, Mr. Zhang served as the Chief Executive Officer of a large nature gas-chemical state owned enterprise (SOE) in the PRC affiliated with the Sinopec Group. Mr. Zhang graduated from the Chemical Engineering Department of Tianjin University in 1967. Mr. Zhang’s extensive knowledge in areas of government regulation and policies, his experience as director of a China listed company, as well as his vast experience in senior management in SOE and the private sector, qualify him as an independent director of our company.
Baowen Dong
, has served as an independent director since February 2008. Mr. Dong participated on the expert team of the Sichuan University from 2003 to 2008, doing teaching evaluation and assessment work in Engineering and Medical Science faculty. In recent years, Mr. Dong has focused on the research of China's Health Care Reform. Previously, he concentrated on biomedical and medical information researches. Mr. Dong has had different roles in areas of teaching and research, including as a dean and a professor, at Sichuan University from 1974 to 2001. Additionally, Mr. Dong was engaged in the field of communication technology from 1966 to 1974. Mr. Dong graduated from Xi’an University of Science and Technology in 1966. His strong academic background in science and research brings value to our company in respect of research and development and qualifies him to serve as a director of our company.
Family Relationships
There are no family relationships among our directors or executive officers.
Director or Officer Involvement in Certain Legal Proceedings
To our knowledge, our directors and executive officers were not involved in any legal proceedings as described in Item 401(f) of Regulation S-K in the past ten years.
Section 16(a) Beneficial Ownership Reporting Compliance
Section 16(a) of the Securities Exchange Act of 1934, as amended, requires our directors, executive officers and persons who own more than 10% a registered class of our equity securities (“Reporting Persons”), to file reports of ownership and changes in ownership on Forms 3, 4 and 5 with the SEC. The Reporting Persons are also required by SEC rules to furnish us with copies of Section 16(a) forms they file. Based upon a review of the filings made on their behalf during the fiscal year ended December 31, 2011, as well as an examination of the SEC’s EDGAR system Form 3, 4, and 5 filings and our records, we believe that, during the year ended December 31, 2011, the Reporting Persons met all applicable Section 16(a) filing requirements.
Code of Ethics
On July 8, 2008, we adopted a code of business conduct and ethics for all directors and employees (including officers) within the meaning of the regulations adopted by the SEC under Section 406 of the Sarbanes-Oxley Act of 2002. The code has been designed to deter wrongdoing and promote (i) honest and ethical conduct, including the ethical handling of actual or apparent conflicts of interest between personal and professional relationships, (ii) full, fair, accurate, timely, and understandable disclosure in reports and documents that we file with, or submit to, the SEC and in other public communications made by us, (iii) compliance with applicable governmental laws, rules and regulations, (iv) the prompt internal reporting of violations of the code to an appropriate person or persons, and (v) accountability for adherence to the code. The application of the code to the persons it applies to may only be waived by our Board of Directors in accordance with SEC regulations and the Sarbanes-Oxley Act of 2002. A copy of the code is available on our website at www.chinapharmaholdings.com or may be obtained by sending a written request to our corporate secretary at China Pharma Holdings, Inc., Second Floor, No. 17, Jinpan Road, Haikou, Hainan Province, China 570216.
Audit Committee
On February 1, 2008, we established an audit committee, which currently consists of our three independent directors: Gene Michael Bennett, Yingwen Zhang and Baowen Dong. Mr. Bennett, the Chairman of the Audit Committee, is an “audit committee financial expert” as defined in Item 401(d)(5) of Regulation S-K promulgated under the Securities Act. The audit committee carries out its responsibilities in accordance with the terms of its Audit Committee Charter, a copy of which attached as Exhibit 99.1 to our Current Report on Form 10-K filed on March 17, 2009.
57
Summary of Executive Compensation
The following table sets forth information concerning all cash and non-cash compensation awarded to, earned by or paid to our principal executive officer and principal financial officer during the last two fiscal years in all capacities to our company and our subsidiaries (collectively, the “Named Executive Officers”). No other executive officer received compensation in excess of $100,000 during the fiscal year ended December 31, 2011.
|
SUMMARY COMPENSATION TABLE
|
|||||||||
|
Name and principal
position
|
Year
Ended
|
Salary
($)
|
Bonus
($)
|
Stock
Awards
($)
|
Option
Awards
($)
|
Non-Equity
Incentive Plan
Compensation
($)
|
Nonqualified
Deferred
Compensation
Earnings ($)
|
All Other
Compensation
($)
|
Total
($)
|
|
Zhilin Li
Chairman, Chief
Executive Officer and
President
|
2011
2010
|
220,000
200,000
|
—
—
|
76,339
(1)
—
|
10,606
(2)
—
|
—
—
|
—
—
|
16,000
(3)
16,000
(3)
|
322,945
216,000
|
|
Frank Waung
Chief Financial
Officer
|
2011
2010
|
160,000
114,000
|
—
—
|
42,854
(4)
21,000
(5)
|
66,384
(2)
226,560
(6)
|
—
—
|
—
—
|
—
—
|
269,238
361,500
|
|
|
_____________
|
58
|
(1)
|
Represents the dollar amounts recognized in our year-end 2011 financial statements for reporting purposes. Amount represents the value of 75,000 restricted shares granted to Ms. Li. A more detailed discussion of the assumptions used in calculating these value may be found in Note 11 to the consolidated audited financial statements included in this Annual Report on Form 10-K.
|
|
(2)
|
Represents the dollar amounts recognized in our year-end 2011 financial statements for reporting purposes. Amounts shown cover the options awards granted in 2010 and 2011. The amounts represent the compensation costs of awards that are paid in options to purchase 50,000 shares of our common stock with respect to Ms Li, and 200,000 shares of our common stock with respect to Mr. Waung. The amounts do not reflect the actual amounts that may be realized by the named executive officer. The value of the option was determined using the Black-Scholes Option Pricing Model. We apply the simplified method due to the lack of historical share option exercise data to provide a reasonable basis upon which to estimate expected term. A more detailed discussion of the assumptions used in calculating these value may be found in Note 11 to the consolidated audited financial statements included in this Annual Report on Form 10-K.
|
|
(3)
|
Represents the amount payable to Ms. Li for serving as a director of our company. As of the date of this report, $4,000 was paid to Ms. Li for serving on our board of directors in 2010. $12,000 and $16,000 payable to Ms. Li for serving on our board of directors in 2010 and 2011 respectively had not been paid to Ms. Li.
|
|
(4)
|
Represents the dollar amounts recognized in our year-end 2011 financial statements for reporting purposes. Amount represents the value of 50,000 restricted shares granted to Mr. Waung. A more detailed discussion of the assumptions used in calculating these value may be found in Note 11 to the consolidated audited financial statements included in this Annual Report on Form 10-K.
|
|
(5)
|
Represents the dollar amounts recognized in our year-end 2010 financial statements for reporting purposes. Amount represents the value of 6,863 shares granted to Mr. Waung. A more detailed discussion of the assumptions used in calculating these value may be found in Note 10 to the consolidated audited financial statements included in in the Annual Report on Form 10-K/A filed with the SEC on March 17, 2011 (the “2010 10-K”).
|
|
(6)
|
Represents the dollar amounts recognized in our year-end 2010 financial statements for reporting purposes. Amounts shown cover awards granted in 2010. The amounts represent the compensation costs of awards that are paid in options to purchase shares of our common stock, the amounts do not reflect the actual amounts that may be realized by the named executive officer. The value of the option of $226,560 was determined using the Black Scholes Option Pricing Model using the simplified method based on the closing market price of $3.47 per share and assumptions for the risk free interest rate of 1.61% and volatility of 67.6%. We apply the simplified method due to the lack of historical share option exercise data to provide a reasonable basis upon which to estimate expected term. A more detailed discussion of the assumptions used in calculating these value may be found in Note 10 to the consolidated audited financial statements included in the 2010 10-K.
|
Employment Agreements
Zhilin Li
. Hainan Helpson Medical & Biotechnology Co., Ltd., our wholly-owned subsidiary and operating entity in the PRC (“Helpson”), entered into an employment agreement with Ms. Zhilin Li, our Chairman of the Board and Chief Executive Officer, which expired on June 30, 2010. Upon the expiration of the original agreement, Helpson renewed the agreement with Ms. Li on the same terms as original agreement. Pursuant to the terms of the new employment agreement, Ms. Li agreed to continue to serve as Helpson’s chief executive officer for a term of five years at an annual salary of RMB800,000 (equivalent to approximately $119,403). Helpson may adjust Ms. Li's compensation based upon her production and operating achievement and her technical ability and working performance. Ms. Li’s total annual compensation for the fiscal year ended 2010, when aggregated with her compensation from our U.S. holding company level, is $200,000.
On May 25, 2011, Ms. Li’s annual base salary was increased to $220,000. In addition, pursuant to the 2010 Incentive Plan and the Restricted Share Award Agreement dated May 25, 2011 between the Company and Ms. Li, she was granted 75,000 shares of restricted stock, of which (i) 50,000 shares will vest on May 25, 2012, and (ii) 25,000 shares were to vest on the six-month anniversary of the achievement of certain performance-based vesting criteria. Under the 2010 Incentive Plan and pursuant to the Non-qualified Stock Option Agreement dated May 25, 2011 between the Company and Ms. Li (“Li’s Stock Option Agreement”), she was also granted non-qualified stock options to purchase 50,000 shares of common stock at an exercise price of $2.54 per share, of which (i) 25,000 shares will vest on May 25, 2012, and (ii) 25,000 shares were to vest on the three-month anniversary of the achievement of certain performance-based vesting criteria.
Frank Waung
. We entered into an employment agreement with Mr. Frank Waung on April 28, 2009, according to which Mr. Waung agreed to serve as our Chief Financial Officer for one year for an annual salary of $100,000. According to the agreement, Mr. Waung was granted an option to purchase 100,000 shares of our common stock, at the price of $1.70 per share, of which (i) 50,000 of the shares vested on April 28, 2010 and (ii) 50,000 of the shares vested on September 30, 2010. When our 2009 Stock Option Plan was implemented, on October 13, 2009 we issued Mr. Waung an option to purchase 100,000 shares at an exercise price of $2.75 per share and we subsequently agreed that the difference ($1.70 to $2.75) would be provided to Mr. Waung at the time of exercise of the options, subject to approval of the board of directors.
59
Upon the expiration of the original agreement on April 28, 2010, we renewed the agreement with Mr. Waung on similar terms. Pursuant to the terms of the renewed agreement, Mr. Waung agreed to continue to serve as our Chief Financial Officer for one year at an annual salary of $150,000. Mr. Waung was also granted an additional option to purchase 200,000 shares of common stock, of which (i) options to purchase 150,000 of the shares will vest on April 28, 2011 and (ii) options to purchase 50,000 shares were to vest on April 28, 2011 if we consummated an equity offering with minimum gross proceeds of at least $10 million prior to December 31, 2010. Because we did not consummate such an offering prior to December 31, 2010, options to purchase 50,000 shares have failed to vest and were forfeited.
On April 28, 2011, we renewed the employment agreement with Mr. Waung, pursuant to which Mr. Waung agreed to continue to serve as our Chief Financial Officer for one year at an annual salary of $165,000. In addition, pursuant to the 2010 Incentive Plan and the Restricted Share Award Agreement dated May 25, 2011 between the Company and Mr. Waung, he was granted 50,000 shares of restricted stock, of which (i) 25,000 shares will vest on April 28, 2012, and (ii) 25,000 shares were to vest on the six-month anniversary of the achievement of certain performance-based vesting criteria. Under the 2010 Incentive Plan and pursuant to the Non-qualified Stock Option Agreement dated May 25, 2011 between the Company and Mr. Waung (“Waung’s Stock Option Agreement”), he was also granted non-qualified stock options to purchase 50,000 shares of common stock at an exercise price of $2.54 per share, of which (i) 25,000 shares will vest on April 28, 2012, and (ii) 25,000 shares were to vest on the three-month anniversary of the achievement of certain performance-based vesting criteria.
Payments upon Termination or Change-in-Control
Frank Waung.
Pursuant to the terms of Mr. Waung’s employment agreement, except in connection with certain gross misconduct, in order to terminate the agreement we must either (i) provide Mr. Waung with 30 days prior written notice of termination or (ii) pay Mr. Waung one (1) month’s salary upon termination in lieu of providing 30 days prior written notice. In addition, Mr. Waung shall be entitled to (i) accrued and unpaid vacation through the effective date of termination; and (ii) all other compensation and benefits that are vested through the effective date of termination.
PRC Law.
Under the applicable laws of the PRC, we must pay severance to all employees who are Chinese nationals and who are terminated with or without cause, or whose employment agreement with us expires and we choose not to continue their employment. The severance benefit required to be paid under the laws of the PRC equals the average monthly compensation paid to the terminated employee (including any bonuses or other payments made in the 12 months prior to the employee’s termination) multiplied by the number of years the employee has been employed with us, plus an additional month’s salary if 30 days’ prior notice of such termination has not been given. However, if the average monthly compensation to be received by the terminated employee exceeds three times the average monthly salary of the employee’s local area, as determined and published by the local government, such average monthly compensation shall be capped at three times the average monthly salary of the employee’s local area. Except as described above, none of our executive officers have any other agreement or arrangement under which he or she may be entitled to severance payments upon termination of employment.
Outstanding Equity Awards at Fiscal Year-End
The following table provides information on all restricted stock and stock option awards held by our named executive officers as of December 31, 2011.
|
OUTSTANDING EQUITY AWARDS AT FISCAL YEAR-END
|
||||||||||||
|
Option Awards
|
Stock Awards
|
|||||||||||
|
Name
|
Number of
Securities
Underlying
Unexercised
Options (#)
Exercisable
|
Number of
Securities
Underlying
Unexercised
Options
(#)
Unexercisable
|
Equity
Incentive
Plan
Awards:
Number of
Securities
Underlying
Unexercised
Unearned
Options
(#)
|
Option
Exercise
Price
($)
|
Option
Expiration
Date
|
Number
of
Shares
or Units
of
Stock
That
Have
Not
Vested
(#)
|
Market
Value
of
Shares
or
Units
of
Stock
That
Have
Not
Vested
($)
|
Equity
Incentive
Plan
Awards:
Number
of
Unearned
Shares,
Units or
Other
Rights
That
Have Not
Vested
(#)
|
Equity
Incentive
Plan
Awards:
Market
or Payout
Value of
Unearned
Shares,
Units or
Other
Rights
That
Have Not
Vested
($)
|
|||
|
Zhilin Li
|
25,000
(1)
|
2.54
|
5/25/2013
|
75,000 (8) | 50,250 (10) | |||||||
|
Chairman,
Chief Executive
Officer and
President
|
25,000
(2)
|
2.54
|
5/25/2013
|
|
||||||||
|
Frank Waung
|
25,000
(3)
|
2.54
|
5/25/2013
|
|
50,000 (9) | 33,500 (10) | ||||||
|
Chief Financial
|
25,000
(4)
|
2.54
|
5/25/2013
|
|
||||||||
|
Officer
|
||||||||||||
|
|
||||||||||||
|
10,000
(5)
50,000
(6)
150,000
(7)
|
—
—
—
|
—
—
—
|
2.75
2.75
3.47
|
4/27/2012
9/29/2012
4/28/2013
|
—
—
—
|
—
—
—
|
||||||
60
______________________
|
(1)
|
These options were granted under our 2010 Incentive Plan and will become exercisable on May 25, 2012.
|
|
(2)
|
These options were granted under our 2010 Incentive Plan and were to vest on the three-month anniversary of the achievement of certain performance-based vesting criteria.
|
|
(3)
|
These options were granted under our 2010 Incentive Plan and will become exercisable on April 28, 2012.
|
|
(4)
|
These options were granted under our 2010 Incentive Plan and were to vest on the three-month anniversary of the achievement of certain performance-based vesting criteria.
|
|
(5)
|
These options were issued under our 2009 Stock Option Plan and became exercisable on April 28, 2010.
|
|
(6)
|
These options were issued under our 2009 Stock Option Plan and became exercisable on September 30, 2010.
|
|
(7)
|
These options were issued under our 2009 Stock Option Plan and became exercisable on April 28, 2011.
|
|
(8)
|
These stocks were granted under our 2010 Incentive Plan. 50,000 will vest on May 25, 2012 and 25,000 were to vest on the six-month anniversary of the achievement of certain performance-based vesting criteria.
|
|
(9)
|
These stocks were granted under our 2010 Incentive Plan. 25,000 will vest on April 28, 2012 and 25,000 were to vest on the six-month anniversary of the achievement of certain performance-based vesting criteria.
|
|
(10)
|
Represents the dollar amounts calculated based on the closing market price of $0.67 per share on December 30, 2011.
|
Discussion of Summary Compensation and Grants of Plan-based Awards Tables
A summary of certain material terms of our existing compensation plans and arrangements is set forth below.
On September 2, 2009, our Board of Directors adopted, and on September 3, 2009 our stockholders approved, our 2009 Stock Option Plan (the “2009 Option Plan”), which gave us the ability to grant stock options and restricted stock to employees or consultants of our company or of any subsidiary of our company and to non-employee members of our Board of Directors or the board of directors of any of our subsidiaries. The 2009 Option Plan currently allows for awards of stock options and restricted stock for up to 1,000,000 shares of common stock. As of March 2, 2012, options to purchase an aggregate of 300,000 shares of common stock had been granted under the 2009 Option Plan, of which 40,000 have been exercised and 50,000 have failed to vest and been forfeited. In connection with the adoption of our 2010 Long-Term Incentive Plan, our Board of Directors determined that no additional awards of stock options or restricted stock will be made under the 2009 Option Plan, and that the 2009 Option Plan will be terminated following the exercise or expiration of all stock options currently outstanding under such plan.
On November 12, 2010, our Board of Directors adopted, and on December 22, 2010 our stockholders approved, our 2010 Long-Term Incentive Plan (the “2010 Incentive Plan”), which gave us the ability to grant stock options, restricted stock, stock appreciation rights and performance units to employees, directors and consultants, or those who will become employees, directors and consultants of our company and/or our subsidiaries. The 2010 Incentive Plan currently allows for equity awards of up to 4,000,000 shares of common stock. As of March 2, 2012, 125,000 shares of restricted stock and options to purchase an aggregate of 100,000 shares of common stock had been granted under the 2010 Incentive Plan.
Director Compensation
The following table sets forth information concerning cash and non-cash compensation paid to our directors during the year ended December 31, 2011.
61
|
DIRECTOR COMPENSATION
|
|||||||
|
Name
|
Fees
Earned
or
Paid in
Cash
($)
|
Stock
Awards
($)
|
Option
Awards
($)
|
Non-Equity
Incentive
Plan
Compensation
($)
|
Non-Qualified
Deferred
Compensation
Earnings
($)
|
All
Other
Compensation
($)
|
Total
($)
|
|
Heung Mei Tsui
|
16,000
|
—
|
—
|
—
|
—
|
—
|
16,000
|
|
Gene Michael Bennett
|
16,000
|
—
|
—
|
—
|
—
|
—
|
16,000
|
|
Yingwen Zhang
|
5,901
|
—
|
—
|
—
|
—
|
—
|
5,901
|
|
Baowen Dong
|
5,901
|
—
|
—
|
—
|
—
|
—
|
5,901
|
Our directors will also be reimbursed for all of their out-of-pocket expenses in traveling to and attending meetings of our Board of Directors and committees on which they serve.
Ms. Zhilin Li, our Chairman, President and Chief Executive Officer, was also compensated for serving on our board of directors as set forth in the Summary Compensation Table appearing earlier in this Item 11.
Engagement Letters
We have renewed the engagement letters with each of our three independent directors. Pursuant to the renewed engagement letters, each of Mr. Zhang and Mr. Dong is entitled to receive annual compensation of RMB 40,000 (approximately $5,901), payable quarterly and Mr. Bennett is entitled to receive annual compensation of $16,000, payable quarterly, and a warrant to purchase 5,000 shares of common stock at an exercise price of $3.32 per share. As of the date of this report, no warrants have been issued to Mr. Bennett.
We also entered into an engagement letter with Ms. Tsui, pursuant to which Mr. Tsui she is entitled to annual compensation of $16,000 for serving a director of our company.
Compensation Committee Interlocks and Insider Participation
The members of the Nominating and Compensation Committee of our Board of Directors during fiscal 2010 were Messrs. Gene Michael Bennett, Baowen Dong and Yingwen Zhang. During fiscal 2010:
|
·
|
none of the members of the Nominating and Compensation Committee of our Board of Directors was an officer (or former officer) or employee of our company or any of its subsidiaries;
|
|
·
|
none of the members of the Nominating and Compensation Committee had a direct or indirect material interest in any transaction in which we were a participant and the amount involved exceeded $120,000;
|
|
·
|
none of our executive officers served on the compensation committee (or another board committee with similar functions or, if none, the entire Board of Directors) of another entity where one of that entity’s executive officers served on our Nominating and Compensation Committee;
|
|
·
|
none of our executive officers was a director of another entity where one of that entity’s executive officers served on our Nominating and Compensation Committee; and
|
|
·
|
none of our executive officers served on the compensation committee (or another board committee with similar functions or, if none, the entire Board of Directors) of another entity where one of that entity’s executive officers served as a director on our Board of Directors.
|
The following table sets forth certain information as of March 12, 2012 with respect to the beneficial ownership of our common stock, the sole outstanding class of our voting securities, by (i) any person or group owning more than 5% of each class of voting securities, (ii) each director, (iii) each executive officer and (iv) all executive officers and directors as a group.
62
As of March 12, 2012, an aggregate of 43,404,577 shares of our common stock were outstanding.
|
Name and Address of Beneficial Owners
(1)(2)
|
Amount
and Nature
of Beneficial
Ownership
|
Percent of Class
(3)
|
||||
|
Directors and Executive Officers
|
||||||
|
Zhilin Li
President, Chief Executive Officer
and Chairman of the Board
|
10,075,000
|
(4)
|
23.1%
|
|||
|
Frank Waung
Chief Financial Officer
|
273,415
|
(5)
|
*
|
|||
|
Heung Mei Tsui.
Director
|
9,312,651
|
21.5%
|
||||
|
Yingwen Zhang
Director
|
0
|
*
|
||||
|
Gene Michael Bennett
Director
|
0
|
*
|
||||
|
Baowen Dong
Director
|
0
|
*
|
||||
|
All directors and executive officers as a group (6 persons)
|
19,661,066
|
45.0%
|
||||
|
Greater than 5% Stockholders
|
||||||
|
Peter Siris
237 Park Avenue, 9
th
Floor
New York, New York 10017
|
2,713,120
(6)
|
6.2%
|
||||
|
Leigh S. Curry
237 Park Avenue, 9
th
Floor
New York, New York 10017
|
2,713,120
(6)
|
6.2%
|
||||
|
Jian Yang
|
2,278,815
|
5.2%
|
||||
|
William P. Wells
5100 Poplar Ave, Ste 805
Memphis, TN 38137
|
2,425,137
(8)
|
5.59%
|
||||
|
|
__________________
|
|
*
|
Represents less than 1%.
|
|
(1)
|
Pursuant to Rule 13d-3 under the Exchange Act, a person has beneficial ownership of any securities as to which such person, directly or indirectly, through any contract, arrangement, undertaking, relationship or otherwise has or shares voting power and/or investment power or as to which such person has the right to acquire such voting and/or investment power within 60 days.
|
|
(2)
|
Unless otherwise stated, each beneficial owner has sole power to vote and dispose of the shares and the address of such person is c/o China Pharma Holdings, Inc., No. 17 Jinpan Road, 2nd Floor, Haikou, Hainan Province, People’s Republic of China 570215.
|
|
(3)
|
In determining the percentage of common stock owned by the beneficial owners, (a) the numerator is the number of shares of common stock beneficially owned by such owner, including shares the owner may acquire, within 60 days of March 12, 2012 upon the exercise of the options, if any, held by the owner; and (b) the denominator is the sum of (i) the total 43,529,557 shares of common stock outstanding as of March 12, 2012, and (ii) the number of shares underlying the options, which such owner has the right to acquire upon the exercise of the options within 60 days of March 12, 2012 (for those who have options).
|
63
|
(4)
|
Does not include options to purchase 50,000 shares of common stock that are not exercisable within 60 days.
|
|
(5)
|
Includes options to purchase 260,000 shares of common stock that are presently exercisable. Does not include options to purchase 50,000 shares of common stock that are not exercisable within 60 days.
|
|
(6)
|
Consists of 2,713,120 shares of common stock owned by Guerilla Capital Management LLC (“Guerilla”). Peter Siris and Leigh S. Curry share dispositive and voting power over the shares held by Guerilla.
|
|
(7)
|
Consists of shares of common stock that are beneficially owned by Heartland Advisors, Inc. (“Heartland”) by virtue of its investment discretion and voting authority granted by certain of its clients, which may be revoked at any time. Mr. Nasgovitz has investment and voting power over the shares beneficially owned by Heartland.
|
|
(8)
|
Consists of (i) 162,637 shares of common stock owned by Pope Investments II LLC (“Pope II”) and (ii) 2,262,500 shares of our common stock owned by Pope Asset Management, LLC (“Pope Management”). Pope Management is the manager and/or investment advisor of Pope II. Mr. Wells is the sole manager of Pope Management and has dispositive and voting power over the shares held by Pope II and Pope Management.
|
Related Party Transactions
During the last two fiscal years, Heung Mei Tsui, one of our directors, made various loans to our company. The balance of such loans was $899,314 and $303,644 at December 31, 2011 and 2010, respectively. A portion of such loans is evidenced by a written loan agreement dated September 27, 2010 between Mr. Tsui and Onny Investment Limited in the principal amount of $230,000. Pursuant to the terms of the loan agreement, the loan bears interest at a rate of 1% per annum and principle and interest are payable on March 26, 2011. The potion of the loans not subject to a written agreement also accrue interest at the rate of 1% per annum and are payable on demand.
On December 24, 2008, we entered into a line of credit with a bank for with a maximum principle of RMB 17 million (approximately $2.5 million), bearing interest at the rate of 6.37% per annum. The line of credit is collateralized by certain land use rights, buildings, machinery and equipment, and is also personally guaranteed by Ms. Zhilin Li, our Chief Executive Officer. We repaid the entire outstanding principle balance under the line of credit, in the amount of $2,485,060, during the third quarter of fiscal 2009.
Independence of the Board of Directors
The board of directors has determined that Messrs. Gene Michael Bennett, Baowen Dong and Yingwen Zhang are “independent directors” as defined in the listing standards of NYSE Amex.
Audit Fees
The aggregate fees billed by Hansen, Barnett & Maxwell, P.C. for professional services rendered for the audit of our annual financial statements included in our Annual Reports on Form 10-K, for the reviews of the financial statements included in our Quarterly Reports on Form 10-Q, and for services in connection with statutory and regulatory filings or engagements were approximately $142,000 and $165,000 for the fiscal years ended December 31, 2011 and 2010, respectively.
Audit-Related Fees
The aggregate fees billed by our principal accountants for audit-related services were approximately $43,000 and $15,000 for the fiscal years ended December 31, 2011 and 2010, respectively. The audit-related fees related to the audit of restated and amended financial statements for December 31, 2010 and to the review of related financial statements for interim periods, to responding to potential investors’ due diligence questions, and to the review of responses to SEC comment letters.
Tax Fees
The aggregate fees billed by our principal accountants for tax or tax related services were $4,000 and $5,000 for the fiscal years ended December 31, 2011 and 2010, respectively. The tax services related to the preparation of Delaware franchise tax returns and to the preparation of U.S. Federal income tax returns.
64
All Other Fees
We did not engage our principal accountants to render services to us during the last two fiscal years, other than as reported above.
Our Board of Directors has approved the tax and tax related services provided by our principal accountants.
(a) The following documents are filed as part of this report:
Financial Statements
The following financial statements of China Pharma Holdings, Inc. and Reports of Independent Registered Public Accounting Firms are presented in the “F” pages of this report:
|
Reports of Independent Registered Public Accounting Firms
|
F-2
|
|||
|
Consolidated Balance Sheets - as of December 31, 2011 and 2010
|
F-3
|
|||
|
Consolidated Statements of Income and Other Comprehensive Income - for the years ended December 31, 2011 and 2010
|
F-4
|
|||
|
Consolidated Statements of Shareholders’ Equity - for the years ended December 31, 2011 and 2010
|
F-5
|
|||
|
Consolidated Statements of Cash Flows - for the years ended December 31, 2011 and 2010
|
F-6
|
|||
|
Notes to Consolidated Financial Statements
|
F-7 - F-20
|
(b) Exhibits
See the Exhibit Index following the signature page of this report, which Index is incorporated herein by reference.
65
SIGNATURES
Pursuant to the requirements of Section 13 or 15(d) of the Securities Exchange Act of 1934, as amended, the registrant has duly caused this report to be signed on its behalf by the undersigned, thereunto duly authorized.
| Date: March 14, 2012 | CHINA PHARMA HOLDINGS, INC. |
|
By:
/s/ Zhilin L
i
|
|
| Name: Zhilin Li | |
| Title: Chief Executive Officer | |
| (principal executive officer) |
Pursuant to the requirements of the Securities Exchange Act of 1934, this report has been signed below by the following persons on behalf of the registrant and in the capacities and on the dates indicated.
|
Signature
|
Title
|
Date
|
|
/s/ Zhilin Li
Zhilin Li
|
Chairman of the Board, President and Chief Executive Officer (principal executive officer)
|
March 14, 2012
|
|
/s/ Frank Waung
Frank Waung
|
Chief Financial Officer (principal financial officer and principal accounting officer)
|
March 14, 2012
|
|
/s/ Heung Mei Tsui
Heung Mei Tsui
|
Director
|
March 14, 2012
|
|
/s/ Gene Michael Bennett
Gene Michael Bennett
|
Director
|
March 14, 2012
|
|
/s/ Yingwen Zhang
Yingwen Zhang
|
Director
|
March 14, 2012
|
|
/s/ Baowen Dong
Baowen Dong
|
Director
|
March 14, 2012
|
Supplemental Information to be Furnished With Reports Filed Pursuant to Section 15(d) of the Act by Registrants Which Have Not Registered Securities Pursuant to Section 12 of the Act.
As of the date of filing of this Annual Report on Form 10-K, we have not provided any annual report with respect to our last fiscal year or any proxy materials to our shareholders. We intend to provide proxy materials to our shareholders with respect to our next annual meeting, and if we do so, we shall concurrently furnish such materials to the Securities and Exchange Commission.
66
CHINA PHARMA HOLDINGS, INC.
Exhibit Index to Annual Report on Form 10-K
For the Fiscal Year Ended December 31, 2011
|
Exhibit No.
|
Description
|
|||
|
3.1
|
Amended and Restated Certificate of Incorporation of the Company (incorporated by reference to our Quarterly Report on Form 10-Q filed on August 9, 2010).
|
|||
|
3.4
|
Amended and Restated Bylaws of the Company (incorporated by reference to our Quarterly Report on Form 10-Q filed on August 10, 2011).
|
|||
|
10.1
|
Engagement Letter dated April 28, 2009 between the Company and Heung Mei Tsui. (incorporated by reference to our Annual Report on Form 10-K filed on March 3, 2011).
|
|||
|
10.2
|
Warrant issued to Hayden Communications International, Inc., dated December 24, 2008 (incorporated by reference to our Current Report on Form 8-K filed on December 29, 2008).
|
|||
|
10.3
|
2009 Stock Option Plan of the Company (incorporated by reference to Appendix B of the Company’s Preliminary Information Statement on Schedule 14C filed on September 3, 2009).
|
|||
|
10.4
|
Option Grant Agreement dated as of April 28, 2010 between the Company and Frank Waung (incorporated by reference to our Quarterly Report on Form 10-Q filed on August 9, 2010).
|
|||
|
10.5
|
Employment Agreement dated July 1, 2010 between Hainan Helpson Medical & Biotechnology Co., Ltd. and Zhilin Li. (incorporated by reference to our Quarterly Report on Form 10-Q filed on November 10, 2010).
|
|||
|
10.6
|
Employment Agreement dated July 1, 2010 between Hainan Helpson Medical & Biotechnology Co., Ltd. and Frank Waung (incorporated by reference to our Current Report on Form 8-K filed on August 9, 2010).
|
|||
|
10.7
|
Form of Warrant, dated May 17, 2010, issued to FirsTrust Group Inc. (incorporated by reference to our Annual Report on Form 10-K filed on March 3, 2011).
|
|||
|
10.8
|
Loan Agreement dated September 27, 2010 between Onny Investment Limited and Heung Mei Tsui (incorporated by reference to our Annual Report on Form 10-K filed on March 3, 2011).
|
|||
|
10.9
|
2010 Long-Term Incentive Plan of the Company (incorporated by reference to the Definitive Proxy Statement on Schedule 14A filed on November 12, 2010).
|
|||
|
10.10
|
Employment Agreement dated May 31, 2011 between Hainan Helpson Medical & Biotechnology Co., Ltd. and Frank Waung (incorporated by reference to our Current Report on Form 8-K filed on June 1,2011).
|
|||
|
10.11
|
Form of Restricted Stock Grant Agreement between the Company and the grantees under 2010 Long-Term Incentive Plan of the Company (incorporated by reference to our Current Report on Form 8-K filed on June 1,2011).
|
|||
|
10.12
|
Form of Non-Qualified Stock Option Grant Agreement between the Company and the grantees under 2010 Long-Term Incentive Plan of the Company(incorporated by reference to our Current Report on Form 8-K filed on June 1,2011).
|
|||
|
14.1
|
Code of Business Conduct and Ethics (incorporated by reference to the Registration Statement on Form S-1 filed on July 11, 2008).
|
|||
|
21.1
|
Subsidiaries of the Company (incorporated by reference to our Annual Report on Form 10-K filed on March 3, 2011).
|
|||
|
23.1*
|
Consent of Hansen, Barnett & Maxwell, P.C.
|
|||
|
31.1*
|
Certification of Chief Executive Officer pursuant to Rule 13a-14 and Rule 15d-14(a) of the Exchange Act.
|
|
|
31.2*
|
Certification of Chief Financial Officer pursuant to Rule 13a-14 and Rule 15d-14(a) of the Exchange Act.
|
|
|
32.1*
|
Certification of the Chief Executive Officer pursuant to 18 U.S.C. Section 1350, as adopted pursuant to Section 906 of the Sarbanes-Oxley Act of 2002.
|
67
|
32.2*
|
Certification of the Chief Financial Officer pursuant to 18 U.S.C. Section 1350, as adopted pursuant to Section 906 of the Sarbanes-Oxley Act of 2002.
|
|
|
101**
|
Interactive data files pursuant to Rule 405 of Regulation S-T (furnished herewith).
|
___________
* filed herewith.
** The interactive data files in Exhibit No. 101 hereto are deemed not filed or part of a registration statement or prospectus for purposes of Sections 11 or 12 of the Securities Act of 1933, as amended, and not filed for purposes of Section 18 of the Securities and Exchange Act of 1934, as amended, and otherwise are not subject to liability under those sections.
68
CHINA PHARMA HOLDINGS, INC.
INDEX TO FINANCIAL STATEMENTS
|
Page
|
|
|
Report of Independent Registered Public Accounting Firm
|
F-2
|
|
Consolidated Balance Sheets as of December 31, 2011 and 2010
|
F-3
|
|
Consolidated Statements of Operations and Comprehensive Income for the Years Ended December 31, 2011 and 2010
|
F-4
|
|
Consolidated Statements of Stockholders’ Equity for the Years Ended December 31, 2010 and 2011
|
F-5
|
|
Consolidated Statements of Cash Flows for the Years Ended December 31, 2011 and 2010
|
F-6
|
|
Notes to Consolidated Financial Statements
|
F-7
|
F - 1

REPORT OF INDEPENDENT REGISTERED PUBLIC ACCOUNTING FIRM
To the Board of Directors and the Stockholders
China Pharma Holdings, Inc.
We have audited the consolidated balance sheets of China Pharma Holdings, Inc. and subsidiaries as of December 31, 2011 and 2010, and the related consolidated statements of operations and comprehensive income, stockholders’ equity, and cash flows for the years then ended. These financial statements are the responsibility of the Company’s management. Our responsibility is to express an opinion on these financial statements based on our audits.
We conducted our audits in accordance with the standards of the Public Company Accounting Oversight Board (United States). Those standards require that we plan and perform the audits to obtain reasonable assurance about whether the financial statements are free of material misstatement. The Company is not required to have, nor were we engaged to perform, an audit of its internal control over financial reporting. Our audits included consideration of internal control over financial reporting as a basis for designing audit procedures that are appropriate in the circumstances, but not for the purpose of expressing an opinion on the effectiveness of the Company’s internal control over financial reporting. Accordingly, we express no such opinion. An audit also includes examining, on a test basis, evidence supporting the amounts and disclosures in the financial statements, assessing the accounting principles used and significant estimates made by management, as well as evaluating the overall financial statement presentation. We believe that our audits provide a reasonable basis for our opinion.
In our opinion the consolidated financial statements referred to above present fairly, in all material respects, the financial position of China Pharma Holdings, Inc. and subsidiaries as of December 31, 2011 and 2010, and the results of their operations and their cash flows for the years then ended, in conformity with accounting principles generally accepted in the United States of America.
HANSEN, BARNETT & MAXWELL, P.C.
Salt Lake City, Utah
March 14, 2012
F - 2
|
CHINA PHARMA HOLDINGS, INC.
|
||||||||
|
|
||||||||
|
December 31,
|
December 31,
|
|||||||
|
2011
|
2010
|
|||||||
|
ASSETS
|
||||||||
|
Current Assets:
|
||||||||
|
Cash and cash equivalents
|
$ | 4,050,854 | $ | 3,692,086 | ||||
|
Banker's acceptances
|
83,512 | - | ||||||
|
Trade accounts receivable, less allowance for doubtful
|
||||||||
|
accounts of $3,536,405 and $3,317,017, respectively
|
69,695,556 | 61,947,737 | ||||||
|
Other receivables, less allowance for doubtful
|
||||||||
|
accounts of $38,921 and $15,669, respectively
|
55,039 | 65,019 | ||||||
|
Advances to suppliers
|
5,778,841 | 5,311,896 | ||||||
|
Inventory
|
30,378,658 | 20,388,935 | ||||||
|
Deferred tax assets
|
566,226 | 528,684 | ||||||
|
Total Current Assets
|
110,608,686 | 91,934,357 | ||||||
|
Advances for purchases of property and equipment
|
170,323 | 114,946 | ||||||
|
Advances for purchases of intangible assets
|
36,194,494 | 29,781,388 | ||||||
|
Property and equipment
, net of accumulated depreciation of
|
||||||||
|
$3,391,124 and $3,436,182, respectively
|
6,334,817 | 6,372,487 | ||||||
|
Intangible assets
, net of accumulated amortization of
|
||||||||
|
$3,041,804 and $2,342,081, respectively
|
3,082,671 | 3,547,763 | ||||||
|
TOTAL ASSETS
|
$ | 156,390,991 | $ | 131,750,941 | ||||
|
LIABILITIES AND STOCKHOLDERS' EQUITY
|
||||||||
|
Current Liabilities:
|
||||||||
|
Trade accounts payable
|
$ | 3,112,385 | $ | 4,937,781 | ||||
|
Accrued expenses
|
184,017 | 98,206 | ||||||
|
Accrued taxes payable
|
3,082,353 | 2,386,019 | ||||||
|
Other payables
|
784,697 | 92,077 | ||||||
|
Advances from customers
|
1,784,474 | 1,208,988 | ||||||
|
Other payables - related parties
|
899,314 | 303,644 | ||||||
|
Short-term notes payable
|
3,931,745 | 3,781,119 | ||||||
|
Total Current Liabilities
|
13,778,985 | 12,807,834 | ||||||
|
Long-term deferred tax liability
|
128,909 | 71,673 | ||||||
|
Derivative warrant liability
|
- | 934,260 | ||||||
|
Total Liabilities
|
13,907,894 | 13,813,767 | ||||||
|
Stockholders' Equity:
|
||||||||
|
Preferred stock, $0.001 par value; 5,000,000 shares authorized;
|
||||||||
|
no shares issued or outstanding
|
- | - | ||||||
|
Common stock, $0.001 par value; 95,000,000 shares authorized;
|
||||||||
|
43,529,557 shares and 43,404,557 shares outstanding, respectively
|
43,530 | 43,405 | ||||||
|
Additional paid-in capital
|
23,448,534 | 23,252,476 | ||||||
|
Retained earnings
|
104,286,666 | 85,017,024 | ||||||
|
Accumulated other comprehensive income
|
14,704,367 | 9,624,269 | ||||||
|
Total Stockholders' Equity
|
142,483,097 | 117,937,174 | ||||||
|
TOTAL LIABILITIES AND STOCKHOLDERS' EQUITY
|
$ | 156,390,991 | $ | 131,750,941 | ||||
The accompanying notes are an integral part of these consolidated financial statements.
F - 3
|
CHINA PHARMA HOLDINGS, INC.
|
||||||||
|
|
||||||||
|
AND COMPREHENSIVE INCOME
|
||||||||
|
For the Years Ended
|
||||||||
|
December 31,
|
||||||||
|
2011
|
2010
|
|||||||
|
Revenue
|
$ | 81,166,739 | $ | 74,388,180 | ||||
|
Cost of revenue
|
52,178,680 | 44,105,447 | ||||||
|
Gross profit
|
28,988,059 | 30,282,733 | ||||||
|
Operating expenses:
|
||||||||
|
Selling expenses
|
3,439,522 | 2,542,826 | ||||||
|
General and administrative expenses
|
3,716,397 | 3,039,450 | ||||||
|
Bad debt expense
|
108,085 | 505,224 | ||||||
|
Total operating expenses
|
7,264,004 | 6,087,500 | ||||||
|
Government subsidy income
|
301,672 | 469,509 | ||||||
|
Income from operations
|
22,025,727 | 24,664,742 | ||||||
|
Other income (expense):
|
||||||||
|
Interest income
|
7,208 | 15,413 | ||||||
|
Interest expense
|
(255,198 | ) | (168,258 | ) | ||||
|
Derivative gain
|
934,260 | 1,588,888 | ||||||
|
Net other income
|
686,270 | 1,436,043 | ||||||
|
Income before income taxes
|
22,711,997 | 26,100,785 | ||||||
|
Income tax expense
|
(3,442,355 | ) | (2,686,438 | ) | ||||
|
Net income
|
19,269,642 | 23,414,347 | ||||||
|
Other comprehensive income - foreign currency
|
||||||||
|
translation adjustment
|
5,080,098 | 3,721,462 | ||||||
|
Comprehensive income
|
$ | 24,349,740 | $ | 27,135,809 | ||||
|
Earnings per Share:
|
||||||||
|
Basic
|
$ | 0.44 | $ | 0.54 | ||||
|
Diluted
|
$ | 0.44 | $ | 0.54 | ||||
The accompanying notes are an integral part of these consolidated financial statements.
F - 4
|
CHINA PHARMA HOLDINGS, INC.
|
||||||||||||||||||||||||
|
CONSOLIDATED STATEMENTS OF STOCKHOLDERS' EQUITY
|
||||||||||||||||||||||||
|
Accumulated
|
||||||||||||||||||||||||
|
Additional
|
Other
|
Total
|
||||||||||||||||||||||
|
Common Stock
|
Paid-in
|
Retained
|
Comprehensive
|
Stockholders'
|
||||||||||||||||||||
|
Shares
|
Amount
|
Capital
|
Earnings
|
Income
|
Equity
|
|||||||||||||||||||
|
Balance, December 31, 2009,
|
42,308,350 | $ | 42,308 | $ | 20,325,157 | $ | 61,602,677 | $ | 5,902,807 | $ | 87,872,949 | |||||||||||||
|
Exercise of warrants for cash
|
1,085,292 | 1,086 | 2,581,914 | - | - | 2,583,000 | ||||||||||||||||||
|
Issuance of stock as compensation
|
6,863 | 7 | 20,993 | - | - | 21,000 | ||||||||||||||||||
|
Exercise of stock options, net of 35,948 shares
|
||||||||||||||||||||||||
|
received as payment of exercise price
|
4,052 | 4 | (4 | ) | - | - | - | |||||||||||||||||
|
Stock-based compensation from stock options
|
- | - | 207,423 | - | - | 207,423 | ||||||||||||||||||
|
Issuance of warrants as compensation
|
- | - | 116,993 | - | - | 116,993 | ||||||||||||||||||
|
Net income for the year
|
- | - | - | 23,414,347 | - | 23,414,347 | ||||||||||||||||||
|
Foreign currency translation adjustment
|
- | - | - | - | 3,721,462 | 3,721,462 | ||||||||||||||||||
|
Balance, December 31, 2010
|
43,404,557 | 43,405 | 23,252,476 | 85,017,024 | 9,624,269 | 117,937,174 | ||||||||||||||||||
|
Issuance of options as compensation
|
- | - | 76,991 | - | - | 76,991 | ||||||||||||||||||
|
Issuance of non-vested common stock
|
||||||||||||||||||||||||
|
as compensation
|
125,000 | 125 | 119,067 | - | - | 119,192 | ||||||||||||||||||
|
Net income for the year
|
- | - | - | 19,269,642 | - | 19,269,642 | ||||||||||||||||||
|
Foreign currency translation adjustment
|
- | - | - | - | 5,080,098 | 5,080,098 | ||||||||||||||||||
|
Balance, December 31, 2011
|
43,529,557 | $ | 43,530 | $ | 23,448,534 | $ | 104,286,666 | $ | 14,704,367 | $ | 142,483,097 | |||||||||||||
The accompanying notes are an integral part of these consolidated financial statements.
F - 5
|
CHINA PHARMA HOLDINGS, INC.
|
||||||||
|
|
||||||||
|
For the Years Ended
|
||||||||
|
December 31,
|
||||||||
|
2011
|
2010
|
|||||||
|
Cash Flows from Operating Activities:
|
||||||||
|
Net income
|
$ | 19,269,642 | $ | 23,414,347 | ||||
|
Depreciation and amortization
|
1,174,822 | 1,505,195 | ||||||
|
Stock based compensation
|
196,183 | 345,416 | ||||||
|
Derivative gain
|
(934,260 | ) | (1,588,888 | ) | ||||
|
Bad debt expense
|
108,085 | 505,224 | ||||||
|
Deferred income taxes
|
37,281 | (123,177 | ) | |||||
|
Changes in assets and liabilities:
|
||||||||
|
Trade accounts and other receivables
|
(11,392,154 | ) | (9,231,358 | ) | ||||
|
Advances to suppliers
|
(251,171 | ) | (3,367,119 | ) | ||||
|
Inventory
|
(2,925,143 | ) | (5,530,989 | ) | ||||
|
Trade accounts payable
|
(1,928,259 | ) | 895,001 | |||||
|
Accrued expenses and other liabilities
|
758,783 | 74,063 | ||||||
|
Accrued taxes payable
|
591,470 | 785,383 | ||||||
|
Other payables
|
13,327 | (30,183 | ) | |||||
|
Advances from customers
|
518,718 | 132,572 | ||||||
|
Net Cash Provided by Operating Activities
|
5,237,324 | 7,785,487 | ||||||
|
Cash Flows from Investing Activities:
|
||||||||
|
Net investment in banker's acceptances
|
(82,149 | ) | - | |||||
|
Advances for purchases of property and equipment
|
||||||||
|
and intangible assets
|
(5,191,385 | ) | (10,454,529 | ) | ||||
|
Purchase of property and equipment
|
(352,362 | ) | (63,852 | ) | ||||
|
Net Cash Used in Investing Activities
|
(5,625,896 | ) | (10,518,381 | ) | ||||
|
Cash Flows from Financing Activity:
|
||||||||
|
Proceeds from issuance of notes payable
|
- | 3,687,996 | ||||||
|
Payments of notes payable
|
- | (3,835,515 | ) | |||||
|
Borrowings from related party
|
595,670 | 227,903 | ||||||
|
Proceeds from exercise of warrants
|
- | 2,583,000 | ||||||
|
Net Cash Provided by Financing Activity
|
595,670 | 2,663,384 | ||||||
|
Effect of Exchange Rate Changes on Cash
|
151,670 | 126,843 | ||||||
|
Net Increase in Cash
|
358,768 | 57,333 | ||||||
|
Cash and Cash Equivalents at Beginning of Year
|
3,692,086 | 3,634,753 | ||||||
|
Cash and Cash Equivalents at End of Year
|
$ | 4,050,854 | $ | 3,692,086 | ||||
|
Supplemental Cash Flow Information:
|
||||||||
|
Cash paid for interest
|
$ | 248,018 | $ | 168,258 | ||||
|
Cash paid for income taxes
|
4,532,592 | 2,839,548 | ||||||
|
Supplemental Noncash Investing and Financing Activities:
|
||||||||
|
Accounts payable for purchases of property and equipment
|
$ | 143,151 | $ | 100,160 | ||||
|
Accounts receivable collected with banker's acceptances
|
6,102,570 | - | ||||||
|
Inventory purchased with banker's acceptances
|
6,102,570 | - | ||||||
The accompanying notes are an integral part of these consolidated financial statements.
F - 6
CHINA PHARMA HOLDINGS, INC.
NOTES TO CONSOLIDATED FINANCIAL STATEMENTS
FOR THE YEARS ENDED DECEMBER 31, 2011 AND 2010
Organization and Nature of Operations –
China Pharma Holdings, Inc., a Delaware corporation, owns 100% of Onny Investment Limited (Onny), a British Virgin Islands corporation, that in turn owns 100% of Hainan Helpson Medical & Biotechnology Co., Ltd (Helpson), a company organized under the laws of the People's Republic of China (the PRC). China Pharma Holdings, Inc. and its subsidiaries are referred to herein as the Company.
The Foreign Investment Industrial Catalogue
(the Catalogue) jointly issued by the China’s Ministry of Commerce and the National Development and Reform Commission (as the latest version is the year 2011 version) classified various industries/businesses into three different categories: (i) encouraged for foreign investment; (ii) restricted to foreign investment; and (iii) prohibited from foreign investment. For any industry/business not covered by any of these three categories, they will be deemed industries/businesses permitted for foreign investment. A typical foreign investment ownership restriction in the pharmaceutical industry is that a foreign investment enterprise (the FIE) shall not have the whole or majority of its equity interests owned by a foreign owner if the FIE establishes more than 30 branch stores and distributes a variety of brands in those franchise stores, which is not our case. Helpson manufactures and markets generic and branded pharmaceutical products as well as biochemical products primarily to hospitals and private retailers located throughout the PRC. The Company believes Helpson’s business is not subject to any ownership restrictions prescribed under the Catalogue. Onny acquired 100% of the ownership in Helpson from Helpson’s three former shareholders on May 25, 2005 by entry into an Equity Transfer Agreement with such three parties on May 25, 2005. The transaction was approved by the Commercial Bureau of Hainan Province on June 12, 2005 and Helpson received the Certificate of Approval for Establishing of Enterprises with Foreign Investment in the PRC on the same day and its business license evidencing its WFOE (Wholly Foreign Owned Enterprise) status on June 21, 2005.
Through Helpson, the Company manufactures and markets generic and branded pharmaceutical products primarily to hospitals and private retailers located throughout the PRC. The Company has and continues to acquire well-accepted medical formulas to maintain a diverse portfolio of Western and Chinese medicines. Helpson also manufactures biochemical products and health products.
Consolidation and Basis of Presentation
– The accompanying financial statements have been prepared in accordance with accounting principles generally accepted in the United States of America and are expressed in United States dollars. The accompanying consolidated financial statements include the accounts and operations of the Company and its wholly-owned subsidiaries. All significant intercompany balances and transactions have been eliminated in consolidation.
Helpson’s functional currency is the Chinese Renminbi. Helpson’s revenue and expenses are translated into United States dollars at the average exchange rate for the period. Assets and liabilities are translated at the exchange rate as of the end of the reporting period. Gains or losses from translating Helpson’s financial statements are included in accumulated other comprehensive income, which is a component of stockholders’ equity. Gains and losses arising from transactions denominated in a currency other than the functional currency of the entity that is party to the transaction are included in the results of operations.
Accounting Estimates
-
The preparation of financial statements in conformity with accounting principles generally accepted in the United States of America requires Management to make estimates and assumptions that affect the reported amounts of assets and liabilities and the disclosures of contingent assets and liabilities at the date of the financial statements, and the reported amounts of revenues and expenses during the reporting periods. Actual results could differ from those estimates.
F - 7
CHINA PHARMA HOLDINGS, INC.
NOTES TO CONSOLIDATED FINANCIAL STATEMENTS
FOR THE YEARS ENDED DECEMBER 31, 2011 AND 2010
Cash and Cash Equivalents
– Cash and cash equivalents include interest bearing and non-interest bearing bank deposits, money market accounts, and short-term banker’s acceptances purchased with maturities of three months or less.
Trade Accounts Receivable and Allowance for Doubtful Accounts –
Trade accounts receivables are carried at original invoiced amounts less an allowance for doubtful accounts. The allowances for doubtful accounts are calculated based on a detailed review of certain individual customer accounts and an estimation of the overall economic conditions affecting the Company's customer base. The Company reviews a customer's credit history before extending credit. If the financial condition of its customers were to deteriorate, resulting in an impairment of their ability to make payments, additions to the allowance would be required. A provision is made against accounts receivable to the extent they are considered unlikely to be collected. It is common practice in the PRC for receivables to extend beyond one year. Customer balances outstanding for more than one year are allowed for at a greater rate when calculating the allowance for doubtful accounts. At December 31, 2011, trade accounts receivables included $14,973,639 from sales that occurred more than one year prior to December 31, 2011, that Management believes are collectable.
Advances to Suppliers and Advances from Customers
– Common practice in the PRC is to make advances to suppliers for materials and to receive advances from customers for finished products. Advances to suppliers are applied to trade accounts payable when the materials are received. Advances received from customers are applied against trade accounts receivable when finished products are sold.
Inventory
– Inventory is stated at the lower of cost or net realizable value, computed on an average cost basis. An allowance for inventory obsolescence is provided when the market value of inventory items is lower than their cost.
Valuation of Long-Lived Assets
– The carrying values of long-lived assets are reviewed for impairment annually or whenever events or changes in circumstances indicate that the carrying values may not be recoverable. When such an event occurs, the Company projects the undiscounted cash flows to be generated from the use of the asset and its eventual disposition over the remaining life of the asset. If projections indicate that the carrying value of an asset will not be recovered, it is reduced by the estimated excess of the carrying value over the projected discounted cash flows estimated to be generated by the asset. No impairment was recognized during the years ended December 31, 2011 and 2010.
Property and Equipment
– Property and equipment are stated at cost. Maintenance and repairs are charged to expense as incurred and major improvements are capitalized. Gains or losses on sale, trade-in or retirement are included in operations during the period of disposition.
Revenue Recognition
– Revenue is considered earned when the Company has persuasive evidence of an arrangement with the customer, delivery of the products has occurred, the sales price is fixed or determinable, and collectability is reasonably assured. Delivery does not occur until products have been shipped to the customer, risk of loss has transferred to the customer and customer acceptance has been obtained, customer acceptance provisions have lapsed, or the Company has objective evidence that the criteria specified in the customer acceptance provisions have been satisfied. The sales price is not considered to be fixed or determinable until all contingencies related to the sale have been resolved.
Cost of Revenues
– Cost of revenues includes wages, materials, handling charges, and other expenses associated with the manufacture and delivery of products.
F - 8
CHINA PHARMA HOLDINGS, INC.
NOTES TO CONSOLIDATED FINANCIAL STATEMENTS
FOR THE YEARS ENDED DECEMBER 31, 2011 AND 2010
Research and Development
– Research and development expenditures are recorded as expenses in the period in which they occur. Research and development costs were not material during the years ended December 31, 2011 and 2010.
Retirement Benefit Plans
– The Company is required to make monthly contributions at prescribed rates to various employee retirement benefit plans organized by provincial governments. The governments benefit plans assume the retirement benefit obligations of all existing and future retired employees of the Company. The Company contributed $166,071 and $67,675 to retirement benefit plans for the years ended December 31, 2011 and 2010, respectively. Contributions to these plans are charged to expense as incurred.
Advertising Costs
– Advertising costs are expensed when incurred. Total advertising expense for the years ended December 31, 2011 and 2010 were $0 and $3,393, respectively.
Basic and Diluted Earnings per Common Share
-
Basic earnings per common share is computed by dividing net income by the weighted-average number of common shares outstanding during the period. Diluted earnings per share is calculated to give effect to potentially issuable dilutive common shares.
The following table is a presentation of the numerators and denominators used in the calculation of basic and diluted earnings per share:
|
For the Years Ended
|
||||||||
|
December 31,
|
||||||||
|
2011
|
2010
|
|||||||
|
Net income
|
$ | 19,269,642 | $ | 23,414,347 | ||||
|
Basic weighted-average common shares outstanding
|
43,479,899 | 43,329,554 | ||||||
|
Effect of dilutive securities:
|
||||||||
|
Warrants
|
- | 189,348 | ||||||
|
Options
|
- | 13,533 | ||||||
|
Diluted weighted-average common shares outstanding
|
43,479,899 | 43,532,435 | ||||||
|
Basic earnings per share
|
$ | 0.44 | $ | 0.54 | ||||
|
Diluted earnings per share
|
$ | 0.44 | $ | 0.54 | ||||
Potential common shares were not included in the computation of diluted earnings per share as their effect would have been anti-dilutive as follows:
|
For the Years Ended
|
||||||||
|
December 31,
|
||||||||
|
2011
|
2010
|
|||||||
|
Warrants with exercise prices of $3.00 to $3.80 per share
|
150,000 | 183,333 | ||||||
|
Options with an exercise price of $2.54 to $3.47 per share
|
310,000 | 200,000 | ||||||
|
Total
|
460,000 | 383,333 | ||||||
Credit Risk
–
The carrying amounts of accounts receivable included in the balance sheet represent the Company's exposure to credit risk in relation to its financial assets. No other financial assets carry a significant exposure to credit risk. The Company performs ongoing credit evaluations of each customer's financial condition and maintains that actual losses in the aggregate have not exceeded Management's estimations since the Company has not experienced any bad debt losses.
F - 9
CHINA PHARMA HOLDINGS, INC.
NOTES TO CONSOLIDATED FINANCIAL STATEMENTS
FOR THE YEARS ENDED DECEMBER 31, 2011 AND 2010
The Company has its cash in bank deposits primarily at state owned banks located in the PRC. Historically, deposits in PRC banks have been secure due to the state policy on protecting depositors’ interests. The PRC promulgated a new Bankruptcy Law in August 2006, which came into effect on June 1, 2007, which contains provisions for the implementation of measures for the bankruptcy of PRC banks. In the event that bankruptcy laws are enacted for banks in the PRC, the Company’s deposits may be at a higher risk of loss.
Interest Rate Risk
– The Company is exposed to the risk arising from changing interest rates, which may affect the ability of repayment of existing debts and viability of securing future debt instruments within the PRC.
Recently Announced Accounting Standards
-
In January 2010, the Financial Accounting Standards Board (FASB) issued guidance to amend the disclosure requirements related to fair value measurements. The guidance requires the disclosure of roll forward activities on purchases, sales, issuance, and settlements of the assets and liabilities measured using significant unobservable inputs (Level 3 fair value measurements). The guidance became effective for the Company as of January 1, 2011 and did not have a material impact on the consolidated financial statements.
In April 2010, the FASB issued guidance to clarify classification of an employee stock-based payment award when the exercise price is denominated in the currency of a market in which the underlying equity security trades. The guidance became effective for the Company as of January 1, 2011 and did not have a material impact on the consolidated financial statements.
In June 2011, the FASB issued guidance which eliminates the current option to report other comprehensive income and its components in the statement of changes in equity. An entity can elect to present items of net income and other comprehensive income in one continuous statement or in two separate, but consecutive, statements. The guidance is effective for publicly traded companies as of the beginning of a fiscal year that begins after December 15, 2011 and interim and annual periods thereafter. Early adoption is permitted, but full retrospective application is required. The Company adopted this guidance and it did not have a material impact on the consolidated financial statements.
Reclassification
–
The Company has reclassified certain 2010 amounts to conform to the 2011 presentation. The principal item was the reclassification of $25,501,003 from intangible assets to advances for purchases of intangible assets on the accompanying consolidated balance sheet at December 31, 2010. The reclassifications had no effect on net income.
Inventory consisted of the following:
|
December 31,
|
December 31,
|
|||||||
|
2011
|
2010
|
|||||||
|
Raw materials
|
$ | 24,920,825 | $ | 16,258,346 | ||||
|
Finished goods
|
5,457,833 | 4,130,589 | ||||||
|
Total Inventory
|
$ | 30,378,658 | $ | 20,388,935 | ||||
Property and equipment consisted of the following:
F - 10
CHINA PHARMA HOLDINGS, INC.
NOTES TO CONSOLIDATED FINANCIAL STATEMENTS
FOR THE YEARS ENDED DECEMBER 31, 2011 AND 2010
|
December 31,
|
December 31,
|
|||||||
|
2011
|
2010
|
|||||||
|
Permit of land use
|
$ | 442,978 | $ | 426,007 | ||||
|
Building
|
2,397,286 | 2,305,445 | ||||||
|
Plant, machinery and equipment
|
6,184,254 | 5,734,222 | ||||||
|
Motor vehicle
|
145,300 | 139,733 | ||||||
|
Office equipment
|
204,552 | 124,817 | ||||||
|
Construction in progress
|
351,571 | 338,103 | ||||||
|
Total
|
9,725,941 | 9,068,327 | ||||||
|
Less: accumulated depreciation
|
(3,391,124 | ) | (2,695,840 | ) | ||||
|
Property and Equipment, net
|
$ | 6,334,817 | $ | 6,372,487 | ||||
Construction in progress consists of machinery and construction supplies that have been paid for, but are not yet completed and placed into production. Once the machinery is working or the facility is in use, it is moved into plant, machinery and equipment and depreciated. Depreciation is computed on a straight-line basis over the estimated useful lives of the assets as follows:
|
Asset
|
Life - years
|
|
|
Permit of land use
|
40 - 70
|
|
|
Building
|
20 - 35
|
|
|
Plant, machinery and equipment
|
10
|
|
|
Motor vehicle
|
5 - 10
|
|
|
Office equipment
|
3-5
|
Depreciation relating to office equipment was included in general and administrative expenses, while all other depreciation was included in cost of revenue. For the years ended December 31, 2011 and 2010, depreciation expense was $578,297 and $591,562, respectively.
Intangible assets represent the cost of medical formulas approved for production by the State Food and Drug Administration (the “SFDA”) in China. During the years ended December 31, 2011 or 2010, the Company did not obtain SFDA production approval for any medical formula and therefore there were no costs reclassified from advances to medical formulas.
Approved medical formulas are amortized from the date SFDA approval is obtained over their individually identifiable estimated useful life, which are from ten to thirteen years. It is at least reasonably possible that a change in the estimated useful lives of the medical formulas could occur in the near term due to changes in the demand for the drugs and medicines produced from these medical formulas. Amortization expense relating to intangible assets was $596,525 and $913,633 for the years ended December 31, 2011 and 2010, respectively, and was included in the general and administrative expenses. Medical formulas typically do not have a residual value at the end of their amortization period.
The Company evaluates each approved medical formula for impairment at the date of SFDA approval, when indications of impairment are present and at the date of each financial statement. The Company’s evaluation is based on an estimated undiscounted net cash flow model, considering currently available market data for the related drug and the Company’s estimated market share. If the carrying value of the medical formula exceeds the estimated future net cash flows, an impairment loss is recognized for the excess of the carrying value over the discounted estimated future net cash flows. As a result of the evaluation, the Company has determined that each medical formula continues to provide benefits to the Company and no impairment was recognized during the years ended December 31, 2011 or 2010.
F - 11
CHINA PHARMA HOLDINGS, INC.
NOTES TO CONSOLIDATED FINANCIAL STATEMENTS
FOR THE YEARS ENDED DECEMBER 31, 2011 AND 2010
Intangible assets consisted solely of SFDA approved medical formulas as follows:
|
December 31,
|
||||||||
|
2011
|
2010
|
|||||||
|
Gross carrying amount
|
$ | 6,124,475 | $ | 5,889,844 | ||||
|
Accumulated amortization
|
(3,041,804 | ) | (2,342,081 | ) | ||||
|
Net carrying amount
|
$ | 3,082,671 | $ | 3,547,763 | ||||
The estimated aggregate annual amortization expense for each of the next five years and thereafter is as follows:
|
Year
|
Amount
|
|||
|
2012
|
$ | 605,642 | ||
|
2013
|
606,423 | |||
|
2014
|
591,149 | |||
|
2015
|
590,696 | |||
|
2016
|
416,437 | |||
|
Thereafter
|
272,324 | |||
|
Total
|
$ | 3,082,671 | ||
In order to expand the number of medicines manufactured and marketed by the Company, the Company has entered into contracts with independent laboratories for the purchase of medical formulas. Although SFDA approval has not been obtained for these medical formulas at the dates of the contracts, the object of the contracts is for the purchase of SFDA-approved medical formulas once the SFDA approval process is completed. Some of the medical formulas currently in the SFDA approval process also come with SFDA-approved patents, and the Company has received the title for one patent and is currently in the transfer process to receive another one. The related patents have not expired.
Prior to entering into the contracts, the laboratories typically have completed all required research and development to determine the medical formula for and the method of production of the generic medicine. Since the laboratories are not eligible to apply for SFDA production approval, they usually collaborate with a production facility (such as the Company) and apply for the production approval in the name of the manufacturer. The Company buys the final products with the production approval from the SFDA and the laboratories have to complete the SFDA process from the point of the contract.
A typical SFDA approval process for the production of a generic medical product involves a number of steps that generally requires three to five years. If the medical formula is purchased at the point when the generic medical product receives the SFDA’s approval for clinical study, which is very typical for the Company, the clinical study that follows will usually take from 1.5 to three years to complete. After the clinical study is completed, the results are submitted to the SFDA and a production approval application is filed with the SFDA. In most cases, it will take between eight to eighteen months to prepare and submit the production approval application and obtain SFDA approval. Upon approving the generic medical product, the SFDA issues a production certificate and the Company can produce and sell the generic medical product. As a result of this process, SFDA approval is expected to be received in approximately two to five years from the dates of the medical formula contracts.
F - 12
CHINA PHARMA HOLDINGS, INC.
NOTES TO CONSOLIDATED FINANCIAL STATEMENTS
FOR THE YEARS ENDED DECEMBER 31, 2011 AND 2010
Under the terms of the contracts, the laboratories are required to obtain production approval (on behalf of the Company) for the medical formulas from the SFDA. Management monitors the status of each medical formula on a regular basis in order to assess whether the laboratories are performing adequately under the contracts. If a medical product is not approved by the SFDA, as evidenced by their issuance of a denial letter, or if the laboratory breaches the contract, the laboratory is required under the contract to provide a refund to the Company of the full amount of the payments made to the laboratory for that formula, or the Company can require the application of those payments to another medical formula with the same laboratory. As a result of the refund right, the Company is purchasing an approved medical product. Accordingly, payments made prior to the issuance of production approval by the SFDA are recorded as advances for purchases of intangible assets.
To date, no formula has failed to receive SFDA production approval nor has the Company been informed or become aware of any formula that may fail to receive such approval. However, there is no assurance that the medical products will receive production approval and if the Company does not receive such approval, it will enforce its contractual rights to receive the refund from the laboratory or have the payments applied to another medical formula with the same laboratory.
At December 31, 2011, the Company was obligated to pay laboratories approximately $8,640,000 upon their completion of the various phases of contracts to provide SFDA production approval of medical formulas.
During the years ended December 31, 2011 and December 31, 2010, a member of the Company’s board of directors advanced the Company $595,670 and $227,903, respectively. Total advances owing to the board member were $899,314 and $303,644 as of December 31, 2011 and December 31, 2010, respectively, and are recorded as other payables – related parties on the accompanying consolidated balance sheets.
On July 2, 2009, the Company entered into a revolving line of credit with a bank, with the related note payable bearing interest at an annual rate of 5.31% and collateralized by certain land use rights, buildings, machinery and equipment. The revolving line of credit was paid in full during the third quarter of fiscal 2010.
On September 30, 2010, the Company entered into a new revolving line of credit with a bank in the amount of RMB 25,000,000 (approximately $3,800,000), with the related note payable bearing interest at a base rate equal to the PRC’s floating six-month to one year rate of 5.56% plus an additional 10% of the base rate, with a resulting rate of 6.12% at December 31, 2010. Advances on the line of credit are due one year from the date of the advance, with the note payable collateralized by certain land use rights and buildings. On October 26, 2011 the Company renewed the underlying note with the same bank. The new note bears interest at a base rate equal to the PRC’s floating six-month to one year rate of 6.56% plus an additional 15% of the base rate, with a resulting rate of 7.54% at December 31, 2011. Advances on the line of credit are due one year from the date of the advance and collateralized by certain land use rights and buildings. The outstanding balance due under the revolving line of credit was RMB 25,000,000 ($3,931,745) at December 31, 2011. This amount has been classified as short-term notes payable in the accompanying consolidated balance sheet at December 31, 2011. The Company has no additional amounts available to it under the line of credit.
Fair Value of
Notes Payable
– Based on the borrowing rates currently available to the Company for bank loans with similar terms and maturities, the carrying amounts of notes payable outstanding at December 31, 2011 and 2010 approximated their fair value because of the immediate or short-term maturity of these financial instruments or because the underlying instruments bear interest rates that approximated current market rates.
F - 13
CHINA PHARMA HOLDINGS, INC.
NOTES TO CONSOLIDATED FINANCIAL STATEMENTS
FOR THE YEARS ENDED DECEMBER 31, 2011 AND 2010
Deferred income tax assets and liabilities are measured using enacted tax rates expected to apply to taxable income in the years in which temporary differences are expected to be recovered or settled. The effect on deferred tax assets and liabilities of a change in tax laws or rates is recognized in income in the period that includes the enactment date.
Undistributed earnings of Helpson, the Company’s foreign subsidiary, since its acquisition, amounted to approximately $102.7 million at December 31, 2011. Those earnings, as well as the investment in Helpson of approximately $23.3 million, are considered to be indefinitely reinvested and, accordingly, no U.S. federal or state income taxes have been provided thereon. Upon distribution of those earnings in the form of dividends or otherwise, the Company would be subject to U.S. federal and state income taxes (net of an adjustment for foreign tax credits) and withholding taxes payable to the PRC. Determination of the amount of unrecognized deferred U.S. income tax liability is not practical because of the complexities associated with its hypothetical calculation; however, unrecognized foreign tax credits may be available to reduce a portion of the U.S. tax liability.
On March 16, 2007, the National People’s Congress of China passed the new Enterprise Income Tax Law (EIT Law) and on December 6, 2007, the State Council of China issued the Implementation Regulations for the EIT Law which took effect on January 1, 2008. The EIT Law and Implementation Regulations Rules impose a unified EIT of 25% on all domestic-invested enterprises and Foreign Invested Entities, or FIEs, unless they qualify under certain limited exceptions.
The Company is located in a special region, which had a 15% corporate income tax rate before the new EIT Law. The new EIT Law abolished the preferential corporate income tax rate in the special region. However, because the Company was in existence prior to the March 16, 2007 China tax law change, it is gradually transitioning to the new 25% tax rate over a five year period beginning on January 1, 2008. The phase-in income tax rate is 22% for 2010 and 25% for 2011. Also, the Company is permitted to use its remaining tax holiday, so it continued to have a favorable income tax rate at the rate of half of the phase-in income tax rate during 2010 of 11%. During 2010, the Company applied for and received a favorable tax rate of 15% for fiscal 2011 through 2013 due to its status in the PRC as a high technology enterprise. Under current tax law in the PRC, the Company is and will be subject to the following enterprise income tax rates:
|
Enterprise Income
|
||
|
Year
|
Tax Rate | |
|
2012
|
15%
|
|
|
2013
|
15%
|
|
|
2014 and after
|
25%
|
The provision for income taxes consisted of the following:
|
Years Ended December 31,
|
||||||||
|
2011
|
2010
|
|||||||
|
Current
|
$ | 3,458,568 | $ | 2,809,615 | ||||
|
Deferred
|
(16,213 | ) | (123,177 | ) | ||||
|
Total income tax expense
|
$ | 3,442,355 | $ | 2,686,438 | ||||
F - 14
CHINA PHARMA HOLDINGS, INC.
NOTES TO CONSOLIDATED FINANCIAL STATEMENTS
FOR THE YEARS ENDED DECEMBER 31, 2011 AND 2010
Following is a reconciliation of income taxes calculated at the federal statutory rates to the provision for income taxes:
|
Years Ended December 31,
|
||||||||
|
2011
|
2010
|
|||||||
|
Tax at statutory rate of 25%
|
$ | 5,677,999 | $ | 6,525,196 | ||||
|
Non-deductible expenses (non-taxable income)
|
261,122 | 324,258 | ||||||
|
Effect of change in tax rate
|
- | (118,868 | ) | |||||
|
Effect of tax holiday
|
(2,330,566 | ) | (3,610,134 | ) | ||||
|
Change in valuation allowance
|
(166,200 | ) | (434,014 | ) | ||||
|
Income tax expense
|
$ | 3,442,355 | $ | 2,686,438 | ||||
The effect of the tax holiday amounted to savings of $2,330,566 and $3,610,134 for the years ended December 31, 2011 and 2010, which was equivalent to basic and diluted earnings per share of $0.05 and $0.08 per share for the years ended December 31, 2011 and 2010, respectively. The temporary differences which give rise to the deferred income tax assets and liability are as follows:
|
December 31,
|
||||||||
|
2011
|
2010
|
|||||||
|
Deferred income tax assets:
|
||||||||
|
Allowance for doubtful trade receivables
|
$ | 530,461 | $ | 497,553 | ||||
|
Allowance for doubtful other receivables
|
5,838 | 2,350 | ||||||
|
Expenses not deductible in current year
|
29,927 | 28,781 | ||||||
|
Share based compensation
|
172,911 | 106,208 | ||||||
|
Derivative warrant liability
|
- | 317,648 | ||||||
|
U.S. net operating losses
|
618,236 | 200,791 | ||||||
|
Total deferred income tax assets
|
1,357,373 | 1,153,331 | ||||||
|
Valuation allowance
|
(791,147 | ) | (624,647 | ) | ||||
|
Net deferred income tax asset
|
$ | 566,226 | $ | 528,684 | ||||
|
Deferred income tax liability:
|
||||||||
|
Intangible assets
|
$ | 128,909 | $ | 71,673 | ||||
As of December 31, 2011, the Company has net operating loss from continuing operations for United States federal income tax purposes of $1,818,341 which are available to offset future taxable income, if any, through 2031. In assessing the realizability of deferred tax assets, Management considers whether it is more likely than not that some portion or all of the deferred tax assets will not be realized. The ultimate realization of deferred tax assets is dependent upon the generation of future taxable income during the periods in which those differences become deductible or tax loss carry forwards are utilized. Management considers projected future taxable income and tax planning strategies in making this assessment. Based upon an assessment of the level of historical taxable income and projections for future taxable income over the periods on which the deferred tax assets are deductible or can be utilized, Management believes it is not likely the Company will realize all of the benefits of the deferred tax assets as of December 31, 2011. Therefore, the Company has provided for a valuation allowance against its deferred tax assets of $791,147 as of December 31, 2011.
The Company has also incurred various other taxes, comprised primarily of business taxes, value-added taxes, urban construction taxes, education surcharges and others. Any unpaid amounts are reflected on the balance sheets as accrued taxes payable. During 2011 and 2010, the Company received an incentive payment from the tax authority of the Hainan provincial government in the PRC totaling $301,672 and $469,509, respectively, which has been recorded as government subsidy income on the accompanying statements of operations and comprehensive income for the years ended December 31, 2011 and 2010.
F - 15
CHINA PHARMA HOLDINGS, INC.
NOTES TO CONSOLIDATED FINANCIAL STATEMENTS
FOR THE YEARS ENDED DECEMBER 31, 2011 AND 2010
Management is required to evaluate tax positions taken by the Company and to recognize a tax liability or asset if it is more likely than not that the tax positions taken would not be sustained upon examination by tax authorities. Management has analyzed the tax positions taken and has concluded that, as of December 31, 2011, there were no uncertain positions taken or expected to be taken that would require recognition of a liability or asset or disclosure in the financial statements. The Company is subject to routine audits by taxing jurisdictions and could be subject to income tax if certain issues were found. Although, there are currently no audits of any tax periods, tax returns for tax years after 2008 remain subject to examination.
On May 27, 2008 and on May 30, 2008, the Company issued warrants to purchase 1,250,000 shares of common stock at $2.80 per share and warrants to purchase 300,000 shares of common stock at $2.98 per share, respectively, exercisable for a period of three years. These warrants were never exercised and expired on May 27, 2011. If the Company had issued shares of common stock or common stock equivalents at a price per share less than the exercise price, the exercise price would have been multiplied by a fraction, the numerator of which would have been the number of shares of common stock outstanding immediately prior to such issuance plus the number of shares of common stock which the offering price for such shares of common stock or common stock equivalents would have purchased at the closing price of the common stock on that date, and the denominator of which would have been the sum of the number of shares of common stock outstanding immediately prior to such issuance plus the number of shares of common stock so issued or issuable. Simultaneously with any adjustment to the exercise price, the number of shares of common stock that could have been purchased upon exercise of the warrants was increased or decreased proportionately, so that after such adjustment the aggregate exercise price payable for the adjusted number of shares would have been the same as the aggregate exercise price in effect immediately prior to such adjustment.
The Company used a Lattice valuation model to measure the fair value of the warrants, and based on the following assumptions, the fair values were as follows:
|
December 31,
|
December 31,
|
|||||||
|
2011
|
2010
|
|||||||
|
Risk free interest rate
|
- | 2.93 | % | |||||
|
Expected life, in years
|
- | 0.41 | ||||||
|
Expected dividend rate
|
- | 0 | % | |||||
|
Volatility
|
- | 67.21 | % | |||||
|
Fair value
|
- | $ | 934,260 | |||||
Changes to the warrant derivative liability are recognized in the results of operations and resulted in derivative gains of $934,260 and $1,588,888 for the years ended December 31, 2011 and 2010, respectively.
Fair value is defined as the exchange price that would be received for an asset or paid to transfer a liability (an exit price) in the principal or most advantageous market for the asset or liability in an orderly transaction between market participants on the measurement date. To measure fair value, a hierarchy has been established which requires an entity to maximize the use of observable inputs and minimize the use of unobservable inputs. This hierarchy uses three levels of inputs to measure the fair value of assets and liabilities as follows: Level 1 – Quoted prices in active markets for identical assets or liabilities. Level 2 – Observable inputs other than Level 1 including quoted prices for similar assets or liabilities, quoted prices in less active markets, or other observable inputs that can be corroborated by observable market data. Level 3 – Unobservable inputs supported by little or no market activity for financial instruments whose value is determined using pricing models, discounted cash flow methodologies, or similar techniques, as well as instruments for which the determination of fair value requires significant management judgment or estimation.
F - 16
CHINA PHARMA HOLDINGS, INC.
NOTES TO CONSOLIDATED FINANCIAL STATEMENTS
FOR THE YEARS ENDED DECEMBER 31, 2011 AND 2010
The Company uses fair value to measure the derivative warrant liability on a recurring basis because fair value is the primary measure for accounting. The Company also uses fair value to measure the value of the banker’s acceptance notes it holds. The Company values its derivative warrants using a valuation method explained
in Note 9
. Banker’s acceptance notes are frequently used in the PRC as payment to vendors and trade at their face amount, which was determined to be their fair value. The Company held the following assets and liabilities recorded at fair value as of December 31, 2011 and 2010:
|
Fair Value Measurements at
|
||||||||||||||||
|
Reporting Date Using
|
||||||||||||||||
|
Description
|
December 31, 2011
|
Level 1
|
Level 2
|
Level 3
|
||||||||||||
|
Banker's acceptance notes
|
$ | 83,512 | $ | - | $ | 83,512 | $ | - | ||||||||
|
Total
|
$ | 83,512 | $ | - | $ | 83,512 | $ | - | ||||||||
|
Fair Value Measurements at
|
||||||||||||||||
|
Reporting Date Using
|
||||||||||||||||
|
Description
|
December 31, 2010
|
Level 1
|
Level 2
|
Level 3
|
||||||||||||
|
Derivatives
|
$ | 934,260 | $ | - | $ | - | $ | 934,260 | ||||||||
|
Total
|
$ | 934,260 | $ | - | $ | - | $ | 934,260 | ||||||||
Preferred and Common Stock
On June 23, 2010, the Company amended its articles of incorporation to increase the total number of authorized common shares from 60,000,000 shares to 95,000,000 shares, and to authorize 5,000,000 shares of preferred stock. The preferred stock may be issued in series with such designations, preferences, stated values, rights, qualifications or limitations as determined solely by the Company’s board of directors.
On November 14, 2010, the Company issued 6,863 shares of common stock to its Chief Financial Officer with a fair value of $21,000 based on the closing market price as of that date of $3.06 per share. The Company recognized compensation expense for the fair value as general and administrative expenses in the accompanying consolidated statement of operations for the year ended December 31, 2010.
Warrants
As of December 31, 2011, the Company had warrants outstanding and exercisable to purchase an aggregate of 150,000 shares of Company's common stock at exercise prices ranging from $3.00 to $3.80 per share, which expire May 16, 2013. At December 31, 2011, the warrants had a weighted-average exercise price of $3.40 per share, a weighted-average remaining contractual life of 1.4 years and a total intrinsic value of $0. Warrants to purchase 200,000 shares of common stock at $2.80 to $3.60 per share expired unexercised during the second quarter of 2011. Warrants to purchase an additional 16,666 shares of common stock at exercise prices ranging from $3.00 to $3.50 expired unexercised during the fourth quarter of 2011.
During the first quarter of 2010, the Company received cash proceeds of $2,583,000 pursuant to the exercise of warrants to purchase 1,085,292 shares of common stock at an exercise price of $2.38 per share. The warrants were issued in conjunction with the Company’s February 1, 2007 Unit Offering. On February 1, 2010, warrants to purchase 88,235 shares of common stock at an exercise price of $2.38 per share expired unexercised.
F - 17
CHINA PHARMA HOLDINGS, INC.
NOTES TO CONSOLIDATED FINANCIAL STATEMENTS
FOR THE YEARS ENDED DECEMBER 31, 2011 AND 2010
On May 17, 2010, the Company issued three-year warrants to purchase 150,000 shares of common stock to a consultant for services rendered. The exercise price is $3.00 per share for 75,000 shares and $3.80 per share for the remaining 75,000 shares. The issue-date fair value of the warrants of $116,993 was recorded as general and administrative expense in the accompanying consolidated financial statements as of the date of issuance. The fair value of the warrants issued was determined using the Black-Scholes Option Pricing Model, using the following assumptions: risk free interest rate of 1.30%, expected dividend yield of 0%, expected volatility of 67.0% and an expected life of three years. The exercise price of the warrants exceeded the market price of the common stock on the date of grant.
Employee Stock Options
2009 Stock Option Plan
On September 2, 2009, the Company’s Board of Directors adopted, and on September 3, 2009 its stockholders approved, the 2009 Stock Option Plan of the Company (the “2009 Option Plan”), which gave the Company the ability to grant stock options and restricted stock to its employees or consultants, or employees or consultants of its subsidiaries and to the non-employee members of its Board of Directors or the board of directors of any of its subsidiaries. The 2009 Option Plan currently allows for awards of stock options and restricted stock for up to 1,000,000 shares of common stock. As of December 31, 2011, options to purchase an aggregate of 300,000 shares of common stock had been granted under the 2009 Option Plan, of which 40,000 have been exercised and 50,000 have failed to vest and have been forfeited. In connection with the adoption of the 2010 Long-Term Incentive Plan of the Company (the “2010 Incentive Plan”) as described in the paragraph below, the Company’s Board of Directors determined that no additional awards of stock options or restricted stock will be made under the 2009 Option Plan, and that the 2009 Option Plan will be terminated following the exercise or expiration of all stock options currently outstanding under such plan.
2010 Incentive Plan
On November 12, 2010, the Company’s Board of Directors adopted, and on December 22, 2010 its stockholders approved, the 2010 Incentive Plan, which gave the Company the ability to grant stock options, restricted (nonvested) stock, stock appreciation rights and performance units to its employees, directors and consultants, or those who will become employees, directors and consultants of the Company and/or its subsidiaries. The 2010 Incentive Plan currently allows for equity awards of up to 4,000,000 shares of common stock.
The Company granted stock options under the 2009 and 2010 Stock Options Plan during the years ended December 31, 2011 and 2010, and recognized $196,184 and $207,423, respectively, of compensation expense as general and administrative expenses related to employee stock options. The total income tax benefit recognized from the related stock-based compensation was $49,046 and $51,856 for the years ended December 31, 2011 and 2010, respectively.
The fair value of each option award is estimated on the date of grant using the Black-Scholes Option Pricing Model using the assumptions noted in the following paragraphs. Expected volatility is based on the historical volatility of the Company’s common stock prices. The Company uses historical data to estimate employee termination rates. The expected term of options granted is determined by the simplified method, which is one-half of the original contractual term. The simplified method is used due to the lack of historical share option exercise data to provide a reasonable basis upon which to estimate expected term. The risk-free rate for periods within the contractual life of the option is based on the U.S. Treasury yield curve in effect at the time of grant.
F - 18
CHINA PHARMA HOLDINGS, INC.
NOTES TO CONSOLIDATED FINANCIAL STATEMENTS
FOR THE YEARS ENDED DECEMBER 31, 2011 AND 2010
On May 25, 2011 the Company issued two-year options to purchase a total of 100,000 shares of its common stock under the 2010 Incentive Plan to two of its executive officers. The Company’s Chief Executive Officer was granted non-qualified stock options to purchase 50,000 shares of common stock at an exercise price of $2.54 per share, the closing price of the Company’s common stock on the day prior to the day of grant, expiring on May 25, 2013, of which 25,000 shares shall vest on May 25, 2012, and 25,000 shares shall vest on the three-month anniversary of the achievement of certain performance-based vesting criteria. The Company also granted its Chief Financial Officer non-qualified stock options to purchase 50,000 shares of common stock at an exercise price of $2.54 per share, the closing price of the Company’s common stock on the day prior to the day of grant, expiring on May 25, 2013, of which 25,000 shares shall vest on April 28, 2012, and 25,000 shares shall vest on the three-month anniversary of the achievement of certain performance-based vesting criteria.
The grant-date fair value of the options of $0.71 per share, or $70,580 in total, was based on the grant-date closing market price of $2.54 per share and on the following weighted-average assumptions: risk free interest rate of 0.54%, expected dividend yield of 0%, expected volatility of 70.4% and an expected life of 1.0 years.
In addition, on May 25, 2011, the Company awarded 125,000 nonvested shares of common stock under the 2010 Incentive Plan to two of its executive officers valued at $317,500 based on the closing market price on the date of grant of $2.54 per share. The nonvested shares vest as follows: 25,000 shares on April 28, 2012, 50,000 shares on May 25, 2012, and 50,000 shares vest on the six-month anniversary of the closing of an offering of securities of the Company for aggregate gross proceeds of at least $20 million by April 27, 2012, provided the officer is employed on that date. The Company is holding the shares, subject to their vesting, and can cancel the shares if they do not vest. Compensation for the 75,000 shares that vest under the service condition is being recognized over the period the shares vest. A total of $127,000 of compensation will be recognized upon the achievement of the vesting criteria for the 50,000 performance-based shares. The Company recognized $119,193 of compensation during the year ended December 31, 2011 relative to the nonvested shares.
On April 28, 2010, the Company granted three-year options to purchase 200,000 shares of common stock under the 2009 Stock Option Plan to an executive officer of the Company. The exercise price is $3.47 per share based on the closing market price for the Company’s common stock as of that date. The options vest one year from the date of grant; however, options to purchase 50,000 shares were forfeitable if performance milestones were not met by December 31, 2010. As of December 31, 2010 the performance milestones were not achieved and the options to purchase 50,000 shares were forfeited. The grant-date fair value of the options of $1.13 per share, or $226,560 in total, which includes $56,640 from the portion that was forfeited, was determined using the following weighted-average assumptions: risk free interest rate of 1.61%, expected dividend yield of 0%, expected volatility of 67.6% and an expected life of 1.5 years. The forfeited portion has not and will not be recognized as compensation.
On October 13, 2009, the Company granted options to purchase 100,000 shares of common stock at an exercise price of $2.75 per share to an officer of the Company under the 2009 Stock Option Plan. The options vest in two equal tranches on April 28, 2010 and September 30, 2010 and expire two years from the respective vesting dates. The exercise price for the options represents 85% of the market price on the date of grant. The grant-date fair value of the option of $1.35 per share, or $134,600 in total, was based on the grant-date closing market price of $3.23 per share and on the following weighted-average assumptions: risk free interest rate of 1.42%, expected dividend yield of 0%, expected volatility of 79.1% and an expected life of 1.4 years.
On November 14, 2010, the Company issued 4,052 shares of common stock to its Chief Financial Officer upon the exercise of 40,000 options to purchase common stock at an exercise price of $2.75 per share. The total intrinsic value of the options exercised was $12,400. The options were exercised on a cashless basis and the exercise price was paid by the officer giving up 35,948 shares of common stock based on the closing market price on the exercise date of $3.06.
A summary of option activity under the 2009 Stock Option Plan and 2010 Incentive Plan as of December 31, 2011 and 2010, and changes during the years then ended is presented below:
F - 19
CHINA PHARMA HOLDINGS, INC.
NOTES TO CONSOLIDATED FINANCIAL STATEMENTS
FOR THE YEARS ENDED DECEMBER 31, 2011 AND 2010
|
Weighted-
|
|||||||||||||||
|
Weighted-
|
Average
|
||||||||||||||
|
Average
|
Remaining
|
Aggregate
|
|||||||||||||
|
Exercise
|
Contractual
|
Intrinsic
|
|||||||||||||
|
Shares
|
Price
|
Term (Years)
|
Value
|
||||||||||||
|
Outstanding at December 31, 2009
|
100,000 | $ | 2.75 | ||||||||||||
|
Granted
|
200,000 | 3.47 | |||||||||||||
|
Exercised
|
(40,000 | ) | 2.75 | ||||||||||||
|
Forfeited
|
(50,000 | ) | 3.47 | ||||||||||||
|
Outstanding at December 31, 2010
|
210,000 | 3.26 | |||||||||||||
|
Granted
|
100,000 | 2.54 | |||||||||||||
|
Exercised
|
- | - | |||||||||||||
|
Forfeited
|
- | - | |||||||||||||
|
Outstanding at December 31, 2011
|
310,000 | $ | 3.03 |
1.22
|
$ |
-
|
|||||||||
|
Exercisable at December 31, 2011
|
210,000 | $ | 3.26 |
1.14
|
$ |
-
|
|||||||||
A summary of the status of the Company’s nonvested shares at December 31, 2011, and changes during the year then ended, is presented below:
|
Weighted-
|
||||||||
|
Average
|
||||||||
|
Grant-Date
|
||||||||
|
Shares
|
Fair Value
|
|||||||
|
Awarded
|
125,000 | $ | 2.54 | |||||
|
Nonvested at December 31, 2011
|
125,000 | $ | 2.54 | |||||
At December 31, 2011, the total remaining unrecognized compensation expense related to stock options was $49,928, of which $14,638 will be recognized in the first half of 2012. In addition, a total of $35,290 will be recognized upon the achievement of certain performance-based vesting criteria. As of December 31, 2011, the aggregate intrinsic value of the options was $0. At December 31, 2011, the total remaining unrecognized compensation expense related to nonvested stock awards was $198,307, of which $71,307 will be recognized in the first half of 2012 and $127,000 will be recognized only upon the achievement of the performance-based vesting criteria. None of the performance-based criteria had been met for the non-qualified stock options and nonvested stock for the year ended December 31, 2011.
Economic environment
-
Substantially all of the Company's operations are conducted in the PRC, and therefore the Company is subject to special considerations and significant risks not typically associated with companies operating in the United States of America. These risks include, among others, the political, economic and legal environments and fluctuations in the foreign currency exchange rate. The Company's results from operations may be adversely affected by changes in the political and social conditions in the PRC, and by changes in governmental policies with respect to laws and regulations, anti-inflationary measures, currency conversion and remittance abroad, and rates and methods of taxation, among other things. The unfavorable changes in global macroeconomic factors may also adversely affect the Company’s operations.
In addition, all of the Company's revenue is denominated in the PRC's currency of Renminbi (RMB), which must be converted into other currencies before remittance out of the PRC. Both the conversion of RMB into foreign currencies and the remittance of foreign currencies abroad require approval of the PRC government.
For the year ended December 31, 2011 and 2010, one customer accounted for 20.4% and 30% of sales, respectively.
At December 31, 2011 and 2010, one customer accounted for 10.2% and 17.0% of accounts receivable, respectively. For the years ended December 31, 2011 and 2010, purchases from one supplier made up 20.8% and 40.0% of raw material purchases, respectively.
F - 20
TABLE OF CONTENTS
Part IItem 1. BusinessItem 1A. Risk FactorsItem 1B. Unresolved Staff CommentsItem 2. PropertiesItem 3. Legal ProceedingsItem 4. Mine Safety DisclosuresPart IIItem 5. Market For Registrant S Common Equity, Related Stockholder Matters and Issuer Purchases Of Equity SecuritiesItem 6. Selected Financial DataItem 7. Management S Discussion and Analysis Of Financial Condition and Results Of OperationsItem 7A. Quantitative and Qualitative Disclosures About Market RiskItem 8. Financial Statements and Supplementary DataItem 9. Changes in and Disagreements with Accountants on Accounting and Financial DisclosureItem 9A. Controls and ProceduresItem 9B. Other InformationPart IIIItem 10. Directors, Executive Officers and Corporate GovernanceItem 11. Executive CompensationItem 12. Security Ownership Of Certain Beneficial Owners and Managementand Related Stockholders MattersItem 13. Certain Relationships and Related Transactions, and Director IndependenceItem 14. Principal Accountant Fees and ServicesPart IVItem 15. Exhibits and Financial Statement SchedulesNote 1 Organization and Significant Accounting PoliciesNote 2 - InventoryNote 3 - Property and EquipmentNote 4 - Intangible AssetsNote 5 Advances For Purchases Of Intangible Asssets and Property and EquipmentNote 6 Related Party TransactionsNote 7 Notes PayableNote 8 - Income TaxesNote 9 Derivative Warrant LiabilityNote 10 Fair Value MeasurementsNote 11 - Stockholders' EquityNote 12 ContingenciesNote 13 Concentrations