CUMBERLAND PHARMACEUTICALS INC
10-Ks and 10-Qs
|
|
|
|
|
|
|
|
|
|
|
|
|
|
|
|
|
|
|
|
|
|
|
|
|
|
|
|
|
|
|
|
|
|
|
|
|
|
|
|
|
|
|
|
|
|
|
|
|
|
|
|
|
UNITED STATES SECURITIES AND EXCHANGE COMMISSION
WASHINGTON, DC 20549
Form 10-K
|
ANNUAL REPORT PURSUANT TO SECTION 13 OR 15(d) OF THE
SECURITIES EXCHANGE ACT OF 1934
|
|
For the fiscal year ended December 31, 2014
|
of
CUMBERLAND PHARMACEUTICALS INC.
A Tennessee Corporation
IRS Employer Identification No. 62-1765329
Commission file number 001-33637
2525 West End Avenue, Suite 950
Nashville, Tennessee 37203
(615) 255-0068
Cumberland Pharmaceuticals Inc. Common Stock, no par value, shares are registered pursuant to Section 12(b) of the Act and are listed on the Nasdaq Global Select Market.
Cumberland Pharmaceuticals Inc. is not a well-known seasoned issuer, as defined in Rule 405 of the Securities Act.
Cumberland Pharmaceuticals Inc. is required to file reports pursuant to Section 13 or Section 15(d) of the Act. Cumberland Pharmaceuticals Inc. (1) has filed all reports required to be filed by Section 13 or 15(d) of the Securities Exchange Act of 1934 during the preceding 12 months, and (2) has been subject to such filing requirements for the past 90 days.
Cumberland Pharmaceuticals Inc. has submitted electronically and posted on its corporate Web site every Interactive Data File required to be submitted and posted pursuant to Rule 405 of Regulation S-T (§232.405 of this chapter) during the preceding 12 months.
Disclosure of delinquent filers pursuant to Item 405 of Regulation S-K (§229.405) will be contained, to the best of registrant’s knowledge, in definitive proxy or information statements incorporated by reference in Part III of this Form 10-K or any amendment to this Form 10-K.
Cumberland Pharmaceuticals Inc. is an non-accelerated filer as defined in Rule 12b-2 of the Exchange Act and is not a shell company.
The aggregate market value of common stock held by non-affiliates as of June 30, 2014 was $
41,739,000
. The number of shares of the registrant’s Common Stock, no par value, outstanding as of March 3, 2015 was
16,968,158
.
DOCUMENTS INCORPORATED BY REFERENCE
Certain information required in Part III of Form 10-K is incorporated by reference from the registrant’s Proxy Statement for its
2015
annual meeting of shareholders.
CUMBERLAND PHARMACEUTICALS INC. AND SUBSIDIARIES
Index
|
Page Number
|
|
THE COMPANY
Cumberland Pharmaceuticals Inc. (“Cumberland,” the “Company,” or as used in the context of “we,” “us,” or “our”), is a specialty pharmaceutical company focused on the acquisition, development and commercialization of branded prescription products. Our primary target markets are hospital acute care and gastroenterology. These medical specialties are characterized by relatively concentrated prescriber bases that we believe can be penetrated effectively by small, targeted sales forces. Cumberland is dedicated to providing innovative products that improve quality of care for patients and address unmet or poorly met medical needs. We market and sell our approved products through our hospital and gastroenterology sales forces in the United States and are establishing a network of international partners to bring our products to patients in their countries.
Our product portfolio includes:
|
•
|
Acetadote
®
(
acetylcysteine
) Injection, for the treatment of acetaminophen poisoning;
|
|
•
|
Caldolor
®
(
ibuprofen
) Injection, for the treatment of pain and fever;
|
|
•
|
Kristalose
®
(
lactulose
) for Oral Solution, a prescription laxative, for the treatment of chronic and acute constipation;
|
|
•
|
Omeclamox
®
-Pak
, (
omeprazole, clarithromycin, amoxicillin
) for the treatment of Helicobacter pylori (
H. pylori
) infection and related duodenal ulcer disease;
|
|
•
|
Vaprisol
®
(
conivaptan
) Injection, to raise serum sodium levels in hospitalized patients with euvolemic and hypervolemic hyponatremia;
|
|
•
|
Hepatoren
®
(
ifetroban
) Injection, a Phase II candidate for the treatment of critically ill hospitalized patients suffering from liver and kidney failure associated with hepatorenal syndrome ("HRS"); and
|
|
•
|
Boxaban™
(ifetroban)
oral capsules, a Phase II candidate for the treatment of patients with aspirin-exacerbated respiratory disease (AERD).
|
We have both product development and commercial capabilities, and believe we can leverage our existing infrastructure to support our expected growth. Our management team consists of pharmaceutical industry veterans experienced in business development, product development, regulatory, manufacturing, sales, marketing and finance. Our business development team identifies, evaluates and negotiates product acquisition, in-licensing and out-licensing opportunities. Our product development team develops proprietary product formulations, manages our clinical trials, prepares all regulatory submissions and manages our medical call center. Our quality and manufacturing professionals oversee the manufacture and release of our products. Our marketing and sales professionals are responsible for our commercial activities, and we work closely with our distribution partners to ensure availability and delivery of our products.
Cumberland's growth strategy involves maximizing the potential of our existing brands while continuing to build a portfolio of differentiated products. We currently market five products approved for sale in the United States. Through our international partners, we are working to bring our products to patients in countries outside the U.S. We also look for opportunities to expand our products into additional patient populations through clinical trials, new indications, and select investigator-initiated studies. We actively pursue opportunities to acquire additional marketed products as well as late-stage development product candidates in our target medical specialties. Further, we are supplementing these activities with the pipeline drug development activities at Cumberland Emerging Technologies ("CET"), our majority-owned subsidiary. CET partners with universities and other research organizations to identify and develop promising, early-stage product candidates, which Cumberland has the opportunity to further develop and commercialize.
1
We were incorporated in 1999 and have been headquartered in Nashville, Tennessee since inception. During 2009, we completed an initial public offering of our common stock and listing on the NASDAQ exchange. Our website address is
www.cumberlandpharma.com
. We make available through our website our Annual Reports on Form 10-K, Quarterly Reports on Form 10-Q, Current Reports on Form 8-K and all other press releases, filings and amendments to those reports as soon as reasonably practicable after their filing with the U.S. Securities and Exchange Commission, (“SEC”). These filings are also available to the public at
www.sec.gov.
PRODUCTS
Our key products include:
|
Products
|
Indication
|
Status
|
||
|
Acetadote
®
|
Acetaminophen Poisoning
|
Marketed
|
||
|
Caldolor
®
|
Pain and Fever
|
Marketed
|
||
|
Kristalose
®
|
Chronic and Acute Constipation
|
Marketed
|
||
|
Omeclamox
®
-Pak
|
H. pylori infection and related Duodenal Ulcer disease
|
Marketed
|
||
|
Vaprisol
®
|
Euvolemic and Hypervolemic Hyponatremia
|
Marketed
|
||
|
Hepatoren
®
|
Hepatorenal Syndrome
|
Phase II
|
||
|
Boxaban
TM
|
Aspirin-Exacerbated Respiratory Disease
|
Phase II
|
||
Acetadote
Acetadote
is an intravenous formulation of N-acetylcysteine, or ("NAC"), indicated for the treatment of acetaminophen poisoning. Acetadote, has been available in the United States since Cumberland's 2004 introduction of the product through our hospital sales force. Acetadote is typically used in hospital emergency departments to prevent or lessen potential liver damage resulting from an overdose of acetaminophen, a common ingredient in many over-the-counter and prescription pain relieving and fever-reducing products. Acetaminophen continues to be the leading cause of poisonings reported by hospital emergency departments in the United States, and Acetadote has become a standard of care for treating this potentially life-threatening condition.
Acetadote received U.S. Food and Drug Administration ("FDA") approval as an orphan drug, which provided seven years of marketing exclusivity from the date of approval. In connection with the FDA's approval of Acetadote, we committed to certain post-marketing activities for the product. Completion of our first Phase IV commitment resulted in the FDA's 2006 approval of expanded labeling for the product for use in pediatric patients. Completion of our second Phase IV commitment in 2006 resulted in further revised labeling for the product with FDA approval of additional safety data in 2008. Completion of our third and final Phase IV commitment in 2010 culminated in the FDA’s approval of a new formulation for the product. The next generation formulation, contains no ethylene diamine tetracetic acid ("EDTA") or other stabilization agent, chelating agent or preservative. In early 2011, Cumberland introduced this new Acetadote formulation replacing the original formulation which we no longer manufacture.
Beginning in 2012, the United States Patent and Trademark Office (the "USPTO") issued us a series of patents associated with our Acetadote product. These patents are discussed in Part I, Item I, "
Business - Trademarks and Patents
" of this Form 10-K. On November 8, 2012, we learned that the FDA approved an abbreviated new drug application (ANDA) filed by InnoPharma, Inc. and referencing Acetadote. That product, with the old formulation containing EDTA, was subsequently introduced by APP, a division of Fresenius Kabi USA, at the end of 2012. In early 2013, we entered into an agreement with Perrigo Company resulting in the distribution of our Authorized Generic acetylcysteine injection (the "Authorized Generic") product. Both Acetadote and our Authorized Generic utilize the
2
new, EDTA-free formulation which accounted for significant market share during 2014. We are seeking additional claims to protect our intellectual property associated with Acetadote through patent applications relating to Acetadote which are pending with the USPTO. We intend to vigorously defend and protect our Acetadote product and related intellectual property rights.
In June 2013, the FDA approved updated labeling for Acetadote revising the product's indication and providing new dosing guidance for specific patient populations. As a result, dosing guidance is now included for patients weighing over 100 kg and new language has been added to alert health care providers that in certain clinical situations, therapy should be extended for some patients.
Caldolor
Caldolor,
our intravenous formulation of ibuprofen, was the first injectable product approved in the United States for the treatment of both pain and fever. We conducted a series of clinical studies in over nine hundred adult patients to develop the data to support our submission for FDA approval. The FDA approved Caldolor for marketing in the United States during the middle portion of 2009 following a priority review. The product is indicated for use in adults for the management of mild to moderate pain, for the management of moderate to severe pain as an adjunct to opioid analgesics, and for the reduction of fever.
In late 2009, we launched Caldolor and stocked the product at major wholesalers serving hospitals nationwide. We initially worked to establish a core group of medical facilities approving and purchasing the product and then focused on building more sales volume and treating a broader range of patients within those stocked facilities. We promote Caldolor in the United States through our dedicated hospital sales force.
We completed a series of Phase IV studies to gather additional data to support our Caldolor product. Those completed studies involved another 1,000 patients. The studies included evaluation of the product for the treatment of pediatric pain and pediatric fever in order to address our Phase IV commitment to the FDA for Caldolor. Also included in these studies were an evaluation of a shortened infusion time for the product and pre-surgical administration. The data from these Phase IV studies, including an updated integrated safety database, was submitted to the FDA in early 2015 with a request for updated labeling for the product. We also continue to pursue and evaluate potential improvements to the product’s packaging.
Kristalose
Kristalose is a prescription laxative administered orally for the treatment of acute and chronic constipation. An innovative, dry powder crystalline formulation of lactulose, Kristalose is designed to enhance patient compliance and acceptance. Kristalose is the only prescription laxative available in pre-measured powder packets. Kristalose dissolves easily in four ounces of water, offering patients a virtually taste-free, grit-free and essentially calorie-free alternative to lactulose syrups. We conducted a preference study which indicated that seventy seven percent of patients surveyed prefer the taste, consistency and portability of Kristalose over similar products in syrup forms.
We acquired exclusive U.S. commercialization rights to Kristalose in 2006, assembled a dedicated field sales force and re-launched the product in September 2006 as a Cumberland brand. We direct our sales efforts to physicians who are the most prolific writers of prescription laxatives, including gastroenterologists and internists. Using the preference data as a cornerstone of our marketing efforts, we have made significant gains following our repositioning of the brand in early 2014. The new marketing strategy includes an enhanced patient coupon program and expanded managed care coverage for the product. As a result of these efforts, Kristalose grew to be our top selling product in 2014.
In late 2011, through a series of transactions, we entered into an agreement with Mylan Inc. to acquire certain assets associated with the Kristalose brand including the Kristalose trademark and the FDA registration. During 2014, we also entered into a long-term supply agreement and new packaging agreements for the product. By entering into these transactions, we streamlined the supply chain for the product and are exploring opportunities to further develop the brand.
3
Omeclamox-Pak
We launched our promotion and distribution efforts to support Omeclamox-Pak in early 2014. Our field sales force promotes Omeclamox-Pak to the gastroenterologist segment, which accounts for the largest component of the prescriber base for this product. Omeclamox-Pak is a branded prescription product used for the treatment of Helicobacter pylori (H. pylori) infection and duodenal ulcer disease. This innovative product combines three well-known and widely prescribed medications: omeprazole, clarithromycin, and amoxicillin. Omeclamox-Pak is the first FDA approved triple therapy combination medication to contain omeprazole as the proton pump inhibitor, which works to decrease the amount of acid the stomach produces. Clarithromycin and amoxicillin are both antibiotic agents which hinder the growth of H. pylori. Interaction of these agents allows the stomach lining to heal effectively. The medications are packaged together on convenient daily dosing cards, making it simple to follow the twice a day dosing before meals.
While there are competing products, Omeclamox-Pak is one of the few actively marketed products for this condition. In addition, compared to the competing branded products, Omeclamox-Pak combines the lowest pill burden and fewest days of therapy. Our involvement with Omeclamox-Pak began in October 2013, through an agreement with Pernix Therapeutics ("Pernix"). Pernix continues to promote the product through its specialty sales force focusing on select primary care physicians. We are responsible for the marketing, sale and distribution of the product.
Vaprisol
In early 2014, we entered into an agreement with Astellas Pharma US, Inc. ("Astellas") to acquire Vaprisol, including certain product rights, intellectual property and related assets. Vaprisol is a patented, prescription brand indicated to raise serum sodium levels in hospitalized patients with euvolemic and hypervolemic hyponatremia. The product was developed and registered by Astellas and then launched in 2006. It is one of two branded prescription products indicated for the treatment of hyponatremia, and the only intravenously administered branded treatment.
Hyponatremia, an imbalance of serum sodium to body water, is the most common electrolyte disorder among hospitalized patients. These electrolyte disturbances occur when the sodium ion concentration in the plasma is lower than normal and are often associated with a variety of critical care conditions including congestive heart failure, liver failure, kidney failure and pneumonia. Vaprisol raises serum sodium to appropriate levels and promotes free water secretion.
We re-launched active promotion of the brand during the middle of 2014 utilizing our hospital sales force, which also features our Caldolor and Acetadote products.
Hepatoren
In 2011, we entered into an agreement to acquire the rights to ifetroban, a new Phase II product candidate. Our acquisition of the rights to the ifetroban program includes an extensive clinical database and non-clinical data package as well as manufacturing processes, know-how and intellectual property. Ifetroban was initially developed by a large pharmaceutical company for significant cardiovascular indications. They conducted extensive studies for their target indications and eventually donated the entire program to Vanderbilt University. Researchers at Vanderbilt identified ifetroban as a potentially valuable compound in treating patients for several niche indications. We acquired the rights to the ifetroban program from Vanderbilt through CET and intend to develop the product for several potential indications.
We have commenced manufacturing of an intravenous formulation of ifetroban and the FDA has cleared our IND application for this product candidate. We have initiated clinical development under the brand name Hepatoren (
ifetroban
) Injection and are evaluating this candidate for the treatment of critically ill hospitalized patients suffering from hepatorenal syndrome ("HRS"), a life-threatening condition involving progressive kidney failure for which there is no U.S. approved pharmaceutical treatment. We would also seek orphan drug status and the associated seven years of marketing exclusivity for this indication.
Boxaban
We have also completed the manufacturing of an oral formulation of ifetroban and the FDA has cleared an IND amendment for this product candidate. We have initiated clinical development under the brand name Boxaban (
ifetroban
) capsules and are evaluating this candidate for patients suffering from aspirin-exacerbated respiratory disease (AERD)
4
a condition for which there is no U.S. approved pharmaceutical treatment. Also known as Samter’s Triad, AERD is a respiratory disease involving chronic asthma and nasal polyposis that is worsened by aspirin or nonsteroidal anti-inflammatory drugs. Approximately one in twenty asthmatic adults in the U.S. suffer from AERD and awareness of the disease is growing within the medical community.
OUR STRATEGY
Continue to build a high-performance sales organization to address our target markets
We believe that our commercial infrastructure can help drive prescription volume and product sales. We currently utilize two distinct sales teams to address our primary target markets: a hospital sales force for the acute care market and a field sales force for the gastroenterology market. We believe that active promotion of our products, supported by non-personal promotional activities developed and implemented by our marketing team, can maximize the opportunity for our brands.
Further develop our existing products and develop new late stage product candidates
We continue to evaluate our products following FDA approval to determine if further clinical work could expand the potential market opportunities for our products and help new patient populations. In addition, we may explore further clinical work that could be used to support our sales and marketing activities and maximize their efforts to further penetrate existing markets. Our clinical team is also working to develop late stage product candidates that could further expand our product portfolio if approved by the FDA.
Expand our product portfolio by acquiring rights to additional products and late-stage product candidates
In addition to our product development activities, we are also seeking to acquire products or late-stage development product candidates to continue to build a portfolio of complementary brands. We focus on under-promoted, FDA-approved drugs as well as late-stage development products that address poorly met medical needs. We plan to continue to target product acquisition candidates that are competitively differentiated, have valuable intellectual property or other protective features, and allow us to leverage our existing infrastructure. The addition of Omeclamox-Pak and Vaprisol reflects our strategy and commitment to selectively expanding our product portfolio as both brands met our acquisition criteria. We will also continue to explore opportunities for label expansion to bring our products to new patient populations.
Expand our global presence through select international partnerships
We have established our own commercial capabilities, including a sales organization to cover the U.S. market for our products. We are building a network of select international partners to register our products and make them available to patients in their countries. We will continue to expand our network of international partners and continue to support our partners’ registration and commercialization efforts in their respective territories.
Develop a pipeline of early-stage products through CET
In order to build our product pipeline, we are supplementing our acquisition and late-stage development activities with the early-stage drug development activities at CET. CET partners with universities and other research organizations to develop promising, early-stage product candidates, and Cumberland has the opportunity to negotiate rights to further develop and commercialize them in the U.S and other markets.
SALES AND MARKETING
Our sales and marketing team has broad industry experience in selling branded pharmaceuticals. Our sales and marketing professionals manage our dedicated hospital and gastroenterology sales forces, including approximately 50 sales representatives and district managers, direct our national marketing campaigns and maintain key national account relationships.
Hospital market:
We promote Caldolor, Vaprisol and Acetadote through our dedicated hospital sales team. This team targets key hospitals across the U.S. and is comprised of sales professionals with substantial experience in the hospital market. Outside market data continues to indicate that the majority of pharmaceutical
5
promotional spending is directed toward large, outpatient markets on drugs intended for chronic use rather than short-term, hospital use. We believe the hospital market is under-served and highly concentrated, and that it can be penetrated effectively by a small, dedicated sales force without large-scale promotional activity. Our position within the acute care market and existing hospital sales team provided the rationale for adding Vaprisol as a third acute care product. Our strategy has been to increase the focus of our hospital sales team on targeted, high priority accounts.
Gastroenterology market:
We promote Kristalose and Omeclamox-Pak through a dedicated field sales team addressing a targeted group of physicians who are responsible for a majority of total retail prescriptions for both products. Because the market for gastrointestinal diseases is broad in patient scope, yet relatively narrow in physician base, we believe it provides product opportunities that can be penetrated with a modest sized sales force. By investing in our sales and marketing activities we believe that we can increase market share for both products. Our focus on the gastroenterology market and our existing field sales infrastructure provided us with the rationale to add Omeclamox-Pak. Our field sales force now features both Kristalose and Omeclamox-Pak during most of their physician calls, expanding our presence in the gastroenterology market.
Our sales and marketing executives conduct ongoing market analysis to evaluate marketing campaigns and promotional programs. The evaluations include development of product profiles, testing of the profiles against the needs of the market, determining what additional product information or development work is needed to effectively market the products and preparing financial forecasts. We utilize professional branding and packaging as well as promotional items to support our products, including direct mail, sales brochures, journal advertising, educational and reminder leave-behinds, patient educational pieces and product sampling. We also regularly attend targeted trade shows to promote broad awareness of our products. Our national accounts group is responsible for key large buyers and related marketing programs. This group supports sales and marketing efforts by maintaining relationships with our wholesaler customers as well as with third-party payors such as group purchasing organizations, pharmacy benefit managers, hospital buying groups, state and federal government purchasers and health insurance companies.
INTERNATIONAL PARTNERSHIPS
We have established our own capabilities to support the commercialization of our products in the U.S. Our international strategy is to identify and partner with other companies that have the appropriate capabilities to support our products in their respective countries. We have entered into a series of agreements to establish a network, which is summarized in the table below, which includes information on the company, licensed product, territory and status:
6
|
International Partner
|
Product(s)
|
Territory
|
Status
|
||||
|
Phebra Pty Ltd
|
Acetadote
|
Australia and New Zealand
|
Marketed
|
||||
|
Alveda Pharmaceuticals, Inc.
|
Caldolor
|
Canada
|
Marketed
|
||||
|
DB Pharm Korea Co., Ltd.
|
Caldolor
|
South Korea
|
Marketed
|
||||
|
Alliance Pharm PTE Ltd.
|
Vaprisol
|
Singapore
|
Distributing
|
||||
|
bioCSL Pty Ltd
|
Caldolor
|
Australia and New Zealand
|
Approved
|
||||
|
Sandor Medicaids Pvt. Ltd.
|
Caldolor
|
India
|
Registration
|
||||
|
GerminMED
|
Caldolor & Acetadote
|
Qatar and Arabian Peninsula
|
Registration
|
||||
|
PT. SOHO Industri Pharmasi
|
Caldolor
|
Pacific Rim
|
Registration
|
||||
|
PT. ETHICA Industri Farmasi
|
Caldolor
|
Indonesia
|
Registration
|
||||
|
Laboratorios Grifols, S.A.
|
Caldolor
|
Spain, Portugal and the majority of South America
|
Development
|
||||
|
Gloria Pharmaceuticals Co. Ltd.
|
Caldolor & Acetadote
|
China
|
Development
|
||||
|
Clinigen Healthcare Limited
|
Vaprisol
|
Most territories outside the U.S. and Singapore
|
Pending
|
||||
|
Laboratorios Valmorca, C.A.
|
Caldolor
|
Venezuela
|
Registration
|
||||
|
Al-Nabil International Ltd.
|
Caldolor & Acetadote
|
U.A.E. (Dubai)
|
Registration
|
||||
Our international commercialization agreements include a license to one or more Cumberland products for a specific territory as noted in the table above. We seek partners who have the local infrastructure to support the registration and commercialization of our products in their territory.
Under the terms of our agreements our partners are responsible for:
|
•
|
Seeking regulatory approvals for the products;
|
|
•
|
Launching the brand;
|
|
•
|
Managing the ongoing marketing, sales and product distribution;
|
|
•
|
Addressing the ongoing regulatory requirements in the international territories;
|
|
•
|
Remitting any upfront, regulatory and sales milestone payments;
|
|
•
|
Providing the transfer price for supplies of product; and
|
|
•
|
Calculating and paying any royalties, as applicable.
|
Our responsibilities include:
|
•
|
Providing a dossier of relevant information to support product registration;
|
|
•
|
Maintaining our intellectual property associated with the product;
|
|
•
|
Sharing our marketing strategy, experience and materials for the brand; and
|
|
•
|
Manufacturing and providing finished product for sale.
|
We are currently working to support our existing international partners and to identify other companies to represent our products in select additional territories.
CLINICAL AND REGULATORY AFFAIRS
We have in-house capabilities for the management of our clinical, professional and regulatory affairs. Our team develops and manages our clinical trials, prepares regulatory submissions, manages ongoing product-related regulatory responsibilities and manages our medical information call center. Team members have been responsible for devising the regulatory and clinical strategies for all our products as well as obtaining FDA approvals for Acetadote and Caldolor.
7
Clinical development
Our clinical development personnel are responsible for:
|
•
|
creating clinical development strategies;
|
|
•
|
designing, implementing and monitoring our clinical trials; and
|
|
•
|
creating case report forms and other study-related documents.
|
Regulatory and quality affairs
Our internal regulatory and quality affairs team is responsible for:
|
•
|
preparing and submitting INDs for clearance to begin patient studies;
|
|
•
|
preparing and submitting NDAs and fulfilling post-approval marketing commitments;
|
|
•
|
maintaining investigational and marketing applications through the submission of appropriate reports;
|
|
•
|
submitting supplemental applications for additional label indications, product line extensions and manufacturing improvements;
|
|
•
|
evaluating regulatory risk profiles for product acquisition candidates, including compliance with manufacturing, labeling, distribution and marketing regulations;
|
|
•
|
monitoring applicable third-party service providers for quality and compliance with current Good Manufacturing Practices ("GMPs"), Good Laboratory Practices ("GLPs"), and Good Clinical Practices ("GCPs"), and performing periodic audits of such vendors; and
|
|
•
|
maintaining systems for document control, product and process change control, customer complaint handling, product stability studies and annual drug product reviews.
|
PROFESSIONAL AND MEDICAL AFFAIRS
Our medical team provides in-house, medical information support for our marketed products. This includes interacting directly with healthcare professionals to address any product or medical inquiries through our medical information call center and medical science liaisons. In addition to coordinating the call center, our clinical/regulatory group generates medical information letters, provides informational memos to our sales forces and assists with ongoing training for the sales forces.
CLINICAL DEVELOPMENT
Caldolor Safety Summary
Extensive use and worldwide literature support the strong safety profile of oral ibuprofen. Building on the oral safety profile, we have assembled an integrated intravenous ibuprofen safety database combining data from our clinical trials as well as previously published study data. We used this data to support our NDA filing and continue to use and update the data as a part of our ongoing safety evaluation. We continue to use this data in our marketing materials and to support our sales force in promoting Caldolor.
In clinical trials supporting our proposed indications, the number and percentage of all patients in pivotal studies who reported treatment emergent adverse events was comparable between IV ibuprofen and placebo treatment groups. Additionally, there have been no safety related differences between Caldolor and placebo involving side effects sometimes observed with oral Nonsteroidal Anti-Inflammatory Drugs ("NSAIDs"), such as changes in renal function, bleeding events or gastrointestinal disorders.
Publication of Caldolor Shortened Infusion Time Studies
In January 2015,
Clinical Therapeutics, The International Peer-Reviewed Journal of Drug Therapy
, published two articles with data from two Caldolor (
ibuprofen
) registry studies. One study entitled, "
A Multicenter, Open-Label,
8
Surgical Surveillance Trial to Evaluate Safety and Efficacy"
provided for
eligible enrolled patients to receive one of two dose strengths (400 mg for treatment of fever, 800 mg for treatment of pain) of intravenous ibuprofen for up to a 24-hour dosing period. One hundred fifty patients from thirteen clinical sites were enrolled in this study. Intravenous ibuprofen reduced fever and pain and the shortened infusion time was well tolerated.
The other registry study entitled
"A Multicenter, Open-Label, Surgical Surveillance Trial to Evaluate Safety"
was a Phase IV multi-center, open-label surveillance clinical study to assess the safety of ibuprofen administered intravenously over five to ten minutes to adult hospitalized patients undergoing surgical procedures. Eligible patients were enrolled to receive 800 mg of intravenous ibuprofen administered at induction of anesthesia and could continue Caldolor therapy for up to 24 hours. Three hundred patients from twenty one clinical sites were enrolled in this study. The shortened infusion time was well tolerated.
Publication of Caldolor Pediatric Pain Study
Data from our Caldolor (
ibuprofen
) pediatric pain study was published in the May 2014 edition of
Pediatric Anesthesia.
The study was a multi-center, randomized, double-blind placebo-controlled, single dose trial of the safety and efficacy of intravenous ibuprofen for treatment of pain in pediatric patients undergoing tonsillectomy. The objective of the study was to determine whether administration of Caldolor prior to pediatric tonsillectomy surgery can significantly decrease the number of doses of narcotic following surgery when compared with placebo.
During the study a total of 161 pediatric patients undergoing tonsillectomy, ranging in age from 6 years to 17 years, were randomized to receive either a single dose of Caldolor or placebo prior to surgery. Postoperative pain was managed with intravenous narcotic on an as needed basis based on the visual analog scale (VAS) as well as deemed appropriate by the recovery room nurses and physicians. The primary endpoint was the number of doses and amount of narcotic administered following surgery.
The pediatric study indicated that there was a significant reduction in the number of postoperative doses and the amount of narcotic administered after surgery in the group that was administered Caldolor compared with the placebo group. There were no differences in the time to the first analgesia request or the number of patients who required analgesia after surgery. There were no significant differences in the incidence of serious adverse events. The study concluded that the administration of Caldolor significantly reduced narcotic use in pediatric tonsillectomy patients.
Caldolor Laparoscopic Cholecystectomy Presentation
Data from the Caldolor study reflects that treatment with preoperative intravenous ibuprofen improved overall quality of recovery in patients undergoing laparoscopic cholecystectomy surgery. These results were presented as a poster presentation entitled
"The Effect of Preoperative Administration of IV Ibuprofen on Stress Response in Patients Undergoing Laparoscopic Cholecystectomy"
in October 2014 at the American Anesthesiology 2014 Annual Meeting in New Orleans, Louisiana.
The investigator study was completed at the University of Medicine and Dentistry of New Jersey/Rutgers University and New York Methodist with Alex Bekker, MD, PhD, as the primary investigator. The study concluded that preoperative intravenous ibuprofen improved the overall quality of recovery including comfort, emotion and pain and reduced fatigue in the early postoperative period. Further, the study results indicated that preoperative administration of intravenous ibuprofen decreased the stress hormones catecholamines and cortisol postoperatively after laparoscopic cholecystectomy.
Caldolor Pediatric Fever Study Presentations
During October 2014, data from our Caldolor pediatric fever study that demonstrated treatment with intravenous ibuprofen was superior in reducing temperatures in hospitalized, febrile pediatric patients when compared to treatment with oral or suppository acetaminophen was presented as part of the American Academy of Pediatrics National Conference & Exhibition in San Diego, California. An abstract presentation entitled “
A Multi-Center, Open-Label, Parallel, Active-Comparator Trial to Determine the Efficacy and Safety of Intravenous Ibuprofen in Pediatric Patients
” was presented by Dr. Corrie Chumpitazi of Texas Children's Hospital, Houston, Texas. The abstract was presented in the section of Emergency Medicine and again in the section on Pharmacy and Therapeutics.
9
The study was designed to evaluate the safety and efficacy in IV ibuprofen when compared to oral or suppository acetaminophen in the treatment of hospitalized, febrile pediatric patients. The study showed that when given intravenous ibuprofen hospitalized children experienced significant reduction in temperature compared to those receiving acetaminophen (oral or suppository). Both single and multiple does of IV ibuprofen were well tolerated and no significant adverse events were noted.
A poster presentation entitled
"A Multi-Center, Randomized, Open-label, Parallel, Active-Comparator Trial to Determine the Efficacy and Safety of Intravenous Ibuprofen in Pediatric children"
was also presented twice at this National Conference. The mission of the American Academy of Pediatrics is to attain optimal physical, mental, and social health and well-being for all infants, children, adolescents and young adults.
During March 2014, data from our Caldolor pediatric fever study was presented at the Society of Pediatric Anesthesiology meeting in Ft. Lauderdale, Florida. The presentation entitled “
A Multi-Center, Open-Label, Parallel, Active-Comparator, Multiple Dose Trial to Determine the Efficacy, Safety, and Pharmacokinetics of Intravenous Ibuprofen in Pediatric Patients
” was presented by Dr. Samia N. Khalil, M.D., Department of Anesthesiology, the University of Texas Medical School at Houston. The meeting was co-sponsored by the Society for Pediatric Anesthesia and the American Academy of Pediatrics Section on Anesthesiology and Pain Medicine.
The pediatric study met its primary endpoint demonstrating that Caldolor was associated with a statistically significant reduction in temperature within the first 2 hours of dosing when compared to acetaminophen. Equally important, no safety concerns were observed during the study. During the study, febrile hospitalized children ranging in age from less than 1 year to 16 years, were administered Caldolor injection or oral or rectal acetaminophen as a single or multiple dose therapy for up to five days. One hundred and three patients were enrolled in this multi-center, randomized, open-label active comparator study. The pediatric patients received either 10 mg/kg intravenous ibuprofen (not to exceed 400 mg per dose) or 10 mg/kg acetaminophen (not to exceed 650 mg per dose).
Caldolor Continuing Education
We have extended the availability of a web-based, accredited, continuing education seminar featuring the benefits of preoperative use of Caldolor in the hospital setting. The seminar has been distributed to over 60,000 health providers with a growing number of participants completing the seminar for continuing education credit.
Hepatoren Study
We continue to evaluate Hepatoren as a treatment for hepatorenal syndrome - a life threatening condition, with a high mortality rate and no approved treatment in this country. We have an ongoing sixty four patient study to evaluate the safety, efficacy and pharmacokinetics of Hepatoren for this unmet medical need. The study is stratified based upon disease type, either Type I or Type II HRS. Enrollment of Type I patients continues at major medical centers with Type II enrollment completed at the end of 2014.
The study is designed to evaluate escalating dose levels of Hepatoren in Type II patients. Progression to higher dose levels is reviewed and approved by an independent safety committee. Top line results from the Type II patients indicate that Hepatoren was overall well tolerated with no safety concerns noted. Furthermore, the patients receiving the higher dose levels of Hepatoren were more likely to experience increases in urine output, a signal of improved kidney function, compared to patients who received placebo. Based on these results, we will proceed with clinical development of this product candidate.
Boxaban Study
We have initiated Phase II clinical study to evaluate Boxaban in patients suffering from aspirin-exacerbated respiratory disease (AERD). The study is designed to gather initial safety and tolerability data on ifetroban in AERD patients. It is a multicenter study of sixteen patients with enrollment underway at several U.S. medical centers including the Scripps Clinic.
BUSINESS DEVELOPMENT
Since inception, we have had an active business development program focused on acquiring rights to marketed products and product candidates that fit our strategy and target markets. We source business development opportunities
10
through our international network of advisory firms and individual pharmaceutical industry and medical advisors. A multi-disciplinary internal management team reviews these opportunities on a regular basis using a list of selection criteria. We have historically focused on product opportunities that are a strategic fit with our commercial organization, development expertise and medical focus, employing a variety of transaction structures. Our additions of Omeclamox-Pak and Vaprisol reflect our business development process and follow our selection criteria.
We intend to continue to build a portfolio of complementary, niche products largely through product acquisitions and late-stage product development. Our primary targets are under-promoted, FDA-approved drugs with existing brand recognition and late-stage development product candidates that address unmet or poorly met medical needs in the hospital acute care and gastroenterology markets. We believe that by focusing mainly on approved or late-stage products, we can minimize the significant risk, cost and time associated with drug development.
CET Collaboration
Through CET, we collaborate with a select group of academic research institutions located in the mid-south region of the U.S. Our business development team is responsible for identifying appropriate CET product candidates and negotiating with our university partners to secure rights to these candidates. Although we believe that these collaborations may be important to our business in the future, they are not material to our business at this time.
CET currently has five collaboration agreements with Universities to co-develop promising biomedical technologies, including: Vanderbilt University, Washington University, the University of Virginia, the University of Tennessee and the University of Mississippi.
These agreements allow us to play an important role in fostering and shaping early-stage biomedical research to improve patient care and provide CET and Cumberland with access to promising pipeline candidates such as Hepatoren and Boxaban.
During the third quarter of 2014, we received a grant from the National Institutes of Health through its Small Business Technology Transfer ("STTR") grant program. The STTR program provides federal funding for innovative research and development by expanding partnerships between businesses and nonprofit research institutions. The STTR program provides for formal collaboration between a research institution and a business to ensure that the related science and technology results in the successful commercialization of the scientific innovations. The STTR grant is in conjunction with Vanderbilt University School of Medicine.
CET Financing
In 2014, we organized an equity financing to recapitalize and strengthen the financial position of CET. This financing included an investment of approximately $1.0 million from Harbin Gloria Pharmaceuticals Co., Ltd. (“Gloria”) for their participation in CET. As a result, Gloria received shares in CET and joined the CET ownership group. As part of this transaction, Gloria will have the first right to negotiate a license to CET developed products for the Chinese market. The funds from this new investment are being used to support and accelerate the development of CET product candidates. CET’s lead product candidate is ifetroban which is being developed by Cumberland under the brand names Hepatoren and Boxaban.
Prior to April 2014, we owned 85% of CET, with the balance of the enterprise owned by Vanderbilt University and the Tennessee Technology Development Corporation. In connection with Gloria’s investment in CET, we also provided an additional investment in CET of $1.0 million in cash and $2.4 million in loan forgiveness. Upon completion of the additional investment by Gloria and Cumberland in April 2014, we held an 80% ownership in CET.
MANUFACTURING AND DISTRIBUTION
We partner with third parties for certain non-core, capital-intensive functions, including manufacturing and distribution. Our executives are experienced in these areas and manage these third-party relationships with a focus on quality assurance and timely delivery.
11
Manufacturing
Our key manufacturing relationships include:
Caldolor
|
•
|
During 2013, we entered into agreements with three international manufacturers for the commercial supply of Caldolor. We have successfully transferred the Caldolor manufacturing process to two of these manufacturers and these two suppliers have manufactured validation inventory under these agreements.
|
Acetadote
|
•
|
During the fourth quarter of 2014, we entered into an agreement with a U.S. based manufacturer to supply our Acetadote product. We are working to transfer the Acetadote manufacturing process to this supplier under this new agreement following the conclusion of manufacturing from our original supplier during 2014.
|
Kristalose
|
•
|
During 2014, we finalized an agreement for the purchase of Kristalose API with our international supplier. This written agreement formalized and extended our existing relationship with this raw materials manufacturer. We also entered into manufacturing relationships with two Kristalose packagers during 2014. Under these agreements, we provide Kristalose API to these manufactures and they package the API (for both commercial sale and samples) into 10 gram and 20 gram finished product units for our purchase and distribution. We ended an agreement with our previous packager during 2014.
|
Omeclamox-Pak
|
•
|
Under the agreement we signed with Pernix, they are responsible for providing Omeclamox-Pak inventory. During 2014, we experienced a temporary shortage of Omeclamox-Pak marketable inventory which was remedied during the year.
|
Vaprisol
|
•
|
As part of the acquisition of Vaprisol, we purchased an existing supply of finished goods and raw material inventory. In addition, as part of this transaction, we were assigned a commercial supply agreement with the manufacturer Astellas used to prepare, package, inspect and label Vaprisol.
|
Distribution
Like many other pharmaceutical companies, we engage a third party contractor with appropriate facilities and logistical expertise to support our distribution efforts. Since August 2002, Cardinal Health ("Cardinal") has exclusively handled U.S. product logistics efforts, including warehousing, shipping, customer billing and collections.
We extended our distribution relationship with Cardinal during May 2013, when we entered into the First Amendment ("First Amendment") to the Exclusive Distribution Agreement under which we have operated since August 2010. The Amendment primarily serves to extend the term of the Agreement through June 30, 2016 and revises the fee schedule under the Agreement. Under the Amendment, we have also engaged Cardinal to assist with our physician sample orders based on the Prescription Drug Marketing Act of 1987 (the “PDMA”) for samples shipping. After June 30, 2016, the contract is automatically renewed on a year-to-year basis that is terminable by either party with ninety days' notice. Under the Amendment and Agreement, Cardinal agrees to provide various services, including storage, distribution, returns, customer support, and system access support to us in connection with the distribution of our products under certain guidelines at established fees.
TRADEMARKS AND PATENTS
We own all the trademarks for each of our branded pharmaceutical products as well as for our corporate name and logo. We have applied for trademark registration for various other names and logos. Over time, we intend to maintain registrations on trademarks that remain valuable to our business.
We seek to protect our products from competition through a combination of patents, trademarks, trade secrets, FDA exclusivity and contractual restrictions on disclosure. Proprietary rights, including patents, are an important element of our business. We seek to protect our proprietary information by requiring our employees, consultants, contractors and other advisors to execute agreements providing for protection of our confidential information upon commencement of their employment or engagement. We also require confidentiality agreements from entities that receive our confidential data or materials.
12
Acetadote and related litigation
We developed a new formulation of Acetadote (acetylcysteine) Injection as part of a Phase IV commitment in response to a request by the FDA to evaluate the reduction of EDTA from the product's formulation. In April 2012, the USPTO issued U.S. Patent number 8,148,356 (the “356 Acetadote Patent”) which is assigned to us. The claims of the 356 Acetadote Patent encompasses the Acetadote formulation and includes composition of matter claims. Following its issuance, the 356 Acetadote Patent was listed in the FDA Orange Book. The 356 Acetadote Patent is scheduled to expire in May 2026, which time period includes a 270-day patent term adjustment granted by the USPTO.
Following the issuance of the 356 Acetadote Patent, we received separate Paragraph IV certification notices from InnoPharma, Inc. ("InnoPharma"), Paddock Laboratories, LLC (“Paddock”), Mylan Institutional LLC (“Mylan”), Sagent Agila LLC ("Sagent") and Perrigo Company ("Perrigo") challenging the 356 Acetadote Patent on the basis of non-infringement and/or invalidity. We responded by filing five separate infringement lawsuits, in the appropriate United States District Courts, to contest each of the challenges.
On November 12, 2012, we entered into a Settlement Agreement (the “Settlement Agreement”) with Paddock and Perrigo to resolve the challenges and the pending litigation with those two companies. On November 1, 2013, the United States District Court filed opinions granting Sagent’s and InnoPharma’s motions to dismiss our suits and we agreed not to file an appeal or motion to reconsider, thereby resolving the challenges and the pending litigation with those two companies. The remaining infringement suit with Mylan is pending.
Under the Settlement Agreement, Paddock and Perrigo admit that the 356 Acetadote Patent is valid and enforceable and that any Paddock or Perrigo generic Acetadote product (with or without EDTA) would infringe upon the 356 Acetadote Patent. In addition, Paddock and Perrigo will not challenge the validity, enforceability, ownership or patentability of the 356 Acetadote Patent through its expiration currently scheduled for May 2026. On November 12, 2012, in connection with the execution of the Settlement Agreement, we entered into a License and Supply Agreement with Paddock and Perrigo (the “License and Supply Agreement”). Under the terms of the License and Supply Agreement, once a third party receives final approval from the FDA for an ANDA to sell a generic Acetadote product and such third party made such generic version available for purchase in commercial quantities in the United States, we supply Perrigo with an Authorized Generic version of our Acetadote product.
On May 18, 2012, we also submitted a Citizen Petition to the FDA requesting that the FDA refrain from approving any applications for acetylcysteine injection that contain EDTA, based in part on the FDA's request that we evaluate the reduction or removal of EDTA from its original Acetadote formulation. On November 7, 2012, the FDA responded to the Citizen Petition denying our request and on November 8, 2012, we learned that the FDA approved the ANDA referencing Acetadote filed by InnoPharma, Inc. We brought suit against the FDA contesting the FDA's decision to approve the InnoPharma generic on November 13, 2012. On September 30, 2013, the United States District Court filed an opinion granting a summary judgment in favor of the FDA regarding this suit.
As noted above, during 2012 the FDA approved the ANDA referencing Acetadote filed by InnoPharma, Inc. Upon this condition, in accordance with the License and Supply agreement with Perrigo, we began to supply Perrigo with our Authorized Generic. On January 7, 2013, Perrigo announced initial distribution of our Authorized Generic acetylcysteine injection product.
On March 19, 2013, the USPTO issued U.S. Patent number 8,399,445 (the “445 Acetadote Patent”) which is assigned to us. The claims of the 445 Acetadote Patent encompass the use of the 200 mg/ml Acetadote formulation to treat patients with acetaminophen overdose. On April 8, 2013, the 445 Acetadote Patent was listed in the FDA Orange Book. The 445 Acetadote Patent is scheduled to expire in August 2025. Following the issuance of the 445 Acetadote Patent we received separate Paragraph IV certification notices from Perrigo, Sagent Pharmaceuticals, Inc., and Mylan challenging the 445 Acetadote Patent on the basis of non-infringement, unenforceability and/or invalidity.
13
On June 10, 2013, we became aware of a Paragraph IV certification notice from Akorn, Inc. challenging the 445 Acetadote Patent and the 356 Acetadote Patent on the basis of non-infringement. On July 12, 2013, we filed a lawsuit for infringement of the 356 Acetadote Patent against Akorn, Inc. in United States District Court.
On February18, 2014, the USPTO issued U.S. Patent number 8,653,061 (the “061 Acetadote Patent”) which is assigned to the Company. The claims of the 061 Acetadote Patent encompass the use of the 200 mg/ml Acetadote formulation to treat patients with acetaminophen overdose. Following its issuance, the 061 Acetadote Patent was listed in the FDA Orange Book. The 061 Acetadote Patent is scheduled to expire in August 2025.
On May 13, 2014, the USPTO issued U.S. Patent number 8,722,738 (the “738 Acetadote Patent”) which is assigned to Cumberland. The claims of the 738 Acetadote Patent encompass administration methods of acetylcysteine injection, without specification of the presence or lack of EDTA in the injection. Following its issuance, the 738 Acetadote Patent was listed in the FDA Orange Book and it is scheduled to expire in April 2032.
On December 11, 2014 and March 3, 2015, the Company became aware of Paragraph IV certification notices from Aurobindo Pharma Limited and Zydus Pharmaceuticals (USA) Inc., respectively, challenging the 356, 445, 061, and 738 Acetadote Patents on the basis of non-infringement.
We are considering our legal options and intend to continue to vigorously defend and protect our Acetadote product and related intellectual property rights.
We also have additional patent applications relating to Acetadote which are pending with the USPTO.
Caldolor
We are the owner of U.S. Patent No. 6,727,286, which is directed to ibuprofen solution formulations, methods of making the same, and methods of using the same, and which expires in 2021. This U.S. patent is associated with our completed international application No. PCT/US01/42894. We have filed for international patent protection in association with this PCT application in various countries, some of which have been allowed and some of which remain pending.
We have an exclusive, worldwide license to clinical data for intravenous ibuprofen from Vanderbilt University, in consideration for royalty obligations related to Caldolor. During 2014, we obtained additional patents for the brand. On May 27, 2014, the USPTO issued U.S. Patent number 8,735,452 (the “452 Caldolor Patent”)
which is assigned to us. The claims of the 452 Caldolor Patent encompass methods of treating pain using intravenous ibuprofen. Following its issuance, the 452 Caldolor Patent was listed in the FDA Orange Book and is scheduled to expire in September 2029.
On October 28, 2014, the USPTO issued U.S. Patent number 8,871,810 (the “810 Caldolor Patent”)
which is assigned to us. The claims of the 810 Caldolor Patent encompass methods of treating pain using intravenous ibuprofen. Following its issuance, the 810 Caldolor Patent was listed in the FDA Orange Book and is scheduled to expire in September 2029. We also have additional patent applications related to Caldolor which are pending with the USPTO.
COMPETITION
The pharmaceutical industry is characterized by intense competition and rapid innovation. Our continued success in developing and commercializing pharmaceutical products will depend, in part, upon our ability to compete against existing and future products in our target markets. Competitive factors directly affecting our markets include but are not limited to:
|
•
|
product attributes such as efficacy, safety, ease-of-use and cost-effectiveness;
|
|
•
|
brand awareness and recognition driven by sales, marketing and distribution capabilities;
|
|
•
|
intellectual property and other exclusivity rights;
|
|
•
|
availability of resources to build and maintain developmental and commercial capabilities;
|
14
|
•
|
successful business development activities;
|
|
•
|
extent of third-party reimbursements; and
|
|
•
|
establishment of advantageous collaborations to conduct development, manufacturing or commercialization efforts.
|
A number of our competitors possess research and development and sales and marketing capabilities as well as financial resources greater than ours. These competitors, in addition to emerging companies and academic research institutions, may be developing, or in the future could develop, new technologies that could compete with our current and future products or render our products obsolete.
Acetadote
Acetadote is our injectable formulation of NAC for the treatment of acetaminophen overdose. NAC is accepted worldwide as the standard of care for acetaminophen overdose. Our competitors in the acetaminophen overdose market are those companies selling orally administered NAC including, but not limited to, Geneva Pharmaceuticals, Inc., Bedford Laboratories division of Ben Venue Laboratories, Inc., Roxane Laboratories, Inc., InnoPharma Inc. and Hospira Inc.
In November 2012, InnoPharma Inc. was granted approval by the FDA to distribute their generic form of the old formulation of Acetadote containing EDTA. In late 2012, we entered into the Settlement Agreement with Paddock and Perrigo that included the right to distribute our Authorized Generic Acetadote injection product. Our branded Acetadote now competes with both the EDTA free Authorized Generic Acetadote distributed by Paddock and Perrigo along with generic Acetadote that contains EDTA.
Caldolor
Caldolor is marketed for the treatment of pain and fever, primarily in a hospital setting. A variety of other products address the acute pain market:
|
•
|
Morphine, the most commonly used product for the treatment of acute, post-operative pain, is manufactured and distributed by several generic pharmaceutical companies;
|
|
•
|
Other generic injectable opioids, including fentanyl, meperidine and hydromorphone, address this market;
|
|
•
|
Ketorolac (brand name Toradol
®
), an injectable NSAID, is also manufactured and distributed by several generic pharmaceutical companies;
|
|
•
|
Ofirmev
®
, an injectable acetaminophen product is marketed by Mallinckrodt plc;
|
|
•
|
Exparel
®
, a bupivacaine delivery platform marketed by Pacira Pharmaceuticals, Inc; and
|
|
•
|
Dyloject, an injectable diclofenac product recently FDA approved and manufactured by Hospira, Inc.
|
We are aware of other product candidates in development to treat acute pain including injectable NSAIDs, novel opioids, new formulations of existing therapies and extended release anesthetics. We believe non-narcotic analgesics for the treatment of post-surgical pain are the primary potential competitors to Caldolor.
In addition to the injectable analgesic products above, many companies are developing analgesics for specific indications such as migraine and neuropathic pain, oral extended-release forms of existing narcotic and non-narcotic products, and products with new methods of delivery such as transdermal. We are not aware of any approved injectable products indicated for the treatment of fever in the U.S. other than Caldolor and Ofirmev. There are, however, numerous drugs available to physicians to reduce fevers in hospital settings via oral administration to the patient, including ibuprofen, acetaminophen, and aspirin. These drugs are manufactured by numerous pharmaceutical companies.
15
Kristalose
Kristalose is a dry powder crystalline prescription formulation of lactulose indicated for the treatment of constipation. The U.S. constipation therapy market includes various prescription and over the counter, or OTC, products. The prescription products which we believe are our primary competitors are:
|
•
|
Amitiza
®
, an oral product indicated for the treatment of chronic idiopathic constipation in adults, and is marketed by Sucampo Pharmaceuticals Inc. and Takeda Pharmaceutical Company Limited.
|
|
•
|
Linzess
®
, an oral product indicated for the treatment of irritable bowel syndrome with constipation and chronic idiopathic constipation. It is marketed by Forest Laboratories, Inc. and Ironwood Pharmaceuticals, Inc; and
|
|
•
|
Liquid lactulose products are marketed by a number of pharmaceutical companies.
|
There are several hundred OTC products used to treat constipation marketed by numerous pharmaceutical and consumer health companies. MiraLax (polyethylene glycol 3350), previously a prescription product, was indicated for the treatment of constipation and manufactured and marketed by Braintree Laboratories, Inc. Under an agreement with Braintree, Schering-Plough introduced MiraLax as an OTC product in February 2007.
Omeclamox-Pak
Omeclamox-Pak is a branded prescription product used for the treatment of Helicobacter pylori (H. pylori) infection and duodenal ulcer disease. It combines three well-known and widely prescribed medications packaged together for patient convenience: omeprazole, clarithromycin, and amoxicillin. The three individual components of Omeclamox-Pak are also available through three separate prescriptions. While there are several competitor products, Omeclamox-Pak is one of the few actively marketed products for this condition. In addition, compared to the branded competing products, Omeclamox-Pak has the lowest pill burden, fewest days of therapy and the lowest cost. The prescription combination products, indicated for treatment of H. pylori, which we believe are our primary competitors are:
|
•
|
PrevPac
®
, an oral product marketed by Takeda Pharmaceutical Company. There are also approved generic versions of PrevPac;
|
|
•
|
Pylera
®
, an oral product marketed by Actavis Pharma, Inc. and Forest Laboratories, Inc.; and
|
|
•
|
Helidac
®
, an oral product marketed by Prometheus Therapeutics.
|
Vaprisol
Vaprisol is a patented, prescription brand indicated to raise serum sodium levels in hospitalized patients with euvolemic and hypervolemic hyponatremia. The product was developed and registered by Astellas and then launched in 2006. It is one of two branded prescription products indicated for the treatment of hyponatremia, and the first and only intravenously administered branded treatment. The other competing product is Samsca, an oral product marketed by Otsuka Pharmaceutical Company.
GOVERNMENT REGULATION
Governmental authorities in the U.S. and other countries extensively regulate the research, development, testing, manufacturing, distribution, marketing and sale of pharmaceutical products. In the U.S., the FDA under the Federal Food, Drug, and Cosmetic Act, ("FDCA"), the Public Health Service Act, and other federal statutes and regulations, subjects pharmaceutical products to rigorous review. Failure to comply with applicable U.S. requirements may subject a company to a variety of administrative or judicial sanctions, such as FDA refusal to approve pending NDAs or biologics license applications, ("BLAs"), warning letters, product recalls, product seizures, total or partial suspension of production or distribution, injunctions, fines, civil penalties, and criminal prosecution.
We, our manufacturers and clinical research organizations may also be subject to regulations under other federal, state and local laws, including the Occupational Safety and Health Act, the Resource Conservation and Recovery Act, the Clean Air Act and import, export and customs regulations as well as the laws and regulations of other countries.
16
FDA Approval Process
The FDA is a regulatory agency within the Department of Health and Human Services. A key responsibility is to regulate the safety and effectiveness of drugs sold in the United States. The FDA divides that responsibility into two phases: pre-approval
(premarket) and post approval
(post market). The FDA reviews manufacturers' applications to market drugs in the United States; a drug may not be sold unless it has FDA approval. The agency continues its oversight of drug safety and effectiveness as long as the drug is on the market.
To market a prescription drug in the United States, a manufacturer needs FDA approval. To get that approval, the manufacturer must demonstrate the drug's safety and effectiveness according to criteria specified in law and agency regulations, ensure that its manufacturing plant passes FDA inspection, and obtain FDA approval for the drug's labeling, a term that includes all written material about the drug, including, for example, packaging, prescribing information for physicians, promotional materials and patient brochures.
The progression to drug approval begins before FDA involvement. First, basic scientists work in the laboratory and with animals; second, a drug or biotechnology company develops a prototype drug. That company must seek and receive FDA approval, by way of an IND application, to test the product with human subjects. Those tests, called clinical trials, are carried out sequentially in Phase I, II, and III studies, which involve increasing numbers of subjects. The manufacturer then compiles the resulting data and analysis in a NDA. The FDA reviews the NDA with three major concerns: (1) safety and effectiveness in the drug's proposed use; (2) appropriateness of the proposed labeling; and (3) adequacy of manufacturing methods to assure the drug's identity, strength, quality, and purity.
The FDCA and associated regulations detail the requirements at each step. The FDA uses a few special mechanisms to expedite drug development and the review process when a drug might address an unmet need or a serious disease or condition. Those mechanisms include accelerated approval, animal efficacy approval, fast track applications, and priority review.
The sponsor of the drug typically conducts human clinical trials in three sequential phases, but the phases may overlap. Phase I clinical trials are generally conducted in a small number of healthy volunteers, primarily to collect and assess pharmacokinetics and safety data at one or more dosages prior to proceeding into patients. In Phase II clinical trials, the sponsor evaluates the early efficacy of the product in short term trials on the targeted indication and identifies possible adverse effects and safety risks in a patient population. Phase III clinical trials typically involve testing for patients in long term trials examining safety and clinical efficacy in an expanded population at geographically-dispersed test sites.
The FDA requires that clinical trials be conducted in accordance with the FDA's GCP requirements. The FDA may order the partial, temporary or permanent discontinuation of a clinical trial at any time or impose other sanctions if it believes that the clinical trial is not being conducted in accordance with FDA requirements or presents an unacceptable risk to the clinical trial patients. The institutional review board ("IRB"), or ethics committee (outside of the U.S.), of each clinical site generally must approve the clinical trial design and patient informed consent and may also require the clinical trial at that site to be halted, either temporarily or permanently, for failure to comply with the IRB's requirements, or may impose other conditions.
The results of the nonclinical and clinical trials, together with detailed information on the manufacture and composition of the product and proposed labeling, are submitted to the FDA in the form of an NDA for marketing approval. The NDA undergoes a 60 day validation review period before it is accepted for filing. If the NDA is found to be incomplete it will not be accepted. Once the NDA is validated and accepted for filing, the FDA begins an in-depth review of the NDA. Under policies agreed to by the FDA under the Prescription Drug User Fee Act, or PDUFA (currently PDUFA V - effective October 1, 2012), the FDA has 10 months in which to complete its initial review of a standard NDA and respond to the applicant. The review process and the PDUFA goal date may be extended by two months to address deficiencies, or by three months if the FDA requests or the NDA sponsor otherwise provides additional information or clarification regarding information already provided in the submission at any time during the review clock period. If the FDA's evaluations of the NDA and the clinical and manufacturing procedures and facilities are favorable, the FDA will issue an approval letter. If not, a Complete Response letter will be sent informing applicants of changes that must be made before the application can be approved, with no implication regarding whether the application will ultimately be approved. An approval letter authorizes commercial marketing of the drug for the
17
proposed indication(s) under study. The General Accounting Office ("GAO") reported that standard NDAs showed a steadier increase with the percentage of first-cycle approval letters rising from 43% for FY 2000 applications to 69% for FY 2010 applications. The percentage of priority NDAs receiving an approval letter at the end of the first review cycle fluctuated from FY 2000 through FY 2010, ranging between 47% and 80% during this time. The time and cost of completing these steps and obtaining FDA approval can vary dramatically depending on the drug. However, to complete these steps for a novel drug can take many years and cost millions of dollars.
Section 505(b) (2) New Drug Applications
An NDA may be submitted under different methods, a 505(b)(1), 505(b)(2) or 505(j). Section 505(b) provides for the submission of an NDA to support the approval of a drug. Upon approval, a drug may be marketed only for the FDA-approved indication(s) in the approved dosage form. Further clinical trials may be necessary to gain approval for the use of the product for any additional indications or dosage forms. The FDA also requires post market safety surveillance reporting to monitor the side effects of the drug, which may result in withdrawal of approval after marketing begins.
Section 505(b)(1) or the 'full' NDA is used for new chemical entities ("NCEs") and requires full clinical and nonclinical development of a compound. Marketing exclusivity assigned to a 505(b)(1) approval is five years. A 505(b)(2) NDA permits the submission of an NDA where at least some of the information required for approval comes from studies not conducted by or for the applicant using previously reported safety and efficacy data, and for which the applicant has not obtained a right of reference. Generally new studies are required to provide data on the proposed change. Some examples of products that may be allowed to follow a 505(b)(2) path to approval are drugs which have a new dosage form, strength, route of administration, formulation or indication or combination drugs. Marketing exclusivity for a 505(b)(2) submission is three years. Any marketing exclusivity is independent of patent exclusivity.
We successfully secured FDA approvals for Acetadote in January 2004 and for Caldolor in June 2009 pursuant to the 505(b)(2) pathway.
Special protocol assessment process
The special protocol assessment, or SPA, process is designed to assess whether a planned protocol is adequate to meet scientific and regulatory requirements identified by the sponsor. Three types of protocols related to PDUFA products are eligible for this special protocol assessment under the PDUFA goals: (1) animal carcinogenicity protocols, (2) final product stability protocols, and (3) clinical protocols for phase III trials whose data will form the primary basis for an efficacy claim if the trials had been the subject of discussion at an end-of-phase 2/pre-phase 3 meeting with the review division, or in some cases, if the division agrees to such a review because the division is aware of the developmental context in which the protocol is being reviewed and the questions are being answered. The clinical protocols for phase III trials can relate to efficacy claims that will be part of an original NDA or BLA or that will be part of an efficacy supplement to an approved NDA or BLA.
New section 505(b)(4)(B) of the Modernization Act directs FDA to meet with sponsors, provided certain conditions are met, for the purpose of reaching agreement on the design and size of clinical trials intended to form the primary basis of an efficacy claim in a marketing application submitted under section 505(b) of the Act or section 351 of the Public Health Service Act (42 U.S.C. 262).3. Such marketing applications include NDAs, BLAs, and efficacy supplements to approved NDAs and BLAs. Under new sections 505(b)(4)(B) and (C) of the Act, if a sponsor makes a reasonable written request to meet with the FDA for the purpose of reaching agreement on the design and size of a clinical trial, the FDA will meet with the sponsor. If an agreement is reached, the FDA will reduce the agreement to writing and make it part of the administrative record. An agreement may not be changed by the sponsor or FDA after the trial begins, except (1) with the written agreement of the sponsor and FDA, or (2) if the director of the FDA reviewing division determines that "a substantial scientific issue essential to determining the safety or effectiveness of the drug" was identified after the testing began (section 505(b)(4)(C) of the Act). If a sponsor and the FDA meet regarding the design and size of a clinical trial under section 505(b)(4)(B) of the Act and the parties cannot agree that the trial design is adequate to meet the goals of the sponsor, the FDA will clearly state the reasons for the disagreement in a letter to the sponsor. However, the absence of an articulated disagreement on a particular issue should not be assumed to represent an agreement reached on that issue. Final determinations by the FDA with respect to a product candidate, including as to the scope of its “labeling”, are made after a complete review of the applicable NDA and are based on the entire data in the application.
18
On June 14, 2004, we submitted a request for SPA of our Caldolor Phase III clinical study. During a meeting with the FDA on September 29, 2004, the FDA confirmed that the efficacy data from our study of post-operative pain with a positive outcome was considered sufficient to support a 505(b)(2) application for the pain indication.
Orphan drug designation
The Orphan Drug Act of 1983, ("Orphan Drug Act"), encourages manufacturers to seek approval of products intended to treat “rare diseases and conditions” with a prevalence of fewer than 200,000 patients in the U.S. or for which there is no reasonable expectation of recovering the development costs for the product. For products that receive orphan drug designation by the FDA, the Orphan Drug Act provides tax credits for clinical research, FDA assistance with protocol design, eligibility for FDA grants to fund clinical studies, waiver of the FDA application fee, and a period of seven years of marketing exclusivity for the product following FDA marketing approval. Acetadote received Orphan Drug designation in October 2001 and in 2004 the FDA approved the product to prevent or lessen hepatic injury after ingestion of a potentially hepatotoxic quantity of acetaminophen. Acetadote was entitled to marketing exclusivity until January 2011 for the treatment of this approved indication.
Section 505(j) abbreviated new drug applications
An ANDA is a type of NDA where approval of a generic drug is based on demonstrating comparability to an innovator drug product (the RLD or Reference Listed Drug). Applications are "abbreviated" because they generally don't include preclinical and clinical data to establish safety and effectiveness. Generics must demonstrate that the product is bioequivalent (i.e., performs in the same manner and is comparable to the 'innovator' product in active ingredient, dosage form, strength, route of administration, labeling, quality, performance characteristics and intended use). Abbreviated applications may be submitted for drug products that are the same as a listed drug and must be identical in active ingredient(s), form, strength, route of administration, and identical in conditions of use (non-exclusive uses). Products are declared suitable based on a suitability petition to the FDA. If the petition is approved, the Sponsor may then submit the ANDA.
The Hatch-Waxman Act
The Drug Price Competition and Patent Term Restoration Act, informally known as the "Hatch-Waxman Act", is a 1984 United States federal law which established the modern system of generic drugs. Hatch-Waxman amended the Federal Food, Drug, and Cosmetic Act. Section 505(j) 21 U.S.C. 355(j) sets forth the process by which would-be marketers of generic drugs can file ANDAs to seek FDA approval of the generic. Section 505(j)(2)(A)(vii)(IV), the so-called Paragraph IV, allows 180 day exclusivity to companies that are the "first-to-file" an ANDA against holders of patents for branded counterparts.
Hatch-Waxman Amendments grant generic manufacturers the ability to mount a validity challenge without incurring the cost of entry or risking enormous damages flowing from any possible infringement. Hatch-Waxman essentially redistributes the relative risk assessments and explains the flow of settlement funds and their magnitude. Hatch-Waxman gives generics considerable leverage in patent litigation.
Health care legislation
On March 23, 2010, President Obama signed into law the Patient Protection and Affordable Care Act, or PPACA. On March 30, 2010, the Health Care and Education Reconciliation Act of 2010, or HCERA, was enacted into law, which modified the revenue provisions of the PPACA. The PPACA as amended by the HCERA constitutes the healthcare reform legislation. The following highlights certain provisions of the legislation that may affect us.
Pharmaceutical Industry Fee:
Beginning in calendar-year 2011, an annual fee was imposed on pharmaceutical manufacturers and importers that sell branded prescription drugs to specified government programs (e.g., Medicare Part D, Medicare Part B, Medicaid, Department of Veterans Affairs programs, Department of Defense programs and TRICARE). The annual fee is allocated to companies based on their previous calendar-year market share using sales data that the government agencies that purchase the pharmaceuticals will provide to the Treasury Department. Although we participate in governmental programs that subject us to this fee, our sales volume in such programs is less than $10 million, with the first $5 million of sales being exempt from the fee. This fee has not had a material impact and is not expected to have a material impact on our results of operations.
19
Physician Payments Sunshine Act:
The Affordable Care Act also includes provisions known as the Physician Payments Sunshine Act, or Sunshine Act, which require manufacturers of pharmaceuticals and medical devices covered under Medicare and Medicaid to record any transfers of value to physicians and teaching hospitals and to report this data to the Centers for Medicare and Medicaid Services, or CMS for aggregation and subsequent public disclosure. Under the Sunshine Act, beginning August 1, 2013, we have collected data regarding reportable transfers of value and have reported such data to CMS. Failure to report appropriate data may result in civil or criminal fines and/or penalties. In addition to the Federal Sunshine Act, similar reporting requirements have also been enacted on the state level requiring transparency of interactions with health care professionals.
Medicaid Rebate Rate:
We currently provide rebates for products sold to Medicaid beneficiaries.
Post Approval Activities
Once a drug is on the U.S. market (following FDA approval of the NDA), the FDA continues to address drug production, distribution, and use. FDA activities are based on ensuring drug safety and effectiveness, and address product integrity, labeling, reporting of research and adverse events, surveillance, drug studies, risk management, information dissemination, off-label use, and direct-to-consumer advertising.
If we amend the NDA for an FDA approved product, such as adding safety or efficacy labeling claims, promoting those new claims, making certain manufacturing changes or product enhancements we will need FDA review and approval before the change can be implemented. While physicians may use products for indications that have not been approved by the FDA, we may not label or promote the product for an indication that has not been approved. Securing FDA approval for new indications, product enhancements, and manufacturing and labeling changes may require us to conduct additional clinical trials under FDA's IND regulations. Even if such studies are conducted, they are still subject to the same requirements and timelines as an original NDA.
The FDA continuously gathers information about possible adverse reactions to the products it has approved for use. The FDA requires all manufacturers to report adverse events. It also provides a procedure for consumers and physicians to voluntarily report their concerns about drugs. The agency collects those reports through MedWatch and uses its Adverse Event Reporting System (AERS) to store and analyze them. Because some events may occur after the use of a drug for reasons unrelated to the product, the FDA reviews the events to assess which ones may indicate a problem with that particular drug. They then use information gleaned from the surveillance data to determine a course of action. They might recommend a change in drug labeling to alert users to a potential problem, or, perhaps, to require the manufacturer to study the observed association between the drug and the adverse event.
In addition to FDA restrictions on marketing of pharmaceutical products, several other types of state and federal laws have been applied to restrict certain marketing practices in the pharmaceutical industry in recent years. These laws include anti-kickback statutes and false claims statutes. The federal health care program anti-kickback statute prohibits, among other things, knowingly and willfully offering, paying, soliciting or receiving remuneration to induce or in return for purchasing, leasing, ordering or arranging for the purchase, lease or order of any health care item or service reimbursable under Medicare, Medicaid or other federally financed health care programs. This statute has been interpreted to apply to arrangements between pharmaceutical manufacturers on the one hand and prescribers, purchasers and formulary managers on the other. Violations of the anti-kickback statute are punishable by imprisonment, criminal fines, civil monetary penalties and exclusion from participation in federal health care programs.
Federal False Claims Act
The Federal false claims laws prohibit any person from knowingly presenting, or causing to be presented, a false claim for payment to the federal government, or knowingly making, or causing to be made, a false statement to have a false claim paid. Recently, several pharmaceutical and other health care companies have been prosecuted under these laws for allegedly inflating drug prices they report to pricing services, which in turn were used by the government to set Medicare and Medicaid reimbursement rates, and for allegedly providing free product to customers with the expectation that the customers would bill federal programs for the product.
20
ICH - International Committee on Harmonization
Outside of the U.S., our ability to market our products will depend on receiving marketing authorizations from the appropriate regulatory authorities. The International Committee on Harmonization (ICH) provides a set of standards that most Regulatory Authorities adhere to (e.g. U.S., Europe, and Japan) allowing greater harmonization in the interpretation and application of technical guidelines and requirements for pharmaceutical product registration, thereby reducing or obviating duplication of testing carried out during the research and development of new human medicines. Regulatory harmonization offers many direct benefits to both regulatory authorities and the pharmaceutical industry with beneficial impact for the protection of public health.
ENVIRONMENTAL MATTERS
We are subject to federal, state and local environmental laws and regulations and we believe that our operations comply with such regulations. We anticipate that the effects of compliance with federal, state and local laws and regulations relating to the discharge of materials into the environment will not have any material effect on our capital expenditures, earnings or competitive position.
SEASONALITY
There are no significant seasonal aspects to our business.
BACKLOG
Due to the relatively short lead-time required to fill orders for our products, backlog of orders is not considered material to our business.
EMPLOYEES
As of December 31, 2014, we had 85 full-time employees. We believe that our future will depend in part on our continued ability to attract, hire, and retain qualified personnel, including hospital and field sales personnel in particular.
You should carefully consider the risk factors described below and throughout this report, which could materially affect our business. There are also risks that are not presently known or not presently material, as well as the other information set forth in this report that could materially affect our business. In addition, in our periodic filings with the SEC, press releases and other statements, we discuss estimates and projections regarding our future performance and business outlook. By their nature, such “forward-looking statements” involve known and unknown risks, uncertainties and other factors that in some cases are out of our control. For a further discussion of forward-looking statements, please refer to the section entitled “Special Note Regarding Forward-Looking Statements.” These factors could cause our actual results to differ materially from our historical results or our present expectations and projections. These risk factors and uncertainties include, but are not limited to the following:
RISKS RELATED TO OUR BUSINESS
An adverse development regarding our products could have a material and adverse impact on our future revenues and profitability.
A number of factors may impact the effectiveness of our marketing and sales activities and the demand for our products, including:
|
•
|
Changes in intellectual property protection available for our products or competing treatments;
|
|
•
|
Any unfavorable publicity concerning us, our products, or the markets for these products such as information concerning product contamination or other safety issues in any of our product markets, whether or not directly involving our products;
|
|
•
|
Perception by physicians and other members of the healthcare community of the safety or efficacy of our products or competing products;
|
21
|
•
|
Regulatory developments related to our marketing and promotional practices or the manufacture or continued use of our products;
|
|
•
|
The prices of our products relative to other drugs or competing treatments;
|
|
•
|
The impact of current or additional generic competitors;
|
|
•
|
The availability and level of third-party reimbursement for sales of our products; and
|
|
•
|
The continued availability of adequate supplies of our products to meet demand.
|
If demand for our products weaken, our revenues and profitability will likely decline. Known adverse effects of our marketed products are documented in product labeling, including the product package inserts, medical information disclosed to medical professionals and all marketing-related materials. At this time, no unforeseen or serious adverse effects outside of those specified in current product labeling have been directly attributed to our approved products.
We currently market and sell five products: Acetadote, Caldolor, Kristalose, Vaprisol and Omeclamox-Pak. A product contamination or other safety or regulatory issues, such as a failure to meet certain FDA reporting requirements involving our products could negatively impact us and possibly lead to a product recall. In addition, changes impacting any of our products in areas such as competition, lack of market acceptance or demand, government regulation, intellectual property, reimbursement and manufacturing could have an adverse impact on our future revenues and profitability.
The FDA has requested prescribers and manufacturers of prescription combination products that contain acetaminophen to limit the amount of acetaminophen to no more than 325 milligrams (mg) in each tablet or capsule. The FDA requested this action to protect consumers from the risk of severe liver damage which can result from excess acetaminophen. This category of prescription drugs combines acetaminophen with another ingredient intended to treat pain (most often an opioid), and these products are commonly prescribed to consumers for pain, such as pain from acute injuries, post-operative pain, or pain following dental procedures.
The FDA also requires manufacturers to appropriately label all prescription combination acetaminophen products to warn of the potential risk for severe liver injury. The actions the FDA is taking for prescription acetaminophen combination products do not affect over-the-counter acetaminophen products. The FDA's regulation of acetaminophen in prescription combination products and over-the-counter products may reduce the number of acetaminophen overdoses which could result in a lower demand for Acetadote. If the demand for Acetadote decreases, it could have an adverse impact on our future revenues and profitability.
Caldolor was approved by the FDA in June 2009, and we started commercializing Caldolor in the United States in September 2009. The commercial success of Caldolor is dependent on many third-parties, including physicians, pharmacists, hospital pharmacy and therapeutics committees, or P&T committees, suppliers and distributors, all of whom we have little or no control over. We expect Caldolor to continue to be administered primarily to hospital and surgery center patients who are unable to receive oral therapies for the treatment of pain or fever. Before we can distribute Caldolor to any new hospital customers, Caldolor must be approved for addition to the hospitals’ formulary lists by their P&T committees. A hospital’s P&T committee generally governs all matters pertaining to the use of medications within the institution, including review of medication formulary data and recommendations of drugs to the medical staff. We cannot guarantee that we will be successful in getting the approvals we need from enough P&T committees to be able to optimize hospital sales of Caldolor. Even if we obtain hospital approval for Caldolor, we must still convince individuals hospital physicians to prescribe Caldolor repeatedly. The commercial success of Caldolor also depends on our ability to coordinate supply, distribution, marketing, sales and education efforts. As with our other products, if Caldolor is not accepted in the marketplace, it could have an adverse impact on our future revenues and profitability.
If any manufacturer we rely upon fails to produce our products in the amounts we require on a timely basis, or fails to comply with stringent regulations applicable to pharmaceutical drug manufacturers, we may be unable to meet demand for our products and may lose potential revenues.
We do not manufacture any of our products, and we do not currently plan to develop any capacity to do so. Our dependence upon third parties for the manufacture of products could adversely affect our profit margins or our ability to develop and deliver products on a timely and competitive basis. If for any reason we are unable to obtain or retain third-party manufacturers on commercially acceptable terms, we may not be able to sell our products as planned. Furthermore, if we encounter delays or difficulties with contract manufacturers in producing our products, the distribution, marketing and subsequent sales of these products could be adversely affected.
Caldolor:
Caldolor has historically been manufactured at Hospira Australia Pty. Ltd.’s facility in Australia and Bayer’s facility in Kansas. During 2013, we entered into agreements with three international manufacturers for the commercial supply
22
of Caldolor. We have successfully transfered the Caldolor manufacturing process to two of these manufacturers and these two suppliers have manufactured validation inventory under these agreements. If the new international manufacturers of Caldolor are unable to produce marketable inventory in sufficient quantities, in the agreed upon time period, we could suffer an inability to meet demand for our product.
Acetadote:
Acetadote was previously manufactured and packaged by two entities: at Bayer’s facility in Kansas through January 2014 and in Ireland by Mylan through April 2014. During the fourth quarter of 2014, we entered into an agreement with a U.S. based manufacturer to supply our Acetadote product. We are working to transfer the Acetadote manufacturing process to this supplier under this new agreement. If the new manufacturer of Acetadote is unable to produce marketable inventory in sufficient quantities, in the agreed upon time period, we could suffer an inability to meet demand for our product.
Kristalose:
The active pharmaceutical ingredient for Kristalose is manufactured at a single facility in Italy. If this facility is damaged or destroyed, or if local conditions result in a work stoppage, we could suffer an inability to meet demand for our product. Kristalose is manufactured through a complex process. It would be particularly difficult to find a new manufacturer of Kristalose on an expedited basis. As a result of these factors, our ability to manufacture Kristalose may be substantially impaired if the manufacturer is unable or unwilling to supply sufficient quantities of the product.
Omeclamox-Pak:
Under the agreement we signed with Pernix, they are responsible for providing Omeclamox-Pak inventory. Pernix obtains the marketable inventory from a supplier who developed and registered Omeclamox-Pak. During 2014, we experienced a temporary shortage of Omeclamox-Pak marketable inventory and were unable to meet demand for our product. If we are unable to obtain marketable inventory in the future we could suffer an inability to meet demand for our product.
Vaprisol:
As part of the acquisition of Vaprisol from Astellas, we purchased an existing supply of finished goods and raw materials inventory. In addition, as part of this transaction, we were assigned a commercial supply agreement with the manufacturer Astellas used to prepare, package, inspect and label Vaprisol. If the manufacturer of Vaprisol is unable to produce additional marketable inventory in sufficient quantities, in the agreed upon time period, we could suffer an inability to meet demand for our product.
In addition, all manufacturers of our products and product candidates must comply with current good manufacturing practices, ("GMPs"), enforced by the FDA through its facilities inspection program. These requirements include quality control, quality assurance and the maintenance of records and documentation. Manufacturers of our products may be unable to comply with GMP requirements and with other FDA, state and foreign regulatory requirements.
We have no control over our manufacturers’ compliance with these regulations and standards. If our third-party manufacturers do not comply with these requirements, we could be subject to:
|
•
|
Fines and civil penalties;
|
|
•
|
Suspension of production or distribution;
|
|
•
|
Suspension or delay in product approval;
|
|
•
|
product seizure or recall; and
|
|
•
|
withdrawal of product approval.
|
We are dependent on a variety of other third parties. If these third parties fail to perform as we expect, our operations could be disrupted and our financial results could suffer.
We have a relatively small internal infrastructure. We rely on a variety of third parties, in addition to our manufacturers, to help us operate our business. Other third parties on which we rely include:
|
•
|
Cardinal Health Specialty Pharmaceutical Services, a logistics and fulfillment company and business unit of Cardinal, which bills for, collects, warehouses and ships our marketed products; and
|
|
•
|
Vanderbilt University, Gloria and the Tennessee Technology Development Corporation, co-owners with us of CET, and the universities that collaborate with us in connection with CET's research and development programs.
|
If these third parties do not continue to provide services to us, or collaborate with us, we might not be able to obtain others who can serve these functions. This could disrupt our business operations, increase our operating expenses or otherwise adversely affect our operating results.
23
Competitive pressures could reduce our revenues and profits.
The pharmaceutical industry is intensely competitive. Our strategy is to target differentiated products in specialized markets. However, this strategy does not relieve us from competitive pressures and can entail distinct competitive risks. Certain of our competitors do not aggressively promote their products in our markets. An increase in promotional activity in our markets could result in large shifts in market share, adversely impacting us.
Our competitors may sell or develop drugs that are more effective and useful or less costly than ours, and they may be more successful in manufacturing and marketing their products. Many of our competitors have significantly greater financial and marketing resources than we do. Additional competitors may enter our markets.
The pharmaceutical industry is characterized by constant and significant investment in new product development, which can result in rapid technological change. The introduction of new products could substantially reduce our market share or render our products obsolete. The selling prices of pharmaceutical products tend to decline as competition increases, through new product introduction or otherwise, which could reduce our revenues and profitability.
Governmental and private healthcare payors emphasize substitution of branded pharmaceuticals with less expensive generic equivalents. An increase in the sales of generic pharmaceutical products could result in a decrease in revenues of our branded pharmaceuticals.
Any attempt by us to expand the potential market for any of our products is subject to limitations.
Expansion of the market for our products may be subject to certain limitations. In the past, these limitations have included FDA required Phase IV commitments. We may also experience delays associated with future required Phase IV clinical studies potentially resulting from, among other factors, difficulty enrolling patients. Such delays could impact our ability to explore opportunities for label expansion and limit our ability to bring our products to new patient populations.
In addition, we have only obtained regulatory approval to market our products in the United States. Not all foreign jurisdictions may represent attractive opportunities for our products due to pricing, competitive, regulatory or other factors. In certain foreign jurisdictions, we have licensed the right to market some of our products to third parties. These third parties are responsible for seeking regulatory approval for the products in their respective jurisdictions. We have no control over these third parties and cannot be sure that marketing approval for our products will be obtained outside the United States.
Our future growth depends on our ability to identify and acquire rights to products. If we do not successfully identify and acquire rights to products, our growth opportunities may be limited.
We acquired rights to Caldolor, Acetadote, Omeclamox-Pak, Vaprisol, Kristalose and Hepatoren. Our business strategy is to continue to acquire rights to FDA-approved products as well as pharmaceutical product candidates in the late stages of development. We do not plan to conduct basic research or pre-clinical product development, except to the extent of our investment in CET. As compared to large multi-national pharmaceutical companies, we have limited resources to acquire third-party products, businesses and technologies and integrate them into our current infrastructure. Many acquisition opportunities involve competition among several potential purchasers including large multi-national pharmaceutical companies and other competitors that have access to greater financial resources than we do. With future acquisitions, we may face financial and operational risks and uncertainties. We may not be able to engage in future product acquisitions, and those we do complete may not be beneficial to us in the long term.
Furthermore, other products in development may encounter unforeseen issues during their clinical trials. Any unforeseen issues or lack of FDA approval will negatively affect marketing and development plans for those products.
Our future growth depends on our ability to successfully integrate acquired product brands into our operations. If we do not successfully integrate acquired product brands into our operations, our growth opportunities may be limited.
We recently added two marketed products to our portfolio of brands. We added Omeclamox-Pak in the fourth quarter of 2013 and Vaprisol during the first quarter of 2014. We successfully launched our promotional efforts to support both brands during 2014. If we are unable to continue to build on our initial success with these brands or we are unable to successfully integrate the marketing, sale and distribution of any other potential products into our current infrastructure or if they require significantly greater resources than originally anticipated, we may face financial and operational risks and uncertainties. If we are unable to successfully integrate any acquired brands, both current and future, these product acquisitions may not be beneficial to us in the long term.
24
Our Hepatoren product candidate has not been approved for sale and may never be successfully commercialized.
We anticipate that a portion of our future revenue growth will come from sales of our Hepatoren product candidate. Hepatoren (ifetroban) is a drug used to treat hepatorenal syndrome ("HRS"). However, Hepatoren has not been approved by the FDA for marketing, and it is still subject to risks associated with its development.
The FDA has cleared our IND for this product candidate as we evaluate Hepatoren as a treatment for HRS, a life threatening condition with no approved treatment in this country. We have an on-going sixty-four patient study to evaluate the safety, efficacy and pharmacokinetics of Hepatoren for this unmet medical need. The study is designed to evaluate escalating dose levels of Hepatoren. Enrollment is underway at major medical centers across the U.S. We have commenced manufacturing and have filed patent applications to protect intellectual property related to the new indication. Delays in the enrollment and completion of the clinical study could significantly delay commercial launch and affect our product development costs. Moreover, results from the clinical study may not be favorable.
Even if Hepatoren is eventually successfully developed and approved by the FDA, it may never gain significant acceptance in the marketplace and therefore never generate substantial revenue or profits for us. Physicians may determine that existing drugs are adequate to address patients' needs. The extent to which Hepatoren will be reimbursed by the U.S. government or third-party payors is also currently unknown.
As a result of the foregoing and other factors, we do not know the extent to which Hepatoren will contribute to our future growth.
If we are unable to maintain, train and build an effective sales and marketing infrastructure, we will not be able to commercialize and grow our products and product candidates successfully.
As we grow, we may not be able to secure sales personnel or organizations that are adequate in number or expertise to successfully market and sell our products. This risk would be accentuated if we acquire products in areas outside of hospital acute care and gastroenterology since our sales forces specialize in these areas. If we are unable to expand our sales and marketing capability, train our sales force effectively or provide any other capabilities necessary to commercialize our products and product candidates, we will need to contract with third parties to market and sell our products. We must train our employees on proper regulatory compliance, including, but not limited to, “fair balance” promotion of our products and anti-kickback laws. If we are unable to establish and maintain compliant and adequate sales and marketing capabilities, we may not be able to increase our product revenue, may generate increased expenses and may experience regulatory compliance issues.
If governmental or third-party payors do not provide adequate reimbursement for our products, our revenue and prospects for profitability may be limited.
Our financial success depends, in part, on the availability of adequate reimbursement from third-party healthcare payors. Such third-party payors include governmental health programs such as Medicare and Medicaid, managed care providers and private health insurers. Third-party payors are increasingly challenging the pricing of medical products and services, while governments continue to propose and pass legislation designed to reduce the cost of healthcare. Adoption of such legislation could further limit reimbursement for pharmaceuticals.
In March 2010, the U.S. government passed into law the Patient Protection and Affordable Care Act, ("PPACA") along with the Health Care and Education Reconciliation Act of 2010, ("HCERA"), which modified the revenue provisions of the PPACA. The PPACA, as amended by the HCERA, constitutes the healthcare reform legislation. The legislation calls for an increase in certain Medicare drug rebates paid by pharmaceutical manufacturers and an industry fee imposed on pharmaceutical manufacturers according to the individual manufacturer’s relative percentage of total industry sales to specified government programs. At this time no assurances can be given that these measures, or any other measures included in the Healthcare Reform Act, will not have an adverse effect on our revenues in the future. Furthermore, future cost control initiatives, legislation and regulations could decrease the price that we receive for any products, which would limit our revenue and profitability.
Also, reimbursement practices of third-party payors might preclude us from achieving market acceptance for our products or maintaining price levels sufficient to realize an appropriate return on our investment in product acquisition and development. If we cannot obtain adequate reimbursement levels, our business, financial condition and results of operations would be materially and adversely affected.
Our employees have been trained to submit accurate and correct pricing information to payors. If, despite the training, our employees provide incorrect or fraudulent information, then we will be subject to various administrative and judicial investigations and litigation.
25
“Formulary” practices of third-party payors could adversely affect our competitive position.
Many managed healthcare organizations are now controlling the pharmaceutical products included on their formulary lists. Having products listed on these formulary lists creates competition among pharmaceutical companies which, in turn, has created a trend of downward pricing pressure in our industry. In addition, many managed care organizations are pursuing various ways to reduce pharmaceutical costs and are considering formulary contracts primarily with those pharmaceutical companies that can offer a full line of products for a given therapy sector or disease state. Our products might not be included on the formulary lists of managed care organizations, and downward pricing pressure in our industry generally could negatively impact our operations.
Continued consolidation of distributor networks in the pharmaceutical industry as well as increases in retailer concentration may limit our ability to profitably sell our products.
We sell most of our products to large pharmaceutical wholesalers, who in turn sell to hospitals, surgery centers and retail pharmacies. The distribution network for pharmaceutical products has become increasingly consolidated in recent years. Further consolidation or financial difficulties could also cause our customers to reduce the amounts of our products that they purchase, which would materially and adversely impact our business, financial condition and results of operations.
Our CET joint initiative may not result in our gaining access to commercially viable products.
Our CET joint initiative with Vanderbilt University, Gloria and Tennessee Technology Development Corporation is designed to help us investigate, in a cost-effective manner, early-stage products and technologies. However, we may never gain access to commercially viable products from CET for a variety of reasons, including:
|
•
|
CET investigates early-stage products, which have the greatest risk of failure prior to FDA approval and commercialization;
|
|
•
|
In some programs, we do not have pre-set rights to product candidates developed by CET. We would need to agree with CET and its collaborators on the terms of any product licensed to, or acquired by, us;
|
|
•
|
We rely principally on government grants to fund CET’s research and development programs. If these grants were no longer available, we or our co-owners might be unable or unwilling to fund CET operations at current levels or at all;
|
|
•
|
We may become involved in disputes with our co-owners regarding CET policy or operations, such as how best to deploy CET assets or which product opportunities to pursue. Disagreement could disrupt or halt product development; and
|
|
•
|
CET may disagree with one of the various universities with which CET is collaborating on research. A disagreement could disrupt or halt product development.
|
We depend on our key personnel, the loss of whom would adversely affect our operations. If we fail to attract and retain the talent required for our business, our business will be materially harmed.
We are a relatively small company, and we depend to a great extent on principal members of our management, scientific staff, and sales representatives and managers. If we lose the services of any key personnel, in particular, A.J. Kazimi, our Chief Executive Officer, or other members of senior management it could have a material adverse effect on our business prospects. Mr. Kazimi, plays a key role in several operational and strategic decisions such that any loss of his services due to death or disability would adversely impact our day-to-day operations. We currently have a key man life insurance policy covering the life of Mr. Kazimi. We have entered into agreements with each of our employees that contain restrictive covenants relating to non-competition and non-solicitation of our customers and suppliers for one year after termination of employment. Nevertheless, each of our officers and key employees may terminate his or her employment at any time without notice and without cause or good reason, and so as a practical matter these agreements do not guarantee the continued service of these employees. Our success depends on our ability to attract and retain highly qualified scientific, technical, sales and managerial personnel and research partners. Competition among pharmaceutical companies for qualified employees is intense, and we may not be able to retain existing personnel or attract and retain qualified staff in the future. If we experience difficulties in hiring and retaining personnel in key positions, we could suffer from delays in product development, loss of customers and sales and diversion of management resources, which could adversely affect operating results.
The size of our organization and our potential growth may lead to difficulties in managing operations.
As of December 31, 2014, we had 85 full-time employees. We may need to continue to expand our managerial, operational, financial and other resources in order to increase our marketing efforts with regard to our currently marketed products,
26
continue our business development and product development activities and commercialize our product candidates. We have experienced, and may continue to experience, growth and increased expenses in the scope of our operations in connection with the continued marketing and development of our products. Our financial performance will depend, in part, on our ability to manage any such growth and expenses of the current organization effectively.
We face potential product liability exposure, and if successful claims are brought against us, we may incur substantial liability for a product or product candidate and may have to limit its commercialization.
We face an inherent risk of product liability lawsuits related to the testing of our product candidates and the commercial sale of our products. An individual may bring a liability claim against us if one of our product candidates or products causes, or appears to have caused, an injury. If we cannot successfully defend ourselves against the product liability claim, we may incur substantial liabilities. Liability claims may result in:
|
•
|
Decreased demand for our products;
|
|
•
|
Injury to our reputation;
|
|
•
|
Withdrawal of clinical trial participants;
|
|
•
|
Significant litigation costs;
|
|
•
|
Substantial monetary awards to or costly settlement with patients;
|
|
•
|
Product recalls;
|
|
•
|
Loss of revenue; and
|
|
•
|
The inability to commercialize our product candidates.
|
We are highly dependent upon medical and patient perceptions of us and the safety and quality of our products. We could be adversely affected if we or our products are subject to negative publicity. We could also be adversely affected if any of our products or any similar products sold by other companies prove to be, or are asserted to be, harmful to patients. Also, because of our dependence upon medical and patient perceptions, any adverse publicity associated with illness or other adverse effects resulting from the use or misuse of our products or any similar products sold by other companies could have a material adverse impact on our results of operations.
We have product liability insurance that covers our clinical trials, the marketing and sale of our products up to a $10 million annual aggregate limit, subject to specified deductibles. Our current or future insurance coverage may prove insufficient to cover any liability claims brought against us.
Because of the increasing costs of insurance coverage, we may not be able to maintain insurance coverage at a reasonable cost or obtain insurance coverage that will be adequate to satisfy any liability that may arise.
Regulatory approval for any approved product is limited by the FDA to those specific indications and conditions for which clinical safety and efficacy have been demonstrated.
Any regulatory approval is limited to those specific diseases and indications for which a product is deemed to be safe and effective by the FDA. In addition to the FDA approval required for new formulations, any new indication for an approved product also requires FDA approval. If we are not able to obtain FDA approval for any desired future indications for our products, our ability to effectively market and sell our products may be reduced and our business may be adversely affected.
While physicians may choose to prescribe drugs for uses that are not described in the product’s labeling and for uses that differ from those tested in clinical studies and approved by the regulatory authorities, our ability to promote the products is limited to those indications that are specifically approved by the FDA. These “off-label” uses are common across medical specialties and may constitute an appropriate treatment for some patients in varied circumstances. Regulatory authorities in the U.S. generally do not regulate the behavior of physicians in their choice of treatments. Regulatory authorities do, however, restrict communications by pharmaceutical companies on the subject of off-label use. If our promotional activities fail to comply with these regulations or guidelines, we may be subject to warnings from, or enforcement action by, these authorities. In addition, our failure to follow FDA rules and guidelines relating to promotion and advertising may cause the FDA to suspend or withdraw an approved product from the market, require a recall or payment of fines, or could result in disgorgement of money, operating restrictions, injunctions or criminal prosecution, any of which could harm our business.
27
Our business and operations would suffer in the event of system failures or adverse events at our corporate headquarters.
Despite the implementation of security measures, our internal computer systems, including those at our corporate headquarters, are vulnerable to damage from computer viruses, unauthorized access, natural disasters, terrorism, war and telecommunication and electrical failures. In the event that our corporate headquarters and/or our computer systems are disabled or materially damaged, it would have a substantial and material negative effect on our operations. Furthermore, any system failure, accident or security breach that causes interruptions in our operations could result in a material disruption of our drug development programs. To the extent that any disruption or security breach results in a loss or damage to our data or applications, or inappropriate disclosure of confidential or proprietary information, we may incur liability and the further development of our products or product candidates may be delayed.
RISKS RELATING TO GOVERNMENT REGULATION
We are subject to stringent government regulation. All of our products face regulatory challenges.
Virtually all aspects of our business activities are regulated by government agencies. The manufacturing, processing, formulation, packaging, labeling, distribution, promotion and sampling, advertising of our products, and disposal of waste products arising from such activities are subject to governmental regulation. These activities are regulated by one or more of the FDA, the Federal Trade Commission, ("FTC"), the Consumer Product Safety Commission, the U.S. Department of Agriculture and the U.S. Environmental Protection Agency, ("EPA"), as well as by comparable agencies in foreign countries. These activities are also regulated by various agencies of the states and localities in which our products are sold. For more information, see “
Business—Government Regulation"
.
Like all pharmaceutical manufacturers, we are subject to regulation by the FDA under the FDCA. All new drugs must be the subject of an FDA-approved new drug application, ("NDA"), before they may be marketed in the United States. The FDA has the authority to withdraw existing NDA approvals and to review the regulatory status of products marketed under the enforcement policy. The FDA may require an approved NDA for any drug product marketed under the enforcement policy if new information reveals questions about the drug’s safety and effectiveness. All drugs must be manufactured in conformity with GMP, and drug products subject to an approved NDA must be manufactured, processed, packaged, held and labeled in accordance with information contained in the NDA. Since we rely on third parties to manufacture our products, GMP requirements directly affect our third party manufacturers and indirectly affect us. The manufacturing facilities of our third-party manufacturers are continually subject to inspection by such governmental agencies, and manufacturing operations could be interrupted or halted in any such facilities if such inspections prove unsatisfactory. Our third-party manufacturers are subject to periodic inspection by the FDA to assure such compliance.
Pharmaceutical products must be distributed, sampled and promoted in accordance with FDA requirements. We must train our employees on proper regulatory compliance, including, but not limited to, “fair balance” promotion of our products and anti-kickback laws. The FDA also regulates the advertising of prescription drugs. The FDA has the authority to request post-approval commitments that can be time-consuming and expensive.
Under the FDCA, the federal government has extensive enforcement powers over the activities of pharmaceutical manufacturers to ensure compliance with FDA regulations. Those powers include, but are not limited to, the authority to initiate court action to seize unapproved or non-complying products, to enjoin non-complying activities, to halt manufacturing operations that are not in compliance with GMP, and to seek civil monetary and criminal penalties. The initiation of any of these enforcement activities, including the restriction or prohibition on sales of our products, could materially and adversely affect our business, financial condition and results of operations.
Any change in the FDA’s enforcement policy could have a material adverse effect on our business, financial condition and results of operations.
We cannot determine what effect changes in regulations or statutes or legal interpretation, when and if promulgated or enacted, may have on our business in the future. Such changes, or new legislation, could have a material adverse effect on our business, financial condition and results of operations.
Proposed legislation may permit re-importation of drugs from other countries into the U.S., including foreign countries where the drugs are sold at lower prices than in the U.S., which could materially and adversely affect our operating results and our overall financial condition.
In previous years, legislation has been introduced in Congress that, if enacted, would permit more widespread re-importation of drugs from foreign countries into the U.S., which may include re-importation from foreign countries where the drugs are sold at lower prices than in the U.S. Such legislation, or similar regulatory changes, if enacted,
28
could decrease the price we receive for any approved products which, in turn, could materially and adversely affect our operating results and our overall financial condition.
We must comply with the Foreign Corrupt Practices Act.
We are required to comply with the United States Foreign Corrupt Practices Act, which prohibits U.S. companies from engaging in bribery or other prohibited payments to foreign officials for the purpose of obtaining or retaining business. Foreign companies, including some of our competitors, are not subject to these prohibitions. If our competitors engage in these practices, they may receive preferential treatment from personnel of some companies, giving our competitors an advantage in securing business from government officials who might give them priority in obtaining new licenses, which would put us at a disadvantage. We have established formal policies or procedures for prohibiting or monitoring this conduct, but we cannot assure you that our employees or other agents will not engage in such conduct for which we might be held responsible. If our employees or other agents are found to have engaged in such practices, we could suffer severe penalties.
We must comply with the Physician Payment Sunshine Act.
We are required to comply with the United States Physician Payment Sunshine Act, which requires manufacturers of drugs, medical devices and biologicals that participate in U.S. federal healthcare programs to report certain payments and items of value given to physicians and teaching hospitals. Manufacturers are required to report this information annually to The Centers for Medicare & Medicaid Services (CMS). Cumberland has implemented a series of policies and procedures for every employee involved in the data collection process, and has systems in place to capture the data, which is verified by an outside firm that specializes in reporting the payments. Cumberland has also established a redundant system to ensure that data was reported completely, in the correct format, and on time. Despite these policies, procedures and systems, we cannot assure you that we will collect and report all data accurately. If we fail to accurately report this information, we could suffer severe penalties.
RISKS RELATING TO INTELLECTUAL PROPERTY
Our strategy to secure and extend marketing exclusivity or patent rights may provide only limited or no protection from competition.
We seek to secure and extend marketing exclusivity for our products through a variety of means, including FDA exclusivity and patent rights. Additional barriers for competitors seeking to enter the market include the time and cost associated with the development, regulatory approval and manufacturing of a similar product formulation.
Acetadote is indicated to prevent or lessen hepatic (liver) injury when administered intravenously within eight to ten hours after ingesting quantities of acetaminophen that are potentially toxic to the liver. As discussed in Part I, Item 1,
Business - Trademarks, Patents and Proprietary Rights,
of this Form 10-K, during April 2012, the United States Patent and Trademark Office (the “USPTO”) issued U.S. Patent number 8,148,356 (the “356 Acetadote Patent”) which is assigned to us. The claims of the 356 Acetadote Patent encompass the new Acetadote formulation and include composition of matter claims. Following its issuance, the 356 Acetadote Patent was listed in the FDA Orange Book. The 356 Acetadote Patent is scheduled to expire in May 2026, which time period includes a 270-day patent term adjustment granted by the USPTO.
Following the issuance of the 356 Acetadote Patent, we received separate Paragraph IV certification notices from InnoPharma, Inc., Paddock Laboratories, LLC ("Paddock") and Mylan Institutional LLC challenging the 356 Acetadote Patent on the basis of non-infringement and/or invalidity. On May 17, 2012, we responded to the Paragraph IV certification notices by filing three separate lawsuits for infringement of the 356 Acetadote Patent. The first lawsuit was filed against Mylan Institutional LLC and Mylan Inc. ("Mylan") in the United States District Court for the Northern District of Illinois, Eastern Division.
The second lawsuit was filed against InnoPharma, Inc. in the United States District Court for the District of Delaware. The third lawsuit was also filed in the United States District Court for the District of Delaware against Paddock and Perrigo Company ("Perrigo"). On May 20, 2012, we received a Paragraph IV certification notice from Sagent Agila LLC challenging the 356 Acetadote Patent. On June 26, 2012, we filed a lawsuit for infringement of the 356 Acetadote Patent against Sagent Agila LLC and Sagent Pharmaceuticals, Inc. ("Sagent") in the United States District Court for the District of Delaware. On July 9, 2012, we received a Paragraph IV certification
29
notice from Perrigo. On August 9, 2012, we filed a lawsuit for infringement of the 356 Acetadote Patent against Perrigo in the United States District Court for the Northern District of Illinois, Eastern Division.
On November 12, 2012, we entered into a Settlement Agreement (the “Settlement Agreement”) with Paddock and Perrigo to resolve the challenges and the pending litigation with each of Paddock and Perrigo involving the 356 Acetadote Patent. Under the Settlement Agreement, Paddock and Perrigo admit that the 356 Acetadote Patent is valid and enforceable and that any Paddock or Perrigo generic Acetadote product (with or without EDTA) would infringe upon the 356 Acetadote Patent. In addition, Paddock and Perrigo will not challenge the validity, enforceability, ownership or patentability of the 356 Acetadote Patent through its expiration currently scheduled for May 2026. On November 12, 2012, in connection with the execution of the Settlement Agreement, we entered into a License and Supply Agreement with Paddock and Perrigo (the “License and Supply Agreement”). Under the terms of the License and Supply Agreement, if a third party receives final approval from the FDA for an ANDA to sell a generic Acetadote product and such third party has made such generic version available for purchase in commercial quantities in the United States, we will supply Perrigo with an Authorized Generic version of our Acetadote product.
On May 18, 2012, we also submitted a Citizen Petition to the FDA requesting that the FDA refrain from approving any applications for acetylcysteine injection that contain EDTA, based in part on the FDA's request that we evaluate the reduction or removal of EDTA from its original Acetadote formulation. On November 7, 2012, the FDA responded to the Citizen Petition denying our request and stating that ANDAs referencing Acetadote that contain EDTA may be accepted and approved provided they meet all applicable requirements. We believe this response contradicts the FDA's request to evaluate the reduction or removal of EDTA. On November 8, 2012, we learned that the FDA approved the ANDA referencing Acetadote filed by InnoPharma, Inc. On November 13, 2012, we brought suit against the FDA in the United States District Court for the District of Columbia alleging that the FDA's denial of our Citizen Petition and acceptance for review and approval of any InnoPharma, Inc. product containing EDTA was arbitrary and in violation of law.
We found during the resulting legal proceedings that the FDA initially concluded that the original Acetadote formulation was withdrawn for safety reasons and no generic versions should be approved. The FDA later reversed its position based on the possibility of drug shortages and the presence of EDTA in other formulations. At the same time, the FDA noted that exclusively marketing a non-EDTA containing product would be preferable because it would eliminate the potential risk of EDTA.
On January 7, 2013, Perrigo announced initial distribution of our Authorized Generic acetylcysteine injection product.
On March 19, 2013, the USPTO issued U.S. Patent number 8,399,445 (the “445 Acetadote Patent”) which is also assigned to us. The claims of the 445 Acetadote Patent encompass the use of the 200 mg/ml Acetadote formulation to treat patients with acetaminophen overdose. On April 8, 2013, the 445 Acetadote Patent was listed in the FDA Orange Book. The 445 Acetadote Patent is scheduled to expire in August 2025. Following the issuance of the 445 Acetadote Patent we have received separate Paragraph IV certification notices from Perrigo, Sagent, and Mylan challenging the 445 Acetadote Patent on the basis of non-infringement, unenforceability and/or invalidity.
On June 10, 2013, we became aware of a Paragraph IV certification notice from Akorn, Inc. challenging the 445 Acetadote Patent and the 356 Acetadote Patent on the basis of non-infringement. On July 12, 2013, we filed a lawsuit for infringement of the 356 Acetadote Patent against Akorn, Inc. in the United States District Court for the District of Delaware.
On June 10, 2013, we announced that the FDA approved updated labeling for Acetadote. The new labeling revises the product's indication and offers new dosing guidance for specific patient populations.
On September 30, 2013, the United States District Court for the District of Columbia filed an opinion granting a Summary Judgment in favor of the FDA regarding Cumberland’s November 13, 2012 suit. On November 1, 2013, the United States District Court for the District of Delaware filed opinions granting Sagent’s and InnoPharma’s motions to dismiss our May 2012 and June 2012 suits.
On February18, 2014, the USPTO issued U.S. Patent number 8,653,061 (the “061 Acetadote Patent”) which is assigned to us. The claims of the 061 Acetadote Patent encompass the use of the 200 mg/ml Acetadote formulation to
30
treat patients with acetaminophen overdose. Following its issuance, the 061 Acetadote Patent was listed in the FDA Orange Book. The 061 Acetadote Patent is scheduled to expire in August 2025.
On May 13, 2014, the USPTO issued U.S. Patent number 8,722,738 (the “738 Acetadote Patent”) which is assigned to us. The claims of the 738 Acetadote Patent encompass administration methods of acetylcysteine injection, without specification of the presence or lack of EDTA in the injection. Following its issuance, the 738 Acetadote Patent was listed in the FDA Orange Book and it is scheduled to expire in April 2032.
On December 11, 2014 and March 3, 2015, we became aware of Paragraph IV certification notices from Aurobindo Pharma Limited and Zydus Pharmaceuticals (USA) Inc., respectively, challenging the 356, 445, 061, and 738 Acetadote Patents on the basis of non-infringement.
By statute, where the Paragraph IV certification is to a patent timely listed before an Abbreviated New Drug Application (“ANDA”) is filed, a company has 45 days to institute a patent infringement lawsuit during which period the FDA may not approve another application. In addition, such a lawsuit for patent infringement filed within such 45-day period may stay, or bar, the FDA from approving another product application for two and a half years or until a district court decision that is adverse to the asserted patents, whichever is earlier.
We also have additional patent applications relating to Acetadote which are pending with the USPTO and may or may not be issued. We intend to continue to vigorously defend and protect our Acetadote product and related intellectual property rights. If we are unsuccessful in protecting our Acetadote intellectual property rights, our competitors may be able to introduce products into the marketplace that reduce the sales and market share of our Acetadote product which may require us to take measures such as reducing prices or increasing our marketing expense, any of which may result in a material adverse effect to our financial condition and results of operations.
We have U.S. patents and related international patents which include composition of matter claims that encompass the Caldolor formulation, including methods of treating pain using intravenous ibuprofen and claims directed to ibuprofen solution formulations, methods of making the same, and methods of using the same, and which are related to our formulation and manufacture of Caldolor. Additionally, the active ingredient in Caldolor, ibuprofen, is in the public domain, and a competitor could try to develop, test and seek FDA approval for a sufficiently distinct formulation for another ibuprofen product that competes with Caldolor. The U.S. patents are listed in the FDA Orange Book, with one expiring in November 2021 and two others expiring in September 2029.
We have numerous U.S. patents and related international patents for Vaprisol. These patents were acquired in our February 2014 acquisition of certain product rights, intellectual property and related assets of Vaprisol
from Astellas.
While we consider patent protection when evaluating product acquisition opportunities, any products we acquire in the future may not have significant patent protection. Neither the USPTO nor the courts have a consistent policy regarding the breadth of claims allowed or the degree of protection afforded under many pharmaceutical patents. Patent applications in the U.S. and many foreign jurisdictions are typically not published until 18 months following the filing date of the first related application, and in some cases not at all. In addition, publication of discoveries in scientific literature often lags significantly behind actual discoveries. Therefore, neither we nor our licensors can be certain that we or they were the first to make the inventions claimed in our issued patents or pending patent applications, or that we or they were the first to file for protection of the inventions set forth in these patent applications. In addition, changes in either patent laws or in interpretations of patent laws in the U.S. and other countries may diminish the value of our intellectual property or narrow the scope of our patent protection. Furthermore, our competitors may independently develop similar technologies or duplicate technology developed by us in a manner that does not infringe our patents or other intellectual property. As a result of these factors, our patent rights may not provide any commercially valuable protection from competing products.
If we are unable to protect the confidentiality of our proprietary information and know-how, the value of our technology and products could be adversely affected.
In addition to patents, we rely upon trade secrets, unpatented proprietary know-how and continuing technological innovation where we do not believe patent protection is appropriate or attainable. For example, the manufacturing process for Kristalose involves substantial trade secrets and proprietary know-how. We have entered into confidentiality agreements with certain key employees and consultants pursuant to which such employees and consultants must assign
31
to us any inventions relating to our business if made by them while they are our employees, as well as certain confidentiality agreements relating to the acquisition of rights to products. Confidentiality agreements can be breached, though, and we might not have adequate remedies for any breach. Also, others could acquire or independently develop similar technology.
We may depend on certain licensors for the maintenance and enforcement of intellectual property rights and have limited, if any, control over the amount or timing of resources that our licensors devote on our behalf.
When we license products, we often depend on our licensors to protect the proprietary rights covering those products. We have limited, if any, control over the amount or timing of resources that our licensors devote on our behalf or the priority they place on maintaining patent or other rights and prosecuting patent applications to our advantage. While any such licensor is expected to be contractually obligated to diligently pursue its patent applications and allow us the opportunity to consult, review and comment on patent office communications, we cannot be sure that it will perform as required. If a licensor does not perform and if we do not assume the maintenance of the licensed patents in sufficient time to make required payments or filings with the appropriate governmental agencies, we risk losing the benefit of all or some of those patent rights.
If the use of our technology conflicts with the intellectual property rights of third parties, we may incur substantial liabilities, and we may be unable to commercialize products based on this technology in a profitable manner or at all.
If our products conflict with the intellectual property rights of others, they could bring legal action against us or our licensors, licensees, manufacturers, customers or collaborators. If we were found to be infringing a patent or other intellectual property rights held by a third party, we could be forced to seek a license to use the patented or otherwise protected technology. We might not be able to obtain such a license on terms acceptable to us or at all. If legal action involving an alleged infringement or misappropriation were to be brought against us or our licensors, we would incur substantial costs in defending the action. If such a dispute were to be resolved against us, we could be subject to significant damages, and the manufacturing or sale of one or more of our products could be enjoined.
We may be involved in lawsuits to protect or enforce our patents or the patents of our collaborators or licensors, which could be costly and time consuming.
We have been involved in lawsuits for infringement of the Acetadote Patents as previously described. Because of their nature, these lawsuits can be costly and time-consuming, and we only experience limited benefits and patent protection. A significant adverse ruling in any such lawsuit could put the Acetadote Patents at risk of being invalidated or interpreted narrowly and could compromise the issuance of our existing patent applications.
Competitors may infringe on our other patents or the patents of our collaborators or licensors. To counter infringement or unauthorized use, we may be required to file infringement claims, which can be expensive and time-consuming. In addition, in an infringement proceeding, a court may decide that a patent of ours is not valid or is unenforceable, or may refuse to stop the other party from using the technology at issue on the grounds that our patents do not cover the technology in question. An adverse result in any litigation or defense proceeding could put one or more of our patents at risk of being invalidated or interpreted narrowly and could put our patent applications at risk of not issuing.
Interference proceedings brought by the USPTO may be necessary to determine the priority of inventions with respect to our patent applications or those of our collaborators or licensors. Litigation or interference proceedings may fail and, even if successful, may result in substantial costs and distraction of our management. We may not be able, alone or with our collaborators and licensors, to prevent misappropriation of our proprietary rights, particularly in countries where the laws may not protect such rights as fully as in the United States.
Furthermore, because of the substantial amount of discovery required in connection with intellectual property litigation, some of our confidential information could be disclosed during this type of litigation. In addition, there could be public announcements of the results of hearings, motions or other interim proceedings or developments.
32
If we breach any of the agreements under which we license rights to our products and product candidates from others, we could lose the ability to continue commercialization of our products and development and commercialization of our product candidates.
We have exclusive licenses for the marketing and sale of certain products and may acquire additional licenses. Such licenses may terminate prior to expiration if we breach our obligations under the license agreement related to these pharmaceutical products. For example, the licenses may terminate if we fail to meet specified quality control standards, including GMP with respect to the products, or commit a material breach of other terms and conditions of the licenses. Such early termination could have a material adverse effect on our business, financial condition and results of operations.
We may be subject to claims that our employees have wrongfully used or disclosed alleged trade secrets of their former employers.
As is common in the biotechnology and pharmaceutical industry, we employ individuals who were previously employed at other biotechnology or pharmaceutical companies, including our competitors or potential competitors. Although no claims against us are currently pending, we may be subject to claims that we or these employees have inadvertently or otherwise used or disclosed trade secrets or other proprietary information of their former employers. Litigation may be necessary to defend against these claims. Even if we are successful in defending against these claims, litigation could result in substantial costs and be a distraction to management.
RISKS RELATED TO OUR FINANCIAL CONDITION AND RESULTS OF OPERATIONS
Our operating results are likely to fluctuate from period to period.
We are a relatively new company seeking to capture significant growth. As we execute our business strategy of adding new products, like Vaprisol and Omeclamox-Pak, increasing market share in Caldolor and Kristalose and striving to maintain market share in our Acetadote product, we anticipate that there may be fluctuations in our future operating results. We may not be able to maintain or improve our current levels of revenue or income. Potential causes of future fluctuations in our operating results may include:
|
•
|
New product launches, which could increase revenues but also increase sales and marketing expenses;
|
|
•
|
Acquisition activity and other charges (such as for inventory expiration);
|
|
•
|
Increases in research and development expenses resulting from the acquisition of a product candidate that requires significant additional studies and development;
|
|
•
|
Changes in the competitive, regulatory or reimbursement environment, which could drive down revenues or drive up sales and marketing or compliance costs; and
|
|
•
|
Unexpected product liability or intellectual property claims and lawsuits.
|
See also “Management’s discussion and analysis of financial condition and results of operations—Liquidity and capital resources.” Fluctuation in operating results, particularly if not anticipated by investors and other members of the financial community, could add to volatility in our stock price.
Our focus on acquisitions as a growth strategy has created intangible assets whose amortization could negatively affect our results of operations.
Our total assets include intangible assets related to our acquisitions. As of
December 31, 2014
, intangible assets relating to product and data acquisitions represented approximately
23%
of our total assets. We may never realize the value of these assets. U.S. Generally Accepted Accounting Principles ("GAAP") require that we evaluate on a regular basis whether events and circumstances have occurred that indicate that all or a portion of the carrying amount of the asset may no longer be recoverable, in which case we would write down the value of the asset and take a corresponding charge to earnings. Any determination requiring the write-off of a significant portion of unamortized intangible assets would adversely affect our results of operations.
33
We may need additional funding and may be unable to raise capital when needed, which could force us to delay, reduce or eliminate our product development or commercialization and marketing efforts.
We may need to raise additional funds in order to meet the capital requirements of running our business and acquiring and developing new pharmaceutical products. If we require additional funding, we may seek to sell common stock or other equity or equity-linked securities, which could result in dilution to our shareholders. We may also seek to raise capital through a debt financing, which would result in ongoing debt-service payments and increased interest expense. Any financings would also likely involve operational and financial restrictions being imposed on us. We might also seek to sell assets or rights in one or more commercial products or product development programs. Additional capital might not be available to us when we need it. We are unable to predict the impact of global credit market trends, and if economic conditions deteriorate, our business, results of operations and ability to raise needed capital could be materially and adversely affected. If we are unable to raise additional capital when needed due to the reasons listed above and lack of creditworthiness, bank failures, or price decline in market investments, we could be forced to scale back our operations to conserve cash.
If we are unable to establish appropriate internal financial reporting controls and procedures, it could cause us to fail to meet our reporting obligations, result in the restatement of our financial statements, harm our operating results, subject us to regulatory scrutiny and sanction, cause investors to lose confidence in our reported financial information and have a negative effect on the market price for shares of our common stock.
Effective internal controls are necessary for us to provide reliable financial reports and mitigate the risk of fraud. We maintain a system of internal control over financial reporting, which is defined as a process designed by, or under the supervision of, our principal executive officer and principal financial officer, and affected by our board of directors, management and other personnel, to provide reasonable assurance regarding the reliability of financial reporting and the preparation of financial statements for external purposes in accordance with GAAP.
We cannot assure you that we will not, in the future, identify areas requiring improvement in our internal control over financial reporting. We cannot assure you that the measures we will take to improve these controls will be successful or that we will implement and maintain adequate controls over our financial processes and reporting in the future as we continue to expand. If we are unable to establish appropriate internal financial reporting controls and procedures, it could cause us to fail to meet our reporting obligations, result in the restatement of our financial statements, harm our operating results, subject us to regulatory scrutiny and sanction, cause investors to lose confidence in our reported financial information and have a negative effect on the market price for shares of our common stock.
In addition, we maintain a system of internal controls and provide training to employees designed to provide reasonable assurance that unlawful and fraudulent activity, including misappropriation of assets, fraudulent financial reporting, and unauthorized access to sensitive or confidential data is either prevented or timely detected. However, in the event that our employees engage in such fraudulent behavior, we could suffer material adverse consequences.
Changes in, or interpretations of, accounting principles and tax laws could have a significant impact on our financial position and results of operations.
We prepare our consolidated financial statements in accordance with GAAP. These principles are subject to interpretation by the SEC and various bodies formed to interpret and create appropriate accounting principles. A change in these principles can have a significant effect on our reported results and may even retroactively affect previously reported transactions.
For example, in recent years, the U.S.-based Financial Accounting Standards Board, ("FASB"), has worked together with the International Accounting Standards Board, ("IASB"), on several projects to further align accounting principles and facilitate more comparable financial reporting between companies who are required to follow GAAP under SEC regulations and those who are required to follow International Financial Reporting Standards, ("IFRS"), outside of the U.S. These efforts by the FASB and IASB may result in different accounting principles under GAAP that may result in materially different financial results for us in areas including, but not limited to, principles for revenue recognition and lease accounting.
34
RISKS RELATED TO OWNING OUR STOCK
The market price of our common stock may fluctuate substantially.
The price for the shares of our common stock sold in our initial public offering was determined by negotiation between the representatives of the underwriters and us. This price may not have reflected the market price of our common stock following our initial public offering. Through March 3, 2015, the closing price of our common stock since our initial public offering has ranged from a low of $4.03 to a high of $17.05 per share. Moreover, the market price of our common stock might decline below current levels. In addition, the market price of our common stock is likely to be highly volatile and may fluctuate substantially. Sales of a substantial number of shares of our common stock in the public market or the perception that these sales may occur could cause the market price of our common stock to decline.
The realization of any of the risks described in these “Risk Factors” could have a dramatic and material adverse impact on the market price of our common stock. In addition, securities class action litigation has often been instituted against companies whose securities have experienced periods of volatility in market price. Any such securities litigation brought against us could result in substantial costs and a diversion of management’s attention and resources, which could negatively impact our business, operating results and financial condition. Sales of a substantial number of shares of our common stock in the public market or the perception that these sales may occur could cause the market price of our common stock to decline.
Unstable market conditions may have serious adverse consequences on our business.
Our general business strategy may be adversely affected by unpredictable and unstable market conditions. While we believe we have adequate capital resources to meet current working capital and capital expenditure requirements, a radical economic downturn or increase in our expenses could require additional financing on less than attractive rates or on terms that are dilutive to existing shareholders. Failure to secure any necessary financing in a timely manner and on favorable terms could have a material adverse effect on our growth strategy, financial performance and stock price and could require us to delay or abandon clinical developments plans. There is a risk that one or more of our current service providers, manufacturers and other partners may encounter difficult economic circumstances, which would directly affect our ability to attain our operating goals on schedule and on budget.
We are experiencing increased costs and regulatory risk as a result of operating as a public company, and our management will be required to devote additional time to new compliance initiatives.
We have and will continue to incur increased costs as a result of operating as a public company, and our management is required to devote additional time to new compliance initiatives. As a public company, we have and will continue to incur legal, accounting and other expenses that we did not incur as a private company. In addition, the Sarbanes-Oxley Act of 2002, or Sarbanes-Oxley Act, Dodd-Frank Wall Street Reform and Consumer Protection Act of 2010, and other rules and regulations subsequently implemented by the SEC and NASDAQ, have imposed various requirements on public companies, including the establishment and maintenance of effective disclosure and financial controls and changes in corporate governance practices. These rules and regulations have and will continue to increase our legal and financial compliance costs and will render some activities more time-consuming and costly. Despite the internal controls and procedures put in place to maintain compliance with securities laws and regulations, our employees may still fail to comply with all SEC disclosure and reporting requirements. Such failure could lead to administrative and civil penalties, criminal penalties, and private litigation with shareholders. The consequences could have a material effect on our ability to effectively market our products and operate our business.
The Sarbanes-Oxley Act requires, among other things, that we maintain effective internal controls for financial reporting and disclosure controls and procedures. In particular, we must perform system and process evaluation and testing of our internal controls over financial reporting to allow management and our independent registered public accounting firm to report on the effectiveness of our internal controls over financial reporting. Our testing, or the subsequent testing by our independent registered public accounting firm, may reveal deficiencies in our internal controls over financial reporting that are deemed to be material weaknesses.
Our compliance with Section 404 of the Sarbanes-Oxley Act requires that we incur substantial accounting expense and expend significant management efforts. Moreover, if we are not able to comply with the requirements of Section 404
35
of the Sarbanes-Oxley Act in a timely manner, or if we or our independent registered public accounting firm identifies deficiencies in our internal controls over financial reporting that are deemed to be material weaknesses, the market price of our stock could decline and we could be subject to sanctions or investigations by NASDAQ, the SEC or other regulatory authorities, which would require additional financial and management resources.
Some provisions of our third amended and restated charter, bylaws and Tennessee law may inhibit potential acquisition bids that you may consider favorable.
Our corporate documents contain provisions that may enable our board of directors to resist a change in control of our company even if a change in control were to be considered favorable by you and other shareholders. These provisions include:
|
•
|
The authorization of undesignated preferred stock, the terms of which may be established and shares of which may be issued without shareholder approval;
|
|
•
|
Advance notice procedures required for shareholders to nominate candidates for election as directors or to bring matters before an annual meeting of shareholders;
|
|
•
|
Limitations on persons authorized to call a special meeting of shareholders;
|
|
•
|
A staggered board of directors;
|
|
•
|
A restriction prohibiting shareholders from removing directors without cause;
|
|
•
|
A requirement that vacancies in directorships are to be filled by a majority of the directors then in office and the number of directors is to be fixed by the board of directors; and
|
|
•
|
No cumulative voting.
|
These and other provisions contained in our third amended and restated charter and bylaws could delay or discourage transactions involving an actual or potential change in control of us or our management, including transactions in which our shareholders might otherwise receive a premium for their shares over then current prices, and may limit the ability of shareholders to remove our current management or approve transactions that our shareholders may deem to be in their best interests and, therefore, could adversely affect the price of our common stock.
In addition, we are subject to control share acquisitions provisions and affiliated transaction provisions of the Tennessee Business Corporation Act, the applications of which may have the effect of delaying or preventing a merger, takeover or other change in control of us and therefore could discourage attempts to acquire our company.
We have never paid cash dividends on our capital stock, and we do not anticipate paying any cash dividends in the foreseeable future.
We have never paid cash dividends on our capital stock. We do not anticipate paying cash dividends to our shareholders in the foreseeable future. The availability of funds for distributions to shareholders will depend substantially on our earnings. Even if we become able to pay dividends in the future, we expect that we would retain such earnings to enhance capital and/or reduce long-term debt.
SPECIAL NOTE REGARDING FORWARD-LOOKING STATEMENTS
Statements in this Annual Report on Form 10-K that are not historical factual statements are “forward-looking statements.” Forward-looking statements include, among other things, statements regarding our intent, belief or expectations, and can be identified by the use of terminology such as “may,” “will,” “expect,” “believe,” “intend,” “plan,” “estimate,” “should,” “seek,” “anticipate” and other comparable terms or the negative thereof. In addition, we, through our senior management, from time to time make forward-looking oral and written public statements concerning our expected future operations and other developments. While forward-looking statements reflect our good-faith beliefs and best judgment based upon current information, they are not guarantees of future performance and are subject to known and unknown risks and uncertainties, including those mentioned in Item 1A, “Risk Factors,” Item 7, “Management’s Discussion and Analysis of Financial Condition and Results of Operations” and elsewhere in this
36
Form 10-K. Actual results may differ materially from the expectations contained in the forward-looking statements as a result of various factors. Such factors include, but are not limited to:
|
•
|
The possible or assumed future results of operations, including the accuracy of our estimates regarding expenses, future revenues, capital requirements and needs for additional financing;
|
|
•
|
Changes in national or regional economic conditions, including changes in interest rates and the availability and the cost of capital to us;
|
|
•
|
Our competitive position and competitors, including the size and growth potential of the markets for our products and product candidates;
|
|
•
|
The success, cost and timing of our product development activities and clinical trials; and our ability to successfully commercialize our product candidates;
|
|
•
|
The performance of our third-party suppliers and manufacturers; and the retention of key scientific and management personnel;
|
|
•
|
Our expectations regarding our ability to provide intellectual property protection for our product candidates; and
|
|
•
|
Changes in reimbursement available to us, including changes in Medicare and Medicaid payment levels and availability of third-party insurance coverage and the effects of future legislation or regulations.
|
37
None.
As of
December 31, 2014
, we leased approximately
25,500
square feet of office space in Nashville, Tennessee for our corporate headquarters. The lease expires in October 2016. Of the
25,500
square feet of leased office space, we have subleased to others approximately 9,900 square feet. We believe these facilities are adequate to meet our current needs for office space. We currently do not plan to purchase or lease facilities for manufacturing, packaging or warehousing, as such services are provided to us by third-party contract groups.
Under an agreement amended in July 2012 and expiring in April 2018, CET leases approximately14,200 square feet of office and wet laboratory space in Nashville, Tennessee. CET uses this space to operate the CET Life Sciences Center for product development work to be carried out in collaboration with universities, research institutions and entrepreneurs. The CET Life Sciences Center provides laboratory and office space, equipment and infrastructure to early-stage life sciences companies and university spin-outs.
On April 14, 2014, we filed with the American Arbitration Association a request for arbitration with Mylan Inc., Mylan Institutional LLC, Mylan Pharma Group Limited, and Mylan Teoranta (collectively, “Mylan”). We are seeking to arbitrate claims against Mylan in connection with our Alliance Agreement dated January 15, 2002, and Manufacturing and Supply Agreement as amended April 25, 2011, which require that Mylan and its affiliates manufacture and supply acetylcysteine drug product, including Acetadote, for us exclusively until April 2016. We have asserted in the request for arbitration claims against Mylan for breach of contract, breach of implied covenant of good faith and fair dealing, and unjust enrichment and seek monetary damages or to enjoin Mylan and its affiliates from selling or supplying acetylcysteine drug product to another entity or person until April 2016.
Also see the discussion of legal proceedings contained in Part I, Item 1,
Business - Trademarks and Patents,
of this Form 10-K, which is incorporated herein by reference.
38
Market Information
Our common stock, no par value, has been traded on the Nasdaq Global Select Market since August 11, 2009 under the symbol “CPIX.” As of March 3, 2015, we had 79 shareholders of record of our common stock. This excludes shareholders whose shares are held by brokers and other institutions on behalf of shareholders. The closing price of our common stock on the Nasdaq Global Select Market on March 3, 2015 was $6.40 per share. The following table sets forth the high and low trading sales prices for our common stock as reported on the Nasdaq Global Select Market for the full quarterly periods during 2013 and 2014:
|
High
|
Low
|
|||
|
Fiscal year ended December 31, 2014:
|
||||
|
First quarter
|
$5.19
|
$4.33
|
||
|
Second quarter
|
4.59
|
4.20
|
||
|
Third quarter
|
5.20
|
4.42
|
||
|
Fourth quarter
|
6.20
|
4.50
|
||
|
Fiscal year ended December 31, 2013:
|
||||
|
First quarter
|
5.10
|
4.03
|
||
|
Second quarter
|
5.37
|
4.52
|
||
|
Third quarter
|
5.85
|
4.33
|
||
|
Fourth quarter
|
5.41
|
4.53
|
||
Dividend Policy
We have not declared or paid any cash dividends on our common stock nor do we anticipate paying dividends for the foreseeable future. We currently intend to retain any future earnings for use in the operation of our business and to fund future growth. The payment of dividends by us on our common stock is limited by our loan agreement. Any future decision to declare or pay dividends will be at the sole discretion of our Board of Directors.
Performance Graph
The stock performance graph below illustrates a comparison of the total cumulative stockholder return on our common stock since December 31, 2009 to the Nasdaq Composite and a composite of ten Nasdaq Pharmaceutical and Specialty Pharmaceutical Stocks which most closely compare to our Company. The graph assumes an initial investment of $100 on December 31, 2009, and that all dividends were reinvested.
39
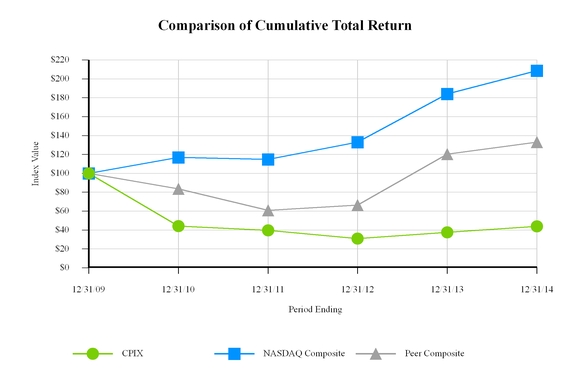
Purchases of Equity Securities
On May 13, 2010, we announced a share repurchase program to purchase up to $10 million of our common stock pursuant to Rule 10b-18 of the Securities Act. In January 2011, April 2012, January 2013 and January 2015, our Board of Directors replaced the prior authorizations with $10 million authorizations for repurchases of our outstanding common stock. We repurchased
881,810
shares,
1,008,105
shares and
1,268,809
shares of common stock for approximately $
4.3 million
, $
4.8 million
and $
8.1 million
during the years ended
December 31, 2014
,
2013
and
2012
, respectively.
The following table summarizes the activity, by month, during the fourth quarter of 2014:
|
Period
|
Total Number
of Shares (or
Units)
Purchased
|
Average
Price Paid
per Share
(or Unit)
|
Total Number of
Shares (or
Units)
Purchased as
Part of Publicly
Announced
Plans or
Programs
|
Maximum Number (or
Approximate Dollar
Value) of Shares (or
Units) that May Yet Be
Purchased Under the
Plans or Programs
|
|||||
|
October
|
63,654
|
|
$4.92
|
63,654
|
$2,550,521
|
||||
|
November
|
156,753
|
|
(1)
|
5.14
|
156,753
|
1,745,033
|
|||
|
December
|
84,425
|
|
5.43
|
84,425
|
1,286,849
|
||||
|
Total
|
304,832
|
|
|||||||
|
(1)
|
Of this amount,
10,000
shares were repurchased directly in a private purchase at the then-current fair market value of common stock.
|
40
The selected consolidated financial data set forth below should be read in conjunction with the audited consolidated financial statements and related notes and Item 7, “Management’s Discussion and Analysis of Financial Condition and Results of Operations” and other financial information appearing elsewhere in this Form 10-K. The historical results are not necessarily indicative of the results to be expected for any future periods.
|
|
Years Ended December 31,
|
||||||||||||||||||||
|
Statement of income data:
|
2014
|
2013
|
2012
|
2011
|
2010
|
||||||||||||||||
|
|
(in thousands, except per share data)
|
||||||||||||||||||||
|
Net revenues
|
$
|
36,902
|
|
$
|
32,027
|
|
$
|
48,851
|
|
$
|
51,143
|
|
$
|
45,876
|
|
||||||
|
Costs and expenses
|
33,343
|
|
35,829
|
|
40,033
|
|
41,293
|
|
39,375
|
|
|||||||||||
|
Operating income (loss)
|
3,559
|
|
(3,801
|
)
|
8,818
|
|
9,849
|
|
6,502
|
|
|||||||||||
|
Net income (loss) attributable to common shareholders
|
2,424
|
|
(2,105
|
)
|
5,842
|
|
5,658
|
|
2,457
|
|
|||||||||||
|
Earnings (loss) per share – basic
|
$
|
0.14
|
|
$
|
(0.11
|
)
|
$
|
0.30
|
|
$
|
0.28
|
|
$
|
0.12
|
|
||||||
|
Earnings (loss) per share – diluted
|
$
|
0.14
|
|
$
|
(0.11
|
)
|
$
|
0.30
|
|
$
|
0.28
|
|
$
|
0.12
|
|
||||||
|
|
As of December 31,
|
||||||||||||||||||||
|
Balance sheet data:
|
2014
|
2013
|
2012
|
2011
|
2010
|
||||||||||||||||
|
|
(in thousands)
|
||||||||||||||||||||
|
Cash and cash equivalents
|
$
|
39,866
|
|
$
|
40,869
|
|
$
|
54,349
|
|
$
|
70,599
|
|
$
|
65,894
|
|
||||||
|
Marketable securities
|
14,841
|
|
14,020
|
|
16,686
|
|
—
|
|
—
|
|
|||||||||||
|
Working capital
|
57,065
|
|
61,134
|
|
79,177
|
|
80,708
|
|
71,811
|
|
|||||||||||
|
Total assets
|
95,405
|
|
87,614
|
|
98,594
|
|
95,518
|
|
92,054
|
|
|||||||||||
|
Total long-term debt and other long-term obligations (including current portion)
|
1,032
|
|
869
|
|
5,042
|
|
5,485
|
|
7,802
|
|
|||||||||||
|
Retained earnings
|
18,818
|
|
16,395
|
|
18,499
|
|
12,657
|
|
6,999
|
|
|||||||||||
|
Total equity
|
80,753
|
|
79,292
|
|
85,566
|
|
82,835
|
|
77,715
|
|
|||||||||||
The following discussion and analysis of our financial position and results of operations should be read together with our audited consolidated financial statements and related notes appearing elsewhere in this Form 10-K. This discussion and analysis may contain forward-looking statements that involve risks and uncertainties – please refer to the section entitled, “Special Note Regarding Forward-Looking Statements,” Contained in Part I, Item 1A, “Risk Factors,” of this Form 10-K. You should review the “Risk Factors” section of this Form 10-K for a discussion of important factors that could cause actual results to differ materially from the results described in or implied by the forward-looking statements described in the following discussion and analysis.
EXECUTIVE SUMMARY
We are a growing specialty pharmaceutical company focused on the acquisition, development and commercialization of branded prescription products. Our primary target markets are hospital acute care and gastroenterology. These markets are characterized by relatively concentrated prescriber bases that we believe can be penetrated effectively by small, targeted sales forces. Cumberland is dedicated to providing innovative products that improve quality of care for patients and address unmet or poorly met medical needs
Our product portfolio includes Acetadote
®
(
acetylcysteine
) Injection for the treatment of acetaminophen poisoning, Caldolor
®
(
ibuprofen
) Injection for the treatment for pain and fever, Kristalose
®
(
lactulose
) for Oral Solution, a prescription laxative, Omeclamox
®
-Pak, (
omeprazole, clarithromycin, amoxicillin
) for the treatment of Helicobacter pylori (
H. pylori
) infection and related duodenal ulcer disease, Vaprisol
®
(
conivaptan
) Injection, to raise serum sodium levels in hospitalized patients with euvolemic and hypervolemic hyponatremia, Hepatoren
(
ifetroban
) Injection, a Phase II candidate for the treatment of critically ill hospitalized patients suffering from hepatorenal syndrome ("HRS") and Boxaban™
(ifetroban)
oral capsules, a Phase II candidate for the treatment of patients with aspirin-exacerbated respiratory disease (AERD).
We market and sell our approved products through our hospital and field sales forces in the United States, which together comprised approximately 50 sales representatives and managers as of
December 31, 2014
.
We have both product development and commercial capabilities, and believe we can leverage our existing infrastructure to support our expected growth. Our management team consists of pharmaceutical industry veterans experienced in business development, product development, regulatory, manufacturing, sales, marketing and finance. Our business development team identifies, evaluates and negotiates product acquisition, in-licensing and out-licensing opportunities. Our product development team develops proprietary product formulations, manages our clinical trials, prepares all regulatory submissions and manages our medical call center. Our quality and manufacturing professionals oversee the manufacture and release of our products. Our marketing and sales professionals are responsible for our commercial activities, and we work closely with our distribution partners to ensure availability and delivery of our products.
The following is a summary of our 2014 highlights and recent developments. For more information, please see Part I, Item I,
Business
, of this Form 10-K.
|
•
|
We restored profitability through a more diversified revenue stream and continued cost management.
|
|
•
|
In 2013, we added Omeclamox-Pak, a branded prescription product used for the treatment of Helicobacter pylori (
H. pylori
) infection and duodenal ulcer disease. We launched our promotion and distribution efforts to support Omeclamox-Pak in early 2014.
|
|
•
|
In February 2014, we entered into an agreement with Astellas to acquire Vaprisol including certain product rights, intellectual property and related assets. Vaprisol is the only intravenously administered branded prescription product indicated for the treatment of hyponatremia. We re-launched active promotion of the brand during the middle of 2014 utilizing our hospital sales force.
|
|
•
|
We launched a new Kristalose positioning program which resulted in it becoming our largest selling brand in 2014. This positioning included a preference study which indicated that patients prefer the taste, consistency and portability of Kristalose over similar products in syrup forms. We combined the preference
|
41
study with an enhanced patient coupon program and expanded managed care coverage to position Kristalose.
|
•
|
We continued our international expansion during 2014 with our Caldolor product launch in Korea.
|
|
•
|
We continued to provide poster presentations and obtain meaningful publications of our Caldolor studies. These presentations and publications highlight the efficacy of Caldolor in treating pain and fever as well as the safety and efficacy of a shortened infusion time of intravenous ibuprofen.
|
|
•
|
We obtained our third and fourth U.S. patents for Acetadote during 2014. The claims of the 061 Acetadote Patent encompass the use of the 200 mg/ml Acetadote formulation to treat patients with acetaminophen overdose. The claims of the 738 Acetadote Patent encompass administration methods of acetylcysteine injection, without specification of the presence or lack of EDTA in the injection. We are continuing to seek additional claims to protect our intellectual property associated with Acetadote.
|
|
•
|
During 2014, we obtained additional patents for Caldolor. The claims of the 452 Caldolor Patent and the 810 Caldolor Patent encompass methods of treating pain using intravenous ibuprofen and are scheduled to expire in September 2029. We also have additional patent applications related to Caldolor which are pending with the USPTO.
|
|
•
|
We successfully transferred the Caldolor manufacturing process to two manufacturers and these suppliers have manufactured validation inventory. We finalized a Kristalose API purchase agreement that formalized and extended our existing relationship with this raw materials manufacturer. We also entered into manufacturing relationships with two Kristalose packagers during 2014.
|
|
•
|
We have also completed the manufacturing of an oral formulation of ifetroban and the FDA has cleared an IND amendment for this product candidate. We have initiated clinical development under the brand name Boxaban (
ifetroban
) capsules and are evaluating this candidate for patients suffering from aspirin-exacerbated respiratory disease (AERD) a condition for which there is no U.S. approved pharmaceutical treatment.
|
|
•
|
We secured a new senior credit facility for up to $20 million with SunTrust Bank and arranged for $2 million in new funding for CET that included an investment from Gloria.
|
CRITICAL ACCOUNTING POLICIES AND SIGNIFICANT JUDGMENTS AND ESTIMATES
Accounting Estimates and Judgments
The preparation of the consolidated financial statements in conformity with GAAP requires management to make estimates, judgments and assumptions that affect the reported amounts of assets and liabilities and disclosure of contingent liabilities at the date of the financial statements and the reported amounts of revenues and expenses during the period. We base our estimates on past experience and on other factors we deem reasonable given the circumstances. Past results help form the basis of our judgments about the carrying value of assets and liabilities that are not determined from other sources. Actual results could differ from these estimates. These estimates, judgments and assumptions are most critical with respect to our accounting for revenue recognition, marketable securities, inventory, intangible assets, research and development accounting, provision for income taxes and share-based payment.
Revenue Recognition
We recognize revenue in accordance with the SEC’s Staff Accounting Bulletin (SAB) No. 101,
Revenue Recognition in Financial Statements
, as amended by SAB No. 104 (together, SAB 101), and Topic 605-15 of the Accounting Standards Codification.
Our revenue is derived primarily from the product sales of Acetadote, Vaprisol, Caldolor, Omeclamox-Pak and Kristalose. Revenue is recognized when persuasive evidence of an arrangement exists, delivery has occurred, the fee is fixed and determinable and collectibility is probable. Delivery is considered to have occurred upon either shipment of the product or arrival at its destination based on the shipping terms of the transaction. When these conditions are satisfied, we recognize gross product revenue, which is the price we charge generally to our wholesalers for a particular
42
product. Other revenue, which is a component of net revenues, includes upfront payments under licensing agreements along with grant and rental income. Other income was
0.6%
percent of net revenues in
2014
,
2.9%
in
2013
, and
1.9%
in
2012
.
Our net product revenue reflects the reduction of gross product revenue at the time of initial sales recognition for estimated accounts receivable allowances for chargebacks, cash discounts and damaged product as well as provisions for sales related accruals of rebates, product returns and administrative fees and fee for services. Our financial statements reflect accounts receivable allowances of
$0.4 million
and
$0.6 million
at
December 31, 2014
and
2013
, respectively for chargebacks, discounts and allowances for product damaged in shipment.
The following table reflects our sales-related accrual activity for the periods indicated below:
|
2014
|
2013
|
2012
|
||||||||||
|
Balance, January 1
|
$
|
2,437,140
|
|
$
|
3,371,863
|
|
$
|
3,216,622
|
|
|||
|
Current provision
|
14,972,112
|
|
4,181,403
|
|
6,000,830
|
|
||||||
|
Current provision for prior period sales
|
—
|
|
—
|
|
(367,060
|
)
|
||||||
|
Actual product returns and credits issued
|
(12,174,452
|
)
|
(5,116,126
|
)
|
(5,478,529
|
)
|
||||||
|
Balance, December 31
|
$
|
5,234,800
|
|
$
|
2,437,140
|
|
$
|
3,371,863
|
|
|||
The allowances for chargebacks, discounts, and damaged products and sales related accruals for rebates and product returns are determined on a product-by-product basis and are established by management as our best estimate at the time of sale based on each product’s historical experience, adjusted to reflect known changes in the factors that impact such allowances and accruals. Additionally, these allowances and accruals are established based on the following:
|
•
|
The contractual terms with customers;
|
|
•
|
Analysis of historical levels of discounts, returns, chargebacks and rebates;
|
|
•
|
Communications with customers;
|
|
•
|
Purchased information about the rate of prescriptions being written and the level of inventory remaining in the distribution channel, if known; and
|
|
•
|
Expectations about the market for each product, including any anticipated introduction of competitive products.
|
The allowances for chargebacks and accruals for rebates and product returns are the most significant estimates used in the recognition of our revenue from product sales. Of the accounts receivable allowances and our sales related accruals, our accrual for fee for services and product returns represents the majority of the balance. Sales related accrued liabilities for rebates, product returns, service fees, and administrative fees totaled
$5.2 million
,
$2.4 million
and
$3.4 million
as of
December 31, 2014
,
2013
and
2012
, respectively. Of these amounts, our estimated liability for fee for services represented
$0.9 million
, $
0.5 million
and $
1.1 million
, respectively, while our accrual for product returns totaled
$2.1 million
, $
1.6 million
and $
1.8 million
, respectively. If the actual amount of cash discounts, chargebacks, rebates, and product returns differs from the amounts estimated by management, material differences may result from the amount of our revenue recognized from product sales. A change in our rebate estimate of one percentage point would have impacted net sales by approximately $
0.3 million
in the year ended
December 31, 2014
and
$0.1 million
in each of the two years ended
December 31, 2013
. A change in our product return estimate of one percentage point would have impacted net sales by $
0.5 million
, $
0.3 million
and $
0.6 million
for the years ended
December 31, 2014
,
2013
and
2012
, respectively.
Fair Value of Marketable Securities
We invest in variable rate demand notes and a portfolio of government-backed securities (including U.S. Treasuries, government-sponsored enterprise debentures and government-sponsored adjustable rate mortgage-backed securities), in order to maximize our return on cash. We classify these investments as trading securities, and mark the investments
43
to fair value at the end of each reporting period, with the adjustment being recognized in the statement of income as a component of interest income. These investments are generally valued using observable market prices by third-party pricing services, or are derived from such services' pricing models. The level of management judgment required in establishing fair value of financial instruments for which there is a quoted price in an active market is minimal. Similarly there is little subjectivity or judgment required for instruments valued using valuation models that are standard across the industry and where all parameter inputs are quoted in active markets. Inputs to the models may include, but are not limited to, reported trades, executable bid and ask prices, broker/dealer quotations, prices or yields of securities with similar characteristics, benchmark curves or information pertaining to the issuer, as well as industry and economic events. The pricing services may use a matrix approach, which considers information regarding securities with similar characteristics to determine the valuation for a security.
Inventories
We record amounts for estimated obsolescence or unmarketable inventory in an amount equal to the difference between the cost of inventory and the estimated market value based upon assumptions about remaining shelf life, future demand and market conditions. The estimated inventory obsolescence amounts are calculated based upon specific review of the inventory expiration dates and the quantity on-hand at
December 31, 2014
in comparison to our expected inventory usage. The amount of actual inventory obsolescence and unmarketable inventory could differ (either higher or lower) in the near term from the estimated amounts. Changes in our estimates would be recorded in the income statement in the period of the change.
Income Taxes
We provide for deferred taxes using the asset and liability approach. Under this method, deferred tax assets and liabilities are recognized for the future tax consequences attributable to operating loss and tax credit carry-forwards and differences between the financial statement carrying amounts of existing assets and liabilities and their respective tax bases. Our principal differences are related to the timing of deductibility of certain items such as depreciation, amortization and expense for options issued to nonemployees. Deferred tax assets and liabilities are measured using management’s estimate of tax rates expected to apply to taxable income in the years in which management believes those temporary differences are expected to be recovered or settled. The effect on deferred tax assets and liabilities of a change in tax rates is recognized in our results of operations in the period that includes the enactment date.
In assessing the realizability of deferred tax assets, management considers whether it is more likely than not that some portion or all of the deferred tax assets will not be realized. The ultimate realization of deferred tax assets is dependent upon the generation of future taxable income during the periods in which those temporary differences become deductible. Management considers the scheduled reversal of deferred tax liabilities, projected future taxable income and tax planning strategies in making this assessment.
The tax benefit associated with the exercise of nonqualified stock options is recognized when the benefit is used to offset income taxes payable. As of
December 31, 2014
, we have unrecognized federal net operating loss carryforwards associated with the exercise of nonqualified options of
$44.2 million
. In addition to these unrecognized federal net operating loss carryforwards, as of
December 31, 2014
, we have recognized federal Orphan Drug and Research and Development tax credits of
$1.1 million
that expire between 2021 and 2033.
Share-Based Payments
We recognize compensation expense for all share-based payments based on the fair value of the award on the date of grant. In addition, incremental compensation expense is recognized upon the modification of equity awards.
During 2011, we began issuing restricted stock awards at no cost in lieu of stock options to employees, directors and consultants. Compensation expense for restricted stock granted to employees and directors is generally equal to the fair market value of the underlying common stock on the date of grant. If a sufficient disincentive for nonperformance does not exist at the date of grant, the compensation cost is remeasured at each reporting date at the then-current fair market value of the underlying common stock until the award vests.
In the second quarter of 2012, we implemented an Option Exchange Program (the “Exchange Program”) whereby certain outstanding stock options could be exchanged for shares of restricted stock. The Exchange Program was designed
44
to provide a value-for-value exchange of equity instruments. The fair value of each exchanged option was determined on the date the Exchange Program commenced using the Black-Scholes option fair value model. As there was no public market for our common stock prior to our initial public offering and, therefore, a lack of company-specific historical or implied volatility data, we determined the share-price volatility based on an analysis of certain publicly-traded companies that we consider to be our peers. The comparable peer companies used for our estimated volatility included publicly-traded companies with operations which we believe to be similar to ours. We estimated the expected life of employee share options based on the simplified method allowed by SAB No. 107, as amended by SAB No. 110. Under this approach, the expected term is presumed to be the average between the weighted-average vesting period and the contractual term. The expected term for options granted to non-employees is generally the contractual term of the option. The risk-free interest rate is based on the U.S. Treasury Note, Stripped Principal, on the date of grant with a term substantially equal to the corresponding option’s expected term. We have never declared or paid any cash dividends nor do we plan to pay cash dividends in the foreseeable future.
The following assumptions were used in calculating the fair value of options exchanged in 2012 as part of the Exchange Program.
|
2012
|
|||
|
Exchange Program
|
|||
|
Dividend yield
|
—
|
||
|
Expected term (years)
|
1.3 - 7.3
|
||
|
Expected volatility
|
37% - 78%
|
||
|
Risk-free interest rate
|
0.23% - 1.50%
|
||
Research and Development
We accrue for and expense research and development costs based on estimates of work performed, patient enrollment or fixed-fee-for-services. As work is performed and/or invoices are received, we adjust our estimates and accruals. To date, our accruals have not differed materially from our estimates. Total research and development costs are a function of studies being conducted and will increase or decrease based on the level of activity in any particular year.
Intangible Assets
Intangible assets include product rights, license agreements and other identifiable intangible assets. We assess the impairment of identifiable intangible assets whenever events or changes in circumstances indicate the carrying value may not be recoverable. In determining the recoverability of our intangible assets, we make assumptions regarding estimated future cash flows and other factors. If the estimated undiscounted future cash flows do not exceed the carrying value of the intangible assets, we must determine the fair value of the intangible assets. If the fair value of the intangible assets is less than the carrying value, an impairment loss will be recognized in an amount equal to the difference. Fair value is determined through various valuation techniques including quoted market prices, third-party independent appraisals and discounted cash flow models, as considered necessary.
45
RESULTS OF OPERATIONS
Year ended December 31, 2014 compared to year ended December 31, 2013
The following table presents the statements of operations for the years ended
December 31, 2014
and
2013
:
|
|
Years ended December 31,
|
|||||||||||
|
|
2014
|
2013
|
Change
|
|||||||||
|
Net revenues
|
$
|
36,901,871
|
|
$
|
32,027,462
|
|
$
|
4,874,409
|
|
|||
|
Costs and expenses:
|
||||||||||||
|
Cost of products sold
|
5,053,165
|
|
5,439,422
|
|
(386,257
|
)
|
||||||
|
Selling and marketing
|
14,902,202
|
|
14,387,745
|
|
514,457
|
|
||||||
|
Research and development
|
3,389,419
|
|
5,615,501
|
|
(2,226,082
|
)
|
||||||
|
General and administrative
|
8,401,560
|
|
9,489,976
|
|
(1,088,416
|
)
|
||||||
|
Amortization
|
1,596,689
|
|
896,156
|
|
700,533
|
|
||||||
|
Total costs and expenses
|
33,343,035
|
|
35,828,800
|
|
(2,485,765
|
)
|
||||||
|
Operating income (loss)
|
3,558,836
|
|
(3,801,338
|
)
|
7,360,174
|
|
||||||
|
Interest income
|
251,447
|
|
230,291
|
|
21,156
|
|
||||||
|
Interest expense
|
(67,074
|
)
|
(103,422
|
)
|
36,348
|
|
||||||
|
Income (loss) before income taxes
|
3,743,209
|
|
(3,674,469
|
)
|
7,417,678
|
|
||||||
|
Income tax (expense) benefit
|
(1,380,744
|
)
|
1,523,051
|
|
(2,903,795
|
)
|
||||||
|
Net income (loss)
|
$
|
2,362,465
|
|
$
|
(2,151,418
|
)
|
$
|
4,513,883
|
|
|||
Net revenues.
Net revenues for the year ended
December 31, 2014
were approximately
$36.9 million
compared to
$32.0 million
for the year ended
December 31, 2013
, representing an increase of
$4.9 million
or
15.2%
. The following table summarizes net revenues by product for the years presented:
|
|
Years ended December 31,
|
||||||||||
|
|
2014
|
2013
|
Change
|
||||||||
|
Products:
|
|||||||||||
|
Acetadote
|
$
|
11,906,232
|
|
$
|
18,846,753
|
|
$
|
(6,940,521
|
)
|
||
|
Omeclamox-Pak
|
4,111,916
|
|
1,045,815
|
|
3,066,101
|
|
|||||
|
Kristalose
|
14,932,271
|
|
9,118,475
|
|
5,813,796
|
|
|||||
|
Vaprisol
|
3,011,997
|
|
—
|
|
3,011,997
|
|
|||||
|
Caldolor
|
2,721,346
|
|
2,089,655
|
|
631,691
|
|
|||||
|
Other
|
218,109
|
|
926,764
|
|
(708,655
|
)
|
|||||
|
Total net product revenues
|
$
|
36,901,871
|
|
$
|
32,027,462
|
|
$
|
4,874,409
|
|
||
Net product revenues.
The revenue increase was driven primarily by increases in Kristalose product revenue of
$5.8 million
, Omeclamox-Pak revenue of
$3.1 million
and Vaprisol revenue of
$3.0 million
. A decrease in branded Acetadote product revenue of
$3.5 million
and a decrease in Authorized Generic Acetadote product revenue of
$3.4 million
partially offset this overall revenue increase.
Kristalose revenue increased
63.8%
over the prior year primarily due to new positioning for the product. We increased the price of Kristalose during the first quarter of
2014
to bring Kristalose more in line with the other marketed branded prescription products in its class. Concurrent with the price increase, we increased our patient focused initiatives to enhance patient affordability and increase demand.
46
The increase in revenue was also attributable to a
30.2%
increase in Caldolor through our growth in international and domestic sales. The addition of Vaprisol in early 2014 and the benefit of a full year of Omeclamox-Pak compared to a partial year of sales for the brand during 2013 also contributed to the revenue increase.
The year over year decrease in Acetadote net revenue was primarily due to decreased sales volume of the branded Acetadote and Authorized Generic product largely as a result of generic competition. Acetadote product revenue for
2014
included
$5.8 million
in sales of the Authorized Generic product compared to prior year sales of
$9.2 million
.
Other revenue.
Other revenue was
$0.2 million
in
2014
compared to
$0.9 million
in
2013
. The decrease was primarily the result
$0.6 million
of upfront payments we received during
2013
in connection with out-licensing agreements with international commercial partners.
Cost of products sold
. As a percentage of net revenues, cost of products sold decreased to
13.7%
during
2014
, compared to
17.0%
in the prior year. The decrease in costs of sales as a percentage of net revenue was partially attributable to a change in the product sales mix and an increase in our sales prices. The comparative decrease is also attributable to the recognition of $0.9 million in inventory write-downs during 2013 for potentially obsolete inventory.
Selling and marketing
. Selling and marketing expense for
2014
was
$14.9 million
, compared to
$14.4 million
for the prior year, representing an increase of
$0.5 million
. The increase was the result of increased sales, including a $0.4 million increase in Omeclamox-Pak product royalties and increased distribution costs of products and product samples. We continue to evaluate our selling and marketing costs and efforts under our commercial strategy, including the incremental costs of promoting our recently added products.
Research and development
. Research and development costs in
2014
were
$3.4 million
, compared to
$5.6 million
last year, representing a decrease of approximately
$2.2 million
, or
39.6%
. This change was a result of decreased product development and clinical study costs during
2014
following the conclusion of clinical studies related to Caldolor during 2013.
General and administrative.
General and administrative expense for
2014
totaled approximately
$8.4 million
, compared to
$9.5 million
in
2013
. The
$1.1 million
decrease was attributable to decreases in salary, wages and benefits, travel costs, legal expenses and consulting fees. We continue to realign the organization to support the current mix of brands.
Amortization.
Amortization expense is the ratable use of our capitalized intangible assets including product and license rights, patents, trademarks and patent defense costs. Amortization expense for
2014
was
$1.6 million
compared to
$0.9 million
last year, representing an increase of
$0.7 million
. The increase in amortization was attributable to additional product and license rights, capitalized patents and patent defense costs.
Income tax (expense) benefit
. Income tax expense for the year ended
December 31, 2014
totaled approximately
$1.4 million
, representing a
$2.9 million
increase in expense over the prior year income tax benefit of
$1.5 million
. The primary reason for the increase was the result of pretax income in
2014
compared to a pretax loss last year. As a percentage of income before income taxes, income tax expense was
36.9%
for
2014
compared to a benefit percentage of
41.4%
for
2013
. The tax expense for 2014 was positively impacted by the extension of the U.S. research and development tax credit for 2014, along with the reduction in our state tax expense during 2014. The tax benefit for
2013
was positively impacted by the reinstatement of the U.S. research and development tax credit during
2013
.
Year ended December 31, 2013 compared to year ended December 31, 2012
Net revenues.
Net revenues in 2013 decreased approximately $16.8 million compared to 2012. The decline in net product revenues was primarily attributable to decreases in Acetadote product revenue of $18.7 million. This decrease was partially offset by an increase in Caldolor product revenue of $1.1 million and revenue of $1.0 million generated from Omeclamox-Pak.
The increase in Caldolor revenue was primarily due to increased volume associated with continued success in penetrating our target market. We have continued to focus more of our sales and marketing resources to driving pull-through use of Caldolor in facilities stocking the product.
47
The decrease in Acetadote net revenue was a result of decreased sales volume of the branded Acetadote product largely as a result of generic competition during 2013. Our Acetadote product revenue also included $9.2 million in sales of our Authorized Generic in 2013 and $0.3 million in 2012.
Other revenue.
We recognized $0.9 million of other revenue in both 2013 and 2012, primarily as the result of upfront payments we received in connection with out-licensing agreements with international commercial partners.
Cost of products sold
. As a percentage of net revenues, cost of products sold increased to 17.0% in 2013 compared to 10.3% in 2012. The increase in costs of sales as a percentage of revenue was attributable to a change in the sales mix along with the recognition of $0.9 million of inventory write-downs during 2013 for potentially obsolete inventory.
Selling and marketing
. Selling and marketing expense for 2013 totaled $14.4 million, compared to $20.3 million for 2012. The $5.9 million decrease was driven primarily by decreased salaries, benefits and other selling expenses of $4.4 million along with $1.1 million in decreased travel, convention and promotion expense. These reductions were primarily a result of our new commercial strategy and sales force realignment that went into effect during the fourth quarter of 2012.
Research and development
. Research and development costs for 2013 were $5.6 million, compared to $5.1 million in 2012, representing an increase of $0.5 million, or 10.2%. The increase was a result of increased product development and study costs in 2013 compared to 2012.
General and administrative.
General and administrative expense totaled $9.5 million in 2013, representing an increase of $0.4 million, or 4.8%, over 2012. The increase was primarily due to several small cost increases including CET rent, stock-based compensation and retirement expense.
Amortization.
Amortization expense is the ratable use of our capitalized intangible assets including product and license rights, patents, trademarks and patent defense costs. Amortization for 2013 totaled $0.9 million, representing an increase of approximately $0.4 million compared to 2012. The increase was primarily due to increased capitalized patents and capitalized patent defense costs.
Income taxes
. The income tax benefit for 2013 was $1.5 million, representing a decrease in tax expense of $4.8 million from the $3.2 million of income tax expense in 2012. As a percentage of loss before income taxes, the income tax benefit was 41.4% for 2013 compared to expense of 35.8% of income before income taxes for 2012. The tax rate for 2013 was positively impacted by the reinstatement of the U.S. research and development tax credit during 2013. The tax rate percentage in 2012 was primarily due to the recognition of a deferred tax benefit associated with the exchange of certain incentive stock options.
LIQUIDITY AND CAPITAL RESOURCES
Our primary sources of liquidity are cash flows provided by our operations, our availability under our line of credit and the cash proceeds from our initial public offering of common stock that was completed in August 2009. For the years ended
December 31, 2014
,
2013
and
2012
, we generated
$6.7 million
,
$0.7 million
and
$7.1 million
in cash flow from operations, respectively. We believe that our internally generated cash flows and amounts available under our line of credit will be adequate to service existing debt, finance internal growth and fund capital expenditures.
In 2012, we began investing a portion of our cash reserves in variable rate demand notes and a portfolio of government-backed securities (including U.S. Treasuries, government-sponsored enterprise debentures and government-sponsored adjustable rate, mortgage-backed securities). The variable rate demand notes, or VRDNs, are generally issued by municipal governments and are backed by a financial institution letter of credit. We hold a put right on the VRDNs, which allows us to liquidate the investments relatively quickly (less than one week). The government-backed securities have an active secondary market that generally provides for liquidity in less than one week. At
December 31, 2014
and
2013
, we had approximately
$14.8 million
and
$14.0 million
invested in marketable securities, respectively.
The following table summarizes our liquidity and working capital as of the years ended December 31:
48
|
|
2014
|
2013
|
||||||
|
Cash and cash equivalents
|
$
|
39,866,037
|
|
$
|
40,869,457
|
|
||
|
Marketable securities
|
14,841,418
|
|
14,019,761
|
|
||||
|
Total cash, cash equivalents and marketable securities
|
$
|
54,707,455
|
|
$
|
54,889,218
|
|
||
|
Working capital (current assets less current liabilities)
|
$
|
57,065,489
|
|
$
|
61,133,945
|
|
||
|
Current ratio (multiple of current assets to current liabilities)
|
5.2
|
|
9.1
|
|
||||
|
Revolving line of credit availability
|
$
|
12,000,000
|
|
$
|
10,000,000
|
|
||
The following table summarizes our net changes in cash and cash equivalents for the years ended December 31:
|
|
2014
|
2013
|
2012
|
||||||||||
|
Cash provided by (used in):
|
|||||||||||||
|
Operating activities
|
$
|
6,693,431
|
|
$
|
746,126
|
|
$
|
7,135,182
|
|
||||
|
Investing activities
|
(6,034,440
|
)
|
(5,071,939
|
)
|
(19,177,141
|
)
|
|||||||
|
Financing activities
|
(1,662,411
|
)
|
(9,154,111
|
)
|
(4,207,806
|
)
|
|||||||
|
Net (decrease) increase in cash and
cash equivalents
|
$
|
(1,003,420
|
)
|
$
|
(13,479,924
|
)
|
$
|
(16,249,765
|
)
|
||||
The net decrease in cash and cash equivalents for
2014
was mainly attributable to cash used in our investing activities. Cash provided by operating activities was
$6.7 million
. Cash used in investing activities included a
$2.0 million
up-front payment for the acquisition of Vaprisol, a
$3.1 million
increase in intangible assets, and a net investment in marketable securities of
$0.8 million
. Our financing activities included the repurchase of shares of our common stock totaling
$4.3 million
partially offset by the
$1.0 million
investment Gloria made in CET. During 2014, we recognized approximately
$1.7 million
of excess tax benefits. The excess tax benefit represents the income taxes that would have been paid if not for the tax deductions created upon the exercise of nonqualified stock options. As noted above, we continue to repurchase shares of our common stock, as discussed in Part II, Item 5,
Market for Registrant’s Common Equity, Related Stockholder Matters and Issuer Purchases of Equity Securities,
of this Form 10-K.
The net use of cash and cash equivalents for the year ended December 31, 2013 was partly attributable to net investing and repayment of financing activities during the year. Net investing activities which used cash included $0.1 million in purchases of equipment and investment in intangible assets of $7.5 million. The investment in intangible assets includes our $4.0 million investment in Omeclamox-Pak. The cash used in investing activities was offset by our decrease of $2.5 million in net investment in marketable securities, with the decrease primarily in our VRDN's. We also repaid the outstanding balance of our revolving line of credit of $4.4 million during 2013. While net cash provided by operating activities was $0.7 million, the net loss of $2.2 million contributed to the net decrease in cash equivalents.
The net decrease in cash and cash equivalents of $16.2 million for the year ended December 31, 2012 was primarily due to the previously noted investment of our cash reserves in government and government-backed securities which are reflected as a net use of cash in investing activities of $16.6 million. Our cash flows from operating activities were primarily due to the $5.8 million in net income for the year supplemented by cash inflows from our receivables. In addition, our financing activities included the repurchase of common stock of $8.1 million in connection with our share repurchase program. During 2012, we recognized approximately $3.8 million of excess tax benefits. The excess tax benefit represents the income taxes that would have been paid if not for the tax deductions created upon the exercise of nonqualified stock options.
On June 26, 2014, we entered into a Revolving Credit Loan Agreement (“Loan Agreement”) with SunTrust Bank. The new agreement replaced the August 2011 Fifth Amended and Restated Loan Agreement with our previous primary lender which was to expire on December 31, 2014. There are no borrowings under the Loan Agreement at
December 31, 2014
. The Loan Agreement provides for an aggregate principal amount of up to $20 million and it has a three year term expiring on June 26, 2017. The initial revolving line of credit is up to $12 million, an increase from the $10 million under the previous agreement. We have the ability to increase the borrowing amount up to $20 million, upon the satisfaction of certain conditions. Our interest rate is based on LIBOR plus an interest rate spread. There is no LIBOR minimum and the LIBOR pricing
49
provides for an interest rate spread of 1.0% to 2.85%. In addition, a fee of 0.25% per year is charged on the unused line of credit. Interest and the unused line fee are payable quarterly. Borrowings under the line of credit are collateralized by substantially all of our assets. Under the Loan Agreement, we are subject to certain financial covenants, including, but not limited to, maintaining an EBIT to Interest Expense Ratio and a Funded Debt Ratio, determined on a quarterly basis. We were in compliance with all covenants at
December 31, 2014
.
Previous Debt Agreement
The August 2011 Fifth Amended and Restated Loan Agreement carried an interest rate of the LIBOR Daily Floating Rate plus an applicable margin, as defined by the agreement (2.17% at December 31, 2013). Interest and an unused line of credit fee (0.25% per annum) were payable quarterly. There were no borrowings outstanding on the credit facility at
December 31, 2013
or at any time during
2014
.
Under the previous agreement, we were subject to certain financial covenants including, but not limited to, maintaining a leverage ratio and interest coverage ratio, as defined in the Agreement. In March 2014 and May 2014, the previous Agreement was amended for certain provisions related to the aggregate ownership of the Company's common stock over 30% and certain other financial covenants. As a result of these amendments we were in compliance with all covenants.
The Company incurred no early termination penalties upon termination of the previous Agreement and incurred less than $0.1 million in deferred financing costs related to the new Loan Agreement, which will be amortized to interest expense using the effective interest method over the term of the Loan Agreement.
Minimum Product Purchase Requirements
Our manufacturing and supply agreement with one manufacturer, which expired in
2014
, contained a minimum annual purchase obligation. Our normal inventory purchasing levels were above the required minimum amounts, and as of
December 31, 2014
, we had met our purchase obligations under the agreement.
Contractual cash obligations
The following table summarizes our contractual cash obligations as of
December 31, 2014
:
|
|
|
Payments Due by Year
|
||||||||||||||||||||||
|
Contractual obligations
(1)
|
Total
(2)
|
2015
|
2016
|
2017
|
2018
|
2019
|
||||||||||||||||||
|
Amounts reflected in the balance sheet:
|
||||||||||||||||||||||||
|
Line of credit
|
$
|
—
|
|
$
|
—
|
|
$
|
—
|
|
$
|
—
|
|
$
|
—
|
|
$
|
—
|
|
||||||
|
Estimated interest on
debt
(3)
|
75,000
|
|
30,000
|
|
30,000
|
|
15,000
|
|
—
|
|
—
|
|
||||||||||||
|
Other cash obligations not reflected on the balance sheet:
|
||||||||||||||||||||||||
|
Operating leases
|
2,305,725
|
|
1,052,662
|
|
941,247
|
|
232,964
|
|
78,852
|
|
—
|
|
||||||||||||
|
Purchase obligations
(4)
|
—
|
|
—
|
|
—
|
|
—
|
|
—
|
|
—
|
|
||||||||||||
|
Total
(1)
|
$
|
2,380,725
|
|
$
|
1,082,662
|
|
$
|
971,247
|
|
$
|
247,964
|
|
$
|
78,852
|
|
$
|
—
|
|
||||||
|
(1)
|
The table of contractual obligations excludes amounts due under the Kristalose purchase agreement as these amounts cannot be determined until sales of the product have occurred. As consideration for the purchase of certain Kristalose assets in November 2011, we agreed to pay the seller a percentage of net sales for a seven-year period beginning November 15, 2011. Payments are due quarterly, in arrears.
|
|
(2)
|
The sum of the individual amounts may not agree due to rounding.
|
|
(3)
|
Represents the estimated unused line of credit payments based on a zero balance outstanding on December 31, 2014. Interest and unused line of credit payments are due and payable quarterly in arrears. Estimated interest for the line of credit is based on the assumption of a consistent zero outstanding balance.
|
|
(4)
|
Represents minimum purchase obligations under our manufacturing agreements.
|
OFF-BALANCE SHEET ARRANGEMENTS
During
2014
,
2013
and
2012
, we did not engage in any off-balance sheet arrangements.
50
RECENTLY ISSUED BUT NOT YET ADOPTED ACCOUNTING PRONOUNCEMENTS
In April 2014, the Financial Accounting Standards Board (the "FASB") issued amended guidance in the form of a FASB Accounting Standards Update on "Reporting Discontinued Operations and Disclosures of Disposals of Components of an Entity". The new guidance restricts the presentation of discontinued operations to business circumstances when the disposal of business operations represents a strategic shift that has or will have a major effect on an entity's operations and financial results. The guidance becomes effective on January 1, 2015. Adoption is on a prospective basis.
In May 2014, the FASB issued amended guidance in the form of a FASB Accounting Standards Update on, "Revenue from Contracts with Customers". The core principle of the new guidance is to recognize revenues when promised goods or services are transferred to customers in an amount that reflects the consideration to which an entity expects to be entitled for those goods or services. The new guidance defines a five step process to achieve this core principle and, in doing so, additional judgments and estimates may be required within the revenue recognition process. The new standard will replace most of the existing revenue recognition standards in U.S. GAAP when it becomes effective on January 1, 2017. Early adoption is not permitted. The new standard can be applied retrospectively to each prior reporting period presented or retrospectively with the cumulative effect of the change recognized at the date of the initial application. The Company is assessing the potential impact of the new standard on financial reporting and has not yet selected a transition method by which we will adopt the standard in 2017.
There are no other recently issued but not yet adopted accounting pronouncements that would materially impact our financial condition or results of operations.
Interest Rate Risk
We are exposed to market risk related to changes in interest rates on our cash on deposit in highly-liquid money market accounts and revolving credit facility. We do not utilize derivative financial instruments or other market risk-sensitive instruments to manage exposure to interest rate changes. The main objective of our cash investment activities is to preserve principal while maximizing interest income through low-risk investments. Our investment policy focuses on principal preservation and liquidity.
We believe that our interest rate risk related to our cash and cash equivalents is not material. The risk related to interest rates for these accounts would produce less income than expected if market interest rates fall. Based on current interest rates, we do not believe we are exposed to significant downside risk related to a change in interest on our money market accounts.
In the first quarter of 2012, we analyzed our return on our investments and determined investing in variable rate demand notes and a portfolio of government backed securities (including U.S. Treasuries, government sponsored enterprise debentures and government sponsored adjustable rate mortgage backed securities), would yield a higher return with minimal additional risk. The variable rate demand notes, or VRDNs, are generally issued by municipal governments and are backed by a financial institution letter of credit. We hold a put right on the VRDN's, which allows us to liquidate the investment relatively quickly (less than one week). The government backed securities have an active secondary market that generally provides for liquidity in less than one week. The risk related to interest rates for these accounts will produce less income than expected if market interest rates fall. Based on the
$14.8 million
in marketable securities outstanding at
December 31, 2014
, a 1% decrease in the fair value of the securities would result in a reduction in pretax net income of $0.1 million.
Based on current interest rates, we do not believe we are exposed to significant downside risk related to change in interest on our investment accounts.
The interest rate risk related to borrowings under our line of credit is based on LIBOR plus an interest rate spread. There is no LIBOR minimum and the LIBOR pricing provides for an interest rate spread of 1.0% to 2.85%. As of
December 31, 2014
,
no
borrowings were outstanding under our line of credit.
51
Exchange Rate Risk
While we operate primarily in the U.S., we are exposed to foreign currency risk. A portion of our research and development is performed abroad.
Currently, we do not utilize financial instruments to hedge exposure to foreign currency fluctuations. We believe our exposure to foreign currency fluctuation is minimal as our purchases in foreign currency have a maximum exposure of 90 days based on invoice terms with a portion of the exposure being limited to 30 days based on the due date of the invoice. Foreign currency exchange losses were immaterial for
2014
,
2013
and
2012
. Neither a five percent increase nor decrease from current exchange rates would have had a material effect on our operating results or financial condition.
See consolidated financial statements, including the reports of the independent registered public accounting firm, starting on page F-1, which is incorporated herein by reference.
None.
Our Chief Executive Officer and Chief Financial Officer have evaluated the effectiveness of the design and operation of our disclosure controls and procedures as of
December 31, 2014
. Based on that evaluation, they have concluded that our disclosure controls and procedures were effective as of
December 31, 2014
to ensure that material information relating to us and our consolidated subsidiaries is made known to officers within these entities in order to allow for timely decisions regarding required disclosure.
Management’s report on internal control over financial reporting and the related attestation report of KPMG LLP, our independent registered public accounting firm, are included on page F-1 and F-3, respectively, of this annual report on Form 10-K, and incorporated herein by reference.
During our
fourth quarter of 2014
, there were no changes in our internal control over financial reporting (as defined in Rule 13a-15(f) or 15d-15(f)).
None.
The information called for by Part III of Form 10-K (Item 10 – Directors, Executive Officers and Corporate Governance, Item 11 – Executive Compensation, Item 12 – Security Ownership of Certain Beneficial Owners and Management and Related Stockholder Matters, Item 13 – Certain Relationships and Related Transactions, and Director Independence, Item 14 – Principal Accounting Fees and Services), is incorporated by reference from our proxy statement related to our 2015 annual meeting of shareholders, which is expected to be filed with the SEC on or around March 10, 2015.
52
|
(a)
|
Documents filed as part of this report:
|
|
(1)
|
Financial Statements
|
|
Page Number
|
||
|
Consolidated Statements of Operations
and Comprehensive Income (Loss)
|
||
|
(2)
|
Financial Statement Schedule
|
|
(b)
|
Exhibits
|
53
|
Exhibit
Number
|
Description
|
|
|
3.1
|
Third Amended and Restated Charter of Cumberland Pharmaceuticals Inc., incorporated herein by reference to the corresponding exhibit to Amendment No. 19 of the Registrant’s Registration Statement on Form S-1 (File No. 333-142535) as filed with the SEC on July 17, 2009
|
|
|
3.2
|
Second Amended and Restated Bylaws of Cumberland Pharmaceuticals Inc., incorporated herein by reference to the corresponding exhibit to Amendment No. 19 of the Registrant’s Registration Statement on Form S-1 (File No. 333-142535) as filed with the SEC on July 17, 2009
|
|
|
4.1
|
Specimen Common Stock Certificate of Cumberland Pharmaceuticals Inc., incorporated herein by reference to the corresponding exhibit to Amendment No. 5 of the Registrant’s Registration Statement on Form S-1 (File No. 333-142535) as filed with the SEC on August 6, 2007
|
|
|
4.2
|
Warrant to Purchase Common Stock of Cumberland Pharmaceuticals Inc., issued to Bank of America, N.A. on October 21, 2003, incorporated herein by reference to the corresponding exhibit to the Registrant’s Registration Statement on Form S-1 (File No. 333-142535) as filed with the SEC on May 1, 2007
|
|
|
4.3
|
Stock Purchase Warrant, issued to S.C.O.U.T. Healthcare Fund L.P. on April 15, 2004, incorporated herein by reference to the corresponding exhibit to Amendment No. 1 of the Registrant’s Registration Statement on Form S-1 (File No. 333-142535) as filed with the SEC on June 22, 2007
|
|
|
4.4
|
Warrant to Purchase Common Stock of Cumberland Pharmaceuticals Inc., issued to Bank of America, N.A. on April 6, 2006, incorporated herein by reference to the corresponding exhibit to the Registrant’s Registration Statement on Form S-1 (File No. 333-142535) as filed with the SEC on May 1, 2007
|
|
|
4.5#
|
Form of Option Agreement under 1999 Stock Option Plan of Cumberland Pharmaceuticals Inc., incorporated herein by reference to the corresponding exhibit to the Registrant’s Registration Statement on Form S-1 (File No. 333-142535) as filed with the SEC on May 1, 2007
|
|
|
4.6.1#
|
Form of Incentive Stock Option Agreement under the Amended and Restated 2007 Long-Term Incentive Compensation Plan of Cumberland Pharmaceuticals Inc. incorporated herein by reference to the corresponding exhibit to the Registrant’s Annual Report on Form 10-K (File No. 001-33637) as filed with the SEC on March 12, 2013
|
|
|
4.6.2#
|
|
Form of Non-Statutory Stock Option Agreement under the Amended and Restated 2007 Long-Term Incentive Compensation Plan of Cumberland Pharmaceuticals Inc. incorporated herein by reference to the corresponding exhibit to the Registrant’s Annual Report on Form 10-K (File No. 001-33637) as filed with the SEC on March 12, 2013
|
|
4.7#
|
|
Form of Non-Statutory Stock Option Agreement under the Amended and Restated 2007 Directors’ Compensation Plan of Cumberland Pharmaceuticals Inc. incorporated herein by reference to the corresponding exhibit to the Registrant’s Annual Report on Form 10-K (File No. 001-33637) as filed with the SEC on March 12, 2013
|
|
4.8
|
|
Warrant to Purchase Common Stock of Cumberland Pharmaceuticals Inc., issued to Bank of America, N.A. on July 22, 2009, incorporated herein by reference to the corresponding exhibit to the Registrant’s Annual Report on Form 10-K (File No. 001-33637) as filed with the SEC on March 19, 2010
|
|
4.9
|
Form of Senior Indenture, incorporated herein by reference to the corresponding exhibit to Registrant's Registration Statement Form S-3 (File No. 333-184091) as filed with the SEC on September 25, 2012.
|
|
|
4.10
|
Form of Subordinated Indenture, incorporated herein by reference to the corresponding exhibit to Registrant's Registration Statement Form S-3 (File No. 333-184091) as filed with the SEC on September 25, 2012
|
|
|
10.1†
|
Manufacturing and Supply Agreement for N-Acetylcysteine, dated January 15, 2002, by and between Bioniche Life Sciences, Inc. and Cumberland Pharmaceuticals Inc., incorporated herein by reference to the corresponding exhibit to Amendment No. 5 of the Registrant’s Registration Statement on Form S-1 (File No. 333-142535) as filed with the SEC on August 6, 2007
|
|
54
|
Exhibit
Number
|
Description
|
|
|
10.2
|
Novation Agreement, dated January 27, 2006, by and among Bioniche Life Sciences, Inc., Bioniche Pharma Group Ltd., and Cumberland Pharmaceuticals Inc., incorporated herein by reference to the corresponding exhibit to the Registrant’s Registration Statement on Form S-1 (File No. 333-142535) as filed with the SEC on May 1, 2007
|
|
|
10.3†
|
First Amendment to Manufacturing and Supply Agreement for N-Acetylcysteine, dated November 16, 2006, by and between Bioniche Teoranta and Cumberland Pharmaceuticals Inc., incorporated herein by reference to the corresponding exhibit to Amendment No. 3 of the Registrant’s Registration Statement on Form S-1 (File No. 333-142535) as filed with the SEC on July 11, 2007
|
|
|
10.3.1†
|
Second Amendment to Manufacturing and Supply Agreement for N-Acetylcysteine, dated March 25, 2008, by and between Bioniche Teoranta and Cumberland Pharmaceuticals Inc., incorporated herein by reference to the corresponding exhibit to Amendment No. 10 of the Registrant’s Registration Statement on Form S-1 (File No. 333-142535) as filed with the SEC on May 21, 2008
|
|
|
10.3.2†
|
Third Amendment to Manufacturing and Supply Agreement for N-Acetylcysteine, effective April 25, 2011, by and between Bioniche Teoranta and Cumberland Pharmaceuticals Inc., incorporated herein by reference to the corresponding exhibit to the Registrant’s Current Report on Form 8-K (File No. 001-33637) as filed with the SEC on June 24, 2011
|
|
|
10.7†
|
Exclusive Distribution Agreement, effective as of July 1, 2010, by and between Cardinal Health 105, Inc. and Cumberland Pharmaceuticals Inc., incorporated herein by reference to the corresponding exhibit of the Registrant’s Current Report on Form 8-K (File No. 001-33637) as filed with the SEC on August 13, 2010
|
|
|
10.7.1†
|
First Amendment to Exclusive Distribution Agreement, dated March 31, 2013, by and between Cardinal Health 105, Inc. and Cumberland Pharmaceuticals Inc., incorporated herein by reference to the corresponding exhibit of the Registrant's Current Report of Form 8-K (File No. 001-33637) as filed with the SEC on June 3, 2013
|
|
|
10.8†
|
Strategic Alliance Agreement, dated July 21, 2000, by and between F.H. Faulding & Co. Limited and Cumberland Pharmaceuticals Inc., including notification of assignment from F.H. Faulding & Co. Limited to Mayne Pharma Pty Ltd., dated April 16, 2002, incorporated herein by reference to the corresponding exhibit to Amendment No. 4 of the Registrant’s Registration Statement on Form S-1 (File No. 333-142535) as filed with the SEC on July 23, 2007
|
|
|
10.10†
|
License Agreement, dated May 28, 1999, by and between Vanderbilt University and Cumberland Pharmaceuticals Inc., incorporated herein by reference to the corresponding exhibit to Amendment No. 3 of the Registrant’s Registration Statement on Form S-1 (File No. 333-142535) as filed with the SEC on July 11, 2007
|
|
|
10.11#
|
Employment Agreement dated March 4, 2015, effective as of January 1, 2015, by and between A.J. Kazimi and Cumberland Pharmaceuticals Inc.
|
|
|
10 .12#
|
Employment Agreement dated March 4, 2015, effective as of January 1, 2015, by and between Martin E. Cearnal and Cumberland Pharmaceuticals Inc.
|
|
|
10.13#
|
Employment Agreement dated March 4, 2015, effective as of January 1, 2015, by and between Leo Pavliv and Cumberland Pharmaceuticals Inc.
|
|
|
10.14#
|
Employment Agreement dated March 4, 2015, effective as of January 1, 2015, by and between Rick S. Greene and Cumberland Pharmaceuticals Inc.
|
|
|
10.15#
|
Employment Agreement dated March 4, 2015, effective as of January 1, 2015, by and between James L. Herman and Cumberland Pharmaceuticals Inc.
|
|
55
|
Exhibit
Number
|
Description
|
|
|
10.17#
|
1999 Stock Option Plan of Cumberland Pharmaceuticals Inc., incorporated herein by reference to the corresponding exhibit to the Registrant’s Registration Statement on Form S-1 (File No. 333-142535) as filed with the SEC on May 1, 2007
|
|
|
10.18#
|
Amended and Restated 2007 Long-Term Incentive Compensation Plan of Cumberland Pharmaceuticals Inc., incorporated herein by reference to Appendix A of the Registrant’s Schedule 14A as filed with the SEC on March 12, 2012 and approved by the Registrant's shareholders on April 17, 2012
|
|
|
10.19#
|
Amended and Restated 2007 Directors’ Incentive Plan of Cumberland Pharmaceuticals Inc., incorporated herein by reference to Appendix B of the Registrant's Schedule 14A as filed with the SEC on March 12, 2012 and approved by the Registrant's shareholders on April 17, 2012
|
|
|
10.20
|
Form of Indemnification Agreement between Cumberland Pharmaceuticals Inc. and all members of its Board of Directors, incorporated herein by reference to the corresponding exhibit to the Registrant’s Registration Statement on Form S-1 (File No. 333-142535) as filed with the SEC on May 1, 2007
|
|
|
10.21†
|
Lease Agreement, dated September 10, 2005, by and between Nashville Hines Development, LLC and Cumberland Pharmaceuticals Inc., incorporated herein by reference to the corresponding exhibit to Amendment No. 3 of the Registrant’s Registration Statement on Form S-1 (File No. 333-142535) as filed with the SEC on July 11, 2007
|
|
|
10.21.1†
|
First Amendment to Office Lease Agreement, dated April 25, 2008, by and between 2525 West End, LLC (successor in interest to Nashville Hines Development LLC) and Cumberland Pharmaceuticals Inc., incorporated herein by reference to the corresponding exhibit to Amendment No. 10 of the Registrant’s Registration Statement on Form S-1 (File No. 333-142535) as filed with the SEC on May 21, 2008
|
|
|
10.21.2†
|
Second Amendment to Office Lease Agreement, dated March 2, 2010, by and between 2525 West End, LLC (successor in interest to Nashville Hines Development LLC) and Cumberland Pharmaceuticals Inc., incorporated herein by reference to the corresponding exhibit to the Registrant’s Quarterly Report on Form 10-Q (File No. 001-33637) as filed with the SEC on May 17, 2010
|
|
|
10.23†
|
Amended and Restated Lease Agreement, dated November 11, 2004, by and between The Gateway to Nashville LLC and Cumberland Emerging Technologies, Inc., incorporated herein by reference to the corresponding exhibit to the Registrant’s Registration Statement on Form S-1 (File No. 333-142535) as filed with the SEC on May 1, 2007
|
|
|
10.24
|
First Amendment to Amended and Restated Lease Agreement, dated August 23, 2005, by and between The Gateway to Nashville LLC and Cumberland Emerging Technologies, Inc., incorporated herein by reference to the corresponding exhibit to the Registrant’s Registration Statement on Form S-1 (File No. 333-142535) as filed with the SEC on May 1, 2007
|
|
|
10.24.1
|
Second Amendment to Amended and Restated Lease Agreement, dated January 9, 2006, by and between The Gateway to Nashville LLC and Cumberland Emerging Technologies, Inc., incorporated herein by reference to the corresponding exhibit to Amendment No. 10 of the Registrant’s Registration Statement on Form S-1 (File No. 333-142535) as filed with the SEC on May 21, 2008
|
|
|
10.24.2†
|
Third Amendment to Amended and Restated Lease Agreement, dated July 3, 2012, by and between The Gateway to Nashville LLC and Cumberland Emerging Technologies, Inc., incorporated herein by reference to the corresponding exhibit to the Registrant's Quarterly Report on Form 10-Q (File No. 001-33637) as filed with the SEC on August 9, 2012
|
|
56
|
Exhibit
Number
|
Description
|
|
|
10.25†
|
Omeclamox-Pak® Promotion Agreement, dated October 1, 2013, by and between Cumberland Pharmaceuticals Inc. and Pernix Therapeutics, LLC incorporated herein by reference to the corresponding exhibit to the Registrant's Annual Report on Form 10-K (File No. 001-33637) as filed with the SEC on March 11, 2014
|
|
|
10.28†
|
Asset Purchase and Royalty Agreement for Kristalose dated November 15, 2011 by and between Mylan Inc. and Cumberland Pharmaceuticals Inc., incorporated herein by reference to the corresponding exhibit of the Registrant’s Current Report on Form 8-K (File No. 001-33637) as filed with the SEC on November 22, 2011
|
|
|
10.29†
|
Packaging Agreement effective November 1, 2011 by and among Mylan Institutional Inc., Mylan Pharmaceuticals Inc. and Cumberland Pharmaceuticals Inc. incorporated herein by reference to the corresponding exhibit to the Registrant’s Annual Report on Form 10-K (File No. 001-33637) as filed with the SEC on March 7, 2012
|
|
|
10.30#
|
Supplemental Executive Retirement and Savings Plan, incorporated herein by reference to the corresponding exhibit to the Registrant's Current Report on Form 8-K (File No. 001-33637) as filed with the SEC on May 24, 2012
|
|
|
10.31†
|
Settlement Agreement, dated November 9, 2012, by and between Cumberland Pharmaceuticals Inc., Paddock Laboratories, LLC and Perrigo Company incorporated herein by reference to the corresponding exhibit to the Registrant’s Annual Report on Form 10-K (File No. 001-33637) as filed with the SEC on March 12, 2013
|
|
|
10.32†
|
License and Supply Agreement, dated November 9, 2012, by and between Cumberland Pharmaceuticals Inc., Paddock Laboratories, LLC and Perrigo Company incorporated herein by reference to the corresponding exhibit to the Registrant’s Annual Report on Form 10-K (File No. 001-33637) as filed with the SEC on March 12, 2013
|
|
|
10.33
|
Revolving Credit Loan Agreement, dated June 26, 2014, by and between Cumberland Pharmaceuticals inc. and SunTrust Bank incorporated herein by reference to the corresponding exhibit to the Registrant's Quarterly Report on Form 10-Q (File No. 001-33637) as filed with the SEC on August 8, 2014
|
|
|
21
|
Subsidiaries of Cumberland Pharmaceuticals Inc., incorporated herein by reference to the corresponding exhibit to the Registrant’s Registration Statement on Form S-1 (File No. 333-142535) as filed with the SEC on May 1, 2007
|
|
|
23.1
|
Consent of KPMG LLP
|
|
|
31.1
|
Certification of Chief Executive Officer Pursuant to Rule 13-14(a) of the Securities Exchange Act of 1934 as Adopted Pursuant to Section 302 of the Sarbanes-Oxley Act of 2002.
|
|
|
31.2
|
Certification of Chief Financial Officer Pursuant to Rule 13-14(a) of the Securities Exchange Act of 1934 as Adopted Pursuant to Section 302 of the Sarbanes-Oxley Act of 2002.
|
|
|
32.1
|
Certification of Chief Executive Officer and Chief Financial Officer Pursuant to 18 U.S.C. Section 1350, as Adopted Pursuant to Section 906 of the Sarbanes-Oxley Act of 2002.
|
|
|
#
|
Indicates a management contract or compensatory plan.
|
|
|
†
|
Confidential treatment has been granted for portions of this exhibit. These portions have been omitted from the Registration Statement and submitted separately to the Securities and Exchange Commission.
|
|
|
††
|
Confidential treatment has been requested for portions of this exhibit. These portions have been omitted from the Registration Statement and submitted separately to the Securities and Exchange Commission.
|
|
57
SIGNATURES
Pursuant to the requirements of Section 13 or 15(d) of the Securities Exchange Act of 1934, the registrant has duly caused this report to be signed on its behalf by the undersigned, thereunto duly authorized, on
March 9, 2015
.
|
Cumberland Pharmaceuticals, Inc.
|
||
|
|
||
|
/s/ A. J. Kazimi
|
||
|
By:
|
A. J. Kazimi
|
|
|
Chief Executive Officer
|
||
|
(Principal Executive Officer)
|
||
Pursuant to the requirements of the Securities Exchange Act of 1934, this report has been signed below by the following persons on behalf of the registrant and in the capacities and on the dates indicated.
|
Signature
|
Title
|
Date
|
||
|
/s/ A. J. Kazimi
|
Chairman and CEO
|
March 9, 2015
|
||
|
A. J. Kazimi
|
(Principal Executive Officer and Director)
|
|||
|
/s/ Rick S. Greene
|
Vice President and CFO
|
March 9, 2015
|
||
|
Rick S. Greene
|
(Principal Financial and
Accounting Officer
|
|||
|
/s/ Thomas R. Lawrence
|
Director
|
March 9, 2015
|
||
|
Thomas R. Lawrence
|
||||
|
/s/ Martin E. Cearnal
|
Director
|
March 9, 2015
|
||
|
Martin E. Cearnal
|
||||
|
/s/ Gordon R. Bernard
|
Director
|
March 9, 2015
|
||
|
Gordon R. Bernard
|
||||
|
/s/ Jonathan I. Griggs
|
Director
|
March 9, 2015
|
||
|
Jonathan I. Griggs
|
||||
|
/s/ James R. Jones
|
Director
|
March 9, 2015
|
||
|
James R. Jones
|
||||
|
/s/ Joey A. Jacobs
|
Director
|
March 9, 2015
|
||
|
Joey A. Jacobs
|
||||
58
MANAGEMENT’S REPORT ON INTERNAL CONTROL OVER FINANCIAL REPORTING
The management of Cumberland Pharmaceuticals Inc. and its subsidiaries (the "Company") is responsible for establishing and maintaining adequate internal control over financial reporting. Cumberland Pharmaceuticals Inc.’s internal control system was designed to provide reasonable assurance to the Company’s management and board of directors regarding the preparation and fair presentation of published financial statements. All internal control systems, no matter how well designed, have inherent limitations. Therefore, even those systems determined to be effective can provide only reasonable assurance with respect to financial statement preparation and presentation.
Cumberland Pharmaceuticals Inc.’s management assessed the effectiveness of the Company’s internal control over financial reporting as of December 31, 2014. In making this assessment, it used the criteria set forth by the Committee of Sponsoring Organizations of the Treadway Commission (COSO) in
Internal Control – Integrated Framework (2013)
.
Based on its assessment, management has concluded that, as of December 31, 2014, the Company’s internal control over financial reporting was effective based on those criteria.
Cumberland Pharmaceuticals Inc.’s independent registered public accounting firm has issued an audit report on the effectiveness of Cumberland Pharmaceuticals Inc.’s internal control over financial reporting. This report appears on page F-3 of this annual report on Form 10-K.
|
/s/ A. J. Kazimi
|
|
A. J. Kazimi
|
|
Chief Executive Officer
|
|
March 9, 2015
|
|
/s/ Rick S. Greene
|
|
Rick S. Greene
|
|
Chief Financial Officer
|
|
March 9, 2015
|
F-1
REPORT OF INDEPENDENT REGISTERED PUBLIC ACCOUNTING FIRM
The Board of Directors
Cumberland Pharmaceuticals Inc.:
We have audited the accompanying consolidated balance sheets of Cumberland Pharmaceuticals Inc. and subsidiaries (the Company) as of December 31, 2014 and 2013, and the related consolidated statements of operations and comprehensive (loss) income, equity, and cash flows for each of the years in the three-year period ended December 31, 2014. In connection with our audits of the consolidated financial statements, we have also audited the financial statement Schedule II - Valuation and Qualifying Accounts for each of the years in the three-year period ended December 31, 2014. These consolidated financial statements and financial statement schedule are the responsibility of the Company's management. Our responsibility is to express an opinion on these consolidated financial statements and financial statement schedule based on our audits.
We conducted our audits in accordance with the standards of the Public Company Accounting Oversight Board (United States). Those standards require that we plan and perform the audit to obtain reasonable assurance about whether the financial statements are free of material misstatement. An audit includes examining, on a test basis, evidence supporting the amounts and disclosures in the financial statements. An audit also includes assessing the accounting principles used and significant estimates made by management, as well as evaluating the overall financial statement presentation. We believe that our audits provide a reasonable basis for our opinion.
In our opinion, the consolidated financial statements referred to above present fairly, in all material respects, the financial position of Cumberland Pharmaceuticals Inc. and subsidiaries as of December 31, 2014 and 2013, and the results of their operations and their cash flows for each of the years in the three‑year period ended December 31, 2014, in conformity with U.S. generally accepted accounting principles. Also, in our opinion, the related financial statement schedule, when considered in relation to the consolidated financial statements taken as a whole, presents fairly, in all material respects, the information set forth herein.
We have also audited, in accordance with the standards of the Public Company Accounting Oversight Board (United States), the Company's internal control over financial reporting as of December 31, 2014, based on criteria established in
Internal Control - Integrated Framework (2013)
issued by the Committee of Sponsoring Organizations of the Treadway Commission (COSO), and our report dated
March 9, 2015
expressed an unqualified opinion on the effectiveness of the Company’s internal control over financial reporting.
/s/ KPMG LLP
Nashville, Tennessee
March 9, 2015
F-2
REPORT OF INDEPENDENT REGISTERED PUBLIC ACCOUNTING FIRM
The Board of Directors
Cumberland Pharmaceuticals Inc.:
We have audited Cumberland Pharmaceuticals Inc.'s (the Company) internal control over financial reporting as of
December 31, 2014
, based on criteria established in
Internal Control - Integrated Framework (2013)
issued by the Committee of Sponsoring Organizations of the Treadway Commission (COSO). The Company's management is responsible for maintaining effective internal control over financial reporting and for its assessment of the effectiveness of internal control over financial reporting, included in the accompanying
Management's Report on Internal Control over Financial Reporting
. Our responsibility is to express an opinion on the Company's internal control over financial reporting based on our audit.
We conducted our audit in accordance with the standards of the Public Company Accounting Oversight Board (United States). Those standards require that we plan and perform the audit to obtain reasonable assurance about whether effective internal control over financial reporting was maintained in all material respects. Our audit included obtaining an understanding of internal control over financial reporting, assessing the risk that a material weakness exists, and testing and evaluating the design and operating effectiveness of internal control based on the assessed risk. Our audit also included performing such other procedures as we considered necessary in the circumstances. We believe that our audit provides a reasonable basis for our opinion.
A company's internal control over financial reporting is a process designed to provide reasonable assurance regarding the reliability of financial reporting and the preparation of financial statements for external purposes in accordance with generally accepted accounting principles. A company's internal control over financial reporting includes those policies and procedures that (1) pertain to the maintenance of records that, in reasonable detail, accurately and fairly reflect the transactions and dispositions of the assets of the company; (2) provide reasonable assurance that transactions are recorded as necessary to permit preparation of financial statements in accordance with generally accepted accounting principles, and that receipts and expenditures of the company are being made only in accordance with authorizations of management and directors of the company; and (3) provide reasonable assurance regarding prevention or timely detection of unauthorized acquisition, use, or disposition of the company's assets that could have a material effect on the financial statements.
Because of its inherent limitations, internal control over financial reporting may not prevent or detect misstatements. Also, projections of any evaluation of effectiveness to future periods are subject to the risk that controls may become inadequate because of changes in conditions, or that the degree of compliance with the policies or procedures may deteriorate.
In our opinion, the Company maintained, in all material respects, effective internal control over financial reporting as of
December 31, 2014
, based on criteria established in
Internal Control - Integrated Framework (2013)
issued by the Committee of Sponsoring Organizations of the Treadway Commission.
We also have audited, in accordance with the standards of the Public Company Accounting Oversight Board (United States), the consolidated balance sheets of Cumberland Pharmaceuticals Inc. and subsidiaries as of December 31, 2014 and 2013, and the related consolidated statements of operations and comprehensive (loss) income, equity, and cash flows for each of the years in the three-year period ended December 31, 2014, and our report dated
March 9, 2015
expressed an unqualified opinion on those consolidated financial statements.
/s/ KPMG LLP
Nashville, Tennessee
March 9, 2015
F-3
CUMBERLAND PHARMACEUTICALS INC. AND SUBSIDIARIES
Consolidated Balance Sheets
December 31, 2014 and 2013
|
2014
|
2013
|
|||||||
|
ASSETS
|
||||||||
|
Current assets:
|
||||||||
|
Cash and cash equivalents
|
$
|
39,866,037
|
|
$
|
40,869,457
|
|
||
|
Marketable securities
|
14,841,418
|
|
14,019,761
|
|
||||
|
Accounts receivable, net of allowances
|
5,504,728
|
|
4,530,424
|
|
||||
|
Inventories
|
5,600,319
|
|
5,722,882
|
|
||||
|
Prepaid and other current assets
|
1,351,324
|
|
825,675
|
|
||||
|
Deferred tax assets
|
3,651,145
|
|
2,711,516
|
|
||||
|
Total current assets
|
70,814,971
|
|
68,679,715
|
|
||||
|
Property and equipment, net
|
651,030
|
|
880,647
|
|
||||
|
Intangible assets, net
|
21,568,541
|
|
15,498,819
|
|
||||
|
Deferred tax assets
|
578,592
|
|
1,208,891
|
|
||||
|
Other assets
|
1,791,980
|
|
1,345,666
|
|
||||
|
Total assets
|
$
|
95,405,114
|
|
$
|
87,613,738
|
|
||
|
LIABILITIES AND EQUITY
|
||||||||
|
Current liabilities:
|
||||||||
|
Accounts payable
|
$
|
3,242,713
|
|
$
|
2,035,853
|
|
||
|
Other current liabilities
|
10,506,769
|
|
5,509,917
|
|
||||
|
Total current liabilities
|
13,749,482
|
|
7,545,770
|
|
||||
|
Revolving line of credit
|
—
|
|
—
|
|
||||
|
Other long-term liabilities
|
902,841
|
|
776,125
|
|
||||
|
Total liabilities
|
14,652,323
|
|
8,321,895
|
|
||||
|
Commitments and contingencies
|
|
|
||||||
|
Equity:
|
||||||||
|
Shareholders’ equity:
|
||||||||
|
Common stock – no par value; 100,000,000 shares authorized; 17,118,993 and 17,985,503 shares issued and outstanding as of December 31, 2014 and 2013, respectively
|
61,942,410
|
|
63,073,941
|
|
||||
|
Retained earnings
|
18,818,263
|
|
16,394,540
|
|
||||
|
Total shareholders’ equity
|
80,760,673
|
|
79,468,481
|
|
||||
|
Noncontrolling interests
|
(7,882
|
)
|
(176,638
|
)
|
||||
|
Total equity
|
80,752,791
|
|
79,291,843
|
|
||||
|
Total liabilities and equity
|
$
|
95,405,114
|
|
$
|
87,613,738
|
|
||
See accompanying notes to consolidated financial statements.
F-4
CUMBERLAND PHARMACEUTICALS INC. AND SUBSIDIARIES
Consolidated Statements of Operations and Comprehensive Income (Loss)
Years ended December 31, 2014, 2013 and 2012
|
2014
|
2013
|
2012
|
||||||||||
|
Revenues:
|
||||||||||||
|
Net product revenue
|
$
|
36,683,762
|
|
$
|
31,100,698
|
|
$
|
47,944,031
|
|
|||
|
Other revenue
|
218,109
|
|
926,764
|
|
907,206
|
|
||||||
|
Net revenues
|
36,901,871
|
|
32,027,462
|
|
48,851,237
|
|
||||||
|
Costs and expenses:
|
||||||||||||
|
Cost of products sold
|
5,053,165
|
|
5,439,422
|
|
5,046,179
|
|
||||||
|
Selling and marketing
|
14,902,202
|
|
14,387,745
|
|
20,329,493
|
|
||||||
|
Research and development
|
3,389,419
|
|
5,615,501
|
|
5,095,172
|
|
||||||
|
General and administrative
|
8,401,560
|
|
9,489,976
|
|
9,055,959
|
|
||||||
|
Amortization
|
1,596,689
|
|
896,156
|
|
506,332
|
|
||||||
|
Total costs and expenses
|
33,343,035
|
|
35,828,800
|
|
40,033,135
|
|
||||||
|
Operating income (loss)
|
3,558,836
|
|
(3,801,338
|
)
|
8,818,102
|
|
||||||
|
Interest income
|
251,447
|
|
230,291
|
|
304,865
|
|
||||||
|
Interest expense
|
(67,074
|
)
|
(103,422
|
)
|
(71,985
|
)
|
||||||
|
Income (loss) before income taxes
|
3,743,209
|
|
(3,674,469
|
)
|
9,050,982
|
|
||||||
|
Income tax (expense) benefit
|
(1,380,744
|
)
|
1,523,051
|
|
(3,244,776
|
)
|
||||||
|
Net income (loss)
|
2,362,465
|
|
(2,151,418
|
)
|
5,806,206
|
|
||||||
|
Net loss at subsidiary attributable to noncontrolling interests
|
61,258
|
|
46,804
|
|
36,286
|
|
||||||
|
Net income (loss) attributable to common shareholders
|
$
|
2,423,723
|
|
$
|
(2,104,614
|
)
|
$
|
5,842,492
|
|
|||
|
Earnings (loss) per share attributable to common shareholders:
|
||||||||||||
|
Basic
|
$
|
0.14
|
|
$
|
(0.11
|
)
|
$
|
0.30
|
|
|||
|
Diluted
|
$
|
0.14
|
|
$
|
(0.11
|
)
|
$
|
0.30
|
|
|||
|
Weighted-average common shares outstanding:
|
||||||||||||
|
Basic
|
17,617,765
|
|
18,332,997
|
|
19,564,625
|
|
||||||
|
Diluted
|
17,899,632
|
|
18,332,997
|
|
19,787,537
|
|
||||||
|
Comprehensive income (loss) attributable to common shareholders
|
$
|
2,423,723
|
|
$
|
(2,104,614
|
)
|
$
|
5,842,492
|
|
|||
|
Net loss at subsidiary attributable to noncontrolling interests
|
61,258
|
|
46,804
|
|
36,286
|
|
||||||
|
Total comprehensive income (loss)
|
$
|
2,362,465
|
|
$
|
(2,151,418
|
)
|
$
|
5,806,206
|
|
|||
See accompanying notes to consolidated financial statements.
F-5
CUMBERLAND PHARMACEUTICALS INC. AND SUBSIDIARIES
Consolidated Statements of Cash Flows
Years ended December 31, 2014, 2013 and 2012
|
2014
|
2013
|
2012
|
||||||||||
|
Cash flows from operating activities:
|
||||||||||||
|
Net income (loss)
|
$
|
2,362,465
|
|
$
|
(2,151,418
|
)
|
$
|
5,806,206
|
|
|||
|
Adjustments to reconcile net income (loss) to net cash flows provided by operating activities:
|
||||||||||||
|
Depreciation and amortization expense
|
1,989,564
|
|
1,301,835
|
|
901,649
|
|
||||||
|
Deferred tax benefit
|
(309,330
|
)
|
(1,579,918
|
)
|
(829,846
|
)
|
||||||
|
Share-based compensation
|
761,663
|
|
674,955
|
|
636,528
|
|
||||||
|
Excess tax benefit derived from exercise of stock options
|
(1,653,028
|
)
|
(48,024
|
)
|
(3,760,766
|
)
|
||||||
|
Noncash interest expense
|
38,634
|
|
24,075
|
|
24,075
|
|
||||||
|
Noncash investment (gains) losses
|
(52,040
|
)
|
178,822
|
|
(45,814
|
)
|
||||||
|
Net changes in assets and liabilities affecting operating activities, net of effect of business combination:
|
||||||||||||
|
Accounts receivable
|
(974,304
|
)
|
1,486,777
|
|
1,065,689
|
|
||||||
|
Inventories
|
1,532,563
|
|
495,473
|
|
(443,661
|
)
|
||||||
|
Prepaid, other current assets and other assets
|
(1,011,365
|
)
|
117,021
|
|
(648,941
|
)
|
||||||
|
Accounts payable and other accrued liabilities
|
3,846,482
|
|
58,855
|
|
4,373,276
|
|
||||||
|
Other long-term liabilities
|
162,127
|
|
187,673
|
|
56,787
|
|
||||||
|
Net cash provided by operating activities
|
6,693,431
|
|
746,126
|
|
7,135,182
|
|
||||||
|
Cash flows from investing activities:
|
||||||||||||
|
Additions to property and equipment
|
(163,258
|
)
|
(97,412
|
)
|
(464,893
|
)
|
||||||
|
Cash paid for acquisitions
|
(2,000,000
|
)
|
—
|
|
—
|
|
||||||
|
Additions to intangible assets
|
(3,101,565
|
)
|
(7,462,080
|
)
|
(2,071,926
|
)
|
||||||
|
Proceeds from sale of marketable securities
|
3,437,645
|
|
6,859,061
|
|
5,220,480
|
|
||||||
|
Purchases of marketable securities
|
(4,207,262
|
)
|
(4,371,508
|
)
|
(21,860,802
|
)
|
||||||
|
Net cash used in investing activities
|
(6,034,440
|
)
|
(5,071,939
|
)
|
(19,177,141
|
)
|
||||||
|
Cash flows from financing activities:
|
||||||||||||
|
Net (repayments) borrowings on line of credit
|
—
|
|
(4,359,951
|
)
|
(500,000
|
)
|
||||||
|
Repurchase of common shares
|
(4,315,444
|
)
|
(4,800,908
|
)
|
(8,086,594
|
)
|
||||||
|
Exercise of stock options
|
—
|
|
(41,276
|
)
|
618,022
|
|
||||||
|
Sale of subsidiary shares to noncontrolling interest
|
1,000,005
|
|
—
|
|
—
|
|
||||||
|
Excess tax benefit derived from exercise of stock options
|
1,653,028
|
|
48,024
|
|
3,760,766
|
|
||||||
|
Net cash used in financing activities
|
(1,662,411
|
)
|
(9,154,111
|
)
|
(4,207,806
|
)
|
||||||
|
Net decrease in cash and cash equivalents
|
(1,003,420
|
)
|
(13,479,924
|
)
|
(16,249,765
|
)
|
||||||
|
Cash and cash equivalents, beginning of year
|
40,869,457
|
|
54,349,381
|
|
70,599,146
|
|
||||||
|
Cash and cash equivalents, end of year
|
$
|
39,866,037
|
|
$
|
40,869,457
|
|
$
|
54,349,381
|
|
|||
|
Supplemental disclosure of cash flow information:
|
||||||||||||
|
Net cash paid (refunded) during the year for:
|
||||||||||||
|
Interest
|
$
|
28,440
|
|
$
|
79,347
|
|
$
|
47,910
|
|
|||
|
Income taxes
|
17,077
|
|
(129,509
|
)
|
112,381
|
|
||||||
|
Noncash investing and financing activities:
|
||||||||||||
|
Change in unpaid invoices for purchases of intangibles
|
(1,574,847
|
)
|
543,905
|
|
888,141
|
|
||||||
See accompanying notes to consolidated financial statements.
F-6
CUMBERLAND PHARMACEUTICALS INC. AND SUBSIDIARIES
Consolidated Statements of Equity
Years ended December 31, 2014, 2013 and 2012
|
|
Cumberland Pharmaceuticals Inc. Shareholders
|
|
|
||||||||||||||||
|
|
Common stock
|
Retained earnings
|
Non-controlling interest
|
Total equity
|
|||||||||||||||
|
|
Shares
|
Amount
|
|||||||||||||||||
|
Balance, December 31, 2011
|
20,020,535
|
|
70,272,155
|
|
12,656,662
|
|
(93,548
|
)
|
82,835,269
|
|
|||||||||
|
Net income
|
5,842,492
|
|
(36,286
|
)
|
5,806,206
|
|
|||||||||||||
|
Share-based compensation
|
20,199
|
|
632,818
|
|
632,818
|
|
|||||||||||||
|
Exercise of options and related tax benefit
|
165,182
|
|
4,378,788
|
|
4,378,788
|
|
|||||||||||||
|
Repurchase of common shares
|
(1,268,809
|
)
|
(8,086,594
|
)
|
(8,086,594
|
)
|
|||||||||||||
|
Balance, December 31, 2012
|
18,937,107
|
|
67,197,167
|
|
18,499,154
|
|
(129,834
|
)
|
85,566,487
|
|
|||||||||
|
Net loss
|
(2,104,614
|
)
|
(46,804
|
)
|
(2,151,418
|
)
|
|||||||||||||
|
Share-based compensation
|
19,743
|
|
670,934
|
|
670,934
|
|
|||||||||||||
|
Exercise of options and related tax benefit
|
36,758
|
|
6,748
|
|
6,748
|
|
|||||||||||||
|
Repurchase of common shares
|
(1,008,105
|
)
|
(4,800,908
|
)
|
(4,800,908
|
)
|
|||||||||||||
|
Balance, December 31, 2013
|
17,985,503
|
|
63,073,941
|
|
16,394,540
|
|
(176,638
|
)
|
79,291,843
|
|
|||||||||
|
Net income
|
2,423,723
|
|
(61,258
|
)
|
2,362,465
|
|
|||||||||||||
|
Share-based compensation
|
15,300
|
|
760,894
|
|
760,894
|
|
|||||||||||||
|
Exercise of options and related tax benefit
|
—
|
|
1,653,028
|
|
1,653,028
|
|
|||||||||||||
|
Sale of subsidiary shares to noncontrolling interest
|
—
|
|
769,991
|
|
—
|
|
230,014
|
|
1,000,005
|
|
|||||||||
|
Repurchase of common shares
|
(881,810
|
)
|
(4,315,444
|
)
|
(4,315,444
|
)
|
|||||||||||||
|
Balance, December 31, 2014
|
17,118,993
|
|
$
|
61,942,410
|
|
$
|
18,818,263
|
|
$
|
(7,882
|
)
|
$
|
80,752,791
|
|
|||||
See accompanying notes to consolidated financial statements.
F-7
CUMBERLAND PHARMACEUTICALS INC. AND SUBSIDIARIES
Notes to Consolidated Financial Statements
|
(1)
|
Organization
|
Cumberland Pharmaceuticals Inc. and its subsidiaries (the "Company," "Cumberland," or in certain context "our" or "we") is a specialty pharmaceutical company focused on the acquisition, development and commercialization of branded prescription products. The Company's primary target markets are hospital acute care and gastroenterology. These medical specialties are characterized by relatively concentrated prescriber bases that the Company believes can be penetrated effectively by small, targeted sales forces. Cumberland is dedicated to providing innovative products that improve quality of care for patients and address unmet or poorly met medical needs.
Cumberland focuses its resources on maximizing the commercial potential of it's products, as well as developing new product candidates, and has both internal development and commercial capabilities. The Company’s products are manufactured by third parties, which are overseen by Cumberland’s quality control and manufacturing professionals. The Company works closely with its third-party distribution partner to make its products available in the United States.
In order to create access to a pipeline of early-stage product candidates, the Company formed a subsidiary, Cumberland Emerging Technologies, Inc. ("CET"), which assists universities and other research organizations to help bring biomedical projects from the laboratory to the marketplace. The Company’s ownership in CET is
80%
. In 2014, the Company organized an equity financing to recapitalize and strengthen the financial position of CET. This financing included an investment of approximately
$1.0 million
from Harbin Gloria Pharmaceuticals Co., Ltd. (“Gloria”) for their participation in CET. As a result, Gloria received shares in CET and joined the CET ownership group. As noted above, the ownership interests of CET includes Gloria and Cumberland, while the remaining interest is owned by Vanderbilt University and the Tennessee Technology Development Corporation. The operating results of CET are allocated to noncontrolling interests in the consolidated statements of operations were approximately $
61,258
, $
46,804
and $
36,286
for the years ended
December 31, 2014
,
2013
and
2012
, respectively.
Effective January 1, 2007, the Company formed a wholly-owned subsidiary, Cumberland Pharma Sales Corp. ("CPSC"). CPSC is the subsidiary that employs the Company's hospital and field sales forces.
(2)
Significant Accounting Policies
Principles of Consolidation
The consolidated financial statements of the Company are stated in U.S. dollars and are prepared using U.S. generally accepted accounting principles. These financial statements include the accounts of the Company and its wholly and majority-owned subsidiaries. All significant intercompany transactions and accounts have been eliminated in consolidation.
Use of Estimates
The preparation of the consolidated financial statements in conformity with U.S. generally accepted accounting principles requires management of the Company to make estimates and assumptions that affect the reported amounts of assets and liabilities and disclosure of contingent liabilities at the date of the consolidated financial statements and the reported amounts of revenues and expenses during the period. Actual results could differ from those estimates under different assumptions and conditions. The Company's most significant estimates include: (1) its allowances for chargebacks and accruals for rebates and product returns and (2) the allowances for obsolescent or unmarketable inventory.
F-8
CUMBERLAND PHARMACEUTICALS INC. AND SUBSIDIARIES
Notes to Consolidated Financial Statements — (Continued)
Segment Reporting
The Company has
one
operating segment which is specialty pharmaceutical products. Management has chosen to organize the Company based on the type of products sold. Operating segments are identified as components of an enterprise about which separate discrete financial information is evaluated by the chief operating decision maker, or decision-making group, in making decisions regarding resource allocation and assessing performance. The Company, which uses consolidated financial information in determining how to allocate resources and assess performance, evaluated that our specialty pharmaceutical products compete in similar economic markets and similar circumstances. Substantially all of the Company’s assets are located in the United States. Total revenues are primarily attributable to U.S. customers. Net revenues from customers outside the United States were approximately $
0.6 million
, $
0.8 million
and $
0.7 million
for the years ended
December 31, 2014
,
2013
and
2012
, respectively.
Fair Value of Financial Instruments
Fair value of financial assets and liabilities is the price the Company would receive to sell an asset or pay to transfer a liability in an orderly transaction with a market participant at the measurement date. The Company's fair value measurements follow the appropriate rules as well as the fair value hierarchy that prioritizes the information used to develop the measurements. It applies whenever other guidance requires (or permits) assets or liabilities to be measured at fair value and gives the highest priority to unadjusted quoted prices in active markets for identical assets or liabilities (Level 1 measurements) and the lowest priority to unobservable inputs (Level 3 measurements).
A summary of the fair value hierarchy that prioritizes observable and unobservable inputs used to measure fair value into three broad levels is described below:
|
Level 1 -
|
Quoted prices for identical instruments in active markets.
|
|
Level 2 -
|
Quoted prices for similar instruments in active markets; quoted prices for identical or similar instruments in markets that are not active; and model-derived valuations whose inputs are observable or whose significant value drivers are observable.
|
|
Level 3 -
|
Significant inputs to the valuation model are unobservable.
|
We maintain policies and procedures to value instruments using the best and most relevant data available. The following section describes the valuation methodologies we use to measure different financial instruments at fair value on a recurring basis.
The Company’s financial instruments include cash and cash equivalents, marketable securities, accounts receivable, accounts payable, accrued liabilities, and a revolving line of credit. The carrying values for cash and cash equivalents, accounts receivable, accounts payable and accrued liabilities approximate their fair values due to their short-term nature. The revolving line of credit has a variable interest rate, which approximates the current market rate.
The Company's fair values of marketable securities are determined based on valuations provided by a third-party pricing service, as derived from such services' pricing models, and are considered either Level 1 or Level 2 measurements, depending on the nature of the investment. The Company has no marketable securities in which the fair value is determined based on Level 3. The level of management judgment required in evaluating fair value for Level 1 investments is minimal. Similarly, there is little subjectivity or judgment required for Level 2 investments valued using valuation models that are standard across the industry and whose parameter inputs are quoted in active markets. Inputs to the models may include, but are not limited to, reported trades, executable bid and ask prices, broker/dealer quotations, prices or yields of securities with similar characteristics, benchmark curves or information pertaining to the issuer, as well as industry and economic events. Based on the information available, the Company
F-9
CUMBERLAND PHARMACEUTICALS INC. AND SUBSIDIARIES
Notes to Consolidated Financial Statements — (Continued)
believes that the valuations provided by the third-party pricing service, as derived from such services' pricing models, are representative of prices that would be received to sell the assets at the measurement date (exit prices).
Cash and Cash Equivalents
Cash and cash equivalents include highly liquid investments with original maturities of three months or less. As of
December 31, 2014
and
2013
, cash equivalents consist primarily of money market funds.
Marketable Securities
The Company invests in marketable debt securities in order to maximize its return on cash. Marketable securities consist of U.S. Treasury notes and bonds, U.S. Government Agency notes and bonds and bank-guaranteed, variable rate demand notes (VRDN). At the time of purchase, the Company classifies marketable securities as either trading securities or available-for-sale securities, depending on the intent at that time. As of
December 31, 2014
and
2013
, marketable securities were comprised solely of trading securities. Trading securities are carried at fair value with unrealized gains and losses recognized as a component of interest income in the consolidated statements of operations.
Accounts Receivable
Trade accounts receivable are recorded at the invoiced amount. The Company records allowances for amounts that could become uncollectible in the future based on historical experience, including amounts related to chargebacks, cash discounts and credits for damaged product. The Company reviews each customer balance to assess collectibility.
The majority of the Company’s products are distributed through independent pharmaceutical wholesalers. Net product revenues and accounts receivable take into account the sale of the product at the wholesale acquisition cost, and an accrual is recorded to reflect the difference between the wholesale acquisition cost and the estimated average end-user contract price. This accrual is calculated on a product-specific basis and is based on the estimated number of outstanding units sold to wholesalers that will ultimately be sold in end-user contracts. When the wholesaler sells the product to the end-user at the agreed upon end-user contract price, the wholesaler charges the Company for the difference between the wholesale acquisition price and the end-user contract price and this chargeback is offset against the initial accrual balance.
Cash discounts are reductions to invoiced amounts offered to customers for payment within a specified period of time from the date of the invoice.
At the time a transaction is recognized as a sale, the Company records a reduction in revenues for an estimate of damaged product in the shipment. The Company’s estimate of the allowance for damaged product is based upon historical experience of claims made for damaged product.
Inventories
The Company works closely with third parties to manufacture and package finished goods for sale. Based on the customer relationship with the manufacturer or packager, the Company will either take title to finished goods at the time of shipment or at the time of arrival from the manufacturer. The Company then warehouses such goods until distribution and sale. Inventories are stated at the lower of cost or market with cost determined using the first-in, first-out method.
The Company continually evaluates inventories for potential losses due to excess, obsolete or slow-moving inventory by comparing sales history and sales projections to the inventory on hand. When evidence indicates the carrying value of a product may not be recoverable, a charge is recorded to reduce the inventory to its current net realizable value.
F-10
CUMBERLAND PHARMACEUTICALS INC. AND SUBSIDIARIES
Notes to Consolidated Financial Statements — (Continued)
Prepaid and Other Current Assets
Prepaid and other current assets consist of the current portion of unamortized deferred financing costs, prepaid insurance premiums, prepaid consulting services and annual fees paid to the U.S. Food and Drug Administration ("FDA"). The Company expenses all prepaid amounts as used or over the period of benefit primarily on a straight-line basis, as applicable.
Property and Equipment
Property and equipment, including leasehold improvements, are stated at cost. Depreciation is recognized using the straight-line method over the estimated useful lives of the assets. Leasehold improvements are amortized over the shorter of the initial lease term plus renewal options, if reasonably assured, or the remaining useful life of the asset. Upon retirement or disposal of assets, any gain or loss is reflected as a component of operating income in the consolidated statement of operations. Improvements that extend an asset’s useful life are capitalized. Repairs and maintenance costs are expensed as incurred.
Intangible Assets
The Company’s intangible assets consist of capitalized costs related to product and license rights, patents and trademarks.
The cost of acquiring product and license rights are capitalized at fair value at the date of acquisition for products that are approved by the FDA for commercial use. These costs are amortized ratably over the estimated economic life of the product. The economic life is estimated based upon the term of the license agreement, patent life or market exclusivity of the product and based on management's assessment of future sales and profitability of the product. This estimate is evaluated on a regular basis during the amortization period and adjusted if appropriate. If there are any changes made to the useful life of the product and license rights, the costs associated with such a change, if any, will be capitalized and amortized over the revised useful life.
Capitalized patent costs consist of outside legal costs associated with obtaining and protecting patents on products that have been approved for marketing by the FDA. If it becomes probable that a patent will not be issued or a patent has been declared invalid, related costs associated with the patent application are expensed at the time such determination is made. All costs associated with obtaining patents for products that have not been approved for marketing by the FDA are expensed as incurred.
Amortization expense is recognized ratably over the following periods:
|
Product rights
|
Estimated economic life
|
|
|
License rights
|
Term of license agreement
|
|
|
Patents
|
Life of patent
|
|
Impairment of Long-Lived Assets
Long-lived assets, such as property and equipment and intangible assets subject to amortization, are reviewed for impairment whenever events or changes in circumstances indicate the carrying amount of an asset may not be recoverable. If events or circumstances arise that require a long-lived asset to be tested for potential impairment, the Company first compares undiscounted cash flows expected to be generated by the asset to its carrying value. If the carrying amount of the long-lived asset is not recoverable on an undiscounted cash flow basis, an impairment charge is recognized to the extent that the carrying value exceeds the fair value. Fair value is determined through various valuation techniques including quoted market prices, third-party independent appraisals and discounted cash flow models.
F-11
CUMBERLAND PHARMACEUTICALS INC. AND SUBSIDIARIES
Notes to Consolidated Financial Statements — (Continued)
Assets to be disposed of, if any, are separately presented in the consolidated balance sheet and reported at the lower of the carrying amount or fair value less costs to sell, and no further depreciation or amortization is recorded on the asset upon classification as held-for-sale. The assets and liabilities of a disposal group classified as held-for-sale, if any, are presented separately in the appropriate asset and liability sections of the consolidated balance sheet. The Company recorded
no
impairment charges during
2014
,
2013
and
2012
.
Revenue Recognition
Revenue is realizable and earned when all of the following criteria are met: persuasive evidence of an arrangement exists; delivery has occurred or services have been rendered; the seller’s price to the buyer is fixed and determinable; and collectibility of the related receivable is reasonably assured. Delivery is considered to have occurred upon either shipment of the product or arrival at its destination, depending upon the shipping terms of the transaction.
Product Revenues
The Company’s net product revenue reflects the reduction from gross product revenue for estimated allowances for chargebacks, discounts and damaged goods, and reflects sales related accruals for rebates, product returns, certain administrative and service fees.
As discussed above, the allowances against accounts receivable for chargebacks, discounts and damaged goods are determined on a product-by-product basis, and established by management as the Company’s best estimate at the time of sale based on each product’s historical experience adjusted to reflect known changes in the factors that impact such allowances. These allowances are established based on the contractual terms with direct and indirect customers and analyses of historical levels of chargebacks, discounts and credits claimed for damaged product.
Other organizations, such as managed care providers, pharmacy benefit management companies and government agencies, may receive rebates from the Company based on either negotiated contracts to carry the Company’s products or reimbursements for filled prescriptions. These entities are considered indirect customers of the Company. In addition, the Company may provide rebates to end-user customers. In conjunction with recognizing a sale to a wholesaler, sales revenues are reduced and accrued liabilities are increased by the Company’s estimate of the rebate that may be claimed.
Consistent with industry practice, the Company maintains a return policy that allows customers to return product within a specified period prior to and subsequent to the expiration date. The Company’s estimate of the provision for returns is based upon historical experience. Any changes in the assumptions used to estimate the provision for returns are recognized in the period those assumptions changed.
The Company has agreements with certain key wholesalers that include a fee for service costs. These costs are netted against product revenues.
Other Revenues
Other revenues primarily consist of income from grant funding programs, licensing agreements, leases and contract services. Revenue related to grants is recognized when all conditions related to such grants have been met. All other revenue is recognized when earned.
The Company is a party to several licensing arrangements with customers that purchase product from the Company. Under these licensing arrangements, the third-party licensee may have access to the Company's FDA registration file. Licensing arrangements typically include an up-front payment for gaining access to the FDA registration file, royalties and milestone payments upon the achievement of specific sales levels. The amounts received for access to the FDA registration file are evaluated and based on the evaluation, the resulting revenue is either recognized upfront or recognized over the term of the arrangement. Royalties and milestones are recognized as revenue when earned. For substantive milestones, the Company uses the milestone method of recognizing
F-12
CUMBERLAND PHARMACEUTICALS INC. AND SUBSIDIARIES
Notes to Consolidated Financial Statements — (Continued)
revenue if it is commensurate with either the performance to achieve the milestone or the enhancement of the value of the delivered item, it relates solely to past performance and it is reasonable relative to other milestones.
Cost of Products Sold
Cost of products sold consists principally of the cost to acquire each unit of product sold, including in-bound freight expense. Cost of products sold also includes expenses associated with the write-down of slow-moving or expired product.
Selling and Marketing Expense
Selling and marketing expense consists primarily of expenses relating to the advertising, promotion, distribution and sale of products, including royalty expense, salaries and related costs.
Distribution Costs
Distribution costs are expensed as incurred and totaled $
1.0 million
in
2014
and $
0.9 million
in both
2013
and
2012
. They are included as a component of selling and marketing expenses in the consolidated statements of operations.
Advertising Costs
Advertising costs are expensed as incurred. These costs were $
2.5 million
, $
2.1 million
and $
3.0 million
in
2014
,
2013
and
2012
, respectively, and are included as a component of selling and marketing expenses in the consolidated statements of operations.
Research and Development
Research and development costs are expensed in the period incurred. Research and development costs are comprised mainly of clinical trial expenses, salaries, wages and other related costs such as materials and supplies. Development expense includes activities performed by third-party providers participating in the Company’s clinical studies. The Company accounts for these costs based on estimates of work performed, patients enrolled or fixed fees for services.
Income Taxes
The Company provides for deferred taxes using the asset and liability approach. Under this method, deferred tax assets and liabilities are recognized for future tax consequences attributable to operating loss and tax credit carryforwards, as well as differences between the carrying amounts of existing assets and liabilities and their respective tax bases. The Company’s principal differences are related to the timing of deductibility of certain items, such as inventory, depreciation, amortization and expense for nonqualified stock options. Deferred tax assets and liabilities are measured using enacted statutory tax rates that are expected to apply to taxable income in the years such temporary differences are anticipated to be recovered or settled. The effect on deferred tax assets and liabilities of a change in tax rates is recognized in income in the period of enactment. The Company only recognizes income tax benefits associated with an income tax position in which it is “more likely than not” that the position would be sustained upon examination by the taxing authorities.
In assessing the realizability of deferred tax assets, management considers whether it is more likely than not that some portion or all of the deferred tax assets will not be realized. The ultimate realization of deferred tax assets is dependent upon the generation of future taxable income during the periods in which those temporary differences become deductible. Management considers the scheduled reversal of deferred tax liabilities, projected future taxable income and tax planning strategies in making this assessment.
The tax benefit associated with the exercise of nonqualified stock options is recognized when the benefit is used to offset income taxes payable.
F-13
CUMBERLAND PHARMACEUTICALS INC. AND SUBSIDIARIES
Notes to Consolidated Financial Statements — (Continued)
The Company’s accounting policy with respect to interest and penalties arising from income tax settlements is to recognize them as part of the provision for income taxes.
Comprehensive Income (Loss)
Total comprehensive income (loss) was comprised solely of net income (loss) for all periods presented.
Earnings (Loss) per Share
Basic earnings per share is calculated by dividing net income attributable to common shareholders by the weighted-average number of shares outstanding. Except where the result would be antidilutive to income from continuing operations, diluted earnings per share is calculated by assuming the vesting of unvested restricted stock and the exercise of stock options and warrants, unrecognized compensation costs, as well as the related income tax benefits.
Share-Based Payments
The Company recognizes compensation cost for all share-based payments issued, modified, repurchased or canceled. The cost of stock options is measured based on the grant-date fair value using the Black-Scholes option-pricing model, and the expense is recognized over the employee’s requisite service period. Depending on the nature of the vesting provisions, restricted stock awards are measured using either the fair value on the grant date or the fair value of common stock on the date the vesting provisions lapse. Prior to the lapse for those equity grants not valued on the grant date, the fair value is measured on the last day of the reporting period.
Collaborative Agreements
The Company is a party to several collaborative arrangements with certain research institutions to identify and pursue promising pre-clinical pharmaceutical product candidates. The Company has determined these collaborative agreements do not meet the criteria for accounting under Accounting Standards Codification 808, Collaborative Agreements. The agreements do not specifically designate each party's rights and obligations to each other under the collaborative arrangements. Except for patent defense costs, expenses incurred by one party are not required to be reimbursed by the other party. The funding for these programs is generally provided through private sector investments or federal Small Business Administration ("SBIR/STTR") grant programs. Expenses incurred under these collaborative agreements are included in research and development expenses in the consolidated statements of operations. Funding received from private sector investments and grants are recorded as net revenues in the consolidated statements of operations.
Recent Accounting Guidance
In April 2014, the Financial Accounting Standards Board (the "FASB") issued amended guidance in the form of a FASB Accounting Standards Update on "Reporting Discontinued Operations and Disclosures of Disposals of Components of an Entity". The new guidance restricts the presentation of discontinued operations to business circumstances when the disposal of business operations represents a strategic shift that has or will have a major effect on an entity's operations and financial results. The guidance becomes effective on January 1, 2015. Adoption is on a prospective basis.
In May 2014, the FASB issued amended guidance in the form of a FASB Accounting Standards Update on, "Revenue from Contracts with Customers". The core principle of the new guidance is to recognize revenues when promised goods or services are transferred to customers in an amount that reflects the consideration to which an entity expects to be entitled for those goods or services. The new guidance defines a five step process to achieve this core principle and, in doing so, additional judgments and estimates may be required within the revenue recognition process. The new standard will replace most of the existing revenue recognition standards in U.S. GAAP when it becomes effective on January 1, 2017. Early adoption is not permitted. The new standard can be applied retrospectively to each prior reporting period presented or retrospectively with the cumulative effect of
F-14
CUMBERLAND PHARMACEUTICALS INC. AND SUBSIDIARIES
Notes to Consolidated Financial Statements — (Continued)
the change recognized at the date of the initial application. The Company is assessing the potential impact of the new standard on financial reporting and has not yet selected a transition method by which we will adopt the standard in 2017.
(3) New Products
Vaprisol
On February 28, 2014, the Company acquired certain product rights, intellectual property and related assets of Vaprisol
from Astellas Pharma US, Inc. ("Astellas"). Vaprisol is a patented, prescription brand indicated to raise serum sodium levels in hospitalized patients with euvolemic and hypervolemic hyponatremia. The product was developed and registered by Astellas and then launched in 2006. It is one of two branded prescription products indicated for the treatment of hyponatremia. The Company provided an upfront payment of
$2.0 million
to Astellas at closing. There is an additional milestone payment due forty-five days after the first anniversary date of the closing of the transaction of up to
$2.0 million
, dependent upon Cumberland achieving certain first year sales levels for the product. Cumberland's acquisition of Vaprisol is accounted for as a business combination and the products sales are included in the results of operations subsequent to the acquisition date.
The following table summarizes the preliminary allocation of the fair values of the assets acquired and liabilities assumed as of the acquisition date for Vaprisol:
|
Intellectual property intangible assets
|
$
|
2,990,000
|
|
|
Inventories
|
1,410,000
|
|
|
|
Acquired contingent liabilities
|
(400,000
|
)
|
|
|
Contingent consideration obligation
|
(2,000,000
|
)
|
|
|
Total net assets acquired
|
$
|
2,000,000
|
|
The contingent consideration obligation represents the additional milestone payment discussed above. Cumberland prepared the valuations of the contingent consideration obligation and the intangible assets utilizing significant unobservable inputs. As a result, the valuations are classified as Level 3 fair value measurements. The Company continues to evaluate the assets acquired and liabilities assumed during the measurement period. Vaprisol contributed
$3.0 million
in net revenues during
2014
. The pro-forma effects of the acquisition on the condensed consolidated financial statements were not deemed material for disclosure purposes.
Omeclamox-Pak
On October 28, 2013, the Company entered into an agreement with Pernix Therapeutics ("Pernix") to distribute and promote Omeclamox-Pak. Omeclamox-Pak is a branded prescription product that combines omeprazole, amoxicillin and clarithromycin for the treatment of Helicobacter pylori (
H. pylori
) infection and duodenal ulcer disease. Under the terms of the agreement, the Company promotes the product to gastroenterologists across the United States and Pernix promotes the product through its specialty sales force focusing on select primary care physicians. The companies cooperate in the marketing and other activities needed to support the commercialization of the brand. The Company paid an upfront payment of
$4.0 million
to Pernix on October 29, 2013. The agreement calls for additional milestones at the first and second anniversary dates of the execution of the agreement totaling
$4.0 million
in the aggregate. Cumberland was not required to make the first milestone payment of
$1.0 million
to Pernix as all the criteria for that payment were not met. Royalty payments ranging from
15%
to
20%
based on tiered levels of gross profits are paid by Cumberland to Pernix. The Company also makes royalty payments to Pernix to reflect their ongoing sales promotional efforts.
F-15
CUMBERLAND PHARMACEUTICALS INC. AND SUBSIDIARIES
Notes to Consolidated Financial Statements — (Continued)
The
$4.0 million
upfront payment that the Company paid to Pernix on October 29, 2013 is included in product and license rights and will be amortized over the remaining expected useful life of the acquired asset, currently the life of the agreement, which ends in June 2032. Omeclamox-Pak contributed
$4.1 million
in net revenues during
2014
and
$1.0 million
during
2013
.
(4) Revenues
Product Revenues
The Company’s net product revenues consisted of the following for the years ended December 31:
|
2014
|
2013
|
2012
|
||||||||||
|
Products:
|
||||||||||||
|
Acetadote
|
$
|
11,906,232
|
|
$
|
18,846,753
|
|
$
|
37,522,180
|
|
|||
|
Omeclamox-Pak
|
4,111,916
|
|
1,045,815
|
|
—
|
|
||||||
|
Kristalose
|
14,932,271
|
|
9,118,475
|
|
9,429,741
|
|
||||||
|
Vaprisol
|
3,011,997
|
|
—
|
|
—
|
|
||||||
|
Caldolor
|
2,721,346
|
|
2,089,655
|
|
992,110
|
|
||||||
|
Total net product revenues
|
$
|
36,683,762
|
|
$
|
31,100,698
|
|
$
|
47,944,031
|
|
|||
As discussed in Note 3, the Company acquired rights to
two
new products, Omeclamox-Pak and Vaprisol, and both contributed to Cumberland's net revenue during 2014. On October 28, 2013, Cumberland entered into an agreement with Pernix to distribute and promote Omeclamox-Pak. Under the terms of the agreement, effective October 1, 2013, the Company began to record the revenue of this product and effective January 2014 Cumberland began distributing Omeclamox-Pak and promoting it to gastroenterologists across the United States. On February 28, 2014, Cumberland entered into an agreement with Astellas to acquire Vaprisol including certain product rights, intellectual property and related assets. The Company began selling Vaprisol in March 2014 and launched promotional efforts for the brand in May 2014.
As part of the November 12, 2012, Settlement Agreement with Paddock and Perrigo, the Company supplies Perrigo with an Authorized Generic ("Authorized Generic") version of the Company's Acetadote product. The Company's revenue generated by sales of its Authorized Generic distributed by Perrigo is included in the Acetadote product revenue presented above. The Company's share of Authorized Generic revenue was
$5.8 million
,
$9.2 million
and
$0.3 million
during
2014
,
2013
and
2012
, respectively.
In December 2011, the Company discontinued sales of the 400mg Caldolor offering domestically and focused on the 800mg Caldolor offering. During 2014, Cumberland had total sales of
$0.5 million
of its 400mg Caldolor offering outside the United States.
The allowances in accounts receivable for chargebacks, cash discounts and damaged goods were
$0.4 million
at
December 31, 2014
and
$0.6 million
at December 31, 2013, and the accruals for rebates, product returns and certain administrative and service fees included in other current liabilities were
$5.2 million
and $
2.4 million
, respectively, at
December 31, 2014
and 2013.
Other Revenues
During 2013, the Company entered into
six
new agreements with international partners for commercialization of certain of the Company's products into additional international territories and amended its agreement with Gloria, a Chinese pharmaceutical company, to extend its territory. As a result of the new and amended agreements, the Company recognized approximately
$0.6 million
of non-refundable up-front payments as other revenue in the consolidated statement of operations during 2013.
The agreements entered into during 2013 provide that each of the partners are responsible for seeking regulatory approvals for the products, and following approvals, will handle ongoing distribution and sales in the respective international territories. The Company maintains responsibility for the intellectual property and product
F-16
CUMBERLAND PHARMACEUTICALS INC. AND SUBSIDIARIES
Notes to Consolidated Financial Statements — (Continued)
formulations. Under the licensing agreements, the Company is entitled to receive additional milestone payments upon the partners' achievement of defined regulatory approvals and sales milestones. The Company will recognize revenue for these substantive milestones using the milestone method. The agreements provide for up to
$0.6 million
in milestone payments related to regulatory approvals and up to
$4.0 million
in milestone payments related to total and annual product sales. As of
December 31, 2014
, the Company has not recognized any revenues related to milestones associated with the new agreements. The Company is also entitled to receive royalties on future sales of the products under the agreements.
In 2012, the Company entered into an exclusive licensing agreement for Acetadote and Caldolor with Harbin Gloria. In connection with the agreement, the Company has certain protective rights, including the right to review and approve all documents submitted to the Chinese State Drug Administration. During 2012, the Company received nonrefundable, up-front payments totaling approximately $
0.7 million
in exchange for the transfer of certain intellectual property, including its product dossiers, and recognized these payments as other revenue in the consolidated statement of operations when the intellectual property was provided to the licensee. The licensing agreement provides for the Company to receive additional milestone payments of $
0.7 million
when the licensee receives notice from the regulatory authority granting approval to conduct clinical trials, or stating that no clinical trials are necessary. The Company is also entitled to receive milestone payments of $
1.1 million
upon receiving regulatory approval for each of Acetadote and Caldolor in China. The Company will recognize revenue for these substantive milestones using the milestone method. As of
December 31, 2014
,
no
revenue has been recognized related to milestones associated with Harbin Gloria.
Other revenues during 2014, 2013 and 2012 also includes revenue generated by CET through grant funding from federal Small Business grant programs, and lease income generated by CET’s Life Sciences Center and contract services. The Life Sciences Center is a research center that provides scientists with access to flexible lab space and other resources to develop biomedical products. Grant revenue from SBIR/STTR programs totaled approximately $
0.1 million
for each of the years ended
December 31, 2014
, 2013 and 2012.
(5) Inventories
The Company's inventories consisted of the following as of December 31:
|
2014
|
2013
|
|||||||
|
Raw materials and work in process
|
$
|
2,571,465
|
|
$
|
2,025,020
|
|
||
|
Finished goods
|
3,028,854
|
|
3,697,862
|
|
||||
|
Total inventories
|
$
|
5,600,319
|
|
$
|
5,722,882
|
|
||
Caldolor inventory represented the majority of net inventory on hand at
December 31, 2014
and
2013
, and had varying original expiration dates that began in the second quarter of 2014 and extend through January 2016. During 2013, the Company provided stability data to the FDA supporting that the Caldolor product expiration dates may be extended by up to a year. In January 2014, the FDA notified the Company that it had approved its request to extend the original shelf life of the Caldolor 800mg vials from
five
to
six
years.
At
December 31, 2014
and
2013
, the Company has recognized and maintained cumulative charges for potential obsolescence and discontinuance losses, primarily for Caldolor, of approximately $
3.2 million
and $
3.5 million
, respectively.
In connection with the acquisition of certain product right assets related to the Kristalose brand as discussed in Note 7, the Company is responsible for purchasing the active pharmaceutical ingredient for Kristalose and maintains this raw material inventory at its third-party manufacturer. As the ingredients are consumed in production, the value of the ingredients is transferred from raw materials to finished goods.
F-17
CUMBERLAND PHARMACEUTICALS INC. AND SUBSIDIARIES
Notes to Consolidated Financial Statements — (Continued)
(6) Property and Equipment
Property and equipment consisted of the following at December 31:
|
Range of
useful lives
|
2014
|
2013
|
||||||||
|
Computer equipment
|
3 – 5 years
|
$
|
792,268
|
|
$
|
754,088
|
|
|||
|
Office equipment
|
3 – 15 years
|
171,649
|
|
132,999
|
|
|||||
|
Furniture and fixtures
|
5 – 15 years
|
703,187
|
|
616,759
|
|
|||||
|
Leasehold improvements
|
3 – 15 years, or remaining lease term
|
1,223,453
|
|
1,223,453
|
|
|||||
|
Total property and
equipment, gross
|
2,890,557
|
|
2,727,299
|
|
||||||
|
Less: accumulated depreciation
and amortization
|
(2,239,527
|
)
|
(1,846,652
|
)
|
||||||
|
Total property and
equipment, net
|
$
|
651,030
|
|
$
|
880,647
|
|
||||
Depreciation expense, including amortization expense related to leasehold improvements, was
$0.4 million
during
2014
,
2013
and
2012
. Depreciation expense is included in general and administrative expense in the consolidated statements of operations.
(7) Intangible Assets
Intangible assets consisted of the following at December 31:
|
2014
|
2013
|
|||||||
|
Product and license rights
|
$
|
16,477,749
|
|
$
|
12,139,031
|
|
||
|
Less: accumulated amortization
|
(2,225,949
|
)
|
(1,096,238
|
)
|
||||
|
Total product and license rights
|
14,251,800
|
|
11,042,793
|
|
||||
|
Patents
|
8,194,264
|
|
4,866,570
|
|
||||
|
Less: accumulated amortization
|
(877,523
|
)
|
(410,544
|
)
|
||||
|
Total patents
|
7,316,741
|
|
4,456,026
|
|
||||
|
Trademarks
|
9,020
|
|
9,020
|
|
||||
|
Less: accumulated amortization
|
(9,020
|
)
|
(9,020
|
)
|
||||
|
Total trademarks
|
—
|
|
—
|
|
||||
|
Total intangible assets
|
$
|
21,568,541
|
|
$
|
15,498,819
|
|
||
On February 28, 2014, the Company acquired the rights of the branded prescription product Vaprisol from Astellas (discussed more fully in Note 3). The intangible asset is valued at
$3.0 million
and is included in product and license rights. The asset will be amortized over the remaining expected useful life of the acquired asset, currently the life of the agreement, which ends in February 2022.
During
2013
, the Company entered into an agreement with Pernix to distribute and promote the branded prescription product Omeclamox-Pak. The
$4.0 million
upfront payment the Company paid to Pernix Therapeutics
F-18
CUMBERLAND PHARMACEUTICALS INC. AND SUBSIDIARIES
Notes to Consolidated Financial Statements — (Continued)
on October 29, 2013 (discussed more fully in Note 3) is included in product and license rights and will be amortized over the remaining expected useful life of the acquired asset, currently the life of the agreement, which ends in June 2032.
In 2011, the Company acquired the Kristalose trademark and FDA registration from Mylan Inc. The agreement requires the Company to make future quarterly payments over a
seven
-year period equal to a percentage of Kristalose net sales. The payments are being treated as consideration for the assets acquired and are being capitalized and amortized over the remaining expected useful life of the acquired asset, currently the remaining term of the
15
year agreement. During
2014
and
2013
, the Company paid
$1.3 million
and
$0.8 million
, respectively, to Mylan Inc. in Kristalose payments.
During
2014
and
2013
, the Company recorded an additional
$3.3 million
and
$2.1 million
, respectively, in intangible assets for capitalized patent costs, including amounts incurred in the protection of the Company's intellectual property. These costs will be amortized over the remaining expected useful life of the associated patents.
Amortization expense related to product and license rights, trademarks and patents was $
1.6 million
, $
0.9 million
and $
0.5 million
during
2014
,
2013
and
2012
, respectively. The expected amortization expense for the Company's current balance of intangible assets are as follows:
|
Year ending December 31:
|
||||
|
2015
|
$
|
1,949,396
|
|
|
|
2016
|
1,949,396
|
|
||
|
2017
|
1,949,396
|
|
||
|
2018
|
1,949,396
|
|
||
|
2019 and thereafter
|
13,770,957
|
|
||
|
$
|
21,568,541
|
|
||
(8) Other Current Liabilities
Other current liabilities consisted of the following at December 31:
|
2014
|
2013
|
|||||||
|
Rebates, product returns, administrative fees
and service fees
|
$
|
5,234,800
|
|
$
|
2,437,140
|
|
||
|
Employee wages and benefits
|
1,154,093
|
|
1,110,726
|
|
||||
|
Acquisition related accruals
|
2,360,960
|
|
—
|
|
||||
|
Accrued inventory purchases
|
198,000
|
|
1,236,000
|
|
||||
|
Other
|
1,558,916
|
|
726,051
|
|
||||
|
Total other current liabilities
|
$
|
10,506,769
|
|
$
|
5,509,917
|
|
||
(9) Debt
New Debt Agreement
On June 26, 2014, the Company entered into a Revolving Credit Loan Agreement (“Loan Agreement”) with SunTrust Bank. The new agreement replaced the August 2011 Fifth Amended and Restated Loan Agreement with a previous lender which was to expire on December 31, 2014. There were
no
borrowings under the Loan Agreement at
December 31, 2014
. The Loan Agreement provides for an aggregate principal amount of up to
$20.0 million
,
F-19
CUMBERLAND PHARMACEUTICALS INC. AND SUBSIDIARIES
Notes to Consolidated Financial Statements — (Continued)
and it has a
three
year term expiring on June 26, 2017. The initial revolving line of credit is up to
$12.0 million
, an increase from the
$10.0 million
under the previous agreement. The Company has the ability to increase the borrowing amount up to
$20.0 million
, upon the satisfaction of certain conditions, as defined in the Loan Agreement.
The interest rate on the Loan Agreement is based on LIBOR plus an interest rate spread. There is no LIBOR minimum and the LIBOR pricing provides for an interest rate spread of
1.0%
to
2.85%
. In addition, a fee of
0.25%
per year is charged on the unused line of credit. Interest expense and the unused line fee are payable quarterly. Borrowings under the line of credit are collateralized by substantially all of our assets.
Under the Loan Agreement, the Company is subject to certain financial covenants, including, but not limited to, maintaining an EBIT to Interest Expense Ratio and a Funded Debt Ratio, determined on a quarterly basis. The Company was in compliance with all covenants at
December 31, 2014
.
The Company incurred no early termination penalties upon termination of the previous Agreement and incurred less than
$0.1 million
in deferred financing costs related to the Loan Agreement, which will be amortized to interest expense using the effective interest method over the term of the Loan Agreement.
Previous Debt Agreement
The August 2011 Fifth Amended and Restated Loan Agreement carried an interest rate of the LIBOR Daily Floating Rate plus an applicable margin, as defined by the agreement (
2.17%
at
December 31, 2013
). Interest and an unused line of credit fee (
0.25%
per annum) were payable quarterly. There were
no
borrowings outstanding on the credit facility at
December 31, 2013
or at any time during
2014
.
Under the previous agreement, the Company was subject to certain financial covenants including, but not limited to, maintaining a leverage ratio and interest coverage ratio, as defined in the agreement. In March 2014 and May 2014, the previous agreement was amended for certain provisions related to the aggregate ownership of the Company's common stock over 30% and certain other financial covenants. As a result of the amendments, the Company was in compliance with all covenants.
(10) Shareholders’ Equity
(a) Initial Public Offering
On
August 10, 2009
, the Company completed its initial public offering of
5,000,000
shares of common stock at a price of $
17.00
per share, raising gross proceeds of $
85.0 million
. After deducting underwriting discounts of approximately $
6.0 million
and offering costs incurred of approximately $
4.2 million
, the net proceeds to the Company were approximately $
74.8 million
. Contemporaneously with the offering, each outstanding share of preferred stock was automatically converted into
two
shares of common stock.
(b) Preferred Stock
The Company is authorized to issue
20,000,000
shares of preferred stock. The Board of Directors is authorized to divide these shares into classes or series, and to fix and determine the relative rights, preferences, qualifications and limitations of the shares of any class or series so established. At
December 31, 2014
and
2013
, there was
no
preferred stock outstanding.
(c) Common Stock
During
2014
,
2013
and
2012
, the Company issued
15,300
shares,
19,743
shares and
20,199
shares of common stock, respectively, as a result of restricted shares vesting as well as other common share issuances.
In the second quarter of 2012, the Company implemented an Option Exchange Program (the "Exchange Program") whereby certain outstanding stock options could be exchanged for shares of restricted stock. The Exchange Program expired on
May 21, 2012
, at which time
424,475
outstanding options were exchanged for
F-20
CUMBERLAND PHARMACEUTICALS INC. AND SUBSIDIARIES
Notes to Consolidated Financial Statements — (Continued)
147,828
shares of restricted stock. The restriction period on the restricted stock lapses from
one
to
four
years after issuance. The Exchange Program was designed to provide a value-for-value exchange of equity instruments. The fair value of each exchanged option was determined on the date the Exchange Program commenced using the Black-Scholes option pricing model, and the following assumptions:
|
Range of Assumptions
|
||
|
Dividend yield
|
—
|
|
|
Expected term (years)
|
1.3 - 7.3
|
|
|
Expected volatility
|
37% - 78%
|
|
|
Risk-free interest rate
|
0.23% - 1.50%
|
|
The Exchange Program resulted in
no
incremental compensation expense during 2012. The remaining unrecognized compensation costs for the exchanged options on the date of the exchange was approximately $
0.3 million
, and will be recognized over the restriction period.
The payment of dividends is restricted by the Agreement with the Company’s primary lender.
(d) Warrants
In connection with the issuance of shares of common stock to a related party in 2004, the Company issued warrants to purchase
40,000
shares of common stock at $
6.00
per share at any time within
10 years
of issuance.
All
of these warrants expired during 2014.
In 2006, the Company signed a new line of credit agreement along with a term loan agreement with a financial institution. In conjunction with these agreements, the Company issued warrants to purchase up to
3,958
shares of common stock at $
9.00
per share that expire in
April 2016
.
All
of these warrants were outstanding and exercisable as of
December 31, 2014
and
2013
.
In connection with the amendment to the debt agreements in 2009, the Company issued warrants to purchase up to
7,500
shares of common stock at $
17.00
per share that expire in
July 2019
.
All
of these warrants were outstanding and exercisable as of
December 31, 2014
and
2013
.
(e) Share Repurchases
On
May 13, 2010,
the Company announced a share repurchase program to purchase up to $
10 million
of its common stock pursuant to Rule 10b-18 of the Securities Act. In January 2011, April 2012, January 2013 and January 2015, the Company's Board of Directors replaced the prior authorizations with new $
10 million
authorizations for repurchases of the Company's outstanding common stock. The Company repurchased
881,810
shares,
1,008,105
shares and
1,268,809
shares of common stock for approximately $
4.3 million
, $
4.8 million
and $
8.1 million
during the years ended
December 31, 2014
,
2013
and
2012
, respectively.
(f) Cumberland Emerging Technologies
In April 2014, the Company received approximately
$1.0 million
from Gloria for its participation in CET. As a result, Gloria received shares in CET and will have the first right to negotiate a license to CET developed products for the Chinese market. Prior to April 2014, Cumberland owned
85%
of CET, with the balance of the enterprise being owned by Vanderbilt University and the Tennessee Technology Development Corporation. In connection with Gloria’s investment in CET, the Company also provided an additional investment in CET. Cumberland contributed
$1.0 million
in cash and provided
$2.4 million
in loan foregiveness to CET in exchange for newly issued shares. Upon completion of the additional investment by Gloria and Cumberland in April 2014, the Company’s ownership in CET is
80%
. As CET is a consolidated subsidiary, the Company reports the operating results of CET and allocates the noncontrolling interests to the non-majority partners.
F-21
CUMBERLAND PHARMACEUTICALS INC. AND SUBSIDIARIES
Notes to Consolidated Financial Statements — (Continued)
(11) Earnings Per Share
The following table shows the computation of the numerator and the denominator used to calculate diluted earnings per share for the years ended December 31:
|
2014
|
2013
|
2012
|
||||||||||
|
Numerator:
|
||||||||||||
|
Net income (loss) attributable to common shareholders
|
$
|
2,423,723
|
|
$
|
(2,104,614
|
)
|
$
|
5,842,492
|
|
|||
|
Denominator:
|
||||||||||||
|
Weighted-average shares outstanding – basic
|
17,617,765
|
|
18,332,997
|
|
19,564,625
|
|
||||||
|
Dilutive effect of restricted stock and stock options
|
281,867
|
|
—
|
|
222,912
|
|
||||||
|
Weighted-average shares outstanding – diluted
|
17,899,632
|
|
18,332,997
|
|
19,787,537
|
|
||||||
The Company's anti-dilutive restricted shares and stock options outstanding were as follows for the years ended December 31:
|
2014
|
2013
|
2012
|
|||||||
|
Anti-dilutive shares
|
194,237
|
|
407,954
|
|
687,430
|
|
|||
F-22
CUMBERLAND PHARMACEUTICALS INC. AND SUBSIDIARIES
Notes to Consolidated Financial Statements — (Continued)
(12) Income Taxes
The components of the Company's net deferred tax assets at December 31 are as follows:
|
2014
|
2013
|
|||||||
|
Deferred Tax Assets
|
||||||||
|
Net operating loss and tax credits
|
$
|
2,205,260
|
|
$
|
2,144,460
|
|
||
|
Property and equipment and intangibles
|
300,301
|
|
214,478
|
|
||||
|
Allowance for accounts receivable
|
172,008
|
|
235,446
|
|
||||
|
Reserve for expired product
|
817,736
|
|
600,406
|
|
||||
|
Inventory
|
1,412,477
|
|
1,495,895
|
|
||||
|
Deferred charges
|
1,504,835
|
|
666,236
|
|
||||
|
Cumulative compensation costs incurred on deductible equity awards
|
1,676,729
|
|
1,378,690
|
|
||||
|
Total deferred tax assets
|
8,089,346
|
|
6,735,611
|
|
||||
|
Deferred Tax Liabilities
|
||||||||
|
Intangible assets
|
(3,707,535
|
)
|
(2,683,587
|
)
|
||||
|
Net deferred tax assets, before valuation allowance
|
4,381,811
|
|
4,052,024
|
|
||||
|
Less: deferred tax asset valuation allowance
|
(152,074
|
)
|
(131,617
|
)
|
||||
|
Net deferred tax assets
|
$
|
4,229,737
|
|
$
|
3,920,407
|
|
||
The following table summarizes the amount and year of expiration of the Company's federal and state net operating loss carryforwards as of
December 31, 2014
:
|
Years of expiration
|
Federal
|
State
|
||||||
|
2015
|
$
|
—
|
|
$
|
83,179
|
|
||
|
2016 - 2017
|
—
|
|
421,643
|
|
||||
|
2018 - 2024
|
—
|
|
47,289,732
|
|
||||
|
2029
|
44,197,129
|
|
—
|
|
||||
|
2033 and 2034
|
$
|
1,984,927
|
|
$
|
2,633,987
|
|
||
|
Total federal and state net operating loss carryforwards
|
$
|
46,182,056
|
|
$
|
50,428,541
|
|
||
The Company has total recognized carryforward tax assets of
$0.2 million
for foreign tax credits and AMT carryforwards. In addition, the Company has recognized as of
December 31, 2014
federal Orphan Drug and Research and Development tax credits of
1.1 million
that expire between 2021 and 2034.
The Company has unrecognized net operating loss carryforwards generated from the exercise of nonqualified options of approximately $
44.2 million
. These benefits occurred as a result of the actual tax benefit realized upon an employee's exercise exceeding the cumulative book compensation charge associated with the awards and will be recognized in the year in which they are able to reduce current income taxes payable. Accordingly, deferred tax assets are not recognized for these net operating loss carryforwards or credit carryforwards resulting from the exercise of nonqualified options. The Company's utilization of these net operating loss carryforwards and a net operating loss in 2013 resulted in minimal income taxes paid in each of the years 2009 through 2014. The Company expects to pay minimal income taxes in 2015 through utilization of these net operating loss carryforwards. The Company has
$50.4 million
of state net operating loss carryforwards. This amount includes $
45.0 million
from the exercise of nonqualified options during 2009. The state net operating loss carryforwards above include approximately $
3.2 million
that is subject to a valuation allowance at
December 31, 2014
.
F-23
CUMBERLAND PHARMACEUTICALS INC. AND SUBSIDIARIES
Notes to Consolidated Financial Statements — (Continued)
Income tax (expense) benefit includes the following components for the years ended December 31:
|
2014
|
2013
|
2012
|
||||||||||
|
Current:
|
||||||||||||
|
Federal
|
$
|
(1,440,010
|
)
|
$
|
(45,287
|
)
|
$
|
(3,185,743
|
)
|
|||
|
State and other
|
(250,064
|
)
|
(11,580
|
)
|
(820,669
|
)
|
||||||
|
Total current income tax expense
|
(1,690,074
|
)
|
(56,867
|
)
|
(4,006,412
|
)
|
||||||
|
Deferred:
|
||||||||||||
|
Federal
|
213,552
|
|
1,426,701
|
|
677,190
|
|
||||||
|
State
|
95,778
|
|
153,217
|
|
84,446
|
|
||||||
|
Total deferred income tax benefit
|
309,330
|
|
1,579,918
|
|
761,636
|
|
||||||
|
Total income tax expense
|
$
|
(1,380,744
|
)
|
$
|
1,523,051
|
|
$
|
(3,244,776
|
)
|
|||
Deferred income tax is comprised of the following components for the years ended December 31:
|
2014
|
2013
|
2012
|
||||||||||
|
Deferred tax (expense) benefit, excluding items below
|
$
|
85,844
|
|
$
|
60,739
|
|
$
|
(11,562
|
)
|
|||
|
Inventory
|
(83,418
|
)
|
310,477
|
|
179,755
|
|
||||||
|
Operating loss carryforwards
|
17,424
|
|
788,342
|
|
25,552
|
|
||||||
|
Tax credit carryforwards
|
43,398
|
|
196,631
|
|
108,699
|
|
||||||
|
Valuation allowance due to changes in net deferred tax asset balances
|
(20,457
|
)
|
(23,299
|
)
|
(15,291
|
)
|
||||||
|
Deductible equity awards
|
298,039
|
|
127,308
|
|
667,171
|
|
||||||
|
Allowance for accounts receivable
|
(63,438
|
)
|
161,084
|
|
(18,615
|
)
|
||||||
|
Deferred charges
|
838,556
|
|
83,755
|
|
19,339
|
|
||||||
|
Reserve for expired product
|
217,330
|
|
(106,554
|
)
|
(29,032
|
)
|
||||||
|
Intangible assets
|
(1,023,948
|
)
|
(18,565
|
)
|
(164,380
|
)
|
||||||
|
Deferred income tax benefit (expense)
|
$
|
309,330
|
|
$
|
1,579,918
|
|
$
|
761,636
|
|
|||
The valuation allowance at
December 31, 2014
and
2013
is primarily related to state tax benefits at CET that will likely not be realized.
F-24
CUMBERLAND PHARMACEUTICALS INC. AND SUBSIDIARIES
Notes to Consolidated Financial Statements — (Continued)
The Company’s effective income tax rate for
2014
,
2013
and
2012
reconciles with the federal statutory tax rate as follows:
|
2014
|
2013
|
2012
|
|||||||
|
Federal tax expense at statutory rate
|
34
|
%
|
34
|
%
|
34
|
%
|
|||
|
State income tax expense (net of federal income tax benefit)
|
5
|
%
|
4
|
%
|
4
|
%
|
|||
|
Permanent differences associated with general business credits
|
(1
|
)%
|
5
|
%
|
—
|
%
|
|||
|
Permanent differences associated with stock options
|
—
|
%
|
—
|
%
|
(5
|
)%
|
|||
|
Other permanent differences
|
1
|
%
|
—
|
%
|
3
|
%
|
|||
|
Other
|
(2
|
)%
|
(1
|
)%
|
—
|
%
|
|||
|
Net income tax expense
|
37
|
%
|
42
|
%
|
36
|
%
|
|||
The Company’s 2009 federal tax return was selected for examination during 2012, and this examination was completed during the year with no significant findings or adjustments. Federal tax years that remain open to examination are 2010 through 2014. Due to a 2009 net operating loss carryback, federal tax years 2006 through 2008 remain open to the extent of net operating losses utilized in those years. State tax years that remain open to examination are 2008 to 2014. The Company has no unrecognized tax benefits in
2014
,
2013
and
2012
.
Excluding the alternative minimum tax (AMT) tax credits, the Company will need to generate future taxable income in order to realize its deferred tax assets. Based upon the level of taxable income over the last three years and projections for future taxable income over the periods in which the deferred tax assets are deductible, management believes it is more likely than not that the Company will realize the benefits of these deductible differences, net of the existing valuation allowances at
December 31, 2014
. The amount of the deferred tax assets considered realizable, however, could be reduced in the future periods if estimates of future taxable income during the carryforward period are reduced.
(13) Stock-Based Compensation Plans
The Company has grants outstanding under
three
equity compensation plans, with
two
available for future grants of equity compensation awards to employees, consultants and directors. All of the equity plans were approved by shareholders. The 2007 Long-Term Incentive Compensation Plan (the 2007 Plan) and the 2007 Directors’ Incentive Plan (the "Directors’ Plan") superseded the 1999 Stock Option Plan. The 2007 Plan and the Directors’ Plan provide for the issuance of stock options, stock appreciation rights and restricted stock. Vesting is determined on a grant-by-grant basis in accordance with the terms of the plans and the related grant agreements. The Company has reserved
2.4 million
shares of common stock for issuance under the 2007 Plan and
250,000
shares for issuance under the Directors’ Plan.
The exercise price of stock options is generally
100%
of the fair market value of the underlying common stock on the grant date. The exercise price of incentive stock options granted to a shareholder who owns more than
10%
of the total combined voting power of all classes of stock must be at least
110%
of the fair market value of the underlying common stock on the grant date. The maximum contractual term of stock options is
ten years
from the date of grant, except for incentive stock options granted to
10%
shareholders, which are
five years
.
During 2011, the Company began issuing shares of restricted stock with
no
exercise price to employees and directors. Restricted stock issued to employees generally cliff-vests on the
fourth
anniversary of the date of grant. Restricted stock issued to directors vests on the
one year
anniversary of the date of grant.
Stock compensation expense is presented as a component of general and administrative expense in the consolidated statements of operations. Stock compensation expense recorded as a component of equity consisted of the following for the years ended December 31:
F-25
CUMBERLAND PHARMACEUTICALS INC. AND SUBSIDIARIES
Notes to Consolidated Financial Statements — (Continued)
|
2014
|
2013
|
2012
|
||||||||||
|
Share-based compensation - employees
|
$
|
660,963
|
|
$
|
614,818
|
|
$
|
555,898
|
|
|||
|
Share-based compensation - nonemployees
|
99,931
|
|
56,116
|
|
76,920
|
|
||||||
|
Total share-based compensation
|
$
|
760,894
|
|
$
|
670,934
|
|
$
|
632,818
|
|
|||
At
December 31, 2014
, there was approximately $
1.6 million
of unrecognized compensation cost related to share-based payments, which is expected to be recognized over a weighted-average period of
2.3
years. This amount relates primarily to unrecognized compensation cost for employees.
Stock Options
Stock option activity for
2014
and
2013
was as follows:
|
Number of
shares
|
Weighted-average exercise price per share
|
Weighted-
average
remaining
contractual
term (years)
|
Aggregate
intrinsic
value
|
||||||||||
|
Outstanding, December 31, 2012
|
666,871
|
|
$
|
5.93
|
|
1.4
|
$
|
132,348
|
|
||||
|
Options granted
|
—
|
|
—
|
|
|||||||||
|
Options exercised
|
(171,100
|
)
|
3.50
|
|
|||||||||
|
Options forfeited or expired
|
(139,275
|
)
|
6.25
|
|
|||||||||
|
Outstanding, December 31, 2013
|
356,496
|
|
6.96
|
|
1.0
|
360
|
|
||||||
|
Options granted
|
—
|
|
—
|
|
|||||||||
|
Options exercised
|
—
|
|
—
|
|
|||||||||
|
Options forfeited or expired
|
(198,140
|
)
|
6.46
|
|
|||||||||
|
Outstanding, December 31, 2014
|
158,356
|
|
7.62
|
|
0.4
|
$
|
2,320
|
|
|||||
|
Exercisable at December 31, 2014
|
158,356
|
|
$
|
7.62
|
|
0.4
|
$
|
2,320
|
|
||||
The Company did not grant any stock options during
2014
,
2013
and
2012
, and no options were exercised during
2014
. Information related to the stock option plans during
2014
,
2013
and
2012
was as follows:
|
2014
|
2013
|
2012
|
||||||||||
|
Intrinsic value of options exercised
|
$
|
—
|
|
$
|
212,444
|
|
$
|
495,480
|
|
|||
|
Weighted-average fair value of
options exercised
|
$
|
—
|
|
$
|
0.12
|
|
$
|
1.00
|
|
|||
F-26
CUMBERLAND PHARMACEUTICALS INC. AND SUBSIDIARIES
Notes to Consolidated Financial Statements — (Continued)
Restricted Stock Awards
As previously noted, the Company began issuing restricted stock to employees and directors in 2011 under the provisions of the 2007 Plan and the Directors’ Plan. Restricted stock activity was as follows:
|
Number
of shares
|
Weighted-
average
grant-date
fair value
|
||||||
|
Nonvested, December 31, 2012
|
383,530
|
|
$
|
4.99
|
|
||
|
Shares granted
|
195,925
|
|
4.78
|
|
|||
|
Shares vested
|
(17,193
|
)
|
3.58
|
|
|||
|
Shares forfeited
|
(41,678
|
)
|
3.97
|
|
|||
|
Nonvested, December 31, 2013
|
520,584
|
|
5.05
|
|
|||
|
Shares granted
|
219,734
|
|
4.68
|
|
|||
|
Shares vested
|
(11,300
|
)
|
4.78
|
|
|||
|
Shares forfeited
|
(36,181
|
)
|
5.41
|
|
|||
|
Nonvested, December 31, 2014
|
692,837
|
|
4.92
|
|
|||
The fair value of restricted stock granted was based on the closing market price of the Company’s common stock on the date of grant.
(14) Employee Benefit Plans
The Company sponsors an employee benefit plan that was established on January 1, 2006, the Cumberland Pharmaceuticals 401(k) Plan (the Plan), under Section 401(k) of the Internal Revenue Code of 1986, as amended, for the benefit of all employees over the age of
21
, having been employed by the Company for at least
six months
. The Plan provides that participants may contribute up to the maximum amount of their compensation as set forth by the Internal Revenue Service each year. Employee contributions are invested in various investment funds based upon elections made by the employees. During
2014
,
2013
and
2012
, the Company contributed approximately $
50,000
in each year to the Plan as an employer match of participant contributions.
In 2012 and 2013, the Company established non-qualified unfunded deferred compensation plans that allow participants to defer receipt of a portion of their compensation. The liability under the plans was
$0.6 million
and $
0.3 million
as of
December 31, 2014
and
2013
, respectively. The Company had assets consisting of company-owned life insurance contracts generally designated to pay benefits of the deferred compensation plans of
$1.7 million
and $
1.3 million
as of
December 31, 2014
and
2013
, respectively.
F-27
CUMBERLAND PHARMACEUTICALS INC. AND SUBSIDIARIES
Notes to Consolidated Financial Statements — (Continued)
(15) Leases
The Company is obligated under long-term real estate leases for corporate office space expiring in October 2016. In addition, the research lab space at CET, under an agreement amended in July 2012, is leased through 2018, with an option to extend the lease through April 2028. The Company also subleases a portion of the space under these leases. Rent expense is recognized over the expected term of the lease, including renewal option periods, if applicable, on a straight-line basis. Rent expense for
2014
,
2013
and
2012
was approximately $
1.0 million
, $
0.9 million
and $
0.9 million
, respectively, and sublease income was approximately $
0.5 million
, $
0.5 million
and $
0.5 million
. Cumulative future minimum sublease income under noncancelable operating subleases totals approximately $
0.3 million
and will be paid through the lease ending in October 2016. Future minimum lease payments under noncancelable operating leases (with initial or remaining lease terms in excess of one year) are as follows:
|
Year ending December 31:
|
||||
|
2015
|
$
|
1,052,662
|
|
|
|
2016
|
941,247
|
|
||
|
2017
|
232,964
|
|
||
|
2018
|
78,852
|
|
||
|
2019 and thereafter
|
—
|
|
||
|
Total future minimum lease payments
|
$
|
2,305,725
|
|
|
(16) Fair Value of Financial Instruments
The Company owns marketable securities that are solely classified as trading securities as of
December 31, 2014
. There were no transfers of assets between levels within the fair value hierarchy. The following table summarizes the fair value of these marketable securities by level within the fair value hierarchy:
|
December 31, 2014
|
December 31, 2013
|
|||||||||||||||||||||||
|
Level 1
|
Level 2
|
Total
|
Level 1
|
Level 2
|
Total
|
|||||||||||||||||||
|
U.S. Treasury notes and bonds
|
$
|
1,338,010
|
|
$
|
—
|
|
$
|
1,338,010
|
|
$
|
2,829,809
|
|
$
|
—
|
|
$
|
2,829,809
|
|
||||||
|
U.S. Agency issued mortgage-backed securities - variable rate
|
—
|
|
4,003,375
|
|
4,003,375
|
|
—
|
|
3,049,754
|
|
3,049,754
|
|
||||||||||||
|
U.S. Agency notes and bonds - fixed rate
|
—
|
|
3,251,336
|
|
3,251,336
|
|
—
|
|
1,496,700
|
|
1,496,700
|
|
||||||||||||
|
SBA loan pools - variable rate
|
—
|
|
1,413,697
|
|
1,413,697
|
|
—
|
|
1,748,498
|
|
1,748,498
|
|
||||||||||||
|
Municipal bonds - VRDN
|
4,835,000
|
|
—
|
|
4,835,000
|
|
4,895,000
|
|
—
|
|
4,895,000
|
|
||||||||||||
|
Total fair value of marketable securities
|
$
|
6,173,010
|
|
$
|
8,668,408
|
|
$
|
14,841,418
|
|
$
|
7,724,809
|
|
$
|
6,294,952
|
|
$
|
14,019,761
|
|
||||||
The fair values of all other financial instruments outstanding as of
December 31, 2014
and
2013
approximate their carrying values. There were no changes to the valuation techniques for the Level 2 marketable securities during 2014 or 2013.
F-28
CUMBERLAND PHARMACEUTICALS INC. AND SUBSIDIARIES
Notes to Consolidated Financial Statements — (Continued)
(17) Market Concentrations
The Company currently focuses on acquiring, developing, and commercializing branded prescription products for the acute care and gastroenterology markets. The Company’s principal financial instruments subject to potential concentration of credit risk are accounts receivable, which are unsecured, and cash equivalents. The Company’s cash equivalents consist primarily of money market funds. Certain bank deposits may at times be in excess of the Federal Deposit Insurance Corporation insurance limits.
The Company’s primary customers are wholesale pharmaceutical distributors in the U.S. Total gross revenues by customer for each customer representing 10% or more of consolidated gross revenues are summarized below for the years ended December 31:
|
2014
|
2013
|
2012
|
||||
|
Customer 1
|
21%
|
19%
|
35%
|
|||
|
Customer 2
|
27%
|
23%
|
30%
|
|||
|
Customer 3
|
34%
|
23%
|
28%
|
|||
|
Customer 4
|
11%
|
24%
|
1%
|
|||
The Company’s accounts receivable, net of allowances, due from these
four
customers at
December 31, 2014
and
2013
was
91.1%
and
85.3%
, respectively.
(18) Manufacturing and Supply Agreements
The Company utilizes
one
or two primary suppliers to manufacture each of its products and product candidates. Although there are a limited number of manufacturers of pharmaceutical products, the Company believes it could utilize other suppliers to manufacture its prescription products on comparable terms. A change in suppliers, problems with its third-party manufacturing operations or related production capacity, or contract disputes with suppliers could cause a delay in manufacturing or shipment of finished goods and possible loss of sales, which could adversely affect operating results.
(19) Employment Agreements
The Company has entered into employment agreements with all its full-time employees. Each employment agreement provides for a salary for services performed, a potential annual bonus and, if applicable, a grant of restricted common shares pursuant to a restricted stock agreement.
(20) Commitments and Contingencies
Commitments
In connection with the acquisition of certain Kristalose assets during 2011, the Company is required to make quarterly payments based on
a
percentage of Kristalose net sales through November 2018. The payments are being treated as consideration for the assets acquired, and are being capitalized and amortized over the remaining expected useful life of the acquired asset, currently the term of the agreement,
15 years
.
In connection with its licensing agreements for Caldolor, the Company is required to pay royalties based on Caldolor net sales over the life of the contracts. Royalty expense is recognized as a component of selling and marketing expense in the period that revenue is recognized.
As discussed in Note 3, in connection with the agreement with Pernix to promote Omeclamox-Pak, the Company will make monthly royalty payments based on tiered levels of gross profits. These costs will be period expenses of the Company. There is also the possibility of an additional milestone payment due at the second anniversary date of the execution of the agreement totaling
$3.0 million
. In the event this milestone payment is
F-29
CUMBERLAND PHARMACEUTICALS INC. AND SUBSIDIARIES
Notes to Consolidated Financial Statements — (Continued)
made the Company will capitalize the payment and amortize it over the remaining expected useful life of the acquired asset, currently the life of the agreement, which ends in June 2032.
As discussed in Note 3, as part of the consideration for the acquisition of Vaprisol
from Astellas, there is an additional milestone payment due forty-five days after the first anniversary date of the closing of the transaction of up to
$2.0 million
, dependent upon Cumberland achieving certain first year sales levels for the product. Cumberland has included this contingent consideration obligation in its liabilities assumed as part of the Vaprisol acquisition.
Legal Matters
In April 2012, the United States Patent and Trademark Office (the “USPTO”) issued U.S. Patent number 8,148,356 (the “356 Acetadote Patent”) to the Company. The claims of the 356 Acetadote Patent encompasses the Acetadote formulation and includes composition of matter claims. Following its issuance, the 356 Acetadote Patent was listed in the FDA Orange Book. The 356 Acetadote Patent is scheduled to expire in May 2026, which time period includes a 270-day patent term adjustment granted by the USPTO.
Following the issuance of the 356 Acetadote Patent, the Company received separate Paragraph IV certification notices from InnoPharma, Inc. ("InnoPharma"), Paddock Laboratories, LLC (“Paddock”), Mylan Institutional LLC (“Mylan”), Sagent Agila LLC ("Sagent") and Perrigo Company ("Perrigo") challenging the 356 Acetadote Patent on the basis of non-infringement and/or invalidity. The Company responded by filing
five
separate infringement lawsuits, in the appropriate United States District Courts, to contest each of the challenges.
On November 12, 2012, the Company entered into a Settlement Agreement (the “Settlement Agreement”) with Paddock and Perrigo to resolve the challenges and the pending litigation with those
two
companies. On November 1, 2013, the United States District Court filed opinions granting Sagent’s and InnoPharma’s motions to dismiss the Company's suits. In November the Company agreed not to file an appeal or motion to reconsider and thereby resolving the challenges and the pending litigation with those two companies. The remaining infringement suit with Mylan is pending.
Under the Settlement Agreement, Paddock and Perrigo admit that the 356 Acetadote Patent is valid and enforceable and that any Paddock or Perrigo generic Acetadote product (with or without EDTA) would infringe upon the 356 Acetadote Patent. In addition, Paddock and Perrigo will not challenge the validity, enforceability, ownership or patentability of the 356 Acetadote Patent through its expiration currently scheduled for May 2026. On November 12, 2012, in connection with the execution of the Settlement Agreement, Cumberland entered into a License and Supply Agreement with Paddock and Perrigo (the “License and Supply Agreement”). Under the terms of the License and Supply Agreement, once a third party receives final approval from the FDA for an ANDA to sell a generic Acetadote product and such third party made such generic version available for purchase in commercial quantities in the United States, the Company supply's Perrigo with an Authorized Generic version of our Acetadote product (the “Authorized Generic”).
On May 18, 2012, Cumberland also submitted a Citizen Petition to the FDA requesting that the FDA refrain from approving any applications for acetylcysteine injection that contain EDTA, based in part on the FDA's request that the Company evaluate the reduction or removal of EDTA from its original Acetadote formulation. On November 7, 2012, the FDA responded to the Citizen Petition denying our request and on November 8, 2012, the Company learned that the FDA approved the ANDA referencing Acetadote filed by InnoPharma, Inc. We brought suit against the FDA contesting the FDA's decision to approve the InnoPharma generic on November 13, 2012. On September 30, 2013, the United States District Court filed an opinion granting a summary judgment in favor of the FDA regarding this suit.
As noted above, during 2012 the FDA approved the ANDA referencing Acetadote filed by InnoPharma, Inc. Upon this condition, in accordance with the License and Supply agreement with Perrigo, we began to supply
F-30
CUMBERLAND PHARMACEUTICALS INC. AND SUBSIDIARIES
Notes to Consolidated Financial Statements — (Continued)
Perrigo with our Authorized Generic. On January 7, 2013, Perrigo announced initial distribution of our Authorized Generic acetylcysteine injection product.
On March 19, 2013, the USPTO issued U.S. Patent number 8,399,445 (the “445 Acetadote Patent”) which is assigned to us. The claims of the 445 Acetadote Patent encompass the use of the 200 mg/ml Acetadote formulation to treat patients with acetaminophen overdose. On April 8, 2013, the 445 Acetadote Patent was listed in the FDA Orange Book. The 445 Acetadote Patent is scheduled to expire in August 2025. Following the issuance of the 445 Acetadote Patent we received separate Paragraph IV certification notices from Perrigo, Sagent Pharmaceuticals, Inc., and Mylan Institutional LLC challenging the 445 Acetadote Patent on the basis of non-infringement, unenforceability and/or invalidity.
On June 10, 2013, we became aware of a Paragraph IV certification notice from Akorn, Inc. challenging the 445 Acetadote Patent and the 356 Acetadote Patent on the basis of non-infringement. On July 12, 2013, we filed a lawsuit for infringement of the 356 Acetadote Patent against Akorn, Inc. in United States District Court.
On February18, 2014, the USPTO issued U.S. Patent number 8,653,061 (the “061 Acetadote Patent”) which is assigned to the Company. The claims of the 061 Acetadote Patent encompass the use of the 200 mg/ml Acetadote formulation to treat patients with acetaminophen overdose. Following its issuance, the 061 Acetadote Patent was listed in the FDA Orange Book. The 061 Acetadote Patent is scheduled to expire in August 2025.
On May 13, 2014, the USPTO issued U.S. Patent number 8,722,738 (the “738 Acetadote Patent”) which is assigned to Cumberland. The claims of the 738 Acetadote Patent encompass administration methods of acetylcysteine injection, without specification of the presence or lack of EDTA in the injection. Following its issuance, the 738 Acetadote Patent was listed in the FDA Orange Book and it is scheduled to expire in April 2032.
On December 11, 2014 and March 3, 2015, the Company became aware of Paragraph IV certification notices from Aurobindo Pharma Limited and Zydus Pharmaceuticals (USA) Inc., respectively, challenging the 356, 445, 061, and 738 Acetadote Patents on the basis of non-infringement.
The Company continues to consider its legal options and intends to continue to vigorously defend and protect its Acetadote product and related intellectual property rights.
The Company is a party to various other legal proceedings in the ordinary course of its business. In the opinion of management, the liability associated with these matters, other than the issue concerning the Company's Acetadote patents discussed above, will not have a material adverse effect on the Company's consolidated financial position, results of operations or cash flows.
F-31
(21) Quarterly Financial Information (Unaudited)
The following table sets forth the unaudited operating results for each fiscal quarter of
2014
and
2013
:
|
First
Quarter
|
Second
Quarter
|
Third
Quarter
|
Fourth
Quarter
|
Total
|
||||||||||||||||
|
2014:
|
||||||||||||||||||||
|
Net revenues
|
$
|
8,093,244
|
|
$
|
9,750,168
|
|
$
|
9,729,047
|
|
$
|
9,329,412
|
|
$
|
36,901,871
|
|
|||||
|
Operating income
|
408,051
|
|
1,215,609
|
|
989,038
|
|
946,138
|
|
3,558,836
|
|
||||||||||
|
Net income attributable to common shareholders
|
286,320
|
|
722,570
|
|
745,920
|
|
668,913
|
|
2,423,723
|
|
||||||||||
|
Earnings per share attributable to common shareholders
(1)
|
||||||||||||||||||||
|
Basic
|
$
|
0.02
|
|
$
|
0.04
|
|
$
|
0.04
|
|
$
|
0.04
|
|
$
|
0.14
|
|
|||||
|
Diluted
|
$
|
0.02
|
|
$
|
0.04
|
|
$
|
0.04
|
|
$
|
0.04
|
|
$
|
0.14
|
|
|||||
|
2013:
|
||||||||||||||||||||
|
Net revenues
|
$
|
10,258,132
|
|
$
|
7,081,088
|
|
$
|
6,528,575
|
|
$
|
8,159,667
|
|
$
|
32,027,462
|
|
|||||
|
Operating income (loss)
|
1,326,051
|
|
(1,140,544
|
)
|
(1,514,768
|
)
|
(2,472,077
|
)
|
(3,801,338
|
)
|
||||||||||
|
Net income (loss) attributable to common shareholders
|
854,709
|
|
(639,018
|
)
|
(819,942
|
)
|
(1,500,363
|
)
|
(2,104,614
|
)
|
||||||||||
|
Earnings (loss) per share attributable to common shareholders
(1)
|
||||||||||||||||||||
|
Basic
|
$
|
0.05
|
|
$
|
(0.03
|
)
|
$
|
(0.04
|
)
|
$
|
(0.08
|
)
|
$
|
(0.11
|
)
|
|||||
|
Diluted
|
$
|
0.05
|
|
$
|
(0.03
|
)
|
$
|
(0.04
|
)
|
$
|
(0.08
|
)
|
$
|
(0.11
|
)
|
|||||
|
(1)
|
Due to the nature of interim earnings per share calculations, the sum of the quarterly earnings per share amounts may not equal the reported earnings per share for the full year.
|
22) Subsequent event
Boxaban
During February 2015, the Company announced that is has completed the manufacture of an oral formulation of ifetroban and the FDA has cleared an IND amendment for this product candidate. Cumberland has initiated clinical development under the brand name Boxaban (
ifetroban
) capsules and is evaluating this candidate for patients suffering from aspirin-exacerbated respiratory disease (AERD) a condition for which there is no U.S. approved pharmaceutical treatment. Also known as Samter’s Triad, AERD is a respiratory disease involving chronic asthma and nasal polyposis that is worsened by aspirin or nonsteroidal anti-inflammatory drugs. Approximately one in twenty asthmatic adults in the U.S. suffer from AERD and awareness of the disease is growing within the medical community.
F-32
Schedule II
CUMBERLAND PHARMACEUTICALS INC. AND SUBSIDIARIES
Valuation and Qualifying Accounts
Years ended
December 31, 2014
,
2013
and
2012
|
Description
|
Balance at
beginning of
period
|
Charged to
costs and
expenses
|
Charged to
other
accounts
|
Deductions
|
Balance at
end of period
|
|||||||||||||||
|
Allowance for uncollectible amounts, cash discounts, chargebacks, and credits issued for damaged products:
|
||||||||||||||||||||
|
For the years ended
December 31:
|
||||||||||||||||||||
|
2012
|
$
|
235,580
|
|
$
|
2,069,470
|
|
$
|
—
|
|
$
|
(2,116,463
|
)
|
(1)
|
$
|
188,587
|
|
||||
|
2013
|
188,587
|
|
2,498,170
|
|
—
|
|
(2,093,641
|
)
|
(1)
|
593,116
|
|
|||||||||
|
2014
|
593,116
|
|
5,166,568
|
|
—
|
|
(5,321,327
|
)
|
(1)
|
438,357
|
|
|||||||||
|
Valuation allowance for deferred tax assets:
|
||||||||||||||||||||
|
For the years ended
December 31:
|
||||||||||||||||||||
|
2012
|
$
|
94,459
|
|
$
|
13,859
|
|
$
|
—
|
|
$
|
—
|
|
$
|
108,318
|
|
|||||
|
2013
|
108,318
|
|
23,299
|
|
—
|
|
—
|
|
131,617
|
|
||||||||||
|
2014
|
131,617
|
|
20,457
|
|
—
|
|
—
|
|
152,074
|
|
||||||||||
(1) Composed of actual returns and credits for chargebacks and cash discounts.
F-33
TABLE OF CONTENTS
Part IItem 1. BusinessItem 1A. Risk FactorsItem 1B. Unresolved Staff CommentsItem 2. PropertiesItem 3. Legal ProceedingsPart IIItem 5. Market For Registrant S Common Equity, Related Stockholder Matters and Issuer Purchases Of Equity SecuritiesItem 6. Selected Financial DataItem 7. Management S Discussion and Analysis Of Financial Condition and Results Of OperationsItem 7A. Quantitative and Qualitative Disclosures About Market RiskItem 8. Financial Statements and Supplementary DataItem 9. Changes in and Disagreements with Accountants on Accounting and Financial DisclosureItem 9A. Controls and ProceduresItem 9B. Other InformationPart IIIPart IVItem 15. Exhibits, Financial Statement Schedules