CHESAPEAKE UTILITIES CORP
10-Ks and 10-Qs
|
|
|
|
|
|
|
|
|
|
|
|
|
|
|
|
|
|
|
|
|
|
|
|
|
|
|
|
|
|
|
|
|
|
|
|
|
|
|
|
|
|
|
|
|
|
|
|
|
|
|
|
|
|
|
|
UNITED STATES
SECURITIES AND EXCHANGE COMMISSION
Washington, D.C. 20549
|
FORM 10-K
|
ANNUAL REPORT PURSUANT TO SECTION 13 OR 15(d) OF
THE SECURITIES EXCHANGE ACT OF 1934
For the Fiscal Year Ended: December 31, 2013
Commission File Number: 001-11590
|
C
HESAPEAKE
U
TILITIES
C
ORPORATION
|
||
|
(Exact name of registrant as specified in its charter)
|
||
|
State of Delaware
|
|
51-0064146
|
|
(State or other jurisdiction of
|
|
(I.R.S. Employer
|
|
incorporation or organization)
|
|
Identification No.)
|
909 Silver Lake Boulevard, Dover, Delaware 19904
(Address of principal executive offices, including zip code)
302-734-6799
(Registrant’s telephone number, including area code)
Securities registered pursuant to Section 12(b) of the Act:
|
Title of each class
|
|
Name of each exchange on which registered
|
|
Common Stock—par value per share $0.4867
|
|
New York Stock Exchange, Inc.
|
|
Securities registered pursuant to Section 12(g) of the Act:
8.25% Convertible Debentures Due 2014
(Title of class)
|
||
Indicate by check mark if the registrant is a well-known seasoned issuer, as defined in Rule 405 of the Securities Act. Yes
¨
. No
ý
.
Indicate by check mark if the registrant is not required to file reports pursuant to Section 13 or Section 15(d) of the Act. Yes
¨
. No
ý
.
Indicate by check mark whether the registrant (1) has filed all reports required to be filed by Section 13 or 15 (d) of the Securities Exchange Act of 1934 during the preceding 12 months (or for such shorter period that the registrant was required to file such reports), and (2) has been subject to such filing requirements for the past 90 days. Yes
ý
. No
¨
.
Indicate by check mark whether the registrant has submitted electronically and posted on its corporate Web site, if any, every Interactive Data File required to be submitted and posted pursuant to Rule 405 of Regulation S-T (§ 232.405 of this chapter) during the preceding 12 months (or for such shorter period that the registrant was required to submit and post such files). Yes
ý
. No
¨
.
Indicate by check mark if disclosure of delinquent filers pursuant to Item 405 of Regulation S-K (§ 229.405 of this chapter) is not contained herein, and will not be contained, to the best of registrant’s knowledge, in definitive proxy or information statements incorporated by reference in Part III of this Form 10-K or any amendments to this Form 10-K.
¨
Indicate by check mark whether the registrant is a large accelerated filer, an accelerated filer, a non-accelerated filer, or a smaller reporting company. See the definitions of “accelerated filer,” “large accelerated filer” and “smaller reporting company” in Rule 12b-2 of the Exchange Act. (Check one):
|
Large accelerated filer
|
|
¨
|
|
Accelerated filer
|
|
ý
|
|
Non-accelerated filer
|
|
¨
|
|
Smaller Reporting Company
|
|
¨
|
Indicate by a check mark whether the registrant is a shell company (as defined in Rule 12b-2 of the Act). Yes
¨
. No
ý
.
The aggregate market value of the common shares held by non-affiliates of Chesapeake Utilities Corporation as of June 30, 2013, the last business day of its most recently completed second fiscal quarter, based on the last trade price on that date, as reported by the New York Stock Exchange, was approximately
$473.7 million
.
As of
February 28, 2014
9,669,772
shares of common stock were outstanding.
DOCUMENTS INCORPORATED BY REFERENCE
Portions of the Proxy Statement for the 2014 Annual Meeting of Stockholders are incorporated by reference in Part II and Part III.
C
HESAPEAKE
U
TILITIES
C
ORPORATION
F
ORM
10-K
YEAR ENDED DECEMBER 31, 2013
TABLE OF CONTENTS
|
|
Page
|
G
LOSSARY OF
D
EFINITIONS
401(k) SERP
: Supplemental Executive Retirement Savings Plan
AFUDC:
Allowance for funds used during construction
ASC:
Accounting Standards Codification
ASU:
Accounting Standards Update
Austin Cox:
Austin Cox Home Services, Inc.
BravePoint:
BravePoint
®
, Inc., our advanced information services subsidiary, headquartered in Norcross, Georgia
Calpine:
Calpine Energy Services, L.P.
CDD:
Cooling degree-days, which is the measure of the variation in weather based on the extent to which the daily average temperature (from 10:00 am to 10:00 am) is above 65 degrees Fahrenheit
Chesapeake:
Chesapeake Utilities Corporation, its divisions and its subsidiaries, as appropriate in the context of the disclosure
Chesapeake Service Company:
Chesapeake Service Company, a subsidiary of Chesapeake and the parent company of Skipjack, BravePoint, CIC and ESRE
Chesapeake Pension Plan:
A defined benefit pension plan sponsored by Chesapeake
Chesapeake Postretirement Plan:
An unfunded postretirement health care and life insurance plan sponsored by Chesapeake
Chesapeake SERP:
An unfunded supplemental executive retirement pension plan sponsored by Chesapeake
CIC:
Chesapeake Investment Company is an affiliated investment company incorporated in Delaware
Columbia:
Columbia Gas Transmission, LLC
Company:
Chesapeake Utilities Corporation, its divisions and its subsidiaries, as appropriate in the context of the disclosure
CP:
Certificate of Public Convenience and Necessity
Crescent:
Crescent Propane, Inc.
Deferred Compensation Plan:
A non-qualified, deferred compensation arrangement under which certain of our executives and members of the Board of Directors are able to defer payment of all or a part of certain specified types of compensation, including executive cash bonuses, executive performance shares, and directors’ retainers and fees
Delmarva Peninsula:
A peninsula on the east coast of the United States of America occupied by Delaware and portions of Maryland and Virginia
Dodd-Frank Act:
The Dodd-Frank Wall Street Reform and Consumer Protection Act
DPA:
Delaware Division of the Public Advocate
DSCP:
Directors Stock Compensation Plan
Dt:
Dekatherm, which is a natural gas unit of measurement that includes a standard measure for heating value
Dts/d:
Dekatherms per day
Eastern Shore:
Eastern Shore Natural Gas Company, a wholly-owned natural gas transmission subsidiary of Chesapeake
EGWIC:
Eastern Gas & Water Investment Company, LLC, an affiliate of Eastern Shore Gas Company
EPA:
United States Environmental Protection Agency
ESG:
Eastern Shore Gas Company and its affiliates
ESRE:
Eastern Shore Real Estate, Inc., a subsidiary that owns and leases office buildings in Delaware and Maryland to affiliates of Chesapeake.
FASB:
Financial Accounting Standards Board
FERC:
Federal Energy Regulatory Commission, an independent agency of the Federal government that regulates the interstate transmission of electricity, natural gas, and oil
FDEP:
Florida Department of Environmental Protection
FDOT:
Florida Department of Transportation
FGT:
Florida Gas Transmission Company
Flo-gas:
Flo-gas Corporation, a subsidiary of FPU
Fort Meade
: The natural gas system purchased by FPU from the City of Fort Meade, Florida
FPU:
Florida Public Utilities Company, a wholly-owned subsidiary of Chesapeake as of October 28, 2009, the date we acquired FPU
FPU Medical Plan:
A separate unfunded postretirement medical plan for FPU sponsored by Chesapeake
FPU Pension Plan:
A separate defined benefit pension plan for FPU sponsored by Chesapeake
FRP:
Fuel Retention Percentage
GAAP:
Accounting principles generally accepted in the United States of America
Glades
: Glades Gas Co., Inc.
GRIP:
Gas Reliability Infrastructure Program, which is a surcharge to natural gas customers designed to recover capital and other program-related costs, inclusive of an appropriate return on investment, associated with accelerating the replacement of qualifying distribution mains and services in Florida
GSR:
Gas Service Rates
Gulf:
Columbia Gulf Transmission Company
Gulf Power:
Gulf Power Company
Gulfstream:
Gulfstream Natural Gas System, LLC
HDD:
Heating degree-days, which is a measure of the variation in weather based on the extent to which the daily average temperature (from 10:00 am to 10:00 am) is below 65 degrees Fahrenheit
IFRS:
International Financial Accounting Standards
IGC:
Indiantown Gas Company
IRS:
Internal Revenue Service
Marianna Commission:
The City Commission of Marianna, Florida
MDE:
Maryland Department of Environment
MGP:
Manufactured gas plant, which is a site where coal was previously used to manufacture gaseous fuel for industrial, commercial and residential use
MWH:
Megawatt hour, which is a unit of measurement for electricity
NAM:
Natural Attenuation Monitoring
Note Agreement:
Note Purchase Agreement entered into by Chesapeake with Note Holders on September 5, 2013
Note Holders:
PAR U Hartford Life & Annuity Comfort Trust, The Prudential Insurance Company of America, The Gibraltar Life Insurance Co., Ltd., The Penn Mutual Life Insurance Company, Thrivent Financial for Lutherans, United of Omaha Life Insurance Company, and Companion Life Insurance Company, which are collectively the lenders that entered into the Note Agreement with Chesapeake on September 5, 2013
Notes:
Series A and B unsecured Senior Notes that have been or will be entered into with the Note Holders
NRG:
NRG Energy Center Dover LLC
NYSE:
New York Stock Exchange
OTC:
Over-the-counter
PBF Energy:
PBF Energy Inc.
Peninsula Pipeline:
Peninsula Pipeline Company, Inc., our wholly-owned Florida intrastate pipeline subsidiary
Peoples Gas:
The Peoples Gas System division of Tampa Electric Company
PESCO:
Peninsula Energy Services Company, Inc., our wholly-owned natural gas marketing subsidiary
PIP:
Performance Incentive Plan
PSC:
Public Service Commission, which is the state agency that regulates the rates and services provided by Chesapeake’s natural gas and electric distribution operations in Delaware, Maryland and Florida and Peninsula Pipeline in Florida
Rayonier:
Rayonier Performance Fibers, LLC
Sandpiper:
Sandpiper Energy, Inc.
Sanford Group:
FPU and other responsible parties involved with the Sanford environmental site
SEC:
Securities and Exchange Commission
Series A Notes:
Series A of the unsecured Senior Notes issued on December 16, 2013 pursuant to the Note Agreement
Series B Notes:
Series B of the unsecured Senior Notes to be issued on May 15, 2014 pursuant to the Note Agreement
Sharp:
Sharp Energy, Inc., our wholly-owned propane distribution subsidiary
Sharpgas:
Sharpgas, Inc., a subsidiary of Sharp
SICP:
2013 Stock and Incentive Compensation Plan, which replaced DSCP and PIP effective May 2, 2013
Skipjack:
Skipjack, Inc. a subsidiary that owns and leases office buildings in Delaware and Maryland to affiliates of Chesapeake
S&P 500 Index:
Standard & Poor’s 500 Index
TETLP:
Texas Eastern Transmission, LP
TOU:
Time-of-use
Transco:
Transcontinental Gas Pipe Line Company, LLC
Virginia LP:
Virginia LP Gas, Inc.
Xeron:
Xeron, Inc., our propane wholesale marketing subsidiary, based in Houston, Texas
P
ART
I
References in this document to “Chesapeake,” the “Company,” “we,” “us” and “our” mean Chesapeake Utilities Corporation, its divisions and/or its wholly-owned subsidiaries, as appropriate in the context of the disclosure.
Safe Harbor for Forward-Looking Statements
We make statements in this Annual Report on Form 10-K that do not directly or exclusively relate to historical facts. Such statements are “forward-looking statements” within the meaning of the Private Securities Litigation Reform Act of 1995. One can typically identify forward-looking statements by the use of forward-looking words, such as “project,” “believe,” “expect,” “anticipate,” “intend,” “plan,” “estimate,” “continue,” “potential,” “forecast” or other similar words, or future or conditional verbs such as “may,” “will,” “should,” “would” or “could.” These statements represent our intentions, plans, expectations, assumptions and beliefs about future financial performance, business strategy, projected plans and objectives of the Company. These statements are subject to many risks and uncertainties. In addition to the risk factors described under Item 1A “Risk Factors,” the following important factors, among others, could cause actual future results to differ materially from those expressed in the forward-looking statements:
|
•
|
state and federal legislative and regulatory initiatives that affect cost and investment recovery, have an impact on rate structures, and affect the speed at and the degree to which competition enters the electric and natural gas industries (including deregulation);
|
|
•
|
the outcomes of regulatory, tax, environmental and legal matters, including whether pending matters are resolved within current estimates and whether the costs associated with such matters are adequately covered by insurance or recovered in rates;
|
|
•
|
the loss of customers due to government-mandated sale of our utility distribution facilities;
|
|
•
|
industrial, commercial and residential growth or contraction in our markets or service territories;
|
|
•
|
the weather and other natural phenomena, including the economic, operational and other effects of hurricanes, ice storms and other damaging weather events;
|
|
•
|
the timing and extent of changes in commodity prices and interest rates;
|
|
•
|
general economic conditions, including any potential effects arising from terrorist attacks and any consequential hostilities or other hostilities or other external factors over which we have no control;
|
|
•
|
changes in environmental and other laws and regulations to which we are subject and environmental conditions of property that we now or may in the future own or operate;
|
|
•
|
the results of financing efforts, including our ability to obtain financing on favorable terms, which can be affected by various factors, including credit ratings and general economic conditions;
|
|
•
|
the impact to the asset values and resulting higher costs and funding obligations of the Company's pension and other postretirement benefit plans as a result of potential downturns in the financial markets, lower discount rates or impacts associated with the Patient Protection and Affordable Care Act;
|
|
•
|
the creditworthiness of counterparties with which we are engaged in transactions;
|
|
•
|
the extent of success in connecting natural gas and electric supplies to transmission systems and in expanding natural gas and electric markets;
|
|
•
|
the effect of accounting pronouncements issued periodically by accounting standard-setting bodies;
|
|
•
|
conditions of the capital markets and equity markets during the periods covered by the forward-looking statements;
|
|
•
|
the ability to successfully execute, manage and integrate merger, acquisition or divestiture plans, regulatory or other limitations imposed as a result of a merger, acquisition or divestiture, and the success of the business following a merger, acquisition or divestiture;
|
|
•
|
the ability to establish and maintain new key supply sources;
|
|
•
|
the effect of spot, forward and future market prices on our distribution, wholesale marketing and energy trading businesses;
|
|
•
|
the effect of competition on our businesses;
|
|
•
|
the ability to construct facilities at or below estimated costs;
|
|
•
|
risks related to cyber-attack or failure of information technology systems; and
|
|
•
|
changes in technology affecting our advanced information services business.
|
Chesapeake Utilities Corporation 2013 Form 10-K Page
1
I
TEM
1. B
USINESS
.
C
ORPORATE
O
VERVIEW
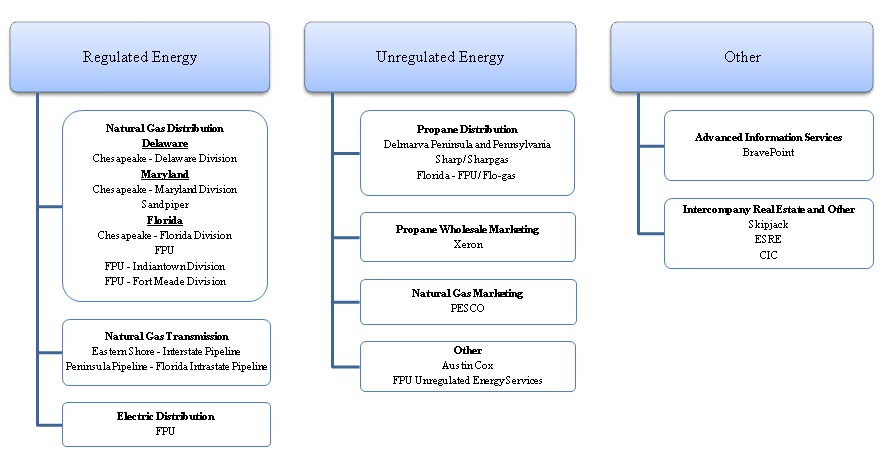
Chesapeake Utilities Corporation is a Delaware corporation formed in 1947. We are a diversified energy company engaged, through our operating divisions and subsidiaries, in various energy and other businesses. We operate primarily on the Delmarva Peninsula and throughout Florida, providing natural gas distribution and transmission, electric distribution and propane distribution service. The core of our business is regulated utilities, which provide stable earnings from their utility operations. Our unregulated businesses provide opportunities to achieve returns greater than those of a traditional utility. The following charts present operating income by energy served and geographic area for the year ended December 31, 2013 and average investment by energy served and geographic area as of December 31, 2013.

O
PERATING
S
EGMENTS
We operate within three reportable segments: Regulated Energy, Unregulated Energy and Other.
The Regulated Energy segment includes our natural gas distribution, natural gas transmission and electric distribution operations. All operations in this segment are regulated, as to their rates and service, by the PSC having jurisdiction in each state in which we operate or by the FERC in the case of Eastern Shore.
The Unregulated Energy segment includes our propane distribution, propane wholesale marketing and natural gas marketing operations, which are unregulated as to their rates and services. Also included in this segment are other unregulated energy services, such as energy-related merchandise sales and heating, ventilation and air conditioning, plumbing and electrical services.
The Other segment consists primarily of our advanced information services operation. Also included in this reportable segment are unregulated subsidiaries that own real estate leased to Chesapeake and certain corporate costs not allocated to other operations.
Chesapeake Utilities Corporation 2013 Form 10-K Page
2
The following chart shows, in simplified form, our principal business structure:
The following table shows the size of each of our operating segments based on operating income for the year ended December 31, 2013 and total assets as of
December 31, 2013
:
|
(dollars in thousands)
|
Operating Income
|
Total Assets
|
|||||||||||
|
Regulated Energy
|
$
|
50,084
|
|
80
|
%
|
$
|
708,950
|
|
85
|
%
|
|||
|
Unregulated Energy
|
12,353
|
|
20
|
%
|
100,585
|
|
12
|
%
|
|||||
|
Other
|
297
|
|
—
|
%
|
27,987
|
|
3
|
%
|
|||||
|
Total
|
$
|
62,734
|
|
100
|
%
|
$
|
837,522
|
|
100
|
%
|
|||
Additional financial information by business segment is set forth in
Item 7. Management’s Discussion and Analysis of Financial Condition and Results of Operation
and
Item 8. Financial Statements and Supplementary Data
(see
Note 5, Segment Information,
in the Consolidated Financial Statements)
.
R
EGULATED
E
NERGY
Overview of Business
Regulated Energy is our largest segment and consists of our natural gas distribution operations in Delaware, Maryland and Florida; our electric distribution operation in Florida and our natural gas transmission operations on the Delmarva Peninsula and in Florida. Our natural gas and electric distribution operations, which are local distribution utilities, generate revenues based on tariff rates approved by the PSC of each state in which we operate. The PSCs, however, have authorized our utilities to negotiate rates, based on approved methodologies, with customers that have competitive alternatives. Eastern Shore, our interstate natural gas transmission subsidiary, bills its customers based upon the FERC-approved tariff rates, and the FERC has also authorized Eastern Shore to negotiate rates above or below the FERC-approved tariff rates. Peninsula Pipeline, our Florida intrastate pipeline subsidiary subject to regulation by Florida PSC, has negotiated contracts with third-party customers and with certain affiliates. Our rates are designed to provide us with the opportunity to generate revenues to recover all prudently incurred costs and provide a return on rate base sufficient to pay interest on debt and a reasonable return for our shareholders. Rate base generally consists of the original cost of utility plant less accumulated depreciation on utility plant in service, working capital and certain other assets and depending upon the regulatory jurisdictions, may also include deferred income tax liabilities and other additions or deletions.
Chesapeake Utilities Corporation 2013 Form 10-K Page
3
The natural gas commodity market for Chesapeake’s Florida division and FPU’s Indiantown division has been deregulated. Accordingly, marketers, rather than a traditional utility, sell natural gas to end-use customers in those jurisdictions. For all of our other local distribution utilities, we have fuel cost recovery mechanisms authorized by the PSCs that allow us to periodically adjust fuel rates to reflect changes in the wholesale cost of natural gas and electricity and to ensure we recover all of the costs prudently incurred in purchasing natural gas and electricity for our customers.
Weather
Revenues from our residential and commercial sales are affected by seasonal variations in weather conditions, which directly influence the volume of natural gas and electricity sold and delivered. Specifically, customer demand substantially increases during the winter months, when natural gas and electricity are used for heating. For electricity, customer demand also increases during the summer months, when electricity is used for cooling. Accordingly, the volumes sold for these purposes are directly affected by the severity of summer and winter weather and can vary substantially from year to year. We measure the relative impact of weather by using an accepted degree-day methodology. Degree-day data is used to estimate amounts of energy required to maintain comfortable indoor temperature levels based on each day’s average temperature. A degree-day is the measure of the variation in the weather based on the extent to which the average daily temperature (from 10:00 am to 10:00 am) falls above or below 65 degrees Fahrenheit. Each degree of temperature below 65 degrees Fahrenheit is counted as one heating degree-day. Each degree of temperature above 65 degrees Fahrenheit is counted as one cooling degree-day. Normal heating degree-days are based on the most recent 10-year average.
In an effort to stabilize the level of net revenues collected from customers in Maryland regardless of weather conditions, Chesapeake’s Maryland division implemented a weather normalization adjustment for our residential heating and smaller commercial heating customers. A weather normalization adjustment is a billing adjustment mechanism that is designed to eliminate the effect of deviations from average seasonal temperatures on utility net revenues. For all of our other local distribution utilities, we do not currently have any weather normalization or “decoupled” rate mechanisms.
Recent Acquisition
On May 31, 2013, we completed the purchase of the operating assets of ESG. Approximately 11,000 residential and commercial underground propane distribution system customers acquired in this purchase are now being served by Sandpiper, our new subsidiary, and are subject to rate and service regulation by the Maryland PSC. We are evaluating the potential conversion of some of the underground propane distribution systems to natural gas distribution. Although these customers are currently being served with propane, we include Sandpiper’s operating results in the Delmarva natural gas distribution operation.
Chesapeake Utilities Corporation 2013 Form 10-K Page
4
Operational Highlight
The following table presents operating revenues, volume and average customers by customer class for our natural gas and electric distribution operations for the year ended
December 31, 2013
:
|
(in thousands)
|
Delmarva
Natural Gas Distribution
(2)
|
Florida Natural Gas Distribution
(3)
|
FPU Electric Distribution
|
||||||||||||||
|
Operating Revenues
|
|||||||||||||||||
|
Residential
|
$
|
52,594
|
|
59
|
%
|
$
|
26,543
|
|
34
|
%
|
$
|
41,349
|
|
55
|
%
|
||
|
Commercial
|
28,445
|
|
32
|
%
|
36,591
|
|
46
|
%
|
38,430
|
|
51
|
%
|
|||||
|
Industrial
|
6,349
|
|
7
|
%
|
16,197
|
|
21
|
%
|
4,088
|
|
5
|
%
|
|||||
|
Other
(1)
|
1,869
|
|
2
|
%
|
(555
|
)
|
(1
|
)%
|
(8,917
|
)
|
(11
|
)%
|
|||||
|
Total Operating Revenues
|
$
|
89,257
|
|
100
|
%
|
$
|
78,776
|
|
100
|
%
|
$
|
74,950
|
|
100
|
%
|
||
|
Volume
(in Dts for natural gas/MWHs for electric)
|
|||||||||||||||||
|
Residential
|
3,189,000
|
|
30
|
%
|
1,542,732
|
|
7
|
%
|
289,745
|
|
45
|
%
|
|||||
|
Commercial
|
3,378,707
|
|
31
|
%
|
4,133,188
|
|
18
|
%
|
309,813
|
|
48
|
%
|
|||||
|
Industrial
|
4,169,615
|
|
39
|
%
|
17,143,536
|
|
75
|
%
|
31,120
|
|
5
|
%
|
|||||
|
Other
|
69,090
|
|
—
|
%
|
(81,723
|
)
|
—
|
%
|
18,347
|
|
2
|
%
|
|||||
|
Total
|
10,806,412
|
|
100
|
%
|
22,737,733
|
|
100
|
%
|
649,025
|
|
100
|
%
|
|||||
|
Average Customers
|
|||||||||||||||||
|
Residential
|
60,685
|
|
90
|
%
|
64,056
|
|
90
|
%
|
23,742
|
|
76
|
%
|
|||||
|
Commercial
|
6,445
|
|
10
|
%
|
5,904
|
|
8
|
%
|
7,407
|
|
24
|
%
|
|||||
|
Industrial
|
110
|
|
—
|
%
|
1,005
|
|
2
|
%
|
2
|
|
—
|
%
|
|||||
|
Other
|
5
|
|
—
|
%
|
—
|
|
—
|
%
|
—
|
|
—
|
%
|
|||||
|
Total
|
67,245
|
|
100
|
%
|
70,965
|
|
100
|
%
|
31,151
|
|
100
|
%
|
|||||
(1)
Operating Revenues from "Other" sources include unbilled revenue, under (over) recoveries of fuel cost, conservation revenue, other miscellaneous charges, fees for billing services provided to third parties and adjustments for pass-through taxes.
(2)
Delmarva natural gas distribution operation includes Chesapeake's Delaware and Maryland divisions in addition to Sandpiper.
(3)
Florida natural gas distribution operation includes Chesapeake's Florida Division, FPU and FPU's Indiantown and Fort Meade divisions.
The following table presents operating revenues and design day capacity for Eastern Shore for the year ended
December 31, 2013
and contracted firm transportation capacity at
December 31, 2013
:
|
(in thousands)
|
Eastern Shore
|
||||
|
Operating Revenues
|
|||||
|
Local distribution companies - affiliated
(1)
|
$
|
16,326
|
|
44
|
%
|
|
Local distribution companies - non-affiliated
|
8,473
|
|
23
|
%
|
|
|
Commercial and industrial
|
12,321
|
|
33
|
%
|
|
|
Other
(2)
|
45
|
|
—
|
%
|
|
|
Total Operating Revenues
|
$
|
37,165
|
|
100
|
%
|
|
Contracted firm transportation capacity
(in Dts/d)
|
|||||
|
Local distribution companies - affiliated
|
100,652
|
|
43
|
%
|
|
|
Local distribution companies - non-affiliated
|
67,293
|
|
29
|
%
|
|
|
Commercial and industrial
|
65,934
|
|
28
|
%
|
|
|
Total
|
233,879
|
|
100
|
%
|
|
|
Designed day capacity
(in Dts/d)
|
234,379
|
|
—
|
|
|
(1)
Eastern Shore's service to our local distribution affiliates is based on FERC-approved rates and is an integral component of the cost associated with providing natural gas supplies for those affiliates. We eliminate operating revenues of Eastern Shore against the cost of sales of those affiliates; however, our local distribution affiliates include this amount in their purchased fuel cost and recover it through fuel cost recovery mechanisms.
(2)
Operating revenues from "Other" sources are from rental of gas properties.
Chesapeake Utilities Corporation 2013 Form 10-K Page
5
Peninsula Pipeline has three contracts with both affiliated and non-affiliated customers to provide firm transportation service. All of the contracts provide a fixed annual transportation fee. For the year ended December 31, 2013, operating revenues of Peninsula Pipeline were
$2.8 million
,
$2.2 million
of which were related to service to FPU under a contract with FPU, which has been approved by the Florida PSC. Peninsula Pipeline's operating revenue from FPU is eliminated against the cost of sales in consolidation; however, FPU includes this amount in its purchased fuel cost and recovers it through the fuel cost recovery mechanism.
Regulatory Matters
The following table highlights the key regulatory structure and the most recent base rate proceeding information for each of our major utilities:
|
Chesapeake - Delaware Division
|
Chesapeake - Florida Division
|
FPU Natural Gas
|
FPU Electric
|
Chesapeake - Maryland Division
|
Eastern Shore
|
|
|
Commission Structure:
|
5 commissioners
|
5 commissioners
|
5 commissioners
|
5 commissioners
|
5 commissioners
|
5 commissioners
|
|
Part-Time
|
Full-Time
|
Full-Time
|
Full-Time
|
Full-Time
|
Full-Time
|
|
|
Gubernatorial Appointment
|
Gubernatorial Appointment
|
Gubernatorial Appointment
|
Gubernatorial Appointment
|
Gubernatorial Appointment
|
Presidential Appointment
|
|
|
Regulatory Jurisdiction:
|
Delaware PSC
|
Florida PSC
|
Florida PSC
|
Florida PSC
|
Maryland PSC
|
FERC
|
|
Base Rate Proceeding:
|
||||||
|
Delay in collection of rates subsequent to filing application
|
60 days
|
90 days
|
90 days
|
90 days
|
180 days
|
Up to 180 days
|
|
Date of most recent application
|
7/6/2007
|
7/14/2009
|
12/17/2008
|
5/31/2006
|
5/1/2006
|
12/30/2010
|
|
Effective date of permanent rates
|
9/30/2008
|
1/14/2010
|
1/14/2010
(1)
|
5/22/2008
|
12/1/2007
|
7/29/2011
|
|
Rate increase (decrease) approved
|
$325,000
|
$2,536,300
|
$7,969,000
|
$3,856,900
|
$648,000
|
$805,000
|
|
Rate of return approved
|
10.25%
(2)
|
10.80%
(2)
|
10.85%
(2)
|
11.00%
(2)
|
10.75%
(2)
|
13.90%
(3)
|
(1)
Effective date of the Order approving settlement agreement, which adjusted rates originally approved on June 4, 2009.
(2)
Allowed return on equity.
(3)
Allowed pre-tax, pre-interest rate of return
Our average investments in 2013 for regulated operations were:
$92.0 million
for Delmarva natural gas distribution;
$177.0 million
for Florida natural gas and electric distribution; and
$139.3 million
for natural gas transmission.
The terms of the settlement agreement in Eastern Shore’s most recent base rate proceeding provides a five-year moratorium on Eastern Shore’s right to file a base rate increase and other parties’ rights to challenge Eastern Shore’s rates. It allows Eastern Shore to file for rate adjustments during those five years in the event certain costs related to government-mandated obligations are incurred and Eastern Shore’s pre-tax earnings do not equal or exceed 13.9 percent. Eastern Shore is also required to file a base rate proceeding by January 2017.
In May 2013, the Maryland PSC approved our application for approval of the acquisition of the ESG operating assets and the transfer of the ESG franchises to Sandpiper. In this application, the Maryland PSC also approved a new gas service tariff and rates applicable to natural gas and propane distribution customers in Worcester County, Maryland. Sandpiper is required to file a base rate proceeding within two and a half years of Sandpiper’s new service in Worcester County, Maryland, which commenced in May 2013.
In addition to the base rates approved by the PSCs, certain of our local distribution utilities have additional surcharge mechanisms, which were separately approved by their respective PSCs. Most notable surcharge mechanisms include Delaware’s additional charges to facilitate natural gas service offerings designed to increase the availability of natural gas in portions of eastern Sussex County, Delaware, and Florida’s GRIP surcharge designed to recover capital and other costs, inclusive of an appropriate return on investment, associated with accelerating the replacement of qualifying distribution mains.
See
Item 8. Financial Statements and Supplementary Data
(
Note 18, Rates and Other Regulatory Activities,
in the Consolidated Financial Statements) for more information
.
Chesapeake Utilities Corporation 2013 Form 10-K Page
6
Competition
Our natural gas and electric distribution operations and our natural gas transmission operations compete with other forms of energy, including natural gas, electricity, oil, propane and other alternative sources of energy. The principal competitive factors are price and, to a lesser extent, accessibility. Our natural gas distribution operations have several large industrial customers that are able to use fuel oil or propane as an alternative to natural gas. When oil or propane prices decline, these interruptible customers may convert to an alternative fuel source to satisfy their fuel requirements, and our sales volumes may decline. To address the uncertainty of alternative fuel prices, we use flexible pricing arrangements on both the supply and sales sides of our business to compete with alternative fuel price fluctuations.
Large industrial natural gas customers may be able to bypass our distribution and transmission systems and make direct connections with “upstream” interstate transmission pipelines when such connections are economically feasible. Certain large industrial electric customers may be capable of generating electricity for their own consumption. Although the risk of bypassing our systems is not considered significant, we may adjust services and rates for these customers to retain their business in certain situations.
Supplies, Transmission and Storage
We believe that the availability of supply and transmission of natural gas and electricity is adequate under existing arrangements to meet the anticipated needs of customers.
Chesapeake’s Delaware and Maryland divisions use their firm transportation resources to meet a significant percentage of their projected demand requirements. They purchase firm natural gas supplies to meet those projected requirements with purchases of baseload, daily spot supplies and storage service. They have both firm and interruptible transportation service contracts with five interstate “open access” pipeline companies (Eastern Shore, Transco, Columbia, Gulf and TETLP) in order to meet customer demand. Their distribution system is directly interconnected with Eastern Shore’s pipeline, which is directly interconnected with the upstream pipelines of Transco, Columbia and TETLP. The Gulf pipeline is directly interconnected with Columbia and indirectly interconnected with Eastern Shore’s pipeline. Chesapeake’s Delaware division has 71,754 Dts of maximum daily firm transportation capacity with Eastern Shore through contracts expiring on various dates between 2014 and 2027. It also has a total of 67,363 Dts of maximum daily firm transportation capacity with four upstream pipelines through contracts expiring between 2014 and 2028. Chesapeake’s Maryland division has 27,898 Dts of maximum daily firm transportation capacity with Eastern Shore through contracts expiring on various dates between 2014 and 2027 and a total of 26,818 Dts of maximum daily firm transportation capacity with four upstream pipelines through contracts expiring between 2014 and 2027. The Delaware and Maryland divisions also have the capability to use propane-air peak-shaving equipment to supplement or displace natural gas purchases.
Chesapeake's Delaware and Maryland divisions contract with an unaffiliated energy marketing and risk management company through an asset management agreement to optimize their transportation and storage capacity and secure adequate supply of natural gas. The asset manager pays our divisions a fee, which our divisions share with their customers. The current asset management agreement expires in March 2015.
Sandpiper has a capacity, supply and operating agreement with EGWIC to purchase propane over a
six
-year term. Sandpiper's initial annual commitment is estimated at approximately
7.4 million
gallons. Sandpiper also has 1,000 Dts of maximum daily firm transportation capacity with Eastern Shore through a contract expiring in 2027.
Chesapeake’s Florida division has firm transportation service agreements with FGT and Gulfstream, totaling 26,092 to 28,639 Dts of daily firm transportation capacity expiring on various dates between 2020 and 2025. As a result of the deregulation of the natural gas sales market in Florida, the Florida PSC approved a program permitting the release of all of the capacity under these agreements to various third parties, including PESCO, our natural gas marketing subsidiary. We are contingently liable to FGT and Gulfstream if any party that acquired the capacity through release fails to pay the capacity charge.
FPU has firm transportation service agreements with FGT, Florida City Gas and Peninsula Pipeline, totaling 31,543 to 57,107 Dts of daily firm transportation capacity expiring on various dates between 2016 and 2033. FPU uses gas marketers and producers to procure all of its gas supplies to meet projected requirements. FPU also uses Peoples Gas to provide wholesale gas sales service in areas far from its interconnections with FGT.
Eastern Shore has three contracts with Transco for a total of 7,292 Dts of firm daily storage injection and withdrawal entitlements and total storage capacity of 288,003 Dts expiring on various dates between 2018 and 2023. Eastern Shore retains these firm storage services in order to provide swing transportation service and firm storage service to customers requesting such services.
FPU primarily purchases its wholesale electricity from two suppliers JEA and Gulf Power, under full requirements contracts expiring in December 2017 and 2019, respectively. The JEA contract provides generation and transmission service to northeast Florida. The Gulf Power contract provides generation and transmission service to northwest Florida. Our electric distribution operation also has a renewable energy purchase agreement with Rayonier that expires in 2023. FPU is committed under the Rayonier contract to purchase between 1.7 MWH and 3.0 MWH of electricity annually.
Chesapeake Utilities Corporation 2013 Form 10-K Page
7
U
NREGULATED
E
NERGY
Overview of Business
Our Unregulated Energy segment provides propane distribution, propane wholesale marketing, natural gas marketing services and other unregulated energy-related services to customers. Revenues generated from the Unregulated Energy segment are not subject to any federal, state or local pricing regulations. Our businesses in the Unregulated Energy segment typically complement our regulated businesses by offering propane as a fuel source where natural gas is not readily available or providing natural gas marketing service to customers who are able to procure their own supplies. Through competitive pricing and supply management, these businesses provide the opportunity to generate returns greater than those of a traditional utility.
Propane Distribution - Overview of Business
Our propane distribution operations sell propane primarily to residential, commercial/industrial and wholesale customers on the Delmarva Peninsula and in southeastern Pennsylvania through Sharp and Sharpgas and in Florida through FPU and Flo-gas. Many of our propane distribution customers are “bulk delivery” customers. We make deliveries of propane to the bulk delivery customers as needed, based on the level of propane remaining in the tank located at the customer’s premises. We invoice and record revenues for our bulk delivery service customers at the time of delivery, rather than upon customers’ actual usage, since the customers typically own the propane gas in the tank on their premises. We also have underground propane distribution systems serving various neighborhoods and communities. For the customers served by underground propane distribution systems, we have installed meters on their premises to measure consumption and bill them monthly.
Propane Distribution - Weather
Revenues from our propane distribution sales activities are affected by seasonal variations in weather conditions. Weather conditions directly influence the volume of propane sold and delivered to customers; specifically, customers’ demand substantially increases during the winter months when propane is used for heating. The timing of deliveries to the bulk delivery customers can also vary significantly from year to year depending on weather variation. Accordingly, the propane volumes sold for this purpose are directly affected by the severity of winter weather and can vary substantially from year to year. Sustained warmer-than-normal temperatures will tend to reduce propane use, while sustained colder-than-normal temperatures will tend to increase consumption.
Chesapeake Utilities Corporation 2013 Form 10-K Page
8
Propane Distribution - Operational Highlights
For the year ended
December 31, 2013
, operating revenues, total gallons sold and average customers by customer class for our Delmarva and Florida propane distribution operations were as follows:
|
(in thousands)
|
Delmarva Peninsula
|
Florida
|
||||||||
|
Operating Revenues
|
||||||||||
|
Residential bulk
|
$
|
24,573
|
|
31
|
%
|
$
|
5,526
|
|
28
|
%
|
|
Residential metered
|
7,723
|
|
10
|
%
|
4,779
|
|
24
|
%
|
||
|
Commercial bulk
|
18,169
|
|
23
|
%
|
6,692
|
|
33
|
%
|
||
|
Commercial metered
|
—
|
|
—
|
%
|
1,899
|
|
9
|
%
|
||
|
Wholesale
|
24,576
|
|
31
|
%
|
610
|
|
3
|
%
|
||
|
Other
(1)
|
4,591
|
|
5
|
%
|
525
|
|
3
|
%
|
||
|
Total Operating Revenues
|
$
|
79,632
|
|
100
|
%
|
$
|
20,031
|
|
100
|
%
|
|
Volume
(in gallons)
|
||||||||||
|
Residential bulk
|
9,192
|
|
22
|
%
|
1,391
|
|
21
|
%
|
||
|
Residential metered
|
3,318
|
|
8
|
%
|
1,027
|
|
15
|
%
|
||
|
Commercial bulk
|
10,482
|
|
25
|
%
|
3,136
|
|
47
|
%
|
||
|
Commercial metered
|
—
|
|
—
|
%
|
673
|
|
10
|
%
|
||
|
Wholesale
|
18,885
|
|
45
|
%
|
449
|
|
7
|
%
|
||
|
Other
|
—
|
|
—
|
%
|
(42
|
)
|
—
|
%
|
||
|
Total
|
41,877
|
|
100
|
%
|
6,634
|
|
100
|
%
|
||
|
Average customers
|
||||||||||
|
Residential bulk
|
23,760
|
|
67
|
%
|
8,542
|
|
53
|
%
|
||
|
Residential metered
|
7,255
|
|
20
|
%
|
6,441
|
|
40
|
%
|
||
|
Commercial bulk
|
3,962
|
|
11
|
%
|
1,014
|
|
6
|
%
|
||
|
Commercial metered
|
—
|
|
—
|
%
|
264
|
|
1
|
%
|
||
|
Wholesale
|
32
|
|
—
|
%
|
3
|
|
—
|
%
|
||
|
Other
|
715
|
|
2
|
%
|
—
|
|
—
|
%
|
||
|
Total
|
35,724
|
|
100
|
%
|
16,264
|
|
100
|
%
|
||
(1)
Operating revenues from "Other" sources include revenues from customer loyalty programs; delivery, service and appliance fees; and unbilled revenues.
Propane Distribution - Competition
We compete with several other propane distributors in our geographic markets, primarily on the basis of price and our responsive and reliable service. Our competitors generally include local outlets of national distributors and local independent distributors, whose proximity to customers entails lower costs to provide service. As an energy source, propane competes with home heating oil and electricity, which are typically more expensive (based on equivalent unit of heat value). Since natural gas has historically been less expensive than propane, propane is generally not distributed in geographic areas served by natural gas pipeline or distribution systems.
Propane Distribution - Supplies, Transportation and Storage
We purchase propane for our propane distribution operations primarily from suppliers, including major oil companies, independent producers of natural gas liquids and from Xeron. Although supplies of propane from these and other sources are generally readily available for purchase, extreme market conditions, such as significant fluctuation in weather, closing of refineries and disruption in supply chain, could result in a reduction in available supplies.
Propane is transported by trucks and railroad cars from refineries, natural gas processing plants or pipeline terminals to our bulk storage facilities. We own various bulk propane storage facilities with an aggregate capacity of approximately
3.6 million
gallons in Delaware, Maryland, Pennsylvania, Virginia and Florida. From these storage facilities, propane is delivered by “bobtail” trucks, owned and operated by us, to tanks located at the customers’ premises.
Propane Wholesale Marketing
Through Xeron, we market propane to major independent oil and petrochemical companies, wholesale resellers and retail propane companies located primarily in the southeastern United States. Xeron enters into forward contracts with various counterparties to commit to purchase or sell an agreed-upon quantity of propane at an agreed-upon price at a specified future date, which typically
Chesapeake Utilities Corporation 2013 Form 10-K Page
9
ranges from one to six months from the execution of the contract. At the expiration of the forward contracts, Xeron typically settles its purchases and sales financially, without taking physical delivery of the propane. Xeron also enters into futures and other option contracts that are traded on the InterContinentalExchange, Inc. The level and profitability of the propane wholesale marketing activity is affected by both propane wholesale price volatility and liquidity in the wholesale market. In 2013, Xeron had operating revenues, net of the associated cost of propane sold totaling approximately
$1.3 million
. For further discussion of Xeron’s wholesale marketing activities, market risks and controls that monitor Xeron’s risks, refer to
Item 7, Management’s Discussion and Analysis of Financial Condition and Results of Operations — Market Risk.
Xeron does not own physical storage facilities or equipment to transport propane; however, it contracts for storage and pipeline capacity to facilitate the sale of propane on a wholesale basis.
Natural Gas Marketing
We provide natural gas supply and supply management services through PESCO to 3,136 customers in Florida and 27 other customers, located primarily on the Delmarva Peninsula. In 2013, PESCO had operating revenues of
$53.7 million
in Florida and
$8.0 million
from customers located primarily on the Delmarva Peninsula. PESCO competes with regulated utilities and other unregulated third-party marketers to sell natural gas supplies directly to commercial and industrial customers through competitively-priced contracts. PESCO does not own or operate any natural gas transmission or distribution assets. The gas that PESCO sells is delivered to retail customers through affiliated and non-affiliated local distribution company systems and transmission pipelines. PESCO bills its customers directly or through the billing services of the regulated utilities that deliver the gas.
Other Unregulated Businesses
We provide heating, ventilation and air conditioning, plumbing and electrical services through Austin Cox to residential, commercial and industrial customers throughout the lower Delmarva Peninsula. FPU sells energy-related merchandise in Florida. Operating revenues in 2013 from these other unregulated businesses totaled
$4.1 million
.
O
THER
Overview of Business
The “Other” segment consists primarily of BravePoint, our advanced information services subsidiary; other unregulated subsidiaries, including Skipjack and ESRE that own real estate leased to affiliates; and certain unallocated corporate costs, which are not directly attributable to a specific business unit.
Advanced Information Services
BravePoint provides domestic and a limited number of international clients with information technology services and solutions for both enterprise and e-business applications. BravePoint provides the following products and services to its clients: Pro-2, ProfitZoom, 360 Analytics, Application Evolution, Software Development, Integration, Database services, Managed DBA, Application Expertise and Marketing Consulting. For the year ended December 31, 2013, BravePoint's operating revenue was
$19.1 million
.
Other Subsidiaries
Skipjack and ESRE own and lease office buildings in Delaware and Maryland to affiliates of Chesapeake. CIC is an affiliated investment company incorporated in Delaware.
E
NVIRONMENTAL
C
OMPLIANCE
We are subject to federal, state and local laws and regulations governing environmental quality and pollution control. These laws and regulations require us to remove or remediate the effect on the environment of the disposal or release of specified substances at current and former operating sites. We have participated in the investigation, assessment or remediation, and have exposures at six former MGP sites. At December 31, 2013, we had
$10.7 million
in environmental liabilities, representing our estimate of such future costs principally related to two of the six former MGP sites. The most significant site is located in West Palm Beach, Florida, where FPU previously operated an MGP and is currently implementing a remedial plan approved by the FDEP. The estimated cost of remediation for the West Palm Beach site ranges from approximately
$4.5 million
to
$15.4 million
. Chesapeake is also currently assessing a remediation plan and actively remediating a former MGP site in Winter Haven, Florida. The estimated cost of remediation for the Winter Haven site ranges from approximately
$443,000
to
$1.0 million
. Base rates of our local distribution utilities include recovery of environmental remediation costs adequate to fully recover our current estimate of cost of remediation. We continue to expect that any additional costs related to environmental remediation and related activities beyond our current estimate will be recoverable from customers through rates. For additional information on each site, refer to
Item 8. Financial Statements and Supplementary Data
(see
Note 19, Environmental Commitments and Contingencies
in the Consolidated Financial Statements).
Chesapeake Utilities Corporation 2013 Form 10-K Page
10
E
MPLOYEES
As of
December 31, 2013
, we had a total of 842 employees, 122 of whom are union employees represented by two labor unions: the International Brotherhood of Electrical Workers and Commercial Workers Union, whose collective bargaining agreements expire in 2014 and 2016.
F
INANCIAL
I
NFORMATION
A
BOUT
G
EOGRAPHICAL
A
REAS
All of our material operations, customers and assets are located in the United States.
A
VAILABLE
I
NFORMATION AND
C
ORPORATE
G
OVERNANCE
D
OCUMENTS
Our Annual Reports on Form 10-K, Quarterly Reports on Form 10-Q, Current Reports on Form 8-K and other reports and amendments to these reports that we file with or furnish to the SEC are available free of charge at our website,
www.chpk.com
,
as soon as reasonably practicable after we electronically file these reports with, or furnish these reports to, the SEC. The content of this website is not part of this report. These reports, and amendments to these reports, that we file with or furnish to the SEC are also available on the SEC’s website,
www.sec.gov
. The public may also read and copy any materials that we file with the SEC at the SEC’s Public Reference Room, 100 F Street, N.E., Washington, DC 20549-5546. The public may obtain information from the Public Reference Room by calling the SEC at 1-800-SEC-0330.
In addition, the following documents are available free of charge on our website,
www.chpk.com
:
•
Business Code of Ethics and Conduct applicable to all employees, officers and directors;
•
Code of Ethics for Financial Officers;
•
Corporate Governance Guidelines;
|
•
|
Charters for the Audit Committee, Compensation Committee and Corporate Governance Committee of the Board Directors; and
|
•
Corporate Governance Guidelines on Director Independence.
Any of these reports or documents may also be obtained by writing to: Corporate Secretary; c/o Chesapeake Utilities Corporation, 909 Silver Lake Boulevard, Dover, DE 19904.
If we make any amendment to, or grant a waiver of, any provision of the Business Code of Ethics and Conduct or the Code of Ethics for Financial Officers applicable to our principal executive officer, president, principal financial officer, principal accounting officer or controller, the amendment or waiver will be disclosed within four business days in a press release, by website disclosure, or by filing a current report on Form 8-K with the SEC.
C
ERTIFICATION TO THE
NYSE
Our Chief Executive Officer certified to the NYSE on June 4, 2013, that as of that date, he was unaware of any violation by Chesapeake of the NYSE’s corporate governance listing standards.
Chesapeake Utilities Corporation 2013 Form 10-K Page
11
I
TEM
1A. R
ISK
F
ACTORS
.
The following is a discussion of the primary factors that may affect the operations or financial performance of our regulated and unregulated businesses. Refer to the section entitled
Item 7. Management’s Discussion and Analysis of Financial Condition and Results of Operations
of this report for an additional discussion of these and other related factors that affect our operations and/or financial performance.
F
INANCIAL
R
ISKS
Instability and volatility in the financial markets could negatively impact our ability to access capital at competitive rates.
Our business strategy includes the continued pursuit of growth, both organically and through acquisitions. To the extent that we do not generate sufficient cash flow from operations, we may incur additional indebtedness to finance our growth. We rely on access to both short-term and long-term capital markets as a significant source of liquidity for capital requirements not satisfied by the cash flows from our operations. We are committed to maintaining a sound capital structure and strong credit ratings to provide the financial flexibility needed to access capital markets when required. However, if we are not able to access capital at competitive rates, our ability to implement our strategic plan, undertake improvements and make other investments required for our future growth may be limited.
A downgrade in our credit rating could adversely affect our access to capital markets and our cost of capital.
Our ability to obtain adequate and cost-effective capital depends on our credit ratings, which are greatly affected by our financial performance and the liquidity of financial markets. A downgrade in our current credit ratings could adversely affect our access to capital markets, as well as our cost of capital.
If we fail to comply with our debt covenant obligations, we could experience adverse financial consequences that could affect our liquidity and ability to borrow funds.
Our long-term debt obligations and committed short-term lines of credit contain financial covenants related to debt-to-capital ratios and interest-coverage ratios. Failure to comply with any of these covenants could result in an event of default which, if not cured or waived, could result in the acceleration of outstanding debt obligations or the inability to borrow under certain credit agreements. Any such acceleration would cause a material adverse change in our financial condition.
An increase in interest rates may adversely affect our results of operations and cash flows.
An increase in interest rates, without the recovery of the higher cost of debt in the sales and/or transportation rates we charge our utility customers, could adversely affect future earnings. An increase in short-term interest rates would negatively affect our results of operations, which depend on short-term lines of credit to finance accounts receivable and storage gas inventories, as well as to temporarily finance capital expenditures.
Inflation may impact our results of operations, cash flows and financial position.
Inflation affects the cost of supply, labor, products and services required for operations, maintenance and capital improvements. To help cope with the effects of inflation on our capital investments and returns, we seek rate increases from regulatory commissions for regulated operations and closely monitor the returns of our unregulated operations. There can be no assurance that we will be able to obtain adequate and timely rate increases to offset the effects of inflation. To compensate for fluctuations in propane gas prices, we adjust our propane selling prices to the extent allowed by the market. There can be no assurance, however, that we will be able to increase propane sales prices sufficiently to compensate fully for such fluctuations in the cost of propane gas to us.
Our energy marketing subsidiaries are exposed to market risks, beyond our control, which could adversely affect our financial results and capital requirements.
Our energy marketing subsidiaries are subject to market risks beyond our control, including market liquidity and commodity price volatility. Although we maintain risk management policies, we may not be able to offset completely the price risk associated with volatile commodity prices, which could lead to volatility in earnings. Physical trading also has price risk on any net open positions at the end of each trading day, as well as volatility resulting from: (i) intra-day fluctuations of natural gas and/or propane prices, and (ii) daily price movements between the time natural gas and/or propane is purchased or sold for future delivery and the time the related purchase or sale is economically hedged. The determination of our net open position at the end of any trading day requires us to make assumptions as to future circumstances, including the use of natural gas and/or propane by our customers in relation to its anticipated market positions. Because the price risk associated with any net open position at the end of such day
Chesapeake Utilities Corporation 2013 Form 10-K Page
12
may increase if the assumptions are not realized, we review these assumptions daily. Net open positions may increase volatility in our financial condition or results of operations if market prices move in a significantly favorable or unfavorable manner, because the changes in fair value of trading contracts are immediately recognized as profits or losses for financial accounting purposes. This volatility may occur, with a resulting increase or decrease in earnings or losses, even though the expected profit margin is essentially unchanged from the date the transactions were consummated.
Our energy marketing subsidiaries are exposed to credit risk of their counterparties.
Our energy marketing subsidiaries extend credit to counterparties and continually monitor and manage collections aggressively. Each of these subsidiaries is exposed to the risk that it may not be able to collect amounts owed to it. If the counterparty to such a transaction fails to perform, and any underlying collateral is inadequate, we could experience financial losses.
Our energy marketing subsidiaries are dependent upon the availability of credit to successfully operate their businesses.
Our energy marketing subsidiaries are dependent upon the availability of credit to buy propane and natural gas for resale or to trade. If financial market conditions decline generally, or the financial condition of these subsidiaries or of our Company declines, then the cost of credit available to these subsidiaries could increase. If credit is not available, or if credit is more costly, our results of operations, cash flows and financial condition may be adversely affected.
Current market conditions have adversely impacted the return on plan assets for our pension plans, which may require significant additional funding.
We have pension plans that are closed to new employees and the future benefits are frozen. The costs of providing benefits and related funding requirements of these plans are subject to changes in the market value of the assets that fund the plans and the discount rates used to estimate the pension benefit obligations. As a result of the extreme volatility and disruption in the domestic and international equity, bond and interest rate markets in recent years, the asset values and benefit obligations of Chesapeake’s and FPU’s Pension Plans have fluctuated significantly since 2008. The funded status of the plans and the related costs reflected in our financial statements are affected by various factors that are subject to an inherent degree of uncertainty, particularly in the current economic environment. Future losses of asset values and further declines in discount rates may necessitate accelerated funding of the plans in the future to meet minimum federal government requirements as well as higher pension expense to be recorded in future years. Adverse changes in the asset values and benefit obligations of our pension plans may require us to record higher pension expense and fund obligations earlier than originally planned, which would have an adverse impact on our cash flows from operations, decrease borrowing capacity and increase interest expense.
O
PERATIONAL
R
ISKS
Fluctuations in weather may cause a significant variance in our earnings.
Our natural gas and propane distribution operations are sensitive to fluctuations in weather conditions, which directly influence the volume of natural gas and propane we sell and deliver to our customers. A significant portion of our natural gas and propane distribution revenues is derived from the sales and deliveries of natural gas and propane to residential and commercial heating customers during the five-month peak heating season (November through March). If the weather is warmer than normal, we sell and deliver less natural gas and propane to customers, and earn less revenue, which could adversely affect our results of operations, cash flows and financial condition.
Our electric operation is also affected by variations in general weather conditions and particularly unusually severe weather conditions. Electricity is generally less seasonal than natural gas and propane sales because it is used for both heating and cooling in our service areas.
The amount and availability of natural gas, propane and electricity supplies are difficult to predict; a substantial reduction in available supplies could reduce our earnings in those segments.
Natural gas, propane and electricity production can be affected by factors beyond our control, such as weather and closings of energy generation facilities and refineries. If we are unable to obtain sufficient natural gas, electricity and propane supplies to meet demand, results in those businesses may be adversely affected. Any substantial decrease in the availability of supplies of natural gas, propane and electricity could result in increased supply costs and higher prices for customers, which could also adversely affect our financial condition and results of operations.
Chesapeake Utilities Corporation 2013 Form 10-K Page
13
We rely on a limited number of natural gas, propane and electricity suppliers, the loss of which could have a material adverse effect on our financial condition and results of operations.
We have entered into various agreements with suppliers to purchase natural gas, propane and electricity to serve our customers. The loss of any significant suppliers or our inability to renew these contracts at favorable terms upon their expiration could significantly affect our ability to serve our customers and have a material adverse impact on our financial condition and results of operations.
A substantial disruption or lack of growth in interstate natural gas pipeline transmission and storage capacity and electric transmission capacity may impair our ability to meet customers’ existing and future requirements.
In order to meet existing and future customer demands for natural gas and electricity, we must acquire sufficient supplies of natural gas and electricity, interstate pipeline transmission and storage capacity, and electric transmission capacity to serve such requirements. We must contract for reliable and adequate upstream transmission capacity for our distribution systems while considering the dynamics of the interstate pipeline and storage and electric transmission markets, our own on-system resources, as well as the characteristics of our markets. Our financial condition and results of operations would be materially and adversely affected if the future availability of these capacities were insufficient to meet future customer demands for natural gas and electricity. Currently, our Florida natural gas operation relies primarily on one pipeline system, FGT, for most of its natural gas supply and transmission. Our Florida electric operation relies primarily on two suppliers, Gulf Power for the northwest service territory and JEA for the northeast service territory. Any interruption to these systems could adversely affect our ability to meet the demands of FPU’s customers and our earnings.
Commodity price increases may adversely affect the operating costs and competitive positions of our natural gas, electric and propane distribution operations, which may adversely affect our results of operations, cash flows and financial condition.
Natural Gas/Electric
. Higher natural gas prices can significantly increase the cost of gas billed to our natural gas customers. Increases in the cost of coal, natural gas and other fuels used to generate electricity can significantly increase the cost of electricity billed to our electric customers. Damage to the production or transportation facilities of our suppliers, decreasing their supply of natural gas and electricity, could result in increased supply costs and higher prices for our customers. Such cost increases generally have no immediate effect on our revenues and net income because of our regulated fuel cost recovery mechanisms. Our net income, however, may be reduced by higher expenses that we may incur for uncollectible customer accounts and by lower volumes of natural gas and electricity deliveries when customers reduce their consumption. Therefore, increases in the price of natural gas, coal and other fuels can affect our operating cash flows and the competitiveness of natural gas and electricity as energy sources.
Propane
. Propane costs are subject to volatile changes as a result of product supply or other market conditions, including weather and economic and political factors affecting crude oil and natural gas supply or pricing. For example, weather conditions could damage production or transportation facilities, which could result in decreased supplies of propane, increased supply costs and higher prices for customers. Such cost changes can occur rapidly and can affect profitability. There is no assurance that we will be able to pass on propane cost increases fully or immediately, particularly when propane costs increase rapidly. Therefore, average retail sales prices can vary significantly from year to year as product costs fluctuate in response to propane, fuel oil, crude oil and natural gas commodity market conditions. In addition, in periods of sustained higher commodity prices, declines in retail sales volumes due to reduced consumption and increased amounts of uncollectible accounts may adversely affect net income.
Our propane inventory is subject to inventory valuation risk, which may result in a write-down of inventory.
Our propane distribution operations own bulk propane storage facilities, with an aggregate capacity of approximately
3.6 million
gallons. We purchase and store propane based on several factors, including inventory levels and the price outlook. We may purchase large volumes of propane at current market prices during periods of low demand and low prices, which generally occur during the summer months. Propane is a commodity, and as such, its price is subject to volatile fluctuations in response to changes in supply or other market conditions. We have no control over these market conditions. Consequently, the wholesale price of the propane that we purchase can change rapidly over a short period of time. The retail market price for propane could fall below the price at which we made the purchases, which would adversely affect our profits or cause sales from that inventory to be unprofitable. In addition, falling propane prices may result in inventory write-downs, as required by GAAP, if the market price of propane falls below our weighted average cost of inventory, which could adversely affect net income.
Operating events affecting public safety and the reliability of our natural gas and electric distribution and transmission systems could adversely affect our operations and increase our costs.
Our natural gas and electric operations are exposed to operational events and risks, such as major leaks, outages, mechanical failures and breakdown, operations below expected level of performance or efficiency and accidents that could affect public safety and the reliability of our distribution and transmission systems, significantly increase costs and cause loss of customer confidence.
Chesapeake Utilities Corporation 2013 Form 10-K Page
14
If we are unable to recover from customers through the regulatory process, all or some of these costs and our authorized rate of return, our results of operations, financial condition and cash flows could be adversely affected.
We operate in a competitive environment, and we may lose customers to competitors.
Natural Gas
. Our natural gas marketing operations compete with third-party suppliers to sell natural gas to commercial and industrial customers. Our natural gas transmission and distribution operations compete with interstate pipelines when our transmission and/or distribution customers are located close enough to a competing pipeline to make direct connections economically feasible. Failure to retain and grow our customer base in the natural gas operations would have an adverse effect on our financial condition, cash flows and results of operations.
Electric
. While there is active wholesale power sales competition in Florida, our retail electric business through FPU has remained substantially free from direct competition from other electric service providers. Generally, however, our retail electric business through FPU remains subject to competition from other energy sources. Changes in the competitive environment caused by legislation, regulation, market conditions or initiatives of other electric power providers, particularly with respect to retail competition, could adversely affect our results of operations, cash flows and financial condition.
Propane
. Our propane distribution operations compete with other propane distributors, primarily on the basis of service and price. Some of our competitors have significantly greater resources. Our ability to grow the propane distribution business is contingent upon capturing additional market share, expanding into new markets, and successfully utilizing pricing programs that retain and grow our customer base. Failure to retain and grow our customer base in our propane distribution operations would have an adverse effect on our results of operations, cash flows and financial condition.
Our propane wholesale marketing operation competes with various marketers, many of which have significantly greater resources and are able to obtain price or volumetric advantages.
Energy conservation could lower energy consumption and adversely affect our earnings.
We have seen various legislative and regulatory initiatives to promote energy efficiency and conservation at both federal and state levels. In response to the initiatives in the states in which we operate, we have put into place programs to promote energy efficiency by our current and potential customers. To the extent a PSC allows us to recover the cost of such energy efficiency programs, funding for such programs is recovered through the rates we charge to our regulated customers. However, lower energy consumption as a result of energy efficiency and conservation by current and potential customers may adversely affect our results of operations, cash flows and financial condition.
Changes in technology may adversely affect BravePoint’s competitiveness.
BravePoint participates in a market that is characterized by rapidly changing technology and accelerating product introduction cycles. The success of BravePoint depends upon our ability to address the rapidly changing needs of our customers by developing and supplying high-quality, cost-effective products, product enhancements and services, on a timely basis, and by keeping pace with technological developments and emerging industry standards. There is no assurance that we will be able to keep up with technological advancements to the degree necessary to keep our products and services competitive.
Our use of derivative instruments may adversely affect our results of operations.
Fluctuating commodity prices may affect our earnings and financing costs because our propane distribution and wholesale marketing operations use derivative instruments, including forwards, futures, swaps and puts, to hedge price risk. While we have risk management policies and operating procedures in place to control our exposure to risk, if we purchase derivative instruments that are not properly matched to our exposure, our results of operations, cash flows, and financial condition may be adversely affected.
Changes in customer growth may affect earnings and cash flows.
Our ability to increase gross margins in our regulated energy and unregulated propane distribution businesses is dependent upon growth in the residential construction market, adding new commercial and industrial customers and conversion of customers to natural gas, electricity or propane from other energy sources. Slowdowns in growth may adversely affect our gross margin, earnings and cash flows.
Chesapeake Utilities Corporation 2013 Form 10-K Page
15
Our businesses are capital intensive, and the increased costs and/or delays of capital projects may adversely affect our future earnings.
Our businesses are capital intensive and require significant investments in on-going infrastructure projects. There are limited materials and qualified vendors that can be used in our projects. Our ability to complete our infrastructure projects on a timely basis and manage the overall cost of those projects is affected by the availability of the necessary materials and qualified vendors. Our future earnings could be adversely affected if we are unable to manage such capital projects effectively, or if full recovery of such capital costs is not permitted in future regulatory proceedings.
Our regulated energy business may be at risk if franchise agreements are not renewed.
Our regulated natural gas and electric distribution operations hold franchises in each of the incorporated municipalities that require franchise agreements in order to provide natural gas and electricity. Our natural gas and electric distribution operations are currently in negotiations for franchises with certain municipalities for new service areas and renewal of some existing franchises. Ongoing financial results would be adversely impacted from the loss of service to certain operating areas within our electric or natural gas territories in the event that franchise agreements were not renewed.
A strike, work stoppage or a labor dispute could adversely affect our operations.
We are party to collective bargaining agreements with various labor unions at some of our Florida operations. A strike, work stoppage or a labor dispute with a union or employees represented by a union could cause interruption to our operations. If a strike, work stoppage or other labor dispute were to occur, our results could be adversely affected.
Accidents, natural disasters, severe weather (such as a major hurricane) and acts of terrorism could adversely impact earnings.
Inherent in energy transmission and distribution activities are a variety of hazards and operational risks, such as leaks, ruptures, fires, explosions, sabotage and mechanical problems. Natural disasters and severe weather may damage our assets, cause operational interruptions and result in the loss of human life. The threat of terrorism and the impact of retaliatory military and other action by the United States and its allies may lead to increased political, economic and financial market instability and volatility in the price of natural gas, electricity and propane that could affect our operations. In addition, future acts of terrorism could be directed against companies operating in the United States, and companies in the energy industry may face a heightened risk of exposure to acts of terrorism. The insurance industry may also be affected by natural disasters, severe weather and acts of terrorism, and as a result, the availability of insurance covering risks against which we and our competitors typically insure may be limited. In addition, the insurance we are able to obtain may have higher deductibles, higher premiums and more restrictive policy terms, which could adversely affect our results of operations, financial condition and cash flows.
A security breach disrupting our operating systems and facilities or exposing confidential information may adversely affect our reputation, disrupt our operations and increase our costs.
Security breaches of our information technology infrastructure, including cyber-attacks and cyber-terrorism, could lead to system disruptions or generate facility shutdowns. If such an attack or security breach were to occur, our business, results of operations and financial condition could be adversely affected. Additionally, the protection of customer, employee and Company data is crucial to our operational security. A breakdown or a breach in our systems that results in the unauthorized release of individually identifiable customer or other sensitive data could occur and have an adverse effect on our reputation, results of operations and financial condition. A breakdown or breach could also materially increase our costs of maintaining our system and protecting it against future breakdowns or breaches. We take reasonable precautions to safeguard our information systems from cyber-attacks and security breaches; however, there is no guarantee that the procedures implemented to protect against unauthorized access to our information systems are adequate to safeguard against all attacks and breaches.
R
EGULATORY,
L
EGAL AND
E
NVIRONMENTAL
R
ISKS
Regulation of our businesses, including changes in the regulatory environment, may adversely affect our results of operations, cash flows and financial condition.
The Delaware, Maryland and Florida PSCs regulate our utility operations in those states. Eastern Shore is regulated by the FERC. The PSCs and the FERC set the rates that we can charge customers for services subject to their regulatory jurisdiction. Our ability to obtain timely future rate increases and rate supplements to maintain current rates of return depends on regulatory approvals, and there can be no assurance that our regulated operations will be able to obtain such approvals or maintain currently authorized
Chesapeake Utilities Corporation 2013 Form 10-K Page
16
rates of return. When our earnings from the regulated utilities exceed the authorized rate of return, the respective PSC, or the FERC in the case of Eastern Shore, may require us to reduce our rates charged to customers in the future.
We are dependent upon construction of new facilities to support future growth in earnings in our natural gas and electric distribution and natural gas transmission operations.
Construction of new facilities required to support future growth is subject to various regulatory and developmental risks, including but not limited to: (i) our ability to obtain necessary approvals and permits from regulatory agencies on a timely basis and on terms that are acceptable to us; (ii) potential changes in federal, state and local statutes and regulations, including environmental requirements, that prevent a project from proceeding or increase the anticipated cost of the project; (iii) inability to acquire rights-of-way or land rights on a timely basis on terms that are acceptable to us; (iv) lack of anticipated future growth in available natural gas and electricity supply; and (v) insufficient customer throughput commitments.
We are subject to operating and litigation risks that may not be fully covered by insurance.
Our operations are subject to the operating hazards and risks normally incidental to handling, storing, transporting, transmitting and delivering natural gas, electricity and propane to end users. From time to time, we are a defendant in legal proceedings arising in the ordinary course of business. We maintain insurance policies with insurers to cover our general liabilities in the amount of $51 million, which we believe are reasonable and prudent. There can be no assurance, however, that such insurance will be adequate to protect us from all material expenses related to potential future claims for personal injury and property damage or that such levels of insurance will be available in the future at economical prices.
We may face certain regulatory and financial risks related to pipeline safety legislation.
A number of legislative proposals to implement increased oversight over natural gas pipeline operations and increased investment in facilities to inspect pipeline facilities, upgrade pipeline facilities, or control the impact of a breach of such facilities are pending at the federal level. Additional operating expenses and capital expenditures may be necessary to remain in compliance with the increased federal oversight resulting from such proposals. If such legislation is adopted and we incur additional expenses and expenditures as a result, our financial condition, results of operations and cash flows could be adversely affected, particularly if we are not authorized through the regulatory process to recover from customers some or all of these costs and our authorized rate of return.
Costs of compliance with environmental laws may be significant.
We are subject to federal, state and local laws and regulations governing environmental quality and pollution control. These evolving laws and regulations may require expenditures over a long period of time to control environmental effects at our current and former operating sites, especially former MGP sites. Compliance with these legal obligations requires us to commit capital. If we fail to comply with environmental laws and regulations, even if such failure is caused by factors beyond our control, we may be assessed civil or criminal penalties and fines.
To date, we have been able to recover, through regulatory rate mechanisms, the costs associated with the remediation of former MGP sites. There is no guarantee, however, that we will be able to recover future remediation costs in the same manner or at all. A change in our approved rate mechanisms for recovery of environmental remediation costs at former MGP sites could adversely affect our results of operations, cash flows and financial condition.
Further, existing environmental laws and regulations may be revised, or new laws and regulations seeking to protect the environment may be adopted and be applicable to us. Revised or additional laws and regulations could result in additional operating restrictions on our facilities or increased compliance costs, which may not be fully recoverable.
Derivatives legislation and the implementation of related rules could have an adverse impact on our ability to hedge risks associated with our business.
The Dodd-Frank Act regulates derivative transactions, which include certain instruments used in our risk management activities. The Dodd-Frank Act contemplates that most swaps will be required to be cleared through a registered clearing facility and traded on a designated exchange or swap execution facility, subject to certain exceptions for entities that use swaps to hedge or mitigate commercial risk. Although the Dodd-Frank Act includes significant new provisions regarding the regulation of derivatives, the impact of those requirements will not be known definitively until regulations have been adopted and fully implemented by both the SEC and the Commodities Futures Trading Commission, and market participants establish registered clearing facilities under those regulations. The legislation and any new regulations could increase the operational and transactional cost of derivatives contracts and affect the number and/or creditworthiness of available counterparties.
Chesapeake Utilities Corporation 2013 Form 10-K Page
17
Our business may be subject in the future to additional regulatory and financial risks associated with global warming and climate change.
There have been a number of federal and state legislative and regulatory initiatives proposed in recent years in an attempt to control or limit the effects of global warming and overall climate change, including greenhouse gas emissions, such as carbon dioxide. The adoption of this type of legislation by Congress or similar legislation by states or the adoption of related regulations by federal or state governments mandating a substantial reduction in greenhouse gas emissions in the future could have far-reaching and significant impacts on the energy industry. Such new legislation or regulations could result in increased compliance costs for us or additional operating restrictions on our business, affect the demand for natural gas and propane or impact the prices we charge to our customers. At this time, we cannot predict the potential impact of such laws or regulations that may be adopted on our future business, financial condition or financial results.
Chesapeake Utilities Corporation 2013 Form 10-K Page
18
I
TEM
1B. U
NRESOLVED
S
TAFF
C
OMMENTS
.
None.
I
TEM
2. P
ROPERTIES
.
Key Properties
We own approximately
1,214
miles of natural gas distribution mains (together with related service lines, meters and regulators) located in New Castle, Kent and Sussex Counties, Delaware; and Cecil, Caroline, Dorchester, Wicomico and Worcester Counties, Maryland. We own
2,642
miles of natural gas distribution mains (and related equipment) in Nassau, Polk, Osceola, Citrus, DeSoto, Liberty, Hillsborough, Holmes, Jackson, Gadsden, Gilchrist, Union, Washington, Pasco, Suwannee, Palm Beach, Broward, Martin, Marion, Seminole and Volusia Counties, Florid
a.
In addition, we have adequate gate stations to handle receipt of the gas into each of the distribution systems. We also own facilities in Delaware and Maryland, which we use for propane-air injection during periods of peak demand.
We own and operate through Eastern Shore approximately 437 miles of transmission pipeline, extending from supply interconnects at Parkesburg, Daleville and Honey Brook, Pennsylvania; and Hockessin, Delaware, to 90 delivery points in southeastern Pennsylvania, Delaware and the eastern shore of Maryland. We also own and operate through Peninsula Pipeline approximately eight miles of transmission pipeline in Suwannee County, Florida. We also own approximately 45 percent of the 16-mile pipeline extending from the Duval/Nassau County line to Amelia Island in Nassau County, Florida. The remaining 55 percent of the pipeline is owned by Peoples Gas.
We own and operate through FPU
20
miles of electric transmission line located in Nassau County, Florida and
881
miles of electric distribution line in Jackson, Liberty, Calhoun and Nassau Counties, Florida.
We own
479
miles of underground propane distribution mains in Kent, New Castle and Sussex Counties, Delaware; Dorchester, Princess Ann, Queen Anne's, Somerset, Talbot, Wicomico and Worcester Counties, Maryland; Chester and Delaware Counties, Pennsylvania; and Alachua, Brevard, Broward, Citrus, Duval, Hillsborough, Marion, Nassau, Orange, Palm Beach, Polk, Seminole, St. Johns and Volusia Counties, Florida.
We own bulk propane storage facilities, with an aggregate capacity of approximately
2.7 million
gallons, at 31 plant facilities in Delaware, Maryland, Pennsylvania and Virginia, located on real estate that is either owned or leased by us. In Florida, we own 39 bulk propane storage facilities with a total capacity of
906,000
gallons. Xeron does not own physical storage facilities or equipment to transport propane; however, it leases propane storage and pipeline capacity from non-affiliated third parties.
We own offices and operate facilities in the following locations: Worcester, Wicomico, Dorchester, Talbot, Cecil and Somerset Counties, Maryland; Kent and Sussex Counties, Delaware; Accomack County, Virginia; and Palm Beach, Volusia, Levy, Martin, Jackson, Broward, Nassau, Brevard, Alachua, Hendry, Okeechobee, and Polk Counties, Florida.
Lien
All of the assets owned by FPU are subject to a lien in favor of the holders of its first mortgage bond securing its indebtedness under its Mortgage Indenture and Deed of Trust. FPU owns offices and operates facilities in the following locations: Palm Beach, Volusia, Levy, Martin, Jackson, Broward, Nassau, Brevard, Alachua, Hendry and Okeechobee Counties, Florida. The FPU assets subject to the lien also include:
1,800
miles of natural gas distribution mains (and related equipment) in its service areas;
20
miles of electric transmission line located in Nassau County, Florida;
881
miles of electric distribution line located in Jackson, Liberty, Calhoun and Nassau Counties in Florida; 39 bulk propane storage facilities with a total capacity of
906,000
gallons located in south and central Florida; and
71
miles of underground propane distribution mains in Alachua, Brevard, Broward, Citrus, Duval, Hillsborough, Marion, Nassau, Orange, Palm Beach, Polk, Seminole, St. Johns and Volusia Counties, Florida.
Chesapeake Utilities Corporation 2013 Form 10-K Page
19
I
TEM
3. L
EGAL
P
ROCEEDINGS
.
G
ENERAL
We are involved in various legal actions and claims arising in the normal course of business. We are also involved in certain administrative proceedings before various governmental or regulatory agencies concerning rates. In the opinion of management, the ultimate disposition of these current proceedings will not have a material effect on our consolidated financial position, results of operations or cash flows.
L
EGAL
P
ROCEEDINGS
On March 2, 2011, the City of Marianna filed a complaint against FPU in the Circuit Court of the Fourteenth Judicial Circuit in and for Jackson County, Florida. In the complaint, the City of Marianna alleged three breaches of the Franchise Agreement by FPU: (i) FPU failed to develop and implement TOU and interruptible rates that were mutually agreed to by the City of Marianna and FPU; (ii) mutually agreed upon TOU and interruptible rates by FPU were not effective or in effect by February 17, 2011; and (iii) FPU did not have such rates available to all of FPU’s customers located within and without the corporate limits of the City of Marianna. The City of Marianna sought a declaratory judgment allowing it to exercise its option under the Franchise Agreement to purchase FPU’s property (consisting of the electric distribution assets) within the City of Marianna. Any such purchase would be subject to approval by the Marianna Commission, which would also need to approve the presentation of a referendum to voters in the City of Marianna related to the purchase and the operation by the City of Marianna of an electric distribution facility.
Prior to the scheduled trial date, FPU and the City of Marianna reached an agreement in principle to resolve their dispute, which resulted in the City of Marianna dismissing its legal action with prejudice on February 11, 2013. Subsequently, FPU and the City of Marianna entered into a settlement agreement, which contemplated, among other items, the City of Marianna proceeding with a referendum on the purchase of FPU’s facilities within the City of Marianna. On April 9, 2013, the referendum took place, and the citizens of the City of Marianna voted, by a wide margin, to reject the purchase of FPU’s facilities by the City of Marianna. As a result of the dismissal with prejudice of the legal action by the City of Marianna and the outcome of the referendum on the purchase of FPU’s facilities, we no longer have any contingencies related to claims by the City of Marianna.
I
TEM
4A. E
XECUTIVE
O
FFICERS
OF
THE
R
EGISTRANT
.
Set forth below are the names, ages, and positions of our executive officers with their recent business experience. The age of each officer is as of the filing date of this report.
Chesapeake Utilities Corporation 2013 Form 10-K Page
20
|
Name
|
Age
|
Position
|
||
|
Michael P. McMasters
|
55
|
President (March 2010 - present)
Chief Executive Officer (January 2011 - present)
Director (March 2010 - present)
Executive Vice President (September 2008 - February 2010)
Chief Operating Officer (September 2008 - December 2010)
Chief Financial Officer (January 1997 - September 2008)
Mr. McMasters also previously served as Senior Vice President, Vice President, Treasurer, Director of Accounting and Rates, and Controller.
|
||
|
Beth W. Cooper
|
47
|
Senior Vice President (September 2008 - present)
Chief Financial Officer (September 2008 - present)
Corporate Secretary (June 2005 - present)
Vice President (June 2005 - September 2008)
Treasurer (March 2003 - May 2012)
Ms. Cooper also previously served as Assistant Vice President, Assistant Treasurer, Assistant Secretary, Director of Internal Audit, and Director of Strategic Planning.
|
||
|
Elaine B. Bittner
|
44
|
Senior Vice President of Strategic Development (May 2013 - present)
Vice President of Strategic Development (June 2010 - May 2013) Vice President, Eastern Shore (May 2005 - June 2010) Ms. Bittner also previously served as Director of Eastern Shore; Director of Customer Services and Regulatory Affairs for Eastern Shore; Director of Environmental Affairs and Environmental Engineer. |
||
|
Stephen C. Thompson
|
53
|
Senior Vice President (September 2004 - present)
President, Eastern Shore (January 1997 - present)
Vice President (May 1997 - September 2004)
Mr. Thompson also previously served as Director of Gas Supply and Marketing for Eastern Shore; Superintendent of Eastern Shore; and Regional Manager for Florida distribution operations.
|
||
|
Jeffry M. Householder
|
56
|
President of Florida Public Utilities Company (June 2010 - present)
|
||
Chesapeake Utilities Corporation 2013 Form 10-K Page
21
P
ART
II
I
TEM
5. M
ARKET
FOR
THE
R
EGISTRANT
’
S
C
OMMON
E
QUITY
, R
ELATED
S
TOCKHOLDER
M
ATTERS
AND
I
SSUER
P
URCHASES
OF
E
QUITY
S
ECURITIES
.
C
OMMON
S
TOCK
P
RICE
R
ANGES,
C
OMMON
S
TOCK
D
IVIDENDS AND
S
HAREHOLDER
I
NFORMATION:
At
February 28, 2014, there were 2,342 holders
of record of Chesapeake common stock. Our common stock is listed on the NYSE under the symbol “CPK.” The high, low and closing prices of our common stock and dividends declared per share for each calendar quarter during 2013 and 2012 were as follows:
|
Quarter Ended
|
High
|
Low
|
Close
|
Dividends
Declared
Per Share
|
|||||||||||||
|
2013
|
|||||||||||||||||
|
March 31
|
$
|
50.39
|
|
$
|
45.84
|
|
$
|
49.05
|
|
$
|
0.365
|
|
|||||
|
June 30
|
$
|
55.86
|
|
$
|
48.26
|
|
$
|
51.49
|
|
$
|
0.385
|
|
|||||
|
September 30
|
$
|
60.08
|
|
$
|
50.84
|
|
$
|
52.49
|
|
$
|
0.385
|
|
|||||
|
December 31
|
$
|
61.17
|
|
$
|
50.53
|
|
$
|
60.02
|
|
$
|
0.385
|
|
|||||
|
2012
|
|||||||||||||||||
|
March 31
|
$
|
43.83
|
|
$
|
39.89
|
|
$
|
41.12
|
|
$
|
0.345
|
|
|||||
|
June 30
|
$
|
45.15
|
|
$
|
40.22
|
|
$
|
43.72
|
|
$
|
0.365
|
|
|||||
|
September 30
|
$
|
48.51
|
|
$
|
43.65
|
|
$
|
47.36
|
|
$
|
0.365
|
|
|||||
|
December 31
|
$
|
48.92
|
|
$
|
41.17
|
|
$
|
45.40
|
|
$
|
0.365
|
|
|||||
We have paid a cash dividend to common stock shareholders for 53 consecutive years. Dividends are payable at the discretion of our Board of Directors. Future payment of dividends, and the amount of these dividends, will depend on our financial condition, results of operations, capital requirements, and other factors. We declared quarterly cash dividends on our common stock in 2013 and 2012, totaling $1.52 per share and $1.44 per share, respectively.
Indentures to our long-term debt contain various restrictions which limit our ability to pay dividends. Each of our unsecured senior notes contains a “Restricted Payments” covenant. The most restrictive covenants of this type are included within the 7.83 percent Senior Notes, due January 1, 2015. The covenant provides that we cannot pay or declare any dividends or make any other Restricted Payments (such as dividends) in excess of the sum of $10.0 million plus consolidated net income of the Company accrued on and after January 1, 2001. As of December 31, 2013, our cumulative consolidated net income base was
$218.1 million
, offset by Restricted Payments of
$117.7 million
, leaving
$100.5 million
of cumulative net income free of restrictions.
FPU’s first mortgage bonds due in 2022 contain a similar restriction that limits the payment of dividends by FPU. They provide that FPU cannot make dividend or other restricted payments in excess of the sum of
$2.5 million
plus FPU’s consolidated net income accrued on and after January 1, 1992. As of December 31, 2013, FPU had a cumulative net income base of
$95.1 million
, offset by restricted payments of
$37.6 million
, leaving
$57.5 million
of cumulative net income of FPU free of restrictions based on this covenant.
No securities were sold during the year 2013 that were not registered under the Securities Act of 1933, as amended.
Chesapeake Utilities Corporation 2013 Form 10-K Page
22
P
URCHASES OF
E
QUITY
S
ECURITIES BY THE
I
SSUER
The following table sets forth information on purchases by or on behalf of Chesapeake of shares of its common stock during the quarter ended December 31, 2013.
|
Total
Number
of Shares
Purchased
|
Average
Price Paid
per Share
|
Total Number of Shares
Purchased as Part of
Publicly Announced Plans
or Programs
(2)
|
Maximum Number of
Shares That May Yet Be
Purchased Under the Plans
or Programs
(2)
|
|||||||||
|
Period
|
||||||||||||
|
October 1, 2013 through October 31, 2013
(1)
|
274
|
|
$
|
50.61
|
|
—
|
|
—
|
|
|||
|
November 1, 2013 through November 30, 2013
|
—
|
|
—
|
|
—
|
|
—
|
|
||||
|
December 1, 2013 through December 31, 2013
|
—
|
|
—
|
|
—
|
|
—
|
|
||||
|
Total
|
274
|
|
$
|
50.61
|
|
—
|
|
—
|
|
|||
|
(1)
|
Chesapeake purchased shares of common stock on the open market for the purpose of reinvesting the dividend on shares held in the Rabbi Trust accounts for certain Directors and Senior Executives under the Non-Qualified Deferred Compensation Plan. The Non-Qualified Deferred Compensation Plan is discussed in detail in
Item 8, Financial Statements and Supplementary Data
(see
Note 16, Employee Benefit Plans
, in the Consolidated Financial Statements). During the quarter, 274 shares were purchased through the reinvestment of dividends.
|
|
(2)
|
Except for the purpose described in Footnote
(1)
, Chesapeake has no publicly announced plans or programs to repurchase its shares.
|
Discussion of our compensation plans, for which shares of Chesapeake common stock are authorized for issuance, is included in the portion of the Proxy Statement captioned “Equity Compensation Plan Information” to be filed no later than March 31, 2014, in connection with our Annual Meeting to be held on or about
May 6, 2014
, and is incorporated herein by reference.
C
OMMON
S
TOCK
P
ERFORMANCE
G
RAPH
The stock performance graph and table below compares cumulative total stockholder return on our common stock during the five fiscal years ended
December 31, 2013
, with the cumulative total stockholder return of the S&P 500 Index and the cumulative total stockholder return of the Edward Jones Natural Gas Distribution Group, a published listing of selected gas distribution utilities’ results, which consists of Chesapeake and ten other companies, including: AGL Resources, Inc., Atmos Energy Corporation, Delta Natural Gas Company, Inc., The Laclede Group, Inc., New Jersey Resources Corporation, Northwest Natural Gas Company, Piedmont Natural Gas Company, Inc., RGC Resources, Inc., South Jersey Industries, Inc., and WGL Holdings, Inc.
Chesapeake Utilities Corporation 2013 Form 10-K Page
23
The comparison assumes $100 was invested on December 31, 2008 in our common stock and in each of the foregoing indices and assumes reinvested dividends. The comparisons in the graph below are based on historical data and are not intended to forecast the possible future performance of our common stock.
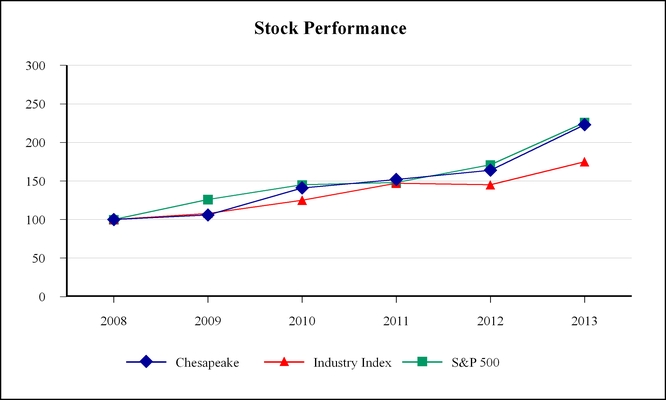
|
2008
|
2009
|
2010
|
2011
|
2012
|
2013
|
||||||||||||||||||
|
Chesapeake
|
$
|
100
|
|
$
|
106
|
|
$
|
141
|
|
$
|
152
|
|
$
|
164
|
|
$
|
223
|
|
|||||
|
Industry Index
|
$
|
100
|
|
$
|
108
|
|
$
|
125
|
|
$
|
147
|
|
$
|
145
|
|
$
|
175
|
|
|||||
|
S&P 500
|
$
|
100
|
|
$
|
126
|
|
$
|
145
|
|
$
|
148
|
|
$
|
171
|
|
$
|
226
|
|
|||||
Chesapeake Utilities Corporation 2013 Form 10-K Page
24
I
TEM
6. S
ELECTED
F
INANCIAL
D
ATA
|
For the Year Ended December 31,
|
|||||||||||
|
2013
|
2012
|
2011
|
|||||||||
|
Operating
(1)
|
|||||||||||
|
(in thousands)
|
|||||||||||
|
Revenues
|
|||||||||||
|
Regulated Energy
|
$
|
264,637
|
|
$
|
246,208
|
|
$
|
256,226
|
|
||
|
Unregulated Energy
|
166,723
|
|
133,049
|
|
149,586
|
|
|||||
|
Other
|
12,946
|
|
13,245
|
|
12,215
|
|
|||||
|
Total revenues
|
$
|
444,306
|
|
$
|
392,502
|
|
$
|
418,027
|
|
||
|
Operating income
|
|||||||||||
|
Regulated Energy
|
$
|
50,084
|
|
$
|
46,999
|
|
$
|
43,911
|
|
||
|
Unregulated Energy
|
12,353
|
|
8,355
|
|
9,619
|
|
|||||
|
Other
|
297
|
|
1,281
|
|
175
|
|
|||||
|
Total operating income
|
$
|
62,734
|
|
$
|
56,635
|
|
$
|
53,705
|
|
||
|
Net income from continuing operations
|
$
|
32,787
|
|
$
|
28,863
|
|
$
|
27,622
|
|
||
|
Assets
|
|||||||||||
|
(in thousands)
|
|||||||||||
|
Gross property, plant and equipment
|
$
|
805,394
|
|
$
|
697,159
|
|
$
|
625,488
|
|
||
|
Net property, plant and equipment
|
$
|
631,246
|
|
$
|
541,781
|
|
$
|
487,704
|
|
||
|
Total assets
|
$
|
837,522
|
|
$
|
733,746
|
|
$
|
709,066
|
|
||
|
Capital expenditures
(1)
|
$
|
108,039
|
|
$
|
78,210
|
|
$
|
44,431
|
|
||
|
Capitalization
|
|||||||||||
|
(in thousands)
|
|||||||||||
|
Stockholders’ equity
|
$
|
278,773
|
|
$
|
256,598
|
|
$
|
240,780
|
|
||
|
Long-term debt, net of current maturities
|
117,592
|
|
101,907
|
|
110,285
|
|
|||||
|
Total capitalization
|
$
|
396,365
|
|
$
|
358,505
|
|
$
|
351,065
|
|
||
|
Current portion of long-term debt
|
11,353
|
|
8,196
|
|
8,196
|
|
|||||
|
Short-term debt
|
105,666
|
|
61,199
|
|
34,707
|
|
|||||
|
Total capitalization and short-term financing
|
$
|
513,384
|
|
$
|
427,900
|
|
$
|
393,968
|
|
||
|
(1)
|
These amounts exclude the results of distributed energy and water services due to their reclassification to discontinued operations. We closed our distributed energy operation in 2007. All assets of the water businesses were sold in 2004 and 2003. These amounts also include accruals for capital expenditures that we have incurred for each reporting period.
|
|
(2)
|
These amounts include the financial position and results of operation of FPU for the period from the merger (October 28, 2009) to December 31, 2009. These amounts also include the effects of acquisition accounting and issuance of Chesapeake common shares as a result of the merger.
|
|
(3)
|
ASC 718,
Compensation—Stock Compensation,
and ASC 715,
Compensation—Retirement Plans
, were adopted in the year 2006; therefore, they were not applicable for the years prior to 2006.
|
Chesapeake Utilities Corporation 2013 Form 10-K Page
25
|
2010
|
2009
(2)
|
2008
|
2007
|
2006
(3)
|
2005
|
2004
|
||||||||||||||||||||
|
$
|
269,438
|
|
$
|
138,671
|
|
$
|
116,123
|
|
$
|
128,566
|
|
$
|
124,438
|
|
$
|
124,445
|
|
$
|
98,037
|
|
||||||
|
146,793
|
|
119,973
|
|
161,290
|
|
115,190
|
|
94,320
|
|
90,995
|
|
67,607
|
|
|||||||||||||
|
11,315
|
|
10,141
|
|
14,030
|
|
14,530
|
|
12,442
|
|
14,045
|
|
12,311
|
|
|||||||||||||
|
$
|
427,546
|
|
$
|
268,785
|
|
$
|
291,443
|
|
$
|
258,286
|
|
$
|
231,200
|
|
$
|
229,485
|
|
$
|
177,955
|
|
||||||
|
$
|
43,267
|
|
$
|
26,668
|
|
$
|
23,833
|
|
$
|
21,739
|
|
$
|
18,618
|
|
$
|
16,278
|
|
$
|
16,270
|
|
||||||
|
8,150
|
|
8,390
|
|
3,600
|
|
5,244
|
|
3,650
|
|
4,167
|
|
3,185
|
|
|||||||||||||
|
513
|
|
(1,322
|
)
|
1,046
|
|
1,131
|
|
1,064
|
|
1,476
|
|
722
|
|
|||||||||||||
|
$
|
51,930
|
|
$
|
33,736
|
|
$
|
28,479
|
|
$
|
28,114
|
|
$
|
23,332
|
|
$
|
21,921
|
|
$
|
20,177
|
|
||||||
|
$
|
26,056
|
|
$
|
15,897
|
|
$
|
13,607
|
|
$
|
13,218
|
|
$
|
10,748
|
|
$
|
10,699
|
|
$
|
9,686
|
|
||||||
|
$
|
584,385
|
|
$
|
543,905
|
|
$
|
381,689
|
|
$
|
352,838
|
|
$
|
325,836
|
|
$
|
280,345
|
|
$
|
250,267
|
|
||||||
|
$
|
462,757
|
|
$
|
436,587
|
|
$
|
280,671
|
|
$
|
260,423
|
|
$
|
240,825
|
|
$
|
201,504
|
|
$
|
177,053
|
|
||||||
|
$
|
670,993
|
|
$
|
615,811
|
|
$
|
385,795
|
|
$
|
381,557
|
|
$
|
325,585
|
|
$
|
295,980
|
|
$
|
241,938
|
|
||||||
|
$
|
46,955
|
|
$
|
26,294
|
|
$
|
30,844
|
|
$
|
30,142
|
|
$
|
49,154
|
|
$
|
33,423
|
|
$
|
17,830
|
|
||||||
|
$
|
226,239
|
|
$
|
209,781
|
|
$
|
123,073
|
|
$
|
119,576
|
|
$
|
111,152
|
|
$
|
84,757
|
|
$
|
77,962
|
|
||||||
|
89,642
|
|
98,814
|
|
86,422
|
|
63,256
|
|
71,050
|
|
58,991
|
|
66,190
|
|
|||||||||||||
|
$
|
315,881
|
|
$
|
308,595
|
|
$
|
209,495
|
|
$
|
182,832
|
|
$
|
182,202
|
|
$
|
143,748
|
|
$
|
144,152
|
|
||||||
|
9,216
|
|
35,299
|
|
6,656
|
|
7,656
|
|
7,656
|
|
4,929
|
|
2,909
|
|
|||||||||||||
|
63,958
|
|
30,023
|
|
33,000
|
|
45,664
|
|
27,554
|
|
35,482
|
|
5,002
|
|
|||||||||||||
|
$
|
389,055
|
|
$
|
373,917
|
|
$
|
249,151
|
|
$
|
236,152
|
|
$
|
217,412
|
|
$
|
184,159
|
|
$
|
152,063
|
|
||||||
Chesapeake Utilities Corporation 2013 Form 10-K Page
26
|
For the Year Ended December 31,
|
|||||||||||
|
2013
|
2012
|
2011
|
|||||||||
|
Common Stock Data and Ratios
|
|||||||||||
|
Basic earnings per share from continuing operations
(1)
|
$
|
3.41
|
|
$
|
3.01
|
|
$
|
2.89
|
|
||
|
Diluted earnings per share from continuing operations
(1)
|
$
|
3.39
|
|
$
|
2.99
|
|
$
|
2.87
|
|
||
|
Return on average equity from continuing operations
(1)
|
12.2
|
%
|
11.6
|
%
|
11.6
|
%
|
|||||
|
Common equity / total capitalization
|
70.3
|
%
|
71.6
|
%
|
68.6
|
%
|
|||||
|
Common equity / total capitalization and short-term financing
|
54.3
|
%
|
60.0
|
%
|
61.1
|
%
|
|||||
|
Book value per share
|
$
|
28.92
|
|
$
|
26.74
|
|
$
|
25.15
|
|
||
|
Market price:
|
|||||||||||
|
High
|
$
|
61.170
|
|
$
|
48.920
|
|
$
|
44.530
|
|
||
|
Low
|
$
|
45.840
|
|
$
|
39.890
|
|
$
|
36.000
|
|
||
|
Close
|
$
|
60.020
|
|
$
|
45.400
|
|
$
|
43.350
|
|
||
|
Average number of shares outstanding
|
9,620,641
|
|
9,586,144
|
|
9,555,799
|
|
|||||
|
Shares outstanding at year-end
|
9,638,230
|
|
9,597,499
|
|
9,567,307
|
|
|||||
|
Registered common shareholders
|
2,345
|
|
2,396
|
|
2,481
|
|
|||||
|
Cash dividends declared per share
|
$
|
1.52
|
|
$
|
1.44
|
|
$
|
1.37
|
|
||
|
Dividend yield (annualized)
(4)
|
2.6
|
%
|
3.2
|
%
|
3.2
|
%
|
|||||
|
Payout ratio from continuing operations
(1) (5)
|
44.6
|
%
|
47.8
|
%
|
47.4
|
%
|
|||||
|
Additional Data
|
|||||||||||
|
Customers
|
|||||||||||
|
Natural gas distribution
|
138,210
|
|
124,015
|
|
121,934
|
|
|||||
|
Electric distribution
|
31,151
|
|
31,066
|
|
30,986
|
|
|||||
|
Propane distribution
|
51,988
|
|
49,312
|
|
48,824
|
|
|||||
|
Volumes
|
|||||||||||
|
Natural gas deliveries (in Dts)
|
74,117,121
|
|
66,784,690
|
|
57,493,022
|
|
|||||
|
Electric Distribution (in MWHs)
|
649,025
|
|
670,998
|
|
694,653
|
|
|||||
|
Propane distribution (in thousands of gallons)
|
48,511
|
|
37,438
|
|
37,387
|
|
|||||
|
Heating degree-days (Delmarva Peninsula)
|
|||||||||||
|
Actual HDD
|
4,638
|
|
3,936
|
|
4,221
|
|
|||||
|
10-year average HDD (normal)
|
4,454
|
|
4,491
|
|
4,499
|
|
|||||
|
Heating degree-days (Florida)
|
|||||||||||
|
Actual HDD
|
671
|
|
633
|
|
753
|
|
|||||
|
10-year average HDD (normal)
|
885
|
|
915
|
|
920
|
|
|||||
|
Cooling degree-days (Florida)
|
|||||||||||
|
Actual CDD
|
2,750
|
|
2,871
|
|
2,858
|
|
|||||
|
10-year average CDD (normal)
|
2,750
|
|
2,756
|
|
2,718
|
|
|||||
|
Propane bulk storage capacity (in thousands of gallons)
|
3,566
|
|
3,400
|
|
3,351
|
|
|||||
|
Total employees
(1)
|
842
|
|
738
|
|
711
|
|
|||||
|
(1)
|
These amounts exclude the results of distributed energy and water services due to their reclassification to discontinued operations. We closed our distributed energy operation in 2007. All assets of the water businesses were sold in 2004 and 2003.
|
|
(2)
|
These amounts include the financial position and results of operation of FPU for the period from the merger closing (October 28, 2009) to December 31, 2009.
|
|
(3)
|
ASC Topic 718,
Compensation—Stock Compensation
, and ASC Topic 715,
Compensation—Retirement Plans
, were adopted in the year 2006; therefore, they were not applicable for the years prior to 2006.
|
|
(4)
|
Dividend yield (annualized) is calculated by multiplying the fourth quarter dividend by four (4), then dividing that amount by the closing common stock price at December 31.
|
|
(5)
|
The payout ratio from continuing operations is calculated by dividing cash dividends declared per share (for the year) by basic earnings per share from continuing operations.
|
Chesapeake Utilities Corporation 2013 Form 10-K Page
27
|
2010
|
2009
(2)
|
2008
|
2007
|
2006
(3)
|
2005
|
2004
|
||||||||||||||||||||
|
$
|
2.75
|
|
$
|
2.17
|
|
$
|
2.00
|
|
$
|
1.96
|
|
$
|
1.78
|
|
$
|
1.83
|
|
$
|
1.68
|
|
||||||
|
$
|
2.73
|
|
$
|
2.15
|
|
$
|
1.98
|
|
$
|
1.94
|
|
$
|
1.76
|
|
$
|
1.81
|
|
$
|
1.64
|
|
||||||
|
11.6
|
%
|
11.2
|
%
|
11.2
|
%
|
11.5
|
%
|
11.0
|
%
|
13.2
|
%
|
12.8
|
%
|
|||||||||||||
|
71.6
|
%
|
68.0
|
%
|
58.7
|
%
|
65.4
|
%
|
61.0
|
%
|
59.0
|
%
|
54.1
|
%
|
|||||||||||||
|
58.2
|
%
|
56.1
|
%
|
49.4
|
%
|
50.6
|
%
|
51.1
|
%
|
46.0
|
%
|
51.3
|
%
|
|||||||||||||
|
$
|
23.75
|
|
$
|
22.33
|
|
$
|
18.03
|
|
$
|
17.64
|
|
$
|
16.62
|
|
$
|
14.41
|
|
$
|
13.49
|
|
||||||
|
$
|
42.200
|
|
$
|
35.000
|
|
$
|
34.840
|
|
$
|
37.250
|
|
$
|
35.650
|
|
$
|
35.780
|
|
$
|
27.550
|
|
||||||
|
$
|
28.010
|
|
$
|
22.020
|
|
$
|
21.930
|
|
$
|
28.000
|
|
$
|
27.900
|
|
$
|
23.600
|
|
$
|
20.420
|
|
||||||
|
$
|
41.520
|
|
$
|
32.050
|
|
$
|
31.480
|
|
$
|
31.850
|
|
$
|
30.650
|
|
$
|
30.800
|
|
$
|
26.700
|
|
||||||
|
9,474,554
|
|
7,313,320
|
|
6,811,848
|
|
6,743,041
|
|
6,032,462
|
|
5,836,463
|
|
5,735,405
|
|
|||||||||||||
|
9,524,195
|
|
9,394,314
|
|
6,827,121
|
|
6,777,410
|
|
6,688,084
|
|
5,883,099
|
|
5,778,976
|
|
|||||||||||||
|
2,482
|
|
2,670
|
|
1,914
|
|
1,920
|
|
1,978
|
|
2,026
|
|
2,026
|
|
|||||||||||||
|
$
|
1.31
|
|
$
|
1.25
|
|
$
|
1.21
|
|
$
|
1.18
|
|
$
|
1.16
|
|
$
|
1.14
|
|
$
|
1.12
|
|
||||||
|
3.2
|
%
|
3.9
|
%
|
3.9
|
%
|
3.7
|
%
|
3.8
|
%
|
3.7
|
%
|
4.2
|
%
|
|||||||||||||
|
47.6
|
%
|
57.6
|
%
|
60.5
|
%
|
60.2
|
%
|
65.2
|
%
|
62.3
|
%
|
66.7
|
%
|
|||||||||||||
|
120,230
|
|
117,887
|
|
65,201
|
|
62,884
|
|
59,132
|
|
54,786
|
|
50,878
|
|
|||||||||||||
|
30,966
|
|
31,030
|
|
—
|
|
—
|
|
—
|
|
—
|
|
—
|
|
|||||||||||||
|
48,100
|
|
48,680
|
|
34,981
|
|
34,143
|
|
33,282
|
|
32,117
|
|
34,888
|
|
|||||||||||||
|
49,310,314
|
|
50,159,227
|
|
46,539,142
|
|
42,910,964
|
|
41,826,357
|
|
43,716,921
|
|
39,469,915
|
|
|||||||||||||
|
751,507
|
|
105,739
|
|
—
|
|
—
|
|
—
|
|
—
|
|
—
|
|
|||||||||||||
|
39,807
|
|
32,546
|
|
27,956
|
|
29,785
|
|
24,243
|
|
26,178
|
|
24,979
|
|
|||||||||||||
|
4,831
|
|
4,729
|
|
4,431
|
|
4,504
|
|
3,931
|
|
4,792
|
|
4,553
|
|
|||||||||||||
|
4,528
|
|
4,462
|
|
4,401
|
|
4,376
|
|
4,372
|
|
4,436
|
|
4,389
|
|
|||||||||||||
|
1,501
|
|
911
|
|
—
|
|
—
|
|
—
|
|
—
|
|
—
|
|
|||||||||||||
|
863
|
|
849
|
|
—
|
|
—
|
|
—
|
|
—
|
|
—
|
|
|||||||||||||
|
2,859
|
|
2,770
|
|
—
|
|
—
|
|
—
|
|
—
|
|
—
|
|
|||||||||||||
|
2,695
|
|
2,687
|
|
—
|
|
—
|
|
—
|
|
—
|
|
—
|
|
|||||||||||||
|
3,041
|
|
3,042
|
|
2,471
|
|
2,441
|
|
2,315
|
|
2,315
|
|
2,045
|
|
|||||||||||||
|
734
|
|
757
|
|
448
|
|
445
|
|
437
|
|
423
|
|
426
|
|
|||||||||||||
Chesapeake Utilities Corporation 2013 Form 10-K Page
28
I
TEM
7. M
ANAGEMENT
’
S
D
ISCUSSION
AND
A
NALYSIS
OF
F
INANCIAL
C
ONDITION
AND
R
ESULTS
OF
O
PERATIONS
This section provides management’s discussion of Chesapeake and its consolidated subsidiaries, with specific information on results of operations, liquidity and capital resources, as well as discussion of how certain accounting principles affect our financial statements. It includes management’s interpretation of our financial results and our operating segments, the factors affecting these results, the major factors expected to affect future operating results as well as investment and financing plans. This discussion should be read in conjunction with our Consolidated Financial Statements and notes thereto in
Item 8, Financial Statements and Supplementary Data
.
Several factors exist that could influence our future financial performance, some of which are described in
Item 1A, Risk Factors
. They should be considered in connection with forward-looking statements contained in this report, or otherwise made by or on behalf of us, since these factors could cause actual results and conditions to differ materially from those set out in such forward-looking statements.
The following discussions and those later in the document on operating income and segment results include the use of the term “gross margin.” Gross margin is determined by deducting the cost of sales from operating revenue. Cost of sales includes the purchased cost of natural gas, electricity and propane and the cost of labor spent on direct revenue-producing activities. Gross margin should not be considered an alternative to operating income or net income, which are determined in accordance with GAAP. We believe that gross margin, although a non-GAAP measure, is useful and meaningful to investors as a basis for making investment decisions. It provides investors with information that demonstrates the profitability achieved by us under our allowed rates for regulated energy operations and under our competitive pricing structure for non-regulated segments. Our management uses gross margin in measuring our business units’ performance and has historically analyzed and reported gross margin information publicly. Other companies may calculate gross margin in a different manner.
I
NTRODUCTION
We are a diversified utility company engaged, directly or through subsidiaries, in regulated energy businesses, unregulated energy businesses, and other unregulated businesses, including advanced information services.
Our strategy is focused on growing earnings from a stable utility foundation and investing in related businesses and services that provide opportunities for returns greater than traditional utility returns. The key elements of this strategy include:
|
•
|
executing a capital investment program in pursuit of organic growth opportunities that generate returns equal to or greater than our cost of capital;
|
|
•
|
expanding the regulated energy distribution and transmission businesses into new geographic areas and providing new services in our current service territories;
|
|
•
|
expanding the propane distribution business in existing and new markets through leveraging our community gas system services and our bulk delivery capabilities;
|
|
•
|
expanding both our regulated energy and unregulated energy businesses through strategic acquisitions;
|
|
•
|
utilizing our expertise across our various businesses to improve overall performance;
|
|
•
|
pursuing and entering new unregulated energy markets and business lines that will complement our existing strategy and operating units;
|
|
•
|
enhancing marketing channels to attract new customers;
|
|
•
|
providing reliable and responsive customer service to existing customers so they become our best promoters;
|
|
•
|
engaging our customers through a distinctive service excellence initiative;
|
|
•
|
developing and retaining a high performing team that advances our goals;
|
|
•
|
empowering and engaging our employees at all levels to live our brand and vision;
|
|
•
|
demonstrating community leadership and engaging our local communities and governments in a cooperative and mutually beneficial way;
|
|
•
|
maintaining a capital structure that enables us to access capital as needed;
|
|
•
|
maintaining a consistent and competitive dividend for shareholders; and
|
|
•
|
creating and maintaining a diversified customer base, energy portfolio and utility foundation.
|
Chesapeake Utilities Corporation 2013 Form 10-K Page
29
C
RITICAL
A
CCOUNTING
P
OLICIES
We prepare our financial statements in accordance with GAAP. Application of these accounting principles requires the use of estimates and assumptions that affect the reported amounts of assets, liabilities, revenues and expenses, and related disclosures of contingencies during the reporting period. We base our estimates on historical experience and on various assumptions that are believed to be reasonable under the circumstances, the results of which form the basis for making judgments about the carrying value of assets and liabilities that are not readily apparent from other sources. Since most of our businesses are regulated and the accounting methods used by these businesses must comply with the requirements of the regulatory bodies, the choices available are limited by these regulatory requirements. In the normal course of business, estimated amounts are subsequently adjusted to actual results that may differ from estimates. Management believes that the following policies require significant estimates or other judgments of matters that are inherently uncertain. These policies and their application have been reviewed by our Audit Committee.
Regulatory Assets and Liabilities
As a result of the ratemaking process, we record certain assets and liabilities in accordance with FASB ASC Topic 980,
Regulated Operations
, and consequently, the accounting principles applied by our regulated energy businesses differ in certain respects from those applied by the unregulated businesses. Costs are deferred when there is a probable expectation that they will be recovered in future revenues as a result of the regulatory process. As more fully described in
Item 8, Financial Statements and Supplementary Data (
see
Note 2, Summary of Significant Accounting Policies
in the Consolidated Financial Statements), we have recorded regulatory assets of
$69.0 million
and regulatory liabilities of
$48.1 million
at
December 31, 2013
. If we were required to terminate application of ASC Topic 980, we would be required to recognize all such deferred amounts as a charge or a credit to earnings, net of applicable income taxes. Such an adjustment could have a material effect on our results of operations.
Valuation of Environmental Regulatory Assets and Liabilities
As more fully described in
Item 8, Financial Statements and Supplementary Data (
see
Note 19, Environmental Commitments and Contingencies
, in the Consolidated Financial Statements), we are currently participating in the investigation, assessment or remediation of six former MGP sites. We have also been in discussions with the MDE regarding a seventh former MGP site. Amounts have been recorded as environmental liabilities and regulatory assets based on estimates of future costs to remediate these sites, which are provided by independent consultants, and future recovery of those costs in rates. At
December 31, 2013
, we had
$10.7 million
in environmental liabilities, representing our estimate of such future costs. We also had
$5.5 million
in regulatory and other assets, representing the amount of our environmental remediation costs to be recovered in future rates. There is uncertainty in these amounts, as the EPA, or other applicable state environmental authority, may not have selected the final remediation methods. In addition, there is uncertainty with regard to amounts that may be recovered from other potentially responsible parties.
Derivatives
We use derivative and non-derivative instruments to manage the risks related to obtaining adequate supplies and the price fluctuations of natural gas, electricity and propane. We also use derivative instruments to engage in propane wholesale marketing activities. We continually monitor the use of these instruments to ensure compliance with our risk management policies and account for them in accordance with the appropriate GAAP, such that every derivative instrument be recorded as either an asset or a liability measured at its fair value. It also requires that changes in the derivatives' fair value are recognized in the current period earnings unless specific hedge accounting criteria is met. If these instruments do not meet the definition of derivatives or are considered “normal purchases and sales,” they are accounted for on an accrual basis of accounting.
Additionally, GAAP also requires us to classify the derivative assets and liabilities based on the lowest level of input that is significant to the fair value measurement. Our assessment of the significance of a particular input to the fair value measurement requires judgment and may affect the fair value of the assets and liabilities and their placement within the fair value hierarchy.
During the last three years, we had the following derivative assets and liabilities:
|
•
|
Propane forward contracts entered into by Xeron; and
|
|
•
|
Propane put and call options entered into by Sharp.
|
We determined that certain propane put and call options met the specific hedge accounting criteria. We also determined that our contracts for the purchase or sale of natural gas, electricity and propane either did not meet the definition of derivatives as they did not have a minimum requirement to purchase/sell or were considered “normal purchases and sales,” as they provided for the purchase or sale of natural gas, electricity or propane to be delivered in quantities that we expect to use and sell by our operations over a reasonable period of time in the normal course of business. Accordingly, these contracts were accounted for on an accrual basis of accounting.
Chesapeake Utilities Corporation 2013 Form 10-K Page
30
As of
December 31, 2013
, we recorded
$385,000
and
$127,000
of derivative assets and liabilities. As of
December 31, 2012
, we recorded
$210,000
and
$331,000
of derivative assets and liabilities.
Operating Revenues
Revenues for our natural gas and electric distribution operations are based on rates approved by the PSC of each state in which we operate. Customers’ base rates may not be changed without formal approval by these commissions. The PSCs, however, have authorized our regulated operations to negotiate rates, based on approved methodologies, with customers that have competitive alternatives. Eastern Shore’s revenues are based on rates approved by the FERC. The FERC has also authorized Eastern Shore to negotiate rates above or below the FERC-approved maximum rates, which customers can elect as an alternative to negotiated rates.
For regulated deliveries of natural gas, propane and electricity, we read meters and bill customers on monthly cycles that do not coincide with the accounting periods used for financial reporting purposes. We accrue unbilled revenues for natural gas and electricity that have been delivered, but not yet billed, at the end of an accounting period to the extent that they do not coincide. We estimate the amount of the unbilled revenue by jurisdiction and customer class. A similar computation is made to accrue unbilled revenues for propane customers with meters, such as community gas system customers, and natural gas marketing customers, whose billing cycles do not coincide with the accounting periods.
We record trading activity for open propane wholesale marketing contracts on a net mark-to-market basis in the consolidated statement of income. For propane bulk delivery customers without meters and advanced information services customers, we record revenue in the period the products are delivered and/or services are rendered.
Each of our natural gas distribution operations in Delaware and Maryland, our bundled natural gas distribution service in Florida and our electric distribution operation in Florida has a fuel cost recovery mechanism. This mechanism provides us with a method of adjusting billing rates to customers to reflect changes in the cost of purchased fuel. The difference between the current cost of fuel purchased and the cost of fuel recovered in billed rates is deferred and accounted for as either unrecovered fuel cost or amounts payable to customers. Generally, these deferred amounts are recovered or refunded within one year.
We charge flexible rates to industrial interruptible customers on our natural gas distribution systems to compete with the price of alternative fuel that they can use. Neither we nor any of our interruptible customers are contractually obligated to deliver or receive natural gas on a firm service basis.
Allowance for Doubtful Accounts
An allowance for doubtful accounts is recorded against amounts due to reduce the net receivable balance to the amount we reasonably expect to collect based upon our collections experience, the condition of the overall economy and our assessment of our customers’ inability or reluctance to pay. If circumstances change, however, our estimate of the recoverability of accounts receivable may also change. Circumstances which could affect our estimates include, but are not limited to, customer credit issues, the level of natural gas, electricity and propane prices and general economic conditions. Accounts are written off once they are deemed to be uncollectible.
Pension and Other Postretirement Benefits
Pension and other postretirement plan costs and liabilities are determined on an actuarial basis and are affected by numerous assumptions and estimates including the market value of plan assets, estimates of the expected returns on plan assets, assumed discount rates, the level of contributions made to the plans, and current demographic and actuarial mortality data. The assumed discount rates and the expected returns on plan assets are the assumptions that generally have the most significant impact on the pension costs and liabilities. The assumed discount rates, the assumed health care cost trend rates and the assumed rates of retirement generally have the most significant impact on our postretirement plan costs and liabilities. Additional information is presented in
Item 8, Financial Statements and Supplementary Data (
See
Note 16, Employee Benefit Plans
in the Consolidated Financial Statements), including plan asset investment allocation, estimated future benefit payments, general descriptions of the plans, significant assumptions, the impact of certain changes in assumptions, and significant changes in estimates.
Actuarial assumptions affecting 2013 include expected long-term rates of return on plan assets of 6.0 percent and 7.0 percent for Chesapeake’s pension plan and FPU’s pension plan, respectively, and discount rates of 4.25 percent and 4.75 percent for Chesapeake’s and FPU’s plans, respectively. The discount rate for each plan was determined by management considering high-quality corporate bond rates, such as Moody’s Aa bond index and the Citigroup yield curve, changes in those rates from the prior year and other pertinent factors, including the expected lives of the plans and the availability of the lump-sum payment option. A
Chesapeake Utilities Corporation 2013 Form 10-K Page
31
0.25 percent decrease in the discount rate could increase our annual pension and postretirement costs by approximately
$4,000
, and a 0.25 percent increase could decrease our annual pension and postretirement costs by approximately
$40,000
.
Actual changes in the fair value of plan assets and the differences between the actual return on plan assets and the expected return on plan assets could have a material effect on the amount of pension and postretirement benefit costs that we ultimately recognize. A 0.25 percent change in the rate of return could change our annual pension cost by approximately
$132,000
and would not have an impact on the postretirement and Chesapeake SERP because these plans are not funded.
The health care inflation rate for 2013 used to calculate the benefit obligation is
5.5 percent
for medical and
6.5 percent
for prescription drugs for the Chesapeake Postretirement Plan; and
6.5 percent
for the FPU Medical Plan. A one–percentage point increase in the health care inflation rate from the assumed rate would increase the accumulated postretirement benefit obligation by approximately
$264,000
as of
December 31, 2013
, and would increase the aggregate of the service cost and interest cost components of the net periodic postretirement benefit cost for 2013 by approximately
$10,000
. A one-percentage point decrease in the health care inflation rate from the assumed rate would decrease the accumulated postretirement benefit obligation by approximately
$228,000
as of
December 31, 2013
, and would decrease the aggregate of the service cost and interest cost components of the net periodic postretirement benefit cost for 2013 by approximately
$8,000
.
Tax-related Contingency
We account for uncertainty in income taxes in the financial statements only if it is more likely than not that an uncertain tax position is sustainable based on technical merits. Recognizable tax positions are then measured to determine the amount of benefit recognized in the financial statements. We recognize penalties and interest related to unrecognized tax benefits as a component of other income.
We account for contingencies associated with taxes other than income when the likelihood of a loss is both probable and estimable. In assessing the likelihood of a loss, we do not consider the existence of current inquiries, or the likelihood of future inquiries, by tax authorities as a factor. Our assessment is based solely on our application of the appropriate statutes and the likelihood of a loss assuming the proper inquiries are made by tax authorities.
As of December 31, 2013 and 2012, we recorded a total liability of
$300,000
associated with unrecognized income tax benefits. As of December 31, 2013 and 2012, we recorded a total liability of
$1.0 million
and
$82,000
, respectively, related to taxes other than income.
Chesapeake Utilities Corporation 2013 Form 10-K Page
32
O
VERVIEW
AND
H
IGHLIGHTS
|
(in thousands except per share)
|
|
|
Increase
|
|
|
Increase
|
|||||||||||||||||
|
For the Year Ended December 31,
|
2013
|
2012
|
(decrease)
|
2012
|
2011
|
(decrease)
|
|||||||||||||||||
|
Business Segment:
|
|||||||||||||||||||||||
|
Regulated Energy
|
$
|
50,084
|
|
$
|
46,999
|
|
$
|
3,085
|
|
$
|
46,999
|
|
$
|
43,911
|
|
$
|
3,088
|
|
|||||
|
Unregulated Energy
|
12,353
|
|
8,355
|
|
3,998
|
|
8,355
|
|
9,619
|
|
(1,264
|
)
|
|||||||||||
|
Other
|
297
|
|
1,281
|
|
(984
|
)
|
1,281
|
|
175
|
|
1,106
|
|
|||||||||||
|
Operating Income
|
62,734
|
|
56,635
|
|
6,099
|
|
56,635
|
|
53,705
|
|
2,930
|
|
|||||||||||
|
Other Income
|
372
|
|
271
|
|
101
|
|
271
|
|
906
|
|
(635
|
)
|
|||||||||||
|
Interest Charges
|
8,234
|
|
8,747
|
|
(513
|
)
|
8,747
|
|
9,000
|
|
(253
|
)
|
|||||||||||
|
Pre-tax Income
|
54,872
|
|
48,159
|
|
6,713
|
|
48,159
|
|
45,611
|
|
2,548
|
|
|||||||||||
|
Income Taxes
|
22,085
|
|
19,296
|
|
2,789
|
|
19,296
|
|
17,989
|
|
1,307
|
|
|||||||||||
|
Net Income
|
$
|
32,787
|
|
$
|
28,863
|
|
$
|
3,924
|
|
$
|
28,863
|
|
$
|
27,622
|
|
$
|
1,241
|
|
|||||
|
Earnings Per Share of Common Stock
|
|||||||||||||||||||||||
|
Basic
|
$
|
3.41
|
|
$
|
3.01
|
|
$
|
0.40
|
|
$
|
3.01
|
|
$
|
2.89
|
|
$
|
0.12
|
|
|||||
|
Diluted
|
$
|
3.39
|
|
$
|
2.99
|
|
$
|
0.40
|
|
$
|
2.99
|
|
$
|
2.87
|
|
$
|
0.12
|
|
|||||
Chesapeake Utilities Corporation 2013 Form 10-K Page
33
2013 compared to 2012
Our net income increased by approximately
$3.9 million
or
0.40
per share (diluted) in 2013, compared to 2012. Key variances included:
|
(in thousands, except per share)
|
Pre-tax
Income |
Net
Income |
Earnings
Per Share |
|||||||||
|
Year ended December 31, 2012 Reported Results
|
$
|
48,159
|
|
$
|
28,863
|
|
$
|
2.99
|
|
|||
|
Adjusting for unusual items:
|
||||||||||||
|
Weather impact (due primarily to significantly warmer-than-normal weather in 2012)
|
3,399
|
|
2,037
|
|
0.21
|
|
||||||
|
Regulatory recovery of litigation-related costs
|
1,494
|
|
895
|
|
0.09
|
|
||||||
|
Accrual for additional taxes other than income
|
(990
|
)
|
(593
|
)
|
(0.06
|
)
|
||||||
|
One-time sales tax expensed by Sandpiper associated with the acquisition
|
(726
|
)
|
(435
|
)
|
(0.04
|
)
|
||||||
|
3,177
|
|
1,904
|
|
0.20
|
|
|||||||
|
Increased (Decreased) Gross Margins:
|
||||||||||||
|
Major projects (see Major Project Highlights table)
|
||||||||||||
|
Contribution from Sandpiper
|
4,432
|
|
2,656
|
|
0.27
|
|
||||||
|
Service expansions
|
3,710
|
|
2,223
|
|
0.23
|
|
||||||
|
Higher propane margins
|
3,163
|
|
1,896
|
|
0.20
|
|
||||||
|
Contribution from other new acquisitions
|
2,016
|
|
1,208
|
|
0.12
|
|
||||||
|
Other natural gas growth
|
1,824
|
|
1,094
|
|
0.11
|
|
||||||
|
Propane wholesale marketing
|
(1,137
|
)
|
(681
|
)
|
(0.07
|
)
|
||||||
|
14,008
|
|
8,396
|
|
0.86
|
|
|||||||
|
Increased Other Operating Expenses:
|
||||||||||||
|
Expenses from acquisitions
|
(5,309
|
)
|
(3,182
|
)
|
(0.33
|
)
|
||||||
|
Higher payroll and benefits costs
|
(2,407
|
)
|
(1,443
|
)
|
(0.15
|
)
|
||||||
|
Increased incentive bonuses
|
(2,002
|
)
|
(1,200
|
)
|
(0.12
|
)
|
||||||
|
Higher depreciation, asset removal and property tax costs due to new capital investments
|
(1,555
|
)
|
(932
|
)
|
(0.10
|
)
|
||||||
|
(11,273
|
)
|
(6,757
|
)
|
(0.70
|
)
|
|||||||
|
Net Other Changes
|
801
|
|
381
|
|
0.04
|
|
||||||
|
Year ended December 31, 2013 Reported Results
|
$
|
54,872
|
|
$
|
32,787
|
|
$
|
3.39
|
|
|||
Chesapeake Utilities Corporation 2013 Form 10-K Page
34
2012 compared to 2011
Our net income increased by approximately
$1.2 million
, or
$0.12
per share (diluted) in 2012, compared to 2011. Key variances included:
|
(in thousands, except per share amounts)
|
Pre-tax
Income
|
Net
Income
|
Earnings
Per Share
|
||||||||
|
Year Ended December 31, 2011 Reported Results
|
$
|
45,611
|
|
$
|
27,622
|
|
$
|
2.87
|
|
||
|
Adjusting for unusual items:
|
|||||||||||
|
Weather impact
|
(3,627
|
)
|
(2,197
|
)
|
(0.23
|
)
|
|||||
|
Amortization of FPU acquisition premium and costs
|
(2,354
|
)
|
(1,426
|
)
|
(0.15
|
)
|
|||||
|
Severance and pension settlement charge in 2011
|
1,299
|
|
787
|
|
0.08
|
|
|||||
|
Florida natural gas reserve and sales tax reserve reversal in 2011
|
(1,049
|
)
|
(636
|
)
|
(0.07
|
)
|
|||||
|
Amortization of deferred tax gain
|
684
|
|
414
|
|
0.04
|
|
|||||
|
Litigation settlement with a major propane supplier in 2011
|
(575
|
)
|
(348
|
)
|
(0.04
|
)
|
|||||
|
Gain from the sale of Internet Protocol asset in 2011
|
(553
|
)
|
(335
|
)
|
(0.03
|
)
|
|||||
|
(6,175
|
)
|
(3,741
|
)
|
(0.40
|
)
|
||||||
|
Increased Margins:
|
|||||||||||
|
Major projects (see Major Project Highlights table)
|
|||||||||||
|
Service expansions
|
4,466
|
|
2,705
|
|
0.28
|
|
|||||
|
Other natural gas growth
|
1,795
|
|
1,088
|
|
0.11
|
|
|||||
|
Higher propane margins
|
2,724
|
|
1,650
|
|
0.17
|
|
|||||
|
BravePoint
|
2,602
|
|
1,576
|
|
0.16
|
|
|||||
|
11,587
|
|
7,019
|
|
0.72
|
|
||||||
|
Increased Other Operating Expenses:
|
|||||||||||
|
BravePoint, primarily due to employee-related costs
|
(1,523
|
)
|
(923
|
)
|
(0.10
|
)
|
|||||
|
Higher depreciation, asset removal and facilities costs
|
(1,326
|
)
|
(803
|
)
|
(0.08
|
)
|
|||||
|
Acquisition-related costs and increased capacity for future growth
|
(758
|
)
|
(459
|
)
|
(0.05
|
)
|
|||||
|
(3,607
|
)
|
(2,185
|
)
|
(0.23
|
)
|
||||||
|
Net other changes
|
743
|
|
148
|
|
0.03
|
|
|||||
|
Year Ended December 31, 2012 Reported Results
|
$
|
48,159
|
|
$
|
28,863
|
|
$
|
2.99
|
|
||
Chesapeake Utilities Corporation 2013 Form 10-K Page
35
S
UMMARY
OF
K
EY
F
ACTORS
The following is a summary of key factors affecting our businesses and their impacts on our results for the year ended
December 31, 2013
, as well as future periods.
Major Projects
Acquisition
In May 2013, we completed the purchase of the operating assets of ESG. Approximately 11,000 residential and commercial underground propane distribution system customers acquired in this transaction are now being served by Sandpiper under a tariff approved by the Maryland PSC. We are evaluating the potential conversion of some of these propane systems to natural gas. This acquisition is expected to be accretive to earnings per share in the first full year of operations. For 2013, we generated
$4.4 million
in additional gross margin and incurred
$3.1 million
in other operating expenses.
Service Expansions
We expanded our natural gas transmission and distribution services in Sussex County, Delaware; Cecil and Worcester Counties, Maryland; and Nassau and Indian River Counties, Florida, which generated additional gross margin of
$1.5 million
in 2013.
In May 2013, Eastern Shore commenced new short-term transmission services to industrial customers located in New Castle and Kent Counties, Delaware. Eastern Shore provided these services from May to October 2013 using existing system capacity under short-term contracts and generated additional gross margin of
$1.4 million
in 2013. Eastern Shore also provided increased interruptible service to one of these industrial customers during 2013, which generated
$333,000
of additional gross margin. In November 2013, Eastern Shore completed construction of new facilities and replaced these short-term contracts with long-term service contracts, which generated additional gross margin of
$702,000
in 2013. We expect these long-term services will generate
$4.3 million
of annual gross margin. These long-term contracts displace the gross margin generated from short-term contracts, increased interruptible service and an annualized gross margin of
$1.1 million
from an older contract, which expired in November 2012.
Chesapeake Utilities Corporation 2013 Form 10-K Page
36
The following Major Project Highlights table summarizes our major projects initiated in 2011, 2012 and 2013 (dollars in thousands):
|
Gross Margin
|
||||||||||||||||
|
Major Projects
|
2011
|
2012
|
2013
|
2014
(1)
|
||||||||||||
|
Acquisition:
|
||||||||||||||||
|
ESG acquisition being served by Sandpiper in Worcester County, Maryland
(2)
|
$
|
—
|
|
$
|
—
|
|
$
|
4,432
|
|
$
|
9,817
|
|
||||
|
Service Expansions
|
||||||||||||||||
|
Natural Gas Distribution:
|
||||||||||||||||
|
Long-term
|
||||||||||||||||
|
Sussex County, Delaware
|
$
|
1
|
|
$
|
590
|
|
$
|
670
|
|
$
|
694
|
|
||||
|
Natural Gas Transmission:
|
||||||||||||||||
|
Short-term
|
||||||||||||||||
|
New Castle County, Delaware
(3) (4) (5)
|
$
|
168
|
|
$
|
868
|
|
$
|
398
|
|
$
|
1,862
|
|
||||
|
Kent County, Delaware
(3)
|
—
|
|
—
|
|
1,158
|
|
—
|
|
||||||||
|
Total Short-term
|
$
|
168
|
|
$
|
868
|
|
$
|
1,556
|
|
$
|
1,862
|
|
||||
|
Long-term
|
||||||||||||||||
|
Sussex County, Delaware
|
$
|
156
|
|
$
|
1,269
|
|
$
|
1,437
|
|
$
|
1,725
|
|
||||
|
New Castle County, Delaware
(6)
|
243
|
|
530
|
|
1,637
|
|
2,964
|
|
||||||||
|
Nassau County, Florida
|
—
|
|
1,540
|
|
1,314
|
|
1,300
|
|
||||||||
|
Worcester County, Maryland
|
—
|
|
90
|
|
417
|
|
547
|
|
||||||||
|
Cecil County, Maryland
|
—
|
|
147
|
|
926
|
|
1,147
|
|
||||||||
|
Indian River, Florida
|
—
|
|
—
|
|
350
|
|
840
|
|
||||||||
|
Kent County, Delaware
|
—
|
|
—
|
|
437
|
|
2,660
|
|
||||||||
|
Total Long-term
|
$
|
399
|
|
$
|
3,576
|
|
$
|
6,518
|
|
$
|
11,183
|
|
||||
|
Total Service Expansions
|
$
|
568
|
|
$
|
5,034
|
|
|
$
|
8,744
|
|
|
$
|
13,739
|
|
||
|
Total Major Projects
|
$
|
568
|
|
$
|
5,034
|
|
$
|
13,176
|
|
$
|
23,556
|
|
||||
(1)
The figures provided represent the estimated annual gross margin.
(2)
During 2013, we incurred
$3.1 million
in other operating expenses related to Sandpiper's operation. We expect to incur
$6.3 million
in other operating expenses
in 2014.
(3)
Prior to commencing new long-term service using new facilities, we provided a short-term service utilizing the existing system capacity. The short-term service
was displaced by the new long-term service.
(4)
In addition to providing a short-term service, we also provided interruptible service during 2013, which generated
$989,000
. Gross margin generated from
interruptible service is expected to be displaced by the long-term service starting in November 2013.
(5)
Expected gross margin in 2014 includes
$1.9 million
from a new short-term contract for 50,000 Dts/d for one year, which is expected to begin in April 2014.
(6)
Gross margin generated from this service expansion replaces the 10,000 Dts/d contract, which expired in November 2012. This expired contract had annualized
gross margin of
$1.1 million
.
Other Natural Gas Growth
In addition to these service expansions, the natural gas distribution operations on the Delmarva Peninsula and in Florida generated
$2.0 million
in additional gross margin for the year ended
December 31, 2013
, due to increases in the number of residential, commercial and industrial customers served. These increases are due primarily to a
two-percent
increase in residential customers on the Delmarva Peninsula, excluding customers added as a part of the Sandpiper acquisition, and an increase in commercial and industrial customers in Florida.
Future Service Expansion Initiatives
In June 2013, Eastern Shore filed an application with the FERC, seeking approval to construct a pipeline lateral to an industrial customer facility under construction in Kent County, Delaware. Upon completion of construction of the required facilities, this new service is expected to generate annual gross margin of approximately $1.2 million to $1.8 million. The new facilities include approximately 5.5 miles of lateral pipeline and metering facilities and extend from Eastern Shore's mainline to this new industrial
Chesapeake Utilities Corporation 2013 Form 10-K Page
37
customer facility. The construction of this lateral will not increase the overall capacity of Eastern Shore's mainline system. Service is projected to commence in January 2015.
We also executed a one-year contract with another industrial customer to provide additional 50,000 Dts/d of capacity from April 2014 to April 2015. This short-term contract is expected to generate
$1.9 million
and
$767,000
of gross margin in 2014 and 2015, respectively.
Investing in Growth
We continue to expand our resources and capabilities to support growth. Our Delmarva natural gas distribution operation is in the early stages of natural gas distribution expansions in Sussex County, Delaware, and Worcester and Cecil Counties, Maryland. These expansions will require not only the construction or conversion of distribution facilities, but also the conversion of residential customers’ appliances or equipment. We have begun reorganizing our Delmarva natural gas distribution operation and expect to increase staffing to support future expansions. Eastern Shore recently completed construction of new facilities to provide additional services to industrial customers on the Delmarva Peninsula and is working on constructing a new lateral pipeline to provide service to a new industrial customer facility in Kent County, Delaware. Eastern Shore is also developing other opportunities to further expand its transmission system, and it also expects to increase its staffing as it continues to expand its facilities and service. Finally, to increase our overall capabilities to move growth initiatives forward and to assist in developing additional strategic initiatives for sustained future growth, resources have been, and continue to be, added in our corporate shared services departments. During 2013, payroll and benefits expense increased by
$2.4 million
, or
six percent
, compared to 2012. We expect to make additional investments in human resources, as needed, to further develop our capability to capitalize on future growth opportunities.
Weather and Consumption
Weather was a significant factor in 2013 as temperatures on the Delmarva Peninsula returned to more normal levels from historically warm weather in 2012. The temperatures in Florida continued to be significantly warmer in 2013. The following tables highlight the HDD and CDD information for the years ended
December 31, 2013
and 2012 and the gross margin variance resulting from weather fluctuations in those periods.
HDD and CDD Information
|
For the Periods Ended December 31,
|
2013
|
2012
|
Variance
|
2012
|
2011
|
Variance
|
|||||||||||
|
Delmarva
|
|||||||||||||||||
|
Actual HDD
|
4,638
|
|
3,936
|
|
702
|
|
3,936
|
|
4,221
|
|
(285
|
)
|
|||||
|
10-Year Average HDD ("Normal")
|
4,454
|
|
4,491
|
|
(37
|
)
|
4,491
|
|
4,499
|
|
(8
|
)
|
|||||
|
Variance from Normal
|
184
|
|
(555
|
)
|
|
(555
|
)
|
(278
|
)
|
|
|||||||
|
Florida
|
|||||||||||||||||
|
Actual HDD
|
671
|
|
633
|
|
38
|
|
633
|
|
753
|
|
(120
|
)
|
|||||
|
10-Year Average HDD ("Normal")
|
885
|
|
915
|
|
(30
|
)
|
915
|
|
920
|
|
(5
|
)
|
|||||
|
Variance from Normal
|
(214
|
)
|
(282
|
)
|
|
(282
|
)
|
(167
|
)
|
|
|||||||
|
Florida
|
|||||||||||||||||
|
Actual CDD
|
2,750
|
|
2,871
|
|
(121
|
)
|
2,871
|
|
2,858
|
|
13
|
|
|||||
|
10-Year Average CDD ("Normal")
|
2,750
|
|
2,756
|
|
(6
|
)
|
2,756
|
|
2,718
|
|
38
|
|
|||||
|
Variance from Normal
|
—
|
|
115
|
|
|
115
|
|
140
|
|
|
|||||||
Chesapeake Utilities Corporation 2013 Form 10-K Page
38
Gross Margin Variance attributed to Weather
|
(in thousands)
|
2013 vs. 2012
|
2013 vs. Normal
|
2012 vs. 2011
|
2012 vs. Normal
|
|||||||||||
|
Delmarva
|
|||||||||||||||
|
Regulated Energy
|
$
|
984
|
|
$
|
493
|
|
$
|
(446
|
)
|
$
|
(909
|
)
|
|||
|
Unregulated Energy
|
3,069
|
|
260
|
|
(2,246
|
)
|
(2,713
|
)
|
|||||||
|
Florida
|
|||||||||||||||
|
Regulated Energy
|
(571
|
)
|
(1,204
|
)
|
(479
|
)
|
(1,193
|
)
|
|||||||
|
Unregulated Energy
|
(83
|
)
|
(316
|
)
|
(456
|
)
|
(242
|
)
|
|||||||
|
Total
|
$
|
3,399
|
|
$
|
(767
|
)
|
$
|
(3,627
|
)
|
$
|
(5,057
|
)
|
|||
Propane Prices
Propane prices affect both retail and wholesale marketing margins. Our propane distribution operation usually benefits from rising propane prices by selling propane to its customers based upon higher wholesale prices, while its average cost of inventory trails behind. Retail prices generally take into account replacement cost, along with other factors, such as competition and market conditions. When wholesale prices (replacement costs) increase, retail prices generally increase, and our margins expand until the current wholesale price is fully reflected in the average cost of inventory. The opposite occurs when wholesale propane prices decline.
Strong retail propane margins throughout 2013 on the Delmarva Peninsula generated
$3.2 million
in additional gross margin. During the first three quarters of 2013, our average propane inventory costs decreased by
25 percent
as a result of lower propane wholesale prices in late 2012 and early 2013, coupled with the execution of our supply plan. This decline in propane costs considerably outpaced a slight decline in retail prices, which were influenced by propane wholesale prices in the local area and other market conditions. The combination of declining costs and sustaining retail prices resulted in higher retail margins during the first three quarters of 2013, compared to the same period in 2012. During the fourth quarter of 2013, average propane wholesale prices in the local area increased by
$0.49
per gallon, or
38 percent
, as demand for propane significantly increased. In executing our supply plan, we benefited from supply diversity and were able to: (a) reduce the impact of this price increase on our average propane inventory cost, and (b) limit the increase in retail prices to our customers, charging considerably less than the wholesale price increase in the local area. As a result, our retail margins did not increase during the fourth quarter of 2013 and did not result in a significant gross margin variance, compared to last year's fourth quarter. Propane retail sales prices are subject to various market conditions, including competition with other propane suppliers as well as the availability and price of alternative energy sources, and may fluctuate based on changes in demand, supply and other energy commodity prices. The level of retail margins sustained during 2013 is not typical and, therefore, is not included in our long-term financial plans or forecasts.
Xeron benefits from price volatility in the propane wholesale market by entering into trading transactions. Xeron experienced a decrease in gross margin of
$1.1 million
for the year ended
December 31, 2013
, compared to the same period in 2012, as lower propane wholesale price volatility during the current period resulted in lower profit on executed trades.
Chesapeake Utilities Corporation 2013 Form 10-K Page
39
R
EGULATED
E
NERGY
|
Increase
|
Increase
|
||||||||||||||||||||||
|
For the Year Ended December 31,
|
2013
|
2012
|
(decrease)
|
2012
|
2011
|
(decrease)
|
|||||||||||||||||
|
(in thousands)
|
|
|
|
|
|
|
|||||||||||||||||
|
Revenue
|
$
|
264,637
|
|
$
|
246,208
|
|
$
|
18,429
|
|
$
|
246,208
|
|
$
|
256,226
|
|
$
|
(10,018
|
)
|
|||||
|
Cost of sales
|
118,817
|
|
111,402
|
|
7,415
|
|
111,402
|
|
128,111
|
|
(16,709
|
)
|
|||||||||||
|
Gross margin
|
145,820
|
|
134,806
|
|
11,014
|
|
134,806
|
|
128,115
|
|
6,691
|
|
|||||||||||
|
Operations & maintenance
|
65,713
|
|
61,113
|
|
4,600
|
|
61,113
|
|
59,816
|
|
1,297
|
|
|||||||||||
|
Depreciation & amortization
|
19,822
|
|
18,653
|
|
1,169
|
|
18,653
|
|
16,512
|
|
2,141
|
|
|||||||||||
|
Other taxes
|
10,201
|
|
8,041
|
|
2,160
|
|
8,041
|
|
7,876
|
|
165
|
|
|||||||||||
|
Other operating expenses
|
95,736
|
|
87,807
|
|
7,929
|
|
87,807
|
|
84,204
|
|
3,603
|
|
|||||||||||
|
Operating Income
|
$
|
50,084
|
|
$
|
46,999
|
|
$
|
3,085
|
|
$
|
46,999
|
|
$
|
43,911
|
|
$
|
3,088
|
|
|||||
2013 compared to 2012
Operating income for the Regulated Energy segment for 2013 was
$50.1 million
, an increase of
$3.1 million
, or
seven percent
. An increase in gross margin of
$11.0 million
was partially offset by an increase in other operating expenses of
$7.9 million
.
Gross Margin
Items contributing to the year-over-year increase of
$11.0 million
, or
eight percent
, in gross margin are listed in the following table:
|
(in thousands)
|
|
||
|
Gross margin for the year ended December 31, 2012
|
$
|
134,806
|
|
|
Factors contributing to the gross margin increase for the year ended December 31, 2013:
|
|||
|
Contribution from Sandpiper
|
4,432
|
|
|
|
Service expansions
|
3,710
|
|
|
|
Other natural gas growth
|
1,824
|
|
|
|
Additional surcharge for GRIP in Florida
|
724
|
|
|
|
Increased customer consumption—weather and other
|
455
|
|
|
|
Other
|
(131
|
)
|
|
|
Gross margin for the year ended December 31, 2013
|
$
|
145,820
|
|
Contribution from Sandpiper
In late May 2013, upon completion of the purchase of the ESG operating assets, Sandpiper began providing services to approximately
11,000
propane underground distribution system customers in Worcester County, Maryland under a new tariff approved by the Maryland PSC. Sandpiper generated
$4.4 million
of gross margin for the year ended
December 31, 2013
.
Service Expansions
Increased gross margin from service expansions was due primarily to the following:
|
•
|
$1.5 million
from expansions of natural gas transmission and distribution services - Expansion initiatives completed in 2012 and 2013 in Sussex County, Delaware; Worcester and Cecil Counties, Maryland; and Nassau and Indian River Counties, Florida.
|
|
•
|
$1.4 million
from short-term natural gas transmission services - From May to October 2013, Eastern Shore provided short-term transmission services to industrial customers located in New Castle and Kent Counties, Delaware by using existing system capacity. In November 2013, upon completion of construction of new facilities, these short-term contracts were replaced with long-term service contracts.
|
|
•
|
$702,000
from long-term transmission services commenced in November 2013 - In November 2013, Eastern Shore began providing long-term transmission services to industrial customers, which displaced the short-term services previously
|
Chesapeake Utilities Corporation 2013 Form 10-K Page
40
discussed. These long-term services are expected to generate
$4.3 million
of annual gross margin. They also displace an annualized gross margin of
$1.1 million
from an older contract, which expired in November 2012.
Other Natural Gas Growth
Increased gross margin from other natural growth was due primarily to the following:
|
•
|
$1.5 million
from Florida customer growth - Our Florida natural gas distribution operation experienced additional gross margin due primarily to new services to commercial and industrial customers.
|
|
•
|
$566,000
from Delmarva customer growth - We experienced
two
percent residential customer growth, as well as growth in commercial and industrial customers, in our Delmarva natural gas distribution operation.
|
Additional Surcharge for GRIP in Florida
In August 2012, the Florida PSC approved a surcharge for GRIP for FPU and Chesapeake's Florida division. This surcharge is designed to recover capital and other program-related costs, inclusive of an appropriate rate of return on investment, associated with accelerating the replacement of qualifying distribution mains and services. During 2013, FPU and Chesapeake's Florida division recorded
$724,000
in additional gross margin as a result of the increased GRIP spending.
Increased Customer Consumption—Weather and Other
Higher customer consumption, due to temperatures on the Delmarva Peninsula returning to more normal levels in 2013, generated increased gross margin of approximately
$984,000
. Higher non-weather related consumption generated additional gross margin of
$42,000
. This was partially offset by
$571,000
in lower gross margin as a result of warmer weather in Florida.
Other Operating Expenses
The increase in other operating expenses was due primarily to (a) $
3.1 million
in other operating expenses associated with Sandpiper's operations; (b)
$1.7 million
in higher payroll and benefits costs to support recent growth and expand our capabilities for future growth; (c)
$1.3 million
of increased incentive bonuses as a result of broader participation in the bonus program, which was extended during 2013 to cover substantially all employees, and the strong financial performance in 2013; (d)
$1.4 million
in higher depreciation, amortization, asset removal costs and property taxes associated with capital expenditures to support growth and maintain system integrity; (e) a one-time sales tax of
$726,000
expensed by Sandpiper related to the ESG acquisition in May 2013; and (f)
$342,000
in increased bad debt expense. These increases were partially offset by a
$1.5 million
recovery of previously expensed costs related to litigation involving our franchise with the City of Marianna, Florida.
2012 Compared to 2011
Operating income for our Regulated Energy segment for 2012 was
$47.0 million
, an increase of
$3.1 million
, or
seven percent
. An increase in gross margin of
$6.7 million
was partially offset by an increase in other operating expenses of
$3.6 million
.
Gross Margin
Items contributing to the year-over-year increase of
$6.7 million
, or
five percent
, in gross margin were as follows:
|
(in thousands)
|
|
||
|
Gross margin for the year ended December 31, 2011
|
$
|
128,115
|
|
|
Factors contributing to the gross margin increase for the year ended December 31, 2012:
|
|||
|
Service expansions
|
4,466
|
|
|
|
Other natural gas growth
|
1,795
|
|
|
|
Florida natural gas regulatory reserve
|
(750
|
)
|
|
|
Eastern Shore rate case settlement
|
737
|
|
|
|
Other
|
673
|
|
|
|
Decreased customer consumption—weather and other
|
(230
|
)
|
|
|
Gross margin for the year ended December 31, 2012
|
$
|
134,806
|
|
Chesapeake Utilities Corporation 2013 Form 10-K Page
41
Service Expansions
Increased gross margin from service expansions was due primarily to the following:
|
•
|
$589,000 from new natural gas distribution services in Sussex County, Delaware - We initiated new natural gas distribution service to several industrial customers in Sussex County, Delaware in late 2011 and during 2012.
|
|
•
|
$700,000 from short-term natural gas transmission services - Eastern Shore provided a short-term transmission service from November 2011 to October 2012 for 9,415 Dts/d to an industrial customer, which generated additional gross margin of $713,000 in 2012. This short-term service was replaced by a long-term service contract for the same capacity in November 2012.
|
|
•
|
$1.1 million from the Sussex County expansion - In conjunction with providing new natural gas distribution service in Sussex County, Delaware, as previously discussed, Eastern Shore initiated new natural gas transmission service in 2011 and 2012.
|
|
•
|
$1.5 million from the Nassau County, Florida expansion - Peninsula Pipeline generated additional gross margin during 2012 as a result of this new transmission service.
|
|
•
|
$237,000 from the Worcester and Cecil Counties, Maryland expansions - We generated additional transmission gross margin of $90,000 and $147,000 during 2012 as a result of Eastern Shore's expansion to Worcester and Cecil Counties, Maryland, respectively.
|
Other Natural Gas Growth
Increased gross margin from other natural gas growth was due primarily to the following:
|
•
|
$1.1 million from Delmarva customer growth - Our Delmarva natural gas distribution operation generated $1.1 million of additional gross margin, due primarily to the addition of 12 new large commercial and industrial customers in 2011 and two-percent growth in residential customers.
|
|
•
|
$986,000 from Florida customer growth - Our Florida natural gas distribution operation generated $986,000 of additional gross margin due primarily to growth in commercial and industrial customers.
|
|
•
|
$360,000 in expired natural gas transmission contracts - Partially offsetting the above increases in gross margin was a decrease in gross margin as a result of expired natural gas transmission contracts.
|
Florida Natural Gas Regulatory Reserve
In January 2012, the Florida PSC approved the recovery of $34.2 million as an acquisition adjustment and $2.2 million in merger-related costs in connection with the Company’s acquisition of FPU in 2009. The Florida PSC also determined that no refund should be made to customers as a result of the 2010 earnings of our Florida natural gas distribution operations. Accordingly, we reversed the $750,000 reserve, in the fourth quarter of 2011. We previously accrued the reserve in the third and fourth quarters of 2010 based on the contingent regulatory risks associated with the Florida natural gas earnings, merger benefits and recovery of the acquisition adjustment.
Eastern Shore Rate Case Settlement
Eastern Shore generated $737,000 of additional gross margin, as a result of new rates which became effective in July 2011.
Decreased Customer Consumption – Weather and Other
Customer consumption of natural gas and electricity decreased during 2012, primarily on the Delmarva Peninsula. The first quarter of 2012 was the warmest first quarter in the past preceding ten years, both on the Delmarva Peninsula and in Florida. We estimate that significantly warmer weather in 2012, primarily during the first three months of 2012, resulted in a period-over-period decrease of approximately $926,000 in gross margin, most of which occurred during the first three months of the year. This decrease was partially offset by $696,000 in higher gross margins due primarily to other volume increases in Florida.
Other Operating Expenses
Other operating expenses for the Regulated Energy segment increased by $3.6 million for 2012 due largely to: (a) $2.4 million in increased amortization expense associated with the recovery of the FPU acquisition adjustment and merger-related costs, which was partially offset by an amortization credit of $684,000 associated with FPU’s pre-merger deferred income tax gain; (b) $1.3 million in higher depreciation expense, asset removal and facilities costs associated with capital investments; (c) $646,000 in increased costs associated with investing in growth; (d) $379,000 in increased payroll and benefits cost for the Delmarva natural
Chesapeake Utilities Corporation 2013 Form 10-K Page
42
gas distribution operation due to increased staffing to support expansions; (e) $325,000 in increased costs related to pipeline integrity requirements; (f) $305,000 in higher legal costs associated with an electric franchise dispute in Marianna, Florida; and (g) $254,000 in an increased accrual for general liability claims. These increases in expenses were partially offset by $1.2 million in reduced payroll and benefits, primarily in Florida, because of a workforce reduction in 2011, and one-time charges totaling $1.1 million in 2011 as a result of the voluntary workforce reduction in Florida and pension settlements.
U
NREGULATED
E
NERGY
|
Increase
|
Increase
|
||||||||||||||||||||||
|
For the Year Ended December 31,
|
2013
|
2012
|
(decrease)
|
2012
|
2011
|
(decrease)
|
|||||||||||||||||
|
(in thousands)
|
|
|
|
|
|
|
|||||||||||||||||
|
Revenue
|
$
|
166,723
|
|
$
|
133,049
|
|
$
|
33,674
|
|
$
|
133,049
|
|
$
|
149,586
|
|
$
|
(16,537
|
)
|
|||||
|
Cost of sales
|
121,348
|
|
97,137
|
|
24,211
|
|
97,137
|
|
112,415
|
|
(15,278
|
)
|
|||||||||||
|
Gross margin
|
45,375
|
|
35,912
|
|
9,463
|
|
35,912
|
|
37,171
|
|
(1,259
|
)
|
|||||||||||
|
Operations & maintenance
|
26,657
|
|
22,804
|
|
3,853
|
|
22,804
|
|
22,863
|
|
(59
|
)
|
|||||||||||
|
Depreciation & amortization
|
3,686
|
|
3,420
|
|
266
|
|
3,420
|
|
3,229
|
|
191
|
|
|||||||||||
|
Other taxes
|
2,679
|
|
1,333
|
|
1,346
|
|
1,333
|
|
1,460
|
|
(127
|
)
|
|||||||||||
|
Other operating expenses
|
33,022
|
|
27,557
|
|
5,465
|
|
27,557
|
|
27,552
|
|
5
|
|
|||||||||||
|
Operating Income
|
$
|
12,353
|
|
$
|
8,355
|
|
$
|
3,998
|
|
$
|
8,355
|
|
$
|
9,619
|
|
$
|
(1,264
|
)
|
|||||
2013 Compared to 2012
Operating income for our Unregulated Energy segment for 2013 was
$12.4 million
, an increase of
$4.0 million
, or
48 percent
. An increase in gross margin of
$9.5 million
was partially offset by an increase in other operating expenses of
$5.5 million
.
Gross Margin
Items contributing to the year-over-year increase of
$9.5 million
, or
26 percent
, in gross margin were as follows:
|
(in thousands)
|
|
||
|
Gross margin for the year ended December 31, 2012
|
$
|
35,912
|
|
|
Factors contributing to the gross margin increase for the year ended December 31, 2013:
|
|||
|
Increased customer consumption—weather and other
|
4,233
|
|
|
|
Increase in propane margins
|
3,163
|
|
|
|
Contributions from acquisitions
|
1,989
|
|
|
|
Other
|
1,215
|
|
|
|
Decreased propane wholesale marketing margins
|
(1,137
|
)
|
|
|
Gross margin for the year ended December 31, 2013
|
$
|
45,375
|
|
Increased Customer Consumption—Weather and Other
Increased gross margin from higher customer consumption was due primarily to the following:
|
•
|
$3.0 million
from increased weather-related consumption - Temperatures on the Delmarva Peninsula returned to more normal levels in 2013, which generated additional gross margin of
$3.1 million
. This was offset by an
$83,000
decrease in gross margin in Florida.
|
|
•
|
$573,000
from non-weather related volumes - This was attributable to the timing of deliveries to bulk customers.
|
|
•
|
$675,000
from higher wholesale sales - An increase in wholesale propane sales generated additional gross margin.
|
Increase in Propane Margins
Higher retail propane margins during 2013 generated
$3.2 million
of additional gross margin. Retail margins on the Delmarva Peninsula remained strong throughout 2013 as our propane supply management resulted in a decrease in the average cost of
Chesapeake Utilities Corporation 2013 Form 10-K Page
43
inventory during 2013, which considerably outpaced a slight decline in retail prices during most of 2013. The propane retail prices are subject to various market conditions, including competition with other propane suppliers and the availability and price of alternative energy sources, and may fluctuate based on changes in demand, supply and other energy commodity prices.
Contributions from Acquisitions
The acquisitions of the operating assets of Glades in February 2013 and Austin Cox in June 2013 generated
$1.2 million
and
$820,000
, respectively of additional gross margin in 2013.
Other
Increased gross margin from other factors is primarily attributable to
$192,000
and
$746,000
from merchandise sales and miscellaneous fees, respectively.
Decreased propane wholesale marketing margins
Xeron experienced a decrease in gross margin of
$1.1 million
, as a result of lower margins on executed trades. Lower price volatility in the wholesale propane market and a decrease in trading volume reduced opportunities for Xeron to generate a profit in 2013 until primarily the latter part of the year.
Other Operating Expenses
The increase in other operating expenses was due primarily to: (a)
$2.2 million
in additional expenses associated with serving newly acquired customers, (b) an accrual of
$990,000
due to a contingency for taxes other than income, and (c)
$706,000
in increased incentive bonuses as a result of the strong financial performance in 2013.
2012 Compared to 2011
Operating income for our Unregulated Energy segment for 2012 was
$8.4 million
, a decrease of
$1.3 million
, or 13 percent, due primarily to a decrease in gross margin of $1.3 million. Other operating expenses for 2012 remained unchanged.
Gross Margin
Items contributing to the year-over-year decrease of
$1.3 million
, or three percent, in gross margin are listed in the following table:
|
(in thousands)
|
|
||
|
Gross margin for the year ended December 31, 2011
|
$
|
37,171
|
|
|
Factors contributing to the gross margin decrease for the year ended December 31, 2012:
|
|||
|
Decreased customer consumption—weather and other
|
(3,259
|
)
|
|
|
Increase in propane margins
|
2,724
|
|
|
|
Gain from litigation settlement—recorded in 2011
|
(575
|
)
|
|
|
Other
|
(149
|
)
|
|
|
Gross margin for the year ended December 31, 2012
|
$
|
35,912
|
|
Decreased Customer Consumption – Weather and Other
Lower gross margin from decreased customer consumption was due primarily to the following:
|
•
|
$2.7 million from decreased weather-related consumption - Significantly warmer weather, particularly during the first three months of 2012, when propane demand for heating is typically at its highest, resulted in decreased propane consumption.
|
|
•
|
$515,000 from decreased non-weather-related volume - Our Delmarva and Florida propane distribution operations experienced a decline in sales volume, beyond the estimated weather impact in 2012, due to the timing of deliveries to bulk-delivery customers, conservation and other factors. This was partially offset by additional gross margin generated from 1,180 customers acquired in late 2011 and early 2012, following the purchase of the operating assets of several small propane distribution companies in Florida.
|
Chesapeake Utilities Corporation 2013 Form 10-K Page
44
Increase in Propane Margins
Higher retail propane margins on the Delmarva Peninsula and in Florida generated $631,000 and $2.1 million, respectively, of additional gross margin in 2012. Sustained retail pricing in response to local market conditions and lower average propane inventory cost contributed to the higher margins.
Gain from Litigation Settlement – Recorded in 2011
A non-recurring gain of $575,000 was recorded in 2011 related to our share of proceeds received from an antitrust litigation settlement with a major propane supplier and is reflected as a period-over-period decrease in gross margin.
Other
PESCO’s gross margin decreased by $310,000 in 2012. PESCO’s gross margin in 2011 benefited from unusually large favorable imbalance resolutions with third-party intrastate pipeline suppliers. Imbalance resolutions are not predictable and, therefore, are not included in our long-term financial plans or forecasts. Lower gross margin from imbalance resolutions was partially offset by additional gross margin generated by new customers and contracts.
Partially offsetting the decrease in PESCO’s gross margin was Xeron's increase in gross margin of $225,000 in 2012 as a result of higher margins from its trading activity, as the market presented opportunities from fluctuations in wholesale propane prices.
Other Operating Expenses
Other operating expenses for the Unregulated Energy segment were $27.6 million for both 2012 and 2011.
O
THER
|
Increase
|
Increase
|
||||||||||||||||||||||
|
For the Year Ended December 31,
|
2013
|
2012
|
(decrease)
|
2012
|
2011
|
(decrease)
|
|||||||||||||||||
|
(in thousands)
|
|
|
|
|
|
|
|||||||||||||||||
|
Revenue
|
$
|
19,990
|
|
$
|
18,357
|
|
$
|
1,633
|
|
$
|
18,357
|
|
$
|
13,829
|
|
$
|
4,528
|
|
|||||
|
Cost of sales
|
10,544
|
|
8,872
|
|
1,672
|
|
8,872
|
|
7,051
|
|
1,821
|
|
|||||||||||
|
Gross margin
|
9,446
|
|
9,485
|
|
(39
|
)
|
9,485
|
|
6,778
|
|
2,707
|
|
|||||||||||
|
Operations & maintenance
|
7,761
|
|
6,953
|
|
808
|
|
6,953
|
|
5,515
|
|
1,438
|
|
|||||||||||
|
Depreciation & amortization
|
457
|
|
438
|
|
19
|
|
438
|
|
413
|
|
25
|
|
|||||||||||
|
Other taxes
|
931
|
|
814
|
|
117
|
|
814
|
|
676
|
|
138
|
|
|||||||||||
|
Other operating expenses
|
9,149
|
|
8,205
|
|
944
|
|
8,205
|
|
6,604
|
|
1,601
|
|
|||||||||||
|
Operating Income — Other
|
297
|
|
1,280
|
|
(983
|
)
|
1,280
|
|
174
|
|
1,106
|
|
|||||||||||
|
Operating Income — Eliminations
|
—
|
|
1
|
|
(1
|
)
|
1
|
|
1
|
|
—
|
|
|||||||||||
|
Operating Income
|
$
|
297
|
|
$
|
1,281
|
|
$
|
(984
|
)
|
$
|
1,281
|
|
$
|
175
|
|
$
|
1,106
|
|
|||||
2013 Compared to 2012
The “Other” segment reported operating income of
$297,000
for 2013, compared to
$1.3 million
in 2012. This decrease was primarily attributable to a decrease in the operating results of BravePoint, which reported a
$154,000
operating loss in 2013, compared to operating income of
$828,000
in 2012.
Gross margin for BravePoint for 2012 and 2013 remained unchanged at
$8.6 million
. Other operating expenses increased by
943,000
to
$8.7 million
in 2013 due primarily to BravePoint's higher payroll and related cos
ts.
2012 Compared to 2011
Operating income for our “Other” segment for 2012 was
$1.3 million
, an increase of
$1.1 million
, compared to 2011. This increase was attributable to higher operating income from BravePoint, which reported operating income of $828,000 in 2012, compared to an operating loss of $270,000 for 2011.
BravePoint generated increased gross margin of $2.6 million, $852,000 of which represented increased margin from ProfitZoom and Application Evolution sales and related services. The remaining increase in gross margin was generated from higher consulting
Chesapeake Utilities Corporation 2013 Form 10-K Page
45
revenues and other product sales. This increase in gross margin was partially offset by $1.5 million of increased other operating expenses as a result of resources added to support these services.
O
THER
I
NCOME
Other income for 2013, 2012 and 2011 was
$372,000
,
$271,000
and
$906,000
, respectively. Included in other income for 2011 was a $553,000 gain from the sale of a non-operating Internet Protocol address asset. The remaining balance in other income includes non-operating investment income, interest income, late fees charged to customers and gains or losses from the sale of assets.
I
NTEREST
E
XPENSE
2013 compared to 2012
Interest expense for the year ended
December 31, 2013
decreased by approximately
$513,000
, or
six percent
, compared to the same period in 2012. The decrease in interest expense was attributable primarily to decreases of
$700,000
in other long-term interest expense due to scheduled repayments and
$321,000
in interest on deposits from customers due to a lower interest rate on those deposits. These decreases were partially offset by an increase of
$501,000
in short-term interest expense due to higher borrowings in 2013.
2012 Compared to 2011
Total interest expense for 2012 decreased by approximately $253,000, or three percent, compared to 2011. The decrease in interest expense was attributable primarily to decreases of $699,000 in other long-term interest expense due to scheduled repayments and $337,000 in interest on deposits from FPU’s customers due to a lower interest rate on those deposits. Also contributing to the decrease was a reduction of $41,000 in short-term interest expense due to slightly lower borrowings and rates in 2012, compared to 2011. Offsetting the decrease in interest expense was additional interest expense of $824,000 related to the $29 million long-term debt issuance of 5.68 percent unsecured senior notes on June 23, 2011. We used the proceeds from these notes to repay a portion of Chesapeake’s short-term loan credit facilities, which had been used to redeem two series of FPU first mortgage bonds.
I
NCOME
T
AXES
2013 compared to 2012
Income tax expense was
$22.1 million
in 2013, compared to
$19.3 million
in 2012. Our effective tax rate was
40.2 percent
in 2013, compared to
40.1 percent
in 2012.
2012 Compared to 2011
Income tax expense was
$19.3 million
in 2012, compared to $18.0 million in 2011. Our effective tax rate was
40.1 percent
in 2012, compared to 39.4 percent in 2011. The increase in our effective tax rate in 2012 was due primarily to a $300,000 tax contingency accrual associated with a state tax audit recorded during 2012.
L
IQUIDITY AND
C
APITAL
R
ESOURCES
Our capital requirements reflect the capital-intensive and seasonal nature of our business and are principally attributable to investment in new plant and equipment, retirement of outstanding debt and seasonal variability in working capital. We rely on cash generated from operations, short-term borrowings, and other sources to meet normal working capital requirements and to finance capital expenditures.
Our energy businesses are weather-sensitive and seasonal. We normally generate a large portion of our annual net income and subsequent increases in our accounts receivable in the first and fourth quarters of each year due to significant volumes of natural gas, electricity, and propane delivered by our natural gas, electric, and propane distribution operations to customers during the
Chesapeake Utilities Corporation 2013 Form 10-K Page
46
peak heating season. In addition, our natural gas and propane inventories, which usually peak in the fall months, are largely drawn down in the heating season and provide a source of cash as the inventory is used to satisfy winter sales demand.
Capital expenditures, which are our investments in new or acquired plant and equipment, are our largest capital requirements. Our capital expenditures during 2013, 2012 and 2011 were
$108.0 million
, $78.2 million, and $44.4 million, respectively. We experienced a significant increase in our capital expenditures in 2013 and 2012, compared to 2011, as a result of the acquisition of ESG, continued expansions of our natural gas distribution and transmission systems on the Delmarva Peninsula and in Florida as well as a natural gas infrastructure replacement program in Florida, electric infrastructure improvements in Florida to increase the distribution system reliability, and other initiatives.
We have budgeted
$110.9 million
for capital expenditures during 2014. The following table shows the 2014 capital expenditure budget by segment:
|
(dollars in thousands)
|
|||
|
Regulated Energy:
|
|||
|
Natural gas distribution
|
$
|
53,444
|
|
|
Natural gas transmission
|
26,857
|
|
|
|
Electric distribution
|
4,697
|
|
|
|
Total Regulated Energy
|
84,998
|
|
|
|
Unregulated Energy:
|
|||
|
Propane distribution
|
5,846
|
|
|
|
Other unregulated energy
|
9,823
|
|
|
|
Total Unregulated Energy
|
15,669
|
|
|
|
Other
|
|||
|
Advanced information services
|
846
|
|
|
|
Other
|
9,400
|
|
|
|
Total Other
|
10,246
|
|
|
|
Total 2014 Capital Expenditures
|
$
|
110,913
|
|
We expect to fund the 2014 capital expenditures program from short-term borrowings, cash provided by operating activities, and other sources. In addition, as further discussed in the
Capital
Structure
section below, we will be issuing $50.0 million of our long-term uncollateralized senior notes in May 2014.
The capital expenditures program is subject to continuous review and modification. Actual capital requirements may vary from the above estimates due to a number of factors, including changing economic conditions, customer growth in existing areas, regulation, new growth or acquisition opportunities and availability of capital. Historically, actual capital expenditures have typically lagged behind the budgeted amounts.
Chesapeake Utilities Corporation 2013 Form 10-K Page
47
Capital Structure
We are committed to maintaining a sound capital structure and strong credit ratings to provide the financial flexibility needed to access capital markets when required. This commitment, along with adequate and timely rate relief for our regulated operations, is intended to ensure our ability to attract capital from outside sources at a reasonable cost. We believe that the achievement of these objectives will provide benefits to our customers, creditors and investors.
The following presents our capitalization, excluding and including short-term borrowings, as of
December 31, 2013
and
2012
:
|
December 31,
2013
|
December 31,
2012
|
||||||||||||
|
(in thousands)
|
|
|
|
|
|||||||||
|
Long-term debt, net of current maturities
|
$
|
117,592
|
|
30
|
%
|
$
|
101,907
|
|
28
|
%
|
|||
|
Stockholders’ equity
|
278,773
|
|
70
|
%
|
256,598
|
|
72
|
%
|
|||||
|
Total capitalization, excluding short-term borrowings
|
$
|
396,365
|
|
100
|
%
|
$
|
358,505
|
|
100
|
%
|
|||
|
December 31,
2013 |
December 31,
2012 |
||||||||||||
|
(in thousands)
|
|
|
|
|
|||||||||
|
Short-term debt
|
$
|
105,666
|
|
21
|
%
|
$
|
61,199
|
|
14
|
%
|
|||
|
Long-term debt, including current maturities
|
128,945
|
|
25
|
%
|
110,103
|
|
26
|
%
|
|||||
|
Stockholders’ equity
|
278,773
|
|
54
|
%
|
256,598
|
|
60
|
%
|
|||||
|
Total capitalization, including short-term borrowings
|
$
|
513,384
|
|
100
|
%
|
$
|
427,900
|
|
100
|
%
|
|||
In September 2013, we entered into an agreement with the Note Holders to issue
$70.0 million
of uncollateralized senior notes. We issued
$20.0 million
of these notes in December 2013, which are included in long-term debt at
December 31, 2013
. We will be issuing the remaining
$50.0 million
of the senior notes in May 2014. The proceeds from this issuance will be used to reduce our short-term borrowings and fund capital expenditures.
As of
December 31, 2013
, we did not have any restrictions on our cash balances. Both Chesapeake’s senior notes and FPU’s first mortgage bonds contain a restriction that limits the payment of dividends or other restricted payments in excess of certain pre-determined thresholds. As of
December 31, 2013
,
$100.5 million
of Chesapeake’s cumulative consolidated net income and
$57.5 million
of FPU’s cumulative net income were free of such restrictions.
Included in the long-term debt balance at
December 31, 2013
was a capital lease obligation associated with Sandpiper's capacity, supply and operating agreement (
$6.1 million
net of current maturities and
$7.0 million
including current maturities). At the closing of the ESG acquisition in May 2013, Sandpiper entered into this agreement, which has a six-year term. The capacity portion of this agreement is accounted for as a capital lease. This capital lease arrangement is further described in
Item 8, Financial Statements and Supplementary Data (
See
Note 4, Acquisitions
in the Consolidated Financial Statements).
Short-term Borrowings
Our outstanding short-term borrowings at
December 31, 2013
and 2012 were
$105.7 million
and
$61.2 million
, respectively, at the weighted average interest rates of
1.25 percent
and
1.48 percent
, respectively.
We utilize bank lines of credit to provide funds for our short-term cash needs to meet seasonal working capital requirements and to temporarily fund portions of the capital expenditure program. As of
December 31, 2013
, we had four unsecured bank lines of credit with two financial institutions for a total of
$125.0 million
. Two of these unsecured bank lines, totaling
$85.0 million
, are available under committed lines of credit. None of these unsecured bank lines of credit requires compensating balances. Advances offered under the uncommitted lines of credit are subject to the discretion of the banks. In addition to the four unsecured bank lines of credit, we had an unsecured short-term credit facility for
$40.0 million
with an existing lender. We are currently authorized by our Board of Directors to borrow up to
$140.0 million
of short-term borrowings, as required.
Our outstanding short-term borrowings at
December 31, 2013
and 2012 included
$3.1 million
and
$4.8 million
, respectively of book overdrafts. Book overdrafts are not actual borrowings under the credit facilities; however, these book drafts would be funded through the credit facilities if presented and, therefore, they were included in the short-term borrowings.
As of
December 31, 2013
, we issued
$4.7 million
in letters of credit to various counter-parties under one of the bank lines of credit. Although the amount of the letters of credit is not included in the outstanding short-term borrowings and we do not anticipate they will be drawn upon by the counter-parties, they reduce the available borrowings under the credit facilities.
Chesapeake Utilities Corporation 2013 Form 10-K Page
48
Our outstanding borrowings under these unsecured short-term credit facilities at
December 31, 2013
and 2012 were
$102.6 million
and
$56.4 million
, respectively. Short term borrowings were as follows during 2013, 2012 and 2011:
|
(in thousands)
|
2013
|
2012
|
2011
|
||||||
|
Average borrowings
|
$
|
67,367
|
|
$
|
23,419
|
|
$
|
11,000
|
|
|
Weighted average interest rate
|
1.34
|
%
|
1.79
|
%
|
2.35
|
%
|
|||
|
Maximum month-end borrowings
|
$
|
102,554
|
|
$
|
56,421
|
|
$
|
35,357
|
|
Cash Flows
The following table provides a summary of our operating, investing and financing cash flows for the years ended
December 31, 2013
, 2012 and 2011:
|
For the Year Ended December 31,
|
|||||||||||
|
2013
|
2012
|
2011
|
|||||||||
|
(in thousands)
|
|
|
|
||||||||
|
Net cash provided by (used in):
|
|||||||||||
|
Operating activities
|
$
|
72,931
|
|
$
|
66,641
|
|
$
|
71,121
|
|
||
|
Investing activities
|
(114,781
|
)
|
(70,598
|
)
|
(47,836
|
)
|
|||||
|
Financing activities
|
41,845
|
|
4,681
|
|
(22,291
|
)
|
|||||
|
Net increase in cash and cash equivalents
|
(5
|
)
|
724
|
|
994
|
|
|||||
|
Cash and cash equivalents—beginning of period
|
3,361
|
|
2,637
|
|
1,643
|
|
|||||
|
Cash and cash equivalents—end of period
|
$
|
3,356
|
|
$
|
3,361
|
|
$
|
2,637
|
|
||
Cash Flows Provided by Operating Activities
Changes in our cash flows from operating activities are attributable primarily to changes in net income and working capital, adjusted for non-cash adjustments for depreciation and deferred income taxes and other deferrals. Changes in working capital are determined by a variety of factors, including weather, the prices of natural gas, electricity and propane, the timing of customer collections, payments for purchases of natural gas, electricity and propane, and deferred fuel cost recoveries.
We normally generate a large portion of our annual net income and related increases in our accounts receivable in the first and fourth quarters of each year due to significant volumes of natural gas and propane delivered by our natural gas and propane distribution operations to customers during the peak heating season. In addition, our natural gas and propane inventories, which usually peak in the fall months, are largely drawn down in the heating season and provide a source of cash as the inventory is used to satisfy winter sales demand.
During
2013
and 2012, net cash provided by operating activities was
$72.9 million
, and
$66.6 million
resulting in an increase in cash flows of
$6.3 million
. Significant operating activities generating the cash flow change were as follows:
|
•
|
Net income, adjusted for reconciling activities, increased cash flows by
$5.6 million
, due primarily to higher earnings and increased non-cash items, such as depreciation and amortization expenses included in our earnings;
|
|
•
|
Lower net regulatory liabilities increased cash flows by
$7.3 million
, due primarily to an increase in fuel cost collected through the fuel cost recovery mechanisms during 2013 and the absence of the $1.2 million refund by Eastern Shore in January 2012 to customers as a result of its rate case settlement;
|
|
•
|
Higher inventory balances in 2013 decreased cash flows by
$5.1 million
due primarily to higher propane costs; and
|
|
•
|
Lower customer deposits decreased cash flows by
$1.7 million
due to refunds to customers during the year.
|
During
2012
and
2011
, our net cash flow provided by operating activities was
$66.6 million
and
$71.1 million
, respectively, resulting in a decrease of
$4.5 million
. Significant operating activities generating the cash flow change were as follows:
|
•
|
Lower customer deposits decreased cash flows by
$6.7 million
, due primarily to the absence in 2012 of a large deposit made by an industrial customer in 2011 and refunds to customers during 2012;
|
|
•
|
Higher net regulatory liabilities decreased cash flows by
$2.5 million
, primarily as a result of a reduction in fuel costs due and collected from regulated customers during 2012; and
|
Chesapeake Utilities Corporation 2013 Form 10-K Page
49
|
•
|
Lower propane inventory, storage gas and other inventory increased cash flows by
$3.1 million
, as a result of lower commodity prices during 2012, partially offset by an increase in the pipes and other construction inventory purchased during 2012.
|
Cash Flows Used in Investing Activities
Net cash used in investing activities totaled
$114.8 million
and
$70.6 million
for 2013 and 2012, respectively, resulting in a decrease in cash flows of
$44.2 million
. Significant investing activities contributing to the cash flow change were as follows:
|
•
|
Increased cash paid for capital expenditures during 2013, decreased cash flows by
$24.3 million
; and
|
|
•
|
Cash paid for acquisitions during 2013, due primarily to the ESG acquisition in May 2013, decreased cash flows by
$20.1 million
.
|
Net cash used in investing activities totaled
$70.6 million
and
$47.8 million
for 2012 and 2011, respectively, resulting in an increase of
$22.8 million
. Significant investing activities contributing to the cash flow change were as follows:
|
•
|
Increased cash paid for capital expenditures during 2012, decreased cash flows by
$25.7 million
; and
|
|
•
|
Cash receipts of $2.2 million from the sale of FPU's office building in West Palm Beach, Florida in 2012 increased cash flows.
|
Cash Flows Provided by/Used in Financing Activities
Net cash provided by financing activities totaled
$41.8 million
and
$4.7 million
for 2013 and 2012, respectively, resulting in an increase of
$37.2 million
. Significant financing activities generating the cash flow change were as follows:
|
•
|
Higher net short-term borrowings to fund capital expenditures and working capital needs increased cash flows by
$20.2 million
;
|
|
•
|
Net cash provided by long-term debt, due primarily to the new issuances during 2013, partially offset by the repayment of FPU’s first mortgage bonds prior to their maturities, increased cash flows by $20.0 million;
|
|
•
|
Book overdrafts decreased cash flows by
$2.3 million
; and
|
|
•
|
Higher cash dividends paid during 2013 decreased cash flows by
$746,000
.
|
Net cash provided by financing activities totaled
$4.7 million
for 2012, compared to net cash used in financing activities of
$22.3 million
in 2011, resulting in an increase of
$27.0 million
. Significant financing activities generating the cash flow change were as follows:
|
•
|
Higher short-term borrowings to fund capital expenditures and working capital needs increased cash flows by
$26.1 million
;
|
|
•
|
Lower scheduled principal payments during 2012 increased cash flows by
$932,000
; and
|
|
•
|
Higher cash dividends paid during 2012 decreased cash flows by
$672,000
.
|
Chesapeake Utilities Corporation 2013 Form 10-K Page
50
C
ONTRACTUAL
O
BLIGATIONS
We have the following contractual obligations and other commercial commitments as of
December 31, 2013
:
|
|
Payments Due by Period
|
||||||||||||||||||
|
Contractual Obligations
|
Less than 1
year
|
1 — 3 years
|
3 — 5 years
|
More than 5
years
|
Total
|
||||||||||||||
|
(in thousands)
|
|
|
|
|
|
||||||||||||||
|
Long-term debt
(1)
|
$
|
10,504
|
|
$
|
15,601
|
|
$
|
18,669
|
|
$
|
77,226
|
|
$
|
122,000
|
|
||||
|
Operating leases
(2)
|
1,249
|
|
1,949
|
|
865
|
|
2,745
|
|
6,808
|
|
|||||||||
|
Capital leases
(2)
(3)
|
1,083
|
|
3,000
|
|
3,000
|
|
625
|
|
7,708
|
|
|||||||||
|
Purchase obligations
(4)
|
|||||||||||||||||||
|
Transmission capacity
|
27,981
|
|
67,837
|
|
47,950
|
|
132,122
|
|
275,890
|
|
|||||||||
|
Storage — Natural Gas
|
3,193
|
|
8,376
|
|
4,167
|
|
1,508
|
|
17,244
|
|
|||||||||
|
Commodities
|
50,066
|
|
23,109
|
|
6,870
|
|
—
|
|
80,045
|
|
|||||||||
|
Electric supply
|
14,435
|
|
30,617
|
|
29,614
|
|
13,978
|
|
88,644
|
|
|||||||||
|
Forward purchase contracts — Propane
(5)
|
2,477
|
|
—
|
|
—
|
|
—
|
|
2,477
|
|
|||||||||
|
Unfunded benefits
(6)
|
452
|
|
953
|
|
819
|
|
2,887
|
|
5,111
|
|
|||||||||
|
Funded benefits
(7)
|
3,166
|
|
70
|
|
—
|
|
2,961
|
|
6,197
|
|
|||||||||
|
Total Contractual Obligations
|
$
|
114,606
|
|
$
|
151,512
|
|
$
|
111,954
|
|
$
|
234,052
|
|
$
|
612,124
|
|
||||
|
(1)
|
Principal payments on long-term debt, see
|
|
(2)
|
See
|
|
(3)
|
See
|
|
(4)
|
See
Item 8, Financial Statements and Supplementary Data, Note 20, Other Commitments and Contingencies
, for further information.
|
|
(5)
|
We have also entered into forward sale contracts. See
|
|
(6)
|
We have recorded long-term liabilities of
$5.1 million
at
December 31, 2013
for unfunded post-employment and post-retirement benefit plans. The amounts specified in the table are based on expected payments to current retirees and assumes a retirement age of 62 for currently active employees. There are many factors that would cause actual payments to differ from these amounts, including early retirement, future health care costs that differ from past experience and discount rates implicit in calculations.
|
|
(7)
|
We have recorded long-term liabilities of
$13.1 million
at
December 31, 2013
for two qualified, defined benefit pension plans. The assets funding these plans are in a separate trust and are not considered assets of the Company or included in the Company’s balance sheets. The Contractual Obligations table above includes
$3.1 million
, reflecting the expected payments we will make to the trust funds in 2014. Additional contributions may be required in future years based on the actual return earned by the plan assets and other actuarial assumptions, such as the discount rate and long-term expected rate of return on plan assets. See
|
O
FF-
B
ALANCE
S
HEET
A
RRANGEMENTS
We have issued corporate guarantees to certain vendors of our subsidiaries, primarily Xeron and PESCO. These corporate guarantees provide for the payment of propane and natural gas purchases in the event of the respective subsidiary’s default. Neither of these subsidiaries has ever defaulted on its obligations to pay its suppliers. The liabilities for these purchases are recorded in our financial statements when incurred. The aggregate amount guaranteed at
December 31, 2013
was
$31.1 million
, with the guarantees expiring on various dates through December 2014.
We have issued a letter of credit for
$1.0 million
, which expires on
September 12, 2014
, related to the electric transmission services for FPU’s northwest electric division. We have also issued a letter of credit to our current primary insurance company for
$1.1 million
, which expires on
December 2, 2014
, as security to satisfy the deductibles under our various insurance policies. As a result of a change in our primary insurance company in 2010, we renewed and decreased the letter of credit for
$304,000
to our former primary insurance company, which will expire on
June 1, 2014
. There have been no draws on these letters of credit as of
December 31, 2013
. We do not anticipate that the letters of credit will be drawn upon by the counterparties, and we expect that the letters of credit will be renewed to the extent necessary in the future.
Chesapeake Utilities Corporation 2013 Form 10-K Page
51
We provided a letter of credit for
$2.3 million
to TETLP related to the precedent agreement. Additional information is presented in
Item 8, Financial Statements and Supplementary Data, Note 20, Other Commitments and Contingencies
in the Consolidated Financial Statements.
I
NTEREST
R
ATE
R
ISK
Long-term debt is subject to potential losses based on changes in interest rates. Our long-term debt consists of fixed-rate senior notes, secured debt and convertible debentures. All of our long-term debt is fixed-rate debt and was not entered into for trading purposes. The carrying value of long-term debt, including current maturities but excluding a capital lease obligation was
$122.0 million
at
December 31, 2013
, as compared to a fair value of
$136.8 million
, using a discounted cash flow methodology that incorporates a market interest rate based on published corporate borrowing rates for debt instruments with similar terms and average maturities with adjustments for duration, optionality, credit risk, and risk profile. We evaluate whether to refinance existing debt or permanently refinance existing short-term borrowing, based in part on the fluctuation in interest rates.
C
OMMODITY
P
RICE
R
ISK
R
ELATED
T
O
R
EGULATED
E
NERGY
S
EGMENT
We have entered into agreements with various wholesale suppliers to purchase natural gas and electricity for resale to our customers. Purchases under these contracts either do not meet the definition of derivatives or are considered “normal purchases and sales” and are accounted for on an accrual basis. For all of our regulated businesses that sell natural gas or electricity to end-use customers, we have fuel cost recovery mechanisms authorized by the PSCs that allow us to periodically adjust fuel rates to reflect changes in the wholesale cost of natural gas and electricity and to ensure that we recover all of the costs prudently incurred in purchasing natural gas and electricity for our customers.
C
OMMODITY
P
RICE
R
ISK
R
ELATED
T
O
U
NREGULATED
E
NERGY
S
EGMENT
Our propane distribution business is exposed to commodity price risk as a result of the competitive nature of retail pricing offered to our customers. In order to mitigate this risk, we utilize propane storage activities and forward contracts for supply.
We can store up to approximately
6.0 million
gallons of propane (including leased storage and rail cars) during the winter season to meet our customers’ peak requirements and to serve metered customers. Purchases under forward contracts are typically considered “normal purchases and sales” and are accounted for on an accrual basis. Decreases in the wholesale price of propane may cause the value of stored propane to decline, particularly if we utilize fixed price forward contracts for supply. To mitigate the risk of propane commodity price fluctuations on the inventory valuation, we have adopted a Risk Management Policy that allows our propane distribution operation to enter into fair value hedges or other economic hedges of our inventory. The following highlights our hedging activities:
|
•
|
In June 2013, our propane distribution operation entered into put options to protect against the decline in propane prices and related potential inventory losses associated with
1.3 million
gallons purchased for the propane price cap program in the upcoming heating season. If the put options are exercised, we would receive the difference between the market price and the strike price if propane prices fall below the strike prices of
$0.830
per gallon in December 2013 through February of 2014 and
$0.860
per gallon in January through March 2014. We account for these options as fair value hedges, and there is no ineffective portion of these hedges. We paid
$120,000
to purchase these put options. As of December 31, 2013, the put options had a fair value of
$20,000
. The change in the fair value of the put options effectively reduced our propane inventory balance.
|
|
•
|
In May 2013, our propane distribution operation entered into a call option to protect against an increase in propane prices associated with
630,000
gallons expected to be purchased at market-based prices to supply the demands of our propane price cap program customers. The retail price that we can charge to those customers during the upcoming heating season is capped at a pre-determined level. The call option is exercised if the propane prices rise above the strike price of
$0.975
per gallon in January through March 2014. We account for this call option as a derivative instrument on a mark-to-market basis with any change in its fair value being reflected in current period earnings. We paid
$72,000
to purchase this call option. As of December 31, 2013, the call option had a fair value of
$169,000
.
|
|
•
|
In May 2012, our propane distribution operation entered into call options to protect against an increase in propane prices associated with
1,260,000
gallons purchased for the propane price cap program for the months of December 2012 through March 2013. The strike prices of these call options ranged from
$0.905
per gallon to
$0.990
per gallon during this four-
|
Chesapeake Utilities Corporation 2013 Form 10-K Page
52
month period. We paid
$139,000
to purchase the call options, which expired without exercising them as the market prices were below the strike prices. We accounted for the call options as a fair value hedge. As of
December 31, 2012
, the call options had a fair value of
$28,000
. There was no ineffective portion of this fair value hedge in 2012.
Our propane wholesale marketing operation, Xeron, is a party to natural gas liquids forward contracts, primarily propane contracts, with various third parties. These contracts require that the propane wholesale marketing operation purchase or sell natural gas liquids at a fixed price at fixed future dates. At expiration, the contracts are typically settled financially without taking physical delivery of propane. The propane wholesale marketing operation also enters into futures contracts that are traded on the IntercontinentalExchange. In certain cases, the futures contracts are settled by the payment or receipt of a net amount equal to the difference between the current market price of the futures contract and the original contract price; however, they may also be settled by physical receipt or delivery of propane.
The forward and futures contracts are entered into for trading and wholesale marketing purposes. The propane wholesale marketing business is subject to commodity price risk on its open positions to the extent that market prices for natural gas liquids deviate from fixed contract settlement prices. Market risk associated with the trading of futures and forward contracts is monitored daily for compliance with our Risk Management Policy, which includes volumetric limits for open positions. To manage exposures to changing market prices, open positions are marked up or down to market prices and reviewed daily by our oversight officials. In addition, the Risk Management Committee reviews periodic reports on markets and the credit risk of counter-parties, approves any exceptions to the Risk Management Policy (within limits established by the Board of Directors) and authorizes the use of any new types of contracts.
Quantitative information on forward, futures and other contracts at
December 31, 2013
and 2012 is presented in the following tables:
|
At December 31, 2013
|
Quantity in
Gallons
|
Estimated Market
Prices
|
Estimated Market
Contract Prices
|
|||||
|
Forward Contracts
|
||||||||
|
Sale
|
1,892,000
|
|
$0.9900 - $1.4750
|
$
|
1.2786
|
|
||
|
Purchase
|
1,991,000
|
|
$0.9411 - $1.4600
|
$
|
1.2444
|
|
||
Estimated market prices and weighted average contract prices are in dollars per gallon.
All contracts expire by the end of the first quarter of 2014.
|
At December 31, 2012
|
Quantity in
Gallons
|
Estimated Market
Prices
|
Weighted Average
Contract Prices
|
|||||
|
Forward Contracts
|
||||||||
|
Sale
|
1,262,000
|
|
$0.7550-$1.3650
|
$
|
0.9214
|
|
||
|
Purchase
|
2,648,000
|
|
$0.7550-$1.3300
|
$
|
0.9291
|
|
||
Estimated market prices and weighted average contract prices are in dollars per gallon.
All contracts expired by the end of the first quarter of 2013.
At
December 31, 2013
and 2012, we marked these forward and other contracts to market, using market transactions in either the listed or OTC markets, which resulted in the following assets and liabilities:
|
(in thousands)
|
2013
|
2012
|
|||||
|
Mark-to-market energy assets, including put/call options
|
$
|
385
|
|
$
|
210
|
|
|
|
Mark-to-market energy liabilities
|
$
|
127
|
|
$
|
331
|
|
|
I
NFLATION
Inflation affects the cost of supply, labor, products and services required for operations, maintenance and capital improvements. While the impact of inflation has remained low in recent years, natural gas and propane prices are subject to rapid fluctuations. In the regulated natural gas and electric distribution operations, fluctuations in natural gas and electricity prices are passed on to customers through the fuel cost recovery mechanism in our tariffs. To help cope with the effects of inflation on our capital investments and returns, we periodically seek rate increases from regulatory commissions for our regulated operations and closely monitor the returns of our unregulated business operations. To compensate for fluctuations in propane gas prices, we adjust propane selling prices to the extent allowed by the market.
Chesapeake Utilities Corporation 2013 Form 10-K Page
53
I
TEM
8. F
INANCIAL
S
TATEMENTS
AND
S
UPPLEMENTARY
D
ATA
.
R
EPORT
OF
I
NDEPENDENT
R
EGISTERED
P
UBLIC
A
CCOUNTING
F
IRM
The Board of Directors and Stockholders of
Chesapeake Utilities Corporation
We have audited the accompanying consolidated balance sheets of Chesapeake Utilities Corporation (the “Company”) as of December 31, 2013 and 2012, and the related consolidated statements of income, comprehensive income, stockholders’ equity, and cash flows for each of the years in the three-year period ended December 31, 2013. These consolidated financial statements are the responsibility of the Company’s management. Our responsibility is to express an opinion on these consolidated financial statements based on our audits.
We conducted our audits in accordance with the standards of the Public Company Accounting Oversight Board (United States). Those standards require that we plan and perform the audit to obtain reasonable assurance about whether the consolidated financial statements are free of material misstatement. An audit includes examining, on a test basis, evidence supporting the amounts and disclosures in the financial statements. An audit also includes assessing the accounting principles used and significant estimates made by management, as well as evaluating the overall financial statement presentation. We believe that our audits provide a reasonable basis for our opinion.
In our opinion, the consolidated financial statements referred to above present fairly, in all material respects, the financial position of the Company as of December 31, 2013 and 2012, and the results of their operations and their cash flows for each of the years in the three-year period ended December 31, 2013, in conformity with accounting principles generally accepted in the United States of America.
We also have audited, in accordance with the standards of the Public Company Accounting Oversight Board (United States), the Company’s internal control over financial reporting as of December 31, 2013, based on criteria established in Internal Control-Integrated Framework issued by the Committee of Sponsoring Organizations of the Treadway Commission (2013 framework), and our report dated
March 6, 2014
expressed an unqualified opinion.
/s/ ParenteBeard LLC
Philadelphia, Pennsylvania
March 6, 2014
Chesapeake Utilities Corporation 2013 Form 10-K Page
54
|
For the Year Ended December 31,
|
|||||||||||
|
2013
|
2012
|
2011
|
|||||||||
|
(in thousands, except shares and per share data)
|
|
|
|
||||||||
|
Operating Revenues
|
|||||||||||
|
Regulated Energy
|
$
|
264,637
|
|
$
|
246,208
|
|
$
|
256,226
|
|
||
|
Unregulated Energy
|
166,723
|
|
133,049
|
|
149,586
|
|
|||||
|
Other
|
12,946
|
|
13,245
|
|
12,215
|
|
|||||
|
Total operating revenues
|
444,306
|
|
392,502
|
|
418,027
|
|
|||||
|
Operating Expenses
|
|||||||||||
|
Regulated energy cost of sales
|
118,818
|
|
111,402
|
|
128,111
|
|
|||||
|
Unregulated energy and other cost of sales
|
126,017
|
|
101,957
|
|
118,787
|
|
|||||
|
Operations
|
91,452
|
|
82,387
|
|
79,810
|
|
|||||
|
Maintenance
|
7,509
|
|
7,423
|
|
7,449
|
|
|||||
|
Depreciation and amortization
|
23,965
|
|
22,510
|
|
20,153
|
|
|||||
|
Other taxes
|
13,811
|
|
10,188
|
|
10,012
|
|
|||||
|
Total operating expenses
|
381,572
|
|
335,867
|
|
364,322
|
|
|||||
|
Operating Income
|
62,734
|
|
56,635
|
|
53,705
|
|
|||||
|
Other income, net of other expenses
|
372
|
|
271
|
|
906
|
|
|||||
|
Interest charges
|
8,234
|
|
8,747
|
|
9,000
|
|
|||||
|
Income Before Income Taxes
|
54,872
|
|
48,159
|
|
45,611
|
|
|||||
|
Income taxes
|
22,085
|
|
19,296
|
|
17,989
|
|
|||||
|
Net Income
|
$
|
32,787
|
|
$
|
28,863
|
|
$
|
27,622
|
|
||
|
Weighted Average Common Shares Outstanding:
|
|||||||||||
|
Basic
|
9,620,641
|
|
9,586,144
|
|
9,555,799
|
|
|||||
|
Diluted
|
9,695,630
|
|
9,671,507
|
|
9,651,058
|
|
|||||
|
Earnings Per Share of Common Stock:
|
|||||||||||
|
Basic
|
$
|
3.41
|
|
$
|
3.01
|
|
$
|
2.89
|
|
||
|
Diluted
|
$
|
3.39
|
|
$
|
2.99
|
|
$
|
2.87
|
|
||
|
Cash Dividends Declared Per Share of Common Stock
|
$
|
1.520
|
|
$
|
1.440
|
|
$
|
1.365
|
|
||
The accompanying notes are an integral part of the financial statements.
Chesapeake Utilities Corporation 2013 Form 10-K Page
55
Consolidated Statements of Comprehensive Income
|
For the Year Ended December 31,
|
|||||||||||
|
2013
|
2012
|
2011
|
|||||||||
|
(in thousands)
|
|
|
|
||||||||
|
Net Income
|
$
|
32,787
|
|
$
|
28,863
|
|
$
|
27,622
|
|
||
|
Other Comprehensive Income (Loss), net of tax:
|
|||||||||||
|
Employee Benefits, net of tax:
|
|||||||||||
|
Amortization of prior service cost, net of tax of ($24), ($26) and $432, respectively
|
(36
|
)
|
(37
|
)
|
645
|
|
|||||
|
Net gain (loss), net of tax of $1,673, ($331) and ($1,164), respectively
|
2,565
|
|
(498
|
)
|
(1,812
|
)
|
|||||
|
Total other comprehensive income (loss)
|
2,529
|
|
(535
|
)
|
(1,167
|
)
|
|||||
|
Comprehensive Income
|
$
|
35,316
|
|
$
|
28,328
|
|
$
|
26,455
|
|
||
The accompanying notes are an integral part of the financial statements.
Chesapeake Utilities Corporation 2013 Form 10-K Page
56
|
As of December 31,
|
|||||||
|
Assets
|
2013
|
2012
|
|||||
|
(in thousands, except shares and per share data)
|
|
|
|||||
|
Property, Plant and Equipment
|
|||||||
|
Regulated energy
|
$
|
691,522
|
|
$
|
585,429
|
|
|
|
Unregulated energy
|
76,267
|
|
70,218
|
|
|||
|
Other
|
21,002
|
|
20,067
|
|
|||
|
Total property, plant and equipment
|
788,791
|
|
675,714
|
|
|||
|
Less: Accumulated depreciation and amortization
|
(174,148
|
)
|
(155,378
|
)
|
|||
|
Plus: Construction work in progress
|
16,603
|
|
21,445
|
|
|||
|
Net property, plant and equipment
|
631,246
|
|
541,781
|
|
|||
|
Current Assets
|
|||||||
|
Cash and cash equivalents
|
3,356
|
|
3,361
|
|
|||
|
Accounts receivable (less allowance for uncollectible accounts of $1,635 and $826, respectively)
|
75,293
|
|
53,787
|
|
|||
|
Accrued revenue
|
13,910
|
|
11,688
|
|
|||
|
Propane inventory, at average cost
|
10,456
|
|
7,612
|
|
|||
|
Other inventory, at average cost
|
4,880
|
|
5,841
|
|
|||
|
Regulatory assets
|
2,436
|
|
2,736
|
|
|||
|
Storage gas prepayments
|
4,318
|
|
3,716
|
|
|||
|
Income taxes receivable
|
2,609
|
|
4,703
|
|
|||
|
Deferred income taxes
|
1,696
|
|
791
|
|
|||
|
Prepaid expenses
|
6,910
|
|
6,020
|
|
|||
|
Mark-to-market energy assets
|
385
|
|
210
|
|
|||
|
Other current assets
|
160
|
|
132
|
|
|||
|
Total current assets
|
126,409
|
|
100,597
|
|
|||
|
Deferred Charges and Other Assets
|
|||||||
|
Goodwill
|
4,354
|
|
4,090
|
|
|||
|
Other intangible assets, net
|
2,975
|
|
2,798
|
|
|||
|
Investments, at fair value
|
3,098
|
|
4,168
|
|
|||
|
Regulatory assets
|
66,584
|
|
77,408
|
|
|||
|
Receivables and other deferred charges
|
2,856
|
|
2,904
|
|
|||
|
Total deferred charges and other assets
|
79,867
|
|
91,368
|
|
|||
|
Total Assets
|
$
|
837,522
|
|
$
|
733,746
|
|
|
The accompanying notes are an integral part of the financial statements.
Chesapeake Utilities Corporation 2013 Form 10-K Page
57
Consolidated Balance Sheets
|
As of December 31,
|
|||||||
|
Capitalization and Liabilities
|
2013
|
2012
|
|||||
|
(in thousands, except shares and per share data)
|
|
|
|||||
|
Capitalization
|
|||||||
|
Stockholders’ equity
|
|||||||
|
Common stock, par value $0.4867 per share (authorized 25,000,000)
|
$
|
4,691
|
|
$
|
4,671
|
|
|
|
Additional paid-in capital
|
152,341
|
|
150,750
|
|
|||
|
Retained earnings
|
124,274
|
|
106,239
|
|
|||
|
Accumulated other comprehensive loss
|
(2,533
|
)
|
(5,062
|
)
|
|||
|
Deferred compensation obligation
|
1,124
|
|
982
|
|
|||
|
Treasury stock
|
(1,124
|
)
|
(982
|
)
|
|||
|
Total stockholders’ equity
|
278,773
|
|
256,598
|
|
|||
|
Long-term debt, net of current maturities
|
117,592
|
|
101,907
|
|
|||
|
Total capitalization
|
396,365
|
|
358,505
|
|
|||
|
Current Liabilities
|
|||||||
|
Current portion of long-term debt
|
11,353
|
|
8,196
|
|
|||
|
Short-term borrowing
|
105,666
|
|
61,199
|
|
|||
|
Accounts payable
|
53,482
|
|
41,992
|
|
|||
|
Customer deposits and refunds
|
26,140
|
|
29,271
|
|
|||
|
Accrued interest
|
1,235
|
|
1,437
|
|
|||
|
Dividends payable
|
3,710
|
|
3,502
|
|
|||
|
Accrued compensation
|
8,394
|
|
7,435
|
|
|||
|
Regulatory liabilities
|
4,157
|
|
1,577
|
|
|||
|
Mark-to-market energy liabilities
|
127
|
|
331
|
|
|||
|
Other accrued liabilities
|
7,678
|
|
7,226
|
|
|||
|
Total current liabilities
|
221,942
|
|
162,166
|
|
|||
|
Deferred Credits and Other Liabilities
|
|||||||
|
Deferred income taxes
|
142,597
|
|
125,205
|
|
|||
|
Deferred investment tax credits
|
74
|
|
113
|
|
|||
|
Regulatory liabilities
|
4,402
|
|
5,454
|
|
|||
|
Environmental liabilities
|
9,155
|
|
9,114
|
|
|||
|
Other pension and benefit costs
|
21,000
|
|
33,535
|
|
|||
|
Accrued asset removal cost—Regulatory liability
|
39,510
|
|
38,096
|
|
|||
|
Other liabilities
|
2,477
|
|
1,558
|
|
|||
|
Total deferred credits and other liabilities
|
219,215
|
|
213,075
|
|
|||
|
Other commitments and contingencies (Note 19 and 20)
|
|||||||
|
Total Capitalization and Liabilities
|
$
|
837,522
|
|
$
|
733,746
|
|
|
The accompanying notes are an integral part of the financial statements.
Chesapeake Utilities Corporation 2013 Form 10-K Page
58
|
For the Year Ended December 31,
|
|||||||||||
|
2013
|
2012
|
2011
|
|||||||||
|
(in thousands)
|
|
|
|
||||||||
|
Operating Activities
|
|||||||||||
|
Net Income
|
$
|
32,787
|
|
$
|
28,863
|
|
$
|
27,622
|
|
||
|
Adjustments to reconcile net income to net operating cash:
|
|||||||||||
|
Depreciation and amortization
|
23,965
|
|
22,510
|
|
20,153
|
|
|||||
|
Depreciation and accretion included in other costs
|
6,123
|
|
5,547
|
|
5,116
|
|
|||||
|
Deferred income taxes, net
|
14,860
|
|
13,881
|
|
17,320
|
|
|||||
|
(Gain) loss on sale of assets
|
(152
|
)
|
93
|
|
(453
|
)
|
|||||
|
Unrealized (gain) loss on commodity contracts
|
(217
|
)
|
339
|
|
(41
|
)
|
|||||
|
Unrealized gain on investments
|
(489
|
)
|
(451
|
)
|
(282
|
)
|
|||||
|
Realized gain on sale of investments, net
|
(702
|
)
|
(88
|
)
|
—
|
|
|||||
|
Employee benefits and compensation
|
1,119
|
|
1,199
|
|
1,960
|
|
|||||
|
Share-based compensation
|
1,631
|
|
1,419
|
|
1,450
|
|
|||||
|
Other, net
|
(28
|
)
|
(27
|
)
|
(50
|
)
|
|||||
|
Changes in assets and liabilities:
|
|||||||||||
|
Sale (purchase) of investments
|
(39
|
)
|
(301
|
)
|
660
|
|
|||||
|
Accounts receivable and accrued revenue
|
(21,244
|
)
|
21,549
|
|
14,979
|
|
|||||
|
Propane inventory, storage gas and other inventory
|
(4,492
|
)
|
603
|
|
(2,484
|
)
|
|||||
|
Regulatory assets
|
(395
|
)
|
252
|
|
18
|
|
|||||
|
Prepaid expenses and other current assets
|
(1,064
|
)
|
(713
|
)
|
(345
|
)
|
|||||
|
Other deferred charges
|
(101
|
)
|
26
|
|
179
|
|
|||||
|
Long-term receivables
|
(228
|
)
|
(290
|
)
|
76
|
|
|||||
|
Accounts payable and other accrued liabilities
|
18,824
|
|
(19,936
|
)
|
(13,612
|
)
|
|||||
|
Income taxes receivable
|
2,311
|
|
2,223
|
|
(185
|
)
|
|||||
|
Accrued interest
|
(202
|
)
|
(200
|
)
|
(152
|
)
|
|||||
|
Customer deposits and refunds
|
(3,362
|
)
|
(1,647
|
)
|
5,096
|
|
|||||
|
Accrued compensation
|
837
|
|
437
|
|
19
|
|
|||||
|
Regulatory liabilities
|
2,723
|
|
(5,220
|
)
|
(2,527
|
)
|
|||||
|
Other liabilities
|
466
|
|
(3,427
|
)
|
(3,396
|
)
|
|||||
|
Net cash provided by operating activities
|
72,931
|
|
66,641
|
|
71,121
|
|
|||||
|
Investing Activities
|
|||||||||||
|
Property, plant and equipment expenditures
|
(97,120
|
)
|
(72,776
|
)
|
(47,037
|
)
|
|||||
|
Proceeds from sale of assets
|
199
|
|
2,279
|
|
937
|
|
|||||
|
Proceeds from sale of investments
|
2,300
|
|
630
|
|
(300
|
)
|
|||||
|
Acquisitions
|
(20,201
|
)
|
(124
|
)
|
(791
|
)
|
|||||
|
Environmental expenditures
|
41
|
|
(607
|
)
|
(645
|
)
|
|||||
|
Net cash used by investing activities
|
(114,781
|
)
|
(70,598
|
)
|
(47,836
|
)
|
|||||
|
Financing Activities
|
|||||||||||
|
Common stock dividends
|
(13,081
|
)
|
(12,335
|
)
|
(11,663
|
)
|
|||||
|
Purchase of stock for Dividend Reinvestment Plan
|
(1,342
|
)
|
(1,273
|
)
|
(1,244
|
)
|
|||||
|
Change in cash overdrafts due to outstanding checks
|
(1,666
|
)
|
597
|
|
91
|
|
|||||
|
Net borrowing (repayment) under line of credit agreements
|
46,133
|
|
25,894
|
|
(241
|
)
|
|||||
|
Other short-term borrowing
|
—
|
|
—
|
|
(29,100
|
)
|
|||||
|
Proceeds from issuance of long-term debt
|
27,000
|
|
—
|
|
29,000
|
|
|||||
|
Repayment of long-term debt and capital lease obligation
|
(15,191
|
)
|
(8,202
|
)
|
(9,134
|
)
|
|||||
|
Other
|
(8
|
)
|
—
|
|
—
|
|
|||||
|
Net cash provided (used) by financing activities
|
41,845
|
|
4,681
|
|
(22,291
|
)
|
|||||
|
Net Increase (Decrease) in Cash and Cash Equivalents
|
(5
|
)
|
724
|
|
994
|
|
|||||
|
Cash and Cash Equivalents — Beginning of Period
|
3,361
|
|
2,637
|
|
1,643
|
|
|||||
|
Cash and Cash Equivalents — End of Period
|
$
|
3,356
|
|
$
|
3,361
|
|
$
|
2,637
|
|
||
Supplemental Cash Flow Disclosures (see Note 6)
The accompanying notes are an integral part of the financial statements.
Chesapeake Utilities Corporation 2013 Form 10-K Page
59
Consolidated Statements of Stockholders’ Equity
|
|
Common Stock
|
|
|
|
|
|
|
|||||||||||||||||||||||
|
(in thousands, except shares and per share data)
|
Number
of
Shares
(1)
|
Par
Value
|
Additional
Paid-In
Capital
|
Retained
Earnings
|
Accumulated
Other
Comprehensive
Loss
|
Deferred
Compensation
|
Treasury
Stock
|
Total
|
||||||||||||||||||||||
|
Balances at December 31, 2010
|
9,524,195
|
|
$
|
4,635
|
|
$
|
148,159
|
|
$
|
76,805
|
|
$
|
(3,360
|
)
|
$
|
777
|
|
$
|
(777
|
)
|
$
|
226,239
|
|
|||||||
|
Net Income
|
—
|
|
—
|
|
—
|
|
27,622
|
|
—
|
|
—
|
|
—
|
|
27,622
|
|
||||||||||||||
|
Other comprehensive loss
|
—
|
|
—
|
|
—
|
|
—
|
|
(1,167
|
)
|
—
|
|
—
|
|
(1,167
|
)
|
||||||||||||||
|
Dividend declared ($1.365 per share)
|
—
|
|
—
|
|
(22
|
)
|
(13,179
|
)
|
—
|
|
—
|
|
—
|
|
(13,201
|
)
|
||||||||||||||
|
Retirement Savings Plan
|
2,002
|
|
1
|
|
79
|
|
—
|
|
—
|
|
—
|
|
—
|
|
80
|
|
||||||||||||||
|
Conversion of Debentures
|
10,680
|
|
5
|
|
176
|
|
—
|
|
—
|
|
—
|
|
—
|
|
181
|
|
||||||||||||||
|
Share-based compensation and tax benefit
(2) (3)
|
30,430
|
|
15
|
|
1,011
|
|
—
|
|
—
|
|
—
|
|
—
|
|
1,026
|
|
||||||||||||||
|
Treasury stock activities
(1)
|
—
|
|
—
|
|
—
|
|
—
|
|
—
|
|
40
|
|
(40
|
)
|
—
|
|
||||||||||||||
|
Balance at December 31, 2011
|
9,567,307
|
|
4,656
|
|
149,403
|
|
91,248
|
|
(4,527
|
)
|
817
|
|
(817
|
)
|
240,780
|
|
||||||||||||||
|
Net Income
|
—
|
|
—
|
|
—
|
|
28,863
|
|
—
|
|
—
|
|
—
|
|
28,863
|
|
||||||||||||||
|
Other comprehensive loss
|
—
|
|
—
|
|
—
|
|
—
|
|
(535
|
)
|
—
|
|
—
|
|
(535
|
)
|
||||||||||||||
|
Dividend declared ($1.440 per share)
|
—
|
|
—
|
|
(7
|
)
|
(13,872
|
)
|
—
|
|
—
|
|
—
|
|
(13,879
|
)
|
||||||||||||||
|
Conversion of Debentures
|
10,975
|
|
5
|
|
181
|
|
—
|
|
—
|
|
—
|
|
—
|
|
186
|
|
||||||||||||||
|
Share-based compensation and tax benefit
(2) (3)
|
19,217
|
|
10
|
|
1,173
|
|
—
|
|
—
|
|
—
|
|
—
|
|
1,183
|
|
||||||||||||||
|
Treasury stock activities
(1)
|
—
|
|
—
|
|
—
|
|
—
|
|
—
|
|
165
|
|
(165
|
)
|
—
|
|
||||||||||||||
|
Balance at December 31, 2012
|
9,597,499
|
|
4,671
|
|
150,750
|
|
106,239
|
|
(5,062
|
)
|
982
|
|
(982
|
)
|
256,598
|
|
||||||||||||||
|
Net Income
|
—
|
|
—
|
|
—
|
|
32,787
|
|
—
|
|
—
|
|
—
|
|
32,787
|
|
||||||||||||||
|
Other comprehensive income
|
—
|
|
—
|
|
—
|
|
—
|
|
2,529
|
|
—
|
|
—
|
|
2,529
|
|
||||||||||||||
|
Dividend declared ($1.520 per share)
|
—
|
|
—
|
|
(6
|
)
|
(14,752
|
)
|
—
|
|
—
|
|
—
|
|
(14,758
|
)
|
||||||||||||||
|
Conversion of Debentures
|
17,383
|
|
8
|
|
287
|
|
—
|
|
—
|
|
—
|
|
—
|
|
295
|
|
||||||||||||||
|
Share-based compensation and tax benefit
(2) (3)
|
23,348
|
|
12
|
|
1,310
|
|
—
|
|
—
|
|
—
|
|
—
|
|
1,322
|
|
||||||||||||||
|
Treasury stock activities
(1)
|
—
|
|
—
|
|
—
|
|
—
|
|
—
|
|
142
|
|
(142
|
)
|
—
|
|
||||||||||||||
|
Balance at December 31, 2013
|
9,638,230
|
|
$
|
4,691
|
|
$
|
152,341
|
|
$
|
124,274
|
|
$
|
(2,533
|
)
|
$
|
1,124
|
|
$
|
(1,124
|
)
|
$
|
278,773
|
|
|||||||
|
(1)
|
Includes
34,495
,
33,461
and
30,597
shares at December 31, 2013, 2012 and 2011, respectively, held in a Rabbi Trust related to our Deferred Compensation Plan.
|
|
(2)
|
Includes amounts for shares issued for Directors’ compensation.
|
|
(3)
|
The shares issued under the PIP are net of shares withheld for employee taxes. For 2013, 2012 and 2011, we withheld
10,411
,
5,670
and
12,234
shares, respectively, for taxes.
|
The accompanying notes are an integral part of the financial statements.
Chesapeake Utilities Corporation 2013 Form 10-K Page
60
Notes to the Consolidated Financial Statements
1. O
RGANIZATION
AND
B
ASIS
OF
P
RESENTATION
Chesapeake, incorporated in 1947 in Delaware, is a diversified energy company engaged in regulated energy, unregulated energy and other unregulated businesses. Our regulated energy businesses consist of: (a) regulated natural gas distribution operations in central and southern Delaware, Maryland’s eastern shore and Florida; (b) regulated natural gas transmission operations on the Delmarva Peninsula, in Pennsylvania and in Florida; and (c) regulated electric distribution operations serving customers in northeast and northwest Florida. Our unregulated energy businesses primarily include: (a) propane distribution operations in Delaware, the eastern shore of Maryland and Virginia, southeastern Pennsylvania and Florida; (b) our propane wholesale marketing operation, which markets propane to major independent oil and petrochemical companies, wholesale resellers and retail propane companies located primarily in the southeastern United States; and (c) our natural gas marketing operation providing natural gas supplies directly to commercial and industrial customers in Florida, Delaware and Maryland. We also engage in non-energy businesses, primarily through our advanced information services subsidiary, which provides information-technology-related business services and solutions for both enterprise and e-business applications.
Our consolidated financial statements as of
December 31, 2013
and 2012 and for the years ended
December 31, 2013
, 2012 and 2011 have been prepared in compliance with the rules and regulations of the SEC and GAAP. Our consolidated financial statements include the accounts of Chesapeake and its wholly-owned subsidiaries. We do not have any ownership interests in investments accounted for using the equity method or any variable interests in a variable interest entity. All intercompany accounts and transactions have been eliminated in consolidation. We have assessed and reported on subsequent events through the date of issuance of these consolidated financial statements.
We reclassified certain amounts in the consolidated statements of cash flows for the years ended December 31, 2012 and 2011 to conform to the current year’s presentation. We also reclassified certain amounts in the consolidated statements of stockholders' equity for the years ended December 31, 2012 and 2011 to conform to the current year’s presentation. These reclassifications are considered immaterial to the overall presentation of our consolidated financial statements.
2. S
UMMARY
OF
S
IGNIFICANT
A
CCOUNTING
P
OLICIES
Use of Estimates
The preparation of financial statements in conformity with GAAP requires management to make estimates in measuring assets and liabilities and related revenues and expenses. These estimates involve judgments with respect to, among other things, various future economic factors that are difficult to predict and are beyond our control; therefore, actual results could differ from these estimates.
Chesapeake Utilities Corporation 2013 Form 10-K Page
61
Notes to the Consolidated Financial Statements
Property, Plant and Equipment
Property, plant and equipment are stated at original cost less accumulated depreciation or fair value, if impaired. Costs include direct labor, materials and third-party construction contractor costs, AFUDC, and certain indirect costs related to equipment and employees engaged in construction. The costs of repairs and minor replacements are charged against income as incurred, and the costs of major renewals and betterments are capitalized. Upon retirement or disposition of property owned by the unregulated businesses, the gain or loss, net of salvage value, is charged to income. Upon retirement or disposition of property within the regulated businesses, the gain or loss, net of salvage value, is charged to accumulated depreciation. A summary of property, plant and equipment by classification as of
December 31, 2013
and 2012 is provided in the following table:
|
As of December 31,
|
|||||||
|
(in thousands)
|
2013
|
2012
|
|||||
|
Property, plant and equipment
|
|||||||
|
Regulated Energy
|
|||||||
|
Natural gas distribution – Delmarva
|
$
|
179,724
|
|
$
|
149,558
|
|
|
|
Natural gas distribution – Florida
|
199,289
|
|
170,943
|
|
|||
|
Natural gas transmission
|
242,163
|
|
202,968
|
|
|||
|
Electric distribution – Florida
|
70,346
|
|
61,960
|
|
|||
|
Unregulated Energy
|
|||||||
|
Propane distribution—Delmarva
|
54,865
|
|
53,156
|
|
|||
|
Propane distribution – Florida
|
20,829
|
|
16,823
|
|
|||
|
Other unregulated energy
|
573
|
|
239
|
|
|||
|
Other
|
21,002
|
|
20,067
|
|
|||
|
Total property, plant and equipment
|
788,791
|
|
675,714
|
|
|||
|
Less: Accumulated depreciation and amortization
|
(174,148
|
)
|
(155,378
|
)
|
|||
|
Plus: Construction work in progress
|
16,603
|
|
21,445
|
|
|||
|
Net property, plant and equipment
|
$
|
631,246
|
|
$
|
541,781
|
|
|
Contributions or Advances in Aid of Construction
Customer contributions or advances in aid of construction reduce property, plant and equipment unless the amounts are refundable to customers. Contributions or advances may be refundable to customers after a number of years based on the amount of revenues generated from the customers or the duration of the service provided to the customers. Refundable contributions or advances are recorded initially as liabilities. The amounts that are determined to be non-refundable reduce property, plant and equipment at the time of such determination. During the years ended
December 31, 2013
and 2012, there were
$785,000
and
$1.1 million
, respectively, of non-refunded contributions or advances reducing property, plant and equipment.
Allowed Funds Used During Construction
Some of the additions to our regulated property, plant and equipment include AFUDC, which represents the estimated cost of funds, from both debt and equity sources, used to finance the construction of major projects. AFUDC is capitalized in rate base for rate making purposes when the completed projects are placed in service. During the years ended
December 31, 2013
, 2012, and 2011, we recorded
$131,000
,
$111,000
and
$25,000
, respectively, of AFUDC, all of which were related to short-term debt and reflected as a reduction of interest charges.
Asset Used in Leases
Property, plant and equipment for the natural gas transmission operation includes
$1.4 million
of assets, consisting primarily of mains, measuring equipment and regulation station equipment used by Peninsula Pipeline to provide natural gas transmission service pursuant to a contract with a third party. This contract is accounted for as an operating lease due to the exclusive use of the assets by the customer. The service under this contract commenced in January 2009 and generates
$264,000
in annual revenue for a term of
20
years. Accumulated depreciation for these assets totaled
$363,000
and
$291,000
at
December 31, 2013
and 2012, respectively.
Chesapeake Utilities Corporation 2013 Form 10-K Page
62
Notes to the Consolidated Financial Statements
Capital Lease Asset
Property, plant and equipment for our Delmarva natural gas distribution operation includes a capital lease asset of
$7.0 million
, net of amortization, related to Sandpiper's capacity, supply and operating agreement. See
Note 4, Acquisitions
for additional information.
Jointly-owned pipeline
Property, plant and equipment for the natural gas transmission operation also includes
$6.7 million
of assets, which consists of the
16
-mile pipeline from the Duval/Nassau County line to Amelia Island in Nassau County, Florida, jointly owned by Peninsula Pipeline and Peoples Gas. The amount included in property, plant and equipment represents Peninsula Pipeline’s
45
-percent ownership of this pipeline. This
16
-mile pipeline was placed in service in December 2012. Accumulated depreciation for this pipeline totaled
$361,000
and
$28,000
, at
December 31, 2013
and 2012, respectively.
Gain on Sale of Asset
In July 2011, we sold an Internet Protocol address asset to an unaffiliated entity for approximately
$553,000
. This particular Internet Protocol address was not used by us and did not have any net carrying value at the time of the sale. We recognized a non-operating pre-tax gain of
$553,000
from this sale, which is included in other income in the accompanying consolidated statements of income.
Depreciation and Accretion Included in Operations Expenses
We compute depreciation expense for our regulated operations by applying composite, annual rates, as approved by the regulators. The following table shows the average depreciation rates used during the years ended
December 31, 2013
, 2012 and 2011:
|
2013
|
2012
|
2011
|
||||||
|
Natural gas distribution – Delmarva
|
2.7
|
%
|
2.5
|
%
|
2.5
|
%
|
||
|
Natural gas distribution – Florida
|
3.3
|
%
|
3.2
|
%
|
3.5
|
%
|
||
|
Natural gas transmission
|
2.7
|
%
|
2.7
|
%
|
2.6
|
%
|
||
|
Electric distribution – Florida
|
3.6
|
%
|
3.8
|
%
|
4.2
|
%
|
||
For our unregulated operations, we compute depreciation expense on a straight line basis over the following estimated useful lives of the assets:
|
Asset Description
|
Useful Life
|
|
Propane distribution mains
|
10-37 years
|
|
Propane bulk plants and tanks
|
10-40 years
|
|
Liquefied petroleum gas equipment
|
5-33 years
|
|
Meters and meter installations
|
5-33 years
|
|
Measuring and regulating station equipment
|
5-37 years
|
|
Office furniture and equipment
|
3-10 years
|
|
Transportation equipment
|
4-20 years
|
|
Structures and improvements
|
5-45 years
|
|
Other
|
Various
|
We report certain depreciation and accretion in operations expense, rather than depreciation and amortization expense, in the accompanying consolidated statements of income in accordance with industry practice and regulatory requirements. Depreciation and accretion included in operations expense consists of the accretion of the costs of removal for future retirements of utility assets, vehicle depreciation, computer software and hardware depreciation, and other minor amounts of depreciation expense. For the years ended
December 31, 2013
, 2012 and 2011,
$6.1 million
,
$5.5 million
and
$5.1 million
, respectively, of depreciation and accretion were reported in operations expenses.
Chesapeake Utilities Corporation 2013 Form 10-K Page
63
Notes to the Consolidated Financial Statements
Regulated Operations
We account for our regulated operations in accordance with ASC Topic 980,
Regulated Operations,
which includes accounting principles for companies whose rates are determined by independent third-party regulators. When setting rates, regulators often make decisions, the economics of which require companies to defer costs or revenues in different periods than may be appropriate for unregulated enterprises. When this situation occurs, a regulated company defers the associated costs as regulatory assets on the balance sheet and records them as expense on the income statement as it collects revenues. Further, regulators can also impose liabilities upon a regulated company for amounts previously collected from customers and for recovery of costs that are expected to be incurred in the future as regulatory liabilities. If we were required to terminate the application of these regulatory provisions to our regulated operations, all such deferred amounts would be recognized in the statement of income at that time, which could have a material impact on our financial position, results of operations and cash flows.
At
December 31, 2013
and 2012, the regulated utility operations had recorded the following regulatory assets and liabilities included in our consolidated balance sheets. These assets and liabilities will be recognized as revenues and expenses in future periods as they are reflected in customers’ rates.
Chesapeake Utilities Corporation 2013 Form 10-K Page
64
Notes to the Consolidated Financial Statements
|
As of December 31,
|
|||||||
|
2013
|
2012
|
||||||
|
(in thousands)
|
|
|
|||||
|
Regulatory Assets
|
|||||||
|
Under-recovered purchased fuel costs
(1)
|
$
|
1,549
|
|
$
|
2,219
|
|
|
|
Deferred post retirement benefits
(2)
|
8,578
|
|
17,755
|
|
|||
|
Deferred transaction and transition costs
(3)
|
471
|
|
1,035
|
|
|||
|
Deferred conversion and development costs
(1)
|
1,320
|
|
842
|
|
|||
|
Environmental regulatory assets and expenditures
(4)
|
5,170
|
|
5,432
|
|
|||
|
Acquisition adjustment
(5)
|
47,478
|
|
48,724
|
|
|||
|
Loss on reacquired debt
(6)
|
1,486
|
|
1,484
|
|
|||
|
Other
|
2,968
|
|
2,653
|
|
|||
|
Total Regulatory Assets
|
$
|
69,020
|
|
$
|
80,144
|
|
|
|
Regulatory Liabilities
|
|||||||
|
Self insurance
(9)
|
$
|
1,000
|
|
$
|
1,212
|
|
|
|
Over-recovered purchased fuel costs
(1)
|
2,818
|
|
218
|
|
|||
|
Conservation cost recovery
(1)
|
51
|
|
356
|
|
|||
|
Storm reserve
(9)
|
2,875
|
|
2,742
|
|
|||
|
Accrued asset removal cost
(8)
|
39,510
|
|
38,096
|
|
|||
|
Deferred gains
(7)
|
783
|
|
1,977
|
|
|||
|
Other
|
1,032
|
|
526
|
|
|||
|
Total Regulatory Liabilities
|
$
|
48,069
|
|
$
|
45,127
|
|
|
|
(1)
|
We are allowed to recover the asset or are required to pay the liability in rates. We do not earn an overall rate of return on these assets.
|
|
(2)
|
The Florida PSC allowed FPU to treat as a regulatory asset the portion of the unrecognized costs pursuant to
ASC Topic 715, Compensation - Retirement Benefits
, related to its regulated operations. See
Note 16, Employee Benefit Plans,
for additional information.
|
|
(3)
|
The Florida PSC approved the inclusion of the FPU merger-related costs in our rate base and the recovery of those costs in rates. The balances at December 31, 2013 and 2012 include the gross-up of this regulatory asset for income tax because a portion of the merger-related costs is not tax-deductible.
|
|
(4)
|
All of our environmental expenditures incurred to date and current estimate of future environmental expenditures have been approved by various PSCs for recovery. See
|
|
(5)
|
We are allowed to include the premiums paid in various natural gas utility acquisitions in Florida in our rate bases and recover them over a specific time period pursuant to the Florida PSC approvals. Included in these amounts are
$1.3 million
of the premium paid by FPU,
$34.2 million
of the premium paid by Chesapeake in 2009, including the gross up of the amount for income tax, because it is not tax deductible, and
$746,000
of the premium paid by FPU in 2010.
|
|
(6)
|
Gains and losses resulting from the reacquisition of long-term debt are amortized over future periods as adjustments to interest expense in accordance with established regulatory practice.
|
|
(7)
|
Pursuant to the Florida PSC order, we are required to defer and amortize over a specific time period certain gains identified during the FPU merger integration.
|
|
(8)
|
In accordance with regulatory treatment, our depreciation rates are comprised of two components – historical cost and the estimated cost of removal, net of estimated salvage, of certain regulated properties. We collect these costs in base rates through depreciation expense with a corresponding credit to accumulated depreciation. Because the accumulated estimated removal costs meet the requirements of authoritative guidance related to regulated operations, we have accounted for them as a regulatory liability and have reclassified them from accumulated depreciation to accumulated removal costs in our consolidated balance sheets.
|
|
(9)
|
We have self-insurance and storm reserves that allow us to collect through rates amounts to be used against general claims, storm restoration costs and other losses as they are incurred.
|
We monitor our regulatory and competitive environments to determine whether the recovery of our regulatory assets continues to be probable. If we were to determine that recovery of these assets is no longer probable, we would write off the assets against earnings. We believe that provisions of ASC Topic 980,
Regulated Operations
, continue to apply to our regulated operations and that the recovery of our regulatory assets is probable.
Chesapeake Utilities Corporation 2013 Form 10-K Page
65
Notes to the Consolidated Financial Statements
Operating Revenues
Revenues for our natural gas and electric distribution operations are based on rates approved by the PSC in each state in which they operate. Eastern Shore’s revenues are based on rates approved by the FERC. Customers’ base rates may not be changed without formal approval by these commissions. The PSCs, however, have authorized our regulated operations to negotiate rates, based on approved methodologies, with customers that have competitive alternatives. The FERC has also authorized Eastern Shore to negotiate rates above or below the FERC-approved maximum rates, which customers can elect as an alternative to negotiated rates.
For regulated deliveries of natural gas and electricity, we read meters and bill customers on monthly cycles that do not coincide with the accounting periods used for financial reporting purposes. We accrue unbilled revenues for natural gas and electricity that have been delivered, but not yet billed, at the end of an accounting period to the extent that they do not coincide. We estimate the amount of the unbilled revenue by jurisdiction and customer class. A similar computation is made to accrue unbilled revenues for propane customers with meters and natural gas marketing customers, whose billing cycles do not coincide with our accounting periods.
The propane wholesale marketing operation records trading activity for open contracts on a net mark-to-market basis in our consolidated statement of income. For propane bulk delivery customers without meters and for advanced information services customers, we record revenue in the period the products are delivered and/or services are rendered.
All of our natural gas and electric distribution operations, except for two utilities that do not sell natural gas to end-use customers as a result of deregulation, have fuel cost recovery mechanisms. These mechanisms provide a method of adjusting the billing rates to reflect changes in the cost of purchased fuel. The difference between the current cost of fuel purchased and the cost of fuel recovered in billed rates is deferred and accounted for as either unrecovered fuel cost or amounts payable to customers. Generally, these deferred amounts are recovered or refunded within
one year
. Chesapeake’s Florida natural gas distribution division and FPU's Indiantown division provide unbundled delivery service to their customers, whereby the customers are permitted to purchase their gas requirements directly from competitive natural gas marketers.
We charge flexible rates to our natural gas distribution industrial interruptible customers to compete with prices of alternative fuels, which these customers are able to use. Neither we nor our interruptible customers are contractually obligated to deliver or receive natural gas on a firm service basis.
We report revenue taxes, such as gross receipts taxes, franchise taxes, and sales taxes, on a net basis.
Cost of Sales
Cost of sales includes the direct costs attributable to the products sold or services provided to our customers. These costs include primarily the variable cost of natural gas, electricity and propane commodities, pipeline capacity costs needed to transport and store natural gas, transmission costs for electricity, transportation costs to transport propane purchases to our storage facilities, and the direct cost of labor for our advanced information services subsidiary.
Operations and Maintenance Expenses
Operations and maintenance expenses include operations and maintenance salaries and benefits, materials and supplies, usage of vehicles, tools and equipment, payments to contractors, utility plant maintenance, customer service, professional fees and other outside services, insurance expense, minor amounts of depreciation, accretion of cost of removal for future retirements of utility assets, and other administrative expenses.
Cash and Cash Equivalents
Our policy is to invest cash in excess of operating requirements in overnight income-producing accounts. Such amounts are stated at cost, which approximates fair value. Investments with an original maturity of three months or less when purchased are considered cash equivalents.
Accounts Receivable and Allowance for Doubtful Accounts
Accounts receivable consist primarily of amounts due for distribution sales of natural gas, electricity and propane and transportation services to customers. An allowance for doubtful accounts is recorded against amounts due to reduce the receivables balance to the amount we reasonably expect to collect based upon our collections experiences and our assessment of customers’ inability or reluctance to pay. If circumstances change, our estimates of recoverable accounts receivable may also change. Circumstances which could affect such estimates include, but are not limited to, customer credit issues, the level of natural gas, electricity and propane prices and general economic conditions. Accounts are written off when they are deemed to be uncollectible.
Chesapeake Utilities Corporation 2013 Form 10-K Page
66
Notes to the Consolidated Financial Statements
Inventories
We use the average cost method to value propane, materials and supplies, and other merchandise inventory. If market prices drop below cost, inventory balances that are subject to price risk are adjusted to market values.
Goodwill and Other Intangible Assets
Goodwill is not amortized but is tested for impairment at least annually. In addition, goodwill of a reporting unit is tested for impairment between annual tests if an event occurs or circumstances change that would more likely than not reduce the fair value of a reporting unit below its carrying value. Other intangible assets are amortized on a straight-line basis over their estimated economic useful lives. Please refer to
Note 10, Goodwill and Other Intangible Assets
, for additional discussion of this subject.
Other Deferred Charges
Other deferred charges include discount, premium and issuance costs associated with long-term debt. Debt issuance costs are deferred and then are amortized to interest expense over the original lives of the respective debt issuances.
Pension and Other Postretirement Plans
Pension and other postretirement plan costs and liabilities are determined on an actuarial basis and are affected by numerous assumptions and estimates including the fair value of plan assets, estimates of the expected returns on plan assets, assumed discount rates, the level of contributions made to the plans, and current demographic and actuarial mortality data. We review annually the estimates and assumptions underlying our pension and other postretirement plan costs and liabilities with the assistance of third-party actuarial firms. The assumed discount rates and the expected returns on plan assets are the assumptions that generally have the most significant impact on our pension costs and liabilities. The assumed discount rates, health care cost trend rates and rates of retirement generally have the most significant impact on our postretirement plan costs and liabilities.
The discount rates are utilized principally in calculating the actuarial present value of our pension and postretirement obligations and net pension and postretirement costs. When estimating our discount rates, we consider high quality corporate bond rates, such as Moody’s Aa bond index and the Citigroup yield curve, changes in those rates from the prior year and other pertinent factors, including the expected life of each of our plans and their respective payment options.
The expected long-term rates of return on assets are utilized in calculating the expected returns on the plan assets component of our annual pension plan costs. We estimate the expected returns on plan assets of each of our plans by evaluating expected bond returns, asset allocations, the effects of active plan management, the impact of periodic plan asset rebalancing and historical performance. We also consider the guidance from our investment advisors in making a final determination of our expected rates of return on assets.
We estimate the health care cost trend rates used in determining our postretirement net expense based upon actual health care cost experience, the effects of recently enacted legislation and general economic conditions. Our assumed rate of retirement is estimated based upon our annual reviews of participant census information as of the measurement date.
Actual changes in the fair value of plan assets and the differences between the actual return on plan assets and the expected return on plan assets could have a material effect on the amount of pension and postretirement benefit costs that we ultimately recognize. A
0.25 percent
decrease in the discount rate could increase our annual pension and postretirement costs by approximately
$4,000
, and a
0.25 percent
increase could decrease our annual pension and postretirement costs by approximately
$40,000
. A
0.25 percent
change in the rate of return could change our annual pension cost by approximately
$132,000
and would not have an impact on the postretirement and supplemental executive retirement plans because these plans are not funded.
Income Taxes, Investment Tax Credit Adjustments and Tax-related contingency
Deferred tax assets and liabilities are recorded for the income tax effect of temporary differences between the financial statement bases and tax bases of assets and liabilities and are measured using the enacted income tax rates in effect in the years in which the differences are expected to reverse. Deferred tax assets are recorded net of any valuation allowance when it is more likely than not that such income tax benefits will be realized. Investment tax credits on utility property have been deferred and are allocated to income ratably over the lives of the subject property.
We account for uncertainty in income taxes in the financial statements only if it is more likely than not that an uncertain tax position is sustainable based on technical merits. Recognizable tax positions are then measured to determine the amount of benefit recognized in the financial statements. We recognize penalties and interest related to unrecognized tax benefits as a component of other income.
We account for contingencies associated with taxes other than income when the likelihood of a loss is both probable and estimable. In assessing the likelihood of a loss, we do not consider the existence of current inquiries, or the likelihood of future inquiries, by
Chesapeake Utilities Corporation 2013 Form 10-K Page
67
Notes to the Consolidated Financial Statements
tax authorities as a factor. Our assessment is based solely on our application of the appropriate statutes and the likelihood of a loss assuming the proper inquiries are made by tax authorities.
Financial Instruments
Xeron engages in trading activities using forward and futures contracts, which have been accounted for using the mark-to-market method of accounting. Under mark-to-market accounting, our trading contracts are recorded at fair value as mark-to-market energy assets and liabilities. The changes in fair value of the contracts are recognized as gains or losses in revenues on the consolidated statements of income in the period of change.
Our natural gas, electric and propane distribution operations and natural gas marketing operations enter into agreements with suppliers to purchase natural gas, electricity and propane for resale to their customers. Purchases under these contracts either do not meet the definition of derivatives or are considered “normal purchases and sales” and are accounted for on an accrual basis.
Our propane distribution operation may enter into derivative transactions, such as swaps, put options and call options in order to mitigate the impact of wholesale price fluctuations on its inventory valuation. These transactions may be designated as fair value hedges if they meet all of the accounting requirements pursuant to ASC Topic 815,
Derivatives and Hedging
and we elect to designate the instruments as fair value hedges. If designated as a fair value hedge, the value of the hedging instrument, such as a swap or put option, is recorded at fair value with the effective portion of the gain or loss of the hedging instrument effectively reducing or increasing the value of propane inventory. The ineffective portion of the gain or loss is recorded in earnings. If the instrument is not designated as a fair value hedge or does not meet the accounting requirements of a fair value hedge, it is recorded at fair value with the gain or loss being recorded in earnings.
FASB Statements and Other Authoritative Pronouncements
Recent Accounting Standards Yet to be Adopted
Income Taxes (ASC 740) - In July 2013, the FASB issued ASU 2013-11,
Presentation of an Unrecognized Tax Benefit When a Net Operating Loss Carryforward, a Similar Tax Loss, or a Tax Credit Carryforward Exists
, which requires the netting of certain unrecognized tax benefits against a deferred tax asset for a loss or other similar tax carryforward that would apply upon settlement of an uncertain tax position. This ASU is effective prospectively, beginning on January 1, 2014, for all unrecognized tax benefits existing at the adoption of this new standard. Retrospective implementation and early adoption of this standard are permitted. We expect the adoption of ASU 2013-11 to have no material impact on our financial position and results of operations.
Recently Adopted Accounting Standards
Comprehensive Income (ASC 220) - Effective January 1, 2013, we adopted ASU 2013-02,
Reporting of Amounts Reclassified Out Of Accumulated Other Comprehensive Income
, which requires enhanced disclosures of amounts reclassified out of accumulated other comprehensive income by component. The adoption of ASU 2013-02 had no impact on our financial position and results of operations. See
Note 15
,
Accumulated Other Comprehensive Income (Loss)
, for additional disclosures required under this new standard.
Balance Sheet (ASC 210) - Effective January 1, 2013, we adopted ASU 2011-11,
Disclosures About Offsetting Assets and Liabilities
, and ASU 2013-01,
Clarifying the Scope of Disclosures about Offsetting Assets and Liabilities
. These new standards require disclosures about offsetting and related arrangements in order to help financial statement users better understand the effect of those arrangements on our financial position. The adoption of ASU 2011-11 and ASU 2013-01 had no material impact on our financial position and results of operations. See
Note
7,
Derivative Instruments
, for additional disclosures about our offsetting of certain assets and liabilities.
Chesapeake Utilities Corporation 2013 Form 10-K Page
68
Notes to the Consolidated Financial Statements
3. E
ARNINGS
P
ER
S
HARE
Basic earnings per share are computed by dividing income available for common stockholders by the weighted average number of shares of common stock outstanding during the period. Diluted earnings per share are computed by dividing income available for common stockholders by the weighted average number of shares of common stock outstanding during the period adjusted for the exercise and/or conversion of all potentially dilutive securities, such as convertible debt and share-based compensation. The calculations of both basic and diluted earnings per share are presented in the following table.
|
For the Year Ended December 31,
|
|||||||||||
|
2013
|
2012
|
2011
|
|||||||||
|
(in thousands, except shares and per share data)
|
|
|
|
||||||||
|
Calculation of Basic Earnings Per Share:
|
|||||||||||
|
Net Income
|
$
|
32,787
|
|
$
|
28,863
|
|
$
|
27,622
|
|
||
|
Weighted average shares outstanding
|
9,620,641
|
|
9,586,144
|
|
9,555,799
|
|
|||||
|
Basic Earnings Per Share
|
$
|
3.41
|
|
$
|
3.01
|
|
$
|
2.89
|
|
||
|
Calculation of Diluted Earnings Per Share:
|
|||||||||||
|
Reconciliation of Numerator:
|
|||||||||||
|
Net Income
|
$
|
32,787
|
|
$
|
28,863
|
|
$
|
27,622
|
|
||
|
Effect of 8.25% Convertible debentures
|
43
|
|
53
|
|
61
|
|
|||||
|
Adjusted numerator — Diluted
|
$
|
32,830
|
|
$
|
28,916
|
|
$
|
27,683
|
|
||
|
Reconciliation of Denominator:
|
|||||||||||
|
Weighted shares outstanding — Basic
|
9,620,641
|
|
9,586,144
|
|
9,555,799
|
|
|||||
|
Effect of dilutive securities:
|
|||||||||||
|
Share-based Compensation
|
25,244
|
|
23,499
|
|
23,792
|
|
|||||
|
8.25% Convertible debentures
|
49,745
|
|
61,864
|
|
71,467
|
|
|||||
|
Adjusted denominator — Diluted
|
9,695,630
|
|
9,671,507
|
|
9,651,058
|
|
|||||
|
Diluted Earnings Per Share
|
$
|
3.39
|
|
$
|
2.99
|
|
$
|
2.87
|
|
||
4. A
CQUISITIONS
Eastern Shore Gas Company
On May 31, 2013, the Maryland PSC approved the acquisition of ESG (see
Note 18, Rates and Other Regulatory Activities
, for additional information regarding this approval). Upon receiving this approval, we completed the purchase of the operating assets of ESG, which was not related to, or affiliated with, our interstate natural gas transmission subsidiary, Eastern Shore. We paid approximately
$16.5 million
at the closing of the transaction, which was subject to certain adjustments specified in the asset purchase agreement. During the third quarter of 2013, the purchase price was reduced by
$543,000
due to adjustments to property, plant and equipment, propane inventory, accounts receivable and other accrued liabilities. The purchase price included approximately
$726,000
of sales tax related to the transaction. We financed the acquisition using unsecured short-term debt.
Approximately
11,000
residential and commercial underground propane distribution system customers and
500
bulk propane delivery customers acquired in the transaction are being served by our new subsidiary, Sandpiper, and our propane distribution subsidiary, Sharp, respectively. Sandpiper's operations, which cover all of Worcester County, Maryland, are now subject to rate and service regulation by the Maryland PSC. We are evaluating the potential conversion of some of the underground propane distribution systems to natural gas distribution. Although these customers are currently being served with propane, we classify Sandpiper's operations as natural gas distribution in the Regulated Energy segment.
In connection with this acquisition, we recorded
$12.6 million
in property, plant and equipment,
$344,000
in propane inventory,
$2.5 million
in accounts receivable and accrued revenue and
$227,000
in other current liabilities, which included the effect of the purchase price adjustment in the third quarter of 2013. All but insignificant amounts of assets and liabilities are recorded in the regulated energy segment. No goodwill or intangible asset was recorded from this acquisition. The allocation of the purchase price and valuation of assets are preliminary, and we will complete the final purchase price allocation as soon as practicable, but no later than one year from the purchase of the assets.
Sales tax of approximately
$726,000
included in the purchase price was expensed as a transaction cost and was reflected in other taxes in the accompanying consolidated statements of income for the year ended December 31, 2013. The revenue and net income
Chesapeake Utilities Corporation 2013 Form 10-K Page
69
Notes to the Consolidated Financial Statements
from this acquisition for the year ended December 31, 2013, included in our consolidated statement of income was
$9.8 million
and
$309,000
, respectively.
At the closing of this transaction, we entered into a capacity, supply and operating agreement with EGWIC, an affiliate of the seller for a term of
six
years. Pursuant to this agreement, Sandpiper has access to
13
propane storage tanks, with total storage capacity of
570,000
gallons in Worcester County, Maryland to meet its supply requirements. For this access, Sandpiper has agreed to pay a monthly fee of
$42,000
for the first annual period and a monthly fee of
$125,000
for the remaining term of the agreement. Sandpiper will also purchase propane supply (initially estimated at approximately
7.4 million
gallons of annual contract volume) from EGWIC over the same
six
-year period. Sandpiper has the option to pay a fixed per-gallon price for some or all of the propane purchases under this agreement or a market-based price using one of two local propane pricing indices. As further discussed in
Note 18, Rates and Other Regulatory Activities
, the cost of the capacity, supply and operating agreement will be recovered as a fuel cost in Sandpiper's new annual GSR filing.
Due to the specific property involved and the fixed monthly payments for the use of the storage capacity, the capacity portion of the capacity, supply and operating agreement is accounted for as a capital lease. As a result, we recorded a corresponding capital lease asset and capital lease obligation of
$7.1 million
at the inception of the agreement. During the year ended December 31, 2013, we recorded approximately
$144,000
and
$147,000
, respectively, for the interest on the capital lease obligation and amortization of the capital lease asset. Since the entire amount of the capacity payments is expected to be recovered through the GSR mechanism, the timing and amount of the expense recognition, as well as the presentation of the expenses, will also follow the regulatory accounting.
Other Acquisitions
On December 2, 2013, we acquired certain operating assets of Fort Meade for approximately
$792,000
. The purchased assets are used to provide natural gas distribution service in the City of Fort Meade, Florida. In connection with this acquisition we recorded
$670,000
in property, plant and equipment,
$14,000
in inventory,
$150,000
in goodwill and
$42,000
in other current liabilities. Valuation of certain property, plant and equipment is preliminary and may be adjusted in the future based upon the final valuation, but no later than one year from the date of acquisition. All of the goodwill is expected to be deductible for income tax purposes. The revenue and net income from this acquisition that were included in our consolidated statement of income for the year ended December 31, 2013 were not material.
On June 7, 2013, we acquired the operating assets of Austin Cox for approximately
$600,000
. The purchased assets are used to provide heating, ventilation and air conditioning, plumbing and electrical services to residential, commercial and industrial customers throughout the lower Delmarva Peninsula. In connection with this acquisition, we recorded
$105,000
in property, plant and equipment,
$30,000
in inventory,
$250,000
as an intangible asset related to a non-compete agreement to be amortized over
five years
beginning in July 2013 and
$237,000
in goodwill. All of the goodwill is expected to be deductible for income tax purposes. The revenue and net income from this acquisition that were included in our consolidated statement of income for the year ended December 31, 2013 were not material.
On February 5, 2013, we purchased the propane operating assets of Glades for approximately
$2.9 million
. The purchased assets are used to provide propane distribution service to approximately
3,000
residential and commercial customers in Okeechobee, Glades and Hendry Counties, Florida. In connection with this acquisition, we recorded
$1.6 million
in property, plant and equipment,
$502,000
in propane and other inventory,
$300,000
in an intangible asset related to Glades’ customer list, to be amortized over
12 years
beginning in February 2013 and
$453,000
in goodwill. All of the goodwill is expected to be deductible for income tax purposes. The revenue and net income from this acquisition that were included in our consolidated statement of income for the year ended December 31, 2013 were not material.
In December 2011 and January, 2012, we purchased the propane operating assets of Crescent and Barefoot Bay Propane Gas Company for total consideration of approximately
$954,000
. In connection with these acquisitions, we recorded
$200,000
in goodwill, all of which is deductible for income tax purposes. There was no intangible asset other than goodwill recorded in connection with these acquisitions. The revenue and net income from these acquisitions, which are included in our consolidated statements of income, are not material.
5. S
EGMENT
I
NFORMATION
We use the management approach to identify operating segments. We organize our business around differences in regulatory environment and/or products or services, and the operating results of each segment are regularly reviewed by the chief operating decision maker (our Chief Executive Officer) in order to make decisions about resources and to assess performance. The segments are evaluated based on their pre-tax operating income. Our operations comprise three operating segments:
Chesapeake Utilities Corporation 2013 Form 10-K Page
70
Notes to the Consolidated Financial Statements
|
•
|
Regulated Energy
. The Regulated Energy segment includes natural gas distribution, natural gas transmission operations and electric distribution operations. All operations in this segment are regulated, as to their rates and services, by the PSCs having jurisdiction in each operating territory or by the FERC in the case of Eastern Shore.
|
|
•
|
Unregulated Energy.
The Unregulated Energy segment includes propane distribution and wholesale marketing operations, and natural gas marketing operations, which are unregulated as to their rates and services. Also included in this segment are other unregulated energy services, such as energy-related merchandise sales and heating, ventilation and air conditioning, plumbing and electrical services.
|
|
•
|
Other
. The “Other” segment consists primarily of our advanced information services subsidiary, as well as our unregulated subsidiaries that own real estate leased to Chesapeake and certain corporate costs not allocated to other operations.
|
The following table presents information about our reportable segments.
|
For the Year Ended December 31,
|
|||||||||||
|
2013
|
2012
|
2011
|
|||||||||
|
(in thousands)
|
|
|
|
||||||||
|
Operating Revenues, Unaffiliated Customers
|
|||||||||||
|
Regulated Energy
|
$
|
263,573
|
|
$
|
245,042
|
|
$
|
255,405
|
|
||
|
Unregulated Energy
|
161,760
|
|
130,020
|
|
149,586
|
|
|||||
|
Other
|
18,973
|
|
17,440
|
|
13,036
|
|
|||||
|
Total operating revenues, unaffiliated customers
|
$
|
444,306
|
|
$
|
392,502
|
|
$
|
418,027
|
|
||
|
Intersegment Revenues
(1)
|
|||||||||||
|
Regulated Energy
|
$
|
1,064
|
|
$
|
1,166
|
|
$
|
821
|
|
||
|
Unregulated Energy
|
4,963
|
|
3,029
|
|
—
|
|
|||||
|
Other
|
1,017
|
|
917
|
|
793
|
|
|||||
|
Total intersegment revenues
|
$
|
7,044
|
|
$
|
5,112
|
|
$
|
1,614
|
|
||
|
Operating Income
|
|||||||||||
|
Regulated Energy
|
$
|
50,084
|
|
$
|
46,999
|
|
$
|
43,911
|
|
||
|
Unregulated Energy
|
12,353
|
|
8,355
|
|
9,619
|
|
|||||
|
Other
|
297
|
|
1,281
|
|
175
|
|
|||||
|
Operating Income
|
62,734
|
|
56,635
|
|
53,705
|
|
|||||
|
Other income
|
372
|
|
271
|
|
906
|
|
|||||
|
Interest charges
|
8,234
|
|
8,747
|
|
9,000
|
|
|||||
|
Income Before Income taxes
|
54,872
|
|
48,159
|
|
45,611
|
|
|||||
|
Income taxes
|
22,085
|
|
19,296
|
|
17,989
|
|
|||||
|
Net Income
|
$
|
32,787
|
|
$
|
28,863
|
|
$
|
27,622
|
|
||
|
Depreciation and Amortization
|
|||||||||||
|
Regulated Energy
|
$
|
19,822
|
|
$
|
18,653
|
|
$
|
16,512
|
|
||
|
Unregulated Energy
|
3,686
|
|
3,420
|
|
3,229
|
|
|||||
|
Other and eliminations
|
457
|
|
437
|
|
412
|
|
|||||
|
Total depreciation and amortization
|
$
|
23,965
|
|
$
|
22,510
|
|
$
|
20,153
|
|
||
|
Capital Expenditures
|
|||||||||||
|
Regulated Energy
|
$
|
95,944
|
|
$
|
69,056
|
|
$
|
37,104
|
|
||
|
Unregulated Energy
|
4,829
|
|
3,969
|
|
2,432
|
|
|||||
|
Other
|
7,266
|
|
5,185
|
|
4,895
|
|
|||||
|
Total capital expenditures
|
$
|
108,039
|
|
$
|
78,210
|
|
$
|
44,431
|
|
||
|
(1)
|
All significant intersegment revenues are billed at market rates and have been eliminated from consolidated revenues.
|
Chesapeake Utilities Corporation 2013 Form 10-K Page
71
Notes to the Consolidated Financial Statements
|
As of December 31,
|
|||||||
|
2013
|
2012
|
||||||
|
Identifiable Assets
|
|||||||
|
Regulated Energy
|
$
|
708,950
|
|
$
|
615,438
|
|
|
|
Unregulated Energy
|
100,585
|
|
79,287
|
|
|||
|
Other
|
27,987
|
|
39,021
|
|
|||
|
Total identifiable assets
|
$
|
837,522
|
|
$
|
733,746
|
|
|
Our operations are almost entirely domestic. BravePoint has infrequent transactions with foreign companies, located primarily in Canada. These transactions, which are denominated and paid in U.S. dollars, are immaterial to the consolidated revenues.
6. S
UPPLEMENTAL
C
ASH
F
LOW
D
ISCLOSURES
Cash paid for interest and income taxes during the years ended
December 31, 2013
, 2012 and 2011 were as follows:
|
For the Year Ended December 31,
|
|||||||||||
|
2013
|
2012
|
2011
|
|||||||||
|
(in thousands)
|
|
|
|
||||||||
|
Cash paid for interest
|
$
|
7,837
|
|
$
|
8,086
|
|
$
|
7,746
|
|
||
|
Cash paid for income taxes
|
$
|
10,243
|
|
$
|
3,809
|
|
$
|
2,327
|
|
||
Non-cash investing and financing activities during the years ended
December 31, 2013
, 2012, and 2011 were as follows:
|
For the Year Ended December 31,
|
|||||||||||
|
2013
|
2012
|
2011
|
|||||||||
|
(in thousands)
|
|
|
|
||||||||
|
Capital property and equipment acquired on account, but not paid as of December 31
|
$
|
341
|
|
$
|
7,065
|
|
$
|
1,811
|
|
||
|
Retirement Savings Plan
|
$
|
—
|
|
$
|
—
|
|
$
|
80
|
|
||
|
Conversion of Debentures
|
$
|
295
|
|
$
|
186
|
|
$
|
181
|
|
||
|
Performance Incentive Plan
|
$
|
355
|
|
$
|
427
|
|
$
|
280
|
|
||
|
Director Stock Compensation Plan
|
$
|
495
|
|
$
|
443
|
|
$
|
456
|
|
||
|
Capital Lease Obligation
|
$
|
7,126
|
|
$
|
—
|
|
$
|
—
|
|
||
7. D
ERIVATIVE
I
NSTRUMENTS
We use derivative and non-derivative contracts to engage in trading activities and manage risks related to obtaining adequate supplies and the price fluctuations of natural gas, electricity and propane. Our natural gas, electric and propane distribution operations have entered into agreements with suppliers to purchase natural gas, electricity and propane for resale to their customers. Purchases under these contracts either do not meet the definition of derivatives or are considered “normal purchases and sales” and are accounted for on an accrual basis. Our propane distribution operation may also enter into fair value hedges of its inventory in order to mitigate the impact of wholesale price fluctuations. As of
December 31, 2013
, our natural gas and electric distribution operations did not have any outstanding derivative contracts.
In June 2013, Sharp entered into put options to protect against the decline in propane prices and related potential inventory losses associated with
1.3 million
gallons purchased for the propane price cap program in the upcoming heating season. If exercised, we will receive the difference between the market price and the strike price if propane prices fall below the strike prices of
$0.830
per gallon in December 2013 through February of 2014 and
$0.860
per gallon in January through March 2014. We account for these options as fair value hedges, and there is no ineffective portion of these hedges. We paid
$120,000
to purchase these put options. As of December 31, 2013, the put options had a fair value of
$20,000
. The change in the fair value of the put options effectively reduced our propane inventory balance.
In May 2013, Sharp entered into a call option to protect against an increase in propane prices associated with
630,000
gallons expected to be purchased at market-based prices to supply the demands of our propane price cap program customers. The retail
Chesapeake Utilities Corporation 2013 Form 10-K Page
72
Notes to the Consolidated Financial Statements
price that we can charge to those customers during the upcoming heating season is capped at a pre-determined level. The call option is exercised if the propane prices rise above the strike price of
$0.975
per gallon in January through March 2014. We account for this call option as a derivative instrument on a mark-to-market basis with any change in its fair value being reflected in current period earnings. We paid
$72,000
to purchase this call option. As of December 31, 2013, the call option had a fair value of
$169,000
.
In May 2012, Sharp entered into call options to protect against an increase in propane prices associated with
1,260,000
gallons purchased for the propane price cap program for the months of December 2012 through March 2013. The strike prices of these call options ranged from
$0.905
per gallon to
$0.990
per gallon during this four-month period. We paid
$139,000
to purchase the call options, which expired without exercising the options as the market prices were below the strike prices. We accounted for the call options as a fair value hedge. As of
December 31, 2012
, the call options had a fair value of
$28,000
. There was no ineffective portion of this fair value hedge in 2012.
Xeron engages in trading activities using forward and futures contracts. These contracts are considered derivatives and have been accounted for using the mark-to-market method of accounting. Under the mark-to-market method of accounting, the trading contracts are recorded at fair value, and the changes in fair value of those contracts are recognized as unrealized gains or losses in the consolidated statements of income in the period of change. As of
December 31, 2013
, we had the following outstanding trading contracts, which we accounted for as derivatives:
|
Quantity in
|
Estimated Market
|
Weighted Average
|
||||||
|
At December 31, 2013
|
Gallons
|
Prices
|
Contract Prices
|
|||||
|
Forward Contracts
|
||||||||
|
Sale
|
1,892,000
|
|
$0.9900 - $1.4750
|
$
|
1.2786
|
|
||
|
Purchase
|
1,991,000
|
|
$0.9411 - $1.4600
|
$
|
1.2444
|
|
||
All contracts expire by the end of the first quarter of 2014.
Xeron has entered into master netting agreements with
two
counterparties to mitigate exposure to counterparty credit risk. The master netting agreements enable Xeron to net these
two
counterparties' outstanding accounts receivable and payable, which are presented on a gross basis in the accompanying consolidated balance sheets. At
December 31, 2013
, Xeron had a right to offset
$2.8 million
and
$3.2 million
of accounts receivable and accounts payable, respectively, with these
two
counterparties. At
December 31, 2012
, Xeron had a right to offset
$1.2 million
and
$511,000
of accounts receivable and accounts payable, respectively, with these
two
counterparties.
The following tables present information about the fair value and related gains and losses of our derivative contracts. We did not have any derivative contracts with a credit-risk-related contingency.
Chesapeake Utilities Corporation 2013 Form 10-K Page
73
Notes to the Consolidated Financial Statements
Fair values of the derivative contracts recorded in the consolidated balance sheets as of
December 31, 2013
and 2012, are as follows:
|
|
Asset Derivatives
|
||||||||
|
|
|
Fair Value As Of
|
|||||||
|
(in thousands)
|
Balance Sheet Location
|
December 31, 2013
|
December 31, 2012
|
||||||
|
Derivatives not designated as hedging instruments
|
|||||||||
|
Forward contracts
|
Mark-to-market energy assets
|
$
|
196
|
|
$
|
182
|
|
||
|
Call Option
|
Mark-to-market energy assets
|
169
|
|
—
|
|
||||
|
Derivatives designated as fair value hedges
|
|||||||||
|
Call option
|
Mark-to-market energy assets
|
—
|
|
28
|
|
||||
|
Put option
|
Mark-to-market energy assets
|
20
|
|
—
|
|
||||
|
Total asset derivatives
|
$
|
385
|
|
$
|
210
|
|
|||
|
|
Liability Derivatives
|
||||||||
|
|
|
Fair Value As Of
|
|||||||
|
(in thousands)
|
Balance Sheet Location
|
December 31, 2013
|
December 31, 2012
|
||||||
|
Derivatives not designated as hedging instruments
|
|||||||||
|
Forward contracts
|
Mark-to-market energy liabilities
|
$
|
127
|
|
$
|
331
|
|
||
|
Total liability derivatives
|
$
|
127
|
|
$
|
331
|
|
|||
The effects of gains and losses from derivative instruments are as follows:
|
|
Amount of Gain (Loss) on Derivatives:
|
||||||||||||
|
|
Location of Gain
(Loss) on Derivatives
|
For the Year Ended December 31,
|
|||||||||||
|
(in thousands)
|
2013
|
2012
|
2011
|
||||||||||
|
Derivatives not designated as hedging instruments:
|
|||||||||||||
|
Unrealized gain (loss) on forward contracts
|
Revenue
|
$
|
217
|
|
$
|
(339
|
)
|
$
|
41
|
|
|||
|
Call Option
|
Cost of Sales
|
97
|
|
—
|
|
(23
|
)
|
||||||
|
Derivatives designated as fair value hedges:
|
|||||||||||||
|
Put/Call Option
|
Cost of Sales
|
(28
|
)
|
27
|
|
|
|
||||||
|
Put/Call Option
(1)
|
Propane Inventory
|
(100
|
)
|
(40
|
)
|
—
|
|
||||||
|
Total
|
$
|
186
|
|
$
|
(352
|
)
|
$
|
18
|
|
||||
|
(1)
|
As a fair value hedge with no ineffective portion, the unrealized gains and losses associated with this call option are recorded in cost of sales, offset by the corresponding change in the value of propane inventory (hedged item), which is also recorded in cost of sales. The amounts in cost of sales offset to zero and the unrealized gains and losses of this call option effectively changed the value of propane inventory.
|
The effects of trading activities on the consolidated statements of income are as follows:
|
|
Amount of Trading Revenue
|
||||||||||||
|
|
Location of Gain
|
For the Year Ended December 31,
|
|||||||||||
|
(in thousands)
|
(Loss) on Derivatives
|
2013
|
2012
|
2011
|
|||||||||
|
Realized gain on forward contracts and options
|
Revenue
|
$
|
1,127
|
|
$
|
2,695
|
|
$
|
2,215
|
|
|||
|
Unrealized gain (loss) on forward contracts
|
Revenue
|
217
|
|
(339
|
)
|
41
|
|
||||||
|
Total
|
$
|
1,344
|
|
$
|
2,356
|
|
$
|
2,256
|
|
||||
Chesapeake Utilities Corporation 2013 Form 10-K Page
74
Notes to the Consolidated Financial Statements
8. F
AIR
V
ALUE
OF
F
INANCIAL
I
NSTRUMENTS
GAAP establishes a fair value hierarchy that prioritizes the inputs to valuation methods used to measure fair value. The hierarchy gives the highest priority to unadjusted quoted prices in active markets for identical assets or liabilities (Level 1 measurements) and the lowest priority to unobservable inputs (Level 3 measurements). The three levels of the fair value hierarchy are the following:
Level 1: Unadjusted quoted prices in active markets that are accessible at the measurement date for identical, unrestricted assets or liabilities;
Level 2: Quoted prices in markets that are not active, or inputs which are observable, either directly or indirectly, for substantially the full term of the asset or liability; and
Level 3: Prices or valuation techniques requiring inputs that are both significant to the fair value measurement and unobservable (i.e. supported by little or no market activity).
Financial Assets and Liabilities Measured at Fair Value
The following table summarizes our financial assets and liabilities that are measured at fair value on a recurring basis and the fair value measurements, by level, within the fair value hierarchy as of
December 31, 2013
:
|
|
|
Fair Value Measurements Using:
|
|||||||||||||
|
(in thousands)
|
Fair Value
|
Quoted Prices in
Active Markets
(Level 1)
|
Significant Other
Observable
Inputs
(Level 2)
|
Significant
Unobservable
Inputs
(Level 3)
|
|||||||||||
|
Assets:
|
|||||||||||||||
|
Investments—guaranteed income fund
|
$
|
458
|
|
$
|
—
|
|
$
|
—
|
|
$
|
458
|
|
|||
|
Investments—other
|
$
|
2,640
|
|
$
|
2,640
|
|
$
|
—
|
|
$
|
—
|
|
|||
|
Mark-to-market energy assets, incl. put/call options
|
$
|
385
|
|
$
|
—
|
|
$
|
385
|
|
$
|
—
|
|
|||
|
Liabilities:
|
|||||||||||||||
|
Mark-to-market energy liabilities
|
$
|
127
|
|
|
|
$
|
127
|
|
$
|
—
|
|
||||
The following table summarizes our financial assets and liabilities that are measured at fair value on a recurring basis and the fair value measurements, by level, within the fair value hierarchy as of
December 31, 2012
:
|
|
|
Fair Value Measurements Using:
|
|||||||||||||
|
(in thousands)
|
Fair Value
|
Quoted Prices in Active Markets (Level 1)
|
Significant Other
Observable
Inputs
(Level 2)
|
Significant
Unobservable
Inputs
(Level 3)
|
|||||||||||
|
Assets:
|
|||||||||||||||
|
Investments—equity securities
|
$
|
2,007
|
|
$
|
2,007
|
|
$
|
—
|
|
$
|
—
|
|
|||
|
Investments—other
|
$
|
2,161
|
|
$
|
2,161
|
|
$
|
—
|
|
$
|
—
|
|
|||
|
Mark-to-market energy assets, including put option
|
$
|
210
|
|
$
|
—
|
|
$
|
210
|
|
$
|
—
|
|
|||
|
Liabilities:
|
|||||||||||||||
|
Mark-to-market energy liabilities
|
$
|
331
|
|
$
|
—
|
|
$
|
331
|
|
$
|
—
|
|
|||
Chesapeake Utilities Corporation 2013 Form 10-K Page
75
Notes to the Consolidated Financial Statements
The following table sets forth the summary of the changes in the fair value of Level 3 investments for the year ended
December 31, 2013
:
|
For the Year Ended December 31, 2013
|
|||
|
(in thousands)
|
|
||
|
Beginning Balance
|
$
|
—
|
|
|
Transfers in due to change in trustee
|
425
|
|
|
|
Purchases and adjustments
|
41
|
|
|
|
Transfers
|
(16
|
)
|
|
|
Investment income
|
8
|
|
|
|
Ending Balance
|
$
|
458
|
|
Investment income from the Level 3 investments is reflected in other income (loss) in the accompanying consolidated statements of income.
The following valuation techniques were used to measure fair value assets in the tables above on a recurring basis as of
December 31, 2013
and 2012:
Level 1 Fair Value Measurements:
Investments- equity securities
— The fair values of these trading securities are recorded at fair value based on unadjusted quoted prices in active markets for identical securities.
Investments- other
— The fair values of these investments, comprised of money market and mutual funds, are recorded at fair value based on quoted net asset values of the shares.
Level 2 Fair Value Measurements:
Mark-to-market energy assets and liabilities —
These forward contracts are valued using market transactions in either the listed or OTC markets.
Propane put/call option –
The fair value of the propane put/call option is valued using market transactions for similar assets and liabilities in either the listed or OTC markets.
Level 3 Fair Value Measurements:
Investments- guaranteed income fund
—The fair values of these investments are recorded at the contract value, which approximates their fair value.
At
December 31, 2013
, there were no non-financial assets or liabilities required to be reported at fair value. We review our non-financial assets for impairment at least on an annual basis, as required.
Other Financial Assets and Liabilities
Financial assets with carrying values approximating fair value include cash and cash equivalents and accounts receivable. Financial liabilities with carrying values approximating fair value include accounts payable and other accrued liabilities and short-term debt. The fair value of cash and cash equivalents is measured using the comparable value in the active market and approximates its carrying value (Level 1 measurement). The fair value of short-term debt approximates the carrying value due to its short maturities and because interest rates approximate current market rates (Level 3 measurement).
At
December 31, 2013
, long-term debt, which includes the current maturities but excludes a capital lease obligation, had a carrying value of
$122.0 million
, compared to a fair value of
$136.8 million
, using a discounted cash flow methodology that incorporates a market interest rate based on published corporate borrowing rates for debt instruments with similar terms and average maturities, adjusted for duration, optionality and risk profile. At
December 31, 2012
, long-term debt, which includes the current maturities of long-term debt, had a carrying value of
$110.1 million
, compared to the estimated fair value of
$133.2 million
. The valuation technique used to estimate the fair value of long-term debt would be considered a Level 3 measurement.
Chesapeake Utilities Corporation 2013 Form 10-K Page
76
Notes to the Consolidated Financial Statements
9. I
NVESTMENTS
The investment balances at
December 31, 2013
and 2012, consisted of the following:
|
As of December 31,
|
|||||||
|
(in thousands)
|
2013
|
2012
|
|||||
|
Rabbi trust associated with 401(k) SERP
|
$
|
2,991
|
|
$
|
2,116
|
|
|
|
Rabbi trust (associated with the deferred compensation plan)
|
107
|
|
39
|
|
|||
|
Investments in equity securities
|
—
|
|
2,013
|
|
|||
|
Total
|
$
|
3,098
|
|
$
|
4,168
|
|
|
We classify these investments as trading securities and report them at their fair value. For the years ended
December 31, 2013
, 2012 and 2011, we recorded net unrealized gains of
$489,000
,
$451,000
and
$282,000
, respectively, in other income in the consolidated statements of income related to these investments. We have also recorded an associated liability, which is included in other pension and benefit costs in the consolidated balance sheets and is adjusted each month for the gains and losses incurred by the Rabbi Trusts. During 2013, we sold our investments in equity securities, which resulted in
$702,000
of realized gain. We recorded
$438,000
of unrealized gain on these securities prior to 2013.
10. G
OODWILL
AND
O
THER
I
NTANGIBLE
A
SSETS
The carrying value of goodwill as of December 31, 2013 and 2012 was as follows:
|
As of December 31,
|
|||||||
|
(in thousands)
|
2013
|
2012
|
|||||
|
Regulated Energy segment
|
$
|
2,790
|
|
$
|
3,216
|
|
|
|
Unregulated Energy segment
|
1,564
|
|
874
|
|
|||
|
Total
|
$
|
4,354
|
|
$
|
4,090
|
|
|
Goodwill in the regulated energy segment is comprised of approximately
$2.5 million
from the FPU merger in October 2009,
$170,000
from the purchase of operating assets from IGC in August 2010 and
$150,000
from the purchase of Fort Meade in December 2013. During 2013, approximately
$576,000
of the
$746,000
goodwill that was originally recorded as a result of the IGC acquisition was reclassified to regulatory asset pursuant to the regulatory order which allowed recovery of the amount in rates. See
Note 18, Rates and Other Regulatory Activities
for further information. Goodwill in the unregulated energy segment is comprised of
$237,000
from the purchase of the operating assets of Austin Cox in June 2013,
$453,000
from the purchase of the operating assets of Glades in February 2013,
$200,000
from the purchase of the operating assets from Crescent in December 2011 and
$674,000
related to the premium paid by Sharp from its acquisitions in the late 1980s and 1990s.
We test for impairment of goodwill at least annually. The testing for 2013 and 2012 indicated no impairment of goodwill.
The carrying value and accumulated amortization of intangible assets subject to amortization as of
December 31, 2013
and 2012 are as follows:
|
As of December 31,
|
|||||||||||||||
|
|
2013
|
2012
|
|||||||||||||
|
(in thousands)
|
Gross
Carrying
Amount
|
Accumulated
Amortization
|
Gross
Carrying
Amount
|
Accumulated
Amortization
|
|||||||||||
|
Customer lists
|
$
|
3,993
|
|
$
|
1,389
|
|
$
|
3,693
|
|
$
|
1,067
|
|
|||
|
Non-Compete agreements
|
353
|
|
87
|
|
103
|
|
43
|
|
|||||||
|
Other
|
270
|
|
165
|
|
270
|
|
158
|
|
|||||||
|
Total
|
$
|
4,616
|
|
$
|
1,641
|
|
$
|
4,066
|
|
$
|
1,268
|
|
|||
The customer lists are intangible assets which were acquired in the purchases of the operating assets of Glades in February 2013, Virginia LP in February 2010 and the FPU merger in October 2009 and are being amortized over
seven
to
12
years. The non-compete agreements are intangible assets acquired in the purchase of the operating assets of Austin Cox in June 2013 and Virginia LP in February 2010 and are being amortized over a
seven
-year period. The other intangible assets consist of acquisition costs from our propane distribution acquisitions in the late 1980s and 1990s and are being amortized over
40 years
.
Chesapeake Utilities Corporation 2013 Form 10-K Page
77
Notes to the Consolidated Financial Statements
For the years ended
December 31, 2013
, 2012 and 2011, amortization expense of intangible assets was
$373,000
,
$329,000
and
$332,000
, respectively. Amortization expense of intangible assets is expected to be:
$400,000
for each year in 2014 and 2015,
$375,000
for 2016,
$373,000
for 2017, and
$344,000
for 2018.
11. I
NCOME
T
AXES
We file a consolidated federal income tax return. Income tax expense allocated to our subsidiaries is based upon their respective taxable incomes and tax credits. State income tax returns are filed on a separate company basis in most states where we have operations and/or are required to file.
The IRS performed its examination of Chesapeake's consolidated federal income tax return for 2009 and FPU's consolidated federal income tax return for 2008 and the period from January 1, 2009 to October 28, 2009 (the pre-merger period in 2009, during which FPU was required to file a separate federal income tax return). Both of the IRS examinations were completed in 2012 without any material findings.
The State of Florida performed its examination of Chesapeake’s state income tax returns for 2008, 2009 and 2010 and completed its examination in 2012 without any material findings.
The State of Texas is currently performing its examination of Chesapeake’s amended state tax return for 2007. We amended the 2007 Texas state tax return due to a change in the methodology used to calculate the gross receipts used to determine the Texas apportionment. This new methodology was used in Chesapeake’s Texas tax returns for all years after 2006. In 2012, we recorded a total liability of
$300,000
associated with the unrecognized tax benefit related to this change in methodology given the unknown outcome of this examination. We recorded this liability associated with the unrecognized tax benefit as an income tax payable, which reduced the income tax receivable in the accompanying balance sheets at December 31, 2013 and 2012.
We generated net operating losses of
$2.0 million
in 2011 for federal income tax purposes, primarily from increased book-to-tax timing differences authorized by The Tax Relief Unemployment Insurance Reauthorization, and Job Creation Act of 2010, which allowed bonus depreciation for certain assets. The federal net operating losses from 2011 were fully utilized in our 2012 federal income tax return. None of the federal net operating losses from 2011 remained at December 31, 2013. We also had state net operating losses of
$25.0 million
in various states as of December 31, 2013, almost all of which will expire in 2030. We have recorded a deferred tax asset of
$1.4 million
and
$1.6 million
related to the net operating loss carry-forwards at December 31, 2013 and 2012, respectively. We have not recorded a valuation allowance to reduce the future benefit of the tax net operating losses because we believe they will be fully utilized.
The following tables provide: (a) the components of income tax expense in 2013, 2012, and 2011; (b) the reconciliation between the statutory federal income tax rate and the effective income tax rate for 2013, 2012, and 2011; and (c) the components of accumulated deferred income tax assets and liabilities at December 31, 2013 and 2012.
|
For the Year Ended December 31,
|
|||||||||||
|
2013
|
2012
|
2011
|
|||||||||
|
(in thousands)
|
|
|
|
||||||||
|
Current Income Tax Expense
|
|||||||||||
|
Federal
|
$
|
4,882
|
|
$
|
3,483
|
|
$
|
—
|
|
||
|
State
|
2,382
|
|
1,990
|
|
742
|
|
|||||
|
Investment tax credit adjustments, net
|
(39
|
)
|
(58
|
)
|
(73
|
)
|
|||||
|
Total current income tax expense
|
7,225
|
|
5,415
|
|
669
|
|
|||||
|
Deferred Income Tax Expense
(1)
|
|||||||||||
|
Property, plant and equipment
|
16,758
|
|
13,688
|
|
16,670
|
|
|||||
|
Deferred gas costs
|
(209
|
)
|
515
|
|
591
|
|
|||||
|
Pensions and other employee benefits
|
(335
|
)
|
553
|
|
786
|
|
|||||
|
FPU merger related premium cost and deferred gain
|
(686
|
)
|
(509
|
)
|
—
|
|
|||||
|
Net operating loss carryforwards
|
62
|
|
740
|
|
(1,000
|
)
|
|||||
|
Other
|
(730
|
)
|
(1,106
|
)
|
273
|
|
|||||
|
Total deferred income tax expense
|
14,860
|
|
13,881
|
|
17,320
|
|
|||||
|
Total Income Tax Expense
|
$
|
22,085
|
|
$
|
19,296
|
|
$
|
17,989
|
|
||
Chesapeake Utilities Corporation 2013 Form 10-K Page
78
Notes to the Consolidated Financial Statements
|
Reconciliation of Effective Income Tax Rates
|
|||||||||||
|
Continuing Operations
|
|||||||||||
|
Federal income tax expense
(2)
|
$
|
19,205
|
|
$
|
16,745
|
|
$
|
16,146
|
|
||
|
State income taxes, net of federal benefit
|
3,105
|
|
2,571
|
|
2,216
|
|
|||||
|
ESOP dividend deduction
|
(256
|
)
|
(235
|
)
|
(236
|
)
|
|||||
|
Other
|
31
|
|
215
|
|
(137
|
)
|
|||||
|
Total Income Tax Expense
|
$
|
22,085
|
|
$
|
19,296
|
|
$
|
17,989
|
|
||
|
Effective Income Tax Rate
|
40.25
|
%
|
40.07
|
%
|
39.44
|
%
|
|||||
|
(1)
|
Includes
$2.1 million
,
$1.9 million
, and
$2.3 million
of deferred state income taxes for the years 2013, 2012 and 2011, respectively.
|
|
(2)
|
Federal income taxes were recorded at
35%
for each year represented.
|
|
As of December 31,
|
|||||||
|
2013
|
2012
|
||||||
|
(in thousands)
|
|
|
|||||
|
Deferred Income Taxes
|
|||||||
|
Deferred income tax liabilities:
|
|||||||
|
Property, plant and equipment
|
$
|
134,414
|
|
$
|
118,212
|
|
|
|
Acquisition adjustment
|
16,790
|
|
17,440
|
|
|||
|
Loss on reacquired debt
|
573
|
|
572
|
|
|||
|
Deferred gas costs
|
607
|
|
816
|
|
|||
|
Other
|
2,850
|
|
2,784
|
|
|||
|
Total deferred income tax liabilities
|
155,234
|
|
139,824
|
|
|||
|
Deferred income tax assets:
|
|||||||
|
Pension and other employee benefits
|
5,390
|
|
7,382
|
|
|||
|
Environmental costs
|
2,083
|
|
1,917
|
|
|||
|
Net operating loss carryforwards
|
1,444
|
|
1,587
|
|
|||
|
Self insurance
|
403
|
|
484
|
|
|||
|
Storm reserve liability
|
1,109
|
|
1,058
|
|
|||
|
Other
|
3,904
|
|
2,982
|
|
|||
|
Total deferred income tax assets
|
14,333
|
|
15,410
|
|
|||
|
Deferred Income Taxes Per Consolidated Balance Sheet
|
$
|
140,901
|
|
$
|
124,414
|
|
|
Chesapeake Utilities Corporation 2013 Form 10-K Page
79
Notes to the Consolidated Financial Statements
12. L
ONG
-
TERM
D
EBT
Our outstanding long-term debt is shown below:
|
As of December 31,
|
|||||||
|
2013
|
2012
|
||||||
|
(in thousands)
|
|
|
|||||
|
FPU secured first mortgage bonds:
|
|||||||
|
9.57% bond, due May 1, 2018
|
$
|
—
|
|
$
|
5,444
|
|
|
|
10.03% bond, due May 1, 2018
|
—
|
|
2,994
|
|
|||
|
9.08% bond, due June 1, 2022
|
7,967
|
|
7,962
|
|
|||
|
Uncollateralized senior notes:
|
|||||||
|
7.83% note, due January 1, 2015
|
2,000
|
|
4,000
|
|
|||
|
6.64% note, due October 31, 2017
|
10,909
|
|
13,636
|
|
|||
|
5.50% note, due October 12, 2020
|
14,000
|
|
16,000
|
|
|||
|
5.93% note, due October 31, 2023
|
30,000
|
|
30,000
|
|
|||
|
5.68% note, due June 30, 2026
|
29,000
|
|
29,000
|
|
|||
|
6.43% note, due May 2, 2028
|
7,000
|
|
—
|
|
|||
|
3.73% note, due December 16, 2028
|
20,000
|
|
—
|
|
|||
|
Convertible debentures:
|
|||||||
|
8.25% due March 1, 2014
|
646
|
|
942
|
|
|||
|
Promissory notes
|
445
|
|
125
|
|
|||
|
Capital lease obligation
|
6,978
|
|
—
|
|
|||
|
Total long-term debt
|
128,945
|
|
110,103
|
|
|||
|
Less: current maturities
|
(11,353
|
)
|
(8,196
|
)
|
|||
|
Total long-term debt, net of current maturities
|
$
|
117,592
|
|
$
|
101,907
|
|
|
Annual maturities and principal repayments of consolidated long-term debt, excluding the capital lease obligation, are as follows:
$10,504
for 2014;
$7,803
for 2015;
$7,798
for 2016;
$10,698
for 2017;
$7,971
for 2018 and
$77,226
thereafter. See Note 14, Lease obligations for future payments related to the capital lease obligation.
Secured First Mortgage Bonds
In May 2013, prior to their respective maturities and in conjunction with the issuance of the
Senior
Notes, which is further described later, we redeemed the
9.57 percent
and
10.03 percent
series of FPU’s first mortgage bonds. The difference between the carrying value of those bonds and the amount paid at redemption of
$93,000
was deferred as a regulatory asset. We are amortizing this difference over the remaining terms of these bonds as an adjustment to interest expense, as allowed by the Florida PSC.
FPU’s remaining secured first mortgage bonds are guaranteed by Chesapeake and are secured by a lien covering all of FPU’s property. FPU’s first mortgage bonds contain a restriction that limits the payment of dividends by FPU. It provides that FPU cannot make dividends or other restricted payments in excess of the sum of
$2.5 million
plus FPU’s consolidated net income accrued on and after January 1, 1992. As of December 31, 2013, FPU’s cumulative net income base was
$95.1 million
, offset by restricted payments of
$37.6 million
, leaving
$57.5 million
of cumulative net income for FPU free of restrictions pursuant to this covenant.
The dividend restrictions by FPU’s first mortgage bonds resulted in approximately
$53.3 million
of the net assets of our consolidated subsidiaries being restricted at December 31, 2013. This represents approximately
19 percent
of our consolidated net assets. Other than the dividend restrictions by FPU’s first mortgage bonds, there are no legal, contractual or regulatory restrictions on the net assets of our subsidiaries for the purposes of determining the disclosure of parent-only financial statements.
Uncollateralized Senior Notes
In September 2013, we entered into a Note Agreement with the Note Holders. Under the terms of the Note Agreement, we will issue
$70.0 million
in aggregate of unsecured Senior Notes to the Note Holders. In December 2013, we issued Series A Notes of unsecured Senior Notes, with an aggregate principal amount of
$20.0 million
, at a rate of
3.73 percent
. Series B Notes of the unsecured Senior Notes, with an aggregate principal amount of
$50.0 million
, will be issued in May 2014, at a rate of
3.88 percent
.
Chesapeake Utilities Corporation 2013 Form 10-K Page
80
Notes to the Consolidated Financial Statements
The proceeds received from the issuances of the Notes will be used to reduce our short-term borrowings under our lines of credit and to fund capital expenditures.
In June 2010, we entered into an agreement with Metropolitan Life Insurance Company and New England Life Insurance Company to issue up to
$36.0 million
of Chesapeake’s unsecured Senior Notes. In June 2011, we issued
$29.0 million
of
5.68 percent
unsecured Senior Notes to permanently finance the redemption of
two
series of FPU first mortgage bonds in 2010. On May 2, 2013, we issued an additional
$7.0 million
of
6.43 percent
unsecured senior notes under the same agreement.
All of our uncollateralized Senior Notes require periodic principal and interest payments as specified in each note. They also contain various restrictions. The most stringent restrictions state that we must maintain equity of at least
40 percent
of total capitalization, and the fixed charge coverage ratio must be at least
1.2
times. The most recent Senior Notes issued in December 2013 also contain a restriction that we must maintain an aggregate net book value in our regulated business assets of at least
50 percent
of our consolidated total assets. Failure to comply with those covenants could result in accelerated due dates and/or termination of the uncollateralized senior note agreements. As of December 31, 2013, we are in compliance with all of our debt covenants.
Most of Chesapeake’s uncollateralized Senior Notes contain a “Restricted Payments” covenant as defined in the Note agreements. The most restrictive covenants of this type are included within the
7.83 percent
Unsecured Senior Notes, due January 1, 2015. The covenant provides that we cannot pay or declare any dividends or make any other Restricted Payments in excess of the sum of
$10.0 million
, plus our consolidated net income accrued on and after January 1, 2001. As of December 31, 2013, the cumulative consolidated net income base was
$218.1 million
, offset by Restricted Payments of
$117.7 million
, leaving
$100.5 million
of cumulative net income free of restrictions
Convertible Debentures
Prior to the maturity in March 2014, the holders of outstanding Convertible Debentures had the option to convert them into shares of our common stock at a conversion price of
$17.01
per share. During 2013 and 2012, Convertible Debentures totaling
$296,000
and
$187,000
, respectively, were converted to stock. The Convertible Debentures were also redeemable for cash at the option of the holder, subject to an annual non-cumulative maximum limitation of
$200,000
. No Convertible Debentures were redeemed for cash in 2013. In 2012, Convertible Debentures totaling
$5,000
were redeemed for cash. Subsequent to December 31, 2013, Convertible Debentures totaling
$537,000
were converted to stock and
$109,000
were redeemed for cash. As of March 1, 2014, we no longer have any outstanding Convertible Debentures.
13. S
HORT
-
TERM
B
ORROWINGS
At
December 31, 2013
and 2012, we had
$105.7 million
and
$61.2 million
, respectively, of short-term borrowings outstanding through
five
unsecured bank credit facilities with
two
financial institutions totaling
$165.0 million
. The annual weighted average interest rates on our short-term borrowings were
1.26 percent
and
1.48 percent
for 2013 and 2012, respectively. We incurred commitment fees of
$56,000
and
$73,000
in 2013 and 2012, respectively.
Chesapeake Utilities Corporation 2013 Form 10-K Page
81
Notes to the Consolidated Financial Statements
|
Outstanding borrowings at
|
||||||||||||||
|
(in thousands)
|
Total Facility
|
Interest Rate
|
Expiration Date
|
December 31, 2013
|
December 31, 2012
|
Available at December 31, 2013
|
||||||||
|
Bank revolving credit
|
||||||||||||||
|
Facility A
|
||||||||||||||
|
Committed
|
$
|
55,000
|
|
LIBOR plus 1.25 percent
|
June 28, 2014
|
$
|
35,000
|
|
$
|
30,000
|
|
$
|
20,000
|
|
|
Uncommitted
|
20,000
|
|
Rate offered by the bank
|
June 28, 2014
|
—
|
|
—
|
|
20,000
|
|
||||
|
Bank revolving credit
|
||||||||||||||
|
Facility B
|
||||||||||||||
|
Committed
|
30,000
|
|
LIBOR plus 1.25 percent
(1)
|
October 31, 2014
|
17,554
|
|
16,421
|
|
12,446
|
|
||||
|
Uncommitted
(2)
|
20,000
|
|
Rate offered by the bank
|
October 31, 2014
|
10,000
|
|
—
|
|
10,000
|
|
||||
|
Short-term revolving credit Note
|
40,000
|
|
LIBOR plus 0.80 percent
(3)
|
October 31, 2014
|
40,000
|
|
10,000
|
|
—
|
|
||||
|
Total short term credit facilities
|
$
|
165,000
|
|
$
|
102,554
|
|
$
|
56,421
|
|
$
|
62,446
|
|
||
|
Book overdrafts
(4)
|
3,112
|
|
4,778
|
|
||||||||||
|
Total short-term borrowing
|
$
|
105,666
|
|
$
|
61,199
|
|
||||||||
(1)
This facility bears interest at LIBOR for the applicable period plus
1.25
percent, if requested three days prior to the advance date. If requested and
advanced on the same day, this facility bears interest at a base rate plus
1.25
percent.
(2)
We have issued
$4.7 million
in letters of credit under this credit facility as of December 31, 2013. There have been no draws on these letters of credit
and we do not anticipate that they will be drawn upon by the counter-parties. We expect that the letters of credit will be renewed to the
extent necessary in the future.
(3)
At our discretion, the borrowings under this facility can bear interest at the lender's base rate plus
0.80
percent.
(4)
If presented, these book overdrafts would be funded through the bank revolving credit facilities.
These bank credit facilities are available to provide funds for our short-term cash needs to meet seasonal working capital requirements and to temporarily fund portions of our capital expenditures. Advances offered under the uncommitted lines of credit are subject to the discretion of the banks. We are currently authorized by our Board of Directors to borrow up to
$140.0 million
of short-term debt, as required, from these short-term lines of credit.
The availability of funds under our credit facilities is subject to conditions specified in the respective credit agreements, all of which we currently satisfy. These conditions include our compliance with financial covenants and the continued accuracy of representations and warranties contained in these agreements. We are required by the financial covenants in our revolving credit facilities to maintain, at the end of each fiscal year:
|
•
|
a funded indebtedness ratio of no greater than
65 percent
; and
|
|
•
|
a fixed charge coverage ratio of at least
1.20
to
1.0
.
|
We are in compliance with all of our debt covenants.
14. L
EASE
O
BLIGATIONS
We have entered into several operating lease arrangements for office space, equipment and pipeline facilities. Rent expense related to these leases for 2013, 2012 and 2011 was
$1.6 million
,
$1.4 million
and
$1.1 million
, respectively. Future minimum payments under our current lease agreements for the years 2014 through 2018 are
$1.2 million
,
$1.1 million
,
$851,000
,
$446,000
and
$419,000
, respectively; and approximately
$2.7 million
thereafter, with an aggregate total of approximately
$6.8 million
.
For the year ended December 31, 2013, we paid
$292,000
for a capital lease arrangement related to Sandpiper's capacity, supply and operating agreement. See
Note 4, Acquisitions
for additional information. Future minimum payments under this lease arrangement are
$1.1 million
for 2014;
$1.5 million
for each year from 2015 through 2018; and
$625,000
thereafter, with an aggregate total of
$7.7 million
.
Chesapeake Utilities Corporation 2013 Form 10-K Page
82
Notes to the Consolidated Financial Statements
15. A
CCUMULATED
O
THER
C
OMPREHENSIVE
I
NCOME
(L
OSS
)
The following table presents the changes in the balance of accumulated other comprehensive income (loss) for the year ended
December 31, 2013
. Defined benefit pension and postretirement plan items are the only component of our accumulated comprehensive income (loss). All amounts in the following table are presented net of tax.
|
For the Year Ended December 31, 2013
|
||||
|
(in thousands)
|
||||
|
Beginning balance
|
$
|
(5,062
|
)
|
|
|
Other comprehensive income before reclassifications
|
2,251
|
|
||
|
Amounts reclassified from accumulated other comprehensive loss
|
278
|
|
||
|
Net current-period other comprehensive income
|
2,529
|
|
||
|
Ending balance
|
$
|
(2,533
|
)
|
|
The following table presents amounts reclassified out of accumulated other comprehensive loss for the year ended
December 31, 2013
.
|
For the Year Ended December 31, 2013
|
||||
|
(in thousands)
|
||||
|
Amortization of defined benefit pension and postretirement plan items:
|
||||
|
Prior service cost
(1)
|
$
|
60
|
|
|
|
Net gain
(1)
|
(523
|
)
|
||
|
Total before tax
|
(463
|
)
|
||
|
Tax cost
|
185
|
|
||
|
Benefit, net of tax
|
$
|
(278
|
)
|
|
|
(1)
|
These amounts are included in the computation of net periodic benefits See
|
Amortization of defined benefit pension and postretirement plan items are included in operations expense in the accompanying consolidated statements of income. Tax cost is included in income tax expense in the accompanying consolidated statements of income.
16. E
MPLOYEE
B
ENEFIT
P
LANS
We measure the assets and obligations of the defined benefit pension plans and other postretirement benefits plans to determine the plans’ funded status as of the end of the year as an asset or a liability on our consolidated balance sheets. We record as a component of other comprehensive income/loss or a regulatory asset the changes in funded status that occurred during the year that are not recognized as part of net periodic benefit costs.
Defined Benefit Pension Plans
We sponsor
three
defined benefit pension plans: the Chesapeake Pension Plan, the FPU Pension Plan and the Chesapeake SERP.
The Chesapeake Pension Plan was closed to new participants effective January 1, 1999, and was frozen with respect to additional years of service and additional compensation effective January 1, 2005. Benefits under the Chesapeake Pension Plan were based on each participant’s years of service and highest average compensation, prior to the freezing of the plan.
The FPU Pension Plan covers eligible FPU non-union employees hired before January 1, 2005 and union employees hired before the respective union contract expiration dates in 2005 and 2006. Prior to the merger, the FPU Pension Plan was frozen with respect to additional years of service and additional compensation, effective December 31, 2009.
The Chesapeake SERP was frozen with respect to additional years of service and additional compensation as of December 31, 2004. Benefits under the Chesapeake SERP were based on each participant’s years of service and highest average compensation, prior to the freezing of the plan.
Chesapeake Utilities Corporation 2013 Form 10-K Page
83
In January 2011, a former executive officer retired and received lump-sum pension distributions of
$844,000
and
$765,000
from the Chesapeake Pension Plan and Chesapeake SERP, respectively. In connection with these lump-sum payment distributions, we recorded
$436,000
in pension settlement losses in addition to the net benefit cost in 2011. Based upon the current funding status of the Chesapeake Pension Plan, which does not meet or exceed
110 percent
of the benefit obligation as required per the Department of Labor regulations, our former executive officer was required to deposit property equal to
125 percent
of the restricted portion of his lump sum distribution into an escrow. Each year, an amount equal to the value of payments that would have been paid to him if he had elected the life annuity form of distribution will become unrestricted. Property equal to the life annuity amount will be returned to him from the escrow account. These same regulations will apply to the top 20 highest compensated employees taking distributions from the Pension Plan.
The following schedule sets forth the funded status at
December 31, 2013
and 2012 and the net periodic cost for the years ended
December 31, 2013
, 2012 and 2011 for the Chesapeake and FPU Pension Plans:
|
|
Chesapeake
Pension Plan
|
FPU
Pension Plan
|
|||||||||||||
|
At December 31,
|
2013
|
2012
|
2013
|
2012
|
|||||||||||
|
(in thousands)
|
|
|
|
|
|||||||||||
|
Change in benefit obligation:
|
|||||||||||||||
|
Benefit obligation — beginning of year
|
$
|
11,933
|
|
$
|
11,672
|
|
$
|
64,512
|
|
$
|
57,999
|
|
|||
|
Interest cost
|
405
|
|
458
|
|
2,367
|
|
2,577
|
|
|||||||
|
Actuarial loss (gain)
|
(1,092
|
)
|
726
|
|
(8,007
|
)
|
6,915
|
|
|||||||
|
Benefits paid
|
(978
|
)
|
(923
|
)
|
(2,996
|
)
|
(2,979
|
)
|
|||||||
|
Benefit obligation — end of year
|
10,268
|
|
11,933
|
|
55,876
|
|
64,512
|
|
|||||||
|
Change in plan assets:
|
|||||||||||||||
|
Fair value of plan assets — beginning of year
|
8,430
|
|
7,162
|
|
41,954
|
|
37,836
|
|
|||||||
|
Actual return on plan assets
|
967
|
|
849
|
|
4,747
|
|
4,526
|
|
|||||||
|
Employer contributions
|
324
|
|
1,342
|
|
632
|
|
2,571
|
|
|||||||
|
Benefits paid
|
(978
|
)
|
(923
|
)
|
(2,996
|
)
|
(2,979
|
)
|
|||||||
|
Fair value of plan assets — end of year
|
8,743
|
|
8,430
|
|
44,337
|
|
41,954
|
|
|||||||
|
Reconciliation:
|
|||||||||||||||
|
Funded status
|
(1,525
|
)
|
(3,503
|
)
|
(11,539
|
)
|
(22,558
|
)
|
|||||||
|
Accrued pension cost
|
$
|
(1,525
|
)
|
$
|
(3,503
|
)
|
$
|
(11,539
|
)
|
$
|
(22,558
|
)
|
|||
|
Assumptions:
|
|||||||||||||||
|
Discount rate
|
4.25
|
%
|
3.50
|
%
|
4.75
|
%
|
3.75
|
%
|
|||||||
|
Expected return on plan assets
|
6.00
|
%
|
6.00
|
%
|
7.00
|
%
|
7.00
|
%
|
|||||||
Chesapeake Utilities Corporation 2013 Form 10-K Page
84
|
Chesapeake
Pension Plan |
FPU
Pension Plan |
||||||||||||||||||||||
|
For the Years Ended December 31,
|
2013
|
2012
|
2011
|
2013
|
2012
|
2011
|
|||||||||||||||||
|
(in thousands)
|
|
|
|
|
|
|
|||||||||||||||||
|
Components of net periodic pension cost:
|
|||||||||||||||||||||||
|
Interest cost
|
$
|
405
|
|
$
|
458
|
|
$
|
520
|
|
$
|
2,367
|
|
$
|
2,577
|
|
$
|
2,695
|
|
|||||
|
Expected return on assets
|
(486
|
)
|
(418
|
)
|
(424
|
)
|
(2,866
|
)
|
(2,627
|
)
|
(2,783
|
)
|
|||||||||||
|
Amortization of prior service cost
|
(1
|
)
|
(5
|
)
|
(5
|
)
|
—
|
|
—
|
|
—
|
|
|||||||||||
|
Amortization of actuarial loss
|
322
|
|
255
|
|
156
|
|
330
|
|
196
|
|
—
|
|
|||||||||||
|
Net periodic pension cost
|
240
|
|
290
|
|
247
|
|
(169
|
)
|
146
|
|
(88
|
)
|
|||||||||||
|
Settlement expense
|
—
|
|
—
|
|
217
|
|
—
|
|
—
|
|
—
|
|
|||||||||||
|
Amortization of pre-merger regulatory asset
|
—
|
|
—
|
|
—
|
|
761
|
|
761
|
|
761
|
|
|||||||||||
|
Total periodic cost
|
$
|
240
|
|
$
|
290
|
|
$
|
464
|
|
$
|
592
|
|
$
|
907
|
|
$
|
673
|
|
|||||
|
Assumptions:
|
|||||||||||||||||||||||
|
Discount rate
|
3.50
|
%
|
4.25
|
%
|
5.00
|
%
|
3.75
|
%
|
4.50
|
%
|
5.25
|
%
|
|||||||||||
|
Expected return on plan assets
|
6.00
|
%
|
6.00
|
%
|
6.00
|
%
|
7.00
|
%
|
7.00
|
%
|
7.00
|
%
|
|||||||||||
Included in the net periodic costs for the FPU Pension Plan is continued amortization of the FPU pension regulatory asset, which represents the portion attributable to FPU's regulated operations of the changes in funded status that occurred but were not recognized as part of net periodic cost prior to the merger with Chesapeake in October 2009. This was previously deferred as a regulatory asset by FPU prior to the merger to be recovered through rates pursuant to an order by the Florida PSC. The unamortized balance of this regulatory asset was
$4.3 million
and
$5.1 million
at
December 31, 2013
and 2012, respectively.
Chesapeake Utilities Corporation 2013 Form 10-K Page
85
The following sets forth the funded status at
December 31, 2013
and 2012 and the net periodic cost for the years ended
December 31, 2013
, 2012 and 2011 for the Chesapeake SERP:
|
At December 31,
|
2013
|
2012
|
|||||
|
(in thousands)
|
|
|
|||||
|
Change in benefit obligation:
|
|||||||
|
Benefit obligation — beginning of year
|
$
|
2,352
|
|
$
|
2,160
|
|
|
|
Interest cost
|
81
|
|
90
|
|
|||
|
Actuarial loss (gain)
|
(134
|
)
|
191
|
|
|||
|
Benefits paid
|
(89
|
)
|
(89
|
)
|
|||
|
Benefit obligation — end of year
|
2,210
|
|
2,352
|
|
|||
|
Change in plan assets:
|
|||||||
|
Fair value of plan assets — beginning of year
|
|||||||
|
Employer contributions
|
89
|
|
89
|
|
|||
|
Benefits paid
|
(89
|
)
|
(89
|
)
|
|||
|
Fair value of plan assets — end of year
|
—
|
|
—
|
|
|||
|
Reconciliation:
|
|||||||
|
Funded status
|
(2,210
|
)
|
(2,352
|
)
|
|||
|
Accrued pension cost
|
$
|
(2,210
|
)
|
$
|
(2,352
|
)
|
|
|
Assumptions:
|
|||||||
|
Discount rate
|
4.25
|
%
|
3.50
|
%
|
|||
|
For the Years Ended December 31,
|
2013
|
2012
|
2011
|
||||||||
|
(in thousands)
|
|
|
|
||||||||
|
Components of net periodic pension cost:
|
|||||||||||
|
Interest cost
|
$
|
81
|
|
$
|
90
|
|
$
|
107
|
|
||
|
Amortization of prior service cost
|
19
|
|
19
|
|
19
|
|
|||||
|
Amortization of actuarial loss
|
64
|
|
46
|
|
38
|
|
|||||
|
Net periodic pension cost
|
164
|
|
155
|
|
164
|
|
|||||
|
Settlement expense
|
—
|
|
—
|
|
219
|
|
|||||
|
Total periodic cost
|
$
|
164
|
|
$
|
155
|
|
$
|
383
|
|
||
|
Assumptions:
|
|||||||||||
|
Discount rate
|
3.50
|
%
|
4.25
|
%
|
5.00
|
%
|
|||||
Our funding policy provides that payments to the trustee of each qualified plan shall be equal to at least the minimum funding requirements of the Employee Retirement Income Security Act of 1974. The following schedule summarizes the assets of the Chesapeake Pension Plan and the FPU Pension Plan, by investment type, at December 31, 2013, 2012 and 2011:
|
|
Chesapeake
Pension Plan |
FPU
Pension Plan |
|||||||||||||||
|
At December 31,
|
2013
|
2012
|
2011
|
2013
|
2012
|
2011
|
|||||||||||
|
Asset Category
|
|||||||||||||||||
|
Equity securities
|
54.40
|
%
|
52.07
|
%
|
51.75
|
%
|
55.02
|
%
|
52.81
|
%
|
51.98
|
%
|
|||||
|
Debt securities
|
36.54
|
%
|
38.00
|
%
|
37.88
|
%
|
36.54
|
%
|
38.04
|
%
|
38.05
|
%
|
|||||
|
Other
|
9.06
|
%
|
9.93
|
%
|
10.37
|
%
|
8.44
|
%
|
9.15
|
%
|
9.97
|
%
|
|||||
|
Total
|
100.00
|
%
|
100.00
|
%
|
100.00
|
%
|
100.00
|
%
|
100.00
|
%
|
100.00
|
%
|
|||||
The investment policy of both the Chesapeake and FPU Pension Plans is designed to provide the capital assets necessary to meet the financial obligations of the plans. The investment goals and objectives are to achieve investment returns that, together with contributions, will provide funds adequate to pay promised benefits to present and future beneficiaries of the plans, earn a long-term investment return in excess of the growth of the Plans’ retirement liabilities, minimize pension expense and cumulative
Chesapeake Utilities Corporation 2013 Form 10-K Page
86
contributions resulting from liability measurement and asset performance, and maintain a diversified portfolio to reduce the risk of large losses.
The following allocation range of asset classes is intended to produce a rate of return sufficient to meet the Plans’ goals and objectives:
|
Asset Allocation Strategy
|
|||||
|
Asset Class
|
Minimum
Allocation Percentage |
Maximum
Allocation Percentage |
|||
|
Domestic Equities (Large Cap, Mid Cap and Small Cap)
|
14
|
%
|
32
|
%
|
|
|
Foreign Equities (Developed and Emerging Markets)
|
13
|
%
|
25
|
%
|
|
|
Fixed Income (Inflation Bond and Taxable Fixed)
|
26
|
%
|
40
|
%
|
|
|
Alternative Strategies (Long/Short Equity and Hedge Fund of Funds)
|
6
|
%
|
14
|
%
|
|
|
Diversifying Assets (High Yield Fixed Income, Commodities, and Real Estate)
|
7
|
%
|
19
|
%
|
|
|
Cash
|
0
|
%
|
5
|
%
|
|
Due to periodic contributions and different asset classes producing varying returns, the actual asset values may temporarily move outside of the intended ranges. The investments are monitored on a quarterly basis, at a minimum, for asset allocation and performance.
At
December 31, 2013
, the assets of the Chesapeake Pension Plan and the FPU Pension Plan were comprised of the following investments:
|
|
Fair Value Measurement Hierarchy
|
|
|||||||||||||
|
Asset Category
|
Level 1
|
Level 2
|
Level 3
|
Total
|
|||||||||||
|
(in thousands)
|
|
|
|
|
|||||||||||
|
Equity securities
|
|||||||||||||||
|
U.S. Large Cap
(1)
|
$
|
3,964
|
|
$
|
4,118
|
|
$
|
—
|
|
$
|
8,082
|
|
|||
|
U.S. Mid Cap
(1)
|
—
|
|
3,412
|
|
—
|
|
3,412
|
|
|||||||
|
U.S. Small Cap
(1)
|
—
|
|
1,736
|
|
—
|
|
1,736
|
|
|||||||
|
International
(2)
|
10,687
|
|
—
|
|
—
|
|
10,687
|
|
|||||||
|
Alternative Strategies
(3)
|
5,235
|
|
—
|
|
—
|
|
5,235
|
|
|||||||
|
19,886
|
|
9,266
|
|
—
|
|
29,152
|
|
||||||||
|
Debt securities
|
|||||||||||||||
|
Inflation Protected
(4)
|
2,462
|
|
—
|
|
—
|
|
2,462
|
|
|||||||
|
Fixed income
(5)
|
—
|
|
14,305
|
|
—
|
|
14,305
|
|
|||||||
|
High Yield
(5)
|
—
|
|
2,629
|
|
—
|
|
2,629
|
|
|||||||
|
2,462
|
|
16,934
|
|
—
|
|
19,396
|
|
||||||||
|
Other
|
|||||||||||||||
|
Commodities
(6)
|
1,939
|
|
—
|
|
—
|
|
1,939
|
|
|||||||
|
Real Estate
(7)
|
1,991
|
|
—
|
|
—
|
|
1,991
|
|
|||||||
|
Guaranteed deposit
(8)
|
—
|
|
—
|
|
602
|
|
602
|
|
|||||||
|
3,930
|
|
—
|
|
602
|
|
4,532
|
|
||||||||
|
Total Pension Plan Assets
|
$
|
26,278
|
|
$
|
26,200
|
|
$
|
602
|
|
$
|
53,080
|
|
|||
Chesapeake Utilities Corporation 2013 Form 10-K Page
87
|
(1)
|
Includes funds that invest primarily in United States common stocks.
|
|
(2)
|
Includes funds that invest primarily in foreign equities and emerging markets equities.
|
|
(3)
|
Includes funds that actively invest in both equity and debt securities, funds that sell short securities and funds that
provide long-term capital appreciation. The funds may invest in debt securities below investment grade.
|
|
(4)
|
Includes funds that invest primarily in inflation-indexed bonds issued by the U.S. government.
|
|
(5)
|
Includes funds that invest in investment grade and fixed income securities.
|
|
(6)
|
Includes funds that invest primarily in commodity-linked derivative instruments and fixed income securities.
|
|
(7)
|
Includes funds that invest primarily in real estate.
|
|
(8)
|
Includes investment in a group annuity product issued by an insurance company.
|
At
December 31, 2012
, the assets of the Chesapeake Pension Plan and the FPU Pension Plan were comprised of the following investments:
|
|
Fair Value Measurement Hierarchy
|
|
|||||||||||||
|
Asset Category
|
Level 1
|
Level 2
|
Level 3
|
Total
|
|||||||||||
|
(in thousands)
|
|
|
|
|
|||||||||||
|
Equity securities
|
|||||||||||||||
|
U.S. Large Cap
(1)
|
$
|
3,504
|
|
$
|
3,443
|
|
$
|
—
|
|
$
|
6,947
|
|
|||
|
U.S. Mid Cap
(1)
|
—
|
|
3,078
|
|
—
|
|
3,078
|
|
|||||||
|
U.S. Small Cap
(1)
|
—
|
|
1,523
|
|
—
|
|
1,523
|
|
|||||||
|
International
(2)
|
10,019
|
|
—
|
|
—
|
|
10,019
|
|
|||||||
|
Alternative Strategies
(3)
|
4,978
|
|
—
|
|
—
|
|
4,978
|
|
|||||||
|
18,501
|
|
8,044
|
|
—
|
|
26,545
|
|
||||||||
|
Debt securities
|
|||||||||||||||
|
Inflation Protected
(4)
|
2,507
|
|
—
|
|
—
|
|
2,507
|
|
|||||||
|
Fixed income
(5)
|
—
|
|
14,109
|
|
—
|
|
14,109
|
|
|||||||
|
High Yield
(5)
|
—
|
|
2,547
|
|
—
|
|
2,547
|
|
|||||||
|
2,507
|
|
16,656
|
|
—
|
|
19,163
|
|
||||||||
|
Other
|
|||||||||||||||
|
Commodities
(6)
|
1,918
|
|
—
|
|
—
|
|
1,918
|
|
|||||||
|
Real Estate
(7)
|
2,048
|
|
—
|
|
—
|
|
2,048
|
|
|||||||
|
Guaranteed deposit
(8)
|
—
|
|
—
|
|
710
|
|
710
|
|
|||||||
|
3,966
|
|
—
|
|
710
|
|
4,676
|
|
||||||||
|
Total Pension Plan Assets
|
$
|
24,974
|
|
$
|
24,700
|
|
$
|
710
|
|
$
|
50,384
|
|
|||
|
(1)
|
Includes funds that invest primarily in United States common stocks.
|
|
(2)
|
Includes funds that invest primarily in foreign equities and emerging markets equities.
|
|
(3)
|
Includes funds that actively invest in both equity and debt securities, funds that sell short securities and funds that provide long-term capital
appreciation. The funds may invest in debt securities below investment grade.
|
|
(4)
|
Includes funds that invest primarily in inflation-indexed bonds issued by the U.S. government.
|
|
(5)
|
Includes funds that invest in investment grade and fixed income securities.
|
|
(6)
|
Includes funds that invest primarily in commodity-linked derivative instruments and fixed income securities.
|
|
(7)
|
Includes funds that invest primarily in real estate.
|
|
(8)
|
Includes investment in a group annuity product issued by an insurance company.
|
At
December 31, 2013
and 2012, all of the investments classified under Level 1 of the fair value measurement hierarchy were recorded at fair value based on unadjusted quoted prices in active markets for identical investments. The Level 2 investments were recorded at fair value based on net asset value per unit of the investments, which used significant observable inputs although those investments were not traded publicly and did not have quoted market prices in active markets. The Level 3 investments were guaranteed deposit accounts, which were valued based on the liquidation value of those accounts, including the effect of the balance and interest guarantee and liquidation restriction.
Chesapeake Utilities Corporation 2013 Form 10-K Page
88
The following table sets forth the summary of the changes in the fair value of Level 3 investments for the years ended
December 31, 2013
and 2012:
|
For the Year Ended December 31,
|
|||||||
|
2013
|
2012
|
||||||
|
(in thousands)
|
|
|
|||||
|
Balance, beginning of year
|
$
|
710
|
|
$
|
897
|
|
|
|
Purchases
|
618
|
|
79
|
|
|||
|
Transfers in
|
3,175
|
|
3,620
|
|
|||
|
Disbursements
|
(3,966
|
)
|
(3,902
|
)
|
|||
|
Investment income
|
65
|
|
16
|
|
|||
|
Balance, end of year
|
$
|
602
|
|
$
|
710
|
|
|
Other Postretirement Benefits Plans
We sponsor two defined benefit plans: the Chesapeake Postretirement Plan and the FPU Medical Plan. In March 2011, new plan provisions for the FPU Medical Plan were adopted in a continuing effort to standardize FPU’s benefits with those offered by Chesapeake. The new plan provisions, which became effective January 1, 2012, require eligible employees retiring in 2012 through 2014 to pay a portion of the total benefit costs based on the year they retire. Participants retiring in 2015 and after will be required to pay the full benefit costs associated with participation in the FPU Medical Plan. The change in the FPU Medical Plan resulted in a curtailment gain of
$892,000
. Since we determined that the non-recurring gain resulted from the FPU merger and the related integration, we determined that the appropriate accounting treatment for the portion of the gain allocated to FPU's regulated operations prescribed deferral as a regulatory liability and amortization over a future period, as specified by the Florida PSC. We recorded
$170,000
of this curtailment gain which was allocated to FPU's unregulated operations in 2012. We deferred
$722,000
of this curtailment gain and included it as a regulatory liability.
Chesapeake Utilities Corporation 2013 Form 10-K Page
89
The following sets forth the funded status at
December 31, 2013
and 2012 and the net periodic cost for the years ended
December 31, 2013
, 2012, and 2011:
|
Chesapeake
Postretirement Plan |
FPU
Medical Plan |
||||||||||||||
|
At December 31,
|
2013
|
2012
|
2013
|
2012
|
|||||||||||
|
(in thousands)
|
|
|
|
|
|||||||||||
|
Change in benefit obligation:
|
|||||||||||||||
|
Benefit obligation — beginning of year
|
$
|
1,415
|
|
$
|
1,396
|
|
$
|
1,774
|
|
$
|
4,081
|
|
|||
|
Service cost
|
—
|
|
—
|
|
—
|
|
1
|
|
|||||||
|
Interest cost
|
47
|
|
55
|
|
63
|
|
79
|
|
|||||||
|
Plan participants contributions
|
92
|
|
111
|
|
104
|
|
92
|
|
|||||||
|
Curtailment gain
|
—
|
|
—
|
|
—
|
|
(2,651
|
)
|
|||||||
|
Actuarial loss (gain)
|
(108
|
)
|
39
|
|
(165
|
)
|
500
|
|
|||||||
|
Benefits paid
|
(184
|
)
|
(186
|
)
|
(257
|
)
|
(328
|
)
|
|||||||
|
Benefit obligation — end of year
|
1,262
|
|
1,415
|
|
1,519
|
|
1,774
|
|
|||||||
|
Change in plan assets:
|
|||||||||||||||
|
Fair value of plan assets — beginning of year
|
—
|
|
—
|
|
—
|
|
—
|
|
|||||||
|
Employer contributions
(1)
|
92
|
|
75
|
|
153
|
|
236
|
|
|||||||
|
Plan participants contributions
|
92
|
|
111
|
|
104
|
|
92
|
|
|||||||
|
Benefits paid
|
(184
|
)
|
(186
|
)
|
(257
|
)
|
(328
|
)
|
|||||||
|
Fair value of plan assets — end of year
|
—
|
|
—
|
|
—
|
|
—
|
|
|||||||
|
Reconciliation:
|
|||||||||||||||
|
Funded status
|
(1,262
|
)
|
(1,415
|
)
|
(1,519
|
)
|
(1,774
|
)
|
|||||||
|
Accrued postretirement cost
|
$
|
(1,262
|
)
|
$
|
(1,415
|
)
|
$
|
(1,519
|
)
|
$
|
(1,774
|
)
|
|||
|
Assumptions:
|
|||||||||||||||
|
Discount rate
|
4.25
|
%
|
3.50
|
%
|
4.75
|
%
|
3.75
|
%
|
|||||||
|
(1)
|
Chesapeake’s Postretirement Plan does not receive a Medicare Part-D subsidy. The FPU Medical Plan did not receive a significant subsidy for the post-merger period.
|
Chesapeake Utilities Corporation 2013 Form 10-K Page
90
Net periodic postretirement benefit costs for 2013, 2012, and 2011 include the following components:
|
Chesapeake
Postretirement Plan |
FPU
Medical Plan |
||||||||||||||||||||||
|
For the Years Ended December 31,
|
2013
|
2012
|
2011
|
2013
|
2012
|
2011
|
|||||||||||||||||
|
(in thousands)
|
|
|
|
|
|
|
|||||||||||||||||
|
Components of net periodic postretirement cost:
|
|||||||||||||||||||||||
|
Service cost
|
$
|
—
|
|
$
|
—
|
|
$
|
—
|
|
$
|
—
|
|
$
|
1
|
|
$
|
125
|
|
|||||
|
Interest cost
|
47
|
|
55
|
|
64
|
|
63
|
|
79
|
|
176
|
|
|||||||||||
|
Amortization of:
|
|||||||||||||||||||||||
|
Actuarial loss
|
74
|
|
73
|
|
67
|
|
—
|
|
—
|
|
55
|
|
|||||||||||
|
Prior service cost
|
(77
|
)
|
(77
|
)
|
(77
|
)
|
—
|
|
—
|
|
—
|
|
|||||||||||
|
Net periodic cost
|
$
|
44
|
|
$
|
51
|
|
$
|
54
|
|
$
|
63
|
|
$
|
80
|
|
$
|
356
|
|
|||||
|
Curtailment gain
|
—
|
|
—
|
|
—
|
|
—
|
|
(892
|
)
|
—
|
|
|||||||||||
|
Amortization of pre-merger regulatory asset
|
—
|
|
—
|
|
—
|
|
8
|
|
8
|
|
8
|
|
|||||||||||
|
Net periodic cost
|
$
|
44
|
|
$
|
51
|
|
$
|
54
|
|
$
|
71
|
|
$
|
(804
|
)
|
$
|
364
|
|
|||||
|
Assumptions
|
|||||||||||||||||||||||
|
Discount rate
|
3.50
|
%
|
4.25
|
%
|
5.00
|
%
|
3.75
|
%
|
4.50
|
%
|
5.25
|
%
|
|||||||||||
Similar to the FPU Pension Plan, continued amortization of the FPU postretirement benefit regulatory asset related to the unrecognized cost prior to the merger with Chesapeake was included in the net periodic cost. The unamortized balance of this regulatory asset was
$54,000
and
$62,000
at
December 31, 2013
and 2012, respectively.
The following table presents the amounts not yet reflected in net periodic benefit cost and included in accumulated other comprehensive income/loss or as a regulatory asset as of
December 31, 2013
:
|
(in thousands)
|
Chesapeake
Pension
Plan
|
FPU
Pension
Plan
|
Chesapeake
SERP
|
Chesapeake
Postretirement
Plan
|
FPU
Medical
Plan
|
Total
|
|||||||||||||||||
|
Prior service cost (credit)
|
$
|
—
|
|
$
|
—
|
|
$
|
28
|
|
$
|
(909
|
)
|
$
|
—
|
|
$
|
(881
|
)
|
|||||
|
Net loss
|
2,483
|
|
5,298
|
|
659
|
|
972
|
|
(142
|
)
|
9,270
|
|
|||||||||||
|
Total
|
$
|
2,483
|
|
$
|
5,298
|
|
$
|
687
|
|
$
|
63
|
|
$
|
(142
|
)
|
$
|
8,389
|
|
|||||
|
Accumulated other comprehensive loss pre-tax
(1)
|
$
|
2,483
|
|
$
|
1,007
|
|
$
|
687
|
|
$
|
63
|
|
$
|
(27
|
)
|
$
|
4,213
|
|
|||||
|
Post-merger regulatory asset
|
—
|
|
4,291
|
|
—
|
|
—
|
|
(115
|
)
|
4,176
|
|
|||||||||||
|
Subtotal
|
2,483
|
|
5,298
|
|
687
|
|
63
|
|
(142
|
)
|
8,389
|
|
|||||||||||
|
Pre-merger regulatory asset
|
—
|
|
4,348
|
|
—
|
|
—
|
|
54
|
|
4,402
|
|
|||||||||||
|
Total unrecognized cost
|
$
|
2,483
|
|
$
|
9,646
|
|
$
|
687
|
|
$
|
63
|
|
$
|
(88
|
)
|
$
|
12,791
|
|
|||||
|
(1)
|
The total amount of accumulated other comprehensive loss recorded on our consolidated balance sheet as of December 31, 2013 is net of income tax benefits of
$1.7 million
.
|
Chesapeake Utilities Corporation 2013 Form 10-K Page
91
The amounts in accumulated other comprehensive income/loss and recorded as a regulatory asset for our pension and postretirement benefits plans that are expected to be recognized as a component of net benefit cost in 2014 are set forth in the following table:
|
(in thousands)
|
Chesapeake
Pension
Plan
|
FPU
Pension
Plan
|
Chesapeake
SERP
|
Chesapeake
Postretirement
Plan
|
FPU
Medical
Plan
|
Total
|
|||||||||||||||||
|
Prior service cost (credit)
|
$
|
—
|
|
$
|
—
|
|
$
|
19
|
|
$
|
(77
|
)
|
$
|
—
|
|
$
|
(58
|
)
|
|||||
|
Net loss
|
$
|
149
|
|
$
|
—
|
|
$
|
48
|
|
$
|
67
|
|
$
|
—
|
|
$
|
264
|
|
|||||
|
Amortization of pre-merger regulatory asset
|
$
|
—
|
|
$
|
761
|
|
$
|
—
|
|
$
|
—
|
|
$
|
8
|
|
$
|
769
|
|
|||||
Assumptions
The assumptions used for the discount rate to calculate the benefit obligations of all the plans were based on the interest rates of high-quality bonds in 2013, reflecting the expected lives of the plans. In determining the average expected return on plan assets for each applicable plan, various factors, such as historical long-term return experience, investment policy and current and expected allocation, were considered. Since Chesapeake’s plans and FPU’s plans have different expected plan lives and investment policies, particularly in light of the lump-sum-payment option provided in the Chesapeake Pension Plan, different assumptions regarding discount rate and expected return on plan assets were selected for Chesapeake’s plans and FPU’s plans. Since both pension plans are frozen with respect to additional years of service and compensation, the rate of assumed compensation increases is not applicable.
The health care inflation rate for 2013 used to calculate the benefit obligation is
5.5 percent
for medical and
6.5 percent
for prescription drugs for the Chesapeake Postretirement Plan; and
6.5 percent
for the FPU Medical Plan. A one–percentage point increase in the health care inflation rate from the assumed rate would increase the accumulated postretirement benefit obligation by approximately
$264,000
as of December 31, 2013, and would increase the aggregate of the service cost and interest cost components of the net periodic postretirement benefit cost for 2013 by approximately
$10,000
. A one-percentage point decrease in the health care inflation rate from the assumed rate would decrease the accumulated postretirement benefit obligation by approximately
$228,000
as of December 31, 2013, and would decrease the aggregate of the service cost and interest cost components of the net periodic postretirement benefit cost for 2013 by approximately
$8,000
.
Estimated Future Benefit Payments
In 2014, we expect to contribute
$670,000
and
$2.4 million
to the Chesapeake Pension Plan and FPU Pension Plan, respectively, and
$88,000
to the Chesapeake SERP. We also expect to contribute
$95,000
and
$245,000
to the Chesapeake Postretirement Plan and FPU Medical Plan, respectively, in 2014. The schedule below shows the estimated future benefit payments for each of the plans previously described:
|
Chesapeake
Pension
Plan
(1)
|
FPU
Pension
Plan
(1)
|
Chesapeake
SERP
(2)
|
Chesapeake
Postretirement
Plan
(2)
|
FPU
Medical
Plan
(2)
|
|||||||||||||||
|
(in thousands)
|
|
|
|
|
|
||||||||||||||
|
2014
|
$
|
494
|
|
$
|
2,814
|
|
$
|
88
|
|
$
|
95
|
|
$
|
245
|
|
||||
|
2015
|
$
|
622
|
|
$
|
2,886
|
|
$
|
138
|
|
$
|
97
|
|
$
|
223
|
|
||||
|
2016
|
$
|
572
|
|
$
|
2,946
|
|
$
|
146
|
|
$
|
98
|
|
$
|
203
|
|
||||
|
2017
|
$
|
1,071
|
|
$
|
2,988
|
|
$
|
143
|
|
$
|
96
|
|
$
|
166
|
|
||||
|
2018
|
$
|
634
|
|
$
|
3,048
|
|
$
|
140
|
|
$
|
95
|
|
$
|
133
|
|
||||
|
Years 2019 through 2023
|
$
|
3,984
|
|
$
|
16,362
|
|
$
|
890
|
|
$
|
436
|
|
$
|
393
|
|
||||
|
(1)
|
The pension plan is funded; therefore, benefit payments are expected to be paid out of the plan assets.
|
|
(2)
|
Benefit payments are expected to be paid out of our general funds.
|
Retirement Savings Plan
Effective January 1, 2012, we sponsor one 401(k) retirement savings plan and the 401(k) SERP, a non-qualified supplemental executive retirement savings plan.
Our 401(k) plan is offered to all eligible employees who have completed three months of service, except for employees represented by a collective bargaining agreement that does not specifically provide for participation in the plan, non-resident aliens with no U.S. source income and individuals classified as consultants, independent contractors or leased employees. Effective January 1,
Chesapeake Utilities Corporation 2013 Form 10-K Page
92
2011, we match
100 percent
of eligible participants’ pre-tax contributions to the Chesapeake 401(k) plan up to a maximum of
six percent
of eligible compensation. In addition, we may make a supplemental contribution to participants in the plan, without regard to whether or not they make pre-tax contributions. Beginning January 1, 2011, the employer matching contribution is made in cash and is invested based on a participant’s investment directions. Any supplemental employer contribution is generally made in Chesapeake stock. With respect to the employer match and supplemental employer contribution, employees are
100 percent
vested after
two
years of service or upon reaching
55
years of age while still employed by Chesapeake. Employees with
one
year of service are
20 percent
vested and will become
100 percent
vested after
two
years of service. Employees who do not make an election to contribute or do not opt out of the Chesapeake 401(k) plan will be automatically enrolled at a deferral rate of
three percent
, and the automatic deferral rate will increase by
one percent
per year up to a maximum of
six percent
.
We also offer the 401(k) SERP to our executive officers over a specific income threshold. Participants receive a cash-only matching contribution percentage equivalent to their 401(k) match level. All contributions and matched funds can be invested among the mutual funds available for investment. All obligations arising under the 401(k) SERP are payable from our general assets, although we have established a Rabbi Trust for the 401(k) SERP. Assets held in the Rabbi Trust for the 401(k) SERP had a fair value of
$3.1 million
and
$2.2 million
at December 31, 2013 and 2012, respectively. (See
Note 9, Investments
, for further details). The assets of the Rabbi Trust are at all times subject to the claims of our general creditors.
Contributions to all of our 401(k) plans totaled
$3.7 million
,
$2.9 million
and
$2.7 million
for the years ended December 31, 2013, 2012 and 2011, respectively. As of December 31, 2013, there are
580,484
shares of our common stock reserved to fund future contributions to the 401(k) plan.
Deferred Compensation Plan
On December 7, 2006, the Board of Directors approved the Deferred Compensation Plan as amended, effective January 1, 2007. At
December 31, 2013
, the Deferred Compensation Plan consisted solely of shares of our common stock related to the deferral of executive performance shares and directors’ stock retainers.
Participants in the Deferred Compensation Plan are able to elect the payment of benefits to begin on a specified future date after the election is made in the form of a lump sum or annual installments. Deferrals of executive cash bonuses and directors’ cash retainers and fees are paid in cash. All deferrals of executive performance shares, which represent deferred stock units, and directors’ stock retainers are paid in shares of our common stock, except that cash is paid in lieu of fractional shares. We established a Rabbi Trust in connection with the Deferred Compensation Plan. The value of our stock held in the Rabbi Trust is classified within the stockholders’ equity section of the consolidated balance sheet and has been accounted for in a manner similar to treasury stock. The amounts recorded under the Deferred Compensation Plan totaled
$1.1 million
and
$982,000
at December 31, 2013 and 2012, respectively.
Effective January 1, 2014, our 401(k) SERP was amended, restated and renamed as the Chesapeake Utilities Corporation Non-Qualified Deferred Compensation Plan. In addition, the Deferred Compensation Plan was consolidated into this plan. As a result of these actions, the 401(k) SERP and the Deferred Compensation Plan are now administered as a single plan.
Chesapeake Utilities Corporation 2013 Form 10-K Page
93
Notes to the Consolidated Financial Statements
17. S
HARE
-B
ASED
C
OMPENSATION
P
LANS
Effective May 2, 2013, our non-employee directors and key employees are awarded share-based awards through our 2013 SICP. Prior to May 2, 2013, our non-employee directors and key employees were awarded share-based awards through our DSCP and our PIP, respectively. We record these share-based awards as compensation costs over the respective service period for which services are received in exchange for an award of equity or equity-based compensation. The compensation cost is based primarily on the fair value of the shares awarded, using the estimated fair value of each share on the date it was granted and the number of shares to be issued at the end of the service period. We have
441,241
shares reserved for issuance under the SICP, including the shares previously awarded through the DSCP and PIP that will be issued from this reserve.
The table below presents the amounts included in net income related to share-based compensation expense for the awards granted under the DSCP and the PIP for the years ended
December 31, 2013
, 2012 and 2011:
|
For the Year Ended December 31,
|
|||||||||||
|
2013
|
2012
|
2011
|
|||||||||
|
(in thousands)
|
|
|
|
||||||||
|
Directors Stock Compensation Plan
|
$
|
478
|
|
$
|
443
|
|
$
|
407
|
|
||
|
Performance Incentive Plan
|
1,153
|
|
976
|
|
1,043
|
|
|||||
|
Total compensation expense
|
1,631
|
|
1,419
|
|
1,450
|
|
|||||
|
Less: tax benefit
|
657
|
|
569
|
|
581
|
|
|||||
|
Share-Based Compensation amounts included in net income
|
$
|
974
|
|
$
|
850
|
|
$
|
869
|
|
||
Stock Options
We did not have any stock options outstanding at December 31, 2013 or 2012, nor were any stock options issued during 2013, 2012 and 2011.
Directors Stock Compensation Plan
Shares granted under the DSCP were issued in advance of the directors’ service periods and were fully vested as of the date of the grant. We record a prepaid expense equal to the fair value of the shares issued and amortize the expense equally over a service period of
one year
. In May 2013, each of our non-employee directors received an annual retainer of
857
shares of common stock under the DSCP. There were no shares granted under the SICP as of December 31, 2013.
A summary of stock activity under the DSCP for the years ended December 31, 2013, 2012 and 2011 is presented below.
|
Number of
Shares
|
Weighted Average
Grant Date Fair Value
|
|||||
|
Outstanding — December 31, 2011
|
—
|
|
$
|
—
|
|
|
|
Granted
|
10,800
|
|
$
|
41.06
|
|
|
|
Vested
|
10,800
|
|
$
|
41.06
|
|
|
|
Outstanding — December 31, 2012
|
—
|
|
$
|
—
|
|
|
|
Granted
|
9,427
|
|
$
|
52.49
|
|
|
|
Vested
|
9,427
|
|
$
|
52.49
|
|
|
|
Outstanding — December 31, 2013
|
—
|
|
$
|
—
|
|
|
The weighted average grant date fair value of DSCP shares awarded during 2013, 2012 and 2011 was
$52.49
,
$41.06
and
$41.02
per share, respectively. The intrinsic values of the DSCP awards are equal to the fair value of these awards on the date of grant. At December 31, 2013, there was
$165,000
of unrecognized compensation expense related to DSCP awards that is expected to be recognized over the first four months of 2014.
Performance Incentive Plan
Our Compensation Committee is authorized to grant key employees of the Company the right to receive awards of shares of our common stock, contingent upon the achievement of established performance goals. These awards are subject to certain post-vesting transfer restrictions.
Chesapeake Utilities Corporation 2013 Form 10-K Page
94
Notes to the Consolidated Financial Statements
We currently have multi-year performance plans, which are based upon the successful achievement of long-term goals, growth and financial results, which comprised both market-based and performance-based conditions or targets. The fair value of each share of stock tied to a performance-based condition or target is equal to the market price of our common stock on the date of the grant. For the market-based conditions, we used the Black-Scholes pricing model to estimate the fair value of each share of market-based award granted.
In July 2012, we replaced a subsidiary officer’s multi-year cash-based incentive award with an award of up to
4,800
shares under the PIP. These shares will vest at the end of the service period ending December 31, 2014 and have terms and market/performance targets similar to other shares granted under the PIP in January 2012.
Effective February 24, 2012, one of our named executive officers, who was a participant in the PIP, resigned. Pursuant to a separation agreement entered into between the Company and the named executive officer, the named executive officer received a cash payment of
$181,500
and other benefits in lieu of other performance-based compensation, which he might have been entitled to receive.
A summary of stock activity under the PIP is presented below:
|
Number of
Shares
|
Weighted Average
Fair Value
|
|||||
|
Outstanding — December 31, 2011
|
87,414
|
|
$
|
34.47
|
|
|
|
Granted
|
35,706
|
|
$
|
39.62
|
|
|
|
Vested
|
13,837
|
|
$
|
29.19
|
|
|
|
Forfeited
(1)
|
21,600
|
|
$
|
36.57
|
|
|
|
Expired
|
3,038
|
|
$
|
26.29
|
|
|
|
Outstanding — December 31, 2012
|
84,645
|
|
$
|
37.86
|
|
|
|
Granted
|
23,491
|
|
$
|
44.85
|
|
|
|
Vested
|
24,332
|
|
$
|
33.26
|
|
|
|
Expired
|
3,043
|
|
$
|
39.12
|
|
|
|
Outstanding — December 31, 2013
|
80,761
|
|
$
|
42.30
|
|
|
|
(1)
|
Includes shares settled with a cash payment pursuant to the terms of a separation agreement with a former named executive officer.
|
In 2013, 2012 and 2011, we withheld shares with value at least equivalent to the employees’ minimum statutory obligation for the applicable income and other employment taxes, and remitted the cash to the appropriate taxing authorities with the executives receiving the net shares. The total number of shares withheld of
10,411
5,670
and
12,234
for 2013, 2012 and 2011, respectively, was based on the value of the PIP shares on their vesting date, determined by the average of high and low of our stock price. Total payments for the employees’ tax obligations to the taxing authorities were approximately
$519,000
,
$238,000
and
$496,000
, in 2013, 2012 and 2011, respectively.
Tax benefit on PIP for 2013, 2012 and 2011 were
$202,000
,
$172,000
and
$13,000
, respectively, and included in additional paid-in capital in the consolidated statements of stockholders' equity.
The weighted average grant-date fair value of PIP awards granted during 2013, 2012 and 2011 was
$44.85
,
$39.62
and
$40.16
per share, respectively. The intrinsic value of the PIP awards was
$4.8 million
,
$3.8 million
and
$3.8 million
for 2013, 2012 and 2011, respectively.
18. R
ATES
AND
O
THER
R
EGULATORY
A
CTIVITIES
Our natural gas and electric distribution operations in Delaware, Maryland and Florida are subject to regulation by their respective PSC; Eastern Shore, our natural gas transmission subsidiary, is subject to regulation by the FERC; and Peninsula Pipeline, our intrastate pipeline subsidiary, is subject to regulation by the Florida PSC. Chesapeake’s Florida natural gas distribution division and FPU’s natural gas and electric operations continue to be subject to regulation by the Florida PSC as separate entities.
Delaware
Natural Gas Expansion Service Offerings:
On November 5, 2013, the Delaware PSC approved a settlement agreement, which incorporated comments from the DPA, the Delaware PSC staff and us, in regards to increasing our natural gas expansion service
Chesapeake Utilities Corporation 2013 Form 10-K Page
95
Notes to the Consolidated Financial Statements
offerings to facilitate conversions to natural gas within our Delaware service areas. Under the settlement agreement, the Delaware division is authorized to:
|
(i)
|
charge a monthly fixed charge to customers in portions of eastern Sussex County, Delaware, which will enable us to extend our distribution system to provide natural gas service to these customers economically without upfront contributions from these customers; and
|
|
(ii)
|
offer optional service choices to customers to facilitate conversions to natural gas, including a conversion finance service to help customers manage their cost of conversion equipment.
|
Maryland
ESG Acquisition:
On September 7, 2012, we filed an application with the Maryland PSC for approval of the acquisition of the ESG operating assets and the transfer of the ESG franchises to Chesapeake (see
Note 4, Acquisitions,
for additional information on the ESG acquisition). In this application, we also requested that the Maryland PSC approve the overall regulatory framework we proposed for Sandpiper in Worcester County. The proposed regulatory framework included: (i) a new gas service tariff and rates applicable to natural gas and propane distribution customers in Worcester County, including the customers that were being served by ESG; (ii) the capacity, supply and operating agreement with ESG for the supply and storage of propane, which will be utilized to serve the ESG customers; and (iii) the accounting treatment for certain purchased assets.
On April 8, 2013, the parties finalized a settlement agreement, which was approved by the Maryland PSC in its order effective May 29, 2013. The Maryland PSC granted approval of: (i) the ESG acquisition; (ii) the overall regulatory framework requested; and (iii) recovery of the cost of the capacity, supply and operating agreement with ESG. In addition, the Maryland PSC's order requires us to file a depreciation study within the first year after the acquisition, at which point, the proper amount of the accumulated depreciation associated with the purchased assets in the rate base and the depreciation rates on those assets will be determined and then applied prospectively. The order also requires us to file a base rate case within two and a half years of Sandpiper's new service in Worcester County. The acquisition of the ESG operating assets was completed on May 31, 2013.
On July 31, 2013, Sandpiper filed an application with the Maryland PSC to revise its tariff to allow, on a temporary basis until the next base rate case, negotiated contract rates for a discrete subset of commercial customers receiving propane service who: (i) experienced rate increases on June 1, 2013, when Sandpiper’s tariff took effect in Worcester County, and (ii) do not meet the minimum usage requirement for eligibility for negotiated contract rates under the current tariff. On August 14, 2013, the Maryland PSC considered the application and accepted the proposed tariff revisions, effective August 14, 2013.
Florida
Marianna Franchise:
On July 7, 2009, the Marianna Commission adopted the Franchise Agreement. The Franchise Agreement required FPU to develop and implement new TOU and interruptible electric power rates, or other similar rates, mutually agreeable to FPU and the City of Marianna, effective by February 17, 2011, and available to all customers within FPU’s northwest division, which includes the City of Marianna. If the rates were not in effect by February 17, 2011, the City of Marianna had the right to give notice to FPU of its intent to exercise its option in the Franchise Agreement to purchase FPU’s property (consisting of the electric distribution assets) within the City of Marianna. Any such purchase was subject to approval by the Marianna Commission, which needed to approve the presentation of a referendum to voters in the City of Marianna for the approval of the purchase and the operation by the City of Marianna of an electric distribution facility.
FPU developed TOU and interruptible rates. On December 14, 2010, FPU filed a petition with the Florida PSC for authority to implement such proposed TOU and interruptible rates on or before February 17, 2011. On January 26, 2011, FPU filed a petition with the Florida PSC for approval of an amendment to FPU’s Generation Services Agreement between FPU and Gulf Power. The amendment provides for a reduction in the capacity demand quantity, which generates the savings necessary to support the TOU and interruptible rates approved by the Florida PSC. The amendment also extended the current agreement by two years, with a new expiration date of December 31, 2019.
On February 11, 2011, the Florida PSC approved FPU’s petition for authority to implement the proposed TOU and interruptible rates, effective as of February 8, 2011. The City of Marianna objected to the proposed rates and filed a petition protesting the entry of the Florida PSC’s order. On June 21, 2011, the Florida PSC issued an order approving the amendment to FPU's Generation Services Agreement. On July 12, 2011, the City of Marianna filed a protest of this decision and requested a hearing on the amendment. On January 24, 2012, the Florida PSC dismissed with prejudice the protests by the City of Marianna regarding both the TOU and interruptible rates and the amendment to the Generation Services Agreement.
The City of Marianna filed an appeal with the Florida Supreme Court on March 7, 2012 and with the Florida PSC on March 19, 2012, seeking an appellate review of both of the decisions by the Florida PSC with respect to the protests by the City of Marianna.
Chesapeake Utilities Corporation 2013 Form 10-K Page
96
Notes to the Consolidated Financial Statements
As more fully disclosed in
Note 20, Other Commitments and Contingencies
, on March 2, 2011, the City of Marianna filed a complaint against FPU in the Circuit Court of the Fourteenth Judicial Circuit in and for Jackson County, Florida, alleging breaches of the Franchise Agreement by FPU and seeking a declaratory judgment that the City of Marianna has the right to exercise its option to purchase FPU’s property in the City of Marianna in accordance with the terms of the Franchise Agreement. Prior to the scheduled trial date, FPU and the City of Marianna reached an agreement in principle to resolve their dispute, which resulted in the City of Marianna dismissing its legal action with prejudice on February 11, 2013. Subsequently, FPU and the City of Marianna entered into a settlement agreement, which contemplated, among other items, the City of Marianna proceeding with a referendum on the purchase of FPU’s facilities. On April 9, 2013, the referendum took place, and the citizens of the City of Marianna voted, by a wide margin, to reject the purchase of FPU's facilities by the City of Marianna. As a result of the outcome of the referendum and pursuant to the terms of the settlement agreement, FPU’s franchise with the City of Marianna was extended by ten years. Also pursuant to the settlement agreement, the City of Marianna withdrew before the Florida Supreme Court its appeals related to the Florida PSC’s orders regarding the implementation of TOU and interruptible rates and the amendment to the Generation Services Agreement between FPU and Gulf Power.
FPU has incurred approximately
$1.9 million
of expenses associated with the City of Marianna litigation. In seeking regulatory recovery of these extraordinary expenses, FPU filed a petition with the Florida PSC on August 27, 2012, for approval to: (i) defer, as a regulatory asset, the expenses associated with the litigation initiated by the City of Marianna; and (ii) amortize over five years, beginning in January 2013, previously expensed as well as future litigation expenses. Although this petition did not request recovery of these expenses, FPU sought deferral treatment of the expenses for regulatory purposes, which could allow future recovery of those expenses. On December 3, 2012, the Florida PSC approved FPU's request. Since this order did not provide specific recovery of these costs, we did not defer these costs as a regulatory asset at that point until further assurance of recovery could be obtained. Subsequent discussions with the Office of Public Counsel resulted in a settlement agreement on October 11, 2013. Under this settlement agreement, FPU will recover approximately
$1.8 million
of the total expenses associated with the City of Marianna litigation by retaining the
$1.8 million
refund received from Gulf Power. This refund represented the higher fuel cost paid by FPU during the City of Marianna franchise dispute as a result of the delay in implementing the amendment to the Generation Service Agreement. Upon reinstatement of the amendment, Gulf Power refunded this amount to FPU pursuant to the terms of the amendment. The remaining litigation expenses will be amortized over the
five
-year period beginning in January 2013, as previously approved by the Florida PSC. The Florida PSC approved the settlement agreement on October 24, 2013.
Pursuant to the settlement agreement we established a regulatory asset of approximately
$1.9 million
by reversing approximately
$1.5 million
of expenses recognized in 2012 and 2011 and deferring
$376,000
of expenses in 2013. The refund of
$1.8 million
received from Gulf Power was reflected as a regulatory liability, which was used to offset the regulatory asset.
Other Matters:
We also had developments in the following regulatory matters in Florida:
On September 28, 2012, FPU provided a letter to the Florida PSC stating its intent to request approval of a
$746,000
acquisition adjustment associated with FPU’s purchase of the operating assets of IGC in 2010. In this letter, FPU also acknowledged the jurisdiction of the Florida PSC to calculate and dispose of prospective overearnings, if any, occurring after October 1, 2012, as the Florida PSC may determine at the conclusion of the acquisition adjustment proceeding. On December 11, 2012, FPU filed a petition to request approval of this acquisition adjustment associated with FPU’s purchase of IGC’s assets. The Florida PSC, at its December 17, 2013 meeting, approved the acquisition adjustment and determined there were no over earnings in 2012.
On December 14, 2012, Peninsula Pipeline filed a petition with the Florida PSC, asking for approval of a transportation service agreement with FPU. The agreement provides for an upstream interconnection of Peninsula Pipeline’s facilities with the FGT system and a downstream interconnection with FPU’s facilities. At the agenda conference on July 30, 2013, the Florida PSC approved this agreement.
On July 2, 2013, FPU filed a petition with the Florida PSC for recognition of a regulatory liability for a one-time curtailment gain associated with a change in the FPU Medical Plan. The change in the FPU Medical Plan was implemented effective January 1, 2012 in an effort to conform the benefits offered to FPU's employees to those offered by Chesapeake. The change in the FPU Medical Plan resulted in a total curtailment gain of
$892,000
, of which
$722,000
was allocated to FPU's regulated operations. Since this gain resulted from the merger integration effort, FPU believes that the treatment most consistent with prior regulatory practice would be to record the gain allocated to the regulated operations as a regulatory liability and amortize that amount over a specified period. This treatment is similar to how merger-related costs and a one-time tax contingency gain were treated. FPU requested approval to record regulatory liabilities of
$464,000
and
$258,000
, respectively, in its natural gas and electric operations. FPU also sought permission to amortize the proposed regulatory liabilities over a
34
-month period, beginning January 1, 2012, and ending October 30, 2014. The Florida PSC approved this petition on October 24, 2013. We recorded
$510,000
of the amortization of this regulatory liability in 2013, including immediate recognition
Chesapeake Utilities Corporation 2013 Form 10-K Page
97
Notes to the Consolidated Financial Statements
in current period earnings of the amortization related to the period prior to the Florida PSC's approval, which reduced depreciation and amortization expense.
Eastern Shore
The following are regulatory activities involving FERC orders applicable to Eastern Shore and the expansions of Eastern Shore’s transmission system:
Mainline Expansion Project:
On May 14, 2012, Eastern Shore submitted to the FERC an application for a CP for approval to construct the facilities necessary to deliver additional firm service of
15,040
Dts/d to an existing electric power generation customer and to Chesapeake’s Delaware and Maryland divisions. The estimated capital cost of the project is approximately
$16.3 million
. The filing was publicly noticed on May 25, 2012.
Two
of Eastern Shore’s existing customers and Chesapeake’s Delaware and Maryland divisions filed motions to intervene in support of the project. One existing customer filed a motion to intervene and protest. On June 28, 2012, Eastern Shore submitted a response to the protest, and on August 31, 2012, the protesting customer filed a reply to Eastern Shore’s response. On October 3, 2012, the US Department of the Interior submitted comments on the FERC’s environmental assessment regarding Eastern Shore’s re-vegetation plan. On October 9, 2012, a non-profit organization also submitted comments on the FERC’s environmental assessment, asserting that the environmental assessment was deficient and requesting the FERC to extend the comment period by
60
days. In February 2013, the FERC approved Eastern Shore’s application and issued a CP. On March 11, 2013, Eastern Shore accepted this CP and filed its environmental compliance plan. On March 21, 2013, the FERC issued a notice to proceed with construction. On November 1, 2013, Eastern Shore commenced service upon completion of construction.
Daleville Compressor Station Upgrade Filing:
On October 12, 2012, Eastern Shore submitted to the FERC an application for a CP, seeking authorization to construct a new gas-fired compressor unit at its existing Daleville Compressor Station located in Chester County, Pennsylvania. The new unit will provide
17,500
Dts/d of additional firm transportation service to two of Eastern Shore’s existing customers. In this application, Eastern Shore also included a description of a second new gas fired compressor unit to be installed at the Daleville Compressor Station, which will replace the
three
existing compressors that serve as back-up units to existing primary compressor units. Eastern Shore also plans to replace the engine exhaust devices of the existing primary compressor units with air emissions control equipment to comply with new environmental regulations. The replacement compressor unit and new engine exhaust devices will result in improved air emissions, reliability and flexibility on Eastern Shore’s system. Eastern Shore does not need specific FERC approval to construct the replacement compressor unit or emission controls; however, Eastern Shore wanted the FERC to be fully advised of these improvement efforts. The estimated capital costs of the project were approximately
$12.1 million
. On March 4, 2013, the FERC approved this application. On April 19, 2013, the FERC issued a notice to proceed with construction. On November 1, 2013, Eastern Shore commenced service upon completion of construction.
White Oak Lateral Project Filing:
On June 13, 2013, Eastern Shore submitted to the FERC an application for a CP, seeking authorization to construct the White Oak lateral project located in Kent County, Delaware. The project consists of installing approximately
5.5
miles of
16
-inch diameter pipeline, metering facilities and miscellaneous appurtenances extending from Eastern Shore's mainline system near its North Dover City Gate Station to the Garrison Oak Technical Park, all located in Dover, Delaware. This project is designed to provide
55,200
Dts/d of delivery lateral firm transportation service to Calpine for its proposed
309
megawatt combined-cycle power plant under development. The total cost of the project is estimated to be approximately
$11.2 million
.
On August 9, 2013, the FERC issued a notice of intent to prepare an environmental assessment for the project. The comment period concluded on September 9, 2013 with no comments being filed in the docket. The environmental assessment was issued on October 4, 2013 and FERC staff recommended a finding of no significant impact. Eastern Shore filed the implementation plan and acceptance of conditions stating that it will comply with all environmental conditions as set forth in the order. On November 27, 2013, the FERC issued a CP for this project. On January 17, 2014, the FERC issued its notice to allow Eastern Shore to proceed with the construction. Eastern Shore began construction activities for this project on January 22, 2014 for an in-service date of January 1, 2015.
Chesapeake Utilities Corporation 2013 Form 10-K Page
98
Notes to the Consolidated Financial Statements
Other matters:
Eastern Shore also had developments in the following FERC matters:
On May 31, 2013, Eastern Shore submitted to the FERC a combined filing of its FRP and Cash-Out Refund for a
twelve
-month period beginning April 2012 and ending March 2013. In this filing, Eastern Shore proposed an FRP rate of
0.24 percent
and continuation of its existing
zero
percent rate for the Cash-Out Surcharge. During the period, Eastern Shore experienced an under-recovery of
$285,000
in its Deferred Gas Required for Operations costs and an over-recovery of
$146,000
in its Deferred Cash-Out costs. Eastern Shore proposed to incorporate the Cash-Out Refund into its FRP to mitigate the effect of the increase in the FRP to its customers. On June 27, 2013, the FERC issued an order accepting Eastern Shore's submittal of a combined filing to update both its FRP and Cash-Out Refund mechanisms, effective July 1, 2013.
19. E
NVIRONMENTAL
C
OMMITMENTS
AND
C
ONTINGENCIES
We are subject to federal, state and local laws and regulations governing environmental quality and pollution control. These laws and regulations require us to remove or remediate at current and former operating sites the effect on the environment of the disposal or release of specified substances.
We have participated in the investigation, assessment or remediation, and have exposures at
six
former MGP sites. Those sites are located in Salisbury, Maryland, and Winter Haven, Key West, Pensacola, Sanford and West Palm Beach, Florida. We have also been in discussions with the MDE regarding a seventh former MGP site located in Cambridge, Maryland.
As of
December 31, 2013
, we had approximately
$10.2 million
in environmental liabilities related to all of FPU’s MGP sites in Florida, which include the Key West, Pensacola, Sanford and West Palm Beach sites, representing our estimate of the future costs associated with those sites. FPU has approval to recover up to
$14.0 million
of its environmental costs related to all of its MGP sites from insurance and from customers through rates, approximately
$9.2 million
of which has been recovered as of
December 31, 2013
. We had approximately
$4.8 million
in regulatory assets for future recovery of environmental costs from FPU’s customers.
In addition to the FPU MGP sites, we had
$488,000
in environmental liabilities at
December 31, 2013
, related to Chesapeake’s MGP sites in Maryland and Florida, representing our estimate of future costs associated with these sites. As of
December 31, 2013
, we had approximately
$691,000
in regulatory and other assets for future recovery through Chesapeake’s rates. Environmental liabilities for all of our MGP sites are recorded on an undiscounted basis based on the estimate of future costs provided by independent consultants.
We continue to expect that all costs related to environmental remediation and related activities will be recoverable from customers through rates.
The following discussion provides details on MGP sites:
West Palm Beach, Florida
Remedial options are being evaluated to respond to environmental impacts to soil and groundwater at and in the immediate vicinity of a parcel of property owned by FPU in West Palm Beach, Florida, where FPU previously operated a MGP. FPU is currently implementing a remedial plan approved by the FDEP for the east parcel of the West Palm Beach site, which includes installation of monitoring test wells, sparging of air into the groundwater system and extraction of vapors from the subsurface. It is anticipated that similar remedial actions ultimately will be implemented for other portions of the site. Estimated costs of remediation for the West Palm Beach site range from approximately
$4.5 million
to
$15.4 million
, including costs associated with the relocation of FPU’s operations at this site, which is necessary to implement the remedial plan, and any potential costs associated with future redevelopment of the properties.
Sanford, Florida
FPU is the current owner of property in Sanford, Florida, which was a former MGP site that was operated by several other entities before FPU acquired the property. FPU was never an owner or an operator of the MGP. In January 2007, FPU and the Sanford Group signed a Third Participation Agreement, which provides for the funding of the final remedy approved by the EPA for the site. FPU’s share of remediation costs under the Third Participation Agreement is set at
five percent
of a maximum of
$13.0 million
, or
$650,000
. As of
December 31, 2013
, FPU has paid
$650,000
to the Sanford Group escrow account for its entire share of the funding requirements.
The total cost of the final remedy is now estimated to be over
$20.0 million
, which includes long-term monitoring and the settlement of claims asserted by
two
adjacent property owners to resolve damages that the property owners allege they have incurred and will incur as a result of the implementation of the EPA-approved remediation. In settlement of these claims, members of the Sanford Group, which in this instance does not include FPU, have agreed to pay specified sums of money to the parties. FPU has refused
Chesapeake Utilities Corporation 2013 Form 10-K Page
99
Notes to the Consolidated Financial Statements
to participate in the funding of the third-party settlement agreements based on its contention that it did not contribute to the release of hazardous substances at the site giving rise to the third-party claims. FPU has advised the other members of the Sanford Group that it is unwilling at this time to agree to pay any sum in excess of the
$650,000
committed by FPU in the Third Participation Agreement.
As of
December 31, 2013
, FPU’s remaining remediation expenses, including attorneys’ fees and costs, are estimated to be
$24,000
. However, we are unable to determine, to a reasonable degree of certainty, whether the other members of the Sanford Group will accept FPU’s asserted defense to liability for costs exceeding
$13.0 million
as provided in the Third Participation Agreement to implement the final remedy for this site or will pursue a claim against FPU for a sum in excess of the
$650,000
that FPU has paid under the Third Participation Agreement. No such claims have been made as of
December 31, 2013
.
Key West, Florida
FPU formerly owned and operated a MGP in Key West, Florida. Field investigations performed in the 1990s identified limited environmental impacts at the site, which is currently owned by an unrelated third party. In 2010, after
17 years
of regulatory inactivity, FDEP observed that some soil and groundwater standards were exceeded and requested implementation of additional soil and groundwater fieldwork. The scope of work is limited to the installation of two additional monitoring wells and periodic monitoring of the new and existing wells. The two new monitoring wells were installed in November 2011, and groundwater monitoring began in December 2011. The first semi-annual report from the monitoring program was issued in May 2012. The data from the June 2012 and September 2012 monitoring events were submitted to the FDEP on October 4, 2012. FDEP responded via e-mail on October 9, 2012 that based on the data NAM appears to be an appropriate remedy for the site. The FDEP issued a Remedial Action Plan approval order, dated October 12, 2012, which specified that a limited semi-annual monitoring program is to be conducted. The annual cost to conduct the limited NAM program is not expected to exceed
$8,000
. Although the duration of the FDEP-required limited NAM cannot be determined with certainty, it is anticipated that total costs to complete the remedial action will not exceed
$50,000
.
Pensacola, Florida
FPU formerly owned and operated a MGP in Pensacola, Florida, which was subsequently owned by Gulf Power. Portions of the site are now owned by the City of Pensacola and the FDOT. In October 2009, FDEP informed Gulf Power that FDEP would approve a conditional No Further Action determination for the site, which must include a requirement for institutional and engineering controls. On December 13, 2011, Gulf Power, the City of Pensacola, FDOT and FPU submitted to FDEP a draft covenant for institutional and engineering controls for the site. Upon FDEP’s approval and the subsequent recording of the institutional and engineering controls, no further work is expected to be required of the parties. Assuming FDEP approves the draft institutional and engineering controls, it is anticipated that FPU’s share of remaining legal and cleanup costs will not exceed
$5,000
.
Salisbury, Maryland
We have substantially completed remediation of a site in Salisbury, Maryland, where it was determined that a former MGP caused localized ground-water contamination. In February 2002, the MDE granted permission to permanently decommission the systems used for remediation and to discontinue all on-site and off-site well monitoring, except for one well, which is being maintained for periodic product monitoring and recovery. We anticipate that the remaining costs of the one remaining monitoring well will not exceed
$5,000
annually. We cannot predict at this time when the MDE will grant permission to permanently decommission the one remaining monitoring well.
Winter Haven, Florida
The Winter Haven site is located on the eastern shoreline of Lake Shipp, in Winter Haven, Florida. Pursuant to a consent order entered into with FDEP, we are obligated to assess and remediate environmental impacts at this former MGP site. The recent groundwater sampling results show a continuing reduction in contaminant concentrations from the treatment system, which has been in operation since 2002. Currently, we predict that remedial action objectives could be met in approximately
two
to
three years
for the area being treated by the remediation system. On August 7, 2012, FDEP issued a letter discussing the need to evaluate further remedial options, which could incorporate risk-management options, including natural attenuation and the use of institutional and engineering controls. Modifications to the existing consent order and the remedial action plan modification could be required to incorporate risk-management options into the remedy for the site. A response letter was submitted to FDEP on May 7, 2013, and the most recent groundwater monitoring report was submitted on June 17, 2013. FDEP issued an additional comment letter, dated September 16, 2013, containing various requests and questions, which we responded to on October 10, 2013. If modifications to the existing consent order and remedial action plan are required, we estimate that future remediation costs could be as much as
$443,000
, which includes an estimate of
$100,000
to implement additional actions, such as institutional controls,
Chesapeake Utilities Corporation 2013 Form 10-K Page
100
Notes to the Consolidated Financial Statements
at the site. If we are required to incur this cost, we continue to believe that the entire amount will be recoverable from customers through our approved rates.
The current treatment system at the Winter Haven site does not address impacted soils in the southwest corner of the site. In 2010, we obtained conditional approval from FDEP for a soil excavation plan; however, because the costs associated with shoreline stabilization and dewatering are likely to be substantial, alternatives to this excavation plan are being evaluated.
FDEP has indicated that we may be required to remediate sediments along the shoreline of Lake Shipp, immediately west of the site. Based on studies performed to date, we object to FDEP’s suggestion that the sediments have been adversely impacted by the former operations of the MGP. Our early estimates indicate that some of the corrective measures discussed by FDEP could cost as much as
$1.0 million
. We believe that corrective measures for the sediments are not warranted and intend to oppose any requirement that we undertake corrective measures in the offshore sediments. We have not recorded a liability for sediment remediation, as the final resolution of this matter cannot be predicted at this time.
Other
We are in discussions with the MDE regarding a former MGP site located in Cambridge, Maryland. The outcome of this matter cannot be determined at this time; therefore, we have not recorded an environmental liability for this location.
20. O
THER
C
OMMITMENTS
AND
C
ONTINGENCIES
Litigation
On March 2, 2011, the City of Marianna filed a complaint against FPU in the Circuit Court of the Fourteenth Judicial Circuit in and for Jackson County, Florida. In the complaint, the City of Marianna alleged
three
breaches of the Franchise Agreement by FPU: (i) FPU failed to develop and implement TOU and interruptible rates that were mutually agreed to by the City of Marianna and FPU; (ii) mutually agreed upon TOU and interruptible rates by FPU were not effective or in effect by February 17, 2011; and (iii) FPU did not have such rates available to all of FPU’s customers located within and without the corporate limits of the City of Marianna. The City of Marianna sought a declaratory judgment allowing it to exercise its option under the Franchise Agreement to purchase FPU’s property (consisting of the electric distribution assets) within the City of Marianna. Any such purchase would be subject to approval by the Marianna Commission, which would also need to approve the presentation of a referendum to voters in the City of Marianna related to the purchase and the operation by the City of Marianna of an electric distribution facility. On March 28, 2011, FPU filed its answer to the declaratory action by the City of Marianna, in which it denied the material allegations by the City of Marianna and asserted several affirmative defenses. On August 3, 2011, the City of Marianna notified FPU that it was formally exercising its option to purchase FPU’s property. On August 31, 2011, FPU advised the City of Marianna that it had no right to exercise the purchase option under the Franchise Agreement and that FPU would continue to oppose the effort by the City of Marianna to purchase FPU’s property. In December 2011, the City of Marianna filed a motion for summary judgment. On April 3, 2012, the court conducted a hearing on the City of Marianna’s motion for summary judgment. The court subsequently denied in part and granted in part the City of Marianna’s motion after concluding that issues of fact remained for trial with respect to each of the three alleged breaches of the Franchise Agreement.
Prior to the February 2013 trial date, FPU and the City of Marianna reached an agreement in principle to resolve their dispute, which resulted in the City of Marianna dismissing its legal action with prejudice on February 11, 2013. Subsequently, FPU and the City of Marianna entered into a settlement agreement, which contemplated, among other items, the City of Marianna proceeding with a referendum on the purchase of FPU’s facilities within the City of Marianna. On April 9, 2013, the referendum took place, and the citizens of the City of Marianna voted, by a wide margin, to reject the purchase of FPU’s facilities by the City of Marianna. As a result of the dismissal with prejudice of the legal action by the City of Marianna and the outcome of the referendum on the purchase of FPU’s facilities, we
no
longer have any contingencies related to claims by the City of Marianna.
We are involved in certain other legal actions and claims arising in the normal course of business. We are also involved in certain legal and administrative proceedings before various governmental agencies concerning rates. In the opinion of management, the ultimate disposition of these proceedings will not have a material effect on our consolidated financial position, results of operations or cash flows.
Natural Gas, Electric and Propane Supply
We have entered into contractual commitments to purchase gas, electricity and propane from various suppliers. The contracts have various expiration dates. For our Delaware and Maryland natural gas distribution divisions, we had a contract with an unaffiliated energy marketing and risk management company to manage a portion of their natural gas transportation and storage capacity, which expired on March 31, 2013. On April 1, 2013, we entered into a new contract with a different company to perform similar asset management functions. The new contract expires on March 31, 2015.
Chesapeake Utilities Corporation 2013 Form 10-K Page
101
Notes to the Consolidated Financial Statements
As discussed in
Note 4, Acquisitions,
in May 2013, Sandpiper entered into a capacity, supply and operating agreement with EGWIC to purchase propane over a
six
-year term. Sandpiper's initial annual commitment is estimated at approximately
7.4 million
gallons. Sandpiper has the option to enter into either a fixed per-gallon price for some or all of the propane purchases or a market-based price utilizing one of two local propane pricing indices.
Chesapeake’s Florida natural gas distribution division has firm transportation service contracts with FGT and Gulfstream. Pursuant to a capacity release program approved by the Florida PSC, all of the capacity under these agreements has been released to various third parties, including PESCO. Under the terms of these capacity release agreements, Chesapeake is contingently liable to FGT and Gulfstream, should any party that acquired the capacity through release fail to pay the capacity charge.
In May 2013, PESCO renewed contracts to purchase natural gas from various suppliers. These contracts expire in May 2014. PESCO is currently obtaining and reviewing proposals from suppliers and anticipates executing agreements before the existing agreements expire.
FPU entered into an amendment to its Generation Services Agreement with Gulf Power, which reduces the capacity demand quantity and provides the savings necessary to support the TOU and interruptible rates for the customers in the City of Marianna, both of which were approved by the Florida PSC. The amendment also extends the current agreement by two years, with a new expiration date of December 31, 2019.
FPU’s electric fuel supply contracts require FPU to maintain an acceptable standard of creditworthiness based on specific financial ratios. FPU’s agreement with JEA requires FPU to comply with the following ratios based on the results of the prior 12 months: (a) total liabilities to tangible net worth less than
3.75
times, and (b) fixed charge coverage ratio greater than
1.5
times. If either ratio is not met by FPU, it has
30 days
to cure the default or provide an irrevocable letter of credit if the default is not cured. FPU’s electric fuel supply agreement with Gulf Power requires FPU to meet the following ratios based on the average of the prior nine quarters: (a) funds from operations interest coverage ratio (minimum of
2
times), and (b) total debt to total capital (maximum of
65
percent). If FPU fails to meet the requirements, it has to provide the supplier a written explanation of actions taken or proposed to be taken to become compliant. Failure to comply with the ratios specified in the Gulf Power agreement could result in FPU providing an irrevocable letter of credit. As of
December 31, 2013
, FPU was in compliance with all of the requirements of its fuel supply contracts.
Sharp entered into a separate supply and operating agreement with EGWIC. Under this agreement, Sharp has a commitment to supply propane to EGWIC over a
six
-year term. Sharp's initial annual commitment is estimated at approximately
7.4 million
gallons. The agreement between Sharp and EGWIC is separate from the agreement between Sandpiper and EGWIC, and neither agreement permits the parties to set off the rights and obligations specified in one agreement against those specified in the other agreement.
The total purchase obligations for natural gas, electric and propane supplies are
$98.2 million
for 2014,
$129.9 million
for 2015-2016,
$88.6 million
for 2017-2018 and
$147.6 million
thereafter.
Corporate Guarantees
The Board of Directors has authorized the Company to issue corporate guarantees securing obligations of our subsidiaries and to obtain letters of credit securing our obligations, including the obligations of our subsidiaries. The maximum authorized liability under such guarantees and letters of credit is
$45.0 million
.
We have issued corporate guarantees to certain vendors of our subsidiaries, the largest portion of which are for Xeron and PESCO. These corporate guarantees provide for the payment of propane and natural gas purchases in the event of the respective subsidiary’s default. Neither subsidiary has ever defaulted on its obligations to pay its suppliers. The liabilities for these purchases are recorded when incurred. The aggregate amount guaranteed at
December 31, 2013
was
$31.1 million
, with the guarantees expiring on various dates through
December 30, 2014
.
Chesapeake guarantees the payment of FPU’s first mortgage bonds. The maximum exposure under the guarantee is the outstanding principal and accrued interest balances. The outstanding principal balances of FPU’s first mortgage bonds approximate their carrying values (see
Note 12, Long-Term Deb
t, for further details).
In addition to the corporate guarantees, we have issued a letter of credit for
$1.0 million
, which expires on
September 12, 2014
, related to the electric transmission services for FPU’s northwest electric division. We have also issued a letter of credit to our current primary insurance company for
$1.1 million
, which expires on
December 2, 2014
, as security to satisfy the deductibles under our various insurance policies. As a result of a change in our primary insurance company in 2010, we renewed and decreased the letter of credit to
$304,000
to our former primary insurance company, which will expire on
June 1, 2014
. There have been no draws on these letters of credit as of
December 31, 2013
. We do not anticipate that the letters of credit will be drawn upon by the counterparties, and we expect that the letters of credit will be renewed to the extent necessary in the future.
Chesapeake Utilities Corporation 2013 Form 10-K Page
102
Notes to the Consolidated Financial Statements
We provided a letter of credit for
$2.3 million
to TETLP related to the precedent agreement and firm transportation service agreement between our Delaware and Maryland divisions.
Tax-related Contingencies
We are subject to various audits and reviews by the federal, state and local and other regulatory authorities regarding income taxes and taxes other than income. As of
December 31, 2013
, we maintained a liability of
$300,000
related to unrecognized income tax benefits and
$1.0 million
related to contingencies for taxes other than income. As of
December 31, 2012
, we maintained a liability of
$300,000
related to unrecognized income tax benefits and
$82,000
related to contingencies for taxes other than income. We recorded an additional accrual in 2013 related to taxes other than income based upon a re-assessment of these tax-related contingencies.
21. Q
UARTERLY
F
INANCIAL
D
ATA
(U
NAUDITED
)
In our opinion, the quarterly financial information shown below includes all adjustments necessary for a fair presentation of the operations for such periods. Due to the seasonal nature of our business, there are substantial variations in operations reported on a quarterly basis.
|
For the Quarters Ended
|
|||||||||||||||
|
March 31
|
June 30
|
September 30
|
December 31
|
||||||||||||
|
(in thousands except per share amounts)
|
|
|
|
|
|||||||||||
|
2013
(1)
|
|||||||||||||||
|
Operating Revenue
|
$
|
140,729
|
|
$
|
94,146
|
|
$
|
86,545
|
|
$
|
122,887
|
|
|||
|
Operating Income
|
$
|
26,550
|
|
$
|
9,152
|
|
$
|
8,720
|
|
$
|
18,312
|
|
|||
|
Net Income
|
$
|
14,869
|
|
$
|
4,356
|
|
$
|
3,879
|
|
$
|
9,683
|
|
|||
|
Earnings per share:
|
|||||||||||||||
|
Basic
|
$
|
1.55
|
|
$
|
0.45
|
|
$
|
0.40
|
|
$
|
1.01
|
|
|||
|
Diluted
|
$
|
1.54
|
|
$
|
0.45
|
|
$
|
0.40
|
|
$
|
1.00
|
|
|||
|
2012
(1)
|
|||||||||||||||
|
Operating Revenue
|
$
|
120,914
|
|
$
|
83,897
|
|
$
|
78,175
|
|
$
|
109,516
|
|
|||
|
Operating Income
|
$
|
20,073
|
|
$
|
10,455
|
|
$
|
7,564
|
|
$
|
18,543
|
|
|||
|
Net Income
|
$
|
10,727
|
|
$
|
5,060
|
|
$
|
3,219
|
|
$
|
9,857
|
|
|||
|
Earnings per share:
|
|||||||||||||||
|
Basic
|
$
|
1.12
|
|
$
|
0.53
|
|
$
|
0.34
|
|
$
|
1.03
|
|
|||
|
Diluted
|
$
|
1.11
|
|
$
|
0.52
|
|
$
|
0.33
|
|
$
|
1.02
|
|
|||
|
(1)
|
The sum of the four quarters does not equal the total year due to rounding.
|
Chesapeake Utilities Corporation 2013 Form 10-K Page
103
I
TEM
9. C
HANGES
I
N
AND
D
ISAGREEMENTS
W
ITH
A
CCOUNTANTS
ON
A
CCOUNTING
AND
F
INANCIAL
D
ISCLOSURE
.
None.
I
TEM
9A. C
ONTROLS
AND
P
ROCEDURES
.
EVALUATION OF DISCLOSURE CONTROLS AND PROCEDURES
Our Chief Executive Officer and Chief Financial Officer, with the participation of other Company officials, have evaluated our “disclosure controls and procedures” (as such term is defined under Rule 13a-15(e) and 15d – 15(e) promulgated under the Securities Exchange Act of 1934, as amended) as of
December 31, 2013
. Based upon their evaluation, our Chief Executive Officer and Chief Financial Officer concluded that our disclosure controls and procedures were effective as of
December 31, 2013
.
CHANGE IN INTERNAL CONTROLS
There has been no change in internal control over financial reporting (as such term is defined in Exchange Act Rule 13a-15(f)) that occurred during the quarter ended
December 31, 2013
, that materially affected, or is reasonably likely to materially affect, internal control over financial reporting.
CEO AND CFO CERTIFICATIONS
Our Chief Executive Officer and Chief Financial Officer have filed with the SEC the certifications required by Section 302 of the Sarbanes-Oxley Act of 2002 as Exhibits 31.1 and 31.2 to our Annual Report on Form 10-K for the fiscal year ended
December 31, 2013
. In addition, on June 4, 2013, our Chief Executive Officer certified to the NYSE that he was not aware of any violation by us of the NYSE corporate governance listing standards.
MANAGEMENT'S REPORT ON INTERNAL CONTROL OVER FINANCIAL REPORTING
Management is responsible for establishing and maintaining adequate internal control over financial reporting, as such term is defined in Rule 13a-15(f) of the Exchange Act. A company’s internal control over financial reporting is a process designed to provide reasonable assurance regarding the reliability of financial reporting and the preparation of financial statements for external purposes in accordance with GAAP. A company’s internal control over financial reporting includes those policies and procedures that: (i) pertain to the maintenance of records which in reasonable detail, accurately and fairly reflect the transactions and dispositions of the assets of the company; (ii) provide reasonable assurance that transactions are recorded as necessary to permit preparation of financial statements in accordance with GAAP and that receipts and expenditures of the company are being made only in accordance with authorizations of management and directors of the company; and (iii) provide reasonable assurance regarding prevention or timely detection of unauthorized acquisition, use, or disposition of the company’s assets that could have a material effect on the financial statements.
Under the supervision and with the participation of management, including the principal executive officer and principal financial officer, our management conducted an evaluation of the effectiveness of its internal control over financial reporting based on the criteria established in an updated report entitled “Internal Control — Integrated Framework,” issued in May 2013 by the Committee of Sponsoring Organizations of the Treadway Commission. Because of its inherent limitations, internal control over financial reporting may not prevent or detect misstatements. Also, projections of any evaluation of effectiveness to future periods are subject to the risk that controls may become inadequate because of changes in conditions, or that the degree of compliance with the policies or procedures may deteriorate.
Our management has evaluated and concluded that our internal control over financial reporting was effective as of
December 31, 2013
.
Our independent auditors, ParenteBeard LLC, have audited and issued their report on effectiveness of our internal control over financial reporting. That report appears on the following page.
Chesapeake Utilities Corporation 2013 Form 10-K Page
104
R
EPORT
OF
I
NDEPENDENT
R
EGISTERED
P
UBLIC
A
CCOUNTING
F
IRM
The Board of Directors and Stockholders of
Chesapeake Utilities Corporation
We have audited Chesapeake Utilities Corporation’s (the “Company”) internal control over financial reporting as of December 31, 2013, based on criteria established in Internal Control-Integrated Framework issued by the Committee of Sponsoring Organizations of the Treadway Commission (“COSO”) (2013 framework). The Company’s management is responsible for maintaining effective internal control over financial reporting, and for its assessment of the effectiveness of internal control over financial reporting, included in the accompanying Management’s Report on Internal Control Over Financial Reporting. Our responsibility is to express an opinion on the Company’s internal control over financial reporting based on our audit.
We conducted our audit in accordance with the standards of the Public Company Accounting Oversight Board (United States). Those standards require that we plan and perform the audit to obtain reasonable assurance about whether effective internal control over financial reporting was maintained in all material respects. Our audit of internal control over financial reporting included obtaining an understanding of internal control over financial reporting, assessing the risk that a material weakness exists, and testing and evaluating the design and operating effectiveness of internal control based on the assessed risk. Our audit also included performing such other procedures as we considered necessary in the circumstances. We believe that our audit provides a reasonable basis for our opinion.
A company’s internal control over financial reporting is a process designed to provide reasonable assurance regarding the reliability of financial reporting and the preparation of financial statements for external purposes in accordance with accounting principles generally accepted in the United States of America. A company’s internal control over financial reporting includes those policies and procedures that (1) pertain to the maintenance of records that, in reasonable detail, accurately and fairly reflect the transactions and dispositions of the assets of the company; (2) provide reasonable assurance that transactions are recorded as necessary to permit preparation of financial statements in accordance with generally accepted accounting principles, and that receipts and expenditures of the company are being made only in accordance with authorizations of management and directors of the company; and (3) provide reasonable assurance regarding prevention or timely detection of unauthorized acquisition, use, or disposition of the company’s assets that could have a material effect on the financial statements.
Because of its inherent limitations, internal control over financial reporting may not prevent or detect misstatements. Also, projections of any evaluation of effectiveness to future periods are subject to the risk that controls may become inadequate because of changes in conditions, or that the degree of compliance with the policies or procedures may deteriorate.
In our opinion, the Company maintained, in all material respects, effective internal control over financial reporting as of December 31, 2013, based on criteria established in Internal Control-Integrated Framework issued by COSO (2013 framework).
We also have audited, in accordance with the standards of the Public Company Accounting Oversight Board (United States), the consolidated balance sheets of the Company as of December 31, 2013 and 2012, and the related consolidated statements of income, comprehensive income, stockholders’ equity, and cash flows of the Company and our report dated March 6, 2014 expressed an unqualified opinion.
/s/ ParenteBeard LLC
Philadelphia, Pennsylvania
March 6, 2014
Chesapeake Utilities Corporation 2013 Form 10-K Page
105
I
TEM
9B. O
THER
I
NFORMATION
.
None.
P
ART
III
I
TEM
10. D
IRECTORS
, E
XECUTIVE
O
FFICERS
OF
THE
R
EGISTRANT
AND
C
ORPORATE
G
OVERNANACE
.
The information required by this Item is incorporated herein by reference to the portions of the Proxy Statement, captioned “Election of Directors (Proposal 1),” “Information Concerning Nominees and Continuing Directors,” “Corporate Governance,” “Committees of the Board – Audit Committee” and “Section 16(a) Beneficial Ownership Reporting Compliance,” to be filed no later than March 31, 2014, in connection with our Annual Meeting to be held on or about
May 6, 2014
.
The information required by this Item with respect to executive officers is, pursuant to instruction 3 of paragraph (b) of Item 401 of Regulation S-K, set forth in this report following Item 4, as
Item 4A Executive Officers of the Registrant
.
We have adopted a Code of Ethics for Financial Officers, which applies to our principal executive officer, president, principal financial officer, principal accounting officer or controller, or persons performing similar functions. The information set forth under Item 1 hereof concerning the Code of Ethics for Financial Officers is filed herewith.
I
TEM
11. E
XECUTIVE
C
OMPENSATION
.
The information required by this Item is incorporated herein by reference to the portions of the Proxy Statement, captioned “Director Compensation,” “Executive Compensation” and “Compensation Discussion and Analysis” in the Proxy Statement to be filed no later than March 31, 2014, in connection with our Annual Meeting to be held on or about
May 6, 2014
.
I
TEM
12. S
ECURITY
O
WNERSHIP
OF
C
ERTAIN
B
ENEFICIAL
O
WNERS
AND
M
ANAGEMENT
AND
R
ELATED
S
TOCKHOLDER
M
ATTERS
.
The information required by this Item is incorporated herein by reference to the portion of the Proxy Statement, captioned “Security Ownership of Certain Beneficial Owners and Management” to be filed no later than March 31, 2014, in connection with our Annual Meeting to be held on or about
May 6, 2014
.
The following table sets forth information, as of December 31, 2013, with respect to our SICP, under which shares of Chesapeake common stock are authorized for issuance:
|
(a)
Number of securities to
be issued upon exercise
of outstanding options,
warrants, and rights
|
(b)
Weighted-average
exercise price
of outstanding options,
warrants, and rights
|
(c)
Number of securities
remaining available for
future issuance under
equity compensation
plans (excluding
securities reflected in column (a))
|
|||||||
|
Equity compensation plans approved by security holders
|
—
|
|
—
|
|
441,241
|
|
|||
|
Equity compensation plans not approved by security holders
|
—
|
|
—
|
|
—
|
|
|||
|
Total
|
—
|
|
—
|
|
441,241
|
|
|||
I
TEM
13. C
ERTAIN
R
ELATIONSHIPS
AND
R
ELATED
T
RANSACTIONS
,
AND
D
IRECTOR
I
NDEPENDENCE
.
The information required by this Item is incorporated herein by reference to the portion of the Proxy Statement captioned, “Corporate Governance,” to be filed no later than March 31, 2014 in connection with our Annual Meeting to be held on or about
May 6, 2014
.
Chesapeake Utilities Corporation 2013 Form 10-K Page
106
I
TEM
14. P
RINCIPAL
A
CCOUNTING
F
EES
AND
S
ERVICES
.
The information required by this Item is incorporated herein by reference to the portion of the Proxy Statement, captioned “Fees and Services of Independent Registered Public Accounting Firm,” to be filed no later than March 31, 2014, in connection with our Annual Meeting to be held on or about
May 6, 2014
.
Chesapeake Utilities Corporation 2013 Form 10-K Page
107
P
ART
IV
I
TEM
15. E
XHIBITS
, F
INANCIAL
S
TATEMENT
S
CHEDULES
.
The following documents are filed as part of this report:
(a)(1) All of the financial statements, reports and notes to the financial statements included in Item 8 of Part II of this Annual Report on Form 10-K.
(a)(2) Report of Independent Registered Public Accounting Firm; and Schedule II—Valuation and Qualifying Accounts.
(a)(3) The Exhibits below.
|
• Exhibit 3.1
|
|
Amended and Restated Certificate of Incorporation of Chesapeake Utilities Corporation is incorporated herein by reference to Exhibit 3.1 of our Quarterly Report on Form 10-Q for the period ended June 30, 2010, File No. 001-11590.
|
|
• Exhibit 3.2
|
|
Amended and Restated Bylaws of Chesapeake Utilities Corporation, effective December 4, 2012, are incorporated herein by reference to Exhibit 3 of our Current Report on Form 8-K, filed December 7, 2012, File No. 001-11590.
|
|
• Exhibit 4.1
|
|
Form of Indenture between Chesapeake and Boatmen’s Trust Company, Trustee, with respect to the 8 1/4% Convertible Debentures is incorporated herein by reference to Exhibit 4.2 of our Registration Statement on Form S-2, Reg. No. 33-26582, filed on January 13, 1989.
|
|
• Exhibit 4.2
|
|
Note Purchase Agreement entered into by Chesapeake on December 27, 2000, pursuant to which Chesapeake privately placed $20 million of its 7.83% Senior Notes, due in 2015, is incorporated by reference to Exhibit 4.4 of our Annual Report on Form 10-K for the year ended December 31, 2009, File No. 001-11590.
|
|
• Exhibit 4.3
|
|
Note Agreement entered into by Chesapeake on October 31, 2002, pursuant to which Chesapeake privately placed $30 million of its 6.64% Senior Notes, due in 2017, is incorporated herein by reference to Exhibit 2 of our Current Report on Form 8-K, filed November 6, 2002, File No. 001-11590.
|
|
• Exhibit 4.4
|
|
Note Agreement entered into by Chesapeake on October 18, 2005, pursuant to which Chesapeake, on October 12, 2006, privately placed $20 million of its 5.5% Senior Notes, due in 2020, with Prudential Investment Management, Inc., is incorporated herein by reference to Exhibit 4.1 of our Annual Report on Form 10-K for the year ended December 31, 2005, File No. 001-11590.
|
|
• Exhibit 4.5
|
|
Note Agreement entered into by Chesapeake on October 31, 2008, pursuant to which Chesapeake, on October 31, 2008, privately placed $30 million of its 5.93% Senior Notes, due in 2023, with General American Life Insurance Company and New England Life Insurance Company, is incorporated by reference to Exhibit 4.7 of our Annual Report on Form 10-K for the year ended December 31, 2009, File No. 001-11590.
|
|
• Exhibit 4.6
|
|
Note Agreement entered into by Chesapeake on June 23, 2011, pursuant to which Chesapeake privately placed $29 million of its 5.68% Senior Notes, due in 2026, with Metropolitan Life Insurance Company and New England Life Insurance Company is not being filed herewith pursuant to Item 601(b)(4)(v) of Regulation S-K under the Securities Act of 1933, as amended. We hereby agree to furnish a copy of that agreement to the SEC upon request.
|
|
• Exhibit 4.7
|
|
Note Agreement entered into by Chesapeake on June 23, 2011, pursuant to which Chesapeake privately placed $7 million of its 6.43% Senior Notes, due in 2028, with Metropolitan Life Insurance Company is not being filed herewith pursuant to Item 601(b)(4)(v) of Regulation S-K under the Securities Act of 1933, as amended. We hereby agree to furnish a copy of that agreement to the SEC upon request.
|
|
• Exhibit 4.8
|
Note Agreement entered into by Chesapeake on September 5, 2013 pursuant to which Chesapeake privately placed Series A Notes of its 3.73% Senior Notes, due 2028 and will issue Series B Notes to the Noteholders is not being filed herewith pursuant to Item 601(b)(4)(v) of Regulation S-K under the Securities Act of 1933, as amended. We hereby agree to furnish a copy of the agreement to the SEC upon request.
|
|
Chesapeake Utilities Corporation 2013 Form 10-K Page
108
|
• Exhibit 4.9
|
|
Form of Indenture of Mortgage and Deed of Trust between Florida Public Utilities Company and the trustee, dated September 1, 1942 for the First Mortgage Bonds, is incorporated herein by reference to Exhibit 7-A of Florida Public Utilities Company’s Registration No. 2-6087.
|
|
• Exhibit 4.10
|
|
Seventeenth Supplemental Indenture entered into by Chesapeake Utilities Corporation and Florida Public Utilities Company, on April 12, 2011, pursuant to which Chesapeake Utilities Corporation guarantees the payment and performance obligations of Florida Public Utilities Company under the Indenture, is incorporated herein by reference to Exhibit 4.1 of our Quarterly Report on Form 10-Q for the period ended March 31, 2011, File No. 001-11590.
|
|
• Exhibit 4.11
|
|
Sixteenth Supplemental Indenture entered into by Chesapeake Utilities Corporation and Florida Public Utilities Company, on December 1, 2009, pursuant to which Chesapeake Utilities Corporation, on December 1, 2009 guaranteed the secured First Mortgage Bonds of Florida Public Utilities Company under the Merger Agreement, is incorporated herein by reference to Exhibit 4.9 of our Annual Report on Form 10-K for the year ended December 31, 2010, File No. 001-11590.
|
|
• Exhibit 4.12
|
|
Thirteenth Supplemental Indenture entered into by Florida Public Utilities Company on June 1, 1992, pursuant to which Florida Public Utilities, on May 1, 1992, privately placed $8,000,000 of its 9.08% First Mortgage Bonds, is incorporated herein by reference to Exhibit 4 to Florida Public Utilities Company’s Quarterly Report on Form 10-Q for the period ended June 30, 1992.
|
|
• Exhibit 10.1*
|
|
Chesapeake Utilities Corporation Cash Bonus Incentive Plan, dated January 1, 2005, is incorporated herein by reference to Exhibit 10.3 of our Annual Report on Form 10-K for the year ended December 31, 2004, File No. 001-11590.
|
|
• Exhibit 10.2*
|
|
Chesapeake Utilities Corporation Directors Stock Compensation Plan, adopted in 2005, is incorporated herein by reference to our Proxy Statement dated March 28, 2005, in connection with our Annual Meeting held on May 5, 2005, File No. 001-11590.
|
|
• Exhibit 10.3*
|
|
Chesapeake Utilities Corporation Employee Stock Award Plan, adopted in 2005, is incorporated herein by reference to our Proxy Statement dated March 28, 2005, in connection with our Annual Meeting held on May 5, 2005, File No. 001-11590.
|
|
• Exhibit 10.4*
|
|
Chesapeake Utilities Corporation Performance Incentive Plan, adopted in 2005, is incorporated herein by reference to our Proxy Statement dated March 28, 2005, in connection with our Annual Meeting held on May 5, 2005, File No. 001-11590.
|
|
• Exhibit 10.5*
|
Chesapeake Utilities Corporation 2013 Stock and Incentive Compensation Plan, effective May 2, 2013 is incorporated herein by reference to our Proxy Statement dated March 29, 2013 in connection with our Annual Meeting held on May 2, 2013, File No. 0000019745.
|
|
|
• Exhibit 10.6*
|
|
Chesapeake Utilities Corporation Deferred Compensation Plan, amended and restated as of January 1, 2009, is incorporated herein by reference to Exhibit 10.5 of our Annual Report on Form 10-K for the year ended December 31, 2008, File No. 001-11590.
|
|
• Exhibit 10.7*
|
|
First Amendment to the Chesapeake Utilities Corporation Deferred Compensation Plan, dated December 28, 2010, is incorporated herein by reference to Exhibit 10.6 of our Annual Report on Form 10-K for the year ended December 31, 2010, File No. 001-11590.
|
|
• Exhibit 10.8*
|
Non-Qualified Deferred Compensation Plan, effective January 1, 2014, is filed herewith.
|
|
|
• Exhibit 10.9*
|
|
Consulting Agreement dated January 2, 2013, by and between Chesapeake Utilities Corporation and John R. Schimkaitis, is incorporated herein by reference to Exhibit 10.7 of our Annual Report on Form 10-K for the year ended December 31, 2012, File No. 001-11590.
|
|
• Exhibit 10.10*
|
|
Executive Employment Agreement dated January 14, 2011, by and between Chesapeake Utilities Corporation and Michael P. McMasters, is incorporated herein by reference to Exhibit 10.1 of our Current Report on Form 8-K, filed January 21, 2011, File No. 001-11590.
|
|
• Exhibit 10.11*
|
Amendment to Executive Employment Agreement effective January 1, 2014, by and between Chesapeake Utilities Corporation and Michael P. McMasters, is incorporated herein by reference to Exhibit 10.1 of our Current Report on Form 8-K filed January 14, 2014, File No. 001-11590.
|
|
Chesapeake Utilities Corporation 2013 Form 10-K Page
109
|
• Exhibit 10.12*
|
|
Executive Employment Agreement dated January 9, 2013, by and between Chesapeake Utilities Corporation and Stephen C. Thompson, is incorporated herein by reference to Exhibit 10.9 of our Annual Report on Form 10-K for the year ended December 31, 2012, File No. 001-11590.
|
|
• Exhibit 10.13*
|
|
Executive Employment Agreement dated January 9, 2013, by and between Chesapeake Utilities Corporation and Beth W. Cooper, is incorporated herein by reference to Exhibit 10.10 of our Annual Report on Form 10-K for the year ended December 31, 2012, File No. 001-11590.
|
|
• Exhibit 10.14*
|
|
Executive Employment Agreement dated January 9, 2013, by and between Chesapeake Utilities Corporation and Elaine B. Bittner, incorporated herein by reference to Exhibit 10.11 of our Annual Report on Form 10-K for the year ended December 31, 2012, File No. 001-11590.
|
|
• Exhibit 10.15*
|
|
Form of Performance Share Agreement, effective January 14, 2011 for the period 2011 to 2013, pursuant to Chesapeake Utilities Corporation Performance Incentive Plan by and between Chesapeake Utilities Corporation and each of Michael P. McMasters, Beth W. Cooper, Stephen C. Thompson and Elaine B. Bittner, is incorporated herein by reference to Exhibit 10.2 of our Current Report on Form 8-K, filed January 21, 2011, File No. 001-11590.
|
|
• Exhibit 10.16*
|
|
Form of Performance Share Agreement, effective January 5, 2012 for the period 2012 to 2014, pursuant to Chesapeake Utilities Corporation Performance Incentive Plan by and between Chesapeake Utilities Corporation and each of Michael P. McMasters, Beth W. Cooper, Stephen C. Thompson and Elaine B. Bittner, is incorporated herein by reference to Exhibit 10.1 of our Current Report on Form 8-K, filed January 5, 2012, File No. 001-11590.
|
|
• Exhibit 10.17*
|
Form of Performance Share Agreement, effective January 8, 2013 for the period 2013 to 2015, pursuant to Chesapeake Utilities Corporation Performance Incentive Plan by and between Chesapeake Utilities Corporation and each of Michael P. McMasters, Beth W. Cooper, Stephen C. Thompson and Elaine B. Bittner, is incorporated herein by reference to Exhibit 10.15 of our Annual Report on Form 10-K for the year ended December 31, 2012, File No. 001-11590.
|
|
|
• Exhibit 10.18*
|
Form of Performance Share Agreement, effective January 7, 2014 for the period 2014 to 2016, pursuant to Chesapeake Utilities Corporation Performance Incentive Plan by and between Chesapeake Utilities Corporation and each of Michael P. McMasters, Beth W. Cooper, Stephen C. Thompson and Elaine B. Bittner, is filed herewith.
|
|
|
• Exhibit 10.19*
|
|
Chesapeake Utilities Corporation Supplemental Executive Retirement Plan, as amended and restated effective January 1, 2009, is incorporated herein by reference to Exhibit 10.27 of our Annual Report on Form 10-K for the year ended December 31, 2008, File No. 001-11590.
|
|
• Exhibit 10.20*
|
|
First Amendment to the Chesapeake Utilities Corporation Supplemental Executive Retirement Plan as amended and restated effective January 1, 2009, is incorporated herein by reference to Exhibit 10.30 of our Annual Report on Form 10-K for the year ended December 31, 2010, File No. 001-11590.
|
|
• Exhibit 10.21*
|
|
Chesapeake Utilities Corporation Supplemental Executive Retirement Savings Plan, as amended and restated effective January 1, 2009, is incorporated herein by reference to Exhibit 10.28 of our Annual Report on Form 10-K for the year ended December 31, 2008, File No. 001-11590.
|
|
• Exhibit 10.22*
|
|
First Amendment to the Chesapeake Utilities Corporation Supplemental Executive Retirement Savings Plan, dated October 28, 2010, is incorporated herein by reference to Exhibit 10.1 of our Quarterly Report on Form 10-Q for the period ended September 30, 2010, File No. 001-11590.
|
|
• Exhibit 10.23*
|
|
Second Amendment to the Chesapeake Utilities Corporation Supplemental Executive Retirement Savings Plan, effective January 1, 2012, is incorporated herein by reference to Exhibit 10.20 of our Annual Report on Form 10-K for the year ended December 31, 2012, File No. 001-11590.
|
|
• Exhibit 10.24
|
|
Amended and Restated Electric Service Contract between Florida Public Utilities Company and JEA dated November 6, 2008, is incorporated herein by reference to Exhibit 10.1 of Florida Public Utilities Company’s Current Report on Form 8-K, filed on November 6, 2008, File No. 001-10908.
|
Chesapeake Utilities Corporation 2013 Form 10-K Page
110
|
• Exhibit 10.25
|
|
Networking Operating Agreement between Florida Public Utilities Company and Southern Company Services, Inc. dated December 27, 2007 and amended on June 3, 2008, is incorporated herein by reference to Exhibit 10.3 of Florida Public Utilities Company’s Quarterly Report on Form 10-Q for the period ended June 30, 2008, File No. 001-10608.
|
|
• Exhibit 10.26
|
|
Network Integration Transmission Service Agreement between Florida Public Utilities Company and Southern Company Services, Inc. dated December 27, 2007 and amended on June 3, 2008, is incorporated herein by reference to Exhibit 10.4 of Florida Public Utilities Company’s Quarterly Report on Form 10-Q for the period ended June 30, 2008, File No. 001-10608.
|
|
• Exhibit 10.27
|
|
Form of Service Agreement for Firm Transportation Service between Florida Public Utilities Company and Florida Gas Transmission Company, LLC dated November 1, 2007 for the period November 2007 to February 2016 (Contract No. 107033), is incorporated herein by reference to Exhibit 10.1 of Florida Public Utilities Company’s Quarterly Report on Form 10-Q for the period ended September 30, 2007, File No. 001-10608.
|
|
• Exhibit 10.28
|
|
Form of Service Agreement for Firm Transportation Service between Florida Public Utilities Company and Florida Gas Transmission Company, LLC dated November 1, 2007 for the period November 2007 to March 2022 (Contract No. 107034), is incorporated herein by reference to Exhibit 10.2 of Florida Public Utilities Company’s Quarterly Report on Form 10-Q for the period ended September 30, 2007, File No. 001-10608.
|
|
• Exhibit 10.29
|
|
Form of Service Agreement for Firm Transportation Service between Florida Public Utilities Company and Florida Gas Transmission Company, LLC dated November 1, 2007 for the period November 2007 to February 2022 (Contract No. 107035), is incorporated herein by reference to Exhibit 10.3 of Florida Public Utilities Company’s Quarterly Report on Form 10-Q for the period ended September 30, 2007, File No. 001-10608.
|
|
• Exhibit 10.30
|
|
Form of Service Agreement for Generation Services entered into by Florida Public Utilities Company and Gulf Power Company, dated December 28, 2006, effective January 1, 2008 is hereby incorporated herein by reference to Exhibit 10(s) on Florida Public Utilities Company’s Annual Report on Form 10-K for the year ended December 31, 2006, File No. 001-10608.
|
|
• Exhibit 10.31
|
|
Amendment to Form of Service Agreement for Generation Services entered into by Florida Public Utilities Company and Gulf Power Company, effective January 25, 2011, is incorporated herein by reference to Exhibit 10.43 of our Annual Report on Form 10-K for the year ended December 31, 2010, File No. 001-10608.
|
|
• Exhibit 12
|
|
Computation of Ratio of Earning to Fixed Charges is filed herewith.
|
|
• Exhibit 14.1
|
|
Code of Ethics for Financial Officers is filed herewith.
|
|
• Exhibit 14.2
|
|
Business Code of Ethics and Conduct is filed herewith.
|
|
• Exhibit 21
|
|
Subsidiaries of the Registrant is filed herewith.
|
|
• Exhibit 23.1
|
|
Consent of Independent Registered Public Accounting Firm is filed herewith.
|
|
• Exhibit 31.1
|
|
Certificate of Chief Executive Officer of Chesapeake Utilities Corporation pursuant to Exchange Act Rule 13a-14(a) and 15d – 14(a), dated March 6, 2014, is filed herewith.
|
|
• Exhibit 31.2
|
|
Certificate of Chief Financial Officer of Chesapeake Utilities Corporation pursuant to Exchange Act Rule 13a-14(a) and 15d – 14(a), dated March 6, 2014, is filed herewith.
|
|
• Exhibit 32.1
|
|
Certificate of Chief Executive Officer of Chesapeake Utilities Corporation pursuant to 18 U.S.C. Section 1350, dated March 6, 2014, is filed herewith.
|
|
• Exhibit 32.2
|
|
Certificate of Chief Financial Officer of Chesapeake Utilities Corporation pursuant to 18 U.S.C. Section 1350, dated March 6, 2014, is filed herewith.
|
|
• Exhibit 101.INS XBRL Instance Document is filed herewith.
|
||
|
• Exhibit 101.SCH XBRL Taxonomy Extension Schema Document is filed herewith.
|
||
|
• Exhibit 101.CAL XBRL Taxonomy Extension Calculation Linkbase Document is filed herewith.
|
||
|
• Exhibit 101.DEF XBRL Taxonomy Extension Definition Linkbase Document is filed herewith.
|
||
|
• Exhibit 101.LAB XBRL Taxonomy Extension Label Linkbase Document is filed herewith.
|
||
Chesapeake Utilities Corporation 2013 Form 10-K Page
111
|
• Exhibit 101.PRE XBRL Taxonomy Extension Presentation Linkbase Document is filed herewith.
|
||
|
*
|
Management contract or compensatory plan or agreement.
|
Chesapeake Utilities Corporation 2013 Form 10-K Page
112
S
IGNATURES
Pursuant to the requirements of Section 13 or 15 (d) of the Securities Exchange Act of 1934, Chesapeake Utilities Corporation has duly caused this report to be signed on its behalf by the undersigned, thereunto duly authorized.
|
C
HESAPEAKE
U
TILITIES
C
ORPORATION
|
|||
|
By:
|
/s/ M
ICHAEL
P. M
C
M
ASTERS
|
||
|
Michael P. McMasters,
|
|||
|
President and Chief Executive Officer
|
|||
|
Date: March 6, 2014
|
|||
Pursuant to the requirements of the Securities Exchange Act of 1934, this report has been signed below by the following persons on behalf of the registrant and in the capacities and on the dates indicated.
|
/
S
/ R
ALPH
J. A
DKINS
|
/
S
/ M
ICHAEL
P. M
C
M
ASTERS
|
||
|
Ralph J. Adkins,
|
Michael P. McMasters,
|
||
|
Chairman of the Board and Director
|
President, Chief Executive Officer and Director
|
||
|
Date: March 6, 2014
|
Date: March 6, 2014
|
||
|
/
S
/ B
ETH
W. C
OOPER
|
/
S
/ E
UGENE
H. B
AYARD
,E
SQ
|
||
|
Beth W. Cooper, Senior Vice President
|
Eugene H. Bayard, Esq., Director
|
||
|
and Chief Financial Officer
|
Date: March 6, 2014
|
||
|
(Principal Financial and Accounting Officer)
|
|||
|
Date: March 6, 2014
|
|||
|
/
S
/ R
ICHARD
B
ERNSTEIN
|
/
S
/ T
HOMAS
J. B
RESNAN
|
||
|
Richard Bernstein, Director
|
Thomas J. Bresnan, Director
|
||
|
Date: March 6, 2014
|
Date: March 6, 2014
|
||
|
/
S
/ T
HOMAS
P. H
ILL
, J
R
.
|
/
S
/ D
ENNIS
S. H
UDSON
, III
|
||
|
Thomas P. Hill, Jr., Director
|
Dennis S. Hudson, III, Director
|
||
|
Date: March 6, 2014
|
Date: March 6, 2014
|
||
|
/
S
/ P
AUL
L. M
ADDOCK
, J
R
.
|
/S/
J
OSEPH
E
.
M
OORE
,
E
SQ
|
||
|
Paul L. Maddock, Jr., Director
|
Joseph E. Moore, Esq., Director
|
||
|
Date: March 6, 2014
|
Date: March 6, 2014
|
||
|
/
S
/ C
ALVERT
A. M
ORGAN
, JR.
|
/
S
/ D
IANNA
F. M
ORGAN
|
||
|
Calvert A. Morgan, Jr., Director
|
Dianna F. Morgan, Director
|
||
|
Date: March 6, 2014
|
Date: March 6, 2014
|
||
|
/
S
/ J
OHN
R. S
CHIMKAITIS
|
|||
|
John R. Schimkaitis
|
|||
|
Vice Chairman of Board and Director
|
|||
|
Date: March 6, 2014
|
|||
Chesapeake Utilities Corporation 2013 Form 10-K Page
113
|
R
EPORT
OF
I
NDEPENDENT
R
EGISTERED
P
UBLIC
A
CCOUNTING
F
IRM
|
The Board of Directors and Stockholders of
Chesapeake Utilities Corporation
The audit referred to in our report dated
March 6, 2014
relating to the consolidated financial statements of Chesapeake Utilities Corporation (the “Company”) as of December 31, 2013 and 2012 and for each of the years in the three-year period ended December 31, 2013, which is contained in Item 8 of this Form 10-K also included the audits of the financial statement schedule listed in Item 15(a)2. This financial statement schedule is the responsibility of the Company’s management. Our responsibility is to express an opinion on this financial statement schedule based on our audits.
In our opinion, such financial statement schedule, when considered in relation to the basic consolidated financial statements taken as a whole, present fairly, in all material respects, the information set forth therein.
/s/ ParenteBeard LLC
Philadelphia, Pennsylvania
March 6, 2014
Chesapeake Utilities Corporation and Subsidiaries
Schedule II
Valuation and Qualifying Accounts
|
|
|
Additions
|
|
|
||||||||||||||
|
For the Year Ended December 31,
|
Balance at
Beginning of
Year
|
Charged to
Income
|
Other
Accounts
(1)
|
Deductions
(2)
|
Balance at End
of Year
|
|||||||||||||
|
(In thousands)
|
|
|
|
|
|
|||||||||||||
|
Reserve Deducted From Related Assets
|
||||||||||||||||||
|
Reserve for Uncollectible Accounts
|
||||||||||||||||||
|
2013
|
$
|
826
|
|
$
|
1,796
|
|
$
|
249
|
|
(1,236
|
)
|
$
|
1,635
|
|
||||
|
2012
|
$
|
1,090
|
|
$
|
826
|
|
$
|
354
|
|
(1,444
|
)
|
$
|
826
|
|
||||
|
2011
|
$
|
1,194
|
|
$
|
1,157
|
|
$
|
293
|
|
(1,554
|
)
|
$
|
1,090
|
|
||||
|
(1)
|
Recoveries.
|
|
(2)
|
Uncollectible accounts charged off.
|
TABLE OF CONTENTS
Item 7. Management S Discussion and Analysis Of Financial Condition and Results Of OperationItem 8. Financial Statements and Supplementary DataNote 5, Segment Information,Note 18, Rates and Other Regulatory Activities,Item 7, Management S Discussion and Analysis Of Financial Condition and Results Of Operations Market RiskNote 19, Environmental Commitments and ContingenciesItem 7. Management S Discussion and Analysis Of Financial Condition and Results Of OperationsItem 8, Financial Statements and Supplementary DataNote 16, Employee Benefit PlansItem 1a, Risk FactorsItem 8, Financial Statements and Supplementary Data (Note 2, Summary Of Significant Accounting PoliciesNote 4, AcquisitionsItem 8, Financial Statements and Supplementary Data, Note 12, Long-term DebtItem 8, Financial Statements and Supplementary Data,Note 14, Lease ObligationsItem 8, Financial Statements and Supplementary Data, Note 4, AcquisitionsItem 8, Financial Statements and Supplementary Data, Note 20, Other Commitments and ContingenciesItem 7a, Quantitative and Qualitative Disclosures About Market RiskItem 8, Financial Statements and Supplementary Data, Note 16, Employee Benefit PlanItem 7A. Q Uantitative and Q Ualitative D Isclosures A Bout M Arket R IskItem 7A. QNote 16, Employee Benefit Plans,Note 10, Goodwill and Other Intangible AssetsNote 18, Rates and Other Regulatory ActivitiesNote 16, Employee Benefit Plans, Provides The Fair Value Measurement Information For Our Pension Plan AssetsNote 9, InvestmentsNote 4, Acquisitions,Note 20, Other Commitments and ContingenciesNote 12, Long-term DebItem 4A Executive Officers Of The Registrant