CAPRI HOLDINGS LTD
10-Ks,20-Fs and 10-Qs
|
|
|
|
|
|
|
|
|
|
|
|
|
|
|
|
|
|
|
|
|
|
|
|
|
|
|
|
|
|
|
|
|
|
|
|
|
|
|
|
|
|
|
|
|
|
|
UNITED STATES
SECURITIES AND EXCHANGE COMMISSION
Washington, D.C. 20549
|
FORM 10-K
|
||||
(Mark One)
|
ý
|
ANNUAL REPORT PURSUANT TO SECTION 13 OR 15(d) OF THE SECURITIES EXCHANGE ACT OF 1934
|
For the fiscal year ended April 1, 2017
or
|
¨
|
TRANSITION REPORT PURSUANT TO SECTION 13 OR 15(d) OF THE SECURITIES EXCHANGE ACT OF 1934
|
For the transition period from
to
Commission file number 001-35368
|
Michael Kors Holdings Limited
(Exact Name of Registrant as Specified in Its Charter)
|
||||
|
British Virgin Islands
|
N/A
|
|
(State or other jurisdiction of incorporation or organization)
|
(I.R.S. Employer Identification No.)
|
33 Kingsway
London, United Kingdom
WC2B 6UF
(Address of Principal Executive Offices)
Registrant’s telephone number, including area code: 44 207 632 8600
Securities registered or to be registered pursuant to Section 12(b) of the Act:
|
Title of Each Class
|
Name of Each Exchange on which Registered
|
|
Ordinary Shares, no par value
|
New York Stock Exchange
|
Securities registered or to be registered pursuant to Section 12(g) of the Act: None
|
Indicate by check mark if the registrant is a well-known seasoned issuer, as defined in Rule 405 of the Securities Act.
|
ý
Yes
¨
No
|
|
Indicate by check mark if the registrant is not required to file reports pursuant to Section 13 or Section 15(d) of the Act.
|
¨
Yes
ý
No
|
|
Indicate by check mark whether the registrant (1) has filed all reports required to be filed by Section 13 or 15(d) of the Securities Exchange Act of 1934 during the preceding 12 months (or for such shorter period that the registrant was required to file such reports), and (2) has been subject to such filing requirements for the past 90 days.
|
ý
Yes
¨
No
|
|
Indicate by check mark whether the registrant has submitted electronically and posted on its corporate Website, if any, every Interactive Data File required to be submitted and posted pursuant to Rule 405 of Regulation S-T (§232.405 of this chapter) during the preceding 12 months (or for such shorter period that the registrant was required to submit and post such files).
|
ý
Yes
¨
No
|
|
Indicate by check mark if disclosure of delinquent filers pursuant to Item 405 of Regulation S-K (§229.405 of this chapter) is not contained herein, and will not be contained, to the best of registrant’s knowledge, in definitive proxy or information statements incorporated by reference in Part III of this Form 10-K or any amendment to this Form 10-K.
|
¨
|
Indicate by check mark whether the registrant is a large accelerated filer, an accelerated filer, a non-accelerated filer, or a smaller reporting company. See the definitions of “large accelerated filer,” “accelerated filer” and “smaller reporting company” in Rule 12b-2 of the Exchange Act. (Check one):
|
Large accelerated filer
|
ý
|
Accelerated filer
|
¨
|
|
Non-accelerated filer
|
¨
(Do not check if smaller reporting company)
|
Smaller reporting company
|
¨
|
|
Emerging growth company
|
¨
|
||
|
If an emerging growth company, indicate by check mark if the registrant has elected not to use the extended transition period for complying with any new or revised financial accounting standards provided pursuant to Section 13(a) of the Exchange Act.
|
¨
|
||
|
Indicate by check mark whether the registrant is a shell company (as defined in Rule 12b-2 of the Act).
|
¨
Yes
ý
No
|
||
The aggregate market value of the registrant’s voting and non-voting ordinary shares held by non-affiliates of the registrant was $7,374,518,747 as of October 1, 2016, the last business day of the registrant’s most recently completed second fiscal quarter based on the closing price of the common stock on the New York Stock Exchange.
As of May 25, 2017, Michael Kors Holdings Limited had
155,839,126
ordinary shares outstanding.
DOCUMENTS INCORPORATED BY REFERENCE
The information required by Part III of this report, to the extent not set forth herein, is incorporated by reference from the Registrant’s definitive Proxy Statement, which will be filed in June 2017, for the 2017 Annual Meeting of the Shareholders.
TABLE OF CONTENTS
|
|
|
Page
|
|
Item 1
|
||
|
Item 1A
|
||
|
Item 1B
|
||
|
Item 2
|
||
|
Item 3
|
||
|
Item 4
|
||
|
Item 5
|
||
|
Item 6
|
||
|
Item 7
|
||
|
Item 7A
|
||
|
Item 8
|
||
|
Item 9
|
||
|
Item 9A
|
||
|
Item 10
|
||
|
Item 11
|
||
|
Item 12
|
||
|
Item 13
|
||
|
Item 14
|
||
|
Item 15
|
||
2
NOTE REGARDING FORWARD-LOOKING STATEMENTS
The statements in this Annual Report on Form 10-K, including documents incorporated herein by reference, that refer to plans and expectations for future periods are forward-looking statements. These forward-looking statements are based on management’s current expectations. Words such as “expects,” “anticipates,” “plans,” “believes,” “estimates,” “may,” “will,”, “should” and variations of such words and similar expressions are intended to identify such forward-looking statements. You should not place undue reliance on such statements. These forward-looking statements are subject to a number of risks and uncertainties, many of which are beyond the Company’s control, which could cause the Company’s actual results to differ materially from those indicated in these forward-looking statements. These factors are more fully discussed in the Company’s risk factors, as they may be amended from time to time, which are set forth in the Company’s filings with the Securities and Exchange Commission, including in this Annual Report, particularly under “Item 1A. Risk Factors” and in “Item 7. Management’s Discussion and Analysis of Financial Condition and Results of Operations.” The Company undertakes no obligation to update or revise any forward-looking statements to reflect subsequent events or circumstances, except as required by applicable laws or regulations.
Electronic Access to Company Reports
Our investor website can be accessed at
www.michaelkors.com
under “Investor Relations.” Our Annual Reports on Form 10-K, Quarterly Reports on Form 10-Q and Current Reports filed with or furnished to the Securities and Exchange Commission (the “SEC”) pursuant to Section 13(a) or Section 15(d) of the Securities Exchange Act of 1934, as amended, are available free of charge on our investor website under the caption “SEC Filings” promptly after we electronically file such materials with, or furnish such materials to, the SEC. No information contained on our website is intended to be included as part of, or incorporated by reference into, this Annual Report on Form 10-K. Information relating to corporate governance at our Company, including our Corporate Governance Guidelines, our Code of Business Conduct and Ethics for all directors, officers, and employees, and information concerning our directors, Committees of the Board, including Committee charters, and transactions in Company securities by directors and executive officers, is available at our investor website under the captions “Corporate Governance” and “SEC Filings.” Paper copies of these filings and corporate governance documents are available to shareholders free of charge by written request to Investor Relations, Michael Kors Holdings Limited, 33 Kingsway, London, United Kingdom, WC2B 6UF. Documents filed with the SEC are also available on the SEC’s website at
www.sec.gov
.
3
Unless the context requires otherwise, references in this Annual Report on Form 10-K to “Michael Kors”, “we”, “us”, “our”, “the Company”, “our Company” and “our business” refer to Michael Kors Holdings Limited and its consolidated subsidiaries, unless the context requires otherwise. References to our stores, retail stores and retail segment include all of our full-price retail stores (including concessions), our e-commerce websites and outlet stores and the term “Fiscal,” with respect to any year, refers to the 52-week period ending on the Saturday closest to March 31 of such year, except for “Fiscal 2016,” which refers to the 53-week period ending April 2, 2016. Some differences in the numbers in the tables and text throughout this annual report may exist due to rounding. All comparable store sales are presented on a 52-week basis.
Our Company
We are a global luxury fashion brand led by a world-class management team and a renowned, award-winning designer. Since launching his namesake brand over 35 years ago, Michael Kors has featured distinctive designs, materials and craftsmanship with a jet-set aesthetic that combines stylish elegance and a sporty attitude. Mr. Kors’ vision has taken the Company from its beginnings as an American luxury sportswear house to a global accessories, footwear and apparel company with a presence in over 100 countries.
We operate our business in three segments — retail, wholesale and licensing — and we have a strategically controlled global distribution network focused on company-operated retail stores, leading department stores, specialty stores and select licensing partners. In
Fiscal 2017
, our retail segment accounted for approximately
57.2%
of our total revenue. As of
April 1, 2017
, our retail segment included:
•
398
retail stores in the Americas, including concessions;
•
429
international retail stores, including concessions, in Europe and Asia; and
|
•
|
our e-commerce sites in the United States ("U.S.") and Canada, as well as our newly launched e-commerce sites in France, Germany, Italy, Spain, Switzerland, the United Kingdom, China and Japan.
|
In
Fiscal 2017
, our wholesale segment accounted for approximately
39.5%
of our total revenue. As of
April 1, 2017
, our wholesale segment included:
•
wholesale sales through approximately
1,405
department stores and
904
specialty store doors in the Americas; and
•
wholesale sales through approximately
1,099
specialty stores and
199
department store doors internationally.
A small number of our wholesale customers account for a significant portion of our net sales. Net sales to our five largest wholesale customers represented
21.0%
of our total revenue for
Fiscal 2017
and
25.8%
of our total revenue for
Fiscal 2016
. Our largest wholesale customer, Macy's, accounted for
8.9%
of our total revenue for
Fiscal 2017
and
12.7%
of our total revenue for
Fiscal 2016
.
Our remaining revenue is generated through our licensing segment, through which we license to third parties certain production, sales and/or distribution rights through product and geographic licensing arrangements. In
Fiscal 2017
, our licensing segment accounted for approximately
3.3%
of our total revenue and consisted primarily of royalties earned on licensed products and our geographic licenses.
For additional financial information regarding our segments, see Segment Information note in the accompanying consolidated financial statements.
We offer three primary collections: the
Michael Kors
Collection
luxury line, the
MICHAEL Michael Kors
accessible luxury line and the
Michael Kors Mens
line.
Michael Kors
Collection
establishes the aesthetic authority of our entire brand and is carried in many of our retail stores, as well as in the finest luxury department stores in the world, including Bergdorf Goodman, Saks Fifth Avenue, Neiman Marcus and Holt Renfrew, among others. In 2004, we saw an opportunity to capitalize on the brand strength of the
Michael Kors
collection and address the significant demand opportunity in accessible luxury goods, and we introduced
MICHAEL Michael Kors
, which has a strong focus on accessories, in addition to offering footwear and apparel.
MICHAEL Michael Kors
is carried in all of our lifestyle stores, as well as leading department stores throughout the world, including Bloomingdale’s, Nordstrom, Macy’s, Harvey Nichols, Galeries Lafayette, Printemps, Lotte, Hyundai, Isetan and Lane Crawford, among others. More recently, we have begun to grow our men's business in recognition of the significant opportunity afforded by our brand's established fashion authority and the expanding men's market. Taken together, our primary collections target a broad customer base while retaining our premium luxury image.
4
Industry
We operate in the global luxury goods industry. Over the past ten years, the luxury goods industry has grown and has remained resilient during economic downturns. However, the accessible luxury retail and wholesale industry has recently been challenged by a number of factors, including lower consumer traffic trends, a promotional selling environment, lower tourist travel, currency effects, restrained consumer spending and a shift in spending from personal luxury goods to luxury experiences. As a result, while accessories have remained the biggest personal luxury goods category, the level of growth within this category, while still positive, has decelerated from prior years. In addition, the consumer demand within the luxury watch and luxury apparel categories has experienced a decline. While the wholesale channel has been challenged, the retail channel has continued to grow, largely driven by the rapid growth of the e-commerce channel and increased off-price sales, which has continued to cannibalize brick and mortar retail store sales. As the overall environment has become increasingly omni-channel, increased customer engagement and tailoring merchandise to customer shopping and communication preferences have become the key ingredients to winning market share. We believe that our innovative product offerings and customer engagement initiatives make us well positioned to capitalize on the continued growth of the luxury accessories product category, as it is one of our primary product categories of focus, as well as to grow our sales in other product categories.
Geographic Information
We generate revenue globally through our three segments. Through our retail and wholesale segments we sell our products in three principal geographic markets: the Americas, including North America, Latin America (excluding Brazil) and the Caribbean, Europe and Asia. Through our licensing segment, we enter into agreements that license to third parties the use of our brand name and trademarks, certain production rights, and sales and/or distribution rights. We have wholesale arrangements pursuant to which we sell products to our geographic licensees, including our licensees in certain parts of Asia (which were reported within our Americas wholesale operations prior to Fiscal 2016).
The following table details our net sales and revenue by segment and geographic location (in millions):
|
|
Fiscal Years Ended
|
|||||||||||
|
|
April 1,
2017 |
April 2,
2016 |
March 28,
2015 |
|||||||||
|
Retail net sales - The Americas
|
$
|
1,713.7
|
|
$
|
1,779.0
|
|
$
|
1,656.1
|
|
|||
|
Retail net sales - Europe
|
507.7
|
|
509.6
|
|
412.1
|
|
||||||
|
Retail net sales - Asia
|
350.7
|
|
106.3
|
|
66.4
|
|
||||||
|
Wholesale net sales - The Americas
|
1,340.9
|
|
1,628.6
|
|
1,662.5
|
|
||||||
|
Wholesale net sales - Europe
|
376.5
|
|
406.4
|
|
401.1
|
|
||||||
|
Wholesale net sales - Asia
|
58.4
|
|
108.9
|
|
1.5
|
|
||||||
|
Licensing Revenue- The Americas
|
86.1
|
|
99.0
|
|
100.3
|
|
||||||
|
Licensing Revenue- Europe
|
59.7
|
|
74.3
|
|
71.5
|
|
||||||
|
Total revenue
|
$
|
4,493.7
|
|
$
|
4,712.1
|
|
$
|
4,371.5
|
|
|||
Competitive Strengths
We believe that the following strengths differentiate us from our competitors:
Global Luxury Fashion Brand Led by a World-Renowned, Award-Winning Designer
. Over the years, we have transformed from an American luxury sportswear house to a global accessories, footwear and apparel company with presence in over 100 countries. Michael Kors, a world-renowned designer, personally leads our experienced design team. Mr. Kors and his team are responsible for conceptualizing and directing the design of all of our products, and their design leadership is a unique advantage that we possess. Mr. Kors has received a number of awards, which recognize the contribution Mr. Kors and his team have made to the fashion industry and our Company. We believe that the Michael Kors name has become synonymous with luxurious fashion that is timeless and elegant, expressed through sophisticated accessory and ready-to-wear collections. Each of our collections exemplifies the jet-set lifestyle and features high quality designs, materials and craftsmanship. Some of the most widely recognized global trendsetters—including celebrities such as Cate Blanchett, Viola Davis, Ashley Graham, Kate Hudson, Angelina Jolie, Blake Lively, Jennifer Lopez, Nicole Kidman, Taylor Swift, Gwyneth Paltrow, and the Duchess of Cambridge wear our collections. We have built a solid foundation for long-term growth through our innovative product offerings, strategically controlled retail and wholesale distribution networks, expanded digital presence and other initiatives.
5
Leveraging our Success in the Accessories Product Category to Grow our Brand Position in Other Product Categories.
The strength of our
Michael Kors
luxury collection and our accessible luxury
MICHAEL Michael Kors
lines
have allowed us to expand our brand awareness and position ourselves as one of the leading global luxury brands in the accessories product category. Capitalizing on the success of our accessories product category, we are continuing to grow and diversify our brand through other product categories, such as mens apparel and accessories, dresses, footwear and wearable technology.
Proven Multi-Format Retail Segment with Future Growth Opportunity
. In
Fiscal 2017
, our retail segment reported net sales of
$2.572 billion
, which represented a
7.4%
increase from net sales of
$2.395 billion
in
Fiscal 2016
. Within our retail segment we have four primary retail store formats: collection stores, lifestyle stores, outlet stores and e-commerce sites. Our collection stores are located in some of the world’s most prestigious shopping areas, such as Madison Avenue in New York and Rodeo Drive in California, and are generally 2,800 square feet in size. Our lifestyle stores are located in some of the world’s most frequented metropolitan shopping locations and leading regional shopping centers, and are generally 2,800 square feet in size. We also extend our reach to additional consumer groups through our outlet stores, which are generally 4,000 square feet in size. We also have e-commerce sites in the United States and Canada and have recently launched new e-commerce sites in China, France, Germany, Italy, Japan, Spain, Switzerland, and the United Kingdom. During Fiscal 2018, we plan to launch e-commerce sites in South Korea, as well as in additional countries in Europe. In addition to these four retail store formats, we operate concessions in a select number of department stores in North America and internationally.
Strong Relationships with Premier Wholesale Customers
. We partner with leading wholesale customers, such as Bergdorf Goodman, Saks Fifth Avenue, Neiman Marcus, Holt Renfrew, Bloomingdale’s and Macy’s in North America, as well as Harvey Nichols, Printemps, Selfridges and Galeries Lafayette in Europe. These relationships enable us to access large numbers of our key consumers in a targeted manner. Our "shop-in-shops" have specially trained staff, as well as customized fixtures, wall casings, decorative items, and flooring, and provide department store consumers with a more personalized shopping experience than traditional retail department store configurations. We are also engaged with our wholesale customers on various initiatives and have entered into new innovative supply chain partnerships with our wholesale customers designed to increase the speed at which our products reach the ultimate consumer. During Fiscal 2017, we began to strategically reduce shipments to decrease promotional activity within our wholesale channel. While we believe that this is necessary to appropriately position our brand long-term, net sales for our wholesale segment decreased by
17.2%
from
$2.144 billion
in
Fiscal 2016
to
$1.776 billion
in
Fiscal 2017
.
Innovative Product Offerings from our Licensing Segment
. The strength of our global brand has been instrumental in helping us build our licensing business. We collaborate with a select number of product licensees who produce and sell what we believe are products requiring specialized expertise that are enhanced by our brand strength, including Fossil Partners, LP. (“Fossil”) for watches and jewelry, Aramis and Designer Fragrances division of The Estée Lauder Companies Inc. (“Estée Lauder”) for fragrances and beauty and Luxottica Group ("Luxottica") for eyewear, among others. While total revenue for licensed products declined from
$173.3 million
in
Fiscal 2016
to
$145.8 million
in
Fiscal 2017
, primarily due to declines related to watch and jewelry product categories and lower geographic licensing revenues due to our acquisitions of the previously licensed operations in Greater China and South Korea, we have continued to introduce new and innovative product offerings in collaboration with our licensees, including the new line of Access smartwatches and other connected accessories launched in Fiscal 2017, as well as new fragrance offerings, including Wonderlust, Sexy Blossom and Turquoise. During Fiscal 2018, we plan to introduce additional fragrance and smartwatch offerings in collaboration with our licensees.
Proven and Experienced Management Team
. Our senior management team has extensive experience across a broad range of disciplines in the retail industry, including design, sales, marketing, public relations, merchandising, real estate, supply chain and finance. With an average of 27 years of experience in the retail industry, including at a number of public companies, and an average of ten years with Michael Kors, our senior management team has strong creative and operational experience and a successful track record. This extensive experience extends beyond our senior management team and deep into our organization.
Business Strategy
Our goal is to continue to create shareholder value by increasing our revenue and profits and strengthening our global brand. We plan to achieve our business strategy by focusing on the following six strategic initiatives:
Trendsetting and Innovative Product Offerings.
We will continue to introduce trendsetting and innovative products, as well as expanding our offerings across product categories to strengthen our position as a fashion leader and generate business growth through:
|
•
|
layered strategically-priced product offerings within our iconic accessory product lines, with unique craftsmanship and design features including personalization, logos, mixed-media leathers, and other detailed elements;
|
|
•
|
expanded licensed product offerings, including new fragrances and smartwatches;
|
6
|
•
|
continued women's apparel growth through increased dress assortment;
|
|
•
|
increased product offerings within our menswear and footwear businesses.
|
Enhanced Brand Communication.
We intend to continue increasing brand awareness and customer loyalty in a number of ways, including by:
|
•
|
leveraging Mr. Kors' global prestige and popularity through a variety of press activities and personal appearances;
|
|
•
|
holding our semi-annual runway shows that reinforce Mr. Kors' designer status and high-fashion image, hosting events in key markets around the world and creating excitement around
Michael Kors Collection, MICHAEL Michael Kors,
Michael Kors Mens
and
Michael Kors Access,
and generating global multimedia press coverage;
|
|
•
|
continuing to evolve our premier retail stores in preeminent, high-visibility locations around the world;
|
|
•
|
delivering a focused message and a clear brand point of view across all marketing channels and ensuring consistency of our product messaging through global marketing campaigns;
|
|
•
|
maintaining and refining our strong advertising position and editorial coverage in global fashion publications;
|
|
•
|
evolving our digital strategy to align with the media consumption habits of our target markets to ensure that we are promoting the right message to the right person at the right time and leveraging our social media presence to drive targeted, personalized reach; and
|
|
•
|
providing broad brand awareness in key global markets through increased outdoor advertising placements.
|
Leading Luxury Digital Presence
. We intend to continue making investments in technology focused on optimizing our digital presence, including:
|
•
|
expanding our international e-commerce presence by launching an additional e-commerce site in Europe, which will support eight countries, as well as an e-commerce site in South Korea in Fiscal 2018; and
|
|
•
|
continuing to evolve our digital experience in response to the shift in consumer preferences toward mobile devices with a focus on addressing new levels of customer service expectations.
|
Expanding Our Global Presence.
We will continue to increase our global penetration in Asia and Europe and leverage our existing operations in international locations to increase global brand awareness and market share by:
|
•
|
growing our recently acquired businesses in Asia through new store openings and increased investments in marketing to grow brand awareness;
|
|
•
|
providing a consistent, sophisticated jet-set lifestyle experience to our customers around the world; and
|
|
•
|
growing our existing global operations by further expanding our international e-commerce presence, elevating our store experience and optimizing our store fleet, as well as continuing to grow our mens' business and our apparel and footwear product categories around the world.
|
Continue to Grow our Men's Business.
We will continue to grow our men's apparel and accessories business and focus on increasing our brand presence and awareness through:
|
•
|
focused marketing and inclusion of our men’s lines within our global advertising campaigns;
|
|
•
|
increasing men's store presence and product assortment, including apparel and accessories, across all channels;
|
|
•
|
developing multi-tier men's product offerings designed to fill our multiple distribution needs; and
|
|
•
|
increased focus on design elements that emphasize logo and other iconic items associated with our brand.
|
Optimizing Customer Engagement.
We plan to continue to invest in technology and focus on customer relationship initiatives as part of our omni-channel strategy to provide a seamless customer experience across the different channels by:
|
•
|
creating a more personalized shopping experience catered to our customers' shopping preferences;
|
|
•
|
continuing to enhance customer experience through omni-channel order fulfillment, including by filling online orders through our retail stores and through our click-and-collect service offerings;
|
|
•
|
introducing new mobile technologies across our retail store and e-commerce network with enhanced styling and wardrobe-building tools and customer-preferred communication capabilities; and
|
|
•
|
introducing a new customer loyalty program, which we are planning to pilot during Fiscal 2018.
|
7
Collections and Products
We have three primary collections that offer accessories, footwear and apparel: the
Michael Kors
Collection,
MICHAEL Michael Kors
and
Michael Kors Mens
, all of which are offered through our retail and wholesale segments. We also offer licensed products primarily through our retail segment. Our net sales by major product category were as follows (in millions):
|
|
Fiscal Years Ended
|
||||||||||||||||
|
|
April 1,
2017 |
% of
Total |
April 2,
2016 |
% of
Total |
March 28,
2015 |
% of
Total |
|||||||||||
|
Accessories
|
$
|
3,061.4
|
|
70.4%
|
$
|
3,179.7
|
|
70.1%
|
$
|
2,872.2
|
|
68.4%
|
|||||
|
Apparel
|
543.2
|
|
12.5%
|
543.7
|
|
12.0%
|
549.4
|
|
13.1%
|
||||||||
|
Footwear
|
462.0
|
|
10.6%
|
491.0
|
|
10.8%
|
444.1
|
|
10.5%
|
||||||||
|
Licensed product
|
281.3
|
|
6.5%
|
324.4
|
|
7.1%
|
334.0
|
|
8.0%
|
||||||||
|
Net sales
|
$
|
4,347.9
|
|
$
|
4,538.8
|
|
$
|
4,199.7
|
|
||||||||
Michael Kors Collection
The
Michael Kors
Collection
is a sophisticated designer collection for women based on a philosophy of essential luxury and pragmatic glamour. The collection includes ready-to-wear and accessories, including handbags and small leather goods, and footwear, many of which are made from fine quality leathers and other exotic skins. Generally, our women's handbags and small leather goods retail from
$300
to
$6,000
, our footwear retails from
$300
to
$1,500
and our ready-to-wear retails from
$300
to
$6,000
.
MICHAEL Michael Kors
MICHAEL Michael Kors
has a strong focus on women's accessories, primarily handbags, as well as footwear and apparel for women, and is carried in all of our lifestyle stores as well as leading department stores throughout the world.
MICHAEL Michael Kors
offers: handbags designed to meet the fashion and functional requirements of our broad and diverse consumer base; small leather goods such as clutches, wallets, wristlets and cosmetic cases; footwear; and apparel, including dresses, tops, jeans, pants, skirts, shorts and outerwear. Generally, our handbags retail from
$200
to
$600
, our small leather goods retail from
$45
to
$250
, our footwear retails from
$40
to
$350
and our apparel retails from
$50
to
$500
.
Michael Kors Mens
Michael Kors Mens
is an innovative collection of men's ready-to-wear, accessories, and footwear with a modern American style. Our menswear apparel retails from
$50
to
$1,300
and our menswear accessories generally retail from $40 to $800.
Our Licensed Products
Watches
. Fossil has been our exclusive watch licensee since April 2004. Watches are sold in our retail stores, our e-commerce sites and by Fossil to wholesale customers in addition to select watch retailers. Generally, our fashion watches retail from
$195
to
$595
.
Jewelry
. Fossil has been our exclusive fashion jewelry licensee since December 2010. Our jewelry product line is complementary to our watches and accessories lines and is comprised of bracelets, necklaces, rings and earrings. Our jewelry is sold in our retail stores, our e-commerce sites and by Fossil to wholesale customers in addition to other specialty stores. Generally, our jewelry retails from
$55
to
$300
.
Wearable Technology
. In addition to the fashion watch and jewelry product categories discussed above, Fossil is our exclusive licensee for wearable technology and connected accessories. During Fiscal 2017, we introduced our first line of
Michael Kors Access
smart watches and other connected accessories, which retail from $95 to $500.
Eyewear
. Since January 2015, Luxottica has been our exclusive eyewear licensee for developing distinctive eyewear inspired by our collections. Our eyewear products are focused on status eyewear with sunglasses serving as a key category. Eyewear is sold in our retail stores, on our e-commerce sites and by Luxottica to wholesale customers in addition to select sunglass retailers and prescription eyewear providers. Generally, our eyewear retails from
$100
to
$210
.
8
Fragrances and Beauty
. Estée Lauder has been our exclusive women’s and men’s fragrance licensee since May 2003. Fragrances are sold in our retail stores, on our e-commerce sites and by Estée Lauder to wholesale customers in addition to select fragrance retailers. Our fragrance and related products generally retail from
$18
to
$125
.
Advertising and Marketing
Our marketing strategy is to deliver a brand and product message that is consistent with the Michael Kors brand image across all customer touch points on their path from brand consideration through purchase. Our global image is created and executed internally by our creative marketing, visual merchandising and public relations teams, which helps ensure the consistency of our message.
In
Fiscal 2017
, we recognized approximately
$118.7 million
in advertising and marketing expenses globally. We engage in a wide range of integrated marketing programs, across various marketing channels including but not limited to email marketing, print advertising, outdoor advertising, online marketing, social media, direct print mailings, public relations outreach, visual merchandising and partnership marketing, in an effort to engage our existing and potential customer base and ultimately stimulate sales in a consumer-preferred shopping venue. In addition, our spring and fall ready-to-wear collections, along with our latest accessories, are showcased at New York Fashion Week. The semi-annual runway shows also generate extensive media coverage.
The growing number of visitors to our e-commerce websites provides an opportunity to increase the size of our customer database and to communicate with our consumers to increase online and physical store sales, as well as build brand awareness. Our mobile optimized e-commerce sites feature the Michael Kors lifestyle images, which allows us to better engage new and existing customers and create innovative ways to keep the brand at the forefront of consumers’ minds by offering a broad selection of products, including accessories, apparel, and footwear. Since e-commerce growth is critical to our overall growth strategy, we continued to expand our global e-commerce presence by launching new e-commerce sites in six European countries, China and Japan during Fiscal 2017, and plan to launch e-commerce sites in additional countries in Europe and South Korea during Fiscal 2018.
Manufacturing and Sourcing
We contract for the purchase of finished goods principally with independent third-party manufacturing contractors, whereby the manufacturing contractor is generally responsible for the entire manufacturing process, including the purchase of piece goods and trim. We allocate product manufacturing among third-party agents based on their capabilities, the availability of production capacity, pricing and delivery. We have relationships with various agents who source our finished goods with numerous manufacturing contractors on our behalf. Although our relationships with our manufacturing contractors or agents are generally terminable at any time, we believe we have mutually satisfactory relationships with these third parties. In
Fiscal 2017
and Fiscal
2016
, one third-party agent sourced approximately
13.9%
and
14.9%
of our finished goods purchases, respectively. In
Fiscal 2017
, by dollar volume, approximately
96.3%
of our products were produced in Asia and Europe. See “Import Restrictions and Other Government Regulations” and Item 1A. —“Risk Factors” — “We primarily use foreign manufacturing contractors and independent third-party agents to source our finished goods, which poses legal, regulatory, political and economic risks to our business operations.”
Manufacturing contractors and agents operate under the close supervision of our global manufacturing divisions and buying agents headquartered in North America, Europe and Asia. All products are produced according to our specifications. Production staff monitors manufacturing at supplier facilities in order to correct problems prior to shipment of the final product. Quality assurance is focused on as early as possible in the production process, allowing merchandise to be received at the distribution facilities and shipped to customers with minimal interruption.
Distribution
Our primary distribution facility in the U.S. is the 1,284,420 square foot leased facility in Whittier, California, which we operate directly and services our retail stores, e-commerce site, and our wholesale operations in the U.S. We also engage in omni-channel order fulfillment by filling online orders through our retail stores and through our click-and-collect service offerings. Our primary distribution facility in Europe is our new Company-owned and operated 1,108,680 square foot distribution facility in Holland, which began during Fiscal 2017 to support our European operations, including the newly launched e-commerce sites. We are also in the process of transitioning out of our previous third-party operated distribution facility in Holland and anticipate to be fully transitioned to our Company-owned facility by the middle of Fiscal 2018.We also have a regional distribution center in Canada, which is leased, as well as regional distribution centers in China, Hong Kong, Japan, South Korea and Taiwan, which are operated by third-parties.
9
Intellectual Property
We own the
Michael Kors
and
MICHAEL Michael Kors
trademarks, as well as other material trademark rights related to the production, marketing and distribution of our products, both in the United States and in other countries in which our products are principally sold. We also have trademark applications pending for a variety of related marks and logos. We aggressively police our trademarks and pursue infringers both domestically and internationally. We also pursue counterfeiters in the United States, Europe, the Middle East, the Far East and elsewhere in the world in both online and offline channels through leads generated internally, as well as through our network of customs authorities, law enforcement, legal representatives and brand specialists around the world.
Pursuant to an agreement entered into by Mr. Kors in connection with the acquisition by our former principal shareholder of a majority interest in the Company in 2003, Mr. Kors (i) represented that all intellectual property rights used in connection with the Company’s business at such time were owned exclusively by the Company, (ii) assigned to the Company (to the extent not already assigned to and owned by the Company) exclusive worldwide rights in perpetuity to the “
Michael Kors
” name and trademark and all derivations thereof, as well as to Mr. Kors’ signature and likeness, and all goodwill associated therewith, (iii) agreed not to take any action against the Company inconsistent with such ownership by the Company (including, without limitation, by asserting any privacy, publicity or moral rights) and (iv) agreed not to use, whether or not he is employed by the Company, any of such intellectual property in connection with any commercial enterprise (provided that he may use the name Michael Kors as his legal name only, and not as service mark or trade name, to identify himself personally and to engage in charitable activities and other activities that do not compete with any businesses of the Company).
Employees
At the end of
Fiscal 2017, 2016 and 2015
, we had approximately 13,702, 12,689 and 11,094 total employees, respectively. As of
April 1, 2017
, we had approximately 7,048 full-time employees and approximately 6,654 part-time employees. Approximately 11,467 of our employees were engaged in retail selling and administrative positions, and our remaining employees were engaged in other aspects of our business as of
April 1, 2017
. None of our employees are currently covered by collective bargaining agreements and we believe that our relations with our employees are good.
Competition
We face intense competition in the product lines and markets in which we operate from both, existing and new competitors. Our products compete with other branded products within their product category. In varying degrees, depending on the product category involved, we compete on the basis of style, price, customer service, quality, brand prestige and recognition, among other bases. In our wholesale business, we compete with numerous manufacturers, importers and distributors of accessories, footwear and apparel for the limited space available for product display. Moreover, the general availability of manufacturing contractors allows new entrants easy access to the markets in which we compete, which may increase the number of our competitors and adversely affect our competitive position and our business. We believe, however, that we have significant competitive advantages because of our brand recognition and the acceptance of our brand name by consumers. See Item 1A. “Risk Factors" — "The markets in which we operate are highly competitive, both within North America and internationally, and increased competition based on a number of factors could cause our profitability to decline.”
Seasonality
We experience certain effects of seasonality with respect to our wholesale and retail segments. Our wholesale segment generally experiences its greatest sales in our third and fourth fiscal quarters while our first fiscal quarter experiences the lowest sales. Our retail segment generally experiences greater sales during our third fiscal quarter as a result of Holiday season sales. In the aggregate, our first fiscal quarter typically experiences significantly less sales volume relative to the other three quarters and our third fiscal quarter generally has higher sales volume relative to the other three quarters.
10
Import Restrictions and Other Governmental Regulations
Virtually all of our merchandise imported into the U.S., Canada, Europe and Asia is subject to duties. In addition, most of the countries to which we ship could impose safeguard quotas to protect their local industries from import surges that threaten to create market disruption. The U.S. government is also considering the imposition of a border adjustment tax. The U.S. and other countries may also unilaterally impose additional duties in response to a particular product being imported at unfairly traded prices that, in such increased quantities, cause or threaten injury to the relevant domestic industry (generally known as “anti-dumping” actions). If dumping is suspected in the U.S., the U.S. government may self-initiate a dumping case on behalf of a particular industry. Furthermore, additional duties, generally known as countervailing duties, can also be imposed by the United States government to offset subsidies provided by a foreign government to foreign manufacturers if the importation of such subsidized merchandise injures or threatens to injure a United States industry. We are also subject to other international trade agreements and regulations, such as the North American Free Trade Agreement ("NAFTA"). See Item 1A. “Risk Factors" — "We primarily use foreign manufacturing contractors and independent third-party agents to source our finished goods, which poses legal, regulatory, political and economic risks to our business operations.”
Accessories, footwear and apparel sold by us are also subject to regulation in the U.S. and other countries by governmental agencies, including, in the U.S., the Federal Trade Commission and the Consumer Products Safety Commission. These regulations relate principally to product labeling, licensing requirements, flammability testing and product safety. We are also subject to environmental laws, rules and regulations. Similarly, accessories, footwear and apparel sold by us are also subject to import regulations in the U.S. and other countries concerning the use of wildlife products for commercial and non-commercial trade, including the U.S. Fish and Wildlife Service. We do not estimate any significant capital expenditures for environmental control matters in the near future. Our licensed products and licensing partners are also subject to regulation. Our agreements require our licensing partners to operate in compliance with all applicable laws and regulations, and we are not aware of any violations that could reasonably be expected to have a material adverse effect on our business or operating results.
We are also required to comply with the disclosure requirements under the U.S. Securities Exchange Act of 1934, as amended, relating to the use of conflict minerals in our products. As a result, we have incurred, and expect to continue to incur, additional costs to comply with this rule.
Although we have not suffered any material restriction from doing business in desirable markets in the past, we cannot assure that significant impediments will not arise in the future as we expand product offerings and introduce additional trademarks to new markets.
You should carefully read this entire report, including, without limitation, the following risk factors and the section of this annual report entitled “Note Regarding Forward-Looking Statements.” Any of the following factors could materially adversely affect our business, financial condition and operating results. Additional risks and uncertainties not currently known to us or that we currently view as immaterial may also materially adversely affect our business, financial condition and operating results.
The markets in which we operate are highly competitive, both within North America and internationally, and increased competition based on a number of factors could cause our profitability to decline.
We face intense competition from other domestic and foreign accessories, footwear and apparel producers and retailers, including the following brands, among others, Coach, Burberry, Guess, Ralph Lauren, Hermès, Louis Vuitton, Gucci, Marc Jacobs, Chloé, Tory Burch, Prada, Kate Spade, Tommy Hilfiger and Calvin Klein, as well as through third party distribution channels, such as e-commerce, department stores and specialty stores. Competition is based on a number of factors, including, without limitation, the following:
|
•
|
anticipating and responding to changing consumer demands in a timely manner;
|
|
•
|
establishing and maintaining favorable brand-name recognition;
|
|
•
|
determining and maintaining product quality;
|
|
•
|
maintaining key employees;
|
|
•
|
maintaining and growing market share;
|
|
•
|
developing quality and differentiated products that appeal to consumers;
|
|
•
|
establishing and maintaining acceptable relationships with retail customers;
|
|
•
|
pricing products appropriately;
|
11
|
•
|
providing appropriate service and support to retailers;
|
|
•
|
optimizing retail and supply chain capabilities;
|
|
•
|
determining size and location of retail and department store selling space; and
|
|
•
|
protecting intellectual property.
|
In addition, some of our competitors may be significantly larger and more diversified than us and may have significantly greater financial, technological, manufacturing, sales, marketing and distribution resources than we do. Their greater capabilities in these areas may enable them to better withstand periodic downturns in the accessories, footwear and apparel industries, compete more effectively on the basis of price and production and more quickly develop new products. The general availability of manufacturing contractors and agents also allows new entrants easy access to the markets in which we compete, which may increase the number of our competitors and adversely affect our competitive position and our business. Any increased competition, or our failure to adequately address any of these competitive factors, could result in reduced revenues, which could adversely affect our business, financial condition and operating results.
Competition, along with other factors such as consolidation, changes in consumer spending patterns and a highly promotional environment, could also result in significant pricing pressure. These factors may cause us to reduce our sales prices to our wholesale customers and retail consumers, which could cause our gross margins to decline if we are unable to appropriately manage inventory levels and/or otherwise offset price reductions with comparable reductions in our operating costs. If our sales prices decline and we fail to sufficiently reduce our product costs or operating expenses, our profitability may decline, which could have a material adverse effect on our business, financial condition and operating results.
Our retail stores are heavily dependent on the ability and desire of consumers to travel and shop and a decline in consumer traffic could have a negative effect on our comparable store sales and/or average sales per square foot, which could cause our share price to decline.
Reduced travel resulting from economic conditions, fuel shortages, increased fuel prices, travel restrictions, travel concerns and other circumstances, including adverse weather conditions, disease epidemics and other health-related concerns, war, terrorist attacks or the perceived threat of war or terrorist attacks could have a material adverse effect on us, particularly if such events impact our customers desire to travel to our retail stores. In addition, other factors that could impact the success of our retail stores include: (i) the location of the mall or the location of a particular store within the mall; (ii) the other tenants occupying space at the mall; (iii) vacancies within the mall; (iv) increased competition in areas where the malls are located; (v) the amount of advertising and promotional dollars spent on attracting consumers to the malls; and (vi) a shift toward online shopping. A decline in consumer traffic could have a negative effect on our comparable store sales and/or average sales per square foot. If our future comparable store sales or average sales per square foot decline or fail to meet market expectations, the price of our ordinary shares could decline.
In addition, the aggregate results of operations of our stores have fluctuated in the past and can be expected to continue to fluctuate in the future. A variety of factors affect both comparable store sales and average sales per square foot, including, among others, fashion trends, competition, current economic conditions, pricing, inflation, the timing of the release of new merchandise and promotional events, changes in our merchandise mix, the success of marketing programs and weather conditions. If we misjudge the market for our products, we may incur excess inventory for some of our products and miss opportunities for other products. These factors may cause our comparable store sales results and average sales per square foot in the future to be materially lower than recent periods and our expectations, which could have a material adverse effect on our results of operations and result in a decline in the price of our ordinary shares.
We may not be able to respond to changing fashion and retail trends in a timely manner, which could have a material adverse effect on our brand, business, financial condition and operating results.
The accessories, footwear and apparel industries have historically been subject to rapidly changing fashion trends and consumer preferences. We believe that our success is largely dependent on our brand image and ability to anticipate and respond promptly to changing consumer demands and fashion trends in the design, styling, production, merchandising and pricing of products. If we do not correctly gauge consumer needs and fashion trends and respond appropriately, consumers may not purchase our products and our brand name and brand image may be impaired. Even if we react appropriately to changes in fashion trends and consumer preferences, consumers may consider our brand image to be outdated or associate our brand with styles that are no longer popular or trend-setting. Any of these outcomes could have a material adverse effect on our brand, business, financial condition and operating results.
12
The success of our business also depends on our ability to continue to develop and maintain a reliable digital experience for our customers. We strive to give our customers a jet-set shopping experience both in stores and through digital technologies, such as computers, mobile phones, tablets, and other devices. We also use social media to interact with our customers and enhance their shopping experience. Our inability to develop and continuously improve our digital footprint could negatively affect our ability to compete with other brands, which could adversely impact our business, results of operations and financial condition.
The accessories, footwear and apparel industries are heavily influenced by general macroeconomic cycles that affect consumer spending, and a prolonged period of depressed consumer spending could have a material adverse effect on our business, financial condition and operating results.
The accessories, footwear and apparel industries have historically been subject to cyclical variations, recessions in the general economy and uncertainties regarding future economic prospects that can affect consumer spending habits. Purchases of discretionary luxury items, such as our products, tend to decline during recessionary periods when disposable income is lower. The success of our operations depends on a number of factors impacting discretionary consumer spending, including general economic conditions, consumer confidence, wages and unemployment, housing prices, consumer debt, interest rates, fuel and energy costs, taxation and political conditions. A continuation or worsening of the current weakness in the economy may negatively affect consumer and wholesale purchases of our products and could have a material adverse effect on our business, results of operations and financial condition.
The long-term growth of our business depends on the successful execution of our strategic initiatives.
As part of our long-term strategy, we intend to grow our market share and revenue through the following initiatives:
|
•
|
trendsetting and innovative product offerings;
|
|
•
|
enhanced brand communication;
|
|
•
|
leading luxury digital presence;
|
|
•
|
expanding our global presence;
|
|
•
|
growing our men's business; and
|
|
•
|
optimizing customer engagement.
|
As announced on May 31, 2017, we also intend to optimize our retail store fleet, including, through the closure of between 100 and 125 of our underperforming full-price retail stores over the next two years, in order to generate cost savings and focus on our most highly productive locations. We cannot guarantee that we will be able to successfully execute on this initiative or achieve the anticipated cost savings, efficiencies, or other benefits related to the retail fleet optimization.
If we are unable to execute on our strategic initiatives, our business, results of operations and financial condition could be materially adversely affected.
Our business is subject to risks associated with importing products, and the imposition of additional duties and any changes to international trade agreements could have a material adverse effect on our business, financial condition and results of operations.
There are risks inherent to importing our products. Virtually all of our merchandise is manufactured in Asia or Europe, and is subject to duties when imported into the United States, Canada, Europe and Asia, as applicable. The United States government could impose a border adjustment tax, which could have a material adverse effect on our business, results of operations and financial condition. In addition, most of the countries to which we ship could impose safeguard quotas to protect their local industries from import surges that threaten to create market disruption. The United States and other countries may also unilaterally impose additional duties in response to a particular product being imported at unfairly traded prices that cause or threaten injury to the relevant domestic industry (generally known as “anti-dumping” actions). If dumping is suspected in the United States, the United States government may self-initiate a dumping case on behalf of a particular industry. Furthermore, additional duties, generally known as countervailing duties, can also be imposed by the United States government or the governments of other countries to offset subsidies provided by a foreign government to foreign manufacturers if the importation of such subsidized merchandise injures or threatens to injure a United States industry or the industry of such other country, as applicable. If the United States imposes import duties or other protective import measures, other countries could retaliate in ways that could harm the international distribution of our products.
We are also dependent on international trade agreements and regulations, such as NAFTA. If the United States were to withdraw from or materially modify NAFTA or certain other international trade agreements, our business could be adversely affected.
13
The accessories, footwear and apparel sold by us are also subject to import regulations in the United States and other countries concerning the use of wildlife products for commercial and non-commercial trade, including the U.S. Fish and Wildlife Service (“F&W”). F&W requires that we obtain a license to import animal and fauna that are subject to regulation by F&W and can revoke (or refuse to renew) this license, seize and possibly destroy our shipments and/or fine the Company for F&W violations.
The imposition of taxes, duties and quotas, the initiation of an anti-dumping action or a countervailing duty action, the withdrawal from or material modification to trade agreements and/or the repercussions of F&W violations could have a material adverse effect on our business, results of operations and financial condition.
We are dependent on a limited number of distribution facilities. If one or more of our distribution facilities experiences operational difficulties or becomes inoperable, it could have a material adverse effect on our business, results of operation and financial condition.
We operate a limited number of distribution facilities. Our ability to meet the needs of our wholesale customers and our own retail stores and e-commerce sites depends on the proper operation of these distribution facilities. If any of these distribution facilities were to shut down or otherwise become inoperable or inaccessible for any reason, we could suffer a substantial loss of inventory and/or disruptions of deliveries to our retail and wholesale customers. In addition, we could incur significantly higher costs and longer lead times associated with the distribution of our products during the time it takes to reopen or replace the damaged facility. Any of the foregoing factors could result in decreased sales and have a material adverse effect on our business, results of operations and financial condition.
In addition, we have been moving into new and larger facilities as needed and have been concurrently implementing new warehouse management systems to further support our efforts to operate with increased efficiency and flexibility. There are risks inherent in operating in new distribution environments and implementing new warehouse management systems, including operational difficulties that may arise with such transitions. We may experience shipping delays should there be any disruptions in our new warehouse management systems or warehouses themselves.
Privacy breaches and other cyber security risks related to our business could negatively affect our reputation, credibility and business.
We are dependent on information technology systems and networks for a significant portion of our direct-to-consumer sales, including our e-commerce sites and retail business credit card transaction authorization and processing. We are responsible for storing data relating to our customers and employees and also rely on third party vendors for the storage, processing and transmission of personal and Company information. Consumers, lawmakers and consumer advocates alike are increasingly concerned over the security of personal information transmitted over the internet, consumer identity theft and privacy. In addition to taking the necessary precautions ourselves, we require that third-party service providers implement reasonable security measures to protect our employees’ and customers’ identity and privacy. We do not, however, control these third-party service providers and cannot guarantee that no electronic or physical computer break-ins or security breaches will occur in the future. Likewise, our systems and technology are subject to the risk of system failures, viruses, “hackers” and other causes that are out of our control. A significant breach of customer, employee or Company data could damage the Company’s reputation, its relationship with customers and the Michael Kors brand, and could result in lost sales, sizable fines, significant breach-notification costs and lawsuits, as well as adversely affect results of operations. The Company may also incur additional costs in the future related to the implementation of additional security measures to protect against new or enhanced data security and privacy threats, or to comply with state, federal and international laws that may be enacted to address those threats.
A material disruption in our information technology systems could have a material adverse effect on our business, financial condition and results of operations.
We rely extensively on our information technology (“IT”) systems to track inventory, manage our supply chain, record and process transactions, manage customer communications, summarize results and manage our business. The failure of our IT systems to operate properly or effectively, problems with transitioning to upgraded or replacement systems, or difficulty in/failure to implement new systems, could adversely affect our business. In addition, we have e-commerce websites in the United States, Canada, select European countries, China and Japan, and plans for additional e-commerce sites in South Korea and additional countries in Europe. Our IT systems and websites may be subject to damage and/or interruption from power outages, computer, network and telecommunications failures, computer viruses, “hackers”, security breaches, usage errors by our employees and bad acts by our customers and website visitors. If our IT systems or websites are damaged or cease to function properly, we may have to make a significant investment to fix or replace them, and we may suffer loss of critical data (including our customer data) and interruptions or delays in our operations in the interim. Any significant disruption in our IT systems or websites could harm our reputation and credibility, and could have a material adverse effect on our business, results of operations and financial condition.
14
The departure of our founder, members of our executive management and other key employees could have a material adverse effect on our business.
We depend on the services and management experience of our founder and executive officers, who have substantial experience and expertise in our business. In particular, Mr. Kors, our Honorary Chairman and Chief Creative Officer, has provided design and executive leadership to the Company since its inception. He is instrumental to our marketing and publicity strategy and is closely identified with both the brand that bears his name and our Company in general. Our ability to maintain our brand image and leverage the goodwill associated with Mr. Kors’ name may be damaged if we were to lose his services. Mr. Kors has the right to terminate his employment with us without cause. In addition, the leadership of John D. Idol, our Chairman and Chief Executive Officer, has been a critical element of our success. We also depend on other key employees involved in our licensing, design and advertising operations. Competition for qualified personnel in the apparel industry is intense, and competitors may use aggressive tactics to recruit our executive officers and key employees. Although we have entered into employment agreements with Mr. Kors and certain of our other executive officers, including Mr. Idol, we may not be able to retain the services of such individuals in the future. The loss of services of one or more of these individuals or any negative public perception with respect to, or relating to, the loss of one or more of these individuals could have a material adverse effect on our business, results of operations and financial condition.
Fluctuations in our tax obligations and changes in tax laws and regulations may have a material adverse impact on our future effective tax rates and results of operations.
Our subsidiaries are subject to taxation in the United States and various foreign jurisdictions, with the applicable tax rates varying by jurisdiction. As a result, our overall effective tax rate is affected by the proportion of earnings from the various tax jurisdictions. We record tax expense based on our estimates of taxable income and required reserves for uncertain tax positions in multiple tax jurisdictions. At any time, there are multiple tax years that are subject to examinations by various taxing authorities. The ultimate resolution of these audits and negotiations with taxing authorities may result in a settlement amount that differs from our original estimate. The United States government has called for comprehensive tax reform which, among other things, might change certain U.S. tax rules impacting the way U.S. based multinationals are taxed on U.S. and foreign income. Any proposed or future changes in tax laws and regulations or interpretations could have a material adverse effect on our effective tax rates, results of operations and financial condition.
On March 26, 2015, the United Kingdom ("U.K.") enacted new Diverted Profits Tax legislation (the “DPT”), which is effective on April 1, 2015. Under the DPT, profits of certain multinational enterprises (such as the Company) deemed to have been artificially diverted from the U.K. will be taxed at a rate of 25%. While the Company believes that all of its affiliated entities and the transactions among them have the required economic substance, there is no assurance that this legislation will not have a material effect on its results of operations and financial condition.
We and our subsidiaries are also engaged in a number of intercompany transactions. Although we believe that these transactions reflect arm’s length terms and that proper transfer pricing documentation is in place, which should be respected for tax purposes, the transfer prices and conditions may be scrutinized by local tax authorities, which could result in additional tax liabilities. On October 5, 2015, the Organization for Economic Co-operation and Development (OECD), an international association of thirty four countries, including the U.S. and U.K., released the final reports from its Base Erosion and Profit Shifting (BEPS) Action Plans. The BEPS recommendations covered a number of issues, including country-by-country reporting, permanent establishment rules, transfer pricing rules and tax treaties. Future tax reform resulting from this development may result in changes to long-standing tax principles, which could adversely affect our effective tax rate or result in higher cash tax liabilities.
We face risks associated with operating in international markets and our strategy to continue to expand internationally.
We operate on a global basis, with approximately
34.3%
of our total revenue from operations outside of the U.S. during
Fiscal 2017
. As a result, we are subject to the risks of doing business internationally, including political and economic instability in foreign countries, laws, regulations and policies of foreign governments, potential negative consequences from changes in taxation policies, political or civil unrest, acts of terrorism, military actions or other conditions. Economic instability and unsettled regional and global conflicts may negatively affect consumer spending by foreign tourists and local consumers in the various regions where we operate, which could adversely affect our revenues and results of operations. We also sell our products at varying retail price points based on geographic location that yield different gross profit margins, and we achieve different operating profit margins, depending on geographic region, due to a variety of factors including product mix, store size, occupancy costs, labor costs and retail pricing. Changes in any one or more of these factors could result in lower revenues, increased costs, and negatively impact our business, results of operations and financial condition.
15
There are some countries where we do not yet have significant operating experience, and in most of these countries we face established competitors with significantly more operating experience in those locations. Many countries have different operational characteristics, including, but not limited to, employment and labor, transportation, logistics, real estate (including lease terms) and local reporting or legal requirements. Furthermore, consumer demand and behavior, as well as tastes and purchasing trends may differ in these countries and, as a result, sales of our product may not be successful, or the margins on those sales may not be in line with those we currently anticipate. In addition, in many of these countries there is significant competition to attract and retain experienced and talented employees. If our international expansion plans are unsuccessful, it could have a material adverse effect on our business, results of operations and financial condition.
In addition, on June 23, 2016, voters in the United Kingdom ("U.K."). approved an advisory referendum to withdraw from the European Union (“Brexit”). The Brexit vote and the perceptions as to the impact of the withdrawal of the U.K. from the European Union ("E.U.") may adversely affect business activity, political stability and economic conditions in the U.K., the E.U. and elsewhere. Negotiations on withdrawal and post-exit arrangements likely will be complex and protracted, and there can be no assurance regarding the terms, timing or consummation of any such arrangements. The proposed withdrawal could adversely affect the tax, currency, operational, legal and regulatory regimes to which our businesses in the region are subject. The withdrawal could also disrupt the free movement of goods, services and people between the U.K. and the E.U. and significantly disrupt trade between the U.K. and the E.U. and other parties. There can be no assurance that any or all of these events will not have a material adverse effect on our business, results of operations and financial condition.
Acquisitions may not be successfully integrated and may not achieve intended benefits.
We face additional risks associated with our strategy to expand internationally through the acquisition of our geographic licensees. On January 1, 2016, we transitioned the previously licensed business in South Korea to a wholly owned operation and on May 31, 2016, we acquired our previously licensed business in the Greater China region, which includes China, Hong Kong, Macau and Taiwan.
We may not be able to successfully integrate the business of any licensee or another entity that we acquire into our own business or achieve any expected cost savings or synergies from such integration. The potential difficulties that we may face that could cause the results of the acquisition to not be in line with our expectations, include, among others:
|
•
|
failure to implement our business plan for the combined business;
|
|
•
|
delays or difficulties in completing the integration of acquired companies or assets;
|
|
•
|
higher than expected costs, lower than expected cost savings and/or a need to allocate resources to manage unexpected operating difficulties;
|
|
•
|
unanticipated issues in integrating logistics, information and other systems;
|
|
•
|
unanticipated changes in applicable laws and regulations;
|
|
•
|
retaining key employees;
|
|
•
|
operating risks inherent in the acquired business and our business;
|
|
•
|
diversion of the attention and resources of management;
|
|
•
|
assumption of liabilities not identified in due diligence or other unanticipated issues, expenses and liabilities; and
|
|
•
|
the impact on our internal controls and compliance with the requirements under the Sarbanes-Oxley Act of 2002.
|
Our acquisitions may not perform as well as initially expected which could have a material adverse effect on our financial condition and results of operations.
We also have a controlling interest in our joint venture in Latin America ("MK Panama") and consolidate this joint venture into our operations. We may not realize a satisfactory return on our investment and our joint venture also exposes us to risks to the extent that our joint venture partner may have economic or business interests or goals that are inconsistent with ours; take actions contrary to our policies or objectives; experience financial or other difficulties; or be unable or unwilling to fulfill their obligations under the joint venture agreement, any of which could negatively impact our business, results of operations and financial condition.
16
A substantial portion of our revenue is derived from a small number of large wholesale customers, and the loss of any of these wholesale customers could substantially reduce our total revenue.
A small number of our wholesale customers account for a significant portion of our net sales. Net sales to our five largest wholesale customers represented
21.0%
of our total revenue for
Fiscal 2017
and
25.8%
of our total revenue for
Fiscal 2016
. Our largest wholesale customer, Macy's, accounted for
8.9%
of our total revenue for
Fiscal 2017
and
12.7%
of our total revenue for
Fiscal 2016
. We do not have written agreements with any of our wholesale customers, and purchases generally occur on an order-by-order basis. A decision by any of our major wholesale customers, whether motivated by marketing strategy, competitive conditions, financial difficulties or otherwise, to decrease significantly the amount of merchandise purchased from us or our licensing partners, or to change their manner of doing business with us or our licensing partners, could substantially reduce our revenue and have a material adverse effect on our profitability. During the past several years, the retail industry has experienced a great deal of consolidation and other ownership changes, and we expect such changes will continue. In addition, store closings by our wholesale customers decrease the number of stores carrying our products, while the remaining stores may purchase a smaller amount of our products and/or may reduce the retail floor space designated for our brands. In the future, retailers may further consolidate, undergo restructurings or reorganizations, realign their affiliations or reposition their stores’ target markets. Any of these types of actions could decrease the number of stores that carry our products or increase the ownership concentration within the retail industry. These changes could decrease our opportunities in the market, increase our reliance on a smaller number of large wholesale customers and decrease our negotiating strength with our wholesale customers. These factors could have a material adverse effect on our business, results of operations and financial condition.
Our business is exposed to foreign currency exchange rate fluctuations.
Our results of operations for our international subsidiaries are exposed to foreign exchange rate fluctuations as the financial results of the applicable subsidiaries are translated from the local currency into U.S. dollars during financial statement consolidation. If the U.S. dollar strengthens against foreign currencies, the translation of these foreign currency denominated transactions could impact our consolidated results of operations. In addition, we have intercompany notes amongst certain of our non-U.S. subsidiaries, which may be denominated in a currency other than the local currency of a particular reporting entity. As a result of using a currency other than the functional currency of the related subsidiary, results of these operations may be adversely affected during times of significant fluctuation between the functional currency of that subsidiary and the denomination currency of the note. We continuously monitor our foreign currency exposure and hedge a portion of our foreign subsidiaries’ foreign currency-denominated inventory purchases to minimize the impact of changes in foreign currency exchange rates. However, we cannot fully anticipate all of our foreign currency exposures and cannot ensure that these hedges will fully offset the impact of foreign currency exchange rate fluctuations.
As a result of operating retail stores and concessions in various countries outside of the U.S., we are also exposed to market risk from fluctuations in foreign currency exchange rates, particularly the Euro, the British Pound, the Chinese Yuan Renminbi, the Japanese Yen, the Korean Won and the Canadian Dollar, among others. A substantial weakening of foreign currencies against the U.S. Dollar could require us to raise our retail prices or reduce our profit margins in various locations outside of the U.S. In addition, our sales and profitability could be negatively impacted if consumers in those markets were unwilling to purchase our products at increased prices.
We are subject to risks associated with leasing retail space under long-term, non-cancelable leases and are required to make substantial lease payments under our operating leases. If we close a leased retail space, we remain obligated under the applicable lease. We also may be unable to renew leases at the end of their terms.
We do not own any of our store facilities; instead, we lease all of our stores under operating leases. Our leases generally have terms of up to 10 years, generally require a fixed annual rent and most require the payment of additional rent if store sales exceed a negotiated amount. Certain of our European stores also require initial investments in the form of key money to secure prime locations, which may be paid to landlords or existing lessees. Generally, our leases are “net” leases, which require us to pay all of the costs of insurance, taxes, maintenance and utilities. We generally cannot cancel these leases at our option. Payments under these operating leases account for a significant portion of our operating costs. For example, as of
April 1, 2017
, we were party to operating leases associated with our stores as well as other corporate facilities requiring future minimum lease payments aggregating to
$1.093 billion
through Fiscal 2022 and approximately
$549.3 million
thereafter through
Fiscal 2035
. We recently announced that we intend to optimize our retail store fleet, including, through the closure of between 100 and 125 of full-price underperforming retail stores. In connection with this retail fleet optimization, we may remain obligated under the applicable lease for, among other things, payment of the base rent for the balance of the lease term. In some instances, we may be unable to close an underperforming retail store due to continuous operation provisions in our leases. In addition, as each of our leases expire, we may be unable to negotiate renewals, either on commercially acceptable terms or at all, which could cause us to close retail stores in desirable locations. Our substantial operating lease obligations, including with respect to closed retail spaces, could have a material adverse effect on our business, results of operations and financial condition.
17
Our business may be negatively impacted due to excess inventories if we misjudge the demand for our products.
We are subject to significant pricing pressure caused by many factors, including competition, a highly promotional selling environment, and changes in consumer spending patterns. If we fail to anticipate, identify and respond effectively to changing consumer demands and fashion trends, we may be faced with significant excess inventories for some products and missed opportunities for other products. If that occurs, we may be forced to rely on markdowns or promotional sales to dispose of excess and slow-moving inventory, which may negatively impact our gross margin and profitability.
Our share price may periodically fluctuate based on the accuracy of our earnings guidance or other forward-looking statements regarding our financial performance.
Our business and long-range planning process is designed to maximize our long-term growth and profitability, and not to achieve an earnings target in any particular fiscal quarter. We believe that this longer-term focus is in the best interests of the Company and our shareholders. At the same time, however, we recognize that it is helpful to provide investors with guidance as to our forecast of total revenue, earnings per share, comparable store sales and other financial metrics or projections. While we generally expect to provide updates to our financial guidance when we report our results each fiscal quarter, we do not have any responsibility to update any of our forward-looking statements at such times or otherwise. In addition, any longer-term guidance that we provide is based on goals that we believe, at the time guidance is given, are reasonably attainable for growth and performance over a number of years. However, such long-range targets are more difficult to predict than our current quarter and fiscal year expectations. If, or when, we announce actual results that differ from those that have been predicted by us, outside investment analysts, or others, our share price could be adversely affected. Investors who rely on these predictions when making investment decisions with respect to our securities do so at their own risk. We take no responsibility for any losses suffered as a result of such changes in our share price.
We periodically return value to shareholders through our share repurchase program. Investors may have an expectation that we will repurchase all shares available under our share repurchase program. The market price of our securities could be adversely affected if our share repurchase activity differs from investors’ expectations or if our share repurchase program were to terminate.
Our current and future licensing arrangements may not be successful and may make us susceptible to the actions of third parties over whom we have limited control.
We have entered into a select number of product licensing agreements with companies that produce and sell, under our trademarks, products requiring specialized expertise. We have also entered into a number of select licensing agreements pursuant to which we have granted third parties certain rights to distribute and sell our products in certain geographical areas, such as the Middle East, Eastern Europe, Brazil, certain parts of Asia and Australia. In addition, we have a joint venture that covers the distribution and sale of products and the operation of retail stores in Latin America (excluding Brazil) and the Caribbean. In the future, we may enter into additional licensing arrangements. Although we take steps to carefully select our licensing partners, such arrangements may not be successful. Our licensing partners may fail to fulfill their obligations under their license agreements or have interests that differ from or conflict with our own, such as the timing of new store openings, the pricing of our products and the offering of competitive products. In addition, the risks applicable to the business of our licensing partners may be different than the risks applicable to our business, including risks associated with each such partner’s ability to:
|
•
|
obtain capital;
|
|
•
|
exercise operational and financial control over its business;
|
|
•
|
manage its labor relations;
|
|
•
|
maintain relationships with suppliers;
|
|
•
|
manage its credit and bankruptcy risks; and
|
|
•
|
maintain customer relationships.
|
Any of the foregoing risks, or the inability of any of our licensing partners to successfully market our products or otherwise conduct its business, may result in loss of revenue and competitive harm to our operations in regions or product categories where we have entered into such licensing arrangements.
We rely on our licensing partners to preserve the value of our brands. Although we attempt to protect our brands through, among other things, approval rights over store location and design, product design, production quality, packaging, merchandising, distribution, advertising and promotion of our stores and products, we may not be able to control the use by our licensing partners of our brand. The misuse of our brand by a licensing partner could have a material adverse effect on our business, results of operations and financial condition.
18
Increases in the cost of raw materials could increase our production costs and cause our operating results and financial condition to suffer.
The costs of raw materials used in our products are affected by, among other things, weather, consumer demand, speculation on the commodities market, the relative valuations and fluctuations of the currencies of producer versus consumer countries and other factors that are generally unpredictable and beyond our control. We are not always successful in our efforts to protect our business from the volatility of the market price of raw materials and our business can be materially affected by dramatic movements in prices of raw materials. The ultimate effect of this change on our earnings cannot be quantified, as the effect of movements in raw materials prices on industry selling prices are uncertain, but any significant increase in these prices could have a material adverse effect on our business, results of operations and financial condition.
We primarily use foreign manufacturing contractors and independent third-party agents to source our finished goods, which poses legal, regulatory, political and economic risks to our business operations.
Our products are primarily produced by, and purchased or procured from, independent manufacturing contractors located mainly in Asia and Europe. A manufacturing contractor’s failure to ship products to us in a timely manner or to meet the required quality standards could cause us to miss the delivery date requirements of our customers for those items. The failure to make timely deliveries may cause customers to cancel orders, refuse to accept deliveries or demand reduced prices, any of which could have a material adverse effect on us. In addition, any of the following factors could negatively affect our ability to produce or deliver our products and, as a result, could have a material adverse effect on our business, results of operations and financial condition:
|
•
|
political or labor instability, labor shortages (stemming from labor disputes or otherwise), or increases in costs of labor or production in countries where manufacturing contractors and suppliers are located;
|
|
•
|
significant delays or disruptions in delivery of our products due to labor disputes or strikes at the location of the source of our goods and/or at ports of entry;
|
|
•
|
political or military conflict involving the United States, which could cause a delay in the transportation of our products and raw materials and increase transportation costs;
|
|
•
|
heightened terrorism security concerns, which could subject imported or exported goods to additional, more frequent or more thorough inspections, leading to delays in deliveries or impoundment of goods for extended periods of time or could result in increased scrutiny by customs officials for counterfeit goods, leading to lost sales, increased costs for our anti-counterfeiting measures and damage to the reputation of our brands;
|
|
•
|
a significant decrease in availability or an increase in the cost of raw materials;
|
|
•
|
disease epidemics and health-related concerns, which could result in closed factories, reduced workforces, scarcity of raw materials and scrutiny or embargoing of goods produced in infected areas;
|
|
•
|
the migration and development of manufacturing contractors, which could affect where our products are or are planned to be produced;
|
|
•
|
imposition of regulations, quotas and safeguards relating to imports and our ability to adjust in a timely manner to changes in trade regulations, which, among other things, could limit our ability to produce products in cost-effective countries that have the labor and expertise needed;
|
|
•
|
increases in the costs of fuel, travel and transportation;
|
|
•
|
imposition of duties, taxes and other charges on imports;
|
|
•
|
significant fluctuation of the value of the United States dollar against foreign currencies; and
|
|
•
|
restrictions on transfers of funds out of countries where our foreign licensees are located.
|
We do not have written agreements with any of our third-party manufacturing contractors. As a result, any single manufacturing contractor could unilaterally terminate its relationship with us at any time. In
Fiscal 2017
, our largest manufacturing contractor, who primarily produces its products in China and who we have worked with for over ten years, accounted for the production of
29.6%
of our finished products. Our inability to promptly replace manufacturing contractors that terminate their relationships with us or cease to provide high quality products in a timely and cost-efficient manner could have a material adverse effect on our business, results of operations and financial condition, and impact the cost and availability of our goods.
19
In addition, we use third-party agents to source our finished goods with numerous manufacturing contractors on our behalf. Any single agent could unilaterally terminate its relationship with us at any time. In
Fiscal 2017
, our largest third-party agent, whose primary place of business is Hong Kong and who we have worked with for over 10 years, sourced approximately
13.9%
of our purchases of finished goods. Our inability to promptly replace agents that terminate their relationships with us or cease to provide high quality service in a timely and cost-efficient manner could have a material adverse effect on our business, results of operations and financial condition.
If we fail to comply with labor laws, or if our manufacturing contractors fail to use acceptable, ethical business practices, our business and reputation could suffer.
We are subject to labor laws governing relationships with employees, including minimum wage requirements, overtime, working conditions and citizenship requirements. Compliance with these laws and regulations may lead to increased costs and operational complexity and may increase our exposure to governmental investigations or litigation.
We require our manufacturing contractors to operate in compliance with applicable laws, rules and regulations regarding working conditions, employment practices and environmental compliance. Additionally, we impose upon our business partners operating guidelines that require additional obligations in those three areas in order to promote ethical business practices, and our staff and third parties we retain for such purposes periodically visit and monitor the operations of our manufacturing contractors to determine compliance. However, we do not control our manufacturing contractors or their labor and other business practices. If one of our manufacturing contractors violates applicable labor or other laws, rules or regulations or implements labor or other business practices that are generally regarded as unethical in the United States, the shipment of finished products to us could be interrupted, orders could be cancelled, relationships could be terminated and our reputation could be damaged. Any of these events could have a material adverse effect on our business, results of operations and financial condition.
We may be unable to protect our trademarks and other intellectual property rights, and others may allege that we infringe upon their intellectual property rights.
Our trademarks, including MICHAEL KORS and MICHAEL MICHAEL KORS, logos and other intellectual property rights are important to our success and our competitive position. We are susceptible to others imitating our products and infringing on our intellectual property rights in the Americas, Europe, the Middle East, the Far East and elsewhere in the world in both online and offline channels. Our brand enjoys significant worldwide consumer recognition, and the generally higher pricing of our products creates additional incentive for counterfeiters to infringe on our brand. We work with customs authorities, law enforcement, legal representatives and brand specialists globally in an effort to prevent the sale of counterfeit Michael Kors products, but we cannot guarantee the extent to which our efforts to prevent counterfeiting of our brand and other intellectual property infringement will be successful. Such counterfeiting and other infringement could dilute our brand and harm our reputation and business.
Our trademark applications may fail to result in registered trademarks or provide the scope of coverage sought, and others may seek to invalidate our trademarks or block sales of our products as a violation of their trademarks and intellectual property rights. In addition, others may assert rights in, or ownership of, trademarks and other intellectual property rights of ours or in trademarks that are similar to ours or trademarks that we license and/or market, and we may not be able to successfully resolve these types of conflicts to our satisfaction. In some cases, trademark owners may have prior rights to our trademarks or similar trademarks. Furthermore, certain foreign countries may not protect trademarks and other intellectual property rights to the same extent as do the laws of the United States.
From time to time, in the ordinary course of our business, we become involved in opposition and cancellation proceedings with respect to trademarks similar to some of our brands. Any litigation or dispute involving the scope or enforceability of our intellectual property rights or any allegation that we infringe upon the intellectual property rights of others could be costly and time-consuming and could result, if determined adversely to us, in harm to our competitive position.
Restrictive covenants in our credit agreement may restrict our ability to pursue our business strategies.
We have a $1.0 billion senior unsecured revolving credit facility (the “2015 Credit Facility”) under which Michael Kors Holdings Limited and its indirect wholly owned subsidiaries Michael Kors (USA), Inc. (“MKUSA”), Michael Kors (Europe) B.V., Michael Kors (Canada) Holdings Ltd. and Michael Kors (Switzerland) GmbH, are borrowers, and the borrowers and certain material subsidiaries provide unsecured guarantees. The credit agreement governing the terms of the 2015 Credit Facility restricts, among other things, asset dispositions, mergers and acquisitions, dividends, share repurchases and redemptions, other restricted payments, indebtedness, loans and investments, liens and affiliate transactions. The 2015 Credit Facility also contains customary events of default, including, but not limited to, payment defaults, material inaccuracy of representations and warranties, covenant defaults, cross-defaults to certain indebtedness, certain events of bankruptcy or insolvency, certain events under ERISA, material judgments, actual or asserted failure of any guaranty supporting the 2015 Credit Facility to be in full force and effect, and changes
20
of control. If such an event of default occurs, the lenders under the 2015 Credit Facility would be entitled to take various actions, including, but not limited to, terminating the commitments and accelerating amounts outstanding under the 2015 Credit Facility. In addition, our credit agreement contains a financial covenant requiring us to maintain a leverage ratio of no greater than 3.5 to 1.0 (with the ratio being total consolidated indebtedness plus 6.0 times the consolidated rent expense for the last four consecutive fiscal quarters, to Consolidated EBITDAR for the last four consecutive fiscal quarters, as defined in
Note 9
to the accompanying consolidated financial statements). See credit discussion in “Management’s Discussion and Analysis of Financial Condition and Results of Operations — Liquidity”. The covenants in the 2015 Credit Facility, among other things, may limit our ability to fund our future working capital needs and capital expenditures, engage in future acquisitions or development activities, or otherwise realize the value of our assets and opportunities fully because of the need to dedicate a portion of our cash flow from operations to payments on debt.
Failure to maintain adequate financial and management processes and controls could lead to errors in our financial reporting, which could harm our business and cause a decline in the price of our ordinary shares.
As a public company we are required to document and test our internal controls over financial reporting pursuant to Section 404 of the Sarbanes-Oxley Act. If our management is unable to certify the effectiveness of our internal controls or if our independent registered public accounting firm cannot render an opinion on management’s assessment and on the effectiveness of our internal control over financial reporting, or if material weaknesses in our internal controls are identified, we could be subject to regulatory scrutiny and a loss of public confidence, which could have an adverse effect on our business and cause a decline in the price of our ordinary shares.
Provisions in our organizational documents may delay or prevent our acquisition by a third party.
Our Memorandum and Articles of Association (together, as amended from time to time, our “Memorandum and Articles”) contains several provisions that may make it more difficult or expensive for a third party to acquire control of us without the approval of our board of directors. These provisions also may delay, prevent or deter a merger, acquisition, tender offer, proxy contest or other transaction that might otherwise result in our shareholders receiving a premium over the market price for their ordinary shares. These provisions include, among others:
|
•
|
our board of directors’ ability to amend the Memorandum and Articles to create and issue, from time to time, one or more classes of preference shares and, with respect to each such class, to fix the terms thereof by resolution;
|
|
•
|
provisions relating to the multiple classes and three-year terms of directors, the manner of election of directors, removal of directors and the appointment of directors upon an increase in the number of directors or vacancy on our board of directors;
|
|
•
|
restrictions on the ability of shareholders to call meetings and bring proposals before meetings;
|
|
•
|
elimination of the ability of shareholders to act by written consent; and
|
|
•
|
the requirement of the affirmative vote of 75% of the shares entitled to vote to amend certain provisions of our Memorandum and Articles.
|
These provisions of our Memorandum and Articles could discourage potential takeover attempts and reduce the price that investors might be willing to pay for our ordinary shares in the future, which could reduce the market price of our ordinary shares.
21
Rights of shareholders under British Virgin Islands law differ from those under United States law, and, accordingly, our shareholders may have fewer protections.
Our corporate affairs are governed by our Memorandum and Articles, the BVI Business Companies Act, 2004 (as amended, the “BVI Act”) and the common law of the British Virgin Islands. The rights of shareholders to take legal action against our directors, actions by minority shareholders and the fiduciary responsibilities of our directors under British Virgin Islands law are to a large extent governed by the common law of the British Virgin Islands and by the BVI Act. The common law of the British Virgin Islands is derived in part from comparatively limited judicial precedent in the British Virgin Islands as well as from English common law, which has persuasive, but not binding, authority on a court in the British Virgin Islands. The rights of our shareholders and the fiduciary responsibilities of our directors under British Virgin Islands law are not as clearly established as they would be under statutes or judicial precedents in some jurisdictions in the United States. In particular, the British Virgin Islands has a less developed body of securities laws as compared to the United States, and some states (such as Delaware) have more fully developed and judicially interpreted bodies of corporate law. As a result of the foregoing, holders of our ordinary shares may have more difficulty in protecting their interests through actions against our management, directors or major shareholders than they would as shareholders of a U.S. company.
The laws of the British Virgin Islands provide limited protection for minority shareholders, so minority shareholders will have limited or no recourse if they are dissatisfied with the conduct of our affairs.
Under the laws of the British Virgin Islands, there is limited statutory law for the protection of minority shareholders other than the provisions of the BVI Act dealing with shareholder remedies. The principal protection under statutory law is that shareholders may bring an action to enforce the constituent documents of a British Virgin Islands company and are entitled to have the affairs of the company conducted in accordance with the BVI Act and the memorandum and articles of association of the company. As such, if those who control the company have persistently disregarded the requirements of the BVI Act or the provisions of the company’s memorandum and articles of association, then the courts will likely grant relief. Generally, the areas in which the courts will intervene are the following: (i) an act complained of which is outside the scope of the authorized business or is illegal or not capable of ratification by the majority; (ii) acts that constitute fraud on the minority where the wrongdoers control the company; (iii) acts that infringe on the personal rights of the shareholders, such as the right to vote; and (iv) acts where the company has not complied with provisions requiring approval of a special or extraordinary majority of shareholders, which are more limited than the rights afforded to minority shareholders under the laws of many states in the United States.
It may be difficult to enforce judgments against us or our executive officers and directors in jurisdictions outside the United States.
Under our Memorandum and Articles, we may indemnify and hold our directors harmless against all claims and suits brought against them, subject to limited exceptions. Furthermore, to the extent allowed by law, the rights and obligations among or between us, any of our current or former directors, officers and employees and any current or former shareholder will be governed exclusively by the laws of the British Virgin Islands and subject to the jurisdiction of the British Virgin Islands courts, unless those rights or obligations do not relate to or arise out of their capacities as such. Although there is doubt as to whether United States courts would enforce these provisions in an action brought in the United States under United States securities laws, these provisions could make judgments obtained outside of the British Virgin Islands more difficult to enforce against our assets in the British Virgin Islands or jurisdictions that would apply British Virgin Islands law.
British Virgin Islands companies may not be able to initiate shareholder derivative actions, thereby depriving shareholders of one avenue to protect their interests.
British Virgin Islands companies may not have standing to initiate a shareholder derivative action in a federal court of the United States. The circumstances in which any such action may be brought, and the procedures and defenses that may be available in respect of any such action, may result in the rights of shareholders of a British Virgin Islands company being more limited than those of shareholders of a company organized in the United States. Accordingly, shareholders may have fewer alternatives available to them if they believe that corporate wrongdoing has occurred. The British Virgin Islands courts are also unlikely to recognize or enforce judgments of courts in the United States based on certain liability provisions of United States securities law or to impose liabilities, in original actions brought in the British Virgin Islands, based on certain liability provisions of the United States securities laws that are penal in nature. There is no statutory recognition in the British Virgin Islands of judgments obtained in the United States, although the courts of the British Virgin Islands will generally recognize and enforce the non-penal judgment of a foreign court of competent jurisdiction without retrial on the merits. This means that even if shareholders were to sue us successfully, they may not be able to recover anything to make up for the losses suffered.
22
None.
The following table sets forth the location, use and size of our significant distribution and corporate facilities as of
April 1, 2017
, all of which are leased with the exception of our distribution center in Holland, which is owned. The leases expire at various times through
Fiscal 2035
, subject to renewal options.
|
Location
|
Use
|
Approximate Square
Footage
|
||
|
Whittier, CA
|
U.S. Distribution Center
|
1,284,420
|
||
|
Venlo, Holland
|
European Distribution Center
|
1,108,680
|
||
|
New York, NY
|
U.S. Corporate Offices
|
262,450
|
||
|
Montreal, Quebec
|
Canadian Corporate Office and Distribution
|
248,070
|
||
|
East Rutherford, NJ
|
U.S. Corporate Offices
|
53,480
|
||
|
Manno, Switzerland
|
European Corporate Offices
|
25,400
|
||
|
Secaucus, NJ
|
U.S. Distribution Center
|
22,760
|
||
|
London, England
|
Regional Corporate Offices
|
21,650
|
||
|
Paris, France
|
Regional Corporate Offices
|
16,030
|
||
As of
April 1, 2017
, we also occupied
827
leased retail stores worldwide (including concessions). We consider our properties to be in good condition and believe that our facilities are adequate for our operations and provide sufficient capacity to meet our anticipated requirements.
Other than the land and building for our European distribution center in Venlo, Holland, fixed assets related to our stores (e.g. leasehold improvements, fixtures, etc.) and computer equipment, we do not own any material property as of
April 1, 2017
.
We are involved in various routine legal proceedings incident to the ordinary course of our business. We believe that the outcome of all pending legal proceedings in the aggregate will not have a material adverse effect on our business, results of operations and financial condition.
None.
23
|
Item 5.
|
Market for Registrant’s Common Equity, Related Stockholder Matters and Issuer Purchases of Equity Securities
|
Market Information
Since our initial public offering ("IPO") on December 15, 2011, our ordinary shares have traded on the NYSE under the symbol “KORS”. At
April 1, 2017
, there were
155,833,304
ordinary shares outstanding, and the closing sale price of our ordinary shares was $38.11. Also as of that date, we had approximately 240 ordinary shareholders of record. The table below sets forth the high and low closing sale prices of our ordinary shares for the periods indicated:
|
High
|
Low
|
||||||
|
Fiscal 2016 Quarter Ended:
|
|||||||
|
June 27, 2015
|
$
|
66.26
|
|
$
|
44.91
|
|
|
|
September 26, 2015
|
$
|
45.37
|
|
$
|
38.06
|
|
|
|
December 26, 2015
|
$
|
43.89
|
|
$
|
38.53
|
|
|
|
April 2, 2016
|
$
|
58.54
|
|
$
|
35.57
|
|
|
|
Fiscal 2017 Quarter Ended:
|
|||||||
|
July 2, 2016
|
$
|
56.35
|
|
$
|
40.70
|
|
|
|
October 1, 2016
|
$
|
52.90
|
|
$
|
46.79
|
|
|
|
December 31, 2016
|
$
|
51.76
|
|
$
|
42.75
|
|
|
|
April 1, 2017
|
$
|
43.56
|
|
$
|
36.02
|
|
|
Share Performance Graph
The line graph below compares the cumulative total shareholder return on our ordinary shares with the Russell 1000 Index (RUI), Standard & Poor’s 500 Index (GSPC), S&P Retail Index (RLX) and the NYSE Composite Index (NYA), and a peer group index of companies that we believe are closest to ours for the period covering our initial public offering on December 15, 2011 through March 31, 2017, the last business day of the our fiscal year. The graph assumes an investment of $100 made at the closing of trading on December 15, 2011, in (i) our ordinary shares, (ii) the shares comprising the RUI, (iii) the shares comprising the GSPC, (iv) the shares comprising the RLX and (v) the shares comprising the NYA. The peer group consists of the following: Coach, Inc., Guess, Inc., PVH Corp., Limited Brands, Inc., and Ralph Lauren Corporation. All values assume reinvestment of the full amount of all dividends, if any, into additional shares of the same class of equity securities at the frequency with which dividends are paid on such securities during the applicable time period.
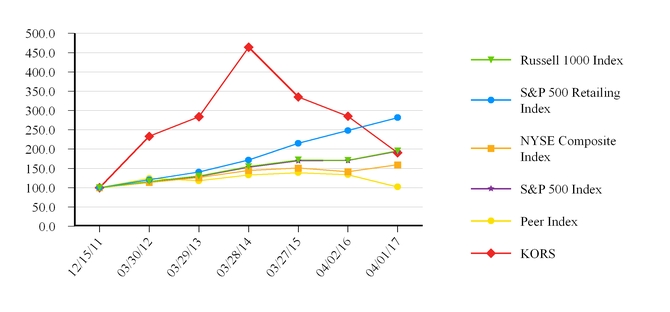
24
Issuer Purchases of Equity Securities
On May 25, 2016, the Company's Board of Directors authorized a new $1.0 billion share repurchase program, which replaced the remaining balance of the previous share repurchase program authorized on October 30, 2014. The Company also has in place a “withhold to cover” repurchase program, which allows the Company to withhold ordinary shares from certain executive officers to satisfy minimum tax withholding obligations relating to the vesting of their restricted share awards.
The following table provides information regarding the Company’s ordinary share repurchases during the three months ended
April 1, 2017
:
|
Total Number of Shares Purchased
|
Average
Price Paid
per Share
|
Total Number of Shares (or Units) Purchased as Part of Publicly Announced Plans or Programs
|
Maximum Dollar Value of
Shares (or Units) That May
Yet be Purchased Under the
Plans or Programs (in millions)
|
|||||||
|
January 1 – January 28
|
—
|
|
$
|
—
|
|
—
|
$250.0
|
|||
|
January 29 – February 25
|
2,720,100
|
|
38.25
|
|
2,720,100
|
146.0
|
||||
|
February 26 – April 1
|
3,921,715
|
|
37.22
|
|
3,921,715
|
—
|
||||
On May 25, 2017, the Company's Board of Directors authorized a new
$1.000 billion
share repurchase program.
The following table sets forth selected historical consolidated financial and other data for Michael Kors Holdings Limited and its consolidated subsidiaries for the periods presented. The statements of operations data for
Fiscal 2017
,
Fiscal 2016
and
Fiscal 2015
and the balance sheet data as of the end of
Fiscal 2017
and
Fiscal 2016
have been derived from our audited consolidated financial statements included elsewhere in this report. The statements of operations data for Fiscal 2013 and Fiscal 2012 and the balance sheet data as of the end of Fiscal 2014, Fiscal 2013 and Fiscal 2012 have been derived from our prior audited consolidated financial statements, which are not included in this report.
The selected historical consolidated financial data below should be read in conjunction with “Management’s Discussion and Analysis of Financial Condition and Results of Operations” and our financial statements and the related notes included elsewhere in this annual report.
25
|
|
Fiscal Years Ended
|
||||||||||||||||||
|
|
April 1,
2017 |
April 2, 2016
(1)
|
March 28,
2015 |
March 30,
2014 |
March 31,
2013 |
||||||||||||||
|
|
(data presented in millions, except for shares and per share data)
|
||||||||||||||||||
|
Statement of Operations Data:
|
|||||||||||||||||||
|
Net sales
|
$
|
4,347.9
|
|
$
|
4,538.8
|
|
$
|
4,199.7
|
|
$
|
3,170.5
|
|
$
|
2,094.7
|
|
||||
|
Licensing revenue
|
145.8
|
|
173.3
|
|
171.8
|
|
140.3
|
|
87.0
|
|
|||||||||
|
Total revenue
|
4,493.7
|
|
4,712.1
|
|
4,371.5
|
|
3,310.8
|
|
2,181.7
|
|
|||||||||
|
Cost of goods sold
|
1,832.3
|
|
1,914.9
|
|
1,723.8
|
|
1,294.7
|
|
875.1
|
|
|||||||||
|
Gross profit
|
2,661.4
|
|
2,797.2
|
|
2,647.7
|
|
2,016.1
|
|
1,306.6
|
|
|||||||||
|
Selling, general and administrative expenses
|
1,552.5
|
|
1,428.0
|
|
1,251.5
|
|
926.9
|
|
621.6
|
|
|||||||||
|
Depreciation and amortization
|
219.8
|
|
183.2
|
|
138.4
|
|
79.7
|
|
54.3
|
|
|||||||||
|
Impairment of long-lived assets
|
199.2
|
|
10.9
|
|
0.8
|
|
1.3
|
|
0.7
|
|
|||||||||
|
Total operating expenses
|
1,971.5
|
|
1,622.1
|
|
1,390.7
|
|
1,007.9
|
|
676.6
|
|
|||||||||
|
Income from operations
|
689.9
|
|
1,175.1
|
|
1,257.0
|
|
1,008.2
|
|
630.0
|
|
|||||||||
|
Other income
|
(5.4
|
)
|
(3.7
|
)
|
(1.6
|
)
|
—
|
|
—
|
|
|||||||||
|
Interest expense, net
|
4.1
|
|
1.7
|
|
0.2
|
|
0.4
|
|
1.5
|
|
|||||||||
|
Foreign currency loss
|
2.6
|
|
4.8
|
|
2.6
|
|
0.1
|
|
1.4
|
|
|||||||||
|
Income before provision for income taxes
|
688.6
|
|
1,172.3
|
|
1,255.8
|
|
1,007.7
|
|
627.1
|
|
|||||||||
|
Provision for income taxes
|
137.1
|
|
334.6
|
|
374.8
|
|
346.2
|
|
229.5
|
|
|||||||||
|
Net income
|
551.5
|
|
837.7
|
|
881.0
|
|
661.5
|
|
397.6
|
|
|||||||||
|
Less: Net loss attributable to noncontrolling interest
|
(1.0
|
)
|
(1.4
|
)
|
—
|
|
—
|
|
—
|
|
|||||||||
|
Net income attributable to MKHL
|
$
|
552.5
|
|
$
|
839.1
|
|
$
|
881.0
|
|
$
|
661.5
|
|
$
|
397.6
|
|
||||
|
Weighted average ordinary shares outstanding:
|
|||||||||||||||||||
|
Basic
|
165,986,733
|
|
186,293,295
|
|
202,680,572
|
|
202,582,945
|
|
196,615,054
|
|
|||||||||
|
Diluted
|
168,123,813
|
|
189,054,289
|
|
205,865,769
|
|
205,638,107
|
|
201,540,144
|
|
|||||||||
|
Net income per ordinary share
(2)
:
|
|||||||||||||||||||
|
Basic
|
$
|
3.33
|
|
$
|
4.50
|
|
$
|
4.35
|
|
$
|
3.27
|
|
$
|
2.02
|
|
||||
|
Diluted
|
$
|
3.29
|
|
$
|
4.44
|
|
$
|
4.28
|
|
$
|
3.22
|
|
$
|
1.97
|
|
||||
|
(1)
|
Fiscal year ended
April 2, 2016
contained 53 weeks, whereas all other fiscal years presented are based on 52-week periods.
|
|
(2)
|
Basic net income per ordinary share is computed by dividing net income available to ordinary shareholders of MKHL by basic weighted average ordinary shares outstanding. Diluted net income per ordinary share is computed by dividing net income attributable to ordinary shareholders of MKHL by diluted weighted average ordinary shares outstanding.
|
|
|
Fiscal Years Ended
|
||||||||||||||||||
|
|
April 1,
2017 |
April 2,
2016 |
March 28,
2015 |
March 30,
2014 |
March 31,
2013 |
||||||||||||||
|
|
(data presented in millions, except for share and store data)
|
||||||||||||||||||
|
Operating Data:
|
|||||||||||||||||||
|
Comparable retail store sales (decline) growth
(1)
|
(8.3
|
)%
|
(4.2
|
)%
|
10.3
|
%
|
26.2
|
%
|
40.1
|
%
|
|||||||||
|
Retail stores, including concessions, end of period
|
827
|
|
668
|
|
526
|
|
405
|
|
304
|
|
|||||||||
|
Balance Sheet Data:
|
|||||||||||||||||||
|
Working capital
|
$
|
598.9
|
|
$
|
1,234.3
|
|
$
|
1,663.4
|
|
$
|
1,438.3
|
|
$
|
816.5
|
|
||||
|
Total assets
|
$
|
2,409.6
|
|
$
|
2,566.8
|
|
$
|
2,684.6
|
|
$
|
2,211.2
|
|
$
|
1,280.1
|
|
||||
|
Short-term debt
|
$
|
133.1
|
|
$
|
—
|
|
$
|
—
|
|
$
|
—
|
|
$
|
—
|
|
||||
|
Long-term debt
|
$
|
—
|
|
$
|
2.3
|
|
$
|
—
|
|
$
|
—
|
|
$
|
—
|
|
||||
|
Shareholders' equity of MKHL
|
$
|
1,592.6
|
|
$
|
1,995.7
|
|
$
|
2,241.0
|
|
$
|
1,806.1
|
|
$
|
1,047.2
|
|
||||
|
Number of ordinary shares issued
|
209,332,493
|
|
208,084,175
|
|
206,486,699
|
|
204,291,345
|
|
201,454,408
|
|
|||||||||
|
(1)
|
Fiscal year ended
April 2, 2016
contained 53 weeks, whereas all other fiscal years presented are based on 52-week periods. All comparable store sales are presented on a 52-week basis.
|
26
The following Management’s Discussion and Analysis of our Financial Condition and Results of Operations should be read in conjunction with the consolidated financial statements and notes thereto included as part of this Annual Report on Form 10-K. This discussion contains forward-looking statements that are based upon current expectations. We sometimes identify forward-looking statements with such words as “may,” “expect,” “anticipate,” “estimate,” “seek,” “intend,” “believe” or similar words concerning future events. The forward-looking statements contained herein, include, without limitation, statements concerning future revenue sources and concentration, gross profit margins, selling and marketing expenses, capital expenditures, general and administrative expenses, capital resources, new stores, retail fleet optimization and anticipated cost savings, additional financings or borrowings and additional losses and are subject to risks and uncertainties including, but not limited to, those discussed in this report that could cause actual results to differ materially from the results contemplated by these forward-looking statements. We also urge you to carefully review the risk factors set forth in “Item 1A. – Risk Factors.”
Overview
Our Business
We are a global luxury fashion brand led by a world-class management team and a renowned, award-winning designer. Since launching his namesake brand over 35 years ago, Michael Kors has featured distinctive designs, materials and craftsmanship with a jet-set aesthetic that combines stylish elegance and a sporty attitude. Mr. Kors’ vision has taken the Company from its beginnings as an American luxury sportswear house to a global accessories, footwear and apparel company with a presence in over 100 countries. We are a highly recognized luxury fashion brand in the Americas and Europe with accelerating brand awareness in other international markets.
We operate our business in three segments—retail, wholesale and licensing—and we have a strategically controlled global distribution network focused on company-operated retail stores, leading department stores, specialty stores and select licensing partners. As of
April 1, 2017
, our retail segment included
398
retail stores in the Americas (including concessions),
429
international retail stores (including concessions) throughout Europe and Asia, our e-commerce sites in the United States ("U.S.") and Canada, as well as our recently launched e-commerce sites in Europe, China and Japan. As of
April 1, 2017
, our wholesale segment included wholesale sales through approximately
1,405
department store doors and
904
specialty store doors in the Americas and wholesale sales through approximately
1,099
specialty store doors and
199
department store doors internationally. Our remaining revenue is generated through our licensing segment, through which we license to third parties certain production, sales and/or distribution rights.
We offer three primary collections: the
Michael Kors Collection
luxury line, the
MICHAEL Michael Kors
accessible luxury line and the
Michael Kors Mens
line. The
Michael Kors
Collection
establishes the aesthetic authority of our entire brand and is carried by many of our retail stores, our e-commerce sites, as well as in the finest luxury department stores in the world. In 2004, we introduced
MICHAEL Michael Kors
, which has a strong focus on accessories, in addition to offering footwear and apparel, and addresses the significant demand opportunity in accessible luxury goods. More recently, we have begun to grow our men's business in recognition of the significant opportunity afforded by our brand's established fashion authority and the expanding men's market. Taken together, our primary collections target a broad customer base while retaining our premium luxury image.
Certain Factors Affecting Financial Condition and Results of Operations
Establishing brand identity and enhancing global presence.
We intend to continue to increase our international presence and global brand recognition through the formation of various joint ventures with international partners, and continuing with our international licensing arrangements. We feel this is an efficient method for continued penetration into the global luxury goods market, especially for markets where we have yet to establish a substantial presence. In addition, our growth strategy includes assuming direct control of certain international operations, which allows us to better manage our growth opportunities in the related regions. During the second quarter of Fiscal 2016, we made additional capital contributions to our Latin American joint venture, MK (Panama) Holdings, S.A. and subsidiaries (“MK Panama”), obtaining a 75% controlling interest in MK Panama, and began to consolidate MK Panama into our operations beginning with the second quarter of Fiscal 2016. On January 1, 2016, we acquired the previously licensed business in South Korea. On May 31, 2016, we further expanded our global presence by acquiring the previously licensed operations in the Greater China region (please refer to Note 3 to the accompanying consolidated financial statements for additional information).
27
Channel Shift and Demand for Our Accessories and Related Merchandise
. Our performance is affected by trends in the luxury goods industry, as well as shifts in demographics and changes in lifestyle preferences. In addition, the accessible luxury retail and wholesale industry has been recently challenged by lower consumer traffic trends, a promotional selling environment resulting from a channel shift, and other political and economic factors. During Fiscal 2017, we began to strategically reduce shipments to decrease promotional activity within our wholesale channel, which we believe is necessary to appropriately position our brand long-term. Consumer spending has been increasingly constrained due to a decrease in tourist travel and a shift in consumer spending from luxury products to luxury experiences. In addition, consumer shopping preferences have continued to shift from physical stores to on-line shopping. While this trend has resulted in an increase in our e-commerce sales, it has had a negative impact on our brick and mortar stores. We currently expect that this trend will continue in the foreseeable future. As a result, we recorded impairment charges of
$199.2 million
during Fiscal 2017, as compared to
$10.9 million
during Fiscal 2016 and
$0.8 million
in Fiscal 2015, primarily associated with underperforming full-price retail stores (please refer to Notes 11 and 18 to the accompanying consolidated financial statements for additional information). We continue to adjust our operating strategy to the changing business environment and on May 31, 2017, we announced that we plan to close between 100 and 125 of our full-price retail stores over the next two years in order to improve the profitability of our retail store fleet. Over this time period, we expect to incur approximately $100 - $125 million of one-time costs associated with these store closures. Collectively, we anticipate ongoing annual savings of approximately $60 million as a result of the store closures and the lower depreciation and amortization associated with the impairment charges recorded during Fiscal 2017.
Currency fluctuation and the Strengthening U.S. Dollar.
Our consolidated operations are impacted by the relationships between our reporting currency, the U.S. Dollar, and those of our non-U.S. subsidiaries whose functional/local currency is other than the U.S. Dollar. Our Fiscal 2017 results have been negatively impacted by the declines in value of the British Pound relative to the U.S. Dollar of approximately 13%, compared to the same prior year period, following the affirmative vote by the United Kingdom to leave the European Union earlier this fiscal year as well as by the increased volatility of the Euro. Conversely, our results have been positively impacted by increases in the value of the Japanese Yen relative to the U.S. Dollar of approximately 11%.
Disruptions in shipping and distribution
. Our operations are subject to the impact of shipping disruptions as a result of changes or damage to our distribution infrastructure, as well as due to external factors. Any future disruptions in our shipping and distribution network could have a negative impact on our results of operations.
Costs of Manufacturing
. Our industry is subject to volatility in costs related to certain raw materials used in the manufacturing of our products. This volatility applies primarily to costs driven by commodity prices, which can increase or decrease dramatically over a short period of time. These fluctuations may have a material impact on our sales, results of operations and cash flows to the extent they occur. We use commercially reasonable efforts to mitigate these effects by sourcing our products as efficiently as possible. In addition, manufacturing labor costs are also subject to degrees of volatility based on local and global economic conditions. We use commercially reasonable efforts to source from localities that suit our manufacturing standards and result in more favorable labor driven costs to our products.
Critical Accounting Policies
The preparation of financial statements in conformity with accounting principles generally accepted in the United States ("U.S. GAAP") requires management to make estimates and assumptions that affect the reported amounts of assets and liabilities and disclosure of contingent assets and liabilities at the date of the financial statements, as well as the reported amounts of revenue and expenses during the reporting period. Critical accounting policies are those that are the most important to the portrayal of our financial condition and results of operations and that require our most difficult, subjective and complex judgments to make estimates about the effect of matters that are inherently uncertain. In applying such policies, we must make certain assumptions based on our informed judgments, assessments of probability and best estimates. Estimates, by their nature, are subjective and are based on analysis of available information, including current and historical factors and the experience and judgment of management. We evaluate our assumptions and estimates on an ongoing basis. While our significant accounting policies are detailed in
Note 2
to the accompanying financial statements, our critical accounting policies are discussed below and include revenue recognition, inventories, impairment of long-lived assets, goodwill, share-based compensation, derivatives and income taxes.
Revenue Recognition
Revenue is recognized when there is persuasive evidence of an arrangement, delivery has occurred, the price has been fixed and determinable and collectability is reasonably assured. We recognize retail store revenue upon sale of our products to retail consumers, net of estimated returns. Revenue from sales through our e-commerce sites is recognized at the time of delivery to the customer, reduced by an estimate of returns. Wholesale revenue is recognized net of estimates for sales returns, discounts, markdowns and allowances, after merchandise is shipped and title and risk of loss are transferred to our wholesale customers. To arrive at net sales for retail, gross sales are reduced by actual customer returns, as well as by a provision for estimated future
28
customer returns, which is based on management’s review of historical and current customer returns. The amounts reserved for retail sales returns were
$7.3 million
,
$4.7 million
and
$2.5 million
at
April 1, 2017
,
April 2, 2016
and
March 28, 2015
, respectively. To arrive at net sales for wholesale, gross sales are reduced by provisions for estimated future returns based on current expectations, as well as trade discounts, markdowns, allowances, operational chargebacks, and certain cooperative selling expenses. Total sales reserves for wholesale were
$96.7 million
,
$110.9 million
and
$87.5 million
at
April 1, 2017
,
April 2, 2016
and
March 28, 2015
, respectively. These estimates are based on such factors as historical trends, actual and forecasted performance, and market conditions, which are reviewed by management on a quarterly basis. Our historical estimates of these costs were not materially different from actual results.
Royalty revenue generated from product licenses, which includes contributions for advertising, is based on reported sales of licensed products bearing our tradenames at rates specified in the license agreements. These agreements are also subject to contractual minimum levels. Royalty revenue generated by geography-specific licensing agreements is recognized as it is earned under the licensing agreements based on reported sales of licensees applicable to specified periods, as outlined in the agreements. These agreements allow for the use of our tradenames to sell our branded products in specific geographic regions.
Inventories
Our inventory costs include amounts paid to independent manufacturers, plus duties and freight to bring the goods to the Company’s warehouses, which are located in the United States, Holland, Canada, China, Hong Kong, Japan, South Korea and Taiwan. We continuously evaluate the composition of our inventory and make adjustments when the cost of inventory is not expected to be fully recoverable. The net realizable value of our inventory is estimated based on historical experience, current and forecasted demand and market conditions. In addition, reserves for inventory losses are estimated based on historical experience and inventory counts. Our inventory reserves are estimates, which could vary significantly from actual results if future economic conditions, customer demand or competition differ from expectations. Our historical estimates of these adjustments have not differed materially from actual results.
Long-lived Assets
We evaluate all long-lived assets, including fixed assets and finite-lived intangible assets, for impairment whenever events or changes in circumstances indicate that the carrying amount of any such asset may not be recoverable. For the purposes of impairment testing, we group our long-lived assets according to their lowest level of use, such as aggregating and capitalizing all construction costs related to a retail store into leasehold improvements and those related to our wholesale business into shop-in-shops. Our leasehold improvements are typically amortized over the life of the store lease, including highly probable renewals, and our shop-in-shops are amortized over a useful life of three or four years. Our impairment testing is based on our best estimate of the future operating cash flows. If the sum of our estimated undiscounted future cash flows associated with the asset is less than the asset’s carrying value, we recognize an impairment charge, which is measured as the amount by which the carrying value exceeds the fair value of the asset. These estimates of cash flow require significant management judgment and certain assumptions about future volume, sales and expense growth rates, devaluation and inflation. As such, these estimates may differ from actual cash flows and future impairments may result if actual cash flows are lower than our expectations. During
Fiscal 2017
, we recorded impairment charges of
$199.2 million
, which were primarily related to fixed assets and lease rights for underperforming full-price retail stores. During
Fiscal 2016
and
Fiscal 2015
, we recorded fixed asset impairment charges of
$10.9 million
and
$0.8 million
, respectively, primarily related to our retail segment. Please refer to Notes 6, 7, 11 and 18 to the accompanying consolidated audited financial statements for additional information.
Goodwill
We perform an impairment assessment of goodwill on an annual basis, or whenever impairment indicators exist. In the absence of any impairment indicators, goodwill is assessed during the fourth quarter of each fiscal year. These assessments are made with regards to reporting units within our wholesale, retail and licensing segments where our goodwill is recorded, and are based on our current operating projections. Judgments regarding the existence of impairment indicators are based on market conditions and operational performance of the business.
We may assess our goodwill for impairment initially using a qualitative approach (“step zero”) to determine whether it is more likely than not that the fair value of goodwill is greater than its carrying value. If the results of the qualitative assessment indicate that it is not more likely than not that the fair value of goodwill exceeds its carrying value, a quantitative goodwill analysis would be performed to determine if impairment is required. We may also elect to perform a quantitative analysis of goodwill initially rather than using a qualitative approach. The valuation methods used in the quantitative fair value assessment, discounted cash flow and market multiples methods, require management to make certain assumptions and estimates regarding certain industry trends and future profitability of our reporting units. If the carrying amount of a reporting unit exceeds its fair value, we would compare the implied fair value of the reporting unit goodwill to its carrying value. To compute the implied fair value, we would
29
assign the fair value of the reporting unit to all of the assets and liabilities of that unit (including any unrecognized intangible assets) as if the reporting unit had been acquired in a business combination. The excess of the fair value of a reporting unit over the amounts assigned to its assets and liabilities is the implied fair value of goodwill. If the carrying value of the reporting unit’s goodwill exceeded the implied fair value of the reporting unit’s goodwill, we would record an impairment loss to write down such goodwill to its implied fair value. The valuation of goodwill is affected by, among other things, our business plan for the future and estimated results of future operations. Future events could cause us to conclude the impairment indicators exist and, therefore, that goodwill may be impaired.
During the fourth quarter of
Fiscal 2017
, we elected to bypass the initial qualitative assessment and performed our annual impairment analysis using a quantitative approach, using the discounted cash flow method to estimate fair value. Based on the results of this assessment, we concluded that the fair values of all reporting units significantly exceeded the related carrying amounts and there were no reporting units at risk of impairment. There were no impairment charges related to goodwill in any of the fiscal periods presented.
Share-based Compensation
We grant share-based awards to certain of our employees and directors. The grant date fair value of share options is calculated using the Black-Scholes option pricing model, which requires us to use subjective assumptions. The closing market price at the grant date is used to determine the grant date fair value of restricted shares, restricted share units, and performance restricted share units. These values are recognized as expense over the requisite service period, net of estimated forfeitures, based on expected attainment of pre-established performance goals for performance grants, or the passage of time for those grants which have only time-based vesting requirements.
Our expected volatility is based on the average volatility rates of similar actively traded companies over the past 4.5-9.5 years, which is our range of estimated expected holding periods. The expected holding period for performance-based options is based on the period to expiration, which is generally 9-10 years. This approach was chosen as it directly correlates to our service period. The expected holding period for time-based options is calculated using a simplified method, which uses the vesting term of the options, generally 4 years, and the contractual term of 7 years, resulting in holding periods of 4.5-4.75 years. The simplified method was chosen as a means to determine the Company’s estimated holding period, as prior to December 2011, the Company was privately held and, as such, there is insufficient historical option exercise experience. The risk-free rate is derived from the zero-coupon U.S. Treasury Strips yield curve based on the grant’s estimated holding period. Determining the grant date fair value of share-based awards requires considerable judgment, including estimating expected volatility, expected term, risk-free rate, and forfeitures. If factors change and we employ different assumptions, the fair value of future awards and resulting share-based compensation expense may differ significantly from what we have estimated in the past.
Derivative Financial Instruments
We use forward currency exchange contracts to manage our exposure to fluctuations in foreign currency for certain of our transactions. We are exposed to risks on certain purchase commitments to foreign suppliers based on the value of our purchasing subsidiaries’ local currency relative to the currency requirement of the supplier on the date of the commitment. As such, we enter into forward currency contracts that generally mature in 12 months or less, which is consistent with the related purchase commitments. We designate certain contracts related to the purchase of inventory that qualify for hedge accounting as cash flow hedges, while others remain undesignated. All of our derivative instruments are recorded in our consolidated balance sheets at fair value on a gross basis, regardless of their hedge designation. The effective portion of changes in the fair value for contracts designated as cash flow hedges is recorded in equity as a component of accumulated other comprehensive income (loss) until the hedged item effects earnings. When the inventory related to forecasted inventory purchases that are being hedged is sold to a third party, the gains or losses deferred in accumulated other comprehensive income (loss) are recognized within cost of goods sold. We use regression analysis to assess effectiveness of derivative instruments that are designated as hedges, which compares the change in the fair value of the derivative instrument to the change in the related hedged item. Effectiveness is assessed on a quarterly basis and any portion of the designated hedge contracts deemed ineffective is recorded to foreign currency gain (loss). If the hedge is no longer expected to be highly effective in the future, future changes in the fair value are recognized in earnings. For those contracts that are not designated as hedges, changes in the fair value are recorded in foreign currency gain (loss) in our consolidated statements of operations.
The Company is exposed to the risk that counterparties to derivative contracts will fail to meet their contractual obligations. In order to mitigate counterparty credit risk, the Company only enters into contracts with carefully selected financial institutions based upon their credit ratings and certain other financial factors, adhering to established limits for credit exposure.
30
Income Taxes
Deferred income tax assets and liabilities reflect temporary differences between the tax basis and financial reporting basis of our assets and liabilities and are determined using the tax rates and laws in effect for the periods in which the differences are expected to reverse. We periodically assess the realizability of deferred tax assets and the adequacy of deferred tax liabilities, based on the results of local, state, federal or foreign statutory tax audits or our own estimates and judgments.
Realization of deferred tax assets associated with net operating loss and tax credit carryforwards is dependent upon generating sufficient taxable income prior to their expiration in the applicable tax jurisdiction. We periodically review the recoverability of our deferred tax assets and provide valuation allowances as deemed necessary to reduce deferred tax assets to amounts that more-likely-than-not will be realized. This determination involves considerable judgment and our management considers many factors when assessing the likelihood of future realization of deferred tax assets, including recent earnings results within various taxing jurisdictions, expectations of future taxable income, the carryforward periods remaining and other factors. Changes in the required valuation allowance are recorded in income in the period such determination is made. Deferred tax assets could be reduced in the future if our estimates of taxable income during the carryforward period are significantly reduced or alternative tax strategies are no longer viable.
We recognize the impact of an uncertain income tax position taken on our income tax returns at the largest amount that is more-likely-than-not to be sustained upon audit by the relevant taxing authority. The effect of an uncertain income tax position will not be taken into account if the position has less than a 50% likelihood of being sustained. Our tax positions are analyzed periodically (at least quarterly) and adjustments are made as events occur that warrant adjustments for those positions. We record interest expense and penalties payable to relevant tax authorities as income tax expense.
New Accounting Pronouncements
Please refer to
Note 2
to the accompanying consolidated financial statements for detailed information relating to recently adopted and recently issued accounting pronouncements and the associated impacts.
Segment Information
We generate revenue through three business segments: retail, wholesale and licensing. The following table presents our total revenue and income from operations by segment for
Fiscal 2017
,
Fiscal 2016
and
Fiscal 2015
(in millions):
|
|
Fiscal Years Ended
|
||||||||||
|
|
April 1,
2017 |
April 2,
2016 |
March 28,
2015 |
||||||||
|
Revenue:
|
|||||||||||
|
Net sales: Retail
|
$
|
2,572.1
|
|
$
|
2,394.9
|
|
$
|
2,134.6
|
|
||
|
Wholesale
|
1,775.8
|
|
2,143.9
|
|
2,065.1
|
|
|||||
|
Licensing
|
145.8
|
|
173.3
|
|
171.8
|
|
|||||
|
Total revenue
|
$
|
4,493.7
|
|
$
|
4,712.1
|
|
$
|
4,371.5
|
|
||
|
Income from operations:
|
|||||||||||
|
Retail
|
$
|
159.8
|
|
$
|
501.4
|
|
$
|
557.2
|
|
||
|
Wholesale
|
468.1
|
|
584.1
|
|
610.9
|
|
|||||
|
Licensing
|
62.0
|
|
89.6
|
|
88.9
|
|
|||||
|
Income from operations
|
$
|
689.9
|
|
$
|
1,175.1
|
|
$
|
1,257.0
|
|
||
31
Retail
We have four primary retail store formats: "Collection" stores, "Lifestyle" stores, outlet stores and e-commerce, through which we sell our products, as well as licensed products bearing our name, directly to the end consumer throughout the Americas (excluding Brazil), Europe and certain parts of Asia. In addition to these four retail formats, we operate concessions in a select number of department stores. Our "Collection" stores are located in highly prestigious shopping areas, while our "Lifestyle" stores are located in well-populated commercial shopping locations and leading regional shopping centers. Our outlet stores, which are generally in outlet centers, extend our reach to additional consumer groups. Our e-commerce business includes our existing e-commerce sites in the U.S. and Canada, as well as our recently launched European e-commerce sites in France, Germany, Italy, Spain, Switzerland and the United Kingdom, and our recently launched Asian e-commerce sites in China and Japan. We plan to continue to expand our e-commerce presence to additional countries in Europe and South Korea in Fiscal 2018.
The following table presents the growth in our global network of retail stores during
Fiscal 2017
,
Fiscal 2016
, and
Fiscal 2015
:
|
April 1,
2017 |
April 2,
2016 |
March 28,
2015 |
||||||
|
Full price retail stores including concessions:
|
||||||||
|
Number of stores
|
614
|
|
492
|
|
373
|
|
||
|
Increase during period
|
122
|
|
119
|
|
94
|
|
||
|
Percentage increase vs. prior year
|
24.8
|
%
|
31.9
|
%
|
33.7
|
%
|
||
|
Total gross square footage
|
1,408,775
|
|
1,140,025
|
|
859,352
|
|
||
|
Average square footage per store
|
2,294
|
|
2,317
|
|
2,304
|
|
||
|
Outlet stores:
|
||||||||
|
Number of stores
|
213
|
|
176
|
|
153
|
|
||
|
Increase during period
|
37
|
|
23
|
|
27
|
|
||
|
Percentage increase vs. prior year
|
21.0
|
%
|
15.0
|
%
|
21.4
|
%
|
||
|
Total gross square footage
|
849,184
|
|
637,325
|
|
517,308
|
|
||
|
Average square footage per store
|
3,987
|
|
3,621
|
|
3,381
|
|
||
The following table presents our retail stores by geographic location:
|
April 1,
2017 |
April 2,
2016 |
March 28,
2015 |
||||||
|
Store count by region:
|
||||||||
|
The Americas (U.S., Canada and Latin America)
|
398
|
|
(1)
|
390
|
|
(2)
|
343
|
|
|
Europe
|
201
|
|
177
|
|
133
|
|
||
|
Asia
|
228
|
|
(1)
|
101
|
|
(2)
|
50
|
|
|
Total
|
827
|
|
668
|
|
526
|
|
||
(1)
Store count for Asia includes 111 stores associated with the previously licensed business in Greater China (comprised of China, Hong Kong, Macau and Taiwan) acquired on May 31, 2016, 35 stores associated the previously licensed business in South Korea acquired on January 1, 2016, and 82 stores in Japan. Store count in the Americas includes 6 stores in Latin America, as a result of consolidation of MK Panama into our operations beginning in July 2016 (excluding Brazil operations, which were licensed to another third party during Fiscal 2017).
|
(2)
|
Store count in Asia includes 36 stores in South Korea and 65 stores in Japan; store count in the Americas includes 14 stores in Latin America, due to the consolidation of MK Panama into our operations.
|
See
Note 3
to the accompanying consolidated financial statements for additional information.
32
Wholesale
We sell our products directly to department stores primarily located across the Americas (excluding Brazil) and Europe to accommodate consumers who prefer to shop at major department stores. In addition, we sell to specialty stores for those consumers who enjoy the boutique experience afforded by such stores, as well as to travel retail shops in the Americas, Europe and Asia. We also have wholesale arrangements pursuant to which we sell products to our geographic licensees. We continue to focus our sales efforts and drive sales in existing locations by enhancing presentation with our specialized fixtures that effectively communicate our brand and create a more personalized shopping experience for consumers. We tailor our assortments through wholesale product planning and allocation processes to better match the demands of our department store customers in each local market.
The following table presents the increase (decrease) in our global network of wholesale doors during
Fiscal 2017
,
Fiscal 2016
and
Fiscal 2015
:
|
|
Fiscal Years Ended
|
|||||||
|
|
April 1,
2017 |
April 2,
2016 |
March 28,
2015 |
|||||
|
Number of full-price wholesale doors
|
3,607
|
|
3,889
|
|
4,038
|
|
||
|
(Decrease) increase during period
|
(282
|
)
|
(149
|
)
|
310
|
|
||
|
Percentage (decrease) increase vs. prior year
|
(7.3
|
)%
|
(3.7
|
)%
|
8.3
|
%
|
||
Licensing
We generate revenue through product and geographic licensing arrangements. Our product license agreements allow third parties to use our brand name and trademarks in connection with the manufacturing and sale of a variety of products, including watches, jewelry, fragrances and beauty, and eyewear. In our product licensing arrangements, we take an active role in the design, marketing and distribution of products under our brands. Our geographic licensing arrangements allow third parties to use our tradenames in connection with the retail and/or wholesale sales of our branded products in specific geographic regions. During Fiscal 2016, we acquired a controlling interest in MK Panama on June 28, 2015 and acquired direct control of the previously licensed business in South Korea on January 1, 2016. During Fiscal 2017, we acquired direct control of our licensed operations in the Greater China region on May 31, 2016. The results of the acquired businesses are now being reported as part of our retail and wholesale operations. During the second quarter of Fiscal 2017, the Company licensed the right to operate retail stores bearing the Michael Kors trademark to a third party in Brazil.
Key Performance Indicators and Statistics
We use a number of key indicators of operating results to evaluate our performance, including the following (dollars in millions):
|
|
Fiscal Years Ended
|
||||||||||
|
|
April 1,
2017 |
April 2,
2016 |
March 28,
2015 |
||||||||
|
Total revenue
|
$
|
4,493.7
|
|
$
|
4,712.1
|
|
$
|
4,371.5
|
|
||
|
Gross profit as a percent of total revenue
|
59.2
|
%
|
59.4
|
%
|
60.6
|
%
|
|||||
|
Income from operations
|
$
|
689.9
|
|
$
|
1,175.1
|
|
$
|
1,257.0
|
|
||
|
Retail net sales - The Americas
|
$
|
1,713.7
|
|
$
|
1,779.0
|
|
$
|
1,656.1
|
|
||
|
Retail net sales - Europe
|
$
|
507.7
|
|
$
|
509.6
|
|
$
|
412.1
|
|
||
|
Retail net sales - Asia
|
$
|
350.7
|
|
$
|
106.3
|
|
$
|
66.4
|
|
||
|
(Decrease) increase in comparable store net sales
|
(8.3
|
)%
|
(4.2
|
)%
|
10.3
|
%
|
|||||
|
Wholesale net sales - The Americas
|
$
|
1,340.9
|
|
$
|
1,628.6
|
|
$
|
1,662.5
|
|
||
|
Wholesale net sales - Europe
|
$
|
376.5
|
|
$
|
406.4
|
|
$
|
401.1
|
|
||
|
Wholesale net sales - Asia
|
$
|
58.4
|
|
$
|
108.9
|
|
$
|
1.5
|
|
||
General Definitions for Operating Results
Net sales
consist of sales from comparable retail stores and non-comparable retail stores, net of returns and markdowns, as well as those made to our wholesale customers, net of returns, discounts, markdowns and allowances.
33
Comparable store sales
include sales from a retail store or an e-commerce site that has been operating for one full year after the end of the first month of its operation under our ownership. For stores that are closed, sales that were made in the final month of their operations (assuming closure prior to the fiscal month's end), are excluded from the calculation of comparable store sales. Additionally, sales for stores that are either relocated, or expanded by a square footage of 25% or greater, in any given fiscal year, are also excluded from the calculation of comparable store sales at the time of their move or interruption, until such stores have been in their new location, or are operating under their new size/capacity, for at least one full year after the end of the first month of their relocation or expansion. All comparable store sales are presented on a 52-week basis. Comparable store sales are reported on a global basis, which represents management’s view of our Company as an expanding global business.
Constant currency effects
are non-U.S. GAAP financial measures, which are provided to supplement our reported operating results to facilitate comparisons of our operating results and trends in our business, excluding the effects of foreign currency rate fluctuations. Because we are a global company, foreign currency exchange rates may have a significant effect on our reported results. We calculate constant currency measures and the related foreign currency impacts by translating the current-year’s reported amounts into comparable amounts using prior year’s foreign exchange rates for each currency. All constant currency performance measures discussed below should be considered a supplement to and not in lieu of our operating performance measures calculated in accordance with U.S. GAAP.
Licensing revenue
consists of fees charged on sales of licensed products by our licensees as well as contractual royalty rates for the use of our trademarks in certain geographic territories.
Cost of goods sold
includes the cost of inventory sold, freight-in on merchandise and foreign currency exchange gains/losses related to forward contracts for purchase commitments. All retail store operating and occupancy costs are included in
Selling, general and administrative expenses
(see below), and as a result our cost of goods sold may not be comparable to that of other entities that have chosen to include some or all of those expenses as a component of their cost of goods sold.
Gross profit
is total revenue (net sales plus licensing revenue) minus cost of goods sold. As a result of retail store operating and occupancy costs being excluded from our cost of goods sold, our gross profit may not be comparable to that of other entities that have chosen to include some or all of those expenses as a component of their gross profit.
Selling, general and administrative expenses
consist of warehousing and distribution costs, rent for our distribution centers, store payroll, store occupancy costs (such as rent, common area maintenance, store pre-opening, real estate taxes and utilities), information technology and systems costs, corporate payroll and related benefits, advertising and promotion expense, transaction costs and other general expenses.
Depreciation and amortization
includes depreciation and amortization of fixed and definite-lived intangible assets.
Impairment of long-lived assets
consists of charges to write-down fixed assets and finite-lived intangible assets to fair value.
Income from operations
consists of gross profit minus total operating expenses.
Other (income) expense, net
includes insurance settlements, a gain on acquisition of MK Korea during Fiscal 2016, proceeds received related to our anti-counterfeiting efforts, rental income from our owned distribution center in Europe and equity income or loss earned on our joint venture (prior to obtaining controlling interest in MK Panama). In future periods, it may include any other miscellaneous activities not directly related to our operations.
Interest expense, net
represents interest and fees on our revolving credit facilities and letters of credit (see “Liquidity and Capital Resources” for further detail on our credit facilities), as well as amortization of deferred financing costs, offset by interest earned on highly liquid investments (investments purchased with an original maturity of three months or less, classified as cash equivalents).
Foreign currency loss
includes net gains or losses related to the mark-to-market (fair value) on our forward currency contracts not designated as accounting hedges and unrealized income or loss from the re-measurement of monetary assets and liabilities denominated in currencies other than the functional currencies of our subsidiaries.
Noncontrolling interest
represents the portion of the equity ownership in MK Panama, which is not attributable to the Company. On June 28, 2015, we obtained a controlling interest in MK Panama and began to consolidate its financial results in our operations.
34
Results of Operations
Comparison of
Fiscal 2017
with
Fiscal 2016
The following table details the results of our operations for
Fiscal 2017
and
Fiscal 2016
and expresses the relationship of certain line items to total revenue as a percentage (dollars in millions):
|
|
Fiscal Years Ended
|
$ Change
|
% Change
|
% of Total
Revenue for
Fiscal 2017
|
% of Total
Revenue for
Fiscal 2016
|
|||||||||||||||
|
|
April 1,
2017 |
April 2,
2016 |
||||||||||||||||||
|
Statements of Operations Data:
|
||||||||||||||||||||
|
Net sales
|
$
|
4,347.9
|
|
$
|
4,538.8
|
|
$
|
(190.9
|
)
|
(4.2
|
)%
|
|||||||||
|
Licensing revenue
|
145.8
|
|
173.3
|
|
(27.5
|
)
|
(15.9
|
)%
|
||||||||||||
|
Total revenue
|
4,493.7
|
|
4,712.1
|
|
(218.4
|
)
|
(4.6
|
)%
|
||||||||||||
|
Cost of goods sold
|
1,832.3
|
|
1,914.9
|
|
(82.6
|
)
|
(4.3
|
)%
|
40.8
|
%
|
40.6
|
%
|
||||||||
|
Gross profit
|
2,661.4
|
|
2,797.2
|
|
(135.8
|
)
|
(4.9
|
)%
|
59.2
|
%
|
59.4
|
%
|
||||||||
|
Selling, general and administrative expenses
|
1,552.5
|
|
1,428.0
|
|
124.5
|
|
8.7
|
%
|
34.5
|
%
|
30.3
|
%
|
||||||||
|
Depreciation and amortization
|
219.8
|
|
183.2
|
|
36.6
|
|
20.0
|
%
|
4.9
|
%
|
3.9
|
%
|
||||||||
|
Impairment of long-lived assets
|
199.2
|
|
10.9
|
|
188.3
|
|
NM
|
|
4.4
|
%
|
0.2
|
%
|
||||||||
|
Total operating expenses
|
1,971.5
|
|
1,622.1
|
|
349.4
|
|
21.5
|
%
|
43.9
|
%
|
34.4
|
%
|
||||||||
|
Income from operations
|
689.9
|
|
1,175.1
|
|
(485.2
|
)
|
(41.3
|
)%
|
15.4
|
%
|
24.9
|
%
|
||||||||
|
Other income, net
|
(5.4
|
)
|
(3.7
|
)
|
(1.7
|
)
|
45.9
|
%
|
(0.1
|
)%
|
(0.1
|
)%
|
||||||||
|
Interest expense, net
|
4.1
|
|
1.7
|
|
2.4
|
|
141.2
|
%
|
0.1
|
%
|
—
|
%
|
||||||||
|
Foreign currency loss
|
2.6
|
|
4.8
|
|
(2.2
|
)
|
(45.8
|
)%
|
0.1
|
%
|
0.1
|
%
|
||||||||
|
Income before provision for income taxes
|
688.6
|
|
1,172.3
|
|
(483.7
|
)
|
(41.3
|
)%
|
15.3
|
%
|
24.9
|
%
|
||||||||
|
Provision for income taxes
|
137.1
|
|
334.6
|
|
(197.5
|
)
|
(59.0
|
)%
|
3.1
|
%
|
7.1
|
%
|
||||||||
|
Net income
|
551.5
|
|
837.7
|
|
(286.2
|
)
|
(34.2
|
)%
|
||||||||||||
|
Less: Net loss attributable to noncontrolling interest
|
(1.0
|
)
|
(1.4
|
)
|
0.4
|
|
(28.6
|
)%
|
||||||||||||
|
Net income attributable to MKHL
|
$
|
552.5
|
|
$
|
839.1
|
|
$
|
(286.6
|
)
|
(34.2
|
)%
|
|||||||||
|
NM
|
Not meaningful.
|
|
Total Revenue
Total revenue decreased
$218.4 million
, or
4.6%
, to
$4.494 billion
for the fiscal year ended
April 1, 2017
, compared to
$4.712 billion
for the fiscal year ended
April 2, 2016
, which included net unfavorable foreign currency effects of
$11.7 million
primarily related to the weakening of the British Pound and the Euro, partially offset by the strengthening of the Japanese Yen against the U.S. Dollar in
Fiscal 2017
, as compared to
Fiscal 2016
. On a constant currency basis, our total revenue decreased by
$206.7 million
, or
4.4%
. The decrease in our total revenue was primarily attributable to lower wholesale and licensing revenues, partially offset by increased revenue from our retail business. Total revenue in
Fiscal 2017
included approximately $168.3 million of incremental revenue attributable to our recent acquisitions, including $151.1 million related to our acquisition of the Greater China operations on May 31, 2016 and incremental revenues of $4.0 million and $13.2 million, respectively, resulting from our consolidation of MK Panama and acquisition of MK Korea in Fiscal 2016. Fiscal 2016 included approximately $33.7 million of incremental net retail sales attributable to the inclusion of the 53rd week.
35
The following table details revenues for our three business segments (dollars in millions):
|
|
Fiscal Years Ended
|
|
% Change
|
% of Total
Revenue
for Fiscal
2017
|
% of Total
Revenue
for Fiscal
2016
|
||||||||||||||||||
|
|
April 1,
2017 |
April 2,
2016 |
$ Change
|
As Reported
|
Constant
Currency
|
||||||||||||||||||
|
Revenue:
|
|||||||||||||||||||||||
|
Net sales: Retail
|
$
|
2,572.1
|
|
$
|
2,394.9
|
|
$
|
177.2
|
|
7.4
|
%
|
7.8
|
%
|
57.2
|
%
|
50.8
|
%
|
||||||
|
Wholesale
|
1,775.8
|
|
2,143.9
|
|
(368.1
|
)
|
(17.2
|
)%
|
(17.0
|
)%
|
39.5
|
%
|
45.5
|
%
|
|||||||||
|
Licensing
|
145.8
|
|
173.3
|
|
(27.5
|
)
|
(15.9
|
)%
|
(15.9
|
)%
|
3.3
|
%
|
3.7
|
%
|
|||||||||
|
Total revenue
|
$
|
4,493.7
|
|
$
|
4,712.1
|
|
$
|
(218.4
|
)
|
(4.6
|
)%
|
(4.4
|
)%
|
||||||||||
Retail
Net sales from our retail stores increased
$177.2 million
, or
7.4%
, to
$2.572 billion
for
Fiscal 2017
, compared to
$2.395 billion
for
Fiscal 2016
, which included unfavorable foreign currency effects of
$8.7 million
. On a constant currency basis, net sales from our retail stores increased
$185.9 million
, or
7.8%
. We operated
827
retail stores, including concessions, as of
April 1, 2017
, compared to
668
retail stores, including concessions, as of
April 2, 2016
.
Our comparable store sales decreased
$172.7 million
, or
8.3%
, during
Fiscal 2017
, which included net unfavorable foreign currency effects of
$3.9 million
. Our comparable store sales benefited approximately 304 basis points from the inclusion of the North American e-commerce sales in comparable store sales. On a constant currency basis, our comparable store sales decreased
$168.8 million
, or
8.1%
. The decrease in our comparable store sales was primarily attributable to lower sales from our women's accessories, watches and jewelry product categories during
Fiscal 2017
compared to
Fiscal 2016
.
Our non-comparable store sales increased
$349.9 million
during
Fiscal 2017
, which included net unfavorable foreign currency effects of
$4.8 million
. On a constant currency basis, our non-comparable store sales increased
$354.7 million
. The increase in non-comparable store sales was primarily attributable to operating
159
additional stores since
April 2, 2016
, including 111 stores associated with our acquisition of the previously licensed operations in Greater China. Our recently acquired and consolidated businesses contributed approximately $226.9 million to our non-comparable store sales for
Fiscal 2017
, $206.7 million of which related to Greater China, $15.1 million to South Korea and $5.1 million to Latin America. Fiscal 2016 included approximately $33.7 million of incremental net retail sales attributable to the inclusion of the 53rd week.
Wholesale
Net sales to our wholesale customers decreased
$368.1 million
, or
17.2%
, to
$1.776 billion
for
Fiscal 2017
, compared to
$2.144 billion
for
Fiscal 2016
, which included unfavorable foreign currency effects of
$3.0 million
. On a constant currency basis, our wholesale net sales decreased
$365.1 million
, or
17.0%
. The decrease in our wholesale net sales was primarily attributable to lower sales from our women's accessories, apparel and footwear product lines, offset in part by increased men's sales during
Fiscal 2017
as compared to
Fiscal 2016
. Approximately $51.2 million of the decrease in wholesale net sales was due to the absence of the prior period wholesale sales to our licensees in Greater China, South Korea and Latin America as a result of our acquisition and consolidation of the related businesses.
Licensing
Royalties earned on our licensing agreements decreased
$27.5 million
, or
15.9%
, to
$145.8 million
for
Fiscal 2017
, compared to
$173.3 million
for
Fiscal 2016
. This decrease was primarily attributable to lower licensing revenues related to watches and lower revenues from our geographic licensing arrangements in Asia due to our recent acquisitions of the related licensed operations, as well as a decrease in licensing revenues related to jewelry. These decreases were partially offset by higher licensing revenues related to sales of outerwear.
Gross Profit
Gross profit decreased
$135.8 million
, or
4.9%
, to
$2.661 billion
during
Fiscal 2017
, compared to
$2.797 billion
for
Fiscal 2016
, which included unfavorable foreign currency effects of
$2.0 million
. Gross profit as a percentage of total revenue declined
20
basis points to
59.2%
during
Fiscal 2017
, compared to
59.4%
during
Fiscal 2016
. The slight decrease in our gross profit margin was primarily driven by a 250 basis point decline in our retail gross margin, primarily attributable to increased promotional activity, which was largely offset by a favorable channel mix due to a higher proportion of retail sales than in the prior fiscal period, as
well a 50 basis point improvement in our wholesale gross margin, primarily reflecting lower allowances during
Fiscal 2017
, as compared to
Fiscal 2016
.
36
Total Operating Expenses
Total operating expenses increased
$349.4 million
, or
21.5%
, to
$1.972 billion
during
Fiscal 2017
, compared to
$1.622 billion
for
Fiscal 2016
. Our operating expenses included a net favorable foreign currency impact of approximately
$5.4 million
. Total operating expenses as a percentage of total revenue increased to
43.9%
in
Fiscal 2017
, compared to
34.4%
in
Fiscal 2016
. The components that comprise total operating expenses are detailed below.
Selling, General and Administrative Expenses
Selling, general and administrative expenses increased
$124.5 million
, or
8.7%
, to
$1.553 billion
during
Fiscal 2017
, compared to
$1.428 billion
for
Fiscal 2016
. The increase in selling, general and administrative expenses was primarily due to the following:
|
•
|
an increase of $129.9 million due to the inclusion of the recently acquired businesses in the Greater China and South Korea regions in our operating results during Fiscal 2017;
|
|
•
|
approximately $11.3 million in transaction costs recorded during Fiscal 2017 in connection with our acquisition of the Greater China business; and
|
|
•
|
an increase of $31.4 million in retail store occupancy costs, excluding expenses related to acquired businesses, primarily attributable to the growth in our retail store network and our global e-commerce business.
|
These increases were partially offset in part by:
|
•
|
a decrease of $29.9 million in corporate expenses, excluding transaction costs and expenses related to acquired businesses;
|
|
•
|
a decrease of $12.7 million in selling expenses, excluding acquired businesses; and
|
|
•
|
lower retail compensation-related expenses of $11.3 million primarily as a result of our cost reduction initiatives.
|
Selling, general and administrative expenses as a percentage of total revenue increased to
34.5%
during
Fiscal 2017
, compared to
30.3%
for
Fiscal 2016
. The increase as a percentage of total revenue was primarily due to the increase in our retail store-related costs as a percentage of revenue during
Fiscal 2017
, as compared to
Fiscal 2016
.
Depreciation and Amortization
Depreciation and amortization increased
$36.6 million
, or
20.0%
, to
$219.8 million
during
Fiscal 2017
, compared to
$183.2 million
for
Fiscal 2016
. Approximately $31.1 million of this increase was attributable to depreciation and amortization expenses recorded for our newly acquired and consolidated businesses in Greater China, South Korea and Latin America, including amortization of the reacquired rights intangible asset recognized in connection with the acquisition of the Greater China business. The remainder of the increase in depreciation and amortization expense was due to an increase in build-out of our new retail stores and shop-in-shop locations, and investments in our corporate facilities and our information systems infrastructure. Depreciation and amortization increased to
4.9%
as a percentage of total revenue during
Fiscal 2017
, compared to
3.9%
for
Fiscal 2016
.
Impairment of Long-Lived Assets
During
Fiscal 2017
, we recognized asset impairment charges of approximately
$199.2 million
,
$198.7 million
of which related to fixed assets and lease rights for underperforming retail locations that are still in operation and
$0.5 million
related to our wholesale operations. During
Fiscal 2016
, fixed asset impairment charges of
$10.9 million
, $8.6 million of which related to retail locations that are still in operation, $0.4 million related to our wholesale operations and $1.9 million related to a corporate fixed asset that is no longer in service. Please refer to
Note 11
and
Note 18
to the accompanying consolidated financial statements for additional information.
Income from Operations
As a result of the foregoing, income from operations decreased
$485.2 million
, or
41.3%
, to
$689.9 million
during
Fiscal 2017
, compared to
$1.175 billion
for
Fiscal 2016
, which included net favorable foreign currency effects of
$3.4 million
. Income from operations as a percentage of total revenue declined to
15.4%
in
Fiscal 2017
, compared to
24.9%
in
Fiscal 2016
.
37
The following table details income from operations for our three business segments (dollars in millions):
|
|
Fiscal Years Ended
|
$ Change
|
% Change
|
% of Net
Sales/
Revenue for
Fiscal 2017
|
% of Net
Sales/ Revenue for Fiscal 2016 |
|||||||||||||||
|
|
April 1,
2017 |
April 2,
2016 |
||||||||||||||||||
|
Income from operations:
|
||||||||||||||||||||
|
Retail
|
$
|
159.8
|
|
$
|
501.4
|
|
$
|
(341.6
|
)
|
(68.1
|
)%
|
6.2
|
%
|
20.9
|
%
|
|||||
|
Wholesale
|
468.1
|
|
584.1
|
|
(116.0
|
)
|
(19.9
|
)%
|
26.4
|
%
|
27.2
|
%
|
||||||||
|
Licensing
|
62.0
|
|
89.6
|
|
(27.6
|
)
|
(30.8
|
)%
|
42.5
|
%
|
51.7
|
%
|
||||||||
|
Income from operations
|
$
|
689.9
|
|
$
|
1,175.1
|
|
$
|
(485.2
|
)
|
(41.3
|
)%
|
15.4
|
%
|
24.9
|
%
|
|||||
Retail
Income from operations for our retail segment declined
$341.6 million
, or
68.1%
, to
$159.8 million
during
Fiscal 2017
, compared to
$501.4 million
for
Fiscal 2016
, which included impairment charges relating to underperforming retail stores of
$198.7 million
and
$8.6 million
, respectively. Income from operations as a percentage of net retail sales for the retail segment declined from
20.9%
in
Fiscal 2016
to
6.2%
during
Fiscal 2017
. Approximately 740 basis points of this decline was attributable to the above mentioned impairment charges. The remaining 730 basis point decrease in retail income from operations as a percentage of net retail sales was primarily due to an increase in other operating expenses as a percentage of net retail sales of approximately 480 basis points, as well as a 250 basis point decrease in gross profit margin, as previously discussed, during
Fiscal 2017
as compared to
Fiscal 2016
. The increase in total retail operating expenses as a percentage of net retail sales was largely due to the following: (i) the above-mentioned impairment charges for underperforming retail stores still in operation; (ii) increased retail store-related costs; (iii) higher depreciation expenses associated with the recently acquired businesses and new store openings; (iv) increased corporate allocated expenses primarily due to the inclusion of transaction costs of $11.3 million related to the acquisition of the Greater China business; and (v) amortization of the reacquired rights intangible asset recognized in connection with our acquisition of the Greater China business.
Wholesale
Income from operations for our wholesale segment declined
$116.0 million
, or
19.9%
, to
$468.1 million
during
Fiscal 2017
, compared to
$584.1 million
for
Fiscal 2016
. Income from operations as a percentage of net wholesale sales decreased approximately
80
basis points to
26.4%
. The decrease in wholesale income from operations as a percentage of wholesale net sales was primarily due to higher operating expenses as a percentage of net wholesale sales of approximately 130 basis points, partially offset by a 50 basis point increase in our wholesale gross profit margin, as previously discussed. The increase in operating expenses as a percentage of wholesale sales was primarily attributable to increased distribution, selling and design costs, as well as higher depreciation expenses in
Fiscal 2017
, partially offset by the absence of prior year write-off related to fixed assets.
Licensing
Income from operations for our licensing segment decreased
$27.6 million
, or
30.8%
, to
$62.0 million
during
Fiscal 2017
, compared to
$89.6 million
for
Fiscal 2016
. Income from operations as a percentage of licensing revenue declined approximately
920
basis points to
42.5%
. The decline in licensing income from operations as a percentage of licensing revenue was due to an increase in operating expenses as a percentage of licensing revenues during
Fiscal 2017
, as compared to
Fiscal 2016
. This increase in operating expenses as a percentage of licensing revenue was primarily due to increased advertising expenses, depreciation expenses and corporate allocated expenses, including costs related to protection of our intellectual property, during
Fiscal 2017
as compared to
Fiscal 2016
.
Other Income, net
Other income of
$5.4 million
during
Fiscal 2017
was primarily comprised of $3.8 million in insurance settlements related to the prior-year disruption to our former third party operated e-commerce fulfillment center, $0.9 million of income related to our anti-counterfeiting efforts and $0.7 million of rental income from our owned distribution center in Europe. During
Fiscal 2016
, other income of
$3.7 million
was primarily comprised of a $3.7 million gain on acquisition of MK Korea (see Note 3 to the accompanying consolidated financial statements) and $1.0 million in income related to our anti-counterfeiting efforts, partially offset by $1.0 million of losses related to our joint venture, which were recorded under the equity method of accounting prior to obtaining controlling interest in MK Panama during the second quarter of Fiscal 2016.
38
Interest expense, net
Interest expense, net increased
$2.4 million
to
$4.1 million
for
Fiscal 2017
, as compared to
$1.7 million
for
Fiscal 2016
, primarily due to higher interest expense due to an increase in borrowings outstanding and lower interest income due to a decline in our short-term investments (cash-equivalents) during
Fiscal 2017
.
Foreign Currency Loss
We recognized foreign currency losses of
$2.6 million
and
$4.8 million
during
Fiscal 2017
and
Fiscal 2016
, respectively, which were primarily attributable to net losses on the revaluation and settlement of certain of our account payable in currencies other than the functional currency of the applicable reporting units, as well as the remeasurement of dollar-denominated intercompany loans with certain of our subsidiaries. The net foreign currency losses for
Fiscal 2017
and
Fiscal 2016
also included favorable mark-to-market adjustments of
$2.6 million
and unfavorable mark-to-market adjustments of
$2.1 million
, respectively, related to our forward foreign currency contracts not designated as accounting hedges.
Provision for Income Taxes
We recognized
$137.1 million
of income tax expense during
Fiscal 2017
, compared with
$334.6 million
for
Fiscal 2016
. Our effective tax rate for
Fiscal 2017
was
19.9%
, compared to
28.5%
for
Fiscal 2016
. The decrease in our effective tax rate was primarily due to the favorable effect of global financing activities as well as the increase in taxable income in certain of our non-U.S. subsidiaries (predominantly European operations) during Fiscal 2017, which are subject to lower statutory income tax rates. Due to substantial international growth and expansion over the past several years and our Company being a U.K. tax resident, we believe that it is most appropriate to reconcile our effective tax rate to the U.K. statutory tax rate.
Our effective tax rate may fluctuate from time to time due to the effects of changes in U.S. state and local taxes and tax rates in foreign jurisdictions. In addition, factors such as the geographic mix of earnings, enacted tax legislation and the results of various global tax strategies, may also impact our effective tax rate in future periods.
Net Loss Attributable to Noncontrolling Interest
During
Fiscal 2017
and
Fiscal 2016
, we recorded a net loss attributable to our noncontrolling interest in MK Panama of
$1.0 million
and
$1.4 million
, respectively. These losses represent the share of MK Panama's net loss that is not attributable to the Company.
Net Income Attributable to MKHL
As a result of the foregoing, our net income attributable to MKHL declined
$286.6 million
, or
34.2%
, to
$552.5 million
during
Fiscal 2017
, compared to
$839.1 million
for
Fiscal 2016
, which included net favorable foreign currency effects of
$2.9 million
. Fiscal 2017 net income reflected approximately $148.3 million of impairment charges, net of taxes, primarily related to asset write downs for underperforming retail stores, as described above.
39
Results of Operations
Comparison of Fiscal 2016 with Fiscal 2015
The following table details the results of our operations for Fiscal 2016 and Fiscal 2015 and expresses the relationship of certain line items to total revenue as a percentage (dollars in millions):
|
|
Fiscal Years Ended
|
$ Change
|
% Change
|
% of Total
Revenue for
Fiscal 2016
|
% of Total
Revenue for
Fiscal 2015
|
|||||||||||||||
|
|
April 2,
2016 |
March 28,
2015 |
||||||||||||||||||
|
Statements of Operations Data:
|
||||||||||||||||||||
|
Net sales
|
$
|
4,538.8
|
|
$
|
4,199.7
|
|
$
|
339.1
|
|
8.1
|
%
|
|||||||||
|
Licensing revenue
|
173.3
|
|
171.8
|
|
1.5
|
|
0.9
|
%
|
||||||||||||
|
Total revenue
|
4,712.1
|
|
4,371.5
|
|
340.6
|
|
7.8
|
%
|
||||||||||||
|
Cost of goods sold
|
1,914.9
|
|
1,723.8
|
|
191.1
|
|
11.1
|
%
|
40.6
|
%
|
39.4
|
%
|
||||||||
|
Gross profit
|
2,797.2
|
|
2,647.7
|
|
149.5
|
|
5.6
|
%
|
59.4
|
%
|
60.6
|
%
|
||||||||
|
Selling, general and administrative expenses
|
1,428.0
|
|
1,251.5
|
|
176.5
|
|
14.1
|
%
|
30.3
|
%
|
28.6
|
%
|
||||||||
|
Depreciation and amortization
|
183.2
|
|
138.4
|
|
44.8
|
|
32.4
|
%
|
3.9
|
%
|
3.2
|
%
|
||||||||
|
Impairment of long-lived assets
|
10.9
|
|
0.8
|
|
10.1
|
|
NM
|
|
0.2
|
%
|
—
|
%
|
||||||||
|
Total operating expenses
|
1,622.1
|
|
1,390.7
|
|
231.4
|
|
16.6
|
%
|
34.4
|
%
|
31.8
|
%
|
||||||||
|
Income from operations
|
1,175.1
|
|
1,257.0
|
|
(81.9
|
)
|
(6.5
|
)%
|
24.9
|
%
|
28.8
|
%
|
||||||||
|
Other income, net
|
(3.7
|
)
|
(1.6
|
)
|
(2.1
|
)
|
131.3
|
%
|
(0.1
|
)%
|
(0.1
|
)%
|
||||||||
|
Interest expense, net
|
1.7
|
|
0.2
|
|
1.5
|
|
750.0
|
%
|
—
|
%
|
—
|
%
|
||||||||
|
Foreign currency loss
|
4.8
|
|
2.6
|
|
2.2
|
|
84.6
|
%
|
0.1
|
%
|
0.1
|
%
|
||||||||
|
Income before provision for income taxes
|
1,172.3
|
|
1,255.8
|
|
(83.5
|
)
|
(6.6
|
)%
|
24.9
|
%
|
28.7
|
%
|
||||||||
|
Provision for income taxes
|
334.6
|
|
374.8
|
|
(40.2
|
)
|
(10.7
|
)%
|
7.1
|
%
|
8.6
|
%
|
||||||||
|
Net income
|
837.7
|
|
881.0
|
|
(43.3
|
)
|
(4.9
|
)%
|
||||||||||||
|
Less: Net loss attributable to noncontrolling interest
|
(1.4
|
)
|
—
|
|
(1.4
|
)
|
NM
|
|
||||||||||||
|
Net income attributable to MKHL
|
$
|
839.1
|
|
$
|
881.0
|
|
$
|
(41.9
|
)
|
(4.8
|
)%
|
|||||||||
|
NM
|
Not meaningful.
|
|
Total Revenue
Total revenue increased $340.6 million, or 7.8%, to $4.712 billion for the fiscal year ended April 2, 2016, compared to $4.372 billion for the fiscal year ended March 28, 2015, which included unfavorable foreign currency effects of $168.7 million primarily related to the weakening of the Euro, the Canadian Dollar, and the Japanese Yen against the U.S. Dollar in Fiscal 2016, as compared to Fiscal 2015. On a constant currency basis, our total revenue increased by $509.3 million, or 11.7%. Fiscal 2016 also included approximately $33.7 million of incremental net retail sales attributable to the inclusion of the 53rd week, as well as $28.9 million of incremental revenue recorded as a result of consolidating MK Panama and acquiring MK Korea during Fiscal 2016. The increase in our revenues was primarily due to an increase in our non-comparable retail store sales and wholesale sales, partially offset by lower comparable retail store sales.
40
The following table details revenues for our three business segments (dollars in millions):
|
|
Fiscal Years Ended
|
|
% Change
|
% of Total
Revenue
for Fiscal
2016
|
% of Total
Revenue
for Fiscal
2015
|
||||||||||||||||||
|
|
April 2,
2016 |
March 28,
2015 |
$ Change
|
As Reported
|
Constant
Currency
|
||||||||||||||||||
|
Revenue:
|
|||||||||||||||||||||||
|
Net sales: Retail
|
$
|
2,394.9
|
|
$
|
2,134.6
|
|
$
|
260.3
|
|
12.2
|
%
|
17.2
|
%
|
50.8
|
%
|
48.8
|
%
|
||||||
|
Wholesale
|
2,143.9
|
|
2,065.1
|
|
78.8
|
|
3.8
|
%
|
6.8
|
%
|
45.5
|
%
|
47.3
|
%
|
|||||||||
|
Licensing
|
173.3
|
|
171.8
|
|
1.5
|
|
0.9
|
%
|
0.9
|
%
|
3.7
|
%
|
3.9
|
%
|
|||||||||
|
Total revenue
|
$
|
4,712.1
|
|
$
|
4,371.5
|
|
$
|
340.6
|
|
7.8
|
%
|
11.7
|
%
|
||||||||||
Retail
Net sales from our retail stores increased $260.3 million, or 12.2%, to $2.395 billion for Fiscal 2016, compared to $2.135 billion for Fiscal 2015, which included unfavorable foreign currency effects of $107.2 million. On a constant currency basis, net sales from our retail stores increased $367.5 million, or 17.2%. We operated 668 retail stores, including concessions, as of April 2, 2016, compared to 526 retail stores, including concessions, as of March 28, 2015.
Our comparable store sales declined $77.1 million, or 4.2%, during Fiscal 2016, which included unfavorable foreign currency effects of $61.3 million. Our comparable store sales benefited 194 basis points from the inclusion of the U.S. e-commerce sales in comparable store sales beginning with the third quarter of Fiscal 2016. On a constant currency basis, our comparable store sales declined $15.8 million, or 0.9%, primarily driven by lower comparable store sales from our retail business in the Americas, partially offset by increased comparable store sales from our international businesses. The decline in our comparable store sales primarily reflected lower sales of watches, apparel and jewelry, partially offset by increased sales of accessories during Fiscal 2016 compared to Fiscal 2015.
Our non-comparable store sales increased $337.4 million during Fiscal 2016, which included unfavorable foreign currency effects of $45.9 million. On a constant currency basis, our non-comparable store sales increased $383.3 million. Approximately 86% of this sales growth was attributable to operating 142 additional stores since March 28, 2015 (including 14 stores included as a result of obtaining controlling interest in MK Panama and 36 stores acquired in connection with the MK Korea acquisition) and approximately 14% was attributable to non-comparable sales from our e-commerce sites in the Americas, which included our U.S. e-commerce store sales through the second quarter of Fiscal 2016. Fiscal 2016 included approximately $33.7 million of incremental net retail sales attributable to the inclusion of the 53rd week.
Wholesale
Net sales to our wholesale customers increased $78.8 million, or 3.8%, to $2.144 billion for Fiscal 2016, compared to $2.065 billion for Fiscal 2015, which included unfavorable foreign currency effects of $61.5 million. On a constant currency basis, our wholesale net sales increased $140.3 million, or 6.8%. The increase in our wholesale net sales was primarily attributable to increased sales from our accessories and footwear product lines during Fiscal 2016 as compared to Fiscal 2015.
Licensing
Royalties earned on our licensing agreements increased $1.5 million, or 0.9%, to $173.3 million for Fiscal 2016, compared to $171.8 million for Fiscal 2015. The increase was primarily attributable to higher revenues earned on licensing agreements related to the sales of jewelry, eyewear and outerwear, as well as higher revenues from our geographic licensing arrangements in Asia, partially offset by lower licensing revenues related to the sale of watches.
Gross Profit
Gross profit increased $149.5 million, or 5.6%, to $2.797 billion during Fiscal 2016, compared to $2.648 billion for Fiscal 2015, which included unfavorable foreign currency effects of $113.5 million. Gross profit as a percentage of total revenue declined 120 basis points to 59.4% during Fiscal 2016, compared to 60.6% during Fiscal 2015. The decline in gross profit margin was attributable to gross profit margin declines of 230 basis points from our retail segment and 80 basis points from our wholesale segment. The decrease in gross profit margin from our retail segment was primarily due to an increase in promotional activity during Fiscal 2016, as compared to Fiscal 2015. The decrease in gross profit margin from our wholesale segment was primarily due to an increase in wholesale allowances during Fiscal 2016, as compared to Fiscal 2015. These declines were partially offset by a favorable geographic mix in Fiscal 2016, which was driven by a higher proportion of sales outside the U.S. than in prior year.
41
Total Operating Expenses
Total operating expenses increased $231.4 million, or 16.6%, to $1.622 billion during Fiscal 2016, compared to $1.391 billion for Fiscal 2015. Our operating expenses included a net favorable foreign currency impact of approximately $71.5 million. Total operating expenses as a percentage of total revenue increased to 34.4% in Fiscal 2016, compared to 31.8% in Fiscal 2015. The components that comprise total operating expenses are detailed below.
Selling, General and Administrative Expenses
Selling, general and administrative expenses increased $176.5 million, or 14.1%, to $1.428 billion during Fiscal 2016, compared to $1.252 billion for Fiscal 2015. The increase in selling, general and administrative expenses was primarily due to the following:
|
•
|
a $126.4 million increase in retail store-related costs, including $52.0 million in occupancy costs, $37.0 million in compensation-related costs, $12.2 million in store advertising and promotional spending and $6.4 million in freight-related costs. This increase was primarily attributable to our growth to 668 retail stores from 526 in the prior year and operating our e-commerce sites in the United States for the full year in Fiscal 2016;
|
|
•
|
a $14.3 million increase in corporate employee-related costs, primarily due to an increase in our corporate staff to support our global growth;
|
|
•
|
a $7.2 million increase in write-offs related to fixed assets;
|
|
•
|
a $7.1 million increase in selling costs;
|
|
•
|
a $6.1 million increase in distribution costs; and
|
|
•
|
a $5.7 million increase in corporate occupancy-related costs.
|
Selling, general and administrative expenses as a percentage of total revenue increased to 30.3% during Fiscal 2016, compared to 28.6% for Fiscal 2015. The increase as a percentage of total revenue was primarily due to the increase in our retail store costs during Fiscal 2016, as compared to Fiscal 2015.
Depreciation and Amortization
Depreciation and amortization increased $44.8 million, or 32.4%, to $183.2 million during Fiscal 2016, compared to $138.4 million for Fiscal 2015, primarily due to an increase in the build-out of our new retail stores, new shop-in-shop locations, increase in lease rights related to our new European stores, and investments made in our information systems infrastructure to accommodate our growth. Depreciation and amortization increased to 3.9% as a percentage of total revenue during Fiscal 2016, compared to 3.2% for Fiscal 2015.
Impairment of Long-Lived Assets
During Fiscal 2016, we recognized fixed asset impairment charges of approximately $10.9 million, $8.6 million of which primarily related to seven retail locations that are still in operation, $0.4 million related to our wholesale operations and $1.9 million related to a corporate fixed asset that is no longer in service. During Fiscal 2015, fixed asset impairment charges of $0.8 million related to two of our retail locations that were still in operation.
Income from Operations
As a result of the foregoing, income from operations decreased $81.9 million, or 6.5%, to $1.175 billion during Fiscal 2016, compared to $1.257 billion for Fiscal 2015, which included unfavorable foreign currency effects of $42.0 million. Income from operations as a percentage of total revenue declined to 24.9% in Fiscal 2016, compared to 28.8% in Fiscal 2015.
42
The following table details income from operations for our three business segments (dollars in millions):
|
|
Fiscal Years Ended
|
$ Change
|
% Change
|
% of Net
Sales/
Revenue for
Fiscal 2016
|
% of Net
Sales/ Revenue for Fiscal 2015 |
|||||||||||||||
|
|
April 2,
2016 |
March 28,
2015 |
||||||||||||||||||
|
Income from operations:
|
||||||||||||||||||||
|
Retail
|
$
|
501.4
|
|
$
|
557.2
|
|
$
|
(55.8
|
)
|
(10.0
|
)%
|
20.9
|
%
|
26.1
|
%
|
|||||
|
Wholesale
|
584.1
|
|
610.9
|
|
(26.8
|
)
|
(4.4
|
)%
|
27.2
|
%
|
29.6
|
%
|
||||||||
|
Licensing
|
89.6
|
|
88.9
|
|
0.7
|
|
0.8
|
%
|
51.7
|
%
|
51.8
|
%
|
||||||||
|
Income from operations
|
$
|
1,175.1
|
|
$
|
1,257.0
|
|
$
|
(81.9
|
)
|
(6.5
|
)%
|
24.9
|
%
|
28.8
|
%
|
|||||
Retail
Income from operations for our retail segment declined $55.8 million, or 10.0%, to $501.4 million during Fiscal 2016, compared to $557.2 million for Fiscal 2015. Income from operations as a percentage of net retail sales for the retail segment declined by approximately 520 basis points to 20.9% during Fiscal 2016. The decrease in retail income from operations as a percentage of net retail sales was primarily due to an increase in operating expenses as a percentage of net retail sales of approximately 290 basis points, as well as due to the decrease in gross profit margin, as previously discussed above, during Fiscal 2016, as compared to Fiscal 2015. The increase in operating expenses as a percentage of net retail sales was largely due to increased retail store-related costs and higher depreciation expense primarily attributable to new store openings, as well as fixed asset impairment charges recorded for certain of our retail stores.
Wholesale
Income from operations for our wholesale segment declined $26.8 million, or 4.4%, to $584.1 million during Fiscal 2016, compared to $610.9 million for Fiscal 2015. Income from operations as a percentage of net wholesale sales decreased approximately 240 basis points to 27.2%. This decrease in wholesale income from operations as a percentage of wholesale net sales was due to a net increase in operating expenses as a percentage of net wholesale sales of approximately 160 basis points during Fiscal 2016 as compared to Fiscal 2015, which was largely attributable to higher depreciation expenses, distribution costs, write-offs related to fixed assets and corporate allocated expenses. The increase in wholesale income from operations as a percentage of net sales was also attributable to a lower gross profit margin, as previously discussed.
Licensing
Income from operations for our licensing segment increased $0.7 million, or 0.8%, to $89.6 million during Fiscal 2016, compared to $88.9 million for Fiscal 2015. Income from operations as a percentage of licensing revenue declined approximately 10 basis points to 51.7%. The decline in licensing income from operations as a percentage of licensing revenue was due to an increase in operating expenses as a percentage of licensing revenues during Fiscal 2016, as compared to Fiscal 2015. This increase was largely due to increased costs related to protection of our intellectual property and higher depreciation expenses, partially offset by lower advertising costs as a percentage of licensing revenue.
Other Income, net
Other income of $3.7 million during Fiscal 2016 was primarily comprised of a $3.7 million gain on acquisition of MK Korea (see Note 3 to the accompanying consolidated financial statements) and $1.0 million in income related to our anti-counterfeiting efforts, partially offset by $1.0 million of losses related to our joint venture, which were recorded under the equity method of accounting prior to obtaining controlling interest in MK Panama during the second quarter of Fiscal 2016. During Fiscal 2015, other income of $1.6 million was primarily comprised of $1.5 million in income related to our anti-counterfeiting efforts.
Interest expense, net
Interest expense, net increased $1.5 million to $1.7 million for Fiscal 2016, as compared to $0.2 million for Fiscal 2015, primarily due to lower interest income earned on our short-term investments (cash equivalents), as well as higher interest expense on borrowings during Fiscal 2016.
43
Foreign Currency Loss
We recognized a foreign currency losses of $4.8 million and $2.6 million, respectively, during Fiscal 2016 and Fiscal 2015. These foreign currency losses included mark-to-market adjustments related to our forward foreign currency contracts not designated as accounting hedges, as well as gains and losses on the revaluation and settlement of certain of our accounts payable in currencies other than the functional currency of the applicable reporting units, and the remeasurement of intercompany loans with certain of our subsidiaries.
Provision for Income Taxes
We recognized $334.6 million of income tax expense during Fiscal 2016, compared with $374.8 million for Fiscal 2015. Our effective tax rate for Fiscal 2016 was 28.5%, compared to 29.8% for Fiscal 2015. The decrease in our effective tax rate was primarily due to the increase in taxable income in certain of our non-U.S. subsidiaries (predominantly European operations) during Fiscal 2016, which are subject to lower statutory income tax rates, as well as state tax benefits recognized during Fiscal 2016. Given that certain of our non-U.S. operations have become consistently profitable, we expect this decrease on our combined consolidated effective rate to continue. The Fiscal 2015 effective tax rate was also favorably impacted by the settlement of certain financial instruments in connection with our international income tax structuring.
Our effective tax rate may fluctuate from time to time due to the effects of changes in U.S. federal, state and local taxes and tax rates in foreign jurisdictions. In addition, factors such as the geographic mix of earnings, enacted tax legislation and the results of various global tax strategies, may also impact our effective tax rate in future periods.
Net Loss Attributable to Noncontrolling Interest
During Fiscal 2016, we recorded a net loss attributable to our noncontrolling interest in MK Panama of $1.4 million. This loss represents the share of MK Panama's loss that is not attributable to the Company.
Net Income Attributable to MKHL
As a result of the foregoing, our net income declined $41.9 million, or 4.8%, to $839.1 million during Fiscal 2016, compared to $881.0 million for Fiscal 2015, which included unfavorable foreign currency effects of $38.1 million.
Liquidity and Capital Resources
Liquidity
Our primary sources of liquidity are the cash flows generated from our operations, along with borrowings available under our credit facility (see below discussion regarding “Credit Facilities”) and available cash and cash equivalents. Our primary use of this liquidity is to fund our ongoing cash requirements, including working capital requirements, share repurchases, global retail store construction, expansion and renovation, expansion of our distribution and corporate facilities, construction and renovation of shop-in-shops, investment in information systems infrastructure and other corporate activities. We believe that the cash generated from our operations, together with borrowings available under our revolving credit facility and available cash and cash equivalents, will be sufficient to meet our working capital needs for the next 12 months, including investments made and expenses incurred in connection with our store growth plans, shop-in-shop growth, investments in corporate and distribution facilities, continued systems development, e-commerce and marketing initiatives. We spent
$164.8 million
on capital expenditures during Fiscal 2017, and expect to spend approximately $200 million during Fiscal 2018. The majority of the Fiscal 2017 expenditures related to our retail operations (including e-commerce), with the remainder related to our corporate offices and enhancements to our distribution and information systems infrastructure, as well as in connection with new shop-in-shops.
44
The following table sets forth key indicators of our liquidity and capital resources (in millions):
|
|
As of
|
||||||
|
|
April 1,
2017 |
April 2,
2016 |
|||||
|
Balance Sheet Data:
|
|||||||
|
Cash and cash equivalents
|
$
|
227.7
|
|
$
|
702.0
|
|
|
|
Working capital
|
$
|
598.9
|
|
$
|
1,234.3
|
|
|
|
Total assets
|
$
|
2,409.6
|
|
$
|
2,566.8
|
|
|
|
Short-term debt
|
$
|
133.1
|
|
$
|
—
|
|
|
|
Long-term debt
|
$
|
—
|
|
$
|
2.3
|
|
|
Cash Flows
|
|
Fiscal Years Ended
|
||||||||||
|
|
April 1,
2017 |
April 2,
2016 |
March 28,
2015 |
||||||||
|
Cash Flows Provided By (Used In):
|
|||||||||||
|
Operating activities
|
$
|
1,028.0
|
|
$
|
1,228.4
|
|
$
|
857.9
|
|
||
|
Investing activities
|
(650.9
|
)
|
(381.1
|
)
|
(388.4
|
)
|
|||||
|
Financing activities
|
(843.6
|
)
|
(1,128.3
|
)
|
(434.7
|
)
|
|||||
|
Effect of exchange rate changes
|
(5.9
|
)
|
4.1
|
|
(27.1
|
)
|
|||||
|
Net (decrease) increase in cash and cash equivalents
|
$
|
(472.4
|
)
|
$
|
(276.9
|
)
|
$
|
7.7
|
|
||
Cash Provided by Operating Activities
Cash provided by operating activities decreased
$200.4 million
to
$1.028 billion
during
Fiscal 2017
, as compared to
$1.228 billion
for
Fiscal 2016
. The decrease in cash flows from operating activities was primarily due to a decrease in our net income after non-cash adjustments, as well as a decrease related to changes in our working capital, which was primarily attributable to an unfavorable change in accrued expenses and other current liabilities primarily due to the timing of tax and royalty payments, partially offset by favorable changes in inventory and accounts payable due to lower wholesale inventory purchases and shipments, as well as the timing of payments.
Cash provided by operating activities increased $370.5 million to $1.228 billion during Fiscal 2016, as compared to $857.9 million for Fiscal 2015. The increase in cash flows from operating activities was primarily due to favorable changes in working capital, as well as an increase in our net income after non-cash adjustments. The increase in working capital was largely attributable to: a favorable change in accounts receivable due to higher shipments at the end of Fiscal 2015, as well as improved cash collections; a favorable change in inventories also reflecting higher shipments at the end of Fiscal 2015, partially offset by increased inventory related to new retail stores and wholesale locations (including inventory to support our operations in Panama and South Korea); and increases in accounts payable and accrued expenses and other current liabilities primarily due to the timing of payments, in part due to the inclusion of the 53rd week in Fiscal 2016.
Cash Used in Investing Activities
Net cash used in investing activities increased
$269.8 million
to
$650.9 million
during
Fiscal 2017
, compared to
$381.1 million
during
Fiscal 2016
. The decrease in cash was primarily attributable to $480.6 million of cash paid, net of cash acquired, in connection with our acquisition of the previously licensed business in Greater China during Fiscal 2017, partially offset by lower capital expenditures of
$204.4 million
, attributable to lower corporate expenditures and lower spending to build out new stores and shop-in-shops, partially offset by capital spending related to our newly acquired operations in China and South Korea and increased investments in our e-commerce business.
Net cash used in investing activities was $381.1 million during Fiscal 2016, compared to $388.4 million during Fiscal 2015. The favorable change in cash from investing activities was primarily due to a $17.8 million decline in cash used in connection with lease rights (key money) for new stores, which was partially offset by a $13.0 million increase in capital expenditures, largely attributable to the build-out of our new retail stores and shop-in-shops, as well as investments in new information technology, distribution system enhancements, corporate offices and various other improvements in our infrastructure.
45
Cash Used in Financing Activities
Net cash used in financing activities decreased
$284.7 million
to
$843.6 million
during
Fiscal 2017
, from
$1.128 billion
during
Fiscal 2016
, which was primarily attributable to increased borrowings under our 2015 Credit Facility of $153.4 million, net of debt repayments and a decrease of
$147.6 million
in cash payments to repurchase our ordinary shares.
Net cash used in financing activities was $1.128 billion during Fiscal 2016, compared to $434.7 million during Fiscal 2015. This decline in cash from financing activities was primarily attributable to increased cash payments of $657.1 million in connection with the repurchase of our ordinary shares, as well a $26.8 million decrease in proceeds from our share option arrangements.
Credit Facilities
The following table presents a summary of the Company's borrowing capacity and amounts outstanding as of
April 1, 2017
and
April 2, 2016
(dollars in millions):
|
|
Fiscal Years Ended
|
||||||
|
|
April 1,
2017 |
April 2,
2016 |
|||||
|
Senior Unsecured Revolving Credit Facility ("2015 Credit Facility"):
(1)
|
|||||||
|
Total availability (excluding up to a $500 million accordion feature)
|
$
|
1,000.0
|
|
$
|
1,000.0
|
|
|
|
Borrowings outstanding
(2)
|
127.3
|
|
—
|
|
|||
|
Letters of credit outstanding
|
10.6
|
|
10.0
|
|
|||
|
Remaining availability
|
$
|
862.1
|
|
$
|
990.0
|
|
|
|
Debt Obligations of MK Panama
|
$
|
—
|
|
$
|
2.3
|
|
|
|
Hong Kong Uncommitted Credit Facility:
|
|||||||
|
Total availability (100.0 million Hong Kong Dollars)
|
$
|
12.9
|
|
||||
|
Borrowings outstanding (45.0 million Hong Kong Dollars)(2)
|
5.8
|
|
|||||
|
Bank guarantees outstanding (11.8 million Hong Kong Dollars)
|
1.5
|
|
|||||
|
Remaining availability
|
$
|
5.6
|
|
||||
|
Total borrowings outstanding
(1)
|
$
|
133.1
|
|
$
|
2.3
|
|
|
|
Total remaining availability
|
$
|
867.7
|
|
$
|
990.0
|
|
|
_____________________________
(1)
The 2015 Credit Facility contains customary events of default and requires us to maintain a leverage ratio at the end of each fiscal quarter of no greater than
3.5
to 1, calculated as the ratio of the sum of total indebtedness as of the date of the measurement plus
6.0
times the consolidated rent expense for the last four consecutive fiscal quarters, to Consolidated EBITDAR for the last four consecutive fiscal quarters. Consolidated EBITDAR is defined as consolidated net income plus income tax expense, net interest expense, depreciation and amortization expense, consolidated rent expense and other non-cash charges, subject to certain deductions. The 2015 Credit facility also includes other customary covenants that limit additional indebtedness, guarantees, liens, acquisitions and other investments and cash dividends. As of
April 1, 2017
and
April 2, 2016
, we were in compliance with all covenants related to this agreement.
(2)
Recorded as short-term debt in the Company's consolidated balance sheet as of
April 1, 2017
.
We believe that our 2015 Credit Facility is adequately diversified with no undue concentration in any one financial institution. As of April 1, 2017, there were 13 financial institutions participating in the facility, with none maintaining a maximum commitment percentage in excess of 15%. We have no reason to believe that the participating institutions will be unable to fulfill their obligations to provide financing in accordance with the terms of the 2015 Credit Facility.
Please refer to
Note 9
to the accompanying consolidated financial statements for detailed information relating to our credit facilities.
46
Share Repurchase Program
The following table presents our treasury share repurchases during the fiscal years ended
April 1, 2017
and
April 2, 2016
(dollars in millions):
|
|
Fiscal Years Ended
|
||||||
|
|
April 1,
2017 |
April 2,
2016 |
|||||
|
Cost of shares repurchased under share repurchase program
|
$
|
1,000.0
|
|
$
|
1,150.0
|
|
|
|
Cost of shares withheld to cover tax obligations for vested restricted share awards
|
4.8
|
|
2.4
|
|
|||
|
Total cost of treasury shares repurchased
|
$
|
1,004.8
|
|
$
|
1,152.4
|
|
|
|
Shares repurchased under share repurchase program
|
21,756,353
|
|
24,757,543
|
|
|||
|
Shares withheld to cover tax withholding obligations
|
100,552
|
|
54,875
|
|
|||
|
21,856,905
|
|
24,812,418
|
|
||||
As of
April 1, 2017
, we have fully utilized the previously authorized amount under the share repurchase program. On May 25, 2017, our Board of Directors authorized a new
$1.000 billion
share repurchase program.
Contractual Obligations and Commercial Commitments
As of
April 1, 2017
, our lease commitments and contractual obligations were as follows (in millions):
|
Fiscal Years Ending
|
Fiscal
2018
|
Fiscal
2019-2020
|
Fiscal
2021-2022
|
Fiscal
2023 and
Thereafter
|
Total
|
||||||||||||||
|
Operating leases
|
$
|
250.1
|
|
$
|
464.6
|
|
$
|
378.1
|
|
$
|
549.3
|
|
$
|
1,642.1
|
|
||||
|
Inventory Purchase Obligations
|
599.4
|
|
—
|
|
—
|
|
—
|
|
599.4
|
|
|||||||||
|
Other commitments
|
34.8
|
|
3.2
|
|
1.4
|
|
0.4
|
|
39.8
|
|
|||||||||
|
Short-term debt
|
133.1
|
|
—
|
|
—
|
|
—
|
|
133.1
|
|
|||||||||
|
Total
|
$
|
1,017.4
|
|
$
|
467.8
|
|
$
|
379.5
|
|
$
|
549.7
|
|
$
|
2,414.4
|
|
||||
Operating lease obligations
represent our equipment leases and the minimum lease rental payments under non-cancelable operating leases for our real estate locations globally. In addition to the above amounts, we are typically required to pay real estate taxes, contingent rent based on sales volume and other occupancy costs relating to our leased properties for our retail stores.
Inventory purchase obligations
represent our contractual agreements relating to future purchases of inventory.
Other commitments
include our non-cancelable contractual obligations related to marketing and advertising agreements, information technology agreements, and supply agreements.
Excluded from the above commitments is
$26.5 million
of long-term liabilities related to uncertain tax positions, due to the uncertainty of the time and nature of resolution.
The above table also excludes amounts included in current liabilities in our consolidated balance sheet as of
April 1, 2017
, as these items will be paid within one year, and non-current liabilities that have no cash outflows associated with them (e.g., deferred taxes).
Off-Balance Sheet Arrangements
We have not created, and are not party to, any special-purpose or off-balance sheet entities for the purpose of raising capital, incurring debt or operating our business. In addition to the commitments in the above table, our off-balance sheet commitments relating to our outstanding letters of credit were $11.1 million at
April 1, 2017
, including $0.5 million in letters of credit issued outside of the 2015 Credit Facility. In addition, as of
April 1, 2017
, bank guarantees of approximately
$1.5 million
were supported by our Hong Kong Credit Facility. We do not have any other off-balance sheet arrangements or relationships with entities that are not consolidated into our financial statements that have or are reasonably likely to have a material current or future effect on our financial condition, changes in financial condition, revenues, expenses, results of operations, liquidity, capital expenditures or capital resources.
47
Effects of Inflation
We do not believe that our sales or operating results have been materially impacted by inflation during the periods presented in our financial statements. However, we may experience an increase in cost pressure from our suppliers in the future, which could have an adverse impact on our gross profit results in the periods effected.
We are exposed to certain market risks during the normal course of our business, such as risk arising from fluctuations in foreign currency exchange rates, as well as fluctuations in interest rates. In attempts to manage these risks, we employ certain strategies to mitigate the effect of these fluctuations. We enter into foreign currency forward contracts to manage our foreign currency exposure to the fluctuations of certain foreign currencies. The use of these instruments primarily helps to manage our exposure to our foreign purchase commitments and better control our product costs. We do not use derivatives for trading or speculative purposes.
Foreign Currency Exchange Risk
We are exposed to risks on certain purchase commitments to foreign suppliers based on the value of our purchasing subsidiaries' local currency relative to the currency requirement of the supplier on the date of the commitment. As such, we enter into forward currency exchange contracts that generally mature in 12 months or less and are consistent with the related purchase commitments, to manage our exposure to the changes in the value of the Euro and the Canadian Dollar. These contracts are recorded at fair value in our consolidated balance sheets as either an asset or liability, and are derivative contracts to hedge cash flow risks. Certain of these contracts are designated as hedges for hedge accounting purposes, while certain of these contracts, currently a relatively small portion, are not designated as hedges for accounting purposes. Accordingly, the changes in the fair value of the majority of these contracts at the balance sheet date are recorded in our equity as a component of accumulated other comprehensive income, and upon maturity (settlement) are recorded in, or reclassified into, our cost of sales or operating expenses, in our consolidated statement of operations, as applicable to the transactions for which the forward currency exchange contracts were established. For those contracts which are designated as hedges for accounting purposes, any portion of those contracts deemed ineffective would be charged to earnings, in the period the ineffectiveness was determined.
We perform a sensitivity analysis on our forward currency contracts, both designated and not designated as hedges for accounting purposes, to determine the effects of fluctuations in foreign currency exchange rates. For this sensitivity analysis, we assume a hypothetical change in U.S. Dollar against foreign exchange rates. Based on all foreign currency exchange contracts outstanding as of
April 1, 2017
, a 10% appreciation or devaluation of the U.S. Dollar compared to the level of foreign currency exchange rates for currencies under contract as of
April 1, 2017
, would result in a net increase and decrease, respectively, of approximately $15.7 million in the fair value of these contracts.
Interest Rate Risk
We are exposed to interest rate risk in relation to borrowings outstanding under our 2015 Credit Facility and our Hong Kong Credit Facility. Our 2015 Credit Facility carries interest rates that are tied to LIBOR and the prime rate, among other institutional lending rates (depending on the particular origination of borrowing), as further described in
Note 9
to the accompanying consolidated financial statements. Our Hong Kong Credit Facility carries interest at a rate that is tied to the Hong Kong Interbank Offered Rate. Therefore, our statements of operations and comprehensive income and cash flows are exposed to changes in those interest rates. At
April 1, 2017
, we had short-term borrowings of
$127.3 million
outstanding under our 2015 Credit Facility and short-term borrowings of approximately
$5.8 million
outstanding under our Hong Kong Credit Facility. At
April 2, 2016
, there were no balances outstanding on our 2015 Credit Facility. These balances are not indicative of future balances that may be outstanding under our revolving credit facilities that may be subject to fluctuations in interest rates. Any increases in the applicable interest rate(s) would cause an increase to the interest expense relative to any outstanding balance at that date.
The response to this item is provided in this Annual Report on Form 10-K under Item 15. “Exhibits and Financial Statement Schedule” and is incorporated herein by reference.
48
Not applicable.
Disclosure Controls and Procedures
We carried out an evaluation, under the supervision and with the participation of our management, including our Chief Executive Officer and Chief Financial Officer, our principal executive officer and principal financial officer, respectively, of the design and operation of our disclosure controls and procedures (as such term is defined in Rules 13a - 15(e) and 15(d) - 15(e) under the Securities and Exchange Act of 1934 (the “Exchange Act”)) as of
April 1, 2017
. Based on the evaluation, the Chief Executive Officer and Chief Financial Officer concluded that disclosure controls and procedures as of
April 1, 2017
are effective.
Management’s Report on Internal Control over Financial Reporting
Our management is responsible for establishing and maintaining adequate internal control over financial reporting (as defined under the Exchange Act Rule 13a-15 (f)) to provide reasonable assurance regarding the reliability of financial reporting and that the consolidated financial statements have been prepared in accordance with accounting principles generally accepted in the United States ("U.S. GAAP"). Such internal control over financial reporting includes those policies and procedures that (i) pertain to the maintenance of records that in reasonable detail accurately and fairly reflect the transactions and dispositions of the assets; (ii) provide reasonable assurance (A) that transactions are recorded as necessary to permit preparation of financial statements in accordance with U.S. GAAP and that receipts and expenditures of the Company are being made only in accordance with authorizations of management and directors; and (B) regarding prevention or timely detection of unauthorized acquisition, use or disposition of our assets that could have a material effect on the financial statements.
Our management assessed the effectiveness of our internal control over financial reporting as of
April 1, 2017
. In making this assessment, it used the criteria set forth in
Internal Control—Integrated Framework
issued by the Committee of Sponsoring Organizations of the Treadway Commission (COSO), the 2013 Framework. Based on this assessment, management has determined that, as of
April 1, 2017
, our internal control over financial reporting is effective based on those criteria.
During the first quarter of Fiscal 2017, we acquired 100% of the stock of Michael Kors (HK) Limited and its subsidiaries ("MKHKL"), our former licensees in the Greater China region, which includes China, Hong Kong, Macau and Taiwan (please refer to Note 3 to the accompanying financial statements for additional information). MKHKL's assets (excluding intangible assets recorded in connection with the acquisition) comprised approximately 6.2% of the Company’s total assets and approximately 4.7% of the Company’s total revenue. At April 1, 2017, we were in the process of evaluating the internal controls of the acquired business and integrating it into our existing operations. The acquired business has, therefore, been excluded from management’s assessment of internal control over financial reporting for Fiscal 2017.
The Company’s internal control over financial reporting as of
April 1, 2017
, as well as the consolidated financial statements, have been audited by Ernst & Young LLP, an independent registered public accounting firm, as stated in their report which appears herein. The audit report appears on page 55 of this report.
Changes in Internal Control over Financial Reporting
There have been no changes in our internal control over financial reporting during the three months ended
April 1, 2017
, that have materially affected, or are reasonably likely to materially affect, our internal control over financial reporting.
On May 25, 2017, the Board of Directors of the Company approved a retail fleet optimization plan (the “Retail Optimization Plan”) to improve profitability of its retail stores. As part of the Retail Optimization Plan, the Company intends to close between 100 and 125 of its full-price retail stores over two years (Fiscal 2018 and Fiscal 2019). During the fourth quarter of Fiscal 2017, the Company recorded $193.8 million in impairment charges, primarily relating to its underperfoming full-price retail stores. In addition, in connection with the Retail Optimization Plan, the Company expects to incur approximately $100 - $125 million of one-time costs, including lease termination and other store closure costs, the majority of which are expected to result in future cash expenditures. See "MD&A - Overview" for further discussion.
49
The exact amounts and timing of the Retail Optimization Plan charges and future cash expenditures associated therewith are undeterminable at this time. The Company will either disclose in a Current Report on Form 8-K, or disclose in another periodic filing with the U.S. Securities and Exchange Commission, the amount of any material charges relating to the Retail Optimization Plan by major type of cost once such amounts or range of amounts are determinable.
This disclosure is intended to satisfy the requirements of Item 2.05 of Form 8-K.
Item 10.
Directors, Executive Officers and Corporate Governance
Information with respect to this Item is included in the Company’s Proxy Statement to be filed in June
2017
, which is incorporated herein by reference.
Item 11.
Executive Compensation
Information with respect to this Item is included in the Company’s Proxy Statement to be filed in June
2017
, which is incorporated herein by reference.
Item 12.
Security Ownership of Certain Beneficial Owners and Management and Related Stockholder Matters
The following table sets forth information as of
April 1, 2017
regarding compensation plans under which the Company’s equity securities are authorized for issuance:
|
Equity Compensation Plan Information
|
|||||||||
|
|
(a)
|
(b)
|
|
(c)
|
|||||
|
Plan category
|
Number of securities to be issued upon exercise of outstanding options, warrants and rights
|
Weighted-average exercise price of outstanding options, warrants and rights
|
|
Number of securities remaining available for future issuance under equity compensation plans (excluding securities reflected in column (a))
|
|||||
|
Equity compensation plans approved by security holders
(1)
|
4,809,501
|
|
$
|
49.40
|
|
(2)
|
8,770,441
|
|
|
|
Equity compensation plans not approved by security holders
(3)
|
2,039,513
|
|
$
|
4.64
|
|
(2)
|
—
|
|
|
|
Total
|
6,849,014
|
|
$
|
36.07
|
|
(2)
|
8,770,441
|
|
|
|
(1)
|
Reflects share options, restricted shares and restricted share units issued under the Michael Kors Holdings Limited Amended and Restated Omnibus Incentive Plan.
|
|
(2)
|
Represents the weighted average exercise price of outstanding share awards only.
|
|
(3)
|
Reflects share options issued under the Amended and Restated Michael Kors (USA), Inc. Stock Option Plan (the “Option Plan”). Prior to our initial public offering, we granted share options to purchase ordinary shares to our executive officers and other eligible employees pursuant to the terms of the Option Plan. All of the share options granted under the Option Plan are ten-year share options and vest in full at the end of the ten-year term if our shareholder net equity has increased by at least 20% per annum during such ten-year period. However, a portion of each share option is eligible to vest on an accelerated basis over the course of five years with 20% vesting each year if the pre-established annual performance goal for the year has been met, in each case, subject to the grantee’s continued employment through the vesting date. The annual performance goals are tied to annual divisional pre-tax profit as determined by the Board. As of
April 1, 2017
, there were no shares available for future issuance under the Option Plan.
|
Item 13.
Certain Relationships, Related Transactions and Director Independence
Information with respect to this Item is included in the Company’s Proxy Statement to be filed in June
2017
, which is incorporated herein by reference.
Item 14.
Principal Accountant Fees and Services
Information with respect to this Item is included in the Company’s Proxy Statement to be filed in June
2017
, which is incorporated herein by reference.
50
Item 15.
Exhibits and Financial Statement Schedules
|
(a)
|
The following documents are filed as part of this annual report on Form 10-K:
|
|
1.
|
The following consolidated financial statements listed below are filed as a separate section of this Annual Report on Form 10-K:
|
Report of Independent Registered Public Accounting Firm - Ernst & Young LLP.
Consolidated Balance Sheets as of
April 1, 2017
and
April 2, 2016
.
Consolidated Statements of Operations and Comprehensive Income for the fiscal years ended
April 1, 2017
,
April 2, 2016
and
March 28, 2015
.
Consolidated Statements of Shareholders’ Equity for the fiscal years ended
April 1, 2017
,
April 2, 2016
and
March 28, 2015
.
Consolidated Statements of Cash Flows for the fiscal years ended
April 1, 2017
,
April 2, 2016
and
March 28, 2015
.
Notes to Consolidated Financial Statements for the fiscal years ended
April 1, 2017
,
April 2, 2016
and
March 28, 2015
.
|
2.
|
Exhibits:
|
EXHIBIT INDEX
|
Exhibit
No. |
Document Description
|
|
2.1
|
Share Purchase Agreement dated as of May 31, 2016, by and among Michael Kors (Europe) B.V., Michael Kors (HK) Limited, Michael Kors Far East Trading Limited and Sportswear Holdings Limited (included as Exhibit 2.1 to the Company's Current Report on Form 8-K (File No. 001-35368), filed on June 1, 2016 and incorporated herein by reference).
|
|
3.1
|
Amended and Restated Memorandum and Articles of Association of Michael Kors Holdings Limited (included as Exhibit 99.3 to the Company’s Current Report on Form 6-K filed on February 14, 2012, and incorporated herein by reference).
|
|
4.1
|
Specimen of Ordinary Share Certificate of Michael Kors Holdings Limited (included as Exhibit 4.1 to the Company’s Registration Statement on Form F-1, as amended (File No. 333-178282), filed on December 2, 2011, and incorporated herein by reference).
|
|
4.2
|
Amended and Restated Credit Agreement, dated as of October 29, 2015, by and among Michael Kors (USA), Inc., as borrower and guarantor, Michael Kors Holdings Limited, as borrower and guarantor, the Foreign Subsidiary Borrowers from time to time party thereto, certain other subsidiaries of Michael Kors Holdings Limited from time to time party thereto as Guarantors, the Lenders party thereto, JPMorgan Chase Bank, N.A., as Administrative Agent and Co-Syndication Agent, Citibank, N.A., as Co-Syndication Agent, Bank of America, N.A., as Co-Documentation Agent, and U.S. Bank National Association, as Co-Documentation Agent. (included as Exhibit 10.1 to the Company’s Quarterly Report on Form 10-Q for the fiscal quarter ended December 26, 2015 filed on February 3, 2016, and incorporated herein by reference).
|
|
4.3
|
Shareholders Agreement, dated as of July 11, 2011, among Michael Kors Holdings Limited and certain shareholders of Michael Kors Holdings Limited (included as Exhibit 10.2 to the Company’s Registration Statement on Form F-1, as amended (File No. 333-178282), filed on December 2, 2011, and incorporated herein by reference).
|
|
10.1
|
Form of Indemnification Agreement between Michael Kors Holdings Limited and its directors and executive officers (included as Exhibit 10.5 to the Company’s Registration Statement on Form F-1, as amended (File No. 333-178282), filed on December 2, 2011, and incorporated herein by reference).
|
*Pursuant to Item 601(b)(2) of Regulation S-K, certain schedules and similar attachments have been omitted. The Company hereby agrees to furnish a copy of any omitted schedule or attachment to the Securities and Exchange Commission upon request.
51
|
Exhibit
No.
|
Document Description
|
|
10.4
|
Amended and Restated Michael Kors (USA), Inc. Stock Option Plan (included as Exhibit 10.4 to the Company’s Registration Statement on Form F-1, as amended (File No. 333-178282), filed on December 2, 2011, and incorporated herein by reference).
|
|
10.5
|
Amended No. 1 to the Amended and Restated Michael Kors (USA), Inc. Share Option Plan. (included as Exhibit 4.9 to the Company’s Annual Report on Form 20-F for the fiscal year ended March 31, 2012, filed on June 12, 2012, and incorporated herein by reference).
|
|
10.6
|
Michael Kors Holdings Limited Amended and Restated Omnibus Incentive Plan (included as Appendix A to the Company’s Definitive Proxy Statement on Schedule 14A (File No.
001-35368
), filed on June 16, 2015, and incorporated herein by reference).
|
|
10.7
|
Second Amended and Restated Employment Agreement, dated as of May 20, 2015, by and among Michael Kors (USA), Inc., Michael Kors Holdings Limited and Michael Kors (included as Exhibit 10.7 to the Company's Annual Report on Form 10-K for the fiscal year ended March 28, 2015, filed on May 27, 2015, and incorporated herein by reference).
|
|
10.8
|
Second Amended and Restated Employment Agreement, dated as of May 20, 2015, by and among Michael Kors (USA), Inc., Michael Kors Holdings Limited and John D. Idol (included as Exhibit 10.8 to the Company's Annual Report on Form 10-K for the fiscal year ended March 28, 2015, filed on May 27, 2015, and incorporated herein by reference).
|
|
10.9
|
Amended and Restated Employment Agreement, dated as of May 23, 2013, by and among Michael Kors (USA), Inc., Michael Kors Holdings Limited and Joseph B. Parsons (included as Exhibit 10.9 to the Company’s Annual Report on Form 10-K for the fiscal year ended March 30, 2013 filed on May 29, 2013, and incorporated herein by reference).
|
|
10.10
|
Michael Kors Holdings Limited Executive Bonus Program (included as Exhibit 10.1 to the Company’s Quarterly Report on Form 10-Q for the fiscal quarter ended June 29, 2013 filed on August 6, 2013, and incorporated herein by reference).
|
|
10.11
|
Employment Agreement, dated as of May 12, 2014, by and between Michael Kors (USA), Inc., and Cathy Marie Robison (included as Exhibit 10.14 to the Company’s Annual Report on Form 10-K for the fiscal year ended March 29, 2014 filed on May 28, 2014, and incorporated herein by reference).
|
|
10.12
|
Employment Agreement, dated as of July 14, 2014, by and between Pascale Meyran and Michael Kors (USA), Inc. (included as Exhibit 10.14 to the Company's Annual Report on Form 10-K for the fiscal year ended March 28, 2015, filed on May 27, 2015, and incorporated herein by reference).
|
|
10.13
|
Form of Employee Non-Qualified Option Award Agreement (included as Exhibit 10.15 to the Company's Annual Report on Form 10-K for the fiscal year ended March 28, 2015, filed on May 27, 2015, and incorporated herein by reference).
|
|
10.14
|
Form of Employee Restricted Share Unit Award Agreement (included as Exhibit 10.16 to the Company's Annual Report on Form 10-K for the fiscal year ended March 28, 2015, filed on May 27, 2015, and incorporated herein by reference).
|
|
10.15
|
Form of Performance-Based Restricted Share Unit Award Agreement (included as Exhibit 10.17 to the Company's Annual Report on Form 10-K for the fiscal year ended March 28, 2015, filed on May 27, 2015, and incorporated herein by reference).
|
|
10.16
|
Form of Independent Director Restricted Share Unit Award Agreement (included as Exhibit 10.18 to the Company's Annual Report on Form 10-K for the fiscal year ended March 28, 2015, filed on May 27, 2015, and incorporated herein by reference).
|
|
10.17
|
Aircraft Time Sharing Agreement, dated November 24, 2014, by and between Michael Kors (USA), Inc. and John Idol (included as Exhibit 10.19 to the Company's Annual Report on Form 10-K for the fiscal year ended March 28, 2015, filed on May 27, 2015, and incorporated herein by reference).
|
|
10.18
|
Aircraft Time Sharing Agreement, dated December 12, 2014, by and between Michael Kors (USA), Inc. and Michael Kors (included as Exhibit 10.20 to the Company's Annual Report on Form 10-K for the fiscal year ended March 28, 2015, filed on May 27, 2015, and incorporated herein by reference).
|
|
10.19
|
Employment Agreement, dated as of April 17, 2017, by and among Michael Kors (USA), Inc., Michael Kors Holdings Limited and Thomas J. Edwards, Jr.
|
|
21.1
|
List of subsidiaries of Michael Kors Holdings Limited.
|
|
23.2
|
Consent of Ernst & Young LLP.
|
|
31.1
|
Certification of Chief Executive Officer pursuant to Section 302 of Sarbanes Oxley Act of 2002.
|
|
31.2
|
Certification of Chief Financial Officer pursuant to Section 302 of Sarbanes Oxley Act of 2002.
|
|
32.1
|
Certification of Chief Executive Officer pursuant to 18 U.S.C. Section 1350, as adopted pursuant to Section 906 of the Sarbanes-Oxley Act of 2002.
|
|
32.2
|
Certification of Chief Financial Officer pursuant to 18 U.S.C. Section 1350, as adopted pursuant to Section 906 of the Sarbanes-Oxley Act of 2002.
|
|
101.1
|
Interactive Data Files.
|
52
SIGNATURES
Pursuant to the requirements of Section 13 or 15(d) of the Securities Exchange Act of 1934, the registrant hereby certifies that it meets all of the requirements for filing on Form 10-k and that it has duly caused and authorized the undersigned to sign this report on its behalf.
Date:
May 31, 2017
|
MICHAEL KORS HOLDINGS LIMITED
|
||
|
By:
|
/s/ John D. Idol
|
|
|
Name:
|
John D. Idol
|
|
|
Title:
|
Chairman & Chief Executive Officer
|
|
Pursuant to the requirements of the Securities Exchange Act of 1934, this report has been signed below by the following persons on behalf of the registrant and in the capacities and on the dates indicated.
|
By:
|
/s/ Michael Kors
|
Honorary Chairman, Chief Creative Officer and Director
|
May 31, 2017
|
|
Michael Kors
|
|||
|
By:
|
/s/ John D. Idol
|
Chairman, Chief Executive Officer and Director (Principal Executive Officer)
|
May 31, 2017
|
|
John D. Idol
|
|||
|
By:
|
/s/ Joseph B. Parsons
|
Chief Financial Officer, Chief Operating Officer and Treasurer (Principal Financial and Accounting Officer)
|
May 31, 2017
|
|
Joseph B. Parsons
|
|||
|
By:
|
/s/ M. William Benedetto
|
Director
|
May 31, 2017
|
|
M. William Benedetto
|
|||
|
By:
|
/s/ Robin Freestone
|
Director
|
May 31, 2017
|
|
Robin Freestone
|
|||
|
By:
|
/s/ Judy Gibbons
|
Director
|
May 31, 2017
|
|
Judy Gibbons
|
|||
|
By:
|
/s/ Ann McLaughlin Korologos
|
Director
|
May 31, 2017
|
|
Ann McLaughlin Korologos
|
|||
|
By:
|
/s/ Stephen F. Reitman
|
Director
|
May 31, 2017
|
|
Stephen F. Reitman
|
|||
|
By:
|
/s/ Jane Thompson
|
Director
|
May 31, 2017
|
|
Jane Thompson
|
|||
|
By:
|
/s/ Jean Tomlin
|
Director
|
May 31, 2017
|
|
Jean Tomlin
|
|||
53
REPORT OF INDEPENDENT REGISTERED PUBLIC ACCOUNTING FIRM
To the Board of Directors and Shareholders of Michael Kors Holdings Limited
We have audited the accompanying consolidated balance sheets of Michael Kors Holdings Limited and subsidiaries (“the Company”) as of
April 1, 2017
and
April 2, 2016
, and the related consolidated statements of operations and comprehensive income, shareholders' equity and cash flows for each of the three years in the period ended
April 1, 2017
. These financial statements are the responsibility of the Company's management. Our responsibility is to express an opinion on these financial statements based on our audits.
We conducted our audits in accordance with the standards of the Public Company Accounting Oversight Board (United States). Those standards require that we plan and perform the audit to obtain reasonable assurance about whether the financial statements are free of material misstatement. An audit includes examining, on a test basis, evidence supporting the amounts and disclosures in the financial statements. An audit also includes assessing the accounting principles used and significant estimates made by management, as well as evaluating the overall financial statement presentation. We believe that our audits provide a reasonable basis for our opinion.
In our opinion, the financial statements referred to above present fairly, in all material respects, the consolidated financial position of Michael Kors Holdings Limited and subsidiaries at
April 1, 2017
and
April 2, 2016
, and the consolidated results of their operations and their cash flows for each of the three years in the period ended
April 1, 2017
, in conformity with U.S. generally accepted accounting principles.
We also have audited, in accordance with the standards of the Public Company Accounting Oversight Board (United States), Michael Kors Holdings Limited’s internal control over financial reporting as of
April 1, 2017
, based on criteria established in Internal Control-Integrated Framework issued by the Committee of Sponsoring Organizations of the Treadway Commission (2013 framework) and our report dated
May 31, 2017
expressed an unqualified opinion thereon.
/s/ ERNST & YOUNG LLP
New York, New York
May 31, 2017
54
REPORT OF INDEPENDENT REGISTERED PUBLIC ACCOUNTING FIRM
To the Board of Directors and Shareholders of Michael Kors Holdings Limited
We have audited Michael Kors Holdings Limited and subsidiaries’ (“the Company”) internal control over financial reporting as of
April 1, 2017
, based on criteria established in Internal Control-Integrated Framework issued by the Committee of Sponsoring Organizations of the Treadway Commission (2013 framework) (the COSO criteria). Michael Kors Holdings Limited and subsidiaries’ management is responsible for maintaining effective internal control over financial reporting, and for its assessment of the effectiveness of internal control over financial reporting included in the accompanying Management’s Report on Internal Control over Financial Reporting. Our responsibility is to express an opinion on the Company’s internal control over financial reporting based on our audit.
We conducted our audit in accordance with the standards of the Public Company Accounting Oversight Board (United States). Those standards require that we plan and perform the audit to obtain reasonable assurance about whether effective internal control over financial reporting was maintained in all material respects. Our audit included obtaining an understanding of internal control over financial reporting, assessing the risk that a material weakness exists, testing and evaluating the design and operating effectiveness of internal control based on the assessed risk, and performing such other procedures as we considered necessary in the circumstances. We believe that our audit provides a reasonable basis for our opinion.
A company’s internal control over financial reporting is a process designed to provide reasonable assurance regarding the reliability of financial reporting and the preparation of financial statements for external purposes in accordance with generally accepted accounting principles. A company’s internal control over financial reporting includes those policies and procedures that (1) pertain to the maintenance of records that, in reasonable detail, accurately and fairly reflect the transactions and dispositions of the assets of the company; (2) provide reasonable assurance that transactions are recorded as necessary to permit preparation of financial statements in accordance with generally accepted accounting principles, and that receipts and expenditures of the company are being made only in accordance with authorizations of management and directors of the company; and (3) provide reasonable assurance regarding prevention or timely detection of unauthorized acquisition, use, or disposition of the company’s assets that could have a material effect on the financial statements.
Because of its inherent limitations, internal control over financial reporting may not prevent or detect misstatements. Also, projections of any evaluation of effectiveness to future periods are subject to the risk that controls may become inadequate because of changes in conditions, or that the degree of compliance with the policies or procedures may deteriorate.
As indicated in the accompanying Management’s Report on Internal Control over Financial Reporting, management’s assessment of and conclusion on the effectiveness of internal control over financial reporting did not include the internal controls of Michael Kors (HK) Limited and its subsidiaries, which is included in the fiscal year 2017 consolidated financial statements of Michael Kors Holdings Limited and subsidiaries and constituted 6.2% of total assets, as of April 1, 2017 and 4.7% of net sales for the year then ended. Our audit of internal control over financial reporting of Michael Kors Holdings Limited and subsidiaries also did not include an evaluation of the internal control over financial reporting of Michael Kors (HK) Limited and subsidiaries.
In our opinion, Michael Kors Holdings Limited and subsidiaries maintained, in all material respects, effective internal control over financial reporting as of
April 1, 2017
, based on the COSO criteria.
We also have audited, in accordance with the standards of the Public Company Accounting Oversight Board (United States), the consolidated balance sheets as of
April 1, 2017
and
April 2, 2016
, and the related consolidated statements of operations and comprehensive income, shareholders’ equity and cash flows for each of the three years in the period ended
April 1, 2017
of Michael Kors Holdings Limited and subsidiaries and our report dated
May 31, 2017
expressed an unqualified opinion thereon.
/s/ ERNST & YOUNG LLP
New York, New York
May 31, 2017
55
MICHAEL KORS HOLDINGS LIMITED AND SUBSIDIARIES
(In millions, except share data)
|
April 1,
2017 |
April 2,
2016 |
||||||
|
Assets
|
|||||||
|
Current assets
|
|||||||
|
Cash and cash equivalents
|
$
|
227.7
|
|
$
|
702.0
|
|
|
|
Receivables, net
|
265.8
|
|
307.9
|
|
|||
|
Inventories
|
549.3
|
|
546.8
|
|
|||
|
Prepaid expenses and other current assets
|
121.9
|
|
113.1
|
|
|||
|
Total current assets
|
1,164.7
|
|
1,669.8
|
|
|||
|
Property and equipment, net
|
591.5
|
|
758.2
|
|
|||
|
Intangible assets, net
|
418.1
|
|
67.4
|
|
|||
|
Goodwill
|
119.7
|
|
23.2
|
|
|||
|
Deferred tax assets
|
73.3
|
|
24.5
|
|
|||
|
Other assets
|
42.3
|
|
23.7
|
|
|||
|
Total assets
|
$
|
2,409.6
|
|
$
|
2,566.8
|
|
|
|
Liabilities and Shareholders’ Equity
|
|||||||
|
Current liabilities
|
|||||||
|
Accounts payable
|
$
|
176.3
|
|
$
|
131.4
|
|
|
|
Accrued payroll and payroll related expenses
|
61.1
|
|
59.7
|
|
|||
|
Accrued income taxes
|
60.3
|
|
51.6
|
|
|||
|
Short-term debt
|
133.1
|
|
—
|
|
|||
|
Accrued expenses and other current liabilities
|
135.0
|
|
192.8
|
|
|||
|
Total current liabilities
|
565.8
|
|
435.5
|
|
|||
|
Deferred rent
|
137.8
|
|
106.4
|
|
|||
|
Deferred tax liabilities
|
80.0
|
|
3.5
|
|
|||
|
Long-term debt
|
—
|
|
2.3
|
|
|||
|
Other long-term liabilities
|
31.0
|
|
19.6
|
|
|||
|
Total liabilities
|
814.6
|
|
567.3
|
|
|||
|
Commitments and contingencies
|
|
|
|||||
|
Shareholders’ equity
|
|||||||
|
Ordinary shares, no par value; 650,000,000 shares authorized; 209,332,493 shares issued and 155,833,304 outstanding at April 1, 2017; 208,084,175 shares issued and 176,441,891 outstanding at April 2, 2016
|
—
|
|
—
|
|
|||
|
Treasury shares, at cost (53,499,189 shares at April 1, 2017 and 31,642,284 shares at April 2, 2016)
|
(2,654.9
|
)
|
(1,650.1
|
)
|
|||
|
Additional paid-in capital
|
767.8
|
|
718.9
|
|
|||
|
Accumulated other comprehensive loss
|
(80.6
|
)
|
(80.9
|
)
|
|||
|
Retained earnings
|
3,560.3
|
|
3,007.8
|
|
|||
|
Total shareholders' equity of MKHL
|
1,592.6
|
|
1,995.7
|
|
|||
|
Noncontrolling interest
|
2.4
|
|
3.8
|
|
|||
|
Total equity
|
1,595.0
|
|
1,999.5
|
|
|||
|
Total liabilities and shareholders’ equity
|
$
|
2,409.6
|
|
$
|
2,566.8
|
|
|
See accompanying notes to consolidated financial statements.
56
MICHAEL KORS HOLDINGS LIMITED AND SUBSIDIARIES
(In millions, except share and per share data)
|
|
Fiscal Years Ended
|
||||||||||
|
|
April 1,
2017 |
April 2,
2016 |
March 28,
2015 |
||||||||
|
Net sales
|
$
|
4,347.9
|
|
|
$
|
4,538.8
|
|
$
|
4,199.7
|
|
|
|
Licensing revenue
|
145.8
|
|
|
173.3
|
|
171.8
|
|
||||
|
Total revenue
|
4,493.7
|
|
|
4,712.1
|
|
4,371.5
|
|
||||
|
Cost of goods sold
|
1,832.3
|
|
|
1,914.9
|
|
1,723.8
|
|
||||
|
Gross profit
|
2,661.4
|
|
|
2,797.2
|
|
2,647.7
|
|
||||
|
Selling, general and administrative expenses
|
1,552.5
|
|
|
1,428.0
|
|
1,251.5
|
|
||||
|
Depreciation and amortization
|
219.8
|
|
|
183.2
|
|
138.4
|
|
||||
|
Impairment of long-lived assets
|
199.2
|
|
|
10.9
|
|
0.8
|
|
||||
|
Total operating expenses
|
1,971.5
|
|
|
1,622.1
|
|
1,390.7
|
|
||||
|
Income from operations
|
689.9
|
|
|
1,175.1
|
|
1,257.0
|
|
||||
|
Other income, net
|
(5.4
|
)
|
|
(3.7
|
)
|
(1.6
|
)
|
||||
|
Interest expense, net
|
4.1
|
|
|
1.7
|
|
0.2
|
|
||||
|
Foreign currency loss
|
2.6
|
|
|
4.8
|
|
2.6
|
|
||||
|
Income before provision for income taxes
|
688.6
|
|
|
1,172.3
|
|
1,255.8
|
|
||||
|
Provision for income taxes
|
137.1
|
|
|
334.6
|
|
374.8
|
|
||||
|
Net income
|
551.5
|
|
|
837.7
|
|
881.0
|
|
||||
|
Less: Net loss attributable to noncontrolling interest
|
(1.0
|
)
|
(1.4
|
)
|
—
|
|
|||||
|
Net income attributable to MKHL
|
$
|
552.5
|
|
$
|
839.1
|
|
$
|
881.0
|
|
||
|
Weighted average ordinary shares outstanding:
|
|||||||||||
|
Basic
|
165,986,733
|
|
186,293,295
|
|
202,680,572
|
|
|||||
|
Diluted
|
168,123,813
|
|
189,054,289
|
|
205,865,769
|
|
|||||
|
Net income per ordinary share attributable to MKHL:
|
|||||||||||
|
Basic
|
$
|
3.33
|
|
$
|
4.50
|
|
$
|
4.35
|
|
||
|
Diluted
|
$
|
3.29
|
|
$
|
4.44
|
|
$
|
4.28
|
|
||
|
Statements of Comprehensive Income:
|
|||||||||||
|
Net income
|
$
|
551.5
|
|
$
|
837.7
|
|
$
|
881.0
|
|
||
|
Foreign currency translation adjustments
|
(8.8
|
)
|
18.5
|
|
(91.3
|
)
|
|||||
|
Net gains (losses) on derivatives
|
8.7
|
|
(32.5
|
)
|
30.9
|
|
|||||
|
Comprehensive income
|
551.4
|
|
823.7
|
|
820.6
|
|
|||||
|
Less: Net loss attributable to noncontrolling interest
|
(1.0
|
)
|
(1.4
|
)
|
—
|
|
|||||
|
Less: Other comprehensive income attributable to noncontrolling interest
|
(0.4
|
)
|
0.1
|
|
—
|
|
|||||
|
Comprehensive income attributable to MKHL
|
$
|
552.8
|
|
$
|
825.0
|
|
$
|
820.6
|
|
||
See accompanying notes to consolidated financial statements.
57
MICHAEL KORS HOLDINGS LIMITED AND SUBSIDIARIES
CONSOLIDATED STATEMENTS OF SHAREHOLDERS’ EQUITY
(in millions, except share data which is in thousands)
|
|
Ordinary Shares
|
Additional
Paid-in Capital |
Treasury Shares
|
Accumulated
Other Comprehensive Loss |
Retained
Earnings |
Total Equity of MKHL
|
Non-controlling Interest
|
Total Equity
|
|||||||||||||||||||||||||||||
|
|
Shares
|
Amounts
|
Shares
|
Amounts
|
|||||||||||||||||||||||||||||||||
|
Balance at March 29, 2014
|
204,291
|
|
$
|
—
|
|
$
|
527.2
|
|
(30
|
)
|
$
|
(2.4
|
)
|
$
|
(6.4
|
)
|
$
|
1,287.8
|
|
$
|
1,806.2
|
|
$
|
—
|
|
$
|
1,806.2
|
|
|||||||||
|
Net income
|
—
|
|
—
|
|
—
|
|
—
|
|
—
|
|
881.0
|
|
881.0
|
|
—
|
|
881.0
|
|
|||||||||||||||||||
|
Other comprehensive loss
|
—
|
|
—
|
|
—
|
|
—
|
|
—
|
|
(60.4
|
)
|
—
|
|
(60.4
|
)
|
—
|
|
(60.4
|
)
|
|||||||||||||||||
|
Total comprehensive income
|
—
|
|
—
|
|
—
|
|
—
|
|
—
|
|
—
|
|
—
|
|
820.6
|
|
—
|
|
820.6
|
|
|||||||||||||||||
|
Issuance of restricted shares
|
413
|
|
—
|
|
—
|
|
—
|
|
—
|
|
—
|
|
—
|
|
—
|
|
—
|
|
—
|
|
|||||||||||||||||
|
Exercise of employee share options
|
1,783
|
|
—
|
|
15.3
|
|
—
|
|
—
|
|
—
|
|
—
|
|
15.3
|
|
—
|
|
15.3
|
|
|||||||||||||||||
|
Equity compensation expense
|
—
|
|
—
|
|
48.9
|
|
—
|
|
—
|
|
—
|
|
—
|
|
48.9
|
|
—
|
|
48.9
|
|
|||||||||||||||||
|
Tax benefits on exercise of share options
|
—
|
|
—
|
|
45.3
|
|
—
|
|
—
|
|
—
|
|
—
|
|
45.3
|
|
—
|
|
45.3
|
|
|||||||||||||||||
|
Purchase of treasury shares
|
—
|
|
—
|
|
—
|
|
(6,800
|
)
|
(495.3
|
)
|
—
|
|
—
|
|
(495.3
|
)
|
—
|
|
(495.3
|
)
|
|||||||||||||||||
|
Balance at March 28, 2015
|
206,487
|
|
$
|
—
|
|
$
|
636.7
|
|
(6,830
|
)
|
$
|
(497.7
|
)
|
$
|
(66.8
|
)
|
$
|
2,168.8
|
|
$
|
2,241.0
|
|
$
|
—
|
|
$
|
2,241.0
|
|
|||||||||
|
Net income (loss)
|
—
|
|
—
|
|
—
|
|
—
|
|
—
|
|
—
|
|
839.1
|
|
839.1
|
|
(1.4
|
)
|
837.7
|
|
|||||||||||||||||
|
Other comprehensive (loss) income
|
—
|
|
—
|
|
—
|
|
—
|
|
—
|
|
(14.1
|
)
|
—
|
|
(14.1
|
)
|
0.1
|
|
(14.0
|
)
|
|||||||||||||||||
|
Total comprehensive income (loss)
|
—
|
|
—
|
|
—
|
|
—
|
|
—
|
|
—
|
|
—
|
|
825.0
|
|
(1.3
|
)
|
823.7
|
|
|||||||||||||||||
|
Fair value of noncontrolling interest in MK Panama
|
—
|
|
—
|
|
—
|
|
—
|
|
—
|
|
—
|
|
—
|
|
—
|
|
5.1
|
|
5.1
|
|
|||||||||||||||||
|
Forfeitures of restricted awards, net of vestings
|
(35
|
)
|
—
|
|
—
|
|
—
|
|
—
|
|
—
|
|
—
|
|
—
|
|
—
|
|
—
|
|
|||||||||||||||||
|
Exercise of employee share options
|
1,632
|
|
—
|
|
12.7
|
|
—
|
|
—
|
|
—
|
|
—
|
|
12.7
|
|
—
|
|
12.7
|
|
|||||||||||||||||
|
Equity compensation expense
|
—
|
|
—
|
|
48.4
|
|
—
|
|
—
|
|
—
|
|
—
|
|
48.4
|
|
—
|
|
48.4
|
|
|||||||||||||||||
|
Tax benefits on exercise of share options
|
—
|
|
—
|
|
21.1
|
|
—
|
|
—
|
|
—
|
|
—
|
|
21.1
|
|
—
|
|
21.1
|
|
|||||||||||||||||
|
Purchase of treasury shares
|
—
|
|
—
|
|
—
|
|
(24,812
|
)
|
(1,152.4
|
)
|
—
|
|
—
|
|
(1,152.4
|
)
|
—
|
|
(1,152.4
|
)
|
|||||||||||||||||
|
Other
|
—
|
|
—
|
|
—
|
|
—
|
|
—
|
|
—
|
|
(0.1
|
)
|
(0.1
|
)
|
—
|
|
(0.1
|
)
|
|||||||||||||||||
|
Balance at April 2, 2016
|
208,084
|
|
$
|
—
|
|
$
|
718.9
|
|
(31,642
|
)
|
$
|
(1,650.1
|
)
|
$
|
(80.9
|
)
|
$
|
3,007.8
|
|
$
|
1,995.7
|
|
$
|
3.8
|
|
$
|
1,999.5
|
|
|||||||||
|
Net income (loss)
|
—
|
|
—
|
|
—
|
|
—
|
|
—
|
|
—
|
|
552.5
|
|
552.5
|
|
(1.0
|
)
|
551.5
|
|
|||||||||||||||||
|
Other comprehensive income (loss)
|
—
|
|
—
|
|
—
|
|
—
|
|
—
|
|
0.3
|
|
—
|
|
0.3
|
|
(0.4
|
)
|
(0.1
|
)
|
|||||||||||||||||
|
Total comprehensive income (loss)
|
—
|
|
—
|
|
—
|
|
—
|
|
—
|
|
—
|
|
—
|
|
552.8
|
|
(1.4
|
)
|
551.4
|
|
|||||||||||||||||
|
Vesting of restricted awards, net of forfeitures
|
454
|
|
—
|
|
—
|
|
—
|
|
—
|
|
—
|
|
—
|
|
—
|
|
—
|
|
—
|
|
|||||||||||||||||
|
Exercise of employee share options
|
794
|
|
—
|
|
8.4
|
|
—
|
|
—
|
|
—
|
|
—
|
|
8.4
|
|
—
|
|
8.4
|
|
|||||||||||||||||
|
Equity compensation expense
|
—
|
|
—
|
|
33.9
|
|
—
|
|
—
|
|
—
|
|
—
|
|
33.9
|
|
—
|
|
33.9
|
|
|||||||||||||||||
|
Tax benefits on exercise of share options
|
—
|
|
—
|
|
6.6
|
|
—
|
|
—
|
|
—
|
|
—
|
|
6.6
|
|
—
|
|
6.6
|
|
|||||||||||||||||
|
Purchase of treasury shares
|
—
|
|
—
|
|
—
|
|
(21,857
|
)
|
(1,004.8
|
)
|
—
|
|
—
|
|
(1,004.8
|
)
|
—
|
|
(1,004.8
|
)
|
|||||||||||||||||
|
Balance at April 1, 2017
|
209,332
|
|
$
|
—
|
|
$
|
767.8
|
|
(53,499
|
)
|
$
|
(2,654.9
|
)
|
$
|
(80.6
|
)
|
$
|
3,560.3
|
|
$
|
1,592.6
|
|
$
|
2.4
|
|
$
|
1,595.0
|
|
|||||||||
See accompanying notes to consolidated financial statements.
58
MICHAEL KORS HOLDINGS LIMITED AND SUBSIDIARIES
(In millions)
|
|
Fiscal Years Ended
|
||||||||||
|
|
April 1,
2017 |
April 2,
2016 |
March 28,
2015 |
||||||||
|
Cash flows from operating activities
|
|||||||||||
|
Net income
|
$
|
551.5
|
|
$
|
837.7
|
|
$
|
881.0
|
|
||
|
Adjustments to reconcile net income to net cash provided by operating activities:
|
|||||||||||
|
Depreciation and amortization
|
219.8
|
|
183.2
|
|
138.4
|
|
|||||
|
Equity compensation expense
|
33.9
|
|
48.4
|
|
48.9
|
|
|||||
|
Deferred income taxes
|
(60.3
|
)
|
(1.9
|
)
|
6.2
|
|
|||||
|
Non-cash litigation related costs
|
—
|
|
1.9
|
|
5.7
|
|
|||||
|
Amortization of deferred rent
|
9.2
|
|
2.6
|
|
5.1
|
|
|||||
|
Loss on disposal of fixed assets
|
3.4
|
|
2.8
|
|
1.9
|
|
|||||
|
Impairment of long-lived assets
|
199.2
|
|
10.9
|
|
0.8
|
|
|||||
|
Amortization of deferred financing costs
|
0.9
|
|
0.9
|
|
0.7
|
|
|||||
|
Tax benefits on exercise of share options
|
(6.6
|
)
|
(21.1
|
)
|
(45.3
|
)
|
|||||
|
Foreign currency losses (gains)
|
2.6
|
|
4.8
|
|
(1.5
|
)
|
|||||
|
Gain on acquisition of MK Korea
|
—
|
|
(3.7
|
)
|
|
—
|
|
||||
|
Loss (income) earned on joint venture
|
—
|
|
1.0
|
|
(0.1
|
)
|
|||||
|
Change in assets and liabilities:
|
|||||||||||
|
Receivables, net
|
59.6
|
|
52.5
|
|
(83.3
|
)
|
|||||
|
Inventories
|
20.6
|
|
(16.3
|
)
|
(112.4
|
)
|
|||||
|
Prepaid expenses and other current assets
|
(0.9
|
)
|
(5.3
|
)
|
(20.1
|
)
|
|||||
|
Other assets
|
(7.9
|
)
|
(0.4
|
)
|
(6.3
|
)
|
|||||
|
Accounts payable
|
37.5
|
|
14.2
|
|
(8.6
|
)
|
|||||
|
Accrued expenses and other current liabilities
|
(61.0
|
)
|
104.5
|
|
36.3
|
|
|||||
|
Other long-term liabilities
|
26.5
|
|
11.7
|
|
10.5
|
|
|||||
|
Net cash provided by operating activities
|
1,028.0
|
|
1,228.4
|
|
857.9
|
|
|||||
|
Cash flows from investing activities
|
|||||||||||
|
Capital expenditures
|
(164.8
|
)
|
(369.2
|
)
|
(356.2
|
)
|
|||||
|
Purchase of intangible assets
|
(5.5
|
)
|
(11.4
|
)
|
(29.2
|
)
|
|||||
|
Investment in joint venture
|
—
|
|
(1.0
|
)
|
(3.0
|
)
|
|||||
|
Cash paid for business acquisition, net of cash acquired
|
(480.6
|
)
|
0.5
|
|
—
|
|
|||||
|
Net cash used in investing activities
|
(650.9
|
)
|
(381.1
|
)
|
(388.4
|
)
|
|||||
|
Cash flows from financing activities
|
|||||||||||
|
Repurchase of treasury shares
|
(1,004.8
|
)
|
(1,152.4
|
)
|
(495.3
|
)
|
|||||
|
Tax benefits on exercise of share options
|
6.6
|
|
21.1
|
|
45.3
|
|
|||||
|
Exercise of employee share options
|
8.4
|
|
12.7
|
|
15.3
|
|
|||||
|
Repayments under revolving credit agreement
|
(1,093.8
|
)
|
(199.8
|
)
|
—
|
|
|||||
|
Borrowings under revolving credit agreement
|
1,240.0
|
|
192.6
|
|
—
|
|
|||||
|
Payment of deferred financing costs
|
—
|
|
(2.4
|
)
|
—
|
|
|||||
|
Other financing activities
|
—
|
|
(0.1
|
)
|
—
|
|
|||||
|
Net cash used in financing activities
|
(843.6
|
)
|
(1,128.3
|
)
|
(434.7
|
)
|
|||||
|
Effect of exchange rate changes on cash and cash equivalents
|
(5.9
|
)
|
4.1
|
|
(27.1
|
)
|
|||||
|
Net (decrease) increase in cash and cash equivalents
|
(472.4
|
)
|
(276.9
|
)
|
7.7
|
|
|||||
|
Beginning of period
|
702.0
|
|
978.9
|
|
971.2
|
|
|||||
|
End of period (including restricted cash of $1.9 million at April 1, 2017)
|
$
|
229.6
|
|
$
|
702.0
|
|
$
|
978.9
|
|
||
|
Supplemental disclosures of cash flow information
|
|||||||||||
|
Cash paid for interest
|
$
|
3.5
|
|
$
|
1.5
|
|
$
|
0.7
|
|
||
|
Cash paid for income taxes
|
$
|
171.1
|
|
$
|
273.0
|
|
$
|
373.3
|
|
||
|
Supplemental disclosure of noncash investing and financing activities
|
|||||||||||
|
Accrued capital expenditures
|
$
|
22.8
|
|
$
|
33.6
|
|
$
|
32.9
|
|
||
See accompanying notes to consolidated financial statements.
59
MICHAEL KORS HOLDINGS LIMITED AND SUBSIDIARIES
NOTES TO CONSOLIDATED FINANCIAL STATEMENTS
1. Business and Basis of Presentation
Michael Kors Holdings Limited (“MKHL,” and together with its subsidiaries, the “Company”) was incorporated in the British Virgin Islands (“BVI”) on December 13, 2002. The Company is a leading designer, marketer, distributor and retailer of branded women’s apparel and accessories and men’s apparel bearing the Michael Kors tradename and related trademarks “MICHAEL KORS,” “MICHAEL MICHAEL KORS,” and various other related trademarks and logos. The Company’s business consists of retail, wholesale and licensing segments. Retail operations consist of collection stores and lifestyle stores, including concessions, and outlet stores, located primarily in the Americas (United States, Canada and Latin America, excluding Brazil), Europe and Asia, as well as e-commerce. Wholesale revenues are principally derived from major department and specialty stores located throughout the Americas, Europe and Asia, as well as from our geographic licensees. The Company licenses its trademarks on products such as fragrances, beauty, eyewear, belts, cold weather accessories, jewelry, watches, coats, men’s suits, swimwear, socks, furs and ties, as well as through geographic licenses.
The consolidated financial statements have been prepared in accordance with accounting principles generally accepted in the United States (“U.S. GAAP”) and include the accounts of the Company and its wholly-owned subsidiaries. All significant intercompany balances and transactions have been eliminated in consolidation.
On May 31, 2016, the Company acquired
100%
of the stock of its previously licensed business in the Greater China region, Michael Kors (HK) Limited and Subsidiaries ("MKHKL"), which has operations in China, Hong Kong, Macau and Taiwan. As a result, the Company began consolidating MKHKL into its operations beginning on June 1, 2016. See
Note 3
for additional information.
The Company has historically accounted for its investment in its Latin American joint venture, MK (Panama) Holdings, S.A. and subsidiaries (“MK Panama”), under the equity method of accounting. During the second quarter of Fiscal 2016, the Company made a series of capital contributions to the joint venture, obtaining a controlling interest in MK Panama. As such, the Company has been consolidating MK Panama into its operations beginning with the second quarter of Fiscal 2016. In addition, on January 1, 2016, the Company acquired its previously licensed business in South Korea ("MK Korea") upon expiration of the related license agreement. As a result, the Company began consolidating MK Korea into its operations during the fourth quarter of Fiscal 2016.
See
Note 3
for additional information.
The Company utilizes a 52 to 53 week fiscal year ending on the Saturday closest to March 31. As such, the fiscal years ending on
April 1, 2017
and
March 28, 2015
(“Fiscal
2017
” and “Fiscal
2015
”, respectively) contain 52 weeks, whereas the fiscal year ending on
April 2, 2016
(“Fiscal
2016
”) contained 53 weeks.
2. Summary of Significant Accounting Policies
Use of Estimates
The preparation of financial statements in accordance with U.S. GAAP requires management to use judgment and make estimates that affect the reported amounts of assets and liabilities and disclosure of contingent assets and liabilities at the date of the financial statements and the reported amounts of revenues and expenses during the reporting period. The level of uncertainty in estimates and assumptions increases with the length of time until the underlying transactions are completed. The most significant assumptions and estimates involved in preparing the financial statements include allowances for customer deductions, sales returns, sales discounts and doubtful accounts, estimates of inventory recovery, the valuation of share-based compensation, valuation of deferred taxes and the estimated useful lives used for amortization and depreciation of intangible assets and property and equipment. Actual results could differ from those estimates.
Reclassifications
Certain reclassifications have been made to the prior periods’ financial information in order to conform to the current period’s presentation.
60
Revenue Recognition
Revenue is recognized when there is persuasive evidence of an arrangement, delivery has occurred, the price has been fixed and determinable and collectability is reasonably assured. The Company recognizes retail store revenues upon sale of its products to retail consumers, net of estimated returns. Revenue from sales through the Company’s e-commerce sites is recognized at the time of delivery to the customer, reduced by an estimate of returns. Wholesale revenue is recognized net of estimates for sales returns, discounts, markdowns and allowances, after merchandise is shipped and the title and risk of loss are transferred to the Company’s wholesale customers. To arrive at net sales for retail, gross sales are reduced by actual customer returns as well as by a provision for estimated future customer returns, which is based on management’s review of historical and current customer returns. Sales taxes collected from retail customers are presented on a net basis and, as such, are excluded from revenue. To arrive at net sales for wholesale, gross sales are reduced by provisions for estimated future returns, based on current expectations, as well as trade discounts, markdowns, allowances, operational chargebacks, and certain cooperative selling expenses. These estimates are based on such factors as historical trends, actual and forecasted performance, and market conditions, which are reviewed by management on a quarterly basis.
The following table details the activity and balances of the Company’s sales reserves for the fiscal years ended
April 1, 2017
,
April 2, 2016
, and
March 28, 2015
(in millions):
|
Balance
Beginning
of Year
|
Amounts
Charged to
Revenue
|
Write-offs
Against
Reserves
|
Balance
at
Year End
|
||||||||||||
|
Retail
|
|||||||||||||||
|
Return Reserves:
|
|||||||||||||||
|
Fiscal year ended April 1, 2017
|
$
|
4.7
|
|
$
|
102.4
|
|
$
|
(99.8
|
)
|
$
|
7.3
|
|
|||
|
Fiscal year ended April 2, 2016
|
2.5
|
|
71.7
|
|
(69.5
|
)
|
4.7
|
|
|||||||
|
Fiscal year ended March 28, 2015
|
2.3
|
|
57.0
|
|
(56.8
|
)
|
2.5
|
|
|||||||
|
|
Balance
Beginning
of Year
|
Amounts
Charged to
Revenue
|
Write-offs
Against
Reserves
|
Balance
at
Year End
|
|||||||||||
|
Wholesale
|
|||||||||||||||
|
Total Sales Reserves:
|
|||||||||||||||
|
Fiscal year ended April 1, 2017
|
$
|
110.9
|
|
$
|
271.1
|
|
$
|
(285.3
|
)
|
$
|
96.7
|
|
|||
|
Fiscal year ended April 2, 2016
|
87.5
|
|
348.4
|
|
(325.0
|
)
|
110.9
|
|
|||||||
|
Fiscal year ended March 28, 2015
|
65.9
|
|
281.0
|
|
(259.4
|
)
|
87.5
|
|
|||||||
Royalty revenue generated from product licenses, which includes contributions for advertising, is based on reported sales of licensed products bearing the Company’s tradenames at rates specified in the license agreements. These agreements are also subject to contractual minimum levels. Royalty revenue generated by geographic licensing agreements is recognized as it is earned under the licensing agreements based on reported sales of licensees applicable to specified periods, as outlined in the agreements. These agreements allow for the use of the Company’s tradenames to sell its branded products in specific geographic regions.
Advertising
Advertising and marketing costs are expensed when incurred and are reflected in general and administrative expenses. Advertising and marketing expense was
$118.7 million
,
$103.9 million
and
$103.6 million
in Fiscal
2017
, Fiscal
2016
and Fiscal
2015
, respectively.
Cooperative advertising expense, which represents the Company’s participation in advertising expenses of its wholesale customers, is reflected as a reduction of net sales. Expenses related to cooperative advertising for Fiscal
2017
, Fiscal
2016
and Fiscal
2015
, were
$5.4 million
,
$7.4 million
and
$8.0 million
, respectively.
61
Shipping and Handling
Freight-in expenses are recorded as part of cost of goods sold, along with product costs and other costs to acquire inventory. The costs of preparing products for sale, including warehousing expenses, are included in selling, general and administrative expenses. Selling, general and administrative expenses also include the costs of shipping products to the Company's e-commerce customers. Shipping and handling costs included within selling, general and administrative expenses in the Company's consolidated statements of operations and comprehensive income were
$102.1 million
,
$98.6 million
and
$92.6 million
for Fiscal
2017
, Fiscal
2016
and Fiscal
2015
, respectively. Shipping and handling costs charged to customers are included in total revenue.
Cash and Cash Equivalents
All highly liquid investments with original maturities of three months or less are considered to be cash equivalents. Included in the Company’s cash and cash equivalents as of
April 1, 2017
and
April 2, 2016
are credit card receivables of
$13.9 million
and
$14.5 million
, respectively, which generally settle within two to three business days.
At
April 1, 2017
, the Company had restricted cash of
$1.9 million
, primarily related to European customs obligations, which was recorded within other assets in the Company's consolidated balance sheet.
Inventories
Inventories consist of finished goods and are stated at the lower of cost or net realizable value. Cost is determined using the weighted-average cost method. Costs include amounts paid to independent manufacturers, plus duties and freight to bring the goods to the Company’s warehouses, which are located in the United States, Holland, Canada, Japan, Hong Kong and South Korea. The Company continuously evaluates the composition of its inventory and makes adjustments when the cost of inventory is not expected to be fully recoverable. The net realizable value of the Company’s inventory is estimated based on historical experience, current and forecasted demand, and market conditions. In addition, reserves for inventory loss are estimated based on historical experience and physical inventory counts. The Company’s inventory reserves are estimates, which could vary significantly from actual results if future economic conditions, customer demand or competition differ from expectations. Our historical estimates of these adjustments have not differed materially from actual results.
Store Pre-opening Costs
Costs associated with the opening of new retail stores and start up activities, are expensed as incurred.
Property and Equipment
Property and equipment is stated at cost less accumulated depreciation and amortization (carrying value). Depreciation is recorded on a straight-line basis over the expected remaining useful lives of the related assets. Equipment, furniture and fixtures, are depreciated over
five
to
seven years
, computer hardware and software are depreciated over
three
to
five years
. The Company’s share of the cost of constructing in-store shop displays within its wholesale customers’ floor-space (“shop-in-shops”), which is paid directly to third-party suppliers, is capitalized as property and equipment and is generally amortized over a useful life of
three
to
four years
. Leasehold improvements are amortized using the straight-line method over the shorter of the estimated remaining useful lives of the related assets or the remaining lease term, including highly probable renewal periods. The Company includes all depreciation and amortization expense as a component of total operating expenses, as the underlying long-lived assets are not directly or indirectly related to bringing the Company’s products to their existing location and condition. Maintenance and repairs are charged to expense in the year incurred.
The Company capitalizes, in property and equipment, direct costs incurred during the application development stage and the implementation stage for developing, purchasing or otherwise acquiring software for its internal use. These costs are amortized over the estimated useful lives of the software, generally
five years
. All costs incurred during the preliminary project stage, including project scoping and identification and testing of alternatives, are expensed as incurred.
Finite-Lived Intangible Assets
The Company’s finite-lived intangible assets consist of trademarks, lease rights and customer relationships and are stated at cost less accumulated amortization. Trademarks are amortized over
twenty years
, customer relationships are amortized over
five
to
ten years
, and lease rights are amortized over the terms of the related lease agreements, including highly probable renewal periods, on a straight-line basis. Reacquired rights recorded in connection with the acquisition of MKHKL are amortized through March 31, 2041, the original expiration date of the Company's license agreement in the Greater China region.
62
Impairment of Long-lived Assets
The Company evaluates its long-lived assets, including fixed assets and finite-lived intangible assets, for impairment whenever events or changes in circumstances indicate that the carrying amount of any such asset may not be recoverable. The Company’s impairment testing is based on its best estimate of its future operating cash flows. If the sum of estimated undiscounted future cash flows associated with the asset is less than the asset’s carrying value, an impairment charge is recognized, which is measured as the amount by which the carrying value exceeds the fair value of the asset. These estimates of cash flow require significant management judgment and certain assumptions about future volume, sales and expense growth rates, devaluation and inflation. As such, these estimates may differ from actual cash flows.
Goodwill
The Company performs an assessment of goodwill on an annual basis, or whenever impairment indicators exist. In the absence of any impairment indicators, goodwill is assessed during the fourth quarter of each fiscal year. Judgments regarding the existence of impairment indicators are based on market conditions and operational performance of the business.
The Company may assess its goodwill for impairment initially using a qualitative approach (“step zero”) to determine whether it is more likely than not that the fair value of goodwill is greater than its carrying value. If the results of the qualitative assessment indicate that it is not more likely than not that the fair value of goodwill exceeds its carrying value, a quantitative goodwill analysis would be performed to determine if impairment is required. The Company may also elect to perform a quantitative analysis of goodwill initially rather than using a qualitative approach. The valuation methods used in the quantitative fair value assessment, discounted cash flow and market multiples method, require the Company’s management to make certain assumptions and estimates regarding certain industry trends and future profitability of the Company’s reporting units. If the carrying amount of a reporting unit exceeds its fair value, the Company would compare the implied fair value of the reporting unit goodwill to its carrying value. To compute the implied fair value, the Company would assign the fair value of the reporting unit to all of the assets and liabilities of that unit (including any unrecognized intangible assets) as if the reporting unit had been acquired in a business combination. The excess of the fair value of a reporting unit over the amounts assigned to its assets and liabilities is the implied fair value of goodwill. If the carrying value of the reporting unit goodwill exceeded the implied fair value of the reporting unit goodwill, the Company would record an impairment loss to write down such goodwill to its implied fair value. The valuation of goodwill is affected by, among other things, the Company’s business plan for the future and estimated results of future operations. Future events could cause the Company to conclude that impairment indicators exist, and, therefore, that goodwill may be impaired.
There were
no
impairment charges related to goodwill in any of the fiscal periods presented. See
Note 11
for information relating to the Company's annual impairment analysis performed during the fourth quarter of
Fiscal 2017
.
Insurance
The Company uses a combination of insurance and self-insurance for losses related to a number of risks, including workers' compensation and employee-related health care benefits. The Company also maintains stop-loss coverage with third-party insurers to limit its exposure arising from claims. Self-insurance claims filed and claims incurred but not reported are accrued based upon management’s estimates of the discounted cost for self-insured claims incurred using actuarial assumptions, historical loss experience, actual payroll and other data. Although the Company believes that it can reasonably estimate losses related to these claims, actual results could differ from these estimates.
The Company also maintains other types of customary business insurance policies, including business interruption insurance. Insurance recoveries represent gain contingencies and are recorded upon actual settlement with the insurance carrier. During Fiscal 2017, the Company received an insurance settlement of
$3.8 million
related to the prior-year disruption to our former third party operated e-commerce fulfillment center. This amount was recorded within other income in the Company's consolidated statement of operations and comprehensive income for Fiscal 2017.
Share-based Compensation
The Company grants share-based awards to certain employees and directors of the Company. The grant date fair value of share options is calculated using the Black-Scholes option pricing model. The closing market price at the grant date is used to determine the grant date fair value of restricted shares, restricted shares units (RSUs) and performance RSUs. These fair values are recognized as expense over the requisite service period, net of estimated forfeitures, based on expected attainment of pre-established performance goals for performance grants, or the passage of time for those grants which have only time-based vesting requirements.
63
The Company’s expected volatility is based on the average volatility rates of similar actively traded companies over the Company’s estimated expected holding periods. The expected holding period for performance-based options is based on the period to expiration, which is generally
9
-
10 years
, which directly correlates to the Company’s service period requirement for such options. The expected holding period for time-based options is calculated using the simplified method, which uses the vesting term of the options, generally
4 years
, and the contractual term of
7 years
, resulting in a holding period of
4.5
-
4.75 years
. The simplified method was chosen as a means to determine the Company’s estimated holding period, as prior to December 2011, the Company was privately held and there is insufficient historical option exercise experience. The risk-free interest rate is derived from the zero-coupon U.S. Treasury Strips yield curve based on the grant’s estimated holding period. Determining the grant date fair value of share-based awards requires considerable judgment, including estimating expected volatility, expected term and risk-free rate. If factors change and the Company employs different assumptions, the fair value of future awards and the resulting share-based compensation expense may differ significantly from what the Company has estimated in the past.
Foreign Currency Translation and Transactions
The financial statements of the majority of the Company’s foreign subsidiaries are measured using the local currency as the functional currency. The Company’s functional currency is the United States Dollar (“USD”) for MKHL and its United States based subsidiaries. Assets and liabilities are translated using period-end exchange rates, while revenues and expenses are translated using average exchange rates over the reporting period. The resulting translation adjustments are recorded separately in shareholders’ equity as a component of accumulated other comprehensive income (loss). Foreign currency income and losses resulting from the re-measuring of transactions denominated in a currency other than the functional currency of a particular entity are included in foreign currency loss on the Company’s consolidated statements of operations and comprehensive income.
Derivative Financial Instruments
The Company uses forward currency exchange contracts to manage its exposure to fluctuations in foreign currency for certain transactions. The Company, in its normal course of business, enters into transactions with foreign suppliers and seeks to minimize risks related to these transactions. The Company employs these forward currency contracts to hedge the Company’s cash flows, as they relate to foreign currency transactions. Certain of these contracts are designated as hedges for accounting purposes, while others remain undesignated. All of the Company’s derivative instruments are recorded in the Company’s consolidated balance sheets at fair value on a gross basis, regardless of their hedge designation.
The Company designates certain contracts related to the purchase of inventory that qualify for hedge accounting as cash flow hedges. Formal hedge documentation is prepared for all derivative instruments designated as hedges, including description of the hedged item and the hedging instrument, the risk being hedged, and the manner in which hedge effectiveness will be assessed prospectively and retrospectively. The effective portion of changes in the fair value for contracts designated as cash flow hedges is recorded in equity as a component of accumulated other comprehensive income (loss) until the hedged item effects earnings. When the inventory related to forecasted inventory purchases that are being hedged is sold to a third party, the gains or losses deferred in accumulated other comprehensive income (loss) are recognized within cost of goods sold. The Company uses regression analysis to assess effectiveness of derivative instruments that are designated as hedges, which compares the change in the fair value of the derivative instrument to the change in the related hedged item. Effectiveness is assessed on a quarterly basis and any portion of the designated hedge contracts deemed ineffective is recorded to foreign currency gain (loss). If the hedge is no longer expected to be highly effective in the future, future changes in the fair value are recognized in earnings. For those contracts that are not designated as hedges, changes in the fair value are recorded to foreign currency gain (loss) in the Company’s consolidated statements of operations and comprehensive income. The Company classifies cash flows relating to its derivative instruments consistently with the classification of the hedged item, within cash flows from operating activities.
The Company is exposed to the risk that counterparties to derivative contracts will fail to meet their contractual obligations. In order to mitigate counterparty credit risk, the Company only enters into contracts with carefully selected financial institutions based upon their credit ratings and certain other financial factors, adhering to established limits for credit exposure. The aforementioned forward contracts generally have a term of no more than
12 months
. The period of these contracts is directly related to the foreign transaction they are intended to hedge.
Income Taxes
Deferred income tax assets and liabilities have been provided for temporary differences between the tax bases and financial reporting bases of the Company’s assets and liabilities using the tax rates and laws in effect for the periods in which the differences are expected to reverse. The Company periodically assesses the realizability of deferred tax assets and the adequacy of deferred tax liabilities, based on the results of local, state, federal or foreign statutory tax audits or estimates and judgments used.
64
Realization of deferred tax assets associated with net operating loss and tax credit carryforwards is dependent upon generating sufficient taxable income prior to their expiration in the applicable tax jurisdiction. The Company periodically reviews the recoverability of its deferred tax assets and provides valuation allowances, as deemed necessary, to reduce deferred tax assets to amounts that more-likely-than-not will be realized. The Company’s management considers many factors when assessing the likelihood of future realization of deferred tax assets, including recent earnings results within various taxing jurisdictions, expectations of future taxable income, the carryforward periods remaining and other factors. Changes in the required valuation allowance are recorded in income in the period such determination is made. Deferred tax assets could be reduced in the future if the Company’s estimates of taxable income during the carryforward period are significantly reduced or alternative tax strategies are no longer viable.
The Company recognizes the impact of an uncertain income tax position taken on its income tax returns at the largest amount that is more-likely-than-not to be sustained upon audit by the relevant taxing authority. An uncertain income tax position will be recognized if it has less than a 50% likelihood of being sustained. The tax positions are analyzed periodically (at least quarterly) and adjustments are made as events occur that warrant adjustments for those positions. The Company records interest expense and penalties payable to relevant tax authorities as income tax expense.
Rent Expense, Deferred Rent and Landlord Construction Allowances
The Company leases office space, retail stores and distribution facilities under agreements that are classified as operating leases. Many of these operating leases include contingent rent provisions (percentage rent), and/or provide for certain landlord allowances related to tenant improvements and other relevant items. The recognition of rent expense for an operating lease commences on the earlier of the related lease commencement date or the date of possession of the property. Rent expense is calculated by recognizing total minimum rental payments (net of any rental abatements, construction allowances and other rental concessions) on a straight-line basis over the lease term. The difference between straight-line rent expense and rent paid is recorded as deferred rent, which is classified within short-term and long-term liabilities in the Company’s consolidated balance sheets. The Company accounts for landlord allowances and incentives as a component of deferred rent, which is amortized over the lease term as a reduction of rent expense. The Company records rent expense as a component of selling, general and administrative expenses.
Deferred Financing Costs
The Company defers costs directly associated with acquiring third party financing. These deferred costs are amortized on a straight-line basis, which approximates the effective interest method, as interest expense over the term of the related indebtedness. As of
April 1, 2017
, deferred financing costs were
$3.1 million
, net of accumulated amortization of
$1.3 million
. As of
April 2, 2016
deferred financing costs were
$3.9 million
, net of accumulated amortization of
$0.4 million
. Deferred financing costs are included in other assets on the consolidated balance sheets.
Net Income per Share
The Company’s basic net income per ordinary share is calculated by dividing net income by the weighted average number of ordinary shares outstanding during the period. Diluted net income per ordinary share reflects the potential dilution that would occur if share option grants or any other potentially dilutive instruments, including restricted shares and units (“RSUs”), were exercised or converted into ordinary shares. These potentially dilutive securities are included in diluted shares to the extent they are dilutive under the treasury stock method for the applicable periods. Performance-based RSUs are included in diluted shares if the related performance conditions are considered satisfied as of the end of the reporting period and to the extent they are dilutive under the treasury stock method.
65
The components of the calculation of basic net income per ordinary share and diluted net income per ordinary share are as follows (in millions, except share and per share data):
|
|
Fiscal Years Ended
|
||||||||||
|
|
April 1,
2017 |
April 2,
2016 |
March 28,
2015 |
||||||||
|
Numerator:
|
|||||||||||
|
Net income attributable to MKHL
|
$
|
552.5
|
|
$
|
839.1
|
|
$
|
881.0
|
|
||
|
Denominator:
|
|||||||||||
|
Basic weighted average shares
|
165,986,733
|
|
186,293,295
|
|
202,680,572
|
|
|||||
|
Weighted average dilutive share equivalents:
|
|||||||||||
|
Share options and restricted shares/units, and performance restricted share units
|
2,137,080
|
|
2,760,994
|
|
3,185,197
|
|
|||||
|
Diluted weighted average shares
|
168,123,813
|
|
189,054,289
|
|
205,865,769
|
|
|||||
|
Basic net income per share
|
$
|
3.33
|
|
$
|
4.50
|
|
$
|
4.35
|
|
||
|
Diluted net income per share
|
$
|
3.29
|
|
$
|
4.44
|
|
$
|
4.28
|
|
||
Share equivalents for
2,034,658
shares,
2,255,271
shares and
699,321
shares, for fiscal years ending
April 1, 2017
,
April 2, 2016
and
March 28, 2015
, respectively, have been excluded from the above calculation due to their anti-dilutive effect.
Recently Adopted Accounting Pronouncements
In November 2016, the Financial Accounting Standards Board ("FASB") issued Accounting Standards Update ("ASU") No. 2016-18, “
Statement of Cash Flows (Topic 230): Restricted Cash
,” which provides new guidance for restricted cash classification and presentation of the statement of cash flows. ASU 2016-18 requires restricted cash to be included within cash and cash equivalents on the statement of cash flows. ASU 2016-18 is effective beginning with the Company's fiscal year 2019, with earlier application permitted, and should be applied prospectively. The Company early adopted ASU 2016-18 during Fiscal 2017, which impacted the classification of its restricted cash in its consolidated statements of cash flows.
In July 2015, the FASB issued ASU No. 2015-11,
"Inventory (Topic 330): Simplifying the Measurement of Inventory."
The new guidance requires inventory accounted for using the average cost or first-in first-out method ("FIFO") to be measured at the lower of cost or net realizable value, replacing the current requirement to value inventory at the lower of cost or market. Net realizable value is defined as the estimated selling price in the ordinary course of business, less reasonably predictable costs of completion, disposal and transportation. ASU 2015-11 is effective beginning with the Company's fiscal year 2018 and should be applied prospectively, with earlier application permitted. The adoption of ASU No. 2015-11 did not have a material impact on the Company's financial statements.
In September 2015, the FASB issued ASU No. 2015-16, "
Business Combinations (Topic 805): Simplifying the Accounting for Measurement-Period Adjustments
," which simplifies the accounting for adjustments made to provisional amounts recognized in a business combination by eliminating the requirement to retrospectively account for those adjustments and requiring such adjustments to be recognized in the reporting period in which they are determined. ASU 2015-16 requires disclosures of any amounts that would have been recorded in previous reporting periods if the adjustment was recognized as of the acquisition date. ASU 2015-16 is effective beginning with the Company's Fiscal 2017, with earlier application permitted, and should be applied prospectively. The adoption of ASU 2015-16 did not have a material impact on the Company's consolidated financial statements.
In June 2014, the FASB issued ASU No. 2014-12, “
Accounting for Share-Based Payments When the Terms of an Award Provide That a Performance Target Could Be Achieved after the Requisite Service Period.
” ASU 2014-12 requires that a performance target under stock-based compensation arrangements that could be achieved after the service period is treated as a performance condition and not reflected in the grant-date fair value of the award. Rather, the related compensation cost should be recognized when it becomes probable that the performance targets will be achieved. ASU 2014-12 is effective beginning with the Company’s fiscal year 2018, with early adoption and retrospective application permitted. The Company adopted ASU 2014-12 during the first quarter of Fiscal 2017, which did not have a material impact on the Company's consolidated financial statements.
66
Recently Issued Accounting Pronouncements
The Company has considered all new accounting pronouncements and, other than the recent pronouncements discussed below, have concluded that there are no new pronouncements that may have a material impact on our results of operations, financial condition or cash flows based on current information.
Revenue Recognition
In May 2014, the FASB issued ASU No. 2014-09, “
Revenue from Contracts with Customers
,” which provides new guidance for revenues recognized from contracts with customers, and will replace the existing revenue recognition guidance. ASU 2014-09 requires that revenue is recognized at an amount the company is entitled to upon transferring control of goods or services to customers, as opposed to when risks and rewards transfer to a customer. In July 2015, the FASB issued ASU No. 2015-14, "
Revenue from Contracts with Customers (Topic 606): Deferral of the Effective Date,
" which deferred the effective date of ASU 2014-09 by one year, making it effective for the interim reporting periods within the annual reporting period beginning after December 15, 2017, or beginning with the Company’s Fiscal 2019. This standard may be applied retrospectively to all prior periods presented, or retrospectively with a cumulative adjustment to retained earnings in the year of adoption.
The FASB has issued several additional ASUs to provide implementation guidance on ASU No. 2014-09, including ASU No. 2016-20, "
Technical Corrections and Improvements to Topic 606, Revenue from Contracts with Customers
" issued in December 2016, ASU No. 2016-12, "
Revenue from Contracts with Customers (Topic 606): Narrow-Scope Improvements and Practical Expedients
"
issued in May 2016, ASU No. 2016-10, "
Revenue from Contracts with Customers (Topic 606): Identifying Performance Obligations and Licensing"
issued in April 2016, and ASU No. 2016-08, "
Revenue from Contracts with Customers (Topic 606): Principal versus Agent Considerations (Reporting Revenue Gross versus Net)"
issued in March 2016 . The Company will consider this guidance in evaluating the impact of ASU 2014-09.
Most of our business is comprised of retail and wholesale operations, where revenue is recognized at a point of time. The Company has completed the initial assessment of the new standard and is currently progressing in its implementation. While the evaluation process is not complete, based on our assessment to date, the Company believes that some of the potential impacts of implementing this standard will include the timing of revenue recognition for its licensing royalties, recognition of breakage revenue for unredeemed gift cards, as well as expanded financial statement disclosures, including revenue recognition policies to identify performance obligations to customers and significant judgments in measurement and recognition. The Company currently anticipates adopting this standard using the modified retrospective method with the cumulative adjustment to retained earnings recorded during the first quarter of Fiscal 2019.
Lease Accounting
In February 2016, the FASB issued ASU No. 2016-02, "
Leases (Topic 842),"
which requires lessees to recognize a lease liability and a right-to-use asset on the balance sheet for all leases, except certain short-term leases. ASU 2016-02 is effective beginning with the Company's Fiscal 2020, with early adoption permitted, and must be implemented using a modified retrospective approach for all leases existing at, or entered into after the beginning of the earliest comparative period that is presented in the financial statements. The Company is currently evaluating the impact of ASU 2016-02 on its consolidated financial statements but expects that the adoption of this standard will result in a significant increase in assets and liabilities on its consolidated balance sheets.
Share-Based Compensation
In March 2016, the FASB issued ASU No. 2016-09, "
Improvements to Employee Share-Based Payment Accounting
," which simplifies accounting and presentation of share-based payments, primarily relating to the recognition and classification of excess tax benefits, accounting for forfeitures and tax withholding requirements. The Company will adopt ASU 2016-09 during the first quarter of Fiscal 2018, as required. Upon adoption, any excess tax benefits or deficiencies from share-based compensation awards, which are currently recorded as additional paid-in capital in the Company's consolidated balance sheets, will be recorded in its consolidated statements of operations and comprehensive income at the time of settlement, which will increase future volatility of tax expense. In addition, the elimination of windfall tax benefits from assumed proceeds in applying the treasury stock method for computing diluted earnings per share will result in the Company's share-based compensation awards having a more dilutive effect on earnings per share. The above changes will be adopted on a prospective basis. In addition, the Company will present excess tax benefits solely within operating activities within its consolidated statements of cash flows on a retrospective basis.
67
Goodwill
In January 2017, the FASB issued ASU 2017-04, “
Intangibles - Goodwill and Other (Topic 350): Simplifying the Test for Goodwill Impairment
,” which simplifies the test for goodwill impairment by eliminating Step 2 of goodwill impairment analysis, while retaining the option to perform an initial qualitative assessment for a reporting unit to determine if a quantitative impairment test is required. ASU 2017-04 is effective in the Company’s Fiscal 2021 with early adoption is permitted and should be applied on a prospective basis. The Company is currently evaluating the impact of ASU 2017-04 on the consolidated financial statements.
3. Acquisitions
Fiscal 2017 Acquisition
On May 31, 2016, the Company acquired
100%
of the stock of Michael Kors (HK) Limited and its subsidiaries, its licensees in the Greater China region, which includes China, Hong Kong, Macau and Taiwan. The Company believes that having direct control of this business will allow it to better manage opportunities and capitalize on the growth potential in the region. This acquisition was funded by a cash payment of
$500.0 million
, which may be subject to certain purchase price adjustments. The Company accounted for the acquisition as a business combination. The following table summarized the preliminary estimated fair values of the assets acquired and liabilities assumed at the date of acquisition (in millions):
|
May 31, 2016
|
|||
|
Cash and cash equivalents
|
$
|
19.4
|
|
|
Accounts receivable
|
22.3
|
|
|
|
Inventory
|
36.1
|
|
|
|
Other current assets
|
5.5
|
|
|
|
Current assets
|
83.3
|
|
|
|
Property and equipment
|
46.6
|
|
|
|
Goodwill
|
96.5
|
|
|
|
Reacquired rights
|
400.4
|
|
|
|
Favorable lease assets
|
1.8
|
|
|
|
Customer relationships
|
0.7
|
|
|
|
Deferred tax assets
|
7.8
|
|
|
|
Other assets
|
6.6
|
|
|
|
Total assets acquired
|
$
|
643.7
|
|
|
Accounts payable
|
$
|
8.9
|
|
|
Short-term debt
|
5.8
|
|
|
|
Other current liabilities
|
27.8
|
|
|
|
Current liabilities
|
42.5
|
|
|
|
Unfavorable lease liabilities
|
4.8
|
|
|
|
Deferred tax liabilities
|
92.3
|
|
|
|
Other liabilities
|
4.1
|
|
|
|
Total liabilities assumed
|
$
|
143.7
|
|
|
Fair value of net assets acquired
|
$
|
500.0
|
|
|
Fair value of acquisition consideration
|
$
|
500.0
|
|
68
The purchase price was allocated to the underlying assets acquired and liabilities assumed based on their estimated fair values at the date of acquisition, with the
$96.5 million
difference between the purchase price over the net identifiable tangible and intangible assets acquired allocated to goodwill, which is not deductible for tax purposes. As part of this acquisition, the Company reacquired the rights to use its trademarks and to import, sell, advertise and promote certain of its products in the licensed territories, which were previously granted to its licensees in the Greater China region. As such, the Company recognized reacquired rights as a separate intangible asset from goodwill, which will be amortized through March 31, 2041, the original expiration date of its license agreement in the Greater China region. In addition, the Company recognized customer relationship intangible assets associated with wholesale customers, which will be amortized over
ten years
. The favorable lease assets and unfavorable lease liabilities have been separately recorded in the Company's financial statements and are recognized as rent expense and a reduction in rent expense, respectively, over the remaining term of the related lease agreements.
MKHKL's results of operations have been included in our consolidated financial statements beginning on June 1, 2016. MKHKL contributed total revenue of $
212.4 million
and net loss of $
10.6 million
for the period from the date of acquisition through
April 1, 2017
(after amortization of non-cash valuation adjustments and integration costs).
The following table summarizes the unaudited pro-forma consolidated results of operations for the fiscal years ended
April 1, 2017
and
April 2, 2016
as if the acquisition had occurred on March 29, 2015, the beginning of Fiscal 2016 (in millions):
|
Fiscal Years Ended
|
|||||||
|
April 1,
2017 |
April 2,
2016 |
||||||
|
Pro-forma total revenue
|
$
|
4,520.1
|
|
$
|
4,839.1
|
|
|
|
Pro-forma net income
|
548.7
|
|
832.2
|
|
|||
|
Pro-forma net income per ordinary share attributable to MKHL:
|
|||||||
|
Basic
|
$
|
3.31
|
|
$
|
4.47
|
|
|
|
Diluted
|
$
|
3.26
|
|
$
|
4.40
|
|
|
The unaudited pro-forma consolidated results above are based on the historical financial statements of the Company and MKHKL and are not necessarily indicative of the results of operations that would have been achieved if the acquisition was completed at the beginning of Fiscal 2016 and are not indicative of the future operating results of the combined company. The pro-forma consolidated results of operations reflect the elimination of intercompany transactions and include the effects of purchase accounting adjustments, including amortization charges related to the finite-lived intangible assets acquired (reacquired rights and customer relationships), fair value adjustments relating to leases, fixed assets and inventory, and the related tax effects assuming that the business combination occurred on March 29, 2015. The pro-forma consolidated results of operations for the
fiscal year ended
April 1, 2017
also reflect the elimination of transaction costs of approximately $
11.3 million
, which have been recorded within selling, general and administrative expenses in the Company's consolidated statements of operations and comprehensive income for the
fiscal year ended
April 1, 2017
.
Fiscal 2016 Acquisitions
Acquisition of the Previously Licensed Business in South Korea
On January 1, 2016, the Company acquired direct control of its previously licensed business in South Korea upon the related license expiration. In connection with the acquisition, the Company acquired certain net assets (including inventory and fixed assets) from the Company's former licensee in exchange for cash consideration of approximately
$3.6 million
. The Company accounted for this acquisition as a business combination and began consolidating the South Korean business into its operations beginning with the fourth quarter of Fiscal 2016. The following table summarizes the fair values of the assets acquired and liabilities assumed (in millions):
69
|
January 1, 2016
|
|||
|
Inventory
|
$
|
3.0
|
|
|
Fixed assets
|
2.1
|
|
|
|
Customer relationship intangible assets
|
2.2
|
|
|
|
Fair value of assets acquired
|
7.3
|
|
|
|
Less: consideration paid
|
3.6
|
|
|
|
Gain on acquisition of MK Korea
|
$
|
3.7
|
|
This acquisition resulted in a gain of
$3.7 million
, representing the excess of the fair value of the assets acquired over the consideration paid, which was recorded in other income in the Company's consolidated statement of operations and comprehensive income for Fiscal 2016. The purchase price was negotiated upon the natural expiration of the licensing agreement, which allowed the Company to negotiate favorable terms for the assets that could no longer be used by the licensee. Prior to recognizing a bargain purchase gain, the Company reassessed whether all assets acquired and liabilities assumed have been correctly identified, as well as the key valuation assumptions and business combination accounting procedures for this acquisition. After careful consideration and review, it was concluded that the recognition of a bargain purchase gain is appropriate for this acquisition.
The customer relationship intangible assets associated with the retail concession arrangements and wholesale relationships are being amortized over
5 years
.
Acquisition of Controlling Interest in a Joint Venture
During the second quarter of Fiscal 2016, the Company made contributions to MK Panama totaling
$18.5 million
, consisting of cash consideration of
$3.0 million
and the elimination of liabilities owed to the Company of
$15.5 million
, which increased the Company's ownership interest to
75%
. As a result of obtaining controlling interest in MK Panama, which was previously accounted for under the equity method of accounting, the Company began consolidating MK Panama into its operations during the second quarter of Fiscal 2016. The additional ownership interest provides the Company with more direct control over its operations in Latin America and will allow it to better manage its opportunities in the region.
The Company accounted for its acquisition of controlling interest in MK Panama as a business combination during the second quarter of Fiscal 2016. The following table summarizes the fair values of the assets acquired and liabilities and non-controlling interest assumed as of the date the Company obtained control of MK Panama, inclusive of certain post-closing working capital adjustments (in millions):
|
June 28, 2015
|
|||
|
Current assets
|
$
|
25.9
|
|
|
Fixed assets
|
6.4
|
|
|
|
Customer relationship intangible assets
|
2.0
|
|
|
|
Goodwill
|
9.2
|
|
|
|
Debt obligations
|
(9.5
|
)
|
|
|
Other liabilities
|
(2.3
|
)
|
|
|
Total fair value of net assets of MK Panama
|
31.7
|
|
|
|
Fair value of preexisting interest in MK Panama
|
8.1
|
|
|
|
Non-controlling interest
|
5.1
|
|
|
|
Fair value of consideration provided
|
$
|
18.5
|
|
In connection with this acquisition, the Company recorded non-deductible goodwill of
$9.2 million
, of which
$8.0 million
and
$1.2 million
was assigned to the Company's retail and wholesale segments, respectively. The customer relationship intangible assets are being amortized over
10 years
. The amount recorded in the Company's consolidated statement of operations and comprehensive income in connection with the revaluation of its prior interest in MK Panama was not material.
70
4. Receivables
Receivables consist of (in millions):
|
April 1,
2017 |
April 2,
2016 |
||||||
|
Trade receivables:
|
|||||||
|
Credit risk assumed by insured/factors
|
$
|
294.0
|
|
$
|
353.7
|
|
|
|
Credit risk retained by Company
|
63.8
|
|
61.8
|
|
|||
|
Receivables due from licensees
|
11.9
|
|
9.5
|
|
|||
|
369.7
|
|
425.0
|
|
||||
|
Less allowances:
|
(103.9
|
)
|
(117.1
|
)
|
|||
|
$
|
265.8
|
|
$
|
307.9
|
|
||
Receivables are presented net of allowances for sales returns, discounts, markdowns, operational chargebacks and doubtful accounts. Sales returns are determined based on an evaluation of current market conditions and historical returns experience. Discounts are based on open invoices where trade discounts have been extended to customers. Markdowns are based on wholesale customers' sales performance, seasonal negotiations with customers, historical deduction trends and an evaluation of current market conditions. Operational chargebacks are based on deductions taken by customers, net of expected recoveries. Such provisions, and related recoveries, are reflected in net sales.
The Company has assumed responsibility for most of the previously factored accounts receivable balances, but a large percentage of its trade receivables as of
April 1, 2017
and
April 2, 2016
are insured. The Company's allowance for doubtful accounts is determined through analysis of periodic aging of receivables that are not covered by insurance and assessments of collectability based on an evaluation of historic and anticipated trends, the financial conditions of the Company’s customers and the impact of general economic conditions. The past due status of a receivable is based on its contractual terms. Amounts deemed uncollectible are written off against the allowance when it is probable the amounts will not be recovered. Allowance for doubtful accounts was
$0.9 million
and
$0.7 million
as of
April 1, 2017
and
April 2, 2016
.
5. Concentration of Credit Risk, Major Customers and Suppliers
Financial instruments that subject the Company to concentration of credit risk are cash and cash equivalents and receivables. As part of its ongoing procedures, the Company monitors its concentration of deposits with various financial institutions in order to avoid any undue exposure. The Company mitigates its risk by depositing cash and cash equivalents in major financial institutions. The Company also mitigates its credit risk by obtaining insurance coverage for a substantial portion of its receivables (as demonstrated in the above table in “Credit risk assumed by insured/factors”). For the fiscal years ended
April 1, 2017
,
April 2, 2016
and
March 28, 2015
, net sales related to our largest wholesale customer, Macy's, accounted for approximately
8.9%
,
12.7%
and
13.7%
, respectively, of total revenue. The accounts receivable related to this customer were substantially insured for all three fiscal years. No other customer accounted for 10% or more of the Company’s total revenues during Fiscal
2017
, Fiscal
2016
or Fiscal
2015
.
The Company contracts for the purchase of finished goods principally with independent third-party contractors, whereby the contractor is generally responsible for all manufacturing processes, including the purchase of piece goods and trim. Although the Company does not have any long-term agreements with any of its manufacturing contractors, the Company believes it has mutually satisfactory relationships with them. The Company allocates product manufacturing among agents and contractors based on their capabilities, the availability of production capacity, quality, pricing and delivery. The inability of certain contractors to provide needed services on a timely basis could adversely affect the Company’s operations and financial condition. The Company has relationships with various agents who source the Company’s finished goods with numerous contractors on the Company’s behalf. For the fiscal years ended
April 1, 2017
,
April 2, 2016
and
March 28, 2015
, one agent sourced approximately
13.9%
,
14.9%
and
11.7%
, respectively, and one contractor accounted for approximately
29.6%
,
26.7%
and
29.1%
, respectively, of the Company’s finished goods purchases.
71
6. Property and Equipment, Net
Property and equipment, net, consists of (in millions):
|
April 1,
2017 |
April 2,
2016 |
||||||
|
Leasehold improvements
|
$
|
507.9
|
|
$
|
414.6
|
|
|
|
In-store shops
|
256.0
|
|
242.9
|
|
|||
|
Furniture and fixtures
|
244.1
|
|
212.7
|
|
|||
|
Computer equipment and software
|
226.2
|
|
167.9
|
|
|||
|
Equipment
|
104.4
|
|
79.1
|
|
|||
|
Building
|
40.6
|
|
—
|
|
|||
|
Land
|
14.0
|
|
15.1
|
|
|||
|
1,393.2
|
|
1,132.3
|
|
||||
|
Less: accumulated depreciation and amortization
|
(833.9
|
)
|
(490.9
|
)
|
|||
|
559.3
|
|
641.4
|
|
||||
|
Construction-in-progress
|
32.2
|
|
116.8
|
|
|||
|
$
|
591.5
|
|
$
|
758.2
|
|
||
Depreciation and amortization of property and equipment for the fiscal years ended
April 1, 2017
,
April 2, 2016
, and
March 28, 2015
, was
$197.7 million
,
$172.2 million
and
$131.4 million
, respectively. During
Fiscal 2017
,
Fiscal 2016
and
Fiscal 2015
, the Company recorded fixed asset impairment charges of
$169.0 million
,
$10.9 million
and
$0.8 million
, respectively, primarily related to underperforming retail locations still in operation. Please refer to
Note 18
for detailed disclosures of impairment charges by segment.
7. Intangible Assets and Goodwill
The following table details the carrying values of the Company's intangible assets that are subject to amortization (in millions):
|
|
April 1, 2017
|
April 2, 2016
|
|||||||||||||||||||||
|
|
Gross
Carrying
Amount
|
Accumulated
Amortization
|
Net
|
Gross
Carrying
Amount
|
Accumulated
Amortization
|
Net
|
|||||||||||||||||
|
Reacquired Rights
|
$
|
400.4
|
|
$
|
13.4
|
|
$
|
387.0
|
|
$
|
—
|
|
$
|
—
|
|
$
|
—
|
|
|||||
|
Trademarks
|
23.0
|
|
16.3
|
|
6.7
|
|
23.0
|
|
15.1
|
|
7.9
|
|
|||||||||||
|
Lease Rights
|
74.2
|
|
53.8
|
|
(1)
|
20.4
|
|
73.3
|
|
17.8
|
|
55.5
|
|
||||||||||
|
Customer Relationships
|
5.0
|
|
1.0
|
|
4.0
|
|
4.2
|
|
0.2
|
|
4.0
|
|
|||||||||||
|
$
|
502.6
|
|
$
|
84.5
|
|
$
|
418.1
|
|
$
|
100.5
|
|
$
|
33.1
|
|
$
|
67.4
|
|
||||||
________________________________
(1)
Includes
$30.2 million
of impairment charges recorded during Fiscal 2017 in connection with underperforming full-price retail stores. There were
no
impairment charges related to the Company’s amortized intangibles assets during
Fiscal 2016
and
Fiscal 2015
.
Reacquired rights relate to the Company's reacquisition of the rights to use its trademarks and to import, sell, advertise and promote certain of its products in the previously licensed territories in the Greater China region and are being amortized through March 31, 2041, the expiration date of the related license agreement. The trademarks relate to the Company’s brand name and are amortized over
twenty years
. Customer relationships are amortized over
five
to
ten years
. Lease rights are amortized over the respective terms of the underlying lease, including highly probable renewal periods. Amortization expense was
$22.1 million
,
$11.0 million
and
$7.0 million
, respectively, for each of the fiscal years ended
April 1, 2017
,
April 2, 2016
and
March 28, 2015
.
72
Estimated amortization expense for each of the next five years is as follows (in millions):
|
Fiscal 2018
|
$
|
20.4
|
|
|
Fiscal 2019
|
20.4
|
|
|
|
Fiscal 2020
|
20.4
|
|
|
|
Fiscal 2021
|
20.2
|
|
|
|
Fiscal 2022
|
19.8
|
|
|
|
Thereafter
|
316.9
|
|
|
|
$
|
418.1
|
|
|
The future amortization expense above reflects weighted-average estimated remaining useful lives of
24.2 years
for reacquired rights,
5.8 years
for trademarks,
6.5 years
for customer relationships and
8.3 years
for lease rights.
The following table details the changes in goodwill for each of the Company's reportable segments (in millions):
|
Retail
|
Wholesale
|
Licensing
|
Total
|
||||||||||||
|
Balance at April 2, 2016
|
$
|
8.0
|
|
$
|
13.3
|
|
$
|
1.9
|
|
$
|
23.2
|
|
|||
|
Acquisition of MKHKL
|
83.9
|
|
12.6
|
|
—
|
|
96.5
|
|
|||||||
|
Balance at April 1, 2017
|
$
|
91.9
|
|
$
|
25.9
|
|
$
|
1.9
|
|
$
|
119.7
|
|
|||
The Company's goodwill is not subject to amortization but is evaluated for impairment annually in the last quarter of each fiscal year, or whenever impairment indicators exist. The Company evaluated goodwill during the fourth fiscal quarter of Fiscal
2017
, and determined that there was
no
impairment (See
Note 11
for additional information). As of
April 1, 2017
, cumulative impairment related to goodwill totaled
$5.4 million
. There were
no
charges related to the impairment of goodwill in any of the periods presented.
8. Current Assets and Current Liabilities
Prepaid expenses and other current assets consist of the following (in millions):
|
April 1,
2017 |
April 2,
2016 |
||||||
|
Prepaid taxes
|
$
|
56.6
|
|
$
|
57.8
|
|
|
|
Prepaid rent
|
21.7
|
|
27.3
|
|
|||
|
Leasehold incentive receivable
|
12.0
|
|
8.9
|
|
|||
|
Unrealized gains on forward foreign exchange contracts
|
4.7
|
|
0.1
|
|
|||
|
Restricted cash
|
1.9
|
|
—
|
|
|||
|
Other
|
25.0
|
|
19.0
|
|
|||
|
$
|
121.9
|
|
$
|
113.1
|
|
||
73
Accrued expenses and other current liabilities consist of the following (in millions):
|
April 1,
2017 |
April 2,
2016 |
||||||
|
Accrued capital expenditures
|
$
|
20.5
|
|
$
|
33.6
|
|
|
|
Advance royalties
|
5.0
|
|
30.2
|
|
|||
|
Other taxes payable
|
29.2
|
|
38.2
|
|
|||
|
Accrued rent
|
21.5
|
|
30.5
|
|
|||
|
Gift cards and retail store credits
|
12.9
|
|
13.1
|
|
|||
|
Professional services
|
7.1
|
|
7.0
|
|
|||
|
Unrealized loss on forward foreign exchange contracts
|
0.4
|
|
5.5
|
|
|||
|
Accrued advertising and marketing
|
10.7
|
|
8.8
|
|
|||
|
Other
|
27.7
|
|
25.9
|
|
|||
|
$
|
135.0
|
|
$
|
192.8
|
|
||
Senior Unsecured Revolving Credit Facility
On
October 29, 2015
, the Company entered into an amended and restated senior unsecured revolving credit facility ("2015 Credit Facility") with, among others, JPMorgan Chase Bank, N.A. ("JPMorgan Chase"), as administrative agent, which replaced its prior 2013 senior unsecured revolving credit facility ("2013 Credit Facility"). The Company and its U.S., Canadian, Dutch and Swiss subsidiaries are the borrowers under the 2015 Credit Facility. The borrowers and certain material subsidiaries of the Company provide unsecured guarantees of the 2015 Credit Facility. The 2015 Credit Facility provides for up to
$1.0 billion
in borrowings, which may be denominated in U.S. Dollars and other currencies, including Euros, Canadian Dollars, Pounds Sterling, Japanese Yen and Swiss Francs. The 2015 Credit Facility also provides for the issuance of letters of credit of up to
$75.0 million
and swing line loans of up to
$50.0 million
. The Company has the ability to expand its borrowing availability under the 2015 Credit Facility by up to an additional
$500.0 million
, subject to the agreement of the participating lenders and certain other customary conditions. The 2015 Credit Facility expires on
October 29, 2020
.
Borrowings under the 2015 Credit Facility bear interest, at the Company's option, at (i) for loans denominated in U.S. Dollars, an alternative base rate, which is the greater of the prime rate publicly announced from time to time by JPMorgan Chase, the greater of the federal funds effective rate or Federal Reserve Bank of New York overnight bank funding rate plus 50 basis points or the one-month London Interbank Offered Rate adjusted for statutory reserve requirements for Eurocurrency liabilities ("Adjusted LIBOR") plus 100 basis points, in each case, plus an applicable margin based on the Company's leverage ratio; (ii) Adjusted LIBOR for the applicable interest period, plus an applicable margin based on the Company's leverage ratio; (iii) for Canadian borrowings, the Canadian prime rate, which is the greater of the PRIMCAN Index rate or the rate applicable to one-month Canadian Dollar banker's acceptances quoted on Reuters ("CDOR") plus 100 basis points, plus an applicable margin based on the Company's leverage ratio; or (iv) for Canadian borrowings, the average CDOR rate for the applicable interest period, plus an applicable margin based on the Company's leverage ratio.
The 2015 Credit Facility also provides for an annual administration fee and a commitment fee equal to
0.10%
to
0.175%
per annum, based on the Company's leverage ratio, applied to the average daily unused amount of the facility. Loans under the 2015 Credit Facility may be prepaid and commitments may be terminated or reduced by the borrowers without premium or penalty other than customary breakage costs with respect to loans bearing interest based upon Adjusted LIBOR or the CDOR rate.
The 2015 Credit Facility requires the Company to maintain a leverage ratio at the end of each fiscal quarter of no greater than
3.5
to 1. Such leverage ratio is calculated as the ratio of the sum of total indebtedness as of the date of the measurement plus
6.0
times the consolidated rent expense for the last four consecutive fiscal quarters, to Consolidated EBITDAR for the last four consecutive fiscal quarters. Consolidated EBITDAR is defined as consolidated net income plus income tax expense, net interest expense, depreciation and amortization expense, consolidated rent expense and other non-cash charges, subject to certain deductions. The 2015 Credit Facility also includes covenants that limit additional indebtedness, guarantees, liens, acquisitions and other investments and cash dividends that are customary for financings of this type. As of
April 1, 2017
, the Company was in compliance with all covenants related to this agreement.
74
The 2015 Credit Facility contains events of default customary for financings of this type, including but not limited to, payment defaults, material inaccuracy of representations and warranties, covenant defaults, cross-defaults to certain indebtedness, certain events of bankruptcy or insolvency, certain events under ERISA, material judgments, actual or asserted failure of any guaranty supporting the 2015 Credit Facility to be in full force and effect, and change of control. If such an event of default occurs, the lenders under the 2015 Credit Facility would be entitled to take various actions, including terminating the commitments and accelerating amounts outstanding under the 2015 Credit Facility.
As of
April 1, 2017
, the Company had
$127.3 million
of borrowings outstanding under the 2015 Credit Facility, which were recorded within short-term debt in its consolidated balance sheet as of
April 1, 2017
. In addition, stand-by letters of credit of
$10.6 million
were outstanding as of
April 1, 2017
. There were
no
borrowings outstanding under the 2015 Credit Facility as of
April 2, 2016
. At
April 1, 2017
, the amount available for future borrowings was
$862.1 million
.
Hong Kong Credit Facility
In December 2016, the Company's Hong Kong subsidiary, MKHKL, renewed its uncommitted credit facility ("HK Credit Facility") with HSBC (the "Bank"), which may be used to fund general working capital needs of MKHKL through
November 30, 2017
subject to the Bank's discretion. The HK Credit Facility provides MKHKL with a revolving line of credit of up to
100.0 million
Hong Kong Dollars (approximately
$12.9 million
), and may be used to support bank guarantees. In addition, this credit facility provides for a business card facility of up to
0.4 million
Hong Kong Dollars (less than
$0.1 million
). Borrowings under the HK Credit Facility must be made in increments of at least
5.0 million
Hong Kong Dollars and bear interest at the Hong Kong Interbank Offered Rate ("HIBOR") plus 150 basis points. As of
April 1, 2017
, borrowings outstanding under the HK Credit Facility were
45.0 million
Hong Kong Dollars (approximately $
5.8 million
), which were recorded within short-term debt in the Company's consolidated balance sheet as of
April 1, 2017
. In addition, as of
April 1, 2017
, bank guarantees supported by this facility were
11.8 million
Hong Kong Dollars (approximately $
1.5 million
). At
April 1, 2017
, the amount available for future borrowings under the HK Credit Facility was
43.2 million
Hong Kong Dollars (approximately $
5.6 million
).
Debt Obligations of MK Panama
The Company's consolidated balance sheet as of
April 2, 2016
included
$2.3 million
in debt related to MK Panama, which was
no
longer outstanding as of
April 1, 2017
.
10. Commitments and Contingencies
Leases
The Company leases office space, retail stores and warehouse space under operating lease agreements that expire at various dates through June 2035. In addition to minimum rental payments, the leases require payment of increases in real estate taxes and other expenses incidental to the use of the property.
Rent expense for the Company’s operating leases consists of the following (in millions):
|
|
Fiscal Years Ended
|
||||||||||
|
|
April 1,
2017 |
April 2,
2016 |
March 28,
2015 |
||||||||
|
Minimum rentals
|
$
|
257.0
|
|
$
|
193.5
|
|
$
|
151.0
|
|
||
|
Contingent rent
|
75.5
|
|
64.4
|
|
65.8
|
|
|||||
|
Total rent expense
|
$
|
332.5
|
|
$
|
257.9
|
|
$
|
216.8
|
|
||
75
Future minimum lease payments under the terms of these noncancelable operating lease agreements are as follows (in millions):
|
Fiscal years ending:
|
|
||
|
2018
|
$
|
250.1
|
|
|
2019
|
238.2
|
|
|
|
2020
|
226.4
|
|
|
|
2021
|
214.6
|
|
|
|
2022
|
163.5
|
|
|
|
Thereafter
|
549.3
|
|
|
|
$
|
1,642.1
|
|
|
The Company has issued stand-by letters of credit to guarantee certain of its retail and corporate operating lease commitments, aggregating
$11.1 million
at
April 1, 2017
, including
$10.6 million
in letters of credit issued under the 2015 Credit Facility.
Other Commitments
As of
April 1, 2017
, the Company also has other contractual commitments aggregating
$772.3 million
, which consist of inventory purchase commitments of
$599.4 million
, debt obligations of
$133.1 million
and other contractual obligations of
$39.8 million
, which primarily relate to obligations related to the Company's marketing and advertising agreements, information technology agreements and supply agreements.
Long-term Employment Contract
The Company has an employment agreement with one of its officers that provided for continuous employment through the date of the officer’s death or permanent disability at a salary of
$1.0 million
. In addition to salary, the agreement provided for an annual bonus and other employee related benefits.
Contingencies
In the ordinary course of business, the Company is party to various legal proceedings and claims. Although the outcome of such items cannot be determined with certainty, the Company’s management does not believe that the outcome of all pending legal proceedings in the aggregate will have a material adverse effect on its cash flow, results of operations or financial position.
11. Fair Value of Financial Instruments
Financial assets and liabilities are measured at fair value using the three-level valuation hierarchy for disclosure of fair value measurements. The determination of the applicable level within the hierarchy of a particular asset or liability depends on the inputs used in the valuation as of the measurement date, notably the extent to which the inputs are market-based (observable) or internally derived (unobservable). Observable inputs are inputs that market participants would use in pricing the asset or liability developed based on market data obtained from independent sources. Unobservable inputs are inputs based on a company’s own assumptions about market participant assumptions developed based on the best information available in the circumstances. The hierarchy is broken down into three levels based on the reliability of inputs as follows:
Level 1 – Valuations based on quoted prices in active markets for identical assets or liabilities that a company has the ability to access at the measurement date.
Level 2 – Valuations based on quoted inputs other than quoted prices included within Level 1, that are observable for the asset or liability, either directly or indirectly through corroboration with observable market data.
Level 3 – Valuations based on inputs that are unobservable and significant to the overall fair value measurement.
76
At
April 1, 2017
and
April 2, 2016
, the fair values of the Company’s foreign currency forward contracts, the Company’s only derivative instruments, were determined using broker quotations, which were calculations derived from observable market information: the applicable currency rates at the balance sheet date and those forward rates particular to the contract at inception. The Company makes no adjustments to these broker obtained quotes or prices, but assesses the credit risk of the counterparty and would adjust the provided valuations for counterparty credit risk when appropriate. The fair values of the forward contracts are included in prepaid expenses and other current assets, and in accrued expenses and other current liabilities in the consolidated balance sheets, depending on whether they represent assets or (liabilities) to the Company, as detailed in
Note 12
.
All contracts are measured and recorded at fair value on a recurring basis and are categorized in Level 2 of the fair value hierarchy, as shown in the following table (in millions):
|
|
Fair value at April 1, 2017, using:
|
Fair value at April 2, 2016, using:
|
|||||||||||||||||||||
|
Quoted prices
in active
markets for
identical
assets
(Level 1)
|
Significant
other
observable
inputs
(Level 2)
|
Significant
unobservable
inputs
(Level 3)
|
Quoted prices
in active
markets for
identical
assets
(Level 1)
|
Significant
other
observable
inputs
(Level 2)
|
Significant
unobservable
inputs
(Level 3)
|
||||||||||||||||||
|
Forward foreign currency exchange contracts - assets
|
$
|
—
|
|
$
|
4.7
|
|
$
|
—
|
|
$
|
—
|
|
$
|
0.1
|
|
$
|
—
|
|
|||||
|
Forward foreign currency exchange contracts - liabilities
|
$
|
—
|
|
$
|
0.4
|
|
$
|
—
|
|
$
|
—
|
|
$
|
5.5
|
|
$
|
—
|
|
|||||
The Company’s cash and cash equivalents, accounts receivable and accounts payable, are recorded at carrying value, which approximates fair value. Borrowings under revolving credit agreements, if outstanding, are recorded at carrying value, which resembles fair value due to the short-term nature of such borrowings.
Non-financial Assets and Liabilities
The Company's non-financial assets include goodwill, intangible assets and property and equipment. Such assets are reported at their carrying values and are not subject to recurring fair value measurements. The Company's goodwill is assessed for impairment at least annually, while its other long-lived assets, including fixed assets and finite-lived intangible assets, are assessed for impairment whenever events or changes in circumstances indicate that the carrying amount of any such asset may not be recoverable. The fair values of these assets were determined based on Level 3 measurements using the Company's best estimates of the amount and timing of future discounted cash flows, based on historical experience, market conditions, current trends and performance expectations.
The following table details the carrying values and fair values of the Company's long-lived assets that have been impaired (in millions):
|
Carrying Value Prior to Impairment
|
Fair Value
|
Impairment Charge
|
|||||||||
|
Fiscal 2017:
|
|||||||||||
|
Lease Rights
|
33.5
|
|
3.3
|
|
30.2
|
|
|||||
|
Fixed Assets
|
186.9
|
|
17.9
|
|
169.0
|
|
|||||
|
Total
|
$
|
220.4
|
|
21.2
|
|
$
|
199.2
|
|
|||
|
Fiscal 2016:
|
|||||||||||
|
Fixed Assets
|
$
|
10.9
|
|
$
|
—
|
|
$
|
10.9
|
|
||
|
Fiscal 2015:
|
|||||||||||
|
Fixed Assets
|
$
|
0.8
|
|
$
|
—
|
|
$
|
0.8
|
|
||
Please refer to Notes 6, 7 and 18 for additional information.
77
During the fourth quarter of Fiscal
2017
, the Company elected to perform its annual goodwill impairment analysis using a quantitative approach, using the discounted cash flow method to estimate fair value. Based on the results of this assessment, the Company concluded that the fair values of all reporting units significantly exceeded the related carrying amounts and there were no reporting units at risk of impairment. There were
no
impairment charges related to goodwill in any of the fiscal periods presented.
12. Derivative Financial Instruments
The Company uses forward foreign currency exchange contracts to manage its exposure to fluctuations in foreign currency for certain of its transactions. The Company in its normal course of business enters into transactions with foreign suppliers and seeks to minimize risks related to certain forecasted inventory purchases by using forward foreign currency exchange contracts. The Company only enters into derivative instruments with highly credit-rated counterparties. The Company does not enter into derivative contracts for trading or speculative purposes.
The following table details the fair value of the Company’s derivative contracts, which are recorded on a gross basis in the consolidated balance sheets as of
April 1, 2017
and
April 2, 2016
(in millions):
|
|
|
|
Fair Values
|
||||||||||||||||||||
|
|
Notional Amounts
|
Current Assets
(1)
|
Current Liabilities
(2)
|
||||||||||||||||||||
|
|
April 1,
2017 |
April 2,
2016 |
April 1,
2017 |
April 2,
2016 |
April 1,
2017 |
April 2,
2016 |
|||||||||||||||||
|
Designated forward foreign currency exchange contracts
|
$
|
167.5
|
|
$
|
174.1
|
|
$
|
4.7
|
|
$
|
0.1
|
|
$
|
0.4
|
|
$
|
5.1
|
|
|||||
|
Undesignated forward foreign currency exchange contracts
|
—
|
|
30.0
|
|
—
|
|
—
|
|
—
|
|
0.4
|
|
|||||||||||
|
Total
|
$
|
167.5
|
|
$
|
204.1
|
|
$
|
4.7
|
|
$
|
0.1
|
|
$
|
0.4
|
|
$
|
5.5
|
|
|||||
|
(1)
|
Recorded within prepaid expenses and other current assets in the Company’s audited consolidated balance sheets.
|
|
(2)
|
Recorded within accrued expenses and other current liabilities in the Company’s audited consolidated balance sheets.
|
The Company records and presents the fair values of all of its derivative assets and liabilities in its consolidated balance sheet on a gross basis as shown in the above table. However, the Company has derivative assets and liabilities of
$4.7 million
and
$0.3 million
, respectively, which are subject to master netting arrangements. If the Company were to offset and record the asset and liability balances for its derivative instruments on a net basis in accordance with the terms of its master netting arrangements, which provide for the right to setoff amounts for similar transactions denominated in the same currencies, derivative net assets and net liabilities as of
April 1, 2017
would be
$4.5 million
and
$0.2 million
, respectively. The Company's master netting arrangements do not require cash collateral to be pledged by the Company or its counterparties. The Company’s derivative financial instruments were not subject to master netting arrangements in prior fiscal years.
Changes in the fair value of the effective portion of the Company’s forward foreign currency exchange contracts that are designated as accounting hedges are recorded in equity as a component of accumulated other comprehensive income, and are reclassified from accumulated other comprehensive income into earnings when the items underlying the hedged transactions are recognized into earnings, as a component of cost of sales within the Company’s consolidated statements of operations and comprehensive income. The following table summarizes the impact of the effective portion of gains and losses on the forward contracts designated as hedges (in millions):
|
|
Fiscal Year Ended April 1, 2017
|
Fiscal Year Ended April 2, 2016
|
Fiscal Year Ended March 28, 2015
|
||||||||||||||||||||
|
|
Pre-Tax
Gain
Recognized
in OCI
|
Pre-tax Gain
Reclassified from
Accumulated OCI
into Earnings
|
Pre-Tax
Loss Recognized in OCI |
Pre-tax Gain
Reclassified from Accumulated OCI into Earnings |
Pre-Tax
Gain Recognized in OCI |
Pre-tax Gain
Reclassified from Accumulated OCI into Earnings |
|||||||||||||||||
|
Designated hedges
|
$
|
10.2
|
|
$
|
0.4
|
|
$
|
(25.2
|
)
|
$
|
10.9
|
|
$
|
36.6
|
|
$
|
2.1
|
|
|||||
Amounts related to ineffectiveness were not material during all periods presented. The Company expects that substantially all of the amounts currently recorded in accumulated other comprehensive loss will be reclassified into earnings during the next twelve months, based upon the timing of inventory purchases and turnover. These amounts are subject to fluctuations in the applicable currency exchange rates.
78
During Fiscal
2017
, Fiscal
2016
and
Fiscal 2015
, the Company recognized net gains of
$2.6 million
, losses of
$2.1 million
and gains of
$1.5 million
respectively, related to the change in the fair value of undesignated forward currency exchange contracts within foreign currency loss in the Company’s consolidated statements of operations and comprehensive income.
13. Shareholders’ Equity
Share Repurchase Program
On May 25, 2016, the Company's Board of Directors authorized a new
$1.0 billion
share repurchase program, which replaced the remaining balance of the previous share repurchase program authorized on October 30, 2014. During
Fiscal 2017
and
Fiscal 2016
, the Company repurchased
21,756,353
shares and
24,757,543
shares, respectively, at a cost of
$1.000 billion
and
$1.150 billion
, respectively, under its current share-repurchase program through open market transactions. As of
April 1, 2017
, the Company has fully utilized the previously authorized amount under the share repurchase program. On May 25, 2017, the Company's Board of Directors authorized a new
$1.000 billion
share repurchase program.
The Company also has in place a “withhold to cover” repurchase program, which allows the Company to withhold ordinary shares from certain executive officers to satisfy minimum tax withholding obligations relating to the vesting of their restricted share awards. During
Fiscal 2017
and
Fiscal 2016
, the Company withheld
100,552
shares and
54,875
shares, respectively, at a cost of
$4.8 million
and
$2.4 million
, respectively, in satisfaction of minimum tax withholding obligations relating to the vesting of restricted share awards.
14. Accumulated Other Comprehensive Loss
The following table details changes in the components of accumulated other comprehensive loss, net of taxes for Fiscal
2017
, Fiscal
2016
and Fiscal
2015
(in millions):
|
Foreign Currency
Translation
Losses
|
Net Gains
(Losses) on
Derivatives
|
Other comprehensive loss attributable to MKHL
|
Other comprehensive income attributable to noncontrolling interest
|
Total other comprehensive loss
|
|||||||||||||||
|
Balance at March 29, 2014
|
$
|
(4.8
|
)
|
$
|
(1.6
|
)
|
$
|
(6.4
|
)
|
$
|
—
|
|
$
|
(6.4
|
)
|
||||
|
Other comprehensive (loss) income before reclassifications
|
(91.3
|
)
|
32.8
|
|
(1)
|
(58.5
|
)
|
—
|
|
(58.5
|
)
|
||||||||
|
Less: amounts reclassified from AOCI to earnings
|
—
|
|
1.9
|
|
(2)
|
1.9
|
|
—
|
|
1.9
|
|
||||||||
|
Other comprehensive (loss) income, net of tax
|
(91.3
|
)
|
30.9
|
|
(1)
|
(60.4
|
)
|
—
|
|
(60.4
|
)
|
||||||||
|
Balance at March 28, 2015
|
(96.1
|
)
|
29.3
|
|
(66.8
|
)
|
—
|
|
(66.8
|
)
|
|||||||||
|
Other comprehensive income (loss) before reclassifications
|
18.4
|
|
(22.6
|
)
|
(1)
|
(4.2
|
)
|
0.1
|
|
(4.1
|
)
|
||||||||
|
Less: amounts reclassified from AOCI to earnings
|
—
|
|
9.9
|
|
(2)
|
9.9
|
|
—
|
|
9.9
|
|
||||||||
|
Other comprehensive income (loss), net of tax
|
18.4
|
|
(32.5
|
)
|
(14.1
|
)
|
0.1
|
|
(14.0
|
)
|
|||||||||
|
Balance at April 2, 2016
|
(77.7
|
)
|
(3.2
|
)
|
(1)
|
(80.9
|
)
|
0.1
|
|
(80.8
|
)
|
||||||||
|
Other comprehensive (loss) income before reclassifications
|
(8.4
|
)
|
(3)
|
9.0
|
|
(1)
|
0.6
|
|
(0.4
|
)
|
0.2
|
|
|||||||
|
Less: amounts reclassified from AOCI to earnings
|
—
|
|
0.3
|
|
(2)
|
0.3
|
|
—
|
|
0.3
|
|
||||||||
|
Other comprehensive (loss) income, net of tax
|
(8.4
|
)
|
8.7
|
|
0.3
|
|
(0.4
|
)
|
(0.1
|
)
|
|||||||||
|
Balance at April 1, 2017
|
$
|
(86.1
|
)
|
$
|
5.5
|
|
(1)
|
$
|
(80.6
|
)
|
$
|
(0.3
|
)
|
$
|
(80.9
|
)
|
|||
|
(1)
|
Accumulated other comprehensive income related to net gains (losses) on derivative financial instruments is net of a tax provision (benefit) of
$0.8 million
,
$(0.3) million
and
$3.3 million
, respectively, as of
April 1, 2017
,
April 2, 2016
and
March 28, 2015
. Other comprehensive income (loss) before reclassifications related to derivative instruments for Fiscal
2017
, Fiscal
2016
, and Fiscal
2015
is net of a tax provision (benefit) of
$1.2 million
,
$(2.6) million
and
$3.7 million
, respectively.
|
79
|
(2)
|
Reclassified amounts relate to the Company’s forward foreign currency exchange contracts for inventory purchases and are recorded within cost of goods sold in the Company’s consolidated statements of operations and comprehensive income. The amount reclassified from other comprehensive income for Fiscal
2016
is net of a tax provision of
$1.0 million
. The tax effects related to other fiscal years were not material.
|
|
(3)
|
Foreign currency translation losses for Fiscal
2017
include net losses of
$2.4 million
on intra-entity transactions that are of a long-term investment nature.
|
15. Share-Based Compensation
The Company issues equity grants to certain employees and directors of the Company at the discretion of the Company’s Compensation and Talent Committee. The Company has
two
equity plans,
one
adopted in Fiscal 2008, the Michael Kors (USA), Inc. Stock Option Plan (as amended and restated, the “2008 Plan”), and the other adopted in the third fiscal quarter of Fiscal 2012 and amended and restated with shareholder approval in May 2015, the Michael Kors Holdings Limited Amended and Restated Omnibus Incentive Plan (the “Incentive Plan”). The 2008 Plan only provided for grants of share options and was authorized to issue up to
23,980,823
ordinary shares. As of
April 1, 2017
, there were
no
shares available to grant equity awards under the 2008 Plan. The Incentive Plan allows for grants of share options, restricted shares and restricted share units, and other equity awards, and authorizes a total issuance of up to
15,246,000
ordinary shares. At
April 1, 2017
, there were
8,770,441
ordinary shares available for future grants of equity awards under the Incentive Plan. Option grants issued from the 2008 Plan generally expire
ten years
from the date of the grant, and those issued under the Incentive Plan generally expire
seven years
from the date of the grant.
Share Options
Share options are generally exercisable at no less than the fair market value on the date of grant. The Company has issued
two
types of option grants, those that vest based on the attainment of a performance target and those that vest based on the passage of time. Under the 2008 Plan, performance-based share options may vest based upon the attainment of one of
two
performance measures. One performance measure is a divisional performance target and the other measure is a company-wide performance target, which is based on a cumulative minimum growth requirement in consolidated net equity. The individual performance target vests
20%
of the total option grant each year the target is satisfied. The individual has
ten years
in which to achieve
five
individual performance vesting tranches. The company-wide performance target must be achieved over the
ten
-year term. Performance is measured at the end of the term, and any unvested options vest if the target is achieved. The Company-wide performance target is established at the time of the grant. The target metrics underlying individual performance vesting requirements are established for each recipient each year up until such time as the grant is fully vested. Under the Incentive Plan, options subject to time-based vesting requirements become vested in
four
equal increments on each of the four anniversaries of the date on of grant.
The following table summarizes the share options activity during Fiscal
2017
, and information about options outstanding at
April 1, 2017
:
|
Number of
Options
|
Weighted
Average
Exercise price
|
Weighted
Average
Remaining
Contractual
Life (years)
|
Aggregate
Intrinsic
Value
(in millions)
|
|||||||||
|
Outstanding at April 2, 2016
|
5,820,413
|
|
$
|
28.41
|
|
|||||||
|
Granted
|
177,666
|
|
$
|
49.88
|
|
|||||||
|
Exercised
|
(794,482
|
)
|
$
|
10.49
|
|
|||||||
|
Canceled/forfeited
|
(412,552
|
)
|
$
|
70.62
|
|
|||||||
|
Outstanding at April 1, 2017
|
4,791,045
|
|
$
|
28.55
|
|
3.29
|
$
|
88.6
|
|
|||
|
Vested or expected to vest at April 1, 2017
|
4,774,511
|
|
$
|
28.55
|
|
3.29
|
||||||
|
Vested and exercisable at April 1, 2017
|
3,909,592
|
|
$
|
21.60
|
|
2.95
|
$
|
86.8
|
|
|||
There were
881,453
unvested options and
3,909,592
vested options outstanding at
April 1, 2017
. The total intrinsic value of options exercised during Fiscal
2017
and Fiscal
2016
was
$30.5 million
and
$70.3 million
, respectively. The cash received from options exercised during Fiscal
2017
and Fiscal
2016
was
$8.3 million
and
$12.7 million
, respectively. As of
April 1, 2017
, the remaining unrecognized share-based compensation expense for nonvested share options was
$9.2 million
, which is expected to be recognized over the related weighted-average period of approximately
1.71 years
.
80
The weighted average grant date fair value for options granted during Fiscal
2017
, Fiscal
2016
and Fiscal
2015
, was
$13.79
,
$14.35
and
$27.96
, respectively. The following table represents assumptions used to estimate the fair value of options:
|
|
Fiscal Years Ended
|
|||||||
|
|
April 1,
2017 |
April 2,
2016 |
March 28,
2015 |
|||||
|
Expected dividend yield
|
0.0
|
%
|
0.0
|
%
|
0.0
|
%
|
||
|
Volatility factor
|
30.1
|
%
|
31.1
|
%
|
33.2
|
%
|
||
|
Weighted average risk-free interest rate
|
1.1
|
%
|
1.6
|
%
|
1.5
|
%
|
||
|
Expected life of option
|
4.75 years
|
|
4.75 years
|
|
4.75 years
|
|
||
Restricted Shares and Restricted Share Units
The Company grants restricted shares and restricted share units at the fair market value on the date of the grant. Expense for restricted share awards is based on the closing market price of the Company’s shares on the date of grant and is recognized ratably over the vesting period net of expected forfeitures.
Restricted share grants generally vest in equal increments on each of the
four
anniversaries of the date of grant. In addition, the Company grants
two
types of restricted share unit (“RSU”) awards: time-based RSUs and performance-based RSUs. Time-based RSUs generally vest in full either on the first anniversary of the date of grant for our independent directors, or in equal increments on each of the
four
anniversaries of the date of grant. Performance-based RSUs vest in full on the
three
-year anniversary of the date of grant, subject to the employee’s continued employment during the vesting period and only if certain pre-established cumulative performance targets are met at the end of the
three
-year performance period. Expense related to performance-based RSUs is recognized ratably over the
three
-year performance period, net of forfeitures, based on the probability of attainment of the related performance targets. The potential number of shares that may be earned ranges from
0%
, if the minimum level of performance is not attained, to
150%
, if the level of performance is at or above the predetermined maximum achievement level.
The following table summarizes restricted share activity during Fiscal
2017
:
|
|
Restricted Shares
|
|||||
|
|
Number of Unvested
Restricted Shares
|
Weighted
Average Grant
Date Fair Value
|
||||
|
Unvested at April 2, 2016
|
390,229
|
|
$
|
82.38
|
|
|
|
Granted
|
—
|
|
$
|
—
|
|
|
|
Vested
|
(139,759
|
)
|
$
|
79.46
|
|
|
|
Canceled/forfeited
|
(65,045
|
)
|
$
|
83.71
|
|
|
|
Unvested at April 1, 2017
|
185,425
|
|
$
|
84.12
|
|
|
The total fair value of restricted shares vested was
$6.7 million
,
$14.4 million
and
$22.8 million
during Fiscal
2017
, Fiscal
2016
and Fiscal
2015
, respectively. As of
April 1, 2017
, the remaining unrecognized share-based compensation expense for non-vested restricted share grants was
$8.5 million
, which is expected to be recognized over the related weighted-average period of approximately
1.16 years
.
The following table summarizes the RSU activity during Fiscal
2017
:
|
|
Service-based
|
Performance-based
|
|||||||||||
|
|
Number of
Restricted
Share Units
|
Weighted
Average Grant
Date Fair Value
|
Number of
Restricted
Share Units
|
Weighted
Average Grant
Date Fair Value
|
|||||||||
|
Unvested at April 2, 2016
|
1,071,058
|
|
$
|
47.13
|
|
579,774
|
|
$
|
61.84
|
|
|||
|
Granted
|
907,149
|
|
$
|
49.27
|
|
98,237
|
|
$
|
49.88
|
|
|||
|
Increase due to performance condition
|
—
|
|
$
|
—
|
|
80,093
|
|
$
|
62.24
|
|
|||
|
Vested
|
(278,643
|
)
|
$
|
47.62
|
|
(240,278
|
)
|
$
|
62.24
|
|
|||
|
Canceled/forfeited
|
(228,797
|
)
|
$
|
46.92
|
|
(116,049
|
)
|
$
|
62.73
|
|
|||
|
Unvested at April 1, 2017
|
1,470,767
|
|
$
|
48.39
|
|
401,777
|
|
$
|
58.50
|
|
|||
81
The total fair value of service-based RSUs vested during Fiscal
2017
, Fiscal
2016
and Fiscal
2015
was
$13.7 million
,
$1.1 million
and
$0.4 million
, respectively. As of
April 1, 2017
, the remaining unrecognized share-based compensation expense for non-vested service-based and performance-based RSU grants was
$54.0 million
and
$0.5 million
, respectively, which is expected to be recognized over the related weighted-average periods of approximately
2.70 years
and
0.22 years
, respectively.
Share-Based Compensation Expense
The following table summarizes compensation expense attributable to share-based compensation for Fiscal
2017
, Fiscal
2016
and Fiscal
2015
(in millions):
|
Fiscal Years Ended
|
|||||||||||
|
April 1,
2017 |
April 2,
2016 |
March 28,
2015 |
|||||||||
|
Share-based compensation expense
|
$
|
33.9
|
|
$
|
48.4
|
|
$
|
48.9
|
|
||
|
Tax benefits related to share-based compensation expense
|
$
|
11.2
|
|
$
|
15.7
|
|
$
|
17.5
|
|
||
Forfeitures are estimated at the time of grant and revised, if necessary, in subsequent periods if actual forfeitures differ from those estimates. The Company estimates forfeitures based on its historical forfeiture rate to date. The estimated value of future forfeitures for equity grants as of
April 1, 2017
is approximately
$1.8 million
.
16. Taxes
On October 29, 2014, the Company's Board of Directors approved a proposal to move the Company’s principal executive office from Hong Kong to the United Kingdom ("U.K.") and to become a U.K. tax resident. The Company will remain incorporated in the British Virgin Islands. The Company has achieved tremendous international growth over the past several years and believes that moving its principal executive office to the U.K. will better position it for further expansion in Europe and internationally, and allow it to compete more effectively with other international luxury brands.
MKHL’s subsidiaries are subject to taxation in the U.S. and various other foreign jurisdictions, which are aggregated in the “Non-U.S.” information captioned below.
Income before provision for income taxes consisted of the following (in millions):
|
|
Fiscal Years Ended
|
||||||||||
|
|
April 1,
2017 |
April 2,
2016 |
March 28,
2015 |
||||||||
|
U.S.
|
$
|
228.4
|
|
$
|
737.5
|
|
$
|
814.3
|
|
||
|
Non-U.S.
|
460.2
|
|
434.8
|
|
441.5
|
|
|||||
|
Total income before provision for income taxes
|
$
|
688.6
|
|
$
|
1,172.3
|
|
$
|
1,255.8
|
|
||
82
The provision for income taxes was as follows (in millions):
|
|
Fiscal Years Ended
|
||||||||||
|
|
April 1,
2017 |
April 2,
2016 |
March 28,
2015 |
||||||||
|
Current
|
|||||||||||
|
U.S. Federal
|
$
|
131.2
|
|
$
|
268.0
|
|
$
|
277.0
|
|
||
|
U.S. State
|
20.4
|
|
14.3
|
|
49.7
|
|
|||||
|
Non-U.S.
|
45.8
|
|
54.2
|
|
41.9
|
|
|||||
|
Total current
|
197.4
|
|
336.5
|
|
368.6
|
|
|||||
|
Deferred
|
|||||||||||
|
U.S. Federal
|
(34.1
|
)
|
0.3
|
|
5.0
|
|
|||||
|
U.S. State
|
(5.0
|
)
|
1.0
|
|
0.3
|
|
|||||
|
Non-U.S.
|
(21.2
|
)
|
(3.2
|
)
|
0.9
|
|
|||||
|
Total deferred
|
(60.3
|
)
|
(1.9
|
)
|
6.2
|
|
|||||
|
Total provision for income taxes
|
$
|
137.1
|
|
$
|
334.6
|
|
$
|
374.8
|
|
||
The Company's provision for income taxes for the years ended
April 1, 2017
,
April 2, 2016
and
March 28, 2015
was different from the amount computed by applying statutory U.K. or U.S. federal income tax rates to the underlying income from continuing operations before income taxes and equity in net income of affiliates as a result of the following:
|
|
Fiscal Years Ended
|
|||||||
|
|
April 1,
2017 |
April 2,
2016 |
March 28,
2015 |
|||||
|
Provision for income taxes at the U.K. (2017), U.S. (2015-2016) statutory tax rate
|
20.0
|
%
|
35.0
|
%
|
35.0
|
%
|
||
|
State and local income taxes, net of federal benefit
|
1.3
|
%
|
1.2
|
%
|
2.4
|
%
|
||
|
Effects of global financing arrangements
|
(13.7
|
)%
|
(2.8
|
)%
|
(2.8
|
)%
|
||
|
Differences in tax effects on foreign income
|
11.1
|
%
|
(5.1
|
)%
|
(5.4
|
)%
|
||
|
Foreign tax credit
|
0.3
|
%
|
(0.2
|
)%
|
(0.4
|
)%
|
||
|
Liability for uncertain tax positions
|
—
|
%
|
—
|
%
|
0.2
|
%
|
||
|
Effect of changes in valuation allowances on deferred tax assets
|
0.5
|
%
|
(0.2
|
)%
|
(0.1
|
)%
|
||
|
Other
|
0.4
|
%
|
0.6
|
%
|
0.9
|
%
|
||
|
Effective tax rate
|
19.9
|
%
|
28.5
|
%
|
29.8
|
%
|
||
83
Significant components of the Company’s deferred tax assets (liabilities) consist of the following (in millions):
|
Fiscal Years Ended
|
|||||||
|
April 1,
2017 |
April 2,
2016 |
||||||
|
Deferred tax assets
|
|||||||
|
Inventories
|
$
|
9.0
|
|
$
|
10.5
|
|
|
|
Payroll related accruals
|
2.2
|
|
2.2
|
|
|||
|
Deferred rent
|
39.5
|
|
37.1
|
|
|||
|
Net operating loss carryforwards
|
17.7
|
|
3.4
|
|
|||
|
Stock compensation
|
26.2
|
|
30.0
|
|
|||
|
Sales allowances
|
10.0
|
|
13.4
|
|
|||
|
Other
|
14.7
|
|
12.1
|
|
|||
|
119.3
|
|
108.7
|
|
||||
|
Valuation allowance
|
(7.2
|
)
|
(3.4
|
)
|
|||
|
Total deferred tax assets
|
112.1
|
|
105.3
|
|
|||
|
Deferred tax liabilities
|
|||||||
|
Goodwill and intangibles
|
(112.3
|
)
|
(32.9
|
)
|
|||
|
Depreciation
|
(2.7
|
)
|
(48.0
|
)
|
|||
|
Other
|
(3.8
|
)
|
(3.4
|
)
|
|||
|
Total deferred tax liabilities
|
(118.8
|
)
|
(84.3
|
)
|
|||
|
Net deferred tax assets (liabilities)
|
$
|
(6.7
|
)
|
$
|
21.0
|
|
|
The Company maintains valuation allowances on deferred tax assets applicable to subsidiaries in jurisdictions for which separate income tax returns are filed and where realization of the related deferred tax assets from future profitable operations is not reasonably assured. Deferred tax valuation allowances increased approximately
$4.4 million
,
$3.3 million
and
$0.2 million
in Fiscal
2017
, Fiscal
2016
and Fiscal
2015
, respectively. As a result of the attainment and expectation of achieving profitable operations in certain countries comprising the Company’s European operations, for which deferred tax valuation allowances had been previously established, the Company released valuation allowances amounting to approximately
$0.6 million
,
$5.6 million
and
$2.6 million
in Fiscal
2017
, Fiscal
2016
and Fiscal
2015
, respectively.
At
April 1, 2017
, the Company had non-U.S. net operating loss carryforwards of approximately
$85.8 million
that will begin to expire in
2018
.
As of
April 1, 2017
and
April 2, 2016
, the Company has liabilities related to its uncertain tax positions, including accrued interest, of approximately
$29.1 million
and
$18.5 million
, respectively, which are included in other long-term liabilities in the Company’s audited consolidated balance sheets.
The total amount of unrecognized tax benefits that, if recognized, would impact the effective tax rate was approximately
$26.5 million
,
$16.8 million
and
$19.9 million
as of
April 1, 2017
,
April 2, 2016
and
March 28, 2015
, respectively. A reconciliation of the beginning and ending amounts of unrecognized tax benefits, excluding accrued interest, for Fiscal
2017
, Fiscal
2016
and Fiscal
2015
, are presented below (in millions):
|
Fiscal Years Ended
|
|||||||||||
|
April 1,
2017 |
April 2,
2016 |
March 28,
2015 |
|||||||||
|
Unrecognized tax benefits beginning balance
|
$
|
16.8
|
|
$
|
19.9
|
|
$
|
18.1
|
|
||
|
Additions related to prior period tax positions
|
1.7
|
|
—
|
|
0.4
|
|
|||||
|
Additions related to current period tax positions
|
10.3
|
|
5.8
|
|
5.2
|
|
|||||
|
Decreases from prior period positions
|
(2.3
|
)
|
(5.7
|
)
|
(3.8
|
)
|
|||||
|
Decreases related to audit settlements
|
—
|
|
(3.2
|
)
|
—
|
|
|||||
|
Unrecognized tax benefits ending balance
|
$
|
26.5
|
|
$
|
16.8
|
|
$
|
19.9
|
|
||
84
The Company classifies interest expense and penalties related to unrecognized tax benefits as components of the provision for income taxes. Interest expense recognized in the consolidated statements of operations and comprehensive income for Fiscal
2017
, Fiscal
2016
and Fiscal
2015
was approximately
$2.5 million
,
$1.7 million
and
$1.3 million
, respectively.
The total amount of unrecognized tax benefits relating to the Company’s tax positions is subject to change based on future events including, but not limited to, the settlements of ongoing tax audits and assessments and the expiration of applicable statutes of limitations. The Company anticipates that the balance of gross unrecognized tax benefits, excluding interest and penalties, will be reduced by approximately
$0.7 million
during the next twelve months. However, the outcomes and timing of such events are highly uncertain and changes in the occurrence, expected outcomes, and timing of such events could cause the Company’s current estimate to change materially in the future.
The Company files income tax returns in the U.S., for federal, state, and local purposes, and in certain foreign jurisdictions. With few exceptions, the Company is no longer subject to examinations by the relevant tax authorities for years prior to its fiscal year ended March 30, 2014.
The Company’s policy with respect to its undistributed earnings of the U.S. and non-U.S. subsidiaries is to consider those earnings to be either indefinitely reinvested or able to be repatriated tax-neutral. Undistributed earnings of subsidiaries considered to be either indefinitely reinvested or able to be repatriated tax-neutral amounted to
$2.711 billion
at
April 1, 2017
. Determination of the amount of unrecognized deferred U.S. and non-U.S. income tax liability on those earnings which are indefinitely reinvested is not practicable.
17. Retirement Plans
The Company maintains defined contribution plans for employees, who become eligible to participate after
three months
of service. Features of these plans allow participants to contribute to a plan a percentage of their compensation, up to statutory limits depending upon the country in which a plan operates, and provide for mandatory and/or discretionary matching contributions by the Company, which vary by country. During Fiscal
2017
, Fiscal
2016
, and Fiscal
2015
, the Company recognized expenses of approximately
$9.1 million
,
$10.1 million
, and
$5.8 million
, respectively, related to these retirement plans.
18. Segment Information
The Company operates its business through
three
operating segments—Retail, Wholesale and Licensing—which are based on its business activities and organization. The operating segments are segments of the Company for which separate financial information is available and for which operating results are evaluated regularly by the Company's chief operating decision maker in deciding how to allocate resources, as well as in assessing performance. The primary key performance indicators are net sales or revenue (in the case of Licensing) and operating income for each segment. The Company’s reportable segments represent channels of distribution that offer similar merchandise, customer experience and sales/marketing strategies. The Company’s Retail segment includes sales through the Company owned stores, including “Collection,” “Lifestyle” including “concessions,” and outlet stores located throughout the Americas (U.S., Canada and Latin America, excluding Brazil), Europe, and Asia, as well as the Company’s e-commerce sales. Products sold through the Retail segment include women’s apparel, accessories (which include handbags and small leather goods such as wallets), men's apparel, footwear and licensed products, such as watches, jewelry, fragrances and beauty, and eyewear. The Wholesale segment includes sales primarily to major department stores and specialty shops throughout the Americas, Europe and Asia. Products sold through the Wholesale segment include accessories (which include handbags and small leather goods such as wallets), footwear and women’s and men’s apparel. We also have wholesale arrangements pursuant to which we sell products to our geographic licensees. The Licensing segment includes royalties earned on licensed products and use of the Company’s trademarks, and rights granted to third parties for the right to operate retail stores and/or sell the Company’s products in certain geographic regions such as Brazil, the Middle East, Eastern Europe, certain parts of Asia and Australia. All intercompany revenues are eliminated in consolidation and are not reviewed when evaluating segment performance. Corporate overhead expenses are allocated to the segments based upon specific usage or other allocation methods.
The Company has allocated
$25.9 million
,
$91.9 million
and
$1.9 million
of its recorded
$119.7 million
goodwill as of
April 1, 2017
to its Wholesale, Retail and Licensing segments, respectively. See
Note 3
for goodwill recorded upon the Company's acquisition of MKHKL during Fiscal 2017. As of
April 2, 2016
, the Company's goodwill balance of
$23.2 million
was allocated
$13.3 million
,
$8.0 million
and
$1.9 million
to its Wholesale, Retail, and Licensing segments, respectively. The Company does not have identifiable assets separated by segment.
85
The following table presents the key performance information of the Company’s reportable segments (in millions):
|
|
Fiscal Years Ended
|
||||||||||
|
|
April 1,
2017 |
April 2,
2016 |
March 28,
2015 |
||||||||
|
Revenue:
|
|||||||||||
|
Net sales: Retail
|
$
|
2,572.1
|
|
$
|
2,394.9
|
|
$
|
2,134.6
|
|
||
|
Wholesale
|
1,775.8
|
|
2,143.9
|
|
2,065.1
|
|
|||||
|
Licensing
|
145.8
|
|
173.3
|
|
171.8
|
|
|||||
|
Total revenue
|
$
|
4,493.7
|
|
$
|
4,712.1
|
|
$
|
4,371.5
|
|
||
|
Income from operations:
|
|||||||||||
|
Retail
|
$
|
159.8
|
|
$
|
501.4
|
|
$
|
557.2
|
|
||
|
Wholesale
|
468.1
|
|
584.1
|
|
610.9
|
|
|||||
|
Licensing
|
62.0
|
|
89.6
|
|
88.9
|
|
|||||
|
Income from operations
|
$
|
689.9
|
|
$
|
1,175.1
|
|
$
|
1,257.0
|
|
||
Depreciation and amortization expense for each segment are as follows (in millions):
|
|
Fiscal Years Ended
|
||||||||||
|
|
April 1,
2017 |
April 2,
2016 |
March 28,
2015 |
||||||||
|
Depreciation and amortization
(1)
:
|
|||||||||||
|
Retail
|
$
|
156.1
|
|
$
|
114.5
|
|
$
|
84.5
|
|
||
|
Wholesale
|
61.6
|
|
67.3
|
|
53.0
|
|
|||||
|
Licensing
|
2.1
|
|
1.4
|
|
0.9
|
|
|||||
|
Total depreciation and amortization
|
$
|
219.8
|
|
$
|
183.2
|
|
$
|
138.4
|
|
||
|
(1)
|
Excluded from the above table are impairment charges, which are detailed in the below table and in Notes 6, 7 and 11.
|
The following table presents the Company's impairment charges by asset type (in millions):
|
|
Fiscal Years Ended
|
||||||||||
|
|
April 1,
2017 |
April 2,
2016 |
March 28,
2015 |
||||||||
|
Impairment Charges:
|
|||||||||||
|
Retail
|
$
|
198.7
|
|
$
|
8.6
|
|
$
|
0.8
|
|
||
|
Wholesale
|
0.5
|
|
0.4
|
|
—
|
|
|||||
|
Corporate assets
|
—
|
|
1.9
|
|
—
|
|
|||||
|
Total impairment
|
$
|
199.2
|
|
$
|
10.9
|
|
$
|
0.8
|
|
||
Total revenue (based on country of origin) and long-lived assets by geographic location are as follows (in millions):
|
|
Fiscal Years Ended
|
||||||||||
|
|
April 1,
2017 |
April 2,
2016 |
March 28,
2015 |
||||||||
|
Revenue:
|
|||||||||||
|
The Americas (U.S., Canada and Latin America)
(1)
|
$
|
3,140.7
|
|
$
|
3,506.6
|
|
$
|
3,418.9
|
|
||
|
Europe
|
943.9
|
|
990.3
|
|
884.7
|
|
|||||
|
Asia
|
409.1
|
|
215.2
|
|
67.9
|
|
|||||
|
Total revenue
|
$
|
4,493.7
|
|
$
|
4,712.1
|
|
$
|
4,371.5
|
|
||
86
|
|
As of
|
||||||||||
|
|
April 1,
2017 |
April 2,
2016 |
March 28,
2015 |
||||||||
|
Long-lived assets:
|
|||||||||||
|
The Americas (U.S., Canada and Latin America)
(1)
|
$
|
356.1
|
|
$
|
507.7
|
|
$
|
443.8
|
|
||
|
Europe
|
197.7
|
|
284.2
|
|
169.2
|
|
|||||
|
Asia
|
455.8
|
|
33.7
|
|
11.4
|
|
|||||
|
Total Long-lived assets:
|
$
|
1,009.6
|
|
$
|
825.6
|
|
$
|
624.4
|
|
||
|
(1)
|
Net revenues earned in the U.S. during Fiscal
2017
, Fiscal
2016
, and Fiscal
2015
were
$2.935 billion
,
$3.304 billion
and
$3.228 billion
, respectively. Long-lived assets located in the U.S. as of
April 1, 2017
and
April 2, 2016
were
$328.8 million
and
$472.2 million
, respectively.
|
Net sales by major product category are as follows (in millions):
|
|
Fiscal Years Ended
|
||||||||||||||||||
|
|
April 1,
2017 |
% of
Total
|
April 2,
2016 |
% of
Total
|
March 28,
2015 |
% of
Total
|
|||||||||||||
|
Accessories
|
$
|
3,061.4
|
|
70.4%
|
$
|
3,179.7
|
|
70.1
|
%
|
$
|
2,872.2
|
|
68.4
|
%
|
|||||
|
Apparel
|
543.2
|
|
12.5%
|
543.7
|
|
12.0
|
%
|
549.4
|
|
13.1
|
%
|
||||||||
|
Footwear
|
462.0
|
|
10.6%
|
491.0
|
|
10.8
|
%
|
444.1
|
|
10.5
|
%
|
||||||||
|
Licensed product
|
281.3
|
|
6.5%
|
324.4
|
|
7.1
|
%
|
334.0
|
|
8.0
|
%
|
||||||||
|
Net sales
|
$
|
4,347.9
|
|
$
|
4,538.8
|
|
$
|
4,199.7
|
|
||||||||||
19. Related Party Transactions
The Company’s Chief Creative Officer, Michael Kors, and the Company’s Chief Executive Officer, John Idol, and certain of the Company’s former shareholders, including Sportswear Holdings Limited, jointly owned Michael Kors Far East Holdings Limited, a BVI company, prior to the Company's acquisition of MKHKL on May 31, 2016, which eliminated their ownership interests. On April 1, 2011, the Company entered into certain licensing agreements with certain subsidiaries of Michael Kors Far East Holdings Limited, including MKHKL, (the “Licensees”), which provided the Licensees with certain exclusive rights for use of the Company’s trademarks within China, Hong Kong, Macau and Taiwan, and to import, sell, advertise and promote certain of the Company’s products in these regions, as well as to own and operate stores bearing the Company’s tradenames. The agreements between the Company and the Licensees were scheduled to expire on
March 31, 2041
, and could be terminated by the Company at certain intervals if minimum sales benchmarks are not met. Royalties earned under these agreements were approximately
$1.2 million
during the two months ended May 31, 2016 preceding the acquisition, and were approximately
$7.6 million
and
$4.7 million
, respectively, during
Fiscal 2016
and
Fiscal 2015
. These royalties were driven by Licensee adjusted net sales of the Company’s goods, as defined in the licensing agreement, to their customers of approximately
$28.9 million
during the two months ended May 31, 2016 preceding the acquisition, and approximately
$169.8 million
and
$103.7 million
, respectively during
Fiscal 2016
and
Fiscal 2015
. In addition, the Company sold certain inventory items to the Licensees through its wholesale segment at terms consistent with those of similar licensees in the region. During the two months ended May 31, 2016 preceding the acquisition, amounts recognized as net sales in the Company’s consolidated statement of operations and comprehensive income related to these sales were approximately
$7.9 million
, and were
$62.8 million
and
$35.3 million
, respectively, in
Fiscal 2016
and
Fiscal 2015
. As of
April 2, 2016
, the Company’s total accounts receivable from this related party was
$16.1 million
. Please refer to Note 3 for additional information relating to the Company's acquisition of MKHKL on May 31, 2016.
The Company’s balance sheet as of
April 2, 2016
reflects a
$1.0 million
long-term loan between EBISA, the Company’s partner in the MK Panama joint venture, and Rosales Development Corp. There is a family relationship between EBISA and Rosales Development Corp. The loan was initiated on November 25, 2014 with an annual rate of interest of
5.0%
and was fully repaid during Fiscal 2017.
A former executive officer of the Company (who is no longer a related party as of October 31, 2016) is married to an employee of one of the Company's suppliers of fixtures for its shop-in-shops, retail stores and showrooms. Purchases from this supplier, while deemed to be a related party, were
$1.7 million
,
$3.4 million
and
$1.5 million
during
Fiscal 2017
,
Fiscal 2016
and
Fiscal 2015
, respectively. As of
April 2, 2016
, accounts payable to this supplier were immaterial.
On October 24, 2014, the Company purchased an aircraft from a former board member (who resigned on September 10,
87
2014) in the amount of
$16.5 million
. The purchase price was the fair market value of the aircraft at the purchase date and was no less favorable to the Company than it would have received in an arm’s-length transaction. The aircraft was purchased for purposes of business travel for the Company’s executives and was recorded as a fixed asset in the Company’s consolidated balance sheets. Prior to the purchase of this plane, the Company or its Chief Executive Officer arranged for a plane owned by Sportswear Holdings Limited or its affiliates, which was used for the Company’s directors and senior management for purposes of business travel on terms and conditions not less favorable to the Company than it would receive in an arm’s-length transaction with a third party. To the extent the Company’s Chief Executive Officer entered into such an arrangement for business travel, the Company reimbursed him for the actual market price paid for the use of such plane. The Company chartered this plane from Sportswear Holdings Limited for business purposes, the amounts of which were paid in cash and charged to operating expenses. The Company was charged
$1.4 million
in connection with these services during Fiscal 2015.
The Company purchases certain inventory from a manufacturer owned by one of its former directors (who resigned on September 10, 2014). Amounts purchased from this manufacturer during Fiscal
2015
were approximately
$9.1 million
.
20. Selected Quarterly Financial Information (Unaudited)
The following table summarizes the Fiscal
2017
and Fiscal
2016
quarterly results (dollars in millions):
|
|
Fiscal Quarter Ended
|
|||||||||||||||
|
|
July 2,
2016 |
October 1,
2016 |
December 31,
2016 |
April 1,
2017 |
||||||||||||
|
Fiscal 2017
|
||||||||||||||||
|
Total revenue
|
$
|
987.9
|
|
$
|
1,088.2
|
|
$
|
1,352.8
|
|
$
|
1,064.8
|
|
||||
|
Gross profit
|
$
|
591.3
|
|
$
|
644.7
|
|
$
|
805.7
|
|
$
|
619.7
|
|
||||
|
Income (loss) from operations
(1)
|
$
|
186.9
|
|
$
|
203.7
|
|
$
|
341.9
|
|
$
|
(42.6
|
)
|
||||
|
Net income (loss)
|
$
|
146.3
|
|
$
|
160.7
|
|
$
|
271.3
|
|
$
|
(26.8
|
)
|
||||
|
Net income (loss) attributable to MKHL
|
$
|
147.1
|
|
$
|
160.9
|
|
$
|
271.3
|
|
$
|
(26.8
|
)
|
||||
|
Weighted average ordinary shares outstanding:
|
||||||||||||||||
|
Basic
|
174,158,571
|
|
166,695,631
|
|
163,148,597
|
|
159,944,132
|
|
||||||||
|
Diluted
|
176,613,751
|
|
168,839,967
|
|
165,214,045
|
|
161,827,486
|
|
||||||||
|
Fiscal Quarter Ended
|
||||||||||||||||
|
June 27,
2015 |
September 26,
2015 |
December 26,
2015 |
April 2,
2016 |
(2)
|
||||||||||||
|
Fiscal 2016
|
||||||||||||||||
|
Total revenue
|
$
|
986.0
|
|
$
|
1,130.0
|
|
$
|
1,397.4
|
|
$
|
1,198.7
|
|
||||
|
Gross profit
|
$
|
603.6
|
|
$
|
664.4
|
|
$
|
832.0
|
|
$
|
697.2
|
|
||||
|
Income from operations
|
$
|
248.6
|
|
$
|
273.1
|
|
$
|
409.3
|
|
$
|
244.1
|
|
(3)
|
|||
|
Net income
|
$
|
174.4
|
|
$
|
192.8
|
|
$
|
294.2
|
|
$
|
176.3
|
|
||||
|
Net income attributable to MKHL
|
$
|
174.4
|
|
$
|
193.1
|
|
$
|
294.6
|
|
$
|
177.0
|
|
||||
|
Weighted average ordinary shares outstanding:
|
||||||||||||||||
|
Basic
|
196,977,021
|
|
188,857,398
|
|
182,176,452
|
|
177,814,521
|
|
||||||||
|
Diluted
|
200,054,494
|
|
191,524,156
|
|
184,851,616
|
|
180,439,102
|
|
||||||||
|
(1)
|
Fiscal quarter ended July 2, 2016 contains
$11.3 million
in transaction costs related to the acquisition of the previously licensed Greater China business, fiscal quarter ended October 1, 2016 contains
$4.9 million
in retail fixed asset impairment charges; fiscal quarter ended December 31, 2016 contains
$0.5 million
in wholesale fixed asset impairment charges; fiscal quarter ended
April 1, 2017
contains
$193.8 million
in retail long-lived asset impairment charges.
|
|
(2)
|
Fiscal quarter ended
April 2, 2016
contains 14 weeks, whereas all other fiscal quarters presented contain 13 weeks.
|
|
(3)
|
Fiscal quarter ended
April 2, 2016
contains
$10.9 million
in impairment charges, as well as a
$3.7 million
gain as a result of the MK Korea acquisition.
|
88
21. Subsequent Events
On May 31, 2017,
the Company announced that it plans to close between
100
and
125
of its full-price retail stores over the next two years, in order to to improve the profitability of its retail store fleet. Over this time period, the Company expects to incur approximately
$100
-
$125
million of one-time costs associated with these store closures. Collectively, the Company anticipates ongoing annual savings of approximately
$60
million as a result of store closures and the lower depreciation and amortization expense associated with the impairment charges recorded during Fiscal 2017 (please refer to Notes 11 and 18 for additional information).
89
TABLE OF CONTENTS
Part IItem 1. BusinessItem 1A. Risk FactorsItem 1B. Unresolved Staff CommentsItem 2. PropertiesItem 3. Legal ProceedingsItem 4. Mine Safety DisclosuresPart IIItem 5. Market For Registrant S Common Equity, Related Stockholder Matters and Issuer Purchases Of Equity SecuritiesItem 6. Selected Financial DataItem 7. Management S Discussion and Analysis Of Financial Condition and Results Of OperationsItem 7A. Quantitative and Qualitative Disclosures About Market RiskItem 8. Financial Statements and Supplementary DataItem 9. Changes in and Disagreements with Accountants on Accounting and Financial DisclosureItem 9A. Controls and ProceduresItem 9B. Other InformationPart IIIItem 10. Directors, Executive Officers and Corporate GovernanceItem 11. Executive CompensationItem 12. Security Ownership Of Certain Beneficial Owners and Management and Related Stockholder MattersItem 13. Certain Relationships, Related Transactions and Director IndependenceItem 14. Principal Accountant Fees and ServicesPart IVItem 15. Exhibits and Financial Statement Schedules