CRAWFORD & CO
10-Ks and 10-Qs
|
|
|
|
|
|
|
|
|
|
|
|
|
|
|
|
|
|
|
|
|
|
|
|
|
|
|
|
|
|
|
|
|
|
|
|
|
|
|
|
|
|
|
|
|
|
|
|
|
|
|
|
|
|
|
|
|
|
|
UNITED STATES SECURITIES AND EXCHANGE COMMISSION
Washington, D. C. 20549
Form 10-K
|
x
|
ANNUAL REPORT PURSUANT TO SECTION 13 OR 15(d) OF THE SECURITIES EXCHANGE ACT OF 1934
|
|
|
|
For the fiscal year ended December 31, 2018
|
|
|
o
|
TRANSITION REPORT PURSUANT TO SECTION 13 OR 15(d) OF THE SECURITIES EXCHANGE ACT OF 1934
|
|
|
|
For the transition period from to
|
|
Commission file number 1-10356
CRAWFORD & COMPANY
(Exact name of Registrant as specified in its charter)
|
Georgia
(State or other jurisdiction of incorporation or organization)
|
58-0506554
(I.R.S. Employer Identification Number)
|
|
|
5335 Triangle Parkway, Peachtree Corners, Georgia
(Address of principal executive offices)
|
30092
(Zip Code)
|
|
Registrant's telephone number, including area code
(404) 300-1000
Securities registered pursuant to Section 12(b) of the Act:
|
Title of Each Class
|
Name of Each Exchange on Which Registered
|
|
|
Class A Common Stock — $1.00 Par Value
|
|
New York Stock Exchange
|
|
Class B Common Stock — $1.00 Par Value
|
|
New York Stock Exchange
|
Securities registered pursuant to Section 12(g) of the Act:
None
(Title of Class)
Indicate by check mark if the Registrant is a well-known seasoned issuer, as defined in Rule 405 of the Securities Act. Yes
o
No
x
Indicate by check mark if the Registrant is not required to file reports pursuant to Section 13 or Section 15(d) of the Act. Yes
o
No
x
Indicate by check mark whether the Registrant: (1) has filed all reports required to be filed by Section 13 or 15(d) of the Securities Exchange Act of 1934 during the preceding 12 months (or for such shorter period that the Registrant was required to file such reports), and (2) has been subject to such filing requirements for the past 90 days. Yes
x
No
o
Indicate by check mark whether the Registrant has submitted electronically every Interactive Data File required to be submitted pursuant to Rule 405 of Regulation S-T (§232.405 of this chapter) during the preceding 12 months (or for such shorter period that the Registrant was required to submit such files). Yes
x
No
o
Indicate by check mark if disclosure of delinquent filers pursuant to Item 405 of Regulation S-K (§229.405 of this chapter) is not contained herein, and will not be contained, to the best of Registrant's knowledge, in definitive proxy or information statements incorporated by reference in Part III of this Form 10-K or any amendment to this Form 10-K.
o
Indicate by check mark whether the Registrant is a large accelerated filer, an accelerated filer, a non-accelerated filer, smaller reporting company, or an emerging growth company. See the definitions of "large accelerated filer", "accelerated filer," "smaller reporting company," and "emerging growth company" in Rule 12b-2 of the Exchange Act.
|
Large accelerated filer
o
|
Accelerated filer
x
|
Non-accelerated filer
o
|
Smaller reporting company
o
|
|||
If an emerging growth company, indicate by check mark if the registrant has elected not to use the extended transition period for complying with any new or revised financial accounting standards pursuant to Section 13(a) of the Exchange Act.
o
Indicate by check mark whether the Registrant is a shell company (as defined in Rule 12b-2 of the Exchange Act). Yes
o
No
x
The aggregate market value of the Registrant's voting and non-voting common stock held by non-affiliates of the Registrant
was
$246,488,173
as of
June 29, 2018
, based upon the closing prices of such stock as reported on the NYSE on such date. For purposes hereof, beneficial ownership is determined under rules adopted
pursuant to Section 13 of the Securities Exchange Act of 1934, and excludes voting and non-voting common stock beneficially owned by the directors and executive officers of the Registrant, some of whom may not be deemed to be affiliates upon judicial determination.
The number of shares outstanding of each class of the Registrant's common stock, as o
f
February 15, 2019
, was:
Class A Common Stock — $1.00 Par Value —
30,586,037
Shares
Class B Common Stock — $1.00 Par Value —
23,030,725
Shares
Documents incorporated by reference:
Portions of the Registrant's proxy statement for its
2019
annual shareholders' meeting, which proxy statement will be filed within 120 days of the Registrant's year end, are incorporated by reference into Part III hereof.
CRAWFORD & COMPANY
FORM 10-K
For The Year Ended
December 31, 2018
Table of Contents
|
|
|||
|
|
|||
We use the terms "Crawford", "the Company", "the Registrant", "we", "us" and "our" to refer to the business of Crawford & Company, its subsidiaries, and variable interest entities.
Cautionary Statement Concerning Forward-Looking Statements
This report contains and incorporates by reference forward-looking statements within the meaning of that term in the Private Securities Litigation Reform Act of 1995, Section 27A of the Securities Act of 1933, and Section 21E of the Securities Exchange Act of 1934. Statements contained
or incorporated by reference
in this report that are not statements of historical fact are forward-looking statements made pursuant to the "safe harbor" provisions thereof. These statements may relate to, among other things, our expected future operating results and financial condition, our ability to grow our revenues and reduce our operating expenses, expectations regarding our anticipated contributions to our underfunded defined benefit pension plans, collectability of our billed and unbilled accounts receivable, financial results from our recent acquisitions, our continued compliance with the financial and other covenants contained in our financing agreements,
and our other long-term capi
tal resource and liquidity requirements. These statements may also relate to our business strategies, goals and expectations concerning our market position, future operations, margins, case and project volumes, profitability, contingencies, liquidity position, and capital resources. The words "anticipate", "believe", "could", "would", "should", "estimate", "expect", "intend", "may", "plan", "goal", "strategy", "predict", "project", "will" and similar terms and phrases
, or the negatives thereof,
identify forward-looking statements in this report and in the statements incorporated by reference in this report. These risks and uncertainties include, but are not limited to, those described in Part I, "Item 1A. Risk Factors" and elsewhere in this report and those described from time to time in our other reports filed with the Securities and Exchange Commission.
Although we believe the assumptions upon which these forward-looking statements are based are reasonable, any of these assumptions could prove to be inaccurate and the forward-looking statements based on these assumptions could prove to be incorrect. Our operations and the forward-looking statements related to our operations involve risks and uncertainties, many of which are outside our control, and any one of which, or a combination of which, could materially adversely affect our financial condition and results of operations, and whether the forward-looking statements ultimately prove to be correct. As a result, undue reliance should not be placed on any forward-looking statements. Actual results and trends in the future may differ materially from those suggested or implied by the forward-looking statements. Forward-looking statements speak only as of the date they are made and we undertake no obligation to publicly update any of these forward-looking statements in light of new information or future events.
PART I
ITEM 1.
BUSINESS
Headquartered in Atlanta, Georgia, and founded in 1941, the Company is
the world's largest publicly listed independent provider of claims management and outsourcing solutions to the risk management and insurance industry, as well as to self-insured entities, with an expansive global network serving clients
in more than
70
countries. For the year ended
December 31, 2018
, the Company reported total revenues before reimbursements of
$1.071 billion
.
Shares of the Company's two classes of common stock are traded on the New York Stock Exchange ("NYSE") under the symbols CRD-A and CRD-B, respectively.
The Company's two classes of stock are substantially identical, except with respect to voting rights and the Company's ability to pay greater cash dividends on the non-voting Class A Common Stock than on the voting Class B Common Stock, subject to certain limitations. In addition, with respect to mergers or similar transactions, holders of Class A Common Stock must receive the same type and amount of consideration as holders of Class B Common Stock, unless different consideration is approved by the holders of 75% of the Class A Common Stock, voting as a class.
DESCRIPTION OF SERVICES
The Company delivers services to its clients through a global service line reporting structure consisting of three operating segments:
Crawford Claims Solutions
, which serves the global property and casualty insurance company markets;
Crawford TPA Solutions: Broadspire
®, which serves the global casualty, disability and self-insurance marketplace worldwide; and
Crawford Specialty Solutions
, which serves the global property and casualty insurance company markets. The Company's operating segments are comprised of the following:
|
•
|
Crawford Claims Solutions
, which serves the global property and casualty insurance markets in the U.S., U.K., Canada, Australia, Europe and Rest of World. This is comprised of Claims Field Operations, WeGoLook, Catastrophe Services and Marine service lines based on geography and responsibility.
|
|
•
|
Crawford TPA Solutions: Broadspire
, which provides third party administration for workers' compensation, auto and liability, disability absence management, medical management, and accident and health to corporations, brokers and insurers worldwide. Crawford TPA Solutions: Broadspire operates in the U.S., U.K., Canada, Europe and Rest of World.
|
|
•
|
Crawford Specialty Solutions
provides services to the global property and casualty insurance company markets in the U.S., U.K., Canada, Australia, Europe and Rest of World.
Crawford Specialty Solutions
is comprised of the Global Technical Services and Contractor Connection service lines globally based on geography and responsibility, and the previously reported
Garden City Group
segment which was sold on
June 15, 2018
.
|
A significant portion of our revenues are derived from international operations. For a discussion of certain risks attendant to international operations, see Item 1A, "Risk Factors."
CRAWFORD CLAIMS SOLUTIONS.
The
Crawford Claims Solutions
segment accounted for
33.7%
of the Company's revenues before reimbursements in
2018
. The Company's
Crawford Claims Solutions
segment provides claims management services globally to insurance carriers and self-insured entities related to property, casualty, and catastrophe losses caused by physical damage to commercial and residential real property, certain types of personal property and marine losses. The Company's
Crawford Claims Solutions
segment revenues are substantially derived from the insurance carrier market. Insurance companies customarily manage their own claims administration function, but often rely upon third-parties for certain services which the Company provides, primarily with respect to field investigation, catastrophe, and the evaluation and resolution of property and casualty insurance claims.
1
Claims management services offered by our
Crawford Claims Solutions
segment are provided to clients pursuant to a variety of different referral assignments which generally are classified by the underlying insured risk categories used by insurance companies. These major risk categories are:
|
•
|
Property — losses caused by physical damage to commercial or residential real property and certain types of personal property
|
|
•
|
Catastrophe — losses caused by all types of natural disasters, such as fires, hailstorms, hurricanes, earthquakes and floods, and man-made disasters such as oil spills, chemical releases, and explosions
|
|
•
|
Public Liability — a wide range of non-automobile liability claims such as product liability; owners, landlords and tenants liabilities; and comprehensive general liability
|
|
•
|
Automobile — all types of losses involving use of an automobile, including bodily injury, physical damage, medical payments, collision, fire, theft, and comprehensive liability
|
|
•
|
Marine — losses relating to hull, machinery and cargo
|
Crawford Claims Solutions
serves the global property and casualty insurance company markets in the U.S., U.K., Canada, Australia, Europe and Rest of World.
In addition, the
Crawford Claims Solutions
segment, through the Company’s WeGoLook®, LLC subsidiary, provides a variety of on-demand inspection, verification, and other task specific field services for businesses and consumers through a mobile platform of independent contractors.
CRAWFORD TPA SOLUTIONS: BROADSPIRE.
Our
Crawford TPA Solutions: Broadspire
segment, which provides services to the global casualty and disability insurance and self-insured markets in the U.S., U.K., Canada, Europe, and Rest of World, accounted for
37.9%
of the Company's revenues before reimbursements in
2018
.
Crawford TPA Solutions: Broadspire
Services, Inc., is a leading third-party administrator to employers, brokers and insurance companies.
Through the
Crawford TPA Solutions: Broadspire
segment, we provide a complete range of claims and risk management services to corporations in the self-insured or commercially-insured marketplace inclusive of brokers and insurance companies. In addition to desktop claim adjusting and evaluation of claims,
Crawford TPA Solutions: Broadspire
also offers initial loss reporting services for claimants; loss mitigation services, such as medical bill review, medical case management and vocational rehabilitation; risk management information services; and administration of trust funds established to pay claims.
Crawford TPA Solutions: Broadspire
services are provided through two major service lines:
|
•
|
The Claims Management service line includes workers' compensation, liability, property, accident & health, and disability claims management. Accident & health claims programs include accidental death and dismemberment, business travel, life, disability, critical illness and credit protection claims programs. Disability and leave management services include the handling of short and long term disability, FMLA (Federal Medical Leave Act), Americans with Disabilities Act (ADA, ADAAA) and state leave claims designed to increase employee productivity and contain costs. Inclusive of the claims management services is risk management information and consultative analytical services.
|
|
•
|
The Medical Management service line integrates evidence-based criteria, clinical expertise, and advanced technology into the claims process to achieve optimal outcomes for employees in a cost effective manner. Case managers provide administration services by proactively managing medical treatment for employees while facilitating an understanding of and participation in their rehabilitation process. These programs assist employees recover as quickly as possible in a cost-effective method. Medical bill review services provide analysis of medical charges for clients' claims to identify opportunities for savings. Physician review services include a diverse panel of specialized physician reviewers that evaluate the medical necessity of medical services as well as causal relation determination while also supporting timely return to work for employees.
|
2
CRAWFORD SPECIALTY SOLUTIONS.
The
Crawford Specialty Solutions
segment accounted for
28.4%
of the Company's revenues before reimbursements in
2018
. The
Crawford Specialty Solutions
segment provides services to the global property and casualty insurance company markets in the U.S., U.K., Canada, Australia, Europe and Rest of World, and, prior to the disposition of the
Garden City Group
business line on
June 15, 2018
, the legal settlement administration market primarily in the U.S. and Canada.
|
•
|
Global Technical Services provides claims management services to insurance companies and self-insured entities related to large, complex losses with technical adjusting and industry experts servicing a broad range of industries, including commercial property, aviation, forensic accounting, marine and transportation, retail, building and construction, cyber and energy. Crawford Global Technical Services is a group of skilled adjusters with technical training and specialized expertise, such as in forensics, engineering, accounting, or chemistry, with relationships spanning the insurance industry and Fortune 1000 corporations.
|
|
•
|
Contractor Connection is the largest independently managed contractor network in the industry, with approximately 6,000 credentialed residential and commercial contractors. This innovative service provides a customer-centric solution for a wide range of loss types from
high-frequency, low-complexity
claims to large complex repairs, optimizing the time and work process needed to resolve property claims. Contractor Connection supports our business process outsourcing strategy by providing high-quality outsourced contractor management to national and regional personal and commercial insurance carriers as well as directly to consumer markets.
|
|
•
|
Garden City Group
- prior to its disposition on
June 15, 2018
, this service line performed legal settlement administration services on behalf of law firms, corporations, government agencies and courts. The
Garden City Group
's services included identifying and qualifying class members, handling all written, electronic, and telephonic communications with claimants, and determining and dispensing settlement payments.
|
MATERIAL CUSTOMERS
No single customer accounted for 10% or more of our consolidated revenues in
2018
,
2017
or
2016
. However, for the years ended December 31,
2018
and
2017
, our
Crawford Specialty Solutions
segment derived in excess of 10% of its revenue from one customer, and during the year ended December 31,
2016
, our Crawford Claims Solutions segment derived more than 10% of its revenue from one customer.
In the event we are not able to retain these significant relationships, or replace any lost revenues from such relationships, revenues and operating earnings within these segments, and possibly for the Company as a whole, could be materially adversely affected.
INTELLECTUAL PROPERTY AND TRADEMARKS
The Company's intellectual property portfolio is an important asset which it seeks to expand and protect globally through a combination of trademarks, trade names, copyrights and trade secrets. The Company owns a number of active trademark applications and registrations which expire at various times. As the laws of many countries do not protect intellectual property to the same extent as the laws of the U.S., the Company cannot ensure that it will be able to adequately protect its intellectual property assets outside of the U.S. The failure to protect our intellectual property assets could have a material adverse affect on our business;
however, the loss of any single patent, trademark or service mark, taken alone, would not have a material adverse effect on any of our segments or on the Company as a whole
.
SERVICE DELIVERY
The Company's claims management services are offered primarily through its global network serving clients in more than
70
countri
es. Contractor Connection services are offered by providing high-quality outsourced contractor management to national and regional insurance carriers. WeGoLook services are offered through a mobile platform of independent contractors.
3
COMPETITION
The global claims management services market is highly competitive and comprised of a large number of companies that vary in size and that offer a varied scope of services. The demand from insurance companies and self-insured entities for services provided by independent claims service firms like us is largely dependent on industry-wide claims volumes, which are affected by, among other things, the insurance underwriting cycle, weather-related events, general economic activity, overall employment levels and workplace injury rates. Demand is also impacted by decisions insurance companies and self-insured entities make with respect to the level of claims outsourced to independent claim service firms as opposed to those handled by their own in-house claims adjusters. In addition, our ability to retain clients and maintain or increase case referrals is also dependent in part on our ability to continue to provide high-quality, competitively priced services and effective sales efforts.
We typically earn our revenues on an individual fee-per-claim basis for claims management services we provide to insurance companies and self-insured entities. Accordingly, the volume of claim referrals to us is a key driver of our revenues. Generally, fees are earned over time on cases as services are provided, which generally occurs in the period the case is assigned to us, although sometimes a portion or substantially all of the revenues generated by a specific case assignment will be earned in subsequent periods. We cannot predict the future trend of case volumes for a number of reasons, including the frequency and severity of weather-related cases and the occurrence of natural and man-made disasters, which are a significant source of cases for us and are not subject to accurate forecasting.
The Company competes with a substantial number of smaller local and regional claims management services firms. Many of these smaller firms have rate structures that are lower than the Company's or may, in certain markets, have local knowledge which provides a competitive advantage. We do not believe these smaller firms offer the broad spectrum of claims management services in the range of locations the Company provides and, although such firms may secure business which has a local or regional source, the Company believes its quality product offerings, broader scope of services, and geographically dispersed offices provide us with an overall competitive advantage in securing business from both U.S. and international clients. There are also national and global independent companies that provide a similar broad spectrum of claims management services and who directly compete with the Company.
EMPLOYEES
At
December 31, 2018
, our total number of full-time equivalent employees ("FTEs") was
approximately
9,000
. I
n addition, the Company from time to time, uses the resources of a pool of temporary employees and a network of independent contractors, as and when the demand for services requires. These temporary employees primarily provide catastrophe adjuster services. The Company provides many of its employees with formal classroom training in basic and advanced skills relating to claims administration and healthcare management services. In many cases, employees are required to complete these or other professional courses in order to qualify for promotions. The Company generally considers its relations with its employees to be good.
A
VAILABLE INFORMATION
The Company, a Georgia corporation, is required to file annual, quarterly and current reports, proxy statements and other information with the Securities and Exchange Commission ("SEC").
The Company's Annual Reports on Form 10-K, Quarterly Reports on Form 10-Q, Current Reports on Form 8-K and amendments to reports filed pursuant to Sections 13(a) and 15(d) of the Securities Exchange Act of 1934 are available free of charge on our website, www.crawco.com through the "Investor Relations" link located under the "About Us" tab, as soon as reasonably practicable after these reports are electronically filed or furnished to the SEC. The information contained on, or hyperlinked from, our website is not a part of, nor is it incorporated by reference into, this Annual Report on Form 10-K.
In addition, the SEC maintains an Internet site that contains reports, proxy and information statements, and other information regarding issuers that file electronically with the SEC at
http://www.sec.gov
.
Copies of the Company's Annual Report will also be made available, free of charge, upon written request to Corporate Secretary, Legal Department, Crawford & Company,
5335 Triangle Parkway, Peachtree Corners, Georgia, 30092
.
4
ITEM 1A.
RISK FACTORS
You should carefully consider the risks described below, together with the other information contained or incorporated by reference in this Annual Report on Form 10-K and in our other filings with the SEC from time to time when evaluating our business and prospects. Any of the events discussed in the risk factors below may occur, and our business, results of operations or financial condition could be materially adversely affected. Additional risks and uncertainties not presently known to us, or that we currently deem immaterial, may also materially adversely affect our financial condition or results of operations.
MARKET CONDITIONS
We depend on case volumes for a significant portion of our revenues. Case volumes are not subject to accurate forecasting, and a decline in case volumes may materially adversely affect our financial condition and results of operations.
Because we depend on case volume for revenue streams, a reduction in case referrals for any reason may materially adversely impact our results of operations and financial condition. We are unable to predict case volumes for a number of reasons, including the following:
|
•
|
changes in the degree to which property and casualty insurance carriers or self-insured entities outsource, or intend to outsource, their claims handling functions are generally not disclosed in advance;
|
|
•
|
we cannot predict the length or timing of any insurance cycle, described below;
|
|
•
|
changes in the overall employment levels and associated workplace injury rates could impact the number of total claims and our case volumes and are not subject to accurate forecasting;
|
|
•
|
the frequency and severity of weather-related, natural, and man-made disasters, which are a significant source of cases for us, are also generally not subject to accurate forecasting;
|
|
•
|
potential consolidation of clients in the markets we operate could impact the volume of cases referred to providers;
|
|
•
|
major insurance carriers, underwriters, and brokers could elect to expand their activities as administrators and adjusters, which would directly compete with our business; and
|
|
•
|
we may not desire to or be able to renew existing major contracts with clients.
|
If our case volume referrals decline for any of the foregoing, or any other reason, our revenues may decline, which could materially adversely affect our financial condition and results of operations.
We are subject to insurance underwriting market cycle risks. We may not be able to identify new revenue sources not directly tied to this cycle and, in that event, would remain subject to its risks.
Although the insurance industry underwriting cycle has been characterized in recent years as soft, the property-casualty underwriting cycle remains volatile and could rapidly transition to a harder market due to certain factors such as the occurrence of significant catastrophic losses or the performance of capital markets. In softer insurance markets, insurance premiums and deductible levels are generally in decline and industry-wide claim volumes generally increase, which should increase claim referrals to us, provided property and casualty insurance carriers do not reduce the number of claims they outsource to independent firms such as ours. Because the underwriting cycle can change suddenly due to unforeseen events in the financial markets or catastrophic claims activity, we cannot predict what impact the current market may have on us in the future or the timing of when the market may change in the future. Indicators of a hard insurance underwriting cycle generally include higher premiums, higher deductibles, lower liability limits, increased excluded coverages, increased reservation of rights letters, and more unpaid claims. During a hard insurance underwriting market, insurance companies typically become very selective in the risks they underwrite, and insurance premiums and policy deductibles increase. This often results in a reduction in industry-wide claims volumes, which reduces claim referrals to us unless we are able to grow our market share.
5
We try to mitigate this risk exposure through the development and marketing of services that are not affected by the insurance underwriting cycle. However, there can be no assurance that our mitigation efforts will be effective with respect to eliminating or reducing underwriting market cycle risk. To the extent we cannot effectively minimize the risk through diversification, our financial condition and results of operations could be materially adversely impacted by, or during, future hard market cycles.
In recent periods, we have derived a material amount of our revenues from a limited number of clients. If we are not able to replace these revenues, our financial condition and results of operations could be materially adversely affected.
From time to time, we derive a material portion of our revenues from a limited number of clients. No customer accounts for 10% or more of our consolidated revenues for the years ended December 31,
2018
,
2017
, or
2016
. However, for the years ended
December 31
,
2018
and
2017
, our
Crawford Specialty Solutions
segment derived in excess of 10% of its revenue from one customer, and during the year ended
December 31
,
2016
, our Crawford Claims Solutions segment derived more than 10% of its revenue from one customer.
In the event we are not able to retain these significant relationships, or replace any lost revenues from such relationships, revenues and operating earnings within these segments, and possibly for the Company as a whole, could be materially adversely affected.
TECHNOLOGY AND DATA SECURITY
We manage a large amount of highly sensitive and confidential consumer information including personally identifiable information, protected health information and financial information. Unauthorized access to, alteration or disclosure of this data, whether as a result of criminal conduct, advances in computer hacking or otherwise, could result in a material loss of business, substantial legal liability or significant harm to our reputation.
We manage a large amount of highly sensitive and confidential consumer information including personally identifiable information, protected health information and financial information. A security incident impacting our own data centers or those controlled by our service providers may compromise the confidentiality, integrity or availability of this confidential consumer information. Unauthorized access to or disclosure of confidential consumer information stored by us or our service providers may occur through break-ins, breaches of a secure network by an unauthorized party, employee theft or misuse or other misconduct. It is also possible that unauthorized access to or disclosure of such confidential consumer information may be obtained through inadequate use of security controls by us or our employees. If there were an inadvertent disclosure of confidential consumer information, or if a third party were to gain unauthorized access to the confidential consumer information, our operations could be disrupted, our reputation could be damaged and we could be subject to claims or other liabilities, regulatory investigations, or fines. In addition, such perceived or actual unauthorized disclosure of the information we collect or breach of our security could damage our reputation, result in the loss of customers and harm our business.
We are subject to increased frequency and complexity of cybersecurity attacks. Our failure to effectively identify such attacks could materially adversely affect our business, results of operations, and financial condition.
We have implemented procedures and controls to reduce our exposure to cybersecurity attacks, and assess our incident response and notification protocols. Additionally, we have existing procedures to determine the potential materiality of a cybersecurity incident. These procedures include reporting protocols to and oversight from our Board of Directors. We also have disclosure controls and insider trading restrictions that would apply in the event of a material cybersecurity incident. We have made investments in software and internal training to prevent cybersecurity incidents such as phishing and business email compromise. However, we may not be able to prevent an attack due to the increasing sophistication and frequency of such attacks. Unauthorized access to, or breaches of a secure network by an unauthorized party could occur due to inadequate use of security controls by us or our employees. Any failure to effectively identify such attack, or to do so in a timely manner, could materially adversely affect our business, results of operations, and financial condition.
6
Increasing regulatory focus on privacy issues and expanding laws could impact our business models and expose us to increased liability.
U.S. privacy and data security laws apply to our various businesses. We also do business globally in countries that have more stringent data protection laws than those in the United States that may be inconsistent across jurisdictions and are subject to evolving and differing interpretations. Governments, privacy advocates and class action attorneys are increasingly scrutinizing how companies collect, process, use, store, share and transmit personal data. Globally, new laws, such as the General Data Protection Regulation (“GDPR”) in Europe, and industry self-regulatory codes have been enacted and more are being considered that may affect our ability to respond to customer requests under the laws, and to implement our business models effectively. These requirements, among others, may force us to bear the burden of more onerous obligations in our contracts. Any perception of our practices, products or services as a violation of individual privacy rights may subject us to public criticism, class action lawsuits, reputational harm, or investigations or claims by regulators, industry groups or other third parties, all of which could disrupt our business and expose us to increased liability. Additionally, we store information on behalf of our customers and if our customers fail to comply with contractual obligations or applicable laws, it could result in litigation or reputational harm to us.
Transferring personal information across international borders is becoming increasingly complex. For example, European data transfers outside the European Economic Area are highly regulated. The mechanisms that we and many other companies rely upon for European data transfers are being contested in the European court system. We are closely monitoring developments related to requirements for transferring personal data outside the EU. These requirements may result in an increase in the obligations required to provide our services in the EU or in sanctions and fines for non-compliance. Several other countries, including Canada and Australia, have also established specific legal requirements for cross-border transfers of personal information. These developments in Europe and elsewhere could harm our business, results of operations, and financial condition.
We may not be able to develop or acquire necessary IT resources to support and grow our business. Our failure to do this could materially adversely affect our business, results of operations, and financial condition.
We have made substantial investments in software and related technologies that are critical to the core operations of our business. These IT resources will require future maintenance and enhancements, potentially at substantial costs. Additionally, these IT resources may become obsolete in the future and require replacement, potentially at substantial costs. We may not be able to develop, acquire replacement resources or identify new technology resources necessary to support and grow our business. Any failure to do so, or to do so in a timely manner or at a cost considered reasonable by us, could materially adversely affect our business, results of operations, and financial condition.
If we do not protect our proprietary information and technology resources and prevent third parties from making unauthorized use of our proprietary information, intellectual property, and technology, our financial results could be harmed.
We rely on a combination of trademark, trade name, copyright and trade secret laws to protect our proprietary information,
intellectual property, and technology. H
owever, all of these measures afford only limited protection and may be challenged, invalidated or circumvented by third parties. Third parties may copy aspects of our processes, products or materials, or otherwise obtain and use our proprietary information without authorization. Unauthorized copying or use of our intellectual property or proprietary information could materially adversely affect
our financial condition and results of operations
. Third parties may also develop similar or superior technology independently, including by designing around any of our proprietary technology. Furthermore, the laws of some foreign countries do not offer the same level of protection of our proprietary rights as the laws of the U.S., and we may be subject to unauthorized use of our intellectual property in those countries. Any legal action that we may bring to protect intellectual property and proprietary information could be unsuccessful, expensive and may distract management from day-to-day operations.
7
We currently operate on multiple proprietary software platforms to support our service offerings and internal corporate systems. The failure or obsolescence of any of these platforms, if not remediated or replaced, could materially adversely affect our business, results of operations, and financial condition
We currently utilize multiple software platforms to support our service offerings. We believe certain of these software platforms distinguish our service offerings from our competitors. The failure of one or more of our software platforms to function properly, or the failure of these platforms to remain competitive, could materially adversely affect our business, results of operations, and financial condition.
BUSINESS AND OPERATIONS
A significant portion of our operations are international. These international operations subject us to political, legal, operational, exchange rate and other risks not generally present in U.S. operations, which could materially negatively affect those operations or our business as a whole.
Our international operations subject us to political, legal, operational, exchange rate and other risks that we do not face in our domestic operations. We face, among other risks, the risk of discriminatory regulation; nationalization or expropriation of assets; changes in both domestic and foreign laws regarding taxation, trade and investment abroad; potential loss of proprietary information due to piracy, misappropriation or laws that may be less protective of our intellectual property rights; or price controls and exchange controls or other restrictions that could prevent us from transferring funds from these operations out of the countries in which they were earned or converting local currencies we hold into U.S. dollars or other currencies.
International operations also subject us to numerous additional laws and regulations that are in addition to, or may be different from, those affecting U.S. businesses, such as those related to labor, employment, worker health and safety, antitrust and competition, trade restriction, environmental protection, consumer protection, import/export and anti-corruption, including but not limited to the Foreign Corrupt Practices Act ("FCPA"). Although we have put into place policies and procedures aimed at ensuring legal and regulatory compliance, our employees, subcontractors, and agents could inadvertently or intentionally take actions that violate any of these requirements. Violations of these regulations could impact our ability to conduct business, or subject us to criminal or civil enforcement actions, any of which could have a material adverse effect on our business, financial condition or results of operation
s.
We have operations in the United Kingdom ("U.K.") and the European Union ("EU") that may be impacted by the U.K's planned departure from the EU, known as "Brexit". The uncertainty as to the outcome of Brexit may negatively impact operations in this region or our business as a whole.
The U.K. and EU insurance markets in which we operate may be impacted by the various potential outcomes of Brexit. There are multiple regulatory, contractual, and supply chain issues that need to be considered, and also the potential impact to transactions and assets denominated in foreign currencies. The majority of our relationships in these countries are within our country of operations, however, to the extent we provide services cross-border, there may be increased risks regarding employee mobility, cross-border payments, data transfer and potential regulatory impacts. Failure to secure a pan-European agreement could lead to various country-by-country approaches being implemented, resulting in a lack of consistency between countries. Changes to these regulations could impact our ability to conduct business in these countries, which could have a material adverse effect on our business, results of operations, and financial condition.
8
We currently, and from time to time in the future may, outsource a portion of our internal business functions to third-party providers. Outsourcing these functions has significant risks, and our failure to manage these risks successfully could materially adversely affect our business, results of operations, and financial condition.
We currently, and from time to time in the future may, outsource significant portions of our internal business functions to third-party providers. Third-party providers may not comply on a timely basis with all of our requirements, or may not provide us with an acceptable level of service. In addition, our reliance on third-party providers could have significant negative consequences, including significant disruptions in our operations and significantly increased costs to undertake our operations, either of which could damage our relationships with our customers. As a result of our outsourcing activities, it may also be more difficult for us to recruit and retain qualified employees for our business needs at any time. Our failure to successfully outsource any material portion of our business functions could materially adversely affect our business, results of operations, and financial condition.
We could be subject to adverse changes in tax rates, adoption of new tax laws, additional tax liabilities, or increased volatility in our effective tax rate.
We are subject to the tax laws in the United States and numerous foreign jurisdictions. Changes in tax laws or regulations may be proposed or enacted that could significantly affect our overall tax expense, including changes in our assessment related to the realizability of certain deferred tax assets. For example, on December 22, 2017, the United States government enacted comprehensive tax legislation through the Tax Cuts and Jobs Act (“Tax Act”), which significantly changed the U.S. corporate income tax system. The Tax Act requires complex computations to be performed that were not previously required, significant judgments, estimates and calculations to be made in interpreting its provisions, and the preparation and analysis of information not previously relevant or regularly produced.
The U.S. Treasury Department, the Internal Revenue Service, and other standard-setting bodies could interpret or issue guidance on how provisions of the Tax Act will be applied or otherwise administered that is different from our interpretation. In addition, further legislative action could be taken to address questions or issues caused by the Tax Act. As we continue our ongoing analysis of the Tax Act and its related interpretations, collect and prepare necessary data, and interpret any additional guidance, we may adjust amounts that we have recorded that may adversely impact our results of operations. Additionally, state and foreign governments may enact tax laws in response to the Tax Act or other global initiatives that could result in further changes to our taxation and adversely impact our results of operations.
We are, and may become, party to lawsuits or other claims or investigations that could adversely impact our business.
In the normal course of the claims administration services business, we are from time to time named as a defendant in suits by insureds or claimants contesting decisions by us or our clients with respect to the settlement of claims. Additionally, our clients have in the past brought, and may, in the future bring, claims for indemnification on the basis of alleged actions on our part or on the part of our agents or our employees in rendering services to clients. There can be no assurance that additional lawsuits will not be filed against us. There also can be no assurance that any such lawsuits will not have a disruptive impact upon the operation of our business, that the defense of the lawsuits will not consume the time and attention of our senior management and financial resources or that the resolution of any such litigation will not have a material adverse effect on our business, financial condition and results of operations.
The Company is also subject to numerous federal, state, and foreign labor, employment, worker health and safety, antitrust and competition, environmental and consumer protection, import/export, anti-corruption, and other laws. From time to time the Company faces claims and investigations by employees, former employees, and governmental entities under such laws or employment contracts with such employees or former employees. Such claims, investigations, and any litigation involving the Company could divert management's time and attention from the Company's business operations and could potentially result in substantial costs of defense, settlement or other disposition, which could have a material adverse effect on the Company's results of operations, financial position, and cash flows.
9
LIQUIDITY AND CAPITAL
Our U.S. qualified defined benefit pension plan (the "U.S. Qualified Plan") and certain international defined benefit plans in Germany, Norway, and the Philippines (the "other international plans") are underfunded. Future funding requirements, including those imposed by any further regulatory changes, could restrict cash available for our operating, financing, and investing requirements.
At the end of the most recent measurement periods for our U.S. Qualified Plan and certain of our other international defined benefit pension plans, the projected benefit obligations for these specific plans were underfunded by
$74.3 million
. In recent years we have been required to make significant contributions to these plans and will have to make significant future contributions.
Crawford expects to make no discretionary contributions in 2019 and $9.0 million per annum to the U.S. Qualified Plan for the next four fiscal years following 2019 to improve the funded status of the plan and minimize future required contributions.
Volatility in the capital markets and future legislation may have a negative impact on our U.S., U.K. and other international pension plans, which may further increase the underfunded portion of our pension plans and our attendant funding obligations. Expected and required contributions to our underfunded defined benefit pension plans will reduce our liquidity, restrict available cash for our operating, financing, and investing needs and may materially adversely affect our financial condition and our ability to deploy capital to other opportunities.
While we intend to comply with our future funding requirements through the use of cash from operations, there can be no assurance that we will generate enough cash to do so. Our inability to fund these obligations through cash from operations could require us to seek funding from other sources, including through additional borrowings under our Credit Facility (defined below), if available, proceeds from debt or equity financings, or asset sales. There can be no assurance that we would be able to obtain any such external funding in amounts, at times and on terms that we deem commercially reasonable, in order for us to meet these obligations. Furthermore, any of the foregoing could materially increase our outstanding debt or debt service requirements, or dilute the value of the holdings of our current shareholders, as the case may be. Our inability to comply with any funding obligations in a timely manner could materially adversely affect our financial condition.
We have debt covenants in our credit facility that require us to maintain compliance with certain financial ratios and other requirements. If we are not able to maintain compliance with these requirements, all of our outstanding debt could become immediately due and payable.
We are party to a credit facility, amended and restated as o
f October 11, 2017, with Wells Fargo Bank, N.A., Bank of America, N.A., Citizens Bank, N.A., and the other lenders a party thereto, (as amended,
the "Credit Facility"). The Credit Facility contains various representations, warranties and covenants, including covenants limiting liens, indebtedness, guarantees, mergers and consolidations, substantial asset sales, investments and loans, sale and leasebacks, restrictions on dividends and distributions, and other fundamental changes in our business. Additionally, the Credit Facility contains covenants requiring us to remain in compliance with a maximum leverage ratio and a minimum fixed charge coverage ratio. If we do not maintain compliance with the covenant requirements, we may be in default under the Credit Facility. In such an event, the lenders under the Credit Facility would generally have the right to declare all then-outstanding amounts thereunder immediately due and payable. If we could not obtain a required waiver on satisfactory terms, we could be required to renegotiate the terms of the Credit Facility or immediately repay this indebtedness. Any such renegotiation could result in less favorable terms, including additional fees, higher interest rates and accelerated payments, and would necessitate significant time and attention of management, which could divert their focus from business operations.
Any required payment may necessitate the sale of assets or other uses of resources that we do not believe would be in our best interests.
While we do not presently expect to be in violation of any of these requirements, no assurances can be given that we will be able to continue to comply with them in the future. Any failure to continue to comply with such requirements could materially adversely affect our borrowing ability and access to liquidity, and thus our overall financial condition
, as well as our ability to operate our business. We do not believe there is significant risk to our debt covenants if LIBOR were to be replaced with an alternative reference rate in the future. We have no current hedged transactions, and our Credit Facility allows for the use of a suitable replacement rate if an alternative was required.
10
In recent periods we have incurred impairment charges that reduced the carrying value of our intangible assets and goodwill; in the future we may be required to incur additional impairment charges on a portion or all of the carrying value of our intangible assets and goodwill, which may adversely affect our financial condition and results of operations.
Each year, and more frequently on an interim basis if appropriate, we are required by ASC Topic 350, "Intangibles--Goodwill and Other," to assess the carrying value of our indefinite lived intangible assets and goodwill to determine whether the carrying value of those assets is impaired. Such assessment and determination involves significant judgments to estimate the fair value of our reporting units, including estimating future cash flows, near term and long term revenue growth, and determining appropriate discount rates, among other assumptions. We intend to continue to monitor the performance of our reporting units and, should actual operating earnings consistently fall below forecasted operating earnings, we will perform an interim goodwill impairment analysis. Any such charges could materially adversely affect our financial results in the periods in which they are recorded.
Control by a principal shareholder could adversely affect the Company and our other shareholders.
As of
December 31, 2018
, Jesse C. Crawford, a member of our Board of Directors, and the father of Jesse C. Crawford, Jr., who is also a member of the Board of Directors, beneficially owned approximately
52%
of our outstanding voting Class B Common Stock. As a result, he has the ability to control substantially all matters submitted to our shareholders for approval, including the election and removal of directors. He also has the ability to control our management and affairs. As of
December 31, 2018
, Mr. Crawford also beneficially owned approximately
35%
of our outstanding non-voting Class A Common Stock. This concentration of ownership of our stock may delay or prevent a change in control; impede a merger, consolidation, takeover, or other business combination involving us; discourage a potential acquirer from making a tender offer or otherwise attempting to obtain control of us; reduce the liquidity, and thus the trading price, of our stock; or result in other actions that may be opposed by, or not be in the best interests of, the Company and our other shareholders.
COMPETITION AND EMPLOYEES
We operate in highly competitive markets and face intense competition from both established entities and new entrants into those markets. Our failure to compete effectively may adversely affect us.
Our ability to retain clients and maintain and increase case referrals is also dependent in part on our ability to continue to provide high-quality, competitively priced services and effective sales efforts.
The global claims management services market is highly competitive and comprised of a large number of companies that vary in size and that offer a varied scope of services. The demand from insurance companies and self-insured entities for services provided by independent claims service firms like us is largely dependent on industry-wide claims volumes, which are affected by, among other things, the insurance underwriting cycle, weather-related events, general economic activity, overall employment levels, and workplace injury rates. We are also impacted by decisions insurance companies and self-insured entities make with respect to the level of claims outsourced to independent claim service firms as opposed to those handled by their own in-house claims adjusters.
11
We may not be able to recruit, train, and retain qualified personnel, including retaining a sufficient number of qualified and experienced on-call claims adjusters, to respond to catastrophic events that may, singularly or in combination, significantly increase our clients' needs for adjusters.
Our catastrophe related work and revenues can fluctuate dramatically based on the frequency and severity of natural and man-made disasters. When such events happen, our clients usually require a sudden and substantial increase in the need for catastrophic claims services, which can strain our capacity. Our internal resources are sometimes not sufficient to meet these sudden and substantial increases in demand. When these situations occur, we must retain outside adjusters (temporary employees and contractors) to increase our capacity. There can be no assurance that we will be able to retain such outside adjusters with the requisite qualifications, at the times needed or on terms that we believe are economically reasonable. Insurance companies and other loss adjusting firms also aggressively compete for these independent adjusters, who often command high prices for their services at such times of peak demand. Such competition could reduce availability, increase our costs and r
educe our revenues. Our failure to timely, efficiently, and competently provide these services to o
ur clients could result in reduced revenues, loss of customer goodwill and a materially negative impact on our results of operations.
We compete for nurses and other case management professionals in the healthcare industry, which may increase our labor costs and reduce profitability.
Our Crawford TPA Solutions: Broadspire business competes with the general healthcare industry in recruiting qualified nurses, other case management professionals and other talent. In some markets, the scarcity of nurses and other medical support personnel has become a significant operating issue to healthcare providers. Such competition could reduce availability, increase our costs and reduce our revenues. This shortage may require us to increase wages and benefits to recruit and retain qualified nurses and other healthcare professionals. Our failure to recruit and retain qualified management, nurses, and other healthcare professionals, or to control labor costs could result in reduced revenues, loss of customer goodwill and a materially negative impact on our results of operations.
We face challenges caused by our aging workforce and we may not be able to recruit, train, and retain adequate replacements for our qualified and skilled employees.
Many of the nurses and adjusters in our industry, including those that we employ directly, are approaching retirement age. As these experienced employees retire, we may have difficulty recruiting new employees with comparable qualifications and experience, and we may be unable to transfer our employees’ institutional knowledge successfully to new qualified employees. Any such failures would be exacerbated at times of peak demand and could cause us to rely more heavily on outside nurses and adjusters. Our failure to recruit and train new employees and to ensure they obtain the adequate qualifications and experience could result in reduced revenues, loss of customer goodwill and a materially negative impact on our results of operations.
The risks described above are not the only ones we face, but are the ones currently deemed the most material by us based on available information. New risks may emerge from time to time, and it is not possible for management to predict all such risks, nor can we assess the impact of known risks on our business or the extent to which any factor or combination of factors may cause actual results to differ materially from those contained in any forward-looking statement.
ITEM 1B.
UNRESOLVED STAFF COMMENTS
None.
12
ITEM 2.
PROPERTIES
As of
December 31, 2018
, the Company
owned an office in Kitchener, Ontario.
As of
December 31, 2018
, the Company leased
approximately
270
ot
her office locations under various leases with varying terms. For additional information on the Company's significant operating leases and subleases, see Note 6 "Commitments Under Operating Leases" of our accompanying audited consolidated financial statements included in Item 8 of this Annual Report on Form 10-K. Other office locations are occupied under various short-term rental arrangements. The Company generally believes that its office locations are sufficient for its operations and that, if it were necessary to obtain different or additional office locations, such locations would be available at times, and on commercially reasonable terms, as would be necessary for the conduct of its business. No assurances can be given, however, that the Company would be able to obtain such office locations as and when needed, or on terms it considered to be reasonable, if at all.
ITEM 3.
LEGAL PROCEEDINGS
In the normal course of the claims administration services business, the Company is from time to time named as a defendant in suits by insureds or claimants contesting decisions by the Company or its clients with respect to the settlement of claims. Additionally, clients of the Company have, in the past, brought and may, in the future bring, claims for indemnification on the basis of alleged actions on the part of the Company, its agents or its employees in rendering service to clients. The majority of these claims are of the type covered by insurance maintained by the Company; however, the Company is responsible for the deductibles and self-insured retentions under its various insurance coverages. In the opinion of the Company, adequate reserves have been provided for such known risks. No assurances can be provided, however, that the result of any such action, claim or proceeding, now known or occurring in the future, will not result in a material adverse effect on our business, financial condition or results of operations.
The Company is also subject to numerous federal, state, and foreign labor, employment, worker health and safety, antitrust and competition, environmental and consumer protection, import/export, anti-corruption, and other laws. From time to time the Company faces claims and investigations by employees, former employees, and governmental entities under such laws or employment contracts with such employees or former employees.
The Company is engaged in arbitration with three former executives of the Garden City Group in which the former executives claim that they are entitled to additional payments associated with their departure from the Garden City Group on December 31, 2015. The Company does not believe that any additional amounts are due to the former executives and strongly refutes the allegations. The Company has not made any provision for the claims of the former executives, which were filed in New York, New York in September 2018.
ITEM 4.
MINE SAFETY DISCLOSURES
Not applicable.
PART II
ITEM 5.
MARKET FOR THE REGISTRANT'S COMMON EQUITY, RELATED SHAREHOLDER MATTERS,
AND ISSUER PURCHASES OF EQUITY SECURITIES
Shares of the Company's two classes of common stock are traded on the
NYSE
under the symbols CRD-A and CRD-B, respectively.
The Company's two classes of stock are substantially identical, except with respect to voting rights and the Company's ability to pay greater cash dividends on the non-voting Class A Common Stock than on the voting Class B Common Stock, subject to certain limitations. In addition, with respect to mergers or similar transactions, holders of Class A Common Stock must receive the same type and amount of consideration as holders of Class B Common Stock, unless different consideration is approved by the holders of 75% of the Class A Common Stock, voting as a class.
The number of record holders of each class of the Company's common stock as of
December 31, 2018
was as follows: CRD-A —
2,842
and CRD-B —
403
.
The Company's share repurchase authorization, approved in August 2014, (the "2014 Repurchase Authorization") provided the Company with the ability to repurchase up to
2,000,000
shares of CRD-A or CRD-B (or both). The 2014 Repurchase Authorization was terminated on July 28, 2017.
Effective July 29, 2017, the Company's Board of Directors authorized the repurchase of up to
2,000,000
shares of CRD-A or CRD-B (or both) through July 2020 (the "2017 Repurchase Authorization"). Under the 2017 Repurchase Authorization, repurchases may be made for cash, in the open market or privately negotiated transactions at such times and for such prices as management deems appropriate, subject to applicable contractual and regulatory restrictions.
Through
December 31, 2018
, the Company had repurchased
1,144,410
shares of CRD-A and
94,378
shares of CRD-B under the 2014 and 2017 Repurchase Authorizations at an average cost of
$8.36
and
$8.96
, respectively. At
December 31, 2018
, the Company had remaining authorization to repurchase
427,883
shares under the 2017 Repurchase Authorization.
Through
December 31, 2017
, the Company had repurchased
699,847
shares of CRD-A and
188,180
shares of CRD-B under the 2014 and 2017 Repurchase Authorizations at an average cost of
$8.21
and
$8.88
, respectively. At
December 31, 2017
, the Company had remaining authorization to repurchase
1,666,671
shares under the 2017 Repurchase Authorization.
As discussed in Note 18, "Subsequent Events" of the accompanying audited consolidated financial statements included in Item 8 of this Annual Report on Form 10-K, on
January 22, 2019
, the Company entered into Stock Purchase Agreements to repurchase an aggregate of
421,427
shares of CRD-A and
1,376,889
shares of CRD-B. Pursuant to the Purchase Agreements, the Company paid a purchase price of
$9.10
per share, for an aggregate purchase price of $16,364,676 plus commission. As the Company's Board of Directors separately authorized this repurchase, the authorized shares remaining under the 2017 Repurchase Authorization will not be impacted.
13
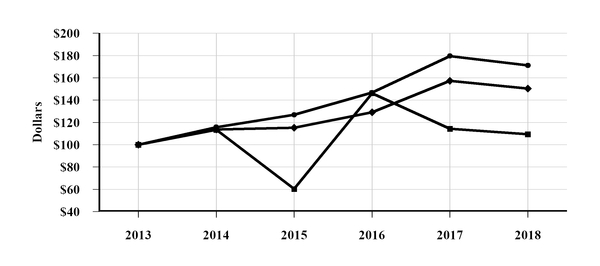
The following graph and table show the value as of
December 31, 2018
of a $100 investment in the Company's Class B common stock as of December 31, 2013 as compared to a similar investment in each of (i) the S&P 500 Index, and (ii) the S&P 500 Property-Casualty Insurance Index, in each case on a total return basis assuming the reinvestment of all dividends. We caution you not to draw any conclusions from the data in this performance graph, as past results do not necessarily indicate future performance.
Comparison of Cumulative Five Year Total Return
n
Crawford & Company (Class B)
t
S&P 500 Index
l
S&P Property-Casualty Insurance Index
|
TOTAL RETURN TO SHAREHOLDERS
|
||||||||||||
|
(Includes reinvestment of dividends)
|
||||||||||||
|
Base
|
INDEXED RETURNS
|
|||||||||||
|
Period
|
YEARS ENDED DECEMBER 31,
|
|||||||||||
|
Company / Index
|
2013
|
2014
|
2015
|
2016
|
2017
|
2018
|
||||||
|
Crawford & Company (Class B)
|
100.00
|
|
113.41
|
|
60.31
|
|
146.23
|
|
114.31
|
|
109.38
|
|
|
S&P 500 Index
|
100.00
|
|
113.69
|
|
115.26
|
|
129.05
|
|
157.22
|
|
150.32
|
|
|
S&P Property-Casualty Insurance Index
|
100.00
|
|
115.75
|
|
126.78
|
|
146.69
|
|
179.53
|
|
171.10
|
|
The foregoing graph and table are not, and shall not be deemed to be, filed as part of the Company's annual report on Form 10-K. Such graph and table do not constitute soliciting material and should not be deemed filed or incorporated by reference into any filing of the Company under the Securities Act of 1933, or the Securities Exchange Act of 1934, except to the extent specifically incorporated by reference therein by the Company.
14
ITEM 6.
SELECTED FINANCIAL DATA
The following selected financial data should be read in conjunction with Item 7, "Management's Discussion and Analysis of Financial Condition and Results of Operations" and the audited consolidated financial statements and notes thereto contained in Item 8, "Financial Statements and Supplementary Data" of this Annual Report on Form 10-K.
|
Year Ended December 31,
|
2018
|
2017
|
2016
|
2015
|
2014
|
||||||||||||||
|
|
(In thousands, except per share amounts and percentages)
|
||||||||||||||||||
|
Revenues before Reimbursements
|
$
|
1,070,971
|
|
$
|
1,105,832
|
|
$
|
1,109,286
|
|
$
|
1,170,385
|
|
$
|
1,142,851
|
|
||||
|
Reimbursements
|
52,008
|
|
57,877
|
|
68,302
|
|
71,135
|
|
74,112
|
|
|||||||||
|
Total Revenues
|
1,122,979
|
|
1,163,709
|
|
1,177,588
|
|
1,241,520
|
|
1,216,963
|
|
|||||||||
|
Total Costs of Services
|
808,005
|
|
842,167
|
|
850,112
|
|
940,352
|
|
914,814
|
|
|||||||||
|
Crawford Claims Solutions Operating Earnings (1)
|
9,836
|
|
17,527
|
|
14,371
|
|
5,708
|
|
1,375
|
|
|||||||||
|
Crawford TPA Solutions: Broadspire Operating Earnings (1)
|
36,909
|
|
38,224
|
|
36,520
|
|
33,915
|
|
21,063
|
|
|||||||||
|
Crawford Specialty Solutions Operating Earnings (1)
|
51,036
|
|
53,418
|
|
65,641
|
|
49,956
|
|
59,314
|
|
|||||||||
|
Unallocated Corporate and Shared Costs and Credits, Net
|
(9,321
|
)
|
(13,463
|
)
|
(24,403
|
)
|
(19,159
|
)
|
(8,633
|
)
|
|||||||||
|
Net Corporate Interest Expense
|
(10,109
|
)
|
(9,062
|
)
|
(9,185
|
)
|
(8,383
|
)
|
(6,031
|
)
|
|||||||||
|
Stock Option Expense
|
(1,742
|
)
|
(1,718
|
)
|
(621
|
)
|
(433
|
)
|
(859
|
)
|
|||||||||
|
Amortization of Customer-Relationship Intangible Assets
|
(11,152
|
)
|
(10,982
|
)
|
(9,592
|
)
|
(9,668
|
)
|
(6,341
|
)
|
|||||||||
|
Goodwill and Intangible Asset Impairment Charges
|
(1,056
|
)
|
(19,598
|
)
|
—
|
|
(49,314
|
)
|
—
|
|
|||||||||
|
Restructuring and Special Charges
|
—
|
|
(12,084
|
)
|
(9,490
|
)
|
(34,395
|
)
|
—
|
|
|||||||||
|
Loss on disposition of business line
|
(20,270
|
)
|
—
|
|
—
|
|
—
|
|
—
|
|
|||||||||
|
Income Taxes
|
(18,542
|
)
|
(15,039
|
)
|
(25,565
|
)
|
(13,832
|
)
|
(28,780
|
)
|
|||||||||
|
Net Loss (Income) Attributable to Noncontrolling Interests and Redeemable Noncontrolling Interests
|
389
|
|
442
|
|
(1,710
|
)
|
117
|
|
(484
|
)
|
|||||||||
|
Net Income (Loss) Attributable to Shareholders of Crawford & Company
|
$
|
25,978
|
|
$
|
27,665
|
|
$
|
35,966
|
|
$
|
(45,488
|
)
|
$
|
30,624
|
|
||||
|
Earnings (Loss) Per Share - Basic (2):
|
|||||||||||||||||||
|
CRD-A
|
$
|
0.51
|
|
$
|
0.53
|
|
$
|
0.68
|
|
$
|
(0.79
|
)
|
$
|
0.59
|
|
||||
|
CRD-B
|
$
|
0.43
|
|
$
|
0.45
|
|
$
|
0.60
|
|
$
|
(0.87
|
)
|
$
|
0.52
|
|
||||
|
Earnings (Loss) Per share - Diluted (2):
|
|||||||||||||||||||
|
CRD-A
|
$
|
0.50
|
|
$
|
0.52
|
|
$
|
0.67
|
|
$
|
(0.79
|
)
|
$
|
0.57
|
|
||||
|
CRD-B
|
$
|
0.42
|
|
$
|
0.45
|
|
$
|
0.60
|
|
$
|
(0.87
|
)
|
$
|
0.52
|
|
||||
|
Current Assets
|
$
|
320,848
|
|
$
|
370,367
|
|
$
|
364,731
|
|
$
|
370,177
|
|
$
|
367,583
|
|
||||
|
Total Assets
|
$
|
701,442
|
|
$
|
787,936
|
|
$
|
735,859
|
|
$
|
783,406
|
|
$
|
789,319
|
|
||||
|
Current Liabilities
|
$
|
225,310
|
|
$
|
256,591
|
|
$
|
230,287
|
|
$
|
258,348
|
|
$
|
259,559
|
|
||||
|
Long-Term Debt and Capital Leases, Less Current Installments
|
$
|
167,126
|
|
$
|
200,460
|
|
$
|
187,002
|
|
$
|
225,365
|
|
$
|
154,046
|
|
||||
|
Total Debt
|
$
|
190,410
|
|
$
|
225,672
|
|
$
|
188,014
|
|
$
|
247,282
|
|
$
|
156,811
|
|
||||
|
Shareholders' Investment Attributable to Shareholders of Crawford & Company
|
$
|
171,288
|
|
$
|
182,320
|
|
$
|
153,883
|
|
$
|
113,693
|
|
$
|
172,937
|
|
||||
|
Total Capital
|
$
|
361,698
|
|
$
|
407,992
|
|
$
|
341,897
|
|
$
|
360,975
|
|
$
|
329,748
|
|
||||
|
Current Ratio
|
1.4:1
|
|
1.4:1
|
|
1.6:1
|
|
1.4:1
|
|
1.4:1
|
|
|||||||||
|
Total Debt to Total Capital Ratio
|
52.6
|
%
|
55.3
|
%
|
55.0
|
%
|
68.5
|
%
|
47.6
|
%
|
|||||||||
|
Return on Average Shareholders' Investment
|
14.7
|
%
|
16.5
|
%
|
26.9
|
%
|
(31.7
|
)%
|
16.4
|
%
|
|||||||||
|
Cash Provided by Operating Activities
|
$
|
52,419
|
|
$
|
40,757
|
|
$
|
98,864
|
|
$
|
61,655
|
|
$
|
6,606
|
|
||||
|
Cash Provided by (Used in) Investing Activities
|
$
|
6,449
|
|
$
|
(81,866
|
)
|
$
|
(32,966
|
)
|
$
|
(101,178
|
)
|
$
|
(31,767
|
)
|
||||
|
Cash (Used in) Provided by Financing Activities
|
$
|
(58,739
|
)
|
$
|
10,343
|
|
$
|
(55,151
|
)
|
$
|
67,889
|
|
$
|
4,532
|
|
||||
|
Shareholders' Investment Attributable to Shareholders of Crawford & Company Per Diluted Share
|
$
|
3.07
|
|
$
|
3.21
|
|
$
|
2.74
|
|
$
|
2.06
|
|
$
|
3.11
|
|
||||
|
Cash Dividends Per Share:
|
|||||||||||||||||||
|
CRD-A
|
$
|
0.28
|
|
$
|
0.28
|
|
$
|
0.28
|
|
$
|
0.28
|
|
$
|
0.24
|
|
||||
|
CRD-B
|
$
|
0.20
|
|
$
|
0.20
|
|
$
|
0.20
|
|
$
|
0.20
|
|
$
|
0.18
|
|
||||
|
Weighted-Average Shares and Share-Equivalents:
|
|||||||||||||||||||
|
Basic
|
55,254
|
|
55,928
|
|
55,483
|
|
55,286
|
|
54,927
|
|
|||||||||
|
Diluted
|
55,882
|
|
56,764
|
|
56,220
|
|
55,286
|
|
55,673
|
|
|||||||||
15
______________________
|
(1)
|
This is a segment financial measure calculated in accordance with ASC Topic 280, "Segment Reporting," and representing segment earnings before certain unallocated corporate and shared costs and credits,
net corporate interest expense, stock option expense, amortization of customer-relationship intangible assets, goodwill and intangible asset impairment charges, restructuring and special charges, loss on disposition of business line, income taxes, and net income or loss attributable to noncontrolling interests and redeemable noncontrolling interests.
|
|
(2)
|
The Company computes earnings (loss) per share of CRD-A and CRD-B using the two-class method, which allocates the undistributed earnings (loss) for each period to each class on a proportionate basis. The Company's Board of Directors has the right, but not the obligation, to declare higher dividends on CRD-A than on CRD-B, subject to certain limitations. In periods when the dividend is the same for CRD-A and CRD-B or when no dividends are declared or paid to either class, the two-class method generally will yield the same earnings (loss) per share for CRD-A and CRD-B.
|
16
ITEM 7.
MANAGEMENT'S DISCUSSION AND ANALYSIS OF FINANCIAL CONDITION AND RESULTS
OF OPERATIONS
The following Management's Discussion and Analysis of Financial Condition and Results of Operations ("MD&A") is intended to help the reader understand Crawford & Company, our operations, and our business environment. This MD&A is provided as a supplement to — and should be read in conjunction with — our audited consolidated financial statements and the accompanying notes thereto contained in Item 8, "Financial Statements and Supplementary Data," of this Annual Report on Form 10-K. As described in Note 1, "Significant Accounting and Reporting Policies," of those accompanying audited consolidated financial statements, financial results from our operations outside of the U.S., Canada, the Caribbean, and certain subsidiaries in the Philippines, are reported and consolidated on a two-month delayed basis in accordance with the provisions of ASC 810, "Consolidation," in order to provide sufficient time for accumulation of their results. Accordingly, the Company's
December 31, 2018
,
2017
, and
2016
consolidated financial statements include the financial position of such operations as of October 31,
2018
and
2017
, respectively, and the results of their operations and cash flows for the fiscal periods ended October 31,
2018
,
2017
and
2016
, respectively.
Business Overview
Based in Atlanta, Georgia, Crawford & Company (www.crawco.com) is
the world's largest publicly listed independent provider of claims management and outsourcing solutions to the risk management and insurance industry, as well as to self-insured entities, with an expansive global network serving clients
in more tha
n
70
coun
tries. Shares of the Company's two classes of common stock are traded on the NYSE under the symbols CRD-A and CRD-B, respectively.
The Company's two classes of stock are substantially identical, except with respect to voting rights and the Company's ability to pay greater cash dividends on the non-voting Class A Common Stock than on the voting Class B Common Stock, subject to certain limitations. In addition, with respect to mergers or similar transactions, holders of Class A Common Stock must receive the same type and amount of consideration as holders of Class B Common Stock, unless different consideration is approved by the holders of 75% of the Class A Common Stock, voting as a class.
As discussed in more detail in subsequent sections of this MD&A, we have three operating segments:
Crawford Claims Solutions
,
Crawford TPA Solutions: Broadspire
, and
Crawford Specialty Solutions
. Our three operating segments represent components of the Company for which separate financial information is available, and which is evaluated regularly by our chief operating decision maker ("CODM") in deciding how to allocate resources and in assessing operating performance.
Crawford Claims Solutions
serves the global property and casualty insurance company markets.
Crawford TPA Solutions: Broadspire
serves the global casualty, disability and self-insurance marketplace worldwide.
Crawford Specialty Solutions
serves the global property and casualty insurance company markets, and prior to the sale of our
Garden City Group
business line in June 2018, the class action, regulatory, mass tort, bankruptcy, and other legal settlement markets.
Insurance companies rely on us for certain services such as field investigation and the evaluation of property and casualty insurance claims.
Self-insured entities typically rely on us for a broader range of services. In addition to field investigation and claims evaluation, we may also provide initial loss reporting services for their claimants, loss mitigation services such as medical bill review, medical case management and vocational rehabilitation, risk management information services, and trust fund administration to pay their claims.
Our Contractor Connection service line provides a managed contractor network to insurance carriers and consumer markets. Prior to the
June 15, 2018
sale, our
Garden City Group
service line provided legal settlement administration services related to class action settlements, mass tort claims and bankruptcies, including identifying and qualifying class members, determining and dispensing settlement payments, and administering settlement funds.
The global claims management services market is highly competitive and comprised of a large number of companies that vary in size and that offer a varied scope of services. The demand from insurance companies and self-insured entities for services provided by independent claims service firms like us is largely dependent on industry-wide claims volumes, which are affected by, among other things, the insurance underwriting cycle, weather-related events, general economic activity, overall employment levels and workplace injury rates. Demand is also impacted by decisions insurance companies and self-insured entities make with respect to the level of claims outsourced to independent claim service firms as opposed to those handled by their own in-house claims adjusters. In addition, our ability to retain clients and maintain or increase case referrals is also dependent in part on our ability to continue to provide high-quality, competitively priced services and effective sales efforts.
17
We typically earn our revenues on an individual fee-per-claim basis for claims management services we provide to insurance companies and self-insured entities. Accordingly, the volume of claim referrals to us is a key driver of our revenues. Generally, fees are earned over time on cases as services are provided, which generally occurs in the period the case is assigned to us, although sometimes a portion or substantially all of the revenues generated by a specific case assignment will be earned in subsequent periods. We cannot predict the future trend of case volumes for a number of reasons, including the frequency and severity of weather-related cases and the occurrence of natural and man-made disasters, which are a significant source of cases for us and are not subject to accurate forecasting.
On
June 15, 2018
, the Company completed the sale of its
Garden City Group
business (the “GCG Business”) to EPIQ Class Action & Claims Solutions, Inc. ("EPIQ") for cash proceeds of $42.0 million, subject to post-closing working capital adjustments. Adjusted proceeds totaled $42.6 million including the working capital adjustment which was received in December 2018. At the time of the disposal, the GCG Business included total assets of $70.6 million and total liabilities of $10.1 million. The total asset balance was primarily comprised of accounts receivable, unbilled revenues and capitalized software costs. After including transaction and other costs related to the sale, the Company recognized a pretax loss on the disposal of $20.3 million. The loss on disposal is presented in the Consolidated Statements of Operations as a separate charge "Loss on disposition of business line".
On January 4, 2017, the Company acquired
85%
of the outstanding membership interests of WeGoLook
®
, LLC, an Oklahoma limited liability company, and certain non-compete agreements, for consideration of $36.1 million on a debt free valuation basis. WeGoLook provides a variety of on-demand inspection, verification, and other field services for businesses and consumers through a mobile platform of independent contractors.
We initiated various restructuring plans through 2017 that were intended to, among other things, reduce overhead costs in certain functions and in our business segments, and streamline senior management to reduce costs and further improve execution. These plans included restructuring and integration costs and other special charges discussed in Note 17, "Restructuring and Special Charges" to the audited consolidated financial statements included in Item 8 of this Annual Report on Form 10-K. Restructuring and special charges, inclusive of costs related to the establishment and phase-in of the Centers, for these and other similar plans totaled $11.6 million in 2017 and $5.7 million in 2016. We reported no restructuring and special charges in 2018 and we do not anticipate any restructuring and special charges in 2019.
There were no goodwill impairment charges in 2018 or 2016. We incurred a non-cash goodwill impairment charge in 2017 of $19.6 million. See the "Critical Accounting Policies" in Item 7 and Note 4, "Goodwill and Intangible Assets" of our accompanying audited consolidated financial statements included in Item 8 of this Annual Report on Form 10-K for further discussion about goodwill impairment charges. In 2018, the Company recognized an impairment of $1.1 million related to an indefinite-lived trade name due to a combination of achieving less than forecasted revenue compared to previous modeled results and further reduced forecasted revenue associated with the trade name.
On December 22, 2017, the Tax Cuts and Jobs Act (the “Tax Act”) was enacted. The Tax Act significantly changes U.S. Federal income tax law. The changes include, but are not limited to: a federal corporate rate reduction from 35% to 21%, limitations on the deductibility of interest expense and executive compensation, creation of a new minimum tax on global intangible low taxed income (“GILTI”), and a one-time U.S. tax liability on those earnings which have not previously been repatriated to the U.S. (the “Transition Tax”) as a result of the transition of U.S. international taxation from a worldwide tax system to a modified territorial tax system. In connection with our initial analysis of the impact of the Tax Act, we recorded a provisional estimate in accordance with Staff Accounting Bulletin No. 118 (“SAB 118”) of net tax expense of $3.8 million in the period ended December 31, 2017. This expense consisted of provisional estimates of $7.6 million net expense for the Transition Tax, which we estimated would be fully offset by foreign tax credit carryforwards, and $3.8 million net benefit for remeasurement of our domestic deferred tax balances for the corporate rate reduction. In the period ended December 31, 2018, the Company completed its accounting for the Tax Act in accordance with SAB 118. As a result, the Company recorded additional income tax expense of $3.6 million. This expense consisted of substantially all of the $7.0 million valuation allowance established against foreign tax credits and $0.1 million for the revaluation of deferred taxes, net of $3.5 million of Transition Tax release of uncertain tax positions and adjustments. The Company has completed the accounting for the Tax Act within the one year measurement period, as allowed under SAB 118.
See Note 8, "Income Taxes” of our accompanying audited consolidated financial statements included in Item 8 of this Annual Report on Form 10-K for further discussion about income taxes.
18
Results of Operations
Executive Summary
Consolidated revenues before reimbursements were
$1.071 billion
in
2018
, a decrease of
3.2%
compared with
$1.106 billion
in
2017
. Net income attributable to Crawford & Company was
$26.0 million
in
2018
, compared with
$27.7 million
in
2017
. During
2018
, the Company did not record any restructuring and special charges, compared to
$12.1 million
in
2017
. During 2018, the Company recorded a loss on disposition of business line totaling
$20.3 million
.
Consolidated revenues before reimbursements decreased
3.2%
in
2018
due to revenue declines in the Crawford Claims Solutions and
Crawford Specialty Solutions
segments, partially offset by an increase in revenues in the Crawford TPA Solutions: Broadspire segment. Changes in foreign exchange rates increased our segment revenues by $7.7 million, or approximately 0.7%, for 2018 compared with 2017.
The decrease in revenues in the
Crawford Specialty Solutions
segment was primarily due to the disposition of the
Garden City Group
business as of
June 15, 2018
, which represents a $46.3 million reduction in revenues in 2018. See Note 3, "Acquisitions and Disposition of Business Line" of our accompany consolidated financial statements for further discussion about this transaction.
Revenues in the
Crawford Specialty Solutions
segment were also impacted due to a change in the operating model in the U.K. contractor repair business where we are now acting as an agent instead of principal in certain relationships with clients related to our Contractor Connection service line, which represents a $11.0 million revenue reduction for the 2018 period as compared to the prior year. This change had no impact to operating earnings. Excluding the
Garden City Group
business, the change in the operating model in the U.K. contractor repair business, and the change in foreign exchange rates, consolidated revenues before reimbursements increased $14.5 million, or 1.4% compared with 2017.
The decrease in revenues in the Crawford Claims Solutions segment was due to the absence of hurricane activity that was present in the U.S. and Australia in 2017, which represents a $19.9 million decrease in segment revenues. The increase in revenues in the Crawford TPA Solutions: Broadspire segment was due to increased cases in the U.S. and Canada.
Segment operating earnings (a measure of segment operating performance used by our management that is defined and discussed in more detail below) decreased in each of our operating segments, due primarily to an increase in centralized administrative support costs during 2018 primarily due to investments in technology and expanding sales efforts.
Although operating earnings is the primary financial performance measure used by our senior management and CODM to evaluate the financial performance of our operating segments and make resource allocation and certain compensation decisions, we believe that a non-GAAP discussion and analysis of segment gross profit is also helpful in understanding the results of our segment operations excluding indirect centralized administrative support costs. Our discussion and analysis of segment gross profit includes the revenues and direct expenses of each segment. Segment gross profit is defined as revenues, less direct costs, which exclude indirect centralized administrative support costs allocated to the business.
Segment gross profit improved in our Crawford Claims Solutions and Crawford TPA Solutions: Broadspire segments, due to a reduction in direct expenses, however there was a decline in our
Crawford Specialty Solutions
segment due primarily to higher direct costs in the
Garden City Group
service line prior to its disposal.
In the Crawford Claims Solutions segment, operating earnings declined primarily due to an increase in centralized indirect administrative support costs during 2018. Excluding indirect support costs, gross profit improved from $75.7 million, or 20.7% of revenues before reimbursements in 2017, to $76.9 million, or 21.3% of revenues before reimbursements in 2018, due primarily to cost reductions in Canada and lower compensation costs in 2018 compared to 2017 related to the hurricane activity in the U.S.
In the Crawford TPA Solutions: Broadspire segment, operating earnings declined primarily due to an increase in centralized indirect administrative support costs during 2018. Excluding indirect support costs, gross profit improved from $106.1 million, or 27.2% of revenues before reimbursements in 2017, to $109.2 million, but declined as a percent of revenues before reimbursements in 2018 to 26.9%, as direct costs grew at a higher rate than revenues.
19
In the
Crawford Specialty Solutions
segment, operating earnings declined as a result of increased compensation expense and centralized indirect administrative support costs compared to 2017, and also due to the
Garden City Group
disposition referenced above. Excluding indirect support costs, gross profit decreased from $115.9 million, or 33.1% of revenues before reimbursements in 2017, to $106.9 million due to the Garden City Group disposal, but increased as a percent of revenues before reimbursements in 2018 to 35.1% due to higher direct costs in the
Garden City Group
service line prior to its disposal.
Cost of services provided, before reimbursements, decreased
$28.3 million
, or
3.6%
for 2018 compared with 2017. The decrease was primarily due to the disposition of the
Garden City Group
referenced above, and lower compensation costs in our Crawford Claims Solutions segment due to the reduction in hurricane-related revenues.
Selling, general and administrative ("SG&A") expenses were $2.6 million higher, an increase of 1.1%, in
2018
compared to
2017
. The increase in 2018 was due to an increase in professional fees, including costs related to the implementation of the Tax Act, software amortization and other administrative expenses, partially offset by a decrease in advertising expenses in our Contractor Connection service line and lower Garden City Group expenses following its disposition in June 2018.
Segment Operating Earnings
We believe that a discussion and analysis of the segment operating earnings of our three operating segments is helpful in understanding the results of our operations. Operating earnings is our segment measure of profitability presented in conformity with the Financial Accounting Standards Board's ("FASB") Accounting Standards Codification ("ASC") Topic 280 "Segment Reporting." Operating earnings is the primary financial performance measure used by our senior management and CODM to evaluate the financial performance of our operating segments and make resource allocation and certain compensation decisions.
We believe operating earnings is a measure that is useful to others in that it allows them to evaluate segment operating performance using the same criteria used by our senior management and CODM. Segment operating earnings represent segment earnings, including the direct and indirect costs of certain administrative functions required to operate our business, but excludes unallocated corporate and shared costs and credits,
net corporate interest expense, stock option expense, amortization of customer-relationship intangible assets, goodwill and intangible asset impairment charges, restructuring and special charges, loss on disposition of business line, income taxes, and net income or loss attributable to noncontrolling interests and redeemable noncontrolling interests.
Administrative functions such as finance, human resources, information technology, quality and compliance, exist in both a centralized shared-service arrangement and within certain operations. Each of these functions are managed by centralized management and we allocate the costs of those services to the segments as indirect costs based on usage.
Gross profit is defined as segment revenues, less segment direct costs, which exclude centralized indirect administrative support costs allocated to the business.
Income taxes, net corporate interest expense, stock option expense, and amortization of customer-relationship intangible assets are recurring components of our net income, but they are not considered part of our segment operating earnings because they are managed on a corporate-wide basis. Income taxes are calculated for the Company on a consolidated basis based on statutory rates in effect in the various jurisdictions in which we provide services, and vary significantly by jurisdiction. Net corporate interest expense results from capital structure decisions made by senior management and the Board of Directors, affecting the Company as a whole. Stock option expense represents the non-cash costs generally related to stock options and employee stock purchase plan expenses which are not allocated to our operating segments. Amortization expense is a non-cash expense for finite-lived customer-relationship and trade name intangible assets acquired in business combinations. None of these costs relate directly to the performance of our services or operating activities and, therefore, are excluded from segment operating earnings in order to better assess the results of each segment's operating activities on a consistent basis.
Unallocated corporate and shared costs and credits include expenses and credits related to our chief executive officer and Board of Directors, certain provisions for bad debt allowances or subsequent recoveries such as those related to bankrupt clients, defined benefit pension costs or credits for our frozen U.S. pension plan, certain unallocated professional fees, and certain self-insurance costs and recoveries that are not allocated to our individual operating segments.
20
Restructuring and special charges, as well as loss on disposition of business line, goodwill impairment charges and impairment of intangible assets arise from time to time from events (such as internal restructurings, losses on subleases, establishment of new operations, and asset impairments) that are not allocated to any particular segment since they historically have not regularly impacted our performance and are not expected to impact our future performance on a regular basis.
Additional discussion and analysis of our income taxes, net corporate interest expense, stock option expense, amortization of customer-relationship intangible assets, unallocated corporate and shared costs, goodwill impairment charges and impairment of intangible assets, restructuring and special charges, and loss on disposition of business line follows the discussion and analysis of the results of operations of our three operating segments.
Segment Revenues
In the normal course of business, our operating segments incur certain out-of-pocket expenses that are thereafter reimbursed by our clients. Under GAAP, these out-of-pocket expenses and associated reimbursements are required to be included when reporting expenses and revenues, respectively, in our consolidated results of operations as the Company is considered the principal in these transactions. In the discussion and analysis of results of operations which follows, we do not include a gross up of expenses and revenues for these pass-through reimbursed expenses. The amounts of reimbursed expenses and related revenues offset each other in our results of operations with no impact to our net income or operating earnings. A reconciliation of revenues before reimbursements to consolidated revenues determined in accordance with GAAP is self-evident from the face of the accompanying statements of operations. Unless noted in the following discussion and analysis, revenue amounts exclude reimbursements for out-of-pocket expenses.
Our segment results are impacted by changes in foreign exchange rates. We believe that a non-GAAP discussion and analysis of segment revenues before reimbursements by major region, based on actual exchange rates and using a constant exchange rate, is helpful in understanding the results of our segment operations. Revenues in our
Crawford Specialty Solutions
segment are also impacted by a change in the operating model in the U.K. contractor repair business where we are now acting as an agent instead of principal in certain relationships with clients related to our Contractor Connection service line, and the disposition of the
Garden City Group
service line as of
June 15, 2018
.
Segment Expenses
Our discussion and analysis of segment operating expenses is comprised of two components: "Direct Compensation, Fringe Benefits & Non-Employee Labor" and "Expenses Other Than Direct Compensation, Fringe Benefits & Non-Employee Labor."
"Direct Compensation, Fringe Benefits & Non-Employee Labor" includes direct compensation, payroll taxes, and benefits provided to the employees of each segment, as well as payments to outsourced service providers that augment our staff in each segment. As a service company, these costs represent our most significant and variable operating expenses.
Costs of administrative functions, including direct compensation, payroll taxes, and benefits, are managed centrally and considered indirect costs. The allocated centralized indirect administrative support costs of our shared-services infrastructure are allocated to each segment based on usage and reflected within "Expenses Other Than Direct Compensation, Fringe Benefits & Non-Employee Labor" of each segment.
In addition to allocated corporate and shared costs, "Expenses Other Than Direct Compensation, Fringe Benefits & Non-Employee Labor" includes travel and entertainment, office rent and occupancy costs, automobile expenses, office operating expenses, data processing costs, cost of risk, professional fees, and amortization and depreciation expense other than amortization of customer-relationship intangible assets.
In addition, we believe that a non-GAAP discussion and analysis of segment gross profit is helpful in understanding the results of our segment operations, excluding indirect centralized administrative support costs. Our discussion and analysis of segment gross profit includes the revenues and direct expenses of each segment.
Unless noted in the following discussion and analysis, revenue amounts exclude reimbursements for out-of-pocket expenses and expense amounts exclude reimbursed out-of-pocket expenses.
21
Operating results for our segments reconciled to income before income taxes and net income attributable to shareholders of Crawford & Company, are as shown in the following table.
|
% Change from Prior Year
|
||||||||||||||||||
|
Year Ended December 31,
|
2018
|
2017
|
2016
|
2018
|
2017
|
|||||||||||||
|
(In thousands, except percentages)
|
||||||||||||||||||
|
Revenues Before Reimbursements:
|
||||||||||||||||||
|
Crawford Claims Solutions
|
$
|
361,107
|
|
$
|
365,074
|
|
$
|
341,555
|
|
(1.1
|
)%
|
6.9
|
%
|
|||||
|
Crawford TPA Solutions: Broadspire
|
405,335
|
|
390,583
|
|
382,657
|
|
3.8
|
%
|
2.1
|
%
|
||||||||
|
Crawford Specialty Solutions
|
304,529
|
|
350,175
|
|
385,074
|
|
(13.0
|
)%
|
(9.1
|
)%
|
||||||||
|
Total, before reimbursements
|
1,070,971
|
|
1,105,832
|
|
1,109,286
|
|
(3.2
|
)%
|
(0.3
|
)%
|
||||||||
|
Reimbursements
|
52,008
|
|
57,877
|
|
68,302
|
|
(10.1
|
)%
|
(15.3
|
)%
|
||||||||
|
Total Revenues
|
$
|
1,122,979
|
|
$
|
1,163,709
|
|
$
|
1,177,588
|
|
(3.5
|
)%
|
(1.2
|
)%
|
|||||
|
Direct Compensation, Fringe Benefits & Non-Employee Labor:
|
||||||||||||||||||
|
Crawford Claims Solutions
|
$
|
240,185
|
|
$
|
244,845
|
|
$
|
219,933
|
|
(1.9
|
)%
|
11.3
|
%
|
|||||
|
% of related revenues before reimbursements
|
66.5
|
%
|
67.1
|
%
|
64.4
|
%
|
|
|
||||||||||
|
Crawford TPA Solutions: Broadspire
|
235,813
|
|
220,743
|
|
214,821
|
|
6.8
|
%
|
2.8
|
%
|
||||||||
|
% of related revenues before reimbursements
|
58.2
|
%
|
56.5
|
%
|
56.2
|
%
|
|
|
||||||||||
|
Crawford Specialty Solutions
|
155,709
|
|
169,134
|
|
185,379
|
|
(7.9
|
)%
|
(8.8
|
)%
|
||||||||
|
% of related revenues before reimbursements
|
51.1
|
%
|
48.4
|
%
|
48.1
|
%
|
|
|
||||||||||
|
Total
|
$
|
631,707
|
|
$
|
634,722
|
|
$
|
620,133
|
|
(0.5
|
)%
|
2.4
|
%
|
|||||
|
% of Revenues before reimbursements
|
59.0
|
%
|
57.4
|
%
|
55.9
|
%
|
||||||||||||
|
Expenses Other than Direct Compensation, Fringe Benefits & Non-Employee Labor:
|
||||||||||||||||||
|
Crawford Claims Solutions
|
$
|
111,086
|
|
$
|
102,702
|
|
$
|
107,251
|
|
8.2
|
%
|
(4.2
|
)%
|
|||||
|
% of related revenues before reimbursements
|
30.8
|
%
|
28.1
|
%
|
31.4
|
%
|
|
|
||||||||||
|
Crawford TPA Solutions: Broadspire
|
132,613
|
|
131,616
|
|
131,316
|
|
0.8
|
%
|
0.2
|
%
|
||||||||
|
% of related revenues before reimbursements
|
32.7
|
%
|
33.7
|
%
|
34.3
|
%
|
|
|
||||||||||
|
Crawford Specialty Solutions
|
97,784
|
|
127,101
|
|
134,054
|
|
(23.1
|
)%
|
(5.2
|
)%
|
||||||||
|
% of related revenues before reimbursements
|
32.1
|
%
|
36.3
|
%
|
34.8
|
%
|
|
|
||||||||||
|
Total, before reimbursements
|
341,483
|
|
361,419
|
|
372,621
|
|
(5.5
|
)%
|
(3.0
|
)%
|
||||||||
|
% of Revenues before reimbursements
|
31.9
|
%
|
32.7
|
%
|
33.6
|
%
|
|
|
||||||||||
|
Reimbursements
|
52,008
|
|
57,877
|
|
68,302
|
|
(10.1
|
)%
|
(15.3
|
)%
|
||||||||
|
Total
|
$
|
393,491
|
|
$
|
419,296
|
|
$
|
440,923
|
|
(6.2
|
)%
|
(4.9
|
)%
|
|||||
|
% of Revenues
|
35.0
|
%
|
36.0
|
%
|
37.4
|
%
|
||||||||||||
|
Segment Operating Earnings:
|
||||||||||||||||||
|
Crawford Claims Solutions
|
$
|
9,836
|
|
$
|
17,527
|
|
$
|
14,371
|
|
(43.9
|
)%
|
22.0
|
%
|
|||||
|
% of related revenues before reimbursements
|
2.7
|
%
|
4.8
|
%
|
4.2
|
%
|
|
|
||||||||||
|
Crawford TPA Solutions: Broadspire
|
36,909
|
|
38,224
|
|
36,520
|
|
(3.4
|
)%
|
4.7
|
%
|
||||||||
|
% of related revenues before reimbursements
|
9.1
|
%
|
9.8
|
%
|
9.5
|
%
|
|
|
||||||||||
|
Crawford Specialty Solutions
|
51,036
|
|
53,418
|
|
65,641
|
|
(4.5
|
)%
|
(18.6
|
)%
|
||||||||
|
% of related revenues before reimbursements
|
16.8
|
%
|
15.3
|
%
|
17.0
|
%
|
|
|
||||||||||
|
Deduct:
|
|
|
||||||||||||||||
|
Unallocated corporate and shared costs and credits, net
|
(9,321
|
)
|
(13,463
|
)
|
(24,403
|
)
|
(30.8
|
)%
|
(44.8
|
)%
|
||||||||
|
Net corporate interest expense
|
(10,109
|
)
|
(9,062
|
)
|
(9,185
|
)
|
11.6
|
%
|
(1.3
|
)%
|
||||||||
|
Stock option expense
|
(1,742
|
)
|
(1,718
|
)
|
(621
|
)
|
1.4
|
%
|
176.7
|
%
|
||||||||
|
Amortization of customer-relationship intangible assets
|
(11,152
|
)
|
(10,982
|
)
|
(9,592
|
)
|
1.5
|
%
|
14.5
|
%
|
||||||||
|
Goodwill and intangible asset impairment charges
|
(1,056
|
)
|
(19,598
|
)
|
—
|
|
(94.6
|
)%
|
nm
|
|
||||||||
|
Restructuring and special charges
|
—
|
|
(12,084
|
)
|
(9,490
|
)
|
nm
|
|
27.3
|
%
|
||||||||
|
Loss on disposition of business line
|
(20,270
|
)
|
—
|
|
—
|
|
nm
|
|
nm
|
|
||||||||
|
Income Before Income Taxes
|
44,131
|
|
42,262
|
|
63,241
|
|
4.4
|
%
|
(33.2
|
)%
|
||||||||
|
Income taxes
|
(18,542
|
)
|
(15,039
|
)
|
(25,565
|
)
|
23.3
|
%
|
(41.2
|
)%
|
||||||||
|
Net Income
|
25,589
|
|
27,223
|
|
37,676
|
|
(6.0
|
)%
|
(27.7
|
)%
|
||||||||
|
Net loss (income) attributable to noncontrolling interests and redeemable noncontrolling interests
|
389
|
|
442
|
|
(1,710
|
)
|
(12.0
|
)%
|
(125.8
|
)%
|
||||||||
|
Net Income Attributable to Shareholders of Crawford & Company
|
$
|
25,978
|
|
$
|
27,665
|
|
$
|
35,966
|
|
(6.1
|
)%
|
(23.1
|
)%
|
|||||
nm
= not meaningful
22
The table below, read together with the reconciliation on the previous page, represents gross profit for our segments reconciled to net income attributable to shareholders of Crawford & Company.
|
% Change from Prior Year
|
||||||||||||||||||
|
Year Ended December 31,
|
2018
|
2017
|
2016
|
2018
|
2017
|
|||||||||||||
|
(In thousands, except percentages)
|
||||||||||||||||||
|
Revenues Before Reimbursements:
|
||||||||||||||||||
|
Crawford Claims Solutions
|
$
|
361,107
|
|
$
|
365,074
|
|
$
|
341,555
|
|
(1.1
|
)%
|
6.9
|
%
|
|||||
|
Crawford TPA Solutions: Broadspire
|
405,335
|
|
390,583
|
|
382,657
|
|
3.8
|
%
|
2.1
|
%
|
||||||||
|
Crawford Specialty Solutions
|
304,529
|
|
350,175
|
|
385,074
|
|
(13.0
|
)%
|
(9.1
|
)%
|
||||||||
|
Total, before reimbursements
|
1,070,971
|
|
1,105,832
|
|
1,109,286
|
|
(3.2
|
)%
|
(0.3
|
)%
|
||||||||
|
Direct Expenses:
|
||||||||||||||||||
|
Crawford Claims Solutions
|
$
|
284,241
|
|
$
|
289,399
|
|
$
|
267,645
|
|
(1.8
|
)%
|
8.1
|
%
|
|||||
|
% of related revenues before reimbursements
|
78.7
|
%
|
79.3
|
%
|
78.4
|
%
|
||||||||||||
|
Crawford TPA Solutions: Broadspire
|
296,111
|
|
284,529
|
|
277,802
|
|
4.1
|
%
|
2.4
|
%
|
||||||||
|
% of related revenues before reimbursements
|
73.1
|
%
|
72.8
|
%
|
72.6
|
%
|
||||||||||||
|
Crawford Specialty Solutions
|
197,592
|
|
234,283
|
|
262,330
|
|
(15.7
|
)%
|
(10.7
|
)%
|
||||||||
|
% of related revenues before reimbursements
|
64.9
|
%
|
66.9
|
%
|
68.1
|
%
|
||||||||||||
|
Total segment direct expenses
|
777,944
|
|
808,211
|
|
807,777
|
|
(3.7
|
)%
|
0.1
|
%
|
||||||||
|
% of related revenues before reimbursements
|
72.6
|
%
|
73.1
|
%
|
72.8
|
%
|
|
|
|
|
||||||||
|
Segment Gross Profit:
|
||||||||||||||||||
|
Crawford Claims Solutions
|
$
|
76,866
|
|
$
|
75,675
|
|
$
|
73,910
|
|
1.6
|
%
|
2.4
|
%
|
|||||
|
% of related revenues before reimbursements
|
21.3
|
%
|
20.7
|
%
|
21.6
|
%
|
|
|
|
|
||||||||
|
Crawford TPA Solutions: Broadspire
|
109,224
|
|
106,054
|
|
104,855
|
|
3.0
|
%
|
1.1
|
%
|
||||||||
|
% of related revenues before reimbursements
|
26.9
|
%
|
27.2
|
%
|
27.4
|
%
|
|
|
|
|
||||||||
|
Crawford Specialty Solutions
|
106,937
|
|
115,892
|
|
122,744
|
|
(7.7
|
)%
|
(5.6
|
)%
|
||||||||
|
% of related revenues before reimbursements
|
35.1
|
%
|
33.1
|
%
|
31.9
|
%
|
|
|
|
|
||||||||
|
Total segment gross profit
|
293,027
|
|
297,621
|
|
301,509
|
|
(1.5
|
)%
|
(1.3
|
)%
|
||||||||
|
% of related revenues before reimbursements
|
27.4
|
%
|
26.9
|
%
|
27.2
|
%
|
|
|
|
|
||||||||
|
Segment Indirect Costs:
|
|
|
|
|
||||||||||||||
|
Crawford Claims Solutions
|
$
|
67,030
|
|
$
|
58,148
|
|
$
|
59,539
|
|
15.3
|
%
|
(2.3
|
)%
|
|||||
|
% of related revenues before reimbursements
|
18.6
|
%
|
15.9
|
%
|
17.4
|
%
|
||||||||||||
|
Crawford TPA Solutions: Broadspire
|
72,315
|
|
67,830
|
|
68,335
|
|
6.6
|
%
|
(0.7
|
)%
|
||||||||
|
% of related revenues before reimbursements
|
17.8
|
%
|
17.4
|
%
|
17.9
|
%
|
||||||||||||
|
Crawford Specialty Solutions
|
55,901
|
|
62,474
|
|
57,103
|
|
(10.5
|
)%
|
9.4
|
%
|
||||||||
|
% of related revenues before reimbursements
|
18.4
|
%
|
17.8
|
%
|
14.8
|
%
|
||||||||||||
|
Total segment indirect costs
|
195,246
|
|
188,452
|
|
184,977
|
|
3.6
|
%
|
1.9
|
%
|
||||||||
|
% of related revenues before reimbursements
|
18.2
|
%
|
17.0
|
%
|
16.7
|
%
|
||||||||||||
|
Segment Operating Earnings:
|
||||||||||||||||||
|
Crawford Claims Solutions
|
$
|
9,836
|
|
$
|
17,527
|
|
$
|
14,371
|
|
(43.9
|
)%
|
22.0
|
%
|
|||||
|
% of related revenues before reimbursements
|
2.7
|
%
|
4.8
|
%
|
4.2
|
%
|
||||||||||||
|
Crawford TPA Solutions: Broadspire
|
36,909
|
|
38,224
|
|
36,520
|
|
(3.4
|
)%
|
4.7
|
%
|
||||||||
|
% of related revenues before reimbursements
|
9.1
|
%
|
9.8
|
%
|
9.5
|
%
|
||||||||||||
|
Crawford Specialty Solutions
|
51,036
|
|
53,418
|
|
65,641
|
|
(4.5
|
)%
|
(18.6
|
)%
|
||||||||
|
% of related revenues before reimbursements
|
16.8
|
%
|
15.3
|
%
|
17.0
|
%
|
||||||||||||
* See table on the previous page for a reconciliation of segment operating earnings to Net income attributable to shareholders of Crawford & Company.
23
Y
EAR
E
NDED
D
ECEMBER
31, 2018
C
OMPARED
W
ITH
Y
EAR
E
NDED
D
ECEMBER
31, 2017
CRAWFORD CLAIMS SOLUTIONS SEGMENT
Operating Earnings
Operating earnings for our
Crawford Claims Solutions
segment decreased from
$17.5 million
in
2017
to
$9.8 million
in
2018
, representing an operating margin of
2.7%
in
2018
compared with
4.8%
in
2017
. Operating earnings decreased from
2017
to
2018
primarily due to lower revenues in the U.S. and from an increase in centralized administrative support costs as compared to 2017. Excluding centralized indirect support costs, gross profit improved from $75.7 million, or 20.7% of revenues before reimbursements in 2017, to $76.9 million, or 21.3% of revenues before reimbursements in 2018, due primarily to cost reductions in Canada and lower compensation costs in 2018 compared to 2017 related to the hurricane activity in the U.S. in the prior year.
Revenues before Reimbursements
Crawford Claims Solutions
revenues are primarily derived from the global property and casualty insurance company markets in the U.S., U.K., Canada, Australia, Europe and Rest of World.
Crawford Claims Solutions
revenues before reimbursements by major region, based on actual exchange rates and using a constant exchange rate were as follows:
|
In thousands (except percentages)
|
|||||||||||||||||
|
Based on actual exchange rates
|
Based on exchange rates for December 31, 2017
|
||||||||||||||||
|
Year Ended December 31,
|
2018
|
2017
|
Variance
|
2018
|
Variance
|
||||||||||||
|
U.S.
|
$
|
150,777
|
|
$
|
166,325
|
|
(9.3
|
)%
|
$
|
150,777
|
|
(9.3
|
)%
|
||||
|
U.K.
|
64,940
|
|
59,297
|
|
9.5
|
%
|
62,736
|
|
5.8
|
%
|
|||||||
|
Canada
|
50,278
|
|
46,055
|
|
9.2
|
%
|
50,633
|
|
9.9
|
%
|
|||||||
|
Australia
|
44,666
|
|
47,136
|
|
(5.2
|
)%
|
45,348
|
|
(3.8
|
)%
|
|||||||
|
Europe
|
30,971
|
|
27,076
|
|
14.4
|
%
|
29,071
|
|
7.4
|
%
|
|||||||
|
Rest of World
|
19,475
|
|
19,185
|
|
1.5
|
%
|
19,283
|
|
0.5
|
%
|
|||||||
|
Total Crawford Claims Solutions Revenues before Reimbursements
|
$
|
361,107
|
|
$
|
365,074
|
|
(1.1
|
)%
|
$
|
357,848
|
|
(2.0
|
)%
|
||||
Overall, there was a decrease in revenues in the
Crawford Claims Solutions
segment in
2018
compared with
2017
. This decrease was primarily due to a decrease in weather-related activity in the U.S. as a result of hurricanes Harvey, Irma and Maria that were present in the prior year.
Revenues before reimbursements from our Crawford Claims Solutions segment totaled
$361.1 million
in 2018 compared with
$365.1 million
in 2017. Changes in foreign exchange rates resulted in an increase of our Crawford Claims Solutions segment revenues by approximately 0.9%, or $3.3 million for 2018. Absent foreign exchange rate fluctuations, Crawford Claims Solutions segment revenues would have been
$357.8 million
for 2018. Revenues in our U.S. operations include revenues from an outsourcing project for a major U.S. insurance carrier, which resulted in $6.9 million and $20.7 million of revenues in 2018 and 2017, respectively, representing a negative variance of 3.8% in Crawford Claim Solutions revenues. Revenues were negatively impacted by a decrease in unit volumes, measured principally by cases received, which decreased revenues 3.1% in 2018 compared with 2017. Changes in product mix and in the rates charged for those services accounted for a 4.9% revenue increase for 2018 compared with the 2017 period.
There was a decrease in revenues in the U.S. for 2018 due to a reduction in hurricane-related activity that was present in 2017. Based on constant foreign exchange rates, there was an increase in revenues in the U.K. for 2018 compared with 2017 due to an increase in weather related case volumes and expanding new services. Revenues in Canada increased in 2018 compared with the 2017 period due to cases resulting from the 2018 windstorms in Ontario. There was a revenue decrease in Australia due to a change in the mix of services provided and a reduction in weather related case activity. The revenue increase in Europe was due to increases in Germany and the Netherlands. The slight increase in revenues in Rest of World for 2018 compared with 2017 was primarily due to weather related case activity in the Philippines, partially offset by a decrease of weather related activity in Latin America.
24
Reimbursed Expenses Included in Total Revenues
Reimbursements for out-of-pocket expenses incurred in our
Crawford Claims Solutions
segment which are included in total Company revenues were
$19.0 million
in
2018
compared to
$21.7 million
in
2017
. The 2018 decrease was due to the decreased revenues, primarily related to the hurricane activity that existed in 2017.
Case Volume Analysis
Crawford Claims Solutions
unit volumes by underlying case category, as measured by cases received, for
2018
and
2017
were as follows:
|
Year Ended December 31,
|
2018
|
2017
|
Variance
|
|||||
|
U.S.
|
312,245
|
|
314,356
|
|
(0.7
|
)%
|
||
|
U.K.
|
58,377
|
|
54,037
|
|
8.0
|
%
|
||
|
Canada
|
42,064
|
|
34,172
|
|
23.1
|
%
|
||
|
Australia
|
33,083
|
|
43,276
|
|
(23.6
|
)%
|
||
|
Europe
|
45,390
|
|
55,570
|
|
(18.3
|
)%
|
||
|
Rest of World
|
20,277
|
|
26,487
|
|
(23.4
|
)%
|
||
|
Total Crawford Claims Solutions Cases Received
|
511,436
|
|
527,898
|
|
(3.1
|
)%
|
||
Overall, there was a
3.1%
decrease in cases received in
Crawford Claims Solutions
in
2018
compared to
2017
. The decrease in U.S. case volumes was due to lower weather related activity in 2018 as compared to 2017, due to the hurricanes that were present in 2017. The U.K. case volumes were higher in the 2018 period due to an increase in weather related activity. There was an increase in Canada due to cases received in 2018 resulting from Ontario windstorms. The decrease in cases in Australia was due to a decline in
high-frequency, low-complexity
property cases that were present in the prior year. There was a reduction in cases received in Europe due to lower
high-frequency, low-complexity
property cases in Belgium and Poland, partially offset by an increase in Germany. The decrease in cases in Rest of World was due to a decline in
high-frequency, low-complexity
property cases in Asia.
Direct Compensation, Fringe Benefits & Non-Employee Labor
The most significant expense in our
Crawford Claims Solutions
segment is the compensation of employees, including related payroll taxes and fringe benefits, and payments to outsourced service providers that augment our staff.
Crawford Claims Solutions
direct compensation, fringe benefits, and non-employee labor expense
, as a percent of segment revenues before reimbursements, was
66.5%
for
2018
and
67.1%
for
2017
. The decrease was primarily due to improved staff utilization in 2018 and the incremental costs to mobilize staff in areas affected by the hurricanes in 2017.
The dollar amount of these expenses decreased from
$244.8 million
in
2017
to
$240.2 million
in
2018
. There was an average of
3,014
FTEs in
2018
compared with an average of
3,040
FTEs in
2017
. The decrease in expenses and FTEs in
2018
was primarily due to the reduction in employees related to the lower revenues in the current period.
Expenses Other than Reimbursements, Direct Compensation, Fringe Benefits & Non-Employee Labor
Crawford Claims Solutions
segment expenses other than reimbursements, direct compensation, fringe benefits, and non-employee labor increased from
$102.7 million
in
2017
to
$111.1 million
in
2018
, and increased as a percent of segment revenues from
28.1%
in
2017
to
30.8%
in
2018
. The increase in both the amount and the expense as a percent of revenues was due to an $8.9 million increase in indirect centralized administrative support costs in the
2018
period, primarily related to investments in technology and expanding sales efforts.
25
CRAWFORD TPA SOLUTIONS: BROADSPIRE SEGMENT
Operating Earnings
Crawford TPA Solutions: Broadspire
segment operating earnings were
$36.9 million
in
2018
, a decrease
of 3.4%
from
2017
operating earnings of
$38.2 million
. The operating margin decreased from
9.8%
in
2017
to
9.1%
in
2018
.
The decrease in operating earnings for the 2018 period resulted from increased compensation expense and an increase in indirect centralized administrative support costs compared to the 2017 period. Excluding centralized indirect support costs, gross profit improved from $106.1 million, or 27.2% of revenues before reimbursements in 2017, to $109.2 million, but declined as a percent of revenues before reimbursements in 2018 to 26.9%, as direct costs grew at a higher rate than revenues.
Revenues before Reimbursements
Crawford TPA Solutions: Broadspire revenues are from the global casualty and disability insurance and self-insured markets in the U.S., U.K., Canada, and Europe and Rest of World. Revenues before reimbursements by major region, based on actual exchange rates and using a constant exchange rate were as follows:
|
In thousands (except percentages)
|
|||||||||||||||||
|
Based on actual exchange rates
|
Based on exchange rates for December 31, 2017
|
||||||||||||||||
|
Year Ended December 31,
|
2018
|
2017
|
Variance
|
2018
|
Variance
|
||||||||||||
|
U.S.
|
$
|
321,744
|
|
$
|
310,102
|
|
3.8
|
%
|
$
|
321,744
|
|
3.8
|
%
|
||||
|
U.K.
|
12,651
|
|
13,165
|
|
(3.9
|
)%
|
12,211
|
|
(7.2
|
)%
|
|||||||
|
Canada
|
36,648
|
|
33,386
|
|
9.8
|
%
|
36,937
|
|
10.6
|
%
|
|||||||
|
Europe and Rest of World
|
34,292
|
|
33,930
|
|
1.1
|
%
|
32,257
|
|
(4.9
|
)%
|
|||||||
|
Total Crawford TPA Solutions: Broadspire Revenues before Reimbursements
|
$
|
405,335
|
|
$
|
390,583
|
|
3.8
|
%
|
$
|
403,149
|
|
3.2
|
%
|
||||
Revenues before reimbursements from our
Crawford TPA Solutions: Broadspire
totaled
$405.3 million
in
2018
, compared to
$390.6 million
in
2017
. Changes in foreign exchange rates increased our Crawford TPA Solutions: Broadspire segment revenues by $2.2 million, or approximately 0.6%, for
2018
compared with
2017
. Absent foreign exchange rate fluctuations,
Crawford TPA Solutions: Broadspire
segment revenues would have been
$403.1 million
in
2018
. Revenues were positively impacted by an increase in unit volumes, measured principally by cases received, which increased revenues 0.9% in 2018 compared with 2017. Changes in product mix and in the rates charged for those services accounted for a 2.3% revenue increase for 2018 compared with the 2017 period.
The increase in revenues in the U.S. for 2018 as compared with the 2017 period was primarily due to the increase in new Claims Management clients, partially offset by a decrease in
high-frequency, low-complexity
affinity cases. Based on constant foreign exchange rates, the decrease in revenues in the U.K. for 2018 was due to a change in the mix of services provided. Revenues in Canada increased due to a change in the mix of services provided and an increase in new clients. Revenues decreased in Europe and Rest of World due to a product mix shift to increased
high-frequency, low-complexity
cases in Scandinavia.
Reimbursed Expenses Included in Total Revenues
Reimbursements for out-of-pocket expenses incurred in our Crawford TPA Solutions: Broadspire segment which are included in total Company revenues increased to
$10.5 million
in
2018
from
$9.6 million
in
2017
.
This increase was due to higher segment revenues and increased use of third parties in Europe in the 2018 period.
26
Case Volume Analysis
Crawford TPA Solutions: Broadspire
unit volumes, as measured by cases received, by region for
2018
and
2017
were as follows:
|
Year Ended December 31,
|
2018
|
2017
|
Variance
|
|||||
|
U.S.
|
491,837
|
|
498,815
|
|
(1.4
|
)%
|
||
|
U.K.
|
45,678
|
|
45,497
|
|
0.4
|
%
|
||
|
Canada
|
95,082
|
|
80,637
|
|
17.9
|
%
|
||
|
Europe and Rest of World
|
202,112
|
|
202,340
|
|
(0.1
|
)%
|
||
|
Total Crawford TPA Solutions: Broadspire Cases Received
|
834,709
|
|
827,289
|
|
0.9
|
%
|
||
Overall case volumes were
0.9%
higher in
2018
compared with
2017
. The reduction in cases in the U.S. was due to a decrease in Disability and Affinity cases, partially offset by an increase in Casualty cases. The slight increase in the U.K. was due to a change in the mix of services provided. The increase in Canada was due to an increase in
high-frequency, low-complexity
auto cases in the 2018 period. The slight decrease in cases in Europe and Rest of World was due to lower activity within Scandinavia, partially offset by increases in Germany and Spain.
Direct Compensation, Fringe Benefits & Non-Employee Labor
The most significant expense in our Crawford TPA Solutions: Broadspire segment is the compensation of employees, including related payroll taxes and fringe benefits, and payments to outsourced service providers that augment the functions performed by our employees.
D
irect compensation expenses, fringe benefits, and non-employee labor
, as percent of Crawford TPA Solutions: Broadspire segment revenues before reimbursements, incre
ased from
56.5%
in
2017
to
58.2%
in
2018
. The U.S. dollar amount of these expenses increased from
$220.7 million
in
2017
to
$235.8 million
in
2018
. The increase in both the amounts and the percent of revenues for each of the periods was due to an increase in employees and an increase in compensation and related benefit rates in 2018.
There was an average of
3,144
FTEs in this segment in
2018
, an increase from an average of
2,931
FTEs in the
2017
period. The increase in employees was due to conversion of outsourced contractors to full time employees in the Global Business Services Center and the increase in work supporting the increased revenues.
Expenses Other than Reimbursements, Direct Compensation, Fringe Benefits & Non-Employee Labor
Expenses other than reimbursements, direct compensation, fringe benefits, and non-employee labor increased in the Crawford TPA Solutions: Broadspire segment from
$131.6 million
in
2017
to
$132.6 million
in
2018
, but decreased as a percent of sales from
33.7%
in 2017 to
32.7%
in the 2018 period. The increase in amount was due to the increased revenues, however the direct costs grew at a lower rate than revenues.
CRAWFORD SPECIALTY SOLUTIONS
Crawford Specialty Solutions
recorded operating earnings of
$51.0 million
in
2018
, or
16.8%
of revenues before reimbursements, compared with operating earnings of
$53.4 million
in
2017
, or
15.3%
of revenues before reimbursements.
The decrease in operating earnings in the 2018 period was the result of increased compensation expense and centralized indirect administrative support costs compared to 2017. Excluding indirect support costs, gross profit decreased from $115.9 million, or 33.1% of revenues before reimbursements in 2017, to $106.9 million due to the Garden City Group disposal, but increased as a percent of revenues before reimbursements in 2018 to 35.1% due to higher direct costs in the
Garden City Group
service line prior to its disposal.
Unless otherwise noted, all amounts presented below for 2018 reflect activity of the
Garden City Group
service line through
June 15, 2018
due to the disposal of that business as of that date. See Note 3, "Acquisitions and Disposition of Business Line" of our accompanying consolidated financial statements included in Item 8 of this Annual Report on Form 10-K for further discussion about this transaction.
27
Crawford Specialty Solutions
segment revenues
are primarily derived from the global property and casualty insurance company markets in the U.S., U.K., Canada, Australia, Europe and Rest of World, and, prior to the disposition of the
Garden City Group
business line, the legal settlement administration market primarily in the U.S. and Canada. Revenues before reimbursements by major region, based on actual exchange rates and using a constant exchange rate, were as follows:
|
In thousands (except percentages)
|
|||||||||||||||||
|
Based on actual exchange rates
|
Based on exchange rates for December 31, 2017
|
||||||||||||||||
|
Year Ended December 31,
|
2018
|
2017
|
Variance
|
2018
|
Variance
|
||||||||||||
|
U.S.
|
$
|
143,166
|
|
$
|
177,266
|
|
(19.2
|
)%
|
$
|
143,166
|
|
(19.2
|
)%
|
||||
|
U.K.
|
54,060
|
|
66,876
|
|
(19.2
|
)%
|
52,506
|
|
(21.5
|
)%
|
|||||||
|
Canada
|
34,150
|
|
31,521
|
|
8.3
|
%
|
34,416
|
|
9.2
|
%
|
|||||||
|
Australia
|
24,661
|
|
26,484
|
|
(6.9
|
)%
|
25,044
|
|
(5.4
|
)%
|
|||||||
|
Europe
|
21,722
|
|
21,171
|
|
2.6
|
%
|
20,146
|
|
(4.8
|
)%
|
|||||||
|
Rest of World
|
26,770
|
|
26,857
|
|
(0.3
|
)%
|
26,954
|
|
0.4
|
%
|
|||||||
|
Total Crawford Specialty Solutions Revenues before Reimbursements
|
$
|
304,529
|
|
$
|
350,175
|
|
(13.0
|
)%
|
$
|
302,232
|
|
(13.7
|
)%
|
||||
Crawford Specialty Solutions
segment revenues before reimbursements decreased
13.0%
to
$304.5 million
in
2018
compared with
$350.2 million
million in
2017
.
Changes in foreign exchange rates resulted in an increase of our
Crawford Specialty Solutions
segment revenues by approximately 0.7%, or $2.3 million for 2018, as compared with the 2017 period. Absent foreign exchange rate fluctuations,
Crawford Specialty Solutions
segment revenues would have been
$302.2 million
for 2018.
The
Garden City Group
service line disposal in June 2018 represents a $46.3 million reduction, or 13.2% negative variance in
Crawford Specialty Solutions
revenues, respectively, in the 2018 period compared to 2017.
There was a change in the U.K. contractor repair business operating model where we are now acting as an agent instead of principal in certain relationships with clients related to our Contractor Connection service line, which represents a $11.0 million reduction, or 3.1% negative variance in
Crawford Specialty Solutions
revenues in 2018 compared to 2017. This change had no impact to operating earnings.
Overall case volumes were 5.5% higher for 2018 compared with 2017. Changes in product mix and in the rates charged for those services accounted for a 2.9% revenue decrease for 2018 compared with 2017.
The decrease in revenues in the U.S. in 2018, compared with 2017 was due to the
Garden City Group
disposal, partially offset by increases in our Contractor Connection and Global Technical Services service lines. The revenue decrease in the U.K. in the 2018 period was primarily due to the change in U.K. Contractor Connection operating model discussed above, and also due to lower Global Technical Services revenues compared to the 2017 period. Revenues in Canada increased in the 2018 period compared with 2017 due to an increase in weather-related cases in 2018 resulting from the Ontario windstorms. There was a revenue decrease in Australia due to a reduction in weather-related activity in the current year. There was a revenue decrease in Europe due to a change in the mix of services provided in Scandinavia. The slight increase in revenues in Rest of World was primarily due to a change in the mix of services provided in Asia.
Reimbursed Expenses Included in Total Revenues
Reimbursements for out-of-pocket expenses incurred in our
Crawford Specialty Solutions
segment which are included in total Company revenues were
$22.5 million
in
2018
, decreasing from
$26.4 million
in
2017
d
ue to the disposal of the
Garden City Group
service line previously referenced and a reduction in Global Technical Services.
28
Case Volume Analysis
Crawford Specialty Solutions
unit volumes by major underlying case category, as measured by cases received, for
2018
and
2017
were as follows:
|
Year Ended December 31,
|
2018
|
2017
|
Variance
|
|||||
|
U.S.
|
224,137
|
|
220,767
|
|
1.5
|
%
|
||
|
U.K.
|
17,723
|
|
15,215
|
|
16.5
|
%
|
||
|
Canada
|
70,161
|
|
58,419
|
|
20.1
|
%
|
||
|
Australia
|
6,839
|
|
7,775
|
|
(12.0
|
)%
|
||
|
Europe
|
11,005
|
|
10,396
|
|
5.9
|
%
|
||
|
Rest of World
|
21,564
|
|
20,485
|
|
5.3
|
%
|
||
|
Total Crawford Specialty Solutions Cases Received
|
351,429
|
|
333,057
|
|
5.5
|
%
|
||
Overall, there was a
5.5%
increase in cases received in
2018
compared with
2017
. The increase in U.S. case volumes in 2018 was due to an increase in
high-frequency, low-complexity
cases in Contractor Connection. The U.K. case volumes were higher in the 2018 period due to an increase in
high-frequency, low-complexity
property cases in the Contractor Connection service line. The increase in Canada was due to an increase in weather related cases resulting from the Ontario windstorms in 2018 in Contractor Connection and Global Technical Services. The decrease in Australia cases was due to a reduction in weather related activity in the current year. The increase in cases in Europe was due to an increase in Global Technical Services service line. The increase in cases in Rest of World was due to an increase in
high-frequency, low-complexity
cases in the Middle East and Asia, partially offset due to a reduction in
high-frequency, low-complexity
cases in Brazil.
Garden City Group
services were generally project based and not denominated by individual claims and therefore not included in the table above.
Direct Compensation, Fringe Benefits & Non-Employee Labor
The most significant expense in our
Crawford Specialty Solutions
segment is the compensation of employees, including related payroll taxes and fringe benefits, and payments to outsourced service providers that augment the functions performed by our employees.
Crawford Specialty Solutions
direct compensation, fringe benefits, and non-employee labor expense, as a percent of the related revenues before reimbursements, increased from
48.4%
in 2017 to
51.1%
in
2018
. The amount of these expenses decreased from
$169.7 million
in
2017
to
$155.7 million
in
2018
. The decrease in the dollar amount in 2018 was primarily due to the
Garden City Group
disposal referenced above. Excluding the impact of the change in the operating model in the U.K. contractor repair business discussed above, direct compensation expenses, fringe benefits, and non-employee labor as a percent of Crawford Specialty Solutions segment revenues before reimbursements would have been 49.3% in 2018. The increase in expenses as a percent of revenues was due to lower employee utilization in the
Garden City Group
service line through the date of disposal. Average FTEs in this segment totaled
1,579
in
2018
, compared to an average of
1,809
FTEs in
2017
. The decrease in employees was due to the
Garden City Group
disposal referenced above, which had an average of 468 full-time equivalent employees in 2017 compared to 157 in 2018.
Expenses Other than Reimbursements, Direct Compensation, Fringe Benefits & Non-Employee Labor
Crawford Specialty Solutions
segment expenses other than reimbursements, direct compensation, fringe benefits, and non-employee labor
decreased as a percent of segment revenues before rei
mbursements to
32.1%
in
2018
from
36.3%
in
2017
, and the dollar amount of these expenses also decreased by $29.3 million. Expenses decreased by 2.4% in 2018 due to the change in the operating model in the U.K. contractor repair business discussed above. The remaining decrease in both the amount and the percent of segment revenues was due to the
Garden City Group
disposal and a reduction in advertising costs in our Contractor Connection service line during 2018.
29
Y
EAR
E
NDED
D
ECEMBER
31, 2017
C
OMPARED
W
ITH
Y
EAR
E
NDED
D
ECEMBER
31, 2016
CRAWFORD CLAIMS SOLUTIONS SEGMENT
Operating Earnings
Operating earnings for our
Crawford Claims Solutions
segment increased from
$14.4 million
in
2016
to
$17.5 million
in
2017
, representing an operating margin of 4.8% in
2017
compared with 4.2% in
2016
. Operating earnings improved 22.0% from 2016 to 2017 due to an increase in weather related activity resulting from hurricanes Harvey, Irma and Maria in the U.S. in the 2017 period, partially offset by initial start-up costs and operating losses attributable to WeGoLook.
Excluding centralized indirect support costs, gross profit improved from $73.9 million, or 21.6% of revenues before reimbursements in 2016, to $75.7 million, but declined as a percent of revenues before reimbursements in 2017 to 20.7%.
Revenues before Reimbursements
Revenues before reimbursements by major region, based on actual exchange rates and using a constant exchange rate
were as follows:
|
In thousands (except percentages)
|
|||||||||||||||||
|
Based on actual exchange rates
|
Based on exchange rates for December 31, 2016
|
||||||||||||||||
|
Year Ended December 31,
|
2017
|
2016
|
Variance
|
2017
|
Variance
|
||||||||||||
|
U.S.
|
$
|
166,325
|
|
$
|
131,476
|
|
26.5
|
%
|
$
|
166,325
|
|
26.5
|
%
|
||||
|
U.K.
|
59,297
|
|
71,900
|
|
(17.5
|
)%
|
63,988
|
|
(11.0
|
)%
|
|||||||
|
Canada
|
46,055
|
|
44,123
|
|
4.4
|
%
|
45,464
|
|
3.0
|
%
|
|||||||
|
Australia
|
47,136
|
|
40,758
|
|
15.6
|
%
|
45,758
|
|
12.3
|
%
|
|||||||
|
Europe
|
27,076
|
|
30,029
|
|
(9.8
|
)%
|
26,987
|
|
(10.1
|
)%
|
|||||||
|
Rest of World
|
19,185
|
|
23,269
|
|
(17.6
|
)%
|
20,341
|
|
(12.6
|
)%
|
|||||||
|
Total Crawford Claims Solutions Revenues before Reimbursements
|
$
|
365,074
|
|
$
|
341,555
|
|
6.9
|
%
|
$
|
368,863
|
|
8.0
|
%
|
||||
Overall, there was an increase in revenues in the
Crawford Claims Solutions
segment in 2017 compared with 2016. This was due to an increase in revenues in the U.S., Canada and Australia, partially offset by decreases in revenues in the UK, Europe and Rest of World. The increase in revenues in the U.S. was due to an increased claim volumes from hurricane related activity in 2017. Changes in foreign exchange rates resulted in a decrease of our Crawford Claims Solutions segment revenues by approximately 1.1%, or $3.8 million for the period ended December 31, 2017 as compared with 2016. Absent foreign exchange rate fluctuations, Crawford Claims Solutions segment revenues would have been
$368.9 million
for the year ended December 31, 2017.
Revenues in our U.S. operations include revenues from an outsourcing project for a major U.S. insurance carrier, which resulted in $20.7 million and $34.9 million of revenues in the periods ended December 31, 2017 and 2016, respectively, representing a negative variance of 4.1% in Crawford Claim Solutions revenues. There was a 26.9% increase in cases received in 2017 compared with 2016. Excluding the impact of
high-frequency, low-complexity
cases received from the WeGoLook acquisition, there was a decrease in segment unit volume of 0.5%. The WeGoLook acquisition contributed 2.6% of the increase in Crawford Claims Solutions segment revenues. Changes in product mix and in the rates charged for those services accounted for a 10.0% revenue increase in 2017 compared with 2016.
30
There was an increase in revenues in the U.S. for 2017 due to an increase in hurricane related activity that was present in 2017. Based on constant foreign exchange rates, there was a decrease in revenues in the U.K. for 2017 compared with 2016 due to a reduction in weather-related activity compared with the number of cases received from flooding in that region in 2016. Revenues in Canada increased in 2017 due to an increase in
high-frequency, low-complexity
case volumes from existing clients, partially offset by a reduction in weather-related case volumes from the Fort McMurray wildfires in 2016. There was a revenue increase in Australia due to an increase in weather-related activity. The revenue decrease in Europe was due to changes in the mix of services provided in Scandinavia, partially offset by an increase in
high-frequency, low-complexity
cases in Germany. The decrease in revenues in Rest of World for 2017 was due to a reduction in
high-frequency, low-complexity
cases in Asia, partially offset by an increase in Peru from increased weather-related activity.
Reimbursed Expenses Included in Total Revenues
Reimbursements for out-of-pocket expenses incurred in our
Crawford Claims Solutions
segment which are included in total Company re
venues were $21.7 million in 2017 and $21.6 million in 2016. Although there was an increase in overall revenues, the amount of reimbursed expenses increased only slightly due to reduced use of third parties on higher case values in Europe and Rest of World and in Canada where the Fort McMurray wildfires occurred in 2016.
Case Volume Analysis
Crawford Claims Solutions
volumes by underlying case category, as measured by cases received, for
2017
and
2016
were as follows:
|
Year Ended December 31,
|
2017
|
2016
|
Variance
|
|||||
|
U.S.
|
314,356
|
|
173,678
|
|
81.0
|
%
|
||
|
U.K.
|
54,037
|
|
71,917
|
|
(24.9
|
)%
|
||
|
Canada
|
34,172
|
|
32,511
|
|
5.1
|
%
|
||
|
Australia
|
43,276
|
|
46,079
|
|
(6.1
|
)%
|
||
|
Europe
|
55,570
|
|
62,101
|
|
(10.5
|
)%
|
||
|
Rest of World
|
26,487
|
|
29,681
|
|
(10.8
|
)%
|
||
|
Total Crawford Claims Solutions Cases Received
|
527,898
|
|
415,967
|
|
26.9
|
%
|
||
Overall, there was as 26.9% increase in cases received in
Crawford Claims Solutions
in 2017 compared to 2016. This was primarily due to the WeGoLook acquisition, which accounted for a 27.4% increase in Crawford Claims Solutions cases. Absent the
high-frequency, low-complexity
cases form the WeGoLook acquisition, total cases received decreased by 0.5% in 2017 compared to the 2016 period. The increase in U.S. case volumes was due to the WeGoLook acquisition and an increase in weather related activity resulting from cases received from hurricanes in the 2017 period. The U.K. case volumes were lower in the 2017 period due primarily to flooding-related cases received in 2016. The increase in Canada was due to an increase in
high-frequency, low-complexity
case volumes from existing clients, partially offset by a reduction in weather-related case volumes from the Fort McMurray wildfires in 2016. The decrease in cases in Australia was due to a decline in
high-frequency, low-complexity
property cases that were present in the prior year. There was a decrease in cases received in Europe due to a decrease in
high-frequency, low-complexity
property cases. The decrease in cases in Rest of World were due to a decline in
high-frequency, low-complexity
property cases in Asia.
Direct Compensation, Fringe Benefits & Non-Employee Labor
The most significant expense in our
Crawford Claims Solutions
segment is the compensation of employees, including related payroll taxes and fringe benefits, and the payments to outsourced service providers that augment the functions performed by our employees. As a percentage of revenues before reimbursements, direct compensation, fringe benefits, and non-employee labor expenses were 67.1% in 2017 compared with 64.4% for the 2016 period. The increases in expenses as a percent of revenues was primarily due to higher cost of labor for staff working on weather related claims in the U.S. in the 2017 period. The total dollar amount of these expenses increased to $244.8 million in 2017 from $219.9 million for 2016. There was an average of 3,040 full-time equivalent employees in this segment in the 2017 period compared with an average of 2,997 in the 2016 period, including the impact of the WeGoLook acquisition which resulted in an increase of 115 employees in the 2017 period.
31
Expenses Other than Reimbursements, Direct Compensation, Fringe Benefits & Non-Employee Labor
Crawford Claims Solutions
segment expenses other than reimbursements, direct compensation, fringe benefits, and non-employee labor decreased from $107.3 million in 2016 to $102.7 million in 2017. As a percent of segment revenues, segment expenses decreased from 31.4% in 2016 to 28.1% in 2017. The decrease in costs was primarily due to the impact of cost reduction initiatives in 2017.
CRAWFORD TPA SOLUTIONS: BROADSPIRE
Operating Earnings
Crawford TPA Solutions: Broadspire
operating earnings increased to
$38.2 million
in
2017
, an increase of 4.7% from
2016
operating earnings of
$36.5 million
. The operating margin increased from 9.5% in
2016
to 9.8% in
2017
.
Operating earnings improved from 2016 to 2017 due to higher revenues in our Claims Management service line in the U.S., operational efficiency gains, and a reduction in administrative support costs. Excluding centralized indirect support costs, gross profit improved from $104.9 million, or 27.4% of revenues before reimbursements in 2016, to $106.1 million, but decreasing slightly as a percentage of revenues before reimbursements in 2017 to 27.2%, as costs were kept in alignment with the growth in revenues.
Revenues before Reimbursements
Revenues before reimbursements by major region, based on actual exchange rates and using a constant exchange rate, were as follows:
|
In thousands (except percentages)
|
|||||||||||||||||
|
Based on actual exchange rates
|
Based on exchange rates for December 31, 2016
|
||||||||||||||||
|
Year Ended December 31,
|
2017
|
2016
|
Variance
|
2017
|
Variance
|
||||||||||||
|
U.S.
|
$
|
310,102
|
|
$
|
301,976
|
|
2.7
|
%
|
$
|
310,102
|
|
2.7
|
%
|
||||
|
U.K.
|
13,165
|
|
13,654
|
|
(3.6
|
)%
|
14,227
|
|
4.2
|
%
|
|||||||
|
Canada
|
33,386
|
|
32,353
|
|
3.2
|
%
|
32,919
|
|
1.7
|
%
|
|||||||
|
Europe and Rest of World
|
33,930
|
|
34,674
|
|
(2.1
|
)%
|
33,765
|
|
(2.6
|
)%
|
|||||||
|
Total Crawford TPA Solutions: Broadspire Revenues before Reimbursements
|
$
|
390,583
|
|
$
|
382,657
|
|
2.1
|
%
|
$
|
391,013
|
|
2.2
|
%
|
||||
Revenues before reimbursements from our Crawford TPA Solutions: Broadspire segment totaled $390.6 million in 2017 compared with $382.7 million in 2016. Changes in foreign exchange rates resulted in a decrease of our Crawford TPA Solutions: Broadspire segment revenues by approximately 0.1%, or $0.4 million, for 2017 as compared with the 2016 period. Absent foreign exchange rate fluctuations, Crawford TPA Solutions: Broadspire segment revenues would have been $391.0 million for the 2017 period. Revenues were positively impacted by an increase in unit volumes, measured principally by cases received, which increased revenues 1.8% in 2017 compared with 2016. Changes in product mix and in the rates charged for those services accounted for a 0.4% revenue increase for 2017 compared with 2016.
The increase in revenues in the U.S. for 2017 as compared with 2016 was due to an increase in new Claims Management and disability clients. Based on constant foreign exchange rates, the increase in revenues in the U.K. for 2017 was due to client case volume increases and a change in the mix of services provided. Revenues in Canada increased due to a change in the mix of services provided and an increase in new clients. Revenues decreased in Europe and Rest of World in 2017 due to a product mix shift in Scandinavia to increased
high-frequency, low-complexity
cases, partially offset by an increase as we develop our business in other territories, primarily in Australia.
32
Reimbursed Expenses Included in Total Revenues
Reimbursements for out-of-pocket expenses incurred in our Crawford TPA Solutions: Broadspire segment which are included in total Company revenues increased to $9.6 million in
2017
from $9.0 million i
n
2016
. This increase was due to the higher revenues, primarily in the U.S.
Case Volume Analysis
Crawford TPA Solutions: Broadspire
unit volumes, as measured by cases received, by region for
2017
and
2016
were as follows:
|
Year Ended December 31,
|
2017
|
2016
|
Variance
|
|||||
|
U.S.
|
498,815
|
|
477,020
|
|
4.6
|
%
|
||
|
U.K.
|
45,497
|
|
44,728
|
|
1.7
|
%
|
||
|
Canada
|
80,637
|
|
88,577
|
|
(9.0
|
)%
|
||
|
Europe and Rest of World
|
202,340
|
|
202,292
|
|
—
|
%
|
||
|
Total Crawford TPA Solutions: Broadspire Cases Received
|
827,289
|
|
812,617
|
|
1.8
|
%
|
||
Overall case volumes were 1.8% higher in 2017 compared with 2016. The increase in U.S. case volumes was due to an increase in Disability case referrals from new clients and an increase in Medical Management referrals, partially offset by a decline in Affinity claims. The U.K. case volumes were higher due primarily to an increase in cases received from existing clients. The decrease in Canada cases was due to a decline in
high-frequency, low-complexity
vehicle appraisal cases in 2017. Cases in Europe and Rest of World were consistent between the two periods.
Direct Compensation, Fringe Benefits & Non-Employee Labor
The most significant expense in our Crawford TPA Solutions: Broadspire segment is the compensation of employees, including related payroll taxes and fringe benefits, and payments to outsourced service providers that augment the functions performed by our employees.
D
irect compensation expenses, fringe benefits, and non-employee labor
, as a percent of Crawford TPA Solutions: Broadspire segment revenues before reimbursements, increased slightly from 56.2% in 2016 to 56.5% in 2017.
The U.S. dollar amount of these expenses also increased in 2017 by $5.9 million. This increase was due to an increase in employees. T
here was an average of 2,931 FTEs in this segment in
2017
, an increase from 2,833 FTEs in the 2016 period.
Expenses Other than Reimbursements, Direct Compensation, Fringe Benefits & Non-Employee Labor
Expenses other than reimbursements, direct compensation, fringe benefits, and non-employee labor decreased as a percent of Crawford TPA Solutions: Broadspire segment revenues before reimbursements, from 34.3% in 2016 to 33.7% in 2017, although the U.S. dollar amount of these expenses increased only slightly by $0.3 million. The decrease in percentage is primarily due to cost reduction initiatives implemented in 2017 and higher revenues.
CRAWFORD SPECIALTY SOLUTIONS
Operating Earnings
Crawford Specialty Solutions
recorded operating earnings of $53.4 million in
2017
, or 15.3% of revenues before reimbursements, compared with operating earnings of $65.6 million in
2016
, or 17.0% of revenues before reimbursements. Operating earnings decreased from
2016
to
2017
due to lower revenues related to the winding down of the Deepwater Horizon class action settlement project, and reduction in employee utilization in our Garden City Group service line. Excluding centralized indirect support costs, gross profit decreased from $122.7 million, or 31.9% of revenues before reimbursements in 2016, to $115.9 million, or 33.1% of revenues before reimbursements in 2017.
33
Revenues before Reimbursements
Crawford Specialty Solutions
revenues before reimbursements by major region, based on actual exchange rates and using a constant exchange rate, were as follows:
|
In thousands (except percentages)
|
|||||||||||||||||
|
Based on actual exchange rates
|
Based on exchange rates for December 31, 2016
|
||||||||||||||||
|
Year Ended December 31,
|
2017
|
2016
|
Variance
|
2017
|
Variance
|
||||||||||||
|
(In thousands)
|
|||||||||||||||||
|
U.S.
|
$
|
177,266
|
|
$
|
195,607
|
|
(9.4
|
)%
|
$
|
177,266
|
|
(9.4
|
)%
|
||||
|
U.K.
|
66,876
|
|
87,445
|
|
(23.5
|
)%
|
72,974
|
|
(16.5
|
)%
|
|||||||
|
Canada
|
31,521
|
|
30,221
|
|
4.3
|
%
|
31,133
|
|
3.0
|
%
|
|||||||
|
Australia
|
26,484
|
|
25,826
|
|
2.5
|
%
|
25,731
|
|
(0.4
|
)%
|
|||||||
|
Europe
|
21,171
|
|
19,578
|
|
8.1
|
%
|
20,522
|
|
4.8
|
%
|
|||||||
|
Rest of World
|
26,857
|
|
26,397
|
|
1.7
|
%
|
27,040
|
|
2.4
|
%
|
|||||||
|
Total Crawford Specialty Solutions Revenues before Reimbursements
|
$
|
350,175
|
|
$
|
385,074
|
|
(9.1
|
)%
|
$
|
354,666
|
|
(7.9
|
)%
|
||||
Crawford Specialty Solutions
segment revenues before reimbursements decreased 9.1% to $350.2 million in
2017
compared with $385.1 million in
2016
.
Changes in foreign exchange rates resulted in a decrease in our
Crawford Specialty Solutions
segment revenues by approximately 1.2%, or $4.5 million for 2017, as compared with the 2016 period. Absent foreign exchange rate fluctuations,
Crawford Specialty Solutions
segment revenues before reimbursements would have been $354.7 million for 2017.
The decrease in revenues for 2017 compared with 2016 was primarily due to lower revenues in our
Garden City Group
service line, which represents a $36.1 million reduction, or 9.4% of
Crawford Specialty Solutions
revenue variance. This reduction was due to lower revenues from the Deepwater Horizon class action special project and a lower volume of case administration work on projects in the 2017 period. Revenues in the
Crawford Specialty Solutions
segment were also negatively impacted due to a change in the operating model in the U.K. contractor repair business where we are acting in an agency role instead of the contract principal in certain relationships with clients in our Contractor Connection service line, which represents a $16.0 million, or 4.2% revenue reduction, for 2017 compared to the prior year. This change had no impact to segment operating earnings.
Overall Crawford Specialty Solution case volumes were 5.3% higher for 2017 compared with 2016. Changes in product mix and in the rates charged for those services accounted for a 0.4% revenue increase for 2017 compared with the same period in 2016.
The decrease in revenues in the U.S. in 2017 compared with the 2016 period was primarily due to lower revenues in our
Garden City Group
service line discussed above, partially offset by increases in our Global Technical Services and Contractor Connection service lines due to an increase in hurricane activity. The revenue decrease in the U.K. in 2017 was primarily due to the change in U.K. Contractor Connection operating model discussed above, partially offset by an increase in Global Technical Services revenues compared to the 2016 period. Revenues in Canada increased in the 2017 period compared with 2016 due to an increase in high-frequency, low-complexity case volumes from existing clients, and the change in foreign exchange rates, partially offset by a reduction in weather-related case volumes from the Fort McMurray wildfires in 2016. Based on constant exchange rates, there was a slight decrease in revenues in Australia due to a reduction in weather-related activity in the current year. The increase in revenues in Europe was primarily due an increase in revenues in Germany, partially offset by a change in the mix of services provided in Scandinavia. The increase in revenues in Rest of World was primarily due to an increase in weather-related activity in Latin America.
34
Reimbursed Expenses Included in Total Revenues
Reimbursements for out-of-pocket expenses incurred in our
Crawford Specialty Solutions
segment can vary materially from period to period depending on the amount and types of projects and were $26.4 million in
2017
, decreasing from $37.2 million in
2016
due primarily to a lower volume of case administration work in our
Garden City Group
service line and reduced use of third parties in Canada where the Fort McMurray wildfires occurred in 2016.
Case Volume Analysis
Crawford Specialty Solutions
unit volumes by major underlying case category, as measured by cases received, for
2017
and
2016
were as follows:
|
Year Ended December 31,
|
2017
|
2016
|
Variance
|
|||||
|
U.S.
|
220,767
|
|
212,082
|
|
4.1
|
%
|
||
|
U.K.
|
15,215
|
|
16,583
|
|
(8.2
|
)%
|
||
|
Canada
|
58,419
|
|
45,922
|
|
27.2
|
%
|
||
|
Australia
|
7,775
|
|
8,949
|
|
(13.1
|
)%
|
||
|
Europe
|
10,396
|
|
6,822
|
|
52.4
|
%
|
||
|
Rest of World
|
20,485
|
|
25,873
|
|
(20.8
|
)%
|
||
|
Total Crawford Specialty Solutions Cases Received
|
333,057
|
|
316,231
|
|
5.3
|
%
|
||
Overall, there was a 5.3% increase in cases received in 2017 compared with 2016. The increase in U.S. case volumes was due to an increase in high-frequency, low-complexity cases in Contractor Connection, and an increase in Global Technical Services resulting from the hurricane activity. The U.K. case volumes were lower in 2017 due to the flooding that occurred in that region in 2016. The increase in Canada was due to an increase in high-frequency, low-complexity cases in Contractor Connection and an increase in Global Technical Services. The decrease in Australia cases was due to a reduction in weather related activity in the current year. The increase in cases in Europe was due to increases in Global Technical Services in Italy and Scandinavia. The decrease in cases in Rest of World was due to a reduction in high-frequency, low-complexity cases in Brazil and Singapore.
Garden City Group
services are generally project based and not denominated by individual claims and therefore not included in the table above.
Direct Compensation, Fringe Benefits & Non-Employee Labor
The most significant expense in our
Crawford Specialty Solutions
segment is the compensation of employees, including related payroll taxes and fringe benefits, and payments to outsourced service providers that augment the functions performed by our employees.
Crawford Specialty Solutions
direct compensation, fringe benefits, and non-employee labor
expense, as a percent of the related revenues before reimbursements, increased slightly to 48.4% in
2017
compared with 48.1% in
2016
.
The amount of these expenses decreased from $185.4 million in 2016 to $169.1 million in 2017 due to the decline in revenues from the Deepwater Horizon special project discussed above. The increase as a percent of revenues was due to a decrease in employee utilization in the
Garden City Group
service line.
Average FTEs in this segment totaled 1,809 in
2017
, up from 1,776 FTEs in
2016
.
Expenses Other than Reimbursements, Direct Compensation, Fringe Benefits & Non-Employee Labor
Crawford Specialty Solutions
segment expenses other than reimbursements, direct compensation, fringe benefits, and non-employee labor
increased as a percent of segment revenues before reimbursements to 36.3% in
2017
from 34.8% in
2016. T
he dollar amount of these expenses decreased by $7.0 mill
ion. The decrease in the amount was due to the change in the operating model in the U.K. contractor repair business where we are acting in an agency role instead of the contract principal in certain relationships with clients in our Contractor Connection service line, partially offset by an increase in advertising costs in our Contractor Connection service line compared with 2016. The increase in the percent as a percent of revenues was due to the increase in advertising costs in Contractor Connection and an increase in our Garden City Group service line.
35
E
XPENSES AND
C
REDITS
E
XCLUDED FROM
S
EGMENT
O
PERATING
E
ARNINGS
Income Taxes
Our consolidated effective income tax rate for financial reporting purposes may change periodically due to changes in enacted tax rates, changes in tax law, fluctuations in the mix of income earned from our various domestic and international operations, which are subject to income taxes at different rates, our ability to utilize loss and tax credit carryforwards, and amounts related to uncertain income tax positions. Income tax provisions totaled
$18.5 million
,
$15.0 million
, and
$25.6 million
for
2018
,
2017
, and
2016
, respectively. Our effective tax rate for financial reporting purposes was
42.0%
,
35.6%
, and
40.4%
for
2018
,
2017
, and
2016
, respectively. The Company's effective income tax rate in 2018 was impacted by a valuation allowance on certain Foreign Tax Credits, the Tax Cuts and Jobs Act in the U.S., and one-time income tax planning activities. The Company's effective income tax rate in 2017 was impacted by the Tax Cuts and Jobs Act in the U.S. and international restructuring activities. Based on our 2019 operating plans, we anticipate our effective tax rate for financial reporting purposes in 2019 to be in the 31% to 33% range before considering any discrete items and assuming no material changes to tax law and policy in the material jurisdictions in which we operate.
Net Corporate Interest Expense
Net corporate interest expense consists of interest expense that we incur on our short- and long-term borrowings, partially offset by interest income we earn on available cash balances and short-term investments.
These amounts vary based on interest rates, borrowings outstanding, and the amounts of invested cash. Corporate interest expense totaled
$11.4 million
,
$9.9 million
, and
$9.9 million
for
2018
,
2017
, and
2016
, respectively. Corporate interest income to
taled
$1.3 million
,
$0.8 million
, and
$0.7 million
in
2018
,
2017
, and
2016
, respectively. We pay interest on borrowings under our Credit Facility based on variable rates. Our level of interest expense is dependent on the future direction of interest rates as well as the level of outstanding borrowings relative to prior periods. The weighted average interest rates under our Credit Facility were 3.7%, 2.8%, and 2.8% for the years ending December 31, 2018, 2017, and 2016, respectively.
Stock Option Expense
Stock option expense, a component of stock-based compensation, is comprised of non-cash expenses related to stock options granted under our various stock option and employee stock purchase plans. Stock option expense is not allocated to our operating segments. Stock option expense of
$1.7 million
,
$1.7 million
and
$0.6 million
was recognized during
2018
,
2017
, and
2016
, respectivel
y. The increase in the 2018 and 2017 periods, compared to 2016, was due to a higher proportion of options having been granted as a component of our Long Term Incentive Plans. Oth
er stock-based compensation expense related to our Executive Stock Bonus Plan and our 2016 Omnibus Stock and Incentive Plan (pursuant to which we have authority to grant performance shares and restricted shares) is
charged to our operating segments and included in the determination of segment operating earnings or loss.
Amortization of Customer-Relationship Intangible Assets
Amortization of customer-relationship intangible assets represents the non-cash amortization expense for finite-lived
customer-relationship and trade name intangible assets. Amortization expense associated with these intangible assets totaled
$11.2 million
,
$11.0 million
, and
$9.6 million
in
2018
,
2017
, and
2016
, respective
ly. The increase in 2018 and 2017, compared to 2016 was due to amortization of intangible assets acquired in the WeGoLook acquisition. This amortization is included in "Selling, general and administrative expenses" in our Consolidated Statements of Operations.
Unallocated Corporate and Shared Costs and Credits
Certain unallocated costs and credits are excluded from the determination of segment operating earnings. These unallocated corporate and shared costs and credits represent costs
of our frozen U.S. defined benefit pension plan, expenses for our chief executive officer and our Board of Directors, certain adjustments to our self-insured liabilities, certain unallocated professional fees, and certain adjustments and recoveries to our allowances for doubtful accounts receivable.
From time to time, we evaluate which corporate costs and credits are appropriately allocated to one or more of our operating segments. If changes are made to our allocation methodology, prior period allocations are revised to conform to our then-current allocation methodology.
36
Unallocated corp
orate and shared costs and credits were
$9.3 million
,
$13.5 million
, and
$24.4 million
in
2018
,
2017
, and
2016
, respectively. The decrease in 2018 compared with 2017 was due to lower incentive compensation, payroll taxes and benefits, lower self-insured costs and defined benefit pension expenses, partially offset by an increase in unallocated professional fees. These costs decreased in 2017 compared with 2016 due primarily to
a decrease in U.S. defined benefit plan expense, unallocated professional fees, and self-insured expenses.
Goodwill Impairment Charges
There were no goodwill impairment charges in 2018 or 2016. The Company incurred a non-cash goodwill impairment charge of $19.6 million in 2017 related to its
Garden City Group
reporting unit. See the "Critical Accounting Policies" in Item 7 and Note 4, "Goodwill and Intangible Assets" of our accompanying audited consolidated financial statements included in Item 8 of this Annual Report on Form 10-K for further discussion about goodwill impairment charges.
Impairment of Indefinite Lived Intangible Assets
The Company recognized an impairment of $1.1 million in 2018 related to an indefinite-lived trade name due to a combination of achieving less than forecasted revenue compared to previous modeled results and further reduced forecasted revenue associated with the trade name. There were no such charges in 2017 or 2016.
Disposition of Business Line
On
June 15, 2018
, the Company completed the sale of its
Garden City Group
business (the “GCG Business”) to EPIQ Class Action & Claims Solutions, Inc. ("EPIQ") for cash proceeds of $42.6 million including the working capital adjustment. After including transaction and other costs related to the sale, the Company recognized a pretax loss on the disposal of $20.3 million. The loss on disposal is presented in the Consolidated Statements of Operations as a separate charge "Loss on disposition of business line". See Note 3, "Acquisitions and Disposition of Business Line" of our acc
ompanying audited consolidated financial statements included in Item 8 of this Annual Report on Form 10-K
for further discussion about the disposition.
Restructuring and Special Charges
There were no restructuring and special charges in 2018. Total restructuring and special charges were
$12.1 million
in 2017 and
$9.5 million
in 2016. See Note 17, "Restructuring and Special Charges" of our acc
ompanying audited consolidated financial statements included in Item 8 of this Annual Report on Form 10-K
for further discussion about the restructuring and special charges.
Liquidity, Capital Resources, and Financial Condition
We fund our working capital requirements, capital expenditures and acquisitions from net cash provided by operating activities and borrowings under bank credit facilities.
On October 11, 2017, the Company and certain of its subsidiaries (Crawford & Company Risk Services Investments Limited (the "UK Borrower"), Crawford & Company (Canada) Inc. (the "Canadian Borrower") and Crawford & Company (Australia) Pty. Ltd, (the "Australian Borrower"), collectively known with the Company, as the "Borrowers") entered into an Amended and Restated Credit Agreement (the "Amended and Restated Credit Agreement"), which amended and restated our original credit agreement, dated as of December 8, 2011. On
June 15, 2018
, the Company and its guarantor subsidiaries party thereto amended our existing credit facility and entered into a Limited Consent and First Amendment to the Amended and Restated Credit Agreement (“the Amendment”) that consented to the Company’s disposition of the GCG Business. No other terms discussed below were changed due to the Amendment.
The credit facility (as amended, the "Credit Facility") consists of a
$450.0 million
revolving credit facility, with a letter of credit subcommitment of
$100.0 million
. The Credit Facility contains sublimits of
$185.0 million
for borrowings by the UK Borrower,
$75.0 million
for borrowings by the Canadian Borrower, and
$32.5 million
for borrowings by the Australian Borrower. The Credit Facility matures, and all amounts outstanding thereunder, will be due and payable on November 23, 2022.
37
Borrowings under the Credit Facility may be made in U.S. dollars, Euros, the currencies of Canada, Japan, Australia or United Kingdom and, subject to the terms of the Credit Facility, other currencies. Borrowings under the Credit Facility bear interest, at the option of the applicable Borrower, based on the Base Rate (as defined below) or the London Interbank Offered Rate ("LIBOR"), in each case plus an applicable interest margin based on the Company's leverage ratio (as defined below), provided that borrowings in foreign currencies may bear interest based on LIBOR only. The interest margin for LIBOR loans ranges from
1.30%
to
2.10%
and for Base Rate loans ranges from
0.30%
to
1.10%
. Base Rate is defined as the highest of (i) the Federal Funds Rate, as published by the Federal Reserve Bank of New York, plus
1/2 of 1%
, (ii) the prime commercial lending rate of Wells Fargo Bank, National Association and (iii) LIBOR for a
one month
interest period plus
1.0%
. The weighted average interest rates under our Credit Facility were 3.7%, 2.8%, and 2.8% for the years ending December 31, 2018, 2017, and 2016, respectively.
At
December 31, 2018
, a total of
$190.3 million
was outstanding and there was an undrawn amount of
$11.7 million
under the letters of credit subcommitment of the Credit Facility. These letter of credit commitments were for the Company's own obligations. Including the amounts committed under the letters of credit subcommitment, the available borrowing capacity under the Credit Facility totaled
$248.0 million
at
December 31, 2018
.
The obligations of the Borrowers under the Amended and Restated Credit Agreement are guaranteed by each existing material domestic subsidiary of the Company, certain other domestic subsidiaries of the Company and certain existing material foreign subsidiaries of the Company that are disregarded entities for U.S. income tax purposes (each such foreign subsidiary, a "Disregarded Foreign Subsidiary"), and such obligations are required to be guaranteed by each subsequently acquired or formed material domestic subsidiary and Disregarded Foreign Subsidiary (each, a "Guarantor"), and the obligations of the Borrowers other than the Company ("Foreign Borrowers") for which the Company is not the primary obligor are also guaranteed by the Company. In addition, (i) the Borrowers’ obligations under the Amended and Restated Credit Agreement are secured by a first priority lien (subject to liens permitted by the Amended and Restated Credit Agreement) on substantially all of the personal property of the Company and the Guarantors as set forth in the Amended and Restated Pledge and Security Agreement and (ii) the obligations of the Foreign Borrowers are secured by a first priority lien on
100%
of the capital stock of the Foreign Borrowers.
The representations, covenants and events of default in the Credit Facility are customary for financing transactions of this nature, including required compliance with a minimum fixed charge coverage ratio and a maximum leverage ratio (each as defined below).
Under the Credit Facility as amended, the fixed charge coverage ratio, defined as the ratio of (i)(A) consolidated earnings before interest expense, income taxes, depreciation, amortization, stock-based compensation expense, and certain other charges and expenses ("EBITDA")
minus
(B) aggregate income taxes to the extent paid in cash
minus
(C) unfinanced capital expenditures to (ii) the sum of: (A) consolidated interest expense to the extent paid (or required to be paid) in cash,
plus
(B) the aggregate of all scheduled payments of principal on funded debt (including the principal component of payments made in respect of capital lease obligations) required to have been made (whether or not such payments are actually made),
plus
(C) the aggregate of all restricted payments (as defined) paid,
plus
(D) the aggregate of all earnouts paid or required to be paid, must not be less than
1.10
to
1.00
for the
four
-quarter period ending at the end of each fiscal quarter.
Also under the Credit Facility as amended, the senior secured leverage ratio, defined as the ratio of (i) consolidated total funded debt (excluding unsecured or subordinated debt) minus unrestricted cash to (ii) consolidated EBITDA, must not be greater
3.25
to 1.00 at the end of each fiscal quarter. In addition, the maximum permitted total leverage ratio allowable, which includes any unsecured or subordinated debt, must not be greater than
4.25
to
1.00
.
At
December 31, 2018
, the Company was in compliance with the financial covenants under the Credit Facility. Our leverage ratio was 1.48 and 1.80 as of December 31, 2018 and December 31, 2017, respectively, and our fixed charge coverage ratio was 2.50 and 2.23 as of December 31, 2018 and December 31, 2017, respectively. If the Company does not meet the covenant requirements in the future, it would be in default under the Credit Facility.
Upon the occurrence of an event of default, the lenders may terminate the loan commitments, accelerate all loans and exercise any of their rights under the Credit Facility and ancillary documents.
We are not aware of any additional restrictions placed on us, or being considered to be placed on us, related to our ability to access capital, such as borrowings under the Credit Facility. We do not rely on repurchase agreements or the commercial paper market to meet our short-term or long-term funding needs. For additional information on the key covenants contained in our Credit Facility, see "Other Matters Concerning Liquidity and Capital Resources" below.
38
We continue the ongoing monitoring of our customers' ability to pay us for the services that we provide to them. Based on historical results, we currently believe there is a low likelihood that write-offs of our existing accounts receivable will have a material impact on our financial results. However, if one or more of our key customers files bankruptcy or otherwise becomes unable to make required payments to us, or if overall economic conditions deteriorate, we may need to make material provisions in the future to increase our allowance for accounts receivable.
The operations of each of our reporting segments expose us to a number of risks, including foreign currency exchange rate changes that can impact translations of foreign-denominated assets and liabilities into U.S. dollars and future earnings and cash flows from transactions denominated in different currencies, as well as the risk of changes in tax rates or tariffs on earnings or services provided outside the U.S. Changes in the relative values of non-U.S. currencies to the U.S. dollar affect our financial results.
Increases in the value of the U.S. dollar compared with the other functional currencies in certain of the locations in which we do business negatively impacted our revenues and operating earnings in 2018, 2017, and 2016. W
e cannot predict the impact that foreign currency exchange rates may have on our future revenues or operating earnings.
At
December 31, 2018
, our working capital balance (c
urrent assets less current liabilities) was approximately
$95.5 million
, compared with
$113.8 million
at
December 31, 2017
. The decrease in working capital was primarily due to the
Garden City Group
disposal that occurred on
June 15, 2018
. Cash and cash equivalents at the end of
2018
totaled
$53.1 million
, compared with
$54.0 million
at the end of
2017
.
Cash and cash equivalents as of
December 31, 2018
consisted of
$17.4 million
held in the U.S. and
$35.7 million
held in our foreign subsidiaries. All of the cash and cash equivalents held by our foreign subsidiaries is available for general corporate purposes. The Company generally does not provide for additional U.S. and foreign income taxes on undistributed earnings of foreign subsidiaries because they are considered to be indefinitely reinvested. The Company's current expectation is that such earnings will be reinvested by the subsidiaries or will be repatriated only when it would be tax effective or otherwise strategically beneficial to the Company, such as if a very unusual event or project generated profits significantly in excess of ongoing business reinvestment needs. If such an event occurs, we would analyze the potential tax impact or our anticipated investment needs in that region and provide for taxes for earnings that are not expected to be permanently reinvested. Other historical earnings and future foreign earnings necessary for business reinvestment are expected to remain permanently reinvested and will be used to provide working capital for these operations, fund defined benefit pension plan obligations, repay non-U.S. debt, fund capital improvements, and fund future acquisitions. We currently believe that funds expected to be generated from our U.S. operations, along with potential borrowing capabilities in the U.S., will be sufficient to fund our U.S. operations and other obligations, including our funding obligations under our U.S. defined benefit pension plan, for the foreseeable future and, therefore, except in limited circumstances such as those described above, do not foresee a need to repatriate cash held by our foreign subsidiaries in a taxable transaction to fund our U.S. operations.
However, if at a future date or time these funds are necessary for our operations in the U.S. or we otherwise believe it is in our best interests to repatriate all or a portion of such funds, we may be required to accrue and pay taxes to repatriate these funds. No assurances can be provided as to the amount or timing thereof, the tax consequences related thereto, or the ultimate impact any such action may have on our results of operations or financial condition. No additional income or withholding taxes have been provided for any undistributed foreign earnings, other than those subject to the Transition Tax nor have any taxes been provided for outside basis difference inherent in these entities as these amounts continue to be indefinitely reinvested in foreign operations. We have estimated that we have book over tax basis differences of approximately $35.0 million. Due to withholding tax, basis computations, and other related tax considerations, it is not practicable to estimate any taxes to be provided on outside basis differences at this time.
Cash Provided by Operating Activities
Cash provided by operating activities increased by
$11.7 million
in
2018
, from
$40.8 million
in
2017
to
$52.4 million
in
2018
. This increase was primarily due to a decrease in accounts receivables and lower working capital requirements, partially offset by an increase in unbilled receivables and $10.0 million in one-time incremental pension contributions in the U.S. Interest payments on our debt were
$10.4 million
in
2018
, and tax payments, net of refunds, were
$8.2 million
in
2018
.
Cash provided by operating activities decreased by
$58.1 million
in
2017
, from
$98.9 million
in
2016
to
$40.8 million
in
2017
. This decrease was primarily due to a decrease in accrued incentive compensation, accounts payable, and pension liabilities, and an increase in receivables and prepaid expenses. Interest payments on our debt were
$8.4 million
in
2017
, and tax payments, net of refunds, were
$15.6 million
in
2017
. During the 2016 period the Company settled a cross currency swap for $4.1 million increasing cash from operations for the prior year period.
39
Cash Provided by (Used in) Investing Activities
Cash provided by investing activities increased by
$88.3 million
in
2018
, from a use of
$81.9 million
in
2017
to
$6.4 million
provided in
2018
. This increase was primarily due to the proceeds from the
Garden City Group
disposal of
$42.6 million
in 2018 and $36 million cash paid for the acquisition of WeGoLook in 2017. Both of these transactions are discussed in Note 3, "Acquisitions and Disposition of Business Line" included in Item 8 of this Annual Report on Form 10-K. Cash used to acquire property and equipment and capitalized software, including capitalization of costs for internally developed software, was
$30.0 million
in
2018
compared with
$44.9 million
in
2017
. We forecast that our property and equipment additions in 2019, including capitalized software, will approximate $28 million due to investments required to fund initiatives in our three-year strategic plan.
Cash used in investing activities increased by
$48.9 million
in
2017
, from
$33.0 million
in
2016
to
$81.9 million
in
2017
. This increase was primarily due to $36.0 million for the acquisition of WeGoLook and certain certain non-compete agreements. Cash used to acquire property and equipment and capitalized software, including capitalization of costs for internally developed software, was $44.9 million in 2017 compared with
$29.2
million in 2016. This increase also included costs incurred for the consolidation and relocation of our Atlanta Support Center.
Cash (Used in) Provided by Financing Activities
Cash used in financing activities was
$58.7 million
in
2018
. In
2018
, we borrowed
$101.4 million
in short-term borrowings for working capital needs and we repaid a total of
$135.4 million
in short-term borrowings and
$0.5 million
in debt and capital lease obligations. The decrease in borrowings in the
2018
period was primarily due to proceeds from the
Garden City Group
disposition which were used to reduce borrowings. The increase in borrowings in the 2017 period was primarily due to borrowings to fund the WeGoLook acquisition and increased working capital requirements. We used cash to pay cash dividends totaling
$13.5 million
. Also in
2018
, we repurchased
1,144,410
shares of CRD-A and
94,378
shares of CRD-B stock totaling
$10.4 million
, and we received shares of CRD-A stock that were surrendered by employees to settle
$1.1 million
of withholding taxes owed on the issuance of restricted and performance shares.
Cash provided by financing activities was
$10.3 million
in 2017. In 2017, we borrowed
$94.4 million
in short-term borrowings for working capital needs and we repaid a total of
$58.5 million
in short-term borrowings and
$1.2 million
in debt and capital lease obligations. The increase in borrowings in the 2017 period was primarily due to borrowings to fund the WeGoLook acquisition and increased working capital requirements. We used cash to pay cash dividends totaling
$13.7 million
. Also in 2017, we repurchased
699,847
shares of CRD-A and
188,180
shares of CRD-B stock totaling
$7.4 million
, and we received shares of CRD-A stock that were surrendered by employees to settle
$1.9 million
of withholding taxes owed on the issuance of restricted and performance shares.
Other Matters Concerning Liquidity and Capital Resources
Our short-term debt obligations typically peak during the first quarter of each year due to the payment of incentive compensation awards, contributions to retirement plans, and certain other recurring payments, and generally decline during the balance of the year. Our maximum month-end short-term debt obligations were $36.1 million and $32.0 million in 2018 and 2017, respectively. Our average month-end short-term debt obligations were $25.9 million and $8.3 million in 2018 and 2017, respectively. The outstanding balance of our short-term borrowings, excluding outstanding but undrawn letters of credit under our Credit Facility, was
$23.2 million
and
$24.6 million
at
December 31, 2018
and
2017
, respectively. The balance in short-term borrowings at
December 31, 2018
represents amounts under our revolving Credit Facility that we expect, but are not required, to repay in the next twelve months. We have historically used the proceeds from our long-term borrowings to finance, among other things, business acquisitions.
As described above, we have two principal financial covenants in our Credit Facility. The senior secured leverage ratio, defined as the ratio of (i) consolidated total funded debt (excluding unsecured or subordinated debt) minus unrestricted cash to (ii) consolidated EBITDA, must not be greater
3.25
to 1.00 at the end of each fiscal quarter. The fixed charge coverage ratio covenant requires us to comply with a minimum fixed charge coverage ratio, defined as the ratio of (i)(A) consolidated EBITDA
minus
(B) aggregate income taxes to the extent paid in cash
minus
(C) unfinanced capital expenditures to (ii) the sum of: (A) consolidated interest expense to the extent paid (or required to be paid) in cash,
plus
(B) the aggregate of all scheduled payments of principal on funded debt (including the principal component of payments made in respect of capital lease obligations) required to have been made (whether or not such payments are actually made),
plus
(C) the aggregate of all restricted payments (as defined) paid,
plus
(D) the aggregate of all earnouts paid or required to be paid, must not be less than 1.10 to 1.00 for the four-quarter period ending at the end of each fiscal quarter.
40
At
December 31, 2018
, we were in compliance with all required ratios under our Credit Facility.
Our leverage ratio was 1.48 and 1.80 as of December 31, 2018 and December 31, 2017, respectively, and our fixed charge coverage ratio was 2.50 and 2.23 as of December 31, 2018 and December 31, 2017, respectively.
As discussed in Note 18, "Subsequent Events" of our accompanying audited consolidated financial statements included in Item 8 of this Annual Report on Form 10-K, on
January 22, 2019
, the Company entered into Stock Purchase Agreements to repurchase an aggregate of
421,427
shares of CRD-A and
1,376,889
shares of CRD-B. Pursuant to the Purchase Agreements, the Company paid a purchase price of
$9.10
per share, for an aggregate purchase price of $16,364,676 plus commission.
Our leverage ratio and fixed charge coverage ratio would have been 1.61 and 1.71, respectively, as of December 31, 2018 if adjusted for this transaction.
Based on our financial plans, we expect to be able to remain in compliance with all required covenants throughout 2019. Our compliance with the senior secured leverage ratio and fixed charge coverage ratio is particularly sensitive to changes in our EBITDA, and if our financial plans for 2019 or other future periods do not meet our current projections, we could fail to remain in compliance with these financial covenants in our Credit Facility.
Our compliance with the senior secured leverage ratio covenant is also sensitive to changes in our level of consolidated total funded debt, as defined in our Credit Facility. In addition to short- and long-term borrowings, capital leases, and bank overdrafts, among other things, consolidated total funded debt includes letters of credit, the need for which can fluctuate based on our business requirements. An increase in borrowings under our Credit Facility could negatively impact our leverage ratio, unless those increased borrowings are offset by a corresponding increase in our EBITDA. In addition, a reduction in EBITDA in the future could limit our ability to utilize available credit under the Credit Facility, which could negatively impact our ability to fund our current operations or make needed capital investments.
Our compliance with the fixed charge coverage ratio covenant, which measures our ability to pay certain recurring expenses such as interest and lease payments, is also sensitive to the level of capital expenditures and restricted payments, as defined in our Credit Facility. A decrease in EBITDA could negatively impact our fixed charge coverage ratio, as could increases in our capital expenditures, interest expense, tax expense or restricted payments. If we do not manage those items carefully, we could be in default under the Credit Agreement, which would negatively impact our ability to fund our current operations or make needed capital investments.
We believe our current financial resources, together with funds generated from operations and existing and potential borrowing capabilities, will be sufficient to maintain our current operations for the next 12 months.
Contractual Obligations
As of
December 31, 2018
, the impact that our contractual obligations, including estimated interest payments, are expected to have on our liquidity and cash flow in future periods is as follows:
(Note references in the following table refer to the note in the accompanying audited consolidated financial statements in Item 8 of this Annual Report on Form 10-K).
|
Payments Due by Period
|
|||||||||||||||||||
|
One Year or Less
|
1 to 3
Years
|
3 to 5
Years
|
After 5 Years
|
Total
|
|||||||||||||||
|
|
(In thousands)
|
||||||||||||||||||
|
Operating lease obligations (Note 6)
|
$
|
31,286
|
|
$
|
51,166
|
|
$
|
24,142
|
|
$
|
30,735
|
|
$
|
137,329
|
|
||||
|
Long-term debt, including current portions (Note 5)
(1)
|
23,183
|
|
—
|
|
167,121
|
|
—
|
|
190,304
|
|
|||||||||
|
Capital lease obligations (Note 5)
(1)
|
89
|
|
5
|
|
—
|
|
—
|
|
94
|
|
|||||||||
|
Total, before interest payments
|
54,558
|
|
51,171
|
|
191,263
|
|
30,735
|
|
327,727
|
|
|||||||||
|
Estimated interest payments under Credit Facility
|
9,763
|
|
20,070
|
|
8,432
|
|
—
|
|
38,265
|
|
|||||||||
|
Total contractual obligations
|
$
|
64,321
|
|
$
|
71,241
|
|
$
|
199,695
|
|
$
|
30,735
|
|
$
|
365,992
|
|
||||
(1)
Assumes principal amounts are repaid at maturity and not refinanced.
Approximately
$14.0 million
of operating lease obligations included in the table above are expected to be funded by sublessors under existing sublease agreements. See Note 6, "Commitments Under Operating Leases" to the audited consolidated financial statements included in Item 8 of this Annual Report on Form 10-K.
41
Borrowings under our Credit Facility bear interest at a variable rate, based on LIBOR or a Base Rate, in either case plus an applicable margin. Long-term debt refers to the required principal repayment at maturity of the Credit Facility, and may differ significantly from estimates, due to, among other things, actual amounts outstanding at maturity or any refinancings prior to such date. Interest amounts are based on projected borrowings under our Credit Facility and interest rates in effect on
December 31, 2018
, and the actual interest payments may differ significantly from estimates due to, among other things, changes in outstanding borrowings and prevailing interest rates in the future.
At
December 31, 2018
, we had approximately
$7.4 million
of unrecognized income tax benefits related to uncertain tax positions. We cannot reasonably estimate when all of these unrecognized income tax benefits may be settled. We expect
$3.4 million
of reductions to unrecognized income tax benefits within the next 12 months as a result of projected resolutions of income tax uncertainties.
Gross deferred income tax liabilities as of
December 31, 2018
were approximately
$40.3 million
. This amount is not included in the contractual obligations table because we believe this presentation would not be meaningful. Deferred income tax liabilities are calculated based on temporary differences between the tax basis of assets and liabilities and their respective book basis, which will result in taxable amounts in future years when the liabilities are settled at their reported financial statement amounts. The results of these calculations do not have a direct connection with the amount of cash taxes to be paid in any future periods. As a result, we believe scheduling deferred income tax liabilities as payments due by period could be misleading, because this scheduling would not relate to liquidity needs.
Defined Benefit Pension Funding and Cost
We sponsor a qualified defined benefit pension plan in the U.S., (the "U.S. Qualified Plan") three defined benefit plans in the U.K. (the "U.K. Plans"), and defined benefit pension plans in the Netherlands, Norway, Germany, and the Philippines (the "other international plans"). Future cash funding of our defined benefit pension plans will depend largely on future investment performance, interest rates, changes to mortality tables, and regulatory requirements. Effective December 31, 2002, we froze our U.S. Qualified Plan. The aggregate deficit in the funded status of the U.S. Plan and other international plans totaled
$74.3 million
and
$87.0 million
at the end of
2018
and
2017
, respectively. The 2018 decrease in the unfunded deficit of our defined benefit pension plans primarily resulted from increased contributions, partially offset by actuarial losses in the year. During
2018
, we made contributions of
$19.0 million
and
$5.0 million
to our U.S. Qualified Plan and U.K. Plans, respectively. In
2017
, we made contributions of
$9.0 million
and
$5.6 million
to our U.S. Qualified Plan and U.K. Plans, respectively. The U.K. Plans were in a funded status totaling
$32.7 million
and
$34.7 million
at the end of 2018 and 2017, respectively with the fair value of plan assets exceeding the projected benefit obligation. There was a $2.0 million decrease during 2018 in the net prepaid pension balances of the U.K. defined benefit plan that is in an overfunded position.
Our frozen U.S. Qualified Plan was underfunded by
$72.5 million
at
December 31, 2018
based on an accumulated benefit obligation of $420.2 million. Crawford expects to make no discretionary contributions in 2019 and
$9,000,000
per annum to the U.S. Qualified Plan for the four years following 2019 to improve the funded status of the plan and minimize future required contributions. We are not making a discretionary contribution in 2019 because we made an additional voluntary contribution of
$10,000,000
in 2018 in addition to our scheduled 2018 discretionary contribution of
$9,000,000
, which generated a one time U.S. tax benefit. We estimate that we will make the following annual minimum contributions over the next five years to our frozen U.S. Qualified Plan.
|
Year Ending December 31,
|
Estimated U.S. Pension Funding
|
||
|
|
(In thousands)
|
||
|
2019
|
$
|
—
|
|
|
2020
|
9,000
|
|
|
|
2021
|
9,000
|
|
|
|
2022
|
9,000
|
|
|
|
2023
|
9,000
|
|
|
42
Funding requirements are no longer as sensitive to changes in the expected rate of return on plan assets and the discount rate used to determine the present value of projected benefits payable under the U.S. Qualified plan. The Bipartisan Budget Act of 2015 ("BBA2015") included pension funding reform which greatly reduced the contributions required to the U.S. Qualified Plan. In addition to BBA2015 legislation, pension funding has been governed by rules under the Pension Protection Act of 2006, as amended by the Worker, Retiree and Employer Recovery Act of 2008, the Preservation of Access to Care for Medicare Beneficiaries and Pension Relief Act of 2010, and the Moving Ahead for Progress in the 21
st
Century Act, and the Highway Transportation Funding Act of 2014.
Volatility in the capital markets and future legislation may have a negative impact on our U.S., U.K. and other international pension plans, which may further increase the underfunded portion of our pension plans and our attendant funding obligations. Expected and required contributions to our underfunded defined benefit pension plans will reduce our liquidity, restrict available cash for our operating, financing, and investing needs and may materially adversely affect our financial condition and our ability to deploy capital to other opportunities.
Commercial Commitments
As a component of our Credit Facility, we maintain a letter of credit facility to satisfy certain contractual obligations. At
December 31, 2018
, the issued, but undrawn, letters of credit totaled approximately
$11.7 million
. These letters of credit are typically renewed annually, but unless renewed, will expire as follows:
|
Amount of Commitment Expiration per Period
|
|||||||||||||||||||
|
One Year or Less
|
1 to 3 Years
|
3 to 5 Years
|
After 5 Years
|
Total
|
|||||||||||||||
|
|
(In thousands)
|
||||||||||||||||||
|
Standby Letters of Credit
|
$
|
11,729
|
|
$
|
—
|
|
$
|
—
|
|
$
|
—
|
|
$
|
11,729
|
|
||||
Off-Balance Sheet Arrangements
At
December 31, 2018
, we were not party to any off-balance sheet arrangements, other than operating leases, which could materially impact our operations, financial condition, or cash flows. We have certain material obligations under operating lease agreements to which we are a party. In accordance with GAAP, these operating lease obligations and the related leased assets are not reported on our consolidated balance sheets.
We maintain funds in trusts to administer claims for certain clients. These funds are not available for our general operating activities and, as such, have not been recorded in the accompanying consolidated balance sheets. We have concluded that we do not have material off-balance sheet financial risk related to these funds at
December 31, 2018
.
Changes in Financial Condition
The following addresses changes in our financial condition not addressed elsewhere in this MD&A.
The Consolidated Balance Sheet as of
December 31, 2018
reflects the reduction of assets and liabilities resulting from the sale of the
Garden City Group
business. Significant changes on our consolidated balance sheet as of
December 31, 2018
, compared with our consolidated balance sheet as of
December 31, 2017
, were as follows:
|
•
|
Accounts receivable decreased by
$43.1 million
, or
$7.8 million
excluding the $31.7 million reduction from the sale of the
Garden City Group
and foreign currency exchange impacts, in
2018
compared with
2017
. The decrease was primarily due to decreased receivables within Crawford Claims Solutions and Crawford Specialty Solutions.
|
|
•
|
Unbilled revenues increased $18.6 million, after exclusion of the $16.7 million reduction from the sale of the
Garden City Group
and foreign currency exchange impacts. The increase was primarily due to increases in Crawford Claims Solutions and Crawford TPA Solutions: Broadspire.
|
|
•
|
Accounts Payable and Accrued Liabilities decreased $8.9 million after exclusion of the $6.5 million reduction from the sale of the
Garden City Group
and foreign currency exchange impacts. The decrease was due to higher payments for accrued compensation and incentive compensation, and accounts payable in 2018.
|
43
Critical Accounting Policies and Estimates
This MD&A addresses our consolidated financial statements, which are prepared in accordance with U.S. GAAP. The preparation of these financial statements requires us to make estimates and assumptions that affect the reported amounts of assets and liabilities, the disclosure of contingent assets and liabilities at the date of the financial statements, and the reported amounts of revenues and expenses during the reporting period. On an ongoing basis, we evaluate these estimates and judgments based upon historical experience and various other factors that we believe are reasonable under then-existing circumstances. The results of these evaluations form the basis for making judgments about the carrying values of assets and liabilities that are not readily apparent from other sources. Actual results may differ from these estimates under different assumptions or conditions.
We believe the following critical accounting policies require significant judgments and estimates in the preparation of our consolidated financial statements. Changes in these underlying estimates could potentially materially affect consolidated results of operations, financial position and cash flows in the period of change. Although some variability is inherent in these estimates, the amounts provided for are based on the best information available to us and we believe these estimates are reasonable.
We have discussed the following critical accounting policies and estimates with the Audit Committee of our Board of Directors, and the Audit Committee has reviewed our related disclosure in this MD&A.
Revenue Recognition
Our revenues are primarily comprised of claims processing or program administration fees. Fees for professional services are recognized as unbilled revenues at estimated collectible amounts at the time such services are rendered. Substantially all unbilled revenues are billed within one year. Out-of-pocket costs incurred in administering a claim are typically passed on to our clients and included in our revenues under GAAP. Deferred revenues represent the estimated unearned portion of fees related to future services to be performed under certain fixed-fee service arrangements. Deferred revenues are recognized into revenues based on the estimated rate at which the services are provided. These rates are primarily based on an evaluation of historical claim closing rates by major claim type. Additionally, recent claim closing rates are evaluated for a significant deterioration or improvement in the longer-term historical closing rates used.
Our fixed-fee service arrangements typically require us to handle claims on either a one- or two-year basis, or for the lifetime of the claim. In cases where we handle a claim on a non-lifetime basis, we typically receive an additional fee on each anniversary date that the claim remains open. For service arrangements where we provide services for the life of the claim, we are only paid one fee for the life of the claim, regardless of the duration of the claim. As a result, our deferred revenues for claims handled for one or two years are not as sensitive to changes in claim closing rates since the revenues are recognized in the near future, and additional fees are generated for handling long-lived claims. Deferred revenues for lifetime claim handling are considered more sensitive to changes in claim closing rates since we are obligated to handle these claims to their conclusion with no additional fees received for long-lived claim
s. For all fixed fee service arrangements, revenues are recognized over the expected service periods, by type of claim.
Based upon our historical averages, we close approximately 99% of all cases referred to us under lifetime claim service arrangements within five years from the date of referral. Also, within that five-year period, the percentage of cases remaining open in any one particular year has remained relatively consistent from period to period. Each quarter we evaluate our historical case closing rates by type of claim and make adjustments as necessary. Any changes in estimates are recognized in the period in which they are determined.
44
As of
December 31, 2018
, deferred revenues related to lifetime claim handling arrangements approximated $39.7 million. If the rate at which we close cases changes, the amount of revenues recognized within a period could be affected. In addition, given the competitive environment in which we operate, we may be unable to raise our prices to offset the additional expense associated with handling longer-lived claims should such case closing rates change. The change in our first-year case closing rates over the last ten years has ranged from a decrease of 3.3% to an increase of 2.2%, and has averaged a decrease of 0.2%. A 1.0% change is a reasonably likely change in our estimate based on historical data. Absent an increase in per-claim fees from our clients, a 1.0% decrease in claim closing rates for lifetime claims would have resulted in the deferral of additional revenues of approximately $1.3 million for the year ended December 31, 2018, $1.4 million for the year ended December 31,
2017
, and $1.5 million for the year ended December 31,
2016
. If our average claim closing rates for lifetime claims increased by 1.0%, we would have recognized additional revenues of approximately $1.3 million for the year ended
December 31, 2018
, $1.3 million for the year ended December 31, 2017, and $1.1 million for the year ended December 31, 2016.
The Company often sells multiple lines of claims processing and different levels of processing depending on the complexity of the claims within a contract. The Company typically provides a menu of offerings from which the customer chooses to purchase or not at their discretion. The price of each service is separate and distinct and provides a separate and distinct value to the customer. Pricing is consistent for each service irrespective of the other service(s) or quantities requested by the customer. For example, if we provide claims processing for auto and general liability, those services are priced and delivered independently.
Allowance for Doubtful Accounts
We maintain allowances for doubtful accounts for estimated losses resulting from the inability of our clients to make required payments and for adjustments to invoiced amounts. Losses resulting from the inability of clients to make required payments are accounted for as bad debt expense, while adjustments to invoices are accounted for as reductions to revenues. These allowances are established by using historical write-off or adjustment information intended to determine future loss expectations and by considering the current credit worthiness of our clients, any known specific collection problems, and our assessment of current industry conditions. Actual experience may differ significantly from historical or expected loss results. Each quarter, we evaluate the adequacy of the assumptions used in determining these allowances and make adjustments as necessary. Changes in estimates are recognized in the period in which they are determined. Historically, our estimates have been materially accurate.
As of
December 31, 2018
and
2017
, our allowance for doubtful accounts totaled
$9.6 million
and
$12.6 million
, or approximately
6.8%
and
6.7%
of gross billed receivables at
December 31, 2018
and
2017
, respectively. If the financial condition of our clients deteriorates, resulting in an inability to make required payments to us, or if economic conditions deteriorate, additional allowances may be deemed to be appropriate or required. If the allowance for doubtful accounts changed by 1.0% of gross billed receivables, reflecting either an increase or decrease in expected future write-offs, the impact to consolidated pretax income would have been approximately
$1.4 million
,
$1.9 million
, and
$1.7 million
in 2018, 2017, and 2016, respectively.
Valuation of Goodwill, Indefinite-Lived Intangible Assets, and Other Long-Lived Assets
We regularly evaluate whether events and circumstances have occurred which indicate that the carrying amounts of goodwill, indefinite-lived intangible assets, or other long-lived assets have been impaired
.
Goodwill is an asset that represents the excess of the purchase price over the fair value of the separately identifiable net assets (tangible and intangible) acquired in certain business combinations.
Our indefinite-lived
intangible assets consist of trade names associated with acquired businesses.
Goodwill and indefinite-lived intangible assets are not amortized, but are subject to impairment testing at least annually.
When factors indicate that such assets should be evaluated for possible impairment between the scheduled annual impairment tests,
we perform an interim impairment test.
Our other
long-lived assets consist primarily of property and equipment, deferred income tax assets, capitalized software, and amortizable intangible assets related to customer relationships, technology, and trade names with finite lives.
Other long-lived assets are evaluated for impairment when impairment indicators are identified.
The Company currently has four reporting units for goodwill impairment purposes. These reporting units are the Crawford Claims Solutions and Crawford TPA Solutions: Broadspire operating segments and the Global Technical Services and Contractor Connection service lines. The Garden City Group was also a reporting unit before its disposal in the second quarter of 2018.
45
In the annual impairment analysis of goodwill, we compare the carrying value of our reporting units, including goodwill, to the estimated fair values of those reporting units as determined by a combination of the income approach, specifically discounting future projected cash flows, and the market approach, specifically the
Guideline Public Company Method
, as described in more detail in Note 1,
"Significant Accounting and Reporting Policies," of our accompanying audited consolidated financial statements in Item 8 of this Annual Report on Form 10-K
. We perform an interim impairment analysis of goodwill when an event occurs or circumstances change between annual tests that would more likely than not reduce the fair value of the reporting unit below its carrying value. The estimated fair values of our reporting units are based upon certain assumptions made by us. The estimated fair values of our reporting units are reconciled to the Company's total market capitalization, including an estimated implied control premium, as determined by its stock price in order to assist in evaluating the reasonableness of the estimated fair values of each of the reporting units.
Goodwill impairment testing is performed on a reporting unit basis. If the fair value of the reporting unit exceeds its carrying value, including goodwill, goodwill is considered not impaired. If the carrying value of a reporting unit exceeds its fair value, an impairment loss shall be recognized in an amount equal to that excess, limited to the total amount of goodwill allocated to that reporting unit. The loss recognized cannot subsequently be reversed.
We have the option to perform a qualitative assessment of goodwill prior to completing the quantitative analysis described above to determine whether it is more likely than not that the fair value of a reporting unit is less than its carrying value, including goodwill. If we conclude that this is the case, we perform the quantitative analysis discussed above.
The estimated fair value of the Company's Crawford TPA Solutions: Broadspire, Global Technical Services and Contractor Connection reporting units exceed their carrying value by a significant margin. The estimated fair value of its Crawford Claims Solutions reporting unit exceeds its carrying value but by a lesser margin. The Crawford Claims Solutions reporting unit has $35.1 million of goodwill allocated to the reporting unit. An increase in the discount rate of over 175 basis points could potentially trigger an impairment in our Crawford Claims Solutions reporting unit goodwill. The Company intends to continue to monitor the performance of its reporting units for potential indicators of impairment. If impairment indicators exist, the Company will perform an interim goodwill impairment analysis.
The key assumptions used in estimating the fair value of our reporting units utilizing the income approach include the discount rate and the terminal growth rate. The discount rates utilized in estimating the fair value of our reporting units in 2018 range between 13.0% and 16.0%, reflecting our
assessment of a market participant's view of the risks associated with the projected cash flows.
The terminal growth rate used in the analysis was
2.0%
.
The assumptions used in estimating the fair values are based on currently available data and management's best estimates of revenues and cash flows and, accordingly, a change in market conditions or other factors could have a material effect on the estimated values. There are inherent uncertainties related to the assumptions used and to management's application of these assumptions.
The indefinite-lived intangible assets consisting of the
Crawford TPA Solutions: Broadspire
and SLS trade names, with carrying values of $29.1 million and $1.7 million, respectively, are also evaluated for potential impairment on an annual basis or when indicators of potential impairment are identified. SLS operates in the Crawford Claim Solutions segment within the U.K. Based on our 2018 analysis, we do not believe these trade names are impaired. The indefinite-lived intangible asset impairment test involves estimating the fair value using an internally prepared discounted cash flow analysis.
The fair values of the Company's trade names are established using the relief-from-royalty method, a form of the income approach. This method recognizes that, by virtue of owning the trade name as opposed to licensing it, a company or reporting unit is relieved from paying a royalty, usually expressed as a percentage of net sales, for the asset's use. The present value of the after-tax costs savings (i.e., royalty relief) at an appropriate discount rate including a tax amortization benefit indicates the value of the trade name.
We determined the discount rate based on our
performance compared to similar market participants, factored by risk in forecasting using a modified capital asset pricing model.
The values of the
Crawford TPA Solutions: Broadspire
and SLS trade names are each sensitive to changes in the assumptions used above. The estimated fair value of our Broadspire and SLS trade names exceed their carrying value by a significant margin. We will continue to monitor the value of these trade names for potential indicators of impairment.
The Company recognized an impairment of $1.1 million related to an indefinite-lived trade name due to a combination of achieving less than forecasted revenue compared to previous modeled results and further reduced forecasted revenue associated with the trade name.
46
Defined Benefit Pension Plans
We sponsor various defined benefit pension plans in the U.S. and U.K. that cover a substantial number of current and former employees in each location. Certain other employees located in the Netherlands, Norway, Germany, and the Philippines have retirement benefits that are accounted for as defined benefit pension plans under GAAP. We utilize the services of independent actuaries to help us estimate our pension obligations and measure pension costs. Our U.S. Qualified Plan was frozen on December 31, 2002. Our U.K. Plans were closed to new employees as of October 31, 1997, but existing participants may still accrue additional limited benefits based on salary levels existing at the close date. Benefits payable under our U.S. Qualified Plan are generally based on career compensation; however, no additional benefits accrue on our frozen U.S. Qualified Plan after December 31, 2002. Benefits payable under the U.K. Plans are generally based on an employee's salary at the time the applicable plan was closed. Our funding policy is to make cash contributions in amounts sufficient to maintain the plans on an actuarially sound basis, but not in excess of amounts deductible under applicable income tax regulations.
Note 9
, "Retirement Plans," of our accompanying audited consolidated financial statements included in Item 8 of this Annual Report on Form 10-K
provides details about the assumptions used in determining the funded status of the plans, the unrecognized actuarial gain/(loss), the components of net periodic benefit cost, benefit payments expected to be made in the future and plan asset allocations.
Investment objectives for the Company's U.S. and U.K. pension plan assets are to:
|
•
|
ensure availability of funds for payment of plan benefits as they become due;
|
|
•
|
provide for a reasonable amount of long-term growth of capital, without undue exposure to volatility, and protect the assets from erosion of purchasing power; and
|
|
•
|
provide investment results that meet or exceed the plans' actuarially assumed long-term rate of return.
|
The long-term goal for the U.S. and U.K. defined benefit pension plans is to reach fully-funded status and to maintain that status. The investment policies contemplate the plans' asset return requirements and risk tolerances changing over time. Accordingly, reallocation of the portfolios' mix of return-seeking assets and liability-hedging assets will be performed as the plans' funded status improves. In conjunction with our investment policies we have rebalanced the U.S. and U.K. defined benefit pension plans' target allocation mix from an equity-weighted to a fixed-income weighted investment strategy, as we have made cash contributions to the plan and the plans' funded status has improved.
The rules for pension accounting are complex and the assumptions used can produce volatility in our results, financial condition and liquidity. Our pension expense is primarily a function of the value of our plan assets and the discount rate used to measure our pension liability at a single point in time at the end of our fiscal year (the measurement date). Both of these factors are significantly influenced by the stock and bond markets, which are subject to volatility.
In addition to expense volatility, we are required to record mark-to-market adjustments to our balance sheet on an annual basis for the net funded status of our pension plans. These adjustments have fluctuated significantly over the past several years and, like our pension expense, are a result of the discount rate and value of our plan assets at each measurement date, as well as periodic changes to mortality tables used to estimate the life expectancy of plan participants. The funded status of our plans may also impact our liquidity, as changes to funding laws in the U.S. may require higher funding levels for our pension plans.
The principal assumptions used in accounting for our defined benefit pension plans are the discount rate, the expected long-term return on plan assets, and the mortality expectations for plan participants. The
discount rate assumptions reflect the rates at which the benefit obligations could be effectively settled. Our discount rates were determined with the assistance of actuaries, who calculate the yield on a theoretical portfolio of high-grade corporate bonds (rated Aa or better) with cash flows that generally match our expected benefit payments in future years.
At
December 31, 2018
, the discount rate used to compute the benefit obligations of the U.S. and U.K.
defined benefit pension plans
were
4.30%
and
2.77%
, respectively.
The estimated average rate of return on plan assets is a long-term, forward-looking assumption that also materially affects our pension cost. It is required to be the expected future long-term rate of earnings on plan assets. Our pension plan assets are invested primarily in collective funds. As part of our strategy to manage future pension costs and net funded status volatility, we have transitioned to a liability-driven investment strategy with a greater concentration of fixed-income securities as described above.
47
Establishing the expected future rate of investment return on our pension assets is a judgmental matter. Management considers the following factors in determining this assumption:
|
•
|
the duration of our pension plan liabilities, which drives the investment strategy we can employ with our pension plan assets;
|
|
•
|
the types of investment classes in which we invest our pension plan assets and the expected return we can reasonably expect those investment classes to earn over time; and
|
|
•
|
the investment returns we can reasonably expect our investment management program to achieve in excess of the returns we could expect if investments were made strictly in indexed funds.
|
We review the expected long-term rate of return on an annual basis and revise it as appropriate. To support our conclusions, we periodically commission asset/liability studies performed by third-party professional investment advisors and actuaries to assist us in our reviews. These studies project our estimated future pension payments and evaluate the efficiency of the allocation of our pension plan assets into various investment categories. These studies also generate probability-adjusted expected future returns on those assets. As a result of the transition to a liability-driven investment strategy described previously, the expected long-term rates of return on plan assets assumption used to determine
2019
net periodic pension cost were estimated to be
6.10%
and
3.28%
for the U.S. and U.K. plans, respectively.
We
review our employee demographic assumptions annually and update the assumptions as necessary. During 2018, we revised the mortality assumptions for the U.S. plans to incorporate the new mortality tables issued by the Society of Actuaries, adjusted to reflect Company-specific experience and future expectations. This resulted in a $1.3 million decrease in the projected benefit obligation for the U.S. plans.
Pension expense is also affected by the accounting policy used to determine the value of plan assets at the measurement date. We apply our expected return on plan assets using fair market value as of the annual measurement date. The fair market value method results in greater volatility to our pension expense than the calculated value method. The amounts recognized in the balance sheet reflect a snapshot of the state of our long-term pension liabilities at the plan measurement date and the effect of mark-to-market accounting on plan assets. At
December 31, 2018
, we recorded a decrease to equity through other comprehensive income ("OCI") of
$18.0 million
(net of tax at the applicable jurisdictional rate) to reflect unrealized actuarial losses during
2018
. At
December 31, 2017
, we recorded an increase to equity through OCI of
$0.7 million
(net of tax at the applicable jurisdictional rate) to reflect unrealized actuarial gains during
2017
. Those changes are subject to amortization over future years and may be reflected in future income statements.
Cumulative unrecognized actuarial losses for all plans were
$280.9 million
through
December 31, 2018
, compared with
$268.5 million
through
December 31, 2017
. These unrecognized losses reflect changes in the discount rates, differences between expected and actual asset returns, and changes to mortality expectations for plan participants, which are being amortized over future periods. These unrecognized losses may be recovered in future periods through actuarial gains. However, unless the minimum amount required to be amortized is below a corridor amount equal to 10.0% of the greater of the projected benefit obligation or the market-related value of plan assets, these unrecognized actuarial losses are required to be amortized and recognized in future periods. For example, projected pension plan expense for
2019
includes
$10.9 million
of amortization of these actuarial losses versus
$10.7 million
in
2018
,
$11.2 million
in
2017
and
$12.8 million
in
2016
.
Net periodic pension expense for our defined benefit pension plans is sensitive to changes in the underlying assumptions for the expected rates of return on plan assets and the discount rates used to determine the present value of projected benefits payable under the plans. If our assumptions for the expected returns on plan assets of our U.S. and U.K. defined benefit pension plans changed by 0.5%, representing either an increase or decrease in expected returns, the impact to
2018
consolidated pretax income would have been approximately $3.2 million. If our assumptions for the discount rates used to determine the present value of projected benefits payable under the plans changed by 0.25%, representing either an increase or decrease in interest rates used to value pension plan liabilities, the impact to
2018
consolidated pretax income would have been approximately
$0.7 million
.
We estimate the service and interest components of net periodic benefit cost for U.S. and international pension and other postretirement benefits. This approach discounts the individual expected cash flows underlying the service cost and interest cost using the applicable spot rates derived from the yield curve used to discount the cash flows used to measure the benefit obligation. For the pension plans, the weighted average spot rates used to determine interest costs were
3.92%
for the Company’s U.S. plans and
2.44%
for the U.K. plans.
48
Determination of Effective Tax Rate Used for Financial Reporting
We account for certain income and expense items differently for financial reporting and income tax purposes. Provisions for deferred taxes are made in recognition of these temporary differences. The most significant differences relate to accrued compensation and pensions, self-insurance, and depreciation and amortization.
For financial reporting purposes in accordance with the liability method of accounting for income taxes, the provision for income taxes is the sum of income taxes both currently payable and deferred. Currently payable income taxes represent the liability related to our income tax returns for the current year, while the net deferred tax expense or benefit represents the change in the balance of deferred tax assets or liabilities as reported on our consolidated balance sheets that are not related to balances in "Accumulated other comprehensive loss." The changes in deferred tax assets and liabilities are determined based upon changes between the basis of assets and liabilities for financial reporting purposes and the basis of assets and liabilities for income tax purposes, multiplied by the enacted statutory tax rates for the year in which we estimate these differences will reverse. We must estimate the timing of the reversal of temporary differences, as well as whether taxable income in future periods will be sufficient to fully recognize any gross deferred tax assets.
Other factors which influence our effective tax rate used for financial reporting purposes include changes in enacted statutory tax rates, changes in tax law or policy, changes in the composition of taxable income from the countries in which we operate, our ability to utilize net operating loss and tax credit carryforwards, and changes in unrecognized tax benefits.
Our effective tax rate, defined as our provision for income taxes divided by income before income taxes, for financial reporting purposes in
2018
,
2017
, and
2016
was
42.0%
,
35.6%
, and
40.4%
, respectively. If our effective tax rate used for financial reporting purposes changed by 1.0%, we would have recognized an increase or decrease to income taxes of approximately $441,000, $635,000, and $316,000 for the years ended
December 31, 2018
,
2017
, and
2016
, respectively. Our effective tax rate for financial reporting purposes is expected to range between
31%
and
33%
in
2019
before considering any discrete items and assuming no changes in tax law or policy in the material jurisdictions in which we operate.
It is possible that future changes in the tax laws of jurisdictions in which we operate, including but not limited to changes in tax law or policy, could have a significant impact on U.S.-based multinational companies such as our Company. At this time we cannot predict the likelihood or details of any such changes or their specific potential impact on our Company.
Our most significant deferred tax assets are related to the unfunded liability of our defined benefit pension plans, tax credit carryforwards and net operating loss ("NOL") carryforwards. The tax deduction for defined benefit pension plans generally occurs upon funding of plan liabilities. Assuming that the estimated minimum funding requirements for the defined benefit pension plans and the income projections are met, the deferred tax asset should be realized.
In accordance with GAAP, we have considered the four possible sources of taxable income that may be available to realize a tax benefit for deductible temporary differences and carryforwards and have an
$25.9 million
valuation allowance on certain net operating loss and tax credit carryforwards in our international and domestic operations. For our remaining deferred tax assets, we believe that it is more likely than not that we will realize these assets based on our forecast of future taxable income and tax planning strategies that are available to the Company. Future changes in the valuation allowance, if required, should not affect our liquidity or our compliance with any existing debt covenants.
Our tax credit carryforwards primarily consist of $14.5 million of foreign tax credit ("FTC") carryforwards, which materially expire in 2020. Companies that cannot credit all the foreign taxes paid or deemed paid in a particular tax year because their foreign taxes exceed their FTC limitation are allowed to carry their excess taxes back to the preceding tax year and then forward to the ten succeeding years. Utilization of our FTCs is dependent upon sufficient U.S. regular taxable income and foreign source income in the relevant foreign tax credit basket which is impacted by the interaction of overall domestic and overall foreign loss rules. Based on our projections of income through 2020, including the estimated impact of the Tax Cuts and Jobs Act in the U.S., we expect to fully utilize all but $7.0 million of the FTC carryforwards before expiration after consideration of the Tax Act and the four sources of taxable income. Accordingly, in the period ended December 31, 2018 we established a valuation allowance against $7.0 million of the FTCs, which was primarily related to the Tax Act.
49
The NOL carryforwards for which a valuation allowance is not recorded primarily consists of $10.8 million of U.K. NOL carryforwards and $5.8 million of state NOL carryforwards generated by our domestic companies. In the U.K., NOL carryforwards have an unlimited life. Based on our evaluation of sources of taxable income, we expect to fully utilize the U.K. NOL carryforwards. Accordingly, we concluded that it was more likely than not that we should be able to utilize our U.K. NOL carryforwards.
In order to fully utilize these state NOL carryforwards, our domestic operations must generate taxable income prior to the expiration of the carryforwards. After consideration of the four sources of taxable income, the Company expects to fully utilize its state NOL carryforwards in the majority of jurisdictions before expiration. Accordingly, we concluded that it was more likely than not that the Company should be able to utilize its state NOL carryforwards for these jurisdictions. There are certain states with unique rules that result in the Company not expecting to utilize the state NOL carryforwards before expiration. For those jurisdictions, we concluded that it was not more likely than not that the Company should be able to utilize its state NOL carryforwards and a valuation allowance was recorded. The valuation allowance against state NOL carryforwards was $1.1 million as of December 31, 2018.
The remaining NOL carryforwards were generated by certain foreign jurisdictions and are generally offset by full valuation allowances.
Self-Insured Risks
We self-insure certain insurable risks consisting primarily of professional liability, auto liability, employee medical, disability, and workers' compensation. Insurance coverage is obtained for catastrophic property and casualty exposures, including professional liability on a claims-made basis, and those risks required to be insured by law or contract. Most of these self-insured risks are in the U.S. Provisions for claims incurred under self-insured programs are made based on our estimates of the aggregate liabilities for claims incurred, including estimated legal fees, losses that have occurred but have not been reported to us, and the adverse developments on reported losses. These estimated liabilities are calculated based on historical claim payment experience, the expected life of the claims, and other factors considered relevant to the claims. The liabilities for claims incurred under our self-insured workers' compensation and employee disability programs are discounted at the prevailing risk-free rate for government issues of an appropriate duration. All other self-insured liabilities are undiscounted. Each quarter we evaluate the adequacy of the assumptions used in developing these estimated liabilities and make adjustments as necessary. Changes in estimates are recognized in the period in which they are determined. Historically, our estimates have been materially accurate.
As of
December 31, 2018
and
2017
, our estimated liabilities for self-insured risks tot
aled
$29.1 million
and
$22.9 million
, respectively. The estimated liability is most sensitive to changes in the ultimate liabilit
y for a claim and, if applicable, the interest rate used to discount the liability. We believe our provisions for self-insured losses are adequate to cover the expected cost of losses incurred. However, these provisions are estimates and amounts ultimately settled may be significantly greater or less than the provisions established. We used a discount rate o
f 2.95% to determine the present value of our self-insured workers' compensation liabilities as of
December 31, 2018
. If the average discount rate was reduced by 1.0% or increased by 1.0%, reflecting either an increase or decrease in underlying interest rates, our estimated liabilities for these self-insured risks at
December 31, 2018
would have been impacted by approximately
$531,000
, resulting in an increase or decrease to
2018
consolidated net income of approximately
$395,000
.
New Accounting Standards
See Note 1, "Significant Accounting and Reporting Policies," of our accompanying audited consolidated financial statements in Item 8 of this Annual Report on Form 10-K for a description of recent accounting pronouncements including the dates, or expected dates of adoption, and effects, or expected effects, on our disclosures, results of operations, financial condition and cash flows.
ITEM 7A.
QUANTITATIVE AND QUALITATIVE DISCLOSURES ABOUT MARKET RISK
Our operations expose us to various market risks, primarily from changes in foreign currency exchange rates and interest rates. Our objective is to identify and understand these risks and implement strategies to manage them. When evaluating potential strategies, we consider the fundamentals of each market and the underlying accounting and business implications. To implement our various strategies, we may enter into various hedging or similar transactions. The sensitivity analysis we present below do not consider the effect of possible adverse changes in the general economy, nor do they consider additional actions we may take from time to time in the future to mitigate our exposure to these or other market risks. There can be no assurance of the manner in which we will manage or continue to manage any risks in the future or that any of our efforts will be successful.
50
Foreign Currency Exchange Rate Risk
Our international operations
expose us to foreign currency exchange rate changes that can impact translations of foreign-denominated assets and liabilities into U.S. dollars and future earnings and cash flows from transactions denominated in different currencies. Revenues before reimbursements from our international operations included in each of our operating segments w
ere
42.2%
,
40.5%
, and
43.0%
of consolidated revenues before reimbursements for
2018
,
2017
, and
2016
,
respectively. We do not presently engage in any hedging activities to compensate for the effect of potential currency exchange rate fluctuations on the net assets or operating results of our foreign subsidiaries.
In February 2011, we entered into a U.S. dollar and Canadian dollar ("CAD") cross currency basis swap with an initial notional amount of CAD34,749,000 as an economic hedge to an intercompany note payable to us by a Canadian subsidiary. The cross currency basis swap required the Canadian subsidiary to deliver quarterly payments of CAD589,000 to the counterparty and entitled us to receive quarterly payments of U.S. $593,000. The Canadian subsidiary also made interest payments to the counterparty based on 3-month Canada Bankers Acceptances plus a spread, and we received payments based on U.S. 3-month LIBOR. The cross currency basis swap had a scheduled expiration date of September 30, 2025. We elected not to designate this swap as a hedge of the intercompany note from the Canadian subsidiary. Accordingly, changes in the fair value of this swap, as well as changes in the value of the intercompany note, were recorded as gains or losses in "Selling, general, and administrative expenses" in our Consolidated Statements of Operations substantially offset one another prior to the settlement date described below. The changes in the fair value of the cross currency basis swap did not exactly offset changes in the value of the intercompany note, as the fair value of this swap was determined based on forward rates while the value of the intercompany note was determined based on end of period spot rates. The net gains and losses for the swap were not significant.
During September 2016, we entered into a transaction ("settlement") in which the Canadian subsidiary repaid the intercompany note payable to us, and we terminated the cross currency basis swap. In connection with the settlement we received proceeds of $4,100,000 in exchange for terminating the cross currency basis swap. For the year ended December 31, 2016, we recognized a net loss of $585,000 due to changes in the fair value of the cross currency basis swap, the value of the intercompany note, and on the settlement. We recognized a net loss on the settlement due to a change in the forward rates used to value the cross currency basis swap which was not substantially offset by the change in the value of the intercompany note based on the spot rate on the day of the settlement.
We measure foreign currency exchange rate risk based on changes in foreign currency exchange rates using a sensitivity analysis. The sensitivity analysis measures the potential change in earnings based on a hypothetical 10.0% change in currency exchange rates. Exchange rates and currency positions as of
December 31, 2018
were used to perform the sensitivity analysis. Such analysis indicated that a hypothetical 10.0% change in foreign currency exchange rates would have increased or decreased consolidated pretax income during
2018
by approximat
ely $3.9 million had the U.S. dollar exchange rate increased or decreased relative to the currencies to which we had exposure.
Interest Rate Risk
Borrowings under the Credit Facility bear interest at a variable rate, based on LIBOR or a Base Rate (as defined), at our option. As a result, we have market risk exposure to changes in interest rates. Based on the amounts of our floating rate debt at
December 31, 2018
and
December 31, 2017
, if market interest rates had increased or decreased an average of 100 basis points our pretax interest expense would have changed by $1.9 million and $2.3 million in
2018
and
2017
, respectively. We determined these amounts by considering the impact of the hypothetical change in interest rates on our borrowing costs.
Changes in the projected benefit obligations of our defined benefit pension plans are largely dependent on changes in prevailing interest rates as of the plans' respective measurement dates, which are used to value these obligations under ASC 715, "Compensation--Retirement Benefits." If our assumptions for the discount rates used to determine the present value of the projected benefit obligations changed by 0.25%, representing either an increase or decrease in the discount rate, the projected benefit obligations of our U.S. and U.K. defined benefit pension plans would have changed by approximately $18.7 million at
December 31, 2018
. The impact of this change to
2018
consolidated pretax income would have been approximately
$0.7 million
.
51
Periodic pension cost for our defined benefit pension plans is impacted primarily by changes in long-term interest rates whereas interest expense for our variable-rate borrowings is impacted more directly by changes in short-term interest rates. To the extent changes in interest rates on our variable-rate borrowings move in the same direction as changes in the discount rates used for our defined benefit pension plans, changes in our interest expense on our borrowings would be offset to some degree by changes in our defined benefit pension cost. We are unable to quantify the extent of any such offset.
Credit Risk Related to Performing Certain Services for Our Clients
We process payments for claims settlements, primarily on behalf of our self-insured clients. The liability for the settlement cost of claims processed, which is generally pre-funded, remains with the client. Accordingly, we do not incur significant credit risk in the performance of these services.
52
ITEM 8.
FINANCIAL STATEMENTS AND SUPPLEMENTARY DATA
Table of Contents
|
|
Page
|
53
CRAWFORD & COMPANY
CONSOLIDATED STATEMENTS OF OPERATIONS
(In thousands, except per share amounts)
|
Year Ended December 31,
|
2018
|
|
2017
|
|
2016
|
||||||
|
Revenues from Services:
|
|||||||||||
|
Revenues before reimbursements
|
$
|
1,070,971
|
|
$
|
1,105,832
|
|
$
|
1,109,286
|
|
||
|
Reimbursements
|
52,008
|
|
57,877
|
|
68,302
|
|
|||||
|
Total Revenues
|
1,122,979
|
|
1,163,709
|
|
1,177,588
|
|
|||||
|
Costs and Expenses:
|
|||||||||||
|
Costs of services provided, before reimbursements
|
755,997
|
|
784,290
|
|
781,810
|
|
|||||
|
Reimbursements
|
52,008
|
|
57,877
|
|
68,302
|
|
|||||
|
Total costs of services
|
808,005
|
|
842,167
|
|
850,112
|
|
|||||
|
Selling, general, and administrative expenses
|
242,421
|
|
239,840
|
|
239,852
|
|
|||||
|
Corporate interest expense, net of interest income of $1,290, $847, and $749, respectively
|
10,109
|
|
9,062
|
|
9,185
|
|
|||||
|
Goodwill and intangible asset impairment charges
|
1,056
|
|
19,598
|
|
—
|
|
|||||
|
Restructuring and special charges
|
—
|
|
12,084
|
|
9,490
|
|
|||||
|
Loss on disposition of business line
|
20,270
|
|
—
|
|
—
|
|
|||||
|
Total Costs and Expenses
|
1,081,861
|
|
1,122,751
|
|
1,108,639
|
|
|||||
|
Other Income (Expense)
|
3,013
|
|
1,304
|
|
(5,708
|
)
|
|||||
|
Income Before Income Taxes
|
44,131
|
|
42,262
|
|
63,241
|
|
|||||
|
Provision for Income Taxes
|
18,542
|
|
15,039
|
|
25,565
|
|
|||||
|
Net Income
|
25,589
|
|
27,223
|
|
37,676
|
|
|||||
|
Net Loss (Income) Attributable to Noncontrolling Interests and Redeemable Noncontrolling Interests
|
389
|
|
442
|
|
(1,710
|
)
|
|||||
|
Net Income Attributable to Shareholders of Crawford & Company
|
$
|
25,978
|
|
$
|
27,665
|
|
$
|
35,966
|
|
||
|
Earnings Per Share - Basic:
|
|||||||||||
|
Class A Common Stock
|
$
|
0.51
|
|
$
|
0.53
|
|
$
|
0.68
|
|
||
|
Class B Common Stock
|
$
|
0.43
|
|
$
|
0.45
|
|
$
|
0.60
|
|
||
|
Earnings Per Share - Diluted:
|
|||||||||||
|
Class A Common Stock
|
$
|
0.50
|
|
$
|
0.52
|
|
$
|
0.67
|
|
||
|
Class B Common Stock
|
$
|
0.42
|
|
$
|
0.45
|
|
$
|
0.60
|
|
||
|
Weighted-Average Shares Used to Compute Basic Earnings Per Share:
|
|||||||||||
|
Class A Common Stock
|
30,805
|
|
31,322
|
|
30,793
|
|
|||||
|
Class B Common Stock
|
24,449
|
|
24,606
|
|
24,690
|
|
|||||
|
Weighted-Average Shares Used to Compute Diluted Earnings Per Share:
|
|||||||||||
|
Class A Common Stock
|
31,434
|
|
32,158
|
|
31,530
|
|
|||||
|
Class B Common Stock
|
24,449
|
|
24,606
|
|
24,690
|
|
|||||
|
Cash Dividends Per Share:
|
|||||||||||
|
Class A Common Stock
|
$
|
0.28
|
|
$
|
0.28
|
|
$
|
0.28
|
|
||
|
Class B Common Stock
|
$
|
0.20
|
|
$
|
0.20
|
|
$
|
0.20
|
|
||
The accompanying notes are an integral part of these consolidated financial statements.
54
CRAWFORD & COMPANY
CONSOLIDATED STATEMENTS OF COMPREHENSIVE INCOME
(In thousands)
|
Year Ended December 31,
|
2018
|
2017
|
2016
|
||||||||
|
Net Income
|
$
|
25,589
|
|
$
|
27,223
|
|
$
|
37,676
|
|
||
|
Other Comprehensive (Loss) Income:
|
|||||||||||
|
Net foreign currency translation (loss) income, net of tax benefit of $0, $0 and $0, respectively
|
(10,830
|
)
|
6,323
|
|
(10,620
|
)
|
|||||
|
Amounts reclassified into net income for defined benefit pension plans, net of tax provision of $2,686, $3,432 and $4,563, respectively
|
8,076
|
|
7,501
|
|
8,623
|
|
|||||
|
Net unrealized (loss) gain on defined benefit plans arising during the year, net of tax benefit (provision) of $5,333, $236, and ($5,175), respectively
|
(18,014
|
)
|
666
|
|
11,337
|
|
|||||
|
Other Comprehensive (Loss) Income
|
(20,768
|
)
|
14,490
|
|
9,340
|
|
|||||
|
|
|
||||||||||
|
Comprehensive Income
|
4,821
|
|
41,713
|
|
47,016
|
|
|||||
|
Comprehensive loss (income) attributable to noncontrolling interests and redeemable noncontrolling interests
|
1,187
|
|
1,248
|
|
(192
|
)
|
|||||
|
Comprehensive Income Attributable to Shareholders of Crawford & Company
|
$
|
6,008
|
|
$
|
42,961
|
|
$
|
46,824
|
|
||
The accompanying notes are an integral part of these consolidated financial statements.
55
CRAWFORD & COMPANY
CONSOLIDATED BALANCE SHEETS
(In thousands)
|
December 31,
|
2018
|
2017
|
|||||
|
ASSETS
|
|||||||
|
Current Assets:
|
|||||||
|
Cash and cash equivalents
|
$
|
53,119
|
|
$
|
54,011
|
|
|
|
Accounts receivable, less allowance for doubtful accounts of $9,625 and $12,588, respectively
|
131,117
|
|
174,172
|
|
|||
|
Unbilled revenues, at estimated billable amounts
|
108,291
|
|
108,745
|
|
|||
|
Income taxes receivable
|
4,084
|
|
7,987
|
|
|||
|
Prepaid expenses and other current assets
|
24,237
|
|
25,452
|
|
|||
|
Total Current Assets
|
320,848
|
|
370,367
|
|
|||
|
Net Property and Equipment
|
34,303
|
|
41,664
|
|
|||
|
Other Assets:
|
|||||||
|
Goodwill
|
96,890
|
|
96,916
|
|
|||
|
Intangible assets arising from business acquisitions, net
|
85,023
|
|
97,147
|
|
|||
|
Capitalized software costs, net
|
72,210
|
|
89,824
|
|
|||
|
Deferred income tax assets
|
22,146
|
|
24,359
|
|
|||
|
Other noncurrent assets
|
70,022
|
|
67,659
|
|
|||
|
Total Other Assets
|
346,291
|
|
375,905
|
|
|||
|
TOTAL ASSETS
|
$
|
701,442
|
|
$
|
787,936
|
|
|
The accompanying notes are an integral part of these consolidated financial statements.
56
CRAWFORD & COMPANY
CONSOLIDATED BALANCE SHEETS
(In thousands, except par value amounts)
|
December 31,
|
2018
|
2017
|
|||||
|
LIABILITIES AND SHAREHOLDERS' INVESTMENT
|
|||||||
|
Current Liabilities:
|
|||||||
|
Short-term borrowings
|
$
|
23,195
|
|
$
|
24,641
|
|
|
|
Accounts payable
|
37,834
|
|
49,303
|
|
|||
|
Accrued compensation and related costs
|
66,530
|
|
75,892
|
|
|||
|
Self-insured risks
|
15,246
|
|
13,407
|
|
|||
|
Income taxes payable
|
3,145
|
|
2,703
|
|
|||
|
Deferred rent
|
15,919
|
|
15,717
|
|
|||
|
Other accrued liabilities
|
32,391
|
|
36,563
|
|
|||
|
Deferred revenues
|
30,961
|
|
37,794
|
|
|||
|
Current installments of capital leases
|
89
|
|
571
|
|
|||
|
Total Current Liabilities
|
225,310
|
|
256,591
|
|
|||
|
Noncurrent Liabilities:
|
|||||||
|
Long-term debt and capital leases, less current installments
|
167,126
|
|
200,460
|
|
|||
|
Deferred revenues
|
21,713
|
|
22,515
|
|
|||
|
Accrued pension liabilities
|
74,323
|
|
87,035
|
|
|||
|
Other noncurrent liabilities
|
32,024
|
|
27,596
|
|
|||
|
Total Noncurrent Liabilities
|
295,186
|
|
337,606
|
|
|||
|
Redeemable Noncontrolling Interests
|
5,500
|
|
6,775
|
|
|||
|
Shareholders' Investment:
|
|||||||
|
Class A common stock, $1.00 par value, 50,000 shares authorized; 30,927 and 31,439 shares issued and outstanding, respectively
|
30,927
|
|
31,439
|
|
|||
|
Class B common stock, $1.00 par value, 50,000 shares authorized; 24,408 and 24,502 shares issued and outstanding, respectively
|
24,408
|
|
24,502
|
|
|||
|
Additional paid-in capital
|
58,793
|
|
53,170
|
|
|||
|
Retained earnings
|
273,607
|
|
269,686
|
|
|||
|
Accumulated other comprehensive loss
|
(216,447
|
)
|
(196,477
|
)
|
|||
|
Shareholders' Investment Attributable to Shareholders of Crawford & Company
|
171,288
|
|
182,320
|
|
|||
|
Noncontrolling interests
|
4,158
|
|
4,644
|
|
|||
|
Total Shareholders' Investment
|
175,446
|
|
186,964
|
|
|||
|
TOTAL LIABILITIES AND SHAREHOLDERS' INVESTMENT
|
$
|
701,442
|
|
$
|
787,936
|
|
|
The accompanying notes are an integral part of these consolidated financial statements.
57
CRAWFORD & COMPANY
CONSOLIDATED STATEMENTS OF CASH FLOWS
(In thousands)
|
Year Ended December 31,
|
2018
|
2017
|
2016
|
||||||||
|
Cash Flows from Operating Activities:
|
|||||||||||
|
Net income
|
$
|
25,589
|
|
$
|
27,223
|
|
$
|
37,676
|
|
||
|
Reconciliation of net income to net cash provided by operating activities:
|
|||||||||||
|
Depreciation and amortization
|
44,079
|
|
41,658
|
|
40,743
|
|
|||||
|
Goodwill and intangible asset impairment charges
|
1,056
|
|
19,598
|
|
—
|
|
|||||
|
Deferred income taxes
|
7,947
|
|
(2,358
|
)
|
10,531
|
|
|||||
|
Loss on disposition of business line
|
20,270
|
|
—
|
|
—
|
|
|||||
|
Stock-based compensation costs
|
6,196
|
|
6,661
|
|
5,252
|
|
|||||
|
Changes in operating assets and liabilities, net of effects of acquisitions and dispositions:
|
|||||||||||
|
Accounts receivable, net
|
7,844
|
|
(14,844
|
)
|
2,781
|
|
|||||
|
Unbilled revenues, net
|
(18,588
|
)
|
(2,644
|
)
|
(7,782
|
)
|
|||||
|
Accrued or prepaid income taxes
|
2,270
|
|
(508
|
)
|
1,755
|
|
|||||
|
Accounts payable and accrued liabilities
|
(8,952
|
)
|
(14,678
|
)
|
17,120
|
|
|||||
|
Deferred revenues
|
(4,969
|
)
|
(3,482
|
)
|
(8,846
|
)
|
|||||
|
Accrued retirement costs
|
(25,896
|
)
|
(15,364
|
)
|
(9,046
|
)
|
|||||
|
Prepaid expenses and other operating activities
|
(4,427
|
)
|
(505
|
)
|
8,680
|
|
|||||
|
Net cash provided by operating activities
|
52,419
|
|
40,757
|
|
98,864
|
|
|||||
|
Cash Flows from Investing Activities:
|
|||||||||||
|
Acquisitions of property and equipment
|
(14,052
|
)
|
(19,044
|
)
|
(10,354
|
)
|
|||||
|
Capitalization of computer software costs
|
(15,968
|
)
|
(25,867
|
)
|
(18,845
|
)
|
|||||
|
Cash proceeds from disposition of business line
|
39,187
|
|
—
|
|
—
|
|
|||||
|
Payments for business acquisitions, net of cash acquired
|
(2,500
|
)
|
(36,029
|
)
|
(3,672
|
)
|
|||||
|
Other investing activities
|
(218
|
)
|
(926
|
)
|
(95
|
)
|
|||||
|
Net cash provided by (used in) investing activities
|
6,449
|
|
(81,866
|
)
|
(32,966
|
)
|
|||||
|
Cash Flows from Financing Activities:
|
|||||||||||
|
Cash dividends paid
|
(13,528
|
)
|
(13,700
|
)
|
(13,565
|
)
|
|||||
|
Payments related to shares received for withholding taxes under stock-based compensation plans
|
(1,110
|
)
|
(1,933
|
)
|
(1,342
|
)
|
|||||
|
Proceeds from shares purchased under employee stock-based compensation plans
|
1,387
|
|
1,154
|
|
1,743
|
|
|||||
|
Decrease in note payable for share repurchase
|
—
|
|
—
|
|
(2,206
|
)
|
|||||
|
Repurchases of common stock
|
(10,409
|
)
|
(7,422
|
)
|
—
|
|
|||||
|
Increases in short-term and revolving credit facility borrowings
|
101,428
|
|
94,407
|
|
80,164
|
|
|||||
|
Payments on short-term and revolving credit facility borrowings
|
(135,433
|
)
|
(58,490
|
)
|
(118,044
|
)
|
|||||
|
Payments on capital lease obligations
|
(477
|
)
|
(1,233
|
)
|
(1,508
|
)
|
|||||
|
Capitalized loan costs
|
(23
|
)
|
(1,926
|
)
|
(12
|
)
|
|||||
|
Dividends paid to noncontrolling interests
|
(574
|
)
|
(514
|
)
|
(381
|
)
|
|||||
|
Net cash (used in) provided by financing activities
|
(58,739
|
)
|
10,343
|
|
(55,151
|
)
|
|||||
|
Effects of exchange rate changes on cash and cash equivalents
|
(1,021
|
)
|
3,208
|
|
(5,244
|
)
|
|||||
|
(Decrease) Increase in Cash and Cash Equivalents
|
(892
|
)
|
(27,558
|
)
|
5,503
|
|
|||||
|
Cash and Cash Equivalents at Beginning of Year
|
54,011
|
|
81,569
|
|
76,066
|
|
|||||
|
Cash and Cash Equivalents at End of Year
|
$
|
53,119
|
|
$
|
54,011
|
|
$
|
81,569
|
|
||
58
CRAWFORD & COMPANY
CONSOLIDATED STATEMENTS OF SHAREHOLDERS' INVESTMENT
(In thousands)
|
Common Stock
|
Additional Paid-In Capital
|
Accumulated Other Comprehensive (Loss) Income
|
Shareholders' Investment Attributable to
|
Total Shareholders' Investment
|
|||||||||||||||||||||||||||
|
Class A Non-Voting
|
Class B Voting
|
Retained Earnings
|
Shareholders of
Crawford &
Company
|
Noncontrolling Interests
|
|||||||||||||||||||||||||||
|
Balance at December 31, 2015
|
$
|
30,537
|
|
$
|
24,690
|
|
$
|
41,936
|
|
$
|
239,161
|
|
$
|
(222,631
|
)
|
$
|
113,693
|
|
$
|
10,658
|
|
$
|
124,351
|
|
|||||||
|
Net income
|
—
|
|
—
|
|
—
|
|
35,966
|
|
—
|
|
35,966
|
|
1,710
|
|
37,676
|
|
|||||||||||||||
|
Other comprehensive income (loss)
|
—
|
|
—
|
|
—
|
|
—
|
|
10,858
|
|
10,858
|
|
(1,518
|
)
|
9,340
|
|
|||||||||||||||
|
Cash dividends paid
|
—
|
|
—
|
|
—
|
|
(13,565
|
)
|
—
|
|
(13,565
|
)
|
—
|
|
(13,565
|
)
|
|||||||||||||||
|
Stock-based compensation
|
—
|
|
—
|
|
5,252
|
|
—
|
|
—
|
|
5,252
|
|
—
|
|
5,252
|
|
|||||||||||||||
|
Shares issued in connection with stock-based compensation plans, net
|
759
|
|
—
|
|
(368
|
)
|
—
|
|
—
|
|
391
|
|
—
|
|
391
|
|
|||||||||||||||
|
Decrease in value of noncontrolling interest due to sale of controlling interest
|
—
|
|
—
|
|
1,288
|
|
—
|
|
—
|
|
1,288
|
|
(5,088
|
)
|
(3,800
|
)
|
|||||||||||||||
|
Dividends paid to noncontrolling interests
|
—
|
|
—
|
|
—
|
|
—
|
|
—
|
|
—
|
|
(381
|
)
|
(381
|
)
|
|||||||||||||||
|
Balance at December 31, 2016
|
31,296
|
|
24,690
|
|
48,108
|
|
261,562
|
|
(211,773
|
)
|
153,883
|
|
5,381
|
|
159,264
|
|
|||||||||||||||
|
Net income
(1)
|
—
|
|
—
|
|
—
|
|
27,665
|
|
—
|
|
27,665
|
|
526
|
|
28,191
|
|
|||||||||||||||
|
Other comprehensive income (loss)
|
—
|
|
—
|
|
—
|
|
—
|
|
15,296
|
|
15,296
|
|
(806
|
)
|
14,490
|
|
|||||||||||||||
|
Cash dividends paid
|
—
|
|
—
|
|
—
|
|
(13,700
|
)
|
—
|
|
(13,700
|
)
|
—
|
|
(13,700
|
)
|
|||||||||||||||
|
Stock-based compensation
|
—
|
|
—
|
|
6,661
|
|
—
|
|
—
|
|
6,661
|
|
—
|
|
6,661
|
|
|||||||||||||||
|
Repurchases of common stock
|
(701
|
)
|
(188
|
)
|
—
|
|
(6,533
|
)
|
—
|
|
(7,422
|
)
|
—
|
|
(7,422
|
)
|
|||||||||||||||
|
Shares issued in connection with stock-based compensation plans, net
|
844
|
|
—
|
|
(1,623
|
)
|
692
|
|
—
|
|
(87
|
)
|
—
|
|
(87
|
)
|
|||||||||||||||
|
Increase in value of noncontrolling interest due to acquisition of controlling interest
|
—
|
|
—
|
|
24
|
|
—
|
|
—
|
|
24
|
|
57
|
|
81
|
|
|||||||||||||||
|
Dividends paid to noncontrolling interests
|
—
|
|
—
|
|
—
|
|
—
|
|
—
|
|
—
|
|
(514
|
)
|
(514
|
)
|
|||||||||||||||
|
Balance at December 31, 2017
|
31,439
|
|
24,502
|
|
53,170
|
|
269,686
|
|
(196,477
|
)
|
182,320
|
|
4,644
|
|
186,964
|
|
|||||||||||||||
|
Net income
(1)
|
—
|
|
—
|
|
—
|
|
25,978
|
|
—
|
|
25,978
|
|
886
|
|
26,864
|
|
|||||||||||||||
|
Other comprehensive income (loss)
|
—
|
|
—
|
|
—
|
|
—
|
|
(19,970
|
)
|
(19,970
|
)
|
(798
|
)
|
(20,768
|
)
|
|||||||||||||||
|
Cash dividends paid
|
—
|
|
—
|
|
—
|
|
(13,528
|
)
|
—
|
|
(13,528
|
)
|
—
|
|
(13,528
|
)
|
|||||||||||||||
|
Stock-based compensation
|
—
|
|
—
|
|
6,196
|
|
—
|
|
—
|
|
6,196
|
|
—
|
|
6,196
|
|
|||||||||||||||
|
Repurchases of common stock
|
(1,144
|
)
|
(94
|
)
|
—
|
|
(9,171
|
)
|
—
|
|
(10,409
|
)
|
—
|
|
(10,409
|
)
|
|||||||||||||||
|
Shares issued in connection with stock-based compensation plans, net
|
632
|
|
—
|
|
(355
|
)
|
642
|
|
—
|
|
919
|
|
—
|
|
919
|
|
|||||||||||||||
|
Decrease in value of noncontrolling interest due to acquisition of controlling interest
|
—
|
|
—
|
|
(218
|
)
|
—
|
|
—
|
|
(218
|
)
|
—
|
|
(218
|
)
|
|||||||||||||||
|
Dividends paid to noncontrolling interests
|
—
|
|
—
|
|
—
|
|
—
|
|
—
|
|
—
|
|
(574
|
)
|
(574
|
)
|
|||||||||||||||
|
Balance at December 31, 2018
|
$
|
30,927
|
|
$
|
24,408
|
|
$
|
58,793
|
|
$
|
273,607
|
|
$
|
(216,447
|
)
|
$
|
171,288
|
|
$
|
4,158
|
|
$
|
175,446
|
|
|||||||
The accompanying notes are an integral part of these consolidated financial statements.
(1)
The total net income presented in the consolidated statement of shareholders' investment for the years ended December 31, 2017 and December 31, 2018 excludes
$968
and
$1,275
respectively, in net loss attributable to the redeemable noncontrolling interests.
59
Notes to Consolidated Financial Statements
|
1.
|
Significant Accounting and Reporting Policies
|
Nature of Operations
Based in Atlanta, Georgia, Crawford & Company ("Crawford" or "the Company") is
the world's largest publicly listed independent provider of claims management and outsourcing solutions to the risk management and insurance industry, as well as to self-insured entities, with an expansive global network serving clients
in more than
70
countries. Shares of the Company's
two
classes of common stock are traded on the New York Stock Exchange ("NYSE") under the symbols CRD-A and CRD-B, respectively. The Company's
two
classes of stock are substantially identical, except with respect to voting rights and the Company's ability to pay greater cash dividends on the non-voting Class A Common Stock than on the voting Class B Common Stock, subject to certain limitations. In addition, with respect to mergers or similar transactions, holders of Class A Common Stock must receive the same type and amount of consideration as holders of Class B Common Stock, unless different consideration is approved by the holders of
75%
of the Class A Common Stock, voting as a class. The Company's website is www.crawco.com. The information contained on, or hyperlinked from, the Company's website is not a part of, and is not incorporated by reference into, this report.
Principles of Consolidation
The accompanying consolidated financial statements were prepared in accordance with generally accepted accounting principles in the U.S. ("GAAP") and include the accounts of the Company, its majority-owned subsidiaries, and variable interest entities in which the Company is deemed to be the primary beneficiary. Significant intercompany transactions are eliminated in consolidation. Financial results from the Company's operations outside of the U.S., Canada, the Caribbean, and certain subsidiaries in the Philippines, are reported and consolidated on a two-month delayed basis in accordance with the provisions of Accounting Standards Codification ("ASC") 810, "Consolidation," in order to provide sufficient time for accumulation of their results. Accordingly, the Company's
December 31, 2018
,
2017
, and
2016
consolidated financial statements include the financial position of such operations as of October 31,
2018
and
2017
, respectively, and the results of their operations and cash flows for the fiscal periods ended October 31,
2018
,
2017
, and
2016
, respectively.
The Company has controlling ownership interests in several entities that are not wholly-owned by the Company. The financial results and financial positions of these controlled entities are included in the Company's consolidated financial statements, including the controlling interests, noncontrolling interests, and redeemable noncontrolling interests. The noncontrolling interests and redeemable noncontrolling interests represent the equity interests in these entities that are not attributable, either directly or indirectly, to the Company. On the Company's Consolidated Statements of Operations, net income or loss is separately attributed to the controlling interests and noncontrolling interests and redeemable noncontrolling interests.
Noncontrolling interests represent the minority shareholders' share of the net income or loss and shareholders' investment in consolidated subsidiaries. Noncontrolling interests are presented as a component of shareholders' investment in the Consolidated Balance Sheets and reflect the initial fair value of these investments by noncontrolling shareholders, along with their proportionate share of the income or loss of the subsidiaries, less any dividends or distributions. Noncontrolling interests that are redeemable at the option of the holder are presented outside of shareholders' investment as "Redeemable Noncontrolling Interests" and are carried at either their initial fair value plus any profits or losses or estimated redemption value if an adjustment is required.
The Company consolidates the results of a variable interest entity ("VIE") when it is determined to be the primary beneficiary. In accordance with GAAP, in determining whether the Company is the primary beneficiary of a VIE for financial reporting purposes, it considers whether it has the power to direct the activities of the VIE that most significantly impact the economic performance of the VIE and whether it has the obligation to absorb losses or the right to receive returns that would be significant to the VIE.
60
The Company consolidates the results of Lloyd Warwick International Limited ("LWI"), of which it owns
51%
of the capital stock. LWI is a VIE primarily because it does not meet the business scope exception, as Crawford provides more than half of the financial support, and because LWI lacks sufficient equity at risk to permit LWI to carry on its activities without additional financial support. Crawford has agreed to provide financial support to LWI of approximately
$10,000,000
. Crawford is considered to be the primary beneficiary of LWI because of its controlling ownership interest and because Crawford has the obligation to absorb LWI's losses through the additional financial support that Crawford may be obligated to provide. Creditors of LWI have no recourse to Crawford's general credit. Total assets and liabilities of LWI as of
December 31, 2018
were $
12,232,000
and $
10,423,000
, respectively. Total assets and liabilities of LWI as of
December 31, 2017
were $
10,083,000
and $
10,685,000
, respectively. Included in LWI's total liabilities at
December 31, 2018
and
2017
were loans from Crawford of $
6,934,000
and $
8,580,000
, respectively.
The Company consolidates the liabilities of its deferred compensation plan and the related assets, which are held in a rabbi trust and also considered a VIE of the Company. The rabbi trust was created to fund the liabilities of the Company's deferred compensation plan. The Company is considered the primary beneficiary of the rabbi trust because the Company directs the activities of the trust and can use the assets of the trust to satisfy the liabilities of the Company's deferred compensation plan
. At
December 31, 2018
and
2017
, the liabilities of this deferred compensation plan were
$8,914,000
and
$9,337,000
, respectively,
which represented obligations of the Company rather than of the rabbi trust, and the values of the assets held in the related rabbi trust
were
$16,402,000
and
$16,538,000
, respectively. These liabilities and assets are included in "Other noncurrent liabilities" and "Other noncurrent assets" on the Company's Consolidated Balance Sheets, respectively.
Prior Year Reclassifications
The prior year presentation of certain segment information has been reclassified to conform to the current year presentation.
Management's Use of Estimates
The preparation of financial statements in conformity with GAAP requires management to make estimates and assumptions that affect the reported amounts of assets and liabilities, disclosure of contingent assets and liabilities at the date of the financial statements, and the reported amounts of revenues and expenses during the reporting period. Actual results could differ materially from those estimates.
Revenue Recognition
Revenues are recognized when control of the promised services are transferred to the Company's customers in an amount that reflects the consideration the Company expects to be entitled to in exchange for those services. Revenues are recognized net of any sales, use or value added taxes collected from customers, which are subsequently remitted to governmental authorities. As the Company completes its performance obligations, it has an unconditional right to consideration as outlined in the Company's contracts.
The Company's Crawford Claims Solutions segment generates revenue for claims management services provided to insurance companies and self-insured entities related to property, casualty and catastrophe losses caused by physical damage to commercial and residential real property and personal property. The Company's Crawford TPA Solutions: Broadspire segment is a third party administrator that generates revenue through its Claims Management and Medical Management service lines. The Company's
Crawford Specialty Solutions
segment principally generates revenues through its Global Technical Services and Contractor Connection service lines as well as its former
Garden City Group
service line prior to the date of its disposition. The Global Technical Services service line generates revenues for claims management services provided to insurance companies and self-insured entities related to large, complex losses with technical adjusting and industry experts. The Contractor Connection service line generates revenue through its independently managed contractor network, with approximately 6,000 credentialed residential and commercial contractors. Prior to its disposition, the
Garden City Group
service line generated revenues by performing legal settlement administration services on behalf of law firms, corporations, government agencies, and courts. See Note 2, “Revenue Recognition” for further discussion on the Company’s revenue recognition policies.
Intersegment sales are recorded at cost and are not material.
61
Cash and Cash Equivalents
Cash and cash equivalents consist of cash on hand and marketable securities with original maturities of three months or less. The fair value of cash and cash equivalents approximates book value due to their short-term nature. At
December 31, 2018
, cash and cash equivalents included time deposits of approximately
$1,554,000
that were in financial institutions outside the U.S.
Accounts Receivable and Allowance for Doubtful Accounts
The Company extends credit based on an evaluation of a client's financial condition and, generally, collateral is not required. Accounts receivable are typically due upon receipt of the invoice and are stated on the Company's Consolidated Balance Sheets at amounts due from clients net of an estimated allowance for doubtful accounts. Accounts outstanding longer than the contractual payment terms are considered past due. The fair value of accounts receivable approximates book value due to their short-term contractual stipulations.
The Company maintains an allowance for doubtful accounts for estimated losses resulting primarily from the inability of clients to make required payments. Such losses are accounted for as bad debt expense, while adjustments to invoices are accounted for as reductions to revenue. These allowances are established using historical write-off or adjustment information to project future experience and by considering the current creditworthiness of clients, any known specific collection problems, and an assessment of current industry and economic conditions. Actual experience may differ significantly from historical or expected loss results. The Company writes off accounts receivable when they become uncollectible, and any payments subsequently received are accounted for as recoveries. A summary of the activities in the allowance for doubtful accounts for the years ended
December 31, 2018
,
2017
, and
2016
is as follows:
|
|
2018
|
2017
|
2016
|
||||||||
|
|
(In thousands)
|
||||||||||
|
Allowance for doubtful accounts, January 1
|
$
|
12,588
|
|
$
|
14,499
|
|
$
|
13,133
|
|
||
|
Add/ (Deduct):
|
|||||||||||
|
Provision for bad debt expense
|
2,709
|
|
1,554
|
|
2,654
|
|
|||||
|
Write-offs, net of recoveries
|
(3,695
|
)
|
(4,045
|
)
|
50
|
|
|||||
|
Currency translation and other changes
|
(365
|
)
|
580
|
|
(937
|
)
|
|||||
|
Adjustments for business dispositions
|
(1,612
|
)
|
—
|
|
(401
|
)
|
|||||
|
Allowance for doubtful accounts, December 31
|
$
|
9,625
|
|
$
|
12,588
|
|
$
|
14,499
|
|
||
Goodwill, Indefinite-Lived Intangible Assets, and Other Long-Lived Assets
Goodwill is an asset that represents the excess of the purchase price over the fair value of the separately identifiable net assets (tangible and intangible) acquired in certain business combinations.
Indefinite-lived
intangible assets consist of trade names associated with acquired businesses.
Goodwill and indefinite-lived intangible assets are not amortized, but are subject to impairment testing at least annually.
Other
long-lived assets consist primarily of property and equipment, deferred income tax assets, capitalized software, and amortizable intangible assets related to customer relationships, technology, and trade names with finite lives.
Other long-lived assets are evaluated for impairment when impairment indicators are identified.
Subsequent to a business acquisition in which goodwill and indefinite-lived intangibles are recorded as assets, post-acquisition accounting requires that both be tested to determine whether there has been an impairment. The Company performs an impairment test of goodwill and indefinite-lived intangible assets at least annually on October 1 of each year. The Company regularly evaluates whether events and circumstances have occurred which indicate potential impairment of goodwill or indefinite-lived intangible assets.
When factors indicate that such assets should be evaluated for possible impairment between the scheduled annual impairment tests,
the Company performs an interim impairment test.
Goodwill impairment testing is performed on a reporting unit basis. If the fair value of the reporting unit exceeds its carrying value, including goodwill, goodwill is considered not impaired. If the carrying value of a reporting unit exceeds its fair value, an impairment loss shall be recognized in an amount equal to that excess, limited to the total amount of goodwill allocated to that reporting unit. The loss recognized cannot subsequently be reversed.
62
The Company currently has four reporting units for goodwill impairment purposes. These reporting units are the Crawford Claims Solutions and Crawford TPA Solutions: Broadspire operating segments and the Global Technical Services and Contractor Connection service lines. The
Garden City Group
was also a reporting unit before its disposal in the second quarter of 2018.
The carrying value of the reporting unit, including goodwill, is compared with the estimated fair value of the reporting unit as determined utilizing a combination of the income and market approaches. The income approach, which is a level 3 fair value measurement, is based on projected debt-free cash flow which is discounted to the present value using discount factors that consider the timing and risk of the cash flows. The market approach is based on the
Guideline Public Company Method
, which uses market pricing metrics to select multiples to value the Company's reporting units. The resulting estimated fair values of the combined reporting units are reconciled to the Company's market capitalization including an estimated implied control premium. The Company believes that the combination of these approaches is appropriate because it provides a fair value estimate based upon the combination of the reporting unit's expected long-term operating cash flow performance and multiples with which similar publicly traded companies are valued. The Company weights the income and market approaches equally.
During 2018, the Company performed the goodwill impairment testing on all reporting units. The estimated fair value of the Company's Crawford TPA Solutions: Broadspire, Global Technical Services and Contractor Connection reporting units exceed their carrying value by a significant margin. The estimated fair value of its Crawford Claims Solutions reporting unit exceeds its carrying value but by a lesser margin. The Crawford Claims Solutions reporting unit has
$35.1 million
of goodwill allocated to the reporting unit. An increase in the discount rate of over 175 basis points could potentially trigger an impairment in our Crawford Claims Solutions reporting unit goodwill. The Company intends to continue to monitor the performance of its reporting units for potential indicators of impairment. If impairment indicators exist, the Company will perform an interim goodwill impairment analysis.
The key assumptions used in estimating the fair value of our reporting units utilizing the income approach include the discount rate and the terminal growth rate. The discount rates utilized in estimating the fair value of our reporting units in
2018
range between
13.0%
and
16.0%
, reflecting the Company's
assessment of a market participant's view of the risks associated with the projected cash flows.
The terminal growth rate used in the analysis was
2.0%
.
The assumptions used in estimating the fair values are based on currently available data and management's best estimates of revenues and cash flows and, accordingly, a change in market conditions or other factors could have a material effect on the estimated values. There are inherent uncertainties related to the assumptions used and to management's application of these assumptions.
If changes to the Company's reporting structure impact the composition of its reporting units, existing goodwill is reallocated to the revised reporting units based on their relative estimated fair values as determined by a combination of the income and market approaches. If all of the assets and liabilities of an acquired business are assigned to a specific reporting unit, the goodwill associated with that acquisition is assigned to that reporting unit at acquisition unless another reporting unit is also expected to benefit from the acquisition.
For impairment testing of indefinite-lived intangible assets, the book value is compared with the estimated fair value, which is estimated based on the present value of the after-tax cash flows attributable solely to the asset. If book value exceeds the estimated fair value, an impairment is recognized based on the excess.
The fair values of the Company's trade names are established using the relief-from-royalty method, a form of the income approach. This method recognizes that, by virtue of owning the trade name as opposed to licensing it, a company or reporting unit is relieved from paying a royalty, usually expressed as a percentage of net sales, for the asset's use. The present value of the after-tax costs savings (i.e., royalty relief) at an appropriate discount rate including a tax amortization benefit indicates the value of the trade name.
The Company determined the discount rate based on its
performance compared to similar market participants, factored by risk in forecasting using a modified capital asset pricing model.
63
Property and Equipment
Property and equipment are stated at cost less accumulated depreciation. The Company depreciates the cost of property and equipment, including assets recorded under capital leases, over the shorter of the remaining lease term or the estimated useful lives of the related assets, primarily using the straight-line method. The estimated useful lives for property and equipment classifications are as follows:
|
Classification
|
Estimated Useful Lives
|
||
|
Furniture and fixtures
|
3-10 years
|
||
|
Data processing equipment
|
3-5 years
|
||
|
Automobiles and other
|
3-4 years
|
||
|
Buildings and improvements
|
7-40 years
|
||
Property and equipment, including assets under capital leases, consisted of the following at
December 31, 2018
and
2017
:
|
December 31,
|
2018
|
2017
|
|||||
|
|
(In thousands)
|
||||||
|
Land
|
$
|
316
|
|
$
|
343
|
|
|
|
Buildings and improvements
|
28,957
|
|
32,802
|
|
|||
|
Furniture and fixtures
|
33,401
|
|
38,016
|
|
|||
|
Data processing equipment
|
53,790
|
|
67,748
|
|
|||
|
Automobiles
|
227
|
|
594
|
|
|||
|
Total property and equipment
|
116,691
|
|
139,503
|
|
|||
|
Less accumulated depreciation
|
(82,388
|
)
|
(97,839
|
)
|
|||
|
Net property and equipment
|
$
|
34,303
|
|
$
|
41,664
|
|
|
Additions to property and equipment under capital leases, which are excluded from acquisitions of property and equipment in the Company's Statements of Cash Flows, totaled
$760,000
and
$242,000
for
2017
and
2016
, respectively. There were
no
such additions during
2018
.
Depreciation on property and equipment, including property under capital leases and amortization of leasehold improvements, was
$12,862,000
,
$12,557,000
, and
$14,729,000
for the years ended
December 31, 2018
,
2017
, and
2016
, respectively.
Capitalized Software
Capitalized software costs reflects costs related to internally developed or purchased software used by the Company that has expected future economic benefits. Certain internal and external costs incurred during the application development stage are capitalized. Costs incurred during the preliminary project and post implementation stages, including training and maintenance costs, are expensed as incurred. The majority of these capitalized software costs consist of internal payroll costs and external payments for software development, purchases and related services. These capitalized software costs are typically amortized over periods ranging from
three
to
ten
years, depending on the estimated life of each software application. Amortization expense for capitalized software was
$20,066,000
,
$18,118,000
, and
$16,045,000
for the years ended
December 31, 2018
,
2017
, and
2016
, respectively.
64
Self-Insured Risks
The Company self-insures certain risks consisting primarily of professional liability, auto liability, and employee medical, disability, and workers' compensation liability. Insurance coverage is obtained for catastrophic property and casualty exposures, including professional liability on a claims-made basis, and those risks required to be insured by law or contract. Most of these self-insured risks are in the U.S. Provisions for claims under the self-insured programs are made based on the Company's estimates of the aggregate liabilities for claims incurred, including estimated legal fees, losses that have occurred but have not been reported to the Company, and for adverse developments on reported losses. The estimated liabilities are calculated based on historical claims experience, the expected lives of the claims, and other factors considered relevant by management. Changes in these estimates may occur as additional information becomes available. The estimated liabilities for claims incurred under the Company's self-insured workers' compensation and employee disability programs are discounted at the prevailing risk-free interest rate for U.S. government securities of an appropriate duration. All other self-insured liabilities are undiscounted. At
December 31, 2018
and
2017
, accrued liabilities for self-insured risks totaled
$29,078,000
and
$22,854,000
, respectively, including current liabilities of
$15,246,000
and
$13,407,000
, respectively. The noncurrent liabilities are included in "Other noncurrent liabilities" on the Company's Consolidated Balance Sheets.
Income Taxes
The Company accounts for certain income and expense items differently for financial reporting and income tax purposes. Provisions for deferred taxes are made in recognition of these temporary differences. The most significant differences relate to accrued compensation, pension plans, self-insurance, and depreciation and amortization.
For financial reporting purposes, the provision for income taxes is the sum of income taxes both currently payable and payable on a deferred basis. Currently payable income taxes represent the liability related to the income tax returns for the current year, while the net deferred tax expense or benefit represents the change in the balance of deferred income tax assets or liabilities as reported on the Company's Consolidated Balance Sheets that are not related to balances in "Accumulated other comprehensive loss." The changes in deferred income tax assets and liabilities are determined based upon changes in the differences between the basis of assets and liabilities for financial reporting purposes and the basis of assets and liabilities for income tax purposes, measured by the enacted statutory tax rates in effect for the year in which the Company estimates these differences will reverse. The Company must estimate the timing of the reversal of temporary differences, as well as whether taxable income in future periods will be sufficient to fully recognize any gross deferred tax assets. A valuation allowance is provided when it is deemed more-likely-than-not that some portion or all of a deferred tax asset will not be realized.
In 2017, the Company estimated the impact of the Tax Cuts and Jobs Act (the "Tax Act") incorporating assumptions made based upon its current interpretation of the Tax Act and included them in its consolidated financial statements for the year ended December 31, 2017. The SEC Staff issued Staff Accounting Bulletin No. 118 (“SAB 118”) to address the application of U.S. GAAP in situations when a registrant does not have the necessary information available, prepared, or analyzed (including computations) in reasonable detail to complete the accounting for certain income tax effects of the Tax Act. The Company recognized provisional tax impacts related to Transition Tax and revaluation of domestic deferred tax balances, and included those amounts in its consolidated financial statements for the year ended December 31, 2017. In the period ended December 31, 2018, the Company completed its accounting for the Tax Act in accordance with SAB 118. As a result, the Company recorded additional income tax expense of
$3.6 million
. This expense consisted of substantially all of the
$7.0 million
valuation allowance established against foreign tax credits and
$0.1 million
for the revaluation of deferred taxes, net of
$3.5 million
of Transition Tax release of uncertain tax positions and adjustments. The Company has completed the accounting for the Tax Act within the one year measurement period, as allowed under SAB 118.
Other factors which influence the effective tax rate used for financial reporting purposes include
changes in enacted statutory tax rates, changes in tax law or policy, changes in the composition of taxable income from the countries in which it operates, the Company's ability to utilize net operating loss and tax credit carryforwards, and changes in unrecognized tax benefits.
See Note 8, "Income Taxes" for further discussion.
Topic 740, No. 5,
Accounting for Global Intangible Low-Taxed Income
, states that an entity can make an accounting policy election to either recognize deferred taxes for temporary basis differences expected to reverse as GILTI in future years or to provide for the tax expense related to GILTI in the year the tax is incurred as a period expense only. At December 31, 2018, the Company has elected to account for GILTI in the year the tax is incurred.
65
Sales and Other Taxes
In certain jurisdictions, both in the U.S. and internationally, various governments and taxing authorities require the Company to assess and collect sales and other taxes, such as value added taxes, on certain services that the Company renders and bills to its customers. The majority of the Company's revenues are not currently subject to these types of taxes. These taxes are not recorded as additional revenues or expenses in the Company's Consolidated Statements of Operations, but are recorded on the Consolidated Balance Sheets as pass-through amounts until remitted.
Foreign Currency
Foreign currency transactions for the years ended
December 31, 2018
,
2017
, and
2016
resulted in a net gain of
$73,000
, and net losses of
$685,000
and
$339,000
respectively.
For operations outside the U.S. that prepare financial statements in currencies other than the U.S. dollar, results of operations and cash flows are translated into U.S. dollars at average exchange rates during the period, and assets and liabilities are translated at end-of-period exchange rates. The resulting translation adjustments, on a net basis, are included in "Other Comprehensive Income" in the Company's Consolidated Statements of Comprehensive Income, and the accumulated translation adjustment is reported as a component of "Accumulated other comprehensive loss" in the Company's Consolidated Balance Sheets.
Advertising Costs
Advertising costs are expensed in the period in which the costs are incurred. Advertising expenses were
$3,572,000
,
$7,091,000
, and
$3,382,000
, respectively, for the years ended
December 31, 2018
,
2017
, and
2016
. The increase in 2017 was due to costs associated with a branding campaign for the Contractor Connection service line within the Company's
Crawford Specialty Solutions
segment.
Adoption of New Accounting Standards
Revenue from Contracts with Customers
In May 2014, the Financial Accounting Standards Board ("FASB") issued Accounting Standards Update ("ASU") 2014-09 "Revenue from Contracts with Customers" together with its subsequent related amendments in 2015 and 2016, collectively referred to as ASC 606. ASC 606 also includes Subtopic 340-40, Other Assets and Deferred Costs - Contracts with Customers, which requires the deferral of incremental costs of obtaining a contract with a customer. This new standard is effective for annual periods beginning after December 15, 2017, including interim periods within those reporting periods. ASC 606 supersedes the revenue recognition requirements in ASC 605 “Revenue Recognition,” and requires entities to recognize revenues when control of the promised goods or services is transferred to customers at an amount that reflects the consideration to which the entity expects to be entitled to in exchange for those goods or services. The Company adopted ASC 606 as of January 1, 2018 (“transition date”) using the modified retrospective transition method, and applied the new guidance to contracts not substantially completed at the transition date. As a result of adopting ASC 606, the Company recognized a cumulative-effect adjustment to the opening balance of retained earnings as of January 1, 2018.
66
The cumulative effect of the changes made to the Company's Consolidated Balance Sheets as of January 1, 2018 are as follows:
|
Transition Adjustments
|
Adjusted Balances
|
|||||||||||
|
(in thousands)
|
December 31, 2017*
|
Crawford Claims Solutions
|
Crawford Specialty Solutions
|
January 1, 2018
|
||||||||
|
Assets:
|
||||||||||||
|
Unbilled revenues, at estimated billable amounts
|
$
|
108,745
|
|
$
|
1,150
|
|
$
|
—
|
|
$
|
109,895
|
|
|
Deferred income tax assets
|
24,359
|
|
(285
|
)
|
77
|
|
24,151
|
|
||||
|
Liabilities:
|
||||||||||||
|
Deferred revenues (current)
|
37,794
|
|
—
|
|
300
|
|
38,094
|
|
||||
|
Shareholders' Investment:
|
||||||||||||
|
Retained earnings
|
269,686
|
|
865
|
|
(223
|
)
|
270,328
|
|
||||
|
* Derived from the audited Consolidated Balance Sheets
|
||||||||||||
The Crawford Claims Solutions transition adjustment relates to a change in the method utilized to measure the satisfaction of the performance obligation for short term claims loss adjusting service contracts that were in process as of the transition date. The performance obligation for these contracts is satisfied over a short period of time, on average within
30
days. Under ASC 606, revenue is recognized based on historical claim closure rates and claim type applied utilizing a portfolio approach based on time elapsed for these claims. The
Crawford Specialty Solutions
transition adjustment relates to a change in the method utilized to measure the satisfaction of the performance obligation for fixed fee contracts within the
Garden City Group
business, which was disposed of in the second quarter of 2018.
Compensation-Stock Compensation: Scope of Stock Compensation Modification Accounting
In May 2017, the FASB issued ASU 2017-9, "Compensation-Stock Compensation: Scope of Stock Compensation Modification Accounting." This ASU was issued to provide clarity and reduce both (1) diversity in practice and (2) cost and complexity when applying the guidance in Topic 718, Compensation-Stock Compensation, to a change to the terms or conditions of a share-based payment award. The amendments in this update provide guidance about which changes to the terms or conditions of a share-based payment award require an entity to apply modification accounting in Topic 718. This update is effective for annual periods beginning after December 15, 2017, and interim periods thereafter. The Company adopted this ASU for the period ended March 31, 2018, with no material impact on its results of operations, financial condition and cash flows.
Compensation-Retirement Benefits: Improving the Presentation of Net Periodic Pension Cost and Net Periodic Postretirement Benefit Cost
In March 2017, the FASB issued ASU 2017-7, "Compensation-Retirement Benefits: Improving the Presentation of Net Periodic Pension Cost and Net Periodic Postretirement Benefit Cost." This ASU requires that an employer report the service cost component in the same line item or items as other compensation costs arising from services rendered by the pertinent employees during the period. The other components of net benefit cost are required to be presented in the income statement separately from the service cost component and outside a subtotal of income from operations, if one is presented. If a separate line item or items are used to present the other components of net benefit cost, that line item or items must be appropriately described. If a separate line item or items are not used, the line item or items used in the income statement to present the other components of net benefit cost must be disclosed. The amendments in this update also allow only the service cost component to be eligible for capitalization when applicable. The Company adopted this guidance retrospectively for the period ended March 31, 2018 with a resulting reclassification with the service cost component of net periodic pension cost and net periodic postretirement benefit cost continuing to be reported within cost of services provided, before reimbursements and selling, general, and administrative expenses on the Consolidated Statements of Operations based on where the compensation costs of the pertinent employees are presented and the other components being reclassified within Other Income. This entry resulted in a reclassification of the non-service components of net periodic pension costs of $
2,590,000
and $
179,000
of income for years ended December 31, 2018 and 2017, and expense of $
6,563,000
for the year ended December 31, 2016 to "Other Income".
67
Intra-Entity Transfers of Assets Other Than Inventory
In October 2016, the FASB issued ASU 2016-16, "Intra-Entity Transfers of Assets Other Than Inventory." This ASU was issued to improve the accounting for income tax consequences of intra-entity transfers of assets other than inventory. The initiative is designed to reduce the complexity in accounting standards. Under the amendment an entity should recognize the income tax consequences of an intra-entity transfer of an asset other than inventory when the transfer occurs. Consequently, the amendments in this update eliminate the exception for an intra-entity transfer of an asset other than inventory. The Company adopted this ASU for the period ended March 31, 2018, with no impact to its results of operations, financial condition and cash flows.
Classification of Certain Cash Receipts and Cash Payments in the Statement of Cash Flows
In August 2016, the FASB issued ASU 2016-15, "Statement of Cash Flows Classification of Certain Cash Receipts and Cash Payments." This ASU addresses diversity in cash flow reporting issues. The guidance specifically addresses issues concerning debt repayment costs, settlement of zero coupon debt instruments, contingent consideration payments made after a business combination, proceeds from insurance claims and corporate owned life insurance beneficial interests in securitization transactions, and distributions from equity method investees. The guidance also clarifies how the predominant principle should be applied when cash receipts and cash payments have more than one class of cash flows. The Company adopted this guidance for the period ended March 31, 2018, with no impact to the statement of cash flows.
Earning Per Share-Distinguishing Liabilities from Equity-Derivatives and Hedging
In July 2017, the FASB issued ASU 2017-11, "Earnings Per Share (Topic 260); Distinguishing Liabilities from Equity (Topic 480); Derivatives and Hedging (Topic 815): (Part I) Accounting for Certain Financial Instruments with Down Round Features, (Part II) Replacement of the Indefinite Deferral for Mandatorily Redeemable Financial Instruments of Certain Nonpublic Entities and Certain Mandatorily Redeemable Noncontrolling Interests with a Scope Exception." The ASU Part I changes the classification analysis of certain equity-linked financial instruments with down round features and the related disclosures. Part II of the amendments recharacterizes the indefinite deferral of certain provisions of Topic 480 and do not have an accounting effect. The Company elected to early adopt this ASU for the period ended December 31, 2018, with no impact on its results of operations, financial condition and cash flows.
Derivatives and Hedging
In August 2017, the FASB issued ASU 2017-12, "Targeted Improvements to Accounting for Hedging Activities." This ASU was issued to improve the financial reporting of hedging relationships to better portray the economic results of an entity's risk management activities in its financial statements. Additionally, the amendments in this update simplify the application of the hedge accounting guidance. The Company elected to early adopt this ASU for the period ended March 31, 2018, with no impact on its results of operations, financial condition and cash flows. The Company is not currently a party to any derivative contracts. In October 2018, the FASB issued ASU 2018-16, "Derivatives and Hedging (Topic 815).” This update permits the Overnight Index Swap rate based on the Secured Overnight Financing rate as a U.S. benchmark interest rate. The update is effective for annual periods beginning after December 15, 2018 for public business entities that have already adopted the amendments in ASU 2017-12. Early adoption is permitted in any interim period upon issuance of this Update if an entity already has adopted ASU 2017-12. The Company elected to early adopt this ASU for the period ended December 31, 2018, with no impact on its results of operations, financial condition and cash flows.
Pending Adoption of Recently Issued Accounting Standards
Financial Accounting for Leases
In February 2016, the FASB issued ASU 2016-02, "Financial Accounting for Leases." Under this update, a lessee will be required to recognize assets and liabilities for leases with lease terms of more than 12 months. Consistent with current GAAP, the recognition, measurement, and presentation of expenses and cash flows arising from a lease by a lessee primarily will depend on its classification as a finance or operating lease. However, unlike current GAAP, which requires only capital leases to be recognized on the balance sheet, this ASU will require both types of leases to be recognized on the balance sheet. This ASU will also require disclosures to help investors and other financial statement users better understand the amount, timing, and uncertainty of cash flows arising from leases. These disclosures include qualitative and quantitative requirements, providing additional information about the amounts recorded in the financial statements. In July 2018, the FASB issued ASU 2018-11, "Targeted Improvements," which allows a transition option for entities to not apply the new lease standard in
68
comparative periods presented in the financial statements in the year of adoption. The update also provides a practical expedient to allow lessors the option to combine lease and non-lease components. In December 2018, the FASB issued ASU 2018-20, “Leases (Topic 842),” which provides narrow-scope improvements for lessors. These updates are effective for annual periods beginning after December 15, 2018, and interim periods thereafter. Early adoption is permitted. The Company plans to elect the package of practical expedients to not reassess prior conclusions related to contracts containing leases, lease classification, lease term and initial direct costs as well as the practical expedient to choose not to separate nonlease components from lease components and instead account for each as a single lease component for all classes of its assets. The Company also plans to elect ASU 2018-11 and as a result will not adjust the comparative period financial information or make the new required lease disclosures for periods before the effective date. The Company has updated its inventory of real estate, equipment, and automobile leases for attributes required by these standards. While the Company is still assessing certain aspects of the adoption of these standards, including the determination of discount rates and tax accounting, the Company anticipates the adoption of these standards will result in operating lease-related assets and liabilities between
$110 million
and
$130 million
recorded on the Consolidated Balance Sheets as of January 1, 2019 and no material impact to the results of operations and cash flows.
Measurement of Credit Losses on Financial Instruments
In June 2016, the FASB issued ASU 2016-13, "Measurement of Credit Losses on Financial Instruments." This update replaces the incurred loss methodology to record credit losses with a methodology that reflects the expected credit losses for financial assets not accounted for at fair value with gains and losses recognized through income. In November 2018, the FASB issued ASU 2018-19, “Codification Improvements to Topic 326, Financial Instruments-Credit Losses.” This update amends ASU 2016-13 to clarify that receivables arising from operating leases are not within the scope of Subtopic 326-20. Instead, impairment of receivables arising from operating leases should be accounted for in accordance with Topic 842. These amendments are effective for annual periods beginning after December 15, 2019, and interim periods within those fiscal years. Early adoption is permitted for fiscal years beginning after December 15, 2018, and interim periods within those fiscal years. The Company is currently evaluating the effect these amendments may have on its results of operations, financial condition and cash flows.
Reclassification of Certain Tax Effects from Accumulated Other Comprehensive Income
In February 2018, the FASB issued ASU 2018-02,
"
Income Statement-Reporting Comprehensive Income (Topic 220): Reclassification of Certain Tax Effects from Accumulated Other Comprehensive Income." This update allows companies to reclassify stranded tax effects resulting from the 2017 Tax Cuts and Jobs Act (the Tax Act), from accumulated other comprehensive income to retained earnings. This update is effective for annual periods beginning after December 15, 2018, and interim periods thereafter. Early adoption is permitted. The Company is currently evaluating the effect this ASU will have on its Consolidated Balance Sheets and related disclosures.
Changes to the Disclosure Requirements for Fair Value Measurement
In August 2018, the FASB issued ASU 2018-13, “Fair Value Measurement (Topic 820).” This update amends the disclosure requirements on fair value measurements in Topic 820, Fair Value Measurement, by removing and modifying certain disclosure requirements and adding others. This update removes the requirement to disclose the amount of and reasons for transfers between Level 1 and Level 2 of the fair value hierarchy, the policy for timing of transfers between levels and the valuation processes for Level 3 fair value measurements. This update requires the disclosure of the changes in unrealized gains and losses for the period included in other comprehensive income for recurring Level 3 fair value measurements held at the end of the reporting period and the range and weighted average of significant unobservable inputs used to develop Level 3 fair value measurements. Further, this update clarifies that transfers into and out of Level 3 of the fair value hierarchy and purchases and issues of Level 3 assets and liabilities are required to be disclosed. These updates are effective for annual periods beginning after December 15, 2019, and interim periods thereafter. Early adoption is permitted and early adoption of any removed or modified disclosures upon issuance of this update is permitted while delaying adoption of the additional disclosures until the effective date. The Company is currently evaluating the effect this ASU will have on its Fair Value Measurements disclosure.
69
Compensation-Retirement Benefits: Changes to the Disclosure Requirements for Defined Benefit Plans
In August 2018, the FASB issued ASU 2018-14, "Compensation-Retirement Benefits-Defined Benefit Plans-General (Subtopic 715-20)." This update modifies the disclosure requirements for employers that sponsor defined benefit pension or other postretirement plans. This update removes certain disclosure requirements including, but not limited to, the amounts in accumulated other comprehensive income expected to be recognized as components of net periodic benefit cost over the next fiscal year and the amount and timing of plan assets expected to be returned to the employer. This update requires the disclosure of the weighted-average interest crediting rates for cash balance plans and other plans with promised interest crediting rates and an explanation of the reasons for significant gains and losses related to changes in the benefit obligation for the period. This update also clarifies requirements for entities that provide aggregate disclosures for two or more plans. This update is effective for annual periods beginning after December 15, 2020, and interim periods thereafter. Early adoption is permitted. The Company is currently evaluating the effect this ASU will have on its Retirement Plans disclosure.
Customer's Accounting for Implementation Costs Incurred in a Cloud Computing Arrangement That is a Service Contract
In August 2018, the FASB issued ASU 2018-15, "Intangibles-Goodwill and Other-Internal-Use Software (Subtopic 350-40).” This update aligns the requirements for capitalizing implementation costs incurred in a hosting arrangement that is a service contract with the requirements for capitalizing implementation costs incurred to develop or obtain internal-use software, including hosting arrangements that include an internal-use software license. This update also requires the entity (customer) to expense the capitalized implementation costs of a hosting arrangement that is a service contract over the term of the hosting arrangement. Further, this update requires the presentation of the expense in the statement of income, the presentation of the costs on the statement of financial position and the classification of payments in the statement of cash flows related to capitalized implementation costs to be treated the same as the fees of the associated hosting arrangement. The update is effective for annual periods beginning after December 15, 2019, and interim periods thereafter. Early adoption is permitted. The Company is currently evaluating the effect this ASU will have on its results of operations, financial condition and cash flows.
|
2.
|
Revenue Recognition
|
Revenue Recognition
The Company adopted ASC 606 using the modified retrospective method for those contracts which were not substantially completed as of the transition date. The reported results for the year ended
December 31, 2018
, reflect the application of ASC 606 while the reported results for the year ended
December 31, 2017
, reflect the application of ASC 605.
There was no significant impact to the Company's Consolidated Statements of Operations or Consolidated Balance Sheets as a result of applying ASC 606 for the year ended
December 31, 2018
.
Revenue from Contracts with Customers
Revenues are recognized when control of the promised services are transferred to the Company's customers in an amount that reflects the consideration the Company expects to be entitled to in exchange for those services. Revenues are recognized net of any sales, use or value added taxes collected from customers, which are subsequently remitted to governmental authorities. As the Company completes its performance obligations which are identified below, it has an unconditional right to consideration as outlined in the Company's contracts. Generally the Company's accounts receivable are expected to be collected in less than
two
months, in accordance with the underlying payment terms.
The Company's Crawford Claims Solutions segment generates revenue for claims management services provided to insurance companies and self-insured entities related to property, casualty and catastrophe losses caused by physical damage to commercial and residential real property and certain types of personal property. The Company charges on a fee-per-claim basis for each optional purchase of the claims management services exercised by its customer. Revenue is recognized over time as the performance obligations are satisfied through the effort expended to research, investigate, evaluate, document and report the claim and control of these services are transferred to the customer. Revenue is recognized based on historical claim closure rates and claim type for fixed fee claims applied utilizing a portfolio approach based on time elapsed for these claims. For claims billed on a time and expense incurred basis, which are considered variable consideration, the Company recognizes revenue at the amount in which it has the right to invoice for services performed. These methods of revenue recognition are the most accurate depiction of the transfer of the claims management services to the customer. The Company also generates
70
revenue by providing on-demand inspection, verification and other task specific field services for businesses and consumers. Task assignment services are single optional purchase performance obligations which are generally satisfied at a point in time when the control of the service is transferred to the customer. Therefore, revenue is recognized when the customer receives the service requested.
The following table presents Crawford Claims Solutions revenues before reimbursements disaggregated by geography for the year ended
December 31, 2018
. The Company considers all Crawford Claims Solutions revenues to be derived from one service line.
|
Year Ended December 31, 2018
|
|||||||||||||||||||||
|
(in thousands)
|
U.S.
|
U.K.
|
Canada
|
Australia
|
Europe
|
Rest of World
|
Total
|
||||||||||||||
|
Total Crawford Claims Solutions Revenues before Reimbursements
|
$
|
150,777
|
|
$
|
64,940
|
|
$
|
50,278
|
|
$
|
44,666
|
|
$
|
30,971
|
|
$
|
19,475
|
|
$
|
361,107
|
|
The Company's Crawford TPA Solutions: Broadspire segment is a third party administrator that generates revenue through its Claims Management and Medical Management service lines.
The Claims Management service line includes Workers' Compensation, Liability, Property and Disability Claims Management. This service line also performs additional services such as Accident & Health claims programs, including affinity type claims, and disability and leave management services. Each claim referred by the customer is considered an additional optional purchase of claims management services under the agreement with the customer. The transaction price is readily available from the contract and is fixed for each service. Revenue is recognized over time as services are provided as the performance obligations are satisfied through the effort expended to research, investigate, evaluate, document, and report the claim and control of these services are transferred to the customer. Revenue is recognized based on historical claim closure rates and claim type applied utilizing a portfolio approach based on time elapsed for these claims as the Company believes this is the most accurate depiction of the transfer of the claims management services to its customer. This service line also provides Risk Management Information Services. For non-claim services, revenue is recognized over time as services are provided and control of these services are transferred to the customer. Revenue is recognized as time elapses as this is the most accurate depiction of the transfer of the service to the customer.
The Company's obligation to manage claims under the Claims Management service line can range from less than
one
year, on a
one
- or
two
-year basis or for the lifetime of the claim. Under certain claims management agreements, the Company receives consideration from a customer at contract inception prior to transferring services to the customer, however, it would begin performing services immediately. The period between a customer’s payment of consideration and the completion of the promised services could be greater than one year. There is no difference between the amount of promised consideration and the cash selling price of the promised services. The fee is billed upfront by the Company in order to provide customers with simplified and predictable ways of purchasing its services and it is customary to invoice service fees when the claim is assigned. The Company considered whether a significant financing component exists and determined that there is not a significant financing component at the contract level.
The Medical Management service line offers case managers who provide administration services by proactively managing medical treatment for claimants while facilitating an understanding of and participation in their rehabilitation process. Revenue for Medical Management services is recognized over time as the performance obligations are satisfied through the effort expended to manage the medical treatment for claimants and control of these services are transferred to the customer. Medical Management services are generally billed based on time incurred, are considered variable consideration, and revenue is recognized at the amount in which the Company has the right to invoice for services performed. This method of revenue recognition is the most accurate depiction of the transfer of the Medical Management service to the customer. Medical bill review services provide an analysis of medical charges for clients’ claims to identify opportunities for savings. Medical bill review services revenues are recognized over time as control of the service is transferred to the customer. Revenue is recognized based upon the transfer of the results of the medical bill review service to the customer as this is the most accurate depiction of the transfer of the service to the customer.
71
The following table presents TPA Solutions: Broadspire revenues before reimbursements disaggregated by service line and geography for the year ended
December 31, 2018
.
|
Year Ended December 31, 2018
|
||||||||||||||||||
|
(in thousands)
|
U.S.
|
U.K.
|
Canada
|
Europe
|
Rest of World
|
Total
|
||||||||||||
|
Claims Management Services
|
$
|
150,379
|
|
$
|
12,651
|
|
$
|
36,648
|
|
$
|
32,789
|
|
$
|
1,503
|
|
$
|
233,970
|
|
|
Medical Management Services
|
171,365
|
|
—
|
|
—
|
|
—
|
|
—
|
|
171,365
|
|
||||||
|
Total Crawford TPA Solutions: Broadspire Revenues before Reimbursements
|
$
|
321,744
|
|
$
|
12,651
|
|
$
|
36,648
|
|
$
|
32,789
|
|
$
|
1,503
|
|
$
|
405,335
|
|
The Company's
Crawford Specialty Solutions
segment principally generates revenues through its Global Technical Services, Contractor Connection and
Garden City Group
service lines. The
Garden City Group
business was disposed of as of
June 15, 2018
. See Note 3, "Acquisitions and Disposition of Business Line" for further discussion about this transaction.
The Global Technical Services service line generates revenues for claims management services provided to insurance companies and self-insured entities related to large, complex losses with technical adjusting and industry experts. Revenue is recognized over time as the performance obligations are satisfied through the effort expended to research, investigate, evaluate, document and report the claim and control of these services are transferred to the customer. Revenue is recognized based on historical claim closure rates and claim type for fixed fee claims, applied utilizing a portfolio approach based on time elapsed for these claims. For claims billed on a time and expense incurred basis, which are considered variable consideration, the Company recognizes revenue at the amount in which it has the right to invoice for services performed. These methods of revenue recognition are the most accurate depiction of the transfer of the claims management services to the customer.
The Contractor Connection service line generates revenue through its independently managed contractor network. Contractor Connection primarily generates revenue by receiving a fee for each project that is sold by its network of contractors. Revenue is recognized at a point in time once the consumer accepts the contractor's proposal as Contractor Connection’s performance obligation of referring projects to its contractors has been completed and the Company is entitled to consideration at that time. The contractor takes control of the service upon the consumer’s acceptance of the contractor’s proposal.
Prior to its disposition, the
Garden City Group
service line generated revenues by performing legal settlement administration services on behalf of law firms, corporations, government agencies, and courts. The
Garden City Group
's services included identifying and qualifying class members, handling written, electronic, and telephonic communications with claimants, and determining and dispensing settlement payments.
Garden City Group
further provided back-office business process outsourcing services encompassing fulfillment, mail intake, call center and multimedia outreach solutions, payment distribution, and product recall needs. Revenues for professional services, such as project management and oversight, legal counsel, administrative and information technology systems support, were recognized over time as the performance obligations were satisfied through the effort expended to administer projects and control of these services were transferred to the customer. Professional services were generally billed on a time and expense incurred basis, were considered variable consideration, and revenue was recognized at the amount in which the Company has the right to invoice for services performed. Transaction support services, such as mail intake and payment distribution, were considered stand ready performance obligations and were accounted for as a series of distinct services and recognized over time as control of these services were transferred to the customer. The nature of the performance obligations for these services was a promise that consists of standing ready to provide services, or making services available for a customer to use, as and when the customer decided to do so. Revenues for transaction support services were recognized over time as the performance obligations were satisfied through the effort expended to perform the support services and control of these services were transferred to the customer. Transaction support services were generally billed based on per unit rates, were considered variable consideration, and revenue was recognized at the amount in which we had the right to invoice for services performed. These methods of revenue recognition for professional and transaction support services were the most accurate depiction of the transfer of the legal settlement administration services to the customer.
72
The following table presents
Crawford Specialty Solutions
revenues before reimbursements disaggregated by service line and geography for the year ended
December 31, 2018
.
|
Year Ended December 31, 2018
|
|||||||||||||||||||||
|
(in thousands)
|
U.S.
|
U.K.
|
Canada
|
Australia
|
Europe
|
Rest of World
|
Total
|
||||||||||||||
|
Global Technical Services
|
$
|
40,453
|
|
$
|
45,927
|
|
$
|
25,065
|
|
$
|
23,491
|
|
$
|
21,717
|
|
$
|
26,770
|
|
$
|
183,423
|
|
|
Contractor Connection
|
73,886
|
|
8,133
|
|
8,037
|
|
1,170
|
|
5
|
|
—
|
|
91,231
|
|
|||||||
|
Garden City Group
|
28,827
|
|
—
|
|
1,048
|
|
—
|
|
—
|
|
—
|
|
29,875
|
|
|||||||
|
Total Crawford Specialty Solutions Revenues before Reimbursements
|
$
|
143,166
|
|
$
|
54,060
|
|
$
|
34,150
|
|
$
|
24,661
|
|
$
|
21,722
|
|
$
|
26,770
|
|
$
|
304,529
|
|
In the normal course of business, the Company's operating segments incur certain out-of-pocket expenses that are thereafter reimbursed by its customers. The Company controls the promised good or service before it is transferred to its customer, therefore it is a principal in the transaction. These out-of-pocket expenses and associated reimbursements are reported on a gross basis within expenses and revenues, respectively, in the Company's Consolidated Statements of Operations.
Arrangements with Multiple Performance Obligations
For claims management services, the Company typically has one performance obligation; however, it also provides the customer with an option to acquire additional services. The Company sells multiple lines of claims processing and different levels of processing depending on the complexity of the claims. The Company typically provides a menu of offerings from which the customer chooses to purchase at their option. The price of each service is separate and distinct and provides a separate and distinct value to the customer. Pricing is consistent for each service irrespective of the other services or quantities requested by the customer. For example, if the Company provides claims processing for both auto and general liability, those services are priced and delivered independently.
Contract Balances
The timing of revenue recognition, billings and cash collections result in billed accounts receivables, contract assets (reported as unbilled revenues at estimated billable amounts) and contract liabilities (reported as deferred revenues) on the Company’s Consolidated Balance Sheets. Unbilled revenues is a contract asset for revenue that has been recognized in advance of billing the customer, resulting from professional services delivered that we expect and are entitled to receive as consideration under certain contracts. Billing requirements vary by contract but substantially all unbilled revenues are billed within
one
year.
When the Company receives consideration from a customer prior to transferring services to the customer under the terms of certain claims management agreements, it records deferred revenues on the Company’s Consolidated Balance Sheets, which represents a contract liability. These fixed-fee service agreements typically result from the Crawford TPA Solutions: Broadspire segment and require the Company to handle claims on either a
one
- or
two
-year basis, or for the lifetime of the claim. In cases where it handles a claim on a non-lifetime basis, the Company typically receives an additional fee on each anniversary date that the claim remains open. For service agreements where it provides services for the life of the claim, the Company is paid one upfront fee regardless of the duration of the claim. The Company recognizes deferred revenues as revenues as it performs services and transfers control of the services to the customer and satisfies the performance obligation which it determines utilizing a portfolio approach.
73
The Company's deferred revenues for claims handled for one or two years are not as sensitive to changes in claim closing rates since the performance obligations are satisfied within a fixed length of time. Deferred revenues for lifetime claim handling are more sensitive to changes in claim closing rates since the Company is obligated to handle these claims to conclusion with no additional fees received for long-lived claims. For all fixed fee service agreements, revenues are recognized over the expected service periods, by type of claim. Based upon its historical averages, the Company closes approximately
99%
of all cases referred to it under lifetime claim service agreements within
five
years from the date of referral. Also, within that five-year period, the percentage of cases remaining open in any one particular year has remained relatively consistent from period to period. Each quarter the Company evaluates its historical case closing rates by type of claim utilizing a portfolio approach and makes adjustments to deferred revenues as necessary. As a portfolio approach is utilized to recognize deferred revenues, any changes in estimates will impact timing of revenue recognition and any changes in estimates are recognized in the period in which they are determined.
The table below presents the deferred revenues balance as of the transition date and the significant activity affecting deferred revenues during the year ended
December 31, 2018
:
|
(In Thousands)
|
|||
|
Customer Contract Liabilities:
|
Deferred Revenue
|
||
|
Balance at January 1, 2018 (transition date)
|
$
|
60,609
|
|
|
Annual additions
|
77,778
|
|
|
|
Revenue recognized from prior periods
|
(29,888
|
)
|
|
|
Revenue recognized from current year additions
|
(53,075
|
)
|
|
|
Disposal of business line
|
(2,751
|
)
|
|
|
Balance as of December 31, 2018 (current and noncurrent)
|
$
|
52,673
|
|
Remaining Performance Obligations
As of
December 31, 2018
, the Company had
$93.4 million
of remaining performance obligations related to claims and non-claims services in which the price is fixed. Remaining performance obligations consist of deferred revenues as well as certain unbilled receivables that are considered contract assets. The Company expects to recognize approximately
70%
of our remaining performance obligations as revenues within
one
year and the remaining balance thereafter. See the discussion below regarding the practical expedients elected for the disclosure of remaining performance obligations.
Costs to Obtain a Contract
The Company has a sales incentive compensation program where remuneration is based on the revenues recognized in the period and does not represent an incremental cost to the Company which provides a future benefit expected to be longer than one year and would meet the criteria to be capitalized and presented as a contract asset on the Company's Consolidated Balance Sheets.
Practical Expedients Elected
As a practical expedient, the Company does not adjust the consideration in a contract for the effects of a significant financing component it expects, at contract inception, when the period between a customer’s payment of consideration and the transfer of promised services to the customer will be
one
year or less.
For claims management and legal settlement administration services (prior to the disposition of the Garden City Group Business) that are billed on a time and expense incurred or per unit basis and revenue is recognized over time, the Company recognizes revenue at the amount to which it has the right to invoice for services performed.
The Company does not disclose the value of remaining performance obligations for (i) contracts for which it recognizes revenue at the amount to which it has the right to invoice for services performed, and (ii) contracts with variable consideration allocated entirely to a single performance obligation.
74
|
3.
|
Acquisitions and Disposition of Business Line
|
Acquisitions
During the year ended December 31, 2018, the Company acquired
two
separate Global Technical Services businesses for total consideration of approximately
$3,400,000
which is comprised of
$2,500,000
paid at closing, net of cash acquired of
$134,000
,
$348,000
to be paid in one year and contingent earnout consideration of
$377,000
. The acquisitions were accounted for under the guidance of ASC 805-10, as business combinations under the acquisition method. As a result of the acquisitions, the Company recognized net tangible assets of
$462,000
, net of both the deferred payment and contingent earnout, definite lived intangible assets of
$1,094,000
, goodwill of
$1,296,000
and deferred taxes of
$202,000
. The results of the acquisitions are reported within the Company's
Crawford Specialty Solutions
operating segment.
Disposition of Business Line
On
June 15, 2018
, the Company completed the sale of its
Garden City Group
business (the “GCG Business”) to EPIQ Class Action & Claims Solutions, Inc. ("EPIQ") for cash proceeds of
$42,022,000
, subject to post-closing working capital adjustments. Adjusted proceeds totaled
$42,636,000
including the working capital adjustment of
$614,000
which was received in
December
of
2018
. At the time of the disposal, the GCG Business included total assets of
$70,630,000
and total liabilities of
$10,147,000
. The total asset balance was primarily comprised of accounts receivable, unbilled revenues and capitalized software costs. After including transaction and other costs related to the sale, the Company recognized a pretax loss on the disposal of
$20,270,000
, of which
$1,274,000
was recognized during the three months ended
December 31, 2018
. The loss on disposal is presented in the Consolidated Statements of Operations as a separate charge "Loss on disposition of business line". The disposal of this business does not represent a strategic shift in the Company's operations.
The table below presents a computation of the loss on the disposition:
|
(in thousands)
|
|||
|
Negotiated sales price
|
$
|
42,022
|
|
|
Working capital adjustment
|
614
|
|
|
|
Adjusted consideration received
|
42,636
|
|
|
|
Recognized amounts of identifiable assets and liabilities disposed of:
|
(60,483
|
)
|
|
|
Transaction costs of the sale
|
(991
|
)
|
|
|
Other costs arising from the sale
|
(1,432
|
)
|
|
|
Pretax loss on disposition of business line
|
$
|
(20,270
|
)
|
Beginning on January 1, 2018 through the time of the sale, the GCG Business was a component of the Crawford Specialty Services segment. Included in the Consolidated Statements of Operations for the twelve months ended
December 31, 2018
and
2017
are pretax losses, inclusive of retained corporate overhead, of
$3,932,000
and
$4,582,000
, respectively, related to the GCG Business.
75
|
4.
|
Goodwill and Intangible Assets
|
Goodwill
The following table shows the changes in the carrying amount of goodwill for the years ended
December 31, 2018
and
2017
:
|
Crawford Claims Solutions
|
Crawford TPA Solutions: Broadspire
|
Crawford Specialty Solutions
|
Total
|
||||||||||||
|
|
(In thousands)
|
||||||||||||||
|
Balance at December 31, 2016:
|
|||||||||||||||
|
Goodwill
|
$
|
36,256
|
|
$
|
167,971
|
|
$
|
88,537
|
|
$
|
292,764
|
|
|||
|
Accumulated impairment losses
|
(20,407
|
)
|
|
(159,424
|
)
|
|
(21,183
|
)
|
|
(201,014
|
)
|
||||
|
Net goodwill
|
15,849
|
|
8,547
|
|
67,354
|
|
91,750
|
|
|||||||
|
2017 Activity:
|
|||||||||||||||
|
Goodwill of acquired business
|
19,466
|
|
850
|
|
3,662
|
|
23,978
|
|
|||||||
|
Impairment of goodwill
|
—
|
|
—
|
|
(19,598
|
)
|
(19,598
|
)
|
|||||||
|
Other activity
(1)
|
(209
|
)
|
(113
|
)
|
(282
|
)
|
(604
|
)
|
|||||||
|
Foreign currency effects
|
481
|
|
260
|
|
649
|
|
1,390
|
|
|||||||
|
Balance at December 31, 2017:
|
|||||||||||||||
|
Goodwill
|
55,994
|
|
168,968
|
|
92,566
|
|
317,528
|
|
|||||||
|
Accumulated impairment losses
|
(20,407
|
)
|
(159,424
|
)
|
(40,781
|
)
|
(220,612
|
)
|
|||||||
|
Net goodwill
|
35,587
|
|
9,544
|
|
51,785
|
|
96,916
|
|
|||||||
|
2018 Activity:
|
|||||||||||||||
|
Goodwill of acquired businesses
|
—
|
|
—
|
|
1,296
|
|
1,296
|
|
|||||||
|
Goodwill of disposed business
|
—
|
|
—
|
|
(19,598
|
)
|
(19,598
|
)
|
|||||||
|
Accumulated Impairment Losses of Disposed Business
|
—
|
|
—
|
|
19,598
|
|
19,598
|
|
|||||||
|
Foreign currency effects
|
(441
|
)
|
(238
|
)
|
(643
|
)
|
(1,322
|
)
|
|||||||
|
Balance at December 31, 2018:
|
|||||||||||||||
|
Goodwill
|
55,553
|
|
168,730
|
|
73,621
|
|
297,904
|
|
|||||||
|
Accumulated impairment losses
|
(20,407
|
)
|
(159,424
|
)
|
(21,183
|
)
|
(201,014
|
)
|
|||||||
|
Net goodwill
|
$
|
35,146
|
|
$
|
9,306
|
|
$
|
52,438
|
|
$
|
96,890
|
|
|||
(1)
"Other activity" relates to adjustments for deferred taxes and other liabilities acquired in connection with prior period business combinations.
The Company recognized a goodwill impairment in the
Garden City Group
reporting unit of
$19,598,000
during the year ended December 31, 2017. The
$19,598,000
noncash goodwill impairment charge was not reflected in
Crawford Specialty Solutions
segment
Garden City Group
service line operating earnings. This impairment charge did not affect the Company's liquidity and had no effect on the Company's compliance with the financial covenants under its Credit Facility.
76
Intangible Assets
The following is a summary of finite-lived intangible assets acquired through business acquisitions as of
December 31, 2018
and
2017
:
|
Gross Carrying Amount
|
Accumulated Amortization
|
Net Carrying Value
|
Weighted-Average Amortization Period
|
||||||||||
|
|
(In thousands, except years)
|
||||||||||||
|
December 31, 2018:
|
|||||||||||||
|
Customer relationships
|
$
|
126,061
|
|
$
|
(83,275
|
)
|
$
|
42,786
|
|
4.8 years
|
|||
|
Technology-based
|
16,562
|
|
(8,104
|
)
|
8,458
|
|
7.9 years
|
||||||
|
Trade name
|
1,580
|
|
(1,580
|
)
|
—
|
|
0.0 years
|
||||||
|
Other
|
5,475
|
|
(2,517
|
)
|
2,958
|
|
2.2 years
|
||||||
|
Total
|
$
|
149,678
|
|
$
|
(95,476
|
)
|
$
|
54,202
|
|
7.6 years
|
|||
|
December 31, 2017:
|
|
|
|
|
|
|
|||||||
|
Customer relationships
|
$
|
127,076
|
|
$
|
(75,419
|
)
|
$
|
51,657
|
|
6.0 years
|
|||
|
Technology-based
|
16,562
|
|
(7,039
|
)
|
9,523
|
|
8.3 years
|
||||||
|
Trade name
|
1,825
|
|
(1,825
|
)
|
—
|
|
0.0 years
|
||||||
|
Other
|
5,265
|
|
(1,240
|
)
|
4,025
|
|
3.2 years
|
||||||
|
Total
|
$
|
150,728
|
|
$
|
(85,523
|
)
|
$
|
65,205
|
|
8.8 years
|
|||
Amortization of finite-lived intangible assets was
$11,152,000
,
$10,982,000
, and
$9,969,000
for the years ended
December 31, 2018
,
2017
, and
2016
, respectively. For the years ended
December 31, 2018
,
2017
, and
2016
, amortization expense for finite-lived customer relationships and trade name intangible assets in the amounts of $
11,152,000
,
$10,982,000
, and
$9,592,000
, respectively, were excluded from segment operating earnings (see Note 14, "Segment and Geographic Information"). The amortization expense for the technology-based intangible assets is included in segment operating earnings. Intangible assets subject to amortization are amortized on a straight-line basis over lives ranging from
2
to
15
years.
At
December 31, 2018
, annual estimated aggregate amortization expense for intangible assets subject to amortization for the next five years is as follows:
|
Annual Amortization Expense
|
|||
|
Year Ending December 31,
|
(In thousands)
|
||
|
2019
|
$
|
11,190
|
|
|
2020
|
10,631
|
|
|
|
2021
|
9,556
|
|
|
|
2022
|
3,884
|
|
|
|
2023
|
3,790
|
|
|
The following is a summary of indefinite-lived intangible assets at
December 31, 2018
and
2017
:
|
Gross Carrying Amount
|
Accumulated Impairments
|
Net Carrying Value
|
|||||||||
|
(In thousands)
|
|||||||||||
|
December 31, 2018:
|
|||||||||||
|
Trade names
|
$
|
32,477
|
|
$
|
(1,656
|
)
|
$
|
30,821
|
|
||
|
December 31, 2017:
|
|||||||||||
|
Trade names
|
$
|
32,542
|
|
$
|
(600
|
)
|
$
|
31,942
|
|
||
77
During the year ended
December 31, 2018
, the Company recognized an impairment of
$1,056,000
related to an indefinite-lived trade name due to a combination of achieving less than forecasted revenue compared to previous modeled results and further reduced forecasted revenue associated with the trade name. The noncash trade name impairment charge did not impact the Company’s segment operating earnings.
5. Short-Term and Long-Term Debt, Including Capital Leases
Long-term debt consisted of the following at
December 31, 2018
and
2017
:
|
December 31,
|
2018
|
2017
|
|||||
|
|
(In thousands)
|
||||||
|
Credit Facility
|
$
|
190,316
|
|
$
|
224,283
|
|
|
|
Capital lease obligations
|
94
|
|
1,389
|
|
|||
|
Total long-term debt and capital leases
|
190,410
|
|
225,672
|
|
|||
|
Less: portion of Credit Facility classified as short-term
|
(23,195
|
)
|
(24,641
|
)
|
|||
|
Less: current installments of capital leases
|
(89
|
)
|
(571
|
)
|
|||
|
Total long-term debt and capital leases, less current installments
|
$
|
167,126
|
|
$
|
200,460
|
|
|
On October 11, 2017, the Company, its subsidiaries Crawford & Company Risk Services Investments Limited (the "UK Borrower"), Crawford & Company (Canada) Inc. (the "Canadian Borrower") and Crawford & Company (Australia) Pty. Ltd. (the "Australian Borrower") (the Company, together with such subsidiaries, as borrowers (the "Borrowers")), Wells Fargo Bank, National Association, as administrative agent and a lender ("Wells Fargo"), Bank of America, N.A., as syndication agent and a lender, Citizens Bank, N.A., as documentation agent and a lender, and the other lenders party thereto, entered into an Amended and Restated Credit Agreement (the "Amended and Restated Credit Agreement"), which amended and restated that certain Credit Agreement, dated as of December 8, 2011, by and among, inter alia, the Borrowers, Wells Fargo and the other lenders from time to time party thereto (as previously amended, the "Original Credit Agreement"). In connection with the Amended and Restated Credit Agreement, the Company, the Company’s guarantor subsidiaries party thereto and Wells Fargo entered into an Amended and Restated Pledge and Security Agreement (the "Amended and Restated Pledge and Security Agreement") and an Amended and Restated Guaranty Agreement (the "Amended and Restated Guaranty Agreement"), each dated as of the date of the Amended and Restated Credit Agreement.
On
June 15, 2018
, the Company, the Company’s guarantor subsidiaries party thereto, Wells Fargo and the other lenders party thereto entered into a Limited Consent and First Amendment to the Amended and Restated Credit Agreement (“the Amendment”) that consented to the Company’s disposition of the GCG Business. No other terms discussed below were changed due to the Amendment.
The credit facility under the Amended and Restated Credit Agreement (as amended, the "Credit Facility") consists of a
$450.0 million
revolving credit facility, with a letter of credit subcommitment of
$100.0 million
. The Credit Facility contains sublimits of
$185.0 million
for borrowings by the UK Borrower,
$75.0 million
for borrowings by the Canadian Borrower, and
$32.5 million
for borrowings by the Australian Borrower. The Credit Facility matures, and all amounts outstanding thereunder, will be due and payable on November 23, 2022.
Borrowings under the Credit Facility may be made in U.S. dollars, Euros, the currencies of Canada, Japan, Australia or United Kingdom and, subject to the terms of the Credit Facility, other currencies. Borrowings under the Credit Facility bear interest, at the option of the applicable Borrower, based on the Base Rate (as defined below) or the London Interbank Offered Rate ("LIBOR"), in each case plus an applicable interest margin based on the Company's leverage ratio (as defined below), provided that borrowings in foreign currencies may bear interest based on LIBOR only. The interest margin for LIBOR loans ranges from
1.30%
to
2.10%
and for Base Rate loans ranges from
0.30%
to
1.10%
. Base Rate is defined as the highest of (i) the Federal Funds Rate, as published by the Federal Reserve Bank of New York, plus
1/2 of 1%
, (ii) the prime commercial lending rate of Wells Fargo and (iii) LIBOR for a
one month
interest period plus
1.0%
.
At
December 31, 2018
, a total of
$190,316,000
was outstanding and there was an undrawn amount of
$11,729,000
under the letters of credit subcommitment of the Credit Facility. These letter of credit commitments were for the Company's own obligations. Including the amounts committed under the letters of credit subcommitment, the available borrowing capacity under the Credit Facility totaled
$248,029,000
at
December 31, 2018
.
78
The obligations of the Borrowers under the Amended and Restated Credit Agreement are guaranteed by each existing material domestic subsidiary of the Company, certain other domestic subsidiaries of the Company and certain existing material foreign subsidiaries of the Company that are disregarded entities for U.S. income tax purposes (each such foreign subsidiary, a "Disregarded Foreign Subsidiary"), and such obligations are required to be guaranteed by each subsequently acquired or formed material domestic subsidiary and Disregarded Foreign Subsidiary (each, a "Guarantor"), and the obligations of the Borrowers other than the Company ("Foreign Borrowers") for which the Company is not the primary obligor are also guaranteed by the Company. In addition, (i) the Borrowers’ obligations under the Amended and Restated Credit Agreement are secured by a first priority lien (subject to liens permitted by the Amended and Restated Credit Agreement) on substantially all of the personal property of the Company and the Guarantors as set forth in the Amended and Restated Pledge and Security Agreement and (ii) the obligations of the Foreign Borrowers are secured by a first priority lien on
100%
of the capital stock of the Foreign Borrowers.
The representations, covenants and events of default in the Credit Facility are customary for financing transactions of this nature, including required compliance with a minimum fixed charge coverage ratio and a maximum leverage ratio (each as defined below).
Under the Credit Facility as amended, the fixed charge coverage ratio, defined as the ratio of (i)(A) consolidated earnings before interest expense, income taxes, depreciation, amortization, stock-based compensation expense, and certain other charges and expenses ("EBITDA")
minus
(B) aggregate income taxes to the extent paid in cash
minus
(C) unfinanced capital expenditures to (ii) the sum of: (A) consolidated interest expense to the extent paid (or required to be paid) in cash,
plus
(B) the aggregate of all scheduled payments of principal on funded debt (including the principal component of payments made in respect of capital lease obligations) required to have been made (whether or not such payments are actually made),
plus
(C) the aggregate of all restricted payments (as defined) paid,
plus
(D) the aggregate of all earnouts paid or required to be paid, must not be less than
1.10
to
1.00
for the
four
-quarter period ending at the end of each fiscal quarter.
Also under the Credit Facility as amended, the senior secured leverage ratio, defined as the ratio of (i) consolidated total funded debt (excluding unsecured or subordinated debt) minus unrestricted cash to (ii) consolidated EBITDA, must not be greater
3.25
to 1.00 at the end of each fiscal quarter. In addition, the maximum permitted total leverage ratio allowable, which includes any unsecured or subordinated debt, must not be greater than
4.25
to
1.00
.
At
December 31, 2018
, the Company was in compliance with the financial covenants under the Credit Facility. If the Company does not meet the covenant requirements in the future, it would be in default under the Credit Facility. Upon the occurrence of an event of default, the lenders may terminate the loan commitments, accelerate all loans and exercise any of their rights under the Credit Facility and ancillary loan documents.
Short-term borrowings under the Credit Facility totaled
$23,195,000
and
$24,641,000
at
December 31, 2018
and
2017
, respectively. The Company expects, but is not required, to repay all of such short-term borrowings at
December 31, 2018
in 2019.
The Company's capital leases are primarily comprised of equipment leases with terms ranging from
24
to
60
months.
Interest expense, including amortization of capitalized loan costs, on the Company's short-term and long-term borrowings was
$11,399,000
,
$9,909,000
, and
$9,934,000
for the years ended
December 31, 2018
,
2017
, and
2016
, respectively. Interest paid on the Company's short-term and long-term borrowings was
$10,381,000
,
$8,394,000
, and
$8,451,000
for the years ended
December 31, 2018
,
2017
, and
2016
, respectively.
Principal repayments of long-term debt, including current portions and capital leases, as of
December 31, 2018
are expected to be as follows, assuming no prepayments or extensions beyond the stated maturity:
|
Long-term Debt
|
Capital Lease Obligations
|
Total
|
|||||||||
|
Year Ending December 31,
|
(In thousands)
|
||||||||||
|
2019
|
$
|
23,195
|
|
$
|
89
|
|
$
|
23,284
|
|
||
|
2020
|
—
|
|
3
|
|
3
|
|
|||||
|
2021
|
—
|
|
2
|
|
2
|
|
|||||
|
2022
|
167,121
|
|
—
|
|
167,121
|
|
|||||
|
Total
|
$
|
190,316
|
|
$
|
94
|
|
$
|
190,410
|
|
||
79
6. Commitments Under Operating Leases
The Company and its subsidiaries lease certain office space, computer equipment, and automobiles under operating leases. For office leases that contain scheduled rent increases or rent concessions, the Company recognizes monthly rent expense based on a calculated average monthly rent amount that considers the rent increases and rent concessions over the life of the lease term. Leasehold improvements of a capital nature that are made to leased office space under operating leases are amortized over the shorter of the term of the lease or the estimated useful life of the improvement. License and maintenance costs related to leased vehicles are paid by the Company and are expensed as incurred.
Rental expenses, net of amortization of any incentives provided by lessors, for operating leases consisted of the following:
|
Year Ended December 31,
|
2018
|
2017
|
2016
|
||||||||
|
|
(In thousands)
|
||||||||||
|
Office space
|
$
|
36,904
|
|
$
|
40,927
|
|
$
|
43,245
|
|
||
|
Automobiles
|
6,094
|
|
5,794
|
|
6,043
|
|
|||||
|
Computers and equipment
|
275
|
|
288
|
|
111
|
|
|||||
|
Total operating leases
|
$
|
43,273
|
|
$
|
47,009
|
|
$
|
49,399
|
|
||
At
December 31, 2018
, future minimum payments under non-cancelable operating leases with terms of more than
12 months
were as follows:
|
Year Ending December 31,
|
(In thousands)
|
||
|
2019
|
$
|
31,286
|
|
|
2020
|
27,973
|
|
|
|
2021
|
23,193
|
|
|
|
2022
|
14,282
|
|
|
|
2023
|
9,860
|
|
|
|
2024 and Thereafter
|
30,735
|
|
|
Where applicable, the amounts above include sales taxes.
Significant Operating Leases and Subleases
Effective
October 8, 2018
, the Company entered into an amendment and extension of an existing lease, resulting in a 8 years, 9 months operating lease for approximately
64,000
square feet of office space in Sunrise Florida, primarily for its
Crawford TPA Solutions: Broadspire
segment as a replacement for the subleased space in Plantation, Florida described below. Total lease payments over the remaining lease term are approximately
$11,900,000
. Additionally, the Company is responsible for certain related real estate taxes and other expenses, which are excluded from the table above.
Effective
October 10, 2016
, the Company entered into a
13
-year operating lease for approximately
109,000
square feet of office space in Atlanta, Georgia, as a replacement and consolidation for its Atlanta Support Center beginning late 2017. The Company has future total lease payments associated with this lease of approximately
$31,273,000
. Additionally, the Company is responsible for certain related property operating expenses above 2018 base year costs, which are excluded from the table above.
Effective
June 24, 2015
, the Company entered into
10
-year operating leases for approximately
16,000
square feet of office space in
London, England
, as a replacement and consolidation of certain of its United Kingdom operations and regional management facilities. The Company has total lease payments associated with the leases of approximately
$9,851,000
subject to market rate adjustments on the fifth anniversary of the lease commitment date. Additionally, the Company is responsible for certain value-added taxes and operating expenses, which are excluded from the table above.
80
In
November 2014
, the Company entered into an amendment and extension of an existing lease, resulting in a
7 years, 5 months
operating lease agreement for approximately
50,000
square feet of office space in
Jacksonville, FL
, for its U.S. Contractor Connection service line in its
Crawford Claims Solutions
segment. The amended lease on the expanded premises began January 1, 2015. Total lease payments over the remaining lease term are approximately
$2,640,000
. Additionally, the Company is responsible for certain related real estate taxes and operating expenses, which are excluded from the table above.
In
January 2013
, the Company entered into a
10
-year operating lease for approximately
24,000
square feet of office space in
Berkeley Heights, NJ
, primarily for its
Crawford TPA Solutions: Broadspire
segment. The lease began July 1, 2013. Total lease payments over the remaining lease term are approximately
$3,320,000
. Additionally, the Company is responsible for certain related real estate taxes and operating expenses, which are excluded from the table above.
Included in the acquired commitments of Broadspire Management Services, Inc. was a long-term operating lease for a
two
-building office complex in Plantation, Florida. The term of this lease ends in December 2021. Total lease payments over the remaining lease term are approximately
$13,581,000
. All of the office space was subleased at
December 31, 2018
.
Under executed sublease arrangements at
December 31, 2018
, the sublessors are obligated to pay the Company minimum sublease payments as follows:
|
Year Ending December 31,
|
(In thousands)
|
||
|
2019
|
$
|
4,578
|
|
|
2020
|
4,507
|
|
|
|
2021
|
4,516
|
|
|
|
Total minimum sublease payments to be received
|
$
|
13,601
|
|
One
of the sublease agreements is for
three
of the
four
floors of
one
of the leased buildings in Plantation, Florida; this lease expires in December 2021. The remaining floor was subleased through the remaining lease term during 2016. The other sublease is for an entire building and expires in December 2021.
7. Derivative Instruments
In February 2011, the Company entered into a U.S. dollar and Canadian dollar ("CAD") cross currency basis swap with an initial notional amount of CAD
34,749,000
as an economic hedge to an intercompany note payable to the U.S. parent by a Canadian subsidiary. The cross currency basis swap required the Canadian subsidiary to deliver quarterly payments of CAD
589,000
to the counterparty and entitled the U.S. parent to receive quarterly payments of U.S.$
593,000
. The Canadian subsidiary also made interest payments to the counterparty based on 3-month Canada Bankers Acceptances plus a spread, and the U.S. parent received payments based on U.S. 3-month LIBOR. The cross currency basis swap had a scheduled expiration date of September 30, 2025. The Company elected not to designate this swap as a hedge of the intercompany note from the Canadian subsidiary. Accordingly, changes in the fair value of this swap, as well as changes in the value of the intercompany note, were recorded as gains or losses in "Selling, general, and administrative expenses" in the Company's audited Consolidated Statements of Operations over the term of the swap and substantially offset one another prior to the settlement defined below. The changes in the fair value of the cross currency basis swap did not exactly offset changes in the value of the intercompany note, as the fair value of this swap was determined based on forward rates while the value of the intercompany note was determined based on end of period spot rates. The net gains and losses for the swap historically were not significant.
During September 2016, the Company entered into a transaction ("settlement") in which the Canadian subsidiary repaid the intercompany note payable to the U.S. parent and the Company terminated the cross currency basis swap. In connection with the settlement, the Company received proceeds of $
4,100,000
in exchange for terminating the cross currency basis swap. For the year ended December 31, 2016, the Company recognized a net loss of $
585,000
due to changes in the fair value of the cross currency basis swap, the value of the intercompany note, and on the settlement. A net loss was recognized on the settlement due to a change in the forward rates used to value the cross currency basis swap which was not substantially offset by the change in the value of the intercompany note based on the spot rate on the day of the settlement.
81
8. Income Taxes
Income before income taxes consisted of the following:
|
Year Ended December 31,
|
2018
|
2017
|
2016
|
||||||||
|
|
(In thousands)
|
||||||||||
|
U.S.
|
$
|
4,634
|
|
$
|
12,303
|
|
$
|
33,051
|
|
||
|
Foreign
|
39,497
|
|
29,959
|
|
30,190
|
|
|||||
|
Income before income taxes
|
$
|
44,131
|
|
$
|
42,262
|
|
$
|
63,241
|
|
||
The provision for income taxes consisted of the following:
|
Year Ended December 31,
|
2018
|
2017
|
2016
|
||||||||
|
|
(In thousands)
|
||||||||||
|
Current:
|
|||||||||||
|
U.S. federal and state
|
$
|
1,065
|
|
$
|
9,077
|
|
$
|
5,196
|
|
||
|
Foreign
|
9,530
|
|
8,320
|
|
9,838
|
|
|||||
|
Deferred:
|
|||||||||||
|
U.S. federal and state
|
4,051
|
|
389
|
|
9,788
|
|
|||||
|
Foreign
|
3,896
|
|
(2,747
|
)
|
743
|
|
|||||
|
Provision for income taxes
|
$
|
18,542
|
|
$
|
15,039
|
|
$
|
25,565
|
|
||
Net cash payments for income taxes were
$8,168,000
,
$15,574,000
, and
$16,170,000
in
2018
,
2017
, and
2016
, respectively.
The provision for income taxes is reconciled to the federal statutory income tax rate of
21%
in 2018, and
35%
in 2017 and 2016, as follows:
|
Year Ended December 31,
|
2018
|
2017
|
2016
|
||||||||
|
|
(In thousands)
|
||||||||||
|
Federal income taxes at statutory rate
|
$
|
9,267
|
|
$
|
14,792
|
|
$
|
22,134
|
|
||
|
State income taxes, net of federal benefit
|
2,685
|
|
1,349
|
|
2,280
|
|
|||||
|
Goodwill impairment
|
—
|
|
428
|
|
—
|
|
|||||
|
Foreign taxes
|
2,150
|
|
(3,226
|
)
|
2,273
|
|
|||||
|
Change in valuation allowance
|
9,540
|
|
2,913
|
|
(2,196
|
)
|
|||||
|
Research and development credits
|
(273
|
)
|
(448
|
)
|
(429
|
)
|
|||||
|
Foreign tax credits
|
(429
|
)
|
(2,002
|
)
|
(865
|
)
|
|||||
|
Nondeductible meals and entertainment
|
782
|
|
1,222
|
|
1,111
|
|
|||||
|
US tax reform - revaluation of deferred taxes
|
102
|
|
(3,756
|
)
|
—
|
|
|||||
|
US tax reform - transition tax, net of credits
|
(3,496
|
)
|
7,550
|
|
—
|
|
|||||
|
Income tax planning
|
(1,792
|
)
|
—
|
|
—
|
|
|||||
|
Benefit of international restructuring
|
—
|
|
(2,989
|
)
|
—
|
|
|||||
|
Global intangible low-tax income, net of credits
|
454
|
|
—
|
|
—
|
|
|||||
|
Tax rate changes
|
(392
|
)
|
(212
|
)
|
(71
|
)
|
|||||
|
Other
|
(56
|
)
|
(582
|
)
|
1,328
|
|
|||||
|
Provision for income taxes
|
$
|
18,542
|
|
$
|
15,039
|
|
$
|
25,565
|
|
||
The Company's consolidated effective income tax rate may change periodically due to
changes in enacted statutory tax rates, changes in tax law or policy, changes in the composition of taxable income from the countries in which it operates, the Company's ability to utilize net operating loss and tax credit carryforwards, and changes in unrecognized tax benefits.
82
The Company's 2017 effective income tax rate was impacted by the Tax Cuts and Jobs Act (the "Tax Act") in the U.S. and international restructuring activities. On December 22, 2017, the Tax Act was enacted. The changes include, but are not limited to: a federal corporate rate reduction from
35%
to
21%
, limitations on the deductibility of interest expense and executive compensation, creation of a new minimum tax on global intangible low taxed income (“GILTI”), and a one-time U.S. tax liability on those earnings which have not previously been repatriated to the U.S. (the “Transition Tax”) as a result of the transition of U.S. international taxation from a worldwide tax system to a modified territorial tax system. In connection with our initial analysis of the impact of the Tax Act, we recorded a provisional estimate in accordance with Staff Accounting Bulletin No. 118 (“SAB 118”) of net tax expense of
$3.8 million
, in the period ended December 31, 2017. This expense consisted of provisional estimates of
$7.6 million
net expense for the Transition Tax, which we estimated would be fully offset by foreign tax credit carryforwards, and
$3.8 million
net benefit for remeasurement of our domestic deferred tax balances for the corporate rate reduction. At December 31, 2017, the Company had not fully completed its accounting for the tax effects of enactment of the Tax Act in accordance with SAB 118.
During 2018, the Company completed its accounting for the Tax Act in accordance with SAB 118. As a result, the Company recorded additional income tax expense of $
3.6 million
. This expense consisted of substantially all of the $
7.0 million
valuation allowance established against foreign tax credits and $
0.1 million
for the revaluation of deferred taxes, net of $
3.5 million
of Transition Tax release of uncertain tax positions and adjustments.
No additional income or withholding taxes have been provided for any undistributed foreign earnings, other than those subject to the Transition Tax nor have any taxes been provided for outside basis difference inherent in these entities as these amounts continue to be indefinitely reinvested in foreign operations. We have estimated that we have book over tax basis differences of approximately
$35.0 million
. Due to withholding tax, basis computations, and other related tax considerations, it is not practicable to estimate any taxes to be provided on outside basis differences at this time.
Topic 740, No. 5,
Accounting for Global Intangible Low-Taxed Income
, states that an entity can make an accounting policy election to either recognize deferred taxes for temporary basis differences expected to reverse as GILTI in future years or to provide for the tax expense related to GILTI in the year the tax is incurred as a period expense only. At December 31, 2018, the Company has elected to account for GILTI in the year the tax is incurred.
Deferred income taxes consisted of the following at
December 31, 2018
and
2017
:
|
2018
|
2017
|
||||||
|
|
(In thousands)
|
||||||
|
Accounts receivable allowance
|
$
|
1,534
|
|
$
|
55
|
|
|
|
Accrued compensation
|
10,184
|
|
8,741
|
|
|||
|
Accrued pension liabilities
|
13,496
|
|
12,482
|
|
|||
|
Self-insured risks
|
4,933
|
|
5,831
|
|
|||
|
Deferred revenues
|
5,868
|
|
6,793
|
|
|||
|
Accrued rent
|
3,115
|
|
3,380
|
|
|||
|
Interest
|
5,665
|
|
6,146
|
|
|||
|
Tax credit carryforwards
|
14,404
|
|
18,490
|
|
|||
|
Loss carryforwards
|
25,745
|
|
29,655
|
|
|||
|
Other
|
1,230
|
|
1,913
|
|
|||
|
Gross deferred income tax assets
|
86,174
|
|
93,486
|
|
|||
|
Unbilled revenues
|
7,725
|
|
12,689
|
|
|||
|
Depreciation and amortization
|
32,510
|
|
38,339
|
|
|||
|
Other post-retirement benefits
|
78
|
|
116
|
|
|||
|
Gross deferred income tax liabilities
|
40,313
|
|
51,144
|
|
|||
|
Net deferred income tax assets before valuation allowance
|
45,861
|
|
42,342
|
|
|||
|
Valuation allowance
|
(25,864
|
)
|
(18,829
|
)
|
|||
|
Net deferred income tax assets
|
$
|
19,997
|
|
$
|
23,513
|
|
|
|
Amounts recognized in the Consolidated Balance Sheets consist of:
|
|
|
|
|
|||
|
Long-term deferred income tax assets included in "Deferred income tax assets"
|
22,146
|
|
24,359
|
|
|||
|
Long-term deferred income tax liabilities included in "Other noncurrent liabilities"
|
(2,149
|
)
|
(846
|
)
|
|||
|
Net deferred income tax assets
|
$
|
19,997
|
|
$
|
23,513
|
|
|
83
At
December 31, 2018
, the Company had deferred tax assets related to loss carryforwards of
$26,164,000
, before netting of unrecognized tax benefits of
$419,000
. An estimated
$16,239,000
of the deferred tax assets will not expire, and
$9,925,000
will expire over the next
20
years if not utilized by the Company.
Changes in the Company's deferred tax valuation allowance are recorded as adjustments to the provision for income taxes. An analysis of the Company's deferred tax asset valuation allowances is as follows for the years ended
December 31, 2018
,
2017
, and
2016
.
|
2018
|
2017
|
2016
|
|||||||||
|
|
(In thousands)
|
||||||||||
|
Balance, beginning of year
|
$
|
18,829
|
|
$
|
14,498
|
|
$
|
17,204
|
|
||
|
Other changes
|
7,035
|
|
4,331
|
|
(2,706
|
)
|
|||||
|
Balance, end of year
|
$
|
25,864
|
|
$
|
18,829
|
|
$
|
14,498
|
|
||
Changes to the valuation allowance for the year ended
December 31, 2018
were primarily due to anticipated expiration of foreign tax credits after consideration of the Tax Act and the four sources of taxable income and losses in certain of the Company’s international and domestic operations. For the year ended
December 31, 2017
the change was primarily due to losses in certain of the Company’s international operations and domestic operations impacting state NOLs.
A reconciliation of the beginning and ending balance of unrecognized income tax benefits follows:
|
|
(In thousands)
|
||
|
Balance at December 31, 2015
|
$
|
6,187
|
|
|
Additions for tax provisions related to the current year
|
159
|
|
|
|
Reductions for tax positions related to the current year
|
(989
|
)
|
|
|
Additions for tax positions related to prior years
|
278
|
|
|
|
Lapses of applicable statutes of limitation
|
(166
|
)
|
|
|
Balance at December 31, 2016
|
$
|
5,469
|
|
|
Additions for tax provisions related to the current year
|
6,318
|
|
|
|
Reductions for tax positions related to prior years
|
(41
|
)
|
|
|
Additions for tax positions related to prior years
|
823
|
|
|
|
Lapses of applicable statutes of limitation
|
(1,232
|
)
|
|
|
Currency translation adjustment
|
(40
|
)
|
|
|
Balance at December 31, 2017
|
$
|
11,297
|
|
|
Additions for tax provisions related to the current year
|
54
|
|
|
|
Reductions for tax positions related to prior years
|
(3,941
|
)
|
|
|
Currency translation adjustment
|
(9
|
)
|
|
|
Balance at December 31, 2018
|
$
|
7,401
|
|
The Company accrues interest and, if applicable, penalties related to unrecognized tax benefits in income taxes. Total accrued interest expense at
December 31, 2018
,
2017
, and
2016
, was
$256,000
,
$275,000
, and
$155,000
, respectively.
Included in the total unrecognized tax benefits at
December 31, 2018
,
2017
, and
2016
were
$5,493,000
,
$9,389,000
, and
$3,332,000
, respectively, of tax benefits that, if recognized, would affect the effective income tax rate.
The Company conducts business in a number of countries and, as a result, files U.S. federal and various state and foreign jurisdiction income tax returns. In the normal course of business, the Company is subject to examination by various taxing jurisdictions throughout the world, including Canada, the U.K., and the U.S. With few exceptions, the Company is no longer subject to income tax examinations for years before 2008.
Although the outcome of tax audits is always uncertain, the Company believes that adequate amounts of tax, including interest and penalties, have been provided for any adjustments that are expected to result from those years.
84
The Company expects
$3,400,000
in reductions to unrecognized income tax benefits within the next 12 months as a result of projected resolutions of income tax uncertainties.
9. Retirement Plans
The Company and its subsidiaries sponsor various retirement plans. Substantially all employees in the U.S. and certain employees outside the U.S. are covered under the Company's defined contribution plans. Certain employees, retirees, and eligible dependents are also covered under the Company's defined benefit pension plans.
Employer contributions under the Company's defined contribution plans are determined annually based on employee contributions, a percentage of each covered employee's compensation, and years of service. The Company's cost for defined contribution plans totaled
$23,417,000
,
$24,036,000
, and
$23,985,000
in
2018
,
2017
, and
2016
, respectively.
The Company sponsors a qualified defined benefit pension plan in the U.S. (the "U.S. Qualified Plan") and
three
defined benefit pension plans in the U.K. (the "U.K. Plans"). Effective December 31, 2002, the Company elected to freeze its U.S. Qualified Plan. Benefits payable under the Company's U.S. Qualified Plan are generally based on career compensation; however, no additional benefits have accrued on this plan since December 31, 2002. The Company's U.K. Plans were closed to new participants as of October 31, 1997, but existing participants may still accrue additional limited benefits based on salary amounts in effect at the time the relevant plan was closed. Benefits payable under the U.K. Plans are generally based on an employee's final salary at the time the plan was closed. Benefits paid under the U.K. Plans are also subject to adjustments for the effects of inflation. The actuarial present value of the projected benefit payments under the U.K. Plans are based on the employees' expected dates of separation by retirement.
The Bipartisan Budget Act of 2015 ("BBA2015") included pension funding reform which greatly reduced the contributions required to the U.S. Qualified Plan. Required contributions are anticipated in future years as the impact of the BBA2015 pension funding reform is phased out. Currently, the Company plans to make no contribution in 2019 and contribute
$9,000,000
per annum to the U.S. Qualified Plan for the following four fiscal years to improve the funded status of the plan and minimize future required contributions. The Company is not making a discretionary contribution in 2019 because it made an additional voluntary contribution of $
10,000,000
in 2018 which generated a one time U.S. tax benefit. The Company expects to make no discretionary contributions to its U.K. Plans during the next five years.
Certain other employees located in the Netherlands, Norway, Germany, and the Philippines (referred to herein as the "other international plans") have retirement benefits that are accounted for as defined benefit pension plans under GAAP.
External trusts are maintained to hold assets of the Company's U.S. Qualified Plan, U.K. Plans, and other international plans. The Company's funding policy is to make cash contributions in amounts at least sufficient to meet regulatory funding requirements and, in certain instances, to make contributions in excess thereof if such contributions would otherwise be in accordance with the Company's capital allocation plans. Assets of the plans are measured at fair value at the end of each reporting period, but the plan assets are not separately recorded on the Company's Consolidated Balance Sheets. Instead, the funded or unfunded status of the Company's U.S. Qualified Plan, U.K. Plans, and other international plans are recorded in "Accrued pension liabilities" or "Other noncurrent assets" on the Company's Consolidated Balance Sheets based on the projected benefit obligations less the fair values of the plans' assets.
The majority of the Company's defined benefit pension plans have projected benefit obligations in excess of the fair value of plan assets. For these plans, the projected benefit obligations and the fair value of plan assets were as follows as of
December 31, 2018
and
2017
:
|
December 31,
|
2018
|
2017
|
|||||
|
(In thousands)
|
|||||||
|
Projected benefit obligations
|
$
|
459,706
|
|
$
|
515,343
|
|
|
|
Fair value of plans' assets
|
382,181
|
|
424,804
|
|
|||
85
Certain of the Company's U.K. Plans have fair values of plan assets that exceed the projected benefit obligations. For these plans, the projected benefit obligations and the fair value of plan assets were as follows as of
December 31, 2018
and
2017
:
|
December 31,
|
2018
|
2017
|
|||||
|
(In thousands)
|
|||||||
|
Projected benefit obligations
|
$
|
234,776
|
|
$
|
249,397
|
|
|
|
Fair value of plans' assets
|
267,508
|
|
284,091
|
|
|||
In addition, the Company sponsors
two
frozen nonqualified, unfunded defined benefit pension plans for certain employees and retirees, which are based on career compensation. These plans were frozen effective December 31, 2002. The liabilities of these plans, which equal their projected benefit obligations, are included in "Other accrued liabilities" and "Other noncurrent liabilities" on the Company's Consolidated Balance Sheets based on the expected timing of funding these obligations, since they are funded as needed from Company assets.
A reconciliation of the beginning and ending balances of the projected benefit obligations and the fair value of plans' assets for the Company's defined benefit pension plans as of the plans' most recent measurement dates is as follows:
|
Year Ended December 31,
|
2018
|
2017
|
|||||
|
|
(In thousands)
|
||||||
|
Projected Benefit Obligations:
|
|||||||
|
Beginning of measurement period
|
$
|
764,740
|
|
$
|
764,567
|
|
|
|
Service cost
|
1,395
|
|
1,288
|
|
|||
|
Interest cost
|
20,933
|
|
22,723
|
|
|||
|
Employee contributions
|
59
|
|
82
|
|
|||
|
Actuarial (gain) loss
|
(24,277
|
)
|
19,100
|
|
|||
|
Plan settlements
|
(1,014
|
)
|
(7,552
|
)
|
|||
|
Plan amendments
|
1,542
|
|
—
|
|
|||
|
Benefits paid
|
(58,592
|
)
|
(58,092
|
)
|
|||
|
Foreign currency effects
|
(10,304
|
)
|
22,624
|
|
|||
|
End of measurement period
|
694,482
|
|
764,740
|
|
|||
|
Fair Value of Plans' Assets:
|
|||||||
|
Beginning of measurement period
|
708,895
|
|
677,458
|
|
|||
|
Actual return on plans' assets
|
(13,017
|
)
|
57,245
|
|
|||
|
Employer contributions
|
24,862
|
|
15,331
|
|
|||
|
Employee contributions
|
59
|
|
82
|
|
|||
|
Plan settlements
|
(1,014
|
)
|
(7,552
|
)
|
|||
|
Benefits paid
|
(58,592
|
)
|
(58,092
|
)
|
|||
|
Foreign currency effects
|
(11,505
|
)
|
24,423
|
|
|||
|
End of measurement period
|
649,688
|
|
708,895
|
|
|||
|
Unfunded Status
|
$
|
(44,794
|
)
|
$
|
(55,845
|
)
|
|
Due to the frozen status of the U.S. Qualified Plan and the closed status of the U.K. Plans, the accumulated benefit obligations and the projected benefit obligations are not materially different.
86
The underfunded status of the Company's defined benefit pension plans recognized in the Consolidated Balance Sheets at
December 31
consisted of:
|
December 31,
|
2018
|
|
2017
|
||||
|
|
(In thousands)
|
||||||
|
U.S. Qualified Plan
|
$
|
72,484
|
|
$
|
85,834
|
|
|
|
Other international plans
|
1,839
|
|
1,201
|
|
|||
|
Subtotal, included in "Accrued pension liabilities"
|
74,323
|
|
87,035
|
|
|||
|
U.K. prepaid pension asset included in "Other noncurrent assets"
|
(32,732
|
)
|
(34,698
|
)
|
|||
|
Unfunded status of nonqualified defined benefit deferred pension plans included in "Other accrued liabilities"
|
312
|
|
319
|
|
|||
|
Unfunded status of nonqualified defined benefit pension plans included in "Other noncurrent liabilities"
|
2,891
|
|
3,189
|
|
|||
|
Total unfunded status
|
$
|
44,794
|
|
$
|
55,845
|
|
|
|
Accumulated other comprehensive loss, before income taxes
|
$
|
(280,644
|
)
|
$
|
(268,059
|
)
|
|
A fixed number of U.S. employees, retirees, and eligible dependents were previously covered under a frozen post-retirement medical benefits plan and are now provided Company-subsidized premiums for participation in health care exchanges. The liabilities for this plan are included in the Company's self-insured risks liabilities and are not material. This plan was frozen effective December 31, 2002.
The following tables set forth the
2018
and
2017
changes in accumulated other comprehensive loss for the Company's defined benefit retirement plans and post-retirement medical benefits plan on a combined basis:
|
Defined Benefit Pension Plans
|
Post-Retirement Medical Benefits Plan
|
||||||
|
|
(In thousands)
|
||||||
|
Net unrecognized actuarial (loss) gain, December 31, 2016
|
$
|
(280,030
|
)
|
$
|
608
|
|
|
|
Amortization of net loss (gain)
|
11,727
|
|
(152
|
)
|
|||
|
Net gain arising during the year
|
3,537
|
|
—
|
|
|||
|
Currency translation
|
(3,749
|
)
|
—
|
|
|||
|
Net unrecognized actuarial (loss) gain, December 31, 2017
|
(268,515
|
)
|
456
|
|
|||
|
Amortization of net loss (gain)
|
10,914
|
|
(152
|
)
|
|||
|
Net loss arising during the year
|
(24,709
|
)
|
—
|
|
|||
|
Currency translation
|
1,362
|
|
—
|
|
|||
|
Net unrecognized actuarial (loss) gain, December 31, 2018
|
$
|
(280,948
|
)
|
$
|
304
|
|
|
Unrecognized losses reflect changes in the discount rates and differences between expected and actual asset returns, which are being amortized over future periods. These unrecognized losses may be recovered in future periods through actuarial gains. However, unless the minimum amount required to be amortized is below a corridor amount equal to
10.0%
of the greater of the projected benefit obligation or the market-related value of plan assets, these unrecognized actuarial losses are required to be amortized and recognized in future periods. Net unrecognized actuarial losses included in accumulated other comprehensive loss and expected to be recognized in net periodic benefit costs during the year ending December 31,
2019
for the U.S. and U.K. defined benefit pension plans are
$10,880,000
(
$8,122,000
net of tax).
87
Pension expense is affected by the accounting policy used to determine the value of plan assets at the measurement date. The Company applies the expected return on plan assets using fair market value as of the annual measurement date. The fair market value method results in greater volatility to pension expense than the calculated value method. The amounts recognized in the Consolidated Balance Sheets reflect the fair value of the Company's long-term pension liabilities at the plan measurement date and the fair value of plan assets as of the balance sheet date. Net periodic benefit cost related to all of the Company's defined benefit pension plans recognized in the Company's Consolidated Statements of Operations for the years ended
December 31, 2018
,
2017
, and
2016
included the following components:
|
Year Ended December 31,
|
2018
|
2017
|
2016
|
||||||||
|
|
(In thousands)
|
||||||||||
|
Service cost
|
$
|
1,395
|
|
$
|
1,288
|
|
$
|
1,218
|
|
||
|
Interest cost
|
20,933
|
|
22,723
|
|
30,129
|
|
|||||
|
Expected return on assets
|
(34,267
|
)
|
(34,056
|
)
|
(36,406
|
)
|
|||||
|
Amortization of actuarial loss
|
10,744
|
|
11,154
|
|
12,840
|
|
|||||
|
Net periodic benefit (credit) cost
|
$
|
(1,195
|
)
|
$
|
1,109
|
|
$
|
7,781
|
|
||
Benefit cost for the U.S. Qualified Plan does not include service cost since the plan is frozen.
Over the next ten years, the following benefit payments are expected to be required to be made from the Company's U.S. and U.K. defined benefit pension plans:
|
Year Ending December 31,
|
Expected Benefit Payments
|
||
|
|
(In thousands)
|
||
|
2019
|
$
|
43,607
|
|
|
2020
|
44,102
|
|
|
|
2021
|
44,373
|
|
|
|
2022
|
44,595
|
|
|
|
2023
|
44,663
|
|
|
|
2024-2028
|
220,848
|
|
|
The Company reviews its employee demographic assumptions annually and updates the assumptions as necessary. The Company updates the mortality assumptions for the U.S. plans to incorporate the current mortality tables issued by the Society of Actuaries, adjusted to reflect the Company's specific experience and future expectations. This resulted in a $
1,300,000
decrease in the projected benefit obligation for the U.S. plans for the year ended
December 31, 2018
. Certain assumptions used in computing the benefit obligations and net periodic benefit cost for the U.S. and U.K. defined benefit pension plans were as follows:
|
U.S. Qualified Plan:
|
2018
|
2017
|
|||
|
Discount rate used to compute benefit obligations
|
4.30
|
%
|
3.63
|
%
|
|
|
Discount rate used to compute periodic benefit cost
|
3.63
|
%
|
4.15
|
%
|
|
|
Expected long-term rates of return on plans' assets
|
6.20
|
%
|
6.30
|
%
|
|
|
U.K. Defined Benefit Plans:
|
2018
|
2017
|
|||
|
Discount rate used to compute benefit obligations
|
2.77
|
%
|
2.61
|
%
|
|
|
Discount rate used to compute periodic benefit cost
|
2.61
|
%
|
2.65
|
%
|
|
|
Expected long-term rates of return on plans' assets
|
3.98
|
%
|
4.23
|
%
|
|
The discount rate assumptions reflect the rates at which the Company believes the benefit obligations could be effectively settled. The discount rates were determined based on the yield for a portfolio of investment grade corporate bonds with maturity dates matched to the estimated future payments of the plans' benefit obligations.
88
The Company estimates the service and interest components of net periodic benefit cost for its U.S. and international pension and other postretirement benefits. This estimation approach discounts the individual expected cash flows underlying the service cost and interest cost using the applicable spot rates derived from the yield curve used to discount the cash flows used to measure the benefit obligation. For the pension plans, the weighted average spot rates used to determine interest costs were
3.92%
for the U.S. Qualified plan and
2.44%
for the U.K. plans.
The expected long-term rates of return on plan assets were based on the plans' asset mix, historical returns on equity securities and fixed income investments, and an assessment of expected future returns. The expected long-term rates of return on plan assets assumption used to determine
2019
net periodic pension cost are estimated to be
6.10%
and
3.28%
for the U.S.Qualified Plan and U.K. plans, respectively. If actual long-term rates of return differ from those assumed or if the Company used materially different assumptions, actual funding obligations could differ materially from these estimates. Due to the frozen status of the U.S. plan and closed status of the U.K. plans, increases in compensation rates are not material to the computations of benefit obligations or net periodic benefit cost.
Plans' Assets
Asset allocations at the respective measurement dates, by asset category, for the Company's U.S. and U.K. qualified defined benefit pension plans were as follows:
|
|
U.S. Qualified Plan
|
U.K. Plans
|
|||||||||
|
December 31,
|
2018
|
2017
|
2018
|
2017
|
|||||||
|
Equity securities
|
21.8
|
%
|
27.8
|
%
|
18.0
|
%
|
24.8
|
%
|
|||
|
Fixed income securities
|
68.8
|
%
|
62.0
|
%
|
71.8
|
%
|
62.8
|
%
|
|||
|
Alternative strategies
|
7.3
|
%
|
3.9
|
%
|
9.0
|
%
|
10.9
|
%
|
|||
|
Cash, cash equivalents and short-term investment funds
|
2.1
|
%
|
6.3
|
%
|
1.2
|
%
|
1.5
|
%
|
|||
|
Total asset allocation
|
100.0
|
%
|
100.0
|
%
|
100.0
|
%
|
100.0
|
%
|
|||
Investment objectives for the Company's U.S. and U.K. pension plan assets are to ensure availability of funds for payment of plan benefits as they become due; provide for a reasonable amount of long-term growth of capital, without undue exposure to volatility; protect the assets from erosion of purchasing power; and provide investment results that meet or exceed the plans' actuarially assumed long-term rate of return.
Alternative strategies include funds that invest in derivative instruments such as futures, forward contracts, options and swaps, and funds that invest in real estate. These investments are used to help manage risks.
The long-term goal for the U.S. and U.K. plans is to reach fully-funded status and to maintain that status. The investment policies recognize that the plans' asset return requirements and risk tolerances will change over time. Accordingly, reallocation of the portfolios' mix of return-seeking assets and liability-hedging assets will be performed as the plans' funded status improves.
See Note 13, "Fair Value Measurements" for the fair value disclosures of the U.S. and U.K. qualified defined benefit pension plan assets. The assets of the Company's other international plans are primarily insurance contracts, which are measured at contract value and are not measured at fair value. Obligations of the U.S. nonqualified plans are paid from Company assets.
10. Common Stock and Earnings per Share
Shares of the Company's
two
classes of common stock are traded on the NYSE under the symbols CRD-A and CRD-B, respectively. The Company's
two
classes of stock are substantially identical, except with respect to voting rights and the Company's ability to pay greater cash dividends on the non-voting Class A Common Stock than on the voting Class B Common Stock, subject to certain limitations. In addition, with respect to mergers or similar transactions, holders of Class A Common Stock must receive the same type and amount of consideration as holders of Class B Common Stock, unless different consideration is approved by the holders of
75%
of the Class A Common Stock, voting as a class. As described in Note 12, "Stock-Based Compensation," certain shares of CRD-A are issued with restrictions under incentive compensation plans.
89
The Company's share repurchase authorization, approved in August 2014, (the "2014 Repurchase Authorization") provided the Company with the ability to repurchase up to
2,000,000
shares of CRD-A or CRD-B (or both). The 2014 Repurchase Authorization was terminated on July 28, 2017.
Effective July 29, 2017, the Company's Board of Directors authorized the repurchase of up to
2,000,000
shares of CRD-A or CRD-B (or both) through July 2020 (the "2017 Repurchase Authorization"). Under the 2017 Repurchase Authorization, repurchases may be made for cash, in the open market or privately negotiated transactions at such times and for such prices as management deems appropriate, subject to applicable contractual and regulatory restrictions.
Through
December 31, 2018
, the Company had repurchased
1,144,410
shares of CRD-A and
94,378
shares of CRD-B under the 2014 and 2017 Repurchase Authorizations at an average cost of
$8.36
and
$8.96
, respectively. At
December 31, 2018
, the Company had remaining authorization to repurchase
427,883
shares under the 2017 Repurchase Authorization.
Through
December 31, 2017
, the Company had repurchased
699,847
shares of CRD-A and
188,180
shares of CRD-B under the 2014 and 2017 Repurchase Authorizations at an average cost of
$8.21
and
$8.88
, respectively. At
December 31, 2017
, the Company had remaining authorization to repurchase
1,666,671
shares under the 2017 Repurchase Authorization.
Net Income Attributable to Shareholders of Crawford & Company per Common Share
The Company computes earnings per share of CRD-A and CRD-B using the two-class method, which allocates the undistributed earnings for each period to each class on a proportionate basis. The Company's Board of Directors has the right, but not the obligation, to declare higher dividends on CRD-A than on CRD-B, subject to certain limitations. In periods when the dividend is the same for CRD-A and CRD-B or when no dividends are declared or paid to either class, the two-class method generally will yield the same earnings per share for CRD-A and CRD-B. During
2018
,
2017
and
2016
, the Board of Directors declared a higher dividend on CRD-A than on CRD-B.
The computations of basic net income attributable to shareholders of Crawford & Company per common share were as follows:
|
Year Ended December 31,
|
2018
|
2017
|
2016
|
|||||||||||||||||
|
CRD-A
|
CRD-B
|
CRD-A
|
CRD-B
|
CRD-A
|
CRD-B
|
|||||||||||||||
|
(In thousands, except earnings (loss) per share)
|
||||||||||||||||||||
|
Earnings per share - basic:
|
||||||||||||||||||||
|
Numerator:
|
||||||||||||||||||||
|
Allocation of undistributed earnings
|
$
|
6,941
|
|
$
|
5,509
|
|
$
|
7,821
|
|
$
|
6,144
|
|
$
|
12,432
|
|
$
|
9,969
|
|
||
|
Dividends paid
|
8,639
|
|
4,889
|
|
8,780
|
|
4,920
|
|
8,627
|
|
4,938
|
|
||||||||
|
Net income available to common shareholders, basic
|
15,580
|
|
10,398
|
|
16,601
|
|
11,064
|
|
21,059
|
|
14,907
|
|
||||||||
|
Denominator:
|
||||||||||||||||||||
|
Weighted-average common shares outstanding, basic
|
30,805
|
|
24,449
|
|
31,322
|
|
24,606
|
|
30,793
|
|
24,690
|
|
||||||||
|
Earnings per share - basic
|
$
|
0.51
|
|
$
|
0.43
|
|
$
|
0.53
|
|
$
|
0.45
|
|
$
|
0.68
|
|
$
|
0.60
|
|
||
90
The computations of diluted net income attributable to shareholders of Crawford & Company per common share were as follows:
|
Year Ended December 31,
|
2018
|
2017
|
2016
|
|||||||||||||||||
|
CRD-A
|
CRD-B
|
CRD-A
|
CRD-B
|
CRD-A
|
CRD-B
|
|||||||||||||||
|
(In thousands, except earnings (loss) per share)
|
||||||||||||||||||||
|
Earnings per share - diluted:
|
||||||||||||||||||||
|
Numerator:
|
||||||||||||||||||||
|
Allocation of undistributed earnings
|
$
|
7,003
|
|
$
|
5,447
|
|
$
|
7,911
|
|
$
|
6,053
|
|
$
|
12,563
|
|
$
|
9,838
|
|
||
|
Dividends paid
|
8,639
|
|
4,889
|
|
8,780
|
|
4,920
|
|
8,627
|
|
4,938
|
|
||||||||
|
Net income available to common shareholders, diluted
|
15,642
|
|
10,336
|
|
16,691
|
|
10,973
|
|
21,190
|
|
14,776
|
|
||||||||
|
Denominator:
|
||||||||||||||||||||
|
Weighted-average common shares outstanding, basic
|
30,805
|
|
24,449
|
|
31,322
|
|
24,606
|
|
30,793
|
|
24,690
|
|
||||||||
|
Weighted-average effect of dilutive securities
(1)
|
629
|
|
—
|
|
836
|
|
—
|
|
737
|
|
—
|
|
||||||||
|
Weighted-average number of shares outstanding, diluted
|
31,434
|
|
24,449
|
|
32,158
|
|
24,606
|
|
31,530
|
|
24,690
|
|
||||||||
|
Earnings per share - diluted
|
$
|
0.50
|
|
$
|
0.42
|
|
$
|
0.52
|
|
$
|
0.45
|
|
$
|
0.67
|
|
$
|
0.60
|
|
||
Listed below are the shares excluded from the denominator in the above computation of diluted earnings per share for CRD-A because their inclusion would have been anti-dilutive:
|
Year Ended December 31,
|
2018
|
2017
|
2016
|
|||||
|
(In thousands)
|
||||||||
|
Shares underlying stock options excluded due to the options' respective exercise prices being greater than the average stock price during the period
|
1,175
|
|
711
|
|
115
|
|
||
|
Performance stock grants excluded because performance conditions had not been met
(1)
|
752
|
|
402
|
|
—
|
|
||
|
(1)
|
Compensation cost is recognized for these performance stock grants based on expected achievement rates; however no consideration is given for these performance stock grants when calculating earnings per share until the performance measurements are actually achieved.
|
91
11. Accumulated Other Comprehensive Loss
Comprehensive income (loss) for the Company consists of the total of net income, foreign currency translation adjustments, and accrued pension and retiree medical liability adjustments. Foreign currency translation adjustments include net unrealized gains (losses) from intra-entity loans that are long-term in nature of
$(1,838,000)
,
$(836,000)
, and
$2,547,000
for the years ended
December 31, 2018
,
2017
, and
2016
, respectively. The changes in components of "Accumulated other comprehensive loss" ("AOCL"), net of taxes and noncontrolling interests, included in the Company's audited Consolidated
Balance Sheets were as follows:
|
Foreign currency translation adjustments
|
Retirement liabilities
|
AOCL attributable to shareholders of Crawford & Company
|
|||||||||
|
(In thousands)
|
|||||||||||
|
Balance at December 31, 2016
|
$
|
(33,449
|
)
|
$
|
(178,324
|
)
|
$
|
(211,773
|
)
|
||
|
Other comprehensive income before reclassifications
|
7,129
|
|
—
|
|
7,129
|
|
|||||
|
Unrealized net gains arising during the year
|
—
|
|
666
|
|
666
|
|
|||||
|
Amounts reclassified from accumulated other comprehensive income to net income
(1)
|
—
|
|
7,501
|
|
7,501
|
|
|||||
|
Net current period other comprehensive income
|
7,129
|
|
8,167
|
|
15,296
|
|
|||||
|
Balance at December 31, 2017
|
(26,320
|
)
|
(170,157
|
)
|
(196,477
|
)
|
|||||
|
Other comprehensive loss before reclassifications
|
(10,032
|
)
|
—
|
|
(10,032
|
)
|
|||||
|
Unrealized net losses arising during the year
|
—
|
|
(18,014
|
)
|
(18,014
|
)
|
|||||
|
Amounts reclassified from accumulated other comprehensive income to net income (1)
|
—
|
|
8,076
|
|
8,076
|
|
|||||
|
Net current period other comprehensive loss
|
(10,032
|
)
|
(9,938
|
)
|
(19,970
|
)
|
|||||
|
Balance at December 31, 2018
|
$
|
(36,352
|
)
|
$
|
(180,095
|
)
|
$
|
(216,447
|
)
|
||
|
(1)
|
Retirement liabilities reclassified to net income are related to the amortization of actuarial losses and are included in "Selling, general, and administrative expenses" in the Company's Consolidated Statements of Operations. See Note 9, "Retirement Plans" for additional details.
|
Other comprehensive loss amounts attributable to noncontrolling interests shown in the Company's audited Consolidated Statements of Shareholders' Investment are foreign currency translation adjustments.
12. Stock-Based Compensation
The Company has various stock-based incentive compensation plans for its employees and members of its Board of Directors. Only shares of CRD-A can be issued under these plans. The fair value of an equity award is estimated on the grant date without regard to service or performance conditions. The fair value is recognized as compensation expense over the requisite service period for all awards that vest. When recognizing compensation expense, estimates are made for the number of awards that are expected to vest, and subsequent adjustments are made to reflect both changes in the number of shares expected to vest and actual vesting. Compensation expense recognized at the end of any year equals at least the portion of the grant-date value of an award that has vested at that date.
The pretax compensation expense recognized for all stock-based compensation plans was
$6,196,000
,
$6,661,000
, and
$5,252,000
for the years ended
December 31, 2018
,
2017
, and
2016
, respectively. The decrease in 2018 as compared to 2017 was primarily driven by increased performance share forfeiture activity. The increase in 2017 as compared to 2016 was due to a higher proportion of options having been granted as a component of the Company's Long Term Incentive Plans.
92
The total income tax benefit recognized in the Consolidated Statements of Operations for stock-based compensation arrangements was approximately
$1,475,000
,
$2,219,000
, and
$1,983,000
for the years ended
December 31, 2018
,
2017
, and
2016
, respectively. Some of the Company's stock-based compensation awards are granted under plans which are designed not to be taxable as compensation to the recipient based on tax laws of the U.S. or other applicable country. Accordingly, the Company does not recognize tax benefits on all of its stock-based compensation expense. Adjustments to additional paid-in capital for differences between deductions taken on its income tax returns related to stock-based compensation plans and the related income tax benefits previously recognized for financial reporting purposes were not significant in any year.
Stock Options
The Company has granted nonqualified and incentive stock options to key employees and directors. All stock options are for shares of CRD-A. Option awards are granted with an exercise price equal to the fair market value of the Company's stock on the date of grant. The Company's stock option plans have been approved by shareholders, and the Company's Board of Directors is authorized to make specific grants of stock options under active plans. Employee stock options typically are subject to graded vesting over
three years
(
33%
each year) and have a typical life of
ten years
. Compensation cost for stock options is recognized on an accelerated basis over the requisite service period for the entire award. For the years ended
December 31, 2018
,
2017
, and
2016
, compensation expense of
$1,253,000
,
$1,233,000
, and
$280,000
, respectively, was recognized for employee stock option awards.
A summary of option activity as of
December 31, 2018
,
2017
, and
2016
, and changes during each year, is presented below:
|
Shares
|
Weighted-Average Exercise Price
|
Weighted-Average Remaining Contractual Term
|
Aggregate Intrinsic Value
|
|||||||
|
(In thousands)
|
(In thousands)
|
|||||||||
|
Outstanding at December 31, 2015
|
518
|
|
$5.26
|
5.0 years
|
$8
|
|||||
|
Granted
|
250
|
|
8.90
|
|
||||||
|
Exercised
|
(164
|
)
|
5.08
|
|
||||||
|
Forfeited or expired
|
(115
|
)
|
5.20
|
|
||||||
|
Outstanding at December 31, 2016
|
489
|
|
7.19
|
|
7.0 years
|
1,168
|
|
|||
|
Granted
|
654
|
|
9.44
|
|
||||||
|
Exercised
|
(70
|
)
|
5.77
|
|
||||||
|
Forfeited or expired
|
(186
|
)
|
9.24
|
|
||||||
|
Outstanding at December 31, 2017
|
887
|
|
8.53
|
|
8.4 years
|
527
|
|
|||
|
Granted
|
582
|
|
8.60
|
|
||||||
|
Exercised
|
(21
|
)
|
4.88
|
|
||||||
|
Forfeited or expired
|
(154
|
)
|
8.74
|
|
||||||
|
Outstanding at December 31, 2018
|
1,294
|
|
$8.60
|
8.1 years
|
$667
|
|||||
|
Vested and Exercisable at December 31, 2018
|
425
|
|
$8.18
|
7.0 years
|
$453
|
|||||
The weighted average grant date fair value of stock options granted during the year ended December 31,
2018
,
2017
, and
2016
was
$2.78
,
$2.73
and
$4.11
, respectively. Options exercised in
2018
,
2017
, and
2016
had an intrinsic value of
$80,000
,
$234,000
, and
$752,000
, respectively. The fair value of options that vested in
2018
,
2017
, and
2016
was
$36,000
,
$33,000
, and
$467,000
, respectively.
At
December 31, 2018
, the unrecognized compensation cost related to unvested employee stock options was
$872,000
. Directors' stock options had no unrecognized compensation cost since directors' options vest upon grant, and the grant-date fair values were fully expensed on the grant date.
93
The fair value of each option was estimated on the date of grant using the Black-Scholes-Merton option-pricing formula, with the following weighted average assumptions:
|
2018
|
2017
|
|||||
|
Expected dividend yield
|
3.50
|
%
|
4.00
|
%
|
||
|
Expected volatility
|
42.67
|
%
|
43.62
|
%
|
||
|
Risk-free interest rate
|
2.75
|
%
|
2.14
|
%
|
||
|
Expected term of options
|
7 years
|
|
7 years
|
|
||
The expected dividend yield used for 2018 was based on the Company's historical dividend yield. The expected volatility of the price of CRD-A was based on historical realized volatility. The risk-free interest rate was based on the U.S. Treasury Daily Yield Curve Rate on the grant date, with a term equal to the expected term used in the pricing formula. The expected term of the option took into account both the contractual term of the option and the effects of expected exercise behavior.
Performance-Based Stock Grants
Performance share grants are from time to time made to certain key employees of the Company. Such grants entitle employees to earn shares of CRD-A upon the achievement of certain individual and/or corporate objectives. Grants of performance shares are made at the discretion of the Company's Board of Directors, or the Board's Compensation Committee, and are subject to graded or cliff vesting over
three
-year periods. Shares are not issued until the vesting requirements have been met. Dividends are not paid or accrued on unvested/unissued shares. The grant-date fair value of a performance share grant is based on the market value of CRD-A on the date of grant, reduced for the present value of any dividends expected to be paid on CRD-A prior to the vesting of the award. Compensation expense for each award is recognized ratably from the grant date to the vesting date for each tranche.
A summary of the status of the Company's nonvested performance shares as of
December 31, 2018
,
2017
, and
2016
, and changes during each year, is presented below:
|
|
Shares
|
Weighted-Average Grant-Date Fair Value
|
|||
|
Nonvested at December 31, 2015
|
1,316,186
|
|
$6.65
|
||
|
Granted
|
1,179,384
|
|
4.47
|
|
|
|
Vested
|
(499,370
|
)
|
5.28
|
|
|
|
Forfeited or unearned
|
(1,189,319
|
)
|
6.28
|
|
|
|
Nonvested at December 31, 2016
|
806,881
|
|
6.17
|
|
|
|
Granted
|
930,295
|
|
7.54
|
|
|
|
Vested
|
(668,649
|
)
|
5.38
|
|
|
|
Forfeited or unearned
|
(184,185
|
)
|
5.85
|
|
|
|
Nonvested at December 31, 2017
|
884,342
|
|
7.05
|
|
|
|
Granted
|
751,128
|
|
7.43
|
|
|
|
Vested
|
(445,311
|
)
|
5.98
|
|
|
|
Forfeited or unearned
|
(201,322
|
)
|
7.54
|
|
|
|
Nonvested at December 31, 2018
|
988,837
|
|
$8.07
|
||
The total fair value of the performance shares that vested in
2018
,
2017
, and
2016
was
$2,662,000
,
$3,597,000
, and
$2,638,000
, respectively.
Compensation expense recognized for all performance shares totaled
$3,307,000
,
$3,796,000
, and
$3,060,000
for the years ended
December 31, 2018
,
2017
and
2016
, respectively. Compensation cost for these awards is net of estimated or actual award forfeitures. Certain performance awards vest ratably over
three years
, without cumulative earnings per share targets. As of
December 31, 2018
, there was an estimated
$2,564,000
of unearned compensation cost for nonvested performance shares. This unearned compensation cost is expected to be fully recognized by the end of 2020.
94
Restricted Shares
The Company's Board of Directors may elect to issue restricted shares of CRD-A in lieu of, or in addition to, cash payments to certain key employees. Employees receiving these shares are subject to restrictions on their ability to transfer the shares. Such restrictions generally lapse ratably over vesting periods ranging from several months to
five years
. The grant-date fair value of a restricted share of CRD-A is based on the market value of the stock on the date of grant. Compensation cost is recognized on an accelerated basis over the requisite service period.
A summary of the status of the Company's restricted shares of CRD-A as of
December 31, 2018
,
2017
, and
2016
and changes during each year, is presented below:
|
Shares
|
Weighted-Average Grant-Date Fair Value
|
||||
|
Nonvested at December 31, 2015
|
101,002
|
|
$5.01
|
||
|
Granted
|
133,871
|
|
6.54
|
|
|
|
Vested
|
(160,536
|
)
|
6.57
|
|
|
|
Forfeited or unearned
|
(6,668
|
)
|
8.90
|
|
|
|
Nonvested at December 31, 2016
|
67,669
|
|
7.56
|
|
|
|
Granted
|
210,875
|
|
9.26
|
|
|
|
Vested
|
(166,325
|
)
|
9.50
|
|
|
|
Forfeited or unearned
|
—
|
|
—
|
|
|
|
Nonvested at December 31, 2017
|
112,219
|
|
7.89
|
|
|
|
Granted
|
112,502
|
|
7.81
|
|
|
|
Vested
|
(131,260
|
)
|
8.27
|
|
|
|
Forfeited or unearned
|
(21,352
|
)
|
8.43
|
|
|
|
Nonvested at December 31, 2018
|
72,109
|
|
$7.76
|
||
Compensation expense recognized for all restricted shares for the years ended
December 31, 2018
,
2017
, and
2016
was
$1,176,000
,
$1,205,000
, and
$1,567,000
, respectively. As of
December 31, 2018
, there was
$219,000
of total unearned compensation cost related to nonvested restricted shares which is expected to be recognized by June 30, 2020.
Employee Stock Purchase Plans
The Company has
three
employee stock purchase plans: the U.S. Plan, the U.K. Plan, and the International Plan. Eligible employees in Canada, Puerto Rico, and the U.S. Virgin Islands may also participate in the U.S. Plan. The International Plan is for eligible employees located in certain other countries who are not covered by the U.S. Plan or the U.K. Plan. All plans are compensatory.
For all plans, the requisite service period is the period of time over which the employees contribute to the plans through payroll withholdings. For purposes of recognizing compensation expense, estimates are made for the total withholdings expected over the entire withholding period. The market price of a share of stock at the beginning of the withholding period is then used to estimate the total number of shares that will be purchased using the total estimated withholdings. Compensation cost is recognized ratably over the withholding period.
Under the U.S. Plan, the Company is authorized to issue up to
1,200,000
shares of CRD-A to eligible employees. Participating employees can elect to have up to
$25,000
of their eligible annual earnings withheld to purchase shares at the end of the one-year withholding period which starts each July 1 and ends the following June 30. The purchase price of the stock is
85%
of the lesser of the closing price of a share of such stock on the first day or the last day of the withholding period. Participating employees may cease payroll withholdings during the withholding period and/or request a refund of all amounts withheld before any shares are purchased.
95
During the years ended
December 31, 2018
,
2017
and
2016
, a total of
143,769
,
101,708
, and
99,750
shares, respectively, of CRD-A were issued under the prior U.S. employee stock purchase plan to the Company's employees at purchase prices of
$7.32
,
$6.61
, and
$6.49
in
2018
,
2017
, and
2016
, respectively. At
December 31, 2018
, an estimated
142,000
shares will be issued and purchased under the U.S. Plan in
2019
. During the years ended
December 31, 2018
,
2017
, and
2016
, compensation expense of
$321,000
,
$278,000
, and
$261,000
, respectively, was recognized for the prior U.S. employee stock purchase plan.
Under the U.K. Plan, the Company is authorized to issue up to
1,200,000
shares of CRD-A. Under the U.K. Plan, eligible employees can elect to have up to £
250
withheld from payroll each month to purchase shares after the end of a three-year savings period. The purchase price of a share of stock is
85%
of the market price of the stock at a date prior to the grant date as determined under the U.K. Plan. Participating employees may cease payroll withholdings and/or request a refund of all amounts withheld before any shares are purchased.
At
December 31, 2018
, an estimated
151,000
shares will be eligible for purchase under the U.K. Plan at the end of the current withholding periods. This estimate is subject to change based on future fluctuations in the value of the British pound against the U.S. dollar, future changes in the market price of CRD-A, and future employee participation rates. The purchase price per share of CRD-A under the U.K. Plan ranges from
$3.69
to
$6.66
. For the years ended
December 31, 2018
,
2017
, and
2016
, compensation expense of
$140,000
,
$151,000
, and
$80,000
, respectively, was recognized for the U.K. Plan. During
2018
,
2017
, and
2016
, a total of
63,033
shares,
73,986
shares, and
159,256
shares, respectively, of CRD-A were issued under the U.K. Plan.
Under the International Plan, up to
1,000,000
shares of CRD-A may be issued. Participating employees can elect to have up to
$21,250
of their eligible annual earnings withheld to purchase up to
5,000
shares of CRD-A at the end of the one-year withholding period which starts each July 1 and ends the following June 30. The purchase price of the stock is
85%
of the lesser of the closing price for a share of such stock on the first day or the last day of the withholding period. Participating employees may cease payroll withholdings during the withholding period and/or request a refund of all amounts withheld before any shares are purchased. During
2018
,
2017
, and
2016
,
8,740
,
8,342
, and
6,660
shares, respectively, were issued under the International Plan. Compensation expense was immaterial for this plan in all three years.
13. Fair Value Measurements
GAAP defines fair value as the price that would be received to sell an asset or to transfer a liability (an exit price) in the principal or most advantageous market for the asset or liability in an orderly transaction between market participants at the measurement date. Additionally, the inputs used to measure fair value are prioritized based on a three-level hierarchy. This hierarchy requires entities to maximize the use of observable inputs and minimize the use of unobservable inputs. The three levels of inputs used to measure fair value are as follows:
|
•
|
Level 1— Observable inputs that reflect quoted prices in active markets for identical assets or liabilities.
|
|
•
|
Level 2 — Observable inputs other than quoted prices included in Level 1. The Company values assets and liabilities included in this level using dealer and broker quotations, certain pricing models, bid prices, quoted prices for similar assets and liabilities in active markets, or other inputs that are observable or can be corroborated by observable market data.
|
|
•
|
Level 3 — Unobservable inputs that are supported by little or no market activity and that are significant to the fair value of the assets or liabilities. This includes certain pricing models, discounted cash flow methodologies and similar techniques that use significant unobservable inputs.
|
96
Recurring Fair Value Measurements
The following table presents the Company's assets and liabilities that are measured at fair value on a recurring basis and are categorized using the fair value hierarchy:
|
December 31,
|
2018
|
||||||||||||||
|
Quoted Prices in Active Markets (Level 1)
|
Significant Other Observable Inputs (Level 2)
|
Significant Unobservable Inputs (Level 3)
|
Total
|
||||||||||||
|
|
(In thousands)
|
||||||||||||||
|
Assets:
|
|||||||||||||||
|
Money market funds
(1)
|
$
|
10,354
|
|
$
|
—
|
|
$
|
—
|
|
$
|
10,354
|
|
|||
|
Liabilities:
|
|||||||||||||||
|
Contingent earnout liability
(2)
|
—
|
|
—
|
|
360
|
|
360
|
|
|||||||
|
December 31,
|
2017
|
||||||||||||||
|
Level 1
|
Level 2
|
Level 3
|
Total
|
||||||||||||
|
|
(In thousands)
|
||||||||||||||
|
Assets:
|
|||||||||||||||
|
Money market funds
(1)
|
$
|
10,156
|
|
$
|
—
|
|
$
|
—
|
|
$
|
10,156
|
|
|||
____________________
|
(1)
|
The fair values of the money market funds were based on recently quoted market prices and reported transactions in an active marketplace. Money market funds are included on the Company's Consolidated Balance Sheets in "Cash and cash equivalents."
|
|
(2)
|
The contingent earnout liability relates to a business acquired during 2018 by the Crawford Specialty Solutions operating segment. See Note 3, "Acquisitions and Disposition of Business Line" for further details. The fair value of the contingent earnout liability was estimated using internally-prepared revenue projections which is Level 3 data, with the maximum possible earnout of
$665,000
. As such, the fair value is not expected to vary materially from the balance recorded. The fair value of the contingent earnout liabililty is included in "Other accrued liabilities" on the Company's Consolidated Balance Sheets, based upon the term of the contingent earnout agreement.
|
Fair Value Disclosures
There were no transfers of assets between fair value levels during the years ended
December 31, 2018
or
2017
. The categorization of assets and liabilities within the fair value hierarchy and the measurement techniques are reviewed quarterly. Any transfers between levels are deemed to have occurred at the end of the quarter.
The fair values of accounts receivable, unbilled revenues, accounts payable and short-term borrowings approximate their respective carrying values due to the short-term maturities of the instruments. The interest rate on the Company's variable rate long-term debt resets at least every
90 days
; therefore, the recorded value approximates fair value. These assets and liabilities are measured within Level 2 of the fair value hierarchy.
Nonrecurring Fair Value Disclosures
During 2018 the Company impaired and expensed an indefinite-lived trade name of
$1,056,000
. During 2017 the Company impaired and expensed goodwill of
$19,598,000
. See Note 1, "Significant Accounting and Reporting Policies" and Note 4, "Goodwill and Intangible Assets," where discussed in more detail.
97
Fair Value Measurements for Defined Benefit Pension Plan Assets
The fair value hierarchy is also applied to certain other assets that indirectly impact the Company's consolidated financial statements. Assets contributed by the Company to its defined benefit pension plans become the property of the individual plans. Even though the Company no longer has control over these assets, it is indirectly impacted by subsequent fair value adjustments to these assets. The actual return on these assets impacts the Company's future net periodic benefit cost, as well as amounts recognized in its Consolidated Balance Sheets. The Company uses the fair value hierarchy to measure the fair value of assets held by its U.S. and U.K. defined benefit pension plans.
The following table summarizes the level within the fair value hierarchy used to determine the fair value of the Company's pension plan assets for its U.S Qualified Plan at
December 31, 2018
and
2017
:
|
December 31,
|
2018
|
2017
|
|||||||||||||||||||||||||||||
|
Level 1
|
Level 2
|
Level 3
|
Total
|
Level 1
|
Level 2
|
Level 3
|
Total
|
||||||||||||||||||||||||
|
(In thousands)
|
|||||||||||||||||||||||||||||||
|
Asset Category:
|
|||||||||||||||||||||||||||||||
|
Cash and cash equivalents
|
$
|
2,274
|
|
$
|
—
|
|
$
|
—
|
|
$
|
2,274
|
|
$
|
17,349
|
|
$
|
—
|
|
$
|
—
|
|
$
|
17,349
|
|
|||||||
|
Short-term investment funds
|
—
|
|
5,005
|
|
—
|
|
5,005
|
|
—
|
|
7,175
|
|
—
|
|
7,175
|
|
|||||||||||||||
|
Common Collective Equity funds:
|
|
|
|
|
|
|
|
|
|
|
|
|
|
|
|
|
|||||||||||||||
|
U.S.
|
—
|
|
52,882
|
|
—
|
|
52,882
|
|
—
|
|
74,591
|
|
—
|
|
74,591
|
|
|||||||||||||||
|
International
|
—
|
|
22,747
|
|
—
|
|
22,747
|
|
—
|
|
33,343
|
|
—
|
|
33,343
|
|
|||||||||||||||
|
Common Collective Fixed Income Funds and Fixed Income Securities:
|
|
|
|
|
|
|
|
|
|
|
|
|
|
|
|
|
|||||||||||||||
|
U.S.
|
38,719
|
|
183,152
|
|
—
|
|
221,871
|
|
19,663
|
|
206,008
|
|
—
|
|
225,671
|
|
|||||||||||||||
|
International
|
—
|
|
17,523
|
|
—
|
|
17,523
|
|
—
|
|
15,502
|
|
—
|
|
15,502
|
|
|||||||||||||||
|
Alternative strategy funds
|
—
|
|
8,915
|
|
16,488
|
|
25,403
|
|
—
|
|
—
|
|
15,134
|
|
15,134
|
|
|||||||||||||||
|
TOTAL
|
$
|
40,993
|
|
$
|
290,224
|
|
$
|
16,488
|
|
$
|
347,705
|
|
$
|
37,012
|
|
$
|
336,619
|
|
$
|
15,134
|
|
$
|
388,765
|
|
|||||||
98
The following table summarizes the level within the fair value hierarchy used to determine the fair value of the Company's pension plan assets for its U.K. plans at
December 31, 2018
and
2017
:
|
December 31,
|
2018
|
2017
|
|||||||||||||||||||||||||||||
|
Level 1
|
Level 2
|
Level 3
|
Total
|
Level 1
|
Level 2
|
Level 3
|
Total
|
||||||||||||||||||||||||
|
(In thousands)
|
|||||||||||||||||||||||||||||||
|
Asset Category:
|
|||||||||||||||||||||||||||||||
|
Cash and cash equivalents
|
$
|
3,156
|
|
$
|
—
|
|
$
|
—
|
|
$
|
3,156
|
|
$
|
4,303
|
|
$
|
—
|
|
$
|
—
|
|
$
|
4,303
|
|
|||||||
|
Common Collective Equity funds:
|
|
|
|
|
|
|
|
|
|
|
|
|
|
|
|
|
|||||||||||||||
|
U.S.
|
—
|
|
38,307
|
|
—
|
|
38,307
|
|
—
|
|
55,607
|
|
—
|
|
55,607
|
|
|||||||||||||||
|
International
|
—
|
|
9,916
|
|
—
|
|
9,916
|
|
—
|
|
14,932
|
|
—
|
|
14,932
|
|
|||||||||||||||
|
Common Collective Fixed Income Funds and Fixed Income Securities:
|
|
|
|
|
|
|
|
|
|
|
|
|
|
|
|
|
|||||||||||||||
|
Short-term Investment funds:
|
—
|
|
160,609
|
|
—
|
|
160,609
|
|
—
|
|
141,663
|
|
—
|
|
141,663
|
|
|||||||||||||||
|
Government securities
|
—
|
|
31,531
|
|
—
|
|
31,531
|
|
—
|
|
36,797
|
|
—
|
|
36,797
|
|
|||||||||||||||
|
Corporate bonds and debt securities
|
—
|
|
—
|
|
—
|
|
—
|
|
—
|
|
88
|
|
—
|
|
88
|
|
|||||||||||||||
|
Alternative strategy funds
|
—
|
|
14,044
|
|
—
|
|
14,044
|
|
—
|
|
21,016
|
|
—
|
|
21,016
|
|
|||||||||||||||
|
Real estate funds
|
—
|
|
—
|
|
9,945
|
|
9,945
|
|
—
|
|
—
|
|
9,689
|
|
9,689
|
|
|||||||||||||||
|
TOTAL
|
$
|
3,156
|
|
$
|
254,407
|
|
$
|
9,945
|
|
$
|
267,508
|
|
$
|
4,303
|
|
$
|
270,103
|
|
$
|
9,689
|
|
$
|
284,095
|
|
|||||||
Short-term investment funds consist primarily of funds with a maturity of 60 days or less and are valued at amortized cost which approximates fair value.
Equity securities consist primarily of common collective funds (Level 2). Common collective funds are valued at the net asset value per share multiplied by the number of shares held as of the measurement date.
Fixed income securities consist of money market funds, government securities, corporate bonds and debt securities, mortgage-backed securities and other common collective funds. Government securities are valued by third-party pricing sources and are valued daily in an active market (Level 1). Corporate bonds are valued using either the yields currently available on comparable securities of issuers with similar credit ratings or using a discounted cash flows approach that utilizes observable inputs, such as current yields of similar instruments, and includes adjustments for valuation adjustments from internal pricing models which use observable inputs such as issuer details, interest rates, yield curves, default rates and quoted prices for similar assets (Level 2). Mortgage-backed securities are valued by pricing service providers that use broker-dealer quotations or valuation estimates from their internal pricing models (Level 2). Other common collective funds are valued at the net asset value per share multiplied by the number of shares held as of the measurement date (Level 2).
Alternative strategy funds valued at the net asset value per share multiplied by the number of shares held as of the measurement date (Level 2). Alternative strategy funds may include derivative instruments such as futures, forward contracts, options and swaps and are used to help manage risks. Derivative instruments are generally valued by the investment managers or in certain instances by third party pricing sources (Level 2) or may, due to the inherent uncertainty of valuation for those investments, differ significantly from the values that would have been used had a ready market for the investments existed, and the differences could be material (Level 3).
Real estate funds are primarily property unit trusts whose values are primarily reported by the fund manager and are based on valuation of the underlying investments which include inputs such as cost, discounted cash flows, independent appraisals and market-based comparable data (Level 3). The fair values may, due to the inherent uncertainty of valuation for those investments, differ significantly from the values that would have been used had a ready market for the investments existed, and the differences could be material.
99
The following table provides a reconciliation of the beginning and ending balance of Level 3 assets within the Company's U.K. pension plan during the years ended
December 31, 2018
and
2017
:
|
Real Estate Funds
|
U.S
|
U.K.
|
|||||
|
(in thousands)
|
|||||||
|
Balance at December 31, 2016
|
$
|
—
|
|
$
|
9,315
|
|
|
|
Actual return on plan assets:
|
|||||||
|
Related to assets still held at the reporting date
|
—
|
|
374
|
|
|||
|
Purchases, sales and settlements—net
|
15,134
|
|
|
||||
|
Balance at December 31, 2017
|
15,134
|
|
9,689
|
|
|||
|
Actual return on plan assets:
|
|||||||
|
Related to assets still held at the reporting date
|
1,354
|
|
256
|
|
|||
|
Purchases, sales and settlements—net
|
—
|
|
—
|
|
|||
|
Balance at December 31, 2018
|
$
|
16,488
|
|
$
|
9,945
|
|
|
14. Segment and Geographic Information
The Company's
three
reportable segments represent components of the business for which separate financial information is available, and which is evaluated regularly by the CODM. The segments, organized based upon the nature of services, are:
Crawford Claims Solutions
, which primarily
serves the global property and casualty insurance company markets
;
Crawford TPA Solutions: Broadspire
, which
serves the global casualty, disability and self-insurance marketplace
; and
Crawford Specialty Solutions
which serves the global property and casualty insurance company markets, and prior to the
Garden City Group
disposal on
June 15, 2018
,
the class action, regulatory, mass tort, bankruptcy, and other legal settlement markets, primarily in the U.S. and Canada.
Intersegment sales are recorded at cost and are not material.
Operating earnings is the primary financial performance measure used by the Company's senior management and the CODM to evaluate the financial performance of the Company's
three
operating segments and make resource allocation decisions. The Company believes this measure is useful to investors in that it allows them to evaluate segment operating performance using the same criteria used by the Company's senior management and CODM. Operating earnings will differ from net income computed in accordance with GAAP since operating earnings represent segment earnings before certain unallocated corporate and shared costs and credits,
net corporate interest expense, stock option expense, amortization of customer-relationship intangible assets, goodwill and intangible asset impairment charges, restructuring and special charges, loss on disposition of business line, income taxes, and net income or loss attributable to noncontrolling interests and redeemable noncontrolling interests.
Segment operating earnings includes allocations of certain corporate and shared costs. If the Company changes its allocation methods or changes the types of costs that are allocated to its
three
operating segments, prior period amounts presented in the current period financial statements are adjusted to conform to the current allocation process.
In the normal course of its business, the Company sometimes pays for certain out-of-pocket expenses that are thereafter reimbursed by its clients. Under GAAP, these out-of-pocket expenses and associated reimbursements are required to be included when reporting expenses and revenues, respectively, in the Company's consolidated results of operations. However, in evaluating segment results, Company management excludes these reimbursements and related expenses from segment results, as they offset each other.
100
Financial information as of and for the years ended
December 31, 2018
,
2017
, and
2016
related to the Company's reportable segments is presented below.
|
Crawford Claims Solutions
|
Crawford TPA Solutions: Broadspire
|
Crawford Specialty Solutions
|
Total
|
||||||||||||
|
|
|||||||||||||||
|
2018
|
|||||||||||||||
|
Revenues before reimbursements
|
$
|
361,107
|
|
$
|
405,335
|
|
$
|
304,529
|
|
$
|
1,070,971
|
|
|||
|
Segment operating earnings
|
9,836
|
|
36,909
|
|
51,036
|
|
97,781
|
|
|||||||
|
Depreciation and amortization
(1)
|
3,625
|
|
9,844
|
|
3,377
|
|
16,846
|
|
|||||||
|
Assets
(2)
|
163,899
|
|
92,007
|
|
165,415
|
|
421,321
|
|
|||||||
|
2017
|
|||||||||||||||
|
Revenues before reimbursements
|
$
|
365,074
|
|
$
|
390,583
|
|
$
|
350,175
|
|
$
|
1,105,832
|
|
|||
|
Segment operating earnings
|
17,527
|
|
38,224
|
|
53,418
|
|
109,169
|
|
|||||||
|
Depreciation and amortization
(1)
|
4,039
|
|
9,924
|
|
5,629
|
|
19,592
|
|
|||||||
|
Assets
(2)
|
174,559
|
|
91,101
|
|
211,320
|
|
476,980
|
|
|||||||
|
2016
|
|||||||||||||||
|
Revenues before reimbursements
|
$
|
341,555
|
|
$
|
382,657
|
|
$
|
385,074
|
|
$
|
1,109,286
|
|
|||
|
Segment operating earnings
|
14,371
|
|
36,520
|
|
65,641
|
|
116,532
|
|
|||||||
|
Depreciation and amortization
(1)
|
4,531
|
|
10,061
|
|
5,342
|
|
19,934
|
|
|||||||
|
Assets
(2)
|
128,752
|
|
89,862
|
|
215,441
|
|
434,055
|
|
|||||||
______________________
|
(1)
|
Excludes amortization expense of finite-lived customer relationships and trade name intangible assets.
|
|
(2)
|
Consists of accounts receivable, less allowance for doubtful accounts, unbilled revenues, at estimated billable amounts, goodwill and intangible assets arising from business acquisitions, net.
|
Revenues by geographic region and major service line for the Crawford Claims Solutions,
Crawford TPA Solutions: Broadspire
and
Crawford Specialty Solutions
segments are shown in Note 2, "Revenue Recognition."
Capital expenditures for the years ended
December 31, 2018
,
2017
, and
2016
are shown in the following table:
|
Year Ended December 31,
|
2018
|
2017
|
2016
|
||||||||
|
|
(In thousands)
|
||||||||||
|
Crawford Claims Solutions
|
$
|
3,811
|
|
$
|
1,155
|
|
$
|
719
|
|
||
|
Crawford TPA Solutions: Broadspire
|
5,947
|
|
4,136
|
|
4,678
|
|
|||||
|
Crawford Specialty Solutions
|
2,148
|
|
11,689
|
|
2,823
|
|
|||||
|
Corporate
|
18,114
|
|
27,931
|
|
20,979
|
|
|||||
|
Total capital expenditures
|
$
|
30,020
|
|
$
|
44,911
|
|
$
|
29,199
|
|
||
The total of the Company's reportable segments' revenues before reimbursements reconciled to total consolidated revenues for the years ended
December 31, 2018
,
2017
, and
2016
was as follows:
|
Year Ended December 31,
|
2018
|
2017
|
2016
|
||||||||
|
|
(In thousands)
|
||||||||||
|
Segments' revenues before reimbursements
|
$
|
1,070,971
|
|
$
|
1,105,832
|
|
$
|
1,109,286
|
|
||
|
Reimbursements
|
52,008
|
|
57,877
|
|
68,302
|
|
|||||
|
Total consolidated revenues
|
$
|
1,122,979
|
|
$
|
1,163,709
|
|
$
|
1,177,588
|
|
||
101
The Company's reportable segments' total operating earnings reconciled to consolidated income before income taxes for the years ended
December 31, 2018
,
2017
, and
2016
were as follows:
|
Year Ended December 31,
|
2018
|
2017
|
2016
|
||||||||
|
|
(In thousands)
|
||||||||||
|
Operating earnings of all reportable segments
|
$
|
97,781
|
|
$
|
109,169
|
|
$
|
116,532
|
|
||
|
Unallocated corporate and shared costs and credits
|
(9,321
|
)
|
(13,463
|
)
|
(24,403
|
)
|
|||||
|
Net corporate interest expense
|
(10,109
|
)
|
(9,062
|
)
|
(9,185
|
)
|
|||||
|
Stock option expense
|
(1,742
|
)
|
(1,718
|
)
|
(621
|
)
|
|||||
|
Amortization of customer-relationship intangible assets
|
(11,152
|
)
|
(10,982
|
)
|
(9,592
|
)
|
|||||
|
Goodwill and intangible asset impairment charges
|
(1,056
|
)
|
(19,598
|
)
|
—
|
|
|||||
|
Restructuring and special charges
|
—
|
|
(12,084
|
)
|
(9,490
|
)
|
|||||
|
Loss on disposition of business line
|
(20,270
|
)
|
—
|
|
—
|
|
|||||
|
Income before income taxes
|
$
|
44,131
|
|
$
|
42,262
|
|
$
|
63,241
|
|
||
The Company's reportable segments' total assets reconciled to consolidated total assets of the Company at
December 31, 2018
and
2017
are presented in the following table:
|
December 31,
|
2018
|
2017
|
|||||
|
|
(In thousands)
|
||||||
|
Assets of reportable segments
|
$
|
421,321
|
|
$
|
476,980
|
|
|
|
Corporate assets:
|
|||||||
|
Cash and cash equivalents
|
53,119
|
|
54,011
|
|
|||
|
Income taxes receivable
|
4,084
|
|
7,987
|
|
|||
|
Prepaid expenses and other current assets
|
24,237
|
|
25,452
|
|
|||
|
Net property and equipment
|
34,303
|
|
41,664
|
|
|||
|
Capitalized software costs, net
|
72,210
|
|
89,824
|
|
|||
|
Deferred income tax assets
|
22,146
|
|
24,359
|
|
|||
|
Other noncurrent assets
|
70,022
|
|
67,659
|
|
|||
|
Total corporate assets
|
280,121
|
|
310,956
|
|
|||
|
Total assets
|
$
|
701,442
|
|
$
|
787,936
|
|
|
Revenues and long-lived assets for the U.S., U.K. and Canada are set out below as these countries are material for geographical area disclosure. For the purposes of these geographic area disclosures, long-lived assets consists of the net property and equipment and capitalized software costs, net line items on the Company's Consolidated Balance Sheets and excludes intangible assets, including goodwill.
|
U.S.
|
U.K.
|
Canada
|
All Other International
|
Total Company
|
|||||||||||||||
|
|
(In thousands)
|
||||||||||||||||||
|
2018
|
|||||||||||||||||||
|
Revenues before reimbursements
|
$
|
615,687
|
|
$
|
131,651
|
|
$
|
121,076
|
|
$
|
202,557
|
|
$
|
1,070,971
|
|
||||
|
Long-lived assets
|
88,157
|
|
7,631
|
|
7,553
|
|
3,172
|
|
106,513
|
|
|||||||||
|
2017
|
|||||||||||||||||||
|
Revenues before reimbursements
|
653,693
|
|
139,338
|
|
110,962
|
|
201,839
|
|
1,105,832
|
|
|||||||||
|
Long-lived assets
|
111,688
|
|
7,747
|
|
8,771
|
|
3,282
|
|
131,488
|
|
|||||||||
|
2016
|
|||||||||||||||||||
|
Revenues before reimbursements
|
629,385
|
|
172,673
|
|
106,696
|
|
200,532
|
|
1,109,286
|
|
|||||||||
|
Long-lived assets
|
92,565
|
|
8,480
|
|
5,652
|
|
3,868
|
|
110,565
|
|
|||||||||
102
15. Client Funds
The Company maintains funds in custodial accounts at financial institutions to administer claims for certain clients. These funds are not available for the Company's general operating activities and, as such, have not been recorded in the accompanying Consolidated Balance Sheets. The amount of these funds totaled
$464,524,000
and
$480,026,000
at
December 31, 2018
and
2017
, respectively. In addition, the
Garden City Group
service line which was disposed on
June 15, 2018
, in the
Crawford Specialty Solutions
segment administered funds in noncustodial accounts at financial institutions that totaled
$542,635,000
at
December 31
,
2017
.
16. Commitments and Contingencies
As part of the Company's Credit Facility, the Company maintains a letter of credit facility to satisfy certain of its own contractual requirements. At
December 31, 2018
, the aggregate committed amount of letters of credit outstanding under the facility was
$11,729,000
.
From time to time, the Company enters into certain agreements for the purchase or sale of assets or businesses that contain provisions that may require the Company to make additional payments in the future depending upon the achievement of specified operating results of the acquired company, or provide the Company with an option or similar right to purchase additional assets. As a result of the acquisition of WeGoLook, the Company has an option, beginning on January 1, 2022 and expiring on December 31, 2023, to acquire the remaining
15%
outstanding membership interest of WeGoLook. In the event the Company does not exercise the option, beginning on January 1, 2024, the minority members shall have the right to require the Company to acquire the minority members’ interest on or before December 31, 2024. In addition, at the time of the exercise of the option or the put, the minority members may be entitled to additional consideration depending on whether certain financial targets of WeGoLook are achieved between closing and December 31, 2021.
In the normal course of its business, the Company is sometimes named as a defendant or responsible party in suits or other actions by insureds or claimants contesting decisions made by the Company or its clients with respect to the settlement of claims. Additionally, certain clients of the Company have in the past brought, and may, in the future bring, claims for indemnification on the basis of alleged actions by the Company, its agents, or its employees in rendering services to clients. The majority of these claims are of the type covered by insurance maintained by the Company. However, the Company is responsible for the deductibles and self-insured retentions under various insurance coverages. In the opinion of Company management, adequate provisions have been made for such known and foreseeable risks.
The Company is subject to numerous federal, state, and foreign labor, employment, worker health and safety, antitrust and competition, environmental and consumer protection, import/export, anti-corruption, and other laws. From time to time the Company faces claims and investigations by employees, former employees, and governmental entities under such laws or employment contracts with such employees or former employees. Such claims, investigations, and any litigation involving the Company could divert management's time and attention from the Company's business operations and could potentially result in substantial costs of defense, settlement or other disposition, which could have a material adverse effect on the Company's results of operations, financial position, and cash flows. In the opinion of Company management, adequate provisions have been made for any items that are probable and reasonably estimable.
The Company is engaged in arbitration with three former executives of the Garden City Group in which the former executives claim that they are entitled to additional payments associated with their departure from the Garden City Group on December 31, 2015. The Company does not believe that any additional amounts are due to the former executives and strongly refutes the allegations. The Company has not made any provision for the claims of the former executives, which were filed in New York, New York in September 2018.
103
17. Restructuring and Special Charges
There were
no
restructuring and special charges in
2018
. Total restructuring and special charges were
$12,084,000
and
$9,490,000
during the years ended
December 31
,
2017
, and
2016
, respectively.
Restructuring charges for the years ended December 31,
2017
and
2016
of
$12,084,000
and
$8,565,000
were recorded related to the establishment and phase in of the Company's Global Business Services Center in the Philippines and Global Technology Services Center in India (the "Centers"), restructuring and integration costs related to reductions of administrative costs and consolidation of management layers in certain operations, and other restructuring charges for asset impairments and lease termination costs.
The following table shows the costs incurred by type of restructuring activity:
|
Year Ended December 31,
|
2018
|
2017
|
2016
|
||||||||
|
(In thousands)
|
|||||||||||
|
Implementation and phase-in of the Centers
|
$
|
—
|
|
$
|
445
|
|
$
|
3,741
|
|
||
|
Restructuring and integration costs
|
—
|
|
10,119
|
|
2,975
|
|
|||||
|
Asset impairments and lease termination costs
|
—
|
|
1,520
|
|
1,849
|
|
|||||
|
Total restructuring charges
|
$
|
—
|
|
$
|
12,084
|
|
$
|
8,565
|
|
||
Costs associated with the Centers were primarily for severance costs and professional fees. Restructuring and integration costs were predominantly comprised of severance costs, lease costs, and to a lesser extent professional fees and other costs. Asset impairments, including costs incurred for obsolete software, relate to decisions to close certain operations, and lease termination costs related to the exiting of certain leased facilities.
As of
December 31, 2018
, the following liabilities remained on the Company's Consolidated Balance Sheets related to restructuring charges recorded in
2016
and
2017
. The rollforwards of these costs to
December 31, 2018
were as follows:
|
Restructuring Charges
|
Deferred rent
|
Accrued compensation and related costs
|
Accounts payable
|
Other accrued liabilities
|
Total
|
||||||||||||||
|
Balance at December 31, 2015
|
$
|
3,571
|
|
$
|
7,006
|
|
$
|
1,066
|
|
$
|
3,257
|
|
$
|
14,900
|
|
||||
|
Additions
|
1,526
|
|
2,995
|
|
3,611
|
|
433
|
|
8,565
|
|
|||||||||
|
Adjustments to accruals
|
(1,112
|
)
|
—
|
|
(136
|
)
|
—
|
|
(1,248
|
)
|
|||||||||
|
Cash payments
|
(919
|
)
|
(8,476
|
)
|
(3,924
|
)
|
(1,741
|
)
|
(15,060
|
)
|
|||||||||
|
Balance at December 31, 2016
|
3,066
|
|
1,525
|
|
617
|
|
1,949
|
|
7,157
|
|
|||||||||
|
Additions
|
1,277
|
|
10,299
|
|
195
|
|
313
|
|
12,084
|
|
|||||||||
|
Adjustments to accruals
|
(1,497
|
)
|
—
|
|
—
|
|
977
|
|
(520
|
)
|
|||||||||
|
Cash payments
|
—
|
|
(7,042
|
)
|
(812
|
)
|
(1,454
|
)
|
(9,308
|
)
|
|||||||||
|
Balance at December 31, 2017
|
2,846
|
|
4,782
|
|
—
|
|
1,785
|
|
9,413
|
|
|||||||||
|
Additions
|
—
|
|
—
|
|
—
|
|
—
|
|
—
|
|
|||||||||
|
Adjustments to accruals
|
(1,544
|
)
|
—
|
|
—
|
|
(643
|
)
|
(2,187
|
)
|
|||||||||
|
Cash payments
|
—
|
|
(4,305
|
)
|
—
|
|
(656
|
)
|
(4,961
|
)
|
|||||||||
|
Balance at December 31, 2018
|
$
|
1,302
|
|
$
|
477
|
|
$
|
—
|
|
$
|
486
|
|
$
|
2,265
|
|
||||
The Company recorded
no
special charges for the years ended
December 31, 2018
and
2017
. For the year ended
December 31, 2016
, the Company recorded special charges of
$925,000
which consisted of legal and professional fees. As of
December 31, 2018
, all special charges had been paid.
104
18. Subsequent Events
On
January 22, 2019
, the Company entered into Stock Purchase Agreements to repurchase an aggregate of
421,427
shares of CRD-A and
1,376,889
shares of CRD-B. Pursuant to the Purchase Agreements, the Company paid a purchase price of
$9.10
per share, for an aggregate purchase price of $
16,364,676
plus commission. As the Company's Board of Directors separately authorized this repurchase, the authorized shares remaining under the 2017 Repurchase Authorization, as referenced in Note 10, "Common Stock and Earnings per Share", will not be impacted.
105
Management's Statement on Responsibility for Financial Reporting
The management of Crawford & Company is responsible for the integrity and objectivity of the financial information in this Annual Report on Form 10-K. The consolidated financial statements are prepared in conformity with accounting principles generally accepted in the United States, using informed judgments and estimates where appropriate.
The Company maintains a system of internal accounting policies, procedures, and controls designed to provide reasonable, but not absolute, assurance that assets are safeguarded and transactions are executed and recorded in accordance with management's authorization. The internal accounting control system is augmented by a program of internal audits and reviews by management, written policies and guidelines, and the careful selection and training of qualified personnel.
The Audit Committee of the Board of Directors, comprised solely of outside directors, is responsible for monitoring the Company's accounting and reporting practices. The Audit Committee meets regularly with management, the internal auditors, and the independent auditors to review the work of each and to assure that each performs its responsibilities. The independent registered public accounting firm, Ernst & Young LLP, was selected by the Audit Committee of the Board of Directors. Both the internal auditors and Ernst & Young LLP have unrestricted access to the Audit Committee allowing open discussion, without management present, on the quality of financial reporting and the adequacy of accounting, disclosure and financial reporting controls.
|
/s/ Harsha V. Agadi
|
||
|
Harsha V. Agadi
|
||
|
President and
|
||
|
Chief Executive Officer
|
||
|
/s/ W. Bruce Swain
|
||
|
W. Bruce Swain
|
||
|
Executive Vice President
|
||
|
and Chief Financial Officer
|
||
|
/s/ Dalerick M. Carden
|
||
|
Dalerick M. Carden
|
||
|
Senior Vice President, Corporate Controller,
|
||
|
and Chief Accounting Officer
|
||
February 25, 2019
106
Report of Independent Registered Public Accounting Firm
To the Shareholders and the Board of Directors of Crawford & Company
Opinion on the Financial Statements
We have audited the accompanying consolidated balance sheets of Crawford & Company (the Company) as of December 31, 2018 and 2017, the related consolidated statements of operations, comprehensive income, cash flows, and shareholders' investment for each of the three years in the period ended December 31, 2018, and the related notes (collectively referred to as the “consolidated financial statements”). In our opinion, the consolidated financial statements present fairly, in all material respects, the financial position of the Company at December 31, 2018 and 2017, and the results of its operations and its cash flows for each of the three years in the period ended December 31, 2018, in conformity with U.S. generally accepted accounting principles.
We also have audited, in accordance with the standards of the Public Company Accounting Oversight Board (United States) (PCAOB), the Company's internal control over financial reporting as of December 31, 2018, based on criteria established in Internal Control-Integrated Framework issued by the Committee of Sponsoring Organizations of the Treadway Commission (2013 framework) and our report dated February 25, 2019 expressed an unqualified opinion thereon.
Basis for Opinion
These financial statements are the responsibility of the Company's management. Our responsibility is to express an opinion on the Company’s financial statements based on our audits. We are a public accounting firm registered with the PCAOB and are required to be independent with respect to the Company in accordance with the U.S. federal securities laws and the applicable rules and regulations of the Securities and Exchange Commission and the PCAOB.
We conducted our audits in accordance with the standards of the PCAOB. Those standards require that we plan and perform the audit to obtain reasonable assurance about whether the financial statements are free of material misstatement, whether due to error or fraud. Our audits included performing procedures to assess the risks of material misstatement of the financial statements, whether due to error or fraud, and performing procedures that respond to those risks. Such procedures included examining, on a test basis, evidence regarding the amounts and disclosures in the financial statements. Our audits also included evaluating the accounting principles used and significant estimates made by management, as well as evaluating the overall presentation of the financial statements. We believe that our audits provide a reasonable basis for our opinion.
/s/ Ernst & Young LLP
We have served as the Company’s auditor since 2002.
Atlanta, Georgia
February 25, 2019
107
CRAWFORD & COMPANY
QUARTERLY FINANCIAL DATA (UNAUDITED)
|
2018 Quarterly Period
|
First
|
Second
|
Third
|
Fourth
(4)
|
Full Year
|
||||||||||||||
|
|
(In thousands, except per share amounts)
|
||||||||||||||||||
|
Revenues from services:
|
|||||||||||||||||||
|
Revenues before reimbursements
|
$
|
273,104
|
|
$
|
279,044
|
|
$
|
255,029
|
|
$
|
263,794
|
|
$
|
1,070,971
|
|
||||
|
Reimbursements
|
17,283
|
|
14,165
|
|
9,834
|
|
10,726
|
|
52,008
|
|
|||||||||
|
Total revenues
|
290,387
|
|
293,209
|
|
264,863
|
|
274,520
|
|
1,122,979
|
|
|||||||||
|
Total costs of services
|
214,902
|
|
211,688
|
|
189,072
|
|
192,343
|
|
808,005
|
|
|||||||||
|
Income before income taxes
|
12,396
|
|
(1,967
|
)
|
9,707
|
|
23,995
|
|
44,131
|
|
|||||||||
|
Crawford Claims Solutions Operating Earnings (Loss) (1)
|
715
|
|
3,752
|
|
(651
|
)
|
6,020
|
|
9,836
|
|
|||||||||
|
Crawford TPA Solutions: Broadspire Operating Earnings (1)
|
7,824
|
|
8,135
|
|
8,055
|
|
12,895
|
|
36,909
|
|
|||||||||
|
Crawford Specialty Solutions Operating Earnings (1)
|
10,451
|
|
10,387
|
|
14,879
|
|
15,319
|
|
51,036
|
|
|||||||||
|
Unallocated corporate and shared costs, net
|
(815
|
)
|
(703
|
)
|
(5,798
|
)
|
(2,005
|
)
|
(9,321
|
)
|
|||||||||
|
Goodwill and intangible asset impairment charges
|
—
|
|
—
|
|
—
|
|
(1,056
|
)
|
(1,056
|
)
|
|||||||||
|
Net corporate interest expense
|
(2,564
|
)
|
(2,440
|
)
|
(2,398
|
)
|
(2,707
|
)
|
(10,109
|
)
|
|||||||||
|
Stock option expense
|
(450
|
)
|
(512
|
)
|
(393
|
)
|
(387
|
)
|
(1,742
|
)
|
|||||||||
|
Amortization of customer-relationship intangible assets
|
(2,765
|
)
|
(2,791
|
)
|
(2,786
|
)
|
(2,810
|
)
|
(11,152
|
)
|
|||||||||
|
Loss on disposal of business
|
—
|
|
(17,795
|
)
|
(1,201
|
)
|
(1,274
|
)
|
(20,270
|
)
|
|||||||||
|
Income taxes
|
(3,966
|
)
|
(461
|
)
|
(1,828
|
)
|
(12,287
|
)
|
(18,542
|
)
|
|||||||||
|
Net loss attributable to noncontrolling interests
|
139
|
|
3
|
|
17
|
|
230
|
|
389
|
|
|||||||||
|
Net income (loss) attributable to shareholders of Crawford & Company
|
$
|
8,569
|
|
$
|
(2,425
|
)
|
|
$
|
7,896
|
|
|
$
|
11,938
|
|
$
|
25,978
|
|
||
|
Earnings (Loss) Per Share - Basic: (2) (3)
|
|||||||||||||||||||
|
Class A Common Stock
|
$
|
0.16
|
|
$
|
(0.04
|
)
|
$
|
0.15
|
|
$
|
0.23
|
|
$
|
0.51
|
|
||||
|
Class B Common Stock
|
$
|
0.14
|
|
$
|
(0.06
|
)
|
$
|
0.13
|
|
$
|
0.21
|
|
$
|
0.43
|
|
||||
|
Earnings (Loss) Per Share - Diluted: (2) (3)
|
|||||||||||||||||||
|
Class A Common Stock
|
$
|
0.16
|
|
$
|
(0.04
|
)
|
$
|
0.15
|
|
$
|
0.22
|
|
$
|
0.50
|
|
||||
|
Class B Common Stock
|
$
|
0.14
|
|
$
|
(0.06
|
)
|
$
|
0.13
|
|
$
|
0.20
|
|
$
|
0.42
|
|
||||
108
|
2017 Quarterly Period
|
First
|
Second
|
Third
|
Fourth
|
Full Year
|
||||||||||||||
|
(In thousands, except per share amounts)
|
|||||||||||||||||||
|
Revenues from services:
|
|||||||||||||||||||
|
Revenues before reimbursements
|
$
|
267,267
|
|
$
|
269,247
|
|
$
|
270,551
|
|
$
|
298,767
|
|
$
|
1,105,832
|
|
||||
|
Reimbursements
|
12,263
|
|
14,725
|
|
16,115
|
|
14,774
|
|
57,877
|
|
|||||||||
|
Total revenues
|
279,530
|
|
283,972
|
|
286,666
|
|
313,541
|
|
1,163,709
|
|
|||||||||
|
Total costs of services
|
205,000
|
|
201,196
|
|
208,262
|
|
227,709
|
|
842,167
|
|
|||||||||
|
Income before income taxes
|
12,458
|
|
17,085
|
|
16,892
|
|
(4,173
|
)
|
42,262
|
|
|||||||||
|
Crawford Claims Solutions Operating Earnings (1)
|
2,434
|
|
3,327
|
|
2,017
|
|
9,749
|
|
17,527
|
|
|||||||||
|
Crawford TPA Solutions: Broadspire Operating Earnings (1)
|
7,968
|
|
9,710
|
|
9,916
|
|
10,630
|
|
38,224
|
|
|||||||||
|
Crawford Specialty Solutions Operating Earnings (1)
|
8,352
|
|
14,085
|
|
16,445
|
|
14,536
|
|
53,418
|
|
|||||||||
|
Unallocated corporate and shared costs, net
|
(461
|
)
|
2,037
|
|
(4,326
|
)
|
(10,713
|
)
|
(13,463
|
)
|
|||||||||
|
Goodwill impairment charges
|
—
|
|
—
|
|
—
|
|
(19,598
|
)
|
(19,598
|
)
|
|||||||||
|
Net corporate interest expense
|
(2,036
|
)
|
(2,114
|
)
|
(2,524
|
)
|
(2,388
|
)
|
(9,062
|
)
|
|||||||||
|
Stock option expense
|
(417
|
)
|
(457
|
)
|
(468
|
)
|
(376
|
)
|
(1,718
|
)
|
|||||||||
|
Amortization of customer-relationship intangible assets
|
(2,777
|
)
|
(2,721
|
)
|
(2,737
|
)
|
(2,747
|
)
|
(10,982
|
)
|
|||||||||
|
Restructuring and special charges
|
(605
|
)
|
(6,782
|
)
|
(1,431
|
)
|
(3,266
|
)
|
(12,084
|
)
|
|||||||||
|
Income taxes
|
(4,835
|
)
|
(6,812
|
)
|
(4,922
|
)
|
1,530
|
|
(15,039
|
)
|
|||||||||
|
Net loss (income) loss attributable to noncontrolling interests
|
41
|
|
(72
|
)
|
(157
|
)
|
630
|
|
442
|
|
|||||||||
|
Net income (loss) attributable to shareholders of Crawford & Company
|
$
|
7,664
|
|
$
|
10,201
|
|
$
|
11,813
|
|
$
|
(2,013
|
)
|
$
|
27,665
|
|
||||
|
Earnings (Loss) Per Share - Basic: (2) (3)
|
|||||||||||||||||||
|
Class A Common Stock
|
$
|
0.15
|
|
$
|
0.19
|
|
$
|
0.22
|
|
$
|
(0.03
|
)
|
$
|
0.53
|
|
||||
|
Class B Common Stock
|
$
|
0.13
|
|
$
|
0.17
|
|
$
|
0.20
|
|
$
|
(0.05
|
)
|
$
|
0.45
|
|
||||
|
Earnings (Loss) Per Share - Diluted: (2) (3)
|
|||||||||||||||||||
|
Class A Common Stock
|
$
|
0.14
|
|
$
|
0.19
|
|
$
|
0.22
|
|
$
|
(0.03
|
)
|
$
|
0.52
|
|
||||
|
Class B Common Stock
|
$
|
0.12
|
|
$
|
0.17
|
|
$
|
0.20
|
|
$
|
(0.05
|
)
|
$
|
0.45
|
|
||||
__________________
|
(1)
|
This is a segment financial measure representing segment earnings before certain unallocated corporate and shared costs and credits, goodwill and intangible asset impairment charges, net corporate interest expense, stock option expense, amortization of customer-relationship intangible assets, restructuring and special charges, loss on disposal of business, income taxes, and net income or loss attributable to noncontrolling interests and redeemable noncontrolling interests. See Note 14, "Segment and Geographic Information," in the audited consolidated financial statements contained in this Item 8.
|
|
(2)
|
Due to the method used in calculating per share data as prescribed by ASC 260, "Earnings Per Share," the quarterly per share data may not total to the full-year per share data.
|
|
(3)
|
The Company may pay a higher dividend on CRD-A than on CRD-B. This dividend differential can result in different earnings (loss) per share for each class of stock due to the two-class method of computing earnings (loss) per share as required by current accounting guidance. CRD-B generally presents a more dilutive measure.
|
|
(4)
|
The Company recognized a pretax loss on the disposal of the Garden City Group business of $20.3 million in 2018. See Note 3, "Acquisitions and Disposition of Business Line" in the audited consolidated financial statements included in this Item 8. The Company recognized non-cash goodwill impairment in the amount of $19.6 million related to its Garden City Group reporting unit in the fourth quarter of 2017. See Note 4, "Goodwill and Intangible Assets" in the audited consolidated financial statements included in this Item 8. The provision for income taxes in 2018 and 2017 included the impact of these transactions and the impact of U.S. tax reform.
|
109
ITEM 9.
CHANGES IN AND DISAGREEMENTS WITH ACCOUNTANTS ON ACCOUNTING AND
FINANCIAL DISCLOSURE
Not applicable.
ITEM 9A.
CONTROLS AND PROCEDURES
Evaluation of Disclosure Controls and Procedures
The Registrant maintains a set of disclosure controls and procedures, as defined in Rules 13a-15(e) and 15d-15(e) of the Securities Exchange Act of 1934 (the "Exchange Act"), designed to ensure that information required to be disclosed by the Registrant in reports that it files or submits under the Exchange Act is recorded, processed, summarized or reported within the time periods specified in SEC rules and regulations.
Management necessarily applies its judgment in assessing the costs and benefits of such controls and procedures, which, by their nature, can provide only reasonable assurance regarding management's control objectives. The Company's management, including the Chief Executive Officer and the Chief Financial Officer, does not expect that our disclosure controls and procedures can prevent all possible errors or fraud. A control system, no matter how well conceived and operated, can provide only reasonable, not absolute, assurance that misstatements due to error or fraud will not occur or that all control issues and instances of fraud, if any, within the Company have been detected. Judgments in decision-making can be faulty and breakdowns can occur because of simple errors or mistakes. Additionally, controls can be circumvented by the individual acts of one or more persons. The design of any system of controls is based in part upon certain assumptions about the likelihood of future events, and while our disclosure controls and procedures are designed to be effective under circumstances where they should reasonably be expected to operate effectively, there can be no assurance that any design will succeed in achieving its stated goals under all potential future conditions. Because of the inherent limitations in any control system, misstatements due to possible errors or fraud may occur and not be detected.
The Registrant's management, with the participation of the Chief Executive Officer and Chief Financial Officer, has evaluated the effectiveness of the Registrant's disclosure controls and procedures as of
December 31, 2018
. Based on that evaluation, the Registrant's Chief Executive Officer and Chief Financial Officer concluded that the Registrant's disclosure controls and procedures were effective as of
December 31, 2018
.
Report of Management on Internal Control over Financial Reporting
The management of Crawford & Company is responsible for establishing and maintaining adequate internal control over financial reporting as defined in Rules 13a-15(f) and 15d-15(f) under the Exchange Act. The Company's internal control over financial reporting is a process designed to provide reasonable assurance regarding the reliability of financial reporting and the preparation of financial statements for external purposes in accordance with generally accepted accounting principles. The Company's internal control over financial reporting includes those policies and procedures that:
(i) pertain to maintenance of records that, in reasonable detail, accurately and fairly reflect the transactions and disposition of the Company's assets;
(ii) provide reasonable assurance that transactions are recorded as necessary to permit preparation of financial statements in accordance with U.S. generally accepted accounting principles, and that receipts and expenditures of the Company are made only in accordance with authorizations of the Company's management and directors; and
(iii) provide reasonable assurance regarding prevention or timely detection of unauthorized acquisition, use or disposition of the Company's assets that could have a material effect on the financial statements.
Because of its inherent limitations, internal control over financial reporting may not prevent or detect all misstatements. Also, projections of any evaluation of effectiveness to future periods are subject to the risk that controls may become inadequate because of changes in conditions, or that the degree of compliance with the policies or procedures may deteriorate.
110
Management assessed the effectiveness of the Company's internal control over financial reporting as of
December 31, 2018
. In making this assessment, management used the criteria set forth by the Committee of Sponsoring Organizations of the Treadway Commission (COSO) in
Internal Control-Integrated Framework
(2013 framework). Based on this assessment, management determined that the Company maintained effective internal control over financial reporting as of
December 31, 2018
.
The Company's independent registered public accounting firm, Ernst & Young LLP, is appointed by the Audit Committee. Ernst & Young LLP has audited and reported on the consolidated financial statements of Crawford & Company and the Company's internal control over financial reporting, each as contained in this Annual Report on Form 10-K.
Changes in Internal Control over Financial Reporting
While there were no significant changes in the Registrant's internal controls over financial reporting during
2018
that have materially affected, or are reasonably likely to materially affect, the Registrant's internal controls over financial reporting, we did implement a new enterprise reporting system in the U.S. during 2018 and as a result we implemented additional information technology, monitoring and reconciliation controls to ensure the accuracy of financial information generated and transferred during this implementation to ensure an effective internal control environment.
111
Report of Independent Registered Public Accounting Firm
To the Shareholders and the Board of Directors of Crawford & Company
Opinion on Internal Control over Financial Reporting
We have audited Crawford & Company’s internal control over financial reporting as of December 31, 2018, based on criteria established in Internal Control - Integrated Framework issued by the Committee of Sponsoring Organizations of the Treadway Commission (2013 framework) (the COSO criteria). In our opinion, Crawford & Company (the Company) maintained, in all material respects, effective internal control over financial reporting as of December 31, 2018, based on the COSO criteria.
We also have audited, in accordance with the standards of the Public Company Accounting Oversight Board (United States) (PCAOB), the consolidated balance sheets of the Company as of December 31, 2018 and 2017, the related consolidated statements of operations, comprehensive income, cash flows, and shareholders' investment for each of the three years in the period ended December 31, 2018, and the related notes and our report dated February 25, 2019 expressed an unqualified opinion thereon.
Basis for Opinion
The Company’s management is responsible for maintaining effective internal control over financial reporting and for its assessment of the effectiveness of internal control over financial reporting included in the accompanying Report of Management on Internal Control over Financial Reporting. Our responsibility is to express an opinion on the Company’s internal control over financial reporting based on our audit. We are a public accounting firm registered with the PCAOB and are required to be independent with respect to the Company in accordance with the U.S. federal securities laws and the applicable rules and regulations of the Securities and Exchange Commission and the PCAOB.
We conducted our audit in accordance with the standards of the PCAOB. Those standards require that we plan and perform the audit to obtain reasonable assurance about whether effective internal control over financial reporting was maintained in all material respects.
Our audit included obtaining an understanding of internal control over financial reporting, assessing the risk that a material weakness exists, testing and evaluating the design and operating effectiveness of internal control based on the assessed risk, and performing such other procedures as we considered necessary in the circumstances. We believe that our audit provides a reasonable basis for our opinion.
Definition and Limitations of Internal Control Over Financial Reporting
A company’s internal control over financial reporting is a process designed to provide reasonable assurance regarding the reliability of financial reporting and the preparation of financial statements for external purposes in accordance with generally accepted accounting principles. A company’s internal control over financial reporting includes those policies and procedures that (1) pertain to the maintenance of records that, in reasonable detail, accurately and fairly reflect the transactions and dispositions of the assets of the company; (2) provide reasonable assurance that transactions are recorded as necessary to permit preparation of financial statements in accordance with generally accepted accounting principles, and that receipts and expenditures of the company are being made only in accordance with authorizations of management and directors of the company; and (3) provide reasonable assurance regarding prevention or timely detection of unauthorized acquisition, use, or disposition of the company’s assets that could have a material effect on the financial statements.
Because of its inherent limitations, internal control over financial reporting may not prevent or detect misstatements. Also, projections of any evaluation of effectiveness to future periods are subject to the risk that controls may become inadequate because of changes in conditions, or that the degree of compliance with the policies or procedures may deteriorate.
/s/ Ernst & Young LLP
Atlanta, Georgia
February 25, 2019
112
PART III
ITEM 10.
DIRECTORS, EXECUTIVE OFFICERS AND CORPORATE GOVERNANCE
Information required by this Item will be included under the captions "Election of Directors — Nominee Information", "Section 16(a) Beneficial Ownership Reporting Compliance," "Executive Officers," "Corporate Governance—Standing Committees and Attendance at Board and Committee Meetings," and "Corporate Governance — Corporate Governance Guidelines, Committee Charters and Code of Business Conduct" of the Registrant's Proxy Statement for its 2019 Annual Meeting of Shareholders (the "Proxy Statement") to be filed within 120 days after
December 31, 2018
, and is incorporated herein by reference.
The Registrant has adopted a Code of Business Conduct and Ethics for its CEO, CFO, principal accounting officer and all other officers, directors and employees of the Registrant. The Code of Business Conduct and Ethics, as well as the Registrant's Corporate Governance Guidelines and Committee Charters, are available at www.crawco.com. Any amendment or waiver of the Code of Business Conduct and Ethics will be posted on this website within four business days after the effectiveness thereof. The Code of Business Conduct and Ethi
cs may also be obtained without charge by writing to Corporate Secretary, Legal Department, Crawford & Company, 5335 Triangle Parkway, Peachtree Corners, Georgia, 30092.
ITEM 11.
EXECUTIVE COMPENSATION
The information required by this Item will be included under the captions "Compensation Discussion and Analysis," "Summary Compensation Table," "Employment and Change in Control Arrangements," "Corporate Governance—Director Compensation," "Report of the Compensation Committee of the Board of Directors on Executive Compensation," and "Compensation Committee Interlocks and Insider Participation" of the Registrant's Proxy Statement, and is incorporated herein by reference.
ITEM 12.
SECURITY OWNERSHIP OF CERTAIN BENEFICIAL OWNERS AND MANAGEMENT AND
RELATED SHAREHOLDER MATTERS
The information required by this Item will be included under the captions "Stock Ownership Information" and "Equity Compensation Plans" of the Registrant's Proxy Statement, and is incorporated herein by reference.
ITEM 13.
CERTAIN RELATIONSHIPS AND RELATED TRANSACTIONS, AND DIRECTOR
INDEPENDENCE
The information required by this Item will be included under the captions "Information with Respect to Certain Business Relationships and Related Transactions" and "Corporate Governance - Director Independence" of the Registrant's Proxy Statement, and is incorporated herein by reference.
ITEM 14.
PRINCIPAL ACCOUNTANT FEES AND SERVICES
Information regarding principal accountant fees and services will be included under the caption "Ratification of Independent Auditor — Fees Paid to Ernst & Young LLP" of the Registrant's Proxy Statement, and is incorporated herein by reference.
113
PART IV
ITEM 15.
EXHIBITS, FINANCIAL STATEMENT SCHEDULES
(a) The following documents are filed as part of this report:
1. Financial Statements
The financial statements listed below and the related report of Ernst & Young LLP are incorporated herein by reference and included in Item 8 of this Annual Report on Form 10-K:
|
•
|
Consolidated Balance Sheets as of
December 31, 2018
and
2017
|
|
•
|
Consolidated Statements of Operations for the Years Ended
December 31, 2018
,
2017
, and
2016
|
|
•
|
Consolidated Statements of Comprehensive Income for the Years Ended
December 31, 2018
,
2017
, and
2016
|
|
•
|
Consolidated Statements of Shareholders' Investment for the Years Ended
December 31, 2018
,
2017
, and
2016
|
|
•
|
Consolidated Statements of Cash Flows for the Years Ended
December 31, 2018
,
2017
, and
2016
|
|
•
|
Notes to Consolidated Financial Statements
|
2. Financial Statement Schedule
|
•
|
Schedule II — Valuation and Qualifying Accounts — Information required by this schedule is included under the caption "Accounts Receivable and Allowance for Doubtful Accounts" in Note 1 and also in Note 7, "Income Taxes" to the Consolidated Financial Statements included in Item 8 of this Annual Report on Form 10-K, and is incorporated herein by reference.
|
Other schedules have been omitted because they are not applicable.
3. Exhibits filed with this report.
|
Exhibit No.
|
Document
|
|
|
2.1
|
||
|
2.2
|
||
|
3.1
|
||
|
3.2
|
||
|
10.1*
|
||
|
10.2*
|
||
|
10.3*
|
||
|
10.4*
|
||
|
10.5*
|
||
114
|
|
|
|
|
Exhibit No.
|
Document
|
|
|
10.6*
|
||
|
10.7*
|
||
|
10.8*
|
||
|
10.9*
|
||
|
10.10*
|
||
|
10.11*
|
||
|
10.12*
|
||
|
10.13*
|
||
|
10.14*
|
||
|
10.15*
|
||
|
10.16*
|
||
|
10.17*
|
||
|
10.18*
|
||
|
10.19*
|
||
|
10.20*
|
||
|
10.21
|
|
|
115
|
|
|
|
|
Exhibit No.
|
Document
|
|
|
10.22*
|
||
|
10.23*
|
||
|
10.24
|
||
|
10.25
|
||
|
21.1
|
||
|
23.1
|
||
|
31.1
|
||
|
31.2
|
||
|
32.1
|
||
|
32.2
|
||
|
101
|
XBRL Documents.
|
|
_____________
|
*
|
Management contract or compensatory plan or arrangement required to be filed as an exhibit pursuant to Item 601 of Regulation S-K.
|
ITEM 16.
FORM 10-K SUMMARY
None.
116
SIGNATURES
Pursuant to the requirements of Section 13 or 15(d) of the Securities Exchange Act of 1934, the Registrant has duly caused this report to be signed on its behalf by the undersigned, thereunto duly authorized.
|
CRAWFORD & COMPANY
|
|||||
|
Date
|
February 25, 2019
|
By
|
/s/ Harsha V. Agadi
|
||
|
HARSHA V. AGADI, President and Chief Executive Officer
|
|||||
Pursuant to the requirements of the Securities Exchange Act of 1934, this report has been signed below by the following persons on behalf of the Registrant and in the capacities and on the dates indicated.
|
NAME AND TITLE
|
|||
|
Date
|
February 25, 2019
|
/s/ Harsha V. Agadi
|
|
|
HARSHA V. AGADI, President and Chief Executive Officer (Principal Executive Officer) and Director
|
|||
|
Date
|
February 25, 2019
|
/s/ W. Bruce Swain
|
|
|
W. BRUCE SWAIN, Executive Vice President-Finance (Principal Financial Officer)
|
|||
|
Date
|
February 25, 2019
|
/s/ Dalerick M. Carden
|
|
|
DALERICK M. CARDEN, Senior Vice President and Controller (Principal Accounting Officer)
|
|||
|
Date
|
February 25, 2019
|
/s/ P. George Benson
|
|
|
P. GEORGE BENSON, Director
|
|||
|
Date
|
February 25, 2019
|
/s/ Jesse C. Crawford
|
|
|
JESSE C. CRAWFORD, Director
|
|||
|
Date
|
February 25, 2019
|
/s/ Jesse C. Crawford, Jr.
|
|
|
JESSE C. CRAWFORD, JR, Director
|
|||
|
Date
|
February 25, 2019
|
/s/ Michelle Jarrard
|
|
|
MICHELLE JARRARD, Director
|
|||
|
Date
|
February 25, 2019
|
/s/ Joia M. Johnson
|
|
|
JOIA M. JOHNSON, Director
|
|||
|
Date
|
February 25, 2019
|
/s/ Charles H. Ogburn
|
|
|
CHARLES H. OGBURN, Director
|
|||
|
Date
|
February 25, 2019
|
/s/ D. Richard Williams
|
|
|
D. RICHARD WILLIAMS, Director
|
|||
|
Date
|
February 25, 2019
|
/s/ Rahul Patel
|
|
|
RAHUL PATEL, Director
|
|||
117
TABLE OF CONTENTS
Part IItem 1. BusinessItem 1A. Risk FactorsItem 1B. Unresolved Staff CommentsItem 2. PropertiesItem 3. Legal ProceedingsItem 4. Mine Safety DisclosuresPart IIItem 5. Market For The Registrant's Common Equity, Related Shareholder Matters,Item 6. Selected Financial DataItem 7. Management's Discussion and Analysis Of Financial Condition and ResultsItem 7A. Quantitative and Qualitative Disclosures About Market RiskItem 8. Financial Statements and Supplementary DataItem 9. Changes in and Disagreements with Accountants on Accounting andItem 9A. Controls and ProceduresPart IIIItem 10. Directors, Executive Officers and Corporate GovernanceItem 11. Executive CompensationItem 12. Security Ownership Of Certain Beneficial Owners and Management andItem 13. Certain Relationships and Related Transactions, and DirectorItem 14. Principal Accountant Fees and ServicesPart IVItem 15. Exhibits, Financial Statement SchedulesItem 16. Form 10-k Summary